reducing rural roadway departures - transportation · 2014-2016 annual average of rural roadway...
TRANSCRIPT

1
Center for Accelerating Innovation
1
Reducing Rural Roadway DeparturesEvery Day Counts Round 5
Center for Accelerating Innovation
Today’s Presenters
2
Cate SatterfieldRoadway Safety Engineer,
FHWA Office of Safety
Crete, IL
Mike MeeksTraffic Engineer
Franklin County, OH
Dick AlbinRoad Safety Engineer
FHWA, Resource Center Safety & Design Technical Service Team
Olympia, Washington
Scott DavisTraffic Engineering & Operations Manager,
Thurston County, WA

2
Center for Accelerating Innovation
What is “Every Day Counts”(EDC)?State-based model to identify and rapidly deploy proven but underutilized innovations to:shorten the project delivery process
enhance roadway safety
reduce congestion
improve environmental sustainability
EDC Rounds: two year cycles
Initiating 5th Round (2019-2020) - 10 innovations
To date: 4 Rounds, over 40 innovations
3
FAST Act, Sec.1444
For more information: https://www.fhwa.dot.gov/innovation/
Center for Accelerating Innovation
The Mission
4
How?
What?
Why?RRwD = 1/3
traffic deaths
Reduce the potential for serious injury and fatal roadway departure crashes on all public rural roads by increasing the systemic deployment of proven countermeasures.

3
Center for Accelerating Innovation
Source: NHTSA FARS (2014 – 2016 Annual Average)
The Rural RwD Component of Fatalities
Rural RwD
11,874
34%
5
Center for Accelerating Innovation
What is a Roadway Departure (RwD)?FHWA Definition: A crash in which a vehicle crosses an edge line, a center line, or otherwise leaves the traveled way.
6
Photo credit: FHWA Photo credit: Oregon State Police

4
Center for Accelerating Innovation
Percent Rural RwD Fatalities
7
53
63
37
44 (NH)
66 (VT)69
63
32
54
51
65
36
52
40 46
45
5 (MA)
32
46
41
48
34
27
26
12 (CT)
4322
373121
10 (RI)
33
45
16 (MD)
60
31 (DE)27
27
10 (NJ)47
55
44
39
39
16
48
17
26
0 (DC)
36
54
> 50% average
35% - 50% average20% - 34%
average < 20% average
2014-2016 Annual Average of Rural Roadway Departures Source: FARS
Center for Accelerating Innovation
Rural RwD Fatalities
8
363
86
132
51 (NH)
36 (VT)140
82
86
411
267
97
354
225
344 342
612
17 (MA)
1163
417
382
186
178
371
862
34 (CT)
284197
44633467
5 (RI)
182
33
80 (MD)
130
38 (DE)265
262
58 (NJ)107
70
248
312
153
16
167
480
282
0 (DC)
267
145
> 500 fatalities
100-299 fatalities
25-99 fatalities
< 25 fatalities
300-499 fatalities
2014-2016 Annual Average of Rural Roadway Departures Source: FARS
5
Center for Accelerating Innovation
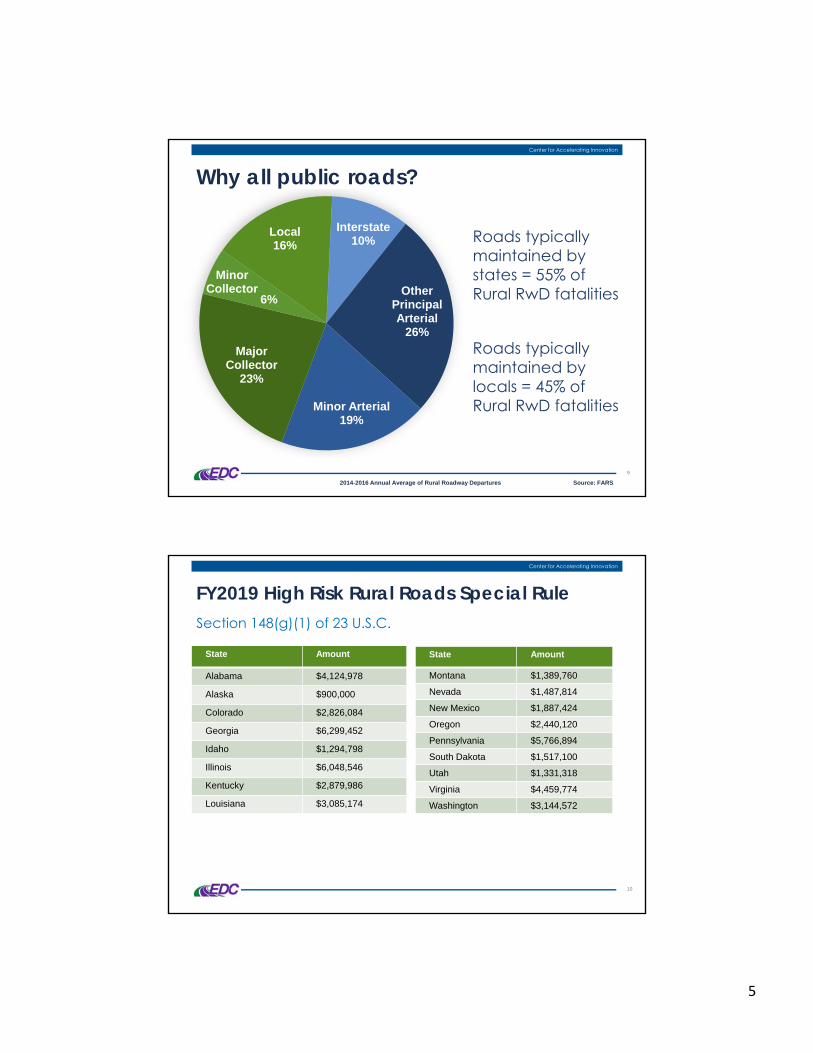
Why all public roads?
9
Local16%
Interstate10%
Other Principal Arterial
26%
Minor Arterial19%
Major Collector
23%
Minor Collector
6%
Roads typically maintained by states = 55% of Rural RwD fatalities
Roads typically maintained by locals = 45% of Rural RwD fatalities
2014-2016 Annual Average of Rural Roadway Departures Source: FARS
Center for Accelerating Innovation
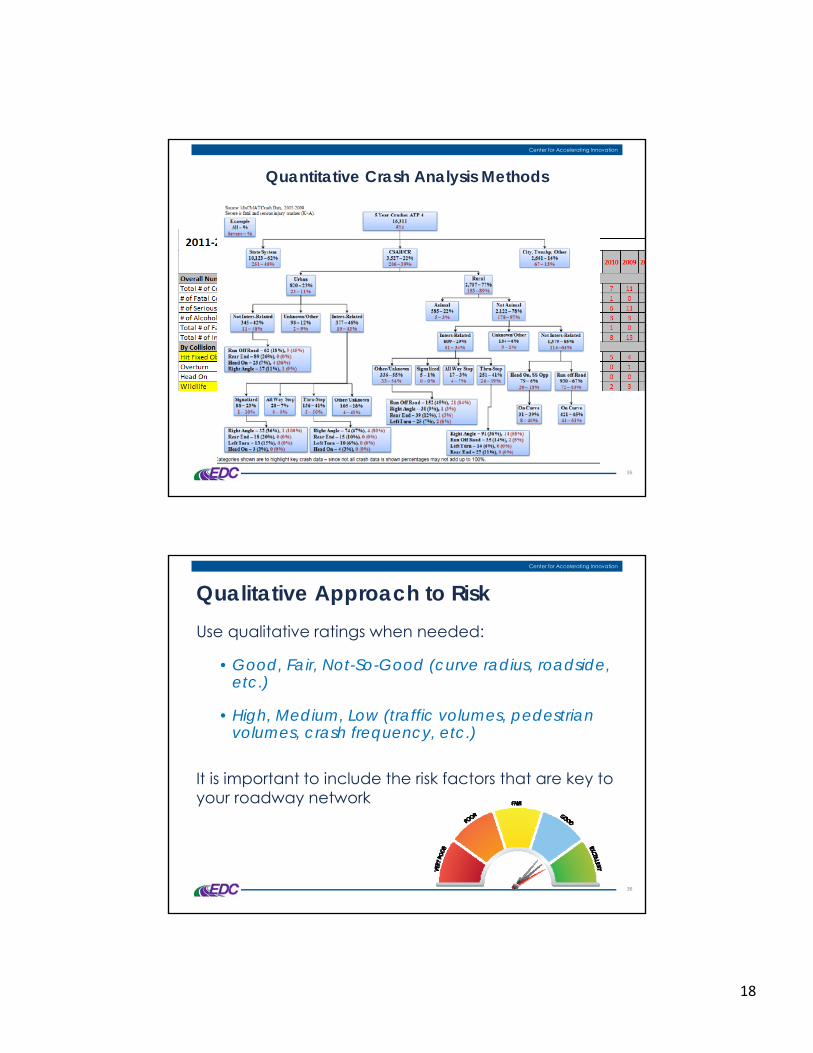
FY2019 High Risk Rural Roads Special RuleSection 148(g)(1) of 23 U.S.C.
10
State Amount
Montana $1,389,760
Nevada $1,487,814
New Mexico $1,887,424
Oregon $2,440,120
Pennsylvania $5,766,894
South Dakota $1,517,100
Utah $1,331,318
Virginia $4,459,774
Washington $3,144,572
State Amount
Alabama $4,124,978
Alaska $900,000
Colorado $2,826,084
Georgia $6,299,452
Idaho $1,294,798
Illinois $6,048,546
Kentucky $2,879,986
Louisiana $3,085,174

6
Center for Accelerating Innovation
Why do drivers leave the roadway?
11
Roadway Condition
Vehicle Component Failure
Collision Avoidance
Driver ErrorPolling Question
Photo credit: FHWA
Center for Accelerating Innovation
Crashes Caused by Various Factors
12
Vehicle 12%
Roadway 34%
Driver 93%27%
3%1%
3% 57%
2%
6%
From: Lum & Reagan, Public Roads Magazine, Winter 1995, “Interactive Highway Safety Design Module”
Humans are the weakest link so we must design around human needs.

7
Center for Accelerating Innovation
13
Center for Accelerating Innovation
How?• Systemic Analysis
• Safety action plans
• Deployment based on risk factors
14
Systemic Deployment
Why?
How?
What?
RRwD = 1/3 traffic deaths

8
Center for Accelerating Innovation
Where would you invest safety funds?20122013201420152016
Center for Accelerating Innovation
Most Harmful Eventin Fatal Crashes
16
2012 2013 2014 2015 2016Motor Vehicle In-Transport 289 249 267 388 373Tree & Shrub (Standing Only) 158 149 155 153 163Rollover/Overturn 132 136 142 159 161Pedestrian 110 97 100 121 137Embankment & Ditch 29 23 18 17 22Utility Pole/Light & Sign Support 25 30 15 23 21Traffic Barrier 16 7 18 16 14Fire/Explosion 14 5 12 13 14Pedalcyclist 13 15 14 16 25Other Object (not fixed) 9 12 12 11 15Culvert 8 5 8 10 7Other Fixed Object 8 8 18 10 15Parked Motor Vehicle 7 4 4 4 5Live Animal 5 3 3 7 2Curb 5 2 5 4 3
Source: FARS

9
Center for Accelerating Innovation
17
Fatal crash locationsarerandom
Source: Pexels
Center for Accelerating Innovation
18
Fatal crash types arepredictable
Source: Pixabay

10
Center for Accelerating Innovation
Systemic Safety Improvements
19
Systemic
• Based on Risk• Correlated with
particular severe crash types
An improvement that is widely implemented based on high-risk roadway features that are correlated with particular severe crash types.
http://safety.fhwa.dot.gov/systemic/index.htm
Center for Accelerating Innovation
Poll question
• What are risk factors that you consider for roadway departures?
20

11
Center for Accelerating Innovation
Rural Roadway Departure Fatalitiesby Most Harmful Event
21
Head-On3,354
28%
Rollover3,609
30%
Trees2,312
19%
2014-2016 Annual Average of Rural RwDs by MHE Source: FARS
Center for Accelerating Innovation
Higher Speed is a Risk Factor
22
63%
84%
78%
0% 20% 40% 60% 80% 100%
Tree
Head-On
Rollover
Rural RwD fatalities where speed limit is > 50 MPH
2014-2016 Annual Average of Rural Roadway Departures Source: FARS

12
Center for Accelerating Innovation
Curves are a Risk Factor
23
50%
32%
44%
0% 10% 20% 30% 40% 50% 60%
Tree
Head-On
Rollover
Curve-related Rural RwD Fatalities
2014-2016 Annual Average of Rural Roadway Departures Source: FARS
Center for Accelerating Innovation
24
State Strategic Highway Safety Plan
(SHSP)
HSIPOther State
Highway funds
Local funding sources
SAFETY ACTION PLANS
• Regional Plans
• Tribal Plans
• Local Plans
• Other Plans
HSIP: 23USC 148(c), 23 CFR 924.7

13
Center for Accelerating Innovation
25
Center for Accelerating Innovation
Minnesota Example
26
State Trunk Highways
51%County Highways
36%
Municipal Roads7%
Other Roads 6%
2015 Fatalities by Roadway in Minnesota

14
Center for Accelerating Innovation
Minnesota Results
27
Source: Mark Vizecky, MnDOT
0.00
0.20
0.40
0.60
0.80
1.00
1.20
1.40
1.60
1.80
2.00
2003 2004 2005 2006 2007 2008 2009 2010 2011 2012 2013 2014
Fata
lity
Rat
e*
Year
County System
State Highway System
Interstate System
Begin Preparation of
County Roadway Safety Plans
Begin Widespread Deployment of
Safety Strategies Along County
System
Center for Accelerating Innovation
Target zeroWashington State County Road Safety
28

15
Center for Accelerating Innovation
Washington State Safety Facts
Counties maintain 47% of the road miles in Washington State
16% of the total vehicle miles traveled occur on County roads
The fatal crash rate is two times higher on county roads than on state highways.
29
Center for Accelerating Innovation
How does Washington State support local road safety?
Provides training
Provides information
Provides 70% HSIP funding to local agencies
Over $200 million awarded to locals since 2009
30
State30%
County30%
City40%
Percent Fatal & Serious Collisions

16
Center for Accelerating Innovation
Crash Information Provided by DOT
First Step in process
Easy to Use
Can quickly ID priorities
31
Center for Accelerating Innovation
County Road Safety Program Results
Over 80% of Washington State Counties have local road safety plans now
All the plans were completed by county staff
32
For more information contact Matthew Enders at [email protected] or visit
http://www.wsdot.wa.gov/LocalPrograms/Traffic/FedSafety.htm

17
Center for Accelerating Innovation
33
Local Road Safety Plans
Center for Accelerating Innovation
Many Data Sources“Do what you can, with what you have, where you are.”
– Theodore Roosevelt
34
Crash
MaintenanceLogs
RoadSafetyAudits
Enforcement
SafetyData
Roadway Traffic Volume
18
Center for Accelerating Innovation
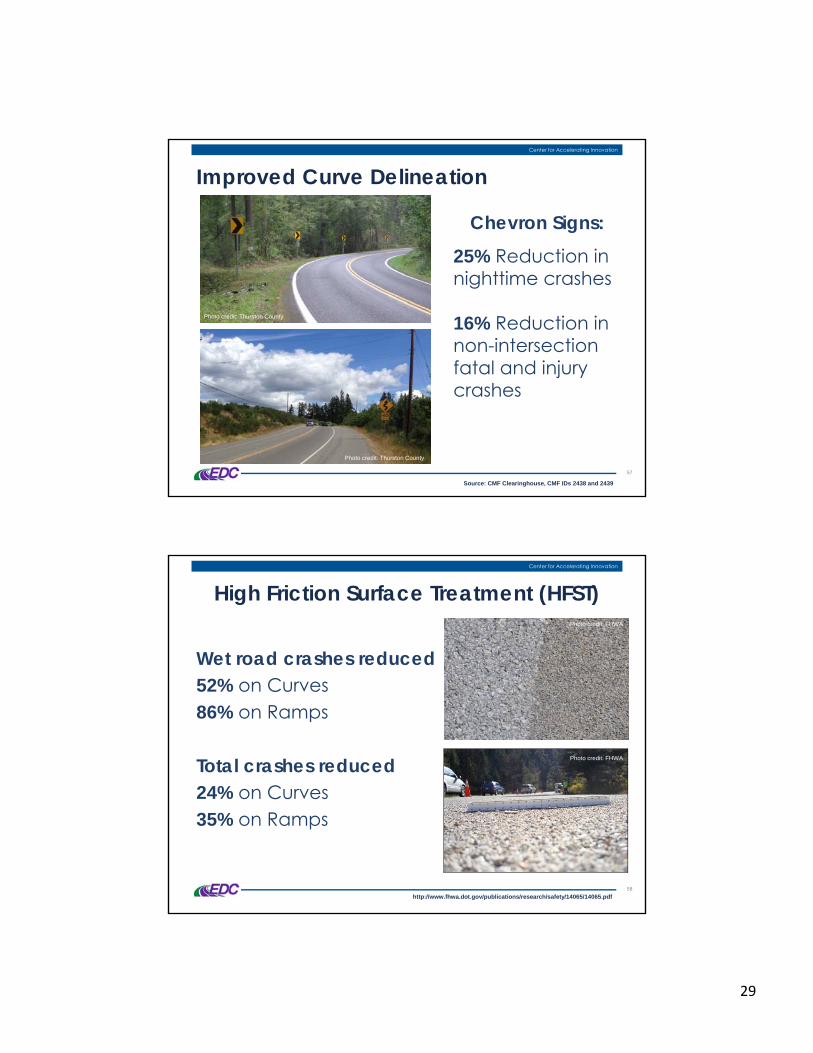
Quantitative Crash Analysis Methods
35
Center for Accelerating Innovation
Qualitative Approach to RiskUse qualitative ratings when needed:
• Good, Fair, Not-So-Good (curve radius, roadside, etc.)
• High, Medium, Low (traffic volumes, pedestrian volumes, crash frequency, etc.)
It is important to include the risk factors that are key to your roadway network
36

19
Center for Accelerating Innovation
Poll question
• Do you have a data-driven plan for your agency to reduce rural roadway departures?
• If so, has it been useful to get projects funded?
37
FRANKLIN COUNTY ENGINEER’S OFFICE
Roadway Departure Programs
38

20
Location Location Location
39
Incremental approach from simple to expensive. Based primarily on the human factor’s research of Ohio University researcher Helmut Zwhalen
Small hot spotSmall systemic
Raised Pavement Markers 6” Center and Edge Lines Chevrons and Guardrail Reflectors
Signs on both sides/ Flashing SignsSigns on both sides/speed bars/chevrons
40

21
Medium hot spotMedium systemic
Innovative/Active warning signs (w/Iowa State Research)
Multi‐disciplinary Safety Audits
Crash curve rankings
41
Large hot spotRealignment of curves
Roundabout at intersection at curves
42

22
43
Thurston County Public Works
THURSTON COUNTY
Local Road Safety Plan Case Example
44

23
Thurston County Public Works
WHERE IS THURSTON COUNTY?
45
https://www.thurstoncountywa.gov/tchome/Pages/default.aspx
Thurston County Public Works
THURSTON COUNTY SAFETY FACTS
Thurston County maintains over 1000 miles of roads
131 severe crashes were reported from 2012 to 2016
Over 70% of the severe crashes are reported to be lane departures
46

24
Thurston County Public Works
CRASH DATA CHALLENGES
47
Thurston County Public Works
DATA ANALYSIS – SYSTEMIC SAFETY PROJECT SELECTION TOOL
48
https://safety.fhwa.dot.gov/systemic/

25
Thurston County Public Works
EMPHASIS AREAS
49
2006‐2010 Collision Data
Fatal/Serious Injury Crashes Only
All Roads All Counties Thurston County
Angle (left‐Turn) 16%(2175)
13%(468)
9%(16)
Intersection‐Related 33%(4557)
22%(812)
19%(34)
Horizontal Curve 26%(3674)
39%(1419)
45%(80)
Thurston County Public Works
IMPLEMENTATION
50
1500 Signs 28 miles 65 miles 35 intersections
75,000 lineal feet 30,000 RPM’s 2 miles
Note: Improvements were completed over several HSIP funding programs and also through local forces

26
Thurston County Public Works
RESULTS
51
35% Reduction in
target crashes
Used Proven
Counter-measures
LSRPby
County staff
Thurston County Local Road Safety
For more information regarding Scott Davis at [email protected] or see case study at
https://safety.fhwa.dot.gov/systemic/tc.cfm
Center for Accelerating Innovation
52

27
Center for Accelerating Innovation
Poll question
• What data do you use?
53
Center for Accelerating Innovation
WHAT?
• Widespread, systemic deployment of underutilized proven roadway departure countermeasures
54
Systemic Deployment
Proven RRwDCountermeasures
Why?How?
What?
RRwD = 1/3 traffic deaths

28
Center for Accelerating Innovation
Roadway Departure Objectives
55
1st - Keep vehicles on the road
2nd - Reduce the potential for crashes
3rd - Minimize the severity
Center for Accelerating Innovation
Strategies include:
Improved curve delineation
Friction treatments in curves and other spot locations
Edge line, shoulder & center line rumble strips.
1st - Keep vehicles on the road
56
29
Center for Accelerating Innovation
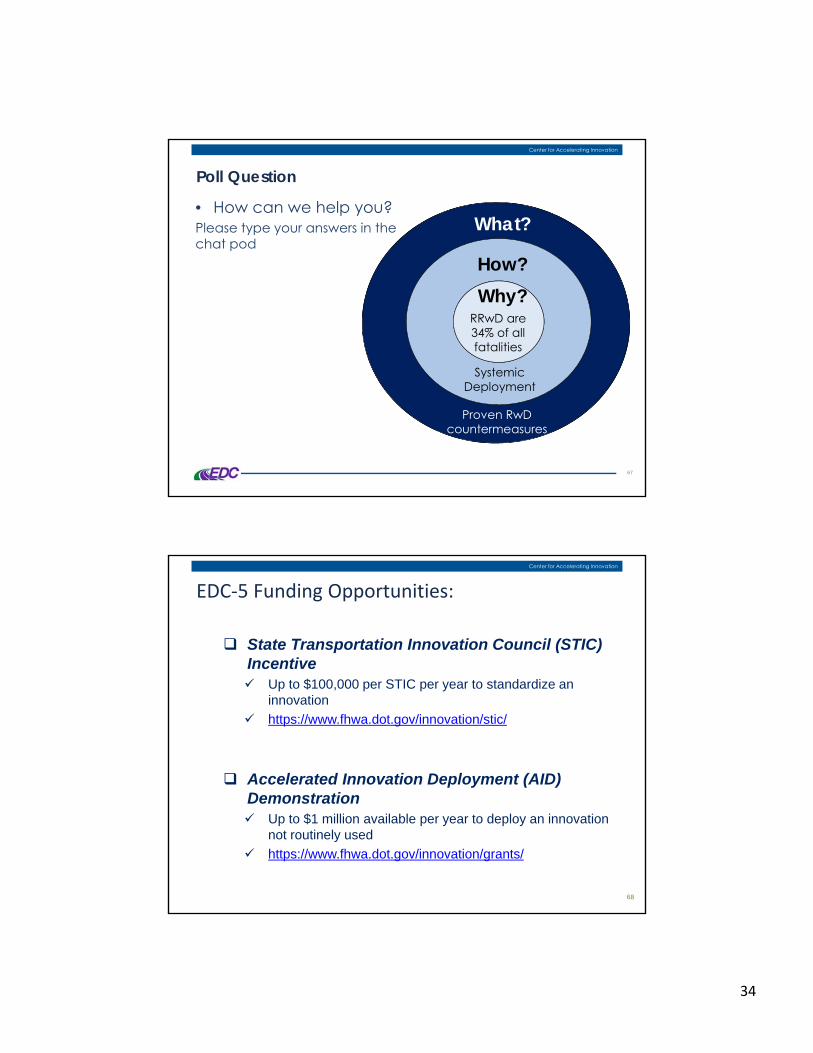
Improved Curve Delineation
Source: CMF Clearinghouse, CMF IDs 2438 and 2439
Photo credit: Thurston County
Photo credit: Thurston County
57
Chevron Signs:
25% Reduction in nighttime crashes
16% Reduction in non-intersection fatal and injury crashes
Center for Accelerating Innovation
High Friction Surface Treatment (HFST)
Wet road crashes reduced52% on Curves 86% on Ramps
Total crashes reduced24% on Curves 35% on Ramps
http://www.fhwa.dot.gov/publications/research/safety/14065/14065.pdf
Photo credit: FHWA
Photo credit: FHWA
58

30
Center for Accelerating Innovation
Edge & Center Rumble StripsPhoto credit: FHWA
Photo credit: FHWA
Photo credit: FHWA
59
Center Line Rumble StripsHead-on, opposite-direction,
and sideswipe fatal and injury crashes reduced by
44-64%
Shoulder Rumble StripsReduction in Single vehicle, run-off-road fatal and injury
crashes reduced by13-51%
http://safety.fhwa.dot.gov/roadway_dept/pavement/rumble_strips/t504040/http://safety.fhwa.dot.gov/roadway_dept/pavement/rumble_strips/t504039/
Center for Accelerating Innovation
Strategies include:
SafetyEdgeSM
Maintained clear zones
Traversable roadside slopes
2nd - Reduce the potential for crashes
60

31
Center for Accelerating Innovation
SafetyEdgeSM
http://safety.fhwa.dot.gov/SafetyEdge/
With SafetyEdge Without SafetyEdge
Drop-off’s crashes 34%Head-on crashes 19%
Run-off-Road crashes 21%Fatal and injury crashes 11%
Photo credit: FHWA Photo credit: FHWA
61
Crash Reduction Factors
https://safety.fhwa.dot.gov/provencountermeasures/safety_edge/fhwasa17044/
Center for Accelerating Innovation
Establish and Maintain Clear ZonesAASHTO Definition — The unobstructed, traversable area provided beyond the edge of the through traveled way for the recovery of errant vehicles
Photo credit: FHWA
62

32
Center for Accelerating Innovation
Traversable Roadside SlopesSlopes that are flatter than 3H:1V are traversable
• 1V:2H to 1V:4 H → 10% reduction in SVROR
• 1V:3H to 1V:6 H → 19% reduction in SVROR
Photo credit: FHWA
Photo credit: FHWA
63
Source: AASHTO Highway Safety Manual
Center for Accelerating Innovation
Strategies include:
Breakaway Features• Signs and luminaire supports• Utility poles
Barriers to shield obstacles including:
• Trees and shrubbery • Other fixed objects • Slopes
3rd - Minimize the severity
64

33
Center for Accelerating Innovation
Polling Questions on systemic application
• Which of the following have you applied systemically on rural roads?
• For the ones you did not select, what are the reasons?
65
Center for Accelerating Innovation
EDC-5 Offerings and Products
Technical Assistance• Local and Regional
Safety Action Plans• Systemic analysis• Peer exchanges• Focus groups on
implementation
66
Training• Webinars• Existing, revised, and
new training• Train-the-trainer• LTAP resource packet
34
Center for Accelerating Innovation
Poll Question
• How can we help you?Please type your answers in the chat pod
67
Proven RwDcountermeasures
Systemic Deployment
Why?How?
What?
RRwD are 34% of all fatalities
Center for Accelerating Innovation
EDC‐5 Funding Opportunities:
68
State Transportation Innovation Council (STIC) Incentive Up to $100,000 per STIC per year to standardize an
innovation
https://www.fhwa.dot.gov/innovation/stic/
Accelerated Innovation Deployment (AID) Demonstration Up to $1 million available per year to deploy an innovation
not routinely used
https://www.fhwa.dot.gov/innovation/grants/

35
Center for Accelerating Innovation
69
Center for Accelerating Innovation
Innovation Deployment News
70
Weekly newsletter
Bi-monthly magazine
To Subscribe: Email: https://www.fhwa.dot.gov/innovation/
Text: Send “FHWA Innovation” to 468311