reducing water use – pressure, pipework and hoses · 02 reducing water use – pressure, pipework...
TRANSCRIPT

Reducing water use – pressure, pipework and hoses
Guidance Leaflet
www.wrap.org.uk/rippleffect
All businesses use water in some way, whether for domestic use, in the manufacturing process or for ancillary activities. Usually, water is delivered to the site and to the point of use under pressure through pipes. The water pressure and the pipework diameter will influence the rate of flow of water. Consequently, they will also influence the rate of use.
The water pressure at the point of use has a significant •effect on the flow rate – the greater the pressure, the greater the flow.
The diameter and configuration of the pipework will •also influence the rate of water use - the larger the diameter, the greater the flow at a given pressure.
In general, these factors can be easily optimised such that water use is reduced without compromising production. With few exceptions, once optimised, any savings achieved will be repeated year on year.
Pressure
Pressure is required in a water distribution system to push the water through the pipes to the point of use and to overcome pressure loss or ‘head’ loss. Pressure loss can be due to:
friction losses against pipe walls, valves and bends •(dynamic head); and
pushing water uphill, for example to an elevated tank •(static head).
While adequate pressure is necessary to overcome these pressure losses, too great a pressure will cause excessive flow at the point of use. This may not be important when filling a set-volume vessel (e.g. a tank) because it simply fills up more quickly. However, for other uses, such as taps, hoses or spray bars, excessive pressure can lead to a waste of water. Excessive pressure can also lead to greater wear and tear on the plumbing system and may cause or exacerbate leakage.
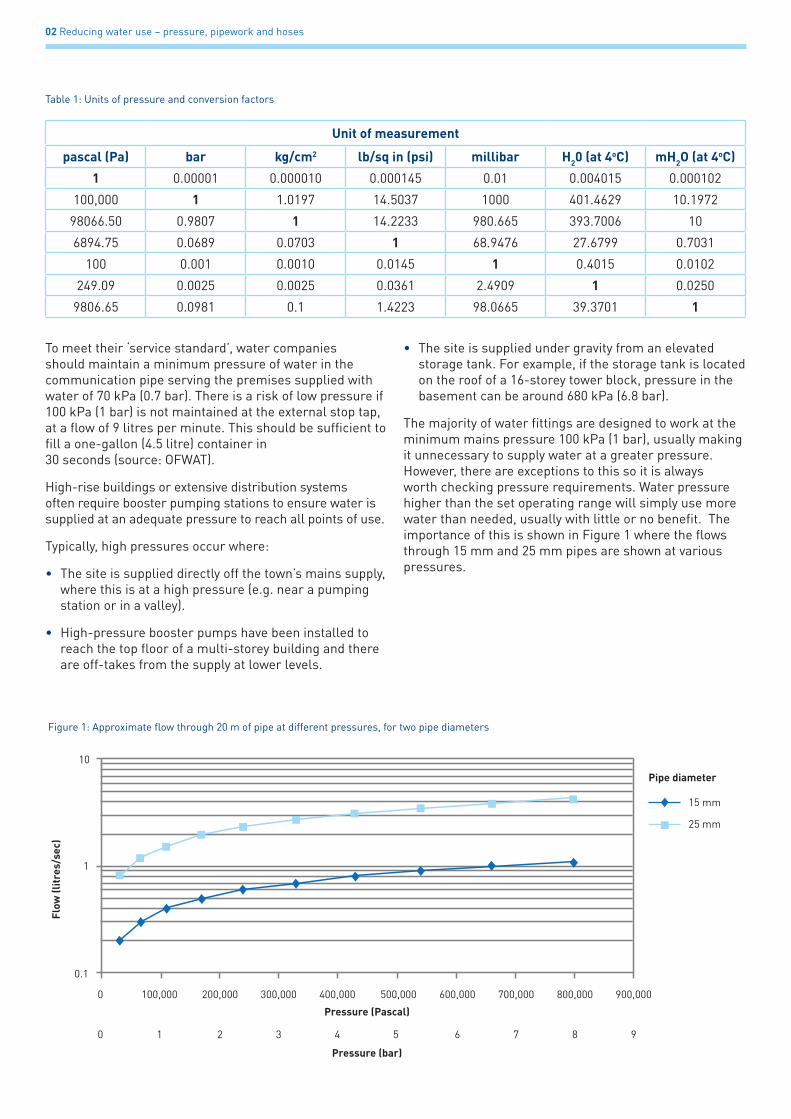
Water pressure is measured in a variety of units. Table 1 shows the most frequently used units of measure and how they relate to one another.
02 Reducing water use – pressure, pipework and hoses
Table 1: Units of pressure and conversion factors
To meet their ‘service standard’, water companies should maintain a minimum pressure of water in the communication pipe serving the premises supplied with water of 70 kPa (0.7 bar). There is a risk of low pressure if 100 kPa (1 bar) is not maintained at the external stop tap, at a flow of 9 litres per minute. This should be sufficient to fill a one-gallon (4.5 litre) container in 30 seconds (source: OFWAT).
High-rise buildings or extensive distribution systems often require booster pumping stations to ensure water is supplied at an adequate pressure to reach all points of use.
Typically, high pressures occur where:
The site is supplied directly off the town’s mains supply, •where this is at a high pressure (e.g. near a pumping station or in a valley).
High-pressure booster pumps have been installed to •reach the top floor of a multi-storey building and there are off-takes from the supply at lower levels.
The site is supplied under gravity from an elevated •storage tank. For example, if the storage tank is located on the roof of a 16-storey tower block, pressure in the basement can be around 680 kPa (6.8 bar).
The majority of water fittings are designed to work at the minimum mains pressure 100 kPa (1 bar), usually making it unnecessary to supply water at a greater pressure. However, there are exceptions to this so it is always worth checking pressure requirements. Water pressure higher than the set operating range will simply use more water than needed, usually with little or no benefit. The importance of this is shown in Figure 1 where the flows through 15 mm and 25 mm pipes are shown at various pressures.
Unit of measurement
pascal (Pa) bar kg/cm2 lb/sq in (psi) millibar H20 (at 4oC) mH2O (at 4oC)
1 0.00001 0.000010 0.000145 0.01 0.004015 0.000102
100,000 1 1.0197 14.5037 1000 401.4629 10.1972
98066.50 0.9807 1 14.2233 980.665 393.7006 10
6894.75 0.0689 0.0703 1 68.9476 27.6799 0.7031
100 0.001 0.0010 0.0145 1 0.4015 0.0102
249.09 0.0025 0.0025 0.0361 2.4909 1 0.0250
9806.65 0.0981 0.1 1.4223 98.0665 39.3701 1
0.1
0 100,000 200,000 300,000 400,000 500,000 600,000 700,000 800,000 900,000
1
10
Flow
(lit
res/
sec)
Pressure (Pascal)
Figure 1: Approximate flow through 20 m of pipe at different pressures, for two pipe diameters
0.10 100,000 200,000 300,000 400,000
Pressure (Pascal)
Flow
(lit
res/
sec)
Approximate flow through 20m of pipe as pressure changes
500,000 600,000 700,000 800,000 900,000
1
10
15mm dia 25mm dia
0.10 100,000 200,000 300,000 400,000
Pressure (Pascal)
Flow
(lit
res/
sec)
Approximate flow through 20m of pipe as pressure changes
500,000 600,000 700,000 800,000 900,000
1
10
15mm dia 25mm dia15 mm
Pipe diameter
25 mm
0.10 100,000 200,000 300,000 400,000
Pressure (Pascal)
Flow
(lit
res/
sec)
Approximate flow through 20m of pipe as pressure changes
500,000 600,000 700,000 800,000 900,000
1
10
15mm dia 25mm dia
0 1 2 3 4 5 6 7 8 9
Pressure (bar)

Reducing water use – pressure, pipework and hoses 03
Apart from the unnecessary use of water, excessive pressure can also:
subject the distribution system and fittings to additional •(unnecessary) wear and tear; and
cause or exacerbate leakage.•
The pressure your water distribution system is operating at can be found from:
your local water company, which may be able to inform •you about supplies direct from the mains.
looking at your booster pumps – these usually have a •pressure indicator (delivery pressure) or set point; and
pressure gauges in your system (if gauges are not •fitted, it is worth installing them – they typically cost between £10 and £20, excluding fitting).
ActionsEstablish the pressure(s) of the cold and hot 1. water distribution system(s) on your site.
Install pressure gauges in appropriate 2. locations if necessary.
ActionWork out how much 1 m1. 3 of water costs you. Do this for each type of water used (e.g. hot water, cold water, softened water).
Remember that additional costs will also be incurred for disposal of any wastewater to sewer, typically between £0.54 and £2.67/m3.
Pumping costs may also be incurred if a site has a booster pumping station. These costs can be estimated from the following equation:
Energy is wasted when booster pumps are set to deliver and maintain excessive pressures. The example below calculates the additional power required to pump 100 m3/hour to the roof of a 7-storey building (i.e. 32 m high) at a head of 70 m (7 bar) rather than an adequate 50 m (5 bar):
With electricity costs of 9.5 p/kWh and an 8-hour day, 6-day week operation for 48 weeks, the annual cost for unnecessary pumping will be about £1,985. This excludes any costs for excessive water use if there are any take-off points at the unnecessarily high pressure.
Hidden COsTs OF exCessive PressUre Controlling pressure can usually save more than the direct cost of the water alone. Often, the amount of hot water used (which has added value) can also be reduced and so can the energy costs for any on-site pumping. Understanding the true cost of water is important for calculating the savings that can be made by improving water efficiency.
Typical costs for water:
1 UK mains supply based on standard 2010/11 tariffs2 Energy costs at 3.6p/kWh for gas and 9.5p/kWh electricity, using a boiler with 90% efficiency3 Pump efficiency can be obtained from pump manufacturer
Power (kW)
Additional power (kW)
1.66 x 70
31.75
9.07 kW
1.66 x 50
22.68
6.1 x 0.6 6.1 x 0.6=
=
=
-
-
flow (m3/minute) x delivery head (m)
6.1 x pump efficiency=
Where: 6.1 is the units conversion factor Efficiency of a typical pump ≈ 60 – 70%3
UK mains supply1 £0.59 – £1.75/m3
Softened water £1.00 - £2.16/m3
Hot water (60°C) – gas heated2 £2.82 - £3.98/m3
Hot water (60°C) – electrically heated2 £6.48 - £7.64/m3

04 Reducing water use – pressure, pipework and hoses
saving water by reducing pressure
When considering reducing water pressure, it is important to:
identify the minimum operating pressure required that •will not compromise performance (i.e. that equipment will operate effectively at the lower pressure); and
check that mixer taps or shower mixer units will not •be adversely affected by the new pressures (i.e. the thermostatic control will still operate).
Although there may be items of equipment that require a higher pressure, it is unlikely that the whole water distribution system will need to be operated at that pressure.
Two easy methods of controlling the pressure in a water distribution system are:
adjusting booster pump set-points; and •
fitting pressure reducing valves (PRVs).•
bOOsTer PUmPsBooster pump units often have a simple dial or preset in the control panel to set the desired delivery pressure. Adjusting the delivery pressure will reduce the pressure to the entire distribution system. Undertake this adjustment with care and seek further advice if necessary.
The cost of reducing the pressure in this way is low and reversible – the original pressure can be reinstated if necessary.
PressUre redUCing vAlves PRVs can be used to control the pressure of the incoming mains, the distribution system or specific points. For example, PRVs can be installed on:
the supply to each floor; •
the down legs of a gravity-fed distribution system; •
the risers in a pumped system; and•
the supply to hoses.•
PRVs can be preset or adjustable; the latter offers more flexibility in operation. Typically, they can accept delivery pressures of up to 2,500 kPa (25 bar) and deliver a pressure of between 150 kPa and 600 kPa (1.5 bar and 6 bar), under variable flow conditions. They are available in a number of sizes - an adjustable PRV will cost around £20 (15 mm) to £200 (50 mm), excluding installation. Pressure gauges are optional on some PRVs, but having one fitted is worthwhile in many situations. The use of PRVs in the water supply industry is commonplace.
Typical locations of PRVs are shown in Figure 3.Figure 2: Typical booster pump unit (courtesy of Lyreco)
ActionsIdentify the location of any booster pump 1. units on your site.
Establish which areas of your site the booster 2. pumps supply and what the current pressure settings are.
Check whether the set pressure could be 3. reduced.
Reduce the set pressure if possible and check 4. that the water supply is not adversely affected.
Reducing water use – pressure, pipework and hoses 05
How reduced flow is assessed
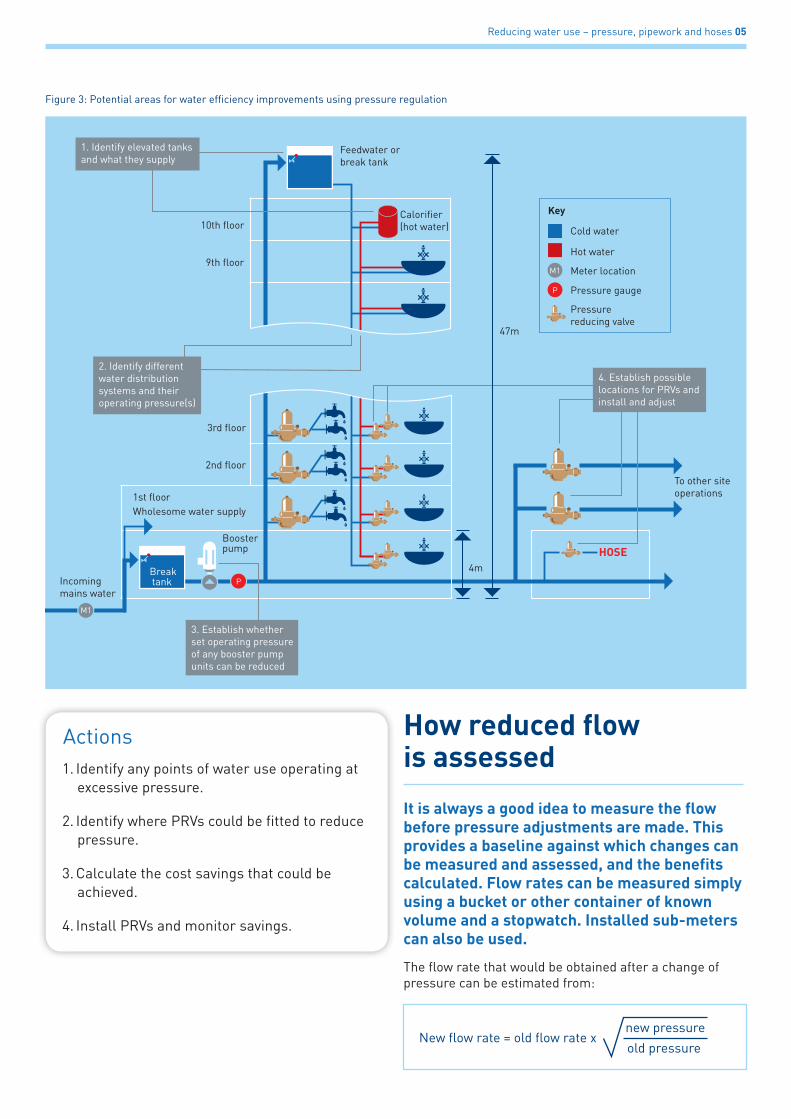
it is always a good idea to measure the flow before pressure adjustments are made. This provides a baseline against which changes can be measured and assessed, and the benefits calculated. Flow rates can be measured simply using a bucket or other container of known volume and a stopwatch. installed sub-meters can also be used.
The flow rate that would be obtained after a change of pressure can be estimated from:
Figure 3: Potential areas for water efficiency improvements using pressure regulation
Calorifier (hot water)
Booster pump
To other site operations
Incoming mains water
10th floor
9th floor
3rd floor
2nd floor
1st floor
4mHOSE
47m
Wholesome water supply
Feedwater or break tank
Break tank
1. Identify elevated tanks and what they supply
3. Establish whether set operating pressure of any booster pump units can be reduced
4. Establish possible locations for PRVs and install and adjust
P
M1
Cold water
Hot water
Meter location
Pressure reducing valve
Key
M1
Pressure gaugeP
2. Identify different water distribution systems and their operating pressure(s)
ActionsIdentify any points of water use operating at 1. excessive pressure.
Identify where PRVs could be fitted to reduce 2. pressure.
Calculate the cost savings that could be 3. achieved.
Install PRVs and monitor savings.4.
New flow rate = old flow rate x old pressure
new pressure
06 Reducing water use – pressure, pipework and hoses
To properly assess the benefits of reducing pressure, it is important to calculate total flow rates and water savings accurately, and take into account all cost savings. For example, if PRVs were fitted to the hot and cold supplies to the sinks in the ground floor washrooms shown in Figure 3 then, using the following information, the cost savings that could be achieved can be calculated:
Number of handwashes per day – 350 •
Duration of handwash (mainly hot water tap) – 20 s•
Pressure reduced from 470 kPa (4.7 bar) to 125 kPa •(1.25 bar)
Flow rate per tap before PRVs installed – •15 litres/minute
Flow rate per tap after PRVs installed – 7 litres/minute•
At a site working 6 days a week, for 50 weeks of the year, the annual saving is around 279,900 litres of water, or nearly 280 m3/year.
As most of this water use is from the hot tap, with a cost of water supply and heating (gas) at £3.40/m3 together with sewerage charges of £1.61/m3, the cost saving by fitting two PRVs (one each for hot and cold supply) will be about £1,402/year (excluding the PRV purchase and fitting costs).
Pipework
Pipework in a water distribution system is usually sized to minimise the dynamic head loss.
This is achieved by using pipes with a large diameter to keep the velocity down – usually to less than 1.5 – 2 m/s at maximum flow. If this is exceeded, then turbulent flow in the pipe increases to a point where it may become noisy (the typical sound of water rushing through a pipe) or cavitation occurs, which is the formation of small bubbles. These will gradually erode pipework and/or fittings.
However, this is not necessarily the case at the point of use – and pipe sizing, particularly on hoses, can have a significant effect on water use.
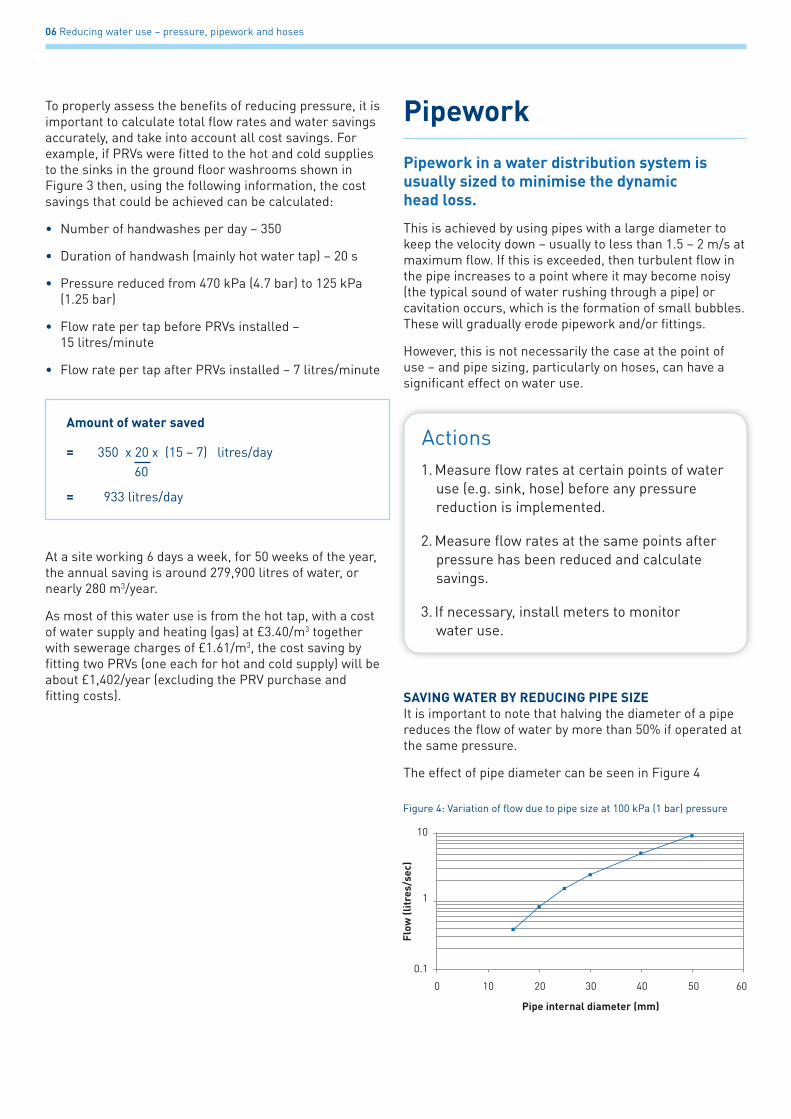
sAving WATer by redUCing PiPe sizeIt is important to note that halving the diameter of a pipe reduces the flow of water by more than 50% if operated at the same pressure.
The effect of pipe diameter can be seen in Figure 4
ActionsMeasure flow rates at certain points of water 1. use (e.g. sink, hose) before any pressure reduction is implemented.
Measure flow rates at the same points after 2. pressure has been reduced and calculate savings.
If necessary, install meters to monitor 3. water use.
Figure 4: Variation of flow due to pipe size at 100 kPa (1 bar) pressure
0.1
Pipe internal diameter (mm)
1
10
0 10 20 30 40 50 60
Flow
(lit
res/
sec)
0.1
Pipe internal diameter (mm)
1
10
0 10 20 30 40 50 60
Flow
(lit
res/
sec)
0.1
Pipe internal diameter (mm)
1
10
0 10 20 30 40 50 60
Flow
(lit
res/
sec)
0.1
Pipe internal diameter (mm)
1
10
0 10 20 30 40 50 60
Flow
(lit
res/
sec)
0.1
Pipe internal diameter (mm)
1
10
0 10 20 30 40 50 60
Flow
(lit
res/
sec)
0.1
Pipe internal diameter (mm)
1
10
0 10 20 30 40 50 60
Flow
(lit
res/
sec)
0.1
Pipe internal diameter (mm)
1
10
0 10 20 30 40 50 60
Flow
(lit
res/
sec)
0.1
Pipe internal diameter (mm)
1
10
0 10 20 30 40 50 60
Flow
(lit
res/
sec)
0
1
10
10 20 30 40 50 60
Pipe internal diameter (mm)
Flow
(lit
res/
sec)
0.1
Amount of water saved
350 x 20 x (15 – 7) litres/day
933 litres/day
60=
=

Reducing water use – pressure, pipework and hoses 07
Greater pipe diameter can lead to significant overuse of water. For example, an open-ended 25 mm (1”) diameter hose that is 45 m long and operated at 400 kPa (4 bar) will deliver around 36 litres/minute. If it is used for 2 hours/day, 260 days/year, the total annual water use will be about 1,123 m3.
A 15 mm (1/2”) diameter hose of the same length and operating at the same pressure, delivers only about 9 litres/minute (i.e. a quarter of the flow). Used for the same duration, this smaller hose would only use 281 m3/year – saving a considerable 842 m3/year.
It is important to note that this concept also applies to taps and any other open discharge – if the diameter can be reduced with no detrimental effect, then the water and cost savings can be significant. More detail on reducing flows through taps is given in EN664 ‘Reducing water use in washrooms: taps’, available on the WRAP website.4
4 http://envirowise.wrap.org.uk
ActionsIdentify any hoses or other open discharges 1. of water (e.g. pipes into rinsing tanks).
Review opportunities for reducing the 2. diameter of pipework.
Modify pipework, and assess water and cost 3. savings achieved.
www.wrap.org.uk/rippleffect
Waste & resources Action Programme
December 2010
The Old Academy 21 Horse Fair Banbury, Oxon OX16 0AH
Tel: 01295 819 900 Fax: 01295 819 911 E-mail: [email protected]
Resource Efficiency helpline 0808 100 2040