reef rescue marine monitoring...
TRANSCRIPT

Reef Rescue Marine Monitoring ProgramFinal Report of AIMS Activities 2011
Inshore Coral Reef Monitoring
Angus Thompson, Paul Costello, Johnston Davidson, Murray Logan,Britta Schaffelke, Miwa Takahashi, Sven Uthicke
PRODUCED FORThe Great Barrier Reef Marine Park Authority
TownsvilleDecember 2011


Reef Rescue Marine Monitoring Program Inshore reef monitoring – Final Report 2011
Australian Institute of Marine SciencePMB No 3Townsville MC Qld 4810
This report should be cited as:Thompson A, Costello P, Davidson J, Logan M, Schaffelke B, Uthicke S Takahashi M (2011) Reef Rescue Marine Monitoring Program. Report of AIMS Activities – Inshore coral reef monitoring 2011. Report for Great Barrier Reef Marine Park Authority. Australian Institute of Marine Science, Townsville. 128 pp.
© Copyright .Australian Institute of Marine Science (AIMS) 2011
All rights are reserved and no part of this document may be reproduced, stored or copied in any form or by any means whatsoever except with the prior written permission of AIMS.
DISCLAIMERWhile reasonable efforts have been made to ensure that the contents of this document are factually correct, AIMS does not make any representation or give any warranty regarding the accuracy, completeness, currency or suitability for any particular purpose of the information or statements contained in this document. To the extent permitted by law AIMS shall not be liable for any loss, damage, cost or expense that may be occasioned directly or indirectly through the use of or reliance on the contents of this document.

Reef Rescue Marine Monitoring Program Inshore reef monitoring – Final Report 2011
ContentsList of Figures and Tables.........................................................................................................iiExecutive Summary.................................................................................................................ivPreface......................................................................................................................................1
1. Introduction to the MMP Inshore Coral Reef Monitoring..................................................2
2. Methods.............................................................................................................................52.1 Sampling design.........................................................................................................5
2.1.1 Site Selection......................................................................................................52.1.2 Depth Selection...................................................................................................5
2.2 Field survey methods.................................................................................................82.2.1 Site marking........................................................................................................82.2.2 Sampling methods...............................................................................................8
2.3 Sediment quality monitoring.....................................................................................112.4 Sea temperature monitoring.....................................................................................112.5 Autonomous Water Quality Loggers........................................................................122.6 Data analyses...........................................................................................................12
2.6.1 Assessment of coral reef community condition.................................................13
3. Results and discussion....................................................................................................173.1 GBR-wide summary of changes in environmental variables and benthic communities
between 2009 and 2010 with reference to changes since 2005.................................173.1.1 Sediment quality................................................................................................173.1.2 Turbidity.............................................................................................................213.1.3 Sea temperature monitoring..............................................................................223.1.4 Condition of inshore coral reef communities.....................................................24
3.2 Description of coral and foraminifera communities on survey reefs in each region. 393.2.1 Wet Tropics Region: Barron Daintree sub-region.............................................393.2.2 Wet Tropics Region: Johnstone Russell-Mulgrave sub-region.........................453.2.3 Wet Tropics Region: Herbert Tully sub-region..................................................553.2.4 Burdekin Region................................................................................................613.2.5 Mackay Whitsunday Region..............................................................................723.2.6 Fitzroy Region...................................................................................................83
4. Conclusions........................................................................................................................93Acknowledgments...............................................................................................................98
5. References......................................................................................................................99
Appendix 1: Detailed data tables..........................................................................................107Appendix 2: QAQC Information............................................................................................123Appendix 3: Analysis of disease as a function of river discharge.........................................124Appendix 4: Details of statistical analysis of potential drivers of hard coral settlement........126Appendix 5: List of Scientific Publications arising from the Programme 2011......................128
i

Reef Rescue Marine Monitoring Program Inshore reef monitoring – Final Report 2011
List of Figures and Tables
Figure 1 Sampling locations of the Reef Rescue MMP inshore coral monitoring...................6Figure 2 Regional trends in sediment composition...............................................................19Figure 3 Regional trends in turbidity.....................................................................................21Figure 4 Sea temperature monitoring 2005 to 2011.............................................................23Figure 5 Regional report card scores....................................................................................26Figure 6 Regional trends in hard coral cover........................................................................28Figure 7 Regional trends in soft coral cover..........................................................................29Figure 8 Regional trends in macroalgae cover.....................................................................30Figure 9 Regional trends in juvenile hard coral density........................................................32Figure 10 Regional trends in hard coral richness (based on number of genera)..................33Figure 11 Regional trends in juvenile hard coral richness (based on number of genera).....34Figure 12 Regional trends in coral settlement......................................................................35Figure 13 Regional trends in density of foraminifera............................................................37Figure 14 Regional trends in the FORAM index...................................................................38Figure 15 Reef Rescue MMP inshore coral reef monitoring sites: Barron Daintree sub-region, Wet Tropics Region....................................................................................................39Figure 16 Cover of major benthic groups and levels of key environmental parameters: Barron Daintree sub-region, Wet Tropics Region...................................................................42Figure 17 Composition of hard coral communities: Barron Daintree sub-region, Wet Tropics Region.....................................................................................................................................43Figure 18 Composition of foraminiferal assemblages: Barron Daintree sub-region, Wet Tropics Region........................................................................................................................44Figure 19 Reef Rescue MMP inshore coral reef monitoring sites: Johnstone Russell-Mulgrave sub-region, Wet Tropics Region.............................................................................46Figure 20 Cover of major benthic groups and levels of key environmental parameters: Johnstone Russell-Mulgrave sub-region, Wet Tropics Region...............................................49Figure 21 Composition of hard coral communities: Johnstone Russell-Mulgrave sub-region, Wet Tropics Region................................................................................................................51Figure 22 Coral settlement to tiles: Johnstone Russell-Mulgrave sub-region, Wet Tropics Region.....................................................................................................................................52Figure 23 Composition of foraminiferal assemblages: Johnstone Russell-Mulgrave sub-region, Wet Tropics Region....................................................................................................54Figure 24 Reef Rescue MMP inshore coral reef monitoring sites (yellow symbols): Herbert Tully sub-region, Wet Tropics Region.....................................................................................55Figure 25 Cover of major benthic groups and levels of key environmental parameters: Herbert Tully sub-region, Wet Tropics Region........................................................................58Figure 26 Composition of hard coral communities: Herbert Tully sub-region, Wet Tropics Region.....................................................................................................................................59Figure 27 Composition of foraminiferal assemblages: Herbert Tully sub-region, Wet Tropics Region.....................................................................................................................................60Figure 28 Reef Rescue MMP inshore coral reef monitoring sites: Burdekin Region............61Figure 29 Cover of major benthic groups and levels of key environmental parameters: Burdekin Region.....................................................................................................................66Figure 30 Composition of hard coral communities: Burdekin Region...................................68Figure 31 Coral settlement to tiles: Burdekin Region............................................................70Figure 32 Composition of foraminiferal assemblages: Burdekin Region..............................71Figure 33 Reef Rescue MMP inshore coral reef monitoring sites: Mackay Whitsunday Region.....................................................................................................................................73Figure 34 Cover of major benthic groups and levels of key environmental parameters: Mackay Whitsunday Region...................................................................................................77Figure 35 Composition of hard coral communities: Mackay Whitsunday Region.................79
ii

Reef Rescue Marine Monitoring Program Inshore reef monitoring – Final Report 2011
Figure 36 Coral settlement to tiles: Mackay Whitsunday Region..........................................81Figure 37 Composition of foraminiferal assemblages: Mackay Whitsunday Region............82Figure 38 Reef Rescue MMP inshore coral reef monitoring sites: Fitzroy Region...............84Figure 39 Cover of major benthic groups and levels of key environmental parameters: Fitzroy Region.........................................................................................................................88Figure 40 Composition of hard coral communities: Fitzroy Region......................................90Figure 41 Coral settlement to tiles Fitzroy Region................................................................91Figure 42 Composition of foraminiferal assemblages: Fitzroy Region..................................92
Figure A3- 1 Response of coral disease to runoff..............................................................125Figure A4- 1 Environmental drivers of hard coral settlement..............................................127
Table 1 Coral reef sampling 2005 to 2011..............................................................................7Table 2 Summary of sampling methods applied in the MMP inshore coral reef monitoring. . .8Table 3 Locations and periods of coral settlement tile deployment.......................................10Table 4 Threshold values for the assessment of coral reef condition and resilience............16Table 5 Annual freshwater discharge for the major GBR Catchment rivers influencing the MMP coral monitoring sites.....................................................................................................18Table 6 Regional and sub-regional estimates of coral community condition........................24Table 7 Benthic community condition: Barron Daintree sub-region, Wet Tropics Region.....41Table 8 Benthic community condition: Johnstone Russell-Mulgrave sub-region, Wet Tropics Region.....................................................................................................................................48Table 9 Benthic community condition: Herbert Tully sub-region, Wet Tropics Region.........57Table 10 Benthic community condition: Burdekin Region.....................................................65Table 11 Benthic community condition: Mackay Whitsunday Region...................................76Table 12 Benthic community condition: Fitzroy Region.......................................................87
Table A1- 1 Clay and silt content of sediments...................................................................107Table A1- 2 Organic carbon content of sediments..............................................................108Table A1- 3 Total nitrogen content of sediments................................................................109Table A1- 4 Inorganic carbon content of sediments............................................................110Table A1- 5 Known disturbances to coral communities at Reef Rescue monitoring locations................................................................................................................................111Table A1- 6 Composition of coral reef communities.Hard coral families (% cover) 2011...113Table A1- 7 Composition of coral reef communities. Common soft coral families (% cover) 2011......................................................................................................................................115Table A1- 8 Composition of coral reef communities. Common macroalgal genera and families (% cover) 2011........................................................................................................117Table A1- 9 Composition of juvenile hard coral communities. Common families (count per 34m2) 2011............................................................................................................................119Table A1- 10 Composition of juvenile soft coral communities. Common families (count per 34m2) 2010............................................................................................................................121Table A1- 11 FORAM index baseline values......................................................................122Table A1- 12 Percent cover of Silt for reefs in the Mackay Whitsunday region..................122
iii

Reef Rescue Marine Monitoring Program Inshore reef monitoring – Final Report 2011
Executive Summary
The coral reef monitoring component of the Reef Rescue Marine Monitoring Program (MMP) undertaken in 2011 was a continuation of activities under previous arrangements from 2005 to 2010. The coral monitoring program continued to survey the cover of benthic organisms, the numbers of coral genera, the number of juvenile-sized coral colonies and sediment quality at 27 inshore reef locations in four Natural Resource Management regions: Wet Tropics; Burdekin; Mackay Whitsunday; and Fitzroy. Monitoring of coral recruitment also continued at three core reef sites in each of the four Regions.
The completion of the seventh inshore coral reef survey under MMP allows for updated assessments of the overall condition of the inshore coral reef communities (see Table below). In summary, the overall regional estimates of condition were unchanged from our previous assessment of 2010. Within NRM regions, however, assessments of some coral community attributes did vary compared to those previously presented as detailed below.
Summary table of the assessment of the overall condition of GBR inshore reef communities in 2011. The regional and sub-regional estimates of coral community condition aggregate assessments of four metrics: coral cover, coral cover change, macroalgal cover and juvenile hard coral density. The regional estimates of these metrics are, in turn, derived from the aggregation of assessments from the reefs within each region (see Section 3.2). The FORAM index assessments are included as a separate metric but are not included in the overall “Condition” assessment for each region. Grey cells indicate no evaluation of the metric in that location. The colour scheme is consistent with reporting to the Paddock to Reef Program with colours reflecting the relative condition of reef communities: red= very poor, orange= poor, yellow= moderate, light green= good, dark green= very good.
Region Sub-region Condition 2011
Coral cover
Coral cover change
Macroalgae cover
Coral juveniles
FORAM index
Barron Daintree
Johnstone, Russell-Mulgrave
Herbert Tully
Wet Tropic
Burdekin
Mackay Whitsunday
Fitzroy
Our assessments of coral reef community condition in 2011 are as follows:
The overall condition of reefs in the Wet Tropics was again assessed as ‘moderate’, however, the underling score declined markedly since 2010. At the sub-regional level, the condition of reefs in the both the Barron Daintree and Johnstone Russell-Mulgrave sub-regions was downgraded from ‘good’ in 2010 to ‘moderate’ in 2011. In part, this downgrading of condition for the Johnstone Russell-Mulgrave sub-region reflects reductions in coral cover and juvenile densities at some reefs that can be linked to acute disturbance as a result of tropical cyclones Tasha and, to a lesser extent, Yasi. However, ongoing disease at Fitzroy Is has also resulted in coral cover declines and, hence, also underperformance of the indicator ‘rate of coral cover change’, which assesses the increase in cover during periods free from acute disturbance against an expected rate. Disease amongst corals at Snapper Is has also
iv

Reef Rescue Marine Monitoring Program Inshore reef monitoring – Final Report 2011
contributed to the downgrading of the condition assessment of reefs in the Barron Daintree sub-Region. In addition, in both the Barron Daintree and Johnstone, Russell-Mulgrave sub-regions, cover of macroalgae increased at some locations and densities of juvenile colonies decreased. In contrast to the above sub-regions, the condition of coral communities on reefs in the Herbert Tully sub-region was again rated as ‘poor’. This ‘poor’ assessment mainly reflected the combined disturbance of cyclones Yasi (2011) and Larry (2006) causing significant reductions in adult coral cover and densities of juvenile corals. While reducing coral cover, Cyclone Yasi also reduced the cover of macroalgae, however this is likely a temporary response to physical removal and we expect macroalgae cover to increase rapidly as was the case following Cyclone Larry. A positive sign, however, was that prior to Cyclone Yasi coral cover was recovering from previous disturbance at moderate rates, indicating some level of resilience.
In 2011, the condition of coral reef communities in the Burdekin Region was again assessed as ‘poor’. Cyclone Yasi reduced both coral and macroalgae cover on several reefs. However, we expect the decline in macroalgae cover to be temporary as available space is high and environmental conditions generally remained conducive to macroalgal growth. Most worrying are reductions in juvenile density that are likely to lead to lower than expected rates of coral cover increase in the future. Although there were high levels of coral settlement at some reefs in 2010, the advent of Cyclone Yasi closely following larval settlement will likely have limited the progression of this recruitment through to juvenile sized colonies in future years.
Coral reef communities in the Mackay Whitsunday Region maintained a ’moderate‘ condition estimate in 2011, though the underlying assessment score has declined (Figure 5). The positive indicators of condition of low cover of macroalgae and moderate cover of corals were balanced against low and declining densities of juvenile colonies and slow rates of increase in hard coral cover. Sediments at the reefs in this region have high proportions of fine grained particles and water turbidity is high: such environmental conditions are known to be stressful to some corals. Higher levels of coral disease in this region were linked to the higher discharge of local rivers, indicating a possible link between elevated runoff resulting from floods in recent years, low rates of coral cover increase, and declines in the density of juvenile corals.
Coral reef communities in the Fitzroy Region maintained a ‘poor’ estimate of condition in 2011. Exposure to low salinity flood waters caused a marked reduction in coral cover and juvenile densities down to at least 2m depth on reefs inshore of Great Keppel Is. This loss of coral cover resulted in a downgrading of this indicator from ‘moderate’ in to 2010 to “poor” in 2011. The decline in juvenile densities led again to a ‘very poor’ assessment for this indicator. Excluding the very low settlement of coral larvae over the summer of 2010/11, there has been an ongoing discrepancy in this region between high rates of coral larvae settling to tiles and the low density of juvenile corals. This lack of progression from available coral larvae through to juvenile colonies along with recently observed low rates of increase in coral cover is of concern for coral community resilience in this region. Levels of coral disease in this region are proportional to annual discharge from the Fitzroy River. In light of flooding of the Fitzroy River in 2008, 2010 and 2011 this link between elevated exposure to runoff and coral stress may explain the lower than expected rates of increase in coral cover over recent years.
Similar to coral communities, the composition of benthic foraminiferal assemblages continued to show distinct regional patterns which reflected differences in water and sediment quality. The condition indicator based on the FORAM index (an indicator of water quality based on the relative proportions of symbiont-bearing, opportunistic and heterotrophic species groups) remained stable and most Regions, and many
v

Reef Rescue Marine Monitoring Program Inshore reef monitoring – Final Report 2011
individual reefs, were again scored as ‘poor’ or ‘very poor’. The foraminiferal assemblages in the inshore GBR changed significantly between 2007 and 2010; the change reflects response patterns identified in experimental studies and support the assumption that the decline of coral reef ecosystem condition has been a response to increased turbidity and nutrient availability due to the recent flood events. The changes in the foraminiferal assemblages also indicate that the negative trajectory of ecosystem health is widespread, e.g. covering a multitude of benthic organisms, a finding also mirrored in the recent MMP seagrass monitoring.
The present assessment of the condition of inshore coral reef communities continues to highlight areas of the GBR where certain aspects of coral communities appear to be under stress and identifies likely causal environmental factors. The monitored coral reef communities are subject not only to acute disturbances, such as tropical cyclones, thermal bleaching, and river floods, but are also under the constant influence of coastal processes that determine the ambient water quality at each individual site. It is emerging that the variation of environmental conditions between years, particularly with respect to the magnitude of river discharges during the wet season, is sufficient to alter the dynamics of coral reef communities on inshore reefs for extended periods. In all regions we have shown that incidence of coral disease has increased proportionally with the discharge of local rivers. Water turbidity and the proportion of fine-grained particles in the reef sediments have also increased during the period of increasing river discharge, and our data indicate that this is affecting coral growth and recruitment, most likely due to light limitation and smothering.
We conclude that acute disturbances in combination with ensuing periods of elevated environmental stresses brought about by higher turbidity and accumulation of organic matter are the cause of marked shifts in coral community composition and condition. Clearly nothing can be done to prevent coral mortality by acute disturbances such as cyclones or flood-associated plumes of freshwater. However, what can be done is to reduce the sediment, nutrient and contaminant loads carried by rivers that both amplify the impacts of acute disturbances and then suppress recovery from such events.
The recognition of the significance of extreme events for shaping the condition of inshore coral reefs is important to inform the management strategies employed to limit downstream impacts of land runoff. The improvements in GBR catchment management implemented under Reef Plan and Reef Rescue are realistically expected to improve inshore marine water quality. However, we propose that the reduction of event loads of sediments and nutrients, e.g. by improved erosion control measures, should have a higher priority. If this could be achieved in the future it would (i) reduce mortality of the more sensitive components of coral communities and so reduce the degree of recovery required; (ii) maintain higher levels of broodstock and so maximise recovery potential; and (iii) reduce the import of sediments, nutrients and contaminants that chronically suppress recovery by limiting the settlement or survival of juvenile corals through smothering of substrates and juvenile colonies and/or through enhancing the fitness of space competitors such as algae. However, improvements in marine water quality and associated coral reef condition are likely to be slow and difficult to detect because of the highly variable baseline, lags in ecosystem responses and potentially long recovery periods.
vi

Reef Rescue Marine Monitoring Program Inshore reef monitoring – Final Report 2011
Preface
The Reef Rescue Marine Monitoring Program (MMP), formerly known as Reef Water Quality Protection Plan Marine Monitoring Programme (Reef Plan MMP), was designed and developed by the Great Barrier Reef Marine Park Authority (GBRMPA) and is now funded by the Australian Government’s Reef Rescue initiative. Since 2010, the MMP has been managed again by the GBRMPA. A summary of the MMP’s overall goals and objectives and a description of the sub-programs is available at: http://www.gbrmpa.gov.au/about-the-reef/how-the-reefs-managed/science-and-research/our-monitoring-and-assessment-programs/reef-rescue-marine-monitoring-programand at: http://e-atlas.org.au/content/rrmmp.
The MMP forms an integral part of the Paddock to Reef Integrated Monitoring, Modeling and Reporting Program, which is a key action of Reef Plan 2009 and is designed to evaluate the efficiency and effectiveness of implementation and report on progress towards the Reef Plan and Reef Rescue goals and targets. A key output of the Paddock to Reef Program is an annual report card, including an assessment of Reef water quality and ecosystem condition to which the MMP contributes assessments and information. The first Annual Report Card (Anon. 20011), which will serve as a baseline for future assessments, was released in August 2011 (available at www.reefplan.qld.gov.au).
The Australian Institute of Marine Science (AIMS) and the GBRMPA entered into a co-investment contract in May 2011 (updated in December 2011) to provide monitoring activities under the MMP.
The AIMS monitoring activities in the current contract period of the MMP are largely an extension of activities established under a previous arrangements from 2005 to 2010 and are grouped into two components:
Inshore Marine Water Quality Monitoring Inshore coral reef monitoring
This Report presents the results of AIMS coral reef monitoring activities from December 2010 to October 2011, with inclusion of data from previous monitoring years since the MMP began in 2005.
Results from the sub-program "Inshore Marine Water Quality Monitoring" are reported separately (Schaffelke et al. 2011, currently in review), however, relevant water quality data are included in the present report to allow interpretation of water quality effects on coral reef condition.
1

Reef Rescue Marine Monitoring Program Inshore reef monitoring – Final Report 2011
1. Introduction to the MMP Inshore Coral Reef Monitoring
Coral reef communities occur in a wide range of environmental settings with their composition varying in response to environmental conditions such as light availability, sedimentation and hydrodynamics (e.g. Done 1983, Fabricius and De’ath 2001). Coral reefs in the coastal and inshore zones of the Great Barrier Reef (GBR), which are often fringing reefs around continental islands, are located in shallow, and generally more turbid, waters than reefs further offshore, as a result of frequent sediment resuspension and episodic flood events. The reefs adjacent to the developed coast of the central and southern GBR are exposed to land runoff carrying excess amounts of fine sediments and nutrients that have increased since European settlement (Kroon et al. 2010); this increase has been implicated in the decline of some coral reefs and seagrass meadows in these zones (reviewed in Brodie et al. 2008). It is, however, difficult to quantify the changes to coral reef communities caused by runoff of excess nutrients and sediments because of the lack of historical biological and environmental data that predate significant land use changes on the catchment. Research approaches in the past have included a weight of evidence assessment (Fabricius and De’ath 2004) and studies along environmental gradients, in particular related to water quality variables (e.g., van Woesik et al. 1999, Fabricius 2005, Fabricius et al. 2005, Cooper et al. 2007, Uthicke and Nobes 2008, De’ath and Fabricius 2010).
Concerns about the negative effects of land runoff led to the formulation of the Reef Water Quality Protection Plan (Reef Plan) for catchments adjacent to the GBR World Heritage Area by the Australian and Queensland governments in 2003 (Anon. 2003). The Reef Plan was revised and updated in 2009 (Anon. 2009) and has two primary goals:
immediate goal - to halt and reverse the decline in quality of water entering the Reef by 2013;
long-term goal - to ensure that by 2020 the quality of water entering the Reef from adjacent catchments has no detrimental impact on the health and resilience of the Great Barrier Reef.
Reef Plan actions and the Reef Rescue initiatives aim to improve land management practices that are expected to result in measurable positive changes in the downstream water quality of creeks and rivers. These actions and initiatives should, with time, also lead to improved water quality in the coastal and inshore GBR (see Brodie et al. for a discussion of expected time lags in the ecosystem response). Given that the benthic communities on inshore reefs of the Great Barrier Reef show clear responses to gradients in water quality, especially of water turbidity, sedimentation rate and nutrient availability (Death and Fabricius 2010, Thompson et al. 2010a, b), improved land management practices have the potential to reduce levels of chronic environmental stresses impacting coral reef communities.
Reef Plan actions also include the establishment of water quality monitoring programs extending from the paddock to the Reef (Anon. 2010), to assess the effectiveness of the Reef Plan's implementation, which are predominantly funded by the Australian Government’s Reef Rescue initiative. The MMP is now an integral part of this monitoring. The collected monitoring data should provide information on the key aspects of the biological communities that are likely to be sensitive to the environmental pressures of interest, in this case water quality. A significant attribute of a healthy coral community is that it should be self-perpetuating and ‘resilient’, that is, able to recover from disturbance. Common disturbances to inshore reefs include cyclones, often with associated flooding, and thermal bleaching, both of which can result in widespread mortality of corals (e.g. Sweatman et al. 2007). Recovery from such events is reliant on both the recruitment of new colonies and regeneration of
2

Reef Rescue Marine Monitoring Program Inshore reef monitoring – Final Report 2011
existing colonies from remaining tissue fragments (Smith 2008, Diaz-Pulido et al. 2009). Laboratory and field studies show that elevated concentrations of nutrients, agrichemicals, and turbidity, can affect one or more of; gametogenesis, fertilisation, planulation, egg size, and embryonic development in corals (reviewed by Fabricius 2005). High levels of sedimentation (i.e., rate of deposition and level of accumulation on surfaces) can affect larval settlement (Babcock and Smith 2002, Baird et al. 2003, Fabricius et al. 2003) and smother juvenile corals (Harrison and Wallace 1990, Rogers 1990, Fabricius and Wolanski 2000). Any of these water quality-related pressures on the early life stages of corals have the potential to suppress the resilience of communities reliant on recruitment for recovery. Suppression of recovery may lead to long-term degradation of reefs as extended recovery time increases the likelihood that further disturbances will occur before recovery is complete (McCook et al. 2001). For this reason, the MMP includes estimates of the supply of coral larvae, by measuring the number of spat that settle on deployed terracotta tiles, and the density and composition of juvenile coral communities to identify areas of the inshore GBR where there are declines or improvements in these key life history processes.
In addition to influences on the early life stages of corals, the position of a reef along environmental gradients can also influence the health and, hence, distribution of mature colonies. In very general terms, community composition changes along environmental gradients due to the differential abilities of species to derive sufficient energy for growth in a given environmental setting. Corals derive energy in two ways, by feeding on ingested particles and plankton organisms and from the photosynthesis of their symbiotic algae (zooxanthellae). The ability to compensate by feeding for a reduction in energy derived from photosynthesis, e.g. as a result of light attenuation in turbid waters, varies between species (Anthony 1999, Anthony and Fabricius 2000). Similarly, the energy required to shed sediments varies between species due to differences in the efficiencies of passive (largely depending on growth form) or active (such as mucus production) strategies for sediment removal (Rogers 1990, Stafford-Smith and Ormond 1992). At the same time, high nutrient levels may favour organisms that rely solely on particle feeding such as sponges and heterotrophic soft corals which are potential space competitors of hard corals. In addition, macroalgae have higher abundance in areas with high water column chlorophyll concentrations, indicating higher nutrient availability (De’ath and Fabricius 2010). High macroalgal abundance may suppress reef resilience (e.g., Hughes et al. 2007, Cheal et al. 2010; Foster et al. 2008; but see Bruno et al. 2009) by increased competition for space or changing the microenvironment for corals to settle and grow in (e.g. McCook et al. 2001, Hauri et al. 2010). The result is that the combination of environmental parameters at a given location will disproportionately favour some species and thus influence the community composition of coral reef benthos. Documenting and monitoring change in the absolute and relative cover of coral reef communities is an important component of the MMP as our expectations for the rate of recovery from disturbances will differ based on the community composition (Thompson and Dolman 2010).
It is important to note, however, that coral colonies exhibit a degree of plasticity in both their physiology (e.g. Falkowski et al. 1990 and Anthony and Fabricius 2000), and morphology (as reviewed by Todd 2008) which allows them, within limits, to adapt to their environmental setting. This plasticity has the potential to decouple the relationship between benthic communities and their environmental setting, especially in locations that have been spared major disturbance. In effect, stands of large (typically old) colonies may represent relics of communities that recruited and survived through juvenile stages under conditions different to those occurring today. The response of the coral reef community to changes in environmental conditions may be delayed until a severe disturbance resets the community (through mortality of the relic community components) with subsequent recovery favouring species suited to the current conditions.
3

Reef Rescue Marine Monitoring Program Inshore reef monitoring – Final Report 2011
In recognition of the potential lagged response of coral communities to changing conditions, monitoring of benthic foraminifera communities was added to the suite of biological indicators as an indicator of environmental change that appears to respond faster and more specifically to changes in water quality (Schaffelke et al. 2008, Uthicke et al. 2010). The use of foraminifera as coral reef indicators on the GBR was tested at AIMS (see e.g. Uthicke and Nobes 2008, Nobes et al. 2008, Uthicke et al. 2010, Uthicke and Altenrath 2010). After discussions at the 2008 MMP Synthesis Workshop it was decided by the GBRMPA for cost efficiency to collect samples of foraminifera from core reefs every year but to analyse the community composition only every other year, with the option to later analyse samples of the intervening years if a significant change was observed (and if funding was available). However, foraminifera samples collected in 2009 were not analysed because of funding deficiencies in that year. Subsequently it was decided to include annual foraminiferal analysis into the MMP. This report includes the temporal profiles of key attributes of the foraminiferal communities from all reefs analysed to date, i.e. samples collected in 2005 and 2006 under a MTRSF-funded research project and in 2007, 2010 and 2011 as part of the MMP. These attributes include the FORAM Index (Hallock et al. 2003), an indicator of water quality based on the relative proportions of symbiont-bearing, opportunistic and heterotrophic species groups, and the richness and densities of these three groups.
The key goal of the Inshore Coral Reef Monitoring component of the MMP is to accurately quantify temporal and spatial variation in inshore coral reef community condition and relate this variation to differences in local reef water quality. An additional detailed report (Thompson et al. 2010a) has linked the consistent spatial patterns in coral community composition observed over the first three years of the program with environmental parameters. To facilitate the identification of relationships between the composition and resilience of benthic communities and their environmental conditions it is essential that the environmental setting of each monitoring location be adequately described. Water temperature is continuously monitored at all locations to allow e.g., the identification of thermal bleaching events. Assessments of the grain size distribution and nutrient content of sediments were added in 2006/07 as indicators for the accumulation of fine sediments and/or nutrients and to infer the general hydrodynamic setting. The MMP water quality monitoring sites (see separate report, Schaffelke et al. 2011) are matched to the core coral reef monitoring locations, which are monitored annually. We are currently exploring the use of MMP remote sensing data to obtain water quality information for the two-yearly monitored cycle reef sites.
In order to relate inshore coral reef community health to variations in local reef water quality, this project has several key objectives:1. Provide an annual time series of benthic community structure (viz. cover and composition
of sessile benthos such as hard corals, soft corals and algae) for inshore reefs as a basis for detecting changes that correspond to water quality;
2. Provide information about coral recruitment on GBR inshore reefs as a measure for reef resilience;
3. Provide information about sea temperature and sediment quality as indicators of environmental conditions at inshore reefs;
4. Provide an integrated assessment of coral community condition for the inshore reefs monitored to serve as a report card against which changes in condition can be tracked.
This report presents data from the seventh annual survey of coral reef sites under the MMP (undertaken from May 2011 to October 2011; hereafter called “2011”) and the sixth annual observations of coral settlement following spawning in late 2010. These data are presented as time series in the context of prior observations extending back to 2005 and the assessment of coral reef community condition is directly transferable into the Paddock to Reef Reporting (see Preface).
4

Reef Rescue Marine Monitoring Program Inshore reef monitoring – Final Report 2011
2. Methods
In this section an overview is given of the sample collection, preparation and analyses methods used to derive the results reported. Detailed documentation of the AIMS methods used in the MMP, including quality assurance and quality control procedures, are available in a separate report that is updated annually (last in May 2011; GBRMPA in press).
2.1 Sampling design
The sampling design was selected for the detection of change in benthic communities on inshore reefs in response to improvements in water quality parameters associated with specific catchments, or groups of catchments (Region), and with disturbance events. Within each Region, reefs were selected along a gradient of exposure to run-off, largely determined as increasing distance from a river mouth in a northerly direction. To account for spatial heterogeneity of benthic communities within reefs, two sites were selected at each reef. Observations on a number of inshore reefs undertaken by AIMS in 2004, during a pilot study to the current monitoring program (Sweatman et al. 2007), highlighted marked differences in community structure and exposure to perturbations with depth; hence sampling within sites was stratified by depth. Within each site and depth, fine scale spatial variability was accounted for by the use of five replicate transects. Reefs within each region were designated as either ‘core’ or ‘cycle’ reefs. At core reefs all benthic community sampling methods were conducted annually, however, at cycle reefs sampling was undertaken every other year and coral recruitment estimates were not included. During the first two years of sampling, some fine tuning of the sampling design occurred. In 2005 and 2006 three mainland fringing reef locations were sampled along the Daintree coast. Concerns over increasing crocodile populations in this area led to the cessation of sampling at these locations in subsequent years. The sites at which coral settlement tiles were deployed changed over the first few years as a focus shifted from fine scale process to inter-regional comparisons (see Table 1).
2.1.1 Site SelectionThe reefs monitored were selected by the GBRMPA, using advice from expert working groups. The selection of reefs was based upon two primary considerations:1. Sampling locations in each catchment of interest were spread along a perceived gradient
of influence away from a priority river;2. Sampling locations were selected where there was either an existing coral reef
community or evidence (in the form of carbonate-based substratum) of past coral reef development.
Where well-developed reefs existed on more than one aspect of an island, two reefs were included in the design. Coral reef communities can be quite different on windward compared to leeward reefs even though the surrounding water quality is relatively similar. Differences in wave and current regimes determine whether materials, e.g. sediments, fresh water, nutrients or toxins imported by flood events, accumulate or disperse and hence determine the exposure of benthic communities to environmental stresses. A list of the selected reefs is presented in Table 1 and the geographic locations are shown in Figure 1.
2.1.2 Depth SelectionFrom observations of a number of inshore reefs undertaken by AIMS in 2004 (Sweatman et al. 2007), marked differences in community structure and exposure to perturbations with depth were noted. The lower limit for the inshore coral surveys was selected at 5m below datum, because coral communities rapidly diminish below this depth at many reefs; 2m
5

Reef Rescue Marine Monitoring Program Inshore reef monitoring – Final Report 2011
below datum was selected as the ‘shallow’ depth as this allowed surveys of the reef crest. Shallower depths were considered but discounted for logistical reasons, including the inability to use the photo technique in very shallow water, site markers creating a danger to navigation and difficulty in locating a depth contour on very shallow sloping substrata typical of reef flats.
Figure 1 Sampling locations of the Reef Rescue MMP inshore coral monitoring. Core reef locations have annual coral reef benthos surveys, coral settlement assessments and regular water quality monitoring. Exceptions are Snapper Is and Dunk Is North (water quality monitoring, annual coral surveys, but no coral settlement). Cycle reef locations (Non-core) have benthos surveys every two years and no water quality monitoring. NRM Region boundaries are represented by coloured catchment areas.
6

Reef Rescue Marine Monitoring Program Inshore reef monitoring – Final Report 2011
Table 1 Coral reef sampling 2005 to 2011. Coral reef monitoring completed (Y), coral settlement tiles deployed (T). The 14 core reefs are indicated by grey shading.
Region Primary catchment
Coral monitoring locations 2005 2006 2007 2008 2009 2010 2011
Wet
Tro
pics
Barron
Daintree
Cape Tribulation (North) Y Y
Cape Tribulation (Middle) Y Y
Cape Tribulation (South) Y Y
Snapper Is North Y Y Y Y Y Y Y
Snapper Is South Y Y Y Y Y Y Y
Johnstone
Russell-Mulgrave
Fitzroy Is West Y T Y T Y T Y T Y T Y T Y T
Fitzroy Is East Y T Y T Y T Y Y Y
High Is West Y T Y T Y T Y T Y T Y T Y T
High Is East Y T Y T Y T Y Y
Frankland Group West Y T Y T Y T Y T Y T Y T Y T
Frankland Group East Y T Y T Y T Y Y
Herbert
Tully
North Barnard Group Y Y Y Y Y
King Reef Y Y Y Y
Dunk Is North Y Y Y Y Y Y Y
Dunk Is South Y Y Y Y Y
Burd
ekin
Herbert Pelorus / Orpheus Is West Y Y Y T Y T Y T Y T Y T
Orpheus Is East Y Y Y Y Y
Burdekin Lady Elliot reef Y Y Y Y
Pandora Reef Y Y Y T Y T Y T Y T Y T
Havannah Is Y Y Y Y Y
Middle Reef Y Y Y Y Y
Geoffrey Bay Y Y Y T Y T Y T Y T Y T
Mac
kay
Whi
tsun
day
Proserpine
Double Cone Is Y T Y T Y T Y T Y T Y T Y T
Hook Is Y Y Y Y
Daydream Is Y T Y T Y T Y T Y T Y T Y T
Shute & Tancred Islands Y Y Y Y
Dent Is Y Y Y Y Y
Pine Is Y T Y T Y T Y T Y T Y T Y T
Seaforth Is Y Y Y Y Y
Fitz
roy
Fitzroy
North Keppel Is Y Y Y Y Y
Middle Is Y Y Y Y
Barren Is Y Y T Y T Y T Y T Y T Y T
Humpy & Halfway Islands Y Y T Y T Y T Y T Y T Y T
Pelican Is Y Y T Y T Y T Y T Y T Y T
Peak Is Y Y Y Y Y
7

Reef Rescue Marine Monitoring Program Inshore reef monitoring – Final Report 2011
2.2 Field survey methods
2.2.1 Site markingAt each reef (Table 1), sites are permanently marked with steel fence posts at the beginning of each of five 20m transects and smaller (10mm diameter) steel rods at the 10m mark and the end of each transect. Compass bearings and measured distances record the transect path between these permanent markers. Transects were set initially by running two 60m fibreglass tape measures out along the desired 5m or 2m depth contour. Digital depth gauges were used along with tide heights from the closest location included in ‘Seafarer Tides’ electronic tide charts produced by the Australian Hydrographic Service to set transects as close as possible to the desired depths of 5m and 2m below lowest astronomical tide (LAT). Consecutive 20m transects were separated by 5m. The position of the first picket of each site was recorded by GPS.
2.2.2 Sampling methodsFive separate sampling methodologies were used to describe the benthic communities of inshore coral reefs. These were each conducted along the fixed transects (for details see Table 2 and descriptions below).
Table 2 Summary of sampling methods applied in the MMP inshore coral reef monitoring
Survey Method Information provided Transect coverage Spatial
coverage
Photo point Intercept
Percentage cover of the substratum of major benthic habitat components.
Approximately 25cm belt along upslope side of transect from which 160 points were sampled.
Full sampling design
Demography Size structure and density of juvenile (<10cm) coral communities.
34cm belt along the upslope side of the transect. Full sampling
design
Scuba search Incidence of factors causing coral mortality 2m belt centred on transect Full sampling design
Settlement tiles Larval supply
Clusters of six tiles in the vicinity of the start of the 1st, 3rd and 5th transects at the 5m sites.
12 core reefs and 5m depth only
Sediment sampling
Grain size distribution and the chemical content of nitrogen, organic carbon and inorganic carbon.Community composition of foraminifera
Sampled from available sediment deposits within the general area of transects.
5m depth onlyForams on 14 core reefs
Photo point intercept transects (PPIT)This method was used to gain estimates of the composition of the benthic communities. The method followed closely the Standard Operation Procedure Number 10 of the AIMS Long-Term Monitoring Program (Jonker et al. 2008). In short, digital photographs were taken at 50cm intervals along each 20m transect. Estimations of cover of benthic community components were derived from the identification of the benthos lying beneath five fixed points overlaid onto these images. At total of 32 images were analysed from each transect. For the majority of hard and soft corals, identification to at least genus level was achieved.
Juvenile coral surveys These surveys aimed to provide an estimate of the number of both hard and soft coral colonies that were successfully recruiting and surviving early post-settlement pressures. In 2005 and 2006 these juvenile coral colonies were counted as part of a demographic survey that counted the number of all individuals falling into a broad range of size classes within a
8

Reef Rescue Marine Monitoring Program Inshore reef monitoring – Final Report 2011
34cm wide belt along the first 10m of each 20m transect. As the focus narrowed to just juvenile colonies, the number of size classes was reduced allowing an increase in the spatial coverage of sampling. From 2007 coral colonies less than 10cm in diameter were counted along the full length of each 20m transect within a belt 34cm wide (data slate length) positioned on the upslope side of the marked transect line. Each colony was identified to genus and assigned to a size class of either, 0-2cm, >2-5cm, or >5-10cm. Importantly, this method aims to record only those small colonies assessed as juveniles, i.e. which result from the settlement and subsequent survival and growth of coral larvae, and does not include small coral colonies considered as resulting from fragmentation or partial mortality of larger colonies.
Scuba search transectsScuba search transects document the incidence of disease and other agents of coral mortality and damage. Tracking of these agents of mortality is important, because declines in coral condition due to these agents are potentially associated with changes in water quality. This method follows closely the Standard Operation Procedure Number 9 of the AIMS Long-Term Monitoring Program (Miller et al. 2009). For each 20m transect a search was conducted within a 2m wide belt centred on the marked transect line for any recent scars, bleaching, disease or damage to coral colonies. An additional category not included in the standard procedure was physical damage. This was recorded on the same 5 point scale as coral bleaching and describes the proportion of the coral community that has been physically damaged, as indicated by toppled or broken colonies. This category may include anchor as well as storm damage.
Hard coral recruitment measured by settlement tilesThis component of the study aims to provide standardised estimates of availability and relative abundance of coral larvae competent to settle. Such estimates may be compared among years for individual reefs to assess, for example, recovery potential of an individual reef after disturbance, a key characteristic of reef health.
At each reef, tiles were deployed over the expected settlement period for each spawning season based on past observations of the timing of coral spawning events. In 2010 tiles were deployed to all reefs prior to the full moon on the 23rd October 2010 (Table 3). This allowed a period of at least three weeks for tiles to ‘condition’ (i.e. to develop a natural, site-specific microbial community that aids settlement, see Webster et al. 2004) before any settlement was expected. Tiles were removed between 28th December 2011 and 6th January 2011 with the exception of those in the Fitzroy region where recovery was delayed due to flooding (see Table 3 for full list of deployment periods).
Each year tiles were fixed to small stainless steel base plates attached to the substratum with plastic masonry plugs, or cable ties (when no solid substratum was available). Each base plate holds one tile at a nominal distance of 10-20mm above the substratum. Tiles were distributed in clusters of six around the star pickets marking the start of the 1st, 3rd and 5th transect at each 5m depth site on 12 core reefs (see Table 1, Figure 1). Upon collection, the base plates were left in place for use in the following year. Collected tiles were stacked onto separate holders, tagged with the collection details (retrieval date, reef name, site and picket number). Small squares of low density foam placed between the tiles prevented contact during transport and handling as this may dislodge or damage the settled corals. On return to land the stacks of six tiles were carefully washed on their holders to remove loose sediment and then bleached for 12-24 hours to remove tissue and fouling organisms. Tiles were then rinsed and soaked in fresh water for a further 24 hours, dried and stored until analyses. Hard coral recruits on retrieved settlement tiles were counted and identified using a stereo dissecting microscope. The taxonomic resolution of these young recruits was limited. The following taxonomic categories were identified: Acroporidae (not Isopora), Acroporidae
9

Reef Rescue Marine Monitoring Program Inshore reef monitoring – Final Report 2011
(Isopora), Fungiidae, Poritidae, Pocilloporidae and ’other families‘. A set of reference images pertaining to these categories has been compiled.
Table 3 Locations and periods of coral settlement tile deployment.
Region Catchment Coral monitoring locations Coral settlement tile deployment
Coral settlement tile retrieval
Wet Tropics JohnstoneRussell-Mulgrave
Fitzroy Is West 08-Oct-10 28-Dec-10High Is West 09-Oct-10 29-Dec-10Frankland Group West 06-Oct-10 29-Dec-10
Burdekin BurdekinGeoffrey Bay 04-Oct-10 04-Jan-11Pandora Reef 05-Oct-10 06-Jan-11Orpheus Is & Pelorus Is West 05-Oct-10 06-Jan-11
Mackay Whitsunday ProserpineDouble Cone Is 02-Oct-10 03-Jan-11Daydream Is 02-Oct-10 02-Jan-11Pine Is 01-Oct-10 02-Jan-11
Fitzroy FitzroyPelican Is 30-Sep-10 22-Mar-11Humpy Is & Halfway Is 30-Sep-10 16-Feb-11Barren Is 30-Sep-10 16-Feb-11
Foraminiferal abundance and community composition from sediment samplesThe density and composition of foraminiferal assemblages were estimated from a subset of the surface sediment samples collected from 14 coral monitoring sites (see section 2.3). Sediments were washed with freshwater over a 63 m sieve to remove small particles. After drying (>24 h, 60°C), haphazard subsamples (ca. 2 g) of the sediment were taken and, using a dissection microscope, all foraminifera present in these were collected. This procedure was repeated until about 200 foraminifera specimens were collected from each sediment sample. Only intact specimens showing no sign of weathering were collected. Samples thus defined are a good representation of the present day biocoenosis (Yordanova and Hohenegger 2002), although not all specimens may have been alive during the time of sampling. Species composition of foraminifera was determined in microfossil slides under a dissection microscope following Nobes and Uthicke (2008). The dry weight of the sediment and the foraminifera was determined to calculate foraminiferal densities per gram sediment. These density values were used to calculate the FORAM index.
The FORAM index (Hallock et al. 2003) summarises foraminiferal assemblages based on the relative proportions of species classified as either symbiont-bearing, opportunistic or heterotrophic and has been used as an indicator of coral reef water quality in Florida and the Caribbean Sea (Hallock et al. 2003). In general, a decline in the FORAM index indicates an increase in the relative abundance of heterotrophic species. Symbiotic relationships with algae are advantageous to foraminifera in clean coral reef waters low in dissolved inorganic nutrients and particulate food sources, whereas heterotrophy becomes advantageous in areas of higher turbidity and higher availability of dissolved and particulate nutrients (Hallock 1981). The FORAM index has been successfully tested on GBR reefs and corresponded well to water quality variables (Uthicke and Nobes 2008, Uthicke et al. 2010).
To calculate the FORAM Index foraminifera are grouped into three groups: 1) Symbiont-bearing, 2) Opportunistic and 3) Other small (or heterotrophic).
The proportion of each functional group is then calculated as:
1) Proportion symbiont-bearing = PS= NS/T
10

Reef Rescue Marine Monitoring Program Inshore reef monitoring – Final Report 2011
2) Proportion opportunistic = PO= NO/T
3) Proportion heterotrophic = Ph= Nh/T
Where Nx = number of foraminifera in the respective group, T= total number of foraminifera in each sample.
The FORAM index is then calculated as FI = 10Ps + Po + 2Ph
2.3 Sediment quality monitoring
Sediment samples were collected from all reefs visited during 2011 (Table 1) for analysis of grain size and of the proportion of inorganic carbon, organic carbon and total nitrogen. At each 5m deep site 60ml syringe tubes were used to collect six 20-40mm deep cores of surface sediment from available deposits along the 120m length of the site. On the boat, the excess sediment was removed to leave 10mm in each syringe, which represented the top centimetre of surface sediment. This sediment was transferred to a labelled sample jar, yielding a pooled sediment sample per site. Another four cores were collected in the same way to yield a pooled sample per site for analysis of foraminiferal assemblage composition. The sample jars were stored in an ice box with ice packs to minimise bacterial decomposition and volatilisation of the organic compounds until transferred to a freezer on the night of collection and kept frozen until analysis.
The sediment samples were defrosted and each sample well mixed before being sub-sampled (approximately 50% removed) to a second labelled sample jar for grain-size analysis. The remaining material was dried, ground and analysed for the composition of organic carbon, inorganic carbon, and nitrogen.
Grain size fractions were estimated by sieving two size fractions (1.0 -1.4mm, >2.0mm) from each sample followed by MALVERN laser analysis of smaller fractions (<1.0mm). Sieving and laser analysis was carried out by Geoscience Australia and the size fractions were chosen to maintain continuity with the analysis provided in previous years by the School of Earth Sciences, James Cook University.
Total carbon (combined inorganic carbon and organic carbon) was determined by combustion of dried and ground samples using a LECO Truspec analyser. Organic carbon and total nitrogen were measured using a Shimadzu TOC-V Analyser with a Total Nitrogen unit and a Solid Sample Module after acidification of the sediment with 2M hydrochloric acid. The inorganic carbon component (assumed to be CaCO3) was calculated as the difference between total carbon and organic carbon values. In purely reef-derived sediments the carbonate carbon component will be very close to 12% of the sample, values lower than this can be interpreted as including higher proportions of non-reefal, terrigenous material.
2.4 Sea temperature monitoring
Temperature loggers are deployed at, or in close proximity to, each survey location at both 2m and 5m depths and routinely exchanged at the time of the coral surveys (i.e. every 12 or 24 months). Two types of temperature loggers have been used for the sea surface temperature logger program. The first type was the Odyssey temperature loggers (http://www.odysseydatarecording.com/), these have now been superseded by Sensus Ultra Temperature logger (http://reefnet.ca/products/sensus/). The Odyssey Temperature loggers
11

Reef Rescue Marine Monitoring Program Inshore reef monitoring – Final Report 2011
were set to take readings every 30 minutes. The Sensus Temperature loggers were set to take readings every 10 minutes. Loggers were calibrated against a certified reference thermometer after each deployment and were generally accurate to ± 0.2°C.
As a reference point for the temperature at each reef during the survey year, a 9 year baseline of mean weekly temperatures over the period July 1999 to July 2008 was estimated for each region (separate baselines were estimated for the three sub regions in the Wet Tropics Region). These long-term means were derived from existing data sets (AIMS Long-term Temperature Monitoring Program) in combination with the first 3 years of sampling at MMP locations. In addition to MMP coral reef sites, data from loggers from the following locations were used for the long-term estimates: Wet Tropics: Coconut Beach, Black Rocks, Low Isles, pre-existing sites at Fitzroy Is,
High Is and the Frankland Group; Burdekin Region: additional and pre-existing sites at Orpheus Is, Magnetic Is and
Cleveland Bay; Mackay Whitsunday Region: Hayman Is and pre-existing site at Daydream Is;
Fitzroy Region: Halftide Rocks, Halfway Is and pre-existing sites at Middle Is and North Keppel Is.
2.5 Autonomous Water Quality Loggers
Instrumental water quality monitoring at the 14 core reefs is undertaken using WETLabs Eco FLNTUSB Combination Fluorometer and Turbidity Sensors. These are deployed at 5m below LAT, generally at the start of a coral survey transect. The data from these instruments are included as additional information about the environmental conditions at the core survey reefs and are reported in more detail separately (Schaffelke et al. 2011).
The Eco FLNTUSB Combination instruments are deployed year round and perform simultaneous in situ measurements of chlorophyll fluorescence, turbidity and temperature. The fluorometer monitors chlorophyll concentration by directly measuring the amount of chlorophyll fluorescence emission, using blue LEDs (centred at 455 nm and modulated at 1 kHz) as the excitation source. Turbidity is measured simultaneously by detecting the scattered light from a red (700 nm) LED at 140 degrees to the same detector used for fluorescence. The instruments were used in ‘logging’ mode and recorded a data point every 10 minutes for each of the three parameters, which was a mean of 50 instantaneous readings.
The Water Quality Guidelines for the Great Barrier Reef Marine Park (GBRMPA 2009, hereafter “the Guidelines”) provide a useful framework to interpret the instrument water quality values obtained at the fourteen core sampling sites. The Guidelines trigger values are mean annual concentrations of 0.45 μg L-1 for chlorophyll and 2 mg L-1 for suspended solids. To allow direct comparison between the Guidelines turbidity trigger it was necessary to convert 2 mg L-1 into the NTU units derived from instrumental readings resulting in a converted trigger value of 1.54 NTU (Schaffelke et al. 2009).
2.6 Data analyses
Recent MMP reports presented comprehensive statistical analyses of spatial patterns in the inshore coral reef data and identified both regional differences in community attributes as well as the relationships between both univariate and multivariate community attributes and key environmental parameters such as water column particulates and sediment quality
12

Reef Rescue Marine Monitoring Program Inshore reef monitoring – Final Report 2011
(Schaffelke et al. 2008, Thompson et al. 2010a). Statistical analysis of spatial relationships between coral communities and their environmental setting are not repeated here.
In this report results are presented to reveal temporal changes in coral community attributes and key environmental variables. Generalized linear mixed effects models were fitted to community attributes and environmental variables separately for each NRM region. In these analyses we were interested in identifying the presence and consistency of trends. To this end, observations for each variable were averaged to the reef level for each year and individual reefs treated as random factors. To allow flexibility in their form, trends are modelled as natural cubic splines. A log link function was used as we were explicitly interested in identifying the consistency of proportional changes in a given variable among reefs, acknowledging that the absolute levels of that variable may differ between reefs.
The results of these analyses are graphically presented in a consistent format for both, environmental variables (Section 3.1.1 to 3.1.3) and biological variables (Section 3.1.4): Predicted trends were plotted as bold black lines, the confidence intervals of these trends were plotted as blue dashed lines, and the actual observed trends at each survey reef were plotted in the background as thin grey lines. A point to note is that in some instances it appears that the predicted trends are slightly offset to the observed changes, which is due to the inclusion in the analysis of both core reefs (sampled every year) and cycle reefs (sampled every other year). Changes occurring on cycle reefs in the year preceding the survey will be perceived as having occurred in the survey year, while changes observed on the core reefs in the survey/reporting year that affected the predicted trend have not yet been recognised on the reefs that are only surveyed a year later.
2.6.1 Assessment of coral reef community condition As expected, coral communities show clear relationships to local environmental conditions, however, these relationships do not easily translate into an assessment of the “health” of these communities as gradients in both environmental condition and community composition may naturally occur. The assessment of coral community condition presented here considers the levels of key community attributes that may each indicate the potential of coral communities to recover from inevitable disturbances. The attributes assessed were: coral cover, macroalgae cover, the rate of coral cover increase, and the density of juvenile hard corals. Thompson et al. (2010b) presented a baseline assessment of coral community condition based on data collected between 2005 and 2009, which was included in the First Report of the Paddock to Reef Integrated Monitoring, Modelling and Reporting Program (Anon. 2011).
Subsequent to this baseline assessment, the estimation of coral community condition was revised with the view to enhancing the sensitivity of the assessment to change. In short, the period over which the metric based on rates of increase in cover of hard corals was restricted to three years and coral settlement was removed as a metric due to high inter-annual variability the causes of which remain unresolved. The 2010 MMP inshore coral monitoring report used this revised assessment metrics (Thompson et al. 2011). For comparative purposes, the regional condition scores from 2008 based on the current, revised metrics are presented in Figure 5. The rationale for, and calculation of, the four metrics used to generate the regional condition scores are outlined below.
Combined cover of hard corals and soft coralsFor coral communities, the underlying assumption for resilience is that recruitment and subsequent growth of colonies is sufficient to compensate for losses resulting from the combination of acute disturbances and chronic environmental limitations. High abundance, expressed as proportional cover of the substratum, can be interpreted as an indication of resilience as the corals are clearly adapted to the ambient environmental conditions. Also,
13

Reef Rescue Marine Monitoring Program Inshore reef monitoring – Final Report 2011
high cover equates to a large broodstock, a necessary link to recruitment and an indication of the potential for recovery of communities in the local area. The selection of critical values (“decision rules” in Table 4) for cover from which to derive community condition scores (Table 4) were largely subjective, however, approximate the lower, central and upper thirds of cover data observed in 2005 for the monitored communities Setting reference points at these baseline levels will reveal relative changes in cover through time, and allows comparisons of this indicator at the regional level.
Rate of increase in cover of hard coralsWhile high coral cover can justifiably be considered a positive indicator of community condition, the reverse is not necessarily true of low cover. Low cover may occur following acute disturbance and, hence, may not be a direct reflection of the community’s resilience to underlying environmental conditions. For this reason, in addition to considering the actual level of coral cover (as per above) we also assess the rate at which coral cover increases as a direct measure of recovery potential. The assessment of rates of cover increase is possible as rates of change in coral cover on inshore reefs have been modelled (Thompson and Dolman 2010); allowing estimations of expected increases in cover for communities of varying composition to be compared against observed changes. In brief, the model used observations of annual change in benthic cover derived from 47 near-shore reefs sampled over the period 1987-2007 to parameterise a multi-species form of the Gompertz growth equation (Dennis and Taper 1994; Ives et al. 2003). The model returned estimates of growth rates for three coral groups; soft corals, hard corals of the family Acroporidae and hard corals of all other families. Importantly, growth rate estimates for each coral group are dependent on the cover of all coral groups and also the cover of macroalgae which in combination represent potential space competitors. It should be noted that the model projections of future coral cover on GBR inshore reefs indicate a long-term decline (Thompson and Dolman 2010) if disturbances, especially bleaching events, would occur with the same frequency and severity as in the recent past. For this reason, only increases in cover that exceeded the upper confidence level of those predicted by the model were considered positive, while observations falling within the upper and lower confidence intervals of the change in cover predicted by the model were scored as neutral and those not meeting the lower confidence interval of the predicted change were scored as negative (Table 4). In Thompson et al. (2010b), and Anon. (2011), the rate of change was averaged over the years 2005-2009 as a baseline estimate for this metric. Subsequently, the period over which the rate of change was averaged was reduced to three years of observations including in the most recent year to assess recent change.
Cover of macroalgaeMacroalgal recruitment, growth and biomass are controlled by a number of environmental factors such as the availability of suitable substratum, sufficient nutrients and light, and the rates of herbivory (Schaffelke et al. 2005). Abundant fleshy macroalgae on coral reefs are considered to be a consequence and, mostly, not a cause of coral mortality (McCook et al. 2001, Szmant 2002). However, high macroalgal abundance may suppress reef resilience (e.g., Hughes et al. 2007, Foster et al. 2008, Cheal et al. 2010; but see Bruno et al. 2009) by increased competition for space or changing the microenvironment for corals to settle and grow in (e.g. McCook et al. 2001, Hauri et al. 2010). On the GBR, high macroalgal cover correlates with high concentrations of chlorophyll, a proxy for nutrient availability (De’ath and Fabricius 2010). Once established, macroalgae pre-empt or compete with corals for space that might otherwise be available for coral growth or recruitment (e.g. Box and Mumby 2007, Hughes et al. 2007). However, as the interactions between corals and algae are complex, likely species-specific and, mostly, un-quantified (McCook et al. 2001), it is difficult to determine realistic thresholds of macroalgal cover from which to infer impacts to the resilience of coral communities. Similar to the assessment of coral cover, we have decided on subjective thresholds based on the distribution of observed macroalgal cover data (Table
14

Reef Rescue Marine Monitoring Program Inshore reef monitoring – Final Report 2011
4). These thresholds clearly identify, and score positively, reefs at which cover of large fleshy algae is low and unlikely to be influencing coral resilience. Conversely, the distinction between moderate and high levels of macroalgal cover score negatively those reefs at which cover of macroalgae is high or has rapidly increased and where there is a high likelihood of a increased coral-algal competition. For the purpose of this metric macroalgae are considered as those species of the families, Rhodophyta, Phaeophyta and Chlorophyta excluding crustose coralline algae and species with a short “hair-like” filamentous growth form, collectively considered as turfs.
Density of juvenile hard coralsRecruitment is an important process for the resilience of coral communities. The abundance of juvenile corals provides an indication of the scope for recovery of populations following disturbance or of those exposed to chronic environmental pressures. Juvenile colonies have been shown to be disproportionately susceptible to the effects of poor water quality (Fabricius 2005), which makes them an important indicator to monitor. However, as the quantification of the density of juvenile corals is a relatively new addition to monitoring studies on the GBR there is little quantitative information about adequate densities of juveniles to ensure the resilience of coral communities. At present, we can only assess juvenile densities in relative terms among reefs. The number of juvenile colonies observed along fixed area transects may also be biased due to the different proportions of substratum available for coral recruitment. For example, live coral cover effectively reduces the space available for settlement, as do sandy or silty substrata onto which corals are unlikely to settle. To create a comparative estimate of juvenile colonies between reefs, the numbers of recruits per square metre were converted to standardised recruit densities per square metre of ‘available substratum’ by considering only the proportion of the substratum that was occupied by turf algae, and hence potentially available to coral recruitment. As a baseline, assessment categories for juvenile density were defined as the upper, lower and central thirds of all observations between 2005 and 2009 (Table 4).
Hard coral recruitment measures by settlement to tilesThe number of coral spat settling to terracotta tiles provides a further estimate of recruitment potential at a subset of the monitored reefs (Table 1). Low densities of juvenile corals may be due to a lack of supply of competent larvae, low survivorship of new recruits or a combination of both. The monitoring of settlement to tiles is aimed at helping to identify the possible cause of trends observed in juvenile densities. This indicator was included in the Paddock to Reef Baseline Report Card (Anon. 2011), however due to high levels of unexplained variability between years, it has been removed from the report card metrics after the 2009 baseline assessment. We do, however, continue to monitor settlement and include scores in our assessment of those reefs at which tiles are deployed. As for juvenile density, the threshold values for numbers of coral spat per tile were based on the upper, lower and central thirds of all observations between 2005 and 2009 (Table 4).
Aggregating indicator scores to reef and regional-scale assessmentsThe assessment of coral communities based on the above indicators is made at spatial scales from the individual reefs through to regions by aggregating over scores for each indicator and reef combination. At the reef level, observations for each indicator were scored on a three point scale of negative, neutral or positive as per rules detailed above and summarised in Table 4. For reef level comparisons these scores were aggregated across the indicators with negative scores cancelling out positive scores and neutral scores ignored, so that reef scores can range from 4+ to 4-.
To aggregate indicator scores to sub-regional or regional level, the assessments for each indicator were converted to numerical scores whereby: positive = 2, neutral = 1, and negative
15

Reef Rescue Marine Monitoring Program Inshore reef monitoring – Final Report 2011
= 0. These resulting metrics were then averaged across the reefs within each (sub) region and divided by 2 to standardize scores to a scale between 0 and 1; the average of these regional metrics gave the overall (sub-) regional assessment rating. Scores for each metric within (sub-) regions and the overall (sub-) regional scores were converted to a five point rating scheme, which was also represented by the following colour scheme: Scores of
0 to 0.2 were rated as ‘very poor’ and coloured red >0.2 to 0.4 were rated as ‘poor’ and coloured orange >0.4 to 0.6 were rated as ‘moderate’ and coloured yellow >0.6 to 0.8 were rated as ‘good’, and coloured light green >0.8 were rated as ‘very good’ and coloured dark green.
Table 4 Threshold values for the assessment of coral reef condition and resilience. *Settlement of coral spat is not considered in regional assessments.
Community attribute Assessment category
Decision rule
Combined hard and soft coral cover
+ > 50%neutral between 25% and 50%- < 25%
Rate of increase in hard coral cover (preceding 3 years)
+ above upper confidence interval of model-predicted changeneutral within confidence intervals of model-predicted change- below lower confidence interval of model-predicted change
Macroalgae cover+ < 5%; or <10% and declining from a high cover following
disturbanceneutral stable between 5-15%, or declining and between 10-20%- > 15% or increasing
Density of hard coral juveniles
+
> 10.5 juvenile colonies per m2 of available substratum (2m depth), or> 13 juvenile colonies per m2 of available substratum (5m depth)
neutral
- between 7 and 10.5 juvenile colonies per m2 of available substratum (2m depth), or- between 7 and 13 juvenile colonies per m2 of available substratum (5m depth)
- < 7 juvenile colonies per m2 of available substratum
Settlement of coral spat*+ > 70 recruits per tileneutral between 30 and 70 recruits per tile- < 30 recruits per tile
ForaminiferaForaminiferal assemblages were assessed separately from the coral community metrics and so assessment scores do not influence the overall assessments for the (sub-) regions. Assemblages at each reef were assessed relative to their deviation from baseline observations over the period 2005-2007 as the assemblage composition is expected to vary between reefs due to the underlying differences in the ambient environmental conditions. The baseline was calculated as the average of the FORAM index (sensu Hallock et al. 2003) calculated from observations in each year during the period 2005-2007 for each reef (Table A1-11). For each reef, subsequent observations scored positive if the FORAM index exceeded the baseline mean by more than one standard deviation of the mean, neutral if observed values were within one standard deviation of the mean, and negative if values were more than one standard deviation below the baseline mean. Other calculations and the application of the colour scheme were as described above for the assessment of coral reef communities.
16

Reef Rescue Marine Monitoring Program Inshore reef monitoring – Final Report 2011
3. Results and discussion
Results are presented in two sections. In the first section the temporal profiles of the various community attributes and environmental variables are presented at the scale of regions. This was done to highlight any major changes in the benthic communities and reef-level environmental parameters, and to provide a summary of the condition of communities within each region. Spatial differences among regions are also evident in the figures presented; however, for the most part, the discussion of results focuses on the comparison of trends within regions rather than on inter-regional differences. For a full analysis of the spatial differences in community attributes between regions and associations between these spatial patterns and environmental conditions, see Schaffelke et al. (2008) and Thompson et al. (2010a).
The second section provides detailed reef-level data for each region, or in the case of the Wet Tropics Region, sub-regions based on major catchments. These reef-level estimates were then aggregated to form the regional and sub-regional assessments presented in Section 1 of the results.
3.1 GBR-wide summary of changes in environmental variables and benthic communities
3.1.1 Sediment qualityThis section provides an overview of sediment data collected from all coral monitoring sites (detailed results in Appendix Table A1-1 to A1-4). The grain size and nutrient content of sediments have demonstrated links to coral community composition (Fabricius et al. 2005, Thompson et al. 2010a). The accumulation of fine grained sediments at a location is an indication of a low energy hydrodynamic setting that allows for the settlement of sediments rather than re-suspension and transport of fine sediments away from the site. Combined with measures of turbidity, this gives an indication of exposure to sedimentation. Sedimentation is detrimental to corals in a number of ways, e.g., impeding settlement of coral larvae (Babcock and Smith 2002, Baird et al. 2003, Fabricius et al., 2003, Birrell et al. 2005), smothering of juveniles (Harrison and Wallace 1990, Rogers 1990, Fabricius and Wolanski 2000), and incurring a metabolic cost as sediment is actively shed (Stafford-Smith and Ormond 1992). Nutrient content in sediments is an indication of the availability of nutrients in the system which in turn can promote the growth of potential space-competitors to corals such as macroalgae and filter feeding organisms (Fabricius 2005).
The exceptional floods of the 2010/11 (Table 5) wet season have delivered large quantities of fine sediments to the coral monitoring locations. On many reefs, and particularly those sheltered from prevailing waves, the proportions of clay and silt sized particles were higher than previously recorded. Regional trends for clay/silt, nitrogen and organic carbon contents of reef sediments (Figures 2a-c), along with regional trends in turbidity (Figure 3), highlight the link between increased discharge from rivers, turbidity in inshore waters, and changes in sediment composition on inshore reefs. The increase in terrestrially derived components was mirrored by decreases in inorganic carbon of reefal origin (Figure 2d).
17

Reef Rescue Marine Monitoring Program Inshore reef monitoring - Final Report 2011
Table 5 Annual freshwater discharge for the major GBR Catchment rivers influencing the MMP coral monitoring sites. Values for each water year (October to September) represent the proportional discharge relative to long-term medians for each river (in ML). Median discharges were estimated from available long-term time series supplied by the Queensland Department of Environment and Resource Management and included data up until 2000: years with 40 or more daily flow estimates missing were excluded. Colours highlight those years for which flow was 1.5 to 2 times the median (yellow), 2 to 3 times the median (light orange), 3 to 4 times the median (dark orange), and more than four times the median (red). Missing values represent years for which >15% of daily flow estimates were not available, where as an * indicates that between 5% and 15% of daily observations were missing.
Region River Median discharge (ML) 2001 2002 2003 2004 2005 2006 2007 2008 2009 2010 2011
Wet Tropics
Daintree 727,872 1.4* 0.2 2.0 0.7 1.7 1.0 1.2 1.7 2.2Barron 604,729 1.4 0.3 0.2 1.6 0.6 1.2 0.7 2.7 1.3 0.8 3.2Mulgrave 751,149 0.2 0.4 1.5 1.2 1.0 1.2 0.9 0.9 1.9Russell 1,193,577 1.0 0.4 0.5 1.1 0.8 1.1 1.1 0.9 0.9 1.0 1.5North Johnstone 1,746,102 1.2 0.4 0.5 1.3 0.8 1.2 1.2 1.1 1.1 1.0 2.0South Johnstone 820,304 1.0* 0.4 0.4 0.7 1.2 1.1 1.0 1.2 0.9 2.1Tully 3,056,169 1.2 0.4 0.5 1.1 0.7 1.2 1.3 1.0 1.2 1.0 1.5Herbert 3,067,947 1.5 0.3 0.2 1.1 0.4 1.3 1.3 1.1 3.1 1.0 3.7
Burdekin Burdekin 6,093,360 1.5 0.7 0.3 0.3 0.7 0.4 1.6 4.6 5.0 1.3 5.8
Mackay WhitsundayProserpine 17,140 0.8 1.2 1.1 0.6 1.4 1.2 2.6 4.5 3.8 3.1 20.4O’Connell 205,286 1.0 0.6 0.2* 0.5 0.6 1.2 1.6 1.1 2.1 4.0Pioneer 420,679 2.1 0.6 0.3 0.1 0.6 0.2 2.0 3.7 2.3 3.3 8.6
Fitzroy Fitzroy 2,754,600 1.1 0.2 0.3* 0.2 0.4 4.3 0.7 4.1 13.5
18
Reef Rescue Marine Monitoring Program Inshore reef monitoring - Final Report 2011
Wet Tropicsa) Clay & Silt
2006
2007
2008
2009
2010
2011
Year
Con
tent
(%)
0
20
40
60
80
2006
2007
2008
2009
2010
2011
Burdekin
2006
2007
2008
2009
2010
2011
Whitsunday
2006
2007
2008
2009
2010
2011
Fitzroy
b) Nitrogen
2006
2007
2008
2009
2010
2011
0.00
0.05
0.10
0.1520
06
2007
2008
2009
2010
2011
2006
2007
2008
2009
2010
2011
2006
2007
2008
2009
2010
2011
c) Organic Carbon
2006
2007
2008
2009
2010
2011
0.0
0.2
0.4
0.6
0.8
1.0
2006
2007
2008
2009
2010
2011
2006
2007
2008
2009
2010
2011
2006
2007
2008
2009
2010
2011
d) Inorganic Carbon
2006
2007
2008
2009
2010
2011
2
4
6
8
10
2006
2007
2008
2009
2010
2011
2006
2007
2008
2009
2010
2011
2006
2007
2008
2009
2010
2011
Figure 2 Regional trends in sediment composition. Proportion of sediment consisting of a) clay and silt sized grains, b) nitrogen, c) organic carbon, and d) inorganic carbon for reefs within each region. Bold black curve represents predicted regional trend bounded by blue dashed lines depicting the 95% confidence intervals of that trend (see section 2.6 for analysis detail). Grey lines show observed trends for each reef.
Catchments in the Wet Tropics and Mackay Whitsunday regions are relatively small and compressed by coastal mountain ranges. At greater than 1000 mm y-1, average rainfall is usually 2-3 times higher per hectare in these catchments than in the drier Burdekin or Fitzroy Regions. Both wet regions have several rivers flowing into the inshore waters. These river systems are relatively small and meander through soils primarily cultivated for crops, with high carbon and nitrogen content (Australian Natural Resource Atlas, electronic resource). The reef sediments analysed in the Mackay Whitsunday Region have the highest proportion of fine grained particles, nitrogen and organic carbon and the lowest levels of inorganic
19

Reef Rescue Marine Monitoring Program Inshore reef monitoring – Final Report 2011
carbon in this study (Figure 2). Double Cone Is, Daydream Is and Pine Is all show higher levels of fine sediments in 2010 that continue into 2011 (Appendix Table 1-1a). This may reflect both the influence of Cyclone Ului in 2010 (Appendix Table A1-5) and the large increase in discharge in 2011 (Table 5). These results indicate that reefs in the Mackay Whitsunday Region have a much greater exposure to pressures associated with high sedimentation and nutrient levels than reefs in other regions. This is supported by field observations of substantially greater accumulation of sediments on coral colonies and also on coral settlement tiles deployed in this region compared to other regions, which may negatively affect coral larval settlement. While data from the Wet Tropics Region are more variable, with moderate proportions of clay/silt sized particles and sediment nutrients, those individual reefs with a propensity to accumulate sediment (Snapper Is North, Frankland Is West) show a trend of increasing levels of clay and silt sized particles, nitrogen and organic carbon.
The Burdekin and Fitzroy regions have a dry tropical climate and are the largest two river catchments in the GBR Region. When these catchments receive flooding rains, the discharge dominates the river inputs into the coastal receiving waters (Table 5). The land use in both regions is predominately pasture for cattle grazing, though there are large areas of sugar cane on the lower flood plains (Brodie et al. 2003, Australian Natural Resource Atlas (electronic resource)). The sediments of reefs in both regions had broadly similar values of clay and silt, nitrogen, organic and inorganic carbon from 2006 to 2011 (Figure 2). The relatively low proportion of clay and silt sized particles in sediment samples reflect the relatively exposed aspects of many of the survey locations, with incident waves frequently re-suspending and transporting fine particles away from the reefs (Wolanski et al. 2005). Despite local hydrodynamics that tend to limit the accumulation of fine particles, the proportion of clay and silts sized particles show increases in recent years (Figure 2a). At sheltered locations, where sediments do accumulate, increases in the proportion of fine grained particles were quite pronounced (Burdekin Region - Middle Reef, Fitzroy Region – North Keppel Is; Appendix Table A1-1).
For the Burdekin, the upward trend in clay and silt sized particles was slight and was mirrored by a slight downturn in the inorganic content of the sediments. Inorganic content effectively measures the proportion of the sediment that is comprised of calcium carbonate which is the skeletal material of many marine invertebrates. A reduction in the proportion of inorganic carbon indicates increasing proportion of terrestrially derived material. The levels of nitrogen and organic carbon do not show increasing trends in reefal sediments in the Burdekin Region despite the increase in fine particles to which nutrients tend to adsorb (Furnas 2003). It is possible that the large distance between the mouth of the Burdekin River and the reef sites (>100 km by sea) allows sufficient time for organic matter carried by flood waters to be remineralised by biological communities.
The sediments at reefs in the Fitzroy Region show a distinct trend of accumulation of fine sediments. This increase is especially evident at the relatively sheltered North Keppel Is, which is the furthest reef from the river mouth that we sample. Northward travelling sediment plumes are usually confined to the inshore by prevailing SE winds, with fine sediment eventually transported out of Keppel Bay, a process that may take several years (Webster and Ford 2010). However, the extreme flood of the Fitzroy River in 2011 (13.5 times median discharge, Table 5) also transported fine sediments out to Barren Is, where clay/silt content quadrupled from normally very low levels (Appendix Table A1-1). Nitrogen and organic carbon levels increased slightly throughout the region, with a corresponding decline in inorganic carbon.
To conclude, there is clear evidence of increased fine sediment availability in the inshore reef environment in all four regions in 2011 as a result of the increasing river discharges over the last four years, and especially the extreme 2011 wet season. Increased sediment loads and
20

Reef Rescue Marine Monitoring Program Inshore reef monitoring – Final Report 2011
the associated prolonged periods of high turbidity (see Section 3.1.2 below) combine to affect all phases of the coral life-cycle (see results below and Gilmour 1999, Fabricius 2005, Cooper et al. 2007, 2008, Humphrey et al. 2008) and, as a consequence, are likely to affect the immediate and long-term resilience of inshore reef communities.
3.1.2 TurbiditySuspended solids, turbidity and Secchi depth are widely applied indicators for the clarity of the water. These measures are influenced by the quality and composition of the sediment (see above) that is resuspended by physical factors such as wind, waves and tides as well as by increased imports of suspended solids into the coastal zone by rivers (Fabricius et al., in review). The MMP inshore water quality monitoring component has measured turbidity since late 2007 using logging instruments at 14 sites, co-located with the core reef survey sites. Turbidity is a fundamental physical environmental variable in coastal marine environments. Turbidity influences benthic irradiance (Davies-Colley and Smith 2001), and the suspended particles carry nutrients and organic carbon, e.g. influencing food availability for suspension feeders or smothering benthic biota such as corals (Weber et al. 2006), as well as bacteria and other pathogens, pesticides, trace metals and other contaminants (Smith and Schindler 2009).
All four monitoring regions show clear trends of increasing water turbidity over the past four years (Figure 3). While a cause and effect relationship cannot be proven with the current analysis, this increase corresponded with increasing river (and associated suspended sediment) discharge over the past four years, especially in the three southern regions(Table 5), and with increasing availability of fine sediment at the survey sites (see above). Another factor influencing the turbidity could be the increased wind speeds associated with the predominantly La Nina dominated weather patterns of the last years.
Wet Tropics
2008
2009
2010
2011
Year
Turb
idity
(ntu
)
0
2
4
6
8Burdekin
2008
2009
2010
2011
Whitsunday
2008
2009
2010
2011
Fitzroy
2008
2009
2010
2011
Figure 3 Regional trends in turbidity. Turbidity measured by FLNTU loggers on the core reefs within each region. Bold black curve represents predicted regional trend bounded by blue dashed lines depicting the 95% confidence intervals of that trend (see section 2.6 for analysis detail). Grey lines show observed trends for each reef.
Higher turbidity levels are generally found in the Whitsunday Region (Figure 3). However, in all regions a clear gradient of turbidity is discernible in the actual observed trends at the individual sites. Reefs close to river mouths, and hence more exposed to river runoff, have generally higher and more variable turbidity while reefs further offshore have clearer water (Figure 3; Schaffelke et al. in press and 2011, Fabricius et al. in review). Highest turbidity values were generally found at Snapper and Dunk Is (Wet Tropics), Magnetic Is (Burdekin),
21

Reef Rescue Marine Monitoring Program Inshore reef monitoring – Final Report 2011
Pine Is (Mackay Whitsunday) and Pelican Is (Fitzroy), the latter sites had the highest average and maximum turbidity of all 14 monitoring sites
3.1.3 Sea temperature monitoring Sea temperature data are reported for the period of July 2005 to June 2011 (Figure 4). Data for each region are represented as the deviation from long-term (9 years from July 1999 to June 2008) weekly averages. Prolonged exposures to high temperatures, atypical for a given season, have been shown to cause stress to corals that may increase susceptibility to disease (e.g. Bruno et al. 2007), cause coral bleaching and in severe cases, mortality (e.g. Berkelmans 2002). Seasonal average temperatures were exceeded for prolonged periods in the summer of 2005/06 in the Burdekin, Mackay Whitsunday and Fitzroy Regions (Figure 4). In the Fitzroy Region these high summer temperatures resulted in widespread bleaching and subsequent loss of coral on most of the reefs included in this study (Figure 6, Appendix Table A1-5). There were also slight declines in coral cover over this period on reefs in the Burdekin and Mackay Whitsunday Regions. These reefs were visited in December 2005 when no bleaching was evident; if temperature stress was responsible for the slight declines in coral cover in these regions they would most likely have occurred in late January and February as was the case in the Fitzroy Region (Diaz-Pulido et al. 2009). Deviations above the long-term averages in the period April 2006 to June 2011 have been relatively minor and/or short lived and have not caused observable mortality of corals in any regions. Over the last four years the seasonal temperature cycle has been characterised by cooler summers and warmer winters for all regions, with heavy cloud-cover, prolonged rainfall and flood plumes a feature of recent summers. Where coral bleaching has occurred it is considered the result of exposure to a combination of low salinity and high turbidity associated with floodwaters. With the exception of the Fitzroy region in 2011, where low salinity penetrated to the depths of our monitoring sites at several reefs (Devlin et al. 2011), salinity stress to corals has typically been confined to shallower depths. Bleaching at 5m depths in the months following flood events is considered a response to prolonged light limitation due to high turbidity rather than direct stress associated with lowered salinity. During 2011 temperatures around reefs in all four regions have been consistently lower than the long-term average.
22

Reef Rescue Marine Monitoring Program Inshore reef monitoring – Final Report 2011
Burdekin
Jul-0
5
Oct
-05
Jan-
06
Apr
-06
Jul-0
6
Oct
-06
Jan-
07
Apr
-07
Jul-0
7
Oct
-07
Jan-
08
Apr
-08
Jul-0
8
Oct
-08
Jan-
09
Apr
-09
Jul-0
9
Oct
-09
Jan-
10
Apr
-10
Jul-1
0
Oct
-10
Jan-
11
Apr
-11
Jun-
11
Dev
iatio
n fro
m b
asel
ine
(o c
)
-2
-1
0
1
2
Wet Tropics
Jul-0
5
Oct
-05
Jan-
06
Apr
-06
Jul-0
6
Oct
-06
Jan-
07
Apr
-07
Jul-0
7
Oct
-07
Jan-
08
Apr
-08
Jul-0
8
Oct
-08
Jan-
09
Apr
-09
Jul-0
9
Oct
-09
Jan-
10
Apr
-10
Jul-1
0
Oct
-10
Jan-
11
Apr
-11
Jun-
11
Dev
iatio
n fro
m b
asel
ine
(o c
)
-2
-1
0
1
2
Mackay / Whitsunday
Jul-0
5
Oct
-05
Jan-
06
Apr
-06
Jul-0
6
Oct
-06
Jan-
07
Apr
-07
Jul-0
7
Oct
-07
Jan-
08
Apr
-08
Jul-0
8
Oct
-08
Jan-
09
Apr
-09
Jul-0
9
Oct
-09
Jan-
10
Apr
-10
Jul-1
0
Oct
-10
Jan-
11
Apr
-11
Jun-
11
Dev
iatio
n fro
m b
asel
ine
(o c
)
-2
-1
0
1
2
Fitzroy
Jul-0
5
Oct
-05
Jan-
06
Apr
-06
Jul-0
6
Oct
-06
Jan-
07
Apr
-07
Jul-0
7
Oct
-07
Jan-
08
Apr
-08
Jul-0
8
Oct
-08
Jan-
09
Apr
-09
Jul-0
9
Oct
-09
Jan-
10
Apr
-10
Jul-1
0
Oct
-10
Jan-
11
Apr
-11
Jun-
11
Dev
iatio
n fro
m b
asel
ine
(o c
)
-2
-1
0
1
2
Figure 4 Sea temperature monitoring 2005 to 2011. Data presented are weekly deviations from regional long-term records (July 1999 to June 2008).
23

Reef Rescue Marine Monitoring Program Inshore reef monitoring – Final Report 2011
3.1.4 Condition of inshore coral reef communitiesReport card of inshore reef condition assessmentsThe assessment of coral reef community condition was based on a combination of their current condition (cover of corals and macroalgae) and their potential to recover from disturbance (rate of coral cover increase and density of juvenile corals). The underlying assumption is that a ‘healthy’ community should show clear signs of recovery after inevitable acute disturbances, such as cyclones and coral bleaching events, or, in the absence of disturbance, maintain a high cover of corals and successful larval recruitment and survival of juveniles.
The assessment of condition was first undertaken for observations between 2005 and 2009 and presented in Thompson et al. (2010b) and in Anon. (2011) as part of the Paddock to Reef reporting. The subsequent assessment (Thompson et al. 2011, Table 6) updated the first assessment but also revised the calculation of condition scores as discussed in section 2.6.1. Here we present the assessment of coral communities based on the revised methodology for observations from 2011 (Table 6). Additionally, to allow for comparisons of conditions across years, we presented the current and 2010 condition assessment scores together with the recalculated assessments for 2009 and 2008 data using the revised metrics (Figure 5).
Table 6 Regional and sub-regional estimates of coral community condition. The overall Condition for 2011 aggregates assessments of four metrics, coral cover, coral cover change, macroalgal cover and juvenile hard coral density. The regional estimates of these metrics are, in turn, derived from the aggregation of assessments from the reefs within each region (see Section 3.2). The FORAM index assessments are included as a separate metric but are not included in the overall “Condition” assessment for each region. Grey cells indicate no evaluation of the metric in that location. The colour scheme is consistent with reporting to the Paddock to Reef Program with colours reflecting the relative condition of reef communities: red= very poor, orange= poor, yellow= moderate, light green= good, dark green= very good.
Region Sub-region Condition 2011 Coral cover
Coral cover change
Macroalgae cover
Coral juveniles
FORAM index
Wet Tropics
Barron DaintreeJohnstone, Russell-MulgraveHerbert Tully
Wet Tropic (Regional)
Burdekin
Mackay Whitsunday
Fitzroy
The current (2011) regional estimates of inshore reef condition are as follows:
The overall condition of reefs in the Wet Tropics was again assessed as ‘moderate’ however the underling total score declined markedly since 2010 (Figure 5). At the sub-regional level the condition of reefs in the both the Barron Daintree and Johnstone Russell-Mulgrave sub-regions was downgraded from ‘good’ in 2010 to ‘moderate’ in 2011. In part, this downgrading of condition for the Johnstone Russell-Mulgrave sub-region reflects reductions in coral cover and juvenile densities at some reefs linked to acute disturbance as a result of tropical cyclones Tasha and possibly Yasi (both in 2011). However, ongoing disease at Fitzroy Is has also resulted in coral cover declines and, hence, underperformance of the rate of coral cover increases during periods free from
24

Reef Rescue Marine Monitoring Program Inshore reef monitoring – Final Report 2011
acute disturbance. Coral disease at Snapper Island has also influenced the downgrading of the assessment of the Barron Daintree sub-Region. Overall the rate at which coral cover has increased when not impacted by acute disturbance has declined, influencing both the assessment of coral cover but also the rate at which cover increases. In addition, in both sub-regions there was higher cover of macroalgae at some locations and reductions in the densities of juvenile colonies. In contrast to the above sub-regions, the condition of coral communities on reefs in the Herbert Tully sub-region was again rated as ‘poor’. This ‘poor’ assessment is strongly influenced by the combined impacts of cyclones Yasi (and Larry (in 2006) that have resulted in very low coral cover and low densities of juvenile corals. While reducing coral cover Cyclone Yasi also reduced the cover of macroalgae, however this is likely a short term response to physical removal and we expect macroalgae cover to increase rapidly as was the case following Cyclone Larry. A positive sign however was that coral cover was recovering at moderate rates prior to Cyclone Yasi, indicating some level of resilience.
In 2011, the condition of coral reef communities in the Burdekin Region remained ‘poor’. Cyclone Yasi reduced coral cover but also the cover of macroalgae on several reefs. However, we expect the decline in macroalgae cover to be temporary as substratum availability is high and environmental conditions that have previously allowed high macroalgal cover to persist have not changed; in the contrary, turbidity has even increased (see above). Most worrying are reductions in juvenile density that are likely to exacerbate continued lower than expected rates of coral cover increase during period free from acute disturbances. Although there were high levels of coral settlement at some reefs in 2010, tropical cyclone Yasi hit shortly after larval settlement, which will likely have limited the progression of this recruitment cohort through to juvenile-sized colonies in future years.
Coral reef communities in the Mackay Whitsunday Region maintained a ’moderate‘ condition estimate in 2011, though the underlying total assessment score has declined (Figure 5). The positive indicators of condition of low cover of macroalgae and moderate cover of corals were balanced against low and declining densities of juvenile colonies and slow rates of increase in hard coral cover. Sediments at the reefs in this region have high proportions of fine grained particles and water turbidity was high: such environmental conditions are known to be stressful to some corals. Higher levels of coral disease in this region were linked to the higher discharge of local rivers, indicating a possible link between elevated runoff resulting from floods in recent years, low rates of coral cover increase, and likely also observed declines in the density of juvenile corals.
Coral reef communities in the Fitzroy Region maintained a ‘poor’ estimate of condition in 2011. Exposure to low salinity flood waters caused a marked reduction in coral cover and juvenile densities down to at least 2m depth on reefs inshore of Great Keppel Is. This loss of coral cover resulted in a downgrading of this indicator from ‘moderate’ in to 2010 to ‘poor’ in 2011. The decline in juvenile densities led again to a ‘very poor’ assessment for this indicator. Excluding the very low settlement of coral larvae over the summer of 2010/11, which was likely to be a direct flood effect, there has been an ongoing discrepancy in this region between high rates of coral larvae settling to tiles and the low density of juvenile corals. This lack of progression from available coral larvae through to juvenile colonies along with recently observed low rates of increase in coral cover is of concern for coral community resilience in this region. Levels of coral disease in this region are proportional to annual discharge from the Fitzroy River. In light of flooding of the Fitzroy River in 2008, 2010 and 2011 this link between elevated exposure to runoff and coral stress may explain the lower than expected rates of increase in coral cover over recent years.
25

Reef Rescue Marine Monitoring Program Inshore reef monitoring – Final Report 2011
Wet Tropics
2008
2009
2010
2011
Sco
re
0.2
0.4
0.6
0.8
Burdekin
2008
2009
2010
2011
Whitsunday
Years
2008
2009
2010
2011
Fitzroy
2008
2009
2010
2011
Figure 5 Regional report card scores. For Paddock to Reef reporting scores are categorized in to a five point scale (see section 2.6.1) here the underling scores are presented allowing a more sensitive depiction of coral reef community condition through time. Yellow symbols represent communities that were assessed to be in moderate condition, while orange symbols represent communities assessed as being in poor condition.
FORAM index-based assessments of the reef conditions observed in 2011 were similar to those in last year’s assessment. The only changes compared to 2010 were an improvement from a ‘very poor’ to ‘moderate’ score for the Herbert Tully sub-region (only represented by Dunk Is), and a change from ‘poor’ to ‘very poor’ in the Mackay Whitsunday Region. The regional FORAM indices in 2011 were consistently below those observed over the period 2005-2007. As was the case for benthic communities, we interpret this decline as being caused by increased sediment and nutrient inputs to the inshore areas facilitated by strong wet seasons in recent years. In general, the community condition as indicated by the FORAM index results in a more negative assessment of the condition of the regions than indicated from the coral community assessments. Whether this reflects higher sensitivity of the foraminiferal indicators to changes in environmental conditions needs to be further evaluated. The FORAM index provides an independent diagnostic aid to the interpretation of changes occurring in the coral communities and clearly suggests a general change in environmental conditions between 2007 and 2011 that favours heterotrophic species.
26

Reef Rescue Marine Monitoring Program Inshore reef monitoring – Final Report 2011
Cover of hard coralsA combination of impacts associated with tropical cyclones Yasi and, to a lesser degree, Tasha, and the acute and chronic effects of flooding, saw coral cover decline in all regions in 2011, to be at its lowest point since surveys began in 2005 (Figure 6).
The most dramatic change in hard coral cover in the period 2005 to 2011 has occurred in the Fitzroy region where, of the reefs surveyed in 2011, cover has declined by an average of 53%. These declines are due primarily to coral bleaching caused by high temperatures in early 2006 and then record breaking flooding of the Fitzroy River in 2011. The bleaching event in 2006 caused substantial declines in cover particularly among the branching Acropora species common to reefs in this region. Recovery from this event was variable among reefs and while rapid at some locations (Diaz-Pulido et al. 2009) recovery was suppressed at others by a combination of exposure to minor storm events and ongoing incidence of coral disease. Flooding of the Fitzroy River in 2011 caused an overall reduction in coral cover similar to that caused by thermal bleaching in 2006. High levels of mortality occurred at sites at 2m depths on all reefs inshore of Great Keppel Island, consistent with exposure to low salinity waters in the Fitzroy flood plume. At these reefs cover also declined at deeper sites though salinity profiles suggest this was not due to direct exposure to reduced salinity (Devlin et al. 2011). High levels of coral disease following flood events are emerging as a chronic effect of flooding both here and in other regions. The most likely mechanisms are that corals are chronically stressed by the prolonged high levels of turbidity and sedimentation in the inshore GBR lagoon, although other, as yet unidentified, consequences of flood plume exposure cannot be discounted (see Appendix 3 for analysis of disease).
In the Wet Tropics Region there have also been two distinct disturbances that have been responsible for the majority of declines in the cover of hard corals. Cyclone Larry in 2006 caused dramatic loss of cover on reefs in the Herbert Tully sub-region where approximately 60% of hard coral cover was lost (section 3.2.3) and also the Eastern reefs of the Frankland Group in the Johnstone Russell-Mulgrave sub-region (section 3.2.2). Following this disturbance, coral cover showed signs of recovery until Cyclone Yasi caused a further loss of corals in the Herbert Tully sub-region and, in combination with Cyclone Tasha, on the eastern reefs in the Johnstone Russell-Mulgrave sub-region. In addition to the influence of cyclones Yasi and Tasha, high levels of disease observed in 2010 at Snapper Island North and Fitzroy Island appear to have resulted in continued declines in coral cover through to 2011.
In the Mackay Whitsunday Region the cover of hard corals remained stable for the period 2005-2009. During this period there were no acute disturbances in the region and the lack of increase in coral cover is of potential concern. In 2010 Cyclone Ului passed through the Whitsunday Islands. This event was the primary cause of the observed decline in hard coral cover in 2010 in that region (Figure 6). The cyclone passed almost directly over the monitoring sites at Daydream Island, and resulted in reductions in cover (see Figure 35) where dense stands of Acropora collapsed. Most other reefs visited in the region also had declining cover, although the magnitude of the disturbance was less severe and varied considerably among locations. In 2011, cover continued to decline or stayed unchanged at most reefs, the clear exception was at 2m depth at Double Cone Island where cover increased due to the survival and growth of coral fragments produced during cyclone Ului. We interpret the continued decline as a consequence of environmental stress due to exceptionally high flows of local rivers in the previous wet season (Table 5) and the resulting elevated levels of turbidity (Figure 3) and fine grained particles in sediments (Figure 2).
27

Reef Rescue Marine Monitoring Program Inshore reef monitoring – Final Report 2011
Regionally, cover has been consistently low in the Burdekin Region since surveys began in 2005 (Figure 6). From past monitoring studies (Sweatman et al. 2007, Done et al. 2007) it is clear that reefs in this region have had minimal recovery since being severely impacted by bleaching in 1998. Although disturbances have been relatively minor, the rate of cover increase has been slow and regional cover has remained consistently low. The recent decline observed in Figure 6 is due mostly to a loss of cover caused by Cyclone Yasi at some reefs: most notably at Orpheus Island East (see section 3.2.4) There were also slight declines considered to have occurred during sub cyclonic storms in 2009 (Pandora Reef, and Lady Elliot Reef) and 2010 (Pelorus Is & Orpheus Is West). Flooding of the Burdekin River and local streams in 2008, 2009 and 2011 (Table 5) have likely also contributed to slight declines or at least limited recovery of 2m sites at Middle Reef and Geoffrey Bay.
Wet Tropics
2005
2006
2007
2008
2009
2010
2011
Year
Cov
er (%
)
0
20
40
60
80
2005
2006
2007
2008
2009
2010
2011
Burdekin
2005
2006
2007
2008
2009
2010
2011
Whitsunday
2005
2006
2007
2008
2009
2010
2011
Fitzroy
Figure 6 Regional trends in hard coral cover. Bold black curve represents predicted regional trend bounded by blue dashed lines depicting the 95% confidence intervals of that trend (see section 2.6 for analysis detail). Grey lines show observed trends for each reef.
28
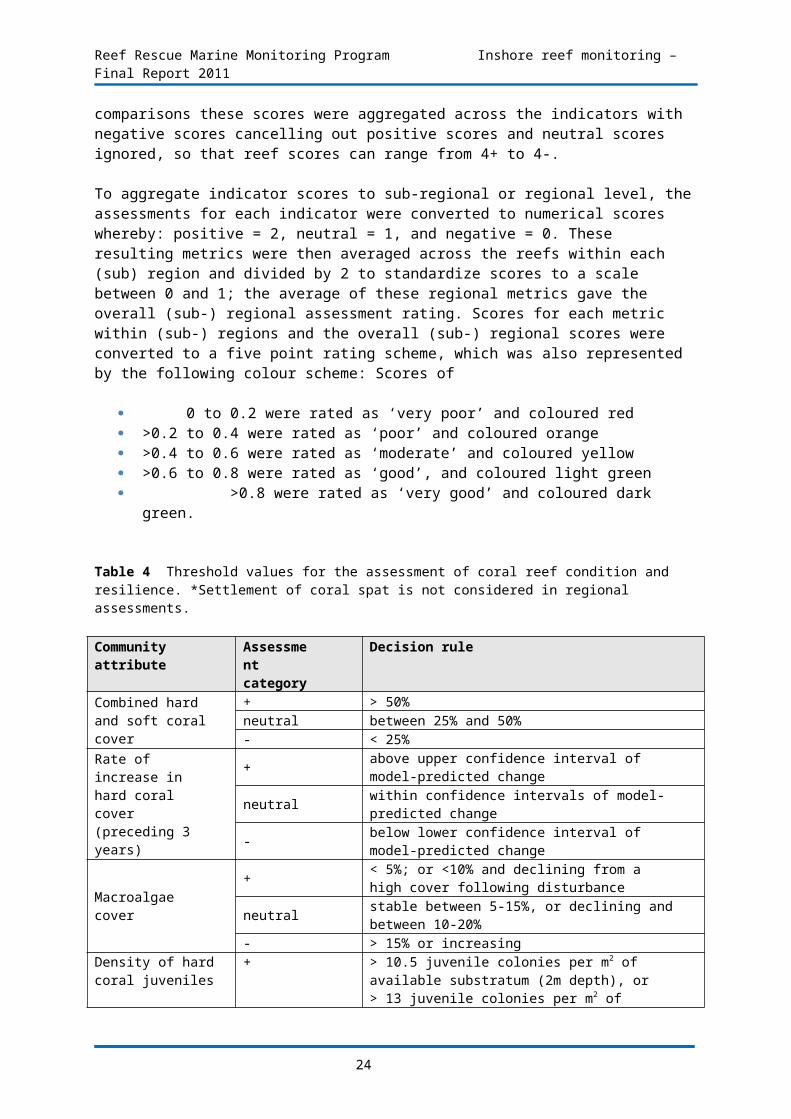
Reef Rescue Marine Monitoring Program Inshore reef monitoring – Final Report 2011
Cover of soft coralsThe average cover of soft corals was generally stable over the period 2005-2010 with cover typically low on most surveyed reefs (Figure 7). In 2011, declines were evident at some Wet Tropics and Burdekin regions reefs caused by physical removal of colonies during Cyclone Yasi. In the Fitzroy Region record flooding of the Fitzroy River killed almost all soft corals at or above 2m depth on reefs inshore of Great Keppel Island and also caused declines at deeper depths. Previous disturbances to soft coral communities include: a sharp decline on one reef (Barren Island) in the Fitzroy Region in 2008 as the result of storm damage (section 3.2.6) and similar reductions in 2006 at reefs in the Wet Tropics and Burdekin Regions exposed to Cyclone Larry (sections 3.2.2-4).
Wet Tropics
2005
2006
2007
2008
2009
2010
2011
Year
Cov
er (%
)
0
10
20
30
40
50
2005
2006
2007
2008
2009
2010
2011
Burdekin
2005
2006
2007
2008
2009
2010
2011
Whitsunday
2005
2006
2007
2008
2009
2010
2011
Fitzroy
Figure 7 Regional trends in soft coral cover. Bold black curve represents predicted regional trend bounded by blue dashed lines depicting the 95% confidence intervals of that trend (see section 2.6 for analysis detail). Grey lines show observed trends for each reef.
Cover of macroalgae The cover of macroalgae can be highly variable through time compared to that of corals, due to the short life spans of individual thalli, seasonally changing biomass and the potential for high growth rates. Inter-annual variations in cover at individual reefs can be seen in the light grey lines of Figure 8. In addition, macroalgae are consistently absent or in very low abundance at some reefs, which can make it difficult to detect consistent regional level trends, as rapid changes in cover on some reefs are weighed against consistently low, and so invariant, abundance at others. Despite these problems the following trends in the cover of macroalgae are evident.
In the Wet Tropics Region, Cyclone Larry temporarily removed algae from some reefs in the Herbert Tully sub-region resulting in a slight regional reduction in cover. In the period 2007 to 2009/10 cover tended to increase as algae re-established and occupied space made available as a result of reduced coral cover post Cyclone Larry. In addition, red algae tended to increase amongst fine branching and sub-massive corals on some reefs in the Johnstone Russell Mulgrave and Daintree sub-regions. In 2011 a reduction in cover occurred following
29

Reef Rescue Marine Monitoring Program Inshore reef monitoring – Final Report 2011
Cyclone Yasi impacting reefs in the southern part of this region. In contrast algae cover increased markedly at Snapper Island North.
In 2011, the cover of macroalgae in the Burdekin Region was at its lowest level since surveys began in 2005. Of the reefs at which moderate to high cover of macroalgae have been observed, brown algae have been the main component of the community at Geoffrey Bay, Pandora Reef and Havannah Is. Cover at these reefs was high though variable over the period 2005-2008 and then declined. Declines in cover at Pandora reefs are considered to have resulted from the physical removal of algae due to a storm event in 2009 and finally Cyclone Yasi in 2011. Similarly, low cover at Geoffrey Bay in 2011 is also considered to be the result of physical removal. Macroalgal cover at Pandora increased rapidly following 2009 and cover at Geoffrey Bay was consistently high prior to 2011, which may indicate that the current low cover levels at these reefs are only temporary. At Havannah Is the cover has followed a similar pattern as Pandora with low estimates of cover in 2009 compared with previous years and then very low cover in 2011. In contrast to Pandora, however, physical damage to the coral communities at Havannah Is was not obvious and so the reduction in cover of macroalgae here may represent a successional trend away from high macroalgal cover at this reef. At Lady Elliot Reef, cover of macroalgae has been consistently high; the macroalgal community here is a mixture of brown (Dictyota sp) and red (Hypnea sp) that form a thick blanket over a rubble substratum at 2m. We did not visit this reef in 2011 and so do not know the current status, but the impact of Cyclone Yasi on the macroalgae community is likely to be similar to that at Pandora Reef. Collectively it is likely that the high cover of macroalgae at reefs in this Region has limited the rate at which coral cover has increased.
On the Mackay Whitsunday Region reefs macroalgae are only common at two of the reefs surveyed. At neither of these reefs have there been substantial changes in cover.
Wet Tropics
2005
2006
2007
2008
2009
2010
2011
Year
Cov
er (%
)
0
10
20
30
40
50
60
2005
2006
2007
2008
2009
2010
2011
Burdekin
2005
2006
2007
2008
2009
2010
2011
Whitsunday
2005
2006
2007
2008
2009
2010
2011
Fitzroy
Figure 8 Regional trends in macroalgae cover. Bold black curve represents predicted regional trend bounded by blue dashed lines depicting the 95% confidence intervals of that trend (see section 2.6 for analysis detail). Grey lines show observed trends for each reef.
In the Fitzroy Region, communities of macroalgae differ between the mixed assemblages found at Peak Is and Pelican Is and those dominated by the brown alga Lobophora variegata
30

Reef Rescue Marine Monitoring Program Inshore reef monitoring – Final Report 2011
on the reefs further offshore. The regional-level increase between 2005 and 2007 was due to the rapid colonisation by L. variegata of coral skeletons after coral bleaching mortality in early 2006 (Diaz-Pulido et al. 2009). Subsequent declines in macroalgal cover reflect both a decrease in cover of L. variegata on offshore reefs along with a slight decrease in the cover of the mixed communities at Peak Is and Pelican Is. Interestingly, decreases in cover of macroalgae in both 2008 and 2010 were observed coinciding with major floods of the Fitzroy River. However, minor storm disturbances also occurred in these years making it unclear as to which of these disturbances exerted the greatest influence on macroalgal cover. In 2011, cover again declined on most reefs, and again this decline followed major flooding of the Fitzroy River further supporting the view that flooding results in at least short-term reductions in algae cover on these reefs.
Density of juvenile hard coral coloniesThe density of juvenile hard coral colonies has declined over the period 2005 to 2011 in all regions except for the Fitzroy Region where densities have remained low but stable (Figure 9). Comparing mean densities of juvenile colonies on reefs sampled in 2005 and 2011 shows that the largest decline has occurred in the Wet Tropics Region where the density of juvenile colonies was 65% lower in 2011. Only one reef, Snapper Is South, had a higher density in 2011. There appear to be two causes of the decrease in densities of juvenile colonies in the Wet Tropic Region. Firstly, a number of reefs were impacted by Cyclone Yasi. At these reefs similar reductions occurred in 2006 as the result of Cyclone Larry, however, over the period 2007-1010 juvenile densities increased again as corals recruited onto the exposed substratum to begin the process of recovery. Future monitoring results will show if the recovery after Cyclone Yasi will follow a similar trajectory. It should be noted, however, that a high proportion of the corals recruiting onto the reefs disturbed by Cyclone Larry were of the genus Turbinaria, a genus not common in the community prior to disturbance. Secondly, and more worrying, is a general decline in juvenile numbers on most reefs that were not impacted by either Cyclone Larry or Cyclone Yasi.
In the Burdekin Region, juvenile densities were relatively stable or showing slight declines over the period 2005-2010. In 2011 there were marked declines on reefs that were impacted by Cyclone Yasi.
In the Mackay Whitsunday Region, the density of juvenile hard corals has steadily declined since surveys began in 2005. The mean density in 2011 had declined to 49% of that observed in 2005. The only acute disturbance that affected the reefs in this region was Cyclone Ului in 2010; however, with the exception of a slight decrease in juvenile density at Daydream Is, the majority of declines do not coincide with this event and remain unexplained.
The mean juvenile density in the Fitzroy Region has been stable over the past six years. This however, masks clear reductions in the density of juvenile colonies at Pelican and Peak Islands in 2011, caused by exposure to flood waters, due to concurrent increases in densities at Barren Is and North Keppel Is. Where the density of juvenile colonies has increased there is a tendency for increasing proportions of genera that were previously not common components of the adult community. Such discrepancies between adult and juvenile community composition may be the first indications of shift in selective pressures resulting from altered environmental conditions.
The numbers of juvenile colonies recorded by this study are the result of settlement and survival over the preceding two to four years. Several acute disturbances are likely to have caused lower density of juvenile colonies on those reefs directly exposed: Cyclone Larry in 2006, Cyclone Ului in 2010, Cyclone Yasi in 2011, a local thermal bleaching event in Keppel
31

Reef Rescue Marine Monitoring Program Inshore reef monitoring – Final Report 2011
Bay in 2006, and exposure of shallow water communities to low salinity flood waters in Keppel Bay 2011. In addition to these acute events, declines in the density of juvenile colonies correspond with increasing levels of fine sediments and turbidity that are likely to be a consequence of four years of higher than median discharges from adjacent catchments (Table 5, Sections 3.1.1 and 3.1.2). These high flows were also correlated with increased levels of disease in adult corals (Appendix 3). Early life stages of corals are generally perceived as being more susceptible than adults to environmental degradation (as reviewed by Fabricius 2005), and it is entirely plausible that observed declines in juvenile densities are a direct response to increased runoff.
Wet Tropics
2005
2006
2007
2008
2009
2010
2011
Year
Col
onie
sm
2
0
5
10
15
2005
2006
2007
2008
2009
2010
2011
Burdekin
2005
2006
2007
2008
2009
2010
2011
Whitsunday
2005
2006
2007
2008
2009
2010
2011
Fitzroy
Figure 9 Regional trends in juvenile hard coral density. Bold black curve represents predicted regional trend bounded by blue dashed lines depicting the 95% confidence intervals of that trend (see section 2.6 for analysis detail). Grey lines show observed trends for each reef.
Richness of hard coral generaA possible result of environmental degradation is the loss of diversity as susceptible taxa are not replaced after mortality events. Over the period 2005-2010 there was no evidence that this is occurring with stable or increasing richness in all regions over this period (Figure 10). In 2011, richness declined in three regions, largely as a result of severe reductions in coral cover on reefs impacted by Cyclone Yasi (Wet Tropics and Burdekin regions) and flooding (Fitzroy Region). In such cases it is not unexpected that genera represented by just a few individuals would no longer be observed.
A further point to note is that richness of coral genera, as reported here, is a relatively coarse measure of diversity because a genus such as Acropora that may represent tens of species is considered equivalent to another genus that represents a single species. This is especially relevant when considering richness on turbid water reefs; a number of species found preferentially in turbid waters are from genera with only few or a single species, while the genus Acropora includes many species and many of these show preferences for clearer water reefs.
32

Reef Rescue Marine Monitoring Program Inshore reef monitoring – Final Report 2011
Wet Tropics
2005
2006
2007
2008
2009
2010
2011
Year
Num
ber o
f gen
us
0
5
10
15
20
25
2005
2006
2007
2008
2009
2010
2011
Burdekin
2005
2006
2007
2008
2009
2010
2011
Whitsunday
2005
2006
2007
2008
2009
2010
2011
Fitzroy
Figure 10 Regional trends in hard coral richness (based on number of genera). Bold black curve represents predicted regional trend bounded by blue dashed lines depicting the 95% confidence intervals of that trend (see section 2.6 for analysis detail). Grey lines show observed trends for each reef.
Richness of juvenile (<10cm) hard coral colonies Estimates of the richness of juvenile hard corals from 2005 and 2006 are not directly comparable to later observations due to a doubling of the transect area for surveys from 2007 onwards. Because of this, we only present patterns in richness from 2007 to 2011(Figure 11).
In all regions there has been a decline in the average number of genera represented by juvenile-sized colonies on the monitored reefs. These declines tend to mirror similar declines in the abundance of juvenile colonies (Figure 9). In 2011, richness decreased in all regions; however, the decline was only minor in the Fitzroy Region. In all regions the decrease coincided with the largest river discharges from adjacent catchments for at least a decade (Table 5). In addition, the passages of tropical cyclones Yasi and Tasha will also have reduced juvenile abundance and, hence, richness on some reefs in the Wet Tropics Region and Burdekin Regions. In the Mackay Whitsunday Region, the steepest decline was between 2007 and 2008 and coincided with a shift from relatively dry to wetter than average years in adjacent catchments (Table 5). In 2011 there was a further albeit lesser decline following further major flooding in the region.
As noted above for generic richness of adult hard corals, it must be noted that generic richness of juvenile hard corals is a very coarse assessment of diversity. Mostly, variation among years is largely due to the observation, or not, of individuals of rare genera. However, it is surprising that consistent declines are emerging and that they appear to coincide with an extended period of wetter than average years, suggesting a degree of sensitivity of juveniles of some genera to an increased exposure to catchment runoff, in addition to the severe disturbances by cyclones in the Wet Tropics.
N
umbe
r of g
ener
a
33

Reef Rescue Marine Monitoring Program Inshore reef monitoring – Final Report 2011
Wet Tropics
2007
2008
2009
2010
2011
Year
0
5
10
15
20
25
30
35
2007
2008
2009
2010
2011
Burdekin
2007
2008
2009
2010
2011
Whitsunday
2007
2008
2009
2010
2011
Fitzroy
Figure 11 Regional trends in juvenile hard coral richness (based on number of genera). Bold black curve represents predicted regional trend bounded by blue dashed lines depicting the 95% confidence intervals of that trend (see section 2.6 for analysis detail). Grey lines show observed trends for each reef.
Hard coral recruitment measured by settlement tilesThe settlement tile deployment and recovery of 2010/2011 represents the sixth recruitment season sampled by the MMP. For all regions and sampling years, settlement of coral larvae to tiles was highly variable (Figure 12), with total annual spat counts ranging from 16,133 to 25,876. Coral settlement to tiles is overwhelmingly dominated by the broadcast spawning Acroporidae. While not ecologically dominant in the adult coral community at all reefs, the family Acroporidae make up 80%, on average, of the spat settled to tiles. Other identifiable, but much less common, spat include the families Poritidae, Pocilloporidae and Fungiidae (see Figures 22, 31, 36, 41 in the regional report sections).
Given the observed high variability of spat counts, we explored a number of environmental variables that potentially promote or suppress coral settlement of Acroporidae (see Appendix 4 for more details on this statistical analysis). In addition to the observed inter-annual variability, the variables that showed significant relationships with larval settlement were (i) the local cover of adult Acroporidae colonies, (ii) Secchi depth during the recruitment period and (iii) the composition of local sediments (Figure A4-1a-d).
The temporal pattern of spat counts, across all reefs, shows a decrease from about 2007 to 2009 and then thereafter an increase (Figure A4-1a). The figure also includes the mean discharge of all major GBR catchment rivers to highlight the decline of settlement during the years with high river discharge, however does not represent a cause-effect-relationship (river flow was not included as a covariate in the model due to its correlation with turbidity).
There was a positive relationship between the cover of adult Acroporidae cover and the number of spat settling to tiles (Figure A4-1b), which suggests a broodstock-recruitment relationship. Other studies have shown local adult fecundity to be a significant determinant of coral settlement (Hughes et al. 2000). Alternatively, as tiles are deployed prior to spawning, bio-films that develop are likely to vary in response to the environmental conditions of the location. Experimental studies indicate that coral larvae select for substrata conditioned in habitats in which adults of their species are found (Baird et al. 2003), suggesting in turn that
N
umbe
r of g
ener
a
34

Reef Rescue Marine Monitoring Program Inshore reef monitoring – Final Report 2011
the presence of adult colonies is the result of larval selectivity. Most likely both processes contribute to the realised settlement of larvae at a given location. As the adult cover increases beyond 35% the settlement rates plateau, which indicates that beyond this threshold other drivers may become more important in influencing settlement or that at this level of cover enough larvae are produced to ensure maximum settlement.
Settlement of coral larvae increased with increasing Secchi depth around the survey reefs, i.e. increased water clarity (Figure A4-1c). However, it appears that this relationship may only hold for more turbid waters as settlement decreases in clearer waters with a Secchi depth of more than 5 m. In clearer waters, other processes such as the cover of broodstock or the connectivity to source populations may become more important. Low water clarity or high turbidity is generally considered to indicate a poor environment for both adult Acroporidae colonies (Fabricius et al. 2011) and the settlement, metamorphosis, and survival of coral planulae (reviewed by Fabricius 2005, see also Fabricius et al. 2005, Cooper et al. 2007, Humphrey et al. 2008).
Wet Tropics
2005
2006
2007
2008
2009
2010
Year
Spa
t per
tile
(ave
rage
)
0
50
100
150
200
2005
2006
2007
2008
2009
2010
Burdekin20
05
2006
2007
2008
2009
2010
Whitsunday
2005
2006
2007
2008
2009
2010
Fitzroy
Figure 12 Regional trends in coral settlement. Bold black curve represents predicted regional trend bounded by blue dashed lines depicting the 95% confidence intervals of that trend (see section 2.6 for analysis detail). Grey lines show observed trends for each reef.
Settlement of coral larvae was inversely related to the proportion of fine grained particles and organic matter in surrounding sediments (Figure A4-1d). Fine grained sediments on reefs are an indication of a low energy hydrodynamic setting that allows for the particulate portion of turbidity to settle and accumulate (e. g. Wolanski et al. 2005). Settlement of larvae is enhanced by chemical cues arising from the biological characteristics of the settlement substratum (e.g. bio-films, Negri et al. 2002, Webster et al. 2004, Tebben et al. 2011). A layer of fine sediments will limit settlement both chemically and physically, by precluding the development of appealing bio-films and by not providing a suitably stable substratum for attachment of larvae (Birrell et al. 2005). A higher proportion of coarser, calcium-carbonate-rich sediments is also indicative of clearer water reefs, often with a higher abundance of Acroporidae.
While the above environmental covariates are important drivers of Acroporidae settlement in the inshore GBR, outliers in the data highlight other potential factors. Barren Is, for example,
35

Reef Rescue Marine Monitoring Program Inshore reef monitoring – Final Report 2011
is a relatively isolated location with clearer water and higher wave exposure than the other settlement survey reefs While the adult community is dominated by Acroporidae, spat counts are low. This may be due to transport of local larvae by currents away from the reef. When turbidity levels increased during the 2009 flood of the Fitzroy River, the settlement count increased, suggesting a temporary change in hydrodynamic conditions, leading either to retention of the local larvae supply and/or to increased connectivity with other reefs (e.g. Humpy/Halfway Is). Within each region, there have been occasions where recruitment at one or more reefs has been exceptionally high, compared to other reefs or other years. This variability in spat counts can be discerned at regional levels (Figure 12), but is more obvious at the reef level (Figures 22, 31, 36, 41) and remains largely unexplained. Recruitment pulses were recorded at one or more reefs in 2007 (Wet Tropics, Burdekin, Mackay Whitsunday regions) and 2010 (Wet Tropics, Burdekin regions), while in the Fitzroy Region pulses were recorded in 2006, 2008, 2009. Most likely they reflect variability in local hydrodynamics that serve to promote connectivity to broodstock. For example, at Pandora Reef recruitment is generally well below the annual overall average (Figure 31). In 2010 the spat count was three times higher than in any other year and the second highest of all reefs sampled. The majority of spat were of the family Acroporidae, while the local adult Acroporidae cover was only 1%, indicating a distant, rather than local, supply of planulae. For the Fitzroy Region in 2006, high settlement at Humpy Is, Halfway Is and Pelican Is was unexpected as this directly followed a major bleaching event that saw a high proportion of adult corals in the region bleached white (Jones et al. 2008), with a marked reduction in coral cover (Figure 39). Bleaching of corals is assumed to reduce fecundity in the following season (Ward et al. 2002, Baird and Marshall 2002), which is contradicted in this case.
In conclusion, factors that promote or suppress large pulse events are likely to operate at a local scale and vary according to the particular reef environment. However, the factors identified to promote settlement such as high cover of broodstock, low turbidity and low abundance of fine, organic-rich sediments do highlight the importance of ongoing catchment management to support an environment favourable for coral settlement at the GBR inshore reefs. While the observed recruitment pulses remain largely unexplained, these events may prove important for maintaining community resilience, particularly where recruitment levels are normally low and the local adult cover is poor (e.g. Burdekin Region). Recruitment pulses are also likely to be important after disturbance events such as flooding and cyclones.
Foraminiferal assemblagesSediment samples for foraminiferal analysis have been collected seven times from most of the 14 core reefs; however, only samples from 2005 and 2006 (as part of a MTSRF-funded research project) and 2007, 2010 and 2011 (as part of the MMP) have been analysed for the density and composition of foraminiferal assemblages. Sediment samples from 2008 and 2009 were appropriately stored at AIMS for potential future analysis, if funding is available.
Foraminiferal densities in all regions fluctuated but are generally between 200 and 400 individuals per g sediment (Figure 13). One exception was in the Mackay Whitsunday Region where densities in 2010 had doubled compared to 2007. This increase reflects a drastic increase in the density of heterotrophic species at both Daydream Is and Pine Is (Figure 37). Also distinct is a sharp increase in densities in the Wet Tropics region in 2011, which was mainly caused by an increase of the heterotrophic community at the Frankland Group and Snapper Island (Figure 18).
The FORAM index over all monitoring years was relatively similar among the Wet Tropics, Burdekin and Fitzroy regions, but distinctly lower in the Mackay Whitsunday Region (Figure 14). However, since the baseline assessments, the FORAM index has significantly declined in all regions, except in the Fitzroy region where the decline was subtle and not significant.
36

Reef Rescue Marine Monitoring Program Inshore reef monitoring – Final Report 2011
It appears likely that higher densities and relative abundances of heterotrophic species, as observed in the Mackay Whitsunday Region, reflect increased food availability as a result of higher concentrations of organic carbon and nitrogen in the sediments (see section 3.1.1), which is most likely an effect of the recent extreme flood events. Both organic carbon and nitrogen content in sediments, in addition to grain size explained a significant amount of variation in the distribution of these species (Uthicke et al. 2010). Experimental work supported this and demonstrated that the growth of symbiont-bearing species is limited under high nutrient loads and that heterotrophic species are generally more abundant at sites with higher sediment organic carbon (Uthicke and Nobes 2008, Uthicke and Altenrath 2010, Reymond et al. 2011). However, declines in the Burdekin and Wet Tropics regions do not appear to correspond to obvious changes in the nutrient/organic matter composition of sediments.
Wet Tropics
2005
2006
2007
2008
2009
2010
2011
Year
Fora
min
ifera
per
gra
m o
f sed
imen
t
0
500
1000
1500
2000
Burdekin
2005
2006
2007
2008
2009
2010
2011
Whitsunday
2005
2006
2007
2008
2009
2010
2011
Fitzroy
2005
2006
2007
2008
2009
2010
2011
Figure 13 Regional trends in density of foraminifera. Bold black curve represents predicted regional trend bounded by blue dashed lines depicting the 95% confidence intervals of that trend (see section 2.6 for analysis detail). Grey lines show observed trends for each reef.
37

Reef Rescue Marine Monitoring Program Inshore reef monitoring – Final Report 2011
Wet Tropics
2005
2006
2007
2008
2009
2010
2011
Year
Fora
m in
dex
0
2
4
6
8
10Burdekin
2005
2006
2007
2008
2009
2010
2011
Whitsunday
2005
2006
2007
2008
2009
2010
2011
Fitzroy
2005
2006
2007
2008
2009
2010
2011
Figure 14 Regional trends in the FORAM index. Bold black curve represents predicted regional trend bounded by blue dashed lines depicting the 95% confidence intervals of that trend (see section 2.6 for analysis detail). Grey lines show observed trends for each reef.
38
Reef Rescue Marine Monitoring Program Inshore reef monitoring – Final Report 2011
3.2 Description of coral and foraminifera communities on survey reefs in each region
3.2.1 Wet Tropics Region: Barron Daintree sub-region Two reefs, Snapper Is North and Snapper Is South are sampled annually in this sub-region (Figure 15). These reefs have been monitored by Sea Research since 1995 (Ayling and Ayling 2005). These historical observations demonstrate the resilience of these communities with periods of recovery following observed disturbances (Table A1-5). This propensity to recover is evident in the observations presented here with coral cover increasing over the period 2005 to 2007 at all locations (Figure 16). Since 2007, however, changes in coral cover have been more variable with cover on the northern reefs not increasing at rates previously observed.
Google Earth 2010
Figure 15 Reef Rescue MMP inshore coral reef monitoring sites: Barron Daintree sub-region, Wet Tropics Region.
The reefs in this sub-region are subject to discharge from the Daintree and, to a lesser extent, the Mossman and Barron rivers. Snapper Is is 4km from the mouth of the Daintree River. Prior to surveys in 2005, corals at 2m sites of Snapper Is South suffered high rates of mortality as a result of freshwater inundation during floods of the Daintree River in 1996 and
39

Reef Rescue Marine Monitoring Program Inshore reef monitoring – Final Report 2011
then again in 2004 (Ayling and Ayling 2005). While not monitored at that time, anecdotal evidence suggests the deeper 5m sites were below the impact of these flood events. The coral communities at Snapper Is North were less impacted by these floods, though they did suffer substantial reductions in cover caused by coral bleaching in 1998 and then Cyclone Rona in 1999 (Ayling and Ayling 2005). Over the period 2005 to 2011, annual discharge for both the Daintree and Barron rivers has been slightly above median levels in all years other than 2007, with a major flood of the Barron River in 2008 and again in 2011. This year’s floods have resulted in the highest flows recorded for both rivers over the last ten years (Table 5).
From 2005 to 2011, the only acute disturbance to have impacted these reefs was a storm event (possibly associated with Cyclone Hamish in March 2009) that caused physical damage to corals at Snapper Is North. It is likely that this disturbance caused the slight reduction in cover of hard coral, soft coral and macroalgae observed in early 2009. While the combined cover of hard and soft corals was still high following the set-back in 2009 there has been little evidence of recovery of the hard coral community resulting in the continued negative assessment of the “change in hard coral cover” indicator (Table 7). By late 2009 at 2m depth, the cover of soft corals (largely Clavularia) and macroalgae had recovered (Figure 16). By 2010, hard coral cover had begun to recover at 2m, but continued to decline at 5m depth where reductions in the cover of the families Poritidae (genus Goniopora) and Acroporidae accounted for the majority of the change (Figure 17).
The 2011 surveys identified a substantial increase in the cover of macroalgae at both, 2m and 5m sites at Snapper Is North that looks to have further suppressed the recovery of hard coral cover (Figure 16). This mixed community is predominantly composed of red algae, (Table A1-8) a group that has been shown to inhibit coral growth by both direct shading and also by causing changes to the chemical microenvironment of the surrounding water (Hauri et. al. 2010). This increase of algae has resulted in the downgrading of assessments for this indicator to negative at both 2m and 5m, and has likely contributed to the decline of cover at 5m to below the 50% threshold and a lower density of juvenile hard corals, leading to a downgrading of the indicators for “coral cover” to neutral and “juvenile density” to negative (Table 7).
Additional to the effects the algal community may have on coral cover, scuba search surveys observed increased prevalence of coral disease in both 2010 and 2011, which is considered to be a likely contributor to the decline in coral cover. In 2010 there was a high incidence of Brown Band (BrB) and Skeletal Eroding Band (SEB) disease and it is likely that these diseases were the primary agent in reducing the Acroporidae cover from 34% to 27% at this site. Whilst there has been a decline in the prevalence of BrB and SEB, there has been an increase in White Syndrome at both sites in 2011. It is possible that changes in environmental condition caused by increased catchment runoff are linked to the increasing prevalence of disease and abundance of red algae.
In contrast to the sites on the northern side of the island, the coral communities at 2m depth on Snapper Is South continue to be assessed positively. Here, hard coral cover has increased steadily over the period 2005-2010 to reach current high levels. This increase reflects both the growth of colonies of the genus Porites that survived exposure to low salinity flood waters in 1996, and the re-establishment of Acropora colonies that suffered high rates of mortality (Ayling and Ayling 2005, Figure 17). In 2011, there was a slight decline in cover of Acropora consistent with further exposure to low salinity waters as a result of flooding of the Daintree River (Figure 17, Table 5). Macroalgal cover has been consistently low (Figure 16) and juvenile coral densities were moderate to high, suggesting a high potential for recovery of the community after disturbance, as occurred in 2009 (Figure 17). The benthic community at 5m depth remains stable with the positive attributes of a high cover of corals and low cover of macroalgae and average rate of increase within the range expected for the
40

Reef Rescue Marine Monitoring Program Inshore reef monitoring – Final Report 2011
community in place, contrasting with the negative attribute of very low density of juvenile hard corals present (Table 7, Figures 16 and 17).
Sediments at Snapper Is North had above average levels of clay and silt sized particles, organic carbon (Figure 16) and nitrogen (Table AI-1a-c). Conversely, inorganic carbon was low (Table AI-1d). In combination, these results suggest a low energy hydrodynamic setting that allows the accumulation of terrigenous sediment. The more exposed Snapper Is South had a lower proportion of fine sediments with higher inorganic carbon content, which indicated that sediments at this site were mainly reef-derived and fine sediments and organic matter did not accumulate. Turbidity at Snapper Is North (Figure 16) exceeds the Guidelines (GBRMPA 2009). High turbidity causes rapid attenuation of light in the water column, which results in a steep environmental gradient with increasing water depth, but also will result in high rates of sedimentation in low energy settings, such as the 5m depth sites. The high turbidity is reflected in the marked compositional difference between hard coral communities at 2m and 5m depth (Figure 17). Chlorophyll concentrations were only marginally below the Guidelines (Figure 16). A positive correlation was identified between water column chlorophyll and cover of reef macroalgae implying that both may be limited by ambient nutrient availability (De’ath and Fabricius 2010).
Table 7 Benthic community condition: Barron Daintree sub-region, Wet Tropics Region. For each reef the overall condition score aggregates over the metrics excluding. Regional assessments for each metric convert three point categorical assessments into a five point scale consistent with reporting to the Paddock to Reef Program (see section 2.6.1 for more details): red= ‘very poor’, orange= ’poor’, yellow= ‘moderate’, light green= ‘good’, dark green= ‘very good’. The average of the regional scores for each metric results in the overall condition regional assessment. Grey shading indicates sites/depths where metrics were not sampled.
Reef Depth(m)
Overall condition
Coral cover Change in hard coral cover
Macroalgae cover
Juvenile density
Snapper Is North
2 -- + - - -
5 --- neutral - - -
Snapper Is South
2 ++++ + + + +
5 neutral + - + -
Sub-regional assessment
The overall condition rating for the reefs in the Barron Daintree sub-region has been downgraded to “moderate” for 2011 (Table 7). Decreases in the rate of change in coral cover, decreased juvenile densities and increased macroalgae cover are the factors which primarily influence this assessment. These factors were offset by the continued high coral cover at these sites. The primary change from the baseline assessment presented in Thompson et al. (2010b) is the reduced score for “change in hard coral cover” from ‘good’ for observations over the period 2005-2009, to the current ‘poor’ for observations over the period 2008-2011 due to the lower than expected increases in coral cover at Snapper Is North and the 5m site at Snapper Is South. It is possible that both the higher incidence of disease and macroalgal cover in coral communities at Snapper Is North are symptomatic of the different environmental conditions at this site, as indicated by the water quality and sediment parameters. The future of coral communities at Snapper Is will heavily depend on the future pressures from terrestrial runoff in the region.
41
Reef Rescue Marine Monitoring Program Inshore reef monitoring – Final Report 2011
Snap
per I
s So
uth
2005
2007
a20
07b
2009
a20
09b
2010
2011
Cov
er (%
)
0
20
40
60
80
100
Snap
per I
s N
orth
2m
Cov
er (%
)
0
20
40
60
80
1005m5m
Chl
orop
hyll
(g-1
)
0.1
0.5
1
2
Turb
idity
(NTU
)
0.5
1
2
34
6
Cla
y &
Silt
(%)
0
20
40
60
80
Org
anic
Car
bon
(%)
0.0
0.2
0.4
0.6
0.8
1.0
Benthic Community Water Quality Sediment
2005
2007
a20
07b
2009
a20
09b
2010
2011
Cla
y &
Silt
(%)
0
10
20
30
40
50
Org
anic
Car
bon
(%)
0.0
0.2
0.4
0.6
0.82m 5m
Figure 16 Cover of major benthic groups and levels of key environmental parameters: Barron Daintree sub-region, Wet Tropics Region. Stacked bars represent cumulative cover of hard coral (blue), soft coral (pink) and macroalgae (green). Box plots for both water and sediment quality represent the distribution of all observations to date, i.e., median value (fine line within the grey box), mean value (heavy line, WQ only), and the ranges of the central 50% (grey box), 80% (whiskers), and 90% (black dots) of observations. Red reference lines indicate the Guidelines for water quality parameters (GBRMPA 2009), and the overall mean across all Reef Rescue MMP reefs for sediment parameters.
42

Reef Rescue Marine Monitoring Program Inshore reef monitoring – Final Report 2011
Sn
appe
r Is
Nor
th
Cov
er %
0
10
20
30
40
50
60
2005
2007
a20
07b
2009
a20
09b
2010
2011
Snap
per I
s So
uth
2005
2007
a20
07b
2009
a20
09b
2010
2011
Cov
er %
0
10
20
30
40
50
60
2m 5m
Juv
enile
s (m
-2)
0
5
10
15
2005
2007
a20
07b
2009
a20
09b
2010
2011
2005
2007
a20
07b
2009
a20
09b
2010
2011
Juve
nile
s (m
-2)
0
5
10
15
2m 5m
Hard Coral Cover Hard Coral Juveniles
2m 5m2m 5m
Acroporidae Agariciidae Faviidae Poritidae other
Figure 17 Composition of hard coral communities: Barron Daintree sub-region, Wet Tropics Region. Stacked bars represent cumulative cover, or density of juvenile colonies per m2, of dominant families within the region (see legend for colour coding). Only families for which cover exceeded 4% cover on at least one reef at one depth in one year were differentiated, all other families were aggregated into ‘other’.
Foraminiferal samples from the Barron Daintree sub-region are only available from two locations at Snapper Is, and only at Snapper Is North are these available for three points in time. At Snapper Is North the richness of foraminifera increased between 2007 and 2010 (Figure 18). This is mainly due to an increase in the number of heterotrophic species, which have also increased in abundance. This change (a higher proportion of heterotrophic individuals) has lead to a strong decline in the FORAM index to a value close to 4 in 2010 and 2011. In the Caribbean, FORAM index values of between 2 and 4 reflect environmental conditions that are marginal for coral reef growth (Hallock et al. 2003). Interestingly, this result coincides with a period during which the rate of increase in coral cover was suppressed (Table 7), which adds weight to the notion that the environmental conditions experienced over the last three years may be causing a degree of chronic stress to benthic communities.
No assessment of condition based on the FORAM index was carried out, because there was only one year (2007) available during the baseline period, on which they assessment was based (see section 2.6.1).
43

Reef Rescue Marine Monitoring Program Inshore reef monitoring – Final Report 2011
Sn
appe
r Is
Sout
h
2005
2007
a20
07b
2009
a20
09b
2010
2011
Ric
hnes
s
0
10
20
30
40
Snap
per I
s N
orth
Ric
hnes
s
0
10
20
30
40
Den
sity
(Ind
. g S
ed
-1)
0200400600800
100012001400160018002000
Fora
m In
dex
0
2
4
6
8
10
2005
2007
a20
07b
2009
a20
09b
2010
2011
Den
sity
(Ind
. g S
ed
-1)
0
100
200
300
400
500
600
Fora
m In
dex
0
2
4
6
8
10
Figure 18 Composition of foraminiferal assemblages: Barron Daintree sub-region, Wet Tropics Region. Bars are the cumulative richness (number of species), or density of individual trophic groups per gram of sediment. Groups as used to calculate the FORAM index are separated by colours (green = symbiont-bearing foraminifera, yellow = opportunistic foraminifera, grey = heterotrophic foraminifera. The FORAM index value is indicated by a triangle.
44

Reef Rescue Marine Monitoring Program Inshore reef monitoring – Final Report 2011
3.2.2 Wet Tropics Region: Johnstone Russell-Mulgrave sub-region
Of the reefs surveyed in this sub-region (Figure 19), those at the Frankland Group and Fitzroy Is have been monitored regularly since 1995 (Ayling and Ayling 2005) and 1992 (Sweatman et al. 2005), respectively. These monitoring programs, along with observations from Reef Rescue MMP, have documented five major disturbances that resulted in substantial reductions in coral cover on reefs in this sub-region; coral bleaching in 1998 and 2002, crown-of-thorns starfish (COTS) outbreak in 1999-2000, Cyclone Larry in 2006 and Cyclone Yasi or/and Tasha in 2010/11 (Table A1-5). Of the reefs for which long-term information exists, the eastern reefs of the Frankland Group suffered the greatest coral mortality as a result of coral bleaching in 1998 where 44% of hard coral cover was lost. A similar proportion of coral cover was lost (43%) on the western reefs (Ayling and Ayling 2005). Fitzroy Is and the Frankland Group both suffered a major reduction in coral cover due to COTS in the period 1999-2000: western reef slope communities at Fitzroy Is lost 78% of their hard coral (Sweatman et al. 2007) and the eastern reef communities of the Frankland Group lost 68% (Ayling and Ayling 2005). Bleaching in 2002 was less severe than in 1998, but still affected most coral communities in some way (Table A1-5). Freshwater plumes associated with major flooding were recorded at most reefs in 1994, 1995, 1996, 1997 and 1999 (Devlin et al. 2001, Devlin and Brodie 2005); however, observations from the time suggest there were no marked impacts on coral cover directly attributable to these events at the depths monitored by the MMP. It is possible that coral communities in water shallower than 2m may have suffered some mortality during these flood events. Observations in February 2009, immediately following flooding of the Russell-Mulgrave River, strongly suggested that freshwater had impacted shallow reef flat communities at some locations (AIMS unpublished data). At the same time, physical damage to corals at Fitzroy Is West was also noticed and attributed to Cyclone Hamish. In January 2011, a layer of low salinity water was observed at High Is West to be causing bleaching and mortality of corals down to the depth of our 2m sites. Longer-term trajectories of coral cover at Fitzroy Is and the Frankland Group are presented in Sweatman et al. (2007), and show periods of recovery up to 2005 following the earlier disturbance events described above.
The Wet Tropics Region was affected by two cyclones in 2011; Cyclone Tasha and Cyclone Yasi. Reefs in the Johnstone Russell-Mulgrave sub-region were heavily impacted by both of these systems. Cyclone Tasha, formed off the Wet Tropics coast on the 24th of December 2010 and had dissipated by the 25th, crossing the coast between Cairns and Innisfail. The system bought winds of up to 75 km h-1 and heavy rainfall (up to 250 mm in some areas). This heavy rainfall contributed to the highest discharges recorded in over at least the last decade for all four major rivers in the sub-region (Table 5). Corals at High Is West were the most impacted with 19% of hard coral cover lost at 2m. The families Acroporidae and Pocilloporidae were disproportionately impacted losing 72% and 89% of cover, respectively (Figure 21). As Cyclone Tasha was a relatively small system, physical damage to reefs appeared limited to east facing sites in the direct path of the storm. High Is East was the only eastern site visited between the two cyclones (Tasha and Yasi) and the majority of coral loss (80% at 2m and 56% at 5m) is attributable to Cyclone Tasha (Figure 20 and Table A1-5).
On January 30th 2011, Cyclone Yasi formed 370 km northeast of Vanuatu and crossed the coast as a category 4 cyclone near Mission Beach on the 2nd of February. This storm brought winds gusting to 285 km h-1 causing wide spread damage in the Wet Tropics. Reefs at High Is East and Frankland Group East were potentially impacted by Cyclone Yasi, however, it would be impossible to separate the impacts from those of Cyclone Tasha as no formal surveys were conducted in the interim. Frankland Group East lost 51% of coral cover at 2m and 35% at 5m attributable to the combined impacts of these cyclones. Frankland Group West suffered a 33% loss of hard coral cover at the 2m, though little physical
45

Reef Rescue Marine Monitoring Program Inshore reef monitoring – Final Report 2011
disturbance was observed suggesting this loss was more likely the result of exposure to flood waters.
©Google Earth 2010
Figure 19 Reef Rescue MMP inshore coral reef monitoring sites (yellow symbols): Johnstone Russell-Mulgrave sub-region, Wet Tropics Region.
The reefs in this sub-region are regularly subjected to outflows from the Johnstone and the Russell-Mulgrave rivers. Although these rivers pass through catchments with intense agricultural development, the majority of reefs surveyed have sediments with moderately low proportion of clay and silt, organic carbon and nitrogen (Figure 20 and Table AI-1a-c), indicating low residence or low accumulation of sediment components derived from the rivers. The exception is Frankland Group West that continues to have higher than average levels of clay and silt, organic carbon and nitrogen. The accumulation of fine sediments has been restricted to pockets and gullies formed between large coral colonies. Given the relatively clear waters at this location (Schaffelke et. al. 2011), complex topography and sheltered nature of the location it is likely that the sediment characteristics here reflect a hydrodynamic setting that reduces resuspension of sediments rather than an indication of high sediment supply. This observation is supported by the general lack of sediment accumulation onto coral settlement tiles deployed at this reef compared with high rates of accumulation at other reefs with similar sediment characteristics but more turbid waters.
46

Reef Rescue Marine Monitoring Program Inshore reef monitoring – Final Report 2011
Fitzroy Is the most northerly reef in the Johnstone Russell-Mulgrave sub-region and, hence, was least impacted by the two cyclones. No physical damage was evident at either Fitzroy Is East or West sites, however, coral cover had declined by 45% (54% at 2m and 38% at 5m) and 29% (40% at 2m and 14% at 5m) respectively. The cause of this decline has been attributed primarily to disease. Disease levels were high in 2010 and increased further in 2011. As in other regions, this peak in disease corresponds to increased river flow (Appendix 3). The disease observed primarily targeted corymbose and tabulate forms of Acropora with many recently killed colonies observed during surveys in 2011. Although levels of turbidity and chlorophyll are largely within GBRMPA guidelines, the emerging picture is that it may not be the ambient levels of water quality and sediment parameters but changes to these levels that cause stress to coral communities and promote disease outbreaks (Fabricius 2005, Appendix 3)
Within this sub-region average turbidity levels and chlorophyll concentrations are below the Guidelines (GBRMPA 2009, Figure 20). The regionally low cover of macroalgae (Figure 8) is consistent with the observed low levels of these key water quality variables. The low cover of macroalgae at these sites adds to the positive assessment of condition at most reefs (Table 8). In addition, the broad similarities in community composition between 2m and 5m depths (Figure 21) are consistent with a low turbidity environment; light climate is generally acknowledged as a strong determinant of coral community composition and the rate of change in light climate with depth is proportional to turbidity.
Coral cover declined at all reefs in 2011 (Figure 20), which led to a downgrading of the assessment of coral cover to ‘moderate’ (Table 8) from the ‘very good’ assessment in 2010. Acute disturbance as a result of cyclones Tasha and possibly Yasi impacted the eastern reefs of Frankland Group and High Is. Flood waters reduced cover at 2m at High Is West and disease was the main cause of coral cover loss at Fitzroy Island. The hard coral communities in this region fall into two broad categories, those with a high proportion of the family Acroporidae and those with a high proportion of the family Poritidae (Figure 21). In general, species within the family Acroporidae are fast growing but can be disproportionately susceptible to environmental stress compared to those of the family Poritidae (e.g., Baird and Marshall 2002, van Woesik 1991). In addition, Acroporidae tend to occur on the more exposed eastern reefs and Poritidae on the relatively sheltered western reefs, making Acroporidae more susceptible to the impacts of tropical cyclones. Over the period 2005-2009, coral communities in this region have increased in cover when not impacted by acute disturbance events in line with expected rates, given the relative proportions of Acroporidae to other families. These increases in cover resulted in generally neutral or positive assessments for the indicator “change in hard coral cover” until and including 2010. In 2011, assessments for this indicator tended to decline due to slower rates or lack off increases in cover in recent years (Table 8). It should here be reiterated that these assessments are based on observations of rate of change of the preceding three years and exclude changes caused by acute disturbance events.
The overall condition rating for this sub-region has been downgraded from ‘good’ in 2010 to ‘moderate’ based on observations in 2011 (Table 8). Large losses in coral cover, decreased juvenile density and lower than predicted changes in hard coral cover offset the positive attribute of generally low cover of macroalgae. In part this downgraded assessment is influenced by the recent disturbance. This is not the case for the density of juvenile corals that has been steadily declining across the region since 2006 resulting in the assessment for this metric in 2011 being ‘very poor’ (Figure 21, Table 8).
One promising observation was the relatively high recruitment recorded for the 2010 spawning season (Figure 22). Both Fitzroy Is West and High Is West had above average levels of recruitment that were higher than those of the previous two years. How much these
47

Reef Rescue Marine Monitoring Program Inshore reef monitoring – Final Report 2011
increases in settlement influence the resilience of reefs in the sub-region will depend on the survivorship of the 2010 cohort and its progression into measurably higher juvenile densities in future years.
Table 8 Benthic community condition: Johnstone Russell-Mulgrave sub-region, Wet Tropics Region. For each reef the overall condition score aggregates over the metrics excluding Settlement and FORAM index. Regional assessments for each metric convert three point categorical assessments into a five point scale consistent with reporting to the Paddock to Reef Program (see section 2.6.1 for more details): red= ‘very poor’, orange= ’poor’, yellow= ‘moderate’, light green= ‘good’, dark green= ‘very good’. The average of the regional scores for metrics, excluding Settlement and FORAM index, result in the overall condition regional assessment. Grey shading indicates sites/depths where metrics were not sampled.
Reef Depth(m)
Overall Condition
Coral cover
Change in hard coral
cover
Macroalgae cover
Juvenile density
Settlement FORAM index
Fitzroy Is East
2 - - - - + -
5 - neutral - + -
Frankland Group East
2 - - - - neutral - -
5 neutral - + neutral neutral
Frankland Group West
2 -- neutral - neutral -
5 - - + - neutral - - -
Fitzroy Is West
2 + + - + neutral
5 ++ + - + neutral + -
High Is East
2 - - - - + -
5 neutral neutral neutral + -
High Is West
2 ++ + + + -
5 - - - - + - neutral -
Sub-regional assessment
48
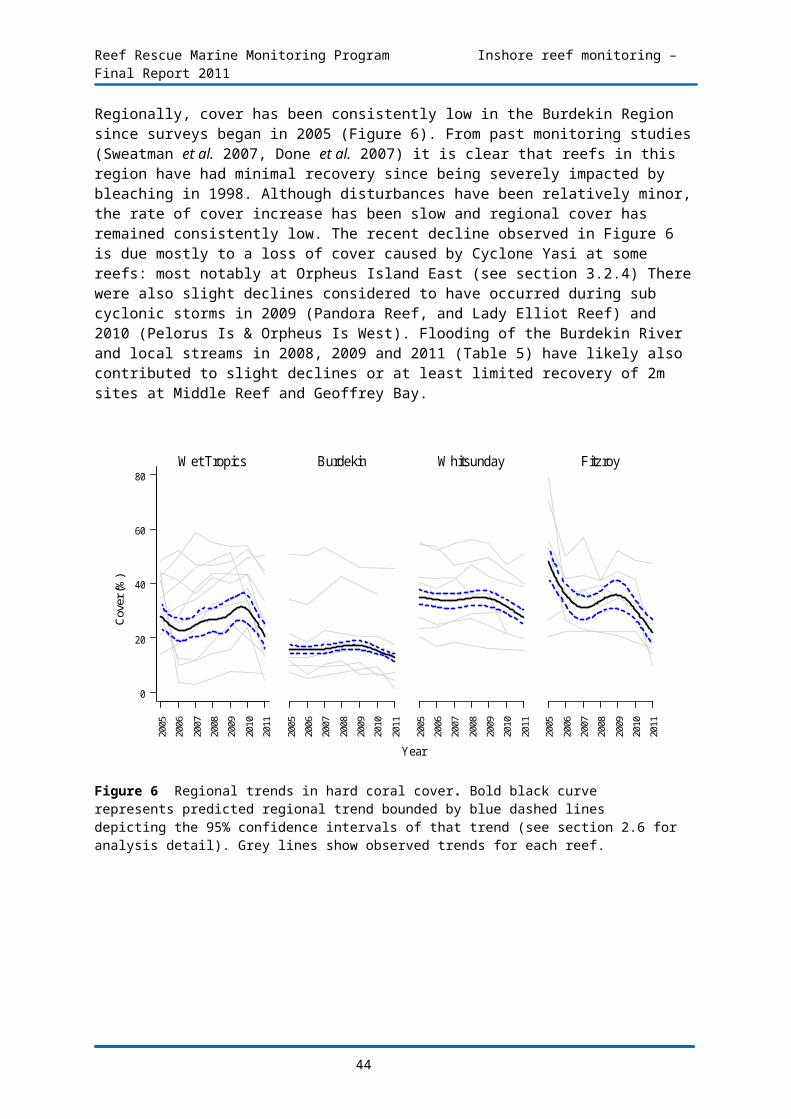
Reef Rescue Marine Monitoring Program Inshore reef monitoring – Final Report 2011
5m
Cla
y &
Silt
(%)
0
10
20
30
40
Org
anic
Car
bon
(%)
0.0
0.1
0.2
0.3
0.4
0.5
Benthic Community Water Quality Sediment
Chl
orop
hyll
(g-1
)
0.0
0.2
0.4
0.6
0.8
1.0
1.2Tu
rbid
ity (N
TU)
0.1
0.3
0.5
1
2
3
Cla
y &
Silt
(%)
0
10
20
30
40
50
60
Org
anic
Car
bon
(%)0.0
0.2
0.4
0.6
0.8
Cla
y &
Silt
(%)
0
10
20
30
40
Org
anic
Car
bon
(%)
0.0
0.1
0.2
0.3
0.4
0.5
Cla
y &
Silt
(%)
0
10
20
30
40
Org
anic
Car
bon
(%)
0.0
0.2
0.4
0.6
0.8
Chl
orop
hyll
(g-1
)
0.0
0.2
0.4
0.6
0.8
1.0
1.2
Turb
idity
(NTU
)
0.1
0.3
0.5
1
2
3
Fitz
roy
Is E
ast
2m
Cov
er (%
)
0
20
40
60
80
100 5m
Fran
klan
d G
roup
Eas
tC
over
(%)
0
20
40
60
80
100
Fran
klan
d Is
Gro
up W
est
Cov
er (%
)
0
20
40
60
80
100
Fitz
roy
Is W
est
2005
2006
2007
2008
2009
2010
2011
Cov
er (%
)
0
20
40
60
80
100
2005
2006
2007
2008
2009
2010
2011
5m 2m
5m 2m
5m 2m
Figure 20 Cover of major benthic groups and levels of key environmental parameters: Johnstone Russell-Mulgrave sub-region, Wet Tropics Region. Stacked bars represent cumulative cover of hard coral (blue), soft coral (pink) and macroalgae (green). Box plots for both water and sediment quality represent the distribution of all observations to date, i.e., median value (fine line within the grey box), mean value (heavy line, WQ only), and the ranges of the central 50% (grey box), 80% (whiskers), and 90% (black dots) of observations. Red reference lines indicate the Guidelines for water quality parameters (GBRMPA 2009), and the overall mean across all Reef Rescue MMP reefs for sediment parameters.
49
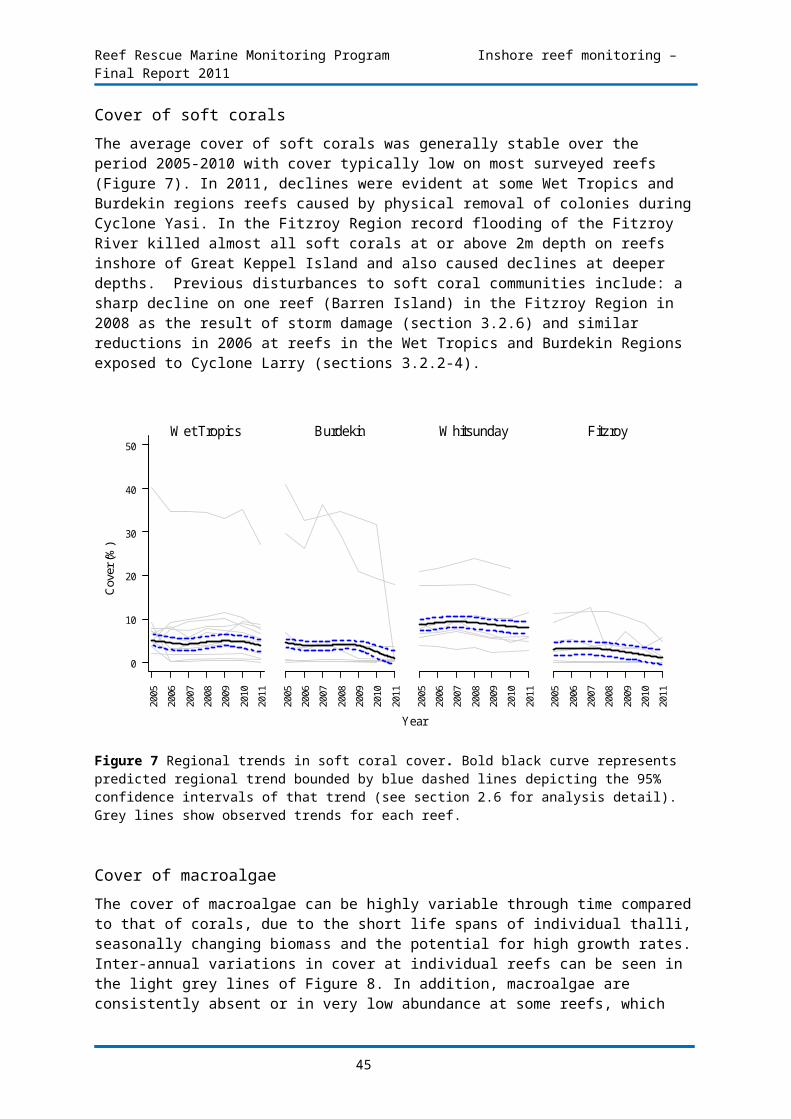
Reef Rescue Marine Monitoring Program Inshore reef monitoring – Final Report 2011
Hig
h Is
Wes
t
2005
2006
2007
2008
2009
2010
2011
Cov
er (%
)
0
20
40
60
80
100
Hig
h Is
Eas
tC
over
(%)
0
20
40
60
80
100
2005
2006
2007
2008
2009
2010
2011
Chl
orop
hyll
(g-1
)
0.0
0.2
0.4
0.6
0.8
1.0
1.2
Turb
idity
(NTU
)
0.1
0.3
0.5
1
2
3
Cla
y &
Silt
(%)
0
10
20
30
40
Org
anic
Car
bon
(%)
0.0
0.1
0.2
0.3
0.4
0.5
Cla
y &
Silt
(%)
0
10
20
30
40
Org
anic
Car
bon
(%)
0.0
0.1
0.2
0.3
0.4
0.5
Figure 20 continued.
50

Reef Rescue Marine Monitoring Program Inshore reef monitoring – Final Report 2011
Fitz
roy
Is E
ast
Cov
er %
0
20
40
60
2005
2006
2007
2008
2009
2010
2011
Fitz
roy
Is W
est
2005
2006
2007
2008
2009
2010
2011
Cov
er %
0
20
40
60
Fran
klan
d G
roup
Eas
t
Cov
er %
0
20
40
60
Fran
klan
d G
roup
Wes
t
Cov
er %
0
20
40
60
Juv
enile
s (m
-2)
0
5
10
15
20
2005
2006
2007
2008
2009
2010
2011
2005
2006
2007
2008
2009
2010
2011
Juve
nile
s (m
-2)
0
5
10
15
20
2m 5m
Juve
nile
s (m
-2)
0
5
10
15
20
Juve
nile
s (m
-2)
0
5
10
15
2m 5m
2m 5m
2m 5m
2m 5m
2m 5m
2m 5m
Hard Coral Cover Hard Coral Juveniles
Acroporidae Agariciidae Pocilloporidae Poritidae other
2m 5m
Figure 21 Composition of hard coral communities: Johnstone Russell-Mulgrave sub-region, Wet Tropics Region. Stacked bars represent cumulative cover, or density of juvenile colonies per m2, of dominant families within the region (see legend for colour coding). Only families for which cover exceeded 4% cover on at least one reef at one depth in one year were differentiated, all other families were aggregated into ‘other’.
51

Reef Rescue Marine Monitoring Program Inshore reef monitoring – Final Report 2011
Hig
h Is
Eas
t
Cov
er %
0
20
40
60
2005
2006
2007
2008
2009
2010
2011
Hig
h Is
Wes
t
2005
2006
2007
2008
2009
2010
2011
Cov
er %
0
20
40
60
2m 5m
Juv
enile
s (m
-2)
0
5
10
15
20
2005
2006
2007
2008
2009
2010
2011
2005
2006
2007
2008
2009
2010
2011
Juve
nile
s (m
-2)
0
5
10
15
20
2m 5m
Hard Coral Cover Hard Coral Juveniles
2m 5m2m 5m
Acroporidae Agariciidae Pocilloporidae Poritidae other
Figure 21 continued.
Figure 22 Coral settlement to tiles: Johnstone Russell-Mulgrave sub-region, Wet Tropics Region. Data are from 5m tile deployments. Average values from all reefs and regions over all years are indicated by red reference lines.
52

Reef Rescue Marine Monitoring Program Inshore reef monitoring – Final Report 2011
Communities of foraminifera on the eastern sides of Islands in the Johnstone Russell-Mulgrave sub-region typically had low richness and abundance of heterotrophic species leading to high values of the FORAM index. This combination of community attributes is typical of foraminiferal assemblages living under environmental conditions with low turbidity and limited accumulation of fine grained sediments (e.g., Renema et al. 2001). On the more sheltered western sides of the Islands, where fine sediments accumulate and sediments have higher concentrations of organic carbon (Figure 20), the richness and relative abundance of heterotrophic species is higher, leading to lower values of the FORAM index (Figure 23). In 2010, the density of foraminifera was low at both High Is West and Fitzroy Is West which was in stark contrast to the very high density at Frankland Is West. At the latter location, the abundance of heterotrophic species was highly variable through time. This trend continued in 2011, but density values at Frankland Is West assumed extremely high values (> 2000 ind. g sed-1) in that year, leading to overall temporal variation of densities at that location by about one order of magnitude..
Considering values of the FORAM index over the period 2005-2007 as a baseline, there has been a decline in the relative abundance of symbiont-bearing species at both Frankland Group West and High Is West leading to the reduced FORAM index. This decline was confirmed in 2011 leading to a ’very poor‘ assessment of foraminiferal assemblage condition in 2011 (Table 8) on those reefs .
53

Reef Rescue Marine Monitoring Program Inshore reef monitoring – Final Report 2011
5m
Fitz
roy
Is E
ast
Ric
hnes
s
0
10
20
30
40
Den
sity
(Ind
. g S
ed -1
)
0
100
200
300
400
500
600
Fora
m In
dex
0
2
4
6
8
10
Fran
klan
d G
roup
Eas
tR
ichn
ess
0
10
20
30
40
Den
sity
(Ind
. g S
ed -1
)
0
100
200
300
400
500
600
Fora
m In
dex
0
2
4
6
8
10
Fran
klan
d G
roup
Wes
tR
ichn
ess
0
10
20
30
40
Den
sity
(Ind
. g S
ed -1
)
0200400600800
1000120014001600180020002200
Fora
m In
dex
0
2
4
6
8
10
Fitz
roy
Is W
est
2005
2006
2007
2008
2009
2010
2011
Ric
hnes
s
0
10
20
30
40
2005
2006
2007
2008
2009
2010
2011
Den
sity
(Ind
. g S
ed -1
)
0
100
200
300
400
500
600
Fora
m In
dex
0
2
4
6
8
10
5m
Hig
h Is
Eas
tR
ichn
ess
0
10
20
30
40
Den
sity
(Ind
. g S
ed -1
)
0
100
200
300
400
500
600
Fora
m In
dex
0
2
4
6
8
10
Hig
h Is
Wes
t
2005
2006
2007
2008
2009
2010
2011
Ric
hnes
s0
10
20
30
40
2005
2006
2007
2008
2009
2010
2011
Den
sity
(Ind
. g S
ed -1
)
0
100
200
300
400
500
600
Fora
m In
dex
0
2
4
6
8
10
Figure 23 Composition of foraminiferal assemblages: Johnstone Russell-Mulgrave sub-region, Wet Tropics Region. Bars are the cumulative richness (number of species), or density of individual trophic groups per gram of sediment. Groups as used to calculate the FORAM index are separated by colours (green = symbiont-bearing foraminifera, yellow = opportunistic foraminifera, grey = heterotrophic foraminifera. The FORAM index value is indicated by a triangle.
54

Reef Rescue Marine Monitoring Program Inshore reef monitoring – Final Report 2011
3.2.3 Wet Tropics Region: Herbert Tully sub-regionThe past dynamics of the reefs in this region are largely unknown as no quantitative monitoring was undertaken prior to the MMP starting in 2005. Flood plume observations by Devlin et al. (2001) show that these reefs were subject to flood events on at least three occasions between 1991 and 2001 (Table A1-5); however, the impacts on the benthic communities are unknown. Recent modelling work (Wooldridge and Done 2004) indicates that hard coral communities in this sub-region were likely to have been impacted by coral bleaching in 1998 and 2002 (Table A1-5). Reductions in hard coral cover similar to those observed by Ayling and Ayling (2005) at the Frankland Is Group in 1998 (43%) may also have occurred in the Herbert Tully sub-region.
©Google Earth 2010
Figure 24 Reef Rescue MMP inshore coral reef monitoring sites (yellow symbols): Herbert Tully sub-region, Wet Tropics Region.
The reefs in this sub-region are exposed to the outflow from the Herbert and Tully Rivers, with Dunk Is only 10km from the Tully River mouth (Figure 24). Both the Tully and Herbert Rivers produced significant flood plumes in 2009, and again in 2011 (see Table 5 and Devlin et al. 2011). The levels of fine sediment and organic carbon in the reefal sediments are low compared to the average from all regions (Figure 25). Turbidity levels at Dunk Is North are consistently high with mean turbidity from 2007- 2011 exceeding the Guidelines (GBRMPA
55

Reef Rescue Marine Monitoring Program Inshore reef monitoring – Final Report 2011
2009), above which coral reef communities undergo substantial changes (De’ath and Fabricius 2008, 2010) (Figure 25). In combination, the sediment and turbidity data suggest a process of frequent re-suspension rather than accumulation of sediments at the sites sampled. The mean chlorophyll concentration was below the Guidelines (GBRMPA 2009) over the period 2007-2011 (Figure 25).
In March 2006, Cyclone Larry severely impacted the coral communities at North Barnard Group and Dunk Is North, resulting in a substantial reduction in the cover of hard and soft corals and also macroalgae (Figure 25). King Reef was also affected; however, as coral cover was already very low, the disturbance was most evident in the removal of macroalgae (Figure 25). A decline in hard coral cover was also observed at Dunk Is South consistent with the timing of Cyclone Larry. Mortality here was considered to have been the result of high turbidity and sedimentation with many corals suffering partial mortality by smothering and bleaching rather than the physical damage, as was observed at the more exposed sites.
In 2011 reefs in this sub-region again suffered extensive damage caused by Cyclone Yasi. Dunk Is North had the greatest loss of coral cover loosing 91% of the coral cover at 2m and 71% at 5m. Following Cyclone Larry, surviving coral fragments were scattered on the substratum with re-growth from these fragments contributing to rapid recovery at Dunk Is North. In contrast, the extreme intensity of Cyclone Yasi left few surviving fragments; a fact that will impede recovery. Dunk Is South also suffered extensive coral loss (75% at 2m and 53% at 5m) during Cyclone Yasi and again, as for Cyclone Larry, the majority of damage here appeared to be due to bleaching, disease and smothering by sediment, though some physical damage was also observed. North Barnard Group, where cover was still very low, was less affected, losing 26% of the coral cover at 2m and only 4% at 5m (Figure 25).
The density of juvenile colonies at all reefs in this sub-region was significantly lower than the previous year, resulting in the overall poor assessment of this condition indicator (Table 9). Although both juvenile and adult densities were reduced, the disparity between the community compositions of each was still apparent (Figure 26). This was most notable at North Barnard Group and Dunk Is North, where juvenile communities had high representation of the families Dendrophylliidae and Faviidae compared to the adult communities that tended to include a high proportion of the family Acroporidae prior to disturbance (Figure 26). Within the family Faviidae, a number of species are either small or have slow growth rates and so it is not clear whether high densities of such taxa are likely to lead to substantial increases in the cover of these families. Juveniles of the family Dendrophylliidae on these reefs are almost entirely of the genus Turbinaria, a group that can form high cover stands especially on turbid water reefs, though they can also suffer high mortality as they have a propensity to attach to lose substrata making them prone to toppling. Should there be a moderate survivorship of Turbinaria, it is possible that the adult community composition may shift on these reefs. Given the considerable depletion in the adult Acroporidae community, the resulting available space may support such a change in community composition.
The overall condition rating for reefs in this sub-region remains ’poor’, primarily due to low cover of corals, and declines in the density of juvenile colonies (Table 9). Substantially reduced cover, coupled with few surviving fragments of the fast growing Acroporidae, suggests that the rapid recovery following Cyclone Larry may not be repeated. At Dunk Is South, where diversity at both depths is highest among this sub-region, the cover of Acroporidae is relatively low and the community comprised of a suite of slower growing corals thus reducing the capacity for rapid change in cover.
56

Reef Rescue Marine Monitoring Program Inshore reef monitoring – Final Report 2011
Table 9 Benthic community condition: Herbert Tully sub-region, Wet Tropics Region. For each reef the overall condition score aggregates over the metrics excluding Settlement and FORAM index. Regional assessments for each metric convert three point categorical assessments into a five point scale consistent with reporting to the Paddock to Reef Program (see section 2.6.1 for more details): red= ‘very poor’, orange= ’poor’, yellow= ‘moderate’, light green= ‘good’, dark green= ‘very good’. The average of the regional scores for metrics, excluding Settlement and FORAM index, result in the overall condition regional assessment. Grey shading indicates sites/depths where metrics were not sampled.
Reef Depth(m)
Overall Condition
Coral cover
Change in hard coral cover
Macroalgae cover
Juvenile density
FORAM index
North Barnard Group
2 - - neutral + -
5 + - neutral + +
Dunk Is North
2 - - - neutral neutral -
5 neutral - neutral + neutral neutral
King Reef2 - - - + neutral -
5 - - + neutral neutral
Dunk Is South
2 - - neutral + -
5 neutral - - + +
Sub-regional assessment
57

Reef Rescue Marine Monitoring Program Inshore reef monitoring – Final Report 2011
Nor
th B
arna
rd G
roup
2m
Cov
er (%
)
0
20
40
60
80
100 5m
Cla
y &
Silt
(%)
0
10
20
30
40
Org
anic
Car
bon
(%)
0.0
0.1
0.2
0.3
0.4
0.5Benthic Community Water Quality Sediment
Dun
k Is
Nor
thC
over
(%)
0
20
40
60
80
100
Chl
orop
hyll
(g-1
)
0.0
0.2
0.4
0.6
0.8
1.0
Turb
idity
(NTU
)
0.5
1
3
6
9
Cla
y &
Silt
(%)
0
10
20
30
40
Org
anic
Car
bon
(%)
0.0
0.1
0.2
0.3
0.4
0.52m 5m
Dun
k Is
Sou
th
2005
2006
2007
2008
2009
2010
2011
Cov
er (%
)
0
20
40
60
80
100
2005
2006
2007
2008
2009
2010
2011
Cla
y &
Silt
(%)
0
10
20
30
40
Org
anic
Car
bon
(%)
0.0
0.1
0.2
0.3
0.4
0.5
Org
anic
Car
bon
(%)0.0
0.1
0.2
0.3
0.4
0.5
Cla
y &
Silt
(%)
0
10
20
30
40
Kin
g R
eef
2m
Cov
er (%
)
0
20
40
60
80
100 5m
2m 5m
Figure 25 Cover of major benthic groups and levels of key environmental parameters: Herbert Tully sub-region, Wet Tropics Region. Stacked bars represent cumulative cover of hard coral (blue), soft coral (pink) and macroalgae (green). Box plots for both water and sediment quality represent the distribution of all observations to date, i.e., median value (fine line within the grey box, mean value (heavy line, WQ only), and the ranges of the central 50% (grey box), 80% (whiskers), and 90% (black dots) of observations. Red reference lines indicate the Guidelines for water quality parameters (GBRMPA 2009), and the overall mean across all Reef Rescue MMP reefs for sediment parameters.
58

Reef Rescue Marine Monitoring Program Inshore reef monitoring – Final Report 2011
Nor
th B
arna
rd G
roup
Cov
er %
0
20
40
60
2005
2006
2007
2008
2009
2010
2011
Dun
k Is
Sou
th
2005
2006
2007
2008
2009
2010
2011
Cov
er %
0
20
40
60
Dun
k Is
Nor
th
Cov
er %
0
20
40
60
Kin
g R
eef
Cov
er %
0
20
40
60
Juv
enile
s (m
-2)
0
5
10
15
20
2005
2006
2007
2008
2009
2010
2011
2005
2006
2007
2008
2009
2010
2011
Juve
nile
s (m
-2)
0
5
10
15
20
2m 5m
Juve
nile
s (m
-2)
0
5
10
15
20
Juve
nile
s (m
-2)
0
5
10
15
20
2m 5m
2m 5m
2m 5m
2m 5m
2m 5m
2m 5m
Hard Coral Cover Hard Coral Juveniles
Acroporidae Agariciidae Dendrophylliidae Faviidae Merulinidae
2m 5m
Pocilloporidae Poritidae other Pectiniidae
Figure 26 Composition of hard coral communities: Herbert Tully sub-region, Wet Tropics Region. Stacked bars represent cumulative cover, or density of juvenile colonies per m2, of dominant families within the region (see legend for colour coding). Only families for which cover exceeded 4% cover on at least one reef at one depth in one year were differentiated, all other families were aggregated into ‘other’.
59

Reef Rescue Marine Monitoring Program Inshore reef monitoring – Final Report 2011
Richness and density of foraminifera were determined for four reefs of the Herbert Tully sub-region, Wet Tropics Region. The FORAM index of the only reef sampled in 2010 (Dunk Is North) indicated a slight but steady decline since 2005. In 2011 the FORAM index was again higher (Figure 27) and similar to the baseline condition, leading to a neutral score for this reef (Table 9).
Nor
th B
arna
rd G
roup
Ric
hnes
s
0
10
20
30
40D
ensi
ty (I
nd. g
Sed
-1)
0
100
200
300
400
500
600
Fora
m In
dex
0
2
4
6
8
10
Dun
k Is
Nor
th
2005
2006
2007
2008
2009
2010
2011
Ric
hnes
s
0
10
20
30
40
2005
2006
2007
2008
2009
2010
2011
Den
sity
(Ind
. g S
ed -1
)
0
100
200
300
400
500
600
Fora
m In
dex
0
2
4
6
8
10K
ing
Ree
fR
ichn
ess
0
10
20
30
40
Den
sity
(Ind
. g S
ed -1
)
0
100
200
300
400
500
600
Fora
m In
dex
0
2
4
6
8
10
Dun
k Is
Sou
th
2005
2006
2007
2008
2009
2010
2011
Ric
hnes
s
0
10
20
30
40
2005
2006
2007
2008
2009
2010
2011
Den
sity
(Ind
. g S
ed -1
)0
100
200
300
400
500
600
Fora
m In
dex
0
2
4
6
8
10
Figure 27 Composition of foraminiferal assemblages: Herbert Tully sub-region, Wet Tropics Region. Bars are the cumulative richness (number of species), or density of individual trophic groups per gram of sediment. Groups as used to calculate the FORAM index are separated by colours (green = symbiont-bearing foraminifera, yellow = opportunistic foraminifera, grey = heterotrophic foraminifera. The FORAM index value is indicated by a triangle.
60
Reef Rescue Marine Monitoring Program Inshore reef monitoring – Final Report 2011
3.2.4 Burdekin Region The Burdekin Region is one of two large dry tropical catchment regions adjacent to the GBR, with cattle grazing as the primary land use. There is also extensive irrigated planting of sugarcane on the floodplains of the Burdekin and Haughton rivers. Fluctuations in climate and cattle numbers greatly affect the condition and nature of vegetation cover, and therefore, the susceptibility of soils to erosion, which leads to runoff of suspended sediments and associated nutrients.
©Google Earth 2010
Figure 28 Reef Rescue MMP inshore coral reef monitoring sites (yellow symbols): Burdekin Region.
The coral monitoring locations are located at some distance from the Burdekin River mouth as there are no well-developed reefs closer (Figure 28). The Burdekin River had major flood events in 2008, 2009 and 2011, after annual flows had been below the long-term median
61

Reef Rescue Marine Monitoring Program Inshore reef monitoring – Final Report 2011
from 2002 to 2006 (Table 5). The 2011 event was the third biggest flood on record for this river, after 1974 and 1991. The sampling sites at Magnetic Island (Geoffrey Bay) and Middle Reef are also influenced by local runoff from island creeks, and the Ross River, and the sites at Havannah Is, Lady Elliot Reef, Pandora Reef, Pelorus Is and Orpheus Is by the Herbert River as well as the smaller creeks and rivers north of Townsville, i.e. the Bohle and Black rivers, and Crystal Creek.
Despite the Burdekin River being the single largest source of fine sediment to the GBR Lagoon (Furnas 2003) the sediments at most reef sites in the region have levels of clay and silt sized particles and organic carbon that are lower than the average levels for reefs monitored under the MMP (Figure 29). The occurrence of predominantly course- grained sediments indicates exposure to frequent wave driven resuspension that precludes the accumulation of fine sediments. Middle Reef is an exception; here sites are sheltered by the land mass of Magnetic Island from wind-driven waves and the ensuing re-suspension (Browne et al. 20010), thus promoting the accumulation of finer grained sediments with higher levels of organic carbon and nitrogen (Figure 29, Table AI-1a-c). Given the hydrodynamic setting of most reefs it is perhaps not surprising that there is no clear response in sediment composition to recent increases in Burdekin River discharge. Possible exceptions were Havannah Is and Pelorus Is and Orpheus Is West in 2011 with higher than previously recorded proportions of clay and silt sized particles. It is however, likely that these increases were driven as much by shifting of sediment deposits as a result of Cyclone Yasi as originating from 2011 floods of the Burdekin River.
Even though the hydrodynamic setting of the reefs monitored in the Burdekin region likely reduces the exposure of corals to detrimental levels of sedimentation, flood-derived sediments will also affect the coral communities. A fine sediment budget indicated that Cleveland Bay accumulates fine sediment during the wet season which is only partially winnowed out during the trade wind-dominated dry season, except for years when cyclonic winds lead to a net export (Lambrechts et al. 2010). This study highlights the potential longer term influence of runoff-derived sediments as their transport, either gradually or during cyclones, will increase levels of water column turbidity. Mean turbidity at Geoffrey Bay substantially exceeds the Guidelines (GBRMPA 2009 (Figure 29).
Reefs in the Burdekin Region have been monitored since 1989 by AIMS, the now Department of Environment and Resource Management and Sea Research under a variety of projects. The resulting time-series reveal the intense and frequent nature of disturbance to some reefs (Ayling and Ayling 2005, Sweatman et al. 2007, Table A1-5); principally bleaching and cyclones. The largest disturbance since monitoring began was the mass coral bleaching event in 1998. This event reduced coral cover on all reefs observed (Table A1-5). In 2002, bleaching was less severe but still affected the most coral communities observed (Table A1-5). During the period 1991-1999 flood plumes extended to most reefs in 1994, 1997 and 1998 (Devlin et al. 2001). However, no direct effects on coral communities (loss of cover) were observed during that period (Ayling and Ayling 2005, Sweatman et al. 2007), though corals in shallower waters than those monitored may have been impacted. Higher than median rainfall since 2008 has seen the return of summer flood plumes, the largest occurring in 2010/11, with the Burdekin River exceeding its median discharge by a factor of 5.8 (Table 5). Despite this level of discharge the large distance between the coral communities monitored and the Burdekin River largely precludes direct impact of low salinity waters at the monitoring locations. Plumes from smaller local catchments such as Ross River are more likely to result in lowered salinity at the depths of our sites.
Cyclonic disturbances in 1990 (Cyclone Joy), 1997 (Cyclone Justin) and 2000 (Cyclone Tessi) have variously affected reefs in this region (Table A1-5). In 2011, physical damage and loss of coral cover attributed to Cyclone Yasi varied substantial among the reefs in this region. The most severely impacted reef was Orpheus Is East where hard and soft corals
62

Reef Rescue Marine Monitoring Program Inshore reef monitoring – Final Report 2011
were almost completely removed (Figure 29). In contrast, no obvious damage was observed at the nearby, more sheltered, reefs of Pelorus Is & Orpheus Is West. At Pandora Reef, there was a clear difference in damage between the two sites separated by just a few hundred metres. However, damage at this reef was less pronounced because the coral communities were predominantly composed of low massive and encrusting forms that are more resistant to physical damage (Figure 30). At both Havannah Is and Geoffrey Bay, physical damage was restricted to minor incidences of breakage to fragile species and overturning of loosely attached colonies. These reductions in cover resulted in a downgrading of the condition indicator ‘coral cover’ from “poor” in 2010 to “very poor” in 2011 (Table 10). Such regionally low coral cover is likely to have ramifications for the regular supply of coral larvae, further limiting already low densities of juvenile colonies (see below) and so potentially suppressing the recovery potential of coral communities.
The abundance and diversity of juvenile hard corals was reduced at all reefs surveyed in 2011, resulting in low abundance and negative assessments for this indicator at almost all reefs and downgrading the regional assessment from “moderate” in 2010 to now “very poor” (Figure 30, Table 10). At most reefs this reduction can be attributed to Cyclone Yasi. At Middle Reef, the decline is part of a longer trend: here levels of clay and silt sized particles are very high suggesting the accumulation of sediments that have been in high supply as a result of flooding in recent years. In addition to low numbers, the composition of juvenile communities is unlikely to promote rapid increases in cover. While juveniles of the fast growing Acroporidae are present at most reefs, they are generally uncommon. Instead, juvenile communities tend to have high proportions of slow growing families (e.g. Faviidae) or small individuals (Fungiidae).
High macroalgal cover is a common transient state following disturbance to coral reefs (e.g. Done 1999), as algae rapidly occupy available substratum. Persistent macroalgal communities, however, can be indicative of environmental conditions such as high water column chlorophyll concentrations, which in turn indicate high nutrient availability that may benefit macroalgae (De’ath and Fabricius 2010) or changed grazing pressure by local herbivores (e.g. Hughes et al. 2007). Once established, high cover of fleshy macroalgae is detrimental to coral community resilience and suppresses hard coral recovery by competing with various life stages of corals and by various mechanisms (Kuffner et al. 2006; Birrell et al. 2008; Forster et al. 2008; Diaz-Pulido et al. 2009, 2010; Hauri et al. 2010). The cover of macroalgae in the Burdekin Region is generally high but very variable between reefs (Figure 29), and is consistent with regionally high chlorophyll concentrations that often exceeded the Guidelines (GBRMPA 2009, Figure 29). However, much of the macroalgae has been removed during Cyclone Yasi, resulting in either a positive or neutral assessment for this indicator at all reefs surveyed this year. The usually high cover of brown macroalgae at Pandora Reef, Havannah Is, and Geoffrey Bay (comprised of the brown algal genera Sargassum, Dictyota, Padina and Lobophora) was markedly reduced. Macroalgae continue to be rare at Orpheus Is East and Pelorus Is & Orpheus Is West where turbidity is low (Figure 29), and at Middle Reef where the reef community consists of extensive coral colonies interspersed with gaps of fine silt sediment, leaving few areas suitable for macroalgal colonisation. Although the current low cover of macroalgae has improved the assessment for this indicator to “good” we expect this is only a transient condition on some reefs.
Soft coral, principally Sinularia, Lobophytum and Sarcophytum spp, continue to dominate the sheltered benthic community at Pelorus Is & Orpheus Is West. This is in contrast to Orpheus Is East where the previously high cover of soft coral has been removed following the impact of Cyclone Yasi. The resulting scoured substratum at 5m at Orpheus Is East showed a slight increase in cover of red macroalgae.
Lady Elliot Reef is a non-core reef and was last surveyed in 2010. This report does not contain data on the impact of Cyclone Yasi. However, the East-facing slopes are as exposed
63

Reef Rescue Marine Monitoring Program Inshore reef monitoring – Final Report 2011
as Pandora Reef and Orpheus Island East, and it is expected that the benthic community would have suffered similar damage, with extensive reduction in benthic flora and fauna. In addition, Lady Elliot Reef lies only 3km from the mainland and is at high risk of impact from coastal flood plumes. Documentation of impact and recovery will be carried out in the 2012 sampling season.
Recruitment of coral larvae to settlement tiles in the Burdekin Region has been well below the overall average among regions for the last three years. In 2010, a large pulse of settlement of Acropora spp. was observed at two of the three reefs (Figure 31). The rise in settlement at Pandora Reef in particular (528%) was the highest among all reefs in all regions for the 2010 survey, although a similar pulse was seen at reefs in the Wet Tropics Region. This marked increase lead to the upgrading of the assessment of settlement from “very poor” last year to “good’ this year. Previous low levels of recruitment in the Burdekin Region corresponded to regionally low abundance of adult colonies and local hydrodynamic conditions that may isolate inshore reefs from those further offshore (unpubl. data; AIMS in-house modelling). The cover of Acropora had increased marginally at some reefs monitored (Havannah Is, 2m and Orpheus Is East 2m) but also at other reefs in the Palm Island Group (A. Thompson pers. obs) as this key group began to recover from a long period of low cover that began following bleaching in 1998 (Sweatman et al. 2007). This slight increase in broodstock or hydrodynamic conditions that enhanced connectivity to reefs further afield are possible explanations for the observed pulse in settlement. The recent pulse in recruitment emphasises the Region’s dependence on accessibility to broodstock, whether that be via increases in local populations or reliance on infrequent connectivity to populations offshore. It will be of interest to follow the progress of this recruitment pulse into the juvenile population.
Accounting for recent acute disturbances, the rate at which coral cover has increased over recent years has been lower than expected on the majority of reefs (Table 10). This reduced rate of cover increase suggests a degree of environmental stress. There is an emerging positive relationship between the discharge of local rivers and levels of disease amongst the coral community (Appendix 3) both in this and other regions monitored. This correlation suggests that corals are more susceptible to disease due to exposure to elevated levels of runoff. While we acknowledge that this result is simply a correlation and causative agents are not yet identified, it remains a compelling explanation for the observed underperformance of coral communities in terms of growth during period free from acute disturbance events.
The benthic communities of the Burdekin Region have endured frequent disturbances that have reduced coral cover on most reefs. In particular the cover of the fast growing Acroporidae has been greatly reduced at most locations. Despite the occasional pulse of larval supply, settlement rates are low and likely contribute to persistently low densities of juvenile colonies. Recovery following disturbances has generally been slow and long-term resilience of reefs in this Region remains a concern.
64
Reef Rescue Marine Monitoring Program Inshore reef monitoring – Final Report 2011
Table 10 Benthic community condition: Burdekin Region. For each reef the overall condition score aggregates over the metrics excluding Settlement and FORAM index. Regional assessments for each metric convert three point categorical assessments into a five point scale consistent with reporting to the Paddock to Reef Program (see section 2.6.1 for more details): red= ‘very poor’, orange= ’poor’, yellow= ‘moderate’, light green= ‘good’, dark green= ‘very good’. The average of the regional scores for metrics, excluding Settlement and FORAM index, result in the overall condition regional assessment. Grey shading indicates sites/depths where metrics were not sampled.
Reef Depth(m)
Overall Condition
Coral cover
Change in hard coral cover
Macroalgae cover
Juvenile density
Settlement FORAM index
Orpheus Is East
2 neutral - + + -
5 - - neutral + -
Pelorus Is & Orpheus
2 neutral - + + -
5 - neutral - + - + -
Havannah Is
2 - - - - + -
5 - - - - + -
Pandora Reef
2 - - - - - neutral -
5 - - - - neutral - + -
Lady Elliot Reef
2 - neutral - - +
5 neutral neutral - + neutral
Middle Reef
- neutral - + -
Geoffrey Bay
2 - - - - - neutral -
5 + neutral + neutral neutral - -
Regional assessment
65

Reef Rescue Marine Monitoring Program Inshore reef monitoring – Final Report 2011
5m
Benthic Community Water Quality Sediment
Cla
y &
Silt
(%)
0
5
10
15
20
25
Org
anic
Car
bon
(%)
0.0
0.1
0.2
0.3
0.4
0.5
Cla
y &
Silt
(%)
0
5
10
15
20
25
Org
anic
Car
bon
(%)
0.0
0.1
0.2
0.3
0.4
0.5
Cla
y &
Silt
(%)
0
5
10
15
20
25
Org
anic
Car
bon
(%)
0.0
0.1
0.2
0.3
0.4
0.5
Orp
heus
Is E
ast
Cov
er (%
)
0
20
40
60
80
100Pe
loru
s Is
& O
rphe
us Is
Wes
t
2m
Cov
er (%
)
0
20
40
60
80
100 5m
Org
anic
Car
bon
(%)
0.0
0.1
0.2
0.3
0.4
0.5
Cla
y &
Silt
(%)
0
5
10
15
20
25
Chl
orop
hyll
(g-1
)
0.0
0.2
0.4
0.6
0.8
1.0
1.2
Turb
idity
(NTU
)
0.1
0.3
0.5
1
2
5
Chl
orop
hyll
(g-1
)
0.0
0.2
0.4
0.6
0.8
1.0
1.2
Turb
idity
(NTU
)
0.1
0.3
0.5
1
2
5
5m 2m H
avan
nah
IsC
over
(%)
0
20
40
60
80
100
Pand
ora
2005
2006
2007
2008
2009
2010
2011
Cov
er (%
)
0
20
40
60
80
100
2005
2006
2007
2008
2009
2010
2011
5m 2m
5m 2m
66

Reef Rescue Marine Monitoring Program Inshore reef monitoring – Final Report 2011
Figure 29 Cover of major benthic groups and levels of key environmental parameters: Burdekin Region. Stacked bars represent cumulative cover of hard coral (blue), soft coral (pink) and macroalgae (green). Box plots for both water and sediment quality represent the distribution of all observations to date, i.e., median value (fine line within the grey box), mean value (heavy line, WQ only), and the ranges of the central 50% (grey box), 80% (whiskers), and 90% (black dots) of observations. Red reference lines indicate the Guidelines for water quality parameters (GBRMPA 2009), and the overall mean across all Reef Rescue MMP reefs for sediment parameters.
Cla
y &
Silt
(%)
0
5
10
15
20
25
Lady
Elli
ot R
eef
2m
Cov
er (%
)
0
20
40
60
80
100 5m5m
Org
anic
Car
bon
(%)
0.0
0.1
0.2
0.3
0.4
0.5Benthic Community Water Quality Sediment
Mid
dle
Ree
fC
over
(%)
0
20
40
60
80
100
Cla
y &
Silt
(%)
0
20
40
60
80
Org
anic
Car
bon
(%)
0.0
0.2
0.4
0.6
0.8
1.0
Geo
ffrey
Bay
2005
2006
2007
2008
2009
2010
2011
Cov
er (%
)
0
20
40
60
80
100
2005
2006
2007
2008
2009
2010
2011 1
Chl
orop
hyll
(g-1
)
0.0
0.2
0.4
0.6
0.8
1.0
1.2
1
Turb
idity
(NTU
)
0.1
0.3
0.5
1
2
5C
lay
& S
ilt (%
)
0
5
10
15
20
25
Org
anic
Car
bon
(%)
0.0
0.1
0.2
0.3
0.4
0.5
2m
2m 5m
Figure 29 continued. Note different scales for sediment quality parameters at different reefs.
67

Reef Rescue Marine Monitoring Program Inshore reef monitoring – Final Report 2011
2m 5m 2m 5m
2m 5m
2m 5m
2m 5m
2m 5m
2m 5m
2m 5m
Hard Coral Cover Hard Coral Juveniles
Acroporidae Agariciidae Faviidae Fungiidae Mussidae
Oculinidae Pectiniidae Pocilloporidae Poritidae other
Orp
heus
Is E
ast
Cov
er %
0
10
20
30
40
50
2005
2006
2007
2008
2009
2010
2011
Pand
ora
Ree
f
2005
2006
2007
2008
2009
2010
2011
Cov
er %
0
10
20
30
40
50
Pelo
rus
Is &
Orp
heus
Is W
est
Cov
er %
0
10
20
30
40
50
Hav
anna
h Is
Cov
er %
0
10
20
30
40
50
Juv
enile
s (m
-2)
0
5
10
15
20
2005
2006
2007
2008
2009
2010
2011
2005
2006
2007
2008
2009
2010
2011
Juve
nile
s (m
-2)
0
5
10
15
20
Juve
nile
s (m
-2)
0
5
10
15
20
Juve
nile
s (m
-2)
0
5
10
15
20
Figure 30 Composition of hard coral communities: Burdekin Region. Stacked bars represent cumulative cover, or density of juvenile colonies per m2, of dominant families within the region (see legend for colour coding). Only families for which cover exceeded 4% cover on at least one reef at one depth in one year were differentiated, all other families were aggregated into ‘other’.
68

Reef Rescue Marine Monitoring Program Inshore reef monitoring – Final Report 2011
Lady
Elli
ot R
eef
Cov
er %
0
10
20
30
40
50
2005
2006
2007
2008
2009
2010
2011
Geo
ffrey
Bay
2005
2006
2007
2008
2009
2010
2011
Cov
er %
0
10
20
30
40
50
2m 5m
Mid
dle
Ree
fC
over
%
0
10
20
30
40
50
Juv
enile
s (m
-2)
0
5
10
15
20
2005
2006
2007
2008
2009
2010
2011
2005
2006
2007
2008
2009
2010
2011
Juve
nile
s (m
-2)
0
5
10
15
20
2m 5m
Juve
nile
s (m
-2)
0
5
10
15
20
2m 5m
Hard Coral Cover Hard Coral Juveniles
2m 2m
Acroporidae Agariciidae Faviidae Fungiidae Mussidae
Oculinidae Pectiniidae Pocilloporidae Poritidae other
2m 5m
Figure 30 continued.
69

Reef Rescue Marine Monitoring Program Inshore reef monitoring – Final Report 2011
Figure 31 Coral settlement to tiles: Burdekin Region. Data are from 5m tile deployments. Average values from all reefs and regions sampled in each year are indicated by red reference lines.
Compared to the other regions the density and richness of foraminifera and values of the FORAM index in the Burdekin Region were more variable amongst reefs and times (Figure 32). Communities at Geoffrey Bay and Middle reefs had consistently lower FORAM indices than other reefs, caused by a high relative abundance of heterotrophic species. In addition, the proportion of heterotrophs at Geoffrey Bay has increased over time reducing the FORAM index to values below 4 in 2010 and 2011. A decline in FORAM index observed in at Pelorus Is & Orpheus Is West in 2010 was still apparent in 2011. These declines resulted in a negative condition rating of the communities of foraminifera of those reefs (Table 10). Thus, foraminiferal assemblages indicate possible environmental stress in this region over recent years. Foraminifera occur at low densities at Pandora Reef, but the FORAM index remained stable at that Reef.
70

Reef Rescue Marine Monitoring Program Inshore reef monitoring – Final Report 2011
Den
sity
(Ind
. g S
ed
-1)
0
100
200
300
400
500
600
Fora
m In
dex
0
2
4
6
8
10
Pand
ora
Ree
f
2005
2006
2007
2008
2009
2010
2011
Ric
hnes
s
0
10
20
30
40
2005
2006
2007
2008
2009
2010
2011
Den
sity
(Ind
. g S
ed
-1)
0102030405060708090
100
Fora
m In
dex
0
2
4
6
8
10
2m
Hav
anna
h Is
5mO
rphe
us Is
Eas
tR
ichn
ess
0
10
20
30
40
Den
sity
(Ind
. g S
ed
-1)
0
100
200
300
400
500
600
Fora
m In
dex
0
2
4
6
8
10
Ric
hnes
s
0
10
20
30
40
Den
sity
(Ind
. g S
ed
-1)
0
100
200
300
400
500
600
Fora
m In
dex
0
2
4
6
8
10
Pelo
rus
Is &
Orp
heus
Is W
est
Ric
hnes
s
0
10
20
30
40
Lady
Elli
ot R
eef
Ric
hnes
s
0
10
20
30
40
Den
sity
(Ind
. g S
ed
-1)
0
100
200
300
400
500
600
Fora
m In
dex
0
2
4
6
8
10
Mid
dle
Ree
f
Ric
hnes
s0
10
20
30
40
Den
sity
(Ind
. g S
ed
-1)
0
100
200
300
400
500
600
Fora
m In
dex
0
2
4
6
8
10
Geo
ffrey
Bay
2005
2006
2007
2008
2009
2010
2011
Ric
hnes
s
0
10
20
30
40
2005
2006
2007
2008
2009
2010
2011
Den
sity
(Ind
. g S
ed
-1)
0100200300400500600700800900
1000
Fora
m In
dex
0
2
4
6
8
10
Figure 32 Composition of foraminiferal assemblages: Burdekin Region. Bars are the cumulative richness (number of species), or density of individual trophic groups per gram of sediment. Groups as used to calculate the FORAM index are separated by colours (green = symbiont-bearing foraminifera, yellow = opportunistic foraminifera, grey = heterotrophic foraminifera. The FORAM index value is indicated by a triangle.
71

Reef Rescue Marine Monitoring Program Inshore reef monitoring – Final Report 2011
3.2.5 Mackay Whitsunday Region The main local sources of sediments and other land-derived material to the Mackay Whitsunday Region are the Proserpine, O’Connell and Pioneer rivers. These catchments have a mixes wet/dry tropical climate. The land-use is dominated by agriculture, such as sugar cane cultivation on the coastal plains. In addition, sediment derived from the far larger, though less frequently flooding, Fitzroy River is also likely to reach and accumulate in this region (Maxwell 1968). The reefs in the Mackay Whitsunday Region are considered to be at high risk from agricultural runoff (Brodie and Furnas 2001), supported by MMP flood monitoring which indicates high exposure to terrestrially derived material (Devlin et al. 2010). Collectively, the sediments on the reefs monitored in this region have the highest, and increasing, proportion of fine grained particles and nutrients and the lowest levels of inorganic carbon (Figures 2, 34). The surrounding waters are nutrient-rich and highly turbid with mean chlorophyll and turbidity levels at or above the Guidelines (GBRMPA 2009) at the three core reefs (Figure 34). The combination of fine grained sediments and high turbidity, along with observations of substantial sediment deposits on substrata, corals and coral settlement tiles, indicates that coral communities in this region are exposed to the effects of sediments both directly through sedimentation and smothering and indirectly through light attenuation as a result of turbidity.
Reefs in the Whitsunday Islands are generally sheltered from wave action by the surrounding islands. This results in limited wave-driven re-suspension and, hence, limited transport of sediments away from the reefs leading to the accumulation of fine sediments. The main agent of dispersal of fine sediments in this region is strong tidal action (Schaffelke et al. 2010), due to tidal ranges exceeding 4m combined with the funnelling effect of narrow channels between the islands. The selection for sediment-tolerant corals is obvious in this region, with relatively low cover of the family Acroporidae on most reefs. Low abundance in the genus Acropora is a useful proxy for determining high sedimentation and turbidity, as many species of this genus favour high light environments (Thompson et al. 2010a). At Daydream Is and Dent Is, where cover of Acroporidae is relatively high at 5m depth, the family is represented by just a few species of Acropora with branching growth forms or the genus Montipora. The families Oculinidae, Pectiniidae, Agariciidae and Poritidae (genus Goniopora) are all found in relatively high abundance on some reefs (Figure 35) and are collectively considered sediment-tolerant taxa (Thompson et al. 2010a).
Tolerance of sedimentation by hard corals is generally achieved by either low sediment retention due to colony morphology, or a capacity to actively remove sediments from their surface, e.g. by mucus sloughing or tissue expansion and contraction (Stafford-Smith and Ormond 1992). Prior to the 2009 surveys, observations of sediments smothering live corals were rare and limited to occasional individuals. From 2009 onwards, accumulated sediments on living coral colonies has been a commonly observed cause of partial mortality. In 2011, sediment loads to living corals continued to be high at 5m depths. The proportion of substratum classified as ‘silt’ in photo-transects was higher than that recorded in 2010 at all but one reef (Table A1-12), showing a continued increase in sediment loads at this depth. This increase corresponds to higher than median flows in adjacent catchments over recent years (Table 5).
72

Reef Rescue Marine Monitoring Program Inshore reef monitoring – Final Report 2011
©Google Earth 2009
Figure 33 Reef Rescue MMP inshore coral reef monitoring sites (yellow symbols): Mackay Whitsunday Region.
There are limited historical time-series data available for the coral communities at most of the survey locations in this region (Sweatman et al. 2007). The largest widespread disturbances in recent history were coral bleaching events in 1998 and 2002, which most likely affected the reefs monitored by this program (Table A1-5). Observations from Dent Is and Daydream Is imply an approximate 40% reduction in coral cover during 1998, while observations from AIMS LTMP monitoring sites at reefs in the outer Whitsunday Group record no obvious impact in 1998 and only marginal reductions in 2002 (Sweatman et al. 2007).
River flows in the region have consistently exceeded long-term medians over the past five years (Table 5). The 2010/11 wet season saw record flooding in the region, most notably the Proserpine River with flows of 20 times the long-term median discharge.
There were no acute disturbances to the reefs in this region between 2005 and 2009. In March 2010, Cyclone Ului crossed the region resulting in physical damage to corals and
73

Reef Rescue Marine Monitoring Program Inshore reef monitoring – Final Report 2011
short-term extreme values of water quality indicators (see Schaffelke et al. 2010). Physical damage to corals was limited to sites directly in the path of the cyclone. Daydream Is and Double Cone Is were the most affected, suffering losses of 40% and 20% of their coral cover, respectively. Dent Is, which was not surveyed in 2010, saw a 22% decline in coral cover over the period 2009 to 2010. The loss of coral at this site may have been caused by Cyclone Ului, but it is possible that increased disease may have contributed to loss of coral cover. The 2011 cyclone season saw Tropical Cyclone Anthony (category 2) cross the region; this system was relatively small and caused no appreciable physical damage to the surveyed reefs.
Following Cyclone Ului, a minor amount of disease was noted at the 5m site at Daydream Is in 2010. By 2011 disease prevalence was found to have increased substantially. White syndrome, brown band and skeletal eroding band (SEB) disease were found to be more prevalent at 5m at both sites on the island. SEB was also found to be present at the 2m sites, the first time this disease has been recorded at this depth since surveys commenced. Increased disease incidence was also recorded at both Pine Is and Dent Is, the latter being the most significant with a twofold increase since 2009. Both of these reefs showed declines in the cover of Acroporidae in 2011(Figure 35). Higher incidence of disease showed a positive relationship to increases in discharge from local rivers, a pattern observed also in the other survey regions (Appendix 3). These findings supporting published studies which have shown a strong connection between physic-chemical aspects of terrestrial runoff (e.g. sedimentation, enrichment with nutrients and organic carbon) and disease prevalence (Bruno et al. 2003, Haapkylä et al. 2011, Kaczmarsky and Richardson 2010). It is likely that increased sediment loads as well as physical damage brought about by Cyclone Ului are the factors currently influencing coral disease dynamics in the region.
While Cyclone Ului had an effect on Daydream Is coral reef communities, the lack of any widespread disturbance in the region since at least 1998 explains the moderate to high cover of hard and soft corals in 2011 (Figure 34). The survey reefs in the Mackay Whitsunday Region are characterised by coral taxa tolerant to the frequently turbid conditions found at these reefs. Changes in hard coral cover across the region have once again fallen short of that predicted for the types of coral communities at these sites and thus the condition assessment for this indicator has remained ‘very poor’ (Table 11).
The cover of macroalgae has remained stable throughout the region. The 2 m sites at both Pine Is and Seaforth Is remain those with the highest macroalgal cover (Figure 34). These two reefs are the closest to the rivers influencing this region and water quality data from Pine Is shows that mean chlorophyll concentration and turbidity exceeded the Guidelines (Figure 34). Turbidity and chlorophyll concentrations are lower at Daydream Is, albeit still exceeded the Guidelines. However, interestingly macroalgal cover did not increase here despite the availability of substratum for colonisation following Cyclone Ului.
The average density of juvenile hard coral colonies was moderate to low on most reefs (Table 11, Figure 35) and the general decline in juvenile populations across all reefs continued. The extent to which the declining juvenile population can support coral community resilience is of concern. Juvenile and adult coral community compositions were broadly similar, which indicates that it is likely that communities similar to those in place now will persist into the future. Notable exceptions include: the continued absence of Oculinidae juveniles at Pine Is, an increase in juvenile Dendrophylliidae at Dent Is and juvenile Pectiniidae at Daydream Is, and the continued higher representation of Faviidae in the juvenile communities across the region (Figure 35). The unusually high cover of adult Oculinidae (genus Galaxea) at Pine Is is due to the presence of a large stand of unusually large colonies at site 2. Such a stand of Galaxea sp. is unique amongst the reefs visited by the MMP and might simply be the result of a stochastic recruit event in the past. Dendrophylliidae (genus Turbinaria) are generally considered to be sediment-tolerant and
74

Reef Rescue Marine Monitoring Program Inshore reef monitoring – Final Report 2011
the increased representation of this genus in the juvenile community at 5m on Dent Is may be a response to increased sediment loads at this location. Similarly, the family Pectiniidae includes some species that tolerate high sedimentation and turbidity; the presence of this family in the juvenile community at Daydream Is is consistent with the environmental conditions observed at this reef and shows potential for recovery of this family following a slight decline since 2005 (Figure 35). Prior to Cyclone Ului in 2010, there was a relatively high population of Acroporidae in both adult and juvenile communities at Daydream Is. The adult population showed continued declines this year, however, the juvenile population increased at 2m and remained stable at 5m. The genus Acropora is not typically common in such turbid settings (Thompson et al. 2010a) and so the high density of juveniles and the high adult cover at Daydream Is was unusual. It will be of interest to see if this family returns to pre 2010 levels of cover despite the unfavourable environmental conditions at this reef. Relatively high proportions of Faviidae in the juvenile communities compared with their representation as adult cover are not uncommon and reflect relatively slow growth of some species, a tendency toward small colony size in others, or a tendency for colonies to settle in the under-storey of other taxa and therefore be obscured from the photo point intercept sampling method used to quantify coral cover.
Settlement of coral larvae was low following the 2010 spawning season (Figure 36). Most notable were Daydream Is and Pine Is where settlement was lower than recorded over the previous three years. It is possible the low settlement at Daydream Is reflects a local reduction in brood stock following Cyclone Ului. Alternatively, settlement tiles at both reefs had substantial build up of fine sediments upon collection and this would certainly have reduced settlement on upper surfaces. The proportion of clay and silt-sized particles has increased noticeably at Pine Is, and very slightly at Daydream Is, where it has always been high (Table A1-1). The composition of sediments is one of several factors, along with turbidity, that we have found to influence coral settlement (Appendix 4). In general, however, high variability in settlement between years is not unusual and the causes of this variability remain largely unexplained; it likely reflects a combination of stochastic events such as weather and currents combining to produce variability in larval supply at a given reef.
The overall condition of coral communities the Mackay Whitsunday Region in 2011 was again assessed as moderate (Table 11, Figure 5). Positive aspects of the communities indicated by persistently low cover of macroalgae and moderate to high coral cover on most reefs balance the negative aspects of community condition, i.e., low and continued declines in the density of juvenile colonies and a lack of cover increase during periods free from acute disturbance. Of the reefs surveyed in 2011, only Double Cone Is returned a positive assessment and had mean water quality parameters at or below GBRMPA Guidelines (Table 11, Figurer 34). Here coral cover is high, and is one of only two reefs in the region that shows increases at a rate predicted based on the community composition. Overall, the influence of prevailing environmental conditions, such as high turbidity and increasing proportions of fine sediment, on the coral communities in this region (particularly on juvenile survivorship) cannot be underestimated. Despite the still moderate to high coral cover on most reefs, the continued decline in juvenile abundance and lack of cover increase suggest a lack of resilience within the community and potential vulnerability to phase shifts should the region be impacted by a severe region-wide disturbance event such as coral bleaching.
75

Reef Rescue Marine Monitoring Program Inshore reef monitoring – Final Report 2011
Table 11 Benthic community condition: Mackay Whitsunday Region. For each reef the overall condition score aggregates over the metrics excluding Settlement and FORAM index. Regional assessments for each metric convert three point categorical assessments into a five point scale consistent with reporting to the Paddock to Reef Program (see section 2.6.1 for more details): red= ‘very poor’, orange= ’poor’, yellow= ‘moderate’, light green= ‘good’, dark green= ‘very good’. The average of the regional scores for metrics, excluding Settlement and FORAM index, result in the overall condition regional assessment. Grey shading indicates sites/depths where metrics were not sampled.
Reef Depth
(m)
Overall condition
Coral cover
Change in hard coral
cover
Macroalgae cover
Juvenile density
Settlement FORAM index
Double Cone Is
2 ++ + neutral + neutral
5 + + neutral + - neutral neutral
Daydream Is
2 - neutral - + -
5 - - - - + - - -
Hook Is2 neutral neutral N/A + -
5 + neutral N/A + neutral
Dent Is2 neutral + - + -
5 - neutral - + -
Shute Is & Tancred Is
2 ++ + - + +
5 ++ neutral neutral + +
Pine Is2 - - neutral neutral - -
5 - neutral - + - neutral -
Seaforth Is2 - - - - - - neutral
5 - - - - neutral neutral
Regional assessment
76

Reef Rescue Marine Monitoring Program Inshore reef monitoring – Final Report 2011
5m
Cla
y &
Silt
(%)
0
20
40
60
80
Org
anic
Car
bon
(%)
0.0
0.2
0.4
0.6
0.8
1.0
Benthic Community Water Quality Sediment
Chl
orop
hyll
(g-1
)
0.0
0.5
1.0
1.5
Turb
idity
(NTU
)
0.5
1
3
6
Cla
y &
Silt
(%)
0
20
40
60
80
Org
anic
Car
bon
(%)
0.0
0.2
0.4
0.6
0.8
1.0
Chl
orop
hyll
(g-1
)
0.0
0.5
1.0
1.5
Turb
idity
(NTU
)
0.5
1
3
6
Cla
y &
Silt
(%)
0
20
40
60
80
Org
anic
Car
bon
(%)
0.0
0.2
0.4
0.6
0.8
1.0
2m 5m
2m 5m
2m 5m
Cla
y &
Silt
(%)
0
20
40
60
80
Org
anic
Car
bon
(%)0.0
0.2
0.4
0.6
0.8
1.0
5m
Den
t Is
2005
2006
2007
2008
2009
2010
2011
Cov
er (%
)
0
20
40
60
80
100
2005
2006
2007
2008
2009
2010
2011
Day
drea
m Is
Cov
er (%
)
0
20
40
60
80
100
Hoo
k Is
Cov
er (%
)
0
20
40
60
80
100
Dou
ble
Con
e Is
2m
Cov
er (%
)
0
20
40
60
80
100
Figure 34 Cover of major benthic groups and levels of key environmental parameters: Mackay Whitsunday Region. Stacked bars represent cumulative cover of hard coral (blue), soft coral (pink) and macroalgae (green). Box plots for both water and sediment quality represent the distribution of all observations to date, i.e., median value (fine line within the grey box), mean value (heavy line, WQ only), and the ranges of the central 50% (grey box), 80% (whiskers), and 90% (black dots) of observations. Red reference lines indicate the Guidelines for water quality parameters (GBRMPA 2009), and the overall mean across all Reef Rescue MMP reefs for sediment parameters.
77

Reef Rescue Marine Monitoring Program Inshore reef monitoring – Final Report 2011
5m
Benthic Community Water Quality Sediment
Shut
e Is
and
Tan
cred
IsC
over
(%)
0
20
40
60
80
100
Cla
y &
Silt
(%)
0
20
40
60
80
Org
anic
Car
bon
(%)
0.0
0.2
0.4
0.6
0.8
Seaf
orth
Is
2005
2006
2007
2008
2009
2010
2011
Cov
er (%
)
0
20
40
60
80
100
2005
2006
2007
2008
2009
2010
2011
Chl
orop
hyll
( g-1)
0.0
0.5
1.0
1.5
Turb
idity
(NTU
)
0.5
1
3
6
10
Cla
y &
Silt
(%)
0
20
40
60
80
Org
anic
Car
bon
(%)
0.0
0.2
0.4
0.6
0.8
Pine
IsC
over
(%)
0
20
40
60
80
100
Cla
y &
Silt
(%)
0
20
40
60
80
Org
anic
Car
bon
(%)
0.0
0.2
0.4
0.6
0.82m 5m
2m 5m
2m 5m
Figure 34 continued.
78

Reef Rescue Marine Monitoring Program Inshore reef monitoring – Final Report 2011
2m 5m
2m 5m
2m 5m
2m 5m
Juv
enile
s (m
-2)
0
5
10
15
2005
2006
2007
2008
2009
2010
2011
2005
2006
2007
2008
2009
2010
2011
Juve
nile
s (m
-2)
0
5
10
15
Juve
nile
s (m
-2)
0
5
10
15
Juve
nile
s (m
-2)
0
5
10
15
Hard Coral Cover Hard Coral Juveniles
Acroporidae Agariciidae Dendrophylliidae Faviidae
Oculinidae Pectiniidae Poritidae other
2m 5m
2m 5m
2m 5m
2m 5m
Hoo
k Is
Cov
er %
0
20
40
60
80
2005
2006
2007
2008
2009
2010
2011
Den
t Is
2005
2006
2007
2008
2009
2010
2011
Cov
er %
0
20
40
60
80
Dou
ble
Con
e Is
Cov
er %
0
20
40
60
80
Day
drea
m Is
Cov
er %
0
20
40
60
80
Figure 35 Composition of hard coral communities: Mackay Whitsunday Region. Stacked bars represent cumulative cover, or density of juvenile colonies per m2, of dominant families within the region (see legend for colour coding). Only families for which cover exceeded 4% cover on at least one reef at one depth in one year were differentiated, all other families were aggregated into ‘other’.
79

Reef Rescue Marine Monitoring Program Inshore reef monitoring – Final Report 2011
Hard Coral Cover Hard Coral Juveniles
Acroporidae Agariciidae Dendrophylliidae Faviidae
Oculinidae Pectiniidae Poritidae other
Shut
e Is
& T
ancr
ed Is
Cov
er %
0
20
40
60
80
2005
2006
2007
2008
2009
2010
2011
Seaf
orth
Is
2005
2006
2007
2008
2009
2010
2011
Cov
er %
0
20
40
60
80
2m 5m
Pine
Is
Cov
er %
0
20
40
60
80
Juv
enile
s (m
-2)
0
5
10
15
2005
2006
2007
2008
2009
2010
2011
2005
2006
2007
2008
2009
2010
2011
Juve
nile
s (m
-2)
0
5
10
15
2m 5m
Juve
nile
s (m
-2)
0
5
10
15
2m 5m 2m 5m
2m 5m2m 5m
Figure 35 continued
80

Reef Rescue Marine Monitoring Program Inshore reef monitoring – Final Report 2011
Figure 36 Coral settlement to tiles: Mackay Whitsunday Region. Data are from 5m tile deployments. Average values from all reefs and regions sampled in each year are indicated by red reference lines.
Foraminiferal assemblages in the Mackay Whitsunday Region are distinct from those in other regions. The diversity of symbiont-bearing foraminifera is generally lower than in the regions further north. In addition, the relative abundance of symbiont-bearing species was low resulting in generally lower regional FORAM indices (Figure 14).
Over the period 2005-2007 the density, taxonomic richness and composition of foraminiferal assemblages remained relatively stable at most reefs (Figure 37). On Dent Is, the richness (mainly of symbiont-bearing species) decreased from 2005 to 2007, however, this reef is not a core reef and foraminifera communities are not monitored here under the MMP. Although richness remained stable at Daydream Is, the density of heterotrophic species nearly tripled between 2007 and 2010, but densities decreased again in 2011. Similarly, the densities of heterotrophic foraminifera on Pine Is sharply increased in 2010 before returning to lower levels in 2011.
The FORAM index on Double Cone Is decreased markedly between 2006 and 2007 and has remained stable at this lower level through to 2011. However, due to the high variance in the first three years (the average of which represents the baseline against which the more recent results are compared) this change was within one standard deviation of baseline average, yielding a neutral score in the condition assessment for 2011(Table 11). The FORAM index at Daydream Is has remained more or less stable between 2010 and 2011 but is significantly lower than the 2005-07 baseline, resulting in a negative condition ranking for that reef in 2011. The FORAM index at Pine Is has not appreciably changed since 2005, giving again a neutral condition assessment for 2011.
A recent study of foraminiferal assemblage composition in sediment cores from the Whitsunday area showed that foraminiferal communities on the MMP survey reefs investigated in this area (Daydream, Double Cone and Dent islands) have remained stable over several thousand years prior to European settlement (Uthicke et al., in press). However, after European settlement, the taxonomic composition the foraminiferal assemblages changed on the three MMP reefs which are closer to the coast and subjected to agricultural runoff, while it remained stable on reefs more distant from the coast (Border and Deloraine islands). Therefore, the recently observed changes in the assemblage composition and FORAM index on the MMP reefs occurred in already altered assemblages; however, these changes have a high indicator value for the monitoring of marine water quality (Fabricius et al. in press).
81

Reef Rescue Marine Monitoring Program Inshore reef monitoring – Final Report 2011
H
ook
Is
5m
Den
t Is
2005
2006
2007
2008
2009
2010
2011
Ric
hnes
s
0
10
20
30
40
2005
2006
2007
2008
2009
2010
2011
Den
sity
(Ind
. g S
ed -1
)
0
100
200
300
400
500
600
Fora
m In
dex
0
2
4
6
8
10
Den
sity
(Ind
. g S
ed -1
)
0
100
200
300
400
500
600
Fora
m In
dex
0
2
4
6
8
10
Dou
ble
Con
e Is
Ric
hnes
s
0
10
20
30
40
Den
sity
(Ind
. g S
ed -1
)
0
100
200
300
400
500
600
Fora
m In
dex
0
2
4
6
8
10
Shut
e Is
& T
ancr
ed Is
Ric
hnes
s
0
10
20
30
40
Den
sity
(Ind
. g S
ed -1
)
0
500
1000
1500
Fora
m In
dex
0
2
4
6
8
10
Pine
IsR
ichn
ess
0
10
20
30
40
Seaf
orth
Is
2005
2006
2007
2008
2009
2010
2011
Ric
hnes
s
0
10
20
30
40
2005
2006
2007
2008
2009
2010
2011
Den
sity
(Ind
. g S
ed -1
)
0
100
200
300
400
500
600
Fora
m In
dex
0
2
4
6
8
10
Den
sity
(Ind
. g S
ed -1
)
0
500
1000
1500
Fora
m In
dex
0
2
4
6
8
10
Day
drea
m Is
Ric
hnes
s
0
10
20
30
40
Ric
hnes
s
0
10
20
30
40
Den
sity
(Ind
. g S
ed -1
)
0
100
200
300
400
500
600
Fora
m In
dex
0
2
4
6
8
10
Figure 37 Composition of foraminiferal assemblages: Mackay Whitsunday Region. Bars are the cumulative richness (number of species), or density of individual trophic groups per gram of sediment. Groups as used to calculate the FORAM index are separated by colours (green = symbiont-bearing foraminifera, yellow = opportunistic foraminifera, grey = heterotrophic foraminifera. The FORAM index value is indicated by a triangle.
82

Reef Rescue Marine Monitoring Program Inshore reef monitoring – Final Report 2011
3.2.6 Fitzroy Region The Fitzroy NRM Region has the largest catchment area draining into the GBR. The climate is dry tropical with highly variable rainfall, high evaporation rates and prolonged dry periods, followed by infrequent major floods. By area, cattle grazing is the primary land use (Brodie et al. 2003). Fluctuations in climate and cattle numbers greatly affect the condition and type of vegetation cover, and therefore the susceptibility of soils to erosion, which leads to runoff of suspended sediments and associated nutrients. In addition, flood events reduce salinity around the reefs in Keppel Bay and can have a substantial impact on shallow water communities. Historical observations document that flooding of the Fitzroy River in January 1991 caused up to 85% mortality of corals at depths down to 1.5m at Humpy Is, Halfway Is and Middle Is, with reduced salinity implicated as the cause of this mortality (van Woesik 1991). After 1991 there were no major flood events until 2008 and 2010, both years with annual discharges of about four times the long-term median. The extreme wet season of 2011 caused the largest flood of the Fitzroy River since detailed records began in 1964, with an annual discharge of more than 13 times the long-term median (Table 5). This flood was also unusual in beginning early in the season with freshwater entering Keppel Bay from late November 2010. Loss of coral cover corresponded to each of the recent flood events with the severity of impact broadly relative to the magnitude of the floods (detailed below). In addition to the immediate impact of reduced salinity, flooding also results in periods of extremely high turbidity, and higher than normal levels of water column chlorophyll especially around the reefs closest to the river mouth (Devlin et al. 2011, Brando et al. 2011, Schaffelke et al. 2011). Relatively low proportions of fine-grained sediments at the reefs in this region (Figure 39) indicate that the hydrodynamic setting of these reefs is sufficiently energetic to prevent the long-term accumulation of fine-grained sediments. Hence, river borne sediments are more likely to impact coral communities through their contribution to turbidity during, and in the months following, flood events rather than by smothering as a result of sedimentation.
In addition to the impacts associated with flood events, monitoring of coral cover by the Queensland Parks and Wildlife Service (spanning 1993-2003, see Sweatman et al. 2007) and then Reef Plan (2005-2010) identified coral bleaching in 1998, 2002 and 2006 and storm events in 2008 and 2010 as causing marked reductions in coral cover in this region (Table A1-5).
The six reefs monitored in this region (Figure 38) span a pronounced water quality gradient. The reefs at Peak Is and Pelican Is are situated in relatively turbid and nutrient-enriched waters compared to the waters surrounding the reefs further offshore (e.g., Barren Is); this is clearly evident in the differences in water column turbidity and chlorophyll (Figure 39). A direct result of this turbidity is the rapid attenuation of light reaching corals as depth increases. While generally high, turbidity at Pelican Is reached extremely high levels coinciding with flooding of the Fitzroy River (Schaffelke et al. 2011). Median turbidity in the period following the 2008 and 2010 floods was at least 10 NTU; levels more than twice the suggested upper threshold beyond which corals may be severely light-limited (Cooper et al. 2007, 2008). The effect of light limitation results in a marked gradient in the composition of coral communities from a high proportion of the family Acroporidae, genus Acropora at 2m depth, to a mixed community at 5m (Figure 40). The communities at 5m depths at these reefs are unique among the reefs monitored under Reef Rescue MMP in having a high representation of the family Siderastreidae, genus Psammocora, and family Merulinidae, genus Hydnophora. These coral families are tolerant of the low light and high nutrient conditions found at these reefs (Figure 39). Although turbidity is not measured at Peak Is, the persistent low cover combined with very low juvenile density and a lack of substantial reef development suggest that the environmental conditions at this location may be beyond the limits that can support a true coral reef community. In contrast to the communities at Peak Is and Pelican Is, coral communities monitored on the reefs further away from the coast and the influence of the Fitzroy River are dominated by the family Acroporidae (mostly the branching
83

Reef Rescue Marine Monitoring Program Inshore reef monitoring – Final Report 2011
species Acropora intermedia and A. muricata) at both 2m and 5m (Figure 40), which are indicators for clear water.
©Google Earth 2010
Figure 38 Reef Rescue MMP inshore coral reef monitoring sites (yellow symbols): Fitzroy Region.
Over the period 2005-2011, coral communities in this region have been impacted by a severe coral bleaching event in 2006 (Diaz-Pulido et al. 2009, Table A1-5), and a combination of floods of the Fitzroy River and storms in both 2008 and 2010 and then major flooding in 2011 (Table A1-5). The proximity to the Fitzroy River, differences in community composition, and subtle differences in the directional aspect of the reefs largely explain the variable impacts of these disturbances across the monitored reefs.
A severe disturbance occurred in early 2006 when abnormally high water temperatures (Figure 4) caused widespread coral bleaching. At each of the reefs dominated by branching Acropora (North Keppel Is, Middle Is, Humpy Is & Halfway Is and Barren Is) this event caused a marked reduction in coral cover, and an ensuing bloom of the brown macroalgae Lobophora variegata (Figure 39, see also Diaz-Pulido et al. 2009). At Barren Is, where mean
84

Reef Rescue Marine Monitoring Program Inshore reef monitoring – Final Report 2011
chlorophyll concentration is below the Guidelines (Figure 39), the bloom of L. variegata was less pronounced than at other reefs and some recovery of coral cover was clearly evident in 2007. There was also some recovery at Humpy Is & Halfway Is at 2m depth. However, there was no recovery in coral cover at North Keppel Is where L. variegata was highly abundant or at 5m at Humpy Is & Halfway Is. At North Keppel Is, the cover of macroalgae remained high until 2010 and coral cover has continued to decline at 5m despite no obvious additional acute disturbances. Interestingly, of the reefs monitored in this region, sediments at North Keppel Is had the highest concentrations of nitrogen and organic carbon with mean levels higher than the average for all reefs monitored under Reef Plan (Figure 39, Table A1-2, A1-3), while mean water column chlorophyll concentration at Humpy Is & Halfway Is exceed the Guidelines; these observations are consistent with a link between persistence and extent of the algal blooms and local nutrient enrichment. The coral communities at Pelican Is and Peak Is were not strongly affected by the 2006 bleaching event and coral cover remained stable or increased over this period (Figure 39). Similarly, high macroalgae cover on these reefs is not related to disturbance to the coral communities in 2006 as diverse algal communities were present when these reefs were first visited in 2004 (Sweatman et al. 2007).
In early 2008, the survey sites were affected by the first major flood of the Fitzroy River for more than a decade and by strong winds. At Barren Is, physical damage to the coral consistent with exposure to high waves was evident during surveys in late April and contributed to reductions in coral cover. Some physical damage to corals was also observed at 2m at both Peak Is and Pelican Is, although observed declines were likely influenced by both, storm damage and exposure to the Fitzroy River flood plume. Coral cover at Middle Is had increased marginally in 2008 while the cover of macroalgae decreased, indicating some recovery from the 2006 bleaching event. Higher levels of disease were recorded at 5m depths on each reef surveyed in 2008 with the exception of Barren Is; this observation is interpreted as an indication of chronic stress to the corals as a result of exposure to either higher than background turbidity and/or nutrients following flooding of the Fitzroy River (see also Appendix 3). Light reduction as a result of turbidity, increased nutrient supply (as evidenced by higher levels of nitrogen in sediments (Figure 3, Table A1-3), or lower salinity are all possible mechanisms that may reduce coral fitness or contribute to higher rates of disease in corals (e.g. Fabricius 2005, Voss and Richardson 2006, Haapkylä et al. 2011).
No major disturbances occurred between 2008 and 2009 and coral cover increased at most reefs. The clear exception was North Keppel Is where coral cover remained low and macroalgae cover high. Cover also declined slightly at Pelican Is 5m; mostly likely due to ongoing mortality from the high levels of disease noted in 2008.
In 2010, the cover of the coral family Acroporidae declined at all reefs where the coral community included a high proportion of this taxon (Figure 40). Surveys for coral disease in 2010 noted a high incidence of disease amongst the Acroporidae that almost certainly contributed to these declines. In early 2010, reefs were again impacted variously by winds from the north and flooding of the Fitzroy River. Again, the high incidence of coral disease in this region followed flooding of the Fitzroy River further reinforcing the proposed link between flooding of the Fitzroy River and chronic stress leading to disease amongst the coral community. Moreover, flood impacts were superimposed over storm damage, with corals at Middle Is and 2m at Barron Is showing obvious physical damage. The reduction in macroalgae at both Peak Is and Pelican Is in 2010 likely also reflects a short-term response to physical removal during recent storms and/or low light conditions during and following the recent flood.
In early 2011 the Fitzroy River again flooded with the annual discharge approximately three times that of the 2008 and 2010 floods. This event caused substantial mortality to corals at 2m below lowest astronomic tide at Peak Is, Pelican Is, Humpy Is and Halfway Is with
85

Reef Rescue Marine Monitoring Program Inshore reef monitoring – Final Report 2011
between 65% (Peak Is) and 99% (Pelican Is) of the coral lost at this depth (Table A1-5). Results of water sampling conducted during the flood event strongly suggest that this mortality was caused by exposure to low salinity waters in the flood plume (Devlin et al. 2011). As observed by van Woesik (1991) corals of the family Acroporidae were particularly susceptible with this family completely lost from the communities at 2m depth at both Peak Is and Pelican Is. An empirically derived salinity threshold for mortality of adult Acropora species from reefs in Keppel Bay is a dose-time response for a salinity range of 22 to 28 PSU and an exposure time of 3 to 16 days at the lowest and highest salinities, respectively (Berkelmans et al. 2011). The most tolerant corals to exposure were of the genus Psammocora, and Cyphastrea. Due to the abundance of these corals at 2m at Peak Island the coral community at this reef was less affected by the flood than at Pelican despite its closer proximity to the Fitzroy River mouth. In addition to losses in cover at 2m, there were also reductions in cover between 2010 and 2011 at 5m depths at all reefs with the region. These deeper corals were not killed as a result of acute osmotic stress as it was noted in February 2011 (during the collection of coral settlement tiles and water quality samples) that while corals at 2m depth were already dead after prolonged flood exposure, those at 5m depth were alive but clearly stressed with large numbers of diseased and bleached colonies of both hard and soft corals at Pelican and Humpy islands. This loss of cover through disease has been observed following each recent flood event and is likely to indicate a chronic effect of runoff. Reduction in light levels over extended periods of time as a result of higher turbidity, from increasing concentrations of suspended sediments as well as dense plankton blooms, is a plausible explanation for reduced fitness of corals (Cooper et al. 2008). However, enhanced virulence of the diseases is also possible, e.g. by increased organic matter availability (Haapkylä et al. 2011), or a combination of the two mechanisms. One effect of flooding that could be considered positive for corals has been the reduction in cover of macroalgae at a number of reefs, however, only ongoing monitoring will reveal whether those reductions are limited to transient flood effects.
Settlement of coral spat to deployed settlement tiles in late 2010 was lower than previously recorded at all reefs in this region (Figure 41). The reason for this very low settlement remains uncertain but is possibly the result of the coincidence of coral spawning with early flooding of the Fitzroy River. Fertilisation and early larval development in corals is severely compromised by exposure to salinities of between 28 and 30, especially when combined with elevated concentrations of suspended sediments or nutrients (Richmond 1993, Humphrey et al. 2008). The majority of spawning in this region was predicted to have occurred several nights after the full moon on the 21st November 2010. By the 4th of December, flood waters are clearly visible on satellite imagery extending at least as far offshore as Humpy Island (MODIS Aqua image courtesy NASA/GSFC, Rapid Response); prior to this date cloud cover obscures the area, however, river discharge data do not suggest that flood waters would have preceded this date. Alternatively, stress to corals, as was indicated by high incidence of disease in mid 2010 possibly as a result of flooding the previous summer, may have reduced fecundity of corals as so limited larval supply. Finally, low temperatures in the month prior to spawning (Figure 4) may have delayed spawning until December in which case, on release, eggs would have floated directly into the flood plumes that covered the Region. In summary, the assessment of coral community condition for this region in 2011 remains ‘poor’, reflecting continued low densities of juvenile colonies, low rates of coral cover increase during periods free from acute disturbances, and currently low coral cover as a result of multiple disturbances in recent years (Table 12). These negative attributes outweigh the positive observations of recent reductions in macroalgal cover at a number of reefs. Generally, the coral communities in this region have shown limited recovery from the severe disturbance caused by coral bleaching in 2006. This is, however, to be expected given the repeated flooding of the Fitzroy River over the past four years. With the eventual release from chronic pressures associated with repeated floods we may expect an improvement in coral community condition in this region.
86

Reef Rescue Marine Monitoring Program Inshore reef monitoring – Final Report 2011
Table 12 Benthic community condition: Fitzroy Region. For each reef the overall condition score aggregates over the metrics excluding Settlement and FORAM index. Regional assessments for each metric convert three point categorical assessments into a five point scale consistent with reporting to the Paddock to Reef Program (see section 2.6.1 for more details): red= ‘very poor’, orange= ’poor’, yellow= ‘moderate’, light green= ‘good’, dark green= ‘very good’. The average of the regional scores for metrics, excluding Settlement and FORAM index, result in the overall condition regional assessment. Grey shading indicates sites/depths where metrics were not sampled.
Reef Depth(m)
Overall condition
Coral cover
Change in hard coral
cover
Macroalgae cover
Juvenile density
Settlement FORAM index
Barren Is2 + neutral neutral + neutral
5 - + - neutral - -
North Keppel Is
2 - - - - - neutral -
5 - - - - + -
Humpy Is & Halfway Is
2 - - - - - neutral -
5 - - neutral - neutral - - neutral
Middle Is2 - neutral N/A neutral -
5 neutral neutral N/A + -
Pelican Is2 - - - neutral neutral -
5 ++ neutral + + neutral - neutral
Peak Is2 - - - - - - - -
5 - - - - + - -
Regional assessment
87

Reef Rescue Marine Monitoring Program Inshore reef monitoring – Final Report 2011
Bar
ren
Is
2m
Cov
er (%
)
0
20
40
60
80
1005m5m
0
Chl
orop
hyll
(g-1
)
0.0
0.2
0.4
0.6
0.8
1.0
0
Turb
idity
(NTU
)
0.1
1
3
5
Cla
y &
Silt
(%)
0
5
10
15
20
25
30
Org
anic
Car
bon
(%)
0.0
0.1
0.2
0.3
0.4
0.5
Benthic Community Water Quality Sediment
Nor
th K
eppe
l Is
Cov
er (%
)
0
20
40
60
80
100
Chl
orop
hyll
(g-1
)
0.0
0.2
0.4
0.6
0.8
1.0Tu
rbid
ity (N
TU)
0.1
1
3
5
Cla
y &
Silt
(%)
0
5
10
15
20
25
30
Org
anic
Car
bon
(%)
0.0
0.2
0.4
0.6
Hum
py Is
& H
alfw
ay Is
Cov
er (%
)
0
20
40
60
80
100
Cla
y &
Silt
(%)
0
5
10
15
20
25
30
Org
anic
Car
bon
(%)0.0
0.1
0.2
0.3
0.4
0.5
Cla
y &
Silt
(%)
0
5
10
15
20
25
30
Org
anic
Car
bon
(%)
0.0
0.1
0.2
0.3
0.4
0.5
Mid
dle
Is
2005
2006
2007
2008
2009
2010
2011
Cov
er (%
)
0
20
40
60
80
100
2005
2006
2007
2008
2009
2010
2011
2m 5m
2m 5m
2m 5m
Figure 39 Cover of major benthic groups and levels of key environmental parameters: Fitzroy Region. Stacked bars represent cumulative cover of hard coral (blue), soft coral (pink) and macroalgae (green). Box plots for both water and sediment quality represent the distribution of all observations to date, i.e., median value (fine line within the grey box), mean value (heavy line, WQ only), and the ranges of the central 50% (grey box), 80% (whiskers), and 90% (black dots) of observations. Red reference lines indicate the Guidelines for water quality parameters (GBRMPA 2009), and the overall mean across all Reef Rescue MMP reefs for sediment parameters.
88

Reef Rescue Marine Monitoring Program Inshore reef monitoring – Final Report 2011
Benthic Community Water Quality Sediment
Pelic
an Is
Cov
er (%
)
0
20
40
60
80
100
Org
anic
Car
bon
(%)
0.0
0.2
0.4
Cla
y &
Silt
(%)
0
5
10
15
20
25
30
Org
anic
Car
bon
(%)
0.0
0.1
0.2
0.3
0.4
0.5
2005
2006
2007
2008
2009
2010
2011
Peak
Is
2005
2006
2007
2008
2009
2010
2011
Cov
er (%
)
0
20
40
60
80
100
Cla
y &
Silt
(%)
0
5
10
15
20
25
30
Chl
orop
hyll
(g-1
)
0.0
0.5
1.0
1.5
Turb
idity
(NTU
)
0.1
1
35
1020
2m 5m
5m 2m
Figure 39 continued
89

Reef Rescue Marine Monitoring Program Inshore reef monitoring – Final Report 2011
SiderastreidaePoritidae other
Bar
ren
Is
Cov
er %
0
20
40
60
80
2005
2006
2007
2008
2009
2010
2011
Mid
dle
Is
2005
2006
2007
2008
2009
2010
2011
Cov
er %
0
20
40
60
80
Nor
th K
eppe
l Is
Cov
er %
0
20
40
60
80
Hum
py Is
& H
alfw
ay Is
Cov
er %
0
20
40
60
80
Juv
enile
s (m
-2)
0
5
10
15
20
2005
2006
2007
2008
2009
2010
2011
2005
2006
2007
2008
2009
2010
2011
Juve
nile
s (m
-2)
0
5
10
15
20
2m 5m
Juve
nile
s (m
-2)
0
5
10
15
20
Juve
nile
s (m
-2)
0
5
10
15
20
2m 5m
2m 5m
2m 5m
2m 5m
2m 5m
2m 5m
Hard Coral Cover Hard Coral Juveniles
Acroporidae Dendrophylliidae Faviidae Merulinidae
2m 5m
90

Reef Rescue Marine Monitoring Program Inshore reef monitoring – Final Report 2011
Figure 40 Composition of hard coral communities: Fitzroy Region. Stacked bars represent cumulative cover, or density of juvenile colonies per m2, of dominant families within the region (see legend for colour coding). Only families for which cover exceeded 4% cover on at least one reef at one depth in one year were differentiated, all other families were aggregated into ‘other’.
Pelic
an Is
Cov
er %
0
20
40
60
80
2005
2006
2007
2008
2009
2010
2011
Peak
Is
2005
2006
2007
2008
2009
2010
2011
Cov
er %
0
20
40
60
80
2m 5m
Juv
enile
s (m
-2)
0
5
10
15
20
2005
2006
2007
2008
2009
2010
2011
2005
2006
2007
2008
2009
2010
2011
Juve
nile
s (m
-2)
0
5
10
15
20
2m 5m
Hard Coral Cover Hard Coral Juveniles
2m 5m2m 5m
Acroporidae Dendrophylliidae Faviidae Merulinidae
SiderastreidaePoritidae other
Figure 40 continued.
Figure 41 Coral settlement to tiles Fitzroy Region. Data are from 5m tile deployments. Average values from all reefs and regions sampled in each year are indicated by red reference lines.
91

Reef Rescue Marine Monitoring Program Inshore reef monitoring – Final Report 2011
The strong environmental gradient between Pelican Is and Peak Is and then the islands further offshore as evidenced by differences in coral community composition (Figure 40) is also evident in the foraminifera with low densities at the inshore reefs, and a very low richness at Peak Is (Figure 42). Reasonable temporal data are only available from Humpy Is & Halfway Is and Pelican Is. At both these locations the richness of foraminifera in 2011 was similar to that observed over the period 2005-2007; however, the densities in 2010 were the lowest recorded (Figure 42). Interestingly, at both reefs the declines were consistent across both heterotrophic and symbiont-bearing groups. In the period between 2007 and 2010 the two major floods of the Fitzroy River are likely implicated in the reduction of foraminiferal density. In 2011, following further flooding it is not surprising that no distinct recovery of the foraminifera was observed. At Peak Is, the density of foraminifera was very low and the FORAM index in 2011 was more than one standard deviation smaller than the baseline values leading to a negative ranking. In total, the rankings for this region combine to a ‘poor’ score for the Fitzroy Region.
Bar
ren
IsR
ichn
ess
0
10
20
30
405m
Den
sity
(Ind
. g S
ed
-1)
0
100
200
300
400
500
600
Fora
m In
dex
0
2
4
6
8
10
Nor
th K
eppe
l Is
Ric
hnes
s
0
10
20
30
40
Den
sity
(Ind
. g S
ed
-1)
0
100
200
300
400
500
600
700
800
Fora
m In
dex
0
2
4
6
8
10
Hum
py Is
& H
alfw
ay Is
2005
2006
2007
2008
2009
2010
2011
Ric
hnes
s
0
10
20
30
40
2005
2006
2007
2008
2009
2010
2011
Den
sity
(Ind
. g S
ed
-1)
0
200
400
600
800
Fora
m In
dex
0
2
4
6
8
10
Peak
Is
2005
2006
2007
2008
2009
2010
2011
Ric
hnes
s
0
10
20
30
40
2005
2006
2007
2008
2009
2010
2011
Den
sity
(Ind
. g S
ed
-1)
0
100
200
300
400
500
600
Fora
m In
dex
0
2
4
6
8
10
Pelic
an Is
Ric
hnes
s
0
10
20
30
40
Den
sity
(Ind
. g S
ed
-1)
0
100
200
300
400
500
600
Fora
m In
dex
0
2
4
6
8
10
Figure 42 Composition of foraminiferal assemblages: Fitzroy Region. Bars are the cumulative richness (number of species), or density of individual trophic groups per gram of sediment. Groups as used to calculate the FORAM index are separated by colours (green = symbiont-bearing foraminifera, yellow = opportunistic foraminifera, grey = heterotrophic foraminifera. The FORAM index value is indicated by a triangle.
92

Reef Rescue Marine Monitoring Program Inshore reef monitoring – Final Report 2011
4. Conclusions
Scientists and managers have realised that the continued management of regional and local pressures such as nutrient runoff and overfishing is vital to provide corals and reef organisms with the maximum resilience to cope with global stressors such as climate change (Bellwood et al. 2004, Marshall and Johnson 2007, Carpenter et al. 2008, Mora 2008). The management of water quality remains an essential requirement to ensure the long-term protection and resilience of the coastal and inshore reefs of the GBR. The MMP supports the effective management of water quality in the inshore GBR by monitoring changes in the inshore marine environment that will gauge the long-term effectiveness of the Australian and Queensland Government’s Reef Water Quality Protection Plan and Reef Rescue initiative to improve water quality entering the GBR. In addition, the MMP will deliver long-term condition assessments and detailed descriptions of GBR inshore coral reef ecosystems, which is essential information for reef managers.
Local environmental conditions clearly influence the benthic communities found on coastal and inshore reefs of the GBR. Collectively these reefs differ markedly from those found in clearer, offshore waters (e.g. Done 1982, Wismer et al. 2009, Death and Fabricius 2010). Within the inshore zone coral reef communities vary along steep environmental gradients that occur with distance from the coast and from major rivers (van Woesik and Done 1997, van Woesik et al. 1999, Fabricius et al. 2005, De’ath and Fabricius 2008, Thompson et al. 2010a, Fabricius et al. 2011). Given the clear relationship between coral community composition and their environmental setting, it is expected that coral communities will be susceptible to deterioration in environmental conditions such as increases in the rates of sedimentation, levels of turbidity, nutrient concentrations or other pressures associated with anthropogenic activities in adjacent catchments or coastal zones. Conversely, if improvements under Reef Plan and Reef Rescue lead to better water quality in the inshore GBR, coral communities may change over time to reflect the improved environmental conditions (De’ath and Fabricius 2008, 2010).
The general responses of coral reef communities to turbidity and nutrients are relatively well understood (e.g., Fabricius 2005, De’ath and Fabricius 2008, Philipp and Fabricius 2003, Thompson et al. 2010a, Uthicke et al. 2010). Simplistically, species that are tolerant to the environmental pressures at a given location are likely to be more abundant, compared to less-tolerant species (e.g., Stafford-Smith and Ormond 1992, Anthony and Fabricius 2000, Anthony and Connolly 2004, Anthony 2006). However, the processes shaping biological communities are complex and variable on a variety of spatial and temporal scales and they are likely to include interactions between various environmental factors, other species or taxonomic groups, past disturbance regimes, and a degree of stochasticity in the demographic processes of individual species. As a result, substantially different communities may be present at any one time in very similar environmental settings. Conversely, species of corals may occur across a broad range of conditions due to their inherent physiological (Anthony and Fabricius 2000) and morphological (Anthony et al. 2005) plasticity. In combination, the above considerations may obscure the relationship between community composition and environmental condition, making it difficult to assess the condition and resilience of GBR inshore coral reef communities based on their composition alone. For the above reasons, our protocol for assessing the condition of coral communities considers their potential to recover from disturbance events. This assessment compares observed levels of various community attributes with levels expected in a resilient community. The underlying assumption is that a healthy community will show resilience to disturbances by recovering lost cover through the recruitment and growth of new colonies or the re-growth of surviving colonies and fragments. Basing our assessments on indicators of recovery potential removes the considerable shortcomings and ambiguities associated with assessing coral community
93

Reef Rescue Marine Monitoring Program Inshore reef monitoring – Final Report 2011
condition based on composition and/or percentage cover alone. Importantly, it provides for communities that vary across naturally occurring environmental gradients to be considered within a uniform framework.
This most recent application of our assessment protocol indicates no change in the overall rating of inshore coral reef condition in any of the regions, compared to those reported for 2010 (Figure 5, Table 6). However, the underlying scores on which the categorical assessments were based declined to their lowest point in the four years for which assessments are available (Figure 5). These declines in condition reflect the combination of acute disturbance and chronic environmental pressures. In both the Wet Tropics and Burdekin regions, Cyclone Yasi caused a reduction of coral cover and density of juvenile corals on reefs exposed to the large waves and swells generated by the extreme weather system. In the Fitzroy Region, major flooding of the Fitzroy River similarly reduced coral cover, the density of juvenile colonies, and the abundance of coral recruits on reefs exposed to low salinity waters. In all three regions, there was a reduction in the regional condition assessment for the indicator ‘coral cover’ with the indicator ‘juvenile density’ also declining in both the Wet Tropics and Burdekin regions; juvenile densities in the Fitzroy Region had already in 2010 been assessed as very poor. While such acute disturbance events must be considered natural pressures influencing coral community dynamics, they serve to highlight the importance of the resilience of communities to recover from such events.
Our data show that the relatively high discharges of rivers entering the GBR in recent years have corresponded with generally declining condition of indicators of coral community resilience. In the period 2008 to 2011, discharges from rivers in the Burdekin, Mackay Whitsunday and Fitzroy regions were at least three times the long-term median during three of the four years. In comparison, discharges in the period 2002 to 2006 were generally well below the long-term median. Comparing the initial observations of coral communities from 2005 and 2006 to the more recent surveys shows a substantial decline in the density of juvenile colonies in the Mackay Whitsunday Region in particular, but also on some reefs in the Burdekin Region. In 2011, the indicator of ‘coral cover change’ was also lower than in previous years in all regions. It should be reiterated here that this indicator is the observed change in hard coral cover averaged over the preceding three years and so the 2011 estimates captured the entire period of high discharge. Supporting the association between river discharge and reduced rates of coral cover increase are our results demonstrating that the incidence of coral disease has increased proportionally to river discharge in all regions (Appendix 3).
Despite the generalisation that runoff had a major negative effect on the GBR inshore coral reef communities, the actual condition of coral communities at an individual reef will vary in response to typically unique combinations of e.g., site specific hydrodynamics, historical disturbance regimes, proximity to rivers and the runoff characteristics of those rivers. For example, high rates of sedimentation are generally detrimental to corals (as reviewed by Fabricius 2005). However, high rates of sedimentation require a combination of supply in the form of high concentrations of suspended particles, measurable as high turbidity, coupled with a low energy hydrodynamic setting that allows these particles to settle and accumulate (Wolanski et al. 2005). Such conditions only occur on a subset of the reefs monitored under the MMP. Collectively, corals on the MMP reefs in the Mackay Whitsunday Region are subjected to high levels of turbidity, have sediments with high proportions of fine-grained particles, nutrients and non-carbonate material and are hence considered to be predisposed to sedimentation impacts; only Middle Reef in the Burdekin Region and Snapper Island North in the Wet Tropics Region share similar environmental conditions. Although not quantified, it was repeatedly observed that tiles deployed to estimate coral settlement in the Mackay Whitsunday Region accumulate substantially more silt than those deployed in other regions. Settlement of larvae is enhanced by chemical cues of the settlement substratum (e.g. bio-films, Negri et al. 2002, Tebben et al. 2011, Webster et al. 2004). A thick layer of sediments
94

Reef Rescue Marine Monitoring Program Inshore reef monitoring – Final Report 2011
will limit settlement both chemically and physically, by precluding the development of suitable bio-films and by not providing a suitably stable substratum for attachment (Birrell et al. 2005). Accumulation of sediments on tiles almost certainly influences settlement rates but, importantly, also mirrors the accumulation of sediments to the reefal substratum that may both limit larval settlement and the subsequent survival of those larvae that do settle (Fabricius et al. 2003, Fabricius 2005). Evidence that increased turbidity leads to increased sedimentation on reefs in the Mackay Whitsunday Region can be found in the generally higher proportion of the substratum categorised as “silt” from photo transect analysis over the period of higher than median river discharge (Table A1-12). These observations are consistent with recent work that indicates fine sediment imported by flood events remains in the coastal zone for long after an event, leading to recurring high turbidity as a result of re-suspension (Wolanski et al. 2008, Lambrechts et al. 2010, Fabricius et al. in review). Increases in both turbidity and sedimentation have the potential to stress and eventually kill corals as the energetic costs of reduced light availability and sediment-shedding out-weigh energetic gains derived from feeding on particulate matter (e.g. Anthony and Connelly 2004). It is entirely plausible that the additional flux of sediments resulting from increased runoff over the past four years have contributed to both declines in the density of juvenile corals and increased stress to adult corals that have lead to suppressed growth and higher incidence of disease.
In both the Burdekin and Fitzroy Regions, most reefs have relatively coarse sediments and so sedimentation is less likely to be a significant factor in contributing to the continued poor assessment of condition in these regions. It is obvious, however, that in both regions, acute disturbances have contributed to these poor assessments. The ‘poor’ condition of coral reef communities in the Burdekin Region in part reflects the consequences of coral mortality during the mass bleaching events in the summers of 1998 and 2002 (Berkelmans et al. 2004, Sweatman et al. 2007) and ultimately Cyclone Yasi in 2011. It appears that these events, and in particular the 1998 event, were of sufficient severity and spatial extent to substantially limit the supply of larvae and, hence, reduce the rate at which coral communities were able to recover (Done et al. 2007). This assumption is supported by the near extinction of Acropora from most reefs surveyed in Halifax Bay in 1998 (Sweatman et al. 2007), hydrodynamic modelling indicating limited connectivity between Halifax Bay and reefs further offshore (Luick et al. 2007, Connie 2.0), and persistently low settlement of coral spat (which are typically mostly Acropora) and low densities of juvenile colonies observed on most reefs in the Burdekin Region during MMP surveys since 2005. In late 2010, we did record a strong settlement pulse of Acropora spat that coincided with very slight increases in cover of Acropora on some reefs. It is also possible, though speculative, that atypical currents provided greater connectivity to more distant broodstock. Irrespective of the source of these larvae, their survival and progression into juvenile size classes is likely to have been reduced as a result of Cyclone Yasi. In addition to a simple lack of broodstock, and perhaps of greater concern, has been the persistence of high cover of macroalgae on several reefs. While it remains unclear as to whether such stands of macroalgae are a natural component of some reefs, their presence will almost certainly further suppress already low levels of coral recruitment (e.g. Hughes et al. 2007, Foster et al. 2008).
In the Fitzroy Region, coral bleaching in 2006 caused a substantial reduction in coral cover from which recovery has been variable. The density of juvenile colonies in the Fitzroy Region has been consistently low especially amongst the thickets of branching Acropora corals that are dominant on the MMP sites in less turbid waters. Such low abundances of juvenile corals is in contrast to the settlement we see on deployed tiles, implying that larvae are either avoiding settling onto the available natural substrata or are not surviving, even though they are clearly present and viable. Given that the majority of available substratum on several of the MMP reefs consists of the basal portions of large thickets of staghorn coral, it is perhaps advantageous for larvae to settle elsewhere as there would be little prospects for juvenile corals to escape over-topping in their natural habitat. Irrespective of the reason for the low
95

Reef Rescue Marine Monitoring Program Inshore reef monitoring – Final Report 2011
recruitment, it is clear that recovery of cover in these thickets is through the growth of surviving fragments; however, this growth rate has been slow in recent years. Following the 2006 bleaching event, the macroalga Lobophora variegata rapidly colonised dead corals and despite early signs of a rapid decline (Diaz-Pulido et al. 2009) has persisted on most reefs. In addition, there have been high incidences of disease corresponding with the floods of the Fitzroy River in 2008, 2010 and 2011, both on these Acropora-dominated reefs and in the mixed communities in more turbid waters. The 2011 flood caused mortality to depths 2-3 m on reefs inshore of Great Keppel Is, as a result of direct exposure to low salinity waters, and of chronic stress leading to disease amongst communities that were not directly exposed.
The condition of coral communities in the Burdekin Region in particular, but also the Fitzroy Region and Herbert-Tully sub-region, highlights a key issue facing inshore coral reefs in general: that of insufficient recovery of communities between successive acute disturbances. That the Burdekin reefs show little evidence of recovery after 10 years illustrates the long-term effects severe disturbances can have on coral communities. While the interactions between water quality and climate change are poorly understood and require urgent experimental investigation, evidence is accumulating that suggests a reduction in the tolerance of corals to heat stress by exposure to contaminants including nutrients, herbicides and suspended particulate matter (Wooldridge 2009, Negri et al. 2011, Cseke and Fabricius et al. in prep.). With frequency and severity of disturbance events projected to increase in response to the continuing rise in greenhouse gases (Hoegh-Guldberg et al. 2007, Steffen 2009) any increase in susceptibility as a result of local stressors may be catastrophic for GBR inshore communities. Increased susceptibility to, or frequency of, disturbance events will reduce the abundance of adult corals and so reduce the supply of coral larvae; this appears to have already occurred in the Burdekin Region.
In addition to being acutely impacted by exposure to runoff, evidence is mounting that runoff is also reducing the resilience of communities following disturbance. The pattern of higher river flows in recent years coinciding with increased levels of disease, low rates of cover increase and declining densities of juvenile corals suggest that coral community resilience has been suppressed by runoff. The time series of high intensity, instrument-derived, water quality measurements at the MMP core reefs has revealed prolonged periods of turbidity following wet seasons (Fabricius et al. in review) which are likely to stress sensitive species. This stress is likely to be compounded by other components of runoff such as the cocktail of pesticides that are reaching reefs (Kennedy et al. 2011). Certainly the observed declines in measures of coral community condition that coincide with periods of high river discharge warrant continued research efforts into both the identification and subsequent fate of river-borne contaminants that are influencing coral community condition over a longer period of time after acute events.
Similar to coral communities, the steady decline of the FORAM index and rapid increases in the densities of heterotrophic species on most reefs appear to reflect higher sediment and nutrient inputs to the inshore areas by above-average wet seasons in recent years. Recent studies on sediment cores and other historical foraminiferal communities highlighted that these communities were surprisingly persistent without anthropogenic disturbances (Tager et al. 2010, Uthicke et al. in press). The recent changes in the foraminiferal assemblages of the inshore GBR reflect response patterns identified in experimental studies (Uthicke and Nobes 2008, Uthicke and Altenrath 2010, Reymond et al. 2011) and support the assumption that the decline of coral reef ecosystem condition has been mainly due to increased turbidity and nutrient availability caused by the recent flood events. The changes in the foraminiferal assemblages also indicate that the negative trajectory of ecosystem health is widespread, e.g. covering a multitude of benthic organisms (see also McKenzie et al. 2011 for MMP seagrass monitoring, showing a continued decline in condition, also attributed to declining water quality due to the recent flood events).
96

Reef Rescue Marine Monitoring Program Inshore reef monitoring – Final Report 2011
The present assessment of the condition of inshore coral reef communities continues to highlight areas of the GBR where certain aspects of coral communities appear to be under stress and identifies likely causal environmental factors. The monitored coral reef communities are subject not only to acute disturbances, such as tropical cyclones, thermal bleaching, and river floods, but are also under the continually shaped by coastal processes that determine the ambient water quality at each individual site. Our MMP data suggest that the variation in environmental conditions between years, particularly with respect to the magnitude of river discharges during the wet season, is sufficient to significantly alter the dynamics of coral reef communities on inshore reefs for extended periods. In all regions we have shown that incidence of coral disease has increased proportionally with the discharge of local rivers. Water turbidity and the proportion of fine-grained particles in the reef sediments have also increased during the period of increasing river discharge, and our data indicate that this is affecting coral growth and recruitment, most likely due to light limitation and smothering. Should proposed links between elevated contaminant loads and susceptibility of corals to thermal bleaching events prove true (Wooldridge 2009, Negri et al. 2011), this will have serious consequences for inshore reefs in a predicted future with more extreme weather events.
We conclude that acute disturbances in combination with ensuing periods of elevated environmental stresses brought about by higher turbidity and accumulation of organic matter are the cause of marked shifts in coral community composition and condition. Clearly nothing can be done to prevent coral mortality by acute disturbances such as cyclones or flood-associated plumes of freshwater. However, what can be done is to reduce the sediment, nutrient and contaminant loads carried by rivers that both amplify the impacts of acute disturbances and then suppress recovery from such events. Recovery from acute disturbance requires the settlement and then survival and growth of juvenile corals to replace those that were killed. These early life history phases have been repeatedly shown to be particularly sensitive to the low light and high sedimentation conditions that result from an increased flux of fine sediments and their associated contaminants (see Fabricius 2011 for a synthesis). Further, our observations of increased levels of disease show that adult coral colonies are also negatively affected and provide evidence that elevated import of river-borne materials lead to changes in coral communities beyond those associated with underlying environmental gradients. Potential longer-term and wider-field consequences of extreme flood events for adult corals are also indicated by the relationship between high river flow and outbreaks of crown-of-thorns starfish (Fabricius et al. 2010); this coral predator is the main agent of coral cover loss in the GBR (Osborne et al. 2011).
The recognition of the significance of extreme events for shaping the condition of inshore coral reefs is important to inform the management strategies employed to limit downstream impacts of land runoff. The improvements in GBR catchment management implemented under Reef Plan and Reef Rescue are realistically expected to improve inshore marine water quality. However, we propose that the reduction of event loads of sediments and nutrients, e.g. by improved erosion control measures, should have a higher priority. If this could be achieved in the future it would (i) reduce mortality of the more sensitive components of coral communities and so reduce the degree of recovery required; (ii) maintain higher levels of broodstock and so maximise recovery potential; and (iii) reduce the import of sediments, nutrients and contaminants that chronically suppress recovery by limiting the settlement or survival of juvenile corals through smothering of substrates and juvenile colonies and/or through enhancing the fitness of space competitors such as algae. However, improvements in marine water quality and associated coral reef condition are likely to be slow and difficult to detect because of the highly variable baseline, lags in ecosystem responses and potentially long recovery periods.
97
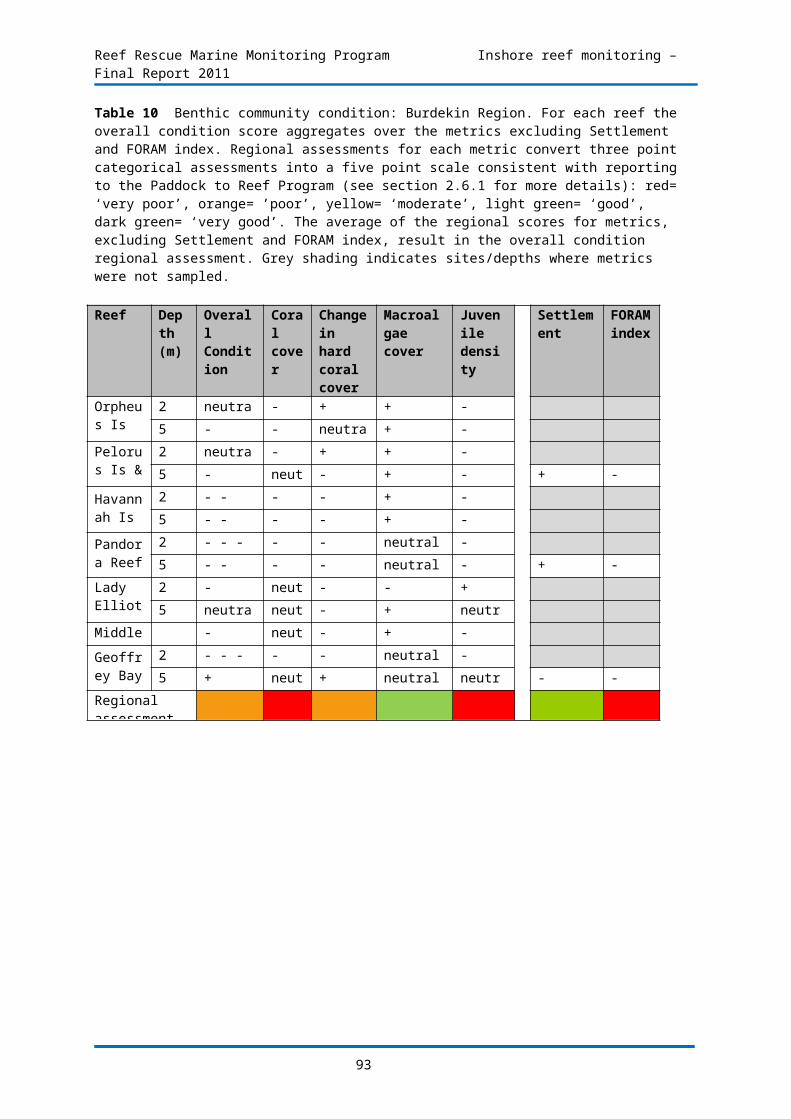
Reef Rescue Marine Monitoring Program Inshore reef monitoring – Final Report 2011
Acknowledgments
We thank Aaron Anderson, Joe Gioffre, Charlotte Johansson, Shawn Smith, Marcus Stowar and Kate Osborne for valuable field assistance over the years. We also thank Terry Done, Johanna Johnson and Katherine Martin for their detailed reviews that improved the previous reports to which this current instalment builds.
98

Reef Rescue Marine Monitoring Program Inshore reef monitoring – Final Report 2011
5. References
Anon. (2003) Reef Water Quality Protection Plan for catchments adjacent to the Great Barrier Reef World Heritage Area. The State of Queensland and Commonwealth of Australia. Queensland Department of Premier and Cabinet, Brisbane. 43 pp
Anon. (2009) Reef Water Quality Protection Plan 2009. For the Great Barrier Reef World Heritage Area and adjacent catchments. The State of Queensland and Commonwealth of Australia. Queensland Department of the Premier and Cabinet, Brisbane. 30 pp. Available at www.reefplan.qld.gov.au
Anon. (2010) Paddock to Reef Integrated Monitoring, Modelling and Reporting Program Design (DRAFT). Version 12 February 2010. The State of Queensland, Queensland Department of the Premier and Cabinet, Brisbane. 93 p.
Anon. (2011) Reef Water Quality Protection Plan 2009. First Report 2009 Baseline. The State of Queensland, Department of the Premier and Cabinet, Brisbane. 140 pp. Available at www.reefplan.qld.gov.au
Anthony KRN (1999) Coral suspension feeding on fine particulate matter. Journal of Experimental Marine Biology and Ecology 232:85-106
Anthony KRN (2006) Enhanced energy status of corals on coastal, high-turbidity reefs. Marine Ecology Progress Series 319:111-116
Anthony KRN, Connolly SR (2004) Environmental limits to growth: physiological niche boundaries of corals along turbidity-light gradients. Oecologia 141:373-384
Anthony KRN, Fabricius KE (2000) Shifting roles of heterotrophy and autotrophy in coral energetics under varying turbidity. Journal of Experimental Marine Biology and Ecology 252:221-253
Anthony KRN, Hoogenboom MO, Connolly SR (2005) Adaptive variation in coral geometry and the optimization of internal colony light climates. Functional Ecology 19:17-26
Australian Natural Resource Atlas (electronic resource), http://www.anra.gov.au/topics/land/carbon/qld/basin-burdekin-river.html http://www.anra.gov.au/topics/land/carbon/qld/basin-fitzroy-river-qld.html http://www.anra.gov.au/topics/land/carbon/qld/basin-barron-river.html http://www.anra.gov.au/topics/land/carbon/qld/basin-mulgrave-russell-river.html http://www.anra.gov.au/topics/land/carbon/qld/basin-johnstone-river.html http://www.anra.gov.au/topics/land/carbon/qld/basin-tully-river.html http://www.anra.gov.au/topics/land/carbon/qld/basin-herbert-river.html http://www.anra.gov.au/topics/land/carbon/qld/basin-proserpine-river.html http://www.anra.gov.au/topics/land/carbon/qld/basin-oconnell-river.html http://www.anra.gov.au/topics/land/carbon/qld/basin-pioneer-river.html(Accessed 20/4/2010)
Ayling A M, Ayling A L (2005) The dynamics of Cairns and Central section fringing reefs: 2005 Unpublished report submitted to the Great Barrier Reef Marine Park Authority, Townsville
Babcock RC, Smith L (2002) Effects of sedimentation on coral settlement and survivorship. In: Kasim Moosa, M.K., Soemodihardjo, S., Nontji, A., Soegiarto, A., Romimohtarto, K., Sukarno, Suharsono (Eds.) Proceedings of the Ninth International Coral Reef Symposium, Bali, Indonesia, October 23–27, 2000. Ministry of Environment, the Indonesian Institute of Sciences and the International Society for Reef Studies, pp. 245–248
Baird AH, Marshall PA (2002) Mortality, growth and reproduction in scleractinian corals following bleaching on the Great Barrier Reef. Marine Ecology Progress Series 237:133-141
Baird AH, Babcock RC, Mundy CP (2003) Habitat selection by larvae influences the depth distribution of six common coral species. Marine Ecology Progress Series 252:289-293
99

Reef Rescue Marine Monitoring Program Inshore reef monitoring – Final Report 2011
Bellwood DR, Hughes TP, Folke C, Nystrom M (2004) Confronting the coral reef crisis. Nature 429:827-833
Berkelmans R (2002) Time-integrated thermal bleaching thresholds of reefs and their variation on the Great Barrier Reef. Marine Ecology Progress Series 229:73-82
Berkelmans R, De’ath G, Kininmonth S, Skirving WJ (2004) A comparison of the 1998 and 2002 coral bleaching events on the Great /barrier Reef: spatial correlation, patterns, and predictions. Coral Reefs 23:74-83
Berkelmans R, Jones A, Brinkman R, Schlott C (2011) Salinity thresholds of reef corals. A review prepared for the Great Barrier Reef Marine Park Authority. Australian Institute of Marine Science, Townsville. 14 pp.
Birrell CL, McCook LJ, Willis BL (2005) Effects of algal turfs and sediment on coral settlement. Marine Pollution Bulletin 51:408-414
Birrell CL, McCook LJ, Willis BL, Diaz-Pulido GA (2008) Effects of benthic algae on the replenishments of corals and the implications for the resilience of coral reefs. Oceanography and Marine Biology: An Annual Review 46: 25-64
Box SJ, Mumby PJ (2007) Effect of macroalgal competition on growth and survival of juvenile Caribbean corals. Marine Ecology Progress Series 342:139-149
Brodie J, Furnas M (2001) Status of nutrient and sediment inputs from Great Barrier Reef catchments and impacts on the Reef Proceedings of the 2nd National Conference on Aquatic Environments: Sustaining Our Aquatic Environments – Implementing Solutions, Townsville
Brodie JE, McKergow LA, Prosser IP, Furnas MJ, Hughes AO, Hunter H (2003) Sources of sediment and nutrient exports to the Great Barrier Reef World Heritage Area., James Cook University, Townsville
Brodie J, Binney J, Fabricius K, Gordon I, Hoegh-Guldberg O, Hunter H, O’Reagain P, Pearson R, Quirk M, Thorburn P, Waterhouse J, Webster I, Wilkinson S (2008) Synthesis of evidence to support the Scientific Consensus Statement on Water Quality in the Great Barrier Reef. The State of Queensland (Department of the Premier and Cabinet). Published by the Reef Water Quality Protection Plan Secretariat, Brisbane
Brodie JE, Kroon FJ, Schaffelke B, Wolanski EC, Lewis SE, Devlin MJ, Bohnet IC, Bainbridge ZT, Waterhouse J, Davis AM (in press) Terrestrial pollutant runoff to the Great Barrier Reef: An update of issues, priorities and management responses. Marine Pollution Bulletin. DOI 10.1016/j.marpolbul.2011.12.012
Browne NK, Smithers SG, Perry CT (2010) Geomorphology and community structure of Middle Reef, central Great Barrier Reef, Australia: an inner-shelf turbid zone reef subject to episodic mortality events. Coral Reefs 29: 683-689
Bruno JF, Sweatman H, Precht WF, Selig ER, Schutte VGW (2009) Assessing evidence of phase shifts from coral to macroalgal dominance on coral reefs. Ecology 90:1478-1484
Bruno JF, Selig ER, Casey KS, Page CA, Willis BL (2007) Thermal stress and coral cover as drivers of coral disease outbreaks. PLoS Biol 5(6): e124. doi 10.1371/journal.pbio50124
Bruno JF, Petes LE, Harvell CD, Hettinger A (2003) Nutrient enrichment can increase the severity of coral diseases. Ecology Letters 6:1056-1061
Bureau of Meteorology (electronic resource) http://www.bom.gov.au/hydro/flood/qld/brochures/burdekin/burdekin.shtml and http://www.bom.gov.au/hydro/flood/qld/brochures/fitzroy/fitzroy.shtml. Accessed 10/4/2010
Carpenter KE, Abrar M, Aeby G, Aronson RB, Banks S, Bruckner A, Chiriboga A, Cortés J, Delbeek C, DeVantier L, Edgar GJ, Edwards AJ, Fenner D, Guzmán HM, Hoeksema BW, Hodgson G, Johan O, Licuanan WY, Livingstone SR, Lovell ER, Moore JA, Obura DO, Ochavillo D, Polidoro BA, Precht WF, Quibilan MC, Reboton C, Richards ZT, Rogers AD, Sanciangco J, Sheppard A,
100

Reef Rescue Marine Monitoring Program Inshore reef monitoring – Final Report 2011
Sheppard C, Smith J, Stuart S, Turak E, Veron JEN, Wallace C, Weil E, Wood E (2008) One-third of reef building corals face elevated extinction risk from climate change and local impacts. Science 321:560-563
Cheal AJ, Macneil MA, Cripps E, Emslie M, Jonker M, Schaffelke B, Sweatman H (2010) Coral-macroalgal phase shifts or reef resilience: links with diversity and functional roles of herbivorous fishes on the Great Barrier Reef. Coral Reefs: DOI 10.1007/s00338-010-0661-y
Connie 2.0, CSIRO Connectivity Interface, http://www.csiro.au/connie2/
Cooper TF, Uthicke S, Humphrey C, Fabricius KE (2007) Gradients in water column nutrients, sediment parameters, irradiance and coral reef development in the Whitsunday Region, central Great Barrier Reef. Estuarine, Coastal and Shelf Science 74:458-470
Cooper TF, Ridd PV, Ulstrup KE, Humphrey C, Slivkoff M, Fabricius KE (2008) Temporal dynamics in coral bioindicators for water quality on coastal coral reefs of the Great Barrier Reef. Marine and Freshwater Research 59:703-716
Davies-Colley R, Smith D (2001) Turbidity, suspended sediment, and water clarity: a review. Journal of the American Water Resources Association 37: 1085-1101.
De'ath G, Fabricius KE (2008) Water Quality of the Great Barrier Reef: Distributions, Effects on Reef Biota and Trigger Values for the Protection of Ecosystem Health. Research Publication No. 89. Great Barrier Marine Park Authority, Townsville
De’ath G, Fabricius K (2010) Water quality as a regional driver of coral biodiversity and macroalgae on the Great Barrier Reef. Ecological Applications 20:840-850
Dennis B, Taper ML (1994) Density dependence in time series observations of natural populations: estimation and testing. Ecological Monographs 64:205-224
Devlin M, Brodie J (2005) Terrestrial discharge into the Great Barrier Reef Lagoon: nutrient behaviour in coastal waters. Marine Pollution Bulletin 51:9-22
Devlin MJ, Waterhouse J, Taylor J, Brodie J (2001) Flood Plumes in the Great Barrier Reef: Spatial and Temporal Patterns in Composition and Distribution. Research Publication No. 68. Great Barrier Reef Marine Park Authority, Townsville
Devlin MJ, McKinna L, Harkness P (2010) Reef Rescue Marine Monitoring Program: Terrestrial runoff in the Great Barrier Reef. Flood Plume Monitoring for 2009/10 Annual Report. Australian Centre for Tropical Freshwater Research, James Cook University, Townsville. 138 pp.
Devlin MJ, Wenger A, Waterhouse J, Romero J, Abbott B, Bainbridge Z, Lewis S (2011) Reef Rescue Marine Monitoring Program: Flood Plume Monitoring Annual Report. Incorporating results from the Extreme Weather Incident Response program, flood plume monitoring. Final Report for 2010/11 Activities. Catchment to Reef Research Group. ACTFR. James Cook University.
Diaz-Pulido G, McCook LJ, Dove S, Berkelmans R, Roff G, Kline DI, Weeks S, Evans RD, Williamson DH, Hoegh-Guldberg O, (2009) Doom and Boom on a Resilient Reef: Climate Change, Algal Overgrowth and Coral Recovery. PLoS ONE 4(4): e5239. doi:10.1371/journal.pone05239
Done TJ (1982) Patterns in the distribution of coral communities across the central Great Barrier Reef. Coral Reefs 1:95-107
Done TJ (1999) Coral community adaptability to environmental change at the scales of Regions, Reefs and Reef Zones. American Zoologist 39:66-
Done T, Turak E, Wakeford M, DeVantier L, McDonald A and Fisk D (2007) Decadal changes in turbid-water coral communities at Pandora Reef: loss of resilience or too soon to tell? Coral reefs 26:789–805
Fabricius KE (2005) Effects of terrestrial runoff on the ecology of corals and coral reefs: Review and synthesis. Marine Pollution Bulletin 50:125-146
101

Reef Rescue Marine Monitoring Program Inshore reef monitoring – Final Report 2011
Fabricius KE (2011) Factors determining the resilience of coral reefs to eutrophication: A review and conceptual model. In Dubinsky Z. and Stambler N. (eds) Coral Reefs: An Ecosystem in Transition. Springer Science and Business Media B.V.
Fabricius KE, Cooper TF, Humphrey C, Uthicke S, De’ath G, Davidson J, LeGrand H, Thompson A, Schaffelke B (in press) A bioindicator system for water quality on inshore coral reefs of the Great Barrier Reef. Marine Pollution Bulletin doi:10.1016/j.marpolbul.2011.09.004.
Fabricius KE, Death G (2001) Biodiversity on the Great Barrier Reef: Large-scale patterns and turbidity-related local loss of soft coral taxa. In Wolanski E (ed) Biological-Physical Links: Oceanographic processes on the Great Barrier Reef. CRC Press, Boca Raton
Fabricius KE, De’ath G (2004) Identifying ecological change and its causes: A case study on coral reefs. Ecological Applications 14:1448-1465
Fabricius KE, De’ath G, Humphrey C, Schaffelke B (in review) Intra-annual variation in turbidity in response to terrestrial runoff at near-shore coral reefs of the Great Barrier Reef.
Fabricius KE, Death G, McCook L, Turak E, Williams DMcB (2005) Changes in algal, coral and fish assemblages along water quality gradients on the inshore Great Barrier Reef. Marine Pollution Bulletin 51:384-396
Fabricius K, Okaji K, De’ath G (2010) Three lines of evidence to link outbreaks of the crown-of-thorns seastar Acanthaster planci to the release of larval food limitation. Coral Reefs 29:593-605
Fabricius KE, Wild C, Wolanski E, Abele D (2003) Effects of transparent exopolymer particles and muddy terrigenous sediments on survival of hard coral recruits. Estuarine, Costal and Shelf Science 57:613-621
Fabricius KE, Wolanski E (2000) Rapid smothering of coral reef organisms by muddy marine snow. Estuarine, Costal and Shelf Science 50:115-120
Falkowski PG, Jokiel PL, Kinzie RA (1990) Irradiance and corals. In Dubinsky Z (ed) Ecosystems of the world 25: Coral Reefs. Elsevier, New York, pp 89-107
Foster NL, Box SJ, Mumby PJ (2008) Competitive effects of macroalgae on the fecundity of the reef-building coral Montastrea annularis. Marine Ecology Progress Series 367: 143-152.
Furnas M (2003) Catchments and corals: terrestrial runoff to the Great Barrier Reef. Australian Institute of Marine Science. Townsville
Great Barrier Reef Marine Park Authority (2009) Water quality guidelines for the Great Barrier Reef Marine Park. Great Barrier Reef Marine Park Authority, Townsville
Great Barrier Reef Marine Park Authority (in press) Reef Rescue Marine Monitoring Program: quality assurance/quality control methods and procedures. Great Barrier Reef Marine Park Authority, Townsville.
Haapkylä J, Unsworth R, Flavell M, Bourne D, Schaffelke B, Willis BL (2011) Seasonal rainfall and runoff promote coral disease on an inshore reef of the Great Barrier Reef, Australia. PLoS One. 6(2): e16893. doi:10.1371/journal.pone.0016893
Hallock P (1981) Algal Symbiosis: a mathematical analysis. Marine Biology 62: 249–155.
Hallock P, Lidz BH, Cockey-Burkhard EM, Donnelly KB (2003) Foraminifera as bioindicators in coral reef assessment and monitoring: the FORAM index. Environmental Monitoring and Assessment 81: 221-238
Harrison PL, Wallace CC (1990) Reproduction, dispersal and recruitment of Scleractinian corals. In Dubinsky Z (ed) Ecosystems of the world 25: Coral Reefs. Elsevier, New York, pp 133-202
Harvell D, Jordan-Dahlgren E, Merkel S, Rosenberg E, Raymundo L, Smith G, Weil E, Willis B, Global Envrionm Facility C (2007) Coral disease, environmental drivers, and the balance between coral and microbial associates. Oceanography 20:172-195
102

Reef Rescue Marine Monitoring Program Inshore reef monitoring – Final Report 2011
Hauri C, Fabricius K, Schaffelke B, Humphrey C (2010) Chemical and physical environmental conditions underneath mat- and canopy-forming macroalgae, and the effects on understory corals. PLoS ONE 5(9): e12685. doi:10.1371/journal.pone.0012685
Hoegh-Guldberg O, Mumby PJ, Hooten AJ (2007) Coral reefs under rapid climate change and ocean acidification. Science 318:1737-1742
Hughes TP, Baird AH, Dinsdale EA, Motschaniwsky NA, Pratchett MS, Tanner JE, Willis BL (2000) Supply-side ecology works both ways: the link between benthic adults, fecundity, and larval recruits. Ecology 81:2241-2249
Hughes TP, Rodrigues MJ, Bellwood DR, Ceccarelli D, Hoegh-Guldberg O, McCook L, Moltschaniwskyj N, Pratchett MS, Steneck RS, Willis B (2007) Phase Shifts, Herbivory, and the Resilience of Coral Reefs to Climate Change. Current Biology 17:360-365
Humphrey C, Weber M, Lott C, Cooper T, Fabricius K (2008) Effects of suspended sediments, dissolved inorganic nutrients and salinity on fertilization and embryo development in the coral Acropora millepora (Ehrenberg, 1834). Coral Reefs 27:837-850
Ives AR, Dennis B, Cottingham KL, Carpenter SR (2003) Estimating community stability and ecological interactions from time series data. Ecological Monographs 73:301-330
Jones AM, Berkelmans R, van Oppen MJH, Mieog JC, Sinclair W (2008) A community shift in the symbionts of a scleractinian coral following a natural bleaching event: field evidence of acclimatization. Proceedings Royal Society London, Series B: Biological Sciences 275: 1359–1365
Jonker M, Johns K, Osborne, K. (2008) Surveys of benthic reef communities using underwater digital photography and counts of juvenile corals. Long-term Monitoring of the Great Barrier Reef, Standard Operational Procedure Number 10, Australian Institute of Marine Science, Townsville
Kaczmarsky L, Richardson LL (2011) Do elevated nutrients and organic carbon on Philippine reefs increase the prevalence of coral disease? Coral Reefs 30:253-257
Kennedy K, Devlin M, Bentley C, Paxman C, Chue KL, Mueller J (2011) Pesticide monitoring in inshore waters of the Great Barrier Reef using both time integrated and event monitoring techniques (2010 - 2011). The University of Queensland, The National Research Centre for Environmental Toxicology (Entox).
Kirk J (1985) Effects of suspensoids (turbidity) on penetration of solar radiation in aquatic ecosystems Hydrobiologia 125: 195-208.
Kroon F, Kuhnert K, Henderson B, Henderson A, Turner R, Huggins R, Wilkinson S, Abbott B, Brodie J, Joo M (2010) Baseline pollutant loads tot eh Great Barrier Reef. CSIRO: Water for a Healthy Country Flagship Report Series.
Kuffner IB, Walters LJ, Becerro MA, Paul VJ, Ritson-Williams R, Beach KS (2006) Inhibition of coral recruitment by macroalgae and cyanobacteria. Marine Ecology Progress Series 323:107-117
Lambrechts J, Humphrey C, McKinna L, Gourge O, Fabricius KE, Mehta AJ, Lewis S, Wolanski E (2010) Importance of wave-induced liquefaction in the fine sediment budget of Cleveland Bay, Great Barrier Reef. Estuarine, Coastal and Shelf Science 89:154-162
Legendre P, Legendre L (1998) Numerical ecology. Second English edition. Elsevier, Amsterdam, The Netherlands.
Luick JL, Mason L, Hardy T, Furnas MJ (2007) Circulation in the Great Barrier Reef Lagoon using numerical tracers and in situ data. Continental Shelf Research 27:757-778
Marshall PA, Johnson JE (2007) The Great Barrier Reef and climate change: vulnerability and management implications. In: Johnson JE, Marshall PA (eds) Climate change and the Great Barrier Reef. Great Barrier Reef Marine Park Authority and the Australian Greenhouse Office, Australia, p 774-801
103

Reef Rescue Marine Monitoring Program Inshore reef monitoring – Final Report 2011
Maxwell WGH (1968) Atlas of the Great Barrier Reef. Elsevier 258pp
McCook LJ, Jompa J, Diaz-Pulido G (2001) Competition between corals and algae on coral reefs: a review of evidence and mechanisms. Coral Reefs 19: 400-417
Miller IR, Jonker M, Coleman G (2009) Crown-of-thorns starfish and coral surveys using the manta tow and SCUBA Search techniques. Long-term Monitoring of the Great Barrier Reef Standard Operational Procedure Number 9, Edition 3. Australian Institute of Marine Science, Townsville
Mora C (2008) A Clear human footprint in the coral reefs of the Caribbean. Proceedings of the Royal Society B 275:767-773
Negri AP, Webster NS, Hill RT, Heyward AJ (2002) Metamorphosis of broadcast spawning corals in response to bacteria isolated from crustose algae. Marine Ecology Progress Series. 223:121-131
Negri AP, Flores F, Röthig T, Uthicke S (2011) Herbicides increase the vulnerability of corals to rising sea surface temperature. Limnology and Oceanography. 56:471-485
Nobes K, Uthicke S (2008) Benthic Foraminifera of the Great Barrier Reef: A guide to species potentially useful as Water Quality Indicators. Report to the Marine and Tropical Sciences Research Facility. Reef and Rainforest Research Centre Limited, Cairns (44pp.). Available at: http://www.rrrc.org.au/publications/downloads/371-AIMS-Nobes-et-al-2008-Benthic-Foraminifera-of-the-GBR.pdf
Osborne K, Dolman AM, Burgess SC, Johns KA (2011) Disturbance and the Dynamics of Coral Cover on the Great Barrier Reef (1995–2009). PLoS ONE 6:e17516
Philipp E, Fabricius K (2003) Photophysiological stress in scleractinian corals in response to short-term sedimentation. Journal of Experimental Marine Biology and Ecology 287:57-78
Pinheiro JC, Bates, DM (2000) Mixed effects models in S and S-PLUS. Springer-Verlag, New York.
Pinheiro JC, Bates DM, DebRoy S, Sarkar D, R Development Core Team (2011). nlme: Linear and Nonlinear Mixed Effects Models. http://tycho-if-a.mirrorservice.org/sites/lib.stat.cmu.edu/R/CRAN/doc/packages/nlme.pdf
R Development Core Team, 2011. R: A Language and Environment for Statistical Computing. R Foundation for Statistical Computing, Vienna, Austria. URL: http://www.R-project.org/.
Renema W, Hoeksema BW, Van Hinte JE (2001) Larger benthic Foraminifera and their distribution patterns on the Spermonde shelf, South Sulawesi. Zoologische Verhandelingen 334: 115-150.
Reymond CE, Uthicke S, Pandolfi JM (2011) Inhibited growth in the photosymbiont-bearing foraminifer Marginopora vertebralis from the nearshore Great Barrier Reef, Australia. Marine Ecology Progress Series 435: 97-109
Richmond RH (1993) Effects of coastal runoff on coral reproduction. In: Ginsburg RN (complier) Proceedings of the colloquium on global aspects of coral reefs: health, hazards and history. Rosenthal School of Marine and Atmospheric Science, University of Miami, Miami, pp 360-364
Rogers CS (1990) Responses of coral reefs and reef organisms to sedimentation. Marine Ecology progress Series 62:185-202
Schaffelke B, Mellors J, Duke NC (2005) Water quality in the Great Barrier Reef region: responses of mangrove, seagrass and macroalgal communities. Marine Pollution Bulletin 51: 279-296
Schaffelke B, Thompson A, Carleton J, Cripps E, Davidson J, Doyle J, Furnas M, Gunn K, Neale S, Skuza M, Uthicke S, Wright M, Zagorskis I (2008) Water Quality and Ecosystem Monitoring Final Report for 2007/2008. Australian Institute of Marine Science, Townsville.
Schaffelke B, Thompson A, Carleton J, Davidson J, Doyle J, Furnas M, Gunn K, Skuza M, Wright M, Zagorskis I (2009) Reef Rescue Marine Monitoring Program-Final Report of AIMS Activities 2008/2009. Australian Institute of Marine Science, Townsville.
104

Reef Rescue Marine Monitoring Program Inshore reef monitoring – Final Report 2011
Schaffelke B, Carleton J, Doyle J, Furnas M, Gunn K, Skuza M, Wright M, Zagorskis I (2010) Reef Rescue Marine Monitoring Program. Final Report of AIMS Activities – Inshore water quality monitoring 2009/10. Australian Institute of Marine Science, Townsville.
Schaffelke B, Carleton J, Doyle J, Furnas M, Gunn K, Skuza M, Wright M, Zagorskis I (2011) Reef Rescue Marine Monitoring Program. Final Report of AIMS Activities – Inshore water quality monitoring 2010/11 Report for the Great Barrier Reef Marine Park Authority. Australian Institute of Marine Science, Townsville.
Schaffelke B, Carleton J, Skuza M, Zagorskis I, Furnas MJ (in press) Water quality in the inshore Great Barrier Reef lagoon: Implications for long-term monitoring and management. Marine Pollution Bulletin. http://dx.doi.org/10.1016/j.marpolbul.2011.10.031
Smith LD (2008) Resilience of coral communities on an isolated system of reefs following catastrophic mass-bleaching. Coral Reefs 27:197-205
Smith VH, Schindler DW (2009) Eutrophication science: where do we go from here? Trends in Ecology and Evolution 24: 201-207
Stafford-Smith MG, Ormond RFG (1992) Sediment-rejection Mechanisms of 42 Species of Australian Scleractinian Corals. Australian Journal of Marine and Freshwater Research 43:683-705
Steffen W (2009) Climate change 2009: faster change and more serious risks. Report to the Australian Government, Department of Climate Change
Sweatman H, Burgess S, Cheal AJ, Coleman G, Delean S, Emslie M, Miller I, Osborne K, McDonald A, Thompson A (2005) Long-term monitoring of the Great Barrier Reef. Status Report No. 7. CD-Rom. Australian Institute of Marine Science, Townsville
Sweatman H, Thompson A, Delean S, Davidson J, Neale S (2007) Status of inshore reefs of the Great Barrier Reef 2004. Australian Institute of Marine Science, Townsville
Szmant AM (2002) Nutrient enrichment on coral reefs: Is it a major cause of coral reef decline? Estuaries 25: 743-766
Tager D, Webster JM, Potts DC, Renema W, Braga JC, Pandolfi JM (2010) Community dynamics of Pleistocene coral reefs during alternative climatic regimes. Ecology 91: 191-200
Tebben J, Tapiolas DM, Motti CA, Abrego D, Negri AP, Blackall LL, Steinberg PD and Harder T (2011) Induction of larval metamorphosis of the coral Acropora millepora by tetrabromopyrrole isolated from a Pseudoalteromonas bacterium. PLoS ONE 6: e19082.
Thompson A, Dolman A (2010) Coral bleaching: one disturbance too many for inshore reefs of the Great Barrier Reef. Coral Reefs 29:637-648
Thompson A, Schaffelke B, De’ath G, Cripps E, Sweatman H (2010)a Water Quality and Ecosystem Monitoring Programme-Reef Water Quality Protection Plan. Synthesis and spatial analysis of inshore monitoring data 2005-08. Report to the Great Barrier Reef Marine Park Authority. Australian Institute of Marine Science, Townsville
Thompson A, Davidson J, Schaffelke B, Sweatman H (2010)b Reef Rescue Marine Monitoring Program. Final Report of AIMS Activities – Inshore coral reef monitoring 2009/10. Report for Reef and Rainforest Research Centre. Australian Institute of Marine Science, Townsville.
Thompson A, Davidson J, Uthicke S, Schaffelke B, Patel F, Sweatman H (2011) Reef Rescue Marine Monitoring Program. Final Report of AIMS Activities-Inshore coral reef monitoring 2010. Report for Reef and Rainforest Research Centre. Australian Institute of Marine Science, Townsville.
Todd PA (2008) Morphological plasticity in Scleractinian corals. Biological Reviews 83:315-337
Uthicke S, Altenrath C (2010) Water column nutrients control growth and C : N ratios of symbiont-bearing benthic foraminifera on the Great Barrier Reef, Australia. Limnology and Oceanography 55: 1681-1669
105

Reef Rescue Marine Monitoring Program Inshore reef monitoring – Final Report 2011
Uthicke S, Nobes K (2008) Benthic foraminifera as ecological indicators for water quality on the Great Barrier Reef. Estuarine, Costal and Shelf Science 78:763-773
Uthicke S, Patel F, Ditchburn R (in press) Elevated land runoff after European settlement perturbs persistent foraminiferal assemblages on the Great Barrier Reef. Ecology
Uthicke S, Thompson A, Schaffelke B (2010) Effectiveness of benthic foraminiferal and coral assemblages as water quality indicators on inshore reefs of the Great Barrier Reef, Australia. Coral Reefs 29:209-225
van Woesik R (1991) Immediate Impact of the January 1991 floods on the Coral Assemblages of the Keppel Islands. Research Publication No. 23. Great Barrier Reef Marine Park Authority, Townsville
van Woesik R, Done TJ (1997) Coral communities and reef growth in the southern Great Barrier Reef. Coral Reefs 16:103-115
van Woesik R, Tomascik T, Blake S (1999) Coral assemblages and physico-chemical characteristics of the Whitsunday Islands: evidence of recent community changes. Marine and Freshwater Research 50:427-440
Voss JD, Richardson LL (2006) Nutrient enrichment enhances black band disease progression in corals. Coral Reefs 25: 569-576
Ward S, Harrison P, Hoegh-Guldberg O (2002) Coral bleaching reduces reproduction of scleractinian corals and increases susceptibility to future stress. In: Moosa MK, Soemodihardjo S, Soegiarto A, Romimohtarto K, Nontji A, Suharsono S (eds) Proc. 9th International Coral Reef Symposium 2:1123-1128
Weber M, Lott C, Fabricius KE (2006) Sedimentation stress in a scleractinian coral exposed to terrestrial and marine sediments with contrasting physical, organic and geochemical properties. Journal of Experimental Marine Biology and Ecology 336: 18-32
Webster IT, Ford PW (2010) Delivery, deposition and redistribution of fine sediments within macrotidal Fitzroy Estuary/Keppel Bay: Southern Great Barrier Reef, Australia. Continental Shelf Research 30: 793-805
Webster NS, Smith LD, Heyward AJ, Watts JEM, Webb RI, Blackall LL, Negri AP (2004) Metamorphosis of a scleractinian coral in response to microbial biofilms. Applied and Environmental Microbiology 70: 1213-1221
Willis BL, Page CA, Dinsdale EA (2004) Coral disease on the Great Barrier Reef
Wismer S, Hoey AS, Bellwood DR (2009) Cross-shelf benthic community structure on the Great Barrier Reef: relationships between macroalgal cover and herbivore biomass. Marine Ecology Progress Series 376:45-54
Wolanski E, Fabricius KE, Cooper TF, Humphrey C (2008) Wet season fine sediment dynamics on the inner shelf of the Great Barrier Reef. Estuarine, Coastal and Shelf Science 77:755-762
Wolanski E, Fabricius KE, Spagnol S, Brinkman R (2005) Fine sediment budget on an inner-shelf coral-fringed island, Great Barrier Reef of Australia. Estuarine, Coastal and Shelf Science 65:153-158
Wooldridge S, Done T (2004) Learning to predict large-scale coral bleaching from past events: A Bayesian approach using remotely sensed data, in-situ data, and environmental proxies. Coral Reefs 23: 96–108
Wooldridge SA (2009) Water quality and coral bleaching thresholds: formalising the linkage for the inshore reefs of the Great Barrier Reef (Australia). Marine Pollution Bulletin 58:745-751
Yordanova EK, Hohenegger J (2002) Taphonomy of larger Foraminifera: relationships between living individuals and empty tests on flat reef slopes (Sesoko Island, Japan). Facies 46:169-204
106

Reef Rescue Marine Monitoring Program Inshore reef monitoring – Final Report 2011
Appendix 1: Detailed data tables
Table A1- 1 Clay and silt content of sediments. Values are the average proportion (%) of the sediment samples, by weight, with grain sizes < 0.063 mm.
Region Catchment Reef 2006 2007 2008 2009 2010 2011
Wet
Tro
pics
Barron
Daintree
Cape Tribulation North 3.73Cape Tribulation Middle 7.42Cape Tribulation South 8.22Snapper Is North 42.86 38.96 39.70 39.12 55.86
Snapper Is South 8.73 7.25 7.28 17.70 23.62
Johnstone
Russell-Mulgrave
Fitzroy Is West 4.07 9.04 9.56 4.60 17.41 23.49Fitzroy Is East 4.77 0.57 5.22 2.45Frankland Group West 35.27 25.30 36.41 23.11 43.62 52.76Frankland Group East 17.85 3.12 3.26 3.21High Is West 9.95 6.20 18.74 8.14 16.01 22.11
High Is East 8.69 0.58 0 2.46
Herbert
Tully
North Barnard Group 12.27 5.93 5.81 11.27King 3.27 1.64 7.43Dunk Is North 5.03 6.65 14.86 5.85 20.36 18.80
Dunk Is South 12.27 5.28 6.90 13.30
Burd
ekin
Burdekin Pelorus and Orpheus Islands West 5.76 3.97 3.89 5.35 7.54 15.24Orpheus Is East 1.60 0 2.04 0.84Lady Elliot 14.50 12.57 16.38Pandora 3.43 2.36 2.98 1.85 6.58 7.95Havannah Is 7.62 7.45 2.99 11.42Geoffrey Bay 13.16 9.76 7.97 4.12 13.84 10.77Middle Reef 80.48 54.92 30.0 49.42
Mac
kay
Whi
tsun
day
Proserpine Double Cone Is 14.12 34.59 28.52 33.33 60.17 52.62Hook Is 36.66 36.36 34.91Daydream Is 61.56 72.46 72.39 38.64 74.43 70.46Shute and Tancred Islands 38.07 25.60 63.77Dent Is 58.15 52.93 56.19 54.60Pine Is 59.53 44.47 58.21 40.57 78.36 63.73
Seaforth Is 36.43 41.37 37.39 36.85
Fitz
roy
Fitzroy North Keppel Is 14.38 8.94 9.15 35.43Barren Is 2.62 2.37 2.82 4.24 4.84 18.39Middle Is 4.69 12.93Humpy and Halfway Islands 3.26 3.14 5.74 5.45 14.94 6.66Pelican Is 2.42 2.55 0 1.69 5.59 5.44
Peak Is 2.51 5.16 13.83 9.53
107

Reef Rescue Marine Monitoring Program Inshore reef monitoring – Final Report 2011
Table A1- 2 Organic carbon content of sediments. Values are the proportion (%) of the total sediment sample by weight.
Region Catchment Reef 2006 2007 2008 2009 2010 2011
Wet
Tro
pics
BarronDaintree
Cape Tribulation North 0.27Cape Tribulation Middle 0.30Cape Tribulation South 0.39Snapper Is North 0.60 0.62 0.59 0.44 0.61Snapper Is South 0.28 0.40 0.36 0.28 0.33
JohnstoneRussell-Mulgrave
Fitzroy Is West 0.25 0.35 0.38 0.24 0.27 0.28Fitzroy Is East 0.20 0.18 0.22 0.15Frankland Islands West 0.58 0.51 0.57 0.53 0.57 0.63Frankland Islands East 0.23 0.23 0.22 0.25High Is West 0.37 0.26 0.35 0.32 0.28 0.33High Is East 0.26 0.19 0.19 0.19
HerbertTully
North Barnard Islands 0.28 0.27 0.25 0.23King 0.18 0.20 0.21Dunk Is North 0.28 0.24 0.26 0.31 0.26 0.25Dunk Is South 0.31 0.23 0.21 0.24
Burd
ekin
BurdekinPelorus and Orpheus Islands West 0.23 0.19 0.20 0.26 0.22 0.29Orpheus Is East 0.22 0.17 0.20 0.19Lady Elliot 0.21 0.19 0.20Pandora 0.19 0.19 0.23 0.24 0.22 0.19Havannah Is 0.26 0.25 0.33 0.25Geoffrey Bay 0.31 0.29 0.30 0.25 0.27 0.22Middle Reef 0.98 0.77 0.79 0.50
Mac
kay
Whi
tsun
day Proserpine Double Cone Is 0.49 0.56 0.48 0.53 0.66 0.63
Hook Is 0.37 0.43 0.37Daydream Is 0.62 0.79 0.88 0.88 0.76 0.90Shute and Tancred Islands 0.48 0.46 0.70Dent Is 0.65 0.67 0.70 0.56Pine Is 0.76 0.66 0.75 0.66 0.79 0.64Seaforth Is 0.47 0.49 0.54 0.38
Fitz
roy
Fitzroy North Keppel Is 0.21 0.48 0.56 0.58Barren Is 0.26 0.28 0.25 0.33 0.34 0.48Middle Is 0.22 0.12Humpy and Halfway Islands 0.30 0.22 0.28 0.30 0.30 0.25Pelican Is 0.23 0.17 0.21 0.26 0.22 0.23Peak Is 0.23 0.25 0.28 0.23
108

Reef Rescue Marine Monitoring Program Inshore reef monitoring – Final Report 2011
Table A1- 3 Total nitrogen content of sediments. Values are the proportion of the total sediment sample by weight expressed as parts per hundred thousand.
Region Catchment Reef 2006 2007 2008 2009 2010 2011
Wet
Tro
pics
Barron
Daintree
Cape Tribulation North 38.79Cape Tribulation Middle 39.18Cape Tribulation South 41.61Snapper Is North 67.88 50.83 79.10 55.73 62.47
Snapper Is South 14.60 44.59 45.74 36.75 45.69
Johnstone
Russell-Mulgrave
Fitzroy Is West 25.56 41.64 36.72 31.02 36.38 39.17Fitzroy Is East 21.07 23.99 31.65 23.05Frankland Group West 42.88 38.10 43.64 46.80 40.12 78.81Frankland Group East 17.98 30.30 25.57 35.30High Is West 82.00 81.45 69.99 78.74 77.94 46.71
High Is East 20.29 33.48 33.57 28.02
Herbert
Tully
North Barnard Group 37.45 32.28 37.69 30.37King 28.12 22.47 29.95Dunk Is North 28.82 31.57 29.25 41.62 34.22 30.85
Dunk Is South 33.44 33.11 26.59 35.66
Burd
ekin
Burdekin Pelorus and Orpheus Islands West 34.54 30.87 31.19 34.65 34.68 38.94Orpheus Is East 18.43 28.16 30.72 30.08Lady Elliot 31.83 20.94 26.56Pandora 30.41 32.55 33.17 26.47 36.73 33.75Havannah Is 23.39 37.00 36.38 39.39Geoffrey Bay 40.93 41.86 40.27 31.35 34.85 33.38Middle Reef 115.68 75.63 108.58 61.07
Mac
kay
Whi
tsun
day
Proserpine Double Cone Is 43.88 92.00 64.02 67.74 80.47 96.38Hook Is 46.62 57.39 53.41Daydream Is 86.01 102.48 102.20 120.14 88.33 107.70Shute and Tancred Islands 66.26 72.03 92.08Dent Is 79.21 88.61 87.24 74.70Pine Is 88.25 85.61 90.59 77.80 82.95 76.41Seaforth Is 57.53 75.03 65.67 58.65
Fitz
roy
Fitzroy North Keppel Is 29.95 52.81 76.38 76.05Barren Is 38.26 51.97 51.17 41.37 54.70 73.80Middle Is 36.54 15.33Humpy and Halfway Islands 40.95 35.17 53.24 36.91 42.25 32.70Pelican Is 32.88 31.62 43.29 40.11 37.91 37.81
Peak Is 34.65 51.87 41.85 34.49
109

Reef Rescue Marine Monitoring Program Inshore reef monitoring – Final Report 2011
Table A1- 4 Inorganic carbon content of sediments. Values are the proportion (%) of the total sediment sample by weight.
Region Catchment Reef 2006 2007 2008 2009 2010 2011
Wet
Tro
pics
Barron
Daintree
Cape Tribulation North 7.87Cape Tribulation Middle 8.53Cape Tribulation South 8.21Snapper Is North 6.99 5.98 6.98 7.70 5.82
Snapper Is South 9.57 7.49 9.60 10.02 8.81
Johnstone
Russell-Mulgrave
Fitzroy Is West 9.80 9.47 9.35 10.26 9.93 8.86Fitzroy Is East 9.76 9.58 10.02 8.61Frankland Islands West 8.12 8.39 7.63 8.64 8.27 6.80Frankland Islands East 10.62 10.37 10.33 7.23High Is West 9.45 9.91 8.90 9.77 10.12 8.94
High Is East 10.09 10.58 10.76 10.20
Herbert
Tully
North Barnard Islands 8.95 9.43 9.47 8.53King 9.30 9.12 9.77Dunk Is North 8.47 8.65 7.15 8.64 8.74 7.29
Dunk Is South 9.60 9.71 10.19 9.34
Burd
ekin
Burdekin Pelorus and Orpheus Islands West 10.17 10.57 10.10 10.06 10.43 9.60Orpheus Is East 10.48 10.58 10.90 10.36Lady Elliot 3.82 5.08 5.42Pandora 10.56 10.55 10.27 10.41 10.63 9.80Havannah Is 10.19 10.11 10.22 8.28Geoffrey Bay 7.88 8.40 8.36 9.17 9.27 3.93Middle Reef 2 4.70 4.75 6.56
Mac
kay
Whi
tsun
day
Proserpine Double Cone Is 9.31 7.49 7.61 7.25 6.62 9.80Hook Is 8.73 8.27 9.12Daydream Is 6.01 4.29 3.93 4.47 4.97 3.82Shute and Tancred Islands 7.58 7.59 5.69Dent Is 6.69 6.42 6.27 6.77Pine Is 5.37 5.62 4.97 5.86 4.48 6.07Seaforth Is 8.40 7.79 7.82 8.23
Fitz
roy
Fitzroy North Keppel Is 5.68 8.70 9.05 7.39Barren Is 9.64 9.81 9.49 9.39 9.76 9.01Middle Is 3.74 1.93Humpy and Halfway Islands 8.68 8.76 8.73 8.86 8.68 7.94Pelican Is 8.03 7.42 8.21 7.80 9.38 7.61Peak Is 6.76 8.38 7.48 7.99
110

Table A1- 5 Known disturbances to coral communities at Reef Rescue monitoring locations. For coral bleaching, decimal fractions indicate the probability of occurrence at this site (see table footnote). Percentages in brackets are the observed proportional loss of hard coral cover for a given disturbance at that reef.
Note: As direct observations of impact were limited during the wide spread bleaching events of 1998 and 2002 tabulated values for these years are the estimated probability that each reef would have experienced a coral bleaching event as calculated using a Bayesian Network model (Wooldridge and Done 2004). The network model allows information about site-specific physical variables (e.g. water quality, mixing strength, thermal history, wave regime) to be combined with satellite-derived estimates of sea surface temperature (SST) in order to provide a probability (= strength of belief) that a given coral community in a given patch of ocean would have experienced a coral bleaching event. Higher probabilities indicate a greater strength of belief in both the likelihood of a bleaching event and the severity of that event. Where impact was observed the proportional reduction in coral cover is included. For all other disturbances listed the proportional reductions in cover are based on direct observation.
Reg
ion
Catc
hmen
t
Reef
Bleaching Other recorded disturbances
1998 2002 2006
Wet
Tro
pics
Barro
nDa
intre
e
Snapper Is (North)0.92
(19%)0.95 (Nil)
Flood 1996 (20%), Cyclone Rona 1999 (74%), Storm , Mar 2009 (14% at 2m, 5% at 5m),Disease 2011 (16% at 2m, 24% at 5m)
Snapper Is (South) 0.92 (Nil) 0.95 (Nil) Flood 1996 (87%), Flood 2004 (32%)
John
ston
eRu
ssel
l-Mul
grav
e
Fitzroy Is (East) 0.92 0.95 Cyclone Felicity (75% manta tow data), Disease 2011 (54% at 2m, 38% at 5m)
Fitzroy Is (West)0.92
(13%)0.95
(15%)Crown-of-thorns 1999-2000 (78%), Cyclone Hamish 2009 (stalled recovery trajectory),Disease 2011 (40% at 2m, 14% at 5m)
Frankland Group (East)0.92
(43%)0.80 (Nil)
Unknown though likely crown-of-thorns 2000 (68%) Cyclone Larry 2006 (60% at 2m , 46% at 5m),Cyclone Tasha/Yasi 2011 (51% at 2 m, 35% at 5m)
Frankland Group (West)
0.93 (44%)
0.80 (Nil) Unknown though likely crown-of-thorns 2000 (35%) Cyclone Tasha/Yasi 2011 (33% at 2m)
High Is (East) 0.93 0.80 Cyclone Tasha/Yasi 2011 (80% at 2m, 56% at 5m)
High Is (West) 0.93 0.80 Cyclone Larry 2006 (25% at 5m), Flood/Bleaching 2011 (19% at 2m, 29% at 5m)
Herb
ert
Tully
North Barnard Group 0.93 0.80 Cyclone Larry 2006 (95% at 2m , 86% at 5m), Cyclone Yasi 2011 (26% at 2m)
King Reef 0.93 0.85 Cyclone Larry 2006 (35% at 2m, 47% at 5m)
Dunk Is (North) 0.93 0.80 Cyclone Larry 2006 (80% at 2m , 71% at 5m), Cyclone Yasi 2011 (91% at 2m, 71% at 5m)
Dunk Is (South) 0.93 0.85 Cyclone Larry 2006 (12% at 2m , 18% at 5m), Cyclone Yasi 2011 (75% at 2m, 53% at 5m)

Reef Rescue Marine Monitoring Program Inshore reef monitoring – Final Report 2011
Table A1-5 continued.Re
gion
Catc
hmen
t
ReefBleaching Other recorded disturbances
1998 2002 2006
Burd
ekin
Burd
ekin
Orpheus Is (East) 0.93 0.80 Cyclone Larry 2006 (22% at 2m, 40% at 5m), Cyclone Yasi 2011 (81% at 2m, 82% at 5m)Orpheus & Pelorus Is (West) 0.92 (83%) 0.80 Unknown 1995-7 though possibly Cyclone Justin (32%) , Cyclone Larry 2006 (16% at 2m), Flood 2010
(63% at 2m, 27% at 5m)Lady Elliott Reef 0.93 0.85
Pandora Reef 0.93 (21%) 0.85 (2%) Cyclone Tessie 2000 (9%), Cyclone Larry 2006 (78% at 2m, 30% at 5m), Storm 2009 (16% at 2m, 51% at 5m), Cyclone Yasi 2011 (50% at 5m)
Havannah Is 0.93 (49%) 0.95 (21%) Combination of Cyclone Tessie and Crown-of-thorns 1999-2001 (66%)Middle Reef 0.93 (4%) 0.95 (12%) Cyclone Tessie 2000 (10%) , Flood/Beaching 2009 (14%),
Geoffrey Bay0.93 (24%) 0.95 (37%)
Cyclone Joy 1990 (13%), Bleaching 1993 (10%), Cyclone Tessie 2000 (18%), Cyclone Larry 2006 (31% at 2m, 4% at 5m), Flood/Bleaching 2009 (2% at 2m, 7% at 5m), Flood 2010 (24% at 2m)Cyclone Yasi and Flood/Bleaching 2011 (20% at 2m, 12% at 5m)
Mac
kay
Whi
tsun
day
Pros
erpi
ne
Hook Is 0.57 1 Coral Bleaching Jan 2006, probable though not observed we did not visit region at time of event. Same for other reefs in region, Cyclone Ului 2010 (27% at 2m, 12% at 5m)
Dent Is 0.57 (crest 32%) 0.95 Cyclone Ului 2010 most likely although reef not surveyed in that year (17% at 2m, 22% at 5m)Seaforth Is 0.57 0.95Double Cone Is 0.57 1 Cyclone Ului 2010 (21% at 2m, 10% at 5m)
Daydream Is 0.31 (crest 44%) 1 Cyclone Ului 2010 (40% at 2m, 41% at 5m)Shute Is & Tancred Is 0.57 1 Cyclone Ului 2010 (3% at 2m)Pine Is 0.31 1 Cyclone Ului 2010 (7% at 2m, 5% at 5m)
Fitz
roy
Fitz
roy
Barren Is 1 1 (22%, 2m ) (33%, 5m) Storm Feb 2008 (38% at 2m, 21% at 5m), Storm Feb 2010 plus disease (14% at 2m)
North Keppel Is 1 (15%) 0.89 (36%) (60%, 2m) (42% , 5m)
Storm Feb 2010 possible though not observed as site not surveyed that year. 2011 ongoing disease (44% at 5m) possibly associated with flood.
Middle Is 1 (56%) 1 (Nil) (62%, 2m) (39%, 5m) Storm Feb 2010 plus disease (12% at 2m, 37% at 5m)
Humpy & Halfway Is 1 (6%) 1 (26%) (24%, 2m) (26%, 5m) Flood 2008 (6% at 2m, 2% at 5m),Flood 2011 (83% at 2m, 12% at 5m)
Pelican Is 1 1 17%, 5m Flood /Storm 2008 (23% at 2m, 2% at 5m), Flood/Storm (20% at 2m), Flood 2011 (99%at 2m, 29% at 5m)Peak Is 1 1 Flood 2008 (17% at 2m), Flood 2011 (65% at 2m, 22% at 5m)
112

Reef Rescue Marine Monitoring Program Inshore reef monitoring – Final Report 2011
Table A1- 6 Composition of coral reef communities. Hard coral families (% cover) 2011Re
gion
Catc
hmen
t
Reef
Dept
h
Acro
porid
ae
Agar
iciid
ae
Dend
roph
yllii
dae
Euph
yylli
dae
Favi
idae
Fung
iidae
Mer
ulin
idae
Mus
sida
e
Ocul
inid
ae
Pect
inid
ae
Poci
llopo
ridae
Porit
idae
Side
rast
reid
ae
Unkn
own
Wet
Tro
pics
Barro
nDa
intre
e Snapper Is North2 40.93318 0 0 0 2.66666
70.25 0.04166
70 0.33333
30 0.33359
50.375 0.41771
50
5 5.943003 16.59709
0.062893
0 1.25 1.064072
0.688286
0 0.563286
0.750786
1.127358
12.71305
0 0
Snapper Is South 2 18.25812 0.25 0.166667
0 1.833595
0.083595
0.041667
0.083333
1.125262
0 1.166929
24.26258
0.291929
05 8.909852 4.32476
20.51948
10 6.53032
30.75722
90.12539
30.25487 0.0625 0.0625 0.375 31.9814
90.81289
30
John
ston
e R
usse
ll-M
ulgr
ave
Fitzroy Is West 2 16.01101 0.250786
0 0.062893
2.504717
0.25 0.5625 0.313286
1.062893
0 0.6875 5.438286
0.0625 05 7.572327 0.56407
20 0.125 1.8125 0.56289
30.37539
31.00275
21.25117
90.6875 0.81407
211.3223
30.43985
80.125
Fitzroy is East 2 9.3125 0.0625 0 0 1.75 0 0 0.25 0.0625 0 1 4.5 0 05 16.94379 0.1875 0.0625 0.0625 3.43789
30.1875 0.25 0.3125 1.1875 0.18789
33.37657
24.56328
60.25 0
High Is West 2 3.190655 0.188291
0.0625 0 1.564858
0.500786
0.375393
0.0625 0.187893
0.125786
0.188291
41.20575
0 0.06289305 1.251179 1.12539
30 0.125 1.06407
20.25 0 0.06289
30.18789
30.1875 0.0625 15.6615
60 0
High Is East 2 3.75 0 0.1875 0 2.0625 0 0.25 1.0625 0.25 0 0 4.125 0.1875 05 4.3125 0.125 0.125 0 1.9375 0 0.1875 0.125 0.25 0.0625 0.1875 12.5625 0.0625 0
Frankland Group West 2 3.501179 3.825472
0 0 0.1875 0.125393
0.25 0.125786
0.250393
0 0.1875 20.14937
0 0.06289305 0.25 0.3125 0 0 0.37895
60.25 0 0 0 0 0 60.1534
80 0
Frankland Group East 2 9.8125 0 0 0 1.375 0 0 0 0 0.125 0.1875 1.3125 0.125 05 7.9375 0.1875 0 0 1.8125 0.0625 0.6875 0.25 0 0.0625 1.125 3.75 0.0625 0
Herb
ert
Tully
North Barnard Group 2 3.5 0.0625 0.0625 0 0.75 0 0 0.0625 0.0625 0 0.0625 0.1875 0.0625 05 4.875 0.1875 0.3125 0 1.5 0 0 0.0625 0.1875 0.1875 0.1875 1.25 0 0
Dunk Is North 2 0.6875 0 0.25 0 0.75 0 0 0.125 0 0 0 0.3125 0 05 3.505503 0.31446
50.50196
50 1.68867
90 0 0.18789
30 0.12539
30.3125 0.125 0 0
Dunk Is South 2 0.3125 0.3125 0.375 0 2 0 0 0.3125 0.3125 0 0 2.25 0 05 2.0625 2.4375 2.5625 0 7.125 0.3125 2 0.625 0 1.6875 0 1.625 0.0625 0.0625
Burd
ekin
Burd
ekin
Pelorus Is and Orpheus Is West
2 1.375 0.0625 0 0 0.6875 0.0625 0 0.0625 0.0625 0.0625 3 0.5625 0 05 2.4375 0.125 0 0.0625 1.25 0.25 0 0.5 0.0625 0.0625 0.375 4 0.125 0
Orpheus Is East 2 0.4375 0 0 0 0.75 0 0 0.1875 0 0 0 0.4375 0 05 0.3125 0 0 0 0.5 0 0 0 0 0 0 0.9375 0 0
Pandora 2 0.625 0 0 0 2.125 0 0 0 0 0 0 1.125 0 05 0.3125 0 0 0 4.5 0 0 0 0.0625 0 0.0625 0 0 0
Havannah Is 2 7.75 0.1875 1.625 0 1.6875 0.125 0.375 0.5 0.875 0 0.1875 1.8125 0.0625 05 0.875 0.25 1.125 0 2.375 1.75 0.8125 0.375 0.75 0.375 0.125 0.625 0.125 0
Geoffrey Bay 2 3.9375 0.8125 1.625 0 2 0.125 0.125 0 0.3125 0 0 1.8125 0.4375 0.06255 4.4375 2.4375 1.0625 0 7.5625 1.9375 1.625 0.25 0.875 0.8125 0 3.3125 0 0
Middle reef 2 1.75 10.687 0.875 0 1.5 0.4375 0.1875 0.5 1.5625 0.4375 0.3125 27.25 0 0
113
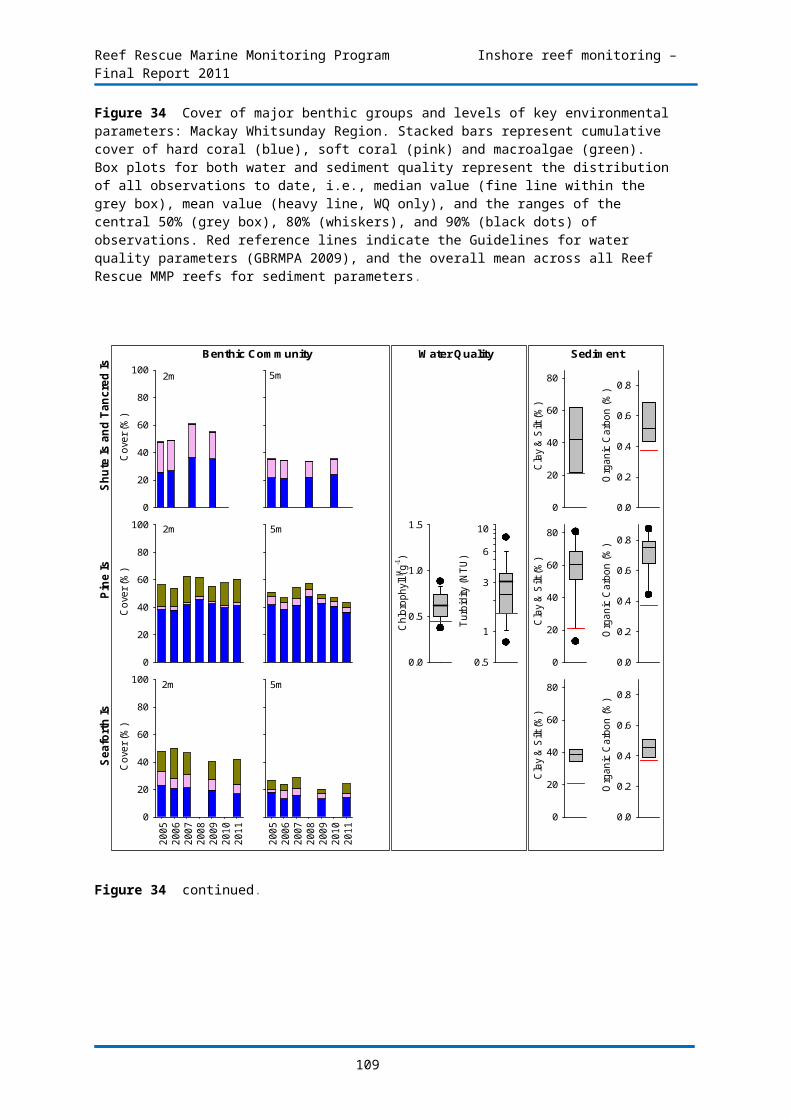
Reef Rescue Marine Monitoring Program Inshore reef monitoring – Final Report 2011
Table A1-6 ContinuedRe
gion
Catc
hmen
t
Reef
Dept
h
Acro
porid
ae
Agar
iciid
ae
Dend
roph
yllii
dae
Euph
yylli
dae
Favi
idae
Fung
iidae
Mer
ulin
idae
Mus
sida
e
Ocul
inid
ae
Pect
inid
ae
Poci
llopo
ridae
Porit
idae
Side
rast
reid
ae
Unkn
own
Mac
kay
Whi
tsun
day
Pros
erpi
ne
Double Cone Is 2 20.875 0.0625 1.4375 0 2.25 0.5 2.1875 0.75 2.3125 1.25 0.3125 5.1875 0.125 005 3.5 2.125 0.5 0.125 1.875 0.375 0.3125 2.25 1.5 1.1875 0.0625 50.5625 0 0
Daydream Is 2 16.125 0.125 0 0 0.25 0 0 0.375 0.0625 1.125 0.25 0.25 0 0.06255 16.75 0.125 0.1875 0 1 0.1875 0 0.3125 0 0.625 0.0625 1.6875 0 0
Dent Is 2 19.10312 1.438291
0.944222
0 1.129742
0.439873
0.441058
2.136076
1.0625 3.263823
0.0625 14.10754
0.3125 0.1253935 8.03901 4.39468
90.18789
30.44025
21.19263
50.69381
41.43867
91.13090
62.06918
73.51537
50.37617
911.7288
60.06289
30.18908
2Pine Is 2 10.89662 0.94339
60.0625 0.06289
30.44025
20.81603
80.81603
80.43789
320.4426
12.76061
30.12539
33.00982
70 0.50117
95 4.876179 2.564465
0.625786
0.562893
0.5625 2.063286
0.5625 2 9.847091
9.819969
0 3.003931
0 0.125
Seaforth Is 2 1.063679 6.375 0.5 0.0625 1.878538
0.5625 0.125 0.25 0.125 0.1875 0 5.875393
0 05 0.875 0.625 0.375 0 2.125 0.8125 0.0625 0.4375 0 0.25 0.0625 8.5 0 0
Fitz
roy
Fitz
roy
North Keppel Is 2 19.0625 0 0 0 0 1.6875 0.25 0 0 0 0.0625 0 0 05 10.625 0 0 0 0.0625 0.1875 0 0.25 0 0.125 0 0 0.5625 0
Barren Is 2 32.8125 0.1875 0.125 0 0.625 0 0.3125 0.1875 0 0 0.6875 0.125 0.375 05 59.1875 0 0 0 0 0 0 0 0 0 0 0 0 0
Humpy Is and Halfway Is 2 8.538766 0 0.0625 0 0.0625 0 0 0 0 0 0.125 0.0625 0 05 26.33848 0 0.125 0 0.3125 0 0 0.0625 0 0 0.06289
30.5 0 0
Pelican Is 2 0 0 0 0 0.1875 0 0 0 0 0 0 0.0625 0.25 05 0.125 0 2.93907
20 9.32075
50.0625 0.4375 0.1875 0.0625 0.25157
20.0625 4.62696
51.8125 0
Peak Is 2 0 0 0.0625 0 2.5 0 0 0.125 0 0.0625 0 0.1875 3 05 0.375 0 1.8125 0 5.1875 0 1.4375 0 0 0 0 2.375 10.375 0.4375
114

Reef Rescue Marine Monitoring Program Inshore reef monitoring – Final Report 2011
Table A1- 7 Composition of coral reef communities. Common soft coral families (% cover) 2011Re
gion
Catc
hmen
t
Reef
Dept
h
Alcy
oniid
ae
Bria
reid
ae
Clav
ular
iinae
Ellis
ellid
ae
Unkn
own
Gorg
onia
ns
Helio
porid
ae
Neph
thei
dae
Tubi
porid
ae
Xeni
idae
Wet
Tro
pics
Barro
nDa
intre e
Snapper Is North 2 0.54 2.58 8.92 0 0 0 0 0 05 0.06 0.13 0.19 0 0.06 0 0 0 0.50
Snapper Is South 2 2.13 0.46 0 0 0 1.58 0 0.13 05 0.63 9.54 0.06 0.38 0 3.20 0 0 0
John
ston
eRu
ssel
l-Mul
grav
e
Fitzroy Is West 2 25.83 0.06 0 0 0 0 0 0 05 28.28 0.06 0 0 0 0 0 0 0
Fitzroy Is East 2 1.31 0.69 1.19 0 0 0 0.06 0 0.505 4.01 3.07 0.31 0 0 0 0.25 0 0
High Is West 2 2.75 0.25 0 0 0 3.06 0 0 05 1.44 0.69 0 0 0.06 1.31 0 0 0
High Is East 2 2.81 5.19 0 0 0 0 0 0 05 0.25 5.06 0 0 0 0 0 0 0
Frankland Group West 2 8.88 0 7.51 0 0 0.31 0 0 05 0.63 0 0.13 0 0 0 0 0 0
Frankland Group East 2 0.13 0.06 0.25 0 0 0 0 0 05 3.63 0.06 0 0 0 0 0 0 0
Herb
ert T
ully North Barnard Group 2 0 0.31 0 0 0 0 0 0 0
5 0.31 1.00 0 0 0 0 0 0 0
Dunk Is North 2 0 0 0 0 0 0 0 0 05 0.06 0 0 0 0 0 0 0 0
Dunk Is South 2 0 0.19 0 0 0 0 0 0 05 0.06 1.88 0 0 0 0 0 0 0
Burd
ekin
Burd
ekin
Pelorus Is and Orpheus Is West
2 13.44 0.25 0.13 0 0 0 0.06 0 05 16.44 4.19 0.31 0.13 0.06 0 0.69 0 0
Orpheus Is East 2 1.31 0 0 0 0 0 0 0 05 0.06 0 0 0 0 0 0 0 0
Pandora Reef 2 0.31 0 0.06 0 0 0 0 0 05 0 0 0 0 0 0 0 0 0
Havannah Is 2 1.38 1.94 0 0 0 0 0 0 0.065 0.19 3.88 0 0 0 0 0 0 0
Geoffrey Bay 2 0.06 0 0 0 0 0 0 0 05 0.44 0.25 0 0 0 0 0 0 0
Middle reef 2 0.75 0 0 0 0 0 0 0 0
Table A1-7 Continued
115

Reef Rescue Marine Monitoring Program Inshore reef monitoring – Final Report 2011
Regi
on
Catc
hmen
t
Reef
Dept
h
Alcy
oniid
ae
Bria
reid
ae
Clav
ular
iinae
Ellis
ellid
ae
Unkn
own
Gorg
onia
ns
Helio
porid
ae
Neph
thei
dae
Tubi
porid
ae
Xeni
idae
Mac
kay
Whi
tsun
day
Pros
erpi
ne
Double Cone Is2 8.63 7.06 0 0 0 0 0 0.13 05 5.00 1.94 0 0 0 0 0.19 0.06 0
Hook Is2 8.69 0 0 0 0 0 0 0 05 2.94 0 0 0 0 0 0 0 0
Daydream Is2 5.27 4.46 0 0 0 0 0 0 05 2.01 0.31 0 0 0.06 0 0 0 0
Seaforth Is2 0.81 1.07 0 0 0 0 0 0 05 3.25 0.31 0 0 0 0 0 0 0
Pine Is2 5.82 1.00 0 0 0 0 0 0 05 1.38 0.06 0 0 0 0 0 0 0
Fitz
roy
Fitz
roy
North Keppel Is2 0 0 0 0 0 0 0 0 05 0 0 0 0 0 0 0 0 0
Barren Is2 0.75 0.19 0 0 0 0 0 0 9.755 0 0 0 0 0 0 0 0 0.94
Humpy Is and Halfway Is2 0.25 0 0 0 0 0 0 0 05 0.50 0 0 0 0 0 0 0 0
Pelican Is2 0 0 0 0 0 0 0 0 05 7.50 0 0 0.13 1.31 0 0 0.19 0.06
Peak Is2 0 0 0 0 0 0 0 0 05 1.38 0 0 0.06 1.19 0 0.19 0 0
116

Reef Rescue Marine Monitoring Program Inshore reef monitoring – Final Report 2011
Table A1- 8 Composition of coral reef communities. Common macroalgal genera and families (% cover) 2011. Presented are genera for which cover exceeded 0.5% on at least one reef, rare or unidentified genera are grouped to family. Taxa are arranged by family from left, to right by red algae (Rhodophyta), green algae (Chlorophyta) and brown algae (Phaeophyta).
Regi
on
Catc
hmen
t
Reef
Dept
h
Asparagopsis
Peyssonnelia
Hypnea
Calc
areo
us
Rhod
ophy
ta
Oth
er
Rhod
ophy
ta
Caulerpa
Halimeda
Othe
r Ch
loro
phyt
a
Dictyota
Lobophora
Padina
Sargassum
Othe
r Ph
aeop
hyta
Cyan
obac
teria
Unkn
own
Fam
ily
Wet
Tro
pics
Barro
nDa
intre
e Snapper Is North2 0.7503 0.1667 2.0003 3.0008 13.589 1.8768 0 0.1258 0.0833 0 0 0 0 0 0.2505
5 4.3141 0.1879 0 4.5633 19.205 0 0.0625 0.0625 0.0625 0 0 0 0.75 0 0
Snapper Is South 2 0 0.0419 0.125 1.2089 0.9589 0 0 0.2917 0 0 0 0 0 0 05 0 0.1254 0.8789 3.0128 4.388 0 0 0 0 0 0 0 0 0 0
John
ston
eRu
ssel
l-Mul
grav
e
Fitzroy Is West2 0 0 0 1.5625 0.1875
000000 0 0 0 0 0 0 0 0.0625 0
5 0 0 0.0625 1.127 0.187893082
0 0 0 0 0 0 0 0 0.125 0
Fitzroy Is East2 0 0.0625 0 0.6875 0.5000
000000 0 0 0 0 0 0 0 0.0625 0.0625
5 0 0 0 1.4379 0.375000000
0 0 0.0625 0 0 0 0 0 0.0625 0.1254
High Is West2 0 0 1.5095 2.3821 1.8825
133350 0 0 0 0 0 0 0 0 0
5 0 0 0 1.0024 0.878537736
0 0 0 0 0 0 0 0 0 0
High Is East2 0 0 0.125 1 0.3125
000000 0 0 0 0 0 0 0 0.125 0
5 0 0.125 0 1.6875 0.500000000
0 0 0 0 0 0 0 0 0.0625 0
Frankland Group West2 0 0.7512 0.3125 1.566 6.6981
132080 0 0.1875 0.0625 0 0 0 0.0625 0 0.1883
5 0 0.6891 0 3.6922 12.075158228
0 0 0.0625 0 0 0 0 0.0625 0 0
Frankland Group West2 0 0.0625 0 6.8125 1.3125
000000 0 0.25 0 0 11.875 0 0.0625 0 0.0625
5 0.1875 0.0625 0 2.5625 0.625000000
0 0 0.25 0 0 1.5625 0 0.25 0 0
Herb
ert
Tully
North Barnard Group2 0 0.1875 0 0.4375 0.125 0 0 3.0625 0.0625 0 0.125 0 0 0.5 05 0 0.4375 0 1.5 0.3125 0 0 0.0625 0.125 0 0 0 0 0.1875 0.0625
Dunk Is North2 0 0.0625 0 0.3125 0.4375 0 0 7.75 0.125 0 0 0 0 0.0625 05 0 0 0 0.3125 0.0625 0 0 0.0625 0 0.0629 0 0 0 0.1258 0
Dunk Is South2 0 0.1875 0 0.875 0.25 0 0 0.0625 0 0.0625 0 0.125 0 0.0625 0.18755 0 0.0625 0 2.4375 0.375 0 0 0 0 0 0 0 0 0 0.0625
Burd
ekin
Burd
ekin
Pelorus Is and Orpheus Is West
2 0 0 0 0.0625 0.0625 0 0 0 0 0 0 0 0 0 05 0 0 0 1.125 0.0625 0 0 0 0 0 0 0 0 0.25 0
Orpheus Is East2 0 0 0 0.3125 0.125 0 0 0 0 0 0 0 0 0.0625 05 0 0.0625 0 0.125 3.25 0 0 0 0 0 0 0 0 2.625 0.125
Pandora Reef2 0.1875 0 0 1.0625 4.0625 0 0 0.25 2.3125 2 2.125 0.1875 0.0625 0.25 1.93755 0.1875 0 0 0.125 0 0 0 0 0.5 1.4375 4.9375 0 0.125 0.1875 0.8125
Havannah Is2 0 0.0625 0 0.3125 0.1875 0 0 0 0 0.1875 0.0625 0 0.0625 0 0.1255 0 0.125 0 0.3125 0.4375 0 0 0 0 0.6875 0 0 0.0625 0.125 0.5
Geoffrey Bay2 0 0.5625 0 4.75 1.4375 0 0 0.0625 6.875 2.25 0 1.9375 0.8125 0.125 0.93755 0 0.6875 0 2.625 0.75 0 0 0.0625 2.6875 0.5625 0 0.9375 0.1875 0.3125 0.75
Middle Reef 5 0 0.187 0 0.875 0.187 0 0 0 0 0.375 0 0.062 0.25 0 0.062
117

Reef Rescue Marine Monitoring Program Inshore reef monitoring – Final Report 2011
Table A1-8 ContinuedRe
gion
Catc
hmen
t
Reef
Dept
h
Asparagopsis
Peyssonnelia
Hypnea
Calc
areo
us
Rhod
ophy
ta
Oth
er R
hodo
phyt
a
Caulerpa
Halimeda
Othe
r Chl
orop
hyta
Dictyota
Lobophora
Padina
Sargassum
Othe
r Pha
eoph
yta
Cyan
obac
teria
Unkn
own
Fam
ily
Mac
kay
Whi
tsun
day
Pros
erpi
ne
Double Cone Is2 0 0 0 0.375 0.0625 0 0 0 0 0 0 0 0 0 05 0 0 0 0.0625 0 0 0 0 0 0.0625 0 0 0 0.0625 0
Daydream Is2 0 0 0 0.25 0 0 0 0 0 1.1875 0 0 0.0625 0 0.06255 0 0 0 0.3125 0 0 0 0 0 0.5 0 0 0 0 0
Dent Is2 0 0 0 0.5012 0 0 0 0 0 0.0625 0 0 0 0 05 0 0 0 0.5641 0.3766 0 0 0 0 0 0 0.125 0 0 0
Seaforth Is2 0 0.1254 0 3.0035 1.0008 0 0.3125 0 0 6.8314 0 9.7079 0.1879 0 05 0 0.0625 0 2.3156 1.3137 0 0.75 0 0 2.2528 0 0.125 0.0629 0 0
Pine Is2 0 0 1.9375 2.0012 0.125 0 0.0625 0 0.2508 2.5012 0.25 9.6321 0.6887 0.1254 1.00165 0 0 0 1.125 0.1875 0 0.1875 0 0.25 3.3125 0 1.1875 0.1875 0.625 0.6875
Fitz
roy
Fitz
roy
North Keppel Is2 0 5.875 0 10.375 1.1875 0 0 0 0 7 0 0 0 0 05 0 2.625 0 5.125 0.9375 0 0 0 0 2.0625 0 0 0 0 0
Barren Is2 0 0 0 5.3125 0.9375 0 0 0 0 1.4375 0 0 0 0 05 0 0.375 0 6.75 0.9375 0 0 0 0 9 0 0 0 0 0
Humpy Is and Halfway Is2 0 2.504 0 2.3821 0.4375 0 0 0.1875 0 3.0111 0 0 0 0 05 0 4.9557 0 6.8983 0.2504 0 0 0 0 2.3168 0 0 0 0 0
Pelican Is2 0 0.0625 0 1.5 1.25 0 0 0.25 0 0.9375 0 0 1.125 0 1.56255 0 0.1875 0 2.0008 0.7504 0 0 0 0 0.0625 0 0 0 0 0.4375
Peak Is2 0 0.1875 0 1.5625 4.6875 0 0 0.0625 0 0.875 0 0.125 4 0 16.255 0 0.25 0 1.3125 3.4375 0 0 0 0 0 0 0 0 0 0.4375
118
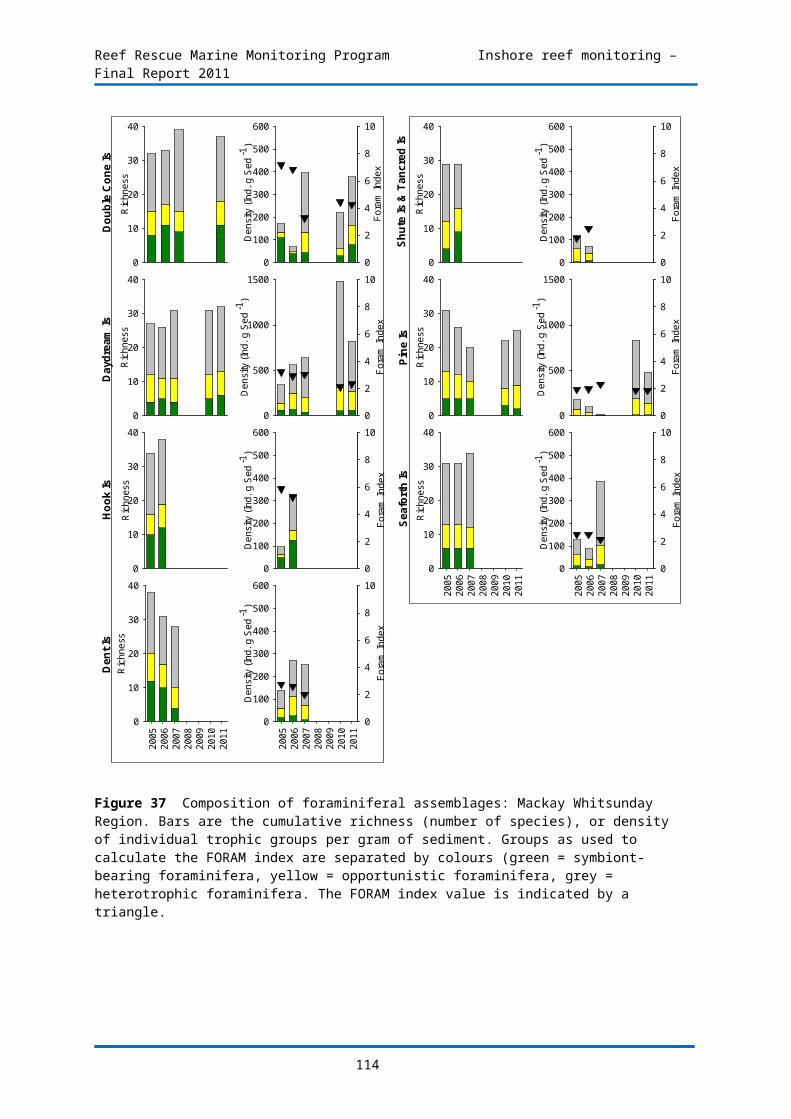
Reef Rescue Marine Monitoring Program Inshore reef monitoring – Final Report 2011
Table A1- 9 Composition of juvenile hard coral communities. Common families (count per 34m2) 2011Re
gion
Catc
hmen
t
Reef
Dept
h
Acro
porid
ae
Agar
iciid
ae
Astro
coen
iidae
Dend
roph
yllii
dae
Euph
yllid
ae
Favi
idae
Fung
iidae
Mer
ulin
idae
Mus
sida
e
Ocul
inid
ae
Pect
iniid
ae
Poci
llopo
ridae
Porit
idae
Side
rast
reid
ae
Wet
Tro
pics
Barro
nDa
intre
e Snapper Is North 2 19.33 0.33 0 0 0 1.00 16.00 0 0 2.00 0 0.67 2.00 05 7.50 1.50 0 0 0 14.50 5.50 0.50 0 2.00 0.50 0 2.00 0
Snapper Is South2 127.67 0.33 0 0.33 0 26.00 6.67 0 0.33 9.00 0 17.67 31.67 3.335 5.50 1.50 0 0.50 0 2.50 4.50 1.00 0.50 3.00 1.00 0 5.00 0
John
ston
eRu
ssel
l-Mul
grav
e
Fitzroy Is West 2 51.00 0.50 0 0 1.00 17.00 5.50 2.50 4.50 5.00 0.50 6.50 24.50 05 32.50 0 0 1.50 1.00 13.00 11.50 2.00 8.00 12.00 4.50 7.00 44.00 0
Fitzroy Is East 2 34.50 0 0 0 0 38.00 1.00 1.50 3.50 0 0 5.00 16.50 0.505 19.00 1.50 1.00 1.00 0 26.00 2.50 1.00 7.00 7.00 1.50 9.00 16.00 1.00
High Is West 2 15.50 1.00 0 2.00 0 7.50 2.50 0 2.00 0.50 0.50 2.00 6.00 05 16.50 3.00 0 4.50 0 9.00 1.50 0.50 4.00 6.50 0.50 1.50 15.50 0
High Is East 2 17.00 0 0 1.50 1.00 7.50 0 0 0.50 0.50 0 2.00 9.50 05 19.50 0 0 5.50 0.50 11.00 0 0 1.50 0.50 0.50 2.00 17.00 1.00
Frankland Group West 2 16.50 2.00 0 0.50 0 5.00 15.00 1.50 2.00 12.00 1.00 4.50 32.50 1.005 2.00 1.50 0 0 0 0.50 4.50 0 2.00 1.00 0.50 1.00 23.00 0
Frankland Group East 2 67.00 0 0 0 0 14.00 2.50 1.50 3.00 2.50 0 6.50 20.50 1.505 57.00 0 0.50 4.00 0.50 31.00 5.50 2.00 6.50 11.00 1.00 28.50 35.00 9.50
Herb
ert
Tully
North Banard Group 2 44.50 0 0 33.50 0 16.00 2.00 0 2.00 1.00 0.50 2.00 10.50 6.005 46.00 0.50 0 89.50 0 57.00 0.50 2.50 5.00 0.50 1.50 5.50 37.50 9.50
Dunk Is North 2 11.50 0 0 18.00 0 40.50 0 0.50 0 0.50 0 0.50 6.50 12.505 15.00 0 0 60.50 0 33.50 0.50 0.50 0.50 0 1.50 2.50 15.50 11.00
Dunk Is South 2 3.50 0.50 0 3.00 0 42.50 0 0 2.00 3.50 0.50 0 6.50 2.505 18.00 0.50 0 7.00 0.50 23.00 1.00 2.00 3.50 4.00 5.00 0 20.50 1.50
Burd
ekin
Burd
ekin
Pelorus Is and Orpheus Is West
2 14.00 1.00 0 1.50 0 24.50 2.00 0 1.00 2.50 5.50 7.00 3.50 05 20 2.50 0.50 4.50 0.50 34.00 1.50 1.50 8.00 4.50 18.50 3.00 10 0.50
Orpheus Is East 2 8.50 0 0 0 0 14.00 0 0 1.00 0 0.50 0 3.50 05 12.50 0 0 0 0 14.00 0 0 2.00 0 0 1.00 4.00 0
Pandora Reef 2 2.00 0 0 0.50 0 1.00 0.50 0 0.50 0.50 0 0.50 0.50 05 2.00 0.50 0 2.50 0 6.00 2.00 0.50 0 3.50 0 0 0.50 0.50
Havannah Is 2 46.50 0.50 0 2.50 0 16.50 8.00 2.00 3.00 7.50 0 2.50 19.50 0.505 9.00 7.00 1.50 6.00 3.50 26.50 31.50 5.50 13.00 28.50 3.00 1.50 33.50 0
Geoffrey Bay 2 38.00 1.50 0 2.50 0 38.00 7.00 2.50 2.50 1.00 0 0 17.00 1.505 18.00 0.50 0 14.00 0 83.50 5.00 2.50 4.50 3.50 3.50 1.00 22.50 0.50
Middle Reef 5 11.50 4.50 0 5.50 0 20 3.50 1.00 2.50 2.50 2.00 0.50 8.00 0
Table A1-9 Continued
119

Reef Rescue Marine Monitoring Program Inshore reef monitoring – Final Report 2011
Regi
on
Catc
hmen
t
Reef
Dept
h
Acro
porid
ae
Agar
iciid
ae
Astro
coen
iidae
Dend
roph
yllii
dae
Euph
yllid
ae
Favi
idae
Fung
iidae
Mer
ulin
idae
Mus
sida
e
Ocul
inid
ae
Pect
iniid
ae
Poci
llopo
ridae
Porit
idae
Side
rast
reid
ae
Mac
kay
Whi
tsun
day
Pros
erpi
ne
Double Cone Is 2 47.50 0 0.50 5.00 1.00 13.50 2.50 5.00 4.00 4.50 3.00 3.50 20.50 05 5.00 3.00 0 0 2.00 10 2.00 2.00 3.50 3.50 4.50 0.50 12.00 0
Daydream Is 2 23.50 0 0 1.50 1.00 14.50 11.50 3.00 12.00 1.00 6.00 1.00 7.00 05 14.50 2.00 0 4.00 0 18.00 1.50 4.00 12.50 1.00 12.00 2.50 6.50 0.50
Dent Is 2 20 0.50 0 5.50 1.00 3.50 7.50 1.00 3.50 3.00 3.50 1.50 12.50 05 16.50 2.50 0 40 1.50 10 3.50 0.50 9.00 0.50 5.00 1.50 8.00 1.00
Seaforth Is 2 32.00 0.50 2.00 0 1.00 7.00 6.50 2.00 8.00 4.50 3.00 2.00 24.00 05 15.50 4.50 0 11.00 2.50 19.50 6.50 1.50 7.00 1.00 13.00 0.50 12.00 0
Pine Is 2 31.00 5.00 0 7.00 1.50 29.00 8.00 7.50 17.00 2.50 5.50 1.50 27.00 2.005 15.00 9.50 0.50 5.50 3.50 44.50 5.00 3.00 24.50 4.00 7.00 0 17.50 0
Fitz
roy
Fitz
roy
North Keppel Is 2 22.50 0 0 0 0 1.50 111.00 0 0 0 0 2.00 0.50 0.505 9.00 0 0 0 0 2.50 62.50 1.00 1.00 0 1.00 0 0.50 1.00
Barren Is 2 60 0 0 27.50 0 39.00 0 0 0.50 0 0 24.50 2.00 1.005 3.00 0 0 0 0 0 0 0 0 0 0 4.00 0 0
Humpy Is and Halfway Is 2 7.00 0 0 2.00 0 14.00 4.50 0.50 1.00 0 0 6.00 8.50 0.505 5.50 0 0 6.50 0 15.50 5.00 0 0 0 0 1.00 8.00 1.50
Pelican Is 2 0 0 0 0 0 3.00 0 0 0 0 0 0 5.50 0.505 1.50 0 0 13.50 0 28.50 0 0 7.50 0 0.50 0 27.50 13.00
Peak Is 2 0 0 0 1.00 0 2.00 0 0 1.00 0 0 0 3.00 6.005 0.50 0 0 33.00 0 11.50 0 0.50 2.50 0 1.00 0 15.50 3.00
120

Reef Rescue Marine Monitoring Program Inshore reef monitoring – Final Report 2011
Table A1- 10 Composition of juvenile soft coral communities. Common families (count per 34m2) 2010
Regi
on
Catc
men
t
Reef
Dept
h
Alcy
oniid
ae
Bria
reid
ae
Clav
ular
iidae
Neph
thei
dae
Xeni
idae
Wet Tropics
Barron Daintree
Snapper Is North
2 0 0 0 0 05 1 1 0 0 0
Snapper Is South
2 9.3 0 0 0 05 0 0 0 0 0
Johnstone
Russell-Mulgrave
Fitzroy Is West
2 80.5
0 0 0.5 05 78 0.5 0 0 0
Fitzroy Is East
2 41.5
3.5 8 9 325 36 4.5 1 1.5 0
High Is West 2 12 0.5 0 0 05 7 2 0 0 0
High Is East 2 40.5
4 1 1.5 05 5.5 7.5 0.5 0 0
Frankland Group West
2 7 0 10.5
0 0.55 3.5 0 2 0 0
Frankland Group East
2 5 0 1.5 1 05 33 0.5 2 0 1.5
Herbert
Tully
North Barnard Group
2 7 0.5 0 0 05 13 0.5 0 3 0
Dunk Is North
2 1.5 0 0 0 05 3 0 0 0 3
Dunk Is South
2 0 1 0 0 05 3.5 3 0 0 0
Burdekin Burdekin
Pelorus Is and Orpheus Is West
2 59.5
2 4 6 25 71.
52 1.5 174
.50
Orpheus Is East
2 3 0 0 0 05 3.5 0.5 0 0 0
Pandora 2 2.5 0 0 0 0.55 0 0 0 0 1.5
Havannah Is 2 7.5 2 0 1.5 25 11 14.
50 1.5 1
Geoffrey Bay
2 2.5 1 0 0 05 12 0 0 0 0
Middle Reef 5 12 0 0 0 0
Mackay Whitsundays Proserpine
Double Cone Is
2 35 5 0 0 1.55 34.
54 0 1 0
Daydream Is 2 75.5
0.5 0 1 05 51.
50 0 0 0
Dent Is 2 27 4 0 0 65 39.
53 0 0 0
Seaforth Is 2 8 2 0 0 15 18.
52 0 0 0
Pine Is 2 23.5
2.5 0 1 35 16 2.5 0 0 4.5
Fitzroy Fitzroy
North Keppel Is
2 4.5 0 0 2 05 1.5 0 0 0 0
Barren Is 2 1.5 0 0 0 18305 0 0 0 0 228.5Humpy Is
and Halfway Is
2 3 0 0 0 0.55 3.5 0 0 0 0
Pelican Is 2 0 0 0 0 05 31.
50.5 0 15.
50
Peak Is2 1 0 0 0 05 29 0 0.5 10 3.5
121

Reef Rescue Marine Monitoring Program Inshore reef monitoring – Final Report 2011
Table A1- 11 FORAM index baseline values. Values represent the average and standard deviation of the FORAM index for core reefs sampled more than once over the period 2005-2007.
Region ReefBaseline FORAM index
Standard Deviation of
baseline
Wet Tropics
Fitzroy Is West 7.26 0.87High Is West 6.63 0.53Frankland Islands West 5.74 2.02Dunk Is North 5.70 0.38
BurdekinPelorus and Orpheus Islands West 7.62 1.24Pandora 8.47 0.63Geoffrey Bay 4.70 1.10
Proserpine
Double Cone Is 5.77 2.15Daydream Is 3.06 0.15Pine Is 2.07 0.21
FitzroyBarren IsHumpy and Halfway Islands 6.63 0.68Pelican Is 5.98 1.75
Table A1- 12 Percent cover of Silt for reefs in the Mackay Whitsunday region. Values are the average cover from 5m transects in each year.
Reef 2005 2006 2007 2008 2009 2010 2011Daydream Is 12.1 8.8 12.8 20.6 23.3 26.3 38.8Dent Is 6.1 11.0 6.3 8.3 13.9Double Cone Is 0.8 1.1 0.6 2.1 6.1 5.0 2.9Hook Is 9.8 8.6 9.5 16.7Pine Is 10.9 11.3 4.6 7.3 31.9 18.1 17.4Seaforth Is 24.0 37.8 30.8 42.3 45.9
122

Reef Rescue Marine Monitoring Program Inshore reef monitoring – Final Report 2011
Appendix 2: QAQC Information
Validation of benthic community assessmentsPhoto point intercept transects. The QA/QC for the estimation of percent cover of benthic communities has two components. The sampling strategy that uses permanently marked transect’s ensures estimates are derived from the same area of substratum each year to minimise possible sampling error. The second component is to ensure the consistency of identification of community components from digital photo images, and to achieve this, all points are double-checked by a single observer on completion of analysis each year. This double-checking has now been done for all digital still photograph images in the database reported in this document. All hard corals, soft corals and macroalgae were identified to at least genus level where image quality allowed. Other benthic groups were also checked and consistency in differentiation achieved.
Juvenile coral belt transects. Three observers collected juvenile coral count data in 2011. Data from Snapper Is was supplied by Sea Research. The Sea Research observer, Tony Ayling, is the most experienced individual in Australia in surveying the benthic communities of inshore coral reefs. Like the AIMS observers, his taxonomic skills are complete at genus level and he used the same field protocols, pre-printed datasheets and data entry programs as AIMS observers. Prior to commencement of surveys observer standardisation for Tony Ayling included detailed discussion and demonstration of methodologies with the AIMS team. While we are confident that limited bias was introduced as a result of his participation as the focus of the program is for temporal comparisons any bias between Tony Ayling and AIMS observers will not manifest in temporal comparisons at Snapper Is. All other reefs were surveyed by experienced AIMS staff that have previously undergone training in the technique sufficient to ensure its standardised application. To ensure no drift occurs between observers informal comparative counts were undertaken along short sections of transect and count and size class information compared and discrepancies discussed with direct reference to the colony in question. As most dives included two of the experienced aims staff uncertainties in identification were typically discussed in situ or that evening with reference to photographs taken of problem individuals. It must be acknowledged however that for some of the smallest size class <2cm identification to genus is impossible in the field, though for the most part this is the case for relatively rare taxa for which reference to nearby larger individuals cannot be made.
Settlement plate spat counts. It is the stated QA/QC aim that hard coral recruits (spat) on retrieved settlement tiles were to be counted and identified using a stereo dissecting microscope with identification to the highest practicable taxonomic resolution and between observer errors (spat overlooked) should not exceed 10%. Identification of the various taxa of spat was achieved on the basis of experience and reference to a photographic archive spat. To examine the percentage of spat overlooked a second observer examined 112 tiles selected at random from 5 different reefs. As spat are marked during counting to avoid double counts, spat missed by the first observer are easily identified (not marked). This comparison revealed 711 missed spat compared to 8686 recorded, an error rate of 8.2%. This is within the stated QA/QC goal of 10%.
123
Reef Rescue Marine Monitoring Program Inshore reef monitoring – Final Report 2011
Appendix 3: Analysis of disease as a function of river discharge.
Coral diseases are an important agent for coral mortality worldwide (Harvell et al. 2007). On the GBR, seven coral diseases are currently recognized to affect corals of the GBR (Willis et al. 2004). While the link between coral disease and anthropogenic stress is poorly understood, recent research suggests that coral disease is facilitated by a decrease in water quality (Bruno et al. 2003, Haapkylä et al. 2011). Monitoring of coral condition as part of the MMP over the period 2005 to 2011 covered a period of substantial inter-annual variability in runoff and increased levels of disease were observed on a number of the surveys inshore reefs (see main report). We analysed the available data to determine whether there is a relationship between the observed levels of disease in GBR inshore coral communities and the variability in river runoff entering the inshore lagoon.
Coral data used include estimates of coral cover derived from photo point transects. Coral disease is taken from scuba search transects. The disease data included in the analyses is the sum of incidences of all identifies disease cases and of “unknown” causes of ongoing mortality at each site at the time of survey. River discharge data are the deviation of annual flow from the baseline median flows (Table 5). The relationship between discharge and coral disease was modelled along with covariates for coral cover and depth.
Candidate linear mixed effects models (LMM, Pinheiro and Bates 2000) relating the total number of disease-affected colonies (normalized via log+1 transformation) to discharge with coral cover as a covariate were fitted (maximum likelihood) incorporating all additive and multiplicative fixed effects combinations of coral cover (%) and relative discharge (transformed to a base two logarithmic scale and modelled as natural splines with 3 degrees of freedom). Catchment, and reef by depth combinations within catchment, were also included as random effects to account for spatial variation, pseudoreplication and temporal autocorrelation arising from multiple and repeated observations from the same catchments/locations. For each catchment, the most parsimonious model was selected by sequentially assessing the influence of interactions, non-linearity and the covariates on the basis of both likelihood ratio tests (P > 0·05; Pinheiro and Bates 2000) and Akaike’s information criterion (lowest AIC) and removing covariates accordingly. Selected models (refit via Restricted Maximum Likelihood - REML) were then used to derive predicted partial effects (and associated 95% confidence intervals) of discharge on the total number of disease-affected colonies. All models were fitted in R (R Development Core Team, 2011) using the lme function (nlme package: Pinheiro et al. 2011.
124

Reef Rescue Marine Monitoring Program Inshore reef monitoring – Final Report 2011
a) All catchments
25 50 100
200
400
800
Annual river discharge relative to median (%)
Dis
ease
d co
loni
esm
ean
ha1
0
500
1000
1500
2000
b) Johnstone & Tully
25 50 100
200
400
800
0
200
400
600
800
1000
c) Burdekin
25 50 100
200
400
800
0
200
400
600
800
1000
d) Whitsunday
25 50 100
200
400
800
0
500
1000
1500
2000
e) Fitzroy
25 50 100
200
400
800
0
500
1000
1500
2000
2500
3000
Figure A3- 1 Response of coral disease to runoff. Plotted are the model predicted responses (solid lines) with 95% confidence intervals (broken lines) for a) all catchments and b)-e) individual catchments. Where blue and red predictions are included, the level of coral cover in that region influenced the disease response. Black fits represent the response at mean levels of cover, blue and red fits are the estimates for high and low (mean cover +/- 2 times the se of the mean) levels of cover respectively.
125

Reef Rescue Marine Monitoring Program Inshore reef monitoring – Final Report 2011
Appendix 4: Details of statistical analysis of potential drivers of hard coral settlement 2006-2010
In addition to the routine reporting of the temporal trends of coral settlement (see section 3.1.4), the settlement data were analysed to determine the effects of selected environmental variables that are most likely to influence the recruitment of coral spat. Due to the dominance of spat of the Family Acroporidae on settlement tiles, the statistical analyses focussed on the distribution and patterns of abundance of Acroporidae spat only. Data used in the model:Response variable: Spat number: the mean number of Acroporidae spat per surface (note that this unit is
different to the spat per tile data reported in the main text and in Figure 11) was calculated for each of the 12 core reefs where settlement tiles were deployed (called hereafter ”settlement reefs”), per year (see also sections 2.2.2 and 3.1.4).
Covariates: Adult Acroporidae cover (as a proxy for the local broodstock= source of spat): the mean
percent cover per settlement reef, per year (from the photo-transect analyses; see also sections 2.2.2 and 3.1.4)
Secchi depth: from satellite data derived from colour images from a MODIS spectroradiometer, processed with a GBR-validated algorithm at the University of Queensland. Monthly means were estimated from Loess-smoothed, seasonally de-trended time series of satellite data available during settlement tile deployments (October – January) from satellite cells selected as close as possible to each settlement reef (note that other de-trending and aggregation intervals were also explored, however the methods described ultimately yielded the strongest patterns)
Turbidity and chlorophyll fluorescence: data collected by autonomous data loggers deployed at each settlement reef (see also sections 2.5 and 3.1.2) were similarly seasonally de-trended and smoothed (to reduce noise) before weekly means were calculated for the duration of tile deployments (October – January).
Sediment grain size and quality (content of organic and inorganic carbon, and nitrogen): from sediment quality analyses at all settlement reefs (see also sections 2.3 and 3.1.1). The four measurements were highly correlated to one another and, consequently, were combined using a principal components analysis (Legendre and Legendre, 1998) and the first principle component scores for each reef and year was used as the environmental covariates representing sediment quality.
Year of settlement sampling
Specific spatial and temporal patterns of Acroporidae spat abundances on settlement tiles were investigated using a linear mixed effects model (LMM, Pinheiro and Bates 2000). Candidate models (fitted via maximum likelihood) incorporated additive fixed effects combinations of the covariates described above. To consider the temporal trends in the covariates they were alternatively incorporated as natural splines (three degrees of freedom) or as up to third order polynomials. Furthermore, to improve normality and reduce heteroskedasticity, some variables (including the response) were logarithmically transformed. Individual reefs were also included as random effects to account for spatial variation, pseudoreplication and temporal autocorrelation arising from multiple and repeated observations from the same reefs. The most parsimonious model was selected by sequentially assessing the tortuosity and effects of each covariate on the basis of both likelihood ratio tests (P > 0·05; Pinheiro and Bates (2000)) and Akaike’s information criterion (lowest AIC) and subsequently retaining or removing covariates accordingly. All models were fitted in R (R Development Core Team, 2011) using the lme function (nlme package: Pinheiro et al. (2011)).
126

Reef Rescue Marine Monitoring Program Inshore reef monitoring – Final Report 2011
The selected model (refit via Restricted Maximum Likelihood - REML) related Acroporidae spat abundances on settlement tiles to (i) the sampling year, (ii) the mean abundance of adult Acroporidae (log+1) (both modelled as natural splines with three degrees of freedom), (iii) satellite Secchi depth (third order polynomal of log transformed data) and (iv) the first principal component of sediment quality data. The predicted partial effects (and associated 95% confidence intervals) of each of the major covariates on Acroporidae spat settlement are presented in (Figure A4-1 a-d). Although not included as a covariate in the model, the total annual river discharge over all catchments (seasonally de-trended) was included to highlight that decreases in spat abundance correspond to increasing discharge levels over six years of sampling (Figure A4-1a). A detailed description and discussion of the results is in section 3.1.4.
Figure A4- 1 Environmental drivers of hard coral settlement. Partial effects plots for the number of Acroporidae spat settling to tiles for (a) sampling years (included is the total river discharge to highlight the correspondence of the decline in settlement with the increasing river discharge, (b) cover of Acroporidae, (c) satellite-derived Secchi depth, and (d) sediment composition.
dc
ba
127

Reef Rescue Marine Monitoring Program Inshore reef monitoring – Final Report 2011
Appendix 5: List of Scientific Publications arising from the Programme 2011
Thompson A, Davidson J, Uthicke S, Schaffelke B, Patel F, Sweatman H (2011) Reef Rescue Marine Monitoring Program. Report of AIMS Activities – Inshore coral reef monitoring 2010. Report for Reef and Rainforest Research Centre. Australian Institute of Marine Science, Townsville.
Fabricius KE, Cooper TF, Humphrey C, Uthicke S, De’ath G, Davidson J, LeGrand H, Thompson A, Schaffelke B (in press) A bioindicator system for water quality on inshore coral reefs of the Great Barrier Reef. Marine Pollution Bulletin. DOI: 10.1016/j.marpolbul.2011.09.004
Conference presentations:
Oral presentation entitled “A report card for monitoring the condition of coral communities over steep environmental gradients” by Angus Thompson*, Britta Schaffelke and Johnston Davidson. Forum: Australian Marine Science Association Conference, Perth, July 2011.
Oral presentation entitled: “The influence of extreme events on coral community dynamics on turbid nearshore reefs of the GBR” by Angus Thompson*, Paul Costello, Johnston Davidson and Britta Schaffelke. Australian Coral Reef Society Conference, Twin Waters, August 2011
Oral presentation entitled “Checking the pulse: coral recruitment dynamics at inshore reefs on the GBR” by Johnston Davidson*, Paul Costello, Murray Logan, Britta Schaffelke and Angus Thompson. Australian Coral Reef Society Conference, Twin Waters, August 2011
Oral presentation entitled: “Water quality monitoring in the inshore GBR: a long-term view after a summer of extremes” by Britta Schaffelke*, Richard Brinkman, Irena Zagorskis, John Carleton and Michelle Devlin. Australian Coral Reef Society Conference, Twin Waters, August 2011
128