reel authority: relational adaptation in the movie...
TRANSCRIPT

Reel Authority: Relational Adaptation in the Movie Industry
Daniel Barron Northwestern University
Robert Gibbons Massachusetts Institute of Technology
Ricard Gil Johns Hopkins University
Kevin J. Murphy University of Southern California
April 3, 2015
Abstract
Formal revenue-sharing contacts between movie distributors and exhibitors are typically signed well before the movie’s release. These contracts convey critical decision rights to the exhibitor (e.g., the decision of whether to show the movie, or in what time slots), but their formal sharing rates are often renegotiated after the movie has finished its run. This paper explores the incidence, magnitude, and determinants of such ex post renegotiations in distributor-exhibitor contracts. Our theoretical and empirical analyses suggest that (1) the reason why renegotiations occur is adaptation after uncertainty is resolved, (2) the process through which such renegotiations occur is relational contracting supported by formal contracting, and (3) the determinants of such renegotiations are (a) the opportunity costs of the exhibitor and (b) the exhibitor’s exercise of “reel authority.” Our empirical setting offers several advantages for studying relational contracts. First, we observe not only the formal and informal payments (i.e., the contracted and renegotiated sharing rates) but also the decisions these payments are meant to influence (i.e., the exhibitor’s decisions about whether and how often to show a movie). In addition, we observe proxies for the exhibitor’s opportunity costs, so we can study not only whether the frequency and magnitude of renegotiations are related to opportunity costs but also whether the exhibitor’s decisions respond to the combination of opportunity costs and relational renegotiations. Key words: adaptation, renegotiation, relational contracts, revenue sharing, movie contracts.
* We are very grateful for comments from Jon Levin, Rocco Macchiavello, Julie Mortimer, and seminar
participants at the AEA, ISNIE, and the MIT Organizational Economics Lunch, and for financial support from MIT Sloan’s Program on Innovation in Markets and Organizations. The usual disclaimer applies.

APRIL 2015 PAGE 1
BARRON, GIBBONS, GIL, AND MURPHY: REEL AUTHORITY
Reel Authority: Relational Adaptation in the Movie Industry
by Daniel Barron, Robert Gibbons, Ricard Gil, and Kevin J. Murphy
1. Introduction
Adaptation to changing circumstances is a fundamental goal of economic systems. This
issue has long been explored in the context of markets—e.g., Arrow (1953), Debreu (1959),
and Grossman (1981)—but surfaces as importantly in other settings. For example, Barnard
(1938: 6) argued that “The survival of an organization depends upon the maintenance of an
equilibrium of complex character in a continuously fluctuating environment.” We see
Barnard’s observation applying not only within firms but also to contracts and other managed
transactions between them.
In a one-shot setting with non-contractible decisions, the parties with decision rights
play a Nash equilibrium after uncertainty has been resolved, choosing decisions that
maximize their respective spot payoffs (and typically depend on the realized state of the
world). Such spot adaptation is often not efficient (i.e., it does not maximize the sum of the
parties’ payoffs). In this spirit, Williamson (2000: 605) summarized decades of informal
theory by arguing that “maladaptation in the contract execution interval is the principal
source of inefficiency.” This inefficiency under spot adaptation motivates the parties to
explore whether relational contracts (i.e., self-enforcing agreements governed by the parties’
concerns about the future of their relationship) can induce state-dependent decision-making
that will improve their expected payoffs.
The fact that the parties utilize relational contracts does not mean that they will eschew
formal contracts. To the contrary, Klein (2000: 68) argued that, even though many business
relationships are self-enforced (Macaulay, 1963), “transactors are not indifferent regarding
the contract terms they choose to govern their self-enforcing relationships.” That is, parties to
relational contracts often sign formal contracts that both limit the parties’ reneging
temptations in some states of the world and exacerbate these temptations in others.1
1 See Klein and Murphy (1988), Klein (1996, 2000) and Williamson (1971, 1975, 1991) for more.

APRIL 2015 PAGE 2
BARRON, GIBBONS, GIL, AND MURPHY: REEL AUTHORITY
This paper explores a unique opportunity to study relational adaptation: contracts
between distributors and exhibitors in the movie industry. After a movie is produced, it is
typically distributed to theaters before its release to other channels. When the distributor (i.e.,
the owner of the movie) and the exhibitor (i.e., the owner of one or more theaters) are
separate firms, they often sign a formal contract to share the box-office revenues generated
by the movie. These formal contracts are usually signed well before the movie’s release, so
they specify the weekly sharing rates if the movie is shown, but they also leave room for
adaptation as uncertainty is resolved. In particular, the contracts do not require the exhibitor
to show the movie in any given week, nor do they dictate how many times a day or in what
time slots the movie is shown. Therefore, once the movie (or, since there may be multiple
copies of the same movie, the “reel”) arrives at a theater, the “reel authority” rests solely with
the exhibitor, not with the distributor.2
Many factors can influence how the parties would like the exhibitor to exercise this
authority. For example, the movie in question may under-perform, while another movie
arriving later may over-perform, creating an opportunity cost for the exhibitor: she may
prefer to show the movie in question fewer times per day, or in less favorable time slots, or
not at all. At the same time, the distributor may prefer that the movie in question be shown on
many screens and in many time slots—say, because of the merchandizing benefits that accrue
to the distributor.
What is striking about the renegotiation of the formal contracts is therefore not whether
it occurs but rather when: the formal sharing rates are often renegotiated after the movie has
finished its run.3 The renegotiation thus occurs weeks after the exhibitor has taken any
adaptation decisions—such as foregoing the temptation to show the movie in question on
fewer screens or in fewer time slots, to accommodate another movie. The renegotiation is
therefore not a simultaneous quid pro quo—such as an exhibitor agreeing to show the movie
in question on its original screens and in its original time slots, in exchange for an immediate
payment from the distributor.
2 See Hanssen (2002), Filson et al. (2005), and Gil and Lafontaine (2012) for further details. 3 See Filson et al. (2005) for the United States and Gil (2013) for Spain.

APRIL 2015 PAGE 3
BARRON, GIBBONS, GIL, AND MURPHY: REEL AUTHORITY
This paper explores the incidence, magnitude, and determinants of ex post
renegotiations in distributor-exhibitor contracts. Our theoretical and empirical analyses
suggest that (1) the reason why renegotiations occur is adaptation after uncertainty is
resolved, (2) the process through which such renegotiations occur is relational contracting
supported by formal contracting, and (3) the determinants of such renegotiations are (a) the
opportunity costs of the exhibitor and (b) the exhibitor’s exercise of reel authority. In brief,
the parties use relational renegotiation to approximate efficient adaptation.
Our empirical setting is very attractive for exploring relational adaptation in contracts
between firms. In other settings, relational payments are based on non-contractible variables
that are observed by the contracting parties but not by the courts (or empirical researchers).
In our setting, in contrast, we observe not only the formal and informal payments (i.e., the
contracted and renegotiated sharing rates) but also the decisions the renegotiations payments
are meant to influence (i.e., the exhibitor’s decisions about whether and to show a movie and,
if so, whether to show it on a dedicated or a shared screen). In addition, we observe proxies
for the exhibitor’s opportunity costs, which we believe are known or estimated by the
exhibitor before making decisions and observed or estimated by the distributor either
contemporaneously or soon thereafter. We can therefore study not only whether the
frequency and magnitude of renegotiations are related to opportunity costs but also whether
the exhibitor’s decisions respond to the combination of opportunity costs and relational
renegotiations.
1.1. Overview
We explore relational renegotiations using weekly data on contract terms and box-
office outcomes from one exhibitor managing 26 movie theaters in Spain. Specifically, we
combine Gil’s (2013) data on contracted and renegotiated revenue shares with detailed
screen-level box-office data during 18 months between January 2001 and July 2002. These
data allow us to analyze both richer dependent variables and richer independent variables
than in previous work. For example, our dependent variables include two types of exhibitor
decisions: not only the decision to show a reel for an additional week, but also the decision to
show the reel on a dedicated or a shared screen. Furthermore, our independent variables
include both the “best dropped” reel (that is, the reel with the highest revenue that was

APRIL 2015 PAGE 4
BARRON, GIBBONS, GIL, AND MURPHY: REEL AUTHORITY
dropped after the prior week) and the “best shared” reel (that is, the reel with the highest
revenue that shares a screen that week with other reels in the same theater).
To motivate our subsequent theory and testing, we first document that, in our data, ex
post renegotiations (if they exist) always favor the exhibitor: that is, the distributor gives the
exhibitor a larger share of the box office revenues than specified under the formal contract—
a renegotiation we henceforth call a “discount.” We then present evidence suggesting that
both the probability of renegotiation and the magnitude of the negotiated discount are related
to the exhibitor’s decisions whether to continue showing a particular reel for an additional
week and, if so, whether to show a particular reel on its own screen (rather than sharing time
slots on that screen with a reel of another movie).
To analyze the incidence, magnitude, and determinants of relational renegotiations, we
first develop two simple models that motivate our empirical approach. The first is a
relational-contract model in which a single distributor and a single exhibitor sign a formal
revenue-sharing contract before the movie has been released, when there is uncertainty about
the exhibitor’s opportunity cost (e.g., the box-office revenues of an alternative movie). The
second is a multi-unit auction model in which multiple distributors compete for a limited
number of screens and time slots. From the first model, we demonstrate that that relational
renegotiation of formal sharing rates can achieve efficient adaptation: the ex post discounts
reward the exhibitor for showing the distributor’s movie longer (or in more time slots) than
would have been induced by the formal contract alone. From the second model, we establish
that, to achieve efficient adaptation, the ex post discounts should be positively related to the
anticipated box-office revenues of the best-dropped and best-shared reels.
Finally, we estimate the probability of renegotiation and the magnitude of the
renegotiated discount as a function of the exhibitor’s opportunity cost (the revenues of the
best dropped and best shared reels, measured relative to the revenues of the reel subject to
renegotiation). We control for potential differences in bargaining power across theaters using
theater fixed effects, and for distributor- or movie-specific factors affecting renegotiations
across all theaters in a given week using movie-week fixed effects. Consistent with our
hypotheses, we find evidence that both the incidence and magnitude of relational

APRIL 2015 PAGE 5
BARRON, GIBBONS, GIL, AND MURPHY: REEL AUTHORITY
renegotiations are positively and significantly related to our proxies for exhibitor opportunity
costs.
We conclude Section 1 with a literature review. Section 2 then describes the
institutional setting and data used in our analysis and offers evidence that future renegotiation
outcomes are related to continuation decisions over whether to continue showing a reel and,
if so, whether to show it on a dedicated screen. Section 3 develops the relational-contract
model (where a single distributor contracts with a single exhibitor) and the multi-unit auction
model (where multiple distributors compete for screens and time slots). Section 4 then
estimates the frequency and magnitude of renegotiated discounts as a function of the
exhibitor’s opportunity cost (the revenues of the best dropped and best shared reels). Section
5 concludes.
1.2. Literature
Our paper contributes to several literatures. First, we join those studying formal
distributor-exhibitor contracts in the movie industry, especially the ex post renegotiation of
these contracts. Regarding formal contracts, Hanssen (2002) studies the transition from flat-
fee to revenue-sharing contracts in movies due to the introduction of sound, and Raut et al
(1998) argue that revenue-sharing contracts may deliver superior performance at cheaper
administrative cost.4 More recently, three papers offer different explanations for the choice of
revenue-sharing formal contracts, and all explore ex post renegotiations of these contracts:
Filson, Switzer, and Besocke (2005) interpret two-sided ex-post renegotiation of formal
revenue-sharing terms as achieving ex post settling up; Gil and Lafontaine (2012) argue that
formal revenue-sharing contracts help achieve state-dependent pricing, thereby reducing the
need for and expected cost of renegotiation; and Gil (2013) views ex post renegotiations as
ex post settling up for movies that do worse than expected. Our paper joins these three in
exploring the use of revenue-sharing contracts and ex post renegotiation. Building on these
papers, we then develop and exploit additional data and theory regarding both the exhibitor’s
opportunity cost and the exhibitor’s exercise of reel authority (e.g., moving a reel from a
dedicated to a shared screen). 4 Dana and Spier (2001), Cachon and Lariviere (2005) and Mortimer (2008) study formal revenue-sharing contracts in the video retail industry and show that revenue-sharing contracts are valuable when demand is uncertain. They do not document the incidence of ex post renegotiation in distribution contracts to video stores.

APRIL 2015 PAGE 6
BARRON, GIBBONS, GIL, AND MURPHY: REEL AUTHORITY
Other papers do study an exhibitor’s exercise of reel authority. For example, Swami,
Eliashberg, and Weinberg (1999) study the optimal allocation of movies to screens,
proposing an algorithm to help exhibitors make “effective and timely decisions regarding
theater screens management.” They compare the results of their algorithm to practice and
argue that their algorithm can lead to a 40% improvement in exhibitor profits. Our relational-
contracts model differs by focusing on the efficient allocation of movies to screens as
uncertainty is resolved over time. Our multi-unit auction is a complementary approach to
their problem: the auction can be seen as decentralizing the allocation decisions to the bids of
the distributors, rather than centralizing them via the algorithm of the exhibitor.
Separate from the literature on movies, there is also a theoretical and empirical
literature on contract renegotiation. As in the literature on movie contracts, one can
distinguish between papers where renegotiation can occur as the last move in a static model,
versus papers where renegotiation is part of a relational contract. Benmelech and Bergman
(2008) and Cai, Li, and Zhou (2010) are examples of the former. Benmelech and Bergman
find that US airlines are able to renegotiate their lease obligations when their financial
position is poor and the liquidation value of their fleet is low because the low liquidation
value causes the lessors to accepted renegotiation rather than repossess the aircraft. Cai et al.
study renegotiation of incentive contracts in the Chinese banking industry and show that,
despite ex post renegotiation, formal incentive contracts affect worker effort. Our paper
differs from these two (and from other theoretical papers that analyze static models) in that
our renegotiation is a unilateral transfer from the distributor to the exhibitor that reduces the
formal revenue share that must be paid to the distributor. This unilateral transfer occurs after
all decisions about the movie have been taken and so cannot be equilibrium play as the last
move in a static model. Rather, our relational renegotiation occurs only because the future
relationship is valuable.
Our paper also relates to the literature on the causes and consequences of relational
contracting and the interplay between relational and formal contracts. Macaulay (1963) and
Macneil (1978) are early contributions to this literature from sociology and law, respectively.
MacLeod and Malcomson (1989) and Levin (2003) established the theoretical economics
literature on relational contracting, and Baker, Gibbons, and Murphy (1994) did likewise for

APRIL 2015 PAGE 7
BARRON, GIBBONS, GIL, AND MURPHY: REEL AUTHORITY
the interplay between formal and relational contracting; see Malcomson (2013) for further
citations and recent work.
Most importantly, our paper contributes to a young but growing empirical literature
that documents how past and future interactions are important drivers of current performance
in supply relationships that use formal and relational contracts. McMillan and Woodruff
(1999) was among the first papers in this literature; see Gil and Zanarone (2015) for a survey.
Much of this literature focuses on how the strength of a relationship affects the terms of
formal or relational contracts. Few have data to analyze the decisions that these formal and
relational terms induce. For example, Macchiavello and Morjaria (2015) use unexpected
shocks as a source of variation for the actions that formal and relational contracts induce; in
contrast, we use routine (in fact, weekly) variation in opportunity costs. As a result, for a
fixed distributor-exhibitor pair, we observe variation in not only relational payments but also
the decisions induced by these payments across a wide set of theaters, movies, and weeks. In
this sense, our setting complements those that focus on variation in the strength of the
relationship; we take the relationship as given and observe its consequences in detail.
2. Relational Renegotiation in Spanish Exhibitor/Distributor Contracts
2.1. Institutional Details and Data Description
As described in detail below, our empirical analysis is based on distributor-exhibitor
contracts from a large movie exhibitor owning a chain of theaters throughout Spain.
Although the eventual contracts between distributors and exhibitors in this market are
simple—defined as a share of the box-office revenues to be paid to the distributor—Gil
(2013) documents that the negotiation process leading to this simple contract can be complex
and begins months before the movie is released.5
5 Filson, Switzer, and Besocke (2005) analyze distributor-exhibitor contracts from a U.S. movie exhibitor owning 13 theaters in the St. Louis area. Consistent with our Spanish data, Filson, et al. show that contracts typically include a sliding scale of distributor sharing rates that decline with the age of the movie. However, they also document that their contracts are sometimes piece-wise linear, where the exhibitor receives a higher share (e.g., 90%) after exceeding some weekly box-office threshold; this alternative payment mechanism appears to be relevant primarily for blockbusters early in their run. We do not observe this alternative payment mechanism in our data.

APRIL 2015 PAGE 8
BARRON, GIBBONS, GIL, AND MURPHY: REEL AUTHORITY
The first step in this negotiation process occurs prior to the determination of a release
date for a movie, when a distributor and an exhibitor reach an agreement on the total number
of copies (or “reels”) per movie that the exhibitor will show in all theaters owned by that
exhibitor. Since the release week of the movie is not yet determined, distributors and
exhibitors do not agree formally on which theaters will show what movies or on the number
of reels per movie in each theater. Second, once the release date is determined, the
distributors and exhibitors negotiate which specific theaters will screen each reel. Third,
sometime between a month and a week before the release date, the revenue-sharing rate is
negotiated for each theater, reel, and week, and the parties sign a formal contract specifying
these rates. The contract is thus signed before the release date but specifies sharing rates
sometimes for eight or more weeks after the release date, so there is substantial uncertainty
when the contract is signed about what revenues might available from showing alternative
movies many weeks after this movie is released. Finally (and most importantly, for our
purposes), the formal sharing rates are often renegotiated after the movie has finished its run.
These renegotiations (if they exist) are initiated by the exhibitor and are characterized as
“discounts” from the distributor’s formal sharing rate.
Figure 1 illustrates the evolution of formal and relational (i.e., renegotiated) sharing
rates for two theaters showing the John Nash biopic, “A Beautiful Mind” (or, “Una Mente
Maravillosa” in Spain), released in Spain on February 22, 2002 (nine weeks after its release
in the United States). The figure shows that—for this particular movie in these two
theaters—the distributor’s average formal share decreased over the movie’s run, and the
likelihood and size of the exhibitor’s negotiated discount increased. In particular, the formal
sharing rate for the distributor decreased by 5% every two weeks, from 60% in week 1 to
40% by week 10. The movie played for 7 weeks in Theater 5 and for 10 weeks in Theater
20.6 Theater 5 started receiving negotiated discounts from the formal sharing rate in week 2;
discounts ranged from 5% in week 2 to 15% in week 7. Theater 20 received no discounts in
the first seven weeks before receiving discounts of 5% and 10% in weeks eight and nine,
respectively.
6 Theater names are concealed to preserve confidentiality.

APRIL 2015 PAGE 9
BARRON, GIBBONS, GIL, AND MURPHY: REEL AUTHORITY
We explore the incidence, magnitude, and determinants of ex post renegotiations in
distributor-exhibitor contracts using detailed weekly data during 18 months between January
2001 and July 2002. During that period, the exhibitor owned 188 screens in 26 theaters
located in 16 different cities in 11 Spanish provinces. We combine Gil’s (2013) data on
contract terms (both formal and renegotiated sharing rates for reels that are shown) with reel-
level weekly data on attendance and box-office revenues.7 Across the 18 months of the
sample, we were able to match contract and box-office data for 435 movies, 5,436 reel-runs,
and 19,551 theater-reel-weeks. In addition, our data identify the specific screens on which a
movie is shown in a given theater, allowing us to analyze whether the exhibitor shows the
movie on a dedicated or a shared screen.
Both our theoretical models in Section 3 and our empirical approach in Section 4
emphasize the exhibitor’s outside option (i.e., the best alternative reel that could be shown in
place of the distributor’s reel on a given screen in a given time slot). In order for the outside
option to be relevant, the theater must be capacity constrained (i.e., screens must be fully
utilized). While the capacity-constraint assumption is reasonable for movies shown in “prime
time” (early to late evening), the constraint is less likely to bind for movies shown in daytime
matinees or after midnight. Ideally, we would constrain our analysis to prime-time showings,
but our data do not include specific show times or screenings per week. We therefore
explored using weekly attendance as an imperfect proxy for prime-time movies, using
detailed show-time data from local newspapers between January and June 2001 for twelve
theaters in Barcelona and Madrid. As described in Appendix 1, we determined that a weekly
attendance of 100 was a reasonable cutoff for separating Prime Time and non-Prime Time
reels: less than 5% of movies showing during prime time had weekly attendance less than
100, while 67% of movies showing only outside of prime time had attendance less than 100.
We therefore exclude reel-weeks with fewer than 100 weekly attendees from our data,
leaving us with 391 movies, 4,931 reel-runs, and 16,398 theater-reel-weeks.8
7 Gil (2013) had access to only theater-level (not reel-level) weekly box-office revenues and so used a two-step estimator to approximate box-office revenue per movie (not per reel) in any given week. Our new data include weekly reel-level revenues for each theater, eliminating the need for Gil’s approximation. 8 In (unreported) robustness tests, we determined that the results below are not sensitive to the specific threshold used as a proxy for Prime Time movies, provided that the threshold exceeded 25.

APRIL 2015 PAGE 10
BARRON, GIBBONS, GIL, AND MURPHY: REEL AUTHORITY
Table 1 presents sample means for selected variables used in our analysis: Panel A
summarizes data from our entire sample, while Panel B summarizes data from the sample
after excluding theater-reel-weeks with weekly attendance less than 100. The sample means
are reported for three categories of reels based on contract terms: (1) reels under contract for
their entire run; (2) reels switching once from being under contract to not being under
contract; and (3) reels not fitting into the previous categories, including reels never under
contract, reels initially not under contract but under contract later, and reels switching
contractual status more than once. Since our focus is on ex post renegotiation of formal
contracts, our primary empirical analysis below is based on reels in the first two categories
(indeed, for reels in the second category, we focus on theater-reel-weeks where there is a
formal contract), but we use all available theater-reel-weeks when measuring opportunity
costs.
As shown in Panel B of Table 1, the average formal share of box office revenues going
to the distributor is 53.5% and 50.8% in Categories 1 and 2, respectively.9 Approximately
58% of the theater-reel-weeks in Category 1 were renegotiated, and the average discount for
renegotiated reels was 10.5%. Similarly, while only 64.4% of theater-reel-weeks in Category
2 had formal contracts, 31.6% of observations in this category (i.e., 31.6 / 64.4 = 49% of
theater-reel-weeks with formal contracts) were renegotiated, and the average discount for
renegotiated reels was 8.2%.
Figure 2 shows the distribution of observed discounts for the 5,476 theater-reel-weeks
with observed discounts in Category 1 and Category 2 of Table 1, Panel B. As shown in the
figure, 5,385 of the observed discounts (98.3% of all observed discounts) are exactly at 5%
(n=2095), 10% (n=1658), 15% (n=1078), 20% (n=424), or 25% (n=130). Nine reel-weeks
(0.16% of the sample) have discounts exceeding 25%, and another nine had negative
discounts of -5% (that is, final distributor sharing rates were 5% larger than the contracted
rate). Imagining that these negative discounts may be coding errors, we exclude these nine
observations from our subsequent analysis.
9 Category 2 may comprise successful movies extended beyond the initial contracting period: reels in this category had longer average run lengths (8.9 weeks vs. 4.0 weeks), higher average weekly box office revenues (€5658 vs. (€4090), and higher average weekly attendance (1329 vs. 974) compared to reels in Category 1.

APRIL 2015 PAGE 11
BARRON, GIBBONS, GIL, AND MURPHY: REEL AUTHORITY
2.2. Relational Renegotiation and Continuation Decisions
While the formal contract specifies the distributor’s revenue share in the event the reel
is shown, decision rights over whether to show the movie, or how often and in what time
slots, are retained by the exhibitor. In our theoretical and empirical analysis, we consider two
types of exhibitor continuation decisions. The first is whether to continue showing a
particular reel in a particular theater in a prime-time slot for an additional week (also during
prime time). The second is whether to show a particular reel during all the prime-time slots
on a given screen, or to share prime-time slots on that screen with another movie.10
Table 2 illustrates both types of continuation decisions for the 22 theaters in our sample
showing “A Beautiful Mind” between February 22 and April 19, 2002.11 In particular, the
table entries report the negotiated discounts (if any) for weeks the movie was shown in a
given theater. Discounts in bold indicate theater-weeks in which “A Beautiful Mind” shared
a screen with at least one other movie during Prime Time (as inferred from our attendance-
based proxy for Prime Time). Table entries of “n/c” (for “no contract”) reflect cases where
the movie’s run extended beyond its original formal contract (e.g., reels in Category 2 in
Table 1).
Table 2 shows that one theater stopped showing “A Beautiful Mind” after six weeks,
eight after seven weeks, three after eight weeks, and ten after nine or more weeks.12 All 22
theaters dedicated a single screen to the movie over its first four weeks; by the fifth week, 9
of the 22 theaters added another Prime Time movie to the same screen. The table shows that,
for the case of this particular movie: (1) discounts vary across theaters during a given week;
(2) discounts are more likely (and are typically higher) later in the run; (3) screen sharing is
more likely later in the run and is often (but not always) associated with discounts. These
10 The exhibitor also has other continuation decisions that we do not analyze, such as showing a movie in a screen with more seats or fewer seats, showing a 3-D vs. 2-D version of the movie, showing the movie on alternate days, moving a movie in a prime-time slot to a matinee or after midnight, and so on. 11 In cases where the theater showed the movie on multiple screens (i.e., had multiple reels), the discounts in the table are those associated with the “first reel” (which we define as the reel with the highest box-office revenues). 12 The distribution of ultimate run lengths for the ten theaters still showing “A Beautiful Mind” in the ninth week is 9 weeks (n=1), 10 weeks (n=2), 11 weeks (n=1), 12 weeks (n=1), 12 weeks (n=2) 14 weeks (n=2), and 16 weeks (n=1). The maximum “contracted” run length in our data (i.e., the number of weeks where we have contract data) is 10 weeks.

APRIL 2015 PAGE 12
BARRON, GIBBONS, GIL, AND MURPHY: REEL AUTHORITY
three stylized facts are not specific to “A Beautiful Mind;” rather, they are broadly
representative of the movies in our sample.
There is a fundamental conflict of interest between the distributor and the exhibitor
with respect to continuation decisions. Once a reel is produced and sent to a theater, the
distributor’s opportunity cost of an additional screening at that theater is negligible and the
distributor will therefore prefer the reel to be shown in as many time slots as possible
(assuming that the marginal box-office or merchandizing revenue for each additional
screening is strictly positive).13 On the other hand, the exhibitor’s opportunity cost of
showing the reel on a given screen in a given time slot equals the exhibitor’s profit from the
best alternative reel that could be shown instead, which will be strictly positive as long as the
exhibitor has fewer screens than available reels. Therefore, an exhibitor facing high
opportunity cost will be tempted to discontinue the distributor’s reel or to show it in fewer or
worse time slots than those preferred by the distributor.
Box office revenues for most movies will decline over the course of a movie’s run, so
the fact that the distributor’s formal share of box-office revenue falls (and the exhibitor’s
contracted share rises) during the run provides the exhibitor with incentives to continue
showing movies as they age (and continue showing them in multiple time slots). However,
since the formal contract is signed before the movie is released and before the success of the
movie or the exhibitor’s opportunity cost is known, there will be situations where it would be
efficient for the exhibitor to continue showing the distributor’s movie, but the exhibitor is not
willing to do so based on only the formal contract. More specifically, new information
affecting the efficient continuation decisions—such as unanticipated box office revenues,
new releases that might perform better or worse than expected, surprising hits or flops, and
so on—emerges continuously during the run of a movie. We hypothesize that the role of the
observed ex post renegotiations is to facilitate efficient adaptation as uncertainty is resolved:
the anticipation of a discount provides incentives for exhibitors to incorporate new
information in their continuation decisions.
13 The distributor might also prefer that the reel be transferred to a theater with higher expected revenues from additional screening. However, with the exception of some “limited release” movies (i.e., movies shown in selected theaters in advance of a national release), there is typically an excess supply of reels after the initial release week (as theaters begin discontinuing the reel), so the distributor’s opportunity cost of an additional screening in any particular theater is essentially zero.

APRIL 2015 PAGE 13
BARRON, GIBBONS, GIL, AND MURPHY: REEL AUTHORITY
If the observed renegotiations occurred on a weekly basis, as exhibitors decided which
reels to show on which screens and in which time slots, we could interpret the renegotiations
as a simultaneous (and likely contractible) quid pro quo—such as an exhibitor agreeing to
continue showing the movie in question in exchange for an immediate payment (i.e.,
discount) from the distributor. However, the renegotiations we observe occur at the end of
the reels’ run, weeks after the exhibitor has taken any continuation decisions, so the
continuation decisions cannot be the result of contemporaneous payments. To the extent that
the eventual renegotiations are anticipated by the exhibitor and, as a consequence, affect
exhibitor continuation decisions weeks before the renegotiations, the renegotiations must (by
definition) be relational: continuation decisions are affected by non-contractual (and hence
relational) commitments by the distributor to offer discounts from contractual sharing rates in
order to provide incentives for distributor-preferred continuation decisions.
Tables 3 and 4 present evidence suggesting that both the probability of renegotiation
and the magnitude of an eventual discount are related to the exhibitor’s earlier continuation
decisions. Simply put, Table 3 reports results from linear probability models predicting
whether a reel is continued for an additional week (or continued on a dedicated screen for an
additional week). Table 4 then shows that the probability and size of an eventual discount are
negatively related to the reel’s predicted continuation probability: reels that were continued
in spite of being predicted not to be continued (or continued on a dedicated screen in spite of
being predicted to be sharing the screen with another movie) are more likely to be associated
with renegotiated discounts after the reel’s run is over.
More specifically, Columns (1) and (2) of Table 3 report results from linear probability
models showing the probability that an exhibitor showing a reel in week t will continue
showing the reel in week t+1. The independent variables are the number of screens in the
theater (which we expect to be positively related to continuation, since more screens
increases the exhibitor’s degrees of freedom in continuing marginal reels), the number of
new releases coming to the theater in week t+1 (which we expect to be negatively correlated
with continuation, since there are fewer screens to allocate among the reels shown in the
current week), the box office revenues of the reel in week t, and a dummy variable equal to
one if the box-office revenues of the reel in week t rank the reel as among the “n” reels with
the lowest box-office revenues (where n is the number of new releases coming to the theater

APRIL 2015 PAGE 14
BARRON, GIBBONS, GIL, AND MURPHY: REEL AUTHORITY
in week t+1). We expect this last variable to be negatively correlated with continuation
decisions, since the n new releases will occupy at least n Prime Time slots, and the n “worst”
existing reels will be obvious candidates for elimination. Column (1) includes no fixed
effects, while column (2) includes both theater and movie-week fixed effects.14 Consistent
with our expectations, the probability of continuing a reel for an additional week is positively
related to the number of screens in the theater (in Column (1)) and to the current-period box-
office revenues, but negatively related to the number of new releases coming to the theater in
week t+1 and to the dummy variable for likely being displaced by these new reels.
Similarly, columns (3) and (4) of Table 3 report results from linear probability models
showing the probability that an exhibitor showing a reel on a dedicated screen in week t will
continue showing the reel on a dedicated screen in week t+1. The sample in columns (3) and
(4) is restricted to reels actually shown in week t+1; we are thus examining the second
continuation decision—continuing to show the reel on a dedicated screen—for the subset of
reels that have already “passed” the first continuation decision. The independent variables
and the use of fixed effects in columns (3) and (4) parallel those in columns (1) and (2). As
shown in the table, the probability of continuing a reel on a dedicated screen for an additional
week is negatively related to the number of new releases coming to the theater in week t+1
and to the dummy variable for being likely displaced by these new reels; the coefficient on
the number of screens in column (3) (without theater or movie-week fixed effects) is
insignificant.
The purpose of Table 3 was not to test any hypothesis, but rather to estimate the
predicted continuation probabilities we use in Table 4 to analyze whether future
renegotiations are related to current continuation decisions. Specifically, Panel A of Table 4
reports the average frequency and magnitude of subsequent renegotiations for theater-reel-
weeks grouped by quintiles of the predicted continuation probability estimated in column (2)
of Table 3. We use this two-step approach because we observe contractual terms (including
discounts) only for reels that are actually continued. That is, while Table 3 is based on all
theater-reel-weeks in week t, independent of whether the reel is continued in week t+1, Panel
A of Table 4 is based only on reels that were shown in both week t and week t+1. Therefore, 14 Since the number of screens in the theater does not change over time for a given theater, we do not include Ln(# of Screens in Theater) in regressions with theater fixed effects.

APRIL 2015 PAGE 15
BARRON, GIBBONS, GIL, AND MURPHY: REEL AUTHORITY
since all the theater-reel-weeks in Panel A were continued, observations in the lowest quintile
are interpreted as reels that were continued in spite of being predicted not to be continued,
while observations in the highest quintile are reels that were expected to be continued and
were, indeed, continued.
As evident from Panel A of Table 4, the frequency of renegotiation, the average
discount (including theater-reel-weeks with no discount), and the average positive discount
(excluding including theater-reel-weeks with no discount) all decline monotonically across
quintiles. The table entries in each column are all significantly different from each other at
the 1% level or better, with only two exceptions: the first and second quintiles in column (1)
and the third and fourth quintiles in column (3) are significantly different from each other at
only the 5% level. We interpret these results as providing strong motivational evidence that
future renegotiation outcomes are related to current decisions of whether to continue showing
or drop a reel.
Panel B of Table 4 reports the average frequency and magnitude of subsequent
renegotiations for theater-reel-weeks grouped by quintiles of the predicted continuation
probability estimated in column (4) of Table 3. The sample in Panel B of Table 4 includes
only theater-reel-weeks where the reel is shown on a dedicated screen in both weeks t and
t+1. Observations in the lowest quintile are interpreted as reels that were continued on
dedicated screens in spite of being predicted to share a screen with another reel, while
observations in the highest quintile are reels that were expected to be continued on a
dedicated screen and were, indeed, continued.
Similar to the results in Panel A of Table 4, Panel B shows that the frequency of
renegotiation and the average discount decline (weakly) monotonically across quintiles: reels
shown on a dedicated screen that were predicted to be shown on a shared screen are more
likely to receive discounts. The positive discounts (i.e., after excluding zeros) in column (3)
generally decline as well except for in the lowest quintile. While the statistical differences
between pairs of the table entries are not as stark as in Panel A, the results for the first three
quintiles are significantly higher than the result for the fifth quintile at the 5% level or

APRIL 2015 PAGE 16
BARRON, GIBBONS, GIL, AND MURPHY: REEL AUTHORITY
better.15 The results therefore provide additional evidence that future renegotiation outcomes
are related to current continuation decisions (in this case, the decision to continue showing a
reel on a dedicated screen).
3. Two Simple Models
3.1. Introduction
This section develops two simple models to illustrate separate aspects of our empirical
approach. The first is a relational-contract model in which a distributor and an exhibitor can
enter into a formal revenue-sharing contract before the movie has been released. At the time
of formal contracting, there is uncertainty over the exhibitor’s opportunity cost—e.g.,
revenues from an alternative movie. After uncertainty is resolved, efficient adaptation means
showing the movie if and only if its value exceeds its cost.
Two related results emerge from this first model. First, for intermediate discount
factors, a relational contract without a formal contract is not optimal; the parties can do better
if they also sign a formal contract to support the relational contract, because the formal
contract can reduce the reneging temptation in the relational contract.16 Second, again for
intermediate discount factors, relational renegotiation of this formal contract can achieve
efficient adaptation: after the movie has finished its run, the distributor allows the exhibitor
to retain a greater revenue share than the formal contract specifies (i.e., the distributor allows
a “discount” from what the formal contract would allow the distributor to receive), as a
reward for the exhibitor showing the distributor’s movie longer than would have been
induced by the formal contract alone.
In keeping with Panel A of Table 4 above, the need for and size of such relational
renegotiation is higher when the exhibitor’s outside option is higher (provided that the
outside option is not so high that showing the distributor’s movie is no longer efficient). A
slightly richer model—say, where the exhibitor has one screen with two time slots—could
15 The only exception is the comparison in column (1) between the first quintile (8.5%) and last quintile (7.8%), which are significantly different with probability p=.063. 16 See Baker, Gibbons, and Murphy (1994) for an early result in this spirit, in an agency setting, and Malcolmson (2013) for a review of subsequent work.

APRIL 2015 PAGE 17
BARRON, GIBBONS, GIL, AND MURPHY: REEL AUTHORITY
forge a parallel connection to Panel B of Table 4, concerning whether the exhibitor shows the
distributor’s movie on a dedicated or a shared screen.
Our relational-contract model considers only a single distributor offering a single
movie and assumes that the exhibitor’s opportunity cost is exogenous. In our second model,
we consider multiple distributors, thereby endogenizing the exhibitor’s opportunity cost of
showing one distributor’s movie in terms of the potential revenue from showing another
distributor’s movie. In addition, we enrich the modeling of the exhibitor, allowing both
multiple screens and multiple time slots. The cost of these enrichments, however, is that we
abandon both relational contracts and ex ante formal contracts. That is, our second model
focuses on the one-shot version of the ex post problem: for a particular theater, given all the
movies it might show (and their anticipated box-office revenues), what is the efficient
allocation of movies to screens and time slots, and what prices will induce this allocation?
To solve this ex post problem, we analyze a multi-unit auction where distributors’ bids
are sharing rates. We show that winning bids will be positively related to the anticipated box-
office revenues of the “best dropped” reel (that is, the reel with the highest revenues that was
dropped in the prior week) and the “best shared” reel (that is, the reel with the highest
revenues that shares a screen with other reels in the same theater).
In principle, one could imagine combining these two simple models, investigating the
role of ex ante formal contracts in a relational multi-unit auction. We do not attempt this task
here. Instead, we take from the first model an understanding of why the parties might write a
formal contract ex ante, only to renegotiate it after the movie has finished its run, and we take
from the second model an understanding of what pricing (via this relational renegotiation)
would induce the efficient allocation of movies to screens and time slots. These two
understandings then guide the empirical work in the following section.
3.2. Relational Adaptation Supported by Formal Contracting
In this first model we consider a repeated game between two players: an exhibitor (E)
and a distributor (D), each with discount rate r. The distributor has a movie that would
produce box-office revenue v if shown by the exhibitor. The timing of the stage game is: (1)
D offers a formal (i.e., court-enforceable) revenue-sharing contract with sharing rate β,

APRIL 2015 PAGE 18
BARRON, GIBBONS, GIL, AND MURPHY: REEL AUTHORITY
meaning that the exhibitor receives βv and the distributor (1- β)v if the movie is shown; (2)
E’s outside option, x, is publicly realized, where x = L or M or H with probabilities qL, qM,
and qH, and L < M < v < H; (3) E chooses either to show D’s movie (d = 1) or to take her
outside option (d = 0); and (4) D can make a payment b to E (where a payment instead from
E to D is b < 0). The payoffs are then and d(1-β)v - b to the distributor and (1-d)x + dβv + b
to the exhibitor. The first-best decision rule, maximizing (1-d)x + dv, is thus d = 1 if x = L or
x = M and d = 0 if x = H.17
In the one-shot version of this repeated game, the equilibrium is simple. Neither party
will make a payment other than b = 0, so the exhibitor will show the movie if and only if
doing so is more profitable than taking her outside option, βv ≥ x. The distributor’s payoff is
negative if β = H/v, so the distributor chooses either β = L/v or β = M/v, depending on
parameters. We assume that qL(M – L) ≥ qM(v – M), so that the distributor’s optimal formal
contract in the one-shot game is βos = L/v. That is, under this parameter assumption, the
distributor prefers to offer the exhibitor a small share and have the movie shown only if x =
L, rather than offer a share large enough to have the movie shown when x = M but thereby
overpay when x = L.18 The parties’ payoffs in the one-shot game are thus Eos = E(x) to the
exhibitor and Dos = qL(v – L) to the distributor.
We now turn to the repeated game. The distributor’s optimal formal contract in the
one-shot game leaves room for relational contracting to improve efficiency in the repeated
game. Specifically, if a relational contract can deliver appropriate payments conditional on x
17 Without the formal contract (β), this static model would be an elemental “adaptation” model, where neither contracts ex ante nor renegotiation ex post can induce first-best adaptation after uncertainty is resolved. See Gibbons (2005) for how Simon (1951) and Williamson (1971) launched this approach. See Baker, Gibbons, and Murphy (2011) for a repeated-game model of relational adaptation where the parties can choose the allocation of decision rights (but not a formal contract) to help enforce their relational contract. 18 The parties are risk-neutral, so agency theory might lead one to expect that an optimal contract could achieve the first-best for any parameters. Formally, the distributor’s optimal contract in our one-shot model does not achieve the first-best because the contract includes only a sharing rate (β), not a non-contingent payment (akin to a salary in an agency model). However, the agency analogy is misleading here; instead, we have a two-sided moral-hazard problem, for at least two reasons. First, the distributor engages in (unmodeled) marketing effort that affects v. Second, the distributor has multiple (unmodeled) reels of the movie, so the first reel may be worth v if no other reels are shown in surrounding theaters, but it may be worth much less than v if many reels are shown nearby. Adding either of these two-sided moral-hazard considerations to the model would make it impossible for a formal contract to achieve the first-best even with a non-contingent payment. Similarly, enriching the model to include a non-contractible private benefit for the distributor when the movie is shown—such as from merchandizing rights or revenues from potential sequels—would also make it impossible for a formal contract to achieve the first-best even with a non-contingent payment.

APRIL 2015 PAGE 19
BARRON, GIBBONS, GIL, AND MURPHY: REEL AUTHORITY
and d, it can improve efficiency by inducing the exhibitor to show the movie if x = M.
Consistent with our empirical setting, such payments (b > 0) are provided after the movie has
finished its run.
In the empirical work in Section 4, we focus on the incidence, magnitude, and
determinants of relational renegotiations in this equilibrium. Concerning incidence, there is
no need for renegotiation if the exhibitor’s revenue from the formal contract exceeds her
outside option, βv ≥ x. Concerning magnitude, provided x > βv, the observed discount should
be (weakly) increasing in x - βv.19 Finally, concerning determinants, the key parameters are
x, v, and β, and the key behavior is the exhibitor’s decision, d: the parameters determine the
size of the discount, but the discount should be awarded only after the desired behavior by
the exhibitor.
The relational-renegotiation equilibrium we construct assumes stationarity (i.e., it
involves the same actions each period on the equilibrium path) and Nash threats (i.e.,
following a deviation, the parties revert to the equilibrium of the one-shot game described
above). In every period: the distributor offers the formal contract β, which the exhibitor
accepts; the exhibitor then observes x and takes the first-best decision; and the distributor
pays the exhibitor b > 0 iff x = M and d = 1. On the equilibrium path, the continuation
payoffs to the distributor and the exhibitor are therefore VD = qL(1-β)v + qM[(1-β)v – b] and
VE = qLβv + qM[βv + b] + qHH per period. If there is a deviation, the parties receive payoffs
Dos and Eos in all future periods, so the parties face two incentive constraints. First, the
exhibitor must be willing to choose d = 1 when x = M:
𝛽𝑣 + 𝑏 + 1𝑟 𝑉
! ≥ 𝑀 + 1𝑟 𝐸
!" . (3.1)
Second, the distributor must be willing to pay b > 0 if x = M and d = 1:
−𝑏 + 1𝑟 𝑉
! ≥ 1𝑟 𝐷
!" . (3.2)
There exists a b satisfying these two conditions only if
19 Our model has only one value of x that should lead to renegotiation (x = M), so there will not be any variation in the observed discount if the model is taken literally. In a richer model there could be more values of x that lead to renegotiation—such as L < M1 < M2 < v < H. Also, in the data, there could be variation in the parameter M across movie-theater-weeks, so there could be different observed discounts for different movie-theater-weeks, with the estimated discount thus increasing in x – βv.

APRIL 2015 PAGE 20
BARRON, GIBBONS, GIL, AND MURPHY: REEL AUTHORITY
𝑀 − 𝛽𝑣 ≤ 1𝑟 (𝑉
! + 𝑉! − 𝐷!" − 𝐸!") , (3.3)
where VD + VE – Dos – Eos = qM(v – M).
Our equilibrium thus imposes a lower bound on the exhibitor’s formal share:
𝛽 ≥ 𝑀𝑣 −
1𝑟 𝑞!(1−
𝑀𝑣 ) . (3.4)
For r sufficiently close to 0, the righthand side of (3.4) is negative, implying that if the parties
are sufficiently patient then they can implement efficient adaptation without using a formal
contract (β = 0).20 At the other extreme, for very large r, the righthand side of (3.4)
approaches M/v, implying that if the parties are very impatient then they cannot implement
first-best decisions without a formal contract that induces the exhibitor to show the movie
even if x = M. Finally, for intermediate values of r (determined in part by the distributor’s
participation constraint), our equilibrium mimics our data: a non-trivial formal contract (β >
L/v) is used to support the relational contract, but the formal contract is relationally
renegotiated to achieve efficient adaptation (b > 0 when x = M and d = 1).
As in any repeated game, there are of course other equilibria. In particular, two
equilibria that also achieve the first-best (and that also exist when our equilibrium exists) are
worth noting. Both of these alternative equilibria again use formal contracts to support
relational contracts, but their renegotiation patterns do not fit our data. First, the formal
contract might sometimes be renegotiated in favor of the distributor; for example, the
exhibitor might refund the distributor part of the formal contract if x = L. Second, there may
be no discounts at all: the distributor might instead offer the exhibitor a generous formal
contract and use the threat of reverting to the one-shot contract to induce first-best decision-
making. But when our equilibrium exists, there is no obvious reason that the parties will play
another equilibrium—which, at best, would redistribute the first-best payoffs between the
parties.
20 Indeed, the parties can achieve the first-best without using a formal contract for higher values of r by using a relational contract with payments bL if x = L and payments bM if x = M, instead of only the latter as we have analyzed. But even this richer approach fails at some critical value of r. Therefore, above this critical value, a relational contract without a formal contract is not optimal; the parties can do better if they sign a formal contract that supports the relational contract by reducing the reneging temptation in the relational contract.

APRIL 2015 PAGE 21
BARRON, GIBBONS, GIL, AND MURPHY: REEL AUTHORITY
3.3. Endogenous Opportunity Costs in a Multi-Unit Auction
We now consider multiple distributors, thereby endogenizing the exhibitor’s
opportunity cost of showing one distributor’s movie in terms of the potential revenue from
showing another distributor’s movie. As explained in Section 3.1, we now focus on the
following problem: for a particular theater, given all the movies it might show (and their
anticipated box-office revenues), what is the efficient allocation of movies to screens and
time slots, and what prices will induce this allocation?
We analyze D distributors, each with one movie, bidding to have one exhibitor show
their movie in one or more of T time slots.21 The exhibitor has S < D screens, so not every
movie can be shown in all time slots. We further simplify by assuming that screens and time
slots are equivalent, but a movie generates less revenue from showing in its second time slot
than in its first, and likewise for subsequent showings. In particular, the total revenue from
showing movie m in n time slots is γnvm where γ0 = 0, γ1 = 1, γn+1 > γn, and γn+1/(n+1) < γn/n.
All movies experience the same proportional diminishing returns—i.e., γn is independent of
m. Movies are indexed by their first-slot expected revenue: v1 > … > vm >... > vD. These
revenues are common knowledge.
To solve for the efficient allocation of movies to screens and time slots, as well as the
prices that will induce this allocation, we analyze a multi-unit Vickrey auction. Each
distributor submits T bids and the ST highest bids are awarded a time slot on a screen. A
bidder who is awarded t time slots pays the sum of the t highest losing bids made by other
distributors. (Of course, were this a single-unit auction, this payment rule would define a
second-price auction.) Parallel to a single-unit Vickrey auction, Krishna (2009) shows that in
a multi-unit Vickrey auction it is a weakly dominant strategy to bid one’s valuations
(Proposition 13.1) and that the resulting allocation is efficient (Proposition 13.2). In our
setting, bidding one’s valuation means bidding the marginal value (γn+1 - γn)vm for the nth slot
for movie m, for n = 1, …, T.
The following example forges a connection to the data. Suppose four distributors want
to show their movies at a theater with two screens and two time slots. Furthermore, suppose 21 For simplicity, the exhibitor has only one theater and each movie has only one reel. In reality, a distributor may have more than one movie at once in a given theater, but if these movies are from different producers then contracts between the distributor and each producer may force the distributor to treat the movies independently.

APRIL 2015 PAGE 22
BARRON, GIBBONS, GIL, AND MURPHY: REEL AUTHORITY
v1 > (γ2 - 1)v1 > v2 > v3 > (γ2 - 1)v2 > v4 > (γ2 - 1)v3. Then distributor 1 gets two time slots,
generates v1 + (γ2 - 1)v1 in revenue, and pays (γ2 - 1)v2 + v4 (the sum of the two highest losing
bids made by other distributors), whereas distributor 2 gets one time slot, generates v2 in
revenue, and pays v4 (the highest losing bid made by another distributor), and distributor 3
gets one time slot, generates v3 in revenue, and pays (γ2 - 1)v2.22
Empirically, there is an important distinction between the payments (γ2 - 1)v2 and v4:
both are losing bids (and so not directly observed in our data), but v4 is based on a movie that
was not shown at all, whereas (γ2 - 1)v2 is based on a movie that was shown once but not
twice. Put differently, v4 defines the extensive margin (i.e., deciding whether to show the
movie at all), whereas (γ2 - 1)v2 defines the intensive margin (i.e., deciding whether to give
the movie an additional time slot).
In the empirical work below, we take the set of movies that could have been shown but
were not to be the set of “dropped” movies—those that were shown in this theater last week
but not this week. In the example above, one might take the set of movies shown last week to
be v1 > v2 > v3 > v4. Given the bidding outcome above, the only dropped movie is movie 4,
but more generally there could be many dropped movies. One result from the multi-unit
auction is that the bid paid by a movie that is shown this week could depend on the expected
revenue from any dropped movie, but a second result is that if this bid depends on any
dropped movie then it depends on the best dropped movie, so we use the best dropped movie
in our empirical work. Similarly, a third result from the auction is that the bid paid by a
movie that is shown this week can depend on the expected revenue of any (other) movie that
shares a screen this week, but a fourth result is that if this bid depends on any movie that
shares a screen then it depends on the best movie that shares a screen, so we use the best
shared movie in our empirical work.
4. The Determinants of Relational Renegotiation
In Section 2.2 we offered evidence that future renegotiation outcomes are related to
current continuation decisions (in particular, decisions over whether to continue showing a
22 As Krishna notes, the Vickrey auction can seem unfair, in the sense that distributor 2 values time slots more than distributor 3 does (and acknowledges this by bidding higher), but 2 nonetheless pays less than 3 does because the highest failed bid was submitted by 2.

APRIL 2015 PAGE 23
BARRON, GIBBONS, GIL, AND MURPHY: REEL AUTHORITY
reel at all, and whether to continue showing a reel on a dedicated screen). In Section 3.2 we
showed that relational renegotiation can achieve efficient adaptation (for suitable
parameters): after the movie has finished its run, the distributor allows the exhibitor to retain
a greater revenue share than the formal contract specifies, as a reward for the exhibitor
showing the distributor’s movie longer (or, in an unmodeled extension, in more time slots)
than would have been induced by the formal contract alone. In Section 3.3 we showed that
winning bids in a multi-unit auction are positively related to the anticipated box-office
revenues of the “best dropped” reel (that is, the reel with the highest revenue that was
dropped after the prior week) and the “best shared” reel (that is, the reel with the highest
revenue that shares a screen with other reels in the same theater this week). In this section,
we combine the implications of these models by analyzing empirically whether the frequency
and magnitude of relational renegotiations are related to the anticipated box-office revenues
of the best-dropped and best-shared reels.
The anticipated box-office revenues of the best-dropped reel is a measure of the
opportunity cost the exhibitor faces from showing the distributor’s reel instead of an
alternative reel. Similarly, the box-office revenues of the best-shared reel is a measure of the
opportunity cost the exhibitor faces from showing the distributor’s reel on a dedicated screen
rather than a shared screen. Implicit in these examples of opportunity costs is the assumption
(consistent with our understanding of the institutional setting) that the best reel available to
the exhibitor in a particular theater in a particular week may differ substantially from the best
reel showing in or arriving at other theaters that week.
Of course, we cannot observe the current-period box-office revenues of the best-
dropped reel since, by construction, the best-dropped reel was not shown during the current
week. We proxy for what the box-office revenues of the best-dropped reel would have been
by using the reel’s revenues from the prior week; we therefore likely overestimate the
opportunity cost of the best-dropped reel, since revenues predictably decrease over time.
Similarly, while we can measure the current-period box-office revenues of best-shared reel,
we cannot measure the revenues that reel would have realized if it had been shown on a
dedicated screen (i.e., in all the Prime Time slots). We proxy for the box-office revenues the
best-shared reel would have realized if it had been shown on a dedicated screen by using the
reel’s revenues from the current week; we therefore likely underestimate this opportunity

APRIL 2015 PAGE 24
BARRON, GIBBONS, GIL, AND MURPHY: REEL AUTHORITY
cost, since revenues likely increase when the reel is shown in additional Prime Time slots on
the same screen.
Table 5 illustrates our approach by returning (for the last time) to “A Beautiful Mind,”
now focusing on the seventh week after the movie’s release. For each theater showing this
movie this week, the numbered columns of the table show (1) box-office revenue for this
movie this week, (2) our proxy for revenues from this week’s best-dropped movie, (3) our
proxy for revenues from this week’s best-shared movie, and (4) the renegotiated discount, if
any, for this movie this week. The observations are sorted by (declining) discounts; Theater 1
is not included because the movie was discontinued in that theater after Week 6.
Even within this movie-week, Table 5 shows substantial variation across theaters in all
four numbered columns. Weekly box-office revenues for this movie this week range from
€873 to €13,172; revenues for the best-dropped movie this week range from €701 to
€6,531 (where missing values reflect theaters with no dropped reels from the prior week);
and revenues for the best-shared movie this week range from €1,480 to €15,300 (where
missing values reflect theaters that showed all reels on dedicated screens during the current
week). And most importantly, the incidence and size of renegotiated discounts varies as well:
twelve theaters had discounts while nine did not, and these twelve discounts ranged from 5%
to 15%.
Our empirical approach exploits such variation within movie-weeks to analyze the
relation between discounts, revenues, and opportunity costs. To do so, the regressions below
include movie-week fixed effects, thereby controlling for the national (or international)
success of the movie, the predictable depreciation in box-office revenues over time (which
varies considerably across movies), the success or failure of new releases (effectively a
week-specific “common shock” to the industry), and any other factors affecting all reels of
the same movie in the same week. In addition, to control for theater-specific factors (such as
location, managerial talent, or other factors), the regressions include theater fixed effects.
In fact, we use not just movie-week fixed effects but instead the richer “reel-movie-
week” fixed effects, because the factors affecting a movie’s first reel in a given theater
(which we define as the reel with the highest revenues) are different from the factors

APRIL 2015 PAGE 25
BARRON, GIBBONS, GIL, AND MURPHY: REEL AUTHORITY
affecting additional reels of the same movie.23 In our empirical analysis, we are therefore
comparing first reels with other first reels, second reels with other second reels, and so on.
This approach allows us to treat the anticipated box-office revenues of an available second
reel of one movie as the opportunity cost for a different movie. Results available upon
request show that our conclusions are robust to (a) dropping all but the first reels, or (b)
keeping all reels but including movie-week (rather than reel-movie-week) fixed effects.
As shown in Section 3.2, formal contracts are expected to be renegotiated if
𝛽𝑣 < 𝑥 < 𝑣 , (4.1)
where v is the total box-office revenues of the current movie, β is the exhibitor’s contracted
share of box-office revenues, and x is a measure of the opportunity cost. Table 6 reports
results from linear probability models where the dependent variable is a dummy variable
equal to one if the contract is renegotiated (and zero otherwise), and the key independent
variables are dummy variables equal to one if x - βv > 0, where x is defined as the box-office
revenues from the best-dropped reel in column (1) and from the best-shared reel in column
(2), and both measures of opportunity cost are regressors in column (3). The regressions
include theater and reel-movie-week fixed effects. The sample size varies across columns
because not all theater-reel-weeks have best-dropped or best-shared reels. We run linear
probability models instead of probit because probit would not accommodate the large number
of fixed effects in our regressions. We cluster standard errors at the theater-week level
because continuation and screen-sharing decisions are likely related across all reels showing
in a given theater during a week.
Consistent with our predictions, the probability of renegotiation is positively and
statistically significant related to our indicator variables in all three regressions. From our
results in column (3) of Table 6, we find that on average a reel is 9.8 percentage points more
likely to have its contract renegotiated if revenues of the best-dropped movie in the previous
week are larger than the exhibitor’s revenues in the current week for the focal movie.
Similarly, the likelihood of renegotiation increases by 2.9 percentage points when the
23 Regarding Table 5, note that there were no theaters in our sample showing “A Beautiful Mind” on more than one screen (i.e., using more than one reel) in the seventh week.

APRIL 2015 PAGE 26
BARRON, GIBBONS, GIL, AND MURPHY: REEL AUTHORITY
revenues of the best-shared movie in the current week are higher than the focal movie’s
current revenues in the given theater.
Conditional on renegotiation, the smallest discount satisfying equation (3.1) is
𝑏 = 𝑀𝑣 − 𝛽 −
( 𝑉𝐸−𝐸𝑜𝑠)
𝑟𝑣 , (4.2)
where, to coincide with the data, we have now expressed b as a sharing rate, rather than in
Euros. As discussed in Section 3.2, our model predicts renegotiation for only one value of
x—namely, x = M, as shown in the M/v term of equation (4.2)—but a richer model could
have renegotiation for multiple values of x, resulting in multiple values of b. Table 7 reports
results from ordinary least-square regressions where the dependent variable is the
renegotiated discount (i.e., the difference between the exhibitor’s final share of the box-office
revenues and the contracted share) and the independent variables are measures of x/v (where
we predict a positive sign) and the exhibitor’s contracted share, β (where we expect a
negative sign). Analogous to Table 6, in Table 7 the independent variable x/v in column (1) is
the revenues of the best-dropped reel in week t-1 divided by the revenues of the focal movie
in week t, while the independent variable x/v in column (2) is the revenues of the best-shared
reel in week t divided by the box-office revenues of the focal movie in week t, and both
measures of x/v are regressors in column (3). We again cluster standard errors at the theater-
week level, for the same reasons mentioned above.
Consistent with our predictions, the magnitude of the discount is positively and
statistically significant related to both of \ opportunity-cost ratios in all three regressions, and
negatively and significantly related to the exhibitor’s contracted share. Results from column
(3) in Table 7 show that a ten-fold increase in the ratio between revenues of the best-dropped
movie and the focal movie is positively associated with an increase in discount of 4.1
percentage points. Similarly, a ten-fold increase in the ratio between revenues of the best-
shared movie and the focal movie is associated with an increase in discount of 1.5 percentage
points. Finally, a decrease of 5% in the formal sharing rate of a movie in a given week is
associated with an increase in discount of 3.1 percentage points.

APRIL 2015 PAGE 27
BARRON, GIBBONS, GIL, AND MURPHY: REEL AUTHORITY
5. Conclusion
This paper has ….
Future work will …

APRIL 2015 PAGE 28
BARRON, GIBBONS, GIL, AND MURPHY: REEL AUTHORITY
References Arrow, Kenneth. 1953. “Le role des valeurs boursieres pour la repartition la meilleure des
risques.” Econometrie, Centre National de la Recherche Scientifique, Paris, 41-48.
Baker, George, Robert Gibbons, and Kevin J. Murphy. 1994. “Subjective Performance Measures in Optimal Incentive Contracts,” The Quarterly Journal of Economics 109 (4): 1125-1156.
Baker, George, Robert Gibbons, and Kevin J. Murphy. 2011. “Relational Adaptation.” Unpublished manuscript.
Benmelech, Efraim, and Nittai Bergman. 2008. “Liquidation Values and the Credibility of Financial Contract Renegotiation: Evidence from U.S. Airlines,” The Quarterly Journal of Economics 123(4): 1635-1677.
Gérard Cachon, Martin Lariviere. 2005. “Supply chain coordination with revenue sharing: strengths and limitations,” Management Science 51(1), 30 – 44.
Cai, Hongbin, Hongbin Li and Li-An Zhou. 2010. “Incentives, Equality and Contract Renegotiations: Theory and Evidence in the Chinese Banking Industry,” Journal of Industrial Economics 58: 156-189.
Dana, James, and Kathryn Spier. 2001. “Revenue Sharing and Vertical Control in the Video Rental Industry,” Journal of Industrial Economics 49(3): 223-45.
Debreu, Gerard. 1959. Theory of Value. New York, NY: John Wiley.
Filson, Darren, David Switzer, and Portia Besocke. 2005. “At the Movies: The Economics of Exhibition Contracts,” Economic Inquiry 43(2): 354-69.
Gibbons, Robert. 2005. “Four Formal(izable) Theories of the Firm?” Journal of Economic Behavior and Organization xx: yy-zz.
Gil, Ricard. 2013. “The interplay of formal and relational contracts: Evidence from movies,” Journal of Law, Economics, and Organization 29(3): 681-710.
Gil, Ricard, and Francine Lafontaine. 2012. “Using revenue sharing to implement flexible prices: Evidence from movie exhibition contracts,” Journal of Industrial Economics 60 (2): 187-219.
Gil, Ricard, and Giorgio Zanarone. 2015. “On the Determinants and Consequences of Informal Contracting.” Unpublished manuscript.
Grossman, Sanford. 1981. “An Introduction to the Theory of Rational Expectations Under Asymmetric Information.” Review of Economic Studies 48: 541-59.
Hanssen, F. Andrew. 2002. “Revenue-Sharing in Movie Exhibition and the Arrival of Sound,” Economic Inquiry 40(3): 380-402.
Klein, Benjamin. 1996. “Why Hold-ups Occur: The Self-Enforcing Range of Contractual Relationships.” Economic Inquiry 34: 444-63.

APRIL 2015 PAGE 29
BARRON, GIBBONS, GIL, AND MURPHY: REEL AUTHORITY
Klein, Benjamin. 2000. “The Role of Incomplete Contracts in Self-Enforcing Relationships,” Revue D’Économie Industrielle 92: 67-80.
Klein, Benjamin, and Kevin M. Murphy. 1988. “Vertical Restraints as Contract Enforcement Mechanisms.” Journal of Law and Economics 31: 265-97.
Macaulay, Stewart. 1963. “Non-Contractual Relations in Business: A Preliminary Study.” American Sociological Review 28: 55-67.
McMillan, John, and Christopher Woodruff. 1999. “Interfirm Relationships and Informal Credit in Vietnam.” Quarterly Journal of Economics 114: 1285-320.
Macchiavello, Rocco, and Ameet Morjaria. 2015. “The Value of Relationships: Evidence form a Supply Shock to Kenyan Rose Exports.” Unpublished manuscript.
Malcolmson, James. 2013. “Relational incentive contracts,” In Robert Gibbons and John Roberts (eds.), The Handbook of Organizational Economics, chapter 25, pp. 1014-1065 (Princeton University Press).
Mortimer, Julie. 2008. “Vertical Contracts in the Video Rental Industry,” The Review of Economic Studies 75(1): 165-199.
Raut, Sumit, Sanjeev Swami, Eunkyu Lee, and Charles B. Weinberg. 1998. “How Complex Do Movie Contracts Need to Be?” Marketing Science 27(4): 627-641.
Swami, Sanjeev, Jehoshua Eliashberg, and Charles B. Weinberg. 1999. “SilverScreener: A Modeling Approach to Movie Screens Management,” Marketing Science 18(3): 352-372.
Williamson, Oliver. 1971. “The Vertical Integration of Production: Market Failure Considerations.” American Economic Review 63: 316-25.
Williamson, Oliver. 1975. Markets and Hierarchies: Analysis and Antitrust Implications, New York, NY: Free Press.
Williamson, Oliver. 1991. “Comparative Economic Organization: The Analysis of Discrete Structural Alternatives.” Administrative Science Quarterly 36: 269-96.
Williamson, Oliver. 2000. “The new institutional economics: Taking stock, looking ahead.” Journal of Economic Literature 38: 595-613.

APRIL 2015 PAGE 30
BARRON, GIBBONS, GIL, AND MURPHY: REEL AUTHORITY
Figure 1. Contracted and Final Sharing Rates for “A Beautiful Mind” in Theaters
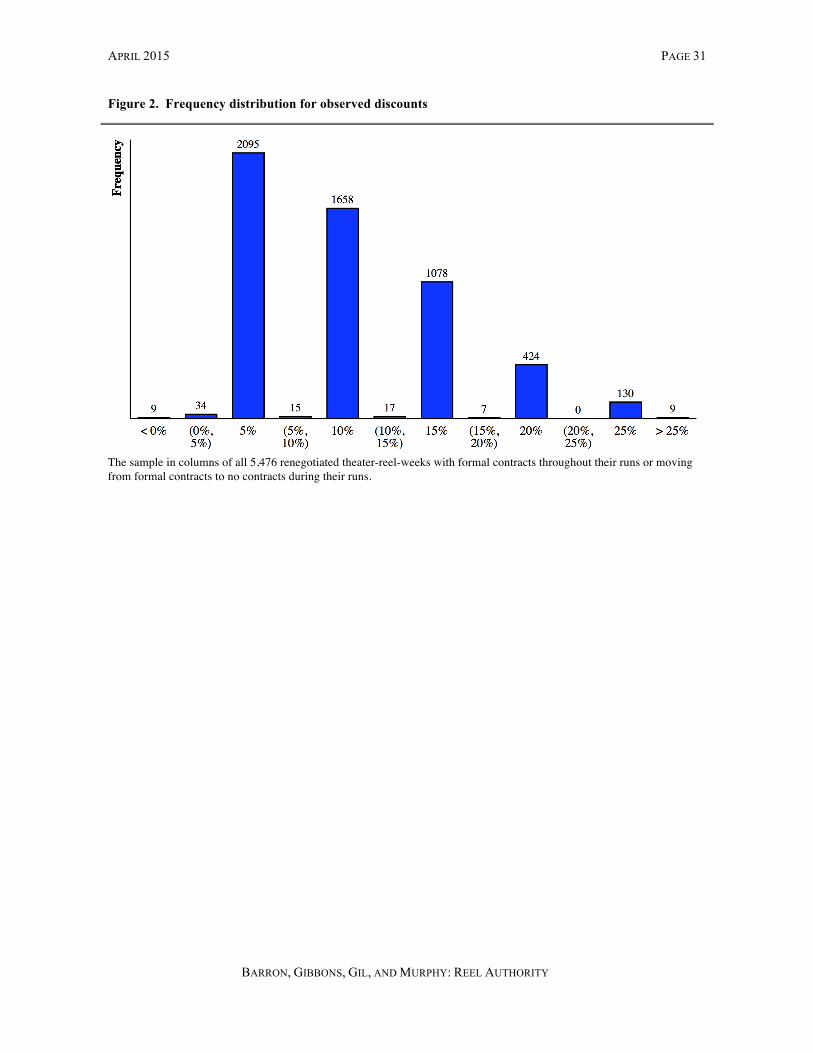
APRIL 2015 PAGE 31
BARRON, GIBBONS, GIL, AND MURPHY: REEL AUTHORITY
Figure 2. Frequency distribution for observed discounts
The sample in columns of all 5,476 renegotiated theater-reel-weeks with formal contracts throughout their runs or moving from formal contracts to no contracts during their runs.
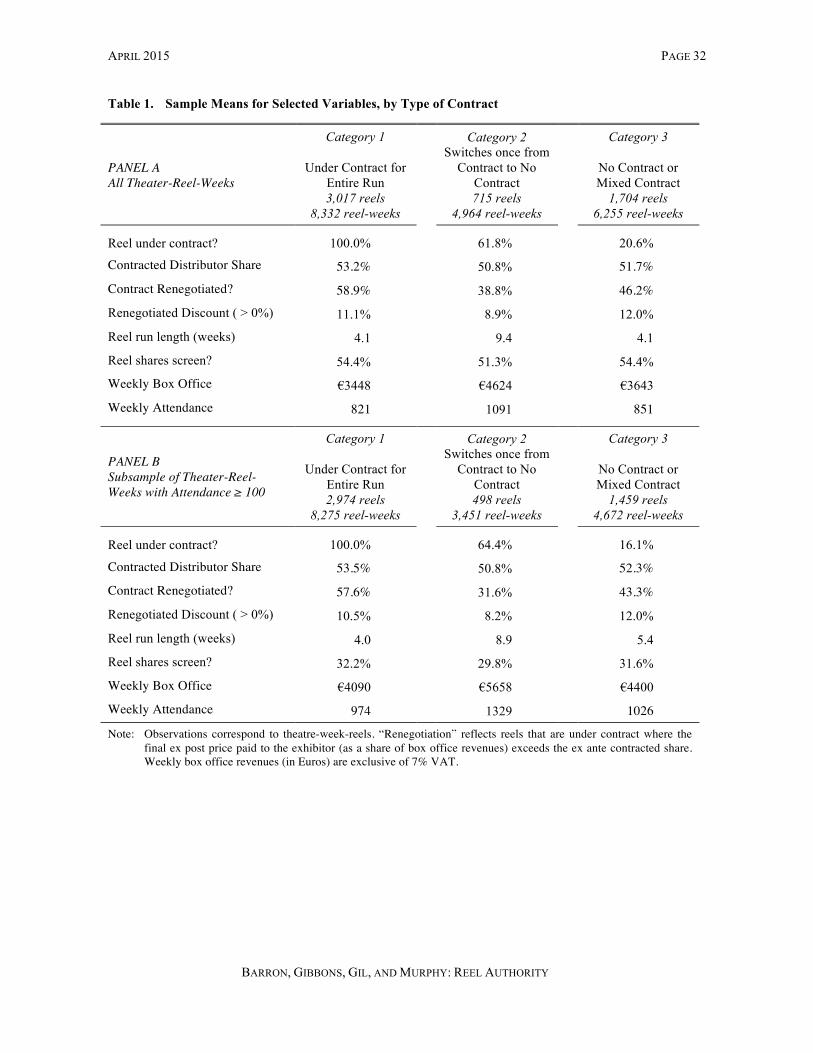
APRIL 2015 PAGE 32
BARRON, GIBBONS, GIL, AND MURPHY: REEL AUTHORITY
Table 1. Sample Means for Selected Variables, by Type of Contract
PANEL A All Theater-Reel-Weeks
Category 1
Under Contract for Entire Run 3,017 reels
8,332 reel-weeks
Category 2 Switches once from
Contract to No Contract 715 reels
4,964 reel-weeks
Category 3
No Contract or Mixed Contract
1,704 reels 6,255 reel-weeks
Reel under contract? 100.0% 61.8% 20.6%
Contracted Distributor Share 53.2% 50.8% 51.7%
Contract Renegotiated? 58.9% 38.8% 46.2%
Renegotiated Discount ( > 0%) 11.1% 8.9% 12.0%
Reel run length (weeks) 4.1 9.4 4.1
Reel shares screen? 54.4% 51.3% 54.4%
Weekly Box Office €3448 €4624 €3643
Weekly Attendance 821 1091 851
PANEL B Subsample of Theater-Reel-Weeks with Attendance ≥ 100
Category 1
Under Contract for Entire Run 2,974 reels
8,275 reel-weeks
Category 2 Switches once from
Contract to No Contract 498 reels
3,451 reel-weeks
Category 3
No Contract or Mixed Contract
1,459 reels 4,672 reel-weeks
Reel under contract? 100.0% 64.4% 16.1%
Contracted Distributor Share 53.5% 50.8% 52.3%
Contract Renegotiated? 57.6% 31.6% 43.3%
Renegotiated Discount ( > 0%) 10.5% 8.2% 12.0%
Reel run length (weeks) 4.0 8.9 5.4
Reel shares screen? 32.2% 29.8% 31.6%
Weekly Box Office €4090 €5658 €4400
Weekly Attendance 974 1329 1026
Note: Observations correspond to theatre-week-reels. “Renegotiation” reflects reels that are under contract where the final ex post price paid to the exhibitor (as a share of box office revenues) exceeds the ex ante contracted share. Weekly box office revenues (in Euros) are exclusive of 7% VAT.

APRIL 2015 PAGE 33
BARRON, GIBBONS, GIL, AND MURPHY: REEL AUTHORITY
Table 2 Negotiated Discounts for “A Beautiful Mind,” February 22, 2002 – April 19, 2002
Theater Week 1 Week 2 Week 3 Week 4 Week 5 Week 6 Week 7 Week 8 Week 9
Formal Sharing
Rate: 60% 60% 55% 55% 50% 50% 45% 45% 40%
1 5% 10% 10% 15% 10% 5% 2 10% 10% 10% 10% 10% 15% 15% 3 5% 0% 5% 5% 10% 15% 15% 4 0% 10% 5% 10% 10% 15% 15% 5 0% 5% 10% 5% 5% 10% 15% 6 0% 0% 0% 10% 5% 0% 15% 7 0% 0% 0% 0% 0% 10% 10% 8 0% 0% 0% 0% 0% 5% 15% 9 0% 0% 0% 0% 0% 0% 15%
10 0% 10% 10% 15% 10% 0% 15% 15% 11 0% 5% 0% 5% 0% 0% 10% 15% 12 0% 0% 0% 5% 0% 0% 5% 15% 13 0% 0% 0% 0% 0% 0% 5% 15% n/c 14 0% 0% 0% 0% 0% 0% 0% 5% n/c 15 0% 0% 0% 0% 0% 0% 0% 5% n/c 16 0% 0% 0% 0% 0% 0% 0% 5% n/c 17 0% 0% 0% 0% 0% 0% 0% 0% n/c 18 0% 0% 0% 0% 0% 0% 0% 0% n/c 19 0% 0% 0% 0% 0% 0% 0% 0% n/c 20 0% 0% 0% 0% 0% 0% 0% 5% 10% 21 0% 0% 0% 0% 0% 0% 0% 5% 0% 22 0% 0% 0% 0% 0% 0% 0% 0% 0%
Note: Data reflect the first-reel of “A Beautiful Mind” shown in 22 theaters over its first nine weeks of release. “Negotiated Discount” is the difference between the ex ante and ex post share of box office revenues paid to the distributor. Bold face font indicates the reel shared the screen with one or more movies during the week (reels with fewer than 100 attendees were excluded). “n/c” denotes that the reel was shown, but we do not have contract data.
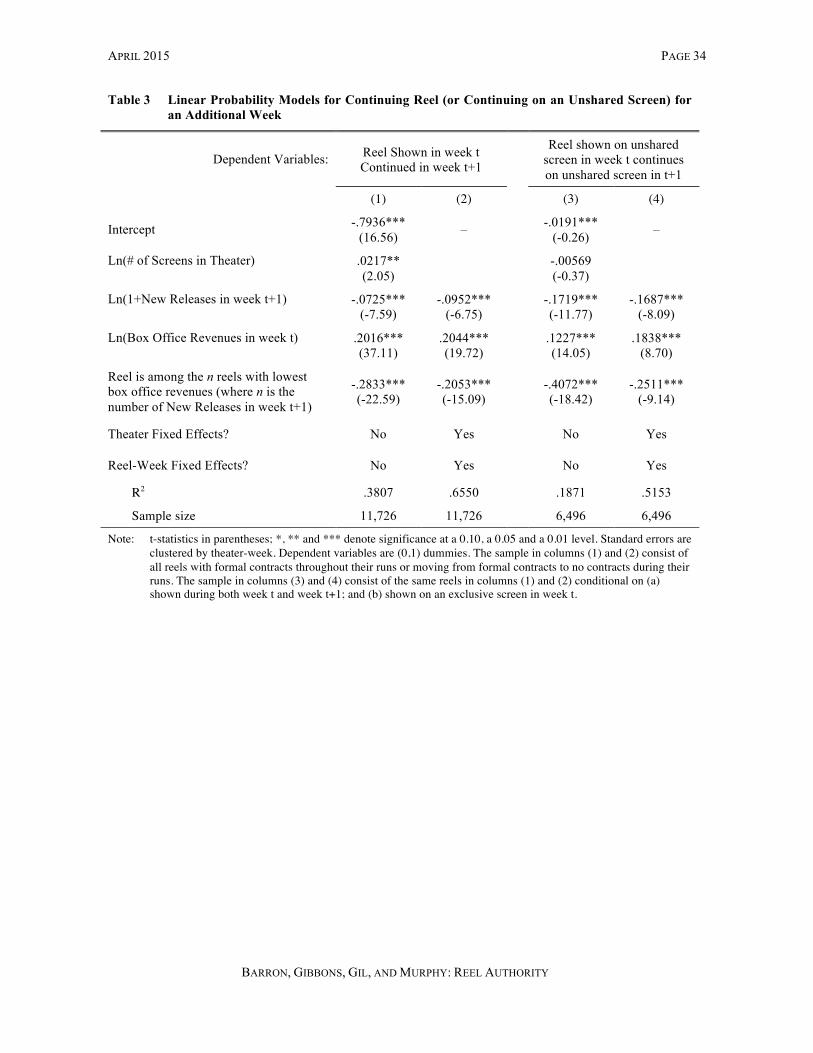
APRIL 2015 PAGE 34
BARRON, GIBBONS, GIL, AND MURPHY: REEL AUTHORITY
Table 3 Linear Probability Models for Continuing Reel (or Continuing on an Unshared Screen) for an Additional Week
Dependent Variables: Reel Shown in week t Continued in week t+1
Reel shown on unshared screen in week t continues on unshared screen in t+1
(1) (2) (3) (4)
Intercept -.7936*** (16.56) – -.0191***
(-0.26) –
Ln(# of Screens in Theater) .0217** (2.05) -.00569
(-0.37)
Ln(1+New Releases in week t+1) -.0725*** (-7.59)
-.0952*** (-6.75) -.1719***
(-11.77) -.1687***
(-8.09)
Ln(Box Office Revenues in week t) .2016*** (37.11)
.2044*** (19.72) .1227***
(14.05) .1838***
(8.70)
Reel is among the n reels with lowest box office revenues (where n is the number of New Releases in week t+1)
-.2833*** (-22.59)
-.2053*** (-15.09) -.4072***
(-18.42) -.2511***
(-9.14)
Theater Fixed Effects? No Yes No Yes
Reel-Week Fixed Effects? No Yes No Yes
R2 .3807 .6550 .1871 .5153
Sample size 11,726 11,726 6,496 6,496
Note: t-statistics in parentheses; *, ** and *** denote significance at a 0.10, a 0.05 and a 0.01 level. Standard errors are clustered by theater-week. Dependent variables are (0,1) dummies. The sample in columns (1) and (2) consist of all reels with formal contracts throughout their runs or moving from formal contracts to no contracts during their runs. The sample in columns (3) and (4) consist of the same reels in columns (1) and (2) conditional on (a) shown during both week t and week t+1; and (b) shown on an exclusive screen in week t.

APRIL 2015 PAGE 35
BARRON, GIBBONS, GIL, AND MURPHY: REEL AUTHORITY
Table 4 Prevalence of Renegotiation and Average Discounts (conditional on Renegotiation) for Continuing Reels (or Continuing on Unshared Screen), by Predicted Continuation Probabilities
Percentage
Renegotiated Average Discount
Average Discount
(Discount > 0)
Panel A. Predicted Continuation Probability from Table 2, Column (2) (n=6,909) (1) (2) (3)
Lowest Quintile (least likely to continue) 66.8% 7.7% 11.5% Second Quintile 62.6% 6.7% 10.7% Third Quintile 53.8% 5.2% 9.7% Fourth Quintile 48.6% 4.5% 9.2% Highest Quintile (most likely to continue) 38.4% 3.2% 8.4%
Panel B. Predicted Probabilities of Continuing on Unshared Screen (conditional on continuation) from Table 2, Column (4) (n=2,819)
(1)
(2)
(3)
Lowest Quintile (least likely to continue unshared) 48.0% 4.1% 8.5% Second Quintile 43.8% 3.8% 8.8% Third Quintile 43.1% 3.8% 8.7% Fourth Quintile 38.1% 3.1% 8.2% Highest Quintile (most likely to continue unshared) 34.6% 2.7% 7.8%
Note: Observations correspond to theater-week-reels. “Renegotiation” reflects reels that are under contract where the final ex post price paid to the exhibitor (as a share of box office revenues) exceeds the ex ante contracted share. “Discount” is the difference between the ex ante and ex post share paid to the distributor. Predicted Continuation Probabilities in Panel A are from the linear probability regressions in column (2) of Table 2, and reflect the probability that the exhibitor will show the reel for an additional week. Predicted Probabilities of Continuing on Unshared Screen in Panel B are from the linear probability regressions in column (4) of Table 2, and reflect the probability that the exhibitor will show the reel on an exclusive screen in week t+1, conditional on (a) showing the reel during both week t and week t+1; and (b) showing the reel on an exclusive screen in week t. The table entries in each column in Panel A are all significantly different from each other at the 1% or better with only two exceptions: the first- and second-quintile in column (1) and the third- and fourth-quintile in column (3) are significantly different from each other at the 5% level. The table entries in each column in Panel B are not all significantly different from each other. However, the table entries for the first three quintiles in each column are significantly higher than the table entries for the fifth quintile at the 5% level or better (with the exception of the difference between first quintile in column (1) (8.5%) and last quintile (7.8%), which are significantly different with probability p=.063.

APRIL 2015 PAGE 36
BARRON, GIBBONS, GIL, AND MURPHY: REEL AUTHORITY
Table 5 Box Office Revenues, (Proxies for) Opportunity Costs, and Renegotiated Discounts for Week 7 of “A Beautiful Mind”
Theater
Box Office Revenues for “A Beautiful
Mind”
Box Office Revenues for Best Reel in Prior Week Dropped in
Current Week
Box Office Revenues for Best Shared
Reel in Current Week
Renegotiated Discount
(1) (2) (3) (4) 2 € 873 € 1,403 € 2,835 15% 3 € 441 € 1,330 € 2,942 15% 4 € 1,773 € 2,267 € 3,596 15% 5 € 2,636 € 3,352 . 15% 6 € 2,740 € 4,845 € 2,754 15% 8 € 2,262 € 1,450 € 3,832 15% 9 € 2,041 € 701 € 8,958 15%
10 € 2,360 € 3,700 € 2,094 15% 7 € 2,631 € 1,513 € 1,480 10%
11 € 2,514 € 1,868 € 6,658 10% 12 € 2,306 . € 3,232 5% 13 € 3,068 € 4,308 € 4,348 5% 14 € 5,006 € 2,404 € 3,298 0% 15 € 5,540 € 1,860 € 5,199 0% 16 € 4,109 € 4,204 € 4,894 0% 17 € 5,487 € 4,232 € 7,595 0% 18 € 7,926 € 3,096 € 7,174 0% 19 € 5,844 € 6,531 € 5,441 0% 20 € 5,110 € 4,536 € 4,258 0% 21 € 8,500 € 5,824 € 15,300 0% 22 € 13,172 € 1,018 . 0%

APRIL 2015 PAGE 37
BARRON, GIBBONS, GIL, AND MURPHY: REEL AUTHORITY
Table 6 Linear Probability Models for the Probability of Renegotiation
Dependent Variable =1 if Contract is Renegotiated, 0 Otherwise
(1) (2) (3)
Dummy if (Best Dropped Reel)t-1 > (β × Revenuest) .1033*** (9.83) .0983***
(8.24)
Dummy if (Best Shared Reel)t > (β × Revenuest) .0402*** (3.40)
.0292** (2.47)
Theater Fixed Effects? Yes Yes Yes
Reel-Week Fixed Effects? Yes Yes Yes
R2 .7053 .7066 .7152
Sample size 9,618 8,428 7,798
Note: t-statistics in parentheses; *, ** and *** denote significance at a 0.10, a 0.05 and a 0.01 level. Standard errors are clustered by theater-week. Observations correspond to theater-week-reels. The dependent variable “Renegotiation” is a (0,1) dummy variable equal to 1 for reel-weeks where the final ex post price paid to the exhibitor (as a share of box office revenues) exceeds the ex ante contracted share.

APRIL 2015 PAGE 38
BARRON, GIBBONS, GIL, AND MURPHY: REEL AUTHORITY
Table 7 OLS Regressions for the Magnitude of the Negotiated Discount for Contracted Reels
Dependent Variable = Ex Post Final Share less Ex Ante Contracted Share
(1) (2) (3)
Ratio of (Best Dropped Reel)t-1 to (Revenues)t .00555*** (6.17) .00408***
(3.92)
Ratio of (Best Shared Reel)t to (Revenues)t .00224*** (7.58)
.00147*** (4.15)
Contracted Share (β) -.5672*** (-17.41)
-.5995*** (-16.47)
-.6192*** (-16.84)
Theater Fixed Effects? Yes Yes Yes
Reel-Week Fixed Effects? Yes Yes Yes
R2 .7961 .8002 .8074
Sample size 9,618 8,428 7,798
Note: t-statistics in parentheses; *, ** and *** denote significance at a 0.10, a 0.05 and a 0.01 level. Standard errors are clustered by theater-week. Observations correspond to theater-week-reels. The dependent variable is the difference between the final ex post price paid to the exhibitor and the ex ante contracted share. The contracted share (β) is the share of box-office revenues contractually guaranteed to the exhibitor. “Best Dropped Reel” is the highest box office revenues in the prior week for reels shown in week t-1 but not in week t. “Best Shared Reel” is the highest box office revenues in the current week of any reel shown in the current week (except the focal reel, if that reel were shared in the current week).

APRIL 2015 PAGE 39
BARRON, GIBBONS, GIL, AND MURPHY: REEL AUTHORITY
APPENDIX 1
The purpose of this Appendix is to explore how reasonable is the threshold of 100 weekly
attendees to separate “Prime-Time” shows from matinees and late night shows that do not
necessarily compete for screen space. We must take a stand on this threshold because our
data does not include show times or number of weekly shows per movie showing in a theater
in a given week. Some movies are likely to show at all times while others may show only a
handful of times and at odd times, therefore it is important to understand when a movie is
competing for a screen when screen and capacity constraint are binding (that is, in prime
time). For this reason, we collected data from two well-known Spanish newspapers (La
Vanguardia and El Pais) with time schedules for 12 theaters in our data set located in the
provinces of Barcelona and Madrid between January 2001 and June 2001. This subsample
contains 2304 observations (out of 19291 in the total data set). In this appendix we aim to (1)
note how different this subsample is from our full sample, and (2) how reasonable our
threshold of 100 weekly attendees is given that we are able to observe what movies ONLY
show outside of “Prime-Time”.
Let us start by exploring differences between this subsample and our full sample. See in
the graph below that the distribution of attendance of the subsample and the rest of the
sample are very similar, and if anything, the rest of the subsample has more data points in the
low range of the distribution. This can be explained by the fact that movie theaters outside
Madrid and Barcelona (two largest cities in Spain) are newer and larger (more screens) and
these screens tend to be smaller on average than those located in larger cities (older theaters
with less screens).

APRIL 2015 PAGE 40
BARRON, GIBBONS, GIL, AND MURPHY: REEL AUTHORITY
When focusing on our subsample of theaters, we define time schedules by prime time
(shows starting between 3pm and midnight) and outside prime time (either matinees that start
before 3 pm, or late night shows starting after midnight). Out of the 2304 observations in this
subsample, 215 week/theater/movie/screen observations (roughly 10%) belong to movies
ONLY playing outside prime-time (either matinees) or/and late night shows). If anything, in
this subsample Madrid theaters are more likely to play late night shows and Barcelona
theaters more likely to play matinees.
In the graph below we explore differences in distribution of attendance for both groups of
movies. One can easily see that the distribution of revenues of prime time and no prime time
movies is radically different although they share almost the same support. While revenues of
movies playing in “Prime Time” are evenly spread across the support, movies only playing
outside “Prime Time” are heavily skewed and concentrated towards low levels of attendance.
0.0
002
.000
4.0
006
.000
8.0
01
0 2000 4000 6000 8000 10000Weekly Attendance
Rest of Sample 2304 obs subsample
Attendance Distribution of Subsample & Rest of Sample

APRIL 2015 PAGE 41
BARRON, GIBBONS, GIL, AND MURPHY: REEL AUTHORITY
Finally, let us now explore how different threshold levels affect the two distribution of
movies (“Prime Time” versus outside “Prime Time”). So far in the paper we have chosen a
cutoff of 100 weekly attendees. According to our subsample, 67% of observations of movies
only playing outside of prime time are below 100 attendees, while 4.8% movies playing in
prime time are below 100 attendees. We calculate the resulting percentages for other
thresholds ranging between 50 and 200 weekly attendees in increments of 25 taking into
account that movies playing outside “Prime Time” represent roughly 10% of our subsample.
We show the results of this exercise in the table below.
Percentile Prime Time Movies
Percentile No Prime Time Movies
X<50 1.8% 35%
X<75 3.2% 54%
X<100 4.8% 67%
X<125 6.4% 75%
X<150 8% 77.1%
X<175 9.9% 80.5%
X<200 11.4% 82.1%
0.0
02.0
04.0
06.0
08
0 2000 4000 6000 8000Weekly Attendance
Prime Time No Prime Time
Attendance Distribution of Movies Outside Prime Time

APRIL 2015 PAGE 42
BARRON, GIBBONS, GIL, AND MURPHY: REEL AUTHORITY
Note that a cutoff of 100 seems a reasonable choice because only 4.8% of “Prime-Time”
movies are below such threshold while more than two thirds of movies only screening
outside “Prime-Time” fall in this category. Given the 9-1 ratio between both groups in the
data, increasing the ratio does not seem to justify the increase in probability of eliminating
movies outside “Prime-Time”.
Overall, movies in “Prime_Time” average 1120 weekly attendees while movies that only
play outside “Prime-Time” average 206 attendees. The fact that the latter is way above 100
comes from the fact that this is highly skewed: the median is 837 for the former and 71 for
the latter, so the distribution for the latter seems more skewed than that of the former. Note as
well that there may be error in the reporting for the scheduling times of some of these movies
that appear as only showing only OUTSIDE prime time. While the 95th percentile of no
prime time movies is 571 attendees (very reasonable number), the 99th percentile is 4364
attendees and the four largest values are 2167, 4364, 4412 and 6665 attendees, respectively.
We checked the identity of these movies scoring so high, and we found that these are US
blockbusters such as “Unbreakable”, “What Women Want”, and “What Lies Beneath” during
their first or second weeks after release. This anomaly, if anything, strengthens the likelihood
of measurement and coding error and works in our favor when making the choice of 100
weekly attendees as our threshold.