ref gali-esys-dd112 galilei - european gnss agency · gali-esys-dd112 19 june 2003 market...
TRANSCRIPT

GALILEIREF :
DATE :
GALI-ESYS-DD112
19 June 2003
Market Intelligence Briefing 3 - Vol 3 ISSUE : 4.1.1 PAGE: 1
Sustainable Mobility and IntermodalityPromoting Competitive and Sustainable Growth
GALILEI
Market Intelligence Briefing 3 - Vol 3
Written by Responsibility - Company Date Signature
Oliver Greening, Project consultant, ESYS 19 June 2003
Verified by
Jon Styles Project Manager, ESYS 19 June 2003
Certified by
Mike Dillon Managing Director, ESYS 19 June 2003
WBS Code : H.4.BClassification : RE

GALILEIREF :
DATE :
GALI-ESYS-DD112
19 June 2003
Market Intelligence Briefing 3 - Vol 3 ISSUE : 4.1.1 PAGE: 2
THE INFORMATION IN THIS DOCUMENT IS PROVIDED AS ISAND NO GUARANTEE OR WARRANTY IS GIVEN THAT THE
INFORMATION IS FIT FOR ANY PURPOSE. THE USER THEREOFUSES THE INFORMATION AT ITS SOLE RISK AND LIABILITY.
FURTHERMORE, DATA, CONCLUSIONS ORRECOMMENDATIONS IN THIS REPORT ARE PROVIDED ON THE
BASIS THAT SUCH INFORMATION IS SUBSEQUENTLY, ANDPRIOR TO USE, VERIFIED BY THE PARTY WISHING TO USE
THAT INFORMATION.

GALILEIREF :
DATE :
GALI-ESYS-DD112
19 June 2003
Market Intelligence Briefing 3 - Vol 3 ISSUE : 4.1 PAGE: 3
CHANGE RECORDS
ISSUE DATE § : CHANGE RECORD AUTHOR
A 25 January 03 First draft OG
B 13 February Update After Internal Review JS
C 19 May 2003 Update in light of GISS comments and review of figures.New figures for gross revenues based on revised pricingassumptions for road mass market equipment agreed withthe GISS. This has resulted in a reduction in purchaserevenues but an increase in service revenues for thesemarkets
NC, BJ
4.1 3 June 2003 Final updates and issue change. NC, BJ
4.1.1 19 June 2003 Minor corrections to some data in annual sales figuresdue to spreadsheet transcription errors in issue B, C and4.1
JS
GALILEIREF :
DATE :
GALI-ESYS-DD112
19 June 2003
Market Intelligence Briefing 3 - Vol 3 ISSUE : 4.1 PAGE: 4
TABLE OF CONTENTS
1 INTRODUCTION............................................................................................................................ 8
1.1 SCOPE AND PURPOSE ............................................................................................................ 81.2 REFERENCES ............................................................................................................................ 91.3 ACRONYMS AND ABBREVIATIONS ................................................................................. 111.4 METHODOLOGY .................................................................................................................... 131.4.1 Mapping of GALA applications to GMO Market Sectors ..................................................131.4.2 GMO model .............................................................................................................................151.4.3 Overview of GMO Model .......................................................................................................161.4.4 Application changes ................................................................................................................17
2 KEY ASSUMPTIONS ................................................................................................................... 18
2.1 SCOPE AND PURPOSE .......................................................................................................... 182.2 THE NATURE OF GMO ASSUMPTIONS ........................................................................... 182.3 GALILEO PROGRAMMATICS ASSUMPTIONS............................................................... 202.4 GALILEO SIGNALS AND SERVICES ASSUMPTIONS.................................................... 212.4.1 Signals and Frequencies .........................................................................................................212.4.2 Open Service............................................................................................................................212.4.3 Commercial Service ................................................................................................................222.4.4 Safety of Life service...............................................................................................................222.4.5 Public regulated service..........................................................................................................222.4.6 Search and Rescue service......................................................................................................222.5 LOCAL AUGMENTATION ASSUMPTIONS ...................................................................... 222.6 DOWNSTREAM PRODUCTS & SERVICES ASSUMPTIONS ......................................... 232.6.1 Equipment ...............................................................................................................................232.6.2 Services ....................................................................................................................................242.7 GALILEO COMMERCIALISATION ASSUMPTIONS...................................................... 242.7.1 Value-adding offer ..................................................................................................................242.7.2 Market development activities...............................................................................................242.8 BENEFITS ANALYSIS ............................................................................................................ 242.9 EXTERNAL FACTORS........................................................................................................... 252.9.1 GPS Developments..................................................................................................................252.9.2 GLONASS ...............................................................................................................................252.9.3 GNSS Market Developments .................................................................................................25
3 SERVICE MAPPING .................................................................................................................... 26
GALILEIREF :
DATE :
GALI-ESYS-DD112
19 June 2003
Market Intelligence Briefing 3 - Vol 3 ISSUE : 4.1 PAGE: 5
4 MARKET RESULTS..................................................................................................................... 29
4.1.1 Changes with respect to GALA study ...................................................................................294.2 NUMBER OF USERS............................................................................................................... 314.3 UNIT SALES ............................................................................................................................. 384.4 PURCHASE REVENUES ........................................................................................................ 424.4.1 Gross purchase revenues........................................................................................................424.4.2 Net Purchase Revenues...........................................................................................................46
GALILEIREF :
DATE :
GALI-ESYS-DD112
19 June 2003
Market Intelligence Briefing 3 - Vol 3 ISSUE : 4.1 PAGE: 6
LIST OF FIGURES
Figure 1-1: GMO model structure ........................................................................................... 16Figure 1-2: Illustration of the origins of net and gross revenues for GNSS products.............. 17Figure 2-1: Categorisation of GMO assumptions with examples............................................ 19Figure 2-2: Schematic of Galileo market uptake by the consumer markets ............................ 20Figure 2-3: Illustration of a generic supply chain for products and services ........................... 23Figure 4-1: GNSS user numbers by region.............................................................................. 32Figure 4-2: GNSS user numbers by market sector .................................................................. 33Figure 4-3: Galileo user numbers by region ............................................................................ 34Figure 4-4: Galileo user numbers by market sector................................................................. 35Figure 4-5: Galileo Open Service (OS) user numbers by region............................................. 36Figure 4-6: Galileo Safety of Life (SoL) user numbers by region........................................... 37Figure 4-7: GNSS unit sales by region .................................................................................... 38Figure 4-8: Galileo unit sales by region................................................................................... 39Figure 4-9: GNSS unit sales by market sector......................................................................... 40Figure 4-10: Galileo unit sales by market sector ..................................................................... 41Figure 4-11: GNSS gross purchase revenues by region .......................................................... 42Figure 4-12: Galileo gross purchase revenues by region......................................................... 43Figure 4-13: GNSS gross purchase revenues by market sector ............................................... 44Figure 4-14: Galileo gross purchase revenues by market sector ............................................. 45Figure 4-15: GNSS net purchase revenues by market sector................................................... 46Figure 4-16: Galileo net purchase revenues by market sector ................................................. 47Figure 4-17: GNSS net purchase revenues by region.............................................................. 48Figure 4-18: Galileo net purchase revenues by region ............................................................ 49
LIST OF TABLES
Table 1-1: List of References................................................................................................... 11Table 3-1: Mapping of GMO market sectors and GALA applications to Galileo services ..... 28Table 4-1: Summary of key market data changes with respect to the GALA study................ 31Table 4-2: Selected annual data for GNSS user numbers by region........................................ 32Table 4-3: Selected annual data for GNSS user numbers by market sector ............................ 33Table 4-4: Selected annual data for Galileo user numbers by region ...................................... 34Table 4-5: Selected annual data for Galileo user numbers by market sector........................... 35

GALILEIREF :
DATE :
GALI-ESYS-DD112
19 June 2003
Market Intelligence Briefing 3 - Vol 3 ISSUE : 4.1 PAGE: 7
Table 4-6: Selected annual data for Galileo Open Service (OS) user numbers by region (basedon the service mapping contained in chapter 3)............................................................... 36
Table 4-7: Selected annual data for Galileo Safety of Life (SoL) user numbers by region(based on the service mapping contained in chapter 3) ................................................... 37
Table 4-8: Selected annual data for GNSS unit sales by region .............................................. 38Table 4-9: Selected annual data for Galileo unit sales by region............................................. 39Table 4-10: Selected annual data for GNSS unit sales by market sector................................. 40Table 4-11: Selected annual data for Galileo unit sales by market sector ............................... 41Table 4-12: Selected annual data for GNSS gross purchase revenues by region .................... 42Table 4-13: Selected annual data by Galileo gross purchase revenues by region ................... 43Table 4-14: Selected annual data for GNSS gross purchase revenues by market sector ......... 44Table 4-15: Selected annual data for Galileo gross purchase revenues by market sector ....... 45Table 4-16: Selected annual data by GNSS net purchase revenues by market sector ............. 46Table 4-17: Selected annual data by Galileo net purchase revenues by market sector............ 47Table 4-18: Selected annual data by GNSS net purchase revenue by region .......................... 48Table 4-19: Galileo net purchase revenues by region.............................................................. 49

GALILEIREF :
DATE :
GALI-ESYS-DD112
19 June 2003
Market Intelligence Briefing 3 - Vol 3 ISSUE : 4.1 PAGE: 8
1 INTRODUCTION
This document forms part of the third Market Intelligence Briefing (MIB3), produced underWork Package H of the GALILEI project. The MIB comprises 3 volumes.
Volume 1: Executive summary – provides a high level summary of the key resultsand messages from the second phase of the GMO study.
Volume 2: Key Markets and Issues – provides the most significant market updatesto the previous GALA Market Assessment in 1999. In particular, itdescribes in detail the characteristics and results for the Personalmobility, Road vehicles, Asset Management and Aviation markets.Likely outcomes for the future are described by means of scenarios
Volume 3: Overall Findings and Results – provides the GMO methodology, keyassumptions and consolidated results across all 9 market segments andover 90 applications areas.
This is Volume 3. It presents the GMO methodology and key assumptions, as well asconsolidated results of GNSS and Galileo user numbers, unit sales and purchase revenues byregion and by market sector. The market research output presented here represents the “mostlikely” case scenario. These Volume 3 findings are based on the in-depth analysis for theselected markets covered in Volume 2 as well as modified GALA figures for all otherapplications.
1.1 SCOPE AND PURPOSE
As a civil controlled satellite navigation system, Galileo will enable the development of awide range of mass-market commercial and public services to be operated safely and reliably.In this context, the Galileo Market Observatory (GMO) task aims to:� Better understand the size, structure and characteristics and likely development of all the
markets that Galileo will serve.� Identify potential revenues from these markets.� Estimate the benefits returned to European users and businesses.� Understand the structure of the supply chain and to consider the competitiveness of
European industry in these markets.
The latest results of this work are presented here in MIB 2 – the second in a series of threemarket information briefings. These analyses have built upon the results of the EC’s GALAand GEMINUS studies, as well as one carried out by Technomar GmbH, in 2000 and early2001. These inputs have been consolidated into one study, and validated and improved byfurther market research, especially in certain high priority market areas. The GALA andTechnomar reports [R.1 and R.2] are recommended background reading for furtherunderstanding of this extensive GNSS market assessment.

GALILEIREF :
DATE :
GALI-ESYS-DD112
19 June 2003
Market Intelligence Briefing 3 - Vol 3 ISSUE : 4.1 PAGE: 9
These Market Information Briefings serve a wide range of stakeholders; from the Galileodesign and development team to the end-user of the foreseen Galileo applications. TheEuropean Commission(EC) is interested in a programme that will maximise the marketuptake, and therefore also the public good benefits, the competitiveness of European industryand the likely revenues accruing to the GALILEO operator. The European Space Agency(ESA) aims to design and develop a satellite navigation system that is better tailored to theneeds of the users, especially for safety-of-life and public applications. The downstreamindustry in Europe is interested in the commercial value of the different markets for satellitenavigation, as well as the opportunities posed by Galileo. The end user would like improvedreliability and ‘value-added’ from satellite navigation applications in general.
1.2 REFERENCES
The references relevant to this document are identified in Table 1-1.
Id. Title
R.1 GALA Market Research Methods and Overall Results: Volumes 1 & 2, GALA-RACAL-DD005, Issue 3, 22 Feb 01.
R.2 Structural Analysis of the European Satellite Navigation Application Segment,Technomar, Final Report, October 2000.
R.3 User Terminal Classification Analysis, GALI-TNAV-DD40, 22 February 2002.
R.4 ‘Caller Location in Telecommunication Networks in view of enhancing 112 EmergencyServices’, Helios Technology, 30 April 2002.
R.5 Galilei TN Market Industrial Consultation, GALI-TPZ-002, 15 January 2003.
R.6 Technical Note on Galileo Service Definition, GALI-TATMLtd-DD010, Issue 1, 2December 2002.
R.7 EGNOS Multi-Modal Costs and Benefits – A study of the aviation case in ECACproduced by the ETG, 13 Dec 1999.
R.8 GNSS Aviation Needs – A Common Aviation Community Position, GNS/GAL/WP01,Eurocontrol, May 2001.
R.9 An assessment of Air Traffic Management in Europe during the Calendar Year 2000 bythe Performance Review Commission, PRR 4, April 2001
R.10 Air Traffic Statistics and Forecasts (STATFOR): Medium Term Forecast of AnnualNumber of IFR Flights (2002-2009), Volume 1 Edition 1.0, 14 March 2002.
R.11 Galilei Working Paper on Intellectual Property Rights, WP I.6, Verson 2.1.R.12 Technical Note: Chip Royalty Revenues, Telespazio, Draft, May 2002.R.13 Galileo Mission Requirements Document, Issue 5.0, 25 October 2002.R.14 Galileo Mission Requirements Document - Justification, Issue 1, 4 May 2001.R.15 User Needs Analysis – GALI-TTL-DD114, 17th January, 2003
R.16 Market Intelligence Briefing 1 (MIB1) – Volume 2 Market Results and Volume 3Principal Issues

GALILEIREF :
DATE :
GALI-ESYS-DD112
19 June 2003
Market Intelligence Briefing 3 - Vol 3 ISSUE : 4.1 PAGE: 10
Id. TitleR.17 Technical Note: Benefits Assessment of Galileo, ECORYS, Issue 1, 3 February 2003.R. 18 Response to ESYS questions at EOIG/ESYS meeting at AENA, Madrid 4 July 2002
R.19 Market Intelligence Briefing 2 (MIB2) – Volume 2 Key Markets and Issues and Volume3 Overall Market Results
R.20 Galileo Service Definition – Part 1 Introduction to Galileo Services, GALI-TATMLtd-DD-10, 17 September 2002.
R.21 Annex 2B, MRD Issue 5.0, 25 October 2002R.22 GALI-TNAV-DD-40, User Terminal Classification Analysis, 22 Feb 2002.
R.23 The Economist, 17 August 2002, article on ‘Surveillance – Something to watch overyou’
R.24 Technical Note Road Market; Report for GMO MIB3, ARCS, December 2002
R.25“Telematikanwendungen in der Automobilindustry”, Presentation of R. Horn, SeniorAssociate of Booz, Allen & Hamilton, February 2002, Mercatorpark Workshop,Munich/Ottobrunn, Germany.
R.26 “How Telematics will impact the Customer and the Industry”, Presentation, K. Lees, FordMotor Company.
R.27 Accenture: “European Telematics Survey”, April 2002.
R.28 Press Release of MAN Truck & Bus UK: “ European CV Manufacturers TelematicSystems-Conformity Statement” - http://www.man.co.uk/news/02/conformity.asp.
R.29 Allied Business Intelligence:”Fleet Management Systems”, Report issued in 2002.
R.30Ian Catling: A Review Of Electronic Fee Collection (EFC) Using Vehicle PositioningSystems (VPS), and of Prospects for the Future, Paper presented at the ITS Conference2002, San Diego, USA.
R.31 Figures are the latest available in 2002 from various sources: Eurostat Yearbook 2001,www.worldbank.org, www.worldlanguage.com.
R.32 Based on a paper: Enabling Technologies and Architecture Requirements for Realisationof ADAS. Schwarz, Schiele and Naab of BMW, ITS World Congress 2002
R.33 The Market Response to Adaptive Cruise Control, ITS World Congress 2002, by Yahagi,Satoru, Yanai and Yoko of the Nissan Motor Company Ltd.
R.34 GALA-RACAL-DD-005 Vol 2 Issue 3 dated 22 Feb 2001, Annex A4
R.35ROSETTA (Real Opportunities for Exploitation of Transport Telematics Applications)Extracts from a draft paper “Radio Navigation – A New Age for Land Based Mobility byRobert Tremlet dated 25 Sep 2002.
R.36 EUROCONTROL, Transition plan for the implementation of the navigation strategy inECAC, 2000.
R.37 ITU-R Recommendation M1371R.38 Council Regulation 2846/98/EC
R.39 Revenue Generating Potential for the GOC – A summary, PriceWaterhouseCoopers,December 2002
GALILEIREF :
DATE :
GALI-ESYS-DD112
19 June 2003
Market Intelligence Briefing 3 - Vol 3 ISSUE : 4.1 PAGE: 11
Id. TitleR.40 Galilei Working Paper on IPR for Galileo – Input for PWC Phase II report, Brad SmithR.41 World Container Census 2002
R.42 European transport Policy for 2010: Time to Decide. COM (2001) 370 FinalR.43 Global Cellular market forecasts to 2010 (3rd Edition), Baskerville, April 2002
R.44 Western European Cellular handset market: Outlook and forecast 1998-2007. StrategyAnalytics, May 2002
R.45 North American wireless handset market: Outlook and forecast 1998-2007, StrategyAnalytics, May 2002
Table 1-1: List of References
1.3 ACRONYMS AND ABBREVIATIONS
The following is a list of acronyms used within this document.
3G Third Generation3GPP Third Generation Partnership ProjectADAS Advanced Driver AssistanceA-GPS Assisted GPSALI Automatic Location IdentificationAOA Angle Of ArrivalAOPA Airline Operators and Pilots AssociationATM Air Traffic ManagementAIS Automatic Identification SystemCA Certification AuthorityCBA Cost Benefit AnalysisCDMA Code Division Multiple AccessCS Commercial ServiceDGPS Differential GPSDME Distance Measuring EquipmentDVB Digital Video BroadcastingE-112 Enhanced 112E-911 Enhanced 911EC European CommissionECAC European Civil Aviation AuthorityECB European Central BankEDGE Enhanced Data rates for GSM EvolutionEEIG European Economic Interest GroupEFC Electronic Fee CollectionEGNOS European Geo-stationary Navigation Overlay ServiceEMU Economic and Monetary Union

GALILEIREF :
DATE :
GALI-ESYS-DD112
19 June 2003
Market Intelligence Briefing 3 - Vol 3 ISSUE : 4.1 PAGE: 12
E-ODT Enhanced Observed Time DifferenceEOIG European Operators and Infrastructures GroupERC Electronic Road ChargingERP Electronic Road PricingESA European Space AgencyESSP European Satellite Services ProviderETC Electronic Toll CollectionETG European Tripartite GroupETSI European Telecommunications Standards InstituteEU European UnionEUR EuroFCC Federal Communication CommissionFOC Full Operational CapabilityFTSE Financial Times Stock ExchangeGALA Galileo Overall Architecture DefinitionGBAS Ground Based Augmentation SystemGDP Gross Domestic ProductGEMINUS Galileo European Multimodal Integrated Navigation User Service studyGISS Galileo Interim Support StructureGLONASS GLObalnaya NAvigatsionnaya Sputnikovaya SistemaGMO Galileo Market ObservatoryGMT Greenwich Mean TimeGNSS Global Navigation Satellite SystemGOC Galileo Operating CompanyGPRS General Packet Radio ServiceGPS Global Positioning SystemGSM Global System for Mobile CommunicationsHGV Heavy Goods VehicleHLD High Level DocumentIATA International Air Transport AssociationICAO International Civil Aviation OrganisationILS Instrument Landing SystemIMO International Maritime OrganisationIN Inertial Navigation SystemIP Intellectual PropertyIPR Intellectual Property RightsITS Intelligent Transport SystemsJMRD Justification for Mission Requirements DocumentLAN Local Area NetworkLBS Location Based ServiceLCV Light Commercial VehicleLSVA Swiss Distance Related Heavy Vehicles FeeMIB Marketing Intelligence BriefingMRD Mission Requirements Document

GALILEIREF :
DATE :
GALI-ESYS-DD112
19 June 2003
Market Intelligence Briefing 3 - Vol 3 ISSUE : 4.1 PAGE: 13
NDB Non Directional BeaconsNPV Net Present ValueOBU On Board UnitOEM Original Equipment ManufacturerOS Open ServiceOTD Observed Time DifferenceOTDOA Observed Time Difference Of ArrivalPRS Public regulated servicePSAP Public Safety Answering PointR&D Research and DevelopmentSA Selective AvailabilitySAR Search and RescueSBAS Space Based Augmentation SystemSIM Subscriber Identity ModuleSIS Signal-in-SpaceSMS Short Message SystemSNTP (Simplified) Network Time ProtocolSoL Safety of Life ServiceSP Service ProviderTA Timing AdvanceTCAR Third carrierTDMA Time Division Multiple AccessTOA Time Of ArrivalTTA Time to AlarmTV TelevisionUMTS Universal Mobile Telecommunication SystemUS United StatesUSD United States DollarUTC Universal Time CoordinatedUTRA UMTS Terrestrial Radio AccessVAS Value Added ServicesVLR Visitor Location RegisterVOR VHF Omni Ranging (Beacons)WAP Wireless Access ProtocolWCDMA Wideband CDMA
Table 1-2: List of acronyms
1.4 METHODOLOGY
1.4.1 MAPPING OF GALA APPLICATIONS TO GMO MARKET SECTORS
The GALA study identified some 100 applications and 30 market sectors that could be(potential) users of GNSS. To represent the results of these graphically would not provide the

GALILEIREF :
DATE :
GALI-ESYS-DD112
19 June 2003
Market Intelligence Briefing 3 - Vol 3 ISSUE : 4.1 PAGE: 14
reader with a meaningful information. The major applications (in terms of user numbersand/or revenues) have therefore been mapped to 8 GMO market sectors; the remainingapplications have been mapped to a category "Other". This mapping, listed according to size(user numbers / revenues) is shown in 1-3.
GMO Market sector- Applications
GALA Application Groupings GALA applicationssubsumed (within another
application category)
1. Personal navigation- Mobile phones- Personal outdoor
recreation
Personal Outdoor RecreationRecreational FlyingMarine LeisureIntegration of PersonalCommunication & Navigation
Lone worker protection(mobile phones)
2. Mass marketvehicles/Cars- telematics- road pricing- ADAS
Cars & Motorcycles (route guidance,information services, emergencycall)
3. Commercial vehiclesincluding LCV andTrucks & Buses- telematics- road pricing- ADAS
Trucks & Buses (route guidance,information services, emergencycall)Light Commercial Vehicles (routeguidance, information services,emergency call)Road tollingADAS
Fleet management(telematics)
4. Aviation Commercial Air Transport (IFR,Surveillance)General Aviation (IFR, Surveillance)
5. Rail Train ControlTrain SupervisionFleet managementFreight management (new GMOapplication)
Energy Optimised DrivingPassenger Informationservices (Fleet management)
6. Maritime Marine Navigation (unregulated,regulated, surveillance)Marine EngineeringHarbour DockingFisheries & EEZ (all)
7. Emergency services Ambulance TrackingPolice/Fire (route guidance, vehicletracking, pedestrian tracking, coverttracking)
8. Survey Rail: Track SurveyPrecision surveying
GALILEIREF :
DATE :
GALI-ESYS-DD112
19 June 2003
Market Intelligence Briefing 3 - Vol 3 ISSUE : 4.1 PAGE: 15
GMO Market sector- Applications
GALA Application Groupings GALA applicationssubsumed (within another
application category)
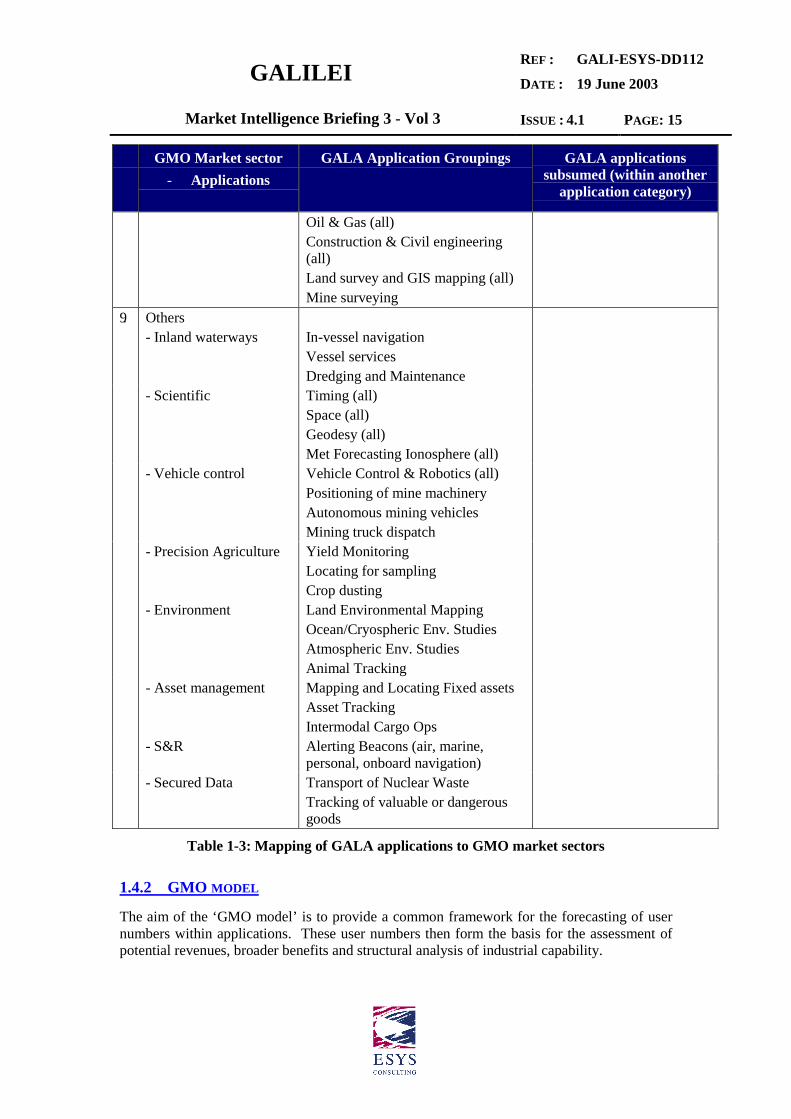
Oil & Gas (all)Construction & Civil engineering(all)Land survey and GIS mapping (all)Mine surveying
9. Others- Inland waterways In-vessel navigation
Vessel servicesDredging and Maintenance
- Scientific Timing (all)Space (all)Geodesy (all)Met Forecasting Ionosphere (all)
- Vehicle control Vehicle Control & Robotics (all)Positioning of mine machineryAutonomous mining vehiclesMining truck dispatch
- Precision Agriculture Yield MonitoringLocating for samplingCrop dusting
- Environment Land Environmental MappingOcean/Cryospheric Env. StudiesAtmospheric Env. StudiesAnimal Tracking
- Asset management Mapping and Locating Fixed assetsAsset TrackingIntermodal Cargo Ops
- S&R Alerting Beacons (air, marine,personal, onboard navigation)
- Secured Data Transport of Nuclear WasteTracking of valuable or dangerousgoods
Table 1-3: Mapping of GALA applications to GMO market sectors
1.4.2 GMO MODEL
The aim of the ‘GMO model’ is to provide a common framework for the forecasting of usernumbers within applications. These user numbers then form the basis for the assessment ofpotential revenues, broader benefits and structural analysis of industrial capability.

GALILEIREF :
DATE :
GALI-ESYS-DD112
19 June 2003
Market Intelligence Briefing 3 - Vol 3 ISSUE : 4.1 PAGE: 16
1.4.3 OVERVIEW OF GMO MODEL
The current GMO revenue model is based on the model reported in MIB1 (GALI-ESYS-DD112, version 5, February 2002). This has been initialised with data modified from GALAPhase 3 inputs. Selected market updates for MIB3 have been conducted. This new data hasreplaced existing GALA data for some markets applications. The overall structure of themodel is shown in Figure 1-1.
ADDRESSABLEMARKET
MARKETPENETRATION
MARKET‘SHARE’
PURCHASEREVENUES
SERVICEREVENUES
BENEFITS
#potential
users
#GNSSusers
#Galileousers
INDUSTRIAL /SUPPLY CHAIN
ANALYSIS
Service mappingScenariosPrice elasticity
Penetration factorsShare factors
Product pricingService pricing
CONTROL SHEETS
MARKET SHEETS
REVENUE SHEETS
Region 2000 2001 2002 2003 2004 2005 2006 2007 2008 2009 2010 2011 2012 2013 2014 2015 2016 2017 2018 2019 2020N America 0 0 0 0 0 0 0 0 0 0 0 0 0 0 0 0 0 0 0 0 0Europe 0 0 0 0 0 0 0 0 0 0 0 0 0 0 0 0 0 0 0 0 0Pacific Rim 0 0 0 0 0 0 0 0 0 0 0 0 0 0 0 0 0 0 0 0 0Russia + E Eur 0 0 0 0 0 0 0 0 0 0 0 0 0 0 0 0 0 0 0 0 0Africa 0 0 0 0 0 0 0 0 0 0 0 0 0 0 0 0 0 0 0 0 0Central Asia 0 0 0 0 0 0 0 0 0 0 0 0 0 0 0 0 0 0 0 0 0India 0 0 0 0 0 0 0 0 0 0 0 0 0 0 0 0 0 0 0 0 0Middle East 0 0 0 0 0 0 0 0 0 0 0 0 0 0 0 0 0 0 0 0 0Cen & S America 0 0 0 0 0 0 0 0 0 0 0 0 0 0 0 0 0 0 0 0 0Antarctic & Arctic 0 0 0 0 0 0 0 0 0 0 0 0 0 0 0 0 0 0 0 0 0
Region 2000 2001 2002 2003 2004 2005 2006 2007 2008 2009 2010 2011 2012 2013 2014 2015 2016 2017 2018 2019 2020N America 0 0 0 0 0 0 0 0 0 0 0 0 0 0 0 0 0 0 0 0 0Europe 0 0 0 0 0 0 0 0 0 0 0 0 0 0 0 0 0 0 0 0 0Pacific Rim 0 0 0 0 0 0 0 0 0 0 0 0 0 0 0 0 0 0 0 0 0Russia + E Eur 0 0 0 0 0 0 0 0 0 0 0 0 0 0 0 0 0 0 0 0 0Africa 0 0 0 0 0 0 0 0 0 0 0 0 0 0 0 0 0 0 0 0 0Central Asia 0 0 0 0 0 0 0 0 0 0 0 0 0 0 0 0 0 0 0 0 0India 0 0 0 0 0 0 0 0 0 0 0 0 0 0 0 0 0 0 0 0 0Middle East 0 0 0 0 0 0 0 0 0 0 0 0 0 0 0 0 0 0 0 0 0Cen & S America 0 0 0 0 0 0 0 0 0 0 0 0 0 0 0 0 0 0 0 0 0Antarctic & Arctic 0 0 0 0 0 0 0 0 0 0 0 0 0 0 0 0 0 0 0 0 0
Region 2000 2001 2002 2003 2004 2005 2006 2007 2008 2009 2010 2011 2012 2013 2014 2015 2016 2017 2018 2019 2020N America 0 0 0 0 0 0 0 0 0 0 0 0 0 0 0 0 0 0 0 0 0Europe 0 0 0 0 0 0 0 0 0 0 0 0 0 0 0 0 0 0 0 0 0Pacific Rim 0 0 0 0 0 0 0 0 0 0 0 0 0 0 0 0 0 0 0 0 0Russia + E Eur 0 0 0 0 0 0 0 0 0 0 0 0 0 0 0 0 0 0 0 0 0Africa 0 0 0 0 0 0 0 0 0 0 0 0 0 0 0 0 0 0 0 0 0Central Asia 0 0 0 0 0 0 0 0 0 0 0 0 0 0 0 0 0 0 0 0 0India 0 0 0 0 0 0 0 0 0 0 0 0 0 0 0 0 0 0 0 0 0Middle East 0 0 0 0 0 0 0 0 0 0 0 0 0 0 0 0 0 0 0 0 0Cen & S America 0 0 0 0 0 0 0 0 0 0 0 0 0 0 0 0 0 0 0 0 0Antarctic & Arctic 0 0 0 0 0 0 0 0 0 0 0 0 0 0 0 0 0 0 0 0 0
Figure 1-1: GMO model structure
The key components are:Control sheets – sheets containing overall model variables such as service mapping and
scenario settings together with the input penetration factors, share factors and pricinginformation
Market sheets – contain a worksheet per market with up to 6 applications per market andperforms the reduction from addressable market to user numbers based on factorsspecified in the control sheets
Revenue sheets – again using one worksheet per market, calculate the revenues from receiverpurchases and service provision and overall totals
Benefits and industrial analysis sheets - assess the broader benefits and industrial structurebased on the user numbers and revenue information.
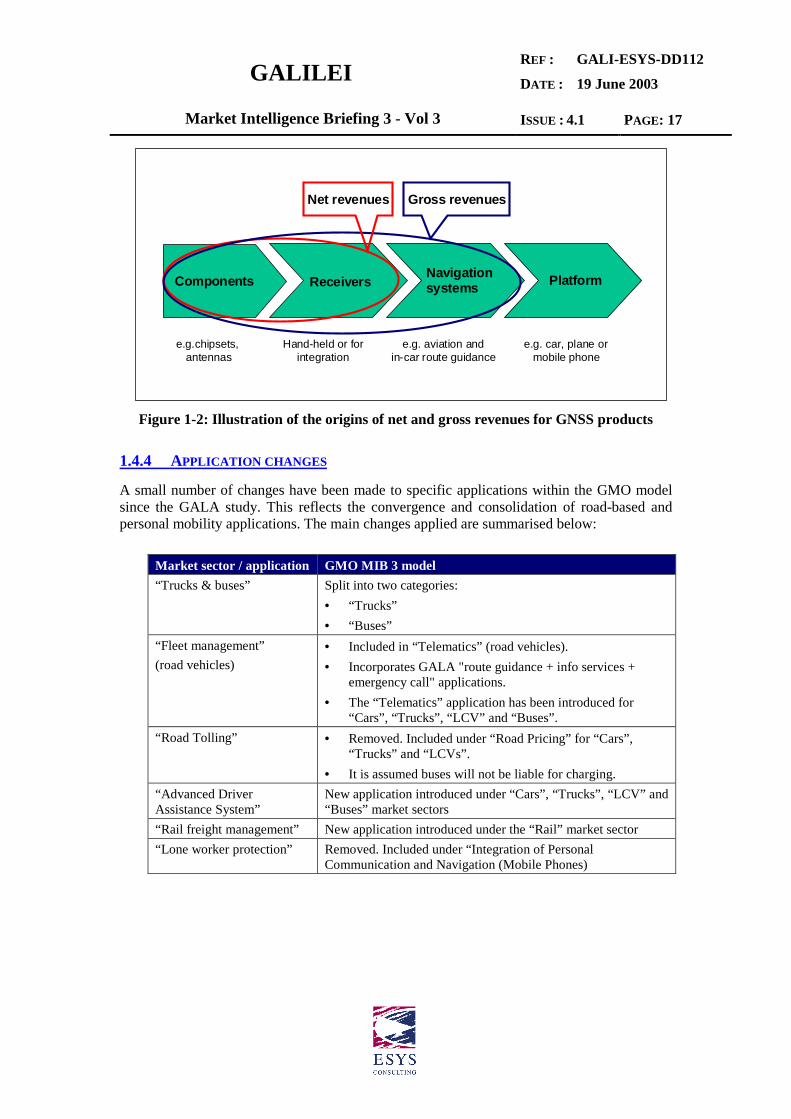
It should be noted that the purchase and service revenues are further broken down into grossrevenues and net revenues. Gross revenues are obtained by multiplying the number of unitsor users with the gross price of the product or service, i.e. the overall price including theadditional hardware (e.g. CD-ROM drive, displays, application software) and services (e.g.traffic status, communications) that are necessary for the application. The net revenues are theproportion of the gross product or service price that can be attributed to the ‘core’ GNSSnavigation/location component/s of the product or service. This is illustrated for products inFigure 1-2, showing the revenues that relate to the price of the components that underlie thesecategories. In general, the net revenues are smaller than the gross revenues. Each GNSSapplication has a different set of product and service prices, as well as differing proportionsof net to gross prices.
GALILEIREF :
DATE :
GALI-ESYS-DD112
19 June 2003
Market Intelligence Briefing 3 - Vol 3 ISSUE : 4.1 PAGE: 17
Figure 1-2: Illustration of the origins of net and gross revenues for GNSS products
1.4.4 APPLICATION CHANGES
A small number of changes have been made to specific applications within the GMO modelsince the GALA study. This reflects the convergence and consolidation of road-based andpersonal mobility applications. The main changes applied are summarised below:
Market sector / application GMO MIB 3 model“Trucks & buses” Split into two categories:
• “Trucks”• “Buses”
“Fleet management”(road vehicles)
• Included in “Telematics” (road vehicles).• Incorporates GALA "route guidance + info services +
emergency call" applications.• The “Telematics” application has been introduced for
“Cars”, “Trucks”, “LCV” and “Buses”.“Road Tolling” • Removed. Included under “Road Pricing” for “Cars”,
“Trucks” and “LCVs”.• It is assumed buses will not be liable for charging.
“Advanced DriverAssistance System”
New application introduced under “Cars”, “Trucks”, “LCV” and“Buses” market sectors
“Rail freight management” New application introduced under the “Rail” market sector“Lone worker protection” Removed. Included under “Integration of Personal
Communication and Navigation (Mobile Phones)
Receivers Navigationsystems PlatformComponents
e.g.chipsets, antennas
e.g. aviation andin-car route guidance
e.g. car, plane ormobile phone
Hand-held or forintegration
Net revenues Gross revenues

GALILEIREF :
DATE :
GALI-ESYS-DD112
19 June 2003
Market Intelligence Briefing 3 - Vol 3 ISSUE : 4.1 PAGE: 18
2 KEY ASSUMPTIONS
2.1 SCOPE AND PURPOSE
The purpose of this section is to give an overview of the key assumptions that have beenmade for Task H of GALILEI, the Galileo Market Observatory (GMO). This section willfocus on the assumptions that will impact the Galileo Mission Requirements Document(MRD) and hence the design & development of the system.The GMO aims to provide a one-stop shop for market and business intelligence concerningGalileo. The focus of the 2-year study is on priority topics (hot spots) for market research andanalysis, and improving our knowledge of Europe’s satellite navigation industry and itscompetitiveness.The starting point for GMO was the vast amount of information and legacy data from theGALA study1 [R.1]. Therefore, many of the underlying assumptions of GMO have beencarried over from the GALA study. Others have been adapted as the approach to themarket analysis for Galileo has evolved and matured.By necessity, the GALA and GMO studies had made a number of assumptions on differentlevels. Some concern the more general issues like the Galileo programmatics and start ofoperations, others are related to the proposed Galileo services, and others are linked to theindividual applications of GNSS and Galileo.GALA initially considered some 100 different GNSS applications. These werecategorised according to existing (e.g. road, rail, aviation and surveying) and future (LBS)market sectors and a detailed analysis of GNSS user requirements within these sectors.In many instances, there was a gap between the users’ performance specifications and theservices to be provided by Galileo. In some cases the user requirements were ‘overstatedand unrealistic’ and a judgement (assumptions) had to be made as to what they would inreality find acceptable. In other cases, local augmentation is needed to meet therequirements. This mapping of the applications to the proposed Galileo services has beenupdated as the services have been defined more precisely. It is currently based on theservices as outlined in the Galileo MRD [R13], and the mapping that is contained in Annex1 to JMRD Issue 1, dated 4 May 2001 [R14], subject to modifications recommended in thelatest version of the User Needs Analysis (DD114) [R15].
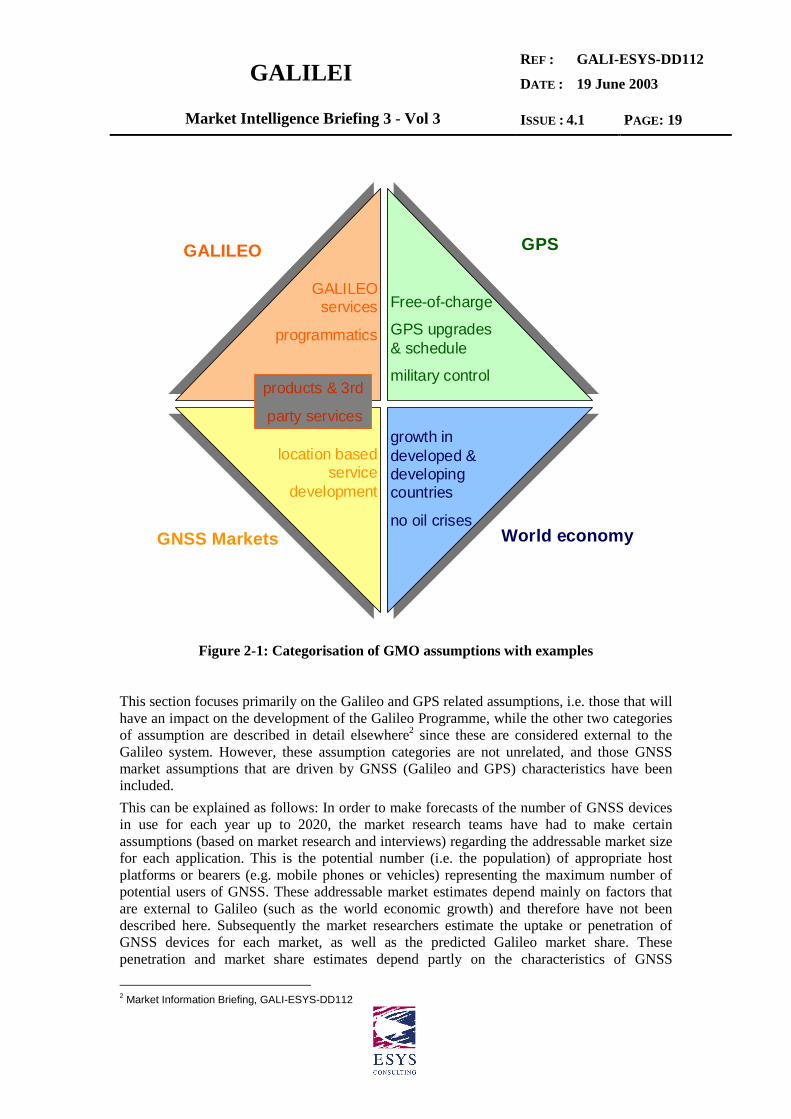
2.2 THE NATURE OF GMO ASSUMPTIONS
The GMO study has made numerous assumptions but not all of these are directly related toGalileo. For the purposes of this report, it is useful to distinguish between assumptions thatdirectly relate to Galileo as well as those that relate to GPS, and market based assumptionsconcerning the markets for navigation & location based services (LBS) and those aboutgeneral economic development across the world. These 4 groups are schematically illustratedin Figure 2-1.
1 Carried out between 1999 -2000
GALILEIREF :
DATE :
GALI-ESYS-DD112
19 June 2003
Market Intelligence Briefing 3 - Vol 3 ISSUE : 4.1 PAGE: 19
GALILEO GPS
GNSS Markets World economy
GALILEOservices
programmatics
Free-of-charge
GPS upgrades& schedule
military control
growth indeveloped &developingcountries
no oil crises
location basedservice
development
products & 3rd
party services
Figure 2-1: Categorisation of GMO assumptions with examples
This section focuses primarily on the Galileo and GPS related assumptions, i.e. those that willhave an impact on the development of the Galileo Programme, while the other two categoriesof assumption are described in detail elsewhere2 since these are considered external to theGalileo system. However, these assumption categories are not unrelated, and those GNSSmarket assumptions that are driven by GNSS (Galileo and GPS) characteristics have beenincluded.This can be explained as follows: In order to make forecasts of the number of GNSS devicesin use for each year up to 2020, the market research teams have had to make certainassumptions (based on market research and interviews) regarding the addressable market sizefor each application. This is the potential number (i.e. the population) of appropriate hostplatforms or bearers (e.g. mobile phones or vehicles) representing the maximum number ofpotential users of GNSS. These addressable market estimates depend mainly on factors thatare external to Galileo (such as the world economic growth) and therefore have not beendescribed here. Subsequently the market researchers estimate the uptake or penetration ofGNSS devices for each market, as well as the predicted Galileo market share. Thesepenetration and market share estimates depend partly on the characteristics of GNSS
2 Market Information Briefing, GALI-ESYS-DD112
GALILEIREF :
DATE :
GALI-ESYS-DD112
19 June 2003
Market Intelligence Briefing 3 - Vol 3 ISSUE : 4.1 PAGE: 20
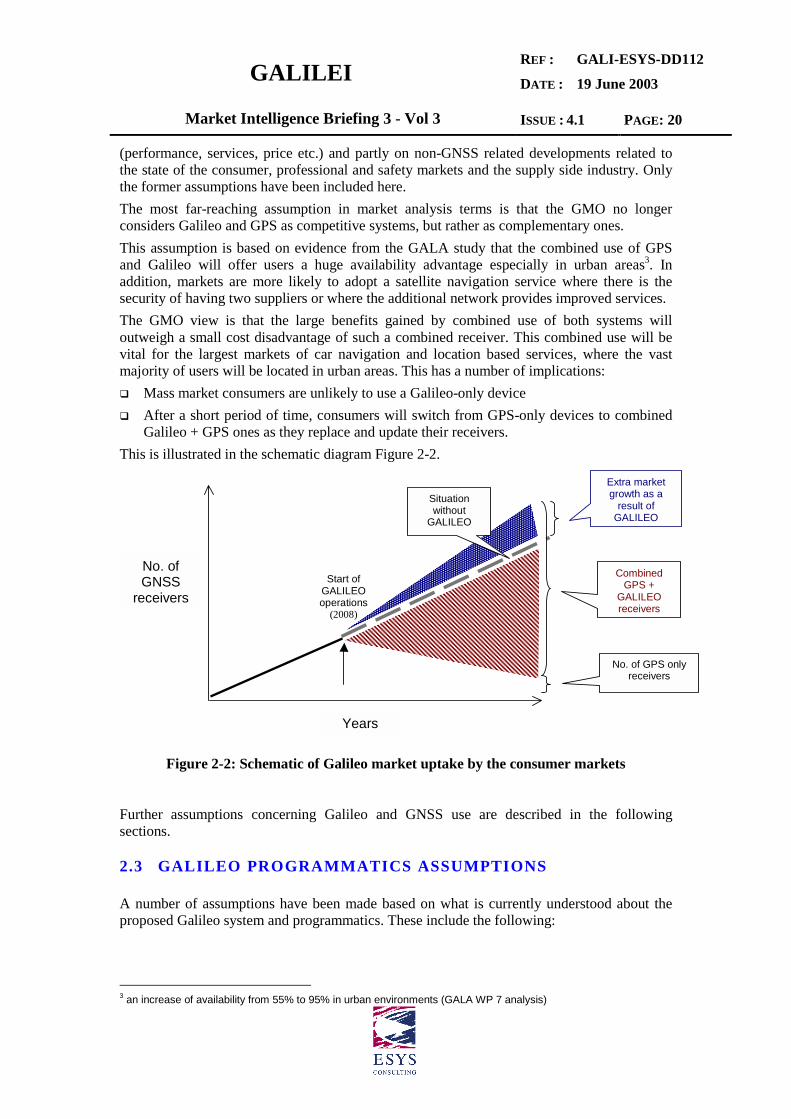
(performance, services, price etc.) and partly on non-GNSS related developments related tothe state of the consumer, professional and safety markets and the supply side industry. Onlythe former assumptions have been included here.The most far-reaching assumption in market analysis terms is that the GMO no longerconsiders Galileo and GPS as competitive systems, but rather as complementary ones.This assumption is based on evidence from the GALA study that the combined use of GPSand Galileo will offer users a huge availability advantage especially in urban areas3. Inaddition, markets are more likely to adopt a satellite navigation service where there is thesecurity of having two suppliers or where the additional network provides improved services.The GMO view is that the large benefits gained by combined use of both systems willoutweigh a small cost disadvantage of such a combined receiver. This combined use will bevital for the largest markets of car navigation and location based services, where the vastmajority of users will be located in urban areas. This has a number of implications:� Mass market consumers are unlikely to use a Galileo-only device� After a short period of time, consumers will switch from GPS-only devices to combined
Galileo + GPS ones as they replace and update their receivers.This is illustrated in the schematic diagram Figure 2-2.
Years
No. ofGNSS
receivers
Situationwithout
GALILEO
Extra marketgrowth as a
result ofGALILEO
CombinedGPS +
GALILEOreceivers
No. of GPS onlyreceivers
Start ofGALILEOoperations
(2008)
Figure 2-2: Schematic of Galileo market uptake by the consumer markets
Further assumptions concerning Galileo and GNSS use are described in the followingsections.
2.3 GALILEO PROGRAMMATICS ASSUMPTIONS
A number of assumptions have been made based on what is currently understood about theproposed Galileo system and programmatics. These include the following:
3 an increase of availability from 55% to 95% in urban environments (GALA WP 7 analysis)

GALILEIREF :
DATE :
GALI-ESYS-DD112
19 June 2003
Market Intelligence Briefing 3 - Vol 3 ISSUE : 4.1 PAGE: 21
� The Galileo space and ground segments will be fully operational (i.e. FOC) in 2008, andsatellite replenishment will take place in a way that operations continue seamlessly untilat least 2020.
� The Galileo constellation will comprise of 30 MEO satellites.� Galileo operations will be under civilian control.� Galileo will be functionally independent from GPS. This will offer Safety of Life (SoL)
users in the civil aviation, rail, road and maritime sectors from two GNSS systems withno common mode of failure.
� At the start of operations, Galileo will have at least the same performance regardingaccuracy, availability, reliability and robustness as the contemporary GPS civilian signals(GPS II or GPS III). It will also at least match the improved signal power of GPS II andwill offer users integrity information a number of years prior to GPS III.
� EGNOS will offer GPS integrity information and a 6 sec TTA for the European ECACregion by 2004, thus acting as a precursor to the global integrity (and TTA of 6 sec)offering of Galileo. This service will allow for early development of future Galileo-basedapplications.
� The appropriate legal framework is in place such that the GOC can offer service level andliability guarantees.
� A publicity campaign market, application and receiver development programme will beput in place such that consumers will be aware of the Galileo brand and the advantagesthat Galileo products and services will offer them before the start of Galileo operations in2008.
2.4 GALILEO SIGNALS AND SERVICES ASSUMPTIONS
This section summarises assumptions that have been made regarding the Galileo signals andservices.
2.4.1 SIGNALS AND FREQUENCIES
� The Galileo frequency plan and signal design will be as specified in the Note on GalileoServices provided by the GISS for the User Fora4 [R.5].
2.4.2 OPEN SERVICE
� The OS (Open service) signals will be interoperable at a user level with GPS, and thus thefrequency will be close to that of the GPS civilian signal thereby minimising theadditional cost of producing a combined Galileo + GPS receiver.
� The OS will provide location accuracy comparable to that of GPS without SA, of around10m (for a single frequency receiver) (based on a specified performance of 15 mhorizontal, 35 m vertical)
� The Galileo pilot signal provided in conjunction with the OS will improve availabilityindoors and in urban canyon environments.
� The Timing accuracy of Galileo will match that of GPS.
4 Technical Note on GALILEO Services, Issue 1, 7 May 2002

GALILEIREF :
DATE :
GALI-ESYS-DD112
19 June 2003
Market Intelligence Briefing 3 - Vol 3 ISSUE : 4.1 PAGE: 22
2.4.3 COMMERCIAL SERVICE
� The commercial revenue opportunities of the CS will be based on ‘value-adding’ servicedifferentiators (technical and non-technical in nature) and thus will offer the user morethan is currently offered by GPS.
� These differentiators include improved performance (e.g. TCAR), a real-timeperformance degradation warning, non-real time system status information, signalauthentication, service level agreements, and liability provision.
� Local augmentation will be provided for applications (such as precision surveying) thatrequire high accuracy and high availability. Various types of augmentation will beprovided by Galileo or third-party providers to meet the requirements of individual orgroups of applications.
2.4.4 SAFETY OF LIFE SERVICE
� The SoL (Safety of Life) service signals will be unencrypted.� This service will offer seamless global integrity with a TTA of 6 sec.� The SoL service and related equipment will be certifiable to SARPS (Standards and
Recommended Practices) set by ICAO� This Galileo service will be functionally independent from EGNOS, but institutionally
and commercially integrated such that Galileo and EGNOS are not in competition.
2.4.5 PUBLIC REGULATED SERVICE
� The PRS (public regulated service) is an encrypted service aimed at public institutionsunder the authority of nation states for defence and civil protection.
� The PRS can be provided when other Galileo services will be denied or downgraded bythe GOC in times of political tension.
� Only authorised users will have access to the PRS.� The PRS will offer revenue opportunities for the GOC if nation states (through their
public or military organisations) are prepared to pay for access to this service.� PRS access will be restricted to EU and other participating states authorised by EU
Member States. The relevant authorities in the Member States will control the distributionof PRS codes.
2.4.6 SEARCH AND RESCUE SERVICE
� Galileo will offer a two-way SAR (Search and Rescue) communications channel forlocation pinpointing of distress calls (at sea or on land), and will be backward compatiblewith the Cospas/Sarsat system.
2.5 LOCAL AUGMENTATION ASSUMPTIONS
� Local elements (or components) and/or complementary systems will be in place to meetthe requirements of the more demanding applications, in terms of accuracy and integrity.
� Where safety-critical applications require performance that cannot be met by the SoL SIS,local augmentation will be provided. This will deliver the required vertical accuracy atairports for cat II or cat III approaches and landings, or <1m accuracy for train control.

GALILEIREF :
DATE :
GALI-ESYS-DD112
19 June 2003
Market Intelligence Briefing 3 - Vol 3 ISSUE : 4.1 PAGE: 23
2.6 DOWNSTREAM PRODUCTS & SERVICES ASSUMPTIONS
� Galileo based products and services will be available on the market ahead of FOC ofGalileo.
� Galileo or third-party service providers or service centres are in place to serve individualmarkets by the time Galileo is fully operational.
� The pricing of Galileo products and services (whether stand-alone or combined withGPS) is competitive with the existing GPS products and services on the market.
� The product and service supply chains will resemble the generic value chain illustrated inFigure 2-3.
Figure 2-3: Illustration of a generic supply chain for products and services
2.6.1 EQUIPMENT
� Galileo enabled chipsets, receivers and systems (from low cost consumer products to highend precision surveying equipment) will be available on the market by, or slightly aheadof, FOC.
� Chipsets or receivers aimed at the mass market will be combined Galileo + GPS products,the price of which will not be significantly higher than that of a GPS-only chipset orreceiver.
� Galileo approved receivers and systems will be available on the market to enablecommercial service level guarantees and certification.
� PRS terminals will be produced in limited numbers under security vetted procedures.
UsersUsers
Informationcontent
providerse.g. maps,
traffic information
Communi-cations
Providers
e.g. GSM or satellite
communications
Service Provider
e.g. ATM,fleet management,
road charging services
Platforms
e.g. car, plane or mobile phone
Navigationsystems
e.g. aviation and in-car route guidance
Receivers
hand-held or for integration
e.g.chipsets, antennas
Components
Products
Services
GALILEIREF :
DATE :
GALI-ESYS-DD112
19 June 2003
Market Intelligence Briefing 3 - Vol 3 ISSUE : 4.1 PAGE: 24
2.6.2 SERVICES
� For the vast majority of markets, services are likely to be provided to the end-users bythird-party Service Providers (SPs) (e.g. providers of location based services or fleetmanagement systems).
� The GOC will sell the SIS together with authentication and integrity information, andother non-technical services e.g. service guarantees, to such SPs.
� It is assumed that these service providers and service centres are in place by FOC, andthat they will serve a wide range of diverse markets.
� Integration of GNSS (Galileo + GPS) and communication technologies (GSM, UMTS)will be available to the mass markets of location based services (LBS) via mobile phonesor in-car telematic systems.
2.7 GALILEO COMMERCIALISATION ASSUMPTIONS
2.7.1 VALUE-ADDING OFFER
At this stage of the study, no specific assumptions have been made regarding the revenuegenerating options for the GOC. However based on the user consultation and market researchcarried out thus far, a number of potential commercial opportunities will be investigated.These represent value-adding data or information that could be sold to SPs including:� Signal authentication or improved service robustness (against radio or electrical
interference).� Integrity information in the form of a real-time service degradation warning.� Non-real time system status information (made available by mechanisms other than the
Galileo satellites).� Traceability and auditability of past system performance.� Service level guarantees where service failure or interruption qualifies the user for
reduced fees or service credits.� Service liability guarantees where service failure or interruption allows users to claim
consequential or 3rd party damages in court.The option of imposing product levies or service licences will be considered for the consumermarkets.
2.7.2 MARKET DEVELOPMENT ACTIVITIES
� Promotion activities will be undertaken to create an awareness of Galileo among SPs andmass-market consumers prior to the start of operations.
� Product and service development by industry will pre-empt the start of Galileo FOCbased on EGNOS and Galileo test-beds and demonstration projects.
2.8 BENEFITS ANALYSIS
The GMO includes an analysis of the benefits that Galileo will bring to European citizens andsociety. This analysis is also based on the assumptions described thus far, but includes someadditional hypotheses.
GALILEIREF :
DATE :
GALI-ESYS-DD112
19 June 2003
Market Intelligence Briefing 3 - Vol 3 ISSUE : 4.1 PAGE: 25
� Galileo SAR will offer improved location determination of the person or ship in distressand will acknowledge reception of the distress call via a message back to the casualty.
� Galileo will lead to an increase of the global market share of European industry forGalileo products & services. This will in turn lead to increased export of GNSS goodsfrom Europe, and a net gain in gross value-added for Europe.
� Galileo will enable some new services that cannot be delivered by GPS alone. These newservices are mainly related to Galileo’s SoL service and value-adding offers such asservice level guarantees. For these ‘delta’ applications, the total benefit is attributed toGalileo.
� The complementary use of Galileo together with GPS will offer an improved quality forthe vast majority of applications. For these applications, the quantitative benefits ofGalileo are estimated as 50% of the benefits of GPS+Galileo.
2.9 EXTERNAL FACTORS
2.9.1 GPS DEVELOPMENTS
� The civilian GPS signal will remain free-of-charge worldwide with selective availabilityswitched off until at least 2020.
� The GPS system will be upgraded according to the schedule set out in the Galileitechnical Note on GPS capabilities5. This will include the provision by the fullconstellation of a second civilian signal with improved power output by 2011, and a thirdcivilian signal by 2014/15. GPS III will implemented at some as yet unknown time in thefuture and will offer system integrity information.
2.9.2 GLONASS
� This study has excluded the markets for GLONASS products and services, and hasexcluded the possibility of using Galileo and GLONASS in combination.
2.9.3 GNSS MARKET DEVELOPMENTS
Some of the key market assumptions have been included here since they will potentially havea huge impact on the numbers of people that will rely on satellite navigation in the future, aswell as on the growth of the GNSS industry.� Mass market LBS from mobile phones will use GNSS technology (although not
exclusively) due to cost and/or performance advantages over telecommunication network-based location pinpointing technologies.
� Market sectors such as civil aviation, maritime and rail transport, will welcome the SoLservice if it will offer a cost-effective navigation aid and/or allow decommission ofexpensive ground infrastructure for safety-critical applications.
5 GPS Capabilities Within Galileo’s Timeframe

GALILEIREF :
DATE :
GALI-ESYS-DD112
19 June 2003
Market Intelligence Briefing 3 - Vol 3 ISSUE : 4.1 PAGE: 26
3 SERVICE MAPPING
A service mapping exercise was carried out in conjunction with the User Needs Analysisstudy team [R.15] to determine the optimal Galileo service for each of the GNSS applicationsin the GMO model. The results are summarised in Table 3-1 below.
The specification of the user requirements for accuracy (of positioning and velocitydetermination) and availability were considered for each application together with anysecondary or tertiary service requirements for integrity, authentication, system statusinformation, certification and recording. Finally, a market reality check was performed totake account of those instances where customers might settle ‘for less’ in terms of servicespecifications if it cost them less. For example, a customer might decide to use the free-of-charge OS rather than paying for a commercial service if his GNSS performance requirementsare not that stringent.
Mapping to GalileoServices
GMO Market sector- Applications
GALA ApplicationGroupings
Core Add-ons1. Personal navigation
- Mobile phones- Personal outdoor
recreation
Personal Outdoor RecreationRecreational FlyingMarine LeisureIntegration of PersonalCommunication &Navigation
OSOS
2. Mass marketvehicles/Cars- telematics- road pricing
Cars & Motorcycles (routeguidance, informationservices, emergency call) OS
OSstatusintegrity, recording
3. Commercial vehiclesincluding LCV andTrucks & Buses- telematics- road pricing
- ADAS
Trucks & Buses (routeguidance, informationservices, emergency call)Light Commercial Vehicles(route guidance, informationservices, emergency call)Road tollingADAS
OSOS
SoL
statusstatus
authentication, certification,recording, LE
4. Aviation Commercial Air Transport(IFR, Surveillance)General Aviation (IFR,Surveillance)
SoL
SoL
authentication, certification,recording, LEauthentication, certification,recording

GALILEIREF :
DATE :
GALI-ESYS-DD112
19 June 2003
Market Intelligence Briefing 3 - Vol 3 ISSUE : 4.1 PAGE: 27
Mapping to GalileoServices
GMO Market sector- Applications
GALA ApplicationGroupings
Core Add-ons5. Rail Train Control
Train SupervisionFleet managementFreight management
SoLOSOSOS
integrity/ SoL
6. Maritime Marine NavigationunregulatedMarine Navigation regulated
Marine EngineeringHarbour Docking
Fisheries & EEZ (all)
OS
OS
OSOS
OS
integrity/ SoL, certification,recordingaccuracy, LEaccuracy, certification,recording, LEintegrity, certification,recording
7. Emergency services Ambulance TrackingPolice/Fire (route guidance,vehicle tracking, pedestriantracking, covert tracking)
OSOS integrity, recording
8. Survey Rail: Track SurveyPrecision surveyingOil & Gas (all)Construction & Civilengineering (all)Land survey and GISmapping (all)Mine surveying
OSOSOSOS
OS
OS
status, LEstatus, LEstatus, LELE
LE
LE9. Others
- Inland waterways In-vessel navigationVessel servicesDredging and Maintenance
SoLOSOS
certificationintegrityintegrity, status, LE
- Scientific Timing (all)Space (all)Geodesy (all)Met Forecasting Ionosphere(all)
OSSoLOSOS
statusLEintegrity, status, LE
- Vehicle control Vehicle Control & Robotics(all)Positioning of minemachineryAutonomous mining vehiclesMining truck dispatch
OS
OS
OSOS
integrity, accuracy +
integrity/SoL
integrity/SoL
-Precision Agriculture Yield MonitoringLocating for samplingCrop dusting
OSOSOS
integrityintegrityintegrity

GALILEIREF :
DATE :
GALI-ESYS-DD112
19 June 2003
Market Intelligence Briefing 3 - Vol 3 ISSUE : 4.1 PAGE: 28
Mapping to GalileoServices
GMO Market sector- Applications
GALA ApplicationGroupings
Core Add-ons- Environment Land Environmental
MappingOcean/Cryospheric Env.StudiesAtmospheric Env. StudiesAnimal Tracking
OS
OS
OSOS
LE
- Asset management Mapping and Locating FixedassetsAsset TrackingIntermodal Cargo Ops
OS
OSOS
LE
LE- S&R Alerting Beacons (air,
marine, personal, onboardnavigation)
OS integrity/SoL
- Secured Data Transport of Nuclear WasteTracking of valuable ordangerous goods
PRSOS integrity
Table 3-1: Mapping of GMO market sectors and GALA applications to Galileo services
It is clear that the vast majority of applications will use the OS, but that over 67% of theapplications require additional services above and beyond the core OS, i.e. just the OS SIS.One application was mapped to the PRS service and 6 applications to the SoL service.The CS was specifically excluded at this stage since it is still not clear exactly what thisservice will offer. The GMO view is that there are commercial opportunities for manyapplications – for the 67% of the applications that require more than the core OS – but thatthese cannot be mapped to a single CS per se, since within these 31 applications there are amyriad of different service requirements.

GALILEIREF :
DATE :
GALI-ESYS-DD112
19 June 2003
Market Intelligence Briefing 3 - Vol 3 ISSUE : 4.1 PAGE: 29
4 MARKET RESULTS
The charts and tables presented in this chapter are summarised below.
Output Sub-divisions Settings appliedNumber of users Regions,
Market sectors,Galileo services
GNSS penetrated(GPS & Galileo),Galileo market share
Annual unit sales Regions,Market sectors
GNSS penetrated(GPS & Galileo)Galileo market share
Annual purchase revenues(gross & net components)
Regions,Market sectors
GNSS penetrated(GPS & Galileo)Galileo market share
It should be noted at this point that all of the model outputs presented below arespecified as annual totals. Even where five year intervals are presented, the figures areannual snapshots and not cumulative totals.
4.1.1 CHANGES WITH RESPECT TO GALA STUDY
This section highlights the market sectors and GNSS application areas where the marketresearch data has been updated and reported in subsequent version of the MIB:
• The work carried out for MIB1 (February 2002) mainly concerned the changes to theGALA model and an initial review of the market hotspots (as described in [R.16]).Essentially, the input data used in MIB 1 was the same as that used in the GALA study.
• MIB2 (August 2002) included updated market data for a number of key market sectors,including mobile phones, vehicle telematics (Europe only), road pricing, aviation andambulance services.
• For this MIB, MIB3 (February 2003), further updates to market data for a number ofmarket sectors have been made. Updated market sectors include mobile phones, vehicletelematics (all regions of the world), road pricing, asset management, and rail. A newvehicle application, Advanced Driver Assistance System (ADAS), has been introduced.The results for each of these key market sectors have been described in detail in theindividual chapters of Volume 2.
The main changes to the input market data for these market hotspots are described in Table4-1.
GALILEIREF :
DATE :
GALI-ESYS-DD112
19 June 2003
Market Intelligence Briefing 3 - Vol 3 ISSUE : 4.1 PAGE: 30
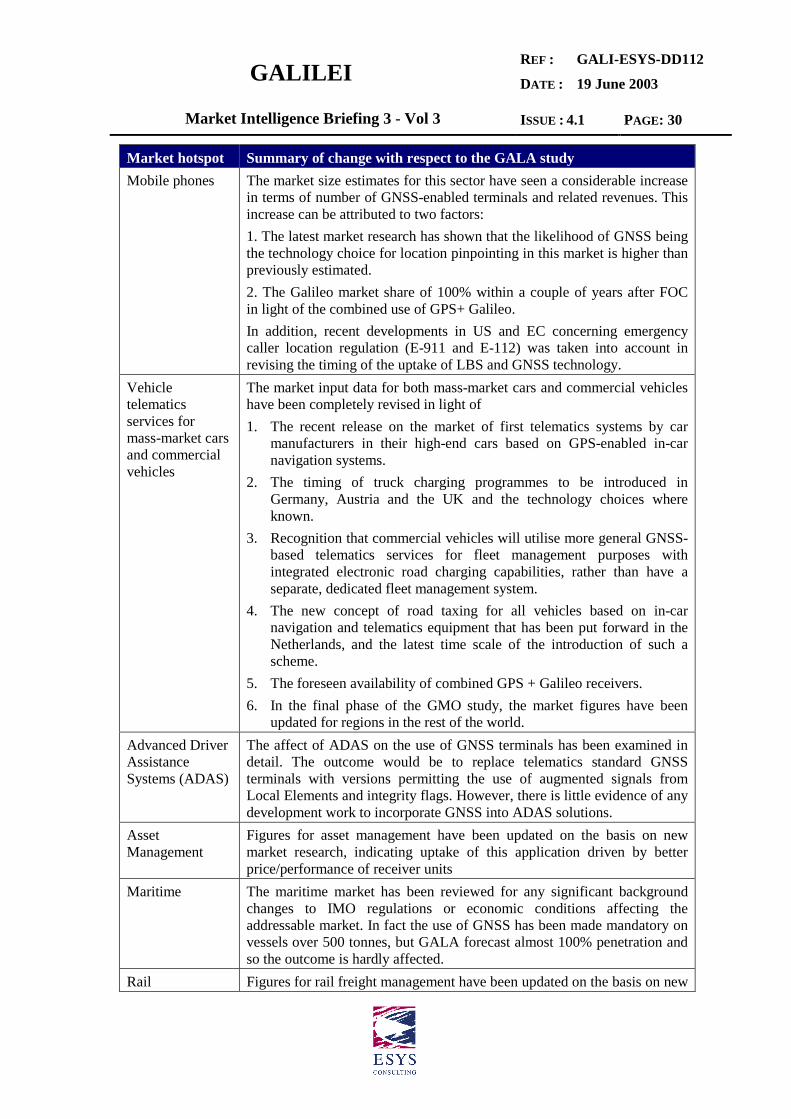
Market hotspot Summary of change with respect to the GALA studyMobile phones The market size estimates for this sector have seen a considerable increase
in terms of number of GNSS-enabled terminals and related revenues. Thisincrease can be attributed to two factors:1. The latest market research has shown that the likelihood of GNSS beingthe technology choice for location pinpointing in this market is higher thanpreviously estimated.2. The Galileo market share of 100% within a couple of years after FOCin light of the combined use of GPS+ Galileo.In addition, recent developments in US and EC concerning emergencycaller location regulation (E-911 and E-112) was taken into account inrevising the timing of the uptake of LBS and GNSS technology.
Vehicletelematicsservices formass-market carsand commercialvehicles
The market input data for both mass-market cars and commercial vehicleshave been completely revised in light of1. The recent release on the market of first telematics systems by car
manufacturers in their high-end cars based on GPS-enabled in-carnavigation systems.
2. The timing of truck charging programmes to be introduced inGermany, Austria and the UK and the technology choices whereknown.
3. Recognition that commercial vehicles will utilise more general GNSS-based telematics services for fleet management purposes withintegrated electronic road charging capabilities, rather than have aseparate, dedicated fleet management system.
4. The new concept of road taxing for all vehicles based on in-carnavigation and telematics equipment that has been put forward in theNetherlands, and the latest time scale of the introduction of such ascheme.
5. The foreseen availability of combined GPS + Galileo receivers.6. In the final phase of the GMO study, the market figures have been
updated for regions in the rest of the world.Advanced DriverAssistanceSystems (ADAS)
The affect of ADAS on the use of GNSS terminals has been examined indetail. The outcome would be to replace telematics standard GNSSterminals with versions permitting the use of augmented signals fromLocal Elements and integrity flags. However, there is little evidence of anydevelopment work to incorporate GNSS into ADAS solutions.
AssetManagement
Figures for asset management have been updated on the basis on newmarket research, indicating uptake of this application driven by betterprice/performance of receiver units
Maritime The maritime market has been reviewed for any significant backgroundchanges to IMO regulations or economic conditions affecting theaddressable market. In fact the use of GNSS has been made mandatory onvessels over 500 tonnes, but GALA forecast almost 100% penetration andso the outcome is hardly affected.
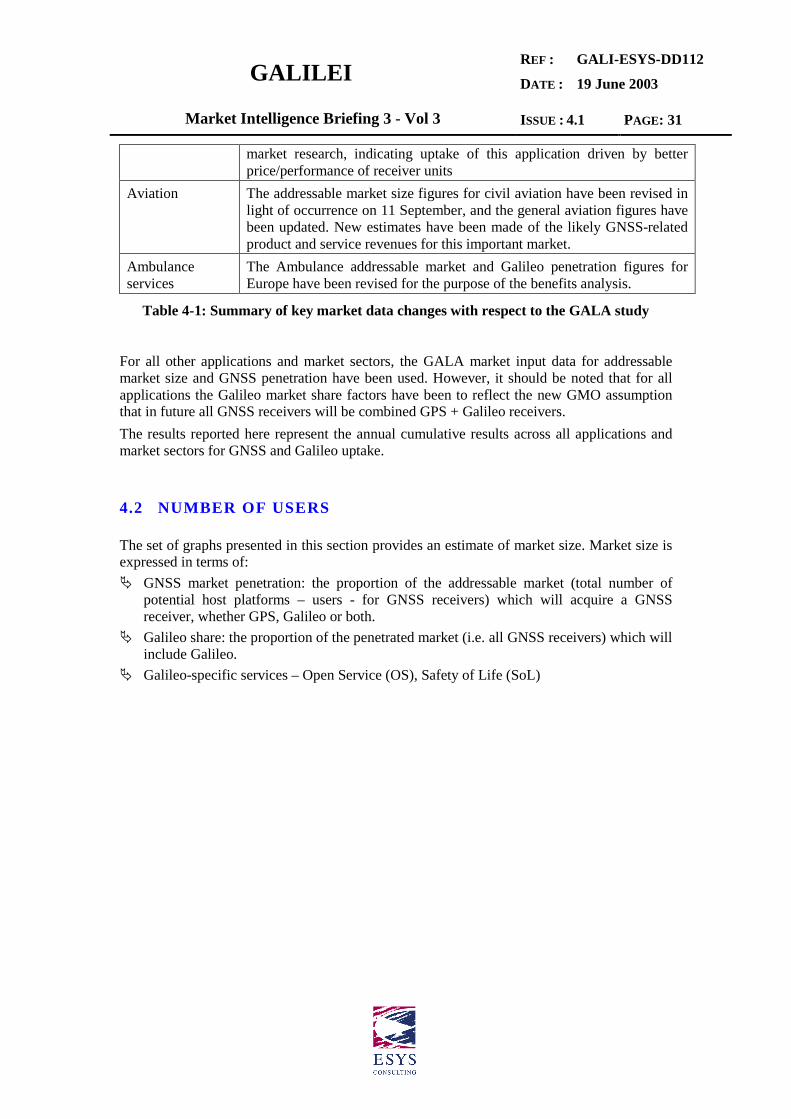
Rail Figures for rail freight management have been updated on the basis on new
GALILEIREF :
DATE :
GALI-ESYS-DD112
19 June 2003
Market Intelligence Briefing 3 - Vol 3 ISSUE : 4.1 PAGE: 31
market research, indicating uptake of this application driven by betterprice/performance of receiver units
Aviation The addressable market size figures for civil aviation have been revised inlight of occurrence on 11 September, and the general aviation figures havebeen updated. New estimates have been made of the likely GNSS-relatedproduct and service revenues for this important market.
Ambulanceservices
The Ambulance addressable market and Galileo penetration figures forEurope have been revised for the purpose of the benefits analysis.
Table 4-1: Summary of key market data changes with respect to the GALA study
For all other applications and market sectors, the GALA market input data for addressablemarket size and GNSS penetration have been used. However, it should be noted that for allapplications the Galileo market share factors have been to reflect the new GMO assumptionthat in future all GNSS receivers will be combined GPS + Galileo receivers.The results reported here represent the annual cumulative results across all applications andmarket sectors for GNSS and Galileo uptake.
4.2 NUMBER OF USERS
The set of graphs presented in this section provides an estimate of market size. Market size isexpressed in terms of:� GNSS market penetration: the proportion of the addressable market (total number of
potential host platforms – users - for GNSS receivers) which will acquire a GNSSreceiver, whether GPS, Galileo or both.
� Galileo share: the proportion of the penetrated market (i.e. all GNSS receivers) which willinclude Galileo.
� Galileo-specific services – Open Service (OS), Safety of Life (SoL)

GALILEIREF :
DATE :
GALI-ESYS-DD112
19 June 2003
Market Intelligence Briefing 3 - Vol 3 ISSUE : 4.1 PAGE: 32
Figure 4-1: GNSS user numbers by region
This figure shows North America, Europe and the Pacific Rim to be the largest markets forGNSS devices followed by Central Asia (China) from 2014 onwards. The shape of this graphis mainly determined by two spurts in growth in the mobile phone market (see Figure 4-2)occurring at different times in two regions of the world, namely in Pacific Rim starting in2004 and Central Asia in 2011 to 2012.
Region 2001 2005 2010 2015 2020N America 9,983,665 80,046,083 260,791,313 385,458,869 507,355,920Europe 6,864,039 50,661,132 192,469,056 338,238,725 451,583,502Pacific Rim 2,813,381 110,315,085 246,279,699 331,594,130 405,374,143Russia & Non Acc 115,489 2,769,510 12,586,051 42,884,249 68,705,543Africa 102,335 4,912,739 22,640,386 79,357,393 123,084,943Central Asia 397,391 19,492,445 95,424,109 316,919,324 462,043,320India 79,061 1,667,268 11,295,782 63,816,122 166,325,760Middle East 81,792 4,268,810 19,264,942 66,995,687 108,056,902Cen & S America 295,501 8,473,772 31,874,698 107,002,615 172,095,689EU Accession 104,336 2,733,256 12,421,380 42,264,202 67,714,196Totals 20,836,990 285,340,100 905,047,417 1,774,531,316 2,532,339,919
Table 4-2: Selected annual data for GNSS user numbers by region
0
500,000,000
1,000,000,000
1,500,000,000
2,000,000,000
2,500,000,000
3,000,000,000
2000
2001
2002
2003
2004
2005
2006
2007
2008
2009
2010
2011
2012
2013
2014
2015
2016
2017
2018
2019
2020
Num
ber o
f use
rs
EU Accession
Cen & S America
Middle East
India
Central Asia
Africa
Russia & Non Acc
Pacif ic Rim
Europe
N America

GALILEIREF :
DATE :
GALI-ESYS-DD112
19 June 2003
Market Intelligence Briefing 3 - Vol 3 ISSUE : 4.1 PAGE: 33
Figure 4-2: GNSS user numbers by market sector
This figure illustrates the importance of the mobile phone market (79%) for GNSS-enableddevices. Together with mass-market vehicles (14%) and commercial vehicles (5%), thesethree markets represent 98% of all users of GNSS.
Region 2001 2005 2010 2015 2020Personal mobility 9,509,882 245,325,387 756,243,624 1,452,434,448 1,991,169,570Mass market vehicles 4,920,454 20,598,377 93,851,122 213,442,041 365,261,601Commercial vehicles 3,330,879 13,222,605 40,860,952 82,036,460 130,530,455Aviation 25,141 40,768 62,971 80,559 110,544Rail 2,406 14,574 62,613 126,293 146,782Maritime 1,783,618 1,029,691 1,344,103 1,594,081 1,915,241Emergency services 395,075 1,054,978 3,152,347 6,098,685 9,885,942Survey 98,143 165,706 302,735 396,853 473,220Others 771,393 3,888,013 9,166,950 18,321,895 32,846,564Totals 20,836,990 285,340,100 905,047,417 1,774,531,316 2,532,339,919
Table 4-3: Selected annual data for GNSS user numbers by market sector
0
500,000,000
1,000,000,000
1,500,000,000
2,000,000,000
2,500,000,000
3,000,000,000
2000
2001
2002
2003
2004
2005
2006
2007
2008
2009
2010
2011
2012
2013
2014
2015
2016
2017
2018
2019
2020
Num
ber o
f use
rs
OthersSurveyEmergency servicesMaritimeRailAviationCommercial vehiclesMass market vehiclesPersonal mobility

GALILEIREF :
DATE :
GALI-ESYS-DD112
19 June 2003
Market Intelligence Briefing 3 - Vol 3 ISSUE : 4.1 PAGE: 34
Figure 4-3: Galileo user numbers by region
This figure reflects the replacement of GPS-enabled devices with GPS+Galileo devices from2007 onwards. Once again, North America, Europe and the Pacific Rim are the largestmarkets for such devices followed by Central Asia (China) from 2014 onwards. The mobilephone market once again dominates these user numbers (see Figure 4-4).
Region 2001 2005 2010 2015 2020N America 0 0 111,869,903 344,582,869 482,505,561Europe 0 0 84,699,715 308,306,052 435,136,326Pacific Rim 0 0 100,321,545 306,534,114 395,386,645Russia & Non Acc 0 0 5,565,439 40,473,018 68,194,769Africa 0 0 9,334,724 75,472,836 123,074,364Central Asia 0 0 38,903,907 300,725,713 461,471,777India 0 0 5,182,198 60,728,829 166,210,422Middle East 0 0 8,009,917 63,244,745 107,263,533Cen & S America 0 0 13,407,177 101,482,452 171,686,179EU Accession 0 0 5,430,782 39,873,979 67,201,388Totals 0 0 382,725,306 1,641,424,608 2,478,130,967
Table 4-4: Selected annual data for Galileo user numbers by region
0
500,000,000
1,000,000,000
1,500,000,000
2,000,000,000
2,500,000,000
3,000,000,000
2000
2001
2002
2003
2004
2005
2006
2007
2008
2009
2010
2011
2012
2013
2014
2015
2016
2017
2018
2019
2020
Num
ber o
f use
rs
EU Accession
Cen & S America
Middle East
India
Central Asia
Africa
Russia & Non Acc
Pacific Rim
Europe
N America
GALILEIREF :
DATE :
GALI-ESYS-DD112
19 June 2003
Market Intelligence Briefing 3 - Vol 3 ISSUE : 4.1 PAGE: 35
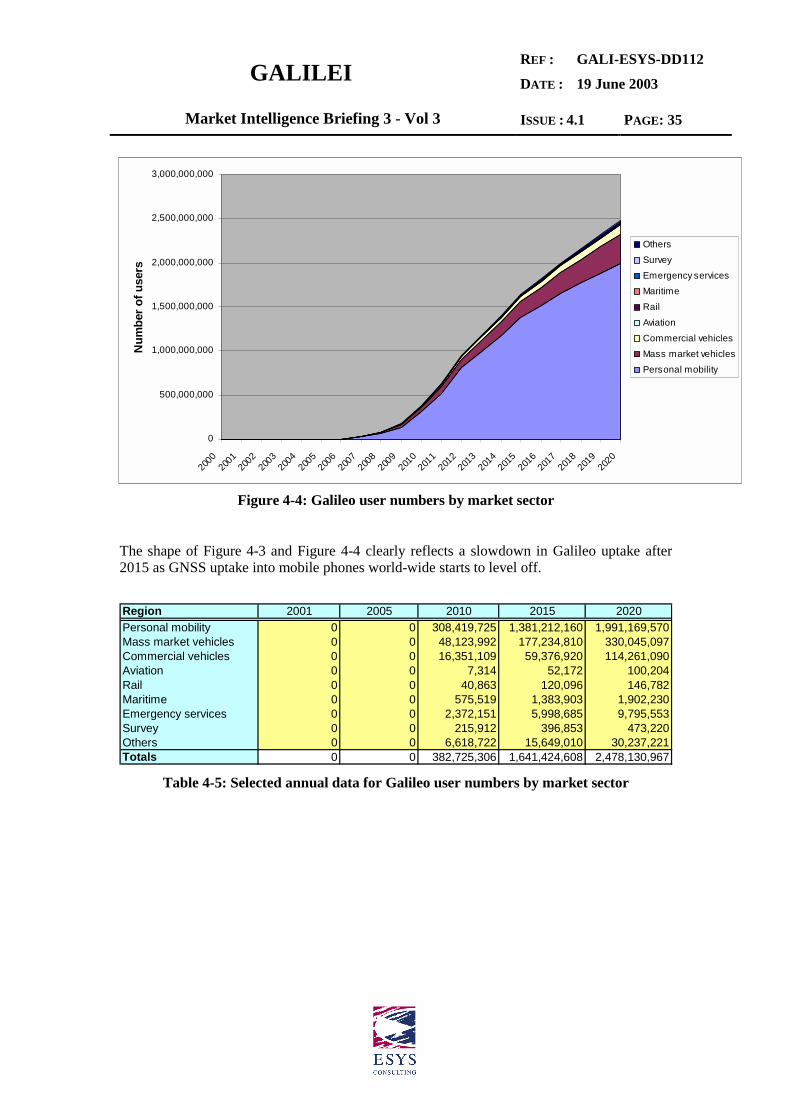
Figure 4-4: Galileo user numbers by market sector
The shape of Figure 4-3 and Figure 4-4 clearly reflects a slowdown in Galileo uptake after2015 as GNSS uptake into mobile phones world-wide starts to level off.
Region 2001 2005 2010 2015 2020Personal mobility 0 0 308,419,725 1,381,212,160 1,991,169,570Mass market vehicles 0 0 48,123,992 177,234,810 330,045,097Commercial vehicles 0 0 16,351,109 59,376,920 114,261,090Aviation 0 0 7,314 52,172 100,204Rail 0 0 40,863 120,096 146,782Maritime 0 0 575,519 1,383,903 1,902,230Emergency services 0 0 2,372,151 5,998,685 9,795,553Survey 0 0 215,912 396,853 473,220Others 0 0 6,618,722 15,649,010 30,237,221Totals 0 0 382,725,306 1,641,424,608 2,478,130,967
Table 4-5: Selected annual data for Galileo user numbers by market sector
0
500,000,000
1,000,000,000
1,500,000,000
2,000,000,000
2,500,000,000
3,000,000,000
2000
2001
2002
2003
2004
2005
2006
2007
2008
2009
2010
2011
2012
2013
2014
2015
2016
2017
2018
2019
2020
Num
ber o
f use
rs
OthersSurveyEmergency servicesMaritimeRailAviationCommercial vehiclesMass market vehiclesPersonal mobility

GALILEIREF :
DATE :
GALI-ESYS-DD112
19 June 2003
Market Intelligence Briefing 3 - Vol 3 ISSUE : 4.1 PAGE: 36
Figure 4-5: Galileo Open Service (OS) user numbers by region
This figure reflects the GMO prediction that over 99.4 % of GNSS users will use the GalileoOS (in combination with GPS) by 2020. This result is dominated by the vast numbers of massmarket users (the mobile phone and vehicle telematics sectors) in North America, Europe,Pacific Rim and China (Central Asia).
Region 2001 2005 2010 2015 2020N America 0 0 111,889,431 343,120,908 465,367,152Europe 0 0 84,711,728 307,007,106 420,390,537Pacific Rim 0 0 100,323,070 306,540,368 395,398,862Russia & Non Acc 0 0 5,574,643 40,575,362 68,443,398Africa 0 0 9,335,875 75,489,297 123,117,123Central Asia 0 0 38,917,264 300,679,271 460,115,282India 0 0 5,185,041 60,756,722 166,275,235Middle East 0 0 8,010,324 63,250,264 107,277,735Cen & S America 0 0 13,407,791 101,488,711 171,700,058EU Accession 0 0 5,440,257 39,931,505 67,295,758Totals 0 0 382,795,425 1,638,839,513 2,445,381,140
Table 4-6: Selected annual data for Galileo Open Service (OS) user numbers by region(based on the service mapping contained in chapter 3)
Please note that a single graph was produced for each individual category of service due to thedominance of OS above SoL (by a factor of about 1,000).
0
500,000,000
1,000,000,000
1,500,000,000
2,000,000,000
2,500,000,000
3,000,000,000
2000
2001
2002
2003
2004
2005
2006
2007
2008
2009
2010
2011
2012
2013
2014
2015
2016
2017
2018
2019
2020
Num
ber o
f use
rs
EU AccessionCen & S AmericaMiddle EastIndiaCentral AsiaAfricaRussia & Non AccPacific RimEurope N America
GALILEIREF :
DATE :
GALI-ESYS-DD112
19 June 2003
Market Intelligence Briefing 3 - Vol 3 ISSUE : 4.1 PAGE: 37
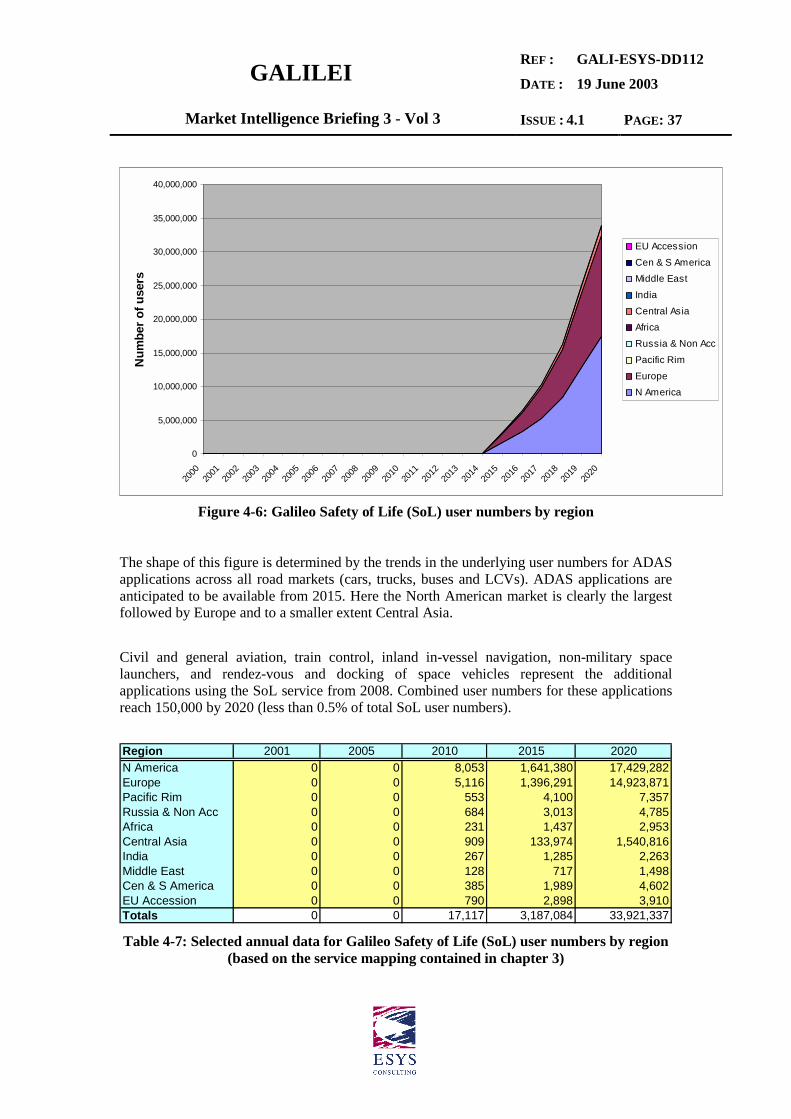
Figure 4-6: Galileo Safety of Life (SoL) user numbers by region
The shape of this figure is determined by the trends in the underlying user numbers for ADASapplications across all road markets (cars, trucks, buses and LCVs). ADAS applications areanticipated to be available from 2015. Here the North American market is clearly the largestfollowed by Europe and to a smaller extent Central Asia.
Civil and general aviation, train control, inland in-vessel navigation, non-military spacelaunchers, and rendez-vous and docking of space vehicles represent the additionalapplications using the SoL service from 2008. Combined user numbers for these applicationsreach 150,000 by 2020 (less than 0.5% of total SoL user numbers).
Region 2001 2005 2010 2015 2020N America 0 0 8,053 1,641,380 17,429,282Europe 0 0 5,116 1,396,291 14,923,871Pacific Rim 0 0 553 4,100 7,357Russia & Non Acc 0 0 684 3,013 4,785Africa 0 0 231 1,437 2,953Central Asia 0 0 909 133,974 1,540,816India 0 0 267 1,285 2,263Middle East 0 0 128 717 1,498Cen & S America 0 0 385 1,989 4,602EU Accession 0 0 790 2,898 3,910Totals 0 0 17,117 3,187,084 33,921,337
Table 4-7: Selected annual data for Galileo Safety of Life (SoL) user numbers by region(based on the service mapping contained in chapter 3)
0
5,000,000
10,000,000
15,000,000
20,000,000
25,000,000
30,000,000
35,000,000
40,000,000
2000
2001
2002
2003
2004
2005
2006
2007
2008
2009
2010
2011
2012
2013
2014
2015
2016
2017
2018
2019
2020
Num
ber o
f use
rs
EU AccessionCen & S AmericaMiddle EastIndiaCentral AsiaAfricaRussia & Non AccPacific RimEurope N America

GALILEIREF :
DATE :
GALI-ESYS-DD112
19 June 2003
Market Intelligence Briefing 3 - Vol 3 ISSUE : 4.1 PAGE: 38
4.3 UNIT SALES
The set of graphs presented in this section provides an estimation of unit sales (number ofreceivers sold per year). This includes total annual sales of GNSS receivers and the Galileoproportion.
0
200,000,000
400,000,000
600,000,000
800,000,000
1,000,000,000
1,200,000,000
2000
2001
2002
2003
2004
2005
2006
2007
2008
2009
2010
2011
2012
2013
2014
2015
2016
2017
2018
2019
2020
Uni
t sal
es
EU AccessionCen & S AmericaMiddle EastIndiaCentral AsiaAfricaRussia & Non AccPacific RimEurope N America
Figure 4-7: GNSS unit sales by region
It is clear from the proceeding Figure 4-9 and Figure 4-10 that these GNSS unit sales figuresare driven by the sales of GNSS- and Galileo-enabled mobile phones. The spurts in mobilephones sales can clearly be seen for the Pacific Rim starting in 2004, and Central Asia startingand 2011-2012. Sales in Central Asia/China will exceed those for other regions of the worldby 2014.
Region 2001 2005 2010 2015 2020N America 2,922,184 48,546,110 117,437,349 148,631,623 176,254,284Europe 1,799,731 34,259,973 93,383,672 142,575,242 167,269,179Pacific Rim 703,566 74,311,352 123,412,660 154,061,096 173,461,062Russia & Non Acc 27,511 2,193,563 7,384,818 22,668,658 31,817,084Africa 37,333 3,957,619 14,222,265 45,294,762 63,423,633Central Asia 65,387 15,885,863 60,764,410 178,511,310 233,827,817India 39,722 1,180,560 7,027,311 37,943,094 91,037,637Middle East 25,443 3,430,474 11,775,783 37,813,580 54,752,156Cen & S America 77,845 6,636,385 19,410,427 60,091,708 87,838,851EU Accession 22,457 2,182,120 7,276,130 22,606,384 31,709,210Totals 5,721,178 192,584,018 462,094,826 850,197,455 1,111,390,913
Table 4-8: Selected annual data for GNSS unit sales by region

GALILEIREF :
DATE :
GALI-ESYS-DD112
19 June 2003
Market Intelligence Briefing 3 - Vol 3 ISSUE : 4.1 PAGE: 39
0
200,000,000
400,000,000
600,000,000
800,000,000
1,000,000,000
1,200,000,000
2000
2001
2002
2003
2004
2005
2006
2007
2008
2009
2010
2011
2012
2013
2014
2015
2016
2017
2018
2019
2020
Use
r sal
es
EU AccessionCen & S AmericaMiddle EastIndiaCentral AsiaAfricaRussia & Non AccPacific RimEurope N America
Figure 4-8: Galileo unit sales by region
Sales of Galileo-enabled devices will clearly slow down in North America, Europe and thePacific Rim by 2012, while it is predicted to continue increasing in other regions, especiallyCentral Asia (China).
Region 2001 2005 2010 2015 2020N America 0 0 70,459,724 148,631,623 176,254,284Europe 0 0 56,029,381 142,575,242 167,269,179Pacific Rim 0 0 74,047,385 154,061,096 173,461,062Russia & Non Acc 0 0 4,430,856 22,668,658 31,817,084Africa 0 0 8,533,286 45,294,762 63,423,633Central Asia 0 0 36,458,579 178,511,310 233,827,817India 0 0 4,216,356 37,943,094 91,037,637Middle East 0 0 7,065,437 37,813,580 54,752,156Cen & S America 0 0 11,646,108 60,091,708 87,838,851EU Accession 0 0 4,365,659 22,606,384 31,709,210Totals 0 0 277,252,770 850,197,455 1,111,390,913
Table 4-9: Selected annual data for Galileo unit sales by region
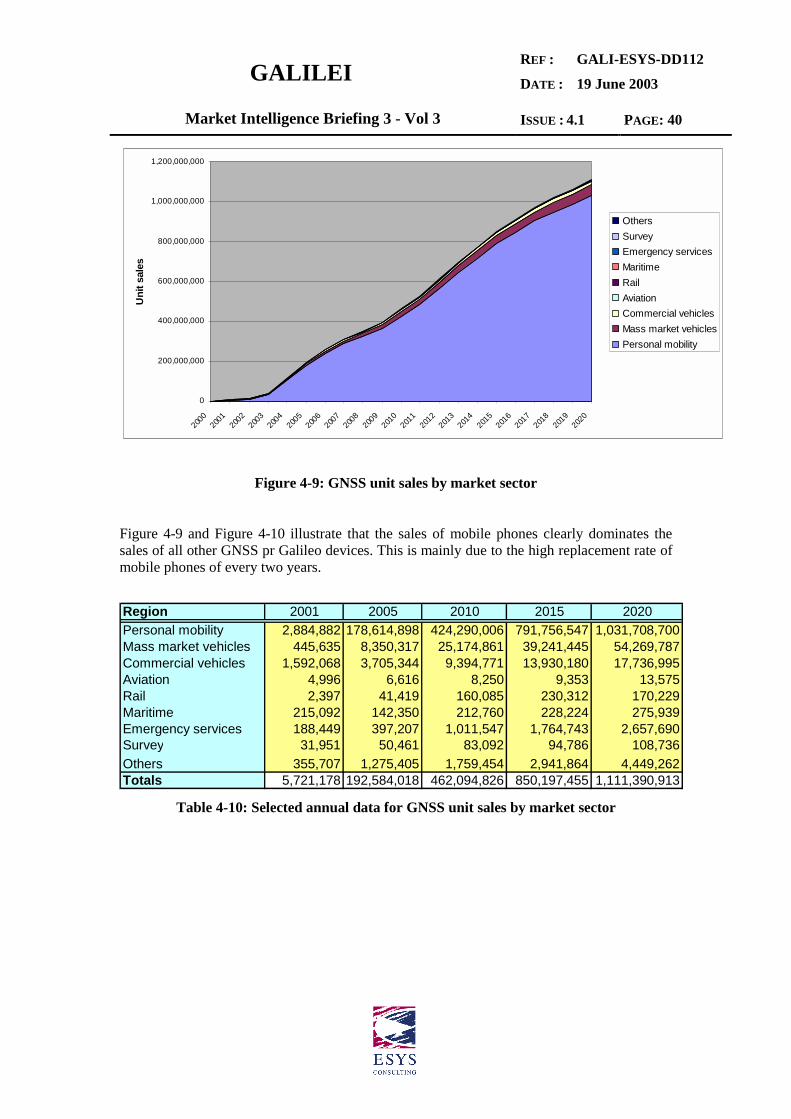
GALILEIREF :
DATE :
GALI-ESYS-DD112
19 June 2003
Market Intelligence Briefing 3 - Vol 3 ISSUE : 4.1 PAGE: 40
0
200,000,000
400,000,000
600,000,000
800,000,000
1,000,000,000
1,200,000,000
2000
2001
2002
2003
2004
2005
2006
2007
2008
2009
2010
2011
2012
2013
2014
2015
2016
2017
2018
2019
2020
Uni
t sal
es
OthersSurveyEmergency servicesMaritimeRailAviationCommercial vehiclesMass market vehiclesPersonal mobility
Figure 4-9: GNSS unit sales by market sector
Figure 4-9 and Figure 4-10 illustrate that the sales of mobile phones clearly dominates thesales of all other GNSS pr Galileo devices. This is mainly due to the high replacement rate ofmobile phones of every two years.
Region 2001 2005 2010 2015 2020Personal mobility 2,884,882 178,614,898 424,290,006 791,756,547 1,031,708,700Mass market vehicles 445,635 8,350,317 25,174,861 39,241,445 54,269,787Commercial vehicles 1,592,068 3,705,344 9,394,771 13,930,180 17,736,995Aviation 4,996 6,616 8,250 9,353 13,575Rail 2,397 41,419 160,085 230,312 170,229Maritime 215,092 142,350 212,760 228,224 275,939Emergency services 188,449 397,207 1,011,547 1,764,743 2,657,690Survey 31,951 50,461 83,092 94,786 108,736Others 355,707 1,275,405 1,759,454 2,941,864 4,449,262Totals 5,721,178 192,584,018 462,094,826 850,197,455 1,111,390,913
Table 4-10: Selected annual data for GNSS unit sales by market sector
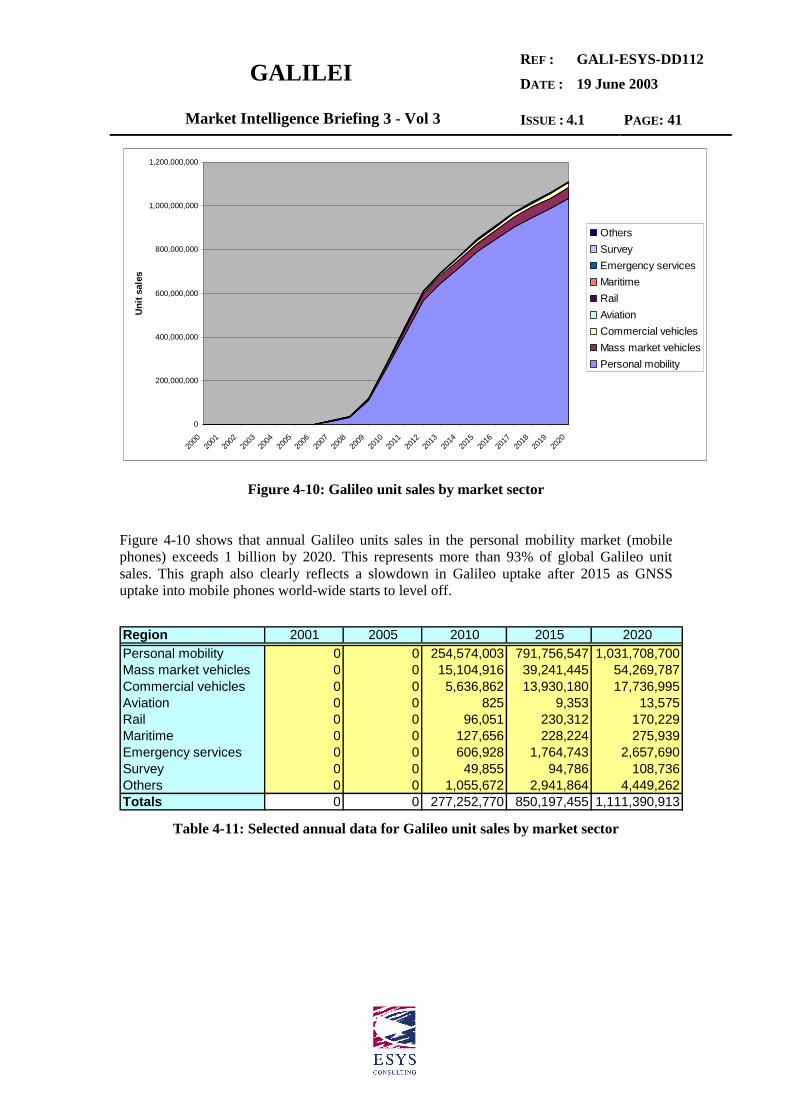
GALILEIREF :
DATE :
GALI-ESYS-DD112
19 June 2003
Market Intelligence Briefing 3 - Vol 3 ISSUE : 4.1 PAGE: 41
0
200,000,000
400,000,000
600,000,000
800,000,000
1,000,000,000
1,200,000,000
2000
2001
2002
2003
2004
2005
2006
2007
2008
2009
2010
2011
2012
2013
2014
2015
2016
2017
2018
2019
2020
Unit
sale
s
OthersSurveyEmergency servicesMaritimeRailAviationCommercial vehiclesMass market vehiclesPersonal mobility
Figure 4-10: Galileo unit sales by market sector
Figure 4-10 shows that annual Galileo units sales in the personal mobility market (mobilephones) exceeds 1 billion by 2020. This represents more than 93% of global Galileo unitsales. This graph also clearly reflects a slowdown in Galileo uptake after 2015 as GNSSuptake into mobile phones world-wide starts to level off.
Region 2001 2005 2010 2015 2020Personal mobility 0 0 254,574,003 791,756,547 1,031,708,700Mass market vehicles 0 0 15,104,916 39,241,445 54,269,787Commercial vehicles 0 0 5,636,862 13,930,180 17,736,995Aviation 0 0 825 9,353 13,575Rail 0 0 96,051 230,312 170,229Maritime 0 0 127,656 228,224 275,939Emergency services 0 0 606,928 1,764,743 2,657,690Survey 0 0 49,855 94,786 108,736Others 0 0 1,055,672 2,941,864 4,449,262Totals 0 0 277,252,770 850,197,455 1,111,390,913
Table 4-11: Selected annual data for Galileo unit sales by market sector
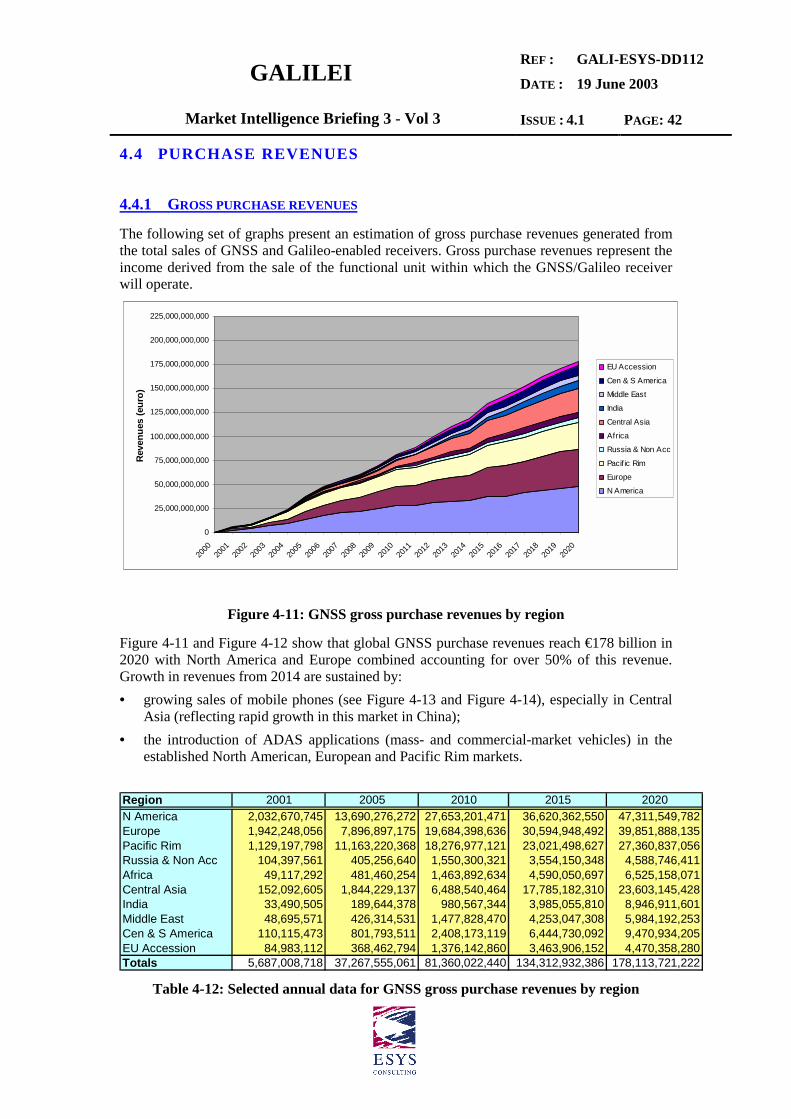
GALILEIREF :
DATE :
GALI-ESYS-DD112
19 June 2003
Market Intelligence Briefing 3 - Vol 3 ISSUE : 4.1 PAGE: 42
4.4 PURCHASE REVENUES
4.4.1 GROSS PURCHASE REVENUES
The following set of graphs present an estimation of gross purchase revenues generated fromthe total sales of GNSS and Galileo-enabled receivers. Gross purchase revenues represent theincome derived from the sale of the functional unit within which the GNSS/Galileo receiverwill operate.
0
25,000,000,000
50,000,000,000
75,000,000,000
100,000,000,000
125,000,000,000
150,000,000,000
175,000,000,000
200,000,000,000
225,000,000,000
2000
2001
2002
2003
2004
2005
2006
2007
2008
2009
2010
2011
2012
2013
2014
2015
2016
2017
2018
2019
2020
Reve
nues
(eur
o)
EU Accession
Cen & S America
Middle East
India
Central Asia
Africa
Russia & Non Acc
Pacific Rim
Europe
N America
Figure 4-11: GNSS gross purchase revenues by region
Figure 4-11 and Figure 4-12 show that global GNSS purchase revenues reach €178 billion in2020 with North America and Europe combined accounting for over 50% of this revenue.Growth in revenues from 2014 are sustained by:• growing sales of mobile phones (see Figure 4-13 and Figure 4-14), especially in Central
Asia (reflecting rapid growth in this market in China);• the introduction of ADAS applications (mass- and commercial-market vehicles) in the
established North American, European and Pacific Rim markets.
Region 2001 2005 2010 2015 2020N America 2,032,670,745 13,690,276,272 27,653,201,471 36,620,362,550 47,311,549,782Europe 1,942,248,056 7,896,897,175 19,684,398,636 30,594,948,492 39,851,888,135Pacific Rim 1,129,197,798 11,163,220,368 18,276,977,121 23,021,498,627 27,360,837,056Russia & Non Acc 104,397,561 405,256,640 1,550,300,321 3,554,150,348 4,588,746,411Africa 49,117,292 481,460,254 1,463,892,634 4,590,050,697 6,525,158,071Central Asia 152,092,605 1,844,229,137 6,488,540,464 17,785,182,310 23,603,145,428India 33,490,505 189,644,378 980,567,344 3,985,055,810 8,946,911,601Middle East 48,695,571 426,314,531 1,477,828,470 4,253,047,308 5,984,192,253Cen & S America 110,115,473 801,793,511 2,408,173,119 6,444,730,092 9,470,934,205EU Accession 84,983,112 368,462,794 1,376,142,860 3,463,906,152 4,470,358,280Totals 5,687,008,718 37,267,555,061 81,360,022,440 134,312,932,386 178,113,721,222
Table 4-12: Selected annual data for GNSS gross purchase revenues by region
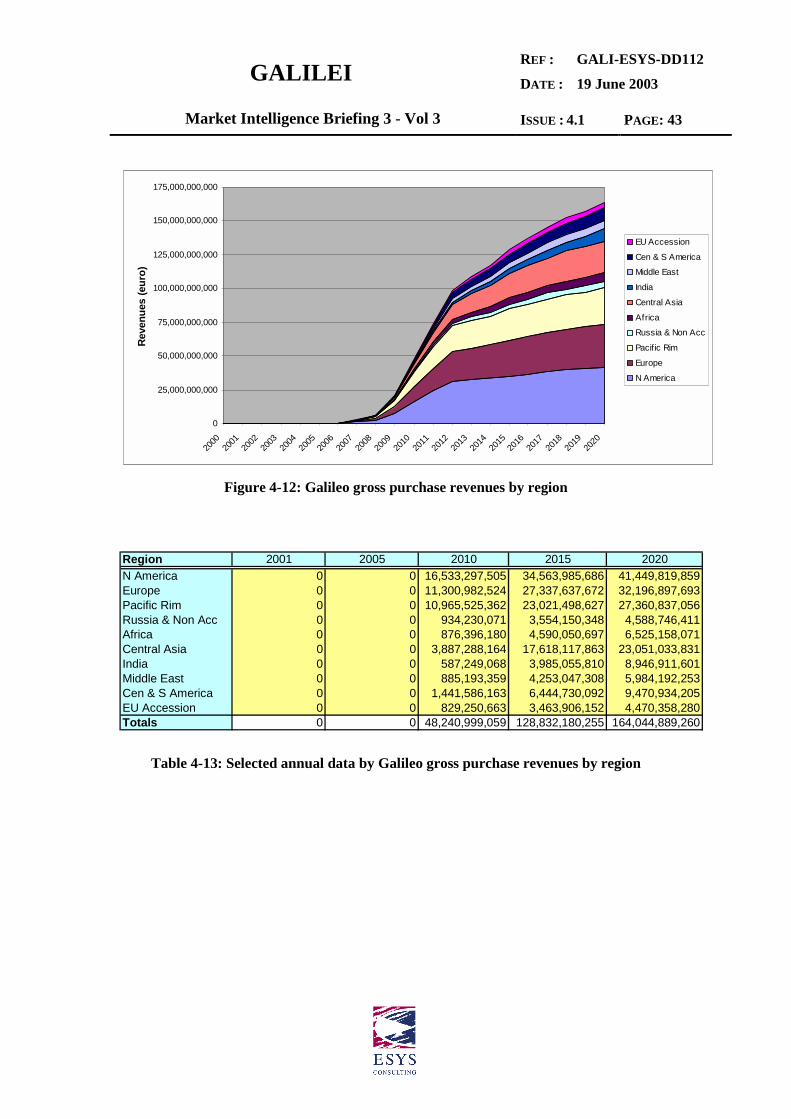
GALILEIREF :
DATE :
GALI-ESYS-DD112
19 June 2003
Market Intelligence Briefing 3 - Vol 3 ISSUE : 4.1 PAGE: 43
0
25,000,000,000
50,000,000,000
75,000,000,000
100,000,000,000
125,000,000,000
150,000,000,000
175,000,000,000
2000
2001
2002
2003
2004
2005
2006
2007
2008
2009
2010
2011
2012
2013
2014
2015
2016
2017
2018
2019
2020
Reve
nues
(eur
o)
EU Accession
Cen & S America
Middle East
India
Central Asia
Africa
Russia & Non Acc
Pacif ic Rim
Europe
N America
Figure 4-12: Galileo gross purchase revenues by region
Region 2001 2005 2010 2015 2020N America 0 0 16,533,297,505 34,563,985,686 41,449,819,859Europe 0 0 11,300,982,524 27,337,637,672 32,196,897,693Pacific Rim 0 0 10,965,525,362 23,021,498,627 27,360,837,056Russia & Non Acc 0 0 934,230,071 3,554,150,348 4,588,746,411Africa 0 0 876,396,180 4,590,050,697 6,525,158,071Central Asia 0 0 3,887,288,164 17,618,117,863 23,051,033,831India 0 0 587,249,068 3,985,055,810 8,946,911,601Middle East 0 0 885,193,359 4,253,047,308 5,984,192,253Cen & S America 0 0 1,441,586,163 6,444,730,092 9,470,934,205EU Accession 0 0 829,250,663 3,463,906,152 4,470,358,280Totals 0 0 48,240,999,059 128,832,180,255 164,044,889,260
Table 4-13: Selected annual data by Galileo gross purchase revenues by region
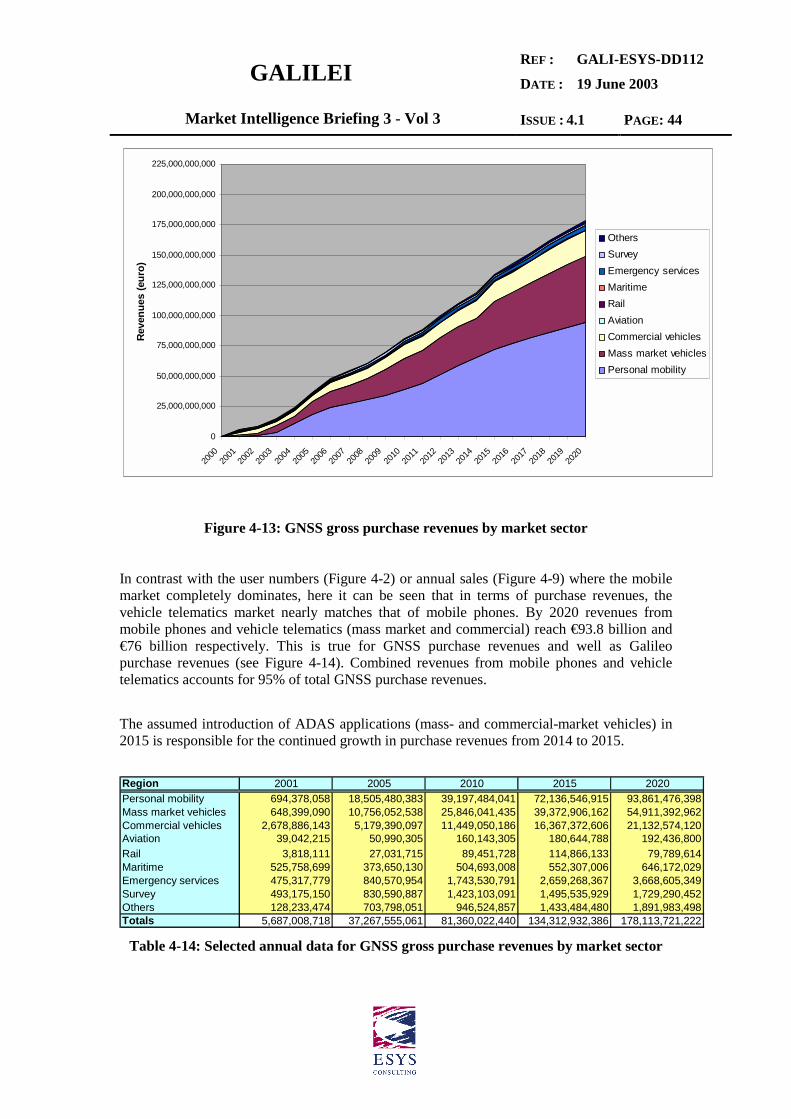
GALILEIREF :
DATE :
GALI-ESYS-DD112
19 June 2003
Market Intelligence Briefing 3 - Vol 3 ISSUE : 4.1 PAGE: 44
0
25,000,000,000
50,000,000,000
75,000,000,000
100,000,000,000
125,000,000,000
150,000,000,000
175,000,000,000
200,000,000,000
225,000,000,000
2000
2001
2002
2003
2004
2005
2006
2007
2008
2009
2010
2011
2012
2013
2014
2015
2016
2017
2018
2019
2020
Reve
nues
(eur
o)
OthersSurveyEmergency servicesMaritimeRailAviationCommercial vehiclesMass market vehiclesPersonal mobility
Figure 4-13: GNSS gross purchase revenues by market sector
In contrast with the user numbers (Figure 4-2) or annual sales (Figure 4-9) where the mobilemarket completely dominates, here it can be seen that in terms of purchase revenues, thevehicle telematics market nearly matches that of mobile phones. By 2020 revenues frommobile phones and vehicle telematics (mass market and commercial) reach €93.8 billion and€76 billion respectively. This is true for GNSS purchase revenues and well as Galileopurchase revenues (see Figure 4-14). Combined revenues from mobile phones and vehicletelematics accounts for 95% of total GNSS purchase revenues.
The assumed introduction of ADAS applications (mass- and commercial-market vehicles) in2015 is responsible for the continued growth in purchase revenues from 2014 to 2015.
Region 2001 2005 2010 2015 2020Personal mobility 694,378,058 18,505,480,383 39,197,484,041 72,136,546,915 93,861,476,398Mass market vehicles 648,399,090 10,756,052,538 25,846,041,435 39,372,906,162 54,911,392,962Commercial vehicles 2,678,886,143 5,179,390,097 11,449,050,186 16,367,372,606 21,132,574,120Aviation 39,042,215 50,990,305 160,143,305 180,644,788 192,436,800Rail 3,818,111 27,031,715 89,451,728 114,866,133 79,789,614Maritime 525,758,699 373,650,130 504,693,008 552,307,006 646,172,029Emergency services 475,317,779 840,570,954 1,743,530,791 2,659,268,367 3,668,605,349Survey 493,175,150 830,590,887 1,423,103,091 1,495,535,929 1,729,290,452Others 128,233,474 703,798,051 946,524,857 1,433,484,480 1,891,983,498Totals 5,687,008,718 37,267,555,061 81,360,022,440 134,312,932,386 178,113,721,222
Table 4-14: Selected annual data for GNSS gross purchase revenues by market sector

GALILEIREF :
DATE :
GALI-ESYS-DD112
19 June 2003
Market Intelligence Briefing 3 - Vol 3 ISSUE : 4.1 PAGE: 45
0
25,000,000,000
50,000,000,000
75,000,000,000
100,000,000,000
125,000,000,000
150,000,000,000
175,000,000,000
200,000,000,000
225,000,000,000
2000
2001
2002
2003
2004
2005
2006
2007
2008
2009
2010
2011
2012
2013
2014
2015
2016
2017
2018
2019
2020
Reve
nues
(eur
o)
Others
Survey
Emergency services
Maritime
Rail
Aviation
Commercial vehicles
Mass market vehicles
Personal mobility
Figure 4-14: Galileo gross purchase revenues by market sector
Region 2001 2005 2010 2015 2020Personal mobility 0 0 23,518,490,424 72,136,546,915 93,861,476,398Mass market vehicles 0 0 14,951,951,887 33,892,154,031 40,842,561,000Commercial vehicles 0 0 6,869,430,111 16,367,372,606 21,132,574,120Aviation 0 0 16,014,331 180,644,788 192,436,800Rail 0 0 53,671,037 114,866,133 79,789,614Maritime 0 0 302,815,805 552,307,006 646,172,029Emergency services 0 0 1,046,118,474 2,659,268,367 3,668,605,349Survey 0 0 853,861,855 1,495,535,929 1,729,290,452Others 0 0 628,645,135 1,433,484,480 1,891,983,498Totals 0 0 48,240,999,059 128,832,180,255 164,044,889,260
Table 4-15: Selected annual data for Galileo gross purchase revenues by market sector

GALILEIREF :
DATE :
GALI-ESYS-DD112
19 June 2003
Market Intelligence Briefing 3 - Vol 3 ISSUE : 4.1 PAGE: 46
4.4.2 NET PURCHASE REVENUES
The following set of graphs present an estimation of net purchase revenues generated from thetotal sales of GNSS and Galileo-enabled receivers. Net purchase revenues represent thenavigation component of the income derived from the sale of the functional unit within whichthe GNSS/Galileo receiver will operate (see Figure 1-2).
Depending on the type of receiver, the navigation-related components can form a major orminor part of the overall receiver, e.g. in mobile phones, GNSS will represent a relativelyminor part (10%), or vehicle telematics (20-25%), while for commercial air transportnavigation systems it will form the major part (100%).
0
5,000,000,000
10,000,000,000
15,000,000,000
20,000,000,000
25,000,000,000
30,000,000,000
35,000,000,000
2000
2001
2002
2003
2004
2005
2006
2007
2008
2009
2010
2011
2012
2013
2014
2015
2016
2017
2018
2019
2020
Reve
nues
(eur
o)
OthersSurveyEmergency servicesMaritimeRailAviationCommercial vehiclesMass market vehiclesPersonal mobility
Figure 4-15: GNSS net purchase revenues by market sector
The overall GNSS net revenues are about 20% of the gross revenues, and clearly thedominance of the mobile phone market (under Personal Mobility) in the graph is lessenedwith respect to the vehicle telematics markets compared to Figure 4-14.
Region 2001 2005 2010 2015 2020Personal mobility 400,248,820 2,314,975,717 4,522,282,334 7,943,735,206 10,214,538,624Mass market vehicles 129,679,818 2,151,210,508 5,169,208,287 7,874,581,232 10,982,278,592Commercial vehicles 669,368,249 1,308,564,088 2,876,552,529 4,091,624,829 5,275,087,004Aviation 36,494,539 47,450,276 153,834,075 173,469,389 182,676,406Rail 925,585 3,339,351 12,233,903 17,343,616 13,913,369Maritime 259,969,393 169,884,525 253,404,853 281,934,096 340,759,060Emergency services 202,104,257 350,660,002 733,523,449 1,137,085,647 1,574,460,062Survey 386,928,595 655,271,354 1,127,339,095 1,179,074,769 1,363,558,649Others 52,679,741 76,449,041 131,549,792 216,709,058 234,385,740Totals 2,138,398,997 7,077,804,861 14,979,928,317 22,915,557,842 30,181,657,506
Table 4-16: Selected annual data by GNSS net purchase revenues by market sector

GALILEIREF :
DATE :
GALI-ESYS-DD112
19 June 2003
Market Intelligence Briefing 3 - Vol 3 ISSUE : 4.1 PAGE: 47
0
5,000,000,000
10,000,000,000
15,000,000,000
20,000,000,000
25,000,000,000
30,000,000,000
35,000,000,000
40,000,000,000
2000
2001
2002
2003
2004
2005
2006
2007
2008
2009
2010
2011
2012
2013
2014
2015
2016
2017
2018
2019
2020
Reve
nues
(eur
o)
Others
Survey
Emergency services
Maritime
Rail
Aviation
Commercial vehicles
Mass market vehicles
Personal mobility
Figure 4-16: Galileo net purchase revenues by market sector
Region 2001 2005 2010 2015 2020Personal mobility 0 0 2,713,369,400 7,943,735,206 10,214,538,624Mass market vehicles 0 0 3,101,524,972 7,874,581,232 10,982,278,592Commercial vehicles 0 0 1,725,931,517 4,091,624,829 5,275,087,004Aviation 0 0 15,383,407 173,469,389 182,676,406Rail 0 0 5,482,978 13,483,105 11,488,957Maritime 0 0 152,042,912 281,934,096 340,759,060Emergency services 0 0 440,114,069 1,137,085,647 1,574,460,062Survey 0 0 671,747,981 1,172,419,676 1,359,152,306Others 0 0 78,929,875 216,709,058 234,385,740Totals 0 0 8,904,527,112 22,905,042,239 30,174,826,752
Table 4-17: Selected annual data by Galileo net purchase revenues by market sector
The equivalent GNSS and Galileo net revenue figures broken down by region are shown inthe following charts and tables. With the influence of specific applications now hidden, theshapes of the curves basically track the equivalent gross revenue charts in figures 4-11 and 4-12.

GALILEIREF :
DATE :
GALI-ESYS-DD112
19 June 2003
Market Intelligence Briefing 3 - Vol 3 ISSUE : 4.1 PAGE: 48
0
5,000,000,000
10,000,000,000
15,000,000,000
20,000,000,000
25,000,000,000
30,000,000,000
35,000,000,000
2000
2001
2002
2003
2004
2005
2006
2007
2008
2009
2010
2011
2012
2013
2014
2015
2016
2017
2018
2019
2020
Rev
enue
s (e
uro)
EU AccessionCen & S AmericaMiddle EastIndiaCentral AsiaAfricaRussia & Non AccPacific RimEurope N America
Figure 4-17: GNSS net purchase revenues by region
Region 2001 2005 2010 2015 2020N America 743,909,556 2,864,696,217 5,500,005,283 7,229,501,577 9,320,439,001Europe 705,139,278 1,620,884,470 3,774,091,060 5,675,759,645 7,499,944,831Pacific Rim 347,747,223 1,698,446,177 2,925,940,366 3,730,525,681 4,595,642,579Russia & Non Acc 71,407,252 150,719,004 444,615,527 740,878,441 915,278,037Africa 28,544,335 90,224,232 224,977,320 603,409,872 854,124,905Central Asia 83,557,496 269,154,554 913,473,182 2,221,842,079 2,939,184,689India 17,197,626 49,984,252 199,257,532 577,088,039 1,126,144,838Middle East 23,723,529 69,599,340 230,453,963 582,018,839 799,429,252Cen & S America 59,512,897 140,483,320 399,526,646 878,082,759 1,295,175,510EU Accession 57,659,806 123,613,295 367,587,439 676,450,911 836,293,863Totals 2,138,398,997 7,077,804,861 14,979,928,317 22,915,557,842 30,181,657,506
Table 4-18: Selected annual data by GNSS net purchase revenue by region
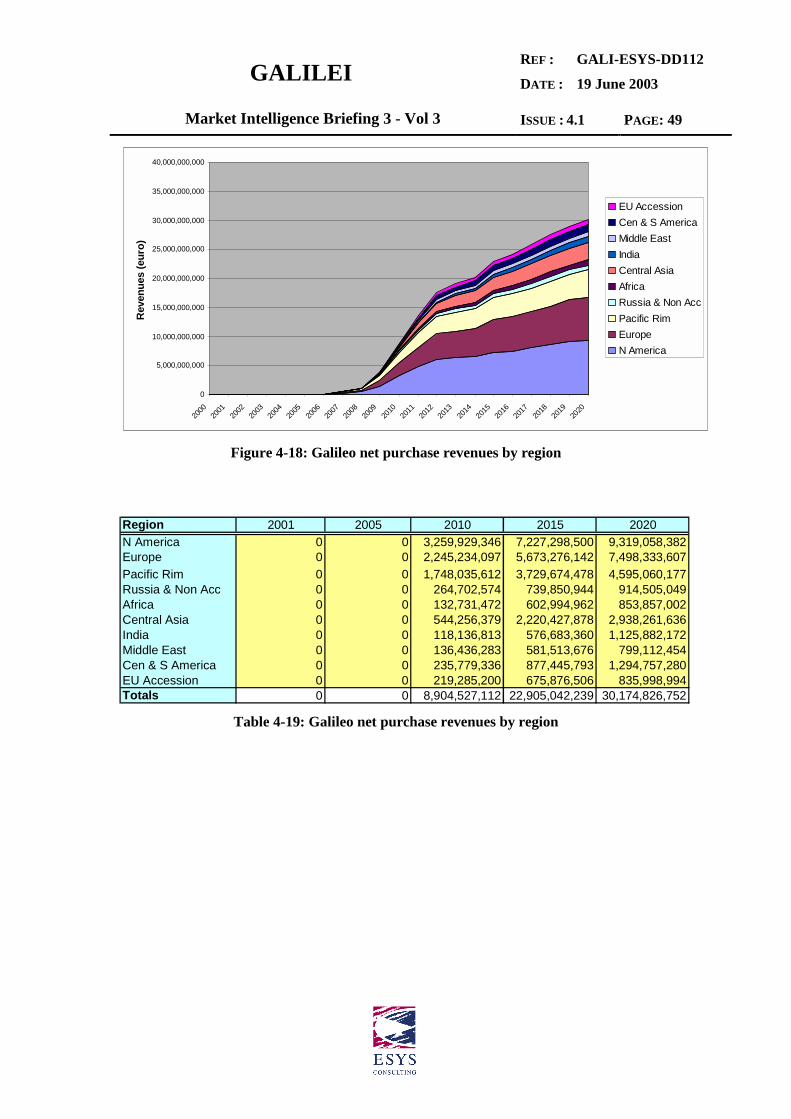
GALILEIREF :
DATE :
GALI-ESYS-DD112
19 June 2003
Market Intelligence Briefing 3 - Vol 3 ISSUE : 4.1 PAGE: 49
0
5,000,000,000
10,000,000,000
15,000,000,000
20,000,000,000
25,000,000,000
30,000,000,000
35,000,000,000
40,000,000,000
2000
2001
2002
2003
2004
2005
2006
2007
2008
2009
2010
2011
2012
2013
2014
2015
2016
2017
2018
2019
2020
Rev
enue
s (e
uro)
EU AccessionCen & S AmericaMiddle EastIndiaCentral AsiaAfricaRussia & Non AccPacific RimEurope N America
Figure 4-18: Galileo net purchase revenues by region
Region 2001 2005 2010 2015 2020N America 0 0 3,259,929,346 7,227,298,500 9,319,058,382Europe 0 0 2,245,234,097 5,673,276,142 7,498,333,607Pacific Rim 0 0 1,748,035,612 3,729,674,478 4,595,060,177Russia & Non Acc 0 0 264,702,574 739,850,944 914,505,049Africa 0 0 132,731,472 602,994,962 853,857,002Central Asia 0 0 544,256,379 2,220,427,878 2,938,261,636India 0 0 118,136,813 576,683,360 1,125,882,172Middle East 0 0 136,436,283 581,513,676 799,112,454Cen & S America 0 0 235,779,336 877,445,793 1,294,757,280EU Accession 0 0 219,285,200 675,876,506 835,998,994Totals 0 0 8,904,527,112 22,905,042,239 30,174,826,752
Table 4-19: Galileo net purchase revenues by region

GALILEIREF :
DATE :
GALI-ESYS-DD112
19 June 2003
Market Intelligence Briefing 3 - Vol 3 ISSUE : 4.1 PAGE: 50
END OF DOCUMENT
GALILEIREF :
DATE :
GALI-ESYS-DD112
19 June 2003
Market Intelligence Briefing 3 - Vol 3 ISSUE : 4.1 PAGE: i
DOCUMENT DISTRIBUTION
From : Nina CostaProject Acronym : GALILEIProject Name : Galileo System AnalysisTitle : Market Intelligence Briefing 3 - Vol 3Issue : 4.1.1Reference/identification : GALI-ESYS-DD112Date : 19 June 2003Page Number : 51File : DD112 Vol 3 issue 4.1.1.docClassification : REWBS : H.4.BContract : GMA1-42031-2001-SI2.324077Type of Document : MIB3 DeliverableTemplate Name : galilei_deliverables_v4.dot
To :
DistributionCompany Name N° Ex. Company Name N° Ex.