reference number of working document: iso/tc ???/sc ??? ncs3710/pmmaterials/resources/9126-4...
TRANSCRIPT
ISO/IEC JTC1/SC7/WG6 N9-Nov-01
TITLE: ISO/IEC 9126-4: Software Engineering - Software product quality - Part 4: Quality in use metrics
DATE: 9-Nov-01
SOURCE: JTC1/SC7/WG6
WORK ITEM: Project 7.13.01.1
STATUS: Version 5.66.0
DOCUMENT TYPE: DTRFinal
ACTION: For voteFor publication
PROJECT Prof. Motoei AZUMAEDITOR: Department of Industrial Eng. and Management
Waseda University3-4-1, Okubo, Shinjuku-ku, Tokyo 169, JapanFAX: [email protected]
DOCUMENT Nigel BEVAN EDITOR: Serco Usability Services
22 Hand Court London WC1V 6JFUKFax: +44 20 74 21 64 [email protected]
CO-EDITOR Witold SurynGemplus Canada3 Place du Commerce, suite 300HE3 1H7Isle des Soeurs, QuebecCanadaFax: +1 514 723 [email protected]

Reference number of working document: ISO/IEC JTC 1/SC 7 N
Date: 9-Nov-01
Reference number of document: ISO/IEC DTR 9126-4
Committee identification: ISO/IEC JTC 1/SC 7/WG 6
Secretariat: ANSI
Software Engineering — Software Product Quality — Part 4 Quality in use metricsDocument type: Technical ReportDocument subtype: Document stage: Document language: E

Contents
1 Scope................................................................................................................................................... 1
2 Conformance...................................................................................................................................... 2
3 References.......................................................................................................................................... 2
4 Terms and definitions........................................................................................................................ 2
5 Symbols and Abbreviated Terms......................................................................................................3
6 Use of software quality metrics.........................................................................................................3
7 How to read and use the metrics table..............................................................................................4
8 Metrics Tables.................................................................................................................................... 58.0General................................................................................................................................................ 5
8.1Effectiveness metrics........................................................................................................................... 78.2Productivity metrics............................................................................................................................. 8
8.3Safety metrics.................................................................................................................................... 108.4Satisfaction metrics............................................................................................................................ 11
Annex A (Informative) Considerations when using metrics..................................................................13A.1 Interpretation of measures...............................................................................................13A.2 Validation of Metrics........................................................................................................... 14A.3 Use of Metrics for Estimation (Judgement) and Prediction (Forecast)...................................16A.4 Detecting deviations and anomalies in quality problem prone components.........................17A.5 Displaying Measurement Results..........................................................................................17
Annex B (Informative) Use of Quality In Use, External & Internal Metrics (Example).......................18B.1 Introduction........................................................................................................................... 18B.2 Overview of Development and Quality Process....................................................................18B.3 Quality Approach Steps........................................................................................................ 19
Annex C (Informative) Detailed explanation of metrics scale types and measurement types.............25C.1 Metric Scale Types............................................................................................................... 25C.2 Measurement Types.............................................................................................................. 26
Annex D (Informative) Term(s)............................................................................................................. 33D.1 Definitions............................................................................................................................ 33
Annex E (Informative) Quality in use evaluation process.....................................................................35E.1 Establish evaluation requirements.........................................................................................35E.2 Specify the evaluation.......................................................................................................... 36E.3 Design the evaluation........................................................................................................... 38E.4 Execute the evaluation.......................................................................................................... 39
Annex F (Informative) Common Industry Format for Quality in Use Test Reports............................40F.1 Purpose and Objectives......................................................................................................... 40F.2 Report Format Description...................................................................................................41F.3 References............................................................................................................................ 49
Annex G (Informative) Common Industry Format Usability Test Example........................................50G.1 Introduction.......................................................................................................................... 51G.2 Method52G.3 Results 55G.4 Appendix A – Participant Instructions..................................................................................62


©ISO ISO/IEC DTR 9126-4
ForewordISO (the International Organisation for Standardisation) and IEC (the International Electrotechnical Commission) form the specialised system for world-wide standardisation. National bodies that are members of ISO or IEC participate in the development of International Standards through technical committees established by the respective organisation to deal with particular fields of technical activity. ISO and IEC technical committees collaborate in fields of mutual interest. Other international organisations, governmental and non-governmental, in liaison with ISO and IEC, also take part in the work.
International Standards are drafted in accordance with the rules given in the ISO/IEC Directives, Part 3.
In the field of information technology, ISO and IEC have established a joint technical committee, ISO/IEC JTC 1. Draft International Standards adopted by the joint technical committee are circulated to national bodies for voting. Publication as an International Standard requires approval by at least 75 % of the national bodies casting a vote.
International Technical Report ISO/IEC 9126-4 was prepared by Joint Technical Committee ISO/IEC JTC1 Information Technology, Subcommittee SC7, Software Engineering
ISO/IEC 9126 consists of the following parts under the general title Software Engineering - Product quality
Part 1: Quality model
Part 2: External Metrics
Part 3: Internal Metrics
Part 4: Quality in use metrics
Annexes A to G are for information only.
iii

ISO/IEC DTR 9126-4 © ISO
IntroductionThis International Technical Report provides quality in use metrics for measuring attributes of quality in use defined in ISO/IEC 9126-1. The metrics listed in this International Technical Report are not intended to be an exhaustive set. Developers, evaluators, quality managers and acquirers may select metrics from this technical report for defining requirements, evaluating software products, measuring quality aspects and other purposes. They may also modify the metrics or use metrics that are not included here. This report is applicable to any kind of software product, although each of the metrics is not always applicable to every kind of software product.
ISO/IEC 9126-1 defines terms for the software quality characteristics and how these characteristics are decomposed into sub-characteristicsubcharacteristics. ISO/IEC 9126-1, however, does not describe how any of these sub-characteristicsubcharacteristics could be measured. ISO/IEC 9126-2 defines external metrics, ISO/IEC 9126-3 defines internal metrics and ISO/IEC 9126-4 defines quality in use metrics, for measurement of the characteristics or sub-characteristicsubcharacteristics. Internal metrics measure the software itself, external metrics measure the behaviour of the computer-based system that includes the software, and quality in use metrics measure the effects of using the software in a specific context of use.
This International Technical Report is intended to be used together with ISO/IEC 9126-1. It is strongly recommended to read ISO/IEC 14598-1 and ISO/IEC 9126-1, prior to using this International Technical Report, particularly if the reader is not familiar with the use of software metrics for product specification and evaluation.
iv

© ISO ISO/IEC DTR 9126-4
Software Engineering –Product quality – Part 4: Quality in use metrics
1 ScopeThis International Technical Report defines quality in use metrics for the characteristics defined in ISO/IEC 9126-1, and is intended to be used together with ISO/IEC 9126-1.
This International Technical Report contains:
an explanation of how to use apply software quality metrics
a basic set of metrics for each characteristic
an example of how to use apply metrics during the software product life cycle
This International Technical Report does not assign ranges of values of these metrics to rated levels or to grades of compliance, because these values are defined for each software product or a part of the software product, by its nature, depending on such factors as category of the software, integrity level and users' needs. Some attributes may have a desirable range of values, which does not depend on specific user needs but depends on generic factors; for example, human cognitive factors.
This International Technical Report can be applied to any kind of software for any application. Users of this International Technical Report can select or modify and apply metrics and measures from this International Technical Report or may define application-specific metrics for their individual application domain. For example, the specific measurement of quality characteristics such as safety or security may be found in International Standard or International Technical Report provided by IEC 65 and ISO/IEC JTC1/SC27.
Intended users of this International Technical Report include:
Acquirer (an individual or organization that acquires or procures a system, software product or software service from a supplier);
Evaluator (an individual or organization that performs an evaluation. An evaluator may, for example, be a testing laboratory , the quality department of a software development organization, a government organization or an user);
Developer (an individual or organization that performs development activities, including requirements analysis, design, and testing through acceptance during the software life cycle process);
Maintainer (an individual or organization that performs maintenance activities);
Supplier (an individual or organization that enters into a contract with the acquirer for the supply of a system, software product or software service under the terms of the contract) when validating software quality at qualification test;
1

ISO/IEC DTR 9126-4 © ISO
User (an individual or organization that uses the software product to perform a specific function) when evaluating quality of software product at acceptance test;
Quality manager (an individual or organization that performs a systematic examination of the software product or software services) when evaluating software quality as part of quality assurance and quality control.
2 ConformanceThere are no conformance requirements in this International Technical Report.
NOTE General conformance requirements for metrics are in ISO/IEC 9126-1.
3 ReferencesISO 2382-20:1990, Information technology, Vocabulary
ISO 8402: 1994, Quality management and quality assurance – Quality vocabulary
ISO/IEC 9126: 1991, Software engineering – Software product evaluation – Quality characteristics and guidelines for their use
ISO/IEC 9126-1(new): Software engineering – Product quality - Part 1: Quality model
ISO/IEC TR 9126-2(new): Software Engineering - Product quality - Part 2: External metrics
ISO/IEC TR 9126-3(new): Software engineering – Product quality - Part 3: Internal metrics
ISO 9241-11: 1998, Ergonomic requirements for office work with visual display terminals (VDTs) – Guidance on usability
ISO/IEC 14598-1: 1999, Information technology – Software product evaluation - Part 1: General overview
ISO/IEC 14598-2: 2000, Software engineering – Product evaluation - Part 2: Planning and management
ISO/IEC 14598-3: 2000, Software engineering - Product evaluation - Part 3: Process for developers
ISO/IEC 14598-4: 1999, Software engineering - Product evaluation - Part 4: Process for acquirers
ISO/IEC 14598-5: 1998, Information technology - Software product evaluation - Part 5: Process for evaluators
ISO/IEC 14598-6 (new): Software engineering - Product evaluation - Part 6: Documentation of evaluation modules
ISO/IEC 12207: 1995, Information technology – Software life cycle processes.
ISO/IEC 14143-1 1998, Functional size measurement Part 1.
4 Terms and definitionsFor the purposes of this International Technical Report, the definitions contained in this clause and in ISO/IEC 14598-1 and ISO/IEC 9126-1 apply. Some of the definitions from ISO/IEC 14598-1 and ISO/IEC 9126-1 are reproduced in Annex D.
2

© ISO ISO/IEC DTR 9126-4
4.1 Context of use
The users, tasks, equipment (hardware, software and materials), and the physical and social environments in which a product is used.
[ISO 9241-11:1998]
4.2 Goal
An intended outcome.
[ISO 9241-11:1998]
4.3 Task
The activities required to achieve a goal.
NOTE 1: These activities can be physical or cognitive.
NOTE 2: Job responsibilities can determine goals and tasks.
[ISO 9241-11:1998]
5 Symbols and Abbreviated TermsThe following symbols and abbreviations are used in this International Technical Report:
SQA - Software Quality Assurance (Group)
SLCP – Software Life Cycle Processes
6 Use of software quality metricsThese International Technical Reports (ISO/IEC 9126-2, ISO/IEC 9126-3 and ISO/IEC 9126-4) provide a suggested set of quality metrics (external, internal and quality in use metrics) to be used with the ISO/IEC 9126-1 quality model. The user of these technical reports may modify the metrics defined, and/or may also use metrics not listed. When using a modified or a new metric not identified in these International Technical Report’s, the user should specify how the metrics relate to the ISO/IEC 9126-1 quality model or any othersubstitute quality model that is being used.
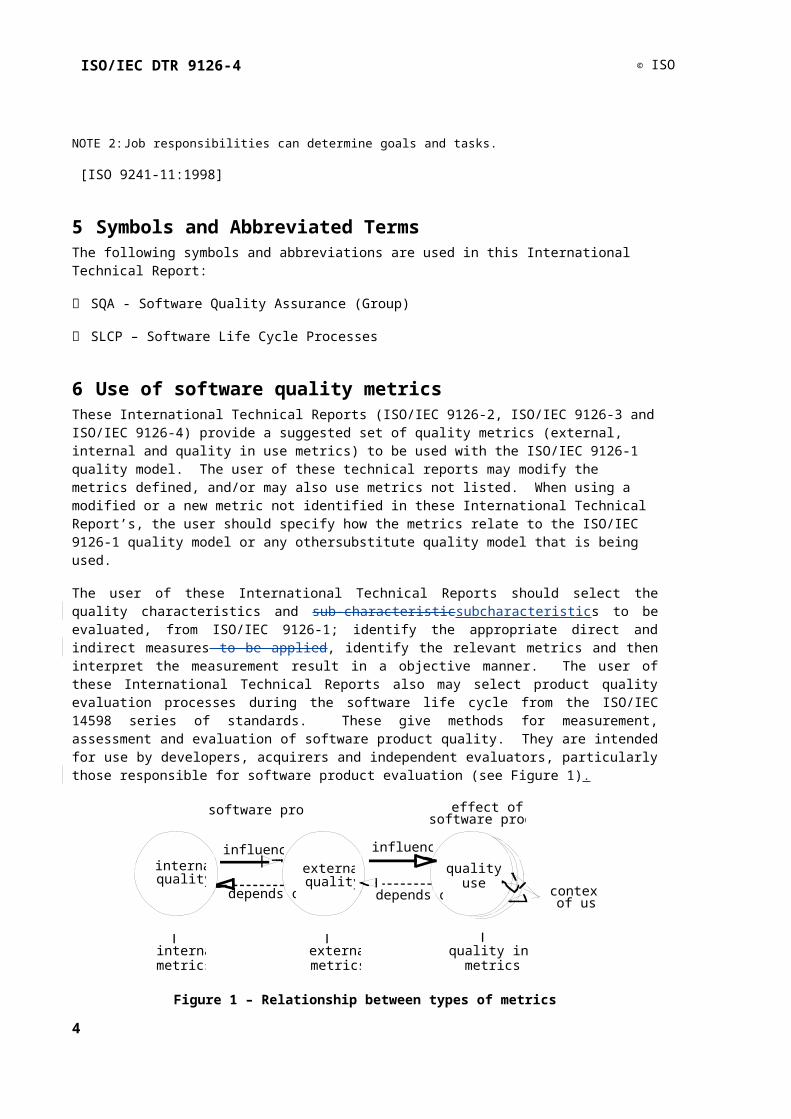
The user of these International Technical Reports should select the quality characteristics and sub-characteristicsubcharacteristics to be evaluated, from ISO/IEC 9126-1; identify the appropriate direct and indirect measures to be applied, identify the relevant metrics and then interpret the measurement result in a objective manner. The user of these International Technical Reports also may select product quality evaluation processes during the software life cycle from the ISO/IEC 14598 series of standards. These give methods for measurement, assessment and evaluation of software product quality. They are intended for use by developers, acquirers and independent evaluators, particularly those responsible for software product evaluation (see Figure 1).
3
ISO/IEC DTR 9126-4 © ISO
external metrics
external quality
quality in use contexts
of use
quality in use metrics
internal metrics
internal quality
influences
depends on
influences
depends on
software product effect of software product
Figure 1 – Relationship between types of metrics
The internal metrics may be applied to a non-executable software product during it’s development stages (such as request for proposal, requirements definition, design specification or source code). Internal metrics provide the users with the ability to measure the quality of the intermediate deliverables and thereby predict the quality of the final product. This allows the user to identify quality issues and take corrective action as early as possible in the development life cycle. This allows the user to detect quality issues and take corrective actions during the early stages of the development life cycle process.
The external metrics may be used to measure the quality of the software product by measuring the behaviour of the system of which it is a part. The external metrics can only be used during the testing stages of the life cycle process and during any operational stages. The measurement is performed when executing the software product in the system environment in which it is intended to operate.. This is achieved by executing the software product in the system environment that it is intended for.
The quality in use metrics measure the extent to whichwhether a product meets the needs of specified users to achieve specified goals with effectiveness, productivity, safety and satisfaction in a specified context of use. This can be only achieved in a realistic system environment.
User quality needs can be specified as quality requirements by quality in use metrics, by external metrics, and sometimes by internal metrics. These requirements specified by metrics should be used as criteria when a product is evaluated.
It is recommended to use internal metrics having a relationship as strong as possible with the target external metrics, so that they can be used to predict the values of external metrics. However, it is often difficult to design a rigorous theoretical model that provides a strong relationship between internal metrics and external metrics. Therefore, a hypothetical model that may contain ambiguity may be designed and the extent of the relationship may be modelled statistically during the use of metrics.
Recommendations and requirements related to validity and reliability are given in ISO/IEC 9126-1: A.4. Additional detailed considerations when using metrics are given in Annex A of this International Technical Report.
7 How to read and use the metrics tablesThe metrics listed in clause 8 are categorised by the characteristics and sub-characteristicsubcharacteristics in ISO/IEC 9126-1. The following information is given for each metric in the table:
a) Metric name: Corresponding metrics in the internal metrics table and external metrics table have similar names.
4

© ISO ISO/IEC DTR 9126-4
b) Purpose of the metric: This is expressed as the question to be answered by the application of the metric.
c) Method of application: Provides an outline of the application.
d) Measurement, formula and data element computations: Provides the measurement formula and explains the meanings of the used data elements.
NOTE In some situations more than one formula is proposed for a metric..
e) Interpretation of measured value: Provides the range and preferred values.
f) Metric scale type: Type of scale used by the metric. Scale types used are; Nominal scale, Ordinal scale, Interval scale, Ratio scale and Absolute scale.
NOTE: A more detailed explanation is given in annex C.
g) Measure type: Types used are; Size type (e.g. Function size, Source size) , Time type ( e.g. Elapsed time, User time) , Count type ( e.g. Number of changes, Number of failures).
NOTE A more detailed explanation is given in Annex C.
h) Input to measurement: Source of data used in the measurement.
i) ISO/IEC 12207 SLCP Reference: Identifies software life cycle process(es) where the metric is applicable.
j) Target audience: Identifies the user(s) of the measurement results.
8 Metrics Tables
8.1 GeneralThe metrics listed in this clause are not intended to be an exhaustive set and may not have been validated. They are listed by software quality characteristics and subcharacteristics, in the order introduced in ISO/IEC 9126-1 They are listed in order of software quality characteristics and sub-characteristicsubcharacteristics.
Metrics, which may be applicable, are not limited to these listed here. Additional specific metrics for particular purposes are provided in other related documents, such as functional size measurement or precise time efficiency measurement.
NOTE It is recommended to refer a specific metric or measurement from specific standards, technical reports or guidelines Functional size measurement is defined in ISO/IEC 14143. An example of precise time efficiency measurement can be referred from ISO/IEC 14756.
Metrics should be validated before application in a specific environment (see Annex A).
NOTE This list of metrics is not finalised, and may be revised in future versions of this International Technical Report. Readers of this International Technical Report are invited to provide feedback.
The quality in use metrics in this clause measure the effectiveness, productivity, safety or satisfaction with which specified users achieve specified goals in a specified context of use. Quality in use depends not only on the software product, but also on the particular context in which the product is being used. The context of use is determined by user factors, task factors and physical and social environmental factors.
Quality in use is assessed by observing representative users carrying out representative tasks in a realistic context of use (see Annex E). The measures may be obtained by simulating a realistic
5

ISO/IEC DTR 9126-4 © ISO
working environment (for instance in a usability laboratory) or by observing operational use of the product. In order to specify or measure quality in use it is first necessary to identify each component of the intended context of use: the users, their goals, and the environment of use. The evaluation should be designed to match this context of use as closely as possible. It is also important that users are only given the type of help and assistance that would be available to them in the operational environment.
NOTE The term usability is sometimes used with a similar meaning to quality in use (but excluding safety) (e.g. in ISO 9241-11).
Some external usability metrics (ISO/IEC 9126-2) are tested in a similar way, but evaluate the use of particular product features during more general use of the product to achieve a typical task as part of a test of the quality in use.
Quality in use has four characteristics (effectiveness, productivity, safety and satisfaction) and no sub-characteristicsubcharacteristics.
6
© ISO ISO/IEC DTR 9126-4
8.2 Effectiveness metricsEffectiveness metrics assess whether the tasks performed by users achieve specified goals with accuracy and completeness in a specified context of use. They do not take account of how the goals were achieved, only the extent to which they were achieved (see E.2.1.2).
Table 8.1 Effectiveness metrics
Metric Name Purpose of the metrics
Method of application
Measurement, formula and data element computations
Interpretation of measured value
Metric scale type
Measure type
Input to measurement
12207
reference
Target audience
Task effectiveness
What proportion of the goals of the task is achieved correctly?
User test M1 = |1-Ai|1
Ai= proportional value of each missing or incorrect component in the task output
0<= M1 <=1
The closer to 1.0 the better.
- A= ? Operation (test) report
User monitoring record
6.5 Validation5.3 Qualifica-tion testing 5.4 Operation
User
Human interface designer
NOTE Each potential missing or incomplete component is given a weight A i based on the extent to which it detracts from the value of the output to the business or user. (If the sum of the weights exceed 1, the metric is normally set to 0, although this may indicate negative outcomes and potential safety issues.) (See for example G.3.1.1.) The scoring scheme is refined iteratively by applying it to a series of task outputs and adjusting the weights until the measures obtained are repeatable, reproducible and meaningful.
Task completion What proportion of the tasks are completed?
User test X = A/B
A = number of tasks completedB = total number of tasks attempted
0<= X <=1
The closer to 1.0 the better.
Ratio A = CountB = Count
X = Count/Count
Operation (test) report
User monitoring record
6.5 Validation5.3 Qualifica-tion testing 5.4 Operation
User
Human interface designer
NOTE This metric can be measured for one user or a group of users. If tasks can be partially completed the Task effectiveness metric should be used..
Error frequency What is the frequency of errors?
User test X = A/T
A = number of errors made by the user
T= time or number of tasks
0<= X
The closer to 0 the better.
Absolute A = Count
Operation (test) report
User monitoring record
6.5 Validation5.3 Qualifica-tion testing 5.4 Operation
User
Human interface designer
7

© ISO ISO/IEC DTR 9126-4
NOTE This metric is only appropriate for making comparisons if errors have equal importance, or are weighted.
8.3 Productivity metricsProductivity metrics assess the resources that users consume in relation to the effectiveness achieved in a specified context of use. The most common resource is time to complete the task, although other relevant resources could include the user’s effort, materials or the financial cost of usage.
Table 8.2 Productivity metrics
Metric Name Purpose of the metrics
Method of application
Measurement, formula and data element computations
Interpretation of measured value
Metric scale type
Measure type
Input to measurement
12207
reference
Target audience
Task time How long does it take to complete a task?
User test X = Ta
Ta = task time
0<= X
The smaller the better.
Interval T= Time Operation (test) report
User monitoring record
6.5 Validation5.3 Qualifica-tion testing 5.4 Operation
User
Human interface designer
Task efficiency How efficient are the users?
User test X = M1 / T
M1 = task effectivenessT = task time
0<= X
The larger the better.
- T= Time
X=
Operation (test) report
User monitoring record
6.5 Validation5.3 Qualifica-tion testing 5.4 Operation
User
Human interface designer
NOTE 1 Task efficiency measures the proportion of the goal achieved for every unit of time. Efficiency increases with increasing effectiveness and reducing task time. A high value indicates that a high proportion of the task is achieved in a small amount of time. It enables comparisons to be made, for example between fast error-prone interfaces and slow easy interfaces (see for example F.2.4.4)..
8

© ISO ISO/IEC DTR 9126-4
Metric Name Purpose of the metrics
Method of application
Measurement, formula and data element computations
Interpretation of measured value
Metric scale type
Measure type
Input to measurement
12207
reference
Target audience
NOTE 2 If Task completion has been measured, task efficiency can be measured as Task completion/task time. This measures the proportion of users who were successful for every unit of time. A high value indicates a high proportion of successful users in a small amount of time.
Economic productivity
How cost-effective is the user?
User test X = M1 / C
M1 = task effectivenessC = total cost of the task
0<= X
The larger the better.
- T= Time
X=
Operation (test) report
User monitoring record
6.5 Validation5.3 Qualifica-tion testing 5.4 Operation
User
Human interface designer
NOTE Costs could for example include the user’s time, the time of others giving assistance, and the cost of computing resources, telephone calls, and materials
Productive proportion
What proportion of the time is the user performing productive actions?
User test X = Ta / Tb
Ta = productive time = task time - help time - error time - search timeTb = task time
0<= X <=1
The closer to 1.0 the better.
Absolute Ta=TimeTb=TimeX= Time/Time
Operation (test) report
User monitoring record
6.5 Validation5.3 Qualifica-tion testing 5.4 Operation
User
Human interface designer
NOTE This metric requires detailed analysis of a videotape of the interaction (see Macleod M, Bowden R, Bevan N and Curson I (1997) The MUSiC Performance Measurement method, Behaviour and Information Technology, 16, 279-293.)
Relative user efficiency
How efficient is a user compared to an expert?
User test Relative user efficiency X = A / B
A = ordinary user’s task efficiency B = expert user’s task efficiency
0<= X <=1
The closer to 1.0 the better.
Absolute X = A / B
Operation (test) report
User monitoring record
6.5 Validation5.3 Qualifica-tion testing 5.4 Operation
User
Human interface designer
NOTE The user and expert carry out the same task. If the expert was 100% productive, and the user and expert had the same task effectiveness, this metric would give a similar value to the Productive proportion.
9

ISO/IEC DTR 9126-4 © ISO
8.4 Safety metricsSafety metrics assess the level of risk of harm to people, business, software, property or the environment in a specified context of use. It includes the health and safety of the both the user and those affected by use, as well as unintended physical or economic consequences.
Table 8.3 Safety metrics
Metric Name Purpose of the metrics
Method of application
Measurement, formula and data element computations
Interpretation of measured value
Metric scale type
Measure type
Input to measurement
12207
reference
Target audience
User health and safety
What is the incidence of health problems among users of the product?
Usage statistics X = 1-A / B
A = number of users reporting RSIB = total number of users
0<= X <=1
The closer to 1 the better.
Absolute A = countB = countX = count/ count
Usage monitoring record
5.4 Operation User
Human interface designer
NOTE Health problems can include Repetitive Strain Injury, fatigue, headaches, etc.
Safety of people affected by use of the system
What is the incidence of hazard to people affected by use of the system?
Usage statistics X = 1-A / B
A = number of people put at hazardB = total number of people potentially affected by the system
0<= X <=1
The closer to 1 the better.
Absolute A = countB = countX = count/ count
Usage monitoring record
5.3 Qualification Testing 5.4 Operation
User
Human interface designer
Developer
NOTE An example of this metric is Patient Safety, where A = number of patients with incorrectly prescribed treatment and B = total number of patients
Economic damage
What is the incidence of economic damage?
Usage statistics X = 1-A/ B
A = number of occurrences of economic damageB = total number of usage situations
0<= X <=1
The closer to 1 the better.
Absolute A = countB = countX = count/ count
Usage monitoring record
5.4 Operation User
Human interface designer
Developer
NOTE This can also be measured based on the number of occurrences of situations where there was a risk of economic damage
Software damage What is the incidence of software
Usage statistics X = 1-A / B
0<= X <=1
The closer to 1
Absolute A = countB = countX =
Usage monitoring
5.4 Operation User
Human
10

© ISO ISO/IEC DTR 9126-4
Metric Name Purpose of the metrics
Method of application
Measurement, formula and data element computations
Interpretation of measured value
Metric scale type
Measure type
Input to measurement
12207
reference
Target audience
corruption? A = number of occurrences of software corruptionB = total number of usage situations
the better. count/ count
record interface designer
Developer
NOTE 1 This can also be measured based on the number of occurrences of situations where there was a risk of software damage
NOTE 2 Can also be measured as X = cumulative cost of software corruption / usage time
8.5 Satisfaction metricsSatisfaction metrics assess the user’s attitudes towards the use of the product in a specified context of use.
NOTE: Satisfaction is influenced by the user's perception of properties of the software product (such as those measured by external metrics) and by the user's perception of the efficiency, productivity and safety in use.
Table 8.4 Satisfaction metrics
Metric Name Purpose of the metrics
Method of application
Measurement, formula and data element computations
Interpretation of measured value
Metric scale type
Measure type
Input to measurement
12207
reference
Target audience
Satisfaction scale
How satisfied is the user?
User test X = A/BA = questionnaire producing psychometric scalesB = population average
0<X the larger the better
Ratio. A= CountX= Count
Operation (test) report
User monitoring record
6.5 Validation5.3 Qualifica-tion testing 5.4 Operation
User
Human interface designer
Developer
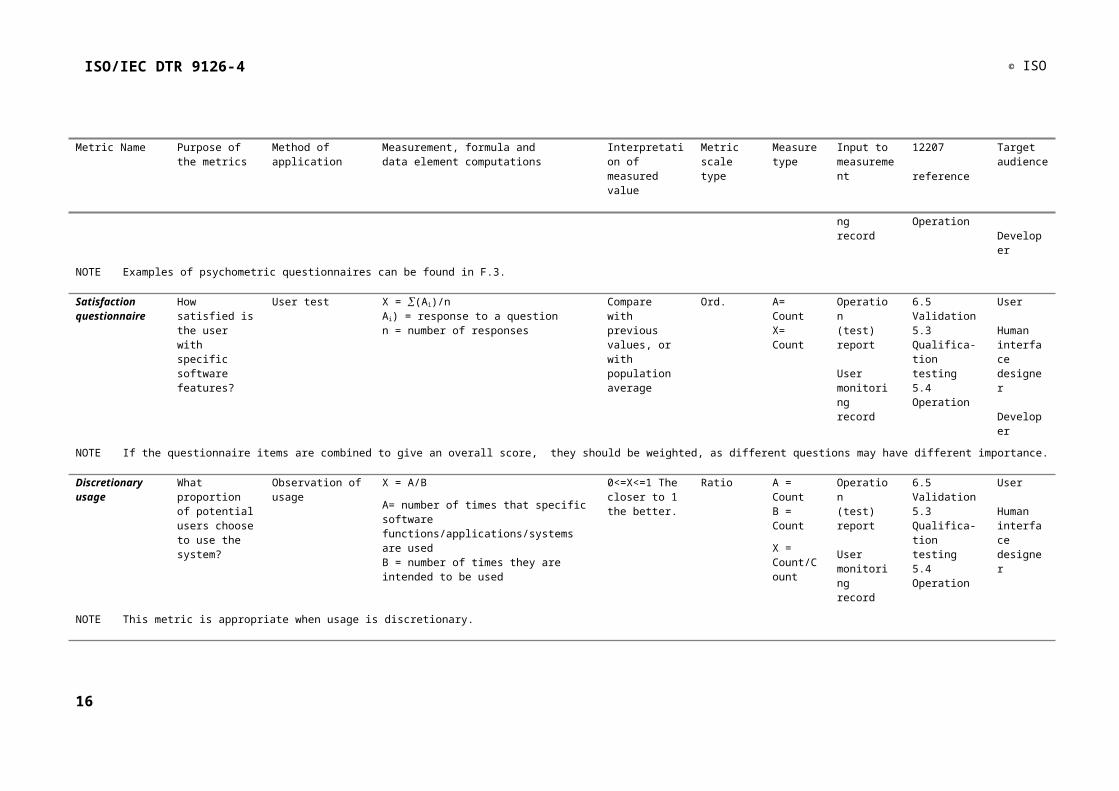
NOTE Examples of psychometric questionnaires can be found in F.3.
Satisfaction questionnaire
How satisfied is the user with specific software features?
User test X = (Ai)/nAi) = response to a questionn = number of responses
Compare with previous values, or with population average
Ord. A= CountX= Count
Operation (test) report
User monitoring record
6.5 Validation5.3 Qualifica-tion testing 5.4 Operation
User
Human interface designer
11

ISO/IEC DTR 9126-4 © ISO
Metric Name Purpose of the metrics
Method of application
Measurement, formula and data element computations
Interpretation of measured value
Metric scale type
Measure type
Input to measurement
12207
reference
Target audience
Developer
NOTE If the questionnaire items are combined to give an overall score, they should be weighted, as different questions may have different importance.
Discretionary usage
What proportion of potential users choose to use the system?
Observation of usage
X = A/B
A= number of times that specific software functions/applications/systems are used B = number of times they are intended to be used
0<=X<=1 The closer to 1 the better.
Ratio A = CountB = Count
X = Count/Count
Operation (test) report
User monitoring record
6.5 Validation5.3 Qualifica-tion testing 5.4 Operation
User
Human interface designer
NOTE This metric is appropriate when usage is discretionary.
12

© ISO ISO/IEC DTR 9126-4
Annex A (Informative)
Considerations when using metrics
A.1 Interpretation of measures
A.1.1 Potential differences between test and operational contexts of useWhen planning the use of metrics or interpreting measures it is important to have a clear understanding of the intended context of use of the software, and any potential differences between the test and operational contexts of use. For example, the “time required to learn operation" measure is often different between skilled operators and unskilled operators in similar software systems. Examples of potential differences are given below.
a) Differences between testing environment and the operational environment
Are there any significant differences between the testing environment and the operational environment?
The following are examples:
testing with higher / comparable / lower performance of CPU of operational computer;
testing with higher / comparable / lower performance of operational network and communication;
testing with higher / comparable / lower performance of operational operating system;
testing with higher / comparable / lower performance of operational user interface.
b) Differences between testing execution and actual operational execution
Are there any significant differences between the testing execution and operational execution in user environment?
The following are examples:
coverage of functionality in test environment;
test case sampling ratio;
automated testing of real time transactions;
stress loads;
24 hour 7 days a week (non stop) operation
appropriateness of data for testing of exceptions and errors;
periodical processing;
resource utilisation.
levels of interruption
production presasures
13

© ISO ISO/IEC DTR 9126-4
distractions
c) User profile under observation
Are there any significant differences between test user profiles and operational user profiles?
The following are examples :mix of type of users;
user skill levels;
specialist users or average users;
limited user group or public users
A1.2 Issues affecting validity of resultsThe following issues may affect the validity of the data that is collected.
a) procedures for collecting evaluation results:
automatically with tools or facilities/ manually collected / questionnaires or interviews;
b) source of evaluation results
developers' self reports / reviewers’ report / evaluator’s report;
c) results data validation
developers' self check / inspection by independent evaluators.
A.1.3 Balance of measurement resourcesIs the balance of measures used at each stage appropriate for the evaluation purpose?
It is important to balance the effort used to apply an appropriate range of metrics for internal, external and quality in use measures.
A.1.4 Correctness of specificationAre there significant differences between the software specification and the real operational needs?
Measurements taken during software product evaluation at different stages are compared against product specifications. Therefore, it is very important to ensure by verification and validation that the product specifications used for evaluation reflect the actual and real needs in operation.A.2
A.2 Validation of Metrics
A.2.1 Desirable Properties for MetricsTo obtain valid results from a quality evaluation, the metrics should have the properties stated below. If a metric does not have these properties, the metric description should explain the associated constraint on its validity and, as far as possible, how that situation can be handled.
a) Reliability (of metric): Reliability is associated with random error. A metric is free of random error if random variations do not affect the results of the metric
14
© ISO
b) Repeatability (of metric): repeated use of the metric for the same product using the same evaluation specification (including the same environment), type of users, and environment by the same evaluators, should produce the same results within appropriate tolerances.Thetolerances. The appropriate tolerances should include such things as fatigue,andfatigue, and learning effect
c) Reproducibility (of metric): use of the metric for the same product using the same evaluation specification (including the same environment) type of users and environment by different evaluators, should produce the same results within appropriate tolerances.
NOTE It is recommended to use statistical analysis to measure the variability of the results
d) Availability (of metric): The metric should clearly indicate the conditions (e.g. presence of specific attributes) which constrain its usage.
e) Indicativeness (of metric): Capability of the metric to identify parts or items of the software which should be improved, given the measured results compared to the expected ones.
NOTE The selected or proposed metric should provide documented evidence of the availability of the metric for use, unlike those requiring project inspection only.
f) Correctness (of measure): The metric should have the following properties:.
1) Objectivity (of measure): the metric results and its data input should be factual: i.e., not influenced by the feelings or the opinions of the evaluator, test users, etc. (except for satisfaction or attractiveness metrics where user feelings and opinions are being measured).
2) Impartiality (of measure): the measurement should not be biased towards any particular result.
3) Sufficient precision (of measure): Precision is determined by the design of the metric, and particularly by the choice of the material definition used as the basis for the metric. The metric user will describe the precision and the sensitivity of the metric.
g) Meaningfulness (of measure): the measurement should produce meaningful results about the software behaviour or quality characteristics.
The metric should also be cost effective: that is, more costly metrics should provide higher value results.
A.2.2 Demonstrating the Validity of Metrics The users of metrics should identify the methods for demonstrating the validity of metrics, as shown below.
a) Correlation
The variation in the quality characteristics values (the measures of principal metrics in operational use) explained by the variation in the metric values, is given by the square of the linear coefficient.
An evaluator can predict quality characteristics without measuring them directly by using correlated metrics.
b) Tracking
If a metric M is directly related to a quality characteristics value Q (the measures of principal metrics in operational use ), for a given product or process, then a change value Q(T1) to Q(T2), would be accompanied by a change metric value from M(T1) to M(T2), in the same direction (for example, if Q increases, M increases).
15

ISO/IEC DTR 9126-4 © ISO
An evaluator can detect movement of quality characteristics along a time period without measuring directly by using those metrics which have tracking ability.
c) Consistency
If quality characteristics values (the measures of principal metrics in operational use) Q1, Q2,..., Qn, corresponding to products or processes 1, 2,..., n, have the relationship Q1 > Q2 > ...> Qn, then the correspond metric values would have the relationship M1 > M2 > ...> Mn.
An evaluator can notice exceptional and error prone components of software by using those metrics which have consistency ability.
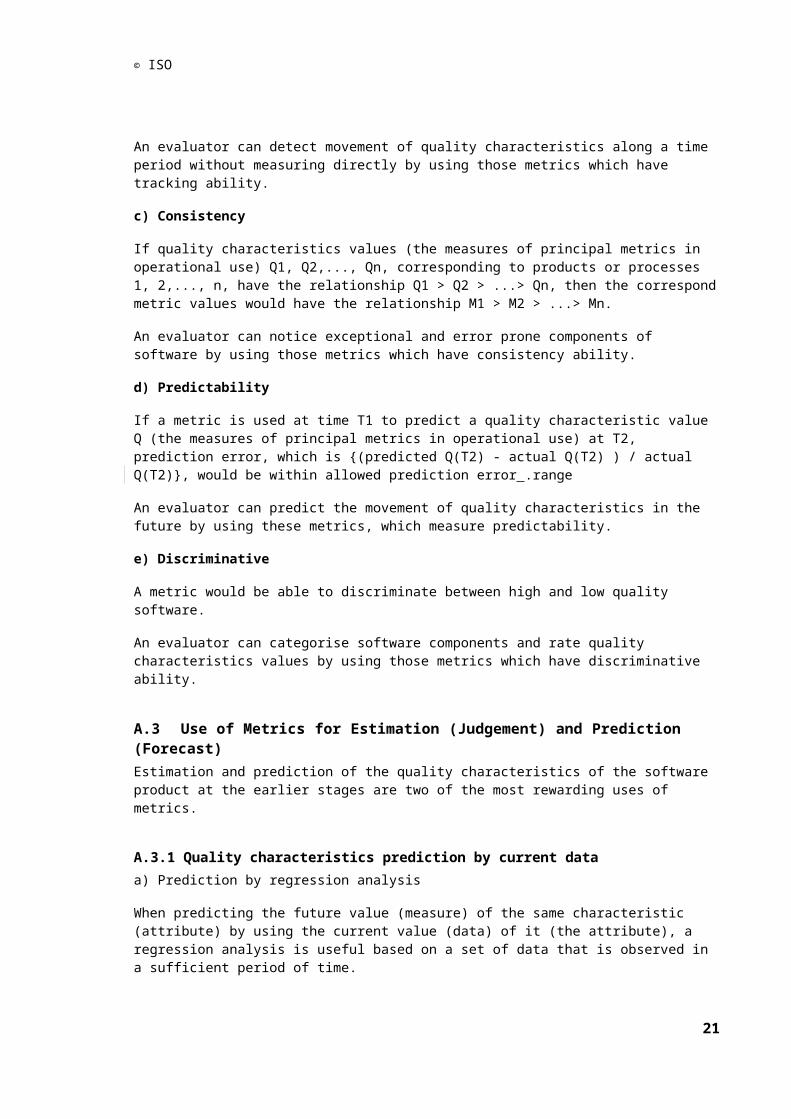
d) Predictability
If a metric is used at time T1 to predict a quality characteristic value Q (the measures of principal metrics in operational use) at T2, prediction error, which is {(predicted Q(T2) - actual Q(T2) ) / actual Q(T2)}, would be within allowed prediction error .range
An evaluator can predict the movement of quality characteristics in the future by using these metrics, which measure predictability.
e) Discriminative
A metric would be able to discriminate between high and low quality software.
An evaluator can categorise software components and rate quality characteristics values by using those metrics which have discriminative ability.
A.3 Use of Metrics for Estimation (Judgement) and Prediction (Forecast)Estimation and prediction of the quality characteristics of the software product at the earlier stages are two of the most rewarding uses of metrics.
A.3.1 Quality characteristics prediction by current dataa) Prediction by regression analysis
When predicting the future value (measure) of the same characteristic (attribute) by using the current value (data) of it (the attribute), a regression analysis is useful based on a set of data that is observed in a sufficient period of time.
For example, the value of MTBF (Mean Time Between Failures) that is obtained during the testing stage (activities) can be used to estimate the MTBF in operation stage.
b) Prediction by correlation analysis
When predicting the future value (measure) of a characteristic (attribute) by using the current measured values of a different attribute, a correlation analysis is useful using a validated function which shows the correlation.
For example, the complexity of modules during coding stage may be used to predict time or effort required for program modification and test during maintenance process.
A.3.2 Current quality characteristics estimation on current factsa) Estimation by correlation analysis
16

© ISO
When estimating the current values of an attribute which are directly unmeasurable, or if there is any other measure that has strong correlation with the target measure, a correlation analysis is useful.
For example, because the number of remaining faults in a software product is not measurable, it may be estimated by using the number and trend of detected faults.
Those metrics which are used for predicting the attributes that are not directly measurable should be estimated as explained below:
using models for predicting the attribute;
using formula for predicting the attribute;
using basis of experience for predicting the attribute;
using justification for predicting the attribute.
Those metrics which are used for predicting the attributes that are not directly measurable may be validated as explained below:
identify measures of attributes which are to be predicted;
identify the metrics which will be used for prediction;
perform a statistical analysis based validation;
document the results
repeat the above periodically
A.4 Detecting deviations and anomalies in quality problem prone componentsThe following quality control tools may be used to analyse deviations and anomalies in software product components:
a) process charts (functional modules of software);
b) Pareto analysis and diagrams;
c) histograms and scatter diagrams;
d) run diagrams, correlation diagrams and stratification;
e) Ishikawa (Fishbone) diagrams;
f) statistical process control (functional modules of software);
g) check sheets.
The above tools can be used to identify quality issues from data obtained by applying the metrics.
A.5 Displaying Measurement Resultsa) Displaying quality characteristics evaluation results
The following graphical presentations are useful to display quality evaluation results for each of the quality characteristic and sub-characteristicsubcharacteristic.
17

ISO/IEC DTR 9126-4 © ISO
Radar chart; Bar chart numbered histogram, multi-variates chart, Importance Performance Matrix, etc.
b) Displaying measures
There are useful graphical presentations such as Pareto chart, trend charts, histograms, correlation charts, etc.
18

© ISO
Annex B(Informative)
Use of Quality in Use, External & Internal Metrics (Framework Example)
B.1 IntroductionThis framework example is a high level description of how the ISO/IEC 9126 Quality model and related metrics may be used during the software development and implementation to achieve a quality product that meets user’s specified requirements. The concepts shown in this example may be implemented in various forms of customization to suit the individual, organisation or project. The example uses the key life cycle processes from ISO/IEC 12207 as a reference to the traditional software development life cycle and quality evaluation process steps from ISO/IEC 14598-3 as a reference to the traditional Software Product Quality evaluation process. The concepts can be mapped on to other models of software life cycles if the user so wishes as long as the underlying concepts are understood.
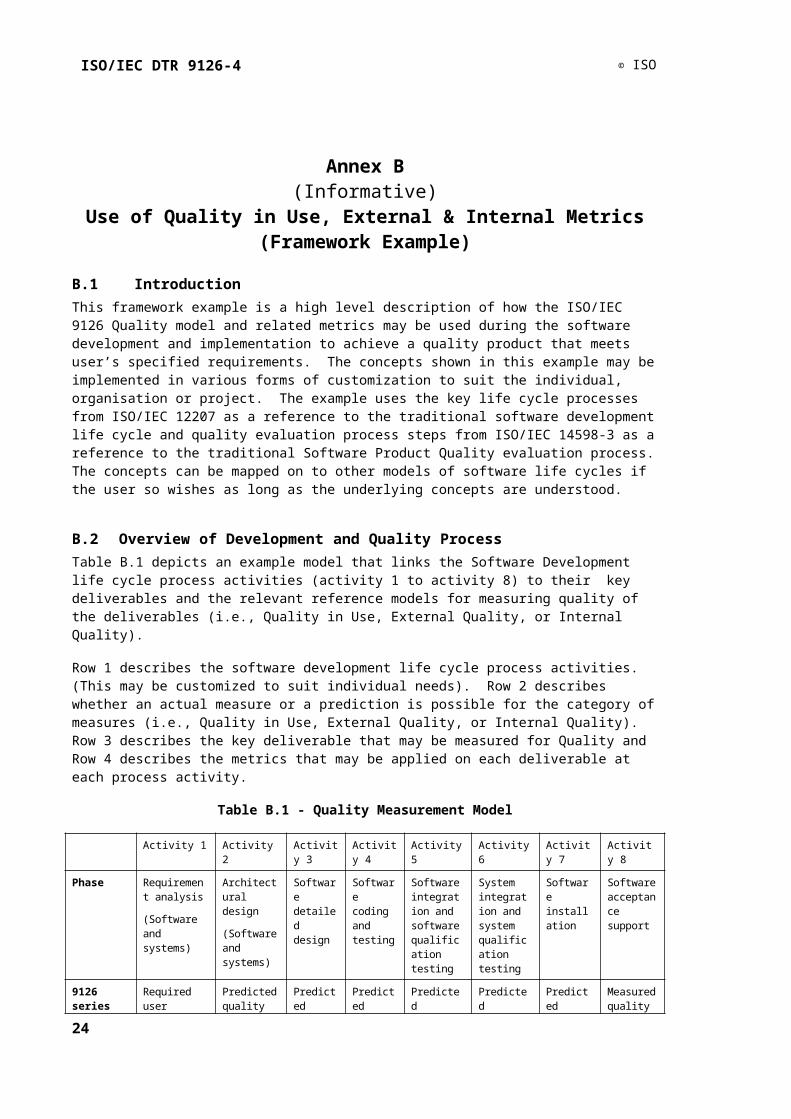
B.2 Overview of Development and Quality ProcessTable B.1 depicts an example model that links the Software Development life cycle process activities (activity 1 to activity 8) to their key deliverables and the relevant reference models for measuring quality of the deliverables (i.e., Quality in Use, External Quality, or Internal Quality).
Row 1 describes the software development life cycle process activities. (This may be customized to suit individual needs). Row 2 describes whether an actual measure or a prediction is possible for the category of measures (i.e., Quality in Use, External Quality, or Internal Quality). Row 3 describes the key deliverable that may be measured for Quality and Row 4 describes the metrics that may be applied on each deliverable at each process activity.
Table B.1 - Quality Measurement Model
Activity 1 Activity 2 Activity 3 Activity 4 Activity 5 Activity 6 Activity 7 Activity 8
Phase Requirement analysis
(Software and systems)
Architectural design
(Software and systems)
Software detailed design
Software coding and testing
Software integration and software qualification testing
System integration and system qualification testing
Software installation
Software acceptance support
9126 series model reference
Required user quality,
Required internal quality,
Required external quality
Predicted quality in use,
Predicted external quality,
Measured internal quality
Predicted quality in use,
Predicted external quality,
Measured internal quality
Predicted quality in use,
Measured external quality,
Predicted external quality,
Measured internal quality
Predicted quality in use,
Measured external quality,
Predicted external quality,
Measured internal quality
Predicted quality in use,
Measured external quality,
Measured internal quality
Predicted quality in use,
Measured external quality,
Measured internal quality
Measured quality in use,
Measured external quality,
Measured internal quality
Key deliverables of activity
User quality requirements (specified),
External quality requirements (specified),
Internal quality
Architecture design of Software / system
Software detailed design
Software code,
Test results
Software product,
Test results
Integrated system,
Test results
Installed system
Delivered software product
19
ISO/IEC DTR 9126-4 © ISO
requirements (specified)
Metrics used to measure
Internal metrics
(External metrics may be applied to validate specifications)
Internal metrics
Internal metrics
Internal metrics
External metrics
Internal metrics
External metrics
Internal metrics
External metrics
Internal metrics
External metrics
Quality in use metrics
Internal metrics
External metrics
B.3 Quality Approach Steps
B.3.1 GeneralEvaluation of the Quality during the development cycle is divided into following steps. Step 1 has to be completed during the Requirement Analysis activity. Steps 2 to 5 have to be repeated during each process Activity defined above.
B.3.2 Step #1 Quality requirements identificationFor each of the Quality characteristics and sub-characteristicsubcharacteristics defined in the Quality model determine the User Needs weights using the two examples in Table B.2 for each category of the measurement. (Quality in Use, External and Internal Quality). Assigning relative weights will allow the evaluators to focus their efforts on the most important sub characteristics.
Table B.2 –User Needs Characteristics & Weights
Quality in Use
CHARACTERISTICWEIGHT
(High/Medium/Low)
Effectiveness H
Productivity H
Safety L
Satisfaction M
20

© ISO
External & Internal Quality
CHARACTERISTICSUB-
CHARACTERISTICSUBCHARACTERISTIC
WEIGHT(High/Medium/Low)
FunctionalitySuitability H
Accuracy H
Interoperability L
Compliance M
Security H
Reliability Maturity(hardware/software/data) L
Fault tolerance L
Recoverability (data, process, technology) H
Compliance H
UsabilityUnderstandability M
Learnability L
Operability H
Attractiveness M
Compliance H
EfficiencyTime behaviour H
Resource utilization H
Compliance H
MaintainabilityAnalyzability H
Changeability M
Stability L
Testability M
Compliance H
PortabilityAdaptability H
Installability L
Co-existence H
Replaceability M
Compliance H
21

ISO/IEC DTR 9126-4 © ISO
NOTE Weights can be expressed in the High/Medium/Low manner or using the ordinal type scale in the range 1-9 (ege.g.: 1-3 = low, 4-6 = medium, 7-9 = high).
B.3.3 Step #2 Specification of the evaluationThis step is applied during every development process activity.
For each of the Quality sub-characteristicsubcharacteristics defined in the Quality model identify the metrics to be applied and the required levels to achieve the User Needs set in Step 1 and record as shown in the example in Table B.3.
Basic input and directions for the content formulation can be obtained from the example in Table B1 that explains what can be measured at this stage of the development cycle.
NOTE It is possible, that some of the rows of the tables would be empty during the specific activities of the development cycle, because it would not be possible to measure all of the sub characteristics early in the development process.
22
© ISO
Table B.3 – Quality Measurement Tables
Quality in Use Measurement Category
CHARACTERISTIC METRICS REQUIRED LEVEL ASSESSMENT ACTUAL RESULT
Effectiveness
Productivity
Safety
Satisfaction
External Quality Measurement Category
CHARACTERISTICSUB-
CHARACTERISTICSUBCHARACTERISTIC
METRICS REQUIRED LEVELASSESSMENT
ACTUAL RESULT
Functionality Suitability
Accuracy
Interoperability
Security
ComplianceReliability Maturity
(hardware/software/data)
Fault tolerance
Recoverability (data, process, technology)Compliance
Usability Understandability
Learnability
Operability
Attractiveness
ComplianceEfficiency Time behaviour
Resource utilisation
ComplianceMaintainability Analyzability
Changeability
Stability
Testability
Compliance
23

ISO/IEC DTR 9126-4 © ISO
Portability Adaptability
Instability
Co-existence
Replaceability
Compliance
Internal Quality Measurement Category
Functionality Suitability
Accuracy
Interoperability
Security
ComplianceReliability Maturity
(hardware/software/data)
Fault tolerance
Recoverability (data, process, technology)Compliance
Usability Understandability
Learnability
Operability
Attractiveness
ComplianceEfficiency Time behaviour
Resource utilisation
ComplianceMaintainability Analyzability
Changeability
Stability
Testability
CompliancePortability Adaptability
Instability
Co-existence
Replaceability
Compliance
B.3.4 Step #3 Design of the evaluationThis step is applied during every development process activity.
Develop a measurement plan (similar to example in Table B.4) containing the deliverables that are used as input to the measurement process and the metrics to be applied.
24

© ISO
Table B.4 – Measurement Plan
SUB-CHARACTERISTICSUB
CHARACTERISTIC
DELIVERABLES TO BE EVALUATED
INTERNAL METRICS TO BE APPLIED
EXTERNAL METRICS TO BE APPLIED
QUALITY IN USE METRICS TO BE
APPLIED
1. Suitability 1.2.3.
1.2.3.
1.2.3.
(Not Applicable)
2. Satisfaction 1.2.3.
(Not Applicable) (Not Applicable) 1.2.3.
3. 4. 5. 6.
B.3.5 Step #4 Execution of the evaluationThis step is applied during every development process activity.
Execute the evaluation plan and complete the column as shown in the examples in Table B.3. Standard ISO-IEC 14598 series of standards should be used asprocess for evaluations may be used as a guidance for planning and executing the measurement process.
B.3.6 Step #5 Feedback to the organizationThis step is applied during every development process activity.
Once all measurements have been completed map the results into Table B.1 and document conclusions in the form of a report. Also identify specific areas where quality improvements are required for the product to meet the user needs.
25

ISO/IEC DTR 9126-4 © ISO
Annex C(Informative)
Detailed explanation of metric scale types and measurement types
C.1 Metric Scale TypesOne of tThe following measurement metric scale types should be identified for each measure, when a user of metrics has the result of a measurement and uses the measure for calculation or comparison. The average, ratio or difference values may have no meaning for some measures. Metric scale types are: Nominal scale, Ordinal scale, Interval scale, Ratio scale, and Absolute scale. A scale should always be defined as M'=F(M), where F is the admissible function. Also the description of each measurement scale type contains a description ofexplain what the admissible function is (if M is a metric then M'=F(M) is also a metric).
a) Nominal Scale
M'=F(M) where F is any one-to-one mapping.
This includes classification, for example, software fault types (data, control, other). An average has a meaning only if it is calculated with frequency of the same type. A ratio has a meaning only when it is calculated with frequency of each mapped type. Therefore, the ratio and average may be used to represent a difference in frequency of only the same type between early and later cases or two similar cases. Otherwise, they may be used to compare mutually compare the frequency of each other type respectively.
EXAMPLES Town transport line identification number , cCompiler error message identification number.
Meaningful statements are Numbers of different categories only.
b) Ordinal Scale
M'=F(M) where F is any monotonic increasing mapping that is, M(x)>=M(y) implies M'(x)>=M'(y).
This includes ordering, for example, software failure by severity (negligible, marginal, critical, catastrophic). An average has a meaning only if it is calculated with frequency of the same mapped order. A ratio has a meaning only when it is calculated with the frequency of each mapped order. Therefore, the ratio and the average may be used to represent a difference in frequency of only the same order between early and later cases or two similar cases. Otherwise, they may be used to compare mutually the frequency of each order.
EXAMPLES School exam result (excellent, good, acceptable, not acceptable),
Meaningful statements: Each will depend on its position in the order , for example the median.
c) Interval Scale
M'=aM+b (a>0)
This includes ordered rating scales where the difference between two measures has an empericalempirical meaning However the ratio of two measures in an interval scale may not have the same empericalempirical meaning
EXAMPLES Temperature (Celsius, FaranheitFahrenheit, KalvinKelvin), Difference of actual computation time to the time predicted
Meaningful statements: An arithmetic average and anything that depends on an order
d) Ratio Scale
26

© ISO
M'=aM (a>0)
This includes ordered rating scales ,where the difference between two measures and also the proportion of two measures have the same empericalempirical meaning .. An average and a ratio have meaning respectively and they give actual meaning to the values..
EXAMPLES Length, Weight, Time, Size, Count
Meaningful statements: Geometrical mean, Percentage
e) Absolute Scale
M'=M they can be measured only in one way.
Any statement relating to measures is meaningful. For example the result of dividing one ratio scale type measure by another ratio scale type measure where the unit of measurement is the same is absolute. An absolute scale type measurement is in fact one without any unit.
EXAMPLE Number of lines of code with comments divided by the total lines of code
Meaningful statements: Everything
C.2 Measurement Types
C.2.0 GeneralIn order to design a procedure for collecting data, interpreting fair meanings, and normalizing measures for comparison, a user of metrics should identify and take account of the measure type of measurement employed by a metric.
C.2.1 Size Measure Type
C.2.1.0 GeneralA measure of this type represents a particular size of software according to what it claims to measure within its definition.
NOTE software may have many representations of size (like any entity can be measured in more than one dimension - mass, volume, surface area etc.).
Normalizing other measures with a size measure can give comparable values in terms of units of size. The size measures described below can be used for software quality measurement.
C.2.1.1 Functional Size TypeFunctional size is an example of one type of size (one dimension) that software may have. Any one instance of software may have more than one functional size depending on, for example:
a) the purpose for measuring the software size (It influences the scope of the software included in the measurement);
b) the particular functional sizing method used (It will change the units and scale).
The definition of the concepts and process for applying a functional size measurement method (FSM Method) is provided by the standard ISO/IEC 14143-Part1.
In order to use functional size for normalization a quality assessor needsit is necessary to ensure that the same functional sizing method is used and that the different software being compared have been measured for the same purpose and consequently have a comparable scope.
27

ISO/IEC DTR 9126-4 © ISO
Although the following often claim that they represent functional sizes, it is not guaranteed they are equivalent to the functional size obtained from applying an FSM Method and compliant with ISO/IEC 14143-Part1. However, they are widely used in software development:
1. number of spread sheets;
2. number of screens;
3. number of files or data sets which are processed;
4. number of itemized functional requirements described in user requirements specifications.
C.2.1.2 Program size typeIn this clause, the term ‘programming’ represents the expressions that when executed result in actionsnumber of executions resulting in an action, and the term ‘language’ represents the type of expression used.
1. Source pProgram source size
The programming language should be explained and it should be provided how the non executable statements, such as comment lines, are treated. The following measures are commonly used:
a) Non-comment source statements (NCSS)
Non-comment source statements (NCSS) include executable statements and data declaration statements with logical source statements.
NOTE 1 New program size A developer may use newly developed program size to represent development and maintenance work product size.
NOTE 2 Changed program size
A developer may use changed program size to represent size of software containing modified components.
NOTE 3 Computed program size
Example of computed program size formula is new lines of code + 0.2 x lines of code in modified components (NASA Goddard ).
It may be necessary to distinguish a type of statements of source code into more detail as follows:
i. Statement Type
Logical Source Statement (LSS). The LSS measures the number of software instructions. The statements are irrespective of their relationship to lines and independent of the physical format in which they appear.
Physical Source Statement (PSS). The PSS measures the number of software source lines of code.
ii. Statement attribute
Executable statements;
Data declaration statements;
Compiler directive statements;
Comment source statements.28

© ISO
iii. Origin
Modified source statements;
Added source statements;
Removed source statements;
Newly Developed source statements: (= added source statements + modified source statements);
Reused source statements: (= original - modified - removed source statements);
2. Program word count size
The measurement may be computed in the following manner using the Halstead's measure:
Program vocabulary = n1+n2; Observed program length = N1+N2, where:
n1: Is the number of distinct operator words which are prepared and reserved by the program language in a program source code;
n2: Is the number of distinct operand words which are defined by the programmer in a program source code;
N1: Is the number of occurrences of distinct operators in a program source code;
N2: Is the number of occurrences of distinct operands in a program source code.
3. Number of modules
The measurement is counting the number of independently executable objects such as modules of a program.
C.2.1.3 Utilized resource size measure typeThis type identifies resources utilized by the operation of the software being evaluated. Examples are:
a) Amount of memory, for example, amount of disk or memory occupied temporally or permanently during the software execution;
b) I/O load, for example, amount of trafficbit size of communication data (meaningful for backup tools on a network);
c) CPU load, for example, percentage of occupied CPU instruction sets per second (This measure type is meaningful for measuring CPU utilization and efficiency of process distribution in multi-thread software running on concurrent/parallel systems);
d) Files and data records, for example, bit size length in ofbytes of files or records;
e) Documents, for example, number of document pages.
It may be important to take note of peak (maximal), minimum and average values, as well as periods of time and number of observations done.
29

ISO/IEC DTR 9126-4 © ISO
C.2.1.4 Specified operating procedure step typeThis type identifies static steps of procedures which are specified in a human-interface design specification or a user manual.
The measured value may differ depending on what kinds of description are used for measurement, such as a diagram or a text representing user operating procedures.
C.2.2 Time measure type
C.2.2.0 GeneralThe user of metrics of time measure type should record time periods, how many sites were examined and how many users took part in the measurements.
The users of metrics should be aware that there are many ways in which time can be measured as a unit, as the following examples show.
a) Real time unit
This is a physical time: i.e. second, minute, or hour. This unit is usually used for describing task processing time of real time software.
b) Computer machinery time unit
This is computer processor's clock time: i.e. second, minute, or hour of CPU time.
c) Official scheduled time unit
This includes working hours, calendar days, months or years.
d) Component time unit
When there are multiple sites, component time identifies individual site and it is an accumulation of individual time of each site. This unit is usually used for describing component reliability, for example, component failure rate.
e) System time unit
When there are multiple sites, system time does not identify individual sites but identifies all the sites running, as a whole in one system. This unit is usually used for describing system reliability, for example, system failure rate.
C.2.2.1 System operation time typeSystem operation time type provides a basis for measuring software availability. This is mainly used for reliability evaluation. It should be identified whether the software is under discontinuous operation or continuous operation. If the software operates discontinuously, it should be assured that the time measurement is done on the periods the software is active (this is obviously extended to continuous operation).
a) Elapsed time
When the use of software is constant, for example in systems operating for the same length of time each week.
b) Machine powered-on time
For real time, embedded or operating system software that is in full use the whole time the system is operational. 30

© ISO
c) Normalized machine time
As in "machine powered-on time", but pooling data from several machines of different “powered-on-time” and applying a correction factor.
C.2.2.2 Execution time typeExecution time type is the time which is needed to execute software to complete a specified task. The distribution of several attempts should be analyzed and mean, deviation or maximal values should be computed. The execution under the specific conditions, particularly overloaded condition, should be examined. Execution time type is mainly used for efficiency evaluation.
C.2.2.3 User time typeUser time type is measured upon time periods spent by individual users on completing tasks by using operations of the software. Some examples are:
a) Session time
Measured between start and end of a session. Useful, as example, for drawing behaviour of users of a home banking system. For an interactive program where idling time is of no interest or where interactive usability problems only are to be studied.
b) Task time
Time spent by an individual user to accomplish a task by using operations of the software on each attempt. The start and end points of the measurement should be well defined.
c) User time
Time spent by an individual user to using the software from time started to a point in time. (Approximately, it is how many hours or days user uses the software from beginning).
C.2.2.4 Effort typeEffort type is the productive time associated with a specific project task.
a) Individual effort
This is the productive time which is needed for the individual person who is a developer, maintainer, or operator to work to complete a specified task. Individual effort assumes productive hours only according to a certain number of productive hours per day.
b) Task effort
Task effort is an accumulated value of all the individual project personnel: developer, maintainer, operator, user or others who worked to complete a specified task.
C.2.2.5 Time interval of events typeThis measure type is the time interval between one event and the next one during an observation period. The frequency of an observation time period may be used in place of this measure. This is typically used for describing the time between failures occurring successively.
31
ISO/IEC DTR 9126-4 © ISO
C.2.3 Count measure type
C.2.3.0 GeneralIf attributes of documents or in count measure types of the software product are counted, they are static count types. If events or human actions are counted, they are kinetic count types.
C.2.3.1 Number of detected fault typeThe measurement counts the detected faults during reviewing, testing, correcting, operating or maintaining. Severity levels may be used to categorize them to take into account the impact of the fault.
C.2.3.2 Program structural complexity number typeThe measurement counts the program structural complexity. Examples are the number of distinct paths or the McCabe's cyclomatic number.
C.2.3.3 Number of detected inconsistency typeThis measure counts the detected inconsistent items which are prepared for the investigation.
a) Number of failed conforming items
Examples:
Conformance to specified items of requirements specifications;
Conformance to rule, regulation, or standard;
Conformance to protocols, data formats, media formats, character codes
b) Number of failed instances of user expectation
The measurement is to count satisfied/unsatisfied list items, which describe gaps between user's reasonable expectation and software product performance.
The measurement uses questionnaires to be answered by testers, customers, operators, or end users on what deficiencies were discovered.
The following are examples:
Function available or not;
Function effectively operable or not;
Function operable to user's specific intended use or not;
Function is expected, needed or not needed.
C.2.3.4 Number of changes typeThis type identifies software configuration items which are detected to have been changed. An example is the number of changed lines of source code.
C.2.3.5 Number of detected failures typeThe measurement counts the detected number failures during product development, testing, operating or maintenance. Severity levels may be used to categorize them to take into account the impact of the failure.
32
© ISO
C.2.3.6 Number of attempts (trial) typeThis measure counts the number of attempts at connection ofcorrecting the defect for fault. For example, during reviews testing, and maintenance.
C.2.3.7 Stroke of human operating procedure typeThis measure counts the number of strokes of user human action as kinetic steps of a procedure when a user is interactively operating the software. This measure quantifies the ergonomic usability as well as the effort to use. Therefore, this is used in usability measurement. Examples are number of strokes to perform a task, number of eye movements, etc.
C.2.3.8 Score typeThis type identifies the score or the result of an arithmetic calculation. Score may include counting or calculation of weights checked on/off on check lists. Examples: Score of check list; score of questionnaire; Delphi method; etc.
33

ISO/IEC DTR 9126-4 © ISO
Annex D(Informative)
Term(s)
D.1 DefinitionsDefinitions are from ISO/IEC 14598-1 and ISO/IEC 9126-1 unless otherwise indicated.
D.1.1 QualityExternal quality: The extent to which a product satisfies stated and implied needs when used under specified conditions.
Internal quality: The totality of attributes of a product that determine its ability to satisfy stated and implied needs when used under specified conditions.
NOTE 1 The term "internal quality", used in this technical report to contrast with "external quality", has essentially the same meaning as "quality" in ISO 8402.
NOTE 2 The term "attribute" is used (rather than the term "characteristic" used in 3.1.3) as the term "characteristic" is used in a more specific sense in ISO/IEC 9126 series.
Quality: The totality of characteristics of an entity that bear on its ability to satisfy stated and implied needs. [ISO 8402]
NOTE 3 In a contractual environment, or in a regulated environment, such as the nuclear safety field, needs are specified, whereas in other environments, implied needs should be identified and defined (ISO 8402: 1994, note 1).
Quality in use: The capability of the software product to enable specified users to achieve specified goals with effectiveness, productivity, safety and satisfaction in specified contexts of use.
NOTE 4 Quality in use is the user’s view of the quality of an environment containing software, and is measured from the results of using the software in the environment, rather than properties of the software itself.
NOTE 5 The definition of quality in use in ISO/IEC 14598-1 does not currently include the new characteristic of “safety”.
Quality model: The set of characteristics and the relationships between them, which provide the basis for specifying quality requirements and evaluating quality.
D.1.2 Software and userSoftware: All or part of the programs, procedures, rules, and associated documentation of an information processing system. (ISO/IEC 2382-1: 1993)
NOTE 1 Software is an intellectual creation that is independent of the medium on which it is recorded.
Software product: The set of computer programs, procedures, and possibly associated documentation and data designated for delivery to a user. [ISO/IEC 12207]
NOTE 2 Products include intermediate products, and products intended for users such as developers and maintainers.
User: An individual that uses the software product to perform a specific function.
34

© ISO
NOTE 3 Users may include operators, recipients of the results of the software, or developers or maintainers of software.
D.1.3 MeasurementAttribute: A measurable physical or abstract property of an entity.
Direct measure: A measure of an attribute that does not depend upon a measure of any other attribute.
External measure: An indirect measure of a product derived from measures of the behaviour of the system of which it is a part.
NOTE 1 The system includes any associated hardware, software (either custom software or off-the-shelf software) and users.
NOTE 2 The number of faults found during testing is an external measure of the number of faults in the program because the number of faults are counted during the operation of a computer system running the program to identify the faults in the code.
NOTE 3 External measures can be used to evaluate quality attributes closer to the ultimate objectives of the design.
Indicator: A measure that can be used to estimate or predict another measure.
NOTE 4 The measure may be of the same or a different characteristic.
NOTE 5 Indicators may be used both to estimate software quality attributes and to estimate attributes of the production process. They are indirect measures of the attributes.
Indirect measure: A measure of an attribute that is derived from measures of one or more other attributes.
NOTE 6 An external measure of an attribute of a computing system (such as the response time to user input) is an indirect measure of attributes of the software as the measure will be influenced by attributes of the computing environment as well as attributes of the software.
Internal measure: A measure derived from the product itself, either direct or indirect; it is not derived from measures of the behaviour of the system of which it is a part.
NOTE 7 Lines of code, complexity, the number of faults found in a walk through and the Fog Index are all internal measures made on the product itself.
Measure (noun): The number or category assigned to an attribute of an entity by making a measurement.
Measure (verb): Make a measurement.
Measurement: The process of assigning a number or category to an entity to describe an attribute of that entity.
NOTE 8 "Category" is used to denote qualitative measures of attributes. For example, some important attributes of software products, e.g. the language of a source program (ADA, C, COBOL, etc.) are qualitative.
Metric: A measurement scale and the method used for measurement.
NOTE 9 Metrics can be internal or external.
Metrics includes methods for categorizing qualitative data.
35

© ISO ISO/IEC DTR 9126-4
Annex E (Informative) Quality in use evaluation process
E.1 Establish evaluation requirementsNOTE The clauses in this annex follow the structure of the evaluation process described in ISO/IEC 14598-1.
E.1.1 Establish purpose of evaluationThe purpose of evaluating quality in use is to assess the extent to which the product enables users to meet their needs to achieve specified goals in specific contexts of use (scenarios of use).
E.1.1.1 AcquisitionPrior to development, an organisation seeking to acquire a product specifically adapted to its needs can use quality in use as a framework for specifying the quality in use requirements which the product should meet and against which acceptance testing may be carried out. Specific contexts in which quality in use is to be measured should be identified, measures of effectiveness, productivity, safety and satisfaction selected, and acceptance criteria based on these measures established.
E.1.1.2 SupplyA supplier can evaluate quality in use to ensure that the product meets the needs of specific types of users and usage environments. Providing the potential acquirer with quality in use results will help the acquirer judge whether the product meets their specific needs (see for example Annexes F and G).
E.1.1.3 DevelopmentA clear understanding of users' requirements for quality in use in different scenarios of usage will help a development team to orient design decisions towards meeting real user needs, and focus development objectives on meeting criteria for quality in use. These criteria can be evaluated when development is complete.
E.1.1.4 Operation By measuring aspects of quality in use, the organisation operating a system can evaluate the extent to which the system meets their needs, and assess what changes might be required in any future version.
E.1.1.5 MaintenanceFor the person maintaining the software, the quality in use of the maintenance task can be measured; for the person porting, the quality in use of the porting task can be measured.
E.1.2 Identify types of productsA working prototype or final product is required to evaluate quality in use.
E.1.3 Specify quality modelThe quality model used is the model for quality in use given in ISO/IEC 9126-1, where quality in use is defined as the capability of the software product to enable specified users to achieve specified goals with effectiveness, productivity, safety and satisfaction in specified contexts of use.
37

© ISO ISO/IEC DTR 9126-4
E.2 Specify the evaluation
E.2.1 Identify the contexts of useIn order to specify or measure quality in use it is necessary to identify each component of the context of use: the users, their goals, and the environment of use. It is not usually possible to test all possible contexts of use, so it is usually necessary to select important or representative user groups and tasks.
E.2.1.1 UsersCharacteristics of users that may influence their performance when using the product need to be specified. These can include knowledge, skill, experience, education, training, physical attributes, and motor and sensory capabilities. It may be necessary to define the characteristics of different types of user, for example users having different levels of experience or performing different roles.
E.2.1.2 Goals The goals of use of the product should be specified. Goals specify what is to be achieved, rather than how. Goals may be decomposed into sub-goals that specify components of an overall goal and the criteria that would satisfy that sub-goal. For example, if the goal was to complete a customer order form, the sub-goals could be to enter the correct information in each field. The breadth of the overall goal depends on the scope of the evaluation. Tasks are the activities required to achieve goals.
E.2.1.3 Environment
Operating environmentsThe hardware and software operating environment should be specified, as this may affect the way the software performs. This includes broader aspects such as network response time.
User environmentsAny aspects of the working environment which may influence the performance of the user should also be specified, such as the physical environment (e.g. workplace, furniture), the ambient environment (e.g. temperature, lighting) and the social and cultural environment (e.g. work practices, access to assistance and motivation).
E.2.2 Choose a context for the evaluationIt is important that the context used for the evaluation matches as closely as possible one or more environments in which the product will actually be used. The validity of the measures obtained to predict the level of quality in use achieved when a product is actually used will depend upon the extent to which the users, tasks and environment are representative of the real situation. At one extreme one may make measurements in the "field" using a real work situation as the basis for the evaluation of the quality in use of a product. At the other end of the continuum one may evaluate a particular aspect of the product in a "laboratory" setting in which those aspects of the context of use which are relevant are re-created in a representative and controlled way. The advantage of using the laboratory based approach is that it offers the opportunity to exercise greater control over the variables which are expected to have critical effects on the level of quality in use achieved, and more precise measurements can be made. The disadvantage is that the artificial nature of a laboratory environment can produce unrealistic results.
38

© ISO
E.2.3 Select metrics
E.2.3.1 Choice of measuresTo specify or evaluate quality in use it is normally necessary to measure at least one metric for effectiveness, productivity, satisfaction, and where relevant safety.
The choice of metrics and the contexts in which they are measured is dependent on the objectives of the parties involved in the measurement. The relative importance of each metric to the goals should be considered. For example where usage is infrequent, higher importance may be given to metrics for understandability and learnability rather than quality in use.
Measures of quality in use should be based on data that reflect the results of users interacting with the product. It is possible to gather data by objective means, such as the measurement of output, of speed of working or of the occurrence of particular events. Alternatively data may be gathered from the subjective responses of the users expressing feelings, beliefs, attitudes or preferences. Objective measures provide direct indications of effectiveness and productivity while subjective measures can be linked directly with satisfaction.
Evaluations can be conducted at different points along the continuum between the field and laboratory settings depending upon the issues that need to be investigated and the completeness of the product that is available for test. The choice of test environment and measures will depend upon the goals of the measurement activity and their relationship with the design cycle.
E.2.3.2 EffectivenessEffectiveness metrics measure the accuracy and completeness with which goals can be achieved.
For example if the desired goal is to accurately reproduce a 2-page document in a specified format, then accuracy could be specified or measured by the number of spelling mistakes and the number of deviations from the specified format, and completeness by the number of words of the document transcribed divided by the number of words in the source document.
E.2.3.3 ProductivityMeasures of productivity relate the level of effectiveness achieved to the expenditure of resources. Relevant resources can include mental or physical effort, time, materials or financial cost. For example, human productivity could be measured as effectiveness divided by human effort, temporal productivity as effectiveness divided by time, or economic productivity as effectiveness divided by cost.
If the desired goal is to print copies of a report, then productivity could be specified or measured by the number of usable copies of the report printed, divided by the resources spent on the task such as labour hours, process expense and materials consumed.
E.2.3.4 SafetyMeasures of safety relate to the risk of operating the software product over time, conditions of use and the context of use. Safety can be analysed in terms of operational safety and contingency safety. Operational safety is the ability of the software to meet user requirements during normal operation without harm to other resources and the environment. Contingency safety is the ability of the software to operate outside its normal operation and divert resources to prevent an escalation of risk.
E.2.3.5 SatisfactionSatisfaction measures the extent to which users are free from discomfort and their attitudes towards the use of the product.
39

ISO/IEC DTR 9126-4 © ISO
Satisfaction can be specified and measured by subjective rating on scales such as: liking for the product, satisfaction with product use, acceptability of the workload when carrying out different tasks, or the extent to which particular quality in use objectives (such as productivity or learnability) have been met. Other measures of satisfaction might include the number of positive and negative comments recorded during use. Additional information can be obtained from longer term measures such as rate of absenteeism, observation of overloading or underloading of the user’s cognitive or physical workload, or from health problem reports, or the frequency with which users request transfer to another job.
Subjective measures of satisfaction are produced by quantifying the strength of a user's subjectively expressed reactions, attitudes, or opinions. This process of quantification can be done in a number of ways, for example, by asking the user to give a number corresponding to the strength of their feeling at any particular moment, or by asking users to rank products in order of preference, or by using an attitude scale based on a questionnaire.
Attitude scales, when properly developed, have the advantage that they can be quick to use, have known reliabilities, and do not require special skills to apply. Attitude questionnaires which are developed using psychometric techniques will have known and quantifiable estimates of reliability and validity, and can be resistant to factors such as faking, positive or negative response bias, and social desirability. They also enable results to be compared with established norms for responses obtained in the past. See F.3 for examples of questionnaires which measure satisfaction with computer-based systems.
E.2.4 Establish criteria for assessmentThe choice of criterion values of measures of quality in use depends on the requirements for the product and the needs of the organisation setting the criteria. Quality in use objectives may relate to a primary goal (e.g. produce a letter) or a sub-goal (e.g. search and replace). Focusing quality in use objectives on the most important user goals may mean ignoring many functions, but is likely to be the most practical approach. Setting quality in use objectives for specific sub-goals may permit evaluation earlier in the development process.
When setting criterion values for a group of users, the criteria may be set as an average (e.g. average time for completion of a task to be no more than 10 minutes), for individuals (e.g. all users can complete the task within 10 minutes), or for a percentage of users (e.g. 90% of users are able to complete the task in 10 minutes).
When setting criteria, care should be taken that appropriate weight is given to each measurement item. For example, to set criteria based on errors, it may be necessary to assign weightings to reflect the relative importance of different types of error.
E.2.5 Interpretation of measuresBecause the relative importance of characteristics of quality in use depends on the context of use and the purposes for which quality in use is being specified or evaluated, there is no general rule for how measures should be chosen or combined.
Care should be taken in generalising the results of any measurement of quality in use to another context which may have significantly different types of users, tasks or environments. If measures of quality in use are obtained over short periods of time the values may not take account of infrequent events which could have a significant impact on quality in use, for example intermittent system errors.
For a general-purpose product it will generally be necessary to specify or measure quality in use in several different representative contexts, which will be a subset of the possible contexts and of the tasks which can be performed. There may be differences between quality in use in these contexts.
40

© ISO
E.3 Design the evaluationThe evaluation should be carried out in conditions as close as possible to those in which the product will be used. It is important that:
Users are representative of the population of users who use the product
Tasks are representative of the ones for which the system is intended
Conditions are representative of the normal conditions in which the product is used (including access to assistance, time pressures and distractions)
By controlling the context of evaluation, experience has shown that reliable results can be obtained with a sample of only eight participants (see F.2.4.1)1.
E.4 Execute the evaluation
E.4.1 Perform the user tests and collect data. When assessing quality in use it is important that the users work unaided, only having access to forms of assistance that would be available under normal conditions of use. As well as measuring effectiveness, productivity and satisfaction it is usual to document the problems users encounter, and to obtain clarification by discussing the problems with users at the end of the session. It is often useful to record the evaluation on video, which permits more detailed analysis, and production of video clips. It is also easier for users to work undisturbed if they are monitored remotely by video.
E.4.2 Produce a reportIf a comprehensive report is required, the Common Industry Format (Annex F) provides a good structure for reporting quality in use.
1 41
ISO/IEC DTR 9126-4
Annex F (Informative) Common Industry Format for Quality in Use Test Reports2
F.1 Purpose and ObjectivesThe overall purpose of the Common Industry Format (CIF) for Usability Test Reports is to promote incorporation of usability as part of the procurement decision-making process for interactive products. Examples of such decisions include purchasing, upgrading and automating. It provides a common format for human factors engineers and usability professionals in supplier companies to report the methods and results of usability tests to customer organizations.
F.1.1 AudienceThe CIF is meant to be used by usability professionals within supplier organizations to generate reports that can be used by customer organizations. The CIF is also meant to be used by customer organizations to verify that a particular report is CIF-compliant. The Usability Test Report itself is intended for two types of readers:
1) Human factors or other usability professionals in customer organizations who are evaluating both the technical merit of usability tests and the usability of the products.
2) Other technical professionals and managers who are using the test results to make business decisions.
Methods and Results sections are aimed at the first audience. These sections describe the test methodology and results in technical detail suitable for replication, and also support application of test data to questions about the product’s expected costs and benefits. Understanding and interpreting these sections will require technical background in human factors or usability engineering for optimal use. The second audience is directed to the Introduction, which provides summary information for non-usability professionals and managers. The Introduction may also be of general interest to other computing professionals.
F.1.2 ScopeTrial use of the CIF report format will occur during a Pilot Study. For further information of the Pilot Study, see the following documenttdocument (http://www.nist.gov/iusr/documents/WhitePaper.html). The report format assumes sound practice (e.g., refs. 8 & 9) has been followed in the design and execution of the test. Summative type usability testing is recommended. The format is intended to support clear and thorough reporting of both the methods and the results of any empirical test. Test procedures which produce measures that summarize usability should be used. Some usability evaluation methods, such as formative tests, are intended to identify problems rather than produce measures; the format is not currently structured to support the results of such testing methods. The common format covers the minimum information that should be reported. Suppliers may choose to include more. Although the format could be extended for wider use with products such as hardware with user interfaces, they are not included at this time. These issues will likely be addressed as we gain more experience in the Pilot study.
F.1.3 Relationship to existing standardsThis document is not formally related to standards-making efforts but has been informed by existing standards such as Annex C of ISO 13407, ISO 9241-11, and ISO/IEC 14598-5. It is consistent with major portions of these documents but more limited in scope.
2 Annexes F and G were supplied by the IUSR industry group (www.nist.gov/iusr), and are not subject to ISO copyright. They are included here as a recommended example of how the results of a test of quality in use can be documented. Note that these annexes use the term “usability” with the meaning defined in ISO 9241-11 which is similar to the definition of quality in use (but does not include safety, and uses the term efficiency for productivity).
42

ISO/IEC DTR 9126-4
F.2 Report Format DescriptionThe format should be used as a generalized template. All the sections are reported according to agreement between the customer organization, the product supplier, and any third-party test organization where applicable. Elements of the CIF are either ‘Mandatory’ or ‘Recommended’ and are marked ‘’ and , respectively, in the text.Appendix A presents guidance for preparing a CIF report. Appendix B provides a checklist that can be used to ensure inclusion of required and recommended information. Appendix C of this template contains an example that illustrates how the report format can be used. A glossary is provided in Appendix D to define terminology used in the report format description. Appendix E contains a Word template for report production.
F.2.1 Title PageThis section contains lines for
identifying the report as a Common Industry Format (CIF) document; state CIF version
naming the product and version that was tested
who led the test
when the test was conducted
the date the report was prepared
who prepared the report
contact information (telephone, email and street address) for an individual or individuals who can clarify all questions about the test to support validation and replication.
F.2.2 Executive SummaryThis section provides a high level overview of the test. This section should begin on a new page and should end with a page break to facilitate its use as a stand-alone summary. The intent of this section is to provide information for procurement decision-makers in customer organizations. These people may not read the technical body of this document but are interested in:
the identity and a description of the product
a summary of the method(s) of the test including the number of and type of participants and their tasks.
results expressed as mean scores or other suitable measure of central tendency
the reason for and nature of the test
tabular summary of performance results.
If differences between values or products are claimed, the probability that the difference did not occur by chance should be stated.
43

ISO/IEC DTR 9126-4
F.2.3 Introduction
F.2.3.1 Full Product Description This section identifies the formal product name and release or version. It describes what parts of the product were evaluated. This section should also specify:
the user population for which the product is intended
any groups with special needs
a brief description of the environment in which it should be used
the type of user work that is supported by the product
F.2.3.2 Test Objectives This section describes all of the objectives for the test and any areas of specific interest. Possible objectives include testing user performance of work tasks and subjective satisfaction in using the product. This section should include:
The functions and components of the product with which the user directly and indirectly interacted in this test.
If the product component or functionality that was tested is a subset of the total product, explain the reason for focusing on the subset.
F.2.4 MethodThis is the first key technical section. It must provide sufficient information to allow an independent tester to replicate the procedure used in testing.
F.2.4.1 ParticipantsThis section describes the users who participated in the test in terms of demographics, professional experience, computing experience and special needs. This description must be sufficiently informative to replicate the study with a similar sample of participants. If there are any known differences between the participant sample and the user population, they should be noted here, e.g., actual users would attend a training course whereas test subjects were untrained. Participants should not be from the same organization as the testing or supplier organization. Great care should be exercised when reporting differences between demographic groups on usability metrics.A general description should include important facts such as:
The total number of participants tested. A minimum of 8 per cell (segment) is recommended [10].
Segmentation of user groups tested (if more than one user group was tested). Example: novice and expert programmers.
The key characteristics and capabilities expected of the user groups being evaluated.
How participants were selected and whether they had the essential characteristics and capabilities.
Whether the participant sample included representatives of groups with special needs such as: the young, the elderly or those with physical or mental disabilities.
44

ISO/IEC DTR 9126-4
A table specifying the characteristics and capabilities of the participants tested should include a row in the table for each participant, and a column for each characteristic. Characteristics should be chosen to be relevant to the product’s usability; they should allow a customer to determine how similar the participants were to the customers’ user population; and they must be complete enough so that an essentially similar group of participants can be recruited. The table below is an example; the characteristics that are shown are typical but may not necessarily cover every type of testing situation.
Gender Age Education Occupation / role
Professional Experience
Computer Experience
Product Experience
P1
P2
Pn
For ‘Gender’, indicate male or female.
For ‘Age’, state the chronological age of the participant, or indicate membership in an age range (e.g. 25-45) or age category (e.g. under 18, over 65) if the exact age is not known.
For ‘Education’, state the number of years of completed formal education (e.g., in the US a high school graduate would have 12 years of education and a college graduate 16 years).
For ‘Occupation/role’, describe what the user’s job role when using the product. Use the Role title if known.
For ‘Professional experience’, give the amount of time the user has been performing in the role.
For ‘Computer experience’, describe relevant background such as how much experience the user has with the platform or operating system, and/or the product domain. This may be more extensive than one column.
For ‘Product experience’ indicate the type and duration of any prior experience with the product or with similar products.
F.2.4.2 Context of Product Use in the TestThis section describes the tasks, scenarios and conditions under which the tests were performed, the tasks that were part of the evaluation, the platform on which the application was run, and the specific configuration operated by test participants. Any known differences between the evaluated context and the expected context of use should be noted in the corresponding subsection.
TasksA thorough description of the tasks that were performed by the participants is critical to the face validity of the test.
Describe the task scenarios for testing.
Explain why these tasks were selected (e.g. the most frequent tasks, the most troublesome tasks).
45

ISO/IEC DTR 9126-4
Describe the source of these tasks (e.g. observation of customers using similar products, product marketing specifications).
Also, include any task data given to the participants, and
any completion or performance criteria established for each task.
Test Facility This section refers to the physical description of the test facility.
Describe the setting, and type of space in which the evaluation was conducted (e.g., usability lab, cubicle office, meeting room, home office, home family room, manufacturing floor). Detail any relevant features or circumstances which could affect the quality of the results, such as video and audio recording equipment, one-way mirrors, or automatic data collection equipment.
Participant’s Computing Environment The section should include all the detail required to replicate and validate the test. It should include appropriate configuration detail on the participant’s computer, including hardware model, operating system versions, and any required libraries or settings. If the product uses a web browser, then the browser should be identified along with its version and the name and version of any relevant plug-ins.
Display Devices If the product has a screen-based visual interface, the screen size, monitor resolution, and colour setting (number of colours) must be detailed. If the product has a print-based visual interface, the media size and print resolution must be detailed. If visual interface elements can vary in size, specify the size(s) used in the test. This factor is particularly relevant for fonts.Audio Devices If the product has an audio interface, specify relevant settings or values for the audio bits, volume, etc.Manual Input Devices If the product requires a manual input device (e.g., keyboard, mouse, joystick) specify the make and model of devices used in the test.
Test Administrator Tools If a standard questionnaire was used, describe or specify it here. Include customized questionnaires in an appendix. Describe any hardware or software used to control the test or to record data.
F.2.4.3 Experimental Design Describe the logical design of the test. Define independent variables and control variables. Briefly describe the measures for which data were recorded for each set of conditions.
Procedure This section details the test protocol.
Give operational definitions of measures and any presented independent variables or control variables. Describe any time limits on tasks, and any policies and procedures for training, coaching, assistance, interventions or responding to questions. Include the sequence of events from greeting the participants to dismissing them. Include details concerning non-disclosure agreements, form completion, warm-ups, pre-task training, and debriefing. Verify that the participants knew and understood their rights as human subjects [1]. Specify the steps that the evaluation team followed to execute the test sessions and record data.
46

ISO/IEC DTR 9126-4
Specify how many people interacted with the participants during the test sessions and briefly describe their roles. State whether other individuals were present in the test environment and their roles. State whether participants were paid or otherwise compensated.
Participant General Instructions Include here or in an appendix all instructions given to the participants (except the actual task instructions, which are given in the Participant Task Instructions section).
Include instructions on how participants were to interact with any other persons present, including how they were to ask for assistance and interact with other participants, if applicable.
Participant Task Instructions This section should summarize the task instructions. Put the exact task instructions in an appendix.
F.2.4.4 Usability Metrics Explain what measures have been used for each category of usability metrics: effectiveness, efficiency and satisfaction. Conceptual descriptions and examples of the metrics are given below.
Effectiveness Effectiveness relates the goals of using the product to the accuracy and completeness with which these goals can be achieved. Common measures of effectiveness include percent task completion, frequency of errors, frequency of assists to the participant from the testers, and frequency of accesses to help or documentation by the participants during the tasks. It does not take account of how the goals were achieved, only the extent to which they were achieved. Efficiency relates the level of effectiveness achieved to the quantity of resources expended.
Completion RateThe results must include the percentage of participants who completely and correctly achieve each task goal. If goals can be partially achieved (e.g., by incomplete or sub-optimum results) then it may also be useful to report the average goal achievement, scored on a scale of 0 to 100% based on specified criteria related to the value of a partial result. For example, a spell-checking task might involve identifying and correcting 10 spelling errors and the completion rate might be calculated based on the percent of errors corrected. Another method for calculating completion rate is weighting; e.g., spelling errors in the title page of the document are judged to be twice as important as errors in the main body of text. The rationale for choosing a particular method of partial goal analysis should be stated, if such results are included in the report. NOTE The unassisted completion rate (i.e. the rate achieved without intervention from the testers) should be reported as well as the assisted rate (i.e. the rate achieved with tester intervention) where these two metrics differ.
ErrorsErrors are instances where test participants did not complete the task successfully, or had to attempt portions of the task more than once. It is recommended that scoring of data include classifying errors according to some taxonomy, such as in [2].
AssistsWhen participants cannot proceed on a task, the test administrator sometimes gives direct procedural help in order to allow the test to proceed. This type of tester intervention is called an assist for the purposes of this report. If it is necessary to provide participants with assists, efficiency and effectiveness metrics must be determined for both unassisted and assisted conditions. For example, if a participant received an assist on Task A, that participant should not be included among those successfully completing the task when calculating the unassisted completion rate for that task. However, if the participant went on to successfully complete the task following the assist, he could be included in the assisted Task A completion rate. When assists are allowed or provided, the number and type of assists must be included as part of the test results.
47

ISO/IEC DTR 9126-4
In some usability tests, participants are instructed to use support tools such as online help or documentation, which are part of the product, when they cannot complete tasks on their own. Accesses to product features which provide information and help are not considered assists for the purposes of this report. It may, however, be desirable to report the frequency of accesses to different product support features, especially if they factor into participants’ ability to use products independently.
Efficiency Efficiency relates the level of effectiveness achieved to the quantity of resources expended. Efficiency is generally assessed by the mean time taken to achieve the task. Efficiency may also relate to other resources (e.g. total cost of usage). A common measure of efficiency is time on task.
Task timeThe results must include the mean time taken to complete each task, together with the range and standard deviation of times across participants. Sometimes a more detailed breakdown is appropriate; for instance, the time that users spent looking for or obtaining help (e.g., including documentation, help system or calls to the help desk). This time should also be included in the total time on task.
Completion Rate/Mean Time-On-Task. The measure Completion Rate / Mean Time-On-Task is the core measure of efficiency. It specifies the percentage of users who were successful (or percentage goal achievement) for every unit of time. This formula shows that as the time on task increases, one would expect users to be more successful. A very efficient product has a high percentage of successful users in a small amount of time. This allows customers to compare fast error-prone interfaces (e.g., command lines with wildcards to delete files) to slow easy interfaces (e.g., using a mouse and keyboard to drag each file to the trash).NOTE Effectiveness and efficiency results must be reported, even when they are difficult to interpret within the specified context of use. In this case, the report must specify why the supplier does not consider the metrics meaningful. For example, suppose that the context of use for the product includes real time, open-ended interaction between close associates. In this case, Time-On-Task may not be meaningfully interpreted as a measure of efficiency, because for many users, time spent on this task is “time well spent”.
SatisfactionSatisfaction describes a user’s subjective response when using the product. User satisfaction may be an important correlate of motivation to use a product and may affect performance in some cases. Questionnaires to measure satisfaction and associated attitudes are commonly built using Likert and semantic differential scales. A variety of instruments are available for measuring user satisfaction of software interactive products, and many companies create their own. Whether an external, standardized instrument is used or a customized instrument is created, it is suggested that subjective rating dimensions such as Satisfaction, Usefulness, and Ease of Use be considered for inclusion, as these will be of general interest to customer organizations. A number of questionnaires are available that are widely used. They include: ASQ [5], CUSI [6], PSSUQ [6], QUIS [3], SUMI [4], and SUS [7]). While each offers unique perspectives on subjective measures of product usability, most include measurements of Satisfaction, Usefulness, and Ease of Use. Suppliers may choose to use validated published satisfaction measures or may submit satisfaction metrics they have developed themselves.
ResultsThis is the second major technical section of the report. It includes a description of how the data were scored, reduced, and analyzed. It provides the major findings in quantitative formats.
48

ISO/IEC DTR 9126-4
Data Analysis
Data Scoring The method by which the data collected were scored should be described in sufficient detail to allow replication of the data scoring methods by another organization if the test is repeated. Particular items that should be addressed include the exclusion of outliers, categorization of error data, and criteria for scoring assisted or unassisted completion.
Data Reduction The method by which the data were reduced should be described in sufficient detail to allow replication of the data reduction methods by another organization if the test is repeated. Particular items that should be addressed include how data were collapsed across tasks or task categories.
Statistical Analysis The method by which the data were analyzed should be described in sufficient detail to allow replication of the data analysis methods by another organization if the test is repeated. Particular items that should be addressed include statistical procedures (e.g. transformation of the data) and tests (e.g. t-tests, F tests and statistical significance of differences between groups). Scores that are reported as means must include the standard deviation and optionally the standard error of the mean.
Presentation of the Results
Effectiveness, Efficiency and Satisfaction results must always be reported. Both tabular and graphical presentations of results should be included. Various graphical formats are effective in describing usability data at a glance. Examples are included in the Sample Test Report in Appendix C. Bar graphs are useful for describing subjective data such as that gleaned from Likert scales. A variety of plots can be used effectively to show comparisons of expert benchmark times for a product vs. the mean participant performance time. The data may be accompanied by a brief explanation of the results but detailed interpretation is discouraged.
Performance Results It is recommended that efficiency and effectiveness results be tabulated across participants on a per unit task basis. A table of results may be presented for groups of related tasks (e.g. all program creation tasks in one group, all debugging tasks in another group) where this is more efficient and makes sense. If a unit task has sub-tasks, then the sub-tasks may be reported in summary form for the unit task. For example, if a unit task is to identify all the misspelled words on a page, then the results may be summarized as a percent of misspellings found. Finally, a summary table showing total mean task times and completion rates across all tasks should be presented. Testers should report additional tables of metrics if they are relevant to the product’s design and a particular application area.
49

ISO/IEC DTR 9126-4
Task A
User #
Unassisted Task Effectiveness [(%)Complete]
Assisted Task Effectiveness [(%)Complete]
Task Time (min)
Effectiveness / Mean Time-On-Task
Errors Assists
1
2
N
Mean
Standard Deviation
Min
Max
Summary
User #
Total Unassisted Task
Effectiveness [(%)Complete]
Total Assisted Task
Effectiveness [(%)Complete]
Total Task Time (min)
Effectiveness / Mean Time-On-Task
Total Errors
Total Assists
1 2 N Mean Standard Deviation
Min Max
Satisfaction Results Data from satisfaction questionnaires can be summarized in a manner similar to that described above for performance data. Each column should represent a single measurement scale.
Satisfaction
User # Scale 1 Scale 2 Scale 3 … Scale N
1
2
N
50

ISO/IEC DTR 9126-4
Mean
Standard Deviation
Min
Max
F.2.6 AppendicesCustom questionnaires, Participant General Instructions and Participant Task Instructions are appropriately submitted as appendices. Release Notes, which would include any information the supplier would like to include since the test was run that might explain or update the test results (e.g. if the UI design has been fixed since the test), should be placed in a separate appendix.
F.3 References1) American Psychological Association. Ethical Principles in the Conduct of Research with Human
Participants. 1982.
2) Norman, D.A. (1983) Design Rules Based on Analyses of Human Error. Communications of the ACM, 26(4), 254-258.
3) Chin, J. P., Diehl, V. A., and Norman, K. (1988). Development of an instrument measuring user satisfaction of the human-computer interface. In the Proceedings of ACM CHI ‘88 (Washington D.C.), 213-218.
4) Kirakowski, J. (1996). The software usability measurement inventory: Background and usage. In Jordan, P., Thomas, B., and Weerdmeester, B. (Eds.), Usability Evaluation in Industry. UK: Taylor and Francis.
5) Lewis, J. R. (1991). Psychometric Evaluation of an After-Scenario Questionnaire for Computer Usability Studies: the ASQ. SIGCHI Bulletin, 23(1), 78-81.
6) Lewis, J. R. (1995). IBM Computer Usability Satisfaction Questionnaires: Psychometric Evaluation and Instructions for Use. International Journal of Human-Computer Interaction, 7, 57-78.
7) Brooke, J. (1996). SUS: A “quick and dirty” usability scale. Usability Evaluation in Industry. UK: Taylor and Francis. (http://www.usability.serco.com/trump/documents/Suschapt.doc).
8) Rubin, J. (1994) Handbook of Usability Testing, How to Plan, Design, and Conduct Effective Tests. New York: John Wiley & Sons, Inc.
9) Dumas, J. & Redish, G. (1993), A Practical Guide to Usability Testing. New Jersey: Ablex Publishing Corp.
10) Nielsen, J. & Landauer, T. K. (1993) A mathematical model of the finding of usability problems. In: CHI '93. Conference proceedings on Human factors in computing systems, 206-213
51

ISO/IEC DTR 9126-4
Annex G (Informative) Common Industry Format Usability Test Example3
DiaryMate v1.1Report by: A Brown and C Davidson
Super Software IncSeptember 1, 1999
Tested August 1999
Any enquiries about the content of this report should be addressed to
E Frost, Usability Manager
Super Software Inc19483 Outerbelt Ave
Hayden CA 95014 USA408 555-2340
3 Annexes F and G were supplied by the IUSR industry group (www.nist.gov/iusr), and are not subject to ISO copyright. They are included here as a recommended example of how the results of a test of quality in use can be documented. Note that these annexes use the term “usability” with the meaning defined in ISO 9241-11 which is similar to the definition of quality in use (but does not include safety, and uses the term efficiency for productivity). Annex G is a fictitious example adapted from a real evaluation.52

ISO/IEC DTR 9126-4
Contents
1 Introduction..........................................................................................................................47
1.1 Executive Summary...........................................................................................................47
1.2 Full Product Description.....................................................................................................47
1.3 Test Objectives..................................................................................................................48
2 Method................................................................................................................................ 482.1 Participants........................................................................................................................ 48
2.2 Context of Product Use in the Test.....................................................................................49
2.3 Design of the Test..............................................................................................................50
2.4 Metrics............................................................................................................................... 50
3 Results................................................................................................................................ 513.1 Treatment of data...............................................................................................................51
3.2 Performance Results..........................................................................................................52
3.3 Satisfaction Results............................................................................................................57
Appendix A – Participant Instructions......................................................................................58Participant General Instructions............................................................................................58
Participant Task Instructions.................................................................................................58
G.1 Introduction
G.1.1 Executive SummaryDiaryMate is a computer version of a paper diary and address book. DiaryMate provides diary, contact and meetings management facilities for individuals and work groups. The test demonstrated the usability of DiaryMate installation, calendar and address book tasks for secretaries and managers.
Eight managers were provided with the distribution disk and user manual, and asked to install the product. Having spent some time familiarizing themselves with it, they were asked to add information for a new contact, and to schedule a meeting.
All participants installed the product successfully in a mean time of 5.6 minutes (although a minor subcomponent was missing from one installation). All participants successfully added the new contact information. The mean time to complete the task was 4.3 minutes.
Seven of the eight participants successfully scheduled a meeting in a mean time of 4.5 minutes.
The overall score on the SUMI satisfaction questionnaire was 51. The target value of 50 (the industry average SUMI score) was within the 95% confidence limits for all scales.
G.1.2 Full Product DescriptionDiaryMate is a computer version of a paper diary and address book. DiaryMate provides diary, contact and meetings management facilities for individuals and work groups. It is a commercial product which includes online help and a 50 page user manual.
53

ISO/IEC DTR 9126-4
The primary user group for DiaryMate is office workers, typically lower and middle level managers. DiaryMate requires Microsoft Windows 3 or higher, and is intended for users who have a basic knowledge of Windows. A full technical specification is provided on the SuperSoft web site: www.supersoft.com/diarymate.
G.1.3 Test Objectives The aim of the evaluation was to validate the usability of the calendar and address book functions, which are the major features of DiaryMate. Representative users were asked to complete typical tasks, and measures were taken of effectiveness, efficiency and satisfaction.
It was expected that installation would take less than 10 minutes, and that all users could successfully fill in contact information in an average time of less than 5 minutes. All SUMI scores should be above the industry average of 50.
G.2 Method
G.2.1 ParticipantsIntended context of use: The key characteristics and capabilities expected of DiaryMate users are:
Familiarity with a PC and a basic working knowledge of Microsoft Windows
A command of the English language
Familiarity with office tasks
At least 10 minutes a day spent on tasks related to diary and contact information
Other characteristics of users which it is expected could influence the usability of DiaryMate are:
amount of experience with Microsoft Windows
amount of experience with any other diary applications
attitude towards use of computer applications to support diary tasks
job function and length of time in current job
Context used for the test: Eight junior or middle managers were selected who had the key characteristics and capabilities, but no previous experience of DiaryMate. The other characteristics of the participants that might influence usability were recorded, together with the age group and gender.
54

ISO/IEC DTR 9126-4
Job Time in job (years)
Windows experience
(years)
Computer diary
experience (years)
Attitude to computer diaries (1-7)*
Gender Age group
1 middle manager
5.5 3.5 0 6 F 20-35
2 junior manager
0.8 2.1 0.8 1 F 20-35
3 middle manager
2.1 2.5 2.1 3 M 20-35
4 junior manager
4.9 3.5 1.5 2 F 36-50
5 middle manager
0.7 0.7 0.7 2 M 20-35
6 junior manager
1.6 2.1 0 3 F 36-50
7 middle manager
4.3 1.4 0 4 M 36-50
8 junior manager
2.7 4.6 2.7 4 M 20-35
*1=prefer to use a computer as much as possible, 7=prefer to use a computer as little as possible
G.2.2 Context of Product Use in the Test
G.2.2.1 Tasks Intended context of use: Interviews with potential users suggested that installing the software was an important task. Having gained familiarity with the application, other key tasks would be adding information for a new contact, and scheduling a meeting.
Context used for the test: The tasks selected for the evaluation were:
The participant will be presented with a copy of the application on a disk together with the documentation and will be asked to perform the installation.
Following this each user will restart the program and spend some time familiarizing themselves with the diary and address book functions.
Each participant will then be asked to add details of a new contact using information supplied.
Each participant will then be asked to schedule a meeting using the diary facility.
G.2.2.2 Test Facility Intended context of use: office environment.
Context used for the test: The evaluation was carried out in our usability laboratory in Hayden. The test room was configured to represent a closed office with a desk, chair and other office fittings.
55

ISO/IEC DTR 9126-4
Participants worked alone without any interruptions, and were observed through a one way mirror, and by video cameras and a remote screen
G.2.2.3 Participant's Computing Environment Intended context of use: DiaryMate is intended for use on any Pentium-based PC running Windows, with at least 8MB free memory.
Context used for the test: The PC used was a Netex PC-560/1 (Pentium 60, 32MB RAM) in standard configuration, with a Netex pro mouse and a 17" colour monitor at 800x600 resolution. The operating system was Windows 95.
G.2.2.4 Test Administrator ToolsTasks were timed using Hanks Usability Logger. Sessions were videotaped (a combined picture of the screen and a view of the participant), although information derived from the videotapes does not form part of this report. At the end of the sessions, participants completed a subjective ratings scale and the SUMI satisfaction questionnaire. SUMI scores have a mean of 50 and standard deviation is 10 (based on a standardization sample of 200 office-type systems tested in Europe and USA - for more information, see www.ucc.ie/hfrg/questionnaires/sumi/index.html).
G.2.3 Design of the TestEight junior and middle managers were tested.
The mean completion rate, mean goal achievement, mean task time, mean completion rate efficiency and mean goal achievement efficiency was calculated for three tasks:
Install the product
Add information for a new contact
Schedule a meeting
G.2.3.1 Procedure On arrival, participants were informed that the usability of DiaryMate was being tested, to find out whether it met the needs of users such as themselves. They were told that it was not a test of their abilities. Participants were shown the evaluation suite, including the control room, and informed that their interaction would be recorded. They were asked to sign a release form. They were then asked to confirm the information they had provided about themselves before participating: Job description, Time in job (years), Windows experience (years), Computer diary experience (years), and Age group. They also scored their attitude towards use of computer applications to support diary and contact management tasks, on a scale of 1 to 7, with anchors: prefer to use a computer as much as possible, prefer to use a computer as little as possible.
Participants were given introductory instructions. The evaluator reset the state of the computer before each task, and provided instructions for the next task. Participants were told the time allocated for each task, and asked to inform the evaluator (by telephone) when they had completed each task. Participants were told that no external assistance could be provided.
After the last task, participants were asked to complete a subjective ratings scale and the SUMI questionnaire.
The evaluator then asked them about any difficulties they had encountered (this information is not included in this report).
Finally they were given $75 for their participation.
56

ISO/IEC DTR 9126-4
G.2.4 Metrics
G.2.4.1 EffectivenessCompletion Rate Percentage of participants who completed each task correctly.
Mean goal achievement Mean extent to which each task was completely and correctly achieved, scored as a percentage.
Errors Errors were not measured.
Assists The participants were given no assistance.
G.2.4.2 EfficiencyTask time: mean time taken to complete each task (for correctly completed tasks).
Completion rate efficiency: mean completion rate/mean task time.
Goal achievement efficiency: mean goal achievement/mean task time.
No of references to the manual: number of separate references made to the manual.
G.2.4.3 SatisfactionSatisfaction was measured using a subjective ratings scale and the SUMI questionnaire, at the end of the session, giving scores for each participant’s perception of: overall satisfaction, efficiency, affect, controllability and learnability.
G.3 Results
G.3.1 Treatment of data
G.3.1.1 Data ScoringMean goal achievement
Mean extent to which each task was completely and correctly completed, scored as a percentage.
The business impact of potential diary and contact information errors was discussed with several potential customers, leading to the following scoring scheme for calculating mean goal achievement:
Installation: all components successfully installed: 100%; for each necessary subcomponent omitted from the installation deduct 20%.
New contact: all details entered correctly: 100%; for each missing item of information, deduct 50%; for each item of information in the wrong field, deduct 20%; for each typo deduct 5%.
New meeting: all details entered correctly: 100%, incorrect time or date: 0%; for each item of information in the wrong field, deduct 20%; for each typo deduct 5%.
Combined deductions equalling or exceeding 100% would be as scored 0% goal achievement.
G.3.1.2 Data ReductionIn addition to data for each task, the combined results show the total task time and the mean results for effectiveness and efficiency metrics.
57

ISO/IEC DTR 9126-4
G.3.1.3 Data AnalysisSUMI results were analyzed using the SUMI scoring program (SUMISCO).
G.3.2 Performance ResultsThe overall score on the SUMI satisfaction questionnaire was 51. The target value of 50 (the industry average SUMI score) was within the 95% confidence limits for all scales.
G.3.2.1 InstallationAll participants installed the product successfully in a mean time of 5.6 minutes (although a minor subcomponent was missing from one installation).
Participant # Unassisted Task
Completion Rate (%)
Goal Achievemen
t (%)
Task Time (min)
Completion Rate / Task
Time*
References to manual
1 100% 100% 5.3 19% 12 100% 100% 3.9 26% 0
3 100% 100% 6.2 16% 14 100% 80% 9.5 11% 2
5 100% 100% 4.1 24% 06 100% 100% 5.9 17% 1
7 100% 100% 4.2 24% 08 100% 100% 5.5 18% 0
Mean 100% 98% 5.6 19% 0.6Standard
error0.0 2.5 0.6 1.8 0.3
Std Deviation
0.0 7.1 1.8 5.1 0.7
Min 100% 80% 3.9 11% 0.0Max 100% 100% 9.5 26% 2.0
*This combined figure of percentage completion per minute is useful when making comparisons between products. A related measure can be obtained by dividing goal achievement by task time.
G.3.2.2 Add new contactAll participants successfully added the new contact information (two participants made minor typos). The mean time to complete the task was 4.3 minutes.
58

ISO/IEC DTR 9126-4
Participant # Unassisted Task
Completion Rate (%)
Goal Achievemen
t (%)
Task Time (min)
Completion Rate / Mean Task Time
References to manual
1 100% 100% 4.4 23% 0
2 100% 100% 3.5 29% 03 100% 95% 4.6 22% 1
4 100% 100% 5.5 18% 15 100% 100% 3.8 26% 0
6 100% 100% 4.5 22% 07 100% 95% 4.9 20% 1
8 100% 100% 3.3 30% 0Mean 100% 99% 4.3 24% 0.4
Standard error
0.0 0.8 0.3 1.5 0.2
Std Deviation
0.0 2.3 0.7 4.2 0.5
Min 100% 95% 3.3 18% 0.0Max 100% 100% 5.5 30% 1.0
G.3.2.3 Schedule a meetingSeven of the eight participants successfully scheduled a meeting in a mean time of 4.5 minutes. Some information was not entered in the intended fields, and the labelling of these fields has been improved in the released version of the product.
The participant who failed had not used a computer diary before, and had a negative attitude towards them. The menu structure has subsequently been improved to clarify the scheduling procedure.
59

ISO/IEC DTR 9126-4
Participant # Unassisted Task
Completion Rate (%)
Goal Achievemen
t (%)
Task Time (min)
Completion Rate / Mean Task Time
(%/min)
References to manual
1 0% 0% 0 0 3
2 100% 95% 4.2 24 23 100% 80% 5.6 18 0
4 100% 100% 3.5 29 15 100% 90% 3.8 26 1
6 100% 60% 6.1 16 07 100% 75% 4.6 22 0
8 100% 80% 3.5 29 2Mean (#2-7) 100% 73% 4.5 22 1.1
Standard error
0.0 4.8 0.4 1.7 0.4
Std Deviation
0.0 13.5 1.0 4.9 1.1
Min (#2-7) 100% 60% 3.5 16% 0Max (#2-7) 100% 100% 6.1 29% 3
NOTE summary data has been given for the seven participants who completed the task.
60

ISO/IEC DTR 9126-4
G.3.3 Combined Performance ResultsParticipant # Unassisted
Completion Rate (%) (all
tasks)
Mean Goal achievemen
t (%)
Total Task Time (min)
Completion Rate / Total Task Time
Total References to manual
1 67% 67% 9.7 7% 4.0
2 100% 98% 11.6 9% 2.0
3 100% 92% 16.4 6% 2.0
4 100% 93% 18.5 5% 4.0
5 100% 97% 11.7 9% 1.0
6 100% 87% 16.5 6% 1.0
7 100% 90% 13.7 7% 1.0
8 100% 93% 12.3 8% 2.0
Mean (#2-7) 100% 93% 14.4 7% 1.9
Standard error
0.0 1.5 1.0 0.5 0.4
Std Deviation
0.0 3.9 2.7 1.3 1.1
Min (#2-7) 100% 87% 11.6 5% 1.0
Max (#2-7) 100% 98% 18.5 9% 4.0
NOTE summary data has been given for the seven participants who completed all tasks.
61
ISO/IEC DTR 9126-4
G.3.4 Satisfaction Results
G.3.4.1 Subjective Ratings ResultsThese subjective ratings data are based on 7-point bipolar Likert-type scales, where 1= worst rating and 7=best rating on the different dimensions shown below:
Participant # Satisfaction Usefulness Ease of Use
Clarity4 Attractiveness1
1 5 3 3 3 42 5 6 6 5 53 5 5 4 5 64 2 5 4 2 55 4 4 4 4 56 4 4 6 5 67 3 2 4 2 38 6 6 4 5 6
Mean 4.3 4.4 4.4 3.9 5.0Std. dev. 1.3 1.4 1.1 1.4 1.1
Min 2 2 3 2 3Max 6 6 6 5 6
G.3.4.2 SUMI ResultsThe overall score on the SUMI satisfaction questionnaire was 51. The target value of 50 (the industry average SUMI score) was within the 95% confidence limits for all scales.
Participant # Global Efficiency Affect Helpfulness Control Learnability
1 35 39 33 30 40 422 50 62 33 44 54 363 55 52 45 53 46 494 51 53 51 52 55 475 48 45 44 46 48 426 51 59 36 45 53 387 54 52 46 52 47 508 52 49 49 53 56 48
Median 51 52 44 49 50 44Upper
confidence level
58 58 51 55 56 50
Lower confidence
level
44 46 37 43 44 38
Min 35 39 33 30 40 36Max 55 62 51 53 56 50
4 This column is not required by CIF. It is optional.62
ISO/IEC DTR 9126-4
The global measure gives an overall indication of satisfaction. Efficiency indicates the participant’s perception of their efficiency, affect indicates how much they like the product, helpfulness indicates how helpful they found it, control indicates whether they felt in control, and learnability is the participant’s perception of ease of learning.
0
10
20
30
40
50
60
70
Global Efficiency Affect Helpfulness
ControlLearnability
Ucl MednLcl
G.4 Appendix A – Participant Instructions
G.4.1 Participant General Instructions Thank you for helping us in this evaluation.
The purpose of this exercise is to find out how easily people like yourself can use DiaryMate, a diary and contact management software application.
To achieve this, we will ask you to perform some tasks, and your performance will be recorded on videotape for later analysis. Then, to help us understand the results, we will ask you to complete a standard questionnaire, and to answer a few questions about yourself and your usual workplace.
The aim of this evaluation is to help assess the product, and the results may be used to help in the design of new versions.
Please remember that we are testing the software, not you.
When you have finished each task, or got as far as you can, please phone us by dialling 1234. I am afraid that we cannot give you any assistance with the tasks.
63

ISO/IEC DTR 9126-4
G.4.2 Participant Task InstructionsYou have just received your copy of DiaryMate. You are keen to have a look at the product which you have not seen before, to find out whether it could meet your current business needs.
You will perform the following tasks:
1. Install the software.
2. Following this you will be asked to restart the program and take some time to familiarise yourself with it and specifically the diary and address book functions,
3. Add details of a new contact to the address book using information supplied.
4. Schedule a meeting using the diary facility.
We are interested to know how you go about these tasks using DiaryMate and whether you find the software helpful or not.
LET US KNOW WHEN YOU ARE READY TO BEGIN
Task 1 – Install the software(YOU HAVE UP TO 15 MINUTES FOR THIS TASK)
There is an envelope on the desk entitled DiaryMate. It contains a diskette, and an instruction manual.
When you are ready, install the software. All the information you need is provided in the envelope.
LET US KNOW WHEN YOU ARE READY TO MOVE ON
Task 2 – Familiarization periodSpend as long as you need to familiarise yourself with the diary and address book functions.
(YOU HAVE UP TO 20 MINUTES)
LET US KNOW WHEN YOU ARE READY TO MOVE ON
Task 3 – Add a contact record(YOU HAVE ABOUT 15 MINUTES FOR THIS TASK)
Use the software to add the following contact details.
NAME - Dr Gianfranco Zola
COMPANY Chelsea Dreams Ltd
ADDRESS - 25 Main Street
Los Angeles
CaliforinaCalifornia 90024
TEL: (work) 222 976 3987
(home) 222 923 2346
LET US KNOW WHEN YOU ARE READY TO MOVE ON64

ISO/IEC DTR 9126-4
Task 4 – Schedule a meeting(YOU HAVE ABOUT 15 MINUTES FOR THIS TASK)
Use the software to schedule the following meeting.
DATE: 23 November 2001
PLACE: The Blue Flag Inn, Cambridge
TIME: 12.00 AM to 1.30 PM
ATTENDEES: Yourself and Gianfranco Zola.
LET US KNOW WHEN YOU HAVE FINISHED
65