reference values for nerve function assessments among · pdf file39 reference values for nerve...
TRANSCRIPT

39
Reference values for nerve function assessments among a study population in northern India - III: Sensory and motor nerve conduction.1J McKnight, 2PG Nicholls, 3Das Loretta, 4KV Desikan, 1DNJ Lockwood, 5EP Wilder-Smith, 6WH van Brakel
1London School of Hygiene and Tropical Medicine, London, UK; 2School of Health Sciences, University of Southampton, Southampton, UK; 3The Leprosy Mission India, PO Naini, Allahabad, UP, India; 4LEPRA India, Hyderabad, India; 5Division of Neurology, National University Hospital, Singapore; 6Royal Tropical Institute (KIT), Amsterdam, The Netherlands
Abstract
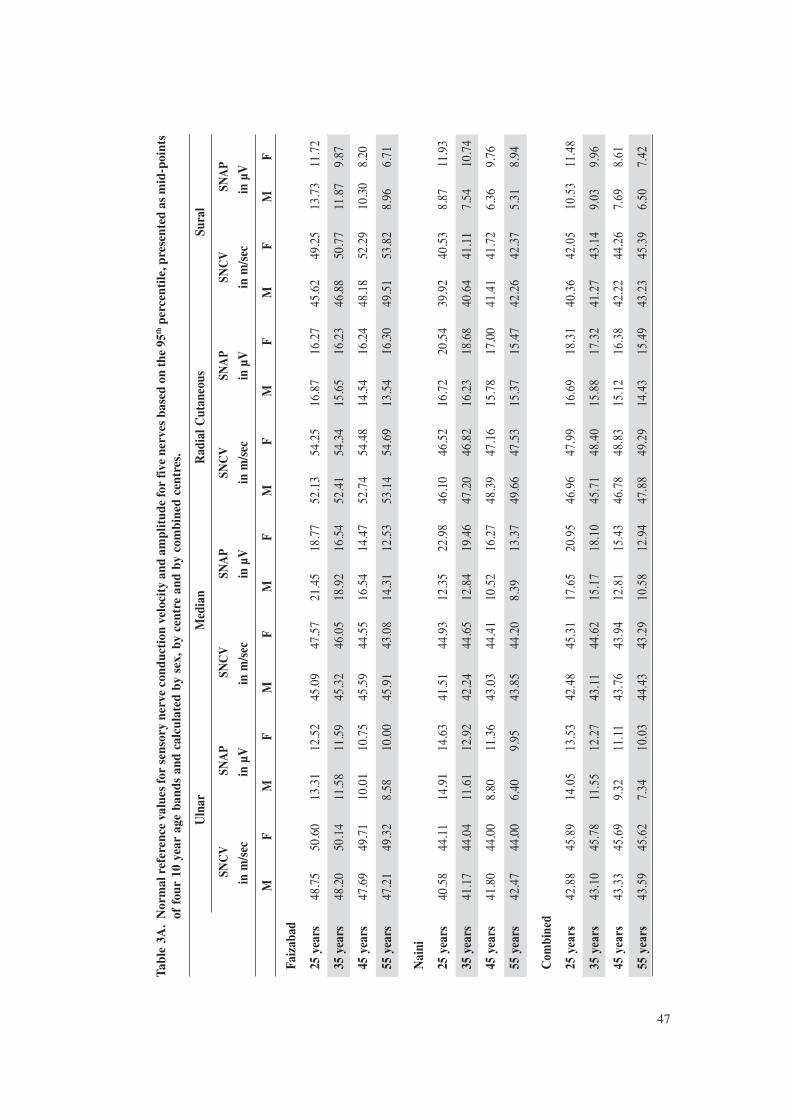
Objective: To identify reference values for normal sensory and motor nerve conduction in upper and lower limb peripheral nerves in a study population in India. The work was carried out in advance of the INFIR Cohort Study, a prospective study of individuals with newly diagnosed multibacillary MB leprosy, the objective being to identify early changes in nerve function predictive of new onset impairment and reactions. Methods: We assessed sensory nerve conduction in bilateral ulnar, median, radial cutaneous and sural nerves and motor nerve conduction in distal and proximal sites in bilateral ulnar, median and peroneal nerves among 315 healthy subjects. After adjustment for skin temperature and removal of outliers reference values were computed using regression analysis of log-transformed data. The analysis and resulting reference values were stratifi ed by age and sex and based on the appropriate 5th or 95th percentiles. Results: Presented here are reference values for sensory nerve conduction velocity (SNCV), sensory nerve action potential (SNAP) amplitude and latency. Also for motor nerve conduction velocity (MNCV) and compound motor action potential (CMAP) amplitude at proximal sites and for amplitude and latency at distal sites. In each case percentiles are given by sex within four 10 year age bands. For males aged 55 years old, the reference value for ulnar SNCV was 43.6 m/sec and SNAP amplitude was 7.43 μV. Ulnar MNCV at the proximal site in the elbow was 50.8 m/sec and CMAP amplitude 7.25 mV and at distal sites in the wrist the amplitude was 7.14 mV and latency 3.1 msec. In the leprosy-affected cohort, the most common and therefore potentially the earliest impairment, is found in sensory nerve conduction amplitude of the sural nerve.
Neurology Asia 2010; 15(1) : 39 – 54
Address correspondence to: Jason McKnight, London School of Hygiene and Tropical Medicine, Keppel St, London WC1E 7HT, UK. Email: [email protected]
INTRODUCTION
Assessment of motor and sensory nerve conduction is a proven diagnostic tool in the testing of peripheral nerve damage.1 Electrophysiological assessment of sensory nerve action potential (SNAP), compound motor action potential (CMAP) amplitudes, sensory nerve conduction velocity (SNCV) and motor nerve conduction velocity (MNCV) help to characterise and quantify the sensory and motor functions in the large myelinated fi bres of peripheral nerves. Reference values are used to defi ne the limits of normal function, with test values outside the range suggesting the presence of some form of neuropathy. Small fi bre function is separately assessed with tests of pain, thermal perception, sweat or vasomotor function. Previous studies
have reported differences in function related to ethnicity and demographic factors.2-4 The present paper is part of a series reporting normal reference values for a study population in northern India in advance of a prospective cohort study or individuals newly diagnosed with multibacillary leprosy. This is the fi rst large study to make prospective assessments of vibration perception, warm and cold sensation and nerve conduction in order to identify the earliest available indicator of changes in nerve function related to leprosy reactions. Since loss of sensation in leprosy brings an increased risk of secondary impairments, identifying the early indicators of nerve involvement is a primary concern. While the TRIPOD study5 suggested that prophylactic treatment of early involvement of large myelinated touch fi bers detected by
Neurology Asia April 2010
40
monofi lament was not appropriate, alternative forms of nerve function assessment may detect other forms of nerve involvement, including those functions fi rst affected. The research was centred on the specialist leprosy referral centres in Naini and Faizabad, Uttar Pradesh, northern India, run by The Leprosy Mission International. Early fi ndings of the Cohort Study have already been published.6-10
METHODS
Subject selection and sample size
Determination of the limits of normal function requires the collection and analysis of data from healthy subjects without a neurological condition drawn from a defi ned population group. In order to achieve a close match with individuals recruited to the cohort study we recruited subjects from among the healthy relatives accompanying individuals attending general and dermatology outpatient clinics at the two participating centres, applying inclusion and exclusion criteria as follows:
Inclusion criteria: Individuals were selected to obtain an equal number of male and female study subjects and by age group. In order to ensure the closest possible match with individuals recruited to the subsequent Cohort Study, equal numbers of subjects were included within four age bands up to 60 years, the maximum age for recruitment.
Exclusion criteria: Since the diagnosis of leprosy can only be made on clinical grounds all subjects were screened by an experienced leprologist leading to the exclusion of anyone exhibiting any clinical signs and symptoms of leprosy. Subjects with any known neurological disorder, previous contact with leprosy or a history of diabetes were also excluded. Individuals aged above 60 years or those less than 10 years were excluded. Nerve conduction testing was concurrent with the parallel studies focussing on thermal sensation and vibration perception. Some subjects were involved in more than one study. To ensure adequate precision we studied 40 subjects within each of the four age groups for men and for women. The overall target for the number of normal subjects was therefore 320, equal numbers to be recruited in each centre.
Equipment and procedures
The equipment used was a Neurocare 2000 nerve conduction system supplied by BioTech
(India). Data was saved in a standard Microsoft Access database. All testing was conducted in air-conditioned rooms with the temperature maintained in the range between 20 and 26˚C. Skin temperatures were recorded using a Testo Quicktemp electronic surface thermometer.
Protocol for testing and data recording
The nerves and test sites matched those used in the Cohort Study. Testing was done bilaterally on the cutaneous area of fi ve nerves that are affected during leprosy neuropathy. For antidromic sensory conduction in the upper limbs, the ulnar and median nerves supplying digits 5 and 2 respectively, and the radial cutaneous nerve at the wrist, were studied. For the lower limb the sural nerve was studied behind the lateral malleolus. Action potentials were recorded at a standard distance of 14 cm in all nerves. Sensory testing produced assessments of SNCV and SNAP amplitude and latency for each nerve. Motor testing produced assessments of MNCV and CMAP amplitude and latency at proximal sites and CMAP amplitude and latency at distal sites for bilateral ulnar, median and peroneal nerves. All the neurophysiological tests were according to a standardised set-up with distances specifi ed. Skin temperatures were measured electronically at wrist and ankle bilaterally. Further details of the study design are available in earlier publications.11 Nerve conduction testing was undertaken by the team of physiotherapists, who were also responsible for vibration perception and thermal threshold testing. After initial extensive on-site training given by a qualifi ed neurophysiologist, four physiotherapists and a physio-technician in Naini and four physiotherapists in Faizabad completed inter-rater reliability testing. Within the centres each pairing was asked to complete up to 20 assessments of volunteer subjects. For this purpose we recruited subjects with a variety of neurological conditions that would ensure the assessors demonstrated reliability across the full range of nerve function. The results were analysed and demonstrated a good level of reliability.
Identifi cation of outliers and calculation of reference values
A total of 315 subjects were assessed. Since the data collection procedure was fully automated data checking focussed on the accuracy of demographic data and the availability of data from all subjects assessed. Prior to analysis all assessments of latency and velocity were normalised for a

41
temperature of 33ºC using the standard formulae described by De Lisa et al.12
In view of age-related changes in parameters of nerve conduction we adopted a regression-based approach to identify outliers. For each assessment of latency, velocity and amplitude we used regression analysis of log-transformed data to compute age-adjusted estimates and identifi ed observations with standardised residual in excess of 2.58 as outliers. These were then excluded from the remaining analysis. In view of differences between centres as well as between sexes the procedure was carried out separately within four groups defi ned by centre and sex. The fi rst round of analyses proved effective in identifying the most extreme outliers. A judgement was then made as to whether the process should be repeated to remove further suspect assessments. The numbers of assessments excluded in this way are reported under the Results heading. In comparison to the procedure used in the earlier analyses, this procedure is more sensitive to differences between age and sex groups and results in a more conservative elimination of outliers. Before computing reference values we used analysis of variance to assess differences between sexes, between age groups, between left and right sides and between centres. Left and right side assessments were then pooled, effectively doubling the sample size. We then used regression analysis of log transformed data on age within each sex and centre combination to compute the specifi c percentiles of normal limits.13 Finally these were reverse-transformed to the original units of amplitude, latency or velocity as appropriate. Presented here are reference values based on estimates of the 95th percentiles for sensory and for motor nerve conduction latency and 5th percentiles for amplitude and velocity. These are based on a re-analysis of the data used in an earlier publication6, the methods described here showing greater sensitivity to differences relating to sex and age.
Application of reference values
The reference values presented here were applied to identify impairment rates (percentages) among the 303 newly diagnosed cases of multibacillary leprosy recruited to the prospective INFIR Cohort Study. Other papers in the present series14,15 describe reference values for vibration perception thresholds and for normal warm and cold sensation. The fi rst of these provides more information on the cohort study.
Ethical Approval
Permission for all aspects of the INFIR study was obtained from the Indian Council of Medical Research through its Research Ethics Committee at the Central JALMA Institute for Leprosy in Agra gave ethical approval. Written consent was obtained from subjects enrolled in the Cohort Study. From individuals participating as subjects in the present study we obtained informed verbal consent, the great majority of those approached being willing to participate.
RESULTS
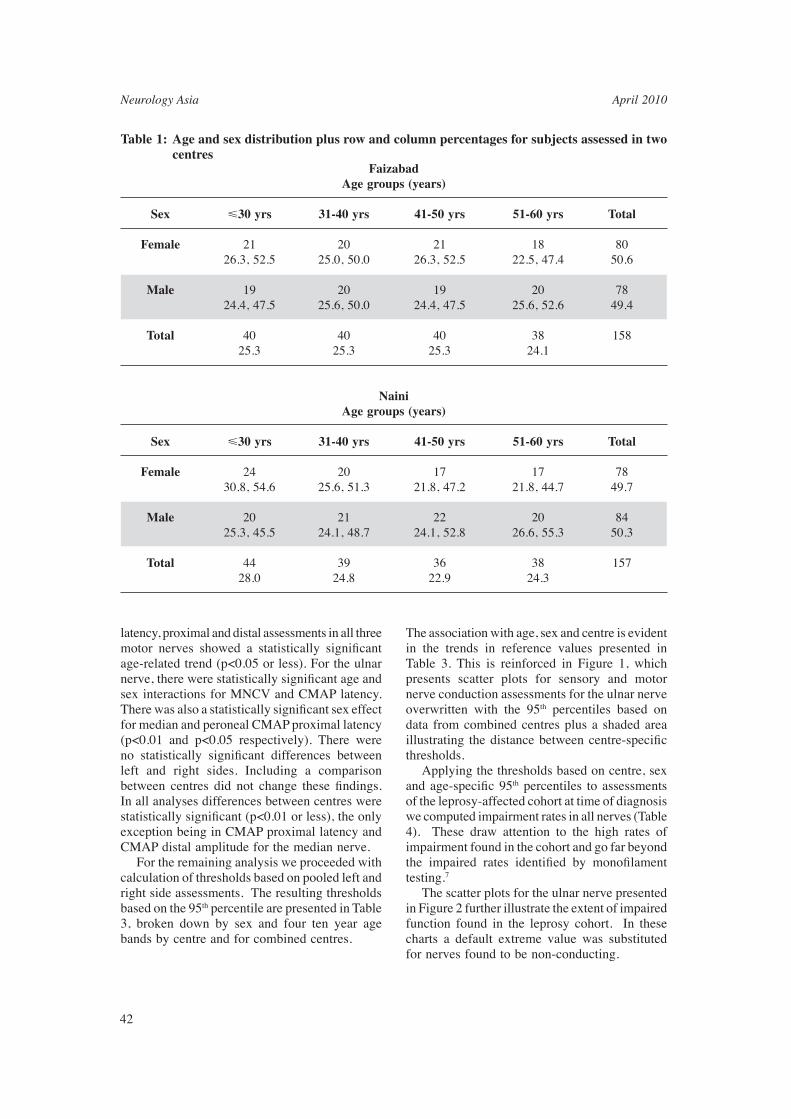
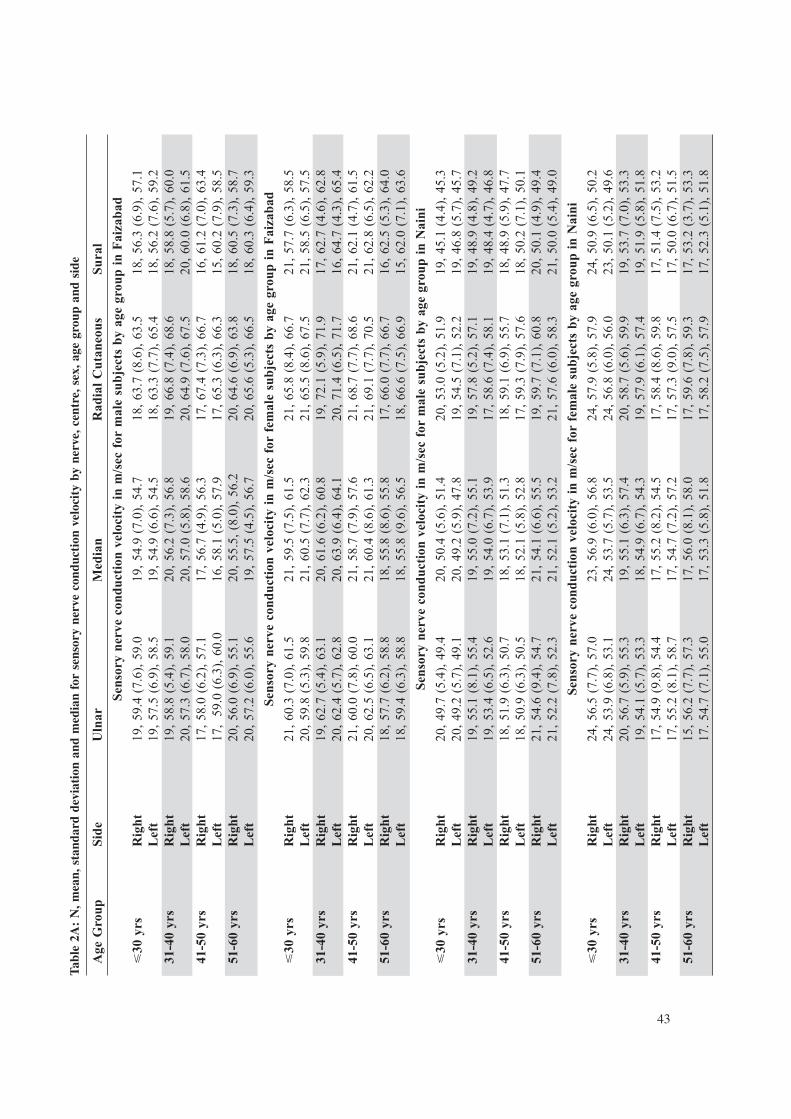
A total of 315 subjects were enrolled during the period from January 2000 up to July 2001. The distribution by age and sex is shown in Table 1. Mean age for men and women in Faizabad were 41.0 years (standard deviation 13.2) and 39.4 years (13.3) respectively and in Naini 39.7 years (13.5) and 37.9 years (13.6). As a result of the two rounds of outlier elimination 0.95% of sensory assessments and 0.77% of motor assessments were excluded. The four sections of Table 2 present summary statistics for left and right side assessments by centre, sex and age group for sensory nerve conduction velocity and amplitude, for proximal motor nerve conduction velocity and amplitude and for distal motor nerve conduction latency and amplitude. To assess the statistical signifi cance of differences in assessments in each nerve relating to sex, age group and side we used analysis of variance of log-transformed data with age as a covariate. In the analyses of sensory assessments, there was a statistically signifi cant age effect in latency, amplitude and velocity for sural and radial cutaneous nerves (all p<0.01 or higher levels of signifi cance). Age also showed a statistically signifi cant association with median and ulnar SNAP amplitude (p<0.001 in each case), but not with latency or velocity in these nerves. Statistically signifi cant sex effects were found in all analyses relating to latency and velocity (p<0.05 or higher levels of signifi cance) but in none of those relating to amplitude. The importance of these differences is refl ected in the charts of Figure 1. No differences relating to side reached statistical signifi cance. Including centre in the analysis did not change these fi ndings, however, between centre differences reached statistical signifi cance in all latency and velocity assessments and in amplitude assessments only for the sural nerve. With the exception of ulnar CMAP distal
Neurology Asia April 2010
42
FaizabadAge groups (years)
Sex �30 yrs 31-40 yrs 41-50 yrs 51-60 yrs Total Female 21 20 21 18 80 26.3, 52.5 25.0, 50.0 26.3, 52.5 22.5, 47.4 50.6
Male 19 20 19 20 78 24.4, 47.5 25.6, 50.0 24.4, 47.5 25.6, 52.6 49.4
Total 40 40 40 38 158 25.3 25.3 25.3 24.1
NainiAge groups (years)
Sex �30 yrs 31-40 yrs 41-50 yrs 51-60 yrs Total Female 24 20 17 17 78 30.8, 54.6 25.6, 51.3 21.8, 47.2 21.8, 44.7 49.7
Male 20 21 22 20 84 25.3, 45.5 24.1, 48.7 24.1, 52.8 26.6, 55.3 50.3
Total 44 39 36 38 157 28.0 24.8 22.9 24.3
Table 1: Age and sex distribution plus row and column percentages for subjects assessed in two centres
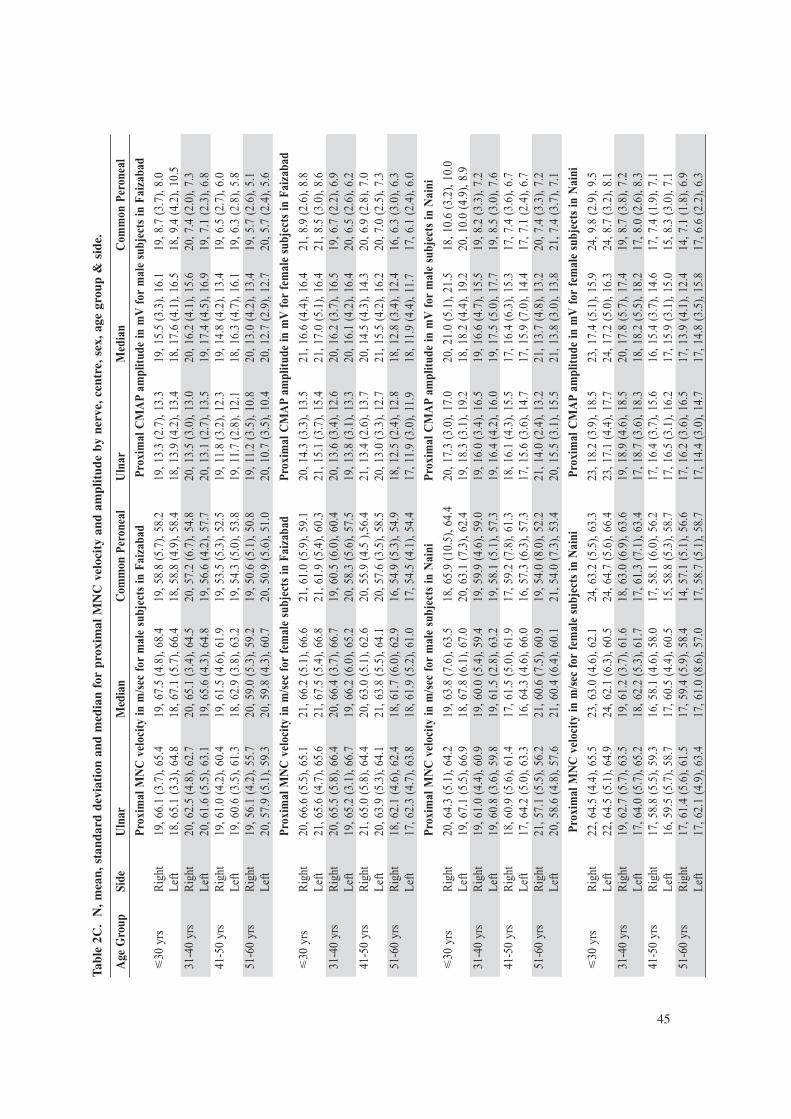
latency, proximal and distal assessments in all three motor nerves showed a statistically signifi cant age-related trend (p<0.05 or less). For the ulnar nerve, there were statistically signifi cant age and sex interactions for MNCV and CMAP latency. There was also a statistically signifi cant sex effect for median and peroneal CMAP proximal latency (p<0.01 and p<0.05 respectively). There were no statistically signifi cant differences between left and right sides. Including a comparison between centres did not change these fi ndings. In all analyses differences between centres were statistically signifi cant (p<0.01 or less), the only exception being in CMAP proximal latency and CMAP distal amplitude for the median nerve. For the remaining analysis we proceeded with calculation of thresholds based on pooled left and right side assessments. The resulting thresholds based on the 95th percentile are presented in Table 3, broken down by sex and four ten year age bands by centre and for combined centres.
The association with age, sex and centre is evident in the trends in reference values presented in Table 3. This is reinforced in Figure 1, which presents scatter plots for sensory and motor nerve conduction assessments for the ulnar nerve overwritten with the 95th percentiles based on data from combined centres plus a shaded area illustrating the distance between centre-specifi c thresholds. Applying the thresholds based on centre, sex and age-specifi c 95th percentiles to assessments of the leprosy-affected cohort at time of diagnosis we computed impairment rates in all nerves (Table 4). These draw attention to the high rates of impairment found in the cohort and go far beyond the impaired rates identifi ed by monofi lament testing.7
The scatter plots for the ulnar nerve presented in Figure 2 further illustrate the extent of impaired function found in the leprosy cohort. In these charts a default extreme value was substituted for nerves found to be non-conducting.
43
Age
Gro
up
Side
U
lnar
M
edia
n R
adia
l C
utan
eous
Su
ral
Se
nsor
y ne
rve
cond
ucti
on v
eloc
ity
in m
/sec
for
mal
e su
bjec
ts b
y ag
e gr
oup
in F
aiza
bad
�30
yrs
R
ight
19
, 59.
4 (7
.6),
59.
0 19
, 54.
9 (7
.0),
54.
7 18
, 63.
7 (8
.6),
63.
5 18
, 56.
3 (6
.9),
57.
1
L
eft
19, 5
7.5
(6.9
), 5
8.5
19, 5
4.9
(6.6
), 5
4.5
18, 6
3.3
(7.7
), 6
5.4
18, 5
6.2
(7.6
), 5
9.2
31-4
0 yr
s R
ight
19
, 58.
8 (5
.4),
59.
1 20
, 56.
2 (7
.3),
56.
8 19
, 66.
8 (7
.4),
68.
6 18
, 58.
8 (5
.7),
60.
0
L
eft
20, 5
7.3
(6.7
), 5
8.0
20, 5
7.0
(5.8
), 5
8.6
20, 6
4.9
(7.6
), 6
7.5
20, 6
0.0
(6.8
), 6
1.5
41-5
0 yr
s R
ight
17
, 58.
0 (6
.2),
57.
1 17
, 56.
7 (4
.9),
56.
3 17
, 67.
4 (7
.3),
66.
7 16
, 61.
2 (7
.0),
63.
4
L
eft
17,
59.0
(6.
3), 6
0.0
16, 5
8.1
(5.0
), 5
7.9
17, 6
5.3
(6.3
), 6
6.3
15, 6
0.2
(7.9
), 5
8.5
51-6
0 yr
s R
ight
20
, 56.
0 (6
.9),
55.
1 20
, 55.
5, (
8.0)
, 56.
2 20
, 64.
6 (6
.9),
63.
8 18
, 60.
5 (7
.3),
58.
7
L
eft
20, 5
7.2
(6.0
), 5
5.6
19, 5
7.5
(4.5
), 5
6.7
20, 6
5.6
(5.3
), 6
6.5
18, 6
0.3
(6.4
), 5
9.3
Se
nsor
y ne
rve
cond
ucti
on v
eloc
ity
in m
/sec
for
fem
ale
subj
ects
by
age
grou
p in
Fai
zaba
d
�30
yrs
R
ight
21
, 60.
3 (7
.0),
61.
5 21
, 59.
5 (7
.5),
61.
5 21
, 65.
8 (8
.4),
66.
7 21
, 57.
7 (6
.3),
58.
5
L
eft
20, 5
9.8
(5.3
), 5
9.8
21, 6
0.5
(7.7
), 6
2.3
21, 6
5.5
(8.6
), 6
7.5
21, 5
8.5
(6.5
), 5
7.5
31-4
0 yr
s R
ight
19
, 62.
7 (5
.4),
63.
1 20
, 61.
6 (6
.2),
60.
8 19
, 72.
1 (5
.9),
71.
9 17
, 62.
7 (4
.6),
62.
8
L
eft
20, 6
2.4
(5.7
), 6
2.8
20, 6
3.9
(6.4
), 6
4.1
20, 7
1.4
(6.5
), 7
1.7
16, 6
4.7
(4.3
), 6
5.4
41-5
0 yr
s R
ight
21
, 60.
0 (7
.8),
60.
0 21
, 58.
7 (7
.9),
57.
6 21
, 68.
7 (7
.7),
68.
6 21
, 62.
1 (4
.7),
61.
5
L
eft
20, 6
2.5
(6.5
), 6
3.1
21, 6
0.4
(8.6
), 6
1.3
21, 6
9.1
(7.7
), 7
0.5
21, 6
2.8
(6.5
), 6
2.2
51-6
0 yr
s R
ight
18
, 57.
7 (6
.2),
58.
8 18
, 55.
8 (8
.6),
55.
8 17
, 66.
0 (7
.7),
66.
7 16
, 62.
5 (5
.3),
64.
0
L
eft
18, 5
9.4
(6.3
), 5
8.8
18, 5
5.8
(9.6
), 5
6.5
18, 6
6.6
(7.5
), 6
6.9
15, 6
2.0
(7.1
), 6
3.6
Se
nsor
y ne
rve
cond
ucti
on v
eloc
ity
in m
/sec
for
mal
e su
bjec
ts b
y ag
e gr
oup
in N
aini
�30
yrs
R
ight
20
, 49.
7 (5
.4),
49.
4 20
, 50.
4 (5
.6),
51.
4 20
, 53.
0 (5
.2),
51.
9 19
, 45.
1 (4
.4),
45.
3
L
eft
20, 4
9.2
(5.7
), 4
9.1
20, 4
9.2
(5.9
), 4
7.8
19, 5
4.5
(7.1
), 5
2.2
19, 4
6.8
(5.7
), 4
5.7
31-4
0 yr
s R
ight
19
, 55.
1 (8
.1),
55.
4 19
, 55.
0 (7
.2),
55.
1 19
, 57.
8 (5
.2),
57.
1 19
, 48.
9 (4
.8),
49.
2
L
eft
19, 5
3.4
(6.5
), 5
2.6
19, 5
4.0
(6.7
), 5
3.9
17, 5
8.6
(7.4
), 5
8.1
19, 4
8.4
(4.7
), 4
6.8
41-5
0 yr
s R
ight
18
, 51.
9 (6
.3),
50.
7 18
, 53.
1 (7
.1),
51.
3 18
, 59.
1 (6
.9),
55.
7 18
, 48.
9 (5
.9),
47.
7
L
eft
18, 5
0.9
(6.3
), 5
0.5
18, 5
2.1
(5.8
), 5
2.8
17, 5
9.3
(7.9
), 5
7.6
18, 5
0.2
(7.1
), 5
0.1
51-6
0 yr
s R
ight
21
, 54.
6 (9
.4),
54.
7 21
, 54.
1 (6
.6),
55.
5 19
, 59.
7 (7
.1),
60.
8 20
, 50.
1 (4
.9),
49.
4
L
eft
21, 5
2.2
(7.8
), 5
2.3
21, 5
2.1
(5.2
), 5
3.2
21, 5
7.6
(6.0
), 5
8.3
21, 5
0.0
(5.4
), 4
9.0
Se
nsor
y ne
rve
cond
ucti
on v
eloc
ity
in m
/sec
for
fem
ale
subj
ects
by
age
grou
p in
Nai
ni
�30
yrs
R
ight
24
, 56.
5 (7
.7),
57.
0 23
, 56.
9 (6
.0),
56.
8 24
, 57.
9 (5
.8),
57.
9 24
, 50.
9 (6
.5),
50.
2
L
eft
24, 5
3.9
(6.8
), 5
3.1
24, 5
3.7
(5.7
), 5
3.5
24, 5
6.8
(6.0
), 5
6.0
23, 5
0.1
(5.2
), 4
9.6
31-4
0 yr
s R
ight
20
, 56.
7 (5
.9),
55.
3 19
, 55.
1 (6
.3),
57.
4 20
, 58.
7 (5
.6),
59.
9 19
, 53.
7 (7
.0),
53.
3
L
eft
19, 5
4.1
(5.7
), 5
3.3
18, 5
4.9
(6.7
), 5
4.3
19, 5
7.9
(6.1
), 5
7.4
19, 5
1.9
(5.8
), 5
1.8
41-5
0 yr
s R
ight
17
, 54.
9 (9
.8),
54.
4 17
, 55.
2 (8
.2),
54.
5 17
, 58.
4 (8
.6),
59.
8 17
, 51.
4 (7
.5),
53.
2
L
eft
17, 5
5.2
(8.1
), 5
8.7
17, 5
4.7
(7.2
), 5
7.2
17, 5
7.3
(9.0
), 5
7.5
17, 5
0.0
(6.7
), 5
1.5
51-6
0 yr
s R
ight
15
, 56.
2 (7
.7),
57.
3 17
, 56.
0 (8
.1),
58.
0 17
, 59.
6 (7
.8),
59.
3 17
, 53.
2 (3
.7),
53.
3
L
eft
17. 5
4.7
(7.1
), 5
5.0
17, 5
3.3
(5.8
), 5
1.8
17, 5
8.2
(7.5
), 5
7.9
17, 5
2.3
(5.1
), 5
1.8
Tab
le 2
A:
N, m
ean,
sta
ndar
d de
viat
ion
and
med
ian
for
sens
ory
nerv
e co
nduc
tion
vel
ocit
y by
ner
ve, c
entr
e, s
ex, a
ge g
roup
and
sid
e

Neurology Asia April 2010
44
Tab
le 2
B.
N, m
ean,
sta
ndar
d de
viat
ion
and
med
ian
for
SNA
P a
mpl
itud
e in
μV
by
nerv
e, c
entr
e, s
ex, a
ge g
roup
and
sid
e.
Age
Gro
up
Side
U
lnar
M
edia
n R
adia
l C
utan
eous
Su
ral
SN
AP
ampl
itud
e in
μV
for
mal
e su
bjec
ts b
y ag
e gr
oup
in F
aiza
bad
�30
yrs
R
ight
19
, 32.
3 (1
8.5)
, 30.
1 19
, 47.
7 (2
0.8)
, 39.
4 18
, 27.
8 (9
.4),
24.
8 18
, 29.
7 (1
0.8)
, 27.
4
Lef
t 19
, 33.
8 (1
6.0)
, 33.
6 19
, 45.
3 (1
9.0)
, 42.
0 18
, 31.
8 (8
.7),
31.
0 18
, 27.
9 (1
1.0)
, 28.
4 31
-40
yrs
Rig
ht
19, 3
3.0
(13.
3), 3
1.0
20, 4
4.0
(15.
8), 4
3.4
19, 2
8.0
(11.
4), 2
4.8
18, 2
9.8
(16.
0), 2
6.3
L
eft
20, 3
2.4
(13.
2), 3
0.7
20, 4
8.6
(15.
6), 5
2.8
20, 3
1.2
(10.
4), 3
3.0
20, 2
9.0
(15.
3), 2
4.9
41-5
0 yr
s R
ight
17
, 25.
0 (1
0.4)
, 25.
0 17
, 43.
8 (1
6.7)
, 43.
0 17
, 26.
2 (8
.8),
24.
6 16
, 23.
3 (1
0.8)
, 20.
9
Lef
t 17
, 29.
3 (1
2.4)
, 29.
5 16
, 45.
2 (1
9.4)
, 44.
3 17
, 28.
7 (8
.9),
27.
0 15
, 21.
6 (1
2.3)
, 18.
2 51
-60
yrs
Rig
ht
20, 2
3.6
(11.
0), 2
4.0
20, 3
3.9
(14.
3), 3
4.4
20, 2
1.4
(6.2
), 2
0.0
18, 1
7.4
(5.5
), 1
7.0
L
eft
20, 2
3.7
(15.
0), 2
0.2
19, 3
6.3
(13.
5), 3
7.0
20, 2
3.6
(6.5
), 2
3.2
18, 1
8.7
(5.5
), 1
9.0
SN
AP
ampl
itud
e in
μV
for
fem
ale
subj
ects
by
age
grou
p in
Fai
zaba
d
�30
yrs
R
ight
21
, 33.
2 (1
7.7)
, 29.
8 21
, 43.
2 (1
9.3)
, 38.
2 21
, 29.
6 (1
1.5)
, 26.
2 21
, 31.
8 (1
2.1)
, 32.
6
Lef
t 20
, 36.
8 (2
2.6)
, 30.
8 21
, 51.
2 (2
7.0)
, 49.
0 21
, 31.
3 (1
0.2)
, 28.
5 21
, 32.
4 (1
4.5)
, 33.
3 31
-40
yrs
Rig
ht
19, 3
7.1
(17.
0), 3
6.4
20, 5
7.5
(18.
3), 5
8.6
19, 3
0.9
(8.8
), 3
0.3
17, 2
1.3
(8.9
), 2
0.6
L
eft
20, 3
9.2
(20.
7), 3
3.1
20, 6
2.2
(21.
2), 6
4.4
20, 3
2.0
(9.5
), 3
1.0
16, 2
2.8
(16.
5), 1
9.3
41-5
0 yr
s R
ight
21
, 33.
5 (1
6.0)
, 32.
8 21
, 42.
6 (1
5.0)
, 42.
7 21
, 31.
8 (1
0.1)
, 29.
2 21
, 24.
5 (9
.7),
19.
8
Lef
t 20
, 42.
1 (2
4.1)
, 35.
9 21
, 50.
3 (2
4.7)
, 37.
1 21
, 33.
2 (9
.2),
34.
1 21
, 25.
3 (1
0.9)
, 21.
551
-60
yrs
Rig
ht
18, 2
5.9
(13.
2), 2
4.0
18, 3
4.2
(18.
4), 2
7.9
17, 3
0.7
(8.9
), 3
0.5
16, 2
0.0
(9.4
), 1
8.5
L
eft
18, 3
0.7
(23.
0), 2
5.0
18, 3
8.8
(21.
1), 4
1.0
18, 3
0.6
(14.
5), 3
2.5
15, 1
7.6
(9.3
), 1
9.1
SN
AP
ampl
itud
e in
μV
for
mal
e su
bjec
ts b
y ag
e gr
oup
in N
aini
�30
yrs
R
ight
20
, 36.
8 (1
9.7)
, 32.
0 20
, 42.
9 (1
5.7)
, 44.
0 20
, 27.
8 (9
.3),
26.
5 19
, 21.
6 (8
.5),
23.
9
Lef
t 20
, 40.
9 (1
8.6)
, 35.
4 20
, 46.
3 (1
8.0)
, 47.
4 19
, 29.
9 (1
0.5)
, 27.
6 19
, 22.
9 (7
.6),
22.
8 31
-40
yrs
Rig
ht
19, 2
9.0
(11.
7), 2
7.2
19, 3
4.2
(17.
5), 3
3.4
19, 2
5.9
(9.6
), 2
4.7
19, 1
8.9
(8.9
), 1
8.3
L
eft
19, 3
4.2
(14.
9), 3
0.2
19, 3
9.7
(22.
6), 3
8.5
17, 3
2.2
(15.
9), 2
8.7
19, 2
0.3
(10.
5), 1
7.4
41-5
0 yr
s R
ight
18
, 26.
0 (1
5.3)
, 22.
0 18
, 29.
6 (1
6.3)
, 27.
0 18
, 30.
4 (8
.8),
29.
0 18
, 19.
2 (8
.6),
17.
3
Lef
t 18
, 26.
8 (1
2.8)
, 22.
6 18
, 40.
1 (1
9.2)
, 35.
8 17
, 31.
7 (8
.2),
30.
4 18
, 20.
1 (7
.1),
20.
7 51
-60
yrs
Rig
ht
21, 1
8.9
(9.3
), 1
7.3
21, 3
1.7
(19.
8), 2
8.3
19, 2
4.2
(7.7
), 2
3.0
20, 1
6.3
(13.
1), 1
2.1
L
eft
21, 2
1.1
(12.
6), 1
9.2
21, 3
3.2
(15.
6), 2
8.7
21, 2
4.2
(7.0
), 2
3.1
21, 1
4.3
(10.
7), 1
0.6
SN
AP
ampl
itud
e in
μV
for
fem
ale
subj
ects
by
age
grou
p in
Nai
ni
�30
yrs
R
ight
24
, 35.
5 (2
0.3)
, 28.
7 23
, 54.
4 (2
9.4)
, 38.
3 24
, 36.
0 (1
1.5)
, 32.
4 24
, 26.
4 (1
0.1)
, 24.
0
Lef
t 24
, 37.
9 (1
9.8)
, 29.
9 24
, 62.
5 (3
5.2)
, 60.
0 24
, 36.
5 (1
1.6)
, 35.
5 23
, 25.
8 (9
.3),
23.
5 31
-40
yrs
Rig
ht
20, 4
0.2
(12.
7), 4
1.7
19, 5
1.6
(21.
5), 4
7.7
20, 3
5.4
(12.
0), 3
5.4
19, 2
2.8
(13.
8), 1
7.8
L
eft
19, 4
4.0
(20.
5), 4
3.4
18, 6
5.9
(25.
0), 6
9.4
19, 3
4.4
(11.
1), 3
4.2
19, 2
1.5
(11.
6), 1
6.3
41-5
0 yr
s R
ight
17
, 34.
3 (1
5.5)
, 29.
5 17
, 46.
1 (1
5.9)
, 52.
3 17
, 32.
9 (9
.6),
32.
8 17
, 23.
3 (1
3.4)
, 19.
3
Lef
t 17
, 39.
0 (1
5.0)
, 36.
0 17
, 51.
9 (1
6.2)
, 49.
3 17
, 33.
6 (1
1.8)
, 31.
0 17
, 21.
2 (8
.0),
20.
1 51
-60
yrs
Rig
ht
15, 2
1.4
(8.9
), 1
9.7
17, 3
4.3
(15.
4), 3
3.5
17, 2
4.1
(6.3
), 2
2.8
17, 1
5.7
(4.0
), 1
6.0
L
eft
17, 2
5.9
(12.
5), 2
3.7
17, 4
5.1
(25.
6), 4
5.4
17, 2
6.1
(7.5
), 2
5.0
17, 1
7.5
(15.
2), 1
2.7
45
Tab
le 2
C.
N, m
ean,
sta
ndar
d de
viat
ion
and
med
ian
for
prox
imal
MN
C v
eloc
ity
and
ampl
itud
e by
ner
ve, c
entr
e, s
ex, a
ge g
roup
& s
ide.
Age
Gro
up
Side
U
lnar
M
edia
n C
omm
on P
eron
eal
Uln
ar
Med
ian
Com
mon
Per
onea
l
Prox
imal
MN
C v
eloc
ity in
m/s
ec f
or m
ale
subj
ects
in F
aiza
bad
Pro
xim
al C
MA
P am
plitu
de in
mV
for
mal
e su
bjec
ts in
Fai
zaba
d
�30
yrs
R
ight
19
, 66.
1 (3
.7),
65.4
19
, 67.
5 (4
.8),
68.4
19
, 58.
8 (5
.7),
58.2
19
, 13.
3 (2
.7),
13.3
19
, 15.
5 (3
.3),
16.1
19
, 8.7
(3.
7), 8
.0
Left
18, 6
5.1
(3.3
), 64
.8
18, 6
7.1
(5.7
), 66
.4
18, 5
8.8
(4.9
), 58
.4
18, 1
3.9
(4.2
), 13
.4
18, 1
7.6
(4.1
), 16
.5
18, 9
.4 (
4.2)
, 10.
5 31
-40
yrs
Rig
ht
20, 6
2.5
(4.8
), 62
.7
20, 6
5.1
(3.4
), 64
.5
20, 5
7.2
(6.7
), 54
.8
20, 1
3.5
(3.0
), 13
.0
20, 1
6.2
(4.1
), 15
.6
20, 7
.4 (
2.0)
, 7.3
Le
ft 20
, 61.
6 (5
.5),
63.1
19
, 65.
6 (4
.3),
64.8
19
, 56.
6 (4
.2),
57.7
20
, 13.
1 (2
.7),
13.5
19
, 17.
4 (4
.5),
16.9
19
, 7.1
(2.
3), 6
.8
41-5
0 yr
s R
ight
19
, 61.
0 (4
.2),
60.4
19
, 61.
5 (4
.6),
61.9
19
, 53.
5 (5
.3),
52.5
19
, 11.
8 (3
.2),
12.3
19
, 14.
8 (4
.2),
13.4
19
, 6.5
(2.
7), 6
.0
Left
19, 6
0.6
(3.5
), 61
.3
18, 6
2.9
(3.8
), 63
.2
19, 5
4.3
(5.0
), 53
.8
19, 1
1.7
(2.8
), 12
.1
18, 1
6.3
(4.7
), 16
.1
19, 6
.3 (
2.8)
, 5.8
51
-60
yrs
Rig
ht
19, 5
6.1
(4.2
), 55
.7
20, 5
9.0
(5.3
), 59
.2
19, 5
0.6
(5.1
), 50
.8
19, 1
1.2
(3.5
), 10
.8
20, 1
3.0
(4.2
), 13
.4
19, 5
.7 (
2.6)
, 5.1
Le
ft 20
, 57.
9 (5
.1),
59.3
20
, 59.
8 (4
.3),
60.7
20
, 50.
9 (5
.6),
51.0
20
, 10.
7 (3
.5),
10.4
20
, 12.
7 (2
.9),
12.7
20
, 5.7
(2.
4), 5
.6
Prox
imal
MN
C v
eloc
ity in
m/s
ec f
or f
emal
e su
bjec
ts in
Fai
zaba
d Pr
oxim
al C
MA
P am
plitu
de in
mV
for
fem
ale
subj
ects
in F
aiza
bad
�30
yrs
R
ight
20
, 66.
6 (5
.5),
65.1
21
, 66.
2 (5
.1),
66.6
21
, 61.
0 (5
.9),
59.1
20
, 14.
3 (3
.3),
13.5
21
, 16.
6 (4
.4),
16.4
21
, 8.9
(2.
6), 8
.8
Left
21, 6
5.6
(4.7
), 65
.6
21, 6
7.5
(5.4
), 66
.8
21, 6
1.9
(5.4
), 60
.3
21, 1
5.1
(3.7
), 15
.4
21, 1
7.0
(5.1
), 16
.4
21, 8
.5 (
3.0)
, 8.6
31
-40
yrs
Rig
ht
20, 6
5.5
(5.8
), 66
.4
20, 6
6.4
(3.7
), 66
.7
19, 6
0.5
(6.0
), 60
.4
20, 1
3.6
(3.4
), 12
.6
20, 1
6.2
(3.7
), 16
.5
19, 6
.7 (
2.2)
, 6.9
Le
ft 19
, 65.
2 (3
.1),
66.7
19
, 66.
2 (6
.0),
65.2
20
, 58.
3 (5
.6),
57.5
19
, 13.
8 (3
.1),
13.3
20
, 16.
1 (4
.2),
16.4
20
, 6.5
(2.
6), 6
.241
-50
yrs
Rig
ht
21, 6
5.0
(5.8
), 64
.4
20, 6
3.0
(5.1
), 62
.6
20, 5
5.9
(4.5
),5
6.4
21, 1
3.4
(2.6
), 13
.7
20, 1
4.5
(4.3
), 14
.3
20, 6
.9 (
2.8)
, 7.0
Le
ft 20
, 63.
9 (5
.3),
64.1
21
, 63.
8 (5
.5),
64.1
20
, 57.
6 (3
.5),
58.5
20
, 13.
0 (3
.3),
12.7
21
, 15.
5 (4
.2),
16.2
20
, 7.0
(2.
5), 7
.3
51-6
0 yr
s R
ight
18
, 62.
1 (4
.6),
62.4
18
, 61.
7 (6
.0),
62.9
16
, 54.
9 (5
.3),
54.9
18
, 12.
5 (2
.4),
12.8
18
, 12.
8 (3
.4),
12.4
16
, 6.3
(3.
0), 6
.3
Left
17, 6
2.3
(4.7
), 63
.8
18, 6
1.9
(5.2
), 61
.0
17, 5
4.5
(4.1
), 54
.4
17, 1
1.9
(3.0
), 11
.9
18, 1
1.9
(4.4
), 11
.7
17, 6
.1 (
2.4)
, 6.0
Prox
imal
MN
C v
eloc
ity in
m/s
ec f
or m
ale
subj
ects
in N
aini
Pr
oxim
al C
MA
P am
plitu
de in
mV
for
mal
e su
bjec
ts in
Nai
ni
�30
yrs
R
ight
20
, 64.
3 (5
.1),
64.2
19
, 63.
8 (7
.6),
63.5
18
, 65.
9 (1
0.5)
, 64.
4 20
, 17.
3 (3
.0),
17.0
20
, 21.
0 (5
.1),
21.5
18
, 10.
6 (3
.2),
10.0
Left
19, 6
7.1
(5.5
), 66
.9
18, 6
7.8
(6.1
), 67
.0
20, 6
3.1
(7.3
), 62
.4
19, 1
8.3
(3.1
), 19
.2
18, 1
8.2
(4.4
), 19
.2
20, 1
0.0
(4.9
), 8.
931
-40
yrs
Rig
ht
19, 6
1.0
(4.4
), 60
.9
19, 6
0.0
(5.4
), 59
.4
19, 5
9.9
(4.6
), 59
.0
19, 1
6.0
(3.4
), 16
.5
19, 1
6.6
(4.7
), 15
.5
19, 8
.2 (
3.3)
, 7.2
Le
ft 19
, 60.
8 (3
.6),
59.8
19
, 61.
5 (2
.8),
63.2
19
, 58.
1 (5
.1),
57.3
19
, 16.
4 (4
.2),
16.0
19
, 17.
5 (5
.0),
17.7
19
, 8.5
(3.
0), 7
.6
41-5
0 yr
s R
ight
18
, 60.
9 (5
.6),
61.4
17
, 61.
5 (5
.0),
61.9
17
, 59.
2 (7
.8),
61.3
18
, 16.
1 (4
.3),
15.5
17
, 16.
4 (6
.3),
15.3
17
, 7.4
(3.
6), 6
.7
Left
17, 6
4.2
(5.0
), 63
.3
16, 6
4.3
(4.6
), 66
.0
16, 5
7.3
(6.3
), 57
.3
17, 1
5.6
(3.6
), 14
.7
17, 1
5.9
(7.0
), 14
.4
17, 7
.1 (
2.4)
, 6.7
51-6
0 yr
s R
ight
21
, 57.
1 (5
.5),
56.2
21
, 60.
6 (7
.5),
60.9
19
, 54.
0 (8
.0),
52.2
21
, 14.
0 (2
.4),
13.2
21
, 13.
7 (4
.8),
13.2
20
, 7.4
(3.
3), 7
.2
Left
20, 5
8.6
(4.8
), 57
.6
21, 6
0.4
(6.4
), 60
.1
21, 5
4.0
(7.3
), 53
.4
20, 1
5.5
(3.1
), 15
.5
21, 1
3.8
(3.0
), 13
.8
21, 7
.4 (
3.7)
, 7.1
Pro
xim
al M
NC
vel
ocity
in m
/sec
for
fem
ale
subj
ects
in N
aini
P
roxi
mal
CM
AP
ampl
itude
in m
V f
or f
emal
e su
bjec
ts in
Nai
ni
�30
yrs
R
ight
22
, 64.
5 (4
.4),
65.5
23
, 63.
0 (4
.6),
62.1
24
, 63.
2 (5
.5),
63.3
23
, 18.
2 (3
.9),
18.5
23
, 17.
4 (5
.1),
15.9
24
, 9.8
(2.
9), 9
.5
Left
22, 6
4.5
(5.1
), 64
.9
24, 6
2.1
(6.3
), 60
.5
24, 6
4.7
(5.6
), 66
.4
23, 1
7.1
(4.4
), 17
.7
24, 1
7.2
(5.0
), 16
.3
24, 8
.7 (
3.2)
, 8.1
31
-40
yrs
Rig
ht
19, 6
2.7
(5.7
), 63
.5
19, 6
1.2
(3.7
), 61
.6
18, 6
3.0
(6.9
), 63
.6
19, 1
8.9
(4.6
), 18
.5
20, 1
7.8
(5.7
), 17
.4
19, 8
.7 (
3.8)
, 7.2
Le
ft 17
, 64.
0 (5
.7),
65.2
18
, 62.
2 (5
.3),
61.7
17
, 61.
3 (7
.1),
63.4
17
, 18.
7 (3
.6),
18.3
18
, 18.
2 (5
.5),
18.2
17
, 8.0
(2.
6), 8
.341
-50
yrs
Rig
ht
17, 5
8.8
(5.5
), 59
.3
16, 5
8.1
(4.6
), 58
.0
17, 5
8.1
(6.0
), 56
.2
17, 1
6.4
(3.7
), 15
.6
16, 1
5.4
(3.7
), 14
.6
17, 7
.4 (
1.9)
, 7.1
Le
ft 16
, 59.
5 (5
.7),
58.7
17
, 60.
5 (4
.4),
60.5
15
, 58.
8 (5
.3),
58.7
17
, 16.
5 (3
.1),
16.2
17
, 15.
9 (3
.1),
15.0
15
, 8.3
(3.
0), 7
.1
51-6
0 yr
s R
ight
17
, 61.
4 (5
.6),
61.5
17
, 59.
4 (5
.9),
58.4
14
, 57.
1 (5
.1),
56.6
17
, 16.
2 (3
.6),
16.5
17
, 13.
9 (4
.1),
12.4
14
, 7.1
(1.
8), 6
.9
Left
17, 6
2.1
(4.9
), 63
.4
17, 6
1.0
(8.6
), 57
.0
17, 5
8.7
(5.1
), 58
.7
17, 1
4.4
(3.0
), 14
.7
17, 1
4.8
(3.5
), 15
.8
17, 6
.6 (
2.2)
, 6.3
Neurology Asia April 2010
46
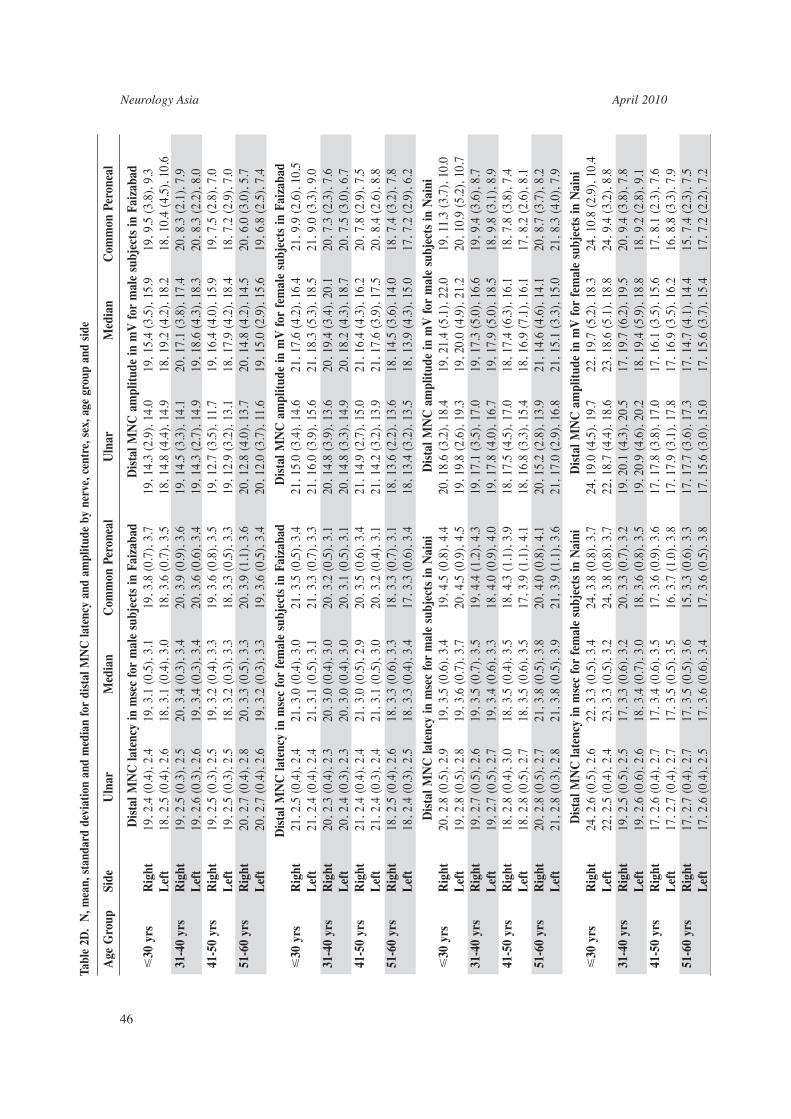
Tabl
e 2D
. N
, mea
n, s
tand
ard
devi
atio
n an
d m
edia
n fo
r di
stal
MN
C la
tenc
y an
d am
plitu
de b
y ne
rve,
cen
tre,
sex
, age
gro
up a
nd s
ide
Age
Gro
up
Side
U
lnar
M
edia
n C
omm
on P
eron
eal
Uln
ar
Med
ian
Com
mon
Per
onea
l
D
ista
l MN
C la
tenc
y in
mse
c fo
r m
ale
subj
ects
in F
aiza
bad
Dis
tal M
NC
am
plitu
de in
mV
for
mal
e su
bjec
ts in
Fai
zaba
d �
30 y
rs
Rig
ht
19, 2
.4 (
0.4)
, 2.4
19
, 3.1
(0.
5), 3
.1
19, 3
.8 (
0.7)
, 3.7
19
, 14.
3 (2
.9),
14.0
19
, 15.
4 (3
.5),
15.9
19
, 9.5
(3.
8), 9
.3
L
eft
18, 2
.5 (
0.4)
, 2.6
18
, 3.1
(0.
4), 3
.0
18, 3
.6 (
0.7)
, 3.5
18
, 14.
8 (4
.4),
14.9
18
, 19.
2 (4
.2),
18.2
18
, 10.
4 (4
.5),
10.6
31-4
0 yr
s R
ight
19
, 2.5
(0.
3), 2
.5
20, 3
.4 (
0.3)
, 3.4
20
, 3.9
(0.
9), 3
.6
19, 1
4.5
(3.3
), 14
.1
20, 1
7.1
(3.8
), 17
.4
20, 8
.3 (
2.1)
, 7.9
Lef
t 19
, 2.6
(0.
3), 2
.6
19, 3
.4 (
0.3)
, 3.4
20
, 3.6
(0.
6), 3
.4
19, 1
4.3
(2.7
), 14
.9
19, 1
8.6
(4.3
), 18
.3
20, 8
.3 (
2.2)
, 8.0
41
-50
yrs
Rig
ht
19, 2
.5 (
0.3)
, 2.5
19
, 3.2
(0.
4), 3
.3
19, 3
.6 (
0.8)
, 3.5
19
, 12.
7 (3
.5),
11.7
19
, 16.
4 (4
.0),
15.9
19
, 7.5
(2.
8), 7
.0
L
eft
19, 2
.5 (
0.3)
, 2.5
18
, 3.2
(0.
3), 3
.3
18, 3
.3 (
0.5)
, 3.3
19
, 12.
9 (3
.2),
13.1
18
, 17.
9 (4
.2),
18.4
18
, 7.2
(2.
9), 7
.0
51-6
0 yr
s R
ight
20
, 2.7
(0.
4), 2
.8
20, 3
.3 (
0.5)
, 3.3
20
, 3.9
(1.
1), 3
.6
20, 1
2.8
(4.0
), 13
.7
20, 1
4.8
(4.2
), 14
.5
20, 6
.0 (
3.0)
, 5.7
Lef
t 20
, 2.7
(0.
4), 2
.6
19, 3
.2 (
0.3)
, 3.3
19
, 3.6
(0.
5), 3
.4
20, 1
2.0
(3.7
), 11
.6
19, 1
5.0
(2.9
), 15
.6
19, 6
.8 (
2.5)
, 7.4
D
ista
l MN
C la
tenc
y in
mse
c fo
r fe
mal
e su
bjec
ts in
Fai
zaba
d D
ista
l MN
C a
mpl
itude
in m
V fo
r fe
mal
e su
bjec
ts in
Fai
zaba
d �
30 y
rs
Rig
ht
21, 2
.5 (
0.4)
, 2.4
21
, 3.0
(0.
4), 3
.0
21, 3
.5 (
0.5)
, 3.4
21
, 15.
0 (3
.4),
14.6
21
, 17.
6 (4
.2),
16.4
21
, 9.9
(2.
6), 1
0.5
L
eft
21, 2
.4 (
0.4)
, 2.4
21
, 3.1
(0.
5), 3
.1
21, 3
.3 (
0.7)
, 3.3
21
, 16.
0 (3
.9),
15.6
21
, 18.
3 (5
.3),
18.5
21
, 9.0
(3.
3), 9
.0
31-4
0 yr
s R
ight
20
, 2.3
(0.
4), 2
.3
20, 3
.0 (
0.4)
, 3.0
20
, 3.2
(0.
5), 3
.1
20, 1
4.8
(3.9
), 13
.6
20, 1
9.4
(3.4
), 20
.1
20, 7
.3 (
2.3)
, 7.6
Lef
t 20
, 2.4
(0.
3), 2
.3
20, 3
.0 (
0.4)
, 3.0
20
, 3.1
(0.
5), 3
.1
20, 1
4.8
(3.3
), 14
.9
20, 1
8.2
(4.3
), 18
.7
20, 7
.5 (
3.0)
, 6.7
41
-50
yrs
Rig
ht
21, 2
.4 (
0.4)
, 2.4
21
, 3.0
(0.
5), 2
.9
20, 3
.5 (
0.6)
, 3.4
21
, 14.
9 (2
.7),
15.0
21
, 16.
4 (4
.3),
16.2
20
, 7.8
(2.
9), 7
.5
L
eft
21, 2
.4 (
0.3)
, 2,4
21
, 3.1
(0.
5), 3
.0
20, 3
.2 (
0.4)
, 3.1
21
, 14.
2 (3
.2),
13.9
21
, 17.
6 (3
.9),
17.5
20
, 8.4
(2.
6), 8
.8
51-6
0 yr
s R
ight
18
, 2.5
(0.
4), 2
.6
18, 3
.3 (
0.6)
, 3.3
18
, 3.3
(0.
7), 3
.1
18, 1
3.6
(2.2
), 13
.6
18, 1
4.5
(3.6
), 14
.0
18, 7
.4 (
3.2)
, 7.8
Lef
t 18
, 2.4
(0.
3), 2
.5
18, 3
.3 (
0.4)
, 3.4
17
, 3.3
(0.
6), 3
.4
18, 1
3.4
(3.2
), 13
.5
18, 1
3.9
(4.3
), 15
.0
17, 7
.2 (
2.9)
, 6.2
D
ista
l MN
C la
tenc
y in
mse
c fo
r m
ale
subj
ects
in N
aini
D
ista
l MN
C a
mpl
itude
in m
V fo
r m
ale
subj
ects
in N
aini
�
30 y
rs
Rig
ht
20, 2
.8 (
0.5)
, 2.9
19
, 3.5
(0.
6), 3
.4
19, 4
.5 (
0.8)
, 4.4
20
, 18.
6 (3
.2),
18.4
19
, 21.
4 (5
.1),
22.0
19
, 11.
3 (3
.7),
10.0
Lef
t 19
, 2.8
(0.
5), 2
.8
19, 3
.6 (
0.7)
, 3.7
20
, 4.5
(0.
9), 4
.5
19, 1
9.8
(2.6
), 19
.3
19, 2
0.0
(4.9
), 21
.2
20, 1
0.9
(5.2
), 10
.7
31-4
0 yr
s R
ight
19
, 2.7
(0.
5), 2
.6
19, 3
.5 (
0.7)
, 3.5
19
, 4.4
(1.
2), 4
.3
19, 1
7.1
(3.5
), 17
.0
19, 1
7.3
(5.0
), 16
.6
19, 9
.4 (
3.6)
, 8.7
Lef
t 19
, 2.7
(0.
5), 2
.7
19, 3
.4 (
0.6)
, 3.3
18
, 4.0
(0.
9), 4
.0
19, 1
7.8
(4.0
), 16
.7
19, 1
7.9
(5.0
), 18
.5
18, 9
.8 (
3.1)
, 8.9
41
-50
yrs
Rig
ht
18, 2
.8 (
0.4)
, 3.0
18
, 3.5
(0.
4), 3
.5
18, 4
.3 (
1.1)
, 3.9
18
, 17.
5 (4
.5),
17.0
18
, 17.
4 (6
.3),
16.1
18
, 7.8
(3.
8), 7
.4
L
eft
18, 2
.8 (
0.5)
, 2.7
18
, 3.5
(0.
6), 3
.5
17, 3
.9 (
1.1)
, 4.1
18
, 16.
8 (3
.3),
15.4
18
, 16.
9 (7
.1),
16.1
17
, 8.2
(2.
6), 8
.1
51-6
0 yr
s R
ight
20
, 2.8
(0.
5), 2
.7
21, 3
.8 (
0.5)
, 3.8
20
, 4.0
(0.
8), 4
.1
20, 1
5.2
(2.8
), 13
.9
21, 1
4.6
(4.6
), 14
.1
20, 8
.7 (
3.7)
, 8.2
Lef
t 21
, 2.8
(0.
3), 2
.8
21, 3
.8 (
0.5)
, 3.9
21
, 3.9
(1.
1), 3
.6
21, 1
7.0
(2.9
), 16
.8
21, 1
5.1
(3.3
), 15
.0
21, 8
.3 (
4.0)
, 7.9
D
ista
l MN
C la
tenc
y in
mse
c fo
r fe
mal
e su
bjec
ts in
Nai
ni
Dis
tal M
NC
am
plitu
de in
mV
for
fem
ale
subj
ects
in N
aini
�30
yrs
R
ight
24
, 2.6
(0.
5), 2
.6
22, 3
.3 (
0.5)
, 3.4
24
, 3.8
(0.
8), 3
.7
24, 1
9.0
(4.5
), 19
.7
22, 1
9.7
(5.2
), 18
.3
24, 1
0.8
(2.9
), 10
.4
L
eft
22, 2
.5 (
0.4)
, 2.4
23
, 3.3
(0.
5), 3
.2
24, 3
.8 (
0.8)
, 3.7
22
, 18.
7 (4
.4),
18.6
23
, 18.
6 (5
.1),
18.8
24
, 9.4
(3.
2), 8
.8
31-4
0 yr
s R
ight
19
, 2,5
(0.
5), 2
.5
17, 3
.3 (
0.6)
, 3.2
20
, 3.3
(0.
7), 3
.2
19, 2
0.1
(4.3
), 20
.5
17, 1
9.7
(6.2
), 19
.5
20, 9
.4 (
3.8)
, 7.8
Lef
t 19
, 2.6
(0.
6), 2
.6
18, 3
.4 (
0.7)
, 3.0
18
, 3.6
(0.
8), 3
.5
19, 2
0.9
(4.6
), 20
.2
18, 1
9.4
(5.9
), 18
.8
18, 9
.2 (
2.8)
, 9.1
41
-50
yrs
Rig
ht
17, 2
.6 (
0.4)
, 2.7
17
, 3.4
(0.
6), 3
.5
17, 3
.6 (
0.9)
, 3.6
17
, 17.
8 (3
.8),
17.0
17
, 16.
1 (3
.5),
15.6
17
, 8.1
(2.
3), 7
.6
L
eft
17, 2
.7 (
0.4)
, 2.7
17
, 3.5
(0.
5), 3
.5
16, 3
.7 (
1.0)
, 3.8
17
, 17.
9 (3
.1),
17.8
17
, 16.
9 (3
.5),
16.2
16
, 8.8
(3.
3), 7
.9
51-6
0 yr
s R
ight
17
, 2.7
(0.
4), 2
.7
17, 3
.5 (
0.5)
, 3.6
15
, 3.3
(0.
6), 3
.3
17, 1
7.7
(3.6
), 17
.3
17, 1
4.7
(4.1
), 14
.4
15, 7
.4 (
2.3)
, 7.5
Lef
t 17
, 2.6
(0.
4), 2
.5
17, 3
.6 (
0.6)
, 3.4
17
, 3.6
(0.
5), 3
.8
17, 1
5.6
(3.0
), 15
.0
17, 1
5.6
(3.7
), 15
.4
17, 7
.2 (
2.2)
, 7.2
47
Tab
le 3
A.
Nor
mal
ref
eren
ce v
alue
s fo
r se
nsor
y ne
rve
cond
ucti
on v
eloc
ity
and
ampl
itud
e fo
r fi
ve n
erve
s ba
sed
on th
e 95
th p
erce
ntile
, pre
sent
ed a
s m
id-p
oint
s of
fou
r 10
yea
r ag
e ba
nds
and
calc
ulat
ed b
y se
x, b
y ce
ntre
and
by
com
bine
d ce
ntre
s.
U
lnar
M
edia
n R
adia
l Cut
aneo
us
Sura
l
SN
CV
SN
AP
SN
CV
SN
AP
SNC
V
SNA
P SN
CV
SN
AP
in
m/s
ec
in μ
V
in m
/sec
in
μV
in
m/s
ec
in μ
V
in m
/sec
in
μV
M
F
M
F M
F
M
F M
F
M
F M
F
M
F
Faiz
abad
25 y
ears
48
.75
50.6
0 13
.31
12.5
2 45
.09
47.5
7 21
.45
18.7
7 52
.13
54.2
5 16
.87
16.2
7 45
.62
49.2
5 13
.73
11.7
2
35 y
ears
48
.20
50.1
4 11
.58
11.5
9 45
.32
46.0
5 18
.92
16.5
4 52
.41
54.3
4 15
.65
16.2
3 46
.88
50.7
7 11
.87
9.87
45 y
ears
47
.69
49.7
1 10
.01
10.7
5 45
.59
44.5
5 16
.54
14.4
7 52
.74
54.4
8 14
.54
16.2
4 48
.18
52.2
9 10
.30
8.20
55 y
ears
47
.21
49.3
2 8.
58
10.0
0 45
.91
43.0
8 14
.31
12.5
3 53
.14
54.6
9 13
.54
16.3
0 49
.51
53.8
2 8.
96
6.71
Nai
ni
25 y
ears
40
.58
44.1
1 14
.91
14.6
3 41
.51
44.9
3 12
.35
22.9
8 46
.10
46.5
2 16
.72
20.5
4 39
.92
40.5
3 8.
87
11.9
3
35 y
ears
41
.17
44.0
4 11
.61
12.9
2 42
.24
44.6
5 12
.84
19.4
6 47
.20
46.8
2 16
.23
18.6
8 40
.64
41.1
1 7.
54
10.7
4
45 y
ears
41
.80
44.0
0 8.
80
11.3
6 43
.03
44.4
1 10
.52
16.2
7 48
.39
47.1
6 15
.78
17.0
0 41
.41
41.7
2 6.
36
9.76
55 y
ears
42
.47
44.0
0 6.
40
9.95
43
.85
44.2
0 8.
39
13.3
7 49
.66
47.5
3 15
.37
15.4
7 42
.26
42.3
7 5.
31
8.94
Com
bine
d
25 y
ears
42
.88
45.8
9 14
.05
13.5
3 42
.48
45.3
1 17
.65
20.9
5 46
.96
47.9
9 16
.69
18.3
1 40
.36
42.0
5 10
.53
11.4
8
35 y
ears
43
.10
45.7
8 11
.55
12.2
7 43
.11
44.6
2 15
.17
18.1
0 45
.71
48.4
0 15
.88
17.3
2 41
.27
43.1
4 9.
03
9.96
45 y
ears
43
.33
45.6
9 9.
32
11.1
1 43
.76
43.9
4 12
.81
15.4
3 46
.78
48.8
3 15
.12
16.3
8 42
.22
44.2
6 7.
69
8.61
55 y
ears
43
.59
45.6
2 7.
34
10.0
3 44
.43
43.2
9 10
.58
12.9
4 47
.88
49.2
9 14
.43
15.4
9 43
.23
45.3
9 6.
50
7.42

Neurology Asia April 2010
48
Tab
le 3
B.
Nor
mal
ref
eren
ce v
alue
s fo
r pr
oxim
al m
otor
ner
ve c
ondu
ctio
n ve
loci
ty a
nd a
mpl
itud
e fo
r th
ree
nerv
es b
ased
on
the
95th
and
5th
per
cent
iles
resp
ecti
vely
, pre
sent
ed a
s m
id-p
oint
s of
fou
r 10
yea
r ag
e ba
nds
and
calc
ulat
ed b
y se
x, b
y ce
ntre
and
by
com
bine
d ce
ntre
s.
U
lnar
M
edia
n P
eron
eal
M
NC
V
CM
AP
M
NC
V
CM
AP
M
NC
V
CM
AP
in
m/s
ec
in m
V
in m
/sec
in
mV
in
m/s
ec
in m
V
M
F
M
F
M
F
M
F
M
F
M
F
Fai
zaba
d
25 y
ears
58
.25
58.0
4 8.
39
9.64
60
.12
58.0
7 10
.49
9.90
50
.48
52.8
2 4.
04
3.74
35 y
ears
55
.66
56.9
8 7.
66
9.17
57
.64
56.4
9 9.
52
8.85
48
.18
51.2
8 3.
39
3.28
45 y
ears
52
.96
55.9
5 6.
96
8.73
55
.15
54.9
3 8.
59
7.83
45
.99
49.8
7 2.
80
2.85
55 y
ears
50
.16
54.9
6 6.
28
8.32
52
.65
53.3
7 7.
71
6.85
43
.90
48.5
6 2.
26
2.45
Nai
ni
25 y
ears
55
.99
54.7
8 12
.04
11.9
6 54
.57
54.1
5 11
.26
10.8
7 51
.64
53.8
2 4.
41
4.92
35 y
ears
54
.36
53.2
4 11
.32
11.3
6 53
.61
53.3
8 10
.03
10.3
4 49
.34
52.3
5 3.
88
4.58
45 y
ears
52
.81
51.6
8 10
.66
10.7
9 52
.70
52.6
6 8.
92
9.87
47
.23
50.9
7 3.
40
4.28
55 y
ears
51
.36
50.1
0 10
.03
10.2
5 51
.84
51.9
9 7.
93
9.44
45
.29
49.6
6 2.
97
4.00
Com
bine
d
25 y
ears
56
.86
56.1
9 9.
54
10.2
8 56
.78
55.3
3 10
.88
10.2
2 50
.73
53.1
4 4.
17
4.24
35 y
ears
54
.81
55.0
3 8.
75
9.76
55
.16
54.3
1 9.
78
9.41
48
.49
51.6
6 3.
58
3.81
45 y
ears
52
.80
53.8
6 7.
99
9.26
53
.59
53.3
1 8.
75
8.64
46
.42
50.2
8 3.
04
3.41
55 y
ears
50
.82
52.7
0 7.
25
8.78
52
.07
52.3
4 7.
79
7.91
44
.51
48.9
8 2.
55
3.03

49
Tab
le 3
C.
Nor
mal
ref
eren
ce v
alue
s fo
r di
stal
mot
or n
erve
con
duct
ion
late
ncy
and
ampl
itud
e fo
r th
ree
nerv
es b
ased
on
the
5th o
r 95
th p
erce
ntile
s, p
rese
nted
as
mid
-poi
nts
of f
our
10 y
ear
age
band
s an
d ca
lcul
ated
by
sex,
by
cent
re a
nd b
y co
mbi
ned
cent
res.
U
lnar
M
edia
n P
eron
eal
C
MA
P
CM
AP
C
MA
P
CM
AP
C
MA
P
CM
AP
L
aten
cy i
n m
sec
Am
plit
ude
in m
V
Lat
ency
in
mse
c A
mpl
itud
e in
mV
L
aten
cy i
n m
sec
Am
plit
ude
in m
V
M
F
M
F
M
F
M
F
M
F
M
F
Fai
zaba
d
25 y
ears
2.
99
3.04
8.
91
10.4
2 3.
81
3.86
11
.23
11.4
7 5.
10
4.32
4.
85
4.09
35 y
ears
3.
05
3.06
8.
29
10.1
1 3.
85
3.93
10
.66
10.4
9 5.
10
4.31
4.
07
3.71
45 y
ears
3.
10
3.08
7.
70
9.81
3.
89
4.00
10
.12
9.54
5.
08
4.30
3.
36
3.35
55 y
ears
3.
15
3.09
7.
14
9.54
3.
92
4.07
9.
61
8.61
5.
06
4.28
2.
71
3.00
Nai
ni
25 y
ears
3.
57
3.39
13
.52
13.1
0 4.
47
4.28
11
.95
12.1
3 6.
31
5.15
4.
81
5.47
35 y
ears
3.
57
3.41
12
.89
12.5
2 4.
54
4.36
10
.68
11.3
6 6.
08
5.04
4.
29
5.01
45 y
ears
3.
56
3.43
12
.30
11.9
8 4.
61
4.43
9.
51
10.6
6 5.
85
4.92
3.
81
4.60
55 y
ears
3.
56
3.45
11
.77
11.4
6 4.
68
4.52
8.
44
10.0
2 5.
61
4.81
3.
37
4.22
Com
bine
d
25 y
ears
3.
33
3.25
10
.43
11.1
6 4.
23
4.11
11
.58
11.7
6 5.
91
4.81
4.
76
4.74
35 y
ears
3.
37
3.26
9.
67
10.7
2 4.
29
4.18
10
.65
10.8
8 5.
75
4.74
4.
12
4.30
45 y
ears
3.
40
3.28
8.
93
10.3
0 4.
35
4.25
9.
77
10.0
4 5.
60
4.66
3.
54
3.87
55 y
ears
3.
43
3.30
8.
21
9.91
4.
41
4.33
8.
93
9.26
5.
44
4.59
3.
00
3.47

Neurology Asia April 2010
50
Figure 1. Scatter plots of ulnar sensory nerve conduction amplitude and proximal and distal motor nerve conduction amplitude for normal subjects by age and by sex with 5th percentile based on combined centres plus shaded area highlighting the difference between centre-specifi c 5th percentiles.
Chart 1B
Chart 1C Chart 1D
Chart 1A
Chart 1E Chart 1F
Scatter plots and a full set of summary statistics, including additional 97.5th and 99th percentile, for all nerves and functions are available from the authors.
DISCUSSION
Conclusions based on NCS testing for neuropathy require comparison of individual results with established reference values. In this study we collected data from subjects representative of the

51
Tabl
e 4.
Pe
rcen
tage
impa
irm
ent r
ates
for
SNC
V, S
NA
P am
plitu
de, M
NC
V a
nd p
roxi
mal
and
dis
tal C
MA
P am
plitu
de a
nd la
tenc
y in
five
ner
ves a
mon
g 30
3 ne
wly
dia
gnos
ed
case
s of
MB
lepr
osy,
by
sex,
by
cent
re a
nd fo
r co
mbi
ned
cent
res.
U
lnar
M
edia
n R
adia
l Cut
aneo
us
Pero
neal
Su
ral
SN
CV
SN
AP
SNC
V
SNA
P SN
CV
SN
AP
SNC
V
SNA
P SN
CV
SN
AP
A
mpl
itude
A
mpl
itude
A
mpl
itude
A
mpl
itude
A
mpl
itude
M
F
M
F M
F
M
F M
F
M
F M
F
M
F M
F
M
F
Faiz
abad
36
.1
25.8
46
.2
33.3
19
.2
25.8
40
.4
30.3
40
.6
44.3
59
.4
62.9
53
.2
50.0
66
.7
62.5
Nai
ni
20.4
25
.6
45.4
32
.1
21.3
28
.2
31.3
34
.6
32.5
37
.3
59.2
61
.3
54.0
52
.0
65.1
72
.0
Com
bine
d 28
.9
25.0
45
.0
31.9
20
.5
26.4
35
.3
32.6
33
.8
39.3
58
.3
63.4
52
.2
51.7
65
.3
65.3
U
lnar
M
edia
n R
adia
l Cut
aneo
us
Pero
neal
Su
ral
M
NC
V
CM
AP
MN
CV
C
MA
P
M
NC
V
CM
AP
A
mpl
itude
A
mpl
itude
Am
plitu
de
M
F
M
F M
F
M
F M
F
M
F M
F
M
F M
F
M
F
Faiz
abad
36
.5
21.0
28
.4
17.7
25
.3
14.5
20
.5
19.4
22
.3
18.8
28
.4
28.1
Nai
ni
49.6
20
.5
39.6
29
.5
19.3
7.
7 26
.5
41.0
27
.2
26.0
42
.1
50.6
Com
bine
d 45
.6
22.1
27
.6
20.7
21
.9
12.9
24
.2
28.6
23
.5
22.0
35
.5
39.0
U
lnar
M
edia
n R
adia
l Cut
aneo
us
Pero
neal
Su
ral
C
MA
P C
MA
P M
NC
V
CM
AP
MN
CV
C
MA
P
Lat
ency
A
mpl
itude
L
aten
cy
Am
plitu
de
Lat
ency
A
mpl
itude
M
F
M
F M
F
M
F M
F
M
F M
F
M
F M
F
M
F
Faiz
abad
26
.0
12.9
17
.1
11.3
13
.0
17.8
17
.8
21.0
17
.7
22.2
31
.3
28.6
Nai
ni
17.5
16
.7
32.5
23
.1
11.8
10
.3
25.6
39
.7
11.9
10
.4
41.3
44
.2
Com
bine
d 21
.8
14.3
17
.6
14.3
14
.3
15.7
22
.7
31.4
16
.5
18.6
36
.6
37.1
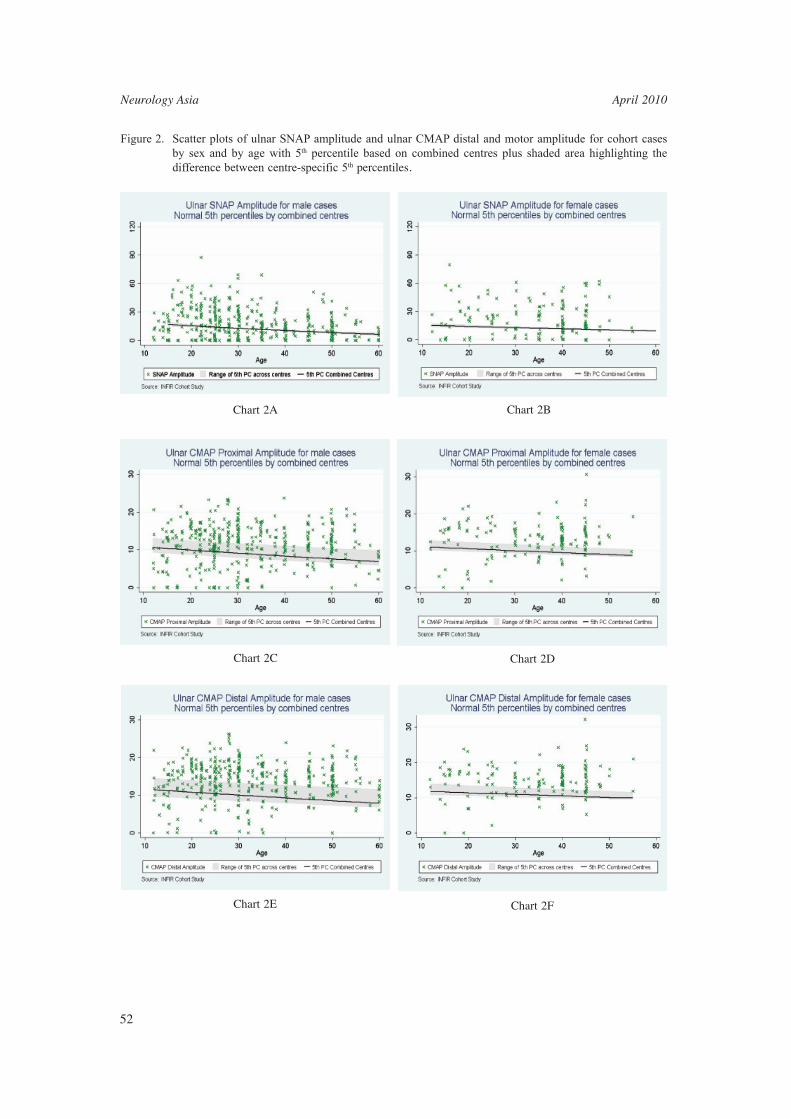
Neurology Asia April 2010
52
Figure 2. Scatter plots of ulnar SNAP amplitude and ulnar CMAP distal and motor amplitude for cohort cases by sex and by age with 5th percentile based on combined centres plus shaded area highlighting the difference between centre-specific 5th percentiles.
Chart 2BChart 2A
Chart 2C Chart 2D
Chart 2E Chart 2F

53
local population. To best defi ne the limits of normal nerve function, reference values were calculated to include adjustment for known covariates and centre-related differences. In the absence of left and right side differences, merging data from right and left side assessments gave greater precision in the estimation of the reference values at each test site. These may now be used to assess nerve function in individuals for whom peripheral nerve function is at risk. The mean values of SNAP amplitude and SNCV and proximal and distal CMAP latency and amplitude and MNCV in the present study correspond well with previous studies.16,17 The sources and implications of differences between centres have been discussed in the earlier papers in this series.14,,15
Reference values based on percentiles were derived by regression-based methods, and are not therefore directly comparable with earlier published work defi ning abnormality as two or greater standard deviations from the mean. Like many diagnostic tools with moderate sensitivity and specifi city, it is advised that values “close” to the published reference value are not necessarily an indication of abnormality.18 However, a progression towards and beyond the reference value represents a new stage in nerve involvement that is likely to be of clinical importance. Skin temperatures recorded in Faizabad ranged from 28.0˚C to 36.9˚C for hands and from 23.0˚C to 36.4˚C for the foot. The equivalent in Naini were 24.0˚C to 36.1˚C and 18.0˚C to 35.0˚C. In addition to the standard temperature correction we carried out a series of analyses exploring any remaining relationship between skin temperature and amplitude and velocity. In all nerves and test sites for both sensory and motor nerve conduction we found skin temperature to be predictive of amplitude (p<0.001 in each case). We also looked for any continuing association between skin temperature and temperature-adjusted measures of SNCV, MNCV, and SNAP and CMAP amplitudes and latencies. While signifi cance levels were generally lower, we found statistically signifi cant temperature-related variation in all measures. The suggestion from these fi ndings is that the chosen approach to temperature adjustment was only partially successful in removing the temperature effect. In a smaller study this effect may not have been detectable. Further analysis of the present data may identify a more sensitive method of adjustment. The reference values reported here were used to assess the nerve status of newly diagnosed cases of multibacillary leprosy recruited to the Cohort
study. In relation to sensory nerve conduction our fi ndings match those of Arruda et al19 who found high rates of abnormality in sural nerve sensory action potential while conduction velocity was only mildly involved. Our fi ndings also reinforce those of Husain and Malaviya20 who compared patients with and without manifest nerve damage and found reduced nerve conduction velocities and changes in latency and amplitude. Changes in sensory nerve conduction were most pronounced. We found high impairment rates in lower limbs and also in the radial cutaneous nerve. Soysal et al21, working in Turkey, used nerve conduction to assess a series of newly-diagnosed leprosy patients. They found that sensory impairment predominated over motor and identifi ed predominantly axonal polyneuropathy that was more severe in the lower extremities. Sensory nerve damage was accompanied by autonomic involvement. Together with the level of impaired function observed in the leprosy cohort, these fi ndings raise issues concerning treatment of these early indicators of nerve involvement and the choice of an appropriate treatment regime. In conclusion, this is the fi rst large-scale study to publish reference values for a full set of nerve conduction parameters for a normal population in northern India. The reference values represent the limit to normal assessments for sensory and motor nerve conduction velocity and amplitude by sex and within 4 ten year age bands. While the research was conducted in preparation for a prospective study of people affected by leprosy, the data have potential applications in the assessment of nerve function in a wide range of neurological conditions. Applying these reference values to the data from the leprosy cohort draws attention to the high rates of impaired function among people affected by leprosy. Further analysis of the Cohort data will determine whether the presence of such impairment at diagnosis is a risk factor for the development of new impairment detectable by monofilament or muscle testing during and subsequent to treatment with multi-drug therapy. Questions also arise about the need for early treatment and the choice of an appropriate treatment regime.
ACKNOWLEDGEMENTS
We are grateful to the people who agreed to participate as subjects in the research reported here. The staff at the TLM hospitals in Naini and Faizabad have been invaluable. We also gratefully
Neurology Asia April 2010
54
acknowledge the fi nancial support of Follereau Luxembourg, LEPRA UK and The Leprosy Mission International, without which this study would have been impossible. We wish to thank the staff of the LEPRA offi ces in Hyderabad and Colchester and the TLM offi ces in Delhi and London for their administrative support. The INFIR Cohort Study is a result of extensive collaboration between Fondation Luxembourgeoise Raoul Follereau (FL), LEPRA UK, LEPRA India, The Leprosy Mission International (TLMI), The Leprosy Mission India, the London School of Hygiene & Tropical Medicine and Aberdeen University Department of Public Health.
REFERENCES
1. Dorfman LJ, Robinson LR. AAEM minimonograph #47: normative data in electrodiagnostic medicine. ff. Muscle Nerve 1997; 20(1):4-14.
2. Tong HC, Werner RA, Franzblau A. Effect of aging on sensory nerve conduction study parameters. Muscle Nerve 2004; 29(5):716-20.
3. Dyck PJ, Davies JL, Litchy WJ, et al. Longitudinal assessment of diabetic polyneuropathy using a composite score in the Rochester Diabetic Neuropathy Study cohort. Neurology1997; 49(1):229-39.
4. Wang SH, Robinson LR. Considerations in reference values for nerve conduction studies. Phys Med Rehabil Clin N Am 1998; 9(4):907-23, viii.
5. Van Brakel WH, Anderson AM, Withington SG, et al. The prognostic importance of detecting mild sensory impairment in leprosy: a randomized controlled trial (TRIPOD 2). Lepr Rev 2003; 74(4):300-10.
6. Van Brakel WH, Nicholls PG, Das L, et al. The INFIR Cohort Study: assessment of sensory and motor neuropathy in leprosy at baseline. Lepr Rev 2005; 76:277-95.
7. van Brakel WH, Nicholls PG, Das L, et al., The INFIR Cohort Study: investigating prediction, detection and pathogenesis of neuropathy and reactions in leprosy. Methods and baseline results of a cohort of multibacillary leprosy patients in north India.[erratum appears in Lepr Rev 2005; 76(3):264]. Lepr Rev 2005; 76(1):14-34.
8. Roberts AE, Nicholls PG, Maddali P, van Brakel WH. Ensuring inter-tester reliability of voluntary muscle and monofi lament sensory testing in the INFIR Cohort Study. Lepr Rev 2007; 78(2):122-30.
9. Suresh M, Nicholls PG, Das L, Van Brakel WH. Voluntary muscle testing and dynamometry in diagnosis of motor impairment in leprosy: a comparative study within the INFIR Cohort Study. Lepr Rev 2008; 79:277-94.
10. Van Brakel WH, Nicholls PG, Wilder-Smith EP, et al. Early Diagnosis of Neuropathy in Leprosy—Comparing Diagnostic Tests in a Large Prospective Study (the INFIR Cohort Study). PLoS Neglected Tropical Diseases 2008. e212. doi:10.1371/journal.pntd.0000212.
11. Van Brakel W, Nicholls PG, Loretta Das et al. The INFIR Cohort Study: investigating prediction, detection and pathogenesis of neuropathy and reactions in leprosy. Methods and baseline results of a cohort of multibacillary leprosy patients in north India. Lepr Rev 2005; 76(1): 14-34.
12. DeLisa JA, Hang JL, Baran EM et al. Temperature effects on nerve conduction velocities and latencies. Manual of nerve conduction velocity and clinical neurophysiology. Raven, New York, 1994:1–21.
13. Dyck PJ, O’Brien PC, Litchey WJ et al., et al. Use of percentiles and normal deviates to express nerve conduction and other test abnormalities. Muscle Nerve 2001; 24(3): 307-10.
14. Nicholls PG, McKnight J, Das Loretta, Desikan KV, Lockwood DNJ, Wilder-Smith EP, van Brakel WH. Reference values for nerve function assessments among a study population in northern India – I: Vibration Perception Thresholds. Neurol Asia 2009; 14(2):129-39.
15. McKnight JM, Nicholls PG, Das Loretta, Desikan KV, Lockwood DNJ, Wilder-Smith EP, van Brakel WH. Reference values for nerve function assessments among a study population in northern India – II: Thermal Sensation Thresholds. Neurol Asia 2010; 15(1):27-38.
16. Løseth S, Nebuchennykh M, Stålberg E,, et al. Medial plantar nerve conduction studies in healthy controls and diabetics. Clin Neurophysiol 2007; 118(5): 1155-61.
17. Awang MS, Abdullah JM, Abdullah MR, et al. Nerve conduction study of healthy Asian Malays: The infl uence of age on median, ulnar, and sural nerves. Med Sci Monit 2007; 13(7): CR330-2.
18. Robinson LR, Temkin NR, Fujimoto WY, et al. Effect of statistical methodology on normal limits in nerve conduction studies. Muscle Nerve 1991; 14(11):1084-90.
19. Arruda APM, Marques W Jr, Foss NT, et al. Near nerve potential of sural nerve in leprosy. Arq Neuropsiquiatr 2004; 62(3A):571-4.
20. Husain S, Malaviya GN. Early nerve damage in leprosy: an electrophysiological study of ulnar and median nerves in patients with and without clinical neural defi cits. Neurol India 2007; 55(1):22-6.
21. Soysal A, Atay T, Ozu T, et al. Electrophysiological evaluation of peripheral and autonomic involvement in leprosy. Can J Neurol Sci 2004; 31(3):357-62.