reforesting des moines project design document
TRANSCRIPT

[email protected]| 999 Third Avenue #4600, Seattle, WA 98104 | www.cityforestcredits.org
Copyright © 2018-2020 City Forest Credits. All rights reserved.
P a g e | 1
GROWING FUTURES. GROWING TREES – DES MOINES, IA
Project Design Document
TABLE OF CONTENTS
Project Overview ........................................................................................................................................ 2
Location and Ownership of Project Area .................................................................................................... 2
Planting Design .......................................................................................................................................... 4
Monitoring and Reporting Plans ................................................................................................................. 4
Carbon and Co-Benefits Quantification Documentation ............................................................................ 5

Copyright © 2018-2020 City Forest Credits. All rights reserved.
P a g e | 2
PROJECT OVERVIEW
Basic Project Details
Project Name: Growing Futures. Growing Trees – Des Moines, IA
Type: Planting
Project Location (property name and city, town, or jurisdiction): Des Moines, IA; Polk County, IA
Project Operator Name: Trees Forever
Project Description
Include details of where the project will take place, how many trees will be planted, what type of
planting, partners, overall project goals, and any other relevant information.
Tree planting projects for the Growing Futures project occurred throughout the City of Des Moines. Tree
planting locations were a mix of street tree and park plantings, but with the major focus on street tree
plantings.
Tree planting totals for the 2019 season are: 734 trees, combination of overstory, understory.
Trees Forever is under contract with the City of Des Moines to plant the city’s trees and works with the forestry department to target tree plantings. The main project goals were to increase tree equity across
the city by targeting trees to under-resourced neighborhoods, working with volunteers to plant trees,
and to complete major street corridor plantings.
Trees Forever worked closely with Microsoft and the City of Des Moines on all aspects of the planting.
Support from these two entities allowed Trees Forever to employ Growing Futures teen employees to
water the newly planted trees throughout the summer and fall months. The overarching goals of these
tree planting projects are to:
Grow leaders by employing and training young people
In Iowa, the highest rates of unemployment are among young people, age 16-19, at rates of 16.5% and
African-American and Hispanic youth experiencing unemployment rates of 14.8% and 9%, respectively.
Grow more beautiful, greener communities and neighborhoods
As trees grow and thrive because of the care they receive from Growing Futures youth, the trees will
improve resident’s quality-of-life.
Grow more trees in underserved communities
Research shows a large discrepancy in tree cover between high- and low-income neighborhoods. We
must ensure there is equitable distribution of tree benefits to all neighborhoods in our community.
Deliver quantified environmental benefits
Working with City Forest Credits, our Growing Futures projects will deliver quantified and reportable
CO2 sequestration, stormwater reductions, energy savings, and air quality improvements.

Copyright © 2018-2020 City Forest Credits. All rights reserved.
P a g e | 3
LOCATION AND OWNERSHIP OF PROJECT AREA (Section 1.3, 2)
Location Eligibility
Project Areas must be located in parcels within or along the boundary of at least one of the following
criteria. Describe how the Project Area(s) meet the location criteria.
A) The Urban Area boundary (“Urban Area”), defined by the most recent publication of the United States Census Bureau
B) The boundary of any incorporated city or town created under the law of its state;
C) The boundary of any unincorporated city, town, or unincorporated urban area created or
designated under the law of its state;
D) The boundary of land owned, designated, and used by a municipal or quasi-municipal entity such
as a utility for source water or water shed protection;
E) A transportation, power transmission, or utility right of way, provided the right of way begins,
ends, or passes through some portion of A through D above.
Ownership Eligibility
Project Operator must demonstrate ownership of property and eligibility to receive potential credits by
meeting at least one of the following:
A) Own the land, the trees, and potential credits upon which the Project trees are located; or
B) Own an easement or equivalent property interest for a public right of way within which Project
trees are located, own the Project trees and credits within that easement, and accept ownership
of those Project trees by assuming responsibility for maintenance and liability for them; or
C) Have a written and signed agreement from the landowner granting ownership to the Project
Operator of any credits for carbon storage or other benefits delivered by Project trees on that
landowner’s land. If Project trees are on private property, this agreement must be recorded in the property records of the county in which the land containing Project trees is located.
Project Area Location
Describe where the Project Area is located and how it meets the location criteria.
All planting projects fell within the Urban Area boundary of the City of Des Moines.
Project Area Ownership and Right to Receive Credits
Describe the property ownership and include relevant documentation including title/filename as an
attachment (Declaration of Land Ownership or Agreement from Owner to Transfer Credits.)
All tree plantings occurred on City of Des Moines owned property – along city streets and within city
parks. The credits generated will be donated back to the property owner. A signed Declaration of
Ownership and Issuance of Credits is on file at City Forest Credits.

Copyright © 2018-2020 City Forest Credits. All rights reserved.
P a g e | 4
Maps
Provide a detailed map of the Project Area. Also provide a map that shows the Project Area within the
context of relevant urban/town boundaries. Include title/filename of relevant attachments.
1) Map of Project Area
2019 Trees Forever Project Area Map.JPEG
2) Regional-scale map of Project Area
2019 Trees Forever Regional Scale Map.JPEG
Additional Notes
PLANTING DESIGN
Describe planting design. Will the trees be planted as scattered single trees, clustered groups like parks
plantings, or as riparian plantings (closely spaced with high expected mortality)?
Describe your data collection on Project Trees. For example, Project Operator can use the data collection
sheet contained in the CFC quantification tool or your own method.
Trees were planted along city streets and city parks. Due to this planting type, there is a combination of
scattered single trees – either along a linear stretch of road or single tree plantings in the right-of-way in
front of a residential property around the city, and some cluster park plantings.
All trees are mapped utilizing the City of Des Moines mapping software – TreeKeeper from Davey
Resource Group. Mapping includes latitude and longitude of each tree, species, tree health information,
and more. Trees are also entered into CFCs quantification tool.
MONITORING AND REPORTING PLANS
Project Operator is required to submit an annual monitoring report. The report must contain any
changes in eligibility status of the Project Operator and any significant tree loss. Confirm and describe
your plans for annual monitoring of this project.
Trees Forever will submit annual monitoring reports containing the required information using the
template provided by City Forest Credits.

Copyright © 2018-2020 City Forest Credits. All rights reserved.
P a g e | 5
CARBON AND CO-BENEFITS QUANTIFICATION DOCUMENTATION (Section 12 and Appendix B)
Describe which quantification approach you anticipate using. When requesting credits after planting or
in Years 4 or 6, attach one of the three documents below and provide the data you have collected for
Project Trees.
1) Single Tree Quantification Tool
2) Canopy Quantification Tool
3) Riparian Quantification with CO2 calculated per acre
If your project is a riparian planting, provide the following:
• General location of plantings on a map
• Most common 4 or 5 species and numbers of trees to be planted
• Approximate number of trees per acre
• Total acreage planted
Trees Forever will use the single tree quantification tool provided by CFC. Pursuant to the single tree
quantification tool, this project is estimated to generate 1,574 creditable tonnes of CO2. We request
issuance of 10% of that total after third-party verification.
ADDITIONAL INFORMATION (OPTIONAL)
Include additional noteworthy aspects of the project. Examples include collaborative partnerships,
community engagement, or project investors.
This tree planting project was a unique combination of tree plantings combined with youth employment
and volunteer engagement. With support from Microsoft and the City of Des Moines, 734 trees were
planted in the 2019 planting season. All trees planted enter into a two year watering cycle where
Growing Futures teen employees will be paid to water the trees throughout the summer months. This
will help to ensure establishment of the young trees and long-term survival.
The following are accomplishments of this planting project:
• 734 trees planted
• 8,538 individual trees watered
• 49 Growing Futures teenagers and 9 young adult crew leaders employed
• 408 volunteers engaged in tree plantings giving 1,436 hours valued at $33,616

2
3
4
5
6
7
8
9
10
11
12
13
14
15
16
17
18
19
20
B C D E F G H I J
Directions
Mortality Deduction (%): 10%
10% 40% 30%
No. Sites
Planted
No. Live
Trees
Mortality
Deduction
(%)
25-yr CO2 stored
(kg/tree)
Tot. 25-yr CO2
stored w/ losses
and 5% deduction
(t)
10% CO2 (t) 40% CO2 (t) 30% CO2 (t)
BDL 359 323 0.10 3,978.85 1221.3 122.13 488.52 366.39
BDM 86 77 0.10 2,451.33 180.2 18.02 72.10 54.07
BDS 289 260 0.10 700.27 173.0 17.30 69.21 51.91
BEL 0 0 0.10 0.00 0.0 0.00 0.00 0.00
BEM 0 0 0.10 0.00 0.0 0.00 0.00 0.00
BES 0 0 0.10 0.00 0.0 0.00 0.00 0.00
CEL 0 0 0.10 0.00 0.0 0.00 0.00 0.00
CEM 0 0 0.10 0.00 0.0 0.00 0.00 0.00
CES 0 0 0.10 0.00 0.0 0.00 0.00 0.00
734 661 0.10 7,130.5 1574.6 157.46 629.83 472.37
Using the information you provide and background data, the tool calculates the amount of Credits that could be issued at years 1 (10%),
3 (40%) and 5 (30%) after planting. A mortality deductions (% loss) is applied to account for anticipated tree losses. A 5% buffer pool
deduction is applied that will go into a program-wide pool to insure against catastrophic loss of trees. This tool is used to determine
credits issued after planting. (Intial Crediting). A different tool is used for credit issuance in Years 4 and 6. The tool in those years
requires calculation of a sample and collection of data on tree status in the sample sites.
Table 3. Credits are based on 10%, 40% and 30% at Years 1, 3 and 5 after planting, respectively, of the projected CO2 stored by live
trees 25-years after planting. These values account for anticipated tree losses and the 5% buffer pool deduction.

1
2
3
4
5
6
7
8
9
10
11
12
13
14
15
16
17
18
19
20
21
A B C D E F
Table 10. Co-Benefits (avoided costs) per year after 25 years (live trees, includes tree losses)
Ecosystem Services
Res Units
Totals Res Unit/site Total $ $/site
Rainfall Interception (m3/yr) 3,841.84 5.23 $27,503.98 $37.471
CO2 Avoided (t, $20/t/yr) 93.20 0.13 $1,864.06 $2.540
Air Quality (t/yr)
O3 0.0520 0.0001 $173.65 $0.237
NOx 0.0084 0.0000 $28.14 $0.038
PM10 0.0273 0.0000 $77.66 $0.106
Net VOCs 0.0350 0.0000 $289.63 $0.395
Air Quality Total 0.1228 0.0002 $569.08 $0.78
Energy (kWh/yr & kBtu/yr)
Cooling - Elec. 122,499.44 166.89 $9,297.71 $12.67
Heating - Nat. Gas 1,793,389.77 2,443.31 $17,458.17 $23.78
Energy Total ($/yr) $26,755.88 $36.45
Grand Total ($/yr) $56,693.00 $77.24
$1,417,324.91
Using the information you provide and background data, the tool provides estimates of co-
benefits after 25 years in Resource Units per year and $ per year.

Copyright © 2021 City Forest Credits. All rights reserved.
PERFORMANCE STANDARD BASELINE METHODOLOGY (APPENDIX D)
There is a second additionality methodology set out in the WRI GHG Protocol guidelines – the
Performance Standard methodology. This Performance Standard essentially allows the project
developer, or in our case, the developers of the protocol, to create a performance standard baseline
using the data from similar activities over geographic and temporal ranges.
The common perception, particularly in the United States, is that projects must meet a project specific
test. Project-specific additionality is easy to grasp conceptually. The 2014 Climate Action Reserve urban
forest protocol essentially uses project-specific requirements and methods.
However, the WRI GHG Protocol clearly states that either a project-specific test or a performance
standard baseline is acceptable.1 One key reason for this is that regional or national data can give a
more accurate picture of existing activity than a narrow focus on one project or organization.
Narrowing the lens of additionality to one project or one tree-planting entity can give excellent data on
that project or entity, which data can also be compared to other projects or entities (common practice).
But plucking one project or entity out of its regional or national context ignores all comparable regional
or national data. And that regional or national data may give a more accurate standard than data from
one project or entity.
By analogy: one pixel on a screen may be dark. If all you look at is the dark pixel, you see darkness. But
the rest of screen may consist of white pixels and be white. Similarly, one active tree-planting
organization does not mean its trees are additional on a regional basis. If the region is losing trees, the
baseline of activity may be negative regardless of what one active project or entity is doing.
Here is the methodology described in the WRI GHG Protocol to determine a Performance Standard
baseline, together with the application of each factor to urban forestry:
1 WRI GHG Protocol, Chapter 2.14 at 16 and Chapter 3.2 at 19.

Copyright © 2021 City Forest Credits. All rights reserved.
Table 2.1 Performance Standard Factors
The Performance Standard methodology approves of the use of data from many different baseline
candidates. In the case of urban forestry, those baseline candidates are other urban areas.2
As stated above, the project activity defined is obtaining an increase in urban trees. The best data to
show the increase in urban trees via urban forest project activities is national or regional data on tree
canopy in urban areas. National or regional data will give a more comprehensive picture of the relevant
activity (increase in urban trees) than data from one city, in the same way that a satellite photo of a city
shows a more accurate picture of tree canopy in a city than an aerial photo of one neighborhood. Tree
canopy data measures the tree cover in urban areas, so it includes multiple baseline candidates such as
city governments and private property owners. Tree canopy data, over time, would show the increase or
decrease in tree cover.
Data on Tree Canopy Change over Time in Urban Areas
The CFC quantitative team determined that there were data on urban tree canopy cover with a
temporal range of four to six years available from four geographic regions. The data are set forth below:
2 See Nowak, et al. “Tree and Impervious Cover Change in U.S. Cities,” Urban Forestry and Urban Greening, 11 (2012), 21-30
WRI Perf. Standard Factor As Applied to Urban Forestry
Describe the project activity Increase in urban trees
Identify the types of candidates Cities and towns, quasi-governmental entities
like utilities, watersheds, and educational
institutions, and private property owners
Set the geographic scope (a national scope is
explicitly approved as the starting point)
Could use national data for urban forestry, or
regional data
Set the temporal scope (start with 5-7 years
and justify longer or shorter)
Use 4-7 years for urban forestry
Identify a list of multiple baseline candidates Many urban areas, which could be blended
mathematically to produce a performance
standard baseline

Copyright © 2021 City Forest Credits. All rights reserved.
Table 2.2 Changes in Urban Tree Canopy (UTC) by Region (from Nowak and Greenfield, 2012, see
footnote 7)
City
Abs Change
UTC (%)
Relative Change
UTC (%)
Ann. Rate (ha
UTC/yr)
Ann. Rate (m2
UTC/cap/yr) Data Years
EAST
Baltimore, MD -1.9 -6.3 -100 -1.5 (2001–2005)
Boston, MA -0.9 -3.2 -20 -0.3 (2003–2008)
New York, NY -1.2 -5.5 -180 -0.2 (2004–2009)
Pittsburgh, PA -0.3 -0.8 -10 -0.3 (2004–2008)
Syracuse, NY 1.0 4.0 10 0.7 (2003–2009)
Mean changes -0.7 -2.4 -60.0 -0.3
Std Error 0.5 1.9 35.4 0.3
SOUTH
Atlanta, GA -1.8 -3.4 -150 -3.1 (2005–2009)
Houston, TX -3.0 -9.8 −890 -4.3 (2004–2009)
Miami, FL -1.7 -7.1 -30 -0.8 (2003–2009)
Nashville, TN -1.2 -2.4 -300 -5.3 (2003–2008)
New Orleans, LA -9.6 -29.2 −1120 -24.6 (2005-2009)
Mean changes -3.5 -10.4 -160.0 -7.6
Std Error 1.6 4.9 60.5 4.3
MIDWEST
Chicago, IL -0.5 -2.7 -70 -0.2 (2005–2009)
Detroit, MI -0.7 -3.0 -60 -0.7 (2005–2009)
Kansas City, MO -1.2 -4.2 -160 -3.5 (2003–2009)
Minneapolis, MN -1.1 -3.1 -30 -0.8 (2003–2008)
Mean changes -0.9 -3.3 -80.0 -1.3
Std Error 0.2 0.3 28.0 0.7
WEST
Albuquerque,
NM
-2.7 -6.6 -420 -8.3 (2006–2009)
Denver, CO -0.3 -3.1 -30 -0.5 (2005–2009)
Los Angeles, CA -0.9 -4.2 -270 -0.7 (2005–2009)
Portland, OR -0.6 -1.9 -50 -0.9 (2005–2009)
Spokane, WA -0.6 -2.5 -20 -1.0 (2002–2007)
Tacoma, WA -1.4 -5.8 -50 -2.6 (2001–2005)
Mean changes -1.1 -4.0 -140.0 -2.3
Std Error 0.4 0.8 67.8 1.2

Copyright © 2021 City Forest Credits. All rights reserved.
These data have been updated by Nowak and Greenfield.3 The 2012 data show that urban tree canopy is
experiencing negative growth in all four regions. The 2018 data document continued loss of urban tree
cover. Table 3 of the 2018 article shows data for all states, with a national loss of urban and community
tree cover of 175,000 acres per year during the study years of 2009-2014.
To put this loss in perspective, the total land area of urban and community tree cover loss during the
study years totals 1,367 square miles – equal to the combined land area of New York City, Atlanta,
Philadelphia, Miami, Boston, Cleveland, Pittsburgh, St. Louis, Portland, OR, San Francisco, Seattle, and
Boise.
Even though there may be individual tree planting activities that increase the number of urban trees
within small geographic locations, the performance of activities to increase tree cover shows a negative
baseline. The Drafting Group did not use negative baselines for the Tree Planting Protocol, but
determined to use baselines of zero.
Deployment of the Performance Standard baseline methodology for a City Forest Planting Protocol is
supported by conclusions that make sense and are anchored in the real world:
• With the data showing that tree loss exceeds gains from planting, new plantings are justified as
additional to that decreasing canopy baseline. In fact, the negative baseline would justify as
additional any trees that are protected from removal.
• Because almost no urban trees are planted now with carbon as a decisive factor, urban tree
planting done to sequester carbon is additional;
• Almost no urban trees are currently planted with a contractual commitment for monitoring.
Maintenance of trees is universally an intention, one that is frequently reached when budgets
are cut, as in the Covid-19 era. The 25-year commitment required by this Protocol is entirely
additional to any practice in place in the U.S. and will result in substantial additional trees
surviving to maturity;
• Because the urban forest is a public resource, and because public funding falls far short of
maintaining tree cover and stocking, carbon revenues will result in additional trees planted or in
maintenance that will result in additional trees surviving to maturity;
• Because virtually all new large-scale urban tree planting is conducted by governmental entities
or non-profits, or by private property developers complying with governmental regulations
(which would not be eligible for carbon credits under our protocol), and because any carbon
revenues will defray only a portion of the costs of tree planting, there is little danger of unjust
enrichment to developers of city forest carbon projects.
3 Nowak et al. 2018. “Declining Urban and Community Tree Cover in the United States,” Urban Forestry and Urban Greening,
32, 32-55

Copyright © 2021 City Forest Credits. All rights reserved.
Last, The WRI GHG Protocol recognizes explicitly that the principles underlying carbon protocols need to
be adapted to different types of projects. The WRI Protocol further approves of balancing the stringency
of requirements with the need to encourage participation in desirable carbon projects:
Setting the stringency of additionality rules involves a balancing act. Additionality criteria that are too
lenient and grant recognition for “non-additional” GHG reductions will undermine the GHG program’s
effectiveness. On the other hand, making the criteria for additionality too stringent could unnecessarily
limit the number of recognized GHG reductions, in some cases excluding project activities that are truly
additional and highly desirable. In practice, no approach to additionality can completely avoid these
kinds of errors. Generally, reducing one type of error will result in an increase of the other. Ultimately,
there is no technically correct level of stringency for additionality rules. GHG programs may decide based
on their policy objectives that it is better to avoid one type of error than the other.4
The policy considerations weigh heavily in favor of “highly desirable” planting projects to reverse tree
loss for the public resource of city forests.
4 WRI GHG Protocol, Chapter 3.1 at 19.
QUANTIFYING CARBON DIOXIDE STORAGE AND CO-BENEFITS FOR URBAN TREE PLANTING
PROJECTS (Appendix B)
Introduction
Ecoservices provided by trees to human beneficiaries are classified according to their spatial scale as
global and local (Costanza 2008) (citations in Part 1 are listed in References at page 16). Removal of
carbon dioxide (CO2) from the atmosphere by urban forests is global because the atmosphere is so well-
mixed it does not matter where the trees are located. The effects of urban forests on building energy
use is a local-scale service because it depends on the proximity of trees to buildings. To quantify these
and other ecoservices City Forest Credits (CFC) has relied on peer-reviewed research that has combined
measurements and modeling of urban tree biomass, and effects of trees on building energy use, rainfall
interception, and air quality. CFC has used the most current science available on urban tree growth in its
estimates of CO2 storage (McPherson et al., 2016a). CFC’s quantification tools provide estimates of co-
benefits after 25 years in Resource Units (i.e., kWh of electricity saved) and dollars per year. Values for
co-benefits are first-order approximations extracted from the i-Tree Streets (i-Tree Eco) datasets for
each of the 16 U.S. reference cities/climate zones (https://www.itreetools.org/tools/i-tree-eco) (Maco
and McPherson, 2003). Modeling approaches and error estimates associated with quantification of CO2
storage and co-benefits have been documented in numerous publications (see References below) and
are summarized here.
Carbon Dioxide Storage
There are three different methods for quantifying carbon dioxide (CO2) storage in urban forest carbon
projects:
• Single Tree Method - planted trees are scattered among many existing trees, as in street, yard,
some parks, and school plantings, individual trees are tracked and randomly sampled
• Clustered Parks Planting Method - planted trees are relatively contiguous in park-like settings
and change in canopy is tracked
• Canopy Method – trees are planted very close together, often but not required to be in riparian
areas, significant mortality is expected, and change in canopy is tracked. The two main goals are
to create a forest ecosystem and generate canopy
• Area Reforestation Method – large areas are planted to generate a forest ecosystem, for
example converting from agriculture and in upland areas. This quantification method is under
development
In all cases, the estimated amount of CO2 stored 25-years after planting is calculated. The forecasted
amount of CO2 stored during this time is the value from which the Registry issues credits in the amounts
of 10%, 40% and 30% at Years 1, 4, and 6 after planting, respectively. A 20% mortality deduction is
applied before calculation of Year 1 Credits in the Single Tree and Clustered Parks Planting Methods. A
5% buffer pool deduction is applied in all three methods before calculation of any crediting, with these
funds going into a program-wide pool to insure against catastrophic loss of trees. At the end of the
project, in year 25, Operators will receive credits for all CO2 stored, minus credits already issued.
In the Single Tree Method, the amount of CO2 stored in project trees 25-years after planting is calculated
as the product of tree numbers and the 25-year CO2 index (kg/tree) for each tree-type (e.g., Broadleaf
Deciduous Large = BDL). The Registry requires the user to apply a 20% tree mortality deduction before
Copyright © 2021 City Forest Credits. All rights reserved.

calculation of Year 1 Credits. Year 4 and Year 6 Credits depend on sampling and mortality data. A 5%
buffer pool deduction is applied as well before calculation at any stage.
In the Clustered Parks Planting Method, the amount of CO2 stored after 25-years by planted project
trees is based on the anticipated amount of tree canopy area (TC). Because different tree-types store
different amounts of CO2 based on their size and wood density, TC is weighted based on species mix.
The estimated amount of TC area occupied by each tree-type is the product of the total TC and each
tree-type’s percentage TC. This calculation distributes the TC area among tree-types based on the
percentage of trees planted and each tree-type’s crown projection area. Subsequent calculations reduce
the amount of CO2 estimated to be stored after 25 years based on the 20% anticipated mortality rate
and the 5% buffer pool deduction.
In the Canopy Method, the forecasted amount of CO2 stored at 25-years is the product of the amount
of TC and the CO2 Index (CI, t CO2 per acre). This approach recognizes that forest dynamics for riparian
projects are different than for park projects. In many cases, native species are planted close together
and early competition results in high mortality and rapid canopy closure. Unlike urban park plantings,
substantial amounts of carbon can be stored in the riparian understory vegetation and forest floor. To
provide an accurate and complete accounting, we use the USDA Forest Service General Technical Report
NE-343, with biometric data for 51 forest ecosystems derived from U.S. Forest Inventory and
Assessment plots (Smith et al., 2006). The tables provide carbon stored per hectare for each of six
carbon pools as a function of stand age. We use values for 25-year old stands that account for carbon in
down dead wood and forest floor material, as well as the understory vegetation and soil. If local plot
data are provided, values for live wood, dead standing and dead down wood are adjusted following
guidance in GTR NE-343. More information on methods used to prepare the tables and make
adjustments can be found in Smith et al., 2006. See Attachment A at the end of this Appendix for more
information on the Canopy Method.
Source Materials for Single Tree Method and Clustered Parks Planting Methods
Estimates of stored (amount accumulated over many years) and sequestered CO2 (i.e., net amount
stored by tree growth over one year) are based on the U.S. Forest Service’s recently published technical
manual and the extensive Urban Tree Database (UTD), which catalogs urban trees with their projected
growth tailored to specific geographic regions (McPherson et al. 2016a, b). The products are a
culmination of 14 years of work, analyzing more than 14,000 trees across the United States. Whereas
prior growth models typically featured only a few species specific to a given city or region, the newly
released database features 171 distinct species across 16 U.S. climate zones. The trees studied also
spanned a range of ages with data collected from a consistent set of measurements. Advances in
statistical modeling have given the projected growth dimensions a level of accuracy never before seen.
Moving beyond just calculating a tree’s diameter or age to determine expected growth, the research
incorporates 365 sets of tree growth equations to project growth.
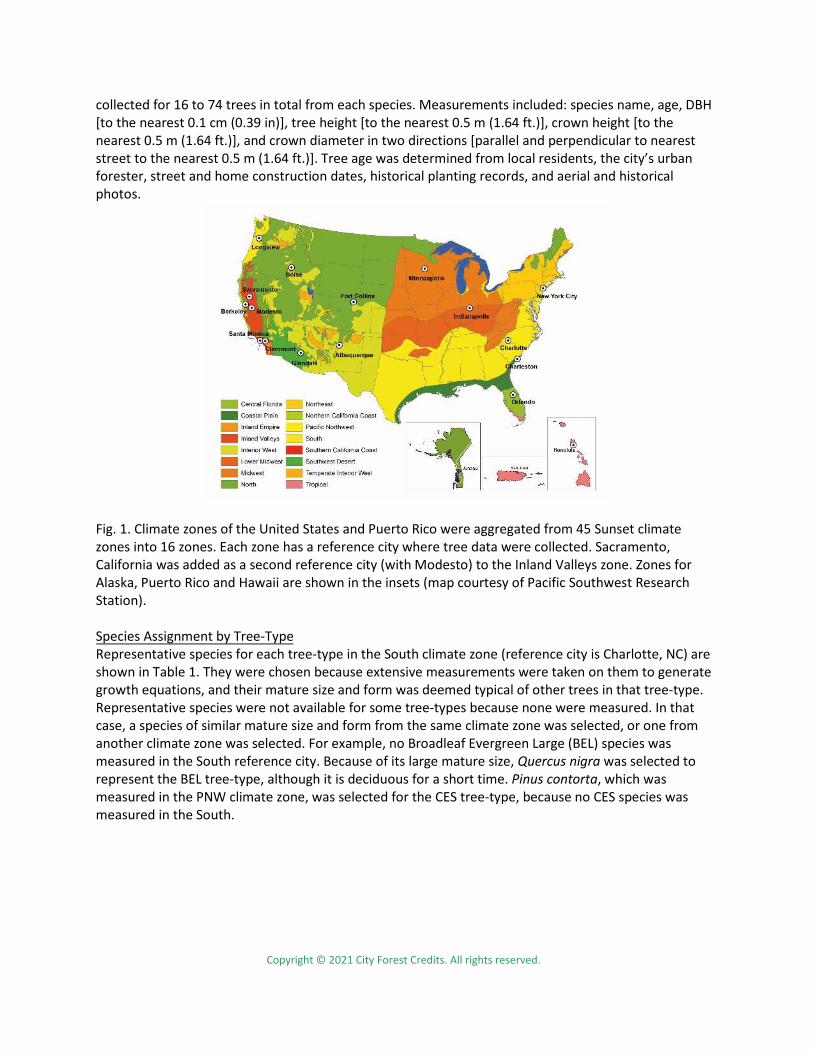
Users select their climate zone from the 16 U.S. climate zones (Fig. 1). Calculations of CO2 stored are for
a representative species for each tree-type that was one of the predominant street tree species per
reference city (Peper et al., 2001). The “Reference city” refers to the city selected for intensive study
within each climate zone (McPherson, 2010). About 20 of the most abundant species were selected for
sampling in each reference city. The sample was stratified into nine diameter at breast height (DBH)
classes (0 to 7.6, 7.6 to 15.2, 15.2 to 30.5, 30.5 to 45.7, 45.7 to 61.0, 61.0 to 76.2, 76.2 to 91.4, 91.4 to
106.7, and >106.7 cm). Typically 10 to 15 trees per DBH class were randomly chosen. Data were
Copyright © 2021 City Forest Credits. All rights reserved.
collected for 16 to 74 trees in total from each species. Measurements included: species name, age, DBH
[to the nearest 0.1 cm (0.39 in)], tree height [to the nearest 0.5 m (1.64 ft.)], crown height [to the
nearest 0.5 m (1.64 ft.)], and crown diameter in two directions [parallel and perpendicular to nearest
street to the nearest 0.5 m (1.64 ft.)]. Tree age was determined from local residents, the city’s urban
forester, street and home construction dates, historical planting records, and aerial and historical
photos.
Fig. 1. Climate zones of the United States and Puerto Rico were aggregated from 45 Sunset climate
zones into 16 zones. Each zone has a reference city where tree data were collected. Sacramento,
California was added as a second reference city (with Modesto) to the Inland Valleys zone. Zones for
Alaska, Puerto Rico and Hawaii are shown in the insets (map courtesy of Pacific Southwest Research
Station).
Species Assignment by Tree-Type
Representative species for each tree-type in the South climate zone (reference city is Charlotte, NC) are
shown in Table 1. They were chosen because extensive measurements were taken on them to generate
growth equations, and their mature size and form was deemed typical of other trees in that tree-type.
Representative species were not available for some tree-types because none were measured. In that
case, a species of similar mature size and form from the same climate zone was selected, or one from
another climate zone was selected. For example, no Broadleaf Evergreen Large (BEL) species was
measured in the South reference city. Because of its large mature size, Quercus nigra was selected to
represent the BEL tree-type, although it is deciduous for a short time. Pinus contorta, which was
measured in the PNW climate zone, was selected for the CES tree-type, because no CES species was
measured in the South.
Copyright © 2021 City Forest Credits. All rights reserved.

Table 1. Nine tree-types and abbreviations. Representative species assigned to each tree-type in the
South climate zone are listed. The biomass equations (species, urban general broadleaf [UGB], urban
general conifer [UGC]) and dry weight density (kg/m3) used to calculate biomass are listed for each tree-
type.
Tree-Type Tree-Type
Abbreviation
Species
Assigned
DW
Density Biomass Equations
Brdlf Decid Large (>50 ft) BDL Quercus phellos 600 Quercus macrocarpa 1.
Brdlf Decid Med (30-50 ft) BDM Pyrus calleryana 600 UGB 2.
Brdlf Decid Small (<30 ft) BDS Cornus florida 545 UGB 2.
Brdlf Evgrn Large (>50 ft) BEL Quercus nigra 797 UGB 2.
Brdlf Evgrn Med (30-50 ft) BEM Magnolia grandiflora 523 UGB 2.
Brdlf Evgrn Small (<30 ft) BES Ilex opaca 580 UGB 2.
Conif Evgrn Large (>50 ft) CEL Pinus taeda 389 UGC 2.
Conif Evgrn Med (30-50 ft) CEM Juniperus virginiana 393 UGC 2.
Conif Evgrn Small (<30 ft) CES Pinus contorta 397 UGC 2. 1.from Lefsky, M., & McHale, M.,2008.2 from Aguaron, E., & McPherson, E. G., 2012
Calculating Biomass and Carbon Dioxide Stored
To estimate CO2 stored, the biomass for each tree-type was calculated using urban-based allometric
equations because open-growing city trees partition carbon differently than forest trees (McPherson et
al., 2017a). Input variables included climate zone, species, and DBH. To project tree size at 25-years after
planting, we used DBH obtained from UTD growth curves for each representative species.
Biomass equations were compiled for 26 open-grown urban trees species from literature sources
(Aguaron and McPherson, 2012). General equations (Urban Gen Broadleaf and Urban Gen Conifer)
were developed from the 26 urban-based equations that were species specific (McPherson et al.,
2016a). These equations were used if the species of interest could not be matched taxonomically or
through wood form to one of the urban species with a biomass equation. Hence, urban general
equations were an alternative to applying species-specific equations because many species did not have
an equation.
These allometric equations yielded aboveground wood volume. Species-specific dry weight (DW) density
factors (Table 1) were used to convert green volume into dry weight (7a). The urban general equations
required looking up a dry weight density factor (in Jenkins et al. 2004 first, but if not available then the
Global Wood Density Database). The amount of belowground biomass in roots of urban trees is not well
researched. This work assumed that root biomass was 28% of total tree biomass (Cairns et al., 1997;
Husch et al., 2003; Wenger, 1984). Wood volume (dry weight) was converted to C by multiplying by the
constant 0.50 (Leith, 1975), and C was converted to CO2 by multiplying by 3.667.
Error Estimates and Limitations
The lack of biometric data from the field remains a serious limitation to our ability to calibrate biomass
equations and assign error estimates for urban trees. Differences between modeled and actual tree
growth adds uncertainty to CO2 sequestration estimates. Species assignment errors result from
matching species planted with the tree-type used for biomass and growth calculations. The magnitude
Copyright © 2021 City Forest Credits. All rights reserved.

of this error depends on the goodness of fit in terms of matching size and growth rate. In previous urban
studies the prediction bias for estimates of CO2 storage ranged from -9% to +15%, with inaccuracies as
much as 51% RMSE (Timilsina et al., 2014). Hence, a conservative estimate of error of ± 20% can be
applied to estimates of total CO2 stored as an indicator of precision.
It should be noted that estimates of CO2 stored using the Tree Canopy Approach have several limitations
that may reduce their accuracy. They rely on allometric relationships for open-growing trees, so storage
estimates may not be as accurate when trees are closely spaced. Also, they assume that the distribution
of tree canopy cover among tree-types remains constant, when in fact mortality may afflict certain
species more than others. For these reasons, periodic “truing-up” of estimates by field sampling is
suggested.
Co-Benefit: Energy Savings
Trees and forests can offer energy savings in two important ways. In warmer climates or hotter months,
trees can reduce air conditioning bills by keeping buildings cooler through reducing regional air
temperatures and offering shade. In colder climates or cooler months, trees can confer savings on the
fuel needed to heat buildings by reducing the amount of cold winds that can strip away heat.
Energy conservation by trees is important because building energy use is a major contributor to
greenhouse gas emissions. Oil or gas furnaces and most forms of electricity generation produce CO2 and
other pollutants as by-products. Reducing the amount of energy consumed by buildings in urban areas
is one of the most effective methods of combatting climate change. Energy consumption is also a costly
burden on many low-income families, especially during mid-summer or mid-winter. Furthermore,
electricity consumption during mid-summer can sometimes over-extend local power grids leading to
rolling brownouts and other problems.
Energy savings are calculated through numerical models and simulations built from observational data
on proximity of trees to buildings, tree shapes, tree sizes, building age classes, and meteorological data
from McPherson et al. (2017) and McPherson and Simpson (2003). The main parameters affecting the
overall amount of energy savings are crown shape, building proximity, azimuth, local climate, and
season. Shading effects are based on the distribution of street trees with respect to buildings recorded
from aerial photographs for each reference city (McPherson and Simpson, 2003). If a sampled tree was
located within 18 m of a conditioned building, information on its distance and compass bearing relative
to a building, building age class (which influences energy use) and types of heating and cooling
equipment were collected and used as inputs to calculate effects of shade on annual heating and cooling
energy effects. Because these distributions were unique to each city, energy values are considered first-
order approximations.
In addition to localized shade effects, which were assumed to accrue only to trees within 18 m of a
building, lowered air temperatures and windspeeds from increased neighborhood tree cover (referred
to as climate effects) can produce a net decrease in demand for winter heating and summer cooling
(reduced wind speeds by themselves may increase or decrease cooling demand, depending on the
circumstances). Climate effects on energy use, air temperature, and wind speed, as a function of
neighborhood canopy cover, were estimated from published values for each reference city. The
percentages of canopy cover increase were calculated for 20-year-old large, medium, and small trees,
based on their crown projection areas and effective lot size (actual lot size plus a portion of adjacent
street and other rights-of-way) of 10,000 ft2 (929 m2), and one tree on average was assumed per lot.
Copyright © 2021 City Forest Credits. All rights reserved.

Climate effects were estimated by simulating effects of wind and air-temperature reductions on building
energy use.
In the case of urban Tree Preservation Projects, trees may not be close enough to buildings to provide
shading effects, but they may influence neighborhood climate. Because these effects are highly site-
specific, we conservatively apply an 80% reduction to the energy effects of trees for Preservation
Projects.
Energy savings are calculated as a real-dollar amount. This is calculated by applying overall reductions in
oil and gas usage or electricity usage to the regional cost of oil and gas or electricity for residential
customers. Colder regions tend to see larger savings in heating and warmer regions tend to see larger
savings in cooling.
Error Estimates and Limitations
Formulaic errors occur in modeling of energy effects. For example, relations between different levels of
tree canopy cover and summertime air temperatures are not well-researched. Another source of error
stems from differences between the airport climate data (i.e., Los Angeles International Airport) used to
model energy effects and the actual climate of the study area (i.e., Los Angeles urban area). Because of
the uncertainty associated with modeling effects of trees on building energy use, energy estimates may
be accurate within ± 25 percent (Hildebrandt & Sarkovich, 1998).
Co-Benefit: CO2 Avoided
Energy savings result in reduced emissions of CO2 and criteria air pollutants (volatile organic
hydrocarbons [VOCs], NO2, SO2, PM10) from power plants and space-heating equipment. Cooling savings
reduce emissions from power plants that produce electricity, the amount depending on the fuel mix.
Electricity emissions reductions were based on the fuel mixes and emission factors for each utility in the
16 reference cities/climate zones across the U.S. The dollar values of electrical energy and natural gas
were based on retail residential electricity and natural gas prices obtained from each utility. Utility-
specific emission factors, fuel prices and other data are available in the Community Tree Guides for each
region (https://www.fs.fed.us/psw/topics/urban_forestry/products/tree_guides.shtml). To convert the
amount of CO2 avoided to a dollar amount in the spreadsheet tools, City Forest Credits uses the price of
$20 per metric ton of CO2.
Error Estimates and Limitations
Estimates of avoided CO2 emissions have the same uncertainties that are associated with modeling
effects of trees on building energy use. Also, utility-specific emission factors are changing as many
utilities incorporate renewable fuels sources into their portfolios. Values reported in CFC tools may
overestimate actual benefits in areas where emission factors have become lower.
Co-Benefit: Rainfall Interception
Forest canopies normally intercept 10-40% of rainfall before it hits the ground, thereby reducing
stormwater runoff. The large amount of water that a tree crown can capture during a rainfall event
makes tree planting a best management practice for urban stormwater control.
City Forest Credits uses a numerical interception model to calculate the amount of annual rainfall
intercepted by trees, as well as throughfall and stem flow (Xiao et al., 2000). This model uses species-
specific leaf surface areas and other parameters from the Urban Tree Database. For example, deciduous
Copyright © 2021 City Forest Credits. All rights reserved.

trees in climate zones with longer “in-leaf” seasons will tend to intercept more rainfall than similar
species in colder areas shorter foliation periods. Model results were compared to observed patterns of
rainfall interception and found to be accurate. This method quantifies only the amount of rainfall
intercepted by the tree crown, and does not incorporate surface and subsurface effects on overland
flow.
The rainfall interception benefit was priced by estimating costs of controlling stormwater runoff. Water
quality and/or flood control costs were calculated per unit volume of runoff controlled and this price
was multiplied by the amount of rainfall intercepted annually.
Error Estimates and Limitations
Estimates of rainfall interception are sensitive to uncertainties regarding rainfall patterns, tree leaf area
and surface storage capacities. Rainfall amount, intensity and duration can vary considerably within a
climate zone, a factor not considered by the model. Although tree leaf area estimates were derived from
extensive measurements on over 14,000 street trees across the U.S. (McPherson et al., 2016a), actual
leaf area may differ because of differences in tree health and management. Leaf surface storage
capacity, the depth of water that foliage can capture, was recently found to vary threefold among 20
tree species (Xiao & McPherson, 2016). A shortcoming is that this model used the same value (1 mm) for
all species. Given these limitations, interception estimates may have uncertainty as great as ± 20
percent.
Co-Benefit: Air Quality
The uptake of air pollutants by urban forests can lower concentrations and affect human health
(Derkzen et al., 2015; Nowak et al., 2014). However, pollutant concentrations can be increased if the
tree canopy restricts polluted air from mixing with the surrounding atmosphere (Vos et al., 2013).
Urban forests are capable of improving air quality by lowering pollutant concentrations enough to
significantly affect human health. Generally, trees are able to reduce ozone, nitric oxides, and
particulate matter. Some trees can reduce net volatile organic compounds (VOCs), but others can
increase them through natural processes. Regardless of the net VOC production, urban forests usually
confer a net positive benefit to air quality. Urban forests reduce pollutants through dry deposition on
surfaces and uptake of pollutants into leaf stomata.
A numerical model calculated hourly pollutant dry deposition per tree at the regional scale using
deposition velocities, hourly meteorological data and pollutant concentrations from local monitoring
stations (Scott et al., 1998). The monetary value of tree effects on air quality reflects the value that
society places on clean air, as indicated by willingness to pay for pollutant reductions. The monetary
value of air quality effects were derived from models that calculated the marginal damage control costs
of different pollutants to meet air quality standards (Wang and Santini 1995). Higher costs were
associated with higher pollutant concentrations and larger populations exposed to these contaminants.
Error Estimates and Limitations
Pollutant deposition estimates are sensitive to uncertainties associated with canopy resistance,
resuspension rates and the spatial distribution of air pollutants and trees. For example, deposition to
urban forests during warm periods may be underestimated if the stomata of well-watered trees remain
open. In the model, hourly meteorological data from a single station for each climate zone may not be
spatially representative of conditions in local atmospheric surface layers. Estimates of air pollutant
uptake may be accurate within ± 25 percent.
Copyright © 2021 City Forest Credits. All rights reserved.

Conclusions
Our estimates of carbon dioxide storage and co-benefits reflect an incomplete understanding of the
processes by which ecoservices are generated and valued (Schulp et al., 2014). Our choice of co-benefits
to quantify was limited to those for which numerical models were available. There are many important
benefits produced by trees that are not quantified and monetized. These include effects of urban forests
on local economies, wildlife, biodiversity and human health and well-being. For instance, effects of
urban trees on increased property values have proven to be substantial (Anderson & Cordell, 1988).
Previous analyses modeled these “other” benefits of trees by applying the contribution to residential
sales prices of a large front yard tree (0.88%) (McPherson et al., 2005). We have not incorporated this
benefit because property values are highly variable. It is likely that co-benefits reported here are
conservative estimates of the actual ecoservices resulting from local tree planting projects.
References
Aguaron, E., & McPherson, E. G. (2012). Comparison of methods for estimating carbon dioxide storage
by Sacramento's urban forest. In R. Lal & B. Augustin (Eds.), Carbon sequestration in urban ecosystems
(pp. 43-71). Dordrecht, Netherlands: Springer.
Anderson, L. M., & Cordell, H. K. (1988). Influence of trees on residential property values in Athens,
Georgia: A survey based on actual sales prices. Landscape and Urban Planning, 15, 153-164.
Cairns, M. A., Brown, S., Helmer, E. H., & Baumgardner, G. A. (1997). Root biomass allocation in the
world’s upland forests. Oecologia 111, 1-11.
Costanza, R. (2008). Ecosystem services: Multiple classification systems are needed. Biological
Conservation, 141(2), 350-352. doi: http://dx.doi.org/10.1016/j.biocon.2007.12.020
Derkzen, M. L., van Teeffelen, A. J. A., & Verburg, P. H. (2015). Quantifying urban ecosystem services
based on high-resolution data of urban green space: an assessment for Rotterdam, the Netherlands.
Journal of Applied Ecology, 52(4), 1020-1032. doi: 10.1111/1365-2664.12469
Hildebrandt, E. W., & Sarkovich, M. (1998). Assessing the cost-effectiveness of SMUD's shade tree
program. Atmospheric Environment, 32, 85-94.
Husch, B., Beers, T. W., & Kershaw, J. A. (2003). Forest Mensuration (4th ed.). New York, NY: John Wiley
and Sons.
Jenkins, J.C.; Chojnacky, D.C.; Heath, L.S.; Birdsey, R.A. (2004). Comprehensive database of diameter-
based biomass regressions for North American tree species. Gen. Tech. Rep. NE-319. Newtown Square,
PA: U.S. Department of Agriculture, Forest Service, Northeastern Research Station. 45 p.
Lefsky, M., & McHale, M. (2008). Volume estimates of trees with complex architecture from terrestrial
laser scanning. Journal of Applied Remote Sensing, 2, 1-19. doi: 02352110.1117/1.2939008
Leith, H. (1975). Modeling the primary productivity of the world. Ecological Studies, 14, 237-263.
Maco, S.E., & McPherson, E.G. (2003). A practical approach to assessing structure, function, and value of
street tree populations in small communities. Journal of Arboriculture. 29(2): 84-97.
Copyright © 2021 City Forest Credits. All rights reserved.

McPherson, E. G. (2010). Selecting reference cities for i-Tree Streets. Arboriculture and Urban Forestry,
36(5), 230-240.
McPherson, E. Gregory; van Doorn, Natalie S.; Peper, Paula J. (2016a). Urban tree database and
allometric equations. General Technical Report PSW-253. U.S. Department of Agriculture, Forest Service,
Pacific Southwest Research Station, Albany, CA. 86 p. TreeSearch #52933
McPherson, E. Gregory; van Doorn, Natalie S.; Peper, Paula J. (2016b). Urban tree database. Fort Collins,
CO: Forest Service Research Data Archive. http://dx.doi.org/10.2737/RDS-2016-0005
McPherson, G., Q. Xiao, N. S. van Doorn, J. de Goede, J. Bjorkman, A. Hollander, R. M. Boynton, J.F.
Quinn and J. H. Thorne. (2017). The structure, function and value of urban forests in California
communities. Urban Forestry & Urban Greening. 28 (2017): 43-53.
McPherson, E. G., & Simpson, J. R. (2003). Potential energy saving in buildings by an urban tree planting
programme in California. Urban Forestry & Urban Greening, 3, 73-86.
McPherson, E. G., Simpson, J. R., Peper, P. J., Maco, S. E., & Xiao, Q. (2005). Municipal forest benefits
and costs in five U.S. cities. Journal of Forestry, 103, 411-416.
Nowak, D. J., Hirabayashi, S., Bodine, A., & Greenfield, E. (2014). Tree and forest effects on air quality
and human health in the United States. Environmental Pollution, 193, 119-129.
Peper, P. J., McPherson, E. G., & Mori, S. M. (2001). Equations for predicting diameter, height, crown
width and leaf area of San Joaquin Valley street trees. Journal of Arboriculture, 27(6), 306-317.
Schulp, C. J. E., Burkhard, B., Maes, J., Van Vliet, J., & Verburg, P. H. (2014). Uncertainties in ecosystem
service maps: A comparison on the European scale. PLoS ONE 9(10), e109643.
Scott, K. I., McPherson, E. G., & Simpson, J. R. (1998). Air pollutant uptake by Sacramento's urban forest.
Journal of Arboriculture, 24(4), 224-234.
Smith, James E.; Heath, Linda S.; Skog, Kenneth E.; Birdsey, Richard A. 2006. Methods for calculating
forest ecosystem and harvested carbon with standard estimates for forest types of the United States.
Gen. Tech. Rep. NE-343. Newtown Square, PA: U.S. Department of Agriculture, Forest Service,
Northeastern Research Station. 216 p.
Timilsina, N., Staudhammer, C.L., Escobedo, F.J., Lawrence, A. (2014). Tree biomass, wood waste yield
and carbon storage changes in an urban forest. Landscape and Urban Planning. 127: 18-27.
Vos, P. E. J., Maiheu, B., Vankerkom, J., & Janssen, S. (2013). Improving local air quality in cities: To tree
or not to tree? Environmental Pollution, 183, 113-122. doi:
http://dx.doi.org/10.1016/j.envpol.2012.10.021
Wang, M.Q.; Santini, D.J. (1995). Monetary values of air pollutant emissions in various U.S. regions.
Transportation Research Record 1475. Washington DC: Transportation Research Board.
Wenger, K. F. (1984). Forestry Handbook. New York, NY: John Wiley and Sons.
Copyright © 2021 City Forest Credits. All rights reserved.

Copyright © 2021 City Forest Credits. All rights reserved.
Xiao, Q., E. G. McPherson, S. L. Ustin, and M. E. Grismer. A new approach to modeling tree rainfall
interception. Journal of Geophysical Research. 105 (2000): 29,173-29,188.
Xiao, Q., & McPherson, E. G. (2016). Surface water storage capacity of twenty tree species in Davis,
California. Journal of Environmental Quality, 45, 188-198.