refractive index determination of nanoparticles in
TRANSCRIPT

Refractive Index Determination of Nanoparticles in Suspension UsingNanoparticle Tracking AnalysisEdwin van der Pol,*,†,‡ Frank A. W. Coumans,†,‡ Auguste Sturk,‡ Rienk Nieuwland,‡
and Ton G. van Leeuwen†
†Biomedical Engineering and Physics, ‡ Laboratory of Experimental Clinical Chemistry, Academic Medical Center, University ofAmsterdam, Amsterdam, The Netherlands
*S Supporting Information
ABSTRACT: The refractive index (RI) dictates interaction between light and nanoparticles and therefore is important to health,environmental, and materials sciences. Using nanoparticle tracking analysis, we have determined the RI of heterogeneousparticles <500 nm in suspension. We demonstrate feasibility of distinguishing silica and polystyrene beads based on their RI. Thehitherto unknown RI of extracellular vesicles from human urine was determined at 1.37 (mean). This method enablesdifferentiation of single nanoparticles based on their RI.
KEYWORDS: Drug delivery, exosomes, extracellular vesicles, microparticles, nanomedicine, nanoparticles
The refractive index (RI) of nanoparticles is anindispensable property in a wide range of applications
and studies but is difficult to measure.1 The RI depends on thewavelength and is defined as the ratio of speed of light invacuum to speed of light in the material. It relates lightscattering to the size, shape, and chemical composition of ananoparticle2 and it defines the magnitude of the optical forcethat an electromagnetic field exerts on nanoparticles.3,4 Becausethe RI is related to the chemical composition of the particle aswell, determination of the RI can also be utilized to differentiatebetween different components of samples. For example, inatmospheric particulate matter, pollen (RI ≈ 1.53)5 could bedistinguished from cement dust (RI ≈ 1.70)6 and fly ash (RI =1.55−1.60).7 In clinical samples, it may be possible todistinguish vesicles from similar-sized lipoproteins (RI =1.45−1.60),8 which are abundantly present in blood.8 Potentialdifferentiation of other nanoparticles by RI include soda lime,borosilicate, calcium carbonate, aluminum oxide, aluminumsilicate, diamond, gold, nickel, poly(methyl methacrylate)(PMMA), polytetrafluoroethylene (PTFE), bacteria, viruses,and yeast. Finally, the transfer of the optical properties of bulkto particle is not always straightforward. For example, for goldnanoparticles the choice of dielectric function is still not fullyclear, resulting in differences in the prediction of the scattering
properties of gold nanorods.9 Thus, the RI dictates theinteraction between light and nanoparticles in diverseapplications spanning environmental science (e.g., the effectof aerosols on climate10,11 or the carbon content ofplankton12), health (drug delivery,13−15 nanotherapy,16 imagingcontrast,17 or photodynamic therapy18,19), and materialsscience (nanoparticles in paint20,21 or solar cells22).Table 1 shows the capabilities of current techniques for
determining the RI of particles. For polydisperse particles withhomogeneous RI, the most applied technique is RI matchingthe medium to the particles.23,24 However, RI matching cannotbe applied to particles of biological origin due to osmoticeffects. Moreover, a sample with heterogeneous RI analyzedwith a technique suitable only for homogeneous RI may resultin artifacts. For monodisperse particles of known size andconcentration, the RI can be determined by measuring theoptical extinction coefficient of multiple particles simulta-neously.11,25,26 Sorting on size may allow these techniques todetermine the RI of polydisperse particles. However, size-basedfractionation of particles <500 nm is difficult and may introduceartifacts.27 For samples with heterogeneous RI and unknown
Received: July 1, 2014Published: September 26, 2014
Letter
pubs.acs.org/NanoLett
© 2014 American Chemical Society 6195 dx.doi.org/10.1021/nl503371p | Nano Lett. 2014, 14, 6195−6201

size distribution, the RI can be derived from single particles bymeasuring angle or wavelength resolved scattering, Fraunhoferdiffraction, or the stiffness of an optical trap.1,28−35 Thesetechniques, however, have only been applied to particles >500nm. Thus, currently no method is capable of determining RI ofsingle nanoparticles (<500 nm) in suspension.Consequently, the RI of extracellular vesicles <500 nm, such
as exosomes, is unknown. Extracellular vesicles are biologicalnanoparticles that are released by cells to transport waste and
exchange intercellular messages, such as DNA, RNA, or surfacereceptors.36 Body fluids, but also seawater, contain typically 105
to 1010 of these vesicles per mL.37−40 Because most vesicleshave specialized functions and contribute to homeostaticprocesses, clinical applications of vesicles are in development.36
Figure 1A shows a transmission electron microscopy (TEM)image of vesicles from human urine (see SupportingInformation). Urine contains a relatively high concentrationof vesicles with low contamination of similar-sized non-cell-
Table 1. Capabilities and Requirements of Methods to Determine the Refractive Index (RI) of Particlesa
method referencesin
suspensiondiameter(μm)
singleparticles
heterogeneousdiameterb
heterogeneousRIb requirements
RI matching 23,24,59 + all − + − altering the mediumoptical extinction coefficient 25 + all − − − particle concentration and
diameter11,26 − all − − − particle concentration and
diameterangle/wavelength resolved scattering,diffraction, optical force
28−30 − >3.0 + + +31−33 + >0.5 + + +1,34,35 + >1.0 + + +
aA method that is incapable or capable of providing information on the RI of single particles, particles with a heterogeneous size or RI distribution,or particles in suspension is indicated by − and +, respectively. b+ Heterogeneous and homogeneous possible; − only homogeneous possible.
Figure 1. Size and morphology of urinary vesicles by TEM. (A) TEM image of urinary vesicles. The vesicles have a characteristic cup-shapedmorphology. (B) Particle size distribution of 2000 vesicles determined from 25 TEM images. The distribution ranges from 15 to 485 nm and has asingle peak at 45 nm.
Figure 2. Detection of light scattered by particles undergoing Brownian motion. (A) Schematic representation of the NTA setup. A laser beam(purple) with a wavelength (λ) of 405 nm and a power (P) of 45 mW illuminates particles (spheres) in suspension. The particles are undergoingBrownian motion, which is the random motion (white arrow) resulting from collisions with molecules in the suspension. Light scattered by a particleis collected by a microscope objective with a numerical aperture (NA) of 0.4. (B) Scattering power versus time of a 203 nm polystyrene bead (solid)and the maximum scattering power (dashed). Because of Brownian motion the particle moves through the focal plane and the laser beam, causingthe scattering power to fluctuate.
Nano Letters Letter
dx.doi.org/10.1021/nl503371p | Nano Lett. 2014, 14, 6195−62016196

derived particles.41 Figure 1B shows the particle sizedistribution (PSD) of urinary vesicles based on TEM data.The PSD ranges from 25 to 485 nm with a mode diameter of45 nm. The small size and large heterogeneity of vesicles arecharacteristic of biological fluids and hamper their detection.39
Please note that other biological fluids, such as blood, containmany components <1 μm with different RI, including proteinaggregates (RI = 1.59−1.64),8,42 lipoproteins (RI = 1.45−1.60),8 and viruses (RI = 1.52−1.57).43,44Currently, various optical techniques, such as flow cytometry,
nanoparticle tracking analysis (NTA), and Raman micro-spectroscopy, are employed and improved to study vesicles insuspension.37,41,45,46 An essential property in these studies isthe RI of vesicles. For example, RI determines the smallestdetectable vesicle in NTA and flow cytometry, RI determinesthe smallest vesicle size that can be trapped with Ramanmicrospectroscopy, and RI determines the relationship betweensize and scatter in flow cytometry.39 In flow cytometry, the RIof vesicles has (accidentally) been assumed to be similar topolystyrene beads. This resulted in a gating strategy thatselected vesicles with diameters from 800 to 2400 nm, ratherthan the intended 500−900 nm.45 The aim of this work is todevelop a method to determine the RI of single nanoparticles insuspension and, as a proof of principle, apply the method toestimate the RI of extracellular vesicles.We have determined the RI by independently measuring
diameter and light scattering power of individual particles withNTA and solving the inverse scattering problem with Mietheory. Figure 2A schematically depicts the operating principleof the NTA. We visualized scattered light from particlesilluminated by a 45 mW 405 nm laser by a dark-fieldmicroscope (NS500, Nanosight, U.K.). Because of Brownianmotion, each particle moved randomly through the suspension.We used the trajectory of each particle in the lateral directionrelative to the microscope objective to determine the diffusioncoefficient, which we related to the particle diameter via theStokes−Einstein equation.37,38,47 Because the detected scatter-ing power depends on the axial position of a particle, whichchanged due to Brownian motion, the detected scatteringpower fluctuated. Figure 2B shows a typical measurement ofthe scattering power versus time for a polystyrene bead with adiameter of 203 nm. Because we focused the objective onto theoptical axis of the laser beam, the maximum scattering powerwas measured when the particle was in focus. To derive the RI,we described the measured (maximum) scattering power Pfrom particles in focus by the theoretical scattering cross sectionσMie from Mie theory2 using the measured particle diameter asinput to the calculation. Mie theory, extensively described byBohren and Huffman,2 provides an analytical solution ofMaxwell’s equations and describes light scattering of spheres ofall size parameters. However, Mie theory does not reduce thesevariables to a single equation, since the solution to Maxwell’sequations are an infinite series expansions of the electro-magnetic fields. We use the Matlab Mie scripts of Matzler48 tocalculate the infinite series and obtain the amplitude scatteringmatrix elements, which describe the relation between theincident and scattered field amplitudes of a sphere. Our modelincorporates particle diameter and RI, RI of the medium, andwavelength, polarization, and collection angles of the micro-scope (see Supporting Information).To calibrate the NTA Instruments, we measured the
scattering power of polystyrene beads PPS of known size andcalculated the scattering cross section of polystyrene spheres
σMiePS . The RI of bulk polystyrene is 1.633 at 405 nm.49 Wemeasured PPS for monodisperse populations of beads (Nano-sphere, Thermo Fisher, MA) with a mean diameter of 46, 102,203, 400, and 596 nm and a concentration of 108 beads·mL−1.For each diameter, five videos of 30 s were captured with NTAv2.3.0.17 software (Nanosight) and at least 100 particles weretracked. Because the scattering power of the beads differs morethan 3 orders of magnitude, each sample required differentcamera settings (see Supporting Information) to prevent pixelsaturation. The videos contain 8-bit images of 640 by 480pixels, which were processed with scripts by Blair andDufresne50 in Matlab (v7.13.0.564) to track the particles (seeSupporting Information). From the trajectory of each particle,we calculated the mean square displacement and diffusioncoefficient and related it to particle diameter via the Stokes−Einstein equation. Furthermore, the script determined themaximum scattering power of each particle within its trajectoryand corrected for the applied shutter time and camera gain. Anincrease in minimum tracklength increases the precision of themeasured diameter and scattering power but also reduces thenumber of analyzed particles. After the analysis described in theSupporting Information, we required a minimum tracklength of30 frames. We performed all measurements at 22.0 °C andassumed a medium viscosity of 0.95 cP. To take into accountthe illumination irradiance and transmission efficiency, themedian of PPS was scaled onto σMie
PS by a least-square fit. Theresulting scaling factor is 0.067, which is a property of theinstrument that we will use throughout this letter to scale P toσ. Figure 3 shows PPS and σMie
PS versus particle diameter. Thedata and theory show good agreement with a coefficient ofdetermination R2 = 0.997.
To validate our approach, we have measured the scatteringcross section of monodisperse populations of silica beads(Kisker Biotech, Germany) with a diameter of 89, 206, 391, and577 nm and a concentration of 108 beads·mL−1, as shown inFigure 3. Since the RI of silica beads (RISi) is not exactlyknown, we performed a least square regression to fit thescattering cross section of silica beads σMie
Si to the data. Wefound a RISi of 1.432, which is in between 1.43 and 1.45 ofprevious estimates,1,51 confirming that NTA can be used todetermine the RI of nanoparticles.
Figure 3. Measured (symbols) and calculated (lines) scattering crosssection versus diameter for polystyrene beads (black) and silica beads(red). The scattering cross section increases with increasing particlediameter and refractive index. The particle diameters are determinedby TEM. Error bars indicate one standard deviation of the mean.
Nano Letters Letter
dx.doi.org/10.1021/nl503371p | Nano Lett. 2014, 14, 6195−62016197

To further validate the method, we determined the PSD andRI distribution of a mixture of 203 nm polystyrene beads and206 nm silica beads with a concentration of 108 beads·mL−1 forboth populations. We captured 20 videos of 30 s to track atleast 1000 particles. Data were processed as described above.Figure 4A shows measured σ versus bead diameter. Each dotrepresents a single particle, and two populations of beads areclearly discernible. As a reference, the gray lines show σMie forseven RIs between 1.35 and 1.65. Figure 4B shows the bead
mixture PSD obtained by NTA fitted by a Gaussiandistribution, which resulted in a size of 213 ± 25 nm (mean± standard deviation). As a reference, the vertical bar shows thediameter of the silica beads determined by transmissionelectron microscopy (TEM), which is 206 ± 18 nm. Weattribute the overestimation of the mean diameter to theuncertainty in the measured diffusion coefficient and to thedifference between the hydrodynamic diameter measured byNTA and the physical diameter measured by TEM.Figure 4C shows the RI distribution of the bead mixture and
a fit of two Gaussian distributions. We could clearly distinguishsilica beads from similar-sized polystyrene beads. We obtainedan RISi of 1.447 ± 0.021 (mean ± standard deviation), which isclose to 1.432 as derived from Figure 3 and in between 1.43and 1.45 of previous estimates.1,51 For the RI of polystyrenebeads (RIPS) we obtained 1.665 ± 0.046, which is between 1.59and 1.68 of previous estimates.11,49 Previous estimates withother techniques resulted in standard deviations of RIPSbetween 0.011 and 0.027,1,11,26 which is lower than our result.However, those techniques could not detect single particles<500 nm, and could not detect heterogeneous RI. Theprecision of RIPS measurements with NTA is approximately2-fold larger than literature values. We expect that the precisionof RI will be reduced for particles with a lower RI thanpolystyrene, as σ becomes more dependent on the RI for suchparticles. This may partly explain why the standard deviation ofRISi was 0.021. Moreover, because the standard deviation of thediameter scales with 1/tracklength1/2,52 increasing thetracklength will reduce the standard deviation of the diameter,σ and RI. Technical modifications required to increase thetracklength without reducing the number of particles trackedare feasible but require extensive modifications to thehardware.53
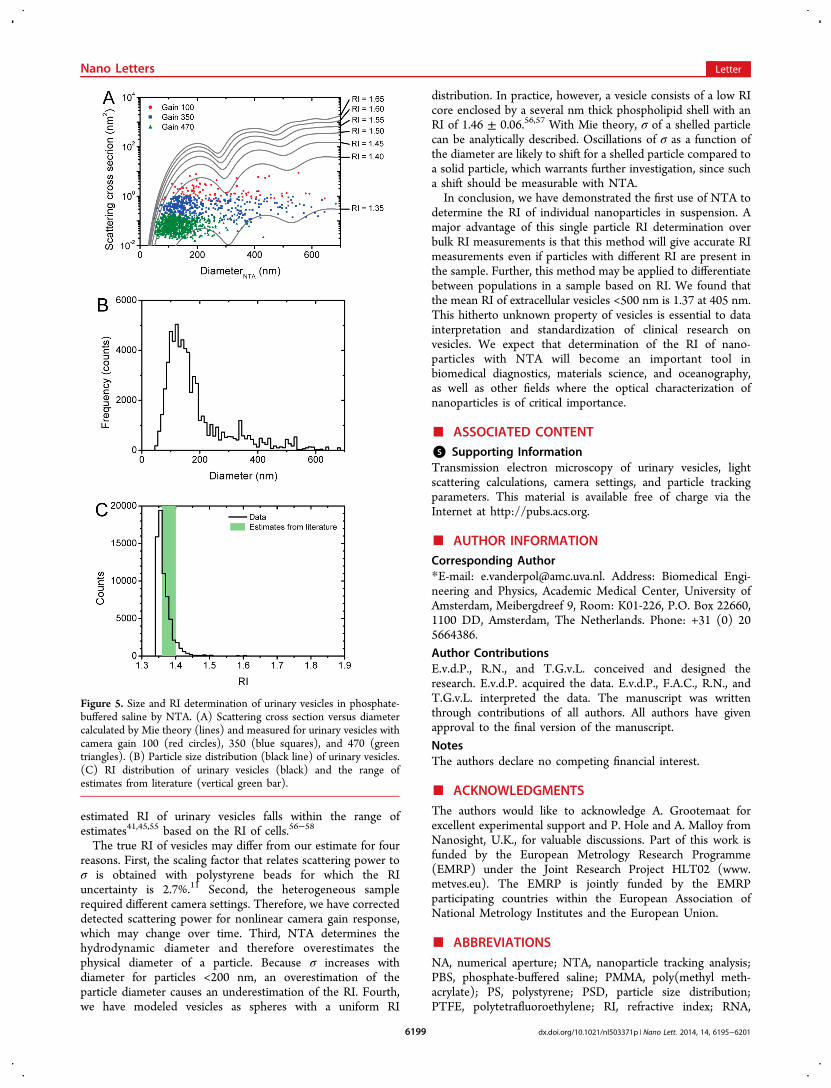
As a proof of principle, we applied NTA for thedetermination of the RI of urinary vesicles from a healthymale individual. After collection, urine was centrifuged twice(50 mL, 4 °C, 10 min, 180g; and 20 min, 1550g) to removecells and diluted 100-fold in 50 nm filtered (Nucleopore, GEHealthcare, IL) phosphate-buffered saline (PBS). Figure 5Ashows σ versus the diameter of urinary vesicles measured byNTA. We captured 20 videos of 30 s to track at least 1000vesicles. Because the scattering power of the vesicles differsmore than 3 orders of magnitude, we used three differentcamera settings: gain 100, 350, and 470. The gains wereselected such that the range of detectable scattering crosssections overlapped. Data processing was performed asdescribed above. The gray lines again show the relationshipbetween σ and the diameter for seven RIs between 1.35 and1.65, taking into account that the RI of PBS is 0.002 higher thanthe RI of water.54 Figure 5B shows the measured PSD ofurinary vesicles. The PSD ranges from 45 to 865 nm with amode diameter of 115 nm. Similar to TEM, the right-hand sideof the PSD shows a decreasing concentration with increasingdiameter, but vesicles smaller than ∼100 nm are below thedetection limit for the settings used. Figure 5C shows themeasured RI distribution of urinary vesicles with a mean RI of1.37. The RI of urinary vesicles is lower compared to a previousestimate of plasma vesicles >500 nm, which have an RIdistribution ranging from 1.34 to 1.50 with a peak at 1.40.31
However, in contrast to urine, plasma of nonfasting subjectscontains chylomicrons,37 which are lipoprotein particles with anRI between 1.45 and 1.60.8 In addition, plasma vesicles maydiffer in composition from urinary vesicles. Moreover, our
Figure 4. Size and refractive index (RI) determination of a mixture of203 nm polystyrene beads and 206 nm silica beads in water bynanoparticle tracking analysis (NTA). (A) Scattering cross sectionversus diameter calculated by Mie theory (lines) and measured for thebead mixture (dots). (B) Particle size distribution of the bead mixture(solid line) fitted by a Gaussian function (dotted line; offset f 0 = 0,mean μ0 = 213 nm, standard deviation SD0 = 25 nm, area A0 = 1.26 ×10⁶). The vertical green bar indicates μ ± SD of the 206 nm silicabeads measured by TEM. (C) RI distribution of the bead mixture(solid line) fitted by a sum of two Gaussian functions (dotted line; f1 =0, μ1 = 1.447, SD1 = 0.021, A1 = 458, μ2 = 1.665, SD2 = 0.046, A2 =793). The vertical green bars indicate the range of reported RIs fromliterature.
Nano Letters Letter
dx.doi.org/10.1021/nl503371p | Nano Lett. 2014, 14, 6195−62016198
estimated RI of urinary vesicles falls within the range ofestimates41,45,55 based on the RI of cells.56−58
The true RI of vesicles may differ from our estimate for fourreasons. First, the scaling factor that relates scattering power toσ is obtained with polystyrene beads for which the RIuncertainty is 2.7%.11 Second, the heterogeneous samplerequired different camera settings. Therefore, we have correcteddetected scattering power for nonlinear camera gain response,which may change over time. Third, NTA determines thehydrodynamic diameter and therefore overestimates thephysical diameter of a particle. Because σ increases withdiameter for particles <200 nm, an overestimation of theparticle diameter causes an underestimation of the RI. Fourth,we have modeled vesicles as spheres with a uniform RI
distribution. In practice, however, a vesicle consists of a low RIcore enclosed by a several nm thick phospholipid shell with anRI of 1.46 ± 0.06.56,57 With Mie theory, σ of a shelled particlecan be analytically described. Oscillations of σ as a function ofthe diameter are likely to shift for a shelled particle compared toa solid particle, which warrants further investigation, since sucha shift should be measurable with NTA.In conclusion, we have demonstrated the first use of NTA to
determine the RI of individual nanoparticles in suspension. Amajor advantage of this single particle RI determination overbulk RI measurements is that this method will give accurate RImeasurements even if particles with different RI are present inthe sample. Further, this method may be applied to differentiatebetween populations in a sample based on RI. We found thatthe mean RI of extracellular vesicles <500 nm is 1.37 at 405 nm.This hitherto unknown property of vesicles is essential to datainterpretation and standardization of clinical research onvesicles. We expect that determination of the RI of nano-particles with NTA will become an important tool inbiomedical diagnostics, materials science, and oceanography,as well as other fields where the optical characterization ofnanoparticles is of critical importance.
■ ASSOCIATED CONTENT*S Supporting InformationTransmission electron microscopy of urinary vesicles, lightscattering calculations, camera settings, and particle trackingparameters. This material is available free of charge via theInternet at http://pubs.acs.org.
■ AUTHOR INFORMATIONCorresponding Author*E-mail: [email protected]. Address: Biomedical Engi-neering and Physics, Academic Medical Center, University ofAmsterdam, Meibergdreef 9, Room: K01-226, P.O. Box 22660,1100 DD, Amsterdam, The Netherlands. Phone: +31 (0) 205664386.
Author ContributionsE.v.d.P., R.N., and T.G.v.L. conceived and designed theresearch. E.v.d.P. acquired the data. E.v.d.P., F.A.C., R.N., andT.G.v.L. interpreted the data. The manuscript was writtenthrough contributions of all authors. All authors have givenapproval to the final version of the manuscript.
NotesThe authors declare no competing financial interest.
■ ACKNOWLEDGMENTSThe authors would like to acknowledge A. Grootemaat forexcellent experimental support and P. Hole and A. Malloy fromNanosight, U.K., for valuable discussions. Part of this work isfunded by the European Metrology Research Programme(EMRP) under the Joint Research Project HLT02 (www.metves.eu). The EMRP is jointly funded by the EMRPparticipating countries within the European Association ofNational Metrology Institutes and the European Union.
■ ABBREVIATIONSNA, numerical aperture; NTA, nanoparticle tracking analysis;PBS, phosphate-buffered saline; PMMA, poly(methyl meth-acrylate); PS, polystyrene; PSD, particle size distribution;PTFE, polytetrafluoroethylene; RI, refractive index; RNA,
Figure 5. Size and RI determination of urinary vesicles in phosphate-buffered saline by NTA. (A) Scattering cross section versus diametercalculated by Mie theory (lines) and measured for urinary vesicles withcamera gain 100 (red circles), 350 (blue squares), and 470 (greentriangles). (B) Particle size distribution (black line) of urinary vesicles.(C) RI distribution of urinary vesicles (black) and the range ofestimates from literature (vertical green bar).
Nano Letters Letter
dx.doi.org/10.1021/nl503371p | Nano Lett. 2014, 14, 6195−62016199

ribonucleic acid; SD, standard deviation; Si, Silica; TEM,transmission electron microscopy
■ REFERENCES(1) Knoner, G.; Parkin, S.; Nieminen, T. A.; Heckenberg, N. R.;Rubinsztein-Dunlop, H. Measurement of the index of refraction ofsingle microparticles. Phys. Rev. Lett. 2006, 97 (15), 157402.(2) Bohren, C. F.; Huffman, D. R. Absorption and scattering of light bysmall particles; Wiley: New York, 1983.(3) Bendix, P. M.; Oddershede, L. B. Expanding the Optical TrappingRange of Lipid Vesicles to the Nanoscale. Nano Lett. 2011, 11 (12),5431−5437.(4) Righini, M.; Ghenuche, P.; Cherukulappurath, S.;Myroshnychenko, V.; de Abajo, F. J. G.; Quidant, R. Nano-OpticalTrapping of Rayleigh Particles and Escherichia coli Bacteria withResonant Optical Antennas. Nano Lett. 2009, 9 (10), 3387−3391.(5) Charriere, F.; Marian, A.; Montfort, F.; Kuehn, J.; Colomb, T.;Cuche, E.; Marquet, P.; Depeursinge, C. Cell refractive indextomography by digital holographic microscopy. Opt. Lett. 2006, 31(2), 178−180.(6) Ferraris, C. F.; Guthrie, W.; Aviles, A. I.; Haupt, R.; MacDonald,B. S. Certification of SRM 114q: Part I; National Institute of Standardsand Technology: Gaithersburg, MD, 2005; Volume 05, pp 260−261.(7) Jewell, R. B.; Rathbone, R. F. Optical properties of coalcombustion byproducts for particle-size analysis by laser diffraction.Coal Combust. Gasif. Prod. J. 2009, 1, 1−7.(8) Mills, G. L.; Lane, P. A.; Weech, P. K. A guidebook to lipoproteintechniques; Elsevier: Amsterdam, 2000.(9) Ungureanu, C.; Rayavarapu, R. G.; Manohar, S.; van Leeuwen, T.G. Discrete dipole approximation simulations of gold nanorod opticalproperties: Choice of input parameters and comparison withexperiment. J. Appl. Phys. 2009, 105 (10), 102032.(10) Forster, P.; Ramaswamy, V.; Artaxo, P.; Berntsen, T.; Betts, R.;Fahey, D.; Haywood, J.; Lean, J.; Lowe, D.; Myhre, G.; Nganga, J.;Prinn, R.; Raga, G.; Schultz, M.; Van Dorland, R. Changes inatmospheric constituents and in radiative forcing. In Climate change2007: The physical science basis. Contribution of Working Group I to theFourth Assessment Report of the Intergovernmental Panel on ClimateChange, 20th ed.; Solomon, S., Qin, D., Manning, M., Chen, Z.,Marquis, M., Averyt, K., Tignor, M., Miller, H., Eds.; CambridgeUniversity Press: Cambridge, United Kingdom, 2007; pp 129−234.(11) Miles, R. E. H.; Rudic, S.; Orr-Ewing, A. J.; Reid, J. P.Measurements of the wavelength dependent extinction of aerosols bycavity ring down spectroscopy. Phys. Chem. Chem. Phys. 2010, 12 (15),3914−3920.(12) Stramski, D. Refractive index of planktonic cells as a measure ofcellular carbon and chlorophyll a content. Deep Sea Res., Part I 1999,46 (2), 335−351.(13) Mackowiak, S. A.; Schmidt, A.; Weiss, V.; Argyo, C.; vonSchirnding, C.; Bein, T.; Brauchle, C. Targeted Drug Delivery inCancer Cells with Red-Light Photoactivated Mesoporous SilicaNanoparticles. Nano Lett. 2013, 13 (6), 2576−2583.(14) Jang, S. C.; Kim, O. Y.; Yoon, C. M.; Choi, D. S.; Roh, T. Y.;Park, J.; Nilsson, J.; Lotvall, J.; Kim, Y. K.; Gho, Y. S. BioinspiredExosome-Mimetic Nanovesicles for Targeted Delivery of Chemo-therapeutics to Malignant Tumors. ACS Nano 2013, 7 (9), 7698−7710.(15) Gujrati, V.; Kim, S.; Kim, S. H.; Min, J. J.; Choy, H. E.; Kim, S.C.; Jon, S. Bioengineered Bacterial Outer Membrane Vesicles as Cell-Specific Drug-Delivery Vehicles for Cancer Therapy. ACS Nano 2014,8, 1525−1537.(16) Ungureanu, C.; Kroes, R.; Petersen, W.; Groothuis, T. A. M.;Ungureanu, F.; Janssen, H.; van Leeuwen, F. W. B.; Kooyman, R. P.H.; Manohar, S.; van Leeuwen, T. G. Light Interactions with GoldNanorods and Cells: Implications for Photothermal Nanotherapeutics.Nano Lett. 2011, 11 (5), 1887−1894.(17) Manohar, S.; Ungureanu, C.; van Leeuwen, T. G. Goldnanorods as molecular contrast agents in photoacoustic imaging: the
promises and the caveats. Contrast Media Mol. Imaging 2011, 6 (5),389−400.(18) Krpetic, Z.; Nativo, P.; See, V.; Prior, I. A.; Brust, M.; Volk, M.Inflicting Controlled Nonthermal Damage to Subcellular Structures byLaser-Activated Gold Nanoparticles. Nano Lett. 2010, 10 (11), 4549−4554.(19) Rozhkova, E. A.; Ulasov, I.; Lai, B.; Dimitrijevic, N. M.; Lesniak,M. S.; Rajh, T. A High-Performance Nanobio Photocatalyst forTargeted Brain Cancer Therapy. Nano Lett. 2009, 9 (9), 3337−3342.(20) Kumar, A.; Vemula, P. K.; Ajayan, P. M.; John, G. Silver-nanoparticle-embedded antimicrobial paints based on vegetable oil.Nat. Mater. 2008, 7 (3), 236−241.(21) Allen, N. S.; Edge, M.; Ortega, A.; Liauw, C. M.; Stratton, J.;McIntyre, R. B. Behaviour of nanoparticle (ultrafine) titanium dioxidepigments and stabilisers on the photooxidative stability of water basedacrylic and isocyanate based acrylic coatings. Polym. Degrad. Stab.2002, 78 (3), 467−478.(22) Zhang, W.; Saliba, M.; Stranks, S. D.; Sun, Y.; Shi, X.; Wiesner,U.; Snaith, H. J. Enhancement of Perovskite-Based Solar CellsEmploying Core-Shell Metal Nanoparticles. Nano Lett. 2013, 13 (9),4505−4510.(23) Barer, R.; Tkaczyk, S. Refractive index of concentrated proteinsolutions. Nature 1954, 173, 821−822.(24) Hart, S. J.; Leski, T. A. Refractive index determination of biologicalparticles; ADA454180; U.S. Naval Research Laboratory: Washington,DC, Jul 31, 2006.(25) Ma, X. Y.; Lu, J. Q.; Brock, R. S.; Jacobs, K. M.; Yang, P.; Hu, X.H. Determination of complex refractive index of polystyrenemicrospheres from 370 to 1610 nm. Phys. Med. Biol. 2003, 48 (24),4165−4172.(26) Lang-Yona, M.; Rudich, Y.; Segre, E.; Dinar, E.; Abo-Riziq, A.Complex Refractive Indices of Aerosols Retrieved by ContinuousWave-Cavity Ring down Aerosol Spectrometer. Anal. Chem. 2009, 81(5), 1762−1769.(27) Varga, Z.; Yuana, Y.; Grootemaat, A. E.; van der Pol, E.;Gollwitzer, C.; Krumrey, M.; Nieuwland, R. Towards traceable sizedetermination of extracellular vesicles. J. Extracell. Vesicles 2014, 3(23298), 1−10.(28) Barnes, M. D.; Lermer, N.; Whitten, W. B.; Ramsey, J. M. ACCD based approach to high-precision size and refractive indexdetermination of levitated microdroplets using Fraunhofer diffraction.Rev. Sci. Instrum. 1997, 68 (6), 2287−2291.(29) Chylek, P.; Ramaswamy, V.; Ashkin, A.; Dziedzic, J. M.Simultaneous determination of refractive-index and size of sphericaldielectric particles from light-scattering data. Appl. Opt. 1983, 22 (15),2302−2307.(30) Pluchino, A. B.; Goldberg, S. S.; Dowling, J. M.; Randall, C. M.Refractive-index measurements of single micron-sized carbon particles.Appl. Opt. 1980, 19 (19), 3370−3372.(31) Konokhova, A. I.; Yurkin, M. A.; Moskalensky, A. E.;Chernyshev, A. V.; Tsvetovskaya, G. A.; Chikova, E. D.; Maltsev, V.P. Light-scattering flow cytometry for identification and character-ization of blood microparticles. J. Biomed. Opt. 2012, 17 (5),0570061−0570068.(32) Ackleson, S. G.; Spinrad, R. W. Size and refractive-index ofindividual marine particulates - a flow cytometric approach. Appl. Opt.1988, 27 (7), 1270−1277.(33) Kolesnikova, I. V.; Potapov, S. V.; Yurkin, M. A.; Hoekstra, A.G.; Maltsev, V. P.; Semyanov, K. A. Determination of volume, shapeand refractive index of individual blood platelets. J. Quant. Spectrosc.Radiat. Transfer 2006, 102 (1), 37−45.(34) Doornbos, R. M. P.; Schaeffer, M.; Hoekstra, A. G.; Sloot, P. M.A.; deGrooth, B. G.; Greve, J. Elastic light-scattering measurements ofsingle biological cells in an optical trap. Appl. Opt. 1996, 35 (4), 729−734.(35) Ulanowski, Z.; Greenaway, R. S.; Kaye, P. H.; Ludlow, I. K.Laser diffractometer for single-particle scattering measurements. Meas.Sci. Technol. 2002, 13 (3), 292−296.
Nano Letters Letter
dx.doi.org/10.1021/nl503371p | Nano Lett. 2014, 14, 6195−62016200

(36) van der Pol, E.; Boing, A. N.; Harrison, P.; Sturk, A.; Nieuwland,R. Classification, functions and clinical relevance of extracellularvesicles. Pharmacol Rev. 2012, 64 (3), 676−705.(37) Dragovic, R. A.; Gardiner, C.; Brooks, A. S.; Tannetta, D. S.;Ferguson, D. J. P.; Hole, P.; Carr, B.; Redman, C. W. G.; Harris, A. L.;Dobson, P. J.; Harrison, P.; Sargent, I. L. Sizing and phenotyping ofcellulars vesicles using Nanoparticle Tracking Analysis. Nanomedicine2011, 7 (6), 780−788.(38) Braeckmans, K.; Buyens, K.; Bouquet, W.; Vervaet, C.; Joye, P.;De Vos, F.; Plawinski, L.; Doeuvre, L.; Angles-Cano, E.; Sanders, N.N.; Demeester, J.; De Smedt, S. C. Sizing Nanomatter in BiologicalFluids by Fluorescence Single Particle Tracking. Nano Lett. 2010, 10(11), 4435−4442.(39) van der Pol, E.; Coumans, F.; Grootemaat, A. E.; Gardiner, C.;Sargent, I. L.; Harrison, P.; Sturk, A.; van Leeuwen, T. G.; Nieuwland,R. Particle size distribution of exosomes and microvesicles bytransmission electron microscopy, flow cytometry, nanoparticletracking analysis, and resistive pulse sensing. J. Thromb. Haemostasis2014, 12 (7), 1182−1192.(40) Biller, S. J.; Schubotz, F.; Roggensack, S. E.; Thompson, A. W.;Summons, R. E.; Chisholm, S. W. Bacterial vesicles in marineecosystems. Science 2014, 343 (6167), 183−186.(41) van der Pol, E.; Hoekstra, A. G.; Sturk, A.; Otto, C.; vanLeeuwen, T. G.; Nieuwland, R. Optical and non-optical methods fordetection and characterization of microparticles and exosomes. J.Thromb. Haemostasis 2010, 8 (12), 2596−2607.(42) McMeekin, T. L.; Wilensky, M.; Groves, M. L. Refractive indicesof proteins in relation to amino acid composition and specific volume.Biochem. Biophys. Res. Commun. 1962, 7 (2), 151−156.(43) Shih, S. J.; Yagami, M.; Tseng, W. J.; Lin, A. Validation of aquantitative method for detection of adenovirus aggregation.Bioprocess. J. 2011, 9 (2), 25−33.(44) Oster, G. Two-phase formation in solutions of tobacco mosaicvirus and the problem of long-range forces. J. Gen. Physiol. 1950, 33(5), 445−473.(45) van der Pol, E.; van Gemert, M. J. C.; Sturk, A.; Nieuwland, R.;van Leeuwen, T. G. Single versus swarm detection of microparticlesand exosomes by flow cytometry. J. Thromb. Haemostasis 2012, 10 (5),919−30.(46) Tatischeff, I.; Larquet, E.; Falcon-Perez, J. M.; Turpin, P. Y.;Kruglik, S. G. Fast characterisation of cell-derived extracellular vesiclesby nanoparticles tracking analysis, cryo-electron microscopy, andRaman tweezers microspectroscopy. J. Extracell. Vesicles 2012, 1, 1−11.(47) Gardiner, C.; Ferreira, Y. J.; Dragovic, R. A.; Redman, C. W. G.;Sargent, I. L. Extracellular vesicle sizing and enumeration bynanoparticle tracking analysis. J. Extracell. Vesicles 2013, 2 (19671),1−11.(48) Matzler, C. MATLAB functions for Mie scattering and absorption,2002−11 ed.; Institut fur Angewandte Physik: Hamburg, 2002; p 02.(49) Kasarova, S. N.; Sultanova, N. G.; Ivanov, C. D.; Nikolov, I. D.Analysis of the dispersion of optical plastic materials. Opt. Mater. 2007,29 (11), 1481−1490.(50) The Matlab particle tracking code repository; GeorgetownUniversity: Washington, DC, 2008.(51) Hart, S. J.; Terray, A. V. Refractive-index-driven separation ofcolloidal polymer particles using optical chromatography. Appl. Phys.Lett. 2003, 83 (25), 5316−5318.(52) Michalet, X.; Berglund, A. J. Optimal diffusion coefficientestimation in single-particle tracking. Phys. Rev. E 2012, 85 (6).(53) Cachau R. E.; Braden B. C.; Collins J. R.; Casas-Finet J. R.Nanoparticles characterization using HDR-NTA image analysis; SPIEPhotonics West, San Francisco, CA, USA, February 2014; pp 8954−34.(54) Kindt, J. D. Optofluidic intracavity spectroscopy for spatially,temperature, and wavelength dependent refractometry. M.Sc. Thesis,Colorado State University, Fort Collins, CO, 2012.(55) Chandler, W. L.; Yeung, W.; Tait, J. F. A new microparticle sizecalibration standard for use in measuring smaller microparticles using anew flow cytometer. J. Thromb. Haemostasis 2011, 9, 1216−1224.
(56) van Manen, H. J.; Verkuijlen, P.; Wittendorp, P.; Subramaniam,V.; van den Berg, T. K.; Roos, D.; Otto, C. Refractive index sensing ofgreen fluorescent proteins in living cells using fluorescence lifetimeimaging microscopy. Biophys. J. 2008, 94 (8), L67−L69.(57) Beuthan, J.; Minet, O.; Helfmann, J.; Herrig, M.; Muller, G. Thespatial variation of the refractive index in biological cells. Phys. Med.Biol. 1996, 41 (3), 369−382.(58) Foladori, P.; Quaranta, A.; Ziglio, G. Use of silica microsphereshaving refractive index similar to bacteria for conversion of flowcytometric forward light scatter into biovolume. Water Res. 2008, 42(14), 3757−3766.(59) Barer, R. Refractometry and interferometry of living cells. J. Opt.Soc. Am. 1957, 47 (6), 545−556.
Nano Letters Letter
dx.doi.org/10.1021/nl503371p | Nano Lett. 2014, 14, 6195−62016201