regional disparities and marginalisation in...
TRANSCRIPT

REGIONAL DISPARITIES AND MARGINALISATION IN KENYA

Regional Disparities and Marginalisation in Kenya i
Regional Disparities and Marginalisation in Kenya

ii Regional Disparities and Marginalisation in Kenya
Regional Disparities and Marginalisation in Kenya
© Friedrich-Ebert-Stiftung, 2012
All inquiries regarding acquisition, use, reproduction and other forms of handling this text that may need the copyright owner’s permission should be addressed to:
Friedrich-Ebert-StiftungPeponi Plaza, 1st Floor, D2Mwanzi Road off Peponi Road, WestlandsP.O Box 14932-00800 Nairobi, KenyaPhone: 254-20-3748338Fax: 254-20-3746992E-Mail: [email protected]
ISBN No: 9966-957-68-5
Printed by:Elite PrePress Ltd.P.O. Box 75289-00200Nairobi, Kenya
Design & Layout:Sunburst Communications Ltd.P.O. Box 43193-00100 Nairobi, KenyaEmail: [email protected]

iiiRegional Disparities and Marginalisation in Kenya
Contents
Foreword iv
Introduction and Overview 1
The Political Dynamics of Regional Disparities and Marginalisation in Kenya 4
Marginalisation and Conflict in Kenya 30
Regional Disparities in Employment and Human Development in Kenya 46
Regional Disparities in Social Development 70
Bibliography 94

iv Regional Disparities and Marginalisation in Kenya
Foreword
The Constitution of 2010 marks the end of a dark past and opens up a new chapter of Kenya‘s political history. However, while it provides for radical changes in the running of the affairs of the country and gives greater say and participation to communities through the devolved system, it also creates new avenues for marginalization and regional disparities to emerge on the basis of the new county structures. A big allure of a devolved system is its promise to bring about equitable distribution of national resources and therefore address socio-economic inequalities that were inherent in a centralized system for many decades.
Yet even with the new governance framework well established, inequality and marginalization will not disappear within a short term. And the biggest challenge will perhaps emerge from new cleavages and old rivalries that were largely submerged by the tight control of the central governance. The introduction of devolved governance that is designed to be a panacea to regional disparities and marginalization, to ethnic rivalries about the control of financial, economic and political resources anticipated to be taken to counties, could easily usher in new conflicts within and between counties. Renewed marginalization and ethnic nationalism could undermine peace, stability, governance and effective service delivery. Therefore, in the new governance framework conflicts caused by marginalization and regional discontent are no more dismissible issues.
Disparities are not amenable to fast remedy, and will remain a policy challenge to the government as well as the non-state actors. They are manifest on different levels which are addressed by the contributions to this reader: • Disparity in economic diversity and activities as well as economic development infrastructure
(number and types of institutions, economic activities, size of credits and deposits, and a notable difference in the age structure indicating migration of labour to the capital).
• Disparity in human development levels on the basis of ethnicity, class, region, gender, age and disabilities, e.g. literacy levels, school enrolment. This disparity will have a significant future impact on productive capacity and diversity of economic activities.
• Disparity in social structure and living conditions between and among Kenyan communities especially in terms of income levels, percentage of the poor, and distribution of social infrastructure.
• Disparity in political representation and participation in decision-making processes and generalized access to and use of political resources.
This publication seeks to interrogate the dynamics of marginalization and regional disparities in Kenya with a view to proposing policy options for addressing them. It is our sincere hope that the book may help alert about the urgency of founding the new political dispensation on a balanced social and economic underpinning.
Caleb M. KhisaPeter OesterdiekhoffFriedrich-Ebert-Stiftung

1Regional Disparities and Marginalisation in Kenya
Introduction and Overview
Since attaining political independence in 1963, Kenya has been grappling with the persistent problem of unbalanced regional development. Through various policies and interventions, the government has tried to reverse the discriminative effects of colonial policies that had created wide disparities and imbalances between regions. However, after decades of experimenting with different economic and social policies, regional disparities and imbalances in economic, social and political development still persist.
A 2007 report on well-being in Kenya confirmed the persistence of disparities. The report proportion of the population living below the absolute poverty line was lowest in Central Kenya, followed by Rift Valley, Nyanza, Eastern, Western, Coast and North Eastern provinces. The report also indicated that the wincidence of poverty has been increasing over time in Coast and North Eastern provinces.
Wide disparities also exist between urban and rural areas, with 85 per cent of all poor people living in rural areas while the majority of the urban poor live in slums and peri-urban settlements. The percentage of hardcore poverty in the rural areas declined from 34.8 per cent in 1997 to 21.9 per cent in 2005/6, while the percentage of urban hardcore poverty increased from 7.6 per cent in 1997 to 8.3 per cent in 2005/6. At the same time, a person born in Nyanza Province could expect to live 16 years less than a person born in Central Province. While 93 per cent of adult women in North Eastern Province had no education at all, only 3 per cent of adult women in Central Province had never been to school. These disparities, while narrowing, continue today: only 19 per cent of eligible girls in North Eastern Province were enrolled in primary school in 2005/06, against 87 per cent in Central Province. Differences between urban and rural conditions are similarly striking, with urban households much more likely to have access to health care, schools and piped water than those in rural areas.
At the national level, the 10 per cent of the richest households in Kenya control about 36 per cent of national wealth, while the poorest 10 per cent control less than 2 per cent. Regional disparities are also vast. About 74 per cent of people living in North Eastern Province are poor, against only 30 per cent of those in Central Province. The high poverty rate of people of North Eastern Province makes them exceptionally vulnerable to weather and price shocks. Women are much less likely than men to have completed

2 Regional Disparities and Marginalisation in Kenya
secondary school education and to be employed in the formal sector. However, female-headed households are only slightly more likely to be poor than male-headed ones (50 per cent compared with 49.1 per cent). Within the same context, gender disparities in employment opportunities and economic investment patterns in Kenya have continued to widen across all sectors of the economy and at various levels of development intervention.
The above trend has led to increased unemployment, under-employment, poverty and powerlessness among many Kenyan women. Part of the reason for the persistent inequity is the slow pace of mainstreaming gender into employment creation and poverty eradication policies, programmes and strategies in a coordinated, multi-sectoral and crosscutting way. The other reason relates to the existence of social, cultural and structural barriers to effective female participation in the labour force. These and other factors have jointly contributed to the low pay and productivity of women’s labour and to their continued under-representation in senior management positions within the public and private sectors.
Regional inequalities and imbalances have increasingly become a source of political and social conflict. In 2007/08, for example, Kenya experienced post election violence predicated on extreme weaknesses of ethnicised governance systems. These were rooted in numerous cases of historical injustices emergent of marginalisation associated with the previous regimes. Common of the three regimes are the on-going crises of marginalisation and regional imbalances that various communities of differing ethnic origin, class, generation and gender have persistently experienced. Even though Kenya developed and promulgated a new Constitution in 2010, the country still suffers from traditional power imbalances between the male and female gender; resource distribution continues to entail a dark lining of inequality based on region, ethnicity, and class; infrastructural development continues to marginalise the already marginalised communities; and public service continues to exhibit generalised ethnic imbalances in favour of communities whose members have occupied the presidency.
While the new Constitution promises radical changes in the management of the country’s affairs and gives greater say to communities through participation in the devolved system, it also creates new avenues through which deepened cases of marginalisation and disparities can emerge on the basis of the new county structures. The greatest allure of a devolved system is its promise to engender equitable distribution of national resources and, therefore, address socio-economic inequalities that were inherent in a centralised system for many decades. Yet, the biggest challenge of this system lies in new fears, and in some cases old rivalries, that were largely submerged by the tight

3Regional Disparities and Marginalisation in Kenya
control of the central government emerging in the form of renewed marginalisation and ethnic nationalism which, if left unaddressed, could undermine the peace, stability, governance and service delivery. As a result, conflicts emerging from marginalisation and regional discontent are not easy to dismiss in the new governance framework.
Addressing regional disparities in Kenya call for a fresh approach that provides a multifaceted and multi-sectoral framework that fosters more balanced economic development in the country. Such an approach could revolve around the formulation and implementation of equity-oriented policies and programmes; the formulation and implementation of integrated regional development framework; reforms in the legal environment in order to create a more cohesive framework for addressing regional disparities and a robust monitoring framework that will develop and monitor the achievement of key indicators and milestones of balanced regional development. Further, recognising the various actors in regional development is critical. However, lack of effective coordination mechanisms could impede efforts to promote balanced regional development.

4 Regional Disparities and Marginalisation in Kenya
The Political Dynamics of Regional Disparities and Marginalisation in Kenya1
IntroductionThe dynamics of regional disparities, economic inequalities and marginalisation in Kenya have recently attracted a number of studies. One of the most recent and comprehensive studies is the Society for International Development (SID) title, Readings on Inequality in Kenya: Sectoral Dynamics and Perspectives. This 2006 study covered different aspects of disparities in Kenya, economic inequalities and marginalisation. From this and other studies on Kenya, a number of important conclusions can be drawn about regional disparities, inequality and marginalisation:
The first and most important is that issues concerning regional disparities, economic inequalities and marginalisation in Kenya are more complex and paradoxical than common discussions have been able to capture and that the “so-called” causes and the suggested policy remedies leave a lot to be desired. The current literature assumes a commonality of interests on a regional and/or ethnic basis. The literature also assumes that inequalities, marginalisation and other disparities only occur across ethnic groups and regions, and hence intra-regional or intra-ethnic disparities, inequalities and marginalisation are not studied. Another assumption is that when one is elected or appointed to a key position in government, such an appointment is a benefit to the entire community or region to which the appointee belongs.
The second, and related to the above, is that even when a region has what appears to be significant levels of advantage, such advantage is not generally shared region-wide and tends to benefit only a small group or elite. That is, such advantages are confined to a sub-region, or a number of elites within the community, leaving out large areas of the region or leaving out a large number of people not enjoying these benefits. With the country moving away from the centralised unitary system to a county-oriented governance system, there is need to shift focus to also include intra-regional and intra-ethnic inequalities, disparities and marginalisation marginalisation with a view to seeking ways of mediating them.
Third, although there is evidence of inequalities and disparities in the composition and recruitment of officers running the public sector, these inequalities and disparities do
1 Joshua Kivuva, PhD, Department of Political Science and Public Administration, University of Nairobi.

5Regional Disparities and Marginalisation in Kenya
not necessarily favour any one particular ethnic group or region to the total exclusion of the others. In fact, successive governments, including the colonial government, favoured and disadvantaged different groups and regions. Indeed, each incoming regime or transition resulted in altering the structure of governance institutions because the incoming elite felt insecure to govern using the inherited framework over which it had no control.
Fourth, there is not a region or community that seems to be completely disadvantaged or totally marginalised. Different communities and regions and different population sizes seem to enjoy different advantages. Similarly, every new administration or regime brings with it a new set of elites and benefits a different region/regions or groups and elites. In parliamentary representation, for example, there is evidence that minorities are in fact more represented than the numerically large groups.
Fifth, it is also important to note that successive governments in Kenya made little effort to equalise development by either allocating resources fairly or by favouring resource disadvantaged regions. This was the case despite the publication of the Sessional Paper No. 1 of 1986 on Economic Management for Renewed Economic Growth, which stated that income gaps would be addressed by raising the productivity and income of farmers, herdsmen and workers of the informal sector.
Finally, the share of development spending in the overall budget allocation has since independence been quite low — at below 20 per cent. Its allocation, even if it had been fairly carried out, would have marginalised certain areas/regions and communities.
Marginalisation, Inequalities and Disparities in KenyaEconomic inequalities, regional or ethnic disparities and marginalisation marginalisation in a society depend on a number of factors. Brian Cooksey, David Court and Ben Makau, attribute problems of inequalities to the economic mode of colonial development; the uneven spread of missionary activity; and, the variable intensity of local self-help activity. Cooksey et al, however, point out that the seriousness of these disparities as threats to nationhood and social cohesion derived from the fact that they tended to coincide with ethnic, linguistic, religious and economic cleavages, which in turn found expression in particularistic loyalties and demands for a greater share of national resources (Cooksey et al, 1994: 201).
Jane Karingai attributes inequalities in Kenya to such factors as historical, natural resource endowments, political patronage, policy choices and cultural norms, exogenous

6 Regional Disparities and Marginalisation in Kenya
factors such as trade and technology, and even bureaucratic excesses. These factors become more pronounced in an environment where taxation and public expenditure policies, budgeting and governance institutions are weak and not impervious to political and bureaucratic manipulations. In countries where oversight institutions are weak, distortions in public spending are not uncommon—the budget is not immune to bureaucratic manipulations; senior civil servants misdirect public spending in favour of certain regions or projects, factors which contribute to misallocation of resources and inequalities (Karingai, 2006: 15).
Ethno-regional disparities in Kenya, economic inequalities and marginalisation marginalisation can be explained from a number of perspectives: The first is a nature-based explanation where the origins of regional disparities are seen as the result of the migratory patterns of the various ethnic groups and differences in economic and resource endowment of the various regions that each group settled, as well as the manner in which each group’s cultural practices influenced capitalist penetration in the regions in which it settled. Weather and climatic conditions the settled regions continue to play an important role as well. Each community, therefore, settled in areas suitable to continue their practices. Those that led a pastoralist life settled in areas with abundant grazing land, where they could raise their animals. Cultivators settled in areas with rich fertile soils for their crops. Some communities settled in arid and semi arid areas while others settled in more fertile areas. Fish eaters settled alongside rivers or near lakes. Similarly, while some communities settled in resource rich regions, others settled in resource scarcity regions. Therefore, much of the marginalisation and inequalities seen in Kenya have their roots in the migratory and settlement patterns of the various communities.
The second is a class-based explanation. Marginalisation Marginalisation, inequalities and other aspects of disparities have a class dimension as well. For example, the distribution of the 1.2 million acres of land taken from the departing settlers with financing from the British government, the World Bank and the Colonial Development Fund and meant to settle families in the 1960s ended up being transferred to wealthy Africans organised in partnerships or limited liability companies, giving rise to a new land policy in Kenya that was based on class rather than race (Ogot, 1995:64).
The third explanation is in terms of access to public services such as education and health care provided by the government. Access to education is particularly important to understanding the perpetration of inequalities since independence. Education has been universally accepted as the basis for material advancement and for enhancing one’s prospects in employment, job advancement, salary and even status. Therefore, those

7Regional Disparities and Marginalisation in Kenya
communities that had access to schools, and those students who had access to high cost schools, had an advantage over the rest. In this regard, the education system reproduced, not altered, the economic, social and political structures inherited at independence.
During the colonial period, education was used as an important instrument of discrimination and exclusion. Education in Kenya was characterised by both segregated schools as well inequality in terms of quality, content, curriculum and infrastructure. European schools were better equipped, had better infrastructure, better teachers, more books and greater government spending than African ones. Although these formerly European schools were opened up to Africans, they were nevertheless made high cost, meaning that only the children of the emerging African elites could access them -- thanks to the high fees charged. These schools were also found in or near Nairobi and, therefore, only a few students knew of their existence.
The fourth explanation of ethno-regional disparities, marginalisation and other inequalities in Kenya are related to the state, the struggles to control the state and other institutions of the state as well as the state’s discriminatory and exclusionary policies that were meant to either provide advantages to certain communities and regions or to discriminate against others. This has taken a number of forms: First, political patronage and other policies pursued by successive governments in Kenya (including the colonial state) tended to provide state resources in such a skewed manner that they benefited mostly those that controlled the state and/ or certain regions.
Second, the appointment and recruitment of state officers, which had favoured certain regions and ethnic groups since independence, gave regional disparities an ethnic basis. Third, disparities have been perpetuated by the unfair system of representation, which has seen certain areas being over-represented while others are grossly under-represented. This is because the creation of areas or units of parliamentary representation (constituencies as they are known in Kenya) was not based on population size or the size of territory but had, since independence, depended on the arbitrariness of the president. Finally, marginalisation, inequalities and other forms of disparities have also been the result of ethnicity and ethnic-based politics, which have since colonialism been a central basis of discrimination.
Ethno-regional disparities and marginalisation have been exacerbated by the discriminatory nature in which: a) the cabinet membership and other senior positions in government, the public sector and parastatal bodies have been allocated; b) the discriminatory nature of public spending, especially the manner in which the government financed infrastructural development and other big contracts were

8 Regional Disparities and Marginalisation in Kenya
awarded; c) national resource endowments; d) political patronage; and, e) corruption, bureaucratic discretion and elite excesses. The latter reasons have influenced the manner in which public resources have been disproportionally used to provide public services such as education and health, which have exacerbated inequalities and marginalisation.
Finally, marginalisation and economic inequalities were (and still are) rife in different regions. Indeed, in almost every region in Kenya, besides the broader regional cleavages, there have been local social, economic and political divisions, which provided the basis for factionalisation, marginalisation and inequalities -- even within regions and ethnic groups. Even in Central Province, the better-off region in Kenya, landlessness has remained a common feature of life in many parts.
Colonialism, Inequalities and Marginalisation in KenyaKenya’s political economy was molded by colonialism (Ochieng’, 1995: 83) in which most of what was produced in Kenya was exported to Europe but the proceeds never returned to develop the country’s economy or its people. Colonialism also created a dual state in Kenya in which European settlers were provided with large fertile tracts of land while Africans were confined to reserves to be sources of cheap labour. In the segregated system, settlers were provided with the means and opportunities for accumulation, while Africans were denied the same. Segregation in the White Highlands did not just separate Europeans and Africans; Africans in the reserves were also segregated from one another, where they were treated differently, depending on their perceived level of cooperation. Those communities that cooperated with the colonial administration were treated better than those that resisted.
The colonial state was also an “exclusionary” and “segregationist” one. State sanctioned segregation and exclusion, or what Mamdani (1996) calls the ‘bifurcated state”, was replicated in the major towns where racial segregation went hand in hand with the ethnicisation of African settlements and reserves.2 The imposition of colonial rule in Kenya entailed a process of Westernisation and capitalist penetration of the African economy, which saw the replacement of the African mode of production by a capitalist one and the integration of African economies into the Western capitalist system but in an exploitative and segregated manner that disadvantaged the former. Those areas of Kenya such as Central Province and Nyanza, which were penetrated earlier by capitalism
2 In the major towns the Kipande system was introduced to ensure that Africans lived and worked in ethnically designated areas, and through a special identity card, the Kipande, it was possible for the colonial administrator to enforce the segregation law since the special identity card indicated the specific areas where the bearer could safely reside or work.

9Regional Disparities and Marginalisation in Kenya
and Western influences developed much earlier than those places where colonisation and Westernisation did not penetrate.
Inequalities and marginalisation in Kenya, therefore, came into being as a result of the uneven penetration of capitalism and Western influence in the country with the onslaught of colonialism. The colonial government concentrated development only in a number of selected regions such as Central Kenya (Kiambu, Nyeri and Murang’a), Eastern (Machakos and Meru); Western (Kakamega and Bungoma); Nyanza (Kisumu and Kisii); and a few urban areas, namely, Nairobi, Mombasa, Kisumu and Nakuru. This left vast areas in the Rift Valley, Coast and North Eastern provinces undeveloped. These areas lagged behind in education, infrastructure and agricultural development, despite many of them being ideal for agriculture. Thus, at independence, some parts of Kenya were “highly economically developed and modern, while others were still using indigenous modes of production” (Ochieng’, 1995: 89).
The uneven development under colonialism corresponded to and had been intersected by regional, ethnic and class factors. Due to their early and more intense penetration by capitalism, Central Province and parts of Nyanza developed much faster than the rest of Kenya. When the State of Emergency was declared and the development of Kikuyu regions slowed down, the Luo petty bourgeoisie and political elite took over the leadership of the nationalist movement, which also entrenched the Luo politically by the time of independence (Ogot, 1995:66). However, owing to the disagreements between Jaramogi Oginga Odinga and Kenyatta, which ended in the former leaving KANU and founding the Kenya Peoples’ Union (KPU), the Luo were subsequently marginalised politically and were, therefore, unable to control important institutions of the state. This explains their political marginalisation, especially in the post-1970 period.
In the Rift Valley and Coast regions, capitalism and colonialism was less developed and the petty-bourgeois classes much smaller and more vulnerable than their Central Province counterparts. Unlike the Luo, the Kalenjin of the Rift Valley lived in close proximity to the White Highlands and feared the possibility of the Kikuyu claiming the White Highlands or even “colonising” them once independence was gained. According to Ogot, this fear was fuelled by the tens of thousands of landless Kikuyu agitating for land in the area, as well as ongoing inflammatory speeches by radical Kikuyu leaders. Similar fears faced the coastal peoples who were afraid of being dominated by upcountry peoples, who already formed the bulk of the labour force in the region. The coastal peoples, who had previously been dominated by the Arabs, were especially afraid of being dominated by the upcountry people as well (Ogot, 1995:66). This fear, to a large extent, was the reason the nomadic peoples of the Rift Valley, together with other

10 Regional Disparities and Marginalisation in Kenya
minority groups, formed the Kenya African Democratic Union (KADU) to compete with the Kenya African National Union (KANU) that represented the interests of the more dominant ethnic groups.
Colonial segregation created a racially tiered society in which Europeans and other colonial administrators were at the top of the pyramid, Asians (Indians, Pakistanis and Goans) and Arabs occupied the second tier, while Africans occupied the bottom level. While Europeans had all the privileges, Africans had none and were forced to work -- with little or no pay -- for the Europeans. Though Asians and Arabs did not have many privileges, they were nevertheless allowed to freely trade and engage in small businesses. The Africans also had the privileged among them -- including teachers, clerks, lawyers, skilled workers, nurses and domestic workers. It was this group of Africans that was to later lead the nationalist movement. At independence, these groups of petty bourgeoisie, in collaboration with the ruling elites, would use the state as an instrument for further accumulation.
Further marginalisation of Africans occurred when they were denied access and participation in the profitable cash and export crop production as a way of forcing them to work for the settlers. The colonial administration also denied Africans commercial credits and alienated their land, which greatly limited African agricultural production and access to fresh land. Further marginalisation of Africans was ensured through the introduction of Hut and Poll taxes which impoverished many and forced many young productive Africans to work in the settlers for little or no pay.
The Paradoxes of Marginalisation and Inequalities in KenyaIn the article, “Governance Institutions and Inequality in Kenya”, Prof Karuti Kanyinga points to the existence of a relationship between ethnicity and resource distribution and, therefore, between ethno-regional imbalances and development in Kenya. Kanyinga shows the disparity in terms of development between and among the eight former provinces of Kenya and since some of the regions are home to a numerically large group, he concludes that there is ethno-regional disparity in development in Kenya. This means that some regions and ethnic groups are collectively poorer than others in that they have fewer opportunities to improve their wellbeing and enjoy fewer services while others are generally better off and have more opportunities (Kanyinga, 2006).
Looked at from a national perspective, Central Province is on the whole better off than the other provinces in terms of wealth and opportunities, while North Eastern and Coast provinces seem to have the least opportunities and are the poorest. The two

11Regional Disparities and Marginalisation in Kenya
provinces have the least opportunities and the lowest access to basic services for their people. Prof Kanyinga has presented data to show that marginalisation, inequalities and other disparities in Kenya can be explained in terms of a region’s access or proximity to power and institutions of power. With data from four institutions, namely: Parliament, the Cabinet, the Judiciary and the public sector (Permanent Secretaries, the provincial administration, public corporations and parastatals), Kanyinga demonstrates a pattern of appointments to these positions in which regions where the powerful in government come from have benefitted more. In fact, Kanyinga points out that the four regimes that have governed Kenya — the colonial government, the Kenyatta, Moi and the Kibaki regimes, deliberately favoured certain regions in appointments to key government positions.
Kanyinga argues that inequalities in governance institutions have been an integral part of Kenya’s social-political life. First, inequalities in the composition and staffing of Kenya governance positions are the result of ethnicity and attempts by the governing elite to consolidate power by locking out members from other ethnic groups. Second, parliamentary seats are inequitably distributed among the main ethnic groups and that population size is not the main factor determining the number of seats a region or community will have. The manner in which the distribution of seats has been done was deliberately constructed to over-represent those regions or communities from where the incumbent President comes. Since Moi came to power, the numerically smaller communities (Maasai, Turkana, Samburu and Somali) have also been over-represented in terms of parliamentary seats. Thus, appointments did not necessarily favour any one particular ethnic group or region to the total exclusion of others.
Prof Kanyinga’s data reveal a number of interesting observations and paradoxes in the people and regions advantaged by incumbency. In service provision, Nairobi and Central provinces have a higher roads density than other areas while in terms of access to water, Nairobi, Central and Coast provinces had more people connected to piped water by 1989 than any other province3. A similar phenomenon is observed in enrolments into primary school. Although Central Province has had some of the highest enrolment, its numbers are declining. Nairobi, Eastern and Western provinces had the highest growth rate between 1979 and 2001, while Central Province had the lowest during the period.An important paradox in Kanyinga’s findings is that minorities are not seriously marginalised in governance institutions. In Parliament, there is evidence that minorities are in fact more represented than the numerically large groups. This is because, during the Moi regime, conditions were created in which the minorities were put in relatively more senior positions in proportions that were higher than their share of the country’s
3 The 1999 census shows the numbers in Central Province declining, though.

12 Regional Disparities and Marginalisation in Kenya
population. Kanyinga’s findings clearly show that it is the large ethnic groups that were marginalised, especially if the number of positions they controlled was compared to the share of the incumbent.
Government Policies to Deal with MarginalisationAt independence, Kenya inherited a system with unequal distribution of services skewed in favour of prosperous areas. Europeans dominated virtually all positions in the civil service and were also the dominant class in industry, professions and commerce, although in the latter sector there was a number of Asian and Arab competitors. Rural and urban inequalities in resource allocation and development were also noticeable, as were gender inequalities. Successive regimes have attempted to address these inequalities with mixed results. The sections that follow discuss government attempts to address inequalities, disparities and marginalisation in Kenya.
Since independence, Kenya’s development strategy has been anchored on Sessional Paper No. 10 of 1965 on “African Socialism and its Application to Planning in Kenya”, and which has served as Kenya’s development bible for decades. Sessional Paper No. 10 aimed to remove the inequalities inherited from the colonial period. It stated as follows: “The state has an obligation to ensure equal opportunity to all its citizens, eliminate exploitation and discrimination and (will) provide the needed social services such as education, medical care and social security”. In African Socialism, the government committed itself to guaranteeing every citizen, poor or rich, full and equal political and economic rights to ensure the participation of every person in the running of the country, and that Kenya’s resources would be used to benefit all Africans. The government also committed itself to train, educate and to mobilise all Kenyans to fully participate in the country’s development.
To develop the country, the government committed itself to improve key strategic and essential infrastructure and services, such as harbours, principal roads, railways, airways, broadcasting and telecommunications. However, the manner in which these services were provided was not equitable and favoured certain areas, while other areas were opened up for more exploitation and investments. During Kenyatta’s rule, infrastructure development targeted tea and coffee growing areas in his Central Province while neglecting most other areas, particularly North Eastern Province. His successor, Daniel arap Moi, pursued policies that targeted grain growers in his native Rift Valley.
Kenyan policy makers adopted a laissez-faire development approach that did not concern itself with alleviating regional disparities in development, including education

13Regional Disparities and Marginalisation in Kenya
(Cooksey et al, 1994: 211). Since parents contributed significantly to the cost of education, it meant that certain communities had more access to education than others, thus increasing the marginalisation of those without adequate schools. This shifted the burden of meeting the cost of schooling to parents, which meant that education was increasingly becoming a preserve of the rich. With the help of donor funding, a number of boarding schools were constructed in marginalised areas. In 1983, a quota system of admission was introduced at the district level to ensure local students had access to district schools. However, by the 1990s, disparities in the education system continued, especially in the arid and semi-arid areas.
The Kenyatta government was more interested in growth and economic development in general than it was in redistribution. Hence, although at independence the Kenyan economy grew at a fairly steady pace, the benefits of this growth were enjoyed by a small number of elites and communities. In the 1980s, however, the Kenyan economy stagnated and Moi’s conflicts with the donor community denied his government foreign aid. As part of the Structural Adjustment Programs (SAPs), the government had to reduce public spending, forcing Moi to rely on domestic resources. The government introduced cost-sharing in the provision of public services4, which disadvantaged the same marginalised people that were being protected. This was made worse by natural calamities that affected the country in 1983-5, especially, drought and famine that reduced maize, wheat and dairy production. The drought caused severe shortages, forcing the government to spend more on importation of essential goods, which took away resources that could have been used in marginalised areas.
Africanisation and Inequalities in KenyaThe first important undertaking of the government was to ensure that the Kenyan economy and civil service, which had hitherto been dominated by European settlers and administrators, came under the control of Africans. This was done through legislation, licensing, the establishment of state corporations to provide finances as well as appointments to key positions in government and industry. Specialised government corporations (parastatals) were established5 to provide Africans with the necessary resources to fully participate in economic development. The Kenya National Trading
4 See Republic of Kenya, 1984. Development Plan 1984-88, Nairobi: Government Printer: 435 Key among them being the Kenya National Trading Corporation (KNTC) to handle import and
export trade), the Agricultural Finance Corporation (AFC) to provide credit to Africans to buy and rehabilitate large scale farms; the Industrial and Commercial Development Corporation (ICDC) to provide industrial credit and other loans for development. The ICDC was to be the main vehicle for the government’s participation in industry. Other institutions included the Kenya Industrial Estates (KIE), the Kenya Tea Development Authority (KTDA), the Industrial Development Bank (IDB), and later the Kenya Grain Growers Cooperative Union (KGGCU).

14 Regional Disparities and Marginalisation in Kenya
Corporation (KNTC) handled import and export trade, the Agricultural Finance Corporation (AFC) provided credit to Africans to buy and rehabilitate large scale farms, and the Industrial and Commercial Development Corporation (ICDC) provided industrial credit and other loans for development. The ICDC was to be the main vehicle for the government’s participation in industry.
Although these corporations enabled Africans to get a firm grip on the economy, the people controlling them and those that benefitted from their funding were disproportionately drawn from a select pool of elites or regions closely identified with the regime in power. The credit from the ICDC and AFC was skewed to benefit entrepreneurs from the political elite that controlled the state. As a result, the Africanisation of the Kenyan economy and civil service ended up benefiting President Kenyatta’s close associates and kinsmen. As the International Labour Organisation (1972) and World Bank (1975) reports point out, Africanisation of jobs in the public sector and the transfer of farms and businesses to the Kenyan petty bourgeoisie and peasants in the first decade of independence “had only amounted to the replacement of a few Europeans, but this did not fundamentally alter the structure of the former colonial economy” (Ochieng’, 1995: 90).
By the end of the Kenyatta era, “significant portions of the Kenya population still remained on the fringes of society”. They felt deprived of a place of dignity in national life by barriers of class, ethnicity, gender or even geography. On the other hand, many Kenyans who were already enjoying the fruits of independence were reluctant or even opposed to sharing their fortunes with the disadvantaged groups (Ogot, 1995:208-9). When Moi came to power, his first priority was to try to correct this. In the first decade of his administration, President Moi “designed, and implemented social, economic and political programmes aimed at incorporating those who were rapidly becoming alienated from the mainstream of national development.” This included North Eastern Province, whose inhabitants did not feel they belonged to Kenya. Moi also mainstreamed other groups such as women, jua kali workers and the disabled into the national social and economic system (Ogot, 1995:209).
Moi adopted distributive policies that targeted the marginalised and minority communities as well those in rural areas. Harking back to the KADU policies of a devolved system of government (Majimbo) which Moi had pushed for as party leader at independence, as President, he introduced the District Focus for Rural Development to empower local communities at the beginning of the 1983 financial year. Under the District Focus strategy, planning for rural areas shifted from Nairobi to the districts. This was also meant to “broaden the base of rural development and encourage local

15Regional Disparities and Marginalisation in Kenya
initiatives in order to improve problem identification, resource mobilisation and project implementation” (Republic of Kenya, 1984:1). Moi also created new areas of representation as well as new administrative units in an attempt to “bring government closer to the people” and reduce the historical marginalisation in the country. Moi also reached out to communities that had hitherto been marginalised. His agricultural policies also shifted away from Kenyatta’s, which had aimed at benefiting tea and coffee farmers in Central Province, to grain and cereal growers in the Rift Valley. In addition to providing the necessary infrastructure in the region, the Moi government placed Rift Valley elites in charge of the agricultural sector to facilitate the importation of cheaper inputs to the agriculture sector for distribution to farmers.
Moi’s redistributive policies switched resources from the cash/export crop growers (tea and coffee) in Central Province to grain growers (wheat, maize and beans) in the Rift Valley. Moi also tried to open up hitherto marginalised areas to cash crops to spur faster development. For example, Moi started tea plantations in Rift Valley and Western provinces, which were not traditionally tea growing regions. Moi also saw the expansion of university education and the construction of public and private universities among marginalised communities and regions. Further, Moi introduced the District Focus for Rural Development, which was meant to not only decentralise development but also to make the district the centre of resource allocation.
Moi also tried to open up many of the marginalised areas through the construction of roads, telecommunications network and health facilities. The construction of the Eldoret International Airport and the tarmacking of a number of road networks in Rift Valley Province stand out in this regard. This was, however, overdone -- with Rift Valley Province receiving the lion’s share of funds for roads and health centres.6 However, even with this, a number of other areas remained marginalised. In fact, questions have been asked as to whether Moi acted as he did to ensure a more equitable distribution of public resources or for political reasons — to favour his community. This is because, as we have seen, Moi tended to concentrate development in the Rift Valley, although he also tried to open up other hitherto marginalised regions. Secondly, by establishing universities outside Nairobi and Central Province, Moi ensured that even marginalised communities and regions had access to an important resource- university motivated small economies of consumption.
6 In 1986-7, Rift Valley Province accounted for 52 per cent of total roads development expenditure (Barkan & Chege, 1989), which increased to 67 per cent by 1995 (Robinson and Torvik, 2005). Similarly, in 1987-88, the province received 49 per cent share of rural health spending and 33 per cent of rural Development Fund (Karingai, 2006: 39).

16 Regional Disparities and Marginalisation in Kenya
Addressing Inequalities through EducationThe Ominde Commission7 was set up in April 1964 to look into the education sector and make recommendations on how it could be made more relevant for the country. One of the major recommendations was on the need for universal education in the country and, therefore, the Commission endorsed free primary education as the future of the education system in Kenya. The Ominde Commission also recommended that more resources be put in areas that had been marginalised education-wise, that is, in areas whose enrolments were below the national average. To meet the manpower requirements for the country, the Ominde Commission recommended that at the beginning, more resources be directed towards secondary and college education than to primary schools (Cooksey et al, 1994:202)
To address the inherited problems of social inequality and regional disparities in access to education, Kenya allowed social demand to run it, which resulted in a significant enrolment for secondary schools. The government was more driven by market forces as well as the idea that a merit based equality of opportunity, determined by national examinations, was more important. A 1966 Teachers Service Commission Act made all teachers state employees, thus providing the government with the power to post teachers anywhere in the Republic. A 1980 law established the Kenya National Examinations Council as the sole body for conducting examinations outside the university. However, policy in the education sector continued being run under political fiat, where the government, through the Ministry of Education, emasculated the other institutions charged with responsibilities in education. With time, however, policymaking in education was increasingly separated from planners and professionals and often negated their advice, instead following the dictates of the political leadership (Cooksey et al, 1994: 207; Friedrich-Naumann-Stiftung, 1992).
With the expansion of education, certain regions, particularly Central Province, were advantaged. There was a widespread perception that the role of education was to prepare its beneficiaries for white-collar jobs (Court and Ghai, 1974) and hence these advantages in access to education also translated to other economic benefits for those who had education. By the 1980s, the education system still reflected the dominant economic, political and social structures and norms of the independence period. This, however, changed significantly when Kenyatta was replaced by President Moi, whose redistributive policies saw the establishment of academies and schools comparable to national ones in different regions of the country. Secondly, Moi oversaw the expansion of the school system by increasing enrolments -- especially university admissions -- to
7 Republic of Kenya, 1964 Education Commission Report part II, Nairobi: Government Printer, 1964.

17Regional Disparities and Marginalisation in Kenya
levels that would not have been thought possible only a few years earlier. The expansion of the education system also reduced the elitist nature of the education system in the country. This, however, came with accusations of a watered down education. Moi’s expansion of the education sector was so rapid that it plunged the entire system into chaos since it was undertaken at a time that Kenya’s economy was in a crisis and hence unable to fund the education system. This was followed by the scrapping of the two-year pre-university advanced level course, which also expanded university education. On coming to power, Mwai Kibaki’s government introduced universal primary education, which has greatly lifted the standards of even the previously marginalised.
The Constitution of Kenya (2010) as a Solution to InequalitiesThe importance of the Constitution of Kenya (2010) in fighting or eliminating inequalities in Kenya cannot be over-emphasised. This is because institutions, political or otherwise, are critical determinants of economic performance (North, 1994). Institutions not only provide the formal rules, laws and constitutions that govern the budget process, but combine with the informal norms, behaviour and conduct, and the enforcement and oversight mechanisms to influence the outcomes in the economy (Karingai, 2006:21). By strengthening the institutional basis of policy-making, the Constitution of Kenya (2010) laid a sound foundation from which economic inequalities, regional disparities and marginalisation can be addressed. Commenting about inequalities and disparities in Kenya, Karingai points out that Kenya’s weak institutions were mainly to blame. This is because weak institutions give room to bureaucratic manipulation, and corruption to influence how resources are allocated.
Weak institutions create room for distorted planning priorities, and end up with unfair construction and distribution of schools, health facilities and other important amenities needed for development. Although corruption leads to wastefulness, theft or looting of public resources, misallocation of public funds and construction of “white elephants”, the opportunities for rent seeking or even for corruption are not evenly spread across regions. The more politically connected, therefore, ended up benefitting more from government wastefulness. Corruption related resources, looted funds and other misappropriated public funds end up being invested somewhere, thus increasing job opportunities and the resources in that area.
The Constitution of Kenya , 2010, provides a solid legal and institutional framework for the recognition and protection of the rights of minorities and those of marginalised groups. It does this through its rights-based approach to development, where everyone is entitled to development as a right. Chapter IV on the Bill of Rights provides a

18 Regional Disparities and Marginalisation in Kenya
framework for affirmative action that ensures that minorities and the marginalised are brought up to speed in social, economic and cultural development.
Second, the Constitution has addressed the issue of inequalities through the budgeting process. The allocation of public funds among and between regions through the budget is the main policy tool that could be used to address regional inequalities (Karingai, 2006:21). In most developed economies, the redistribution policy is designed in such a way that low-income regions enjoy a higher inflow of public resources, while high income generating regions provide the surplus resources needed. The Constitution has adopted a similar mechanism through the establishment of the Equalisation Fund (Article 204), which will see at least 0.5 per cent of Kenya’s annual revenue distributed to the poorer regions of the country for a period of 20 years to assist in the provision of basic services (water, roads, health services) to marginalised areas so as to bring the quality of services in those areas to the level generally enjoyed by the rest of the nation.8 This is meant to ensure that the not-so-developed counties are able to catch up with the rest of Kenya. This is in addition to getting an equal share of the 15 per cent of the country’s revenues that will be devolved to the counties. The distribution of the 15 per cent of revenues will also factor in the level of development in each county and, therefore, ceteris paribus, counties that are considered less developed will get a proportionally higher amount than those that are more endowed with resources.
According to Article 201(b) (iii), one of the principles of public finance is to promote an equitable society -- ensuring that public “expenditure shall promote the equitable development of the country including by making special provision for marginalised groups and areas. Article 202 puts the criteria for determining the equitable sharing of national revenue as consideration of a) economic disparities within and among counties and the need to remedy them; b) the need for affirmative action in respect of disadvantaged areas and groups (Article 2003 (1) (g-h). 9
Prior to the promulgation of the Constitution, there was no formal system of determining the manner in which public funds were to be allocated. Planning, budgeting and spending of government finances was mainly the preserve of the Ministry of Finance, Ministry of Planning and National Development, and a few stakeholder institutions. Due to the centrality of the executive arm of the government in the formulation, planning, implementation and the auditing of public expenditures, members of the cabinet and senior government officers have had a lot of discretion that they have (mis)
8 Art. 204(2)9 Article 260 defines affirmative action to include any measure designed to overcome or ameliorate an
inequality or the systematic denial or infringement of a right or fundamental freedom.

19Regional Disparities and Marginalisation in Kenya
used to unfairly benefit certain areas. Bureaucratic excesses in the allocation of public finances have been exacerbated by the absence of a criterion for such allocations and resulted in many government funded projects tending to go to regions represented by powerful politicians, leaving other regions quite marginalised. Public allocations for districts have also been left to the discretion of the respective ministries and, therefore, it has not been possible to establish whether there was any deliberate attempt towards equitable distribution. Available evidence shows that district allocations are also skewed, but in favour of wealthier districts. Allocations to the various districts were also done from the center in a process that was mainly top bottom.
Unlike at the national level where bureaucratic discretion determined allocation of public resources, there are a number of local funds whose allocation to the districts and local authorities is formalised. These funds include the Constituencies Development Fund (CDF), the Local Authorities Transfer Fund (LATF), Roads Maintenance Levy Fund (RMLF), Youth Enterprise Development Fund (YEDF) and Women Development Fund (WDF). These, together with the recently established Ministry for Development of Northern Kenya, have helped to improve the hitherto marginalised areas and groups. It is, however, doubtful whether much would be achieved through this, owing to corruption and the limited resources that these funds have. The Ministry of Development of Northern Kenya is so grossly underfunded that it can hardly do anything to reverse the years of marginalisation in the northeastern regions of Kenya. It is, however, hoped that the establishment of the devolved system of governance, the Commission for Revenue Allocation as well as the Equalisation Fund will allocate adequate resources in these marginalised regions for their development.
The Constitution assumes that for public expenditure to be an effective tool for reducing inequality, it should be skewed in favour of districts that have high levels of poverty. That is, there should be a form of equalisation or affirmative action directed at the regions and groups that are less resource-endowed to hasten development. This, however, raises a fundamental question about equity, distribution and efficiency, that is, how will the government resolve the conflict between fair distribution of resources and a need for efficient production.
The Constitution has other provisions, specifically addressing issues of minorities and marginalised groups (Persons with Disabilities, the elderly and gender). In Chapter 4 on the Bill of Rights, the Constitution provides specific rights for minorities, marginalised groups and communities (such as the youth, women and the elderly). The following section discusses the provisions of the Constitution regarding minorities, marginalised groups and communities (such as the youth, women and the elderly).

20 Regional Disparities and Marginalisation in Kenya
Marginalisation: The Constitution addresses two types of marginalisation: a marginalised community and a marginalised group. The Constitution defines a marginalised community as:
a) a community that, because of its relatively small population or for any other reason, has been unable to fully participate in the integrated social and economic life of Kenya as a whole;
b) a traditional community that, out of a need or desire to preserve its unique culture and identity from assimilation, has remained outside the integrated social and economic life of Kenya as a whole;
c) an indigenous community that has retained and maintained a traditional lifestyle and livelihood based on hunter or gatherer economy; or
d) pastoral persons and communities, whether they are:i) nomadic; orii) a settled community that, because of its relative geographic
isolation, has experienced only marginal participation in the integrated social and economic life of Kenya as a whole.
The Constitution also defines a marginalised group as a collective of people who, because of laws or practices before, on or after the effective date, were or are disadvantaged by discrimination on one or more of the grounds in Article 27(4)10. The Article gives these grounds as race, sex, pregnancy, marital status, health, ethnic or social origin, colour, age, disability, religion, conscience, belief, culture, dress, language or birth.
The Constitution provides that the state shall put in place affirmative action programmes designed to ensure that minorities and marginalised groups: a) participate and are presented in governance and other spheres of life; b) are accorded special opportunities in education and economic fields; c) are provided special opportunities for access to employment; d) develop their cultural values, languages and practices; and, e) have reasonable access to water, health services and infrastructure. The Constitution further asserts that minorities and the marginalised cannot be discriminated against either by the state or by individuals11. Article 197(2), Parliament shall enact legislation to (a) ensure that the community and cultural diversity of a county is reflected in its assembly and county executive committee, and (b) prescribe mechanisms to protect minorities within counties.
One of the ways communities have been marginalised is when their land is taken away
10 Art. 260 on the interpretation of the Constitution11 Art. 27(4,5)
21Regional Disparities and Marginalisation in Kenya
or targeted by the state or powerful individuals. The Constitution has addressed this by creating community land, which is protected for that community.12
Gender/Women: The Constitution, at Chapter 11 on Devolved Government, also contains provisions that will improve equality of gender and ensure equity. Article 174 on the objects of devolution contains as the objectives of devolution as follows: a) “foster national unity by recognising diversity; b) recognising the right of communities to manage their own affairs and to further their development; e). Protect and promote the interests and rights of minorities and marginalised communities; and c) Ensure equitable sharing of national and local resources throughout Kenya.
Chapter 4, section on Equality and freedom from discrimination categorically, states that women and men have the right to equal treatment, including the right to equal opportunities in political, economic, cultural and social spheres13. In addition, discrimination on account of sex either by the state or by an individual, is also outlawed.14 Article 250, demands that the chairperson and vice chairperson of an independent office or commission shall not be of the same gender15.
More importantly, Article 175(c) states categorically that no more than two thirds of members of representative bodies in each county government shall be of the same gender. Article 197 reinforces this by stating that no more than two thirds of any county assembly or county executive committee shall be of the same gender. Article 177(b) provides the mechanism through which this will be attained. The Article creates Special Seats in each county legislature, whose total number will be determined by the number of special seats necessary to ensure that no more than two thirds of the membership of the county assembly is of the same gender.
The Constitution also provides for election or nomination of marginalised groups, including PWDs and the youth. The Constitution, however, leaves the nomination of such members to political parties.16 Although nominations help to boost the number of women, such a process is riddled with problems — it is a discretionary power and allows for a small number of representatives, resulting in tokenism.17 Even though the Constitution has made provision for each gender to have at least a third of MPs in Parliament, this is still seen as tokenism for women and it is not earned. This also
12 Art. 53(1) mandates that community land shall vest in and be held by communities identified on the basis of ethnicity, culture or similar community of interests.
13 Art. 27(3)14 Art. 27(4,5)15 Art. 250(11)16 Art. 177(2)17 Chesoni, 2006: 213

22 Regional Disparities and Marginalisation in Kenya
implies that the loyalty of those elected or appointed to these special seats will be to the appointing authority/political party and not to the interests of the organisations that the special member is a part of.
After independence, the Constitution allowed for 12 members to be nominated to Parliament. However, despite the Kenya Parliament being a predominantly male House, Kenyatta did not nominate any woman to Parliament, while Moi never nominated more than two women at a time. It was not until the 1997 IPPG agreements that the nomination of the 12 MPs was given to political parties, which were also supposed to consider gender equality in their nomination processes. This boosted women candidates for Parliament by all major parties and for the first time, eight out of the 12 nominated MPs in the Ninth Parliament were women. This, to date, remains the highest number of nominated women MPs in Kenya.
Persons with Disabilities: The Constitution defines a person with disability to include one who has any physical, sensory, mental, psychological, or other impairment, condition or illness that has, or is perceived by significant sectors of the community to have, a substantial or long-term effect on an individual’s ability to carry out ordinary day to day activities. The establishment of the National Council of Persons with Disabilities and the passing of the PWDs Act, the lot of PWDs was not improved in any significant way because other forms of marginalisation and inequalities persisted, which prevented PWDs from enjoying an improved status.
Article 54 gives a number of entitlements to PWDs, including: dignified treatment that does not demean the PWD; education, access to public places, materials and information. Article 54(2) requires the state to ensure the progressive implementation of the principle that at least 5 per cent of the members of the public in elective and appointive bodies are persons with disabilities. Persons with disabilities cannot be discriminated against either by the state or individuals (Art. 27 (4, 5)).
The pre-2010 Constitution recognised and prohibited discrimination on the basis of race, ethnicity, place of origin and sex. However, persons discriminated against on account of disability, age, and social-economic status faced an additional problem in that the traditional international human rights instruments do not recognise or prohibit these forms of discrimination.
Youth: The Constitution mandates the state to take measures, including affirmative action programmes, to ensure that the youth have: access to education, training,

23Regional Disparities and Marginalisation in Kenya
opportunities to participate in political, social and economic spheres of life; access to employment and protection from exploitation and other harmful practices.18
Discrimination: Prior to 2010, the Constitution did not recognise, and therefore did not prohibit discrimination on the basis of disability or age. Section 82(3) of the old constitution prohibited discrimination on account of “race, tribe, place of origin or residence or other connection, political opinions, colour, creed or sex”. In the 1970s, many banks had policies that would not allow women to hold accounts without the permission of their husbands (Mburugu, 1995: 162). Article 4 outlaws all forms of discrimination either by the state or by an individual. Art 27(4) outlaws discrimination (direct or indirect) by the state against any person on any ground, including race, sex, pregnancy, marital status, health, ethnic or social origin, colour, disability, religion, conscience, belief, culture, dress, language and birth.
Shortcomings of the Constitution of Kenya (2010)The Constitution of Kenya (2010) has provided quite progressive mandates to ensure the hitherto marginalised groups (women, youth and PWDs) and regions are empowered, The Constitution did not, however, entrench the mechanisms for achieving this. It leaves the implementation of these measures to groups and institutions without incentives to implement the provision. At times, the implementation is left to the same institutions or persons that had marginalised them in the first place. Take the provision meant to ensure that no one gender occupies more than two thirds of elective positions. No mechanisms to ensure this have been legislated and hence the existing male dominated political parties are not in agreement on how this can be done. A number of them want the provision removed. Even if it is implemented, the choice of women will not be determined by women, but by men who dominate political parties and hence the women elected might be those that will not advance the cause of women, since they will be women whose first loyalty will be to the appointing authorities (political parties) not to women.
Similarly, the clause providing for representative for the youth and PWDs risks the same fate. The election of women and youth as well as PWDs will be done not by women, youth or PWDs but by the entire population. In Kenya as elsewhere, appointees and nominees to any position owe their allegiance to the nominating parties rather than the groups they are supposed to represent. Since the nominating powers will not be women, youth or members of any PWDs organisations, those elected or nominated to represent these groups might be forced to take positions that are detrimental to their groups
18 Art. 55 (a-d)

24 Regional Disparities and Marginalisation in Kenya
because the nominating parties demand it. For example, a woman or PWD might take a position that is detrimental to women or PWDs because the party that nominated them demands that they do so. Efforts should be made to ensure that the final choice of the representative is to a great degree determined by the group the person is to represent. Much work should be done to ensure that women, youth and PWDs organisations have a lot of say in the persons elected or appointed to represent their interests.
Though the Constitution deals with gender, PWDs and other forms of marginalisation, the policies and laws pertaining to persons with disabilities are gender-blind. In addition, the Constitution does not address cultural practices that have discriminated against PWDs such as stigmatisation, public awareness and education. Worse still, the provisions for representation of PWDs even as provided for by the Constitution, are a mere token and assume homogeneity of disabilities. The needs of different groups of disabilities are different yet the Constitution lumped them together, mandating for only one representative for PWDs despite the many varieties of disability.
The foregoing is complicated by the fact that “issues about women, the youth and Persons with Disabilities are a soft target” (Chesoni, 2006: 233) and as a result become avenues for political compromise. In the process of politicians and political parties and cutting deals, women, youth or PWDs representatives are forced to compromise the interests of their groups to those of the party or the nominating organisation. Women have in the past suffered in such circumstances. In 1999, after the East African Treaty was signed, one of the requirements was that each Member State of the EAC was to be represented by at least three women parliamentarians in the EALA, while Uganda and Tanzania nominated three women, Kenya did not, sending only two((Chesoni, 2006: 235). In other instances, “women parliamentarians have had to toe the party line, sometimes even on an issue that may not be in the interest of women’s rights” (Chesoni, 2006: 236).
The Constitution has definitely provided for the empowerment of the marginalised, however, the culture of tokenism (Chesoni, 2006: 236), which considers women and empowerment of marginalised groups and regions as one of the goodies to be dished to them as a favour still persists in Kenya. Thus, despite the provisions in the Constitution, the old culture of marginalisation and exclusion still persists.
The rule that there should be not more than two thirds of any gender in Parliament is still considered tokenistic to women, who did not earn it. Secondly, the areas created for women representatives at the county level are so wide and will be very costly for women. Hence, many will be forced to rely on their political parties, which will make

25Regional Disparities and Marginalisation in Kenya
them more beholden to the party than to women issues. The same applies to youth representatives.
One area where women have been discriminated against in the past is on land ownership. Despite making progressive provisions that provide for equitable access to land, elimination of gender discrimination in law, customs and practice related to land and property in land19, Article 60(g) almost negates (but definitely waters down) the principle of equality by providing that “communities should settle land disputes through recognised local community initiatives consistent with this Constitution”. It is common knowledge that land tenure systems of most of Kenya’s African communities are patrilineal, and in almost all of these communities, women have rights to till the land but the right usually is passed on and/ or secured through the male members of the family(Chesoni, 2006: 215.). While the principle of equality could be used to ensure women get land from their parents or from their spouses, if married, there is the danger that Article 1(g) could be used to ensure that married women do not get a share of their parents land, which might not be considered a violation of the principle of equality. Secondly, in almost every community, when land is registered, due to the male lineage patterns, it is often registered in a man’s name. If the fate of women’s rights to land is left to the communities as Article 60(g) demands, there is the real danger that women’s right to land will continue being appended to their ties to a male—either father or husband, bringing to question gender equality.
By outlawing certain sexual orientations, the Constitution has marginalised and criminalised gay, lesbian and transgendered individuals, and in the process denied them access to justice and government resources and services, especially healthcare.
What Next?Although devolution has the capacity to address the problems of marginalisation, where devolution has taken place, problems of marginalisation have not necessarily reduced. First devolution can and does undermine the state, making it hard for such problems to be addressed. Secondly, devolution creates new minorities (at the devolved level) this is because the devolved units (counties in the case of Kenya) do not completely conform to natural nationality groups, and even if it were possible to do this, problems would still abound because certain elements of the newly created unit will be dominant while others will be or will feel dominated. Thus, devolution in itself is not a solution to the problem of marginalisation. For devolution to resolve minority as well as marginalisation problems, it has to be accompanied by proper institutional
19 Art. 60(1)(a,f)

26 Regional Disparities and Marginalisation in Kenya
design20 to ensure the proper conditions for coexistence and the participation for all is maintained. To design these proper institutions, one must understand and bear in mind the problems that devolution was meant to resolve. 21
In 2006, Prof Karuti Kanyinga recommended constitutional reforms in which the executive authority of the state is checked by parliament as a good approach to dealing with inequalities and the related issues of marginalisation. Kanyinga’s argument was that a parliamentary system was undoubtedly the best approach to ensuring that incumbents are under continuous surveillance both within and outside of Parliament. This, he argues, would introduce a high level of political accountability in the political space by tying leaders in to transparent mechanism of conducting national affairs. Secondly, Kanyinga also recommends reforming the electoral system to replace the current first-past-the-post one, which motivates individuals to mobilise along ethnic lines. To him, this can be replaced by a proportional representation system with a single national constituency. This, Kanyinga argues, would produce more stable governance institutions because the leaders would not be tied to any geographical unit, but to their political parties or their institutions.
The inherited economic and political institutions had not been established to foster development for Africans and hence did not have the capacity to develop the country even after independence. They had been established as instruments of exploitation. The leaders of the nationalist movement were also not developmental and, hence, when they inherited these institutions they did not change them but instead used them to enrich themselves and those who either supported them or came from their regions.
Looking at the legal framework of the Constitution of Kenya (2010), one can make a number of observations. Most importantly, the framework itself is fairly detailed. Whether it will provide the protections to minorities or provide advantages to the marginalised communities, only time will tell. Comparisons between the old constitution and the new one, (especially looking at the administrative divisions) reveal a number of things: first, that the district and division were a closer administrative/ service provision centre than the county. This calls for the rationalisation of the old administrative divisions with the county governments to ensure that devolution does not take away services that were closer to the people and force them to commute longer distances to access them.
Second, there is need to seriously think of further devolution/ decentralisation even within the counties. The more populous and geographically expansive counties such as
20 Michael Keating, “Federation and the Balance of Power in European States.” SIGMA/OECD, 2006:3721 Ibid.

27Regional Disparities and Marginalisation in Kenya
Nairobi, Kakamega and Kiambu need to seriously consider further decentralisation. In addressing these issues, it is important to address issues of minorities and the marginalised. In the rural and other expansive territories, it is also imperative to consider minorities and the marginalised when drawing new boundaries.
Third, in deciding how county funds are to be used, how county administrators would be recruited and how contracts and other county tenders would be decided, there is need to set aside some quota for the marginalised and minorities within the county. The same should be done in infrastructure, schools and the management of any county resources/allocation of county budgets (when county priorities are being set, minorities and the marginalized need to be involved).
Since independence, the system of devolution/ decentralisation in Kenya has been ethnically determined. The majority of counties are inhabited either by one ethnic group or by dominant ethnic groups. This has however created a new problem of ethnic minorities within several counties. Most notable have been the Kuria in Migori County, the Sabaot in Bungoma County, the Sengwer in Elgeyo Marakwet County, the Cherangany in Trans Nzoia County and the Pokot in Baringo County. Owing to the fact that counties and county boundaries cannot be recreated, it is important that the establishment of wards within the counties be done in such a way that these minorities are not further disadvantaged or are not again lumped together in a ward with another dominant group where their voice cannot be heard.
Conclusion: Rethinking Inequalities, Disparities and Marginalisation in KenyaThe foregoing raises an important issue about the nature of marginalisation, inequalities and disparities in Kenya. The current literature assumes a commonality of interests on a regional and/or ethnic basis and assumes that when certain members of any community or region benefits, the entire community or region benefits. Therefore, when one is elected or appointed to a key position in government, it is generally assumed that such an appointment is a benefit to the entire community or region from where the appointee comes. Inequalities, marginalisation and other disparities are assumed to occur across ethnic groups or regions. As a result, intra-regional and intra-ethnic marginalisation, inequalities and disparities have not been analysed.
The reality, however, is that when the President appoints people from his region or ethnic group, these appointments are not representative of the community or the region as a whole. That is, not every part of the region or ethnic group is included. For

28 Regional Disparities and Marginalisation in Kenya
Kenyatta, even though the Kikuyu and Central Province in general had the majority of those in his cabinet, they were all predominantly from Kiambu, and even in Kiambu, the coverage area never went beyond River Chania. Other areas of Central Province were marginalised. With the country moving away from the centralised unitary system to a county-regional governance system, there is need to shift and broaden the focus to also include intra-regional and intra-ethnic inequalities, disparities and marginalisation with a view to seeking ways of mediating them.
On cabinet appointments, as well as appointments to other government positions, two observations need to be made. First, all regimes have attempted to reflect the “face of Kenya” in their appointments. That is, many of those appointed by any president come from different parts of the country. In fact, even when the president’s region or ethnic group is favoured, the majority of all appointments come from outside the president’s region or ethnic group. Kenyatta’s cabinet reflected this and although he had a sizeable number form the Kikuyu community, the majority was drawn from the rest of Kenya. Similarly, during the Moi era, although the centre of power shifted from Central to the Rift Valley Province, not every community or sub-region of the vast Rift Valley benefited. Moi’s appointments seemed to have been confined to a few districts within the Rift Valley, especially from the Tugen community. There were communities in the Rift Valley and regions of the province that were as marginalised as the rest of the country.
A similar scenario has emerged during the Kibaki era. Although Central Province (and the wider Gikuyu, Embu and Meru Association communities) seems to have benefited more, Kibaki’s appointments seem to be influenced more by class and his “old school and golf buddies club” than by pure regionalism or ethnicity. Many of his appointees, especially in his first term, were the so-called “old golf buddies” of Muthaiga Club, especially from the Mount Kenya region. Others, especially within the Meru community seem to come from only one part of the wider Meru. The rest of the Meru community claims marginalisation like any other community in the country.
The second important aspect of these appointments is the nature of elites that successive regimes have relied on. While Kenyatta relied on ethnic groups that were large, mobile, and endowed with resources, the Moi regime relied much on appointees from the small ethnic communities and the marginalised pastoralist communities. In fact, prior to the reintroduction of the multiparty system, and throughout Moi’s two last terms as president, two of Kenya’s largest ethnic groups (the Kikuyu and the Luo) were virtually absent from his administration. In a sense, Moi marginalised two of Kenya’s largest communities. The question is whether Moi’s exclusion of the Kikuyu

29Regional Disparities and Marginalisation in Kenya
and the Luo from his cabinet and other key positions in his government amounted to the marginalisation of the two communities.22
Thirdly, it is important to recognise that what has been happening in Kenya since independence might not have been a deliberate effort to disadvantage certain areas or communities. It might have been influenced by a genuine desire to maximise on meager resources. This is because channeling resources into areas with minimal production potential, for example, was not considered by the Kenyatta government an optimal way to use them. The government, nevertheless, did not make attempts to channel higher resources to disadvantaged areas to reduce inequalities. North Eastern Province was, for most of Kenyatta’s regime, under a State of Emergency. The Maasai, who were one of the most marginalised communities in Kenya, saw their lands targeted by elites from outside their community, thanks to Kenyatta’s policy of every Kenyan being allowed to buy land and settle anywhere in the country. Nubians’ attempts to acquire Kenyan citizenship have not borne fruits despite almost a century of existence in Kenya.
The foregoing analysis calls for a new way of looking at inequalities and marginalisation in Kenya. Presentations that look at inequalities and marginalisation from national or provincial levels miss important aspects—regionalization and the localization of inequalities and marginalisation. To fully understand marginalisation and inequalities, there is need to look at the persons recruited and analyse them within a more localised perspective. Secondly, there is need to rethink the advantages/disadvantages that communities have had from “their leaders” in relation with other factors. For example, while we have shown how the Kikuyu and Central Province is advantaged in terms of services, even during the Moi period, a look at the number of Kikuyu in the provincial administration reveals a different scenario. In 1976, the Kikuyu comprised of 38 per cent of the total number of District Commissioners. When Moi took power, this number reduced to 30 per cent by 1980 and to 6.2 per cent in 1998. If one was looking at these numbers in isolation, one would conclude that the Kikuyu were marginalised during Moi’s time. The opposite is also true for other communities.
22 While Moi might have denied a number of Kikuyu and Luo elites certain opportunities, it is obvious that what Moi did to the two communities did not amount to marginalisation in the strict sense of the term. This is because he did not deprive any of the two communities in terms of education, health and consumption more than he had even for his own communities in the Rift Valley.

30 Regional Disparities and Marginalisation in Kenya
Marginalisation and Conflict in Kenya23
IntroductionMarginalisation as a concept is an age-old subject dating back to the 1920s. It emerged in the 1920s to describe the experience of living between two asymmetrically disproportionate worlds. It was originally coined by Park and further developed by Stonequist to describe the immigration of second generation Americans and their assimilation into the dominant political culture.
Marginalisation was further generalised to refer to status-based social attributes afforded to the elite relative to that of the impoverished. The determination of the existence of marginalisation has conventionally been distinguished by experiences that cause economic or political oppression/segregation of individuals or groups over an extended period of time. This definition has also been expanded to include a process through which persons are peripheralised on the basis of identities, association, experience and environments. The enduring marginalised personality results from the longstanding misappropriation of individuals into a binding subordinate social or economic stratum within which the realisation of their full self is prohibited and from which they are unable to ascend.24
Therefore, the application of marginalisation in this paper will focus on the experience of exclusion, underdevelopment and alienation that exists for communities or certain groups of individuals in Kenya. As the paper teases out the historical context of marginalisation in the country, it will also look at the various stratagems which the state has attempted to put in place to redress the situation as well as the challenges encountered. In the end, recommendations will be offered in line with the provisions of the Constitution.
The Historical ContextMarginalisation and conflict in Kenya originated from the colonial period. In the context of adopting modern systems, African societies abandoned their structures
23 By Adams Oloo, Senior Lecturer, and Chairman of the Department of Political Science and Public Administration, University of Nairobi.
24 Duchscher, Boychuk E. Judy and CowIn Leane. The experience of marginalization in new nursing graduates. November/December nursing outlook.

31Regional Disparities and Marginalisation in Kenya
during the colonial period and adopted Western models. However, their implementation was distorted and entailed a lot of arm twisting during transition from colonialism to independence. The post-colonial government sought national unity through the centralisation of political and economic power, employing vestigial colonial laws and institutions to suppress pluralism. From the foregoing, a leadership crisis crept into the new state as the new African elite became neo-colonialist with erstwhile liberators turning into oppressors of their own people. It can be described as a leadership which in Frantz Fanon’s words was neither “engaged in production, nor invention, nor building, nor labour, it is canalized into the activities of the intermediary type. Its innermost vocation seems to be to keep in the running and be part of the racket.” Moreover, oppression, corrupt rulers, colonial legacy, insufficient political structures and destruction of democracy from the above seem to have compounded the issue of marginalisation and conflict in Kenya.
In Kenya, marginalisation is manifested in groups that have been denied access to economic and political resources to better their lot These groups have come to be referred to as the marginalised, that is, the women, youth, and persons living with disabilities, racial minority groups such as Asians, Arabs, and European, and ethnic minorities such as the Sengwer, the Nubians, the Ogiek, El Molo, the Sakweri and the Ilchamus. This paper will focus on ethnic marginalisation. It attempts to trail the marginalisation of specific ethnic groups from access to power and, concomitantly, their disenfranchisement in terms of economic development and the growth of the group.
Colonial impacts on political organisation in Kenya can be traced back to colonial government policy, which restricted political activity to districts whose boundaries were drawn along ethnic lines. By 1957, there were “at least seven major ‘district’ parties in existence, each of which was tribal and was led by a tribal personality”. Thus, when this restriction was lifted, an attempt to form a unifying political front failed. This resulted in the formation of the Kenya African National Union (KANU), which was made up of the larger ethnic groups, and the Kenya African Democratic Union (KADU), which comprised smaller ethnic groups and had the backing of the minority Asian and European settler communities.
As negotiations for independence began, there was potential for conflict primarily due to fears of political dominance by the larger ethnic groups. Negotiations for independence were also dominated by secession demands from the Northern Frontier District, whose inhabitants wanted to be part of the newly independent state such as the Republic of Somalia, which had gained independence in 1960. There were also demands for
32 Regional Disparities and Marginalisation in Kenya
autonomy by coastal Arabs ahead of Kenya’s independence. The European and settler community feared nationalisation of businesses and the takeover of land and property that had been acquired during the colonial period, and thus sought to influence the process in order to protect their interests. Thus, the independence constitution was negotiated in a fragile political atmosphere which was rife with potential conflict25.
KADU, which was composed of minority ethnic communities and was backed by European and Arab communities, called for a strong regional system of government in order to protect minority interests. KANU, on the other hand, called for a strong centralised system of government which, it argued, was necessary for national unity and development. However, KADU won as the constitution provided for strong regional governments with devolved executive, legislative and administrative powers as well as fiscal arrangements that secured regional autonomy. The independence constitution also provided for a senate/upper house, which practically catered for the interests of regional governments at the national level26.
It is noteworthy that Kenya had previously been administered by a centralised system of government with strong structures. Thus, when KANU won the elections in 1963 and merged with KADU in 1964, it inherited colonial structures and systems that were intact. With the dissolution of KADU, KANU sought to aggressively advance its centralisation policy.27 It all began by the government at the centre denying revenue and independent secretariats to regional governments as required by the independence constitution, thus frustrating attempts to make regional governments operational. Subsequently, the independent constitution was amended to consolidate political power in the presidency and dismantle regional structures. The first amendment merged the functions of head of state and head of government, vested them in the president, making him immensely powerful with control over all arms of government.28
Many ethnic groups are lumped together not only on the basis of historical origins and cultural practices, but also on the basis of expediencies of British colonial administration (Kanyinga, 2006). Some of these groups have distinct ethno-linguistic divisions that have created solid ethnic identities for sub-ethnic groups. Each of these groups inhabits a particular territory and ethnic members share a common ancestry, language and culture. Each and every part of the country is associated with a particular ethnic group.
25 Ibid26 Ibid27 Ibid28 Ibid

33Regional Disparities and Marginalisation in Kenya
Kenya has about 40 or so ethnic groups, some of which are further subdivided into sub-ethnic groups. None of the groups is numerically superior to exercise long-term domination of the other groups in the public sector. There is a fairly relative equality in the national population share of at least the five numerically large groups. The absence of a single disproportionately numerically large group has meant increased politicisation of ethnicity in Kenya. The ethnic elite from the big five groups tend to mobilise political support on an ethnic basis. They use their numbers to counterbalance each other. Political competition has been heightened by the fact that no single group can win on its own without forming an alliance with at least two other populous groups. This has also given logic to inequalities in resource distribution to ethnic groups represented and those not represented in government. Those not included in the architecture of government automatically remain on the periphery, thus developing a perception of being marginalised. Over time, ethnic groups of people not represented in national government have always harboured the feeling of being marginalised -- whether real or imagined. Each group is thus keen to access state power and control it to acquire development resources. The notion of ‘it’s our turn to eat’ has, therefore, become the organising principle of national politics. Competition is explained by this logic. The result is reproduction of ethno-regional imbalances and disparities in development, which acts as impetus for conflict over resources.
Some studies note that prior to independence, state-led initiatives played significant roles in promoting the formation of Kikuyu capital and, therefore, laid the basis for ethnic inequalities. Proximity to the capital city and the White Highlands scheduled for the settler economy provided the Kikuyu with the opportunities for investment and capital accumulation, which other groups could not have.29 Rothschild, for instance, noted that the privileged position in which the Kikuyu found themselves because of their proximity to colonial and settler economy and privileged access to basic services such as education during the colonial period confronted the government with a dilemma on its policies on recruitment and resource allocation. The post-colonial state framework, nevertheless, simply facilitated further accumulation of Kikuyu capital in the finance and agricultural sectors. Thus, central Kenya the heartland of the Kikuyu, evolved from the colonial period far more advanced than other regions. This position advanced further during the first period of independence when the state facilitated the accumulation of Kikuyu capital through the use of state apparatus. This saw central Kenya develop relatively more than other regions of the country.
By the time Daniel arap Moi ascended to power, Kenya had a strongly centralised system reminiscent of the colonial government structure, having done away with the
29 Ibid.

34 Regional Disparities and Marginalisation in Kenya
semi-federal structure at birth. Moi inherited an all powerful presidency when he came to power in 1978. He continued to consolidate and personalise presidential power. He began to deconstruct the Kikuyu state and to replace it with a Kalenjin alternative -- filling powerful positions in government that had been previously occupied by the Kikuyu with members of his Kalenjin ethnic group. He sought to dismantle the Kikuyu businesses that had thrived during Kenyatta’s era. In 1982, the Moi government sponsored a constitutional amendment which made Kenya a one-party state but political pressure from dissenting politicians, human rights and church groups led to the clause’s repeal in 1991, paving the way for multiparty elections in 1992. The reintroduction of multiparty elections coincided with the escalation of politically instigated ethnic violence in 1992 and 1997 elections. The 2007 elections marked the height of political violence and conflict in multiparty Kenya30.
Meanwhile, during this period, the accumulative and exploitative tendencies along demographic lines greatly increased government indebtedness and reinforced a spiral decline in the delivery of public services and of the economy generally. This led to the introduction of Structural Adjustment Programmes, adopted as a condition for the foreign aid the government sought to fund its budget. These led to massive layoffs and retrenchments in the civil service. Many people lost their source of livelihoods, which resulted in increased levels of poverty and struggles for scarce state resources, which subsequently led to internal conflicts as the appropriation of state resources further took ethnic or nepotistic dimensions. These fissures, coupled with the tendency by the political elite to use the advantage of incumbency to loot public resources and share with their kin and close allies, crippled the economy leading to stratified and stunted growth. It antagonised the different ethnic entities that were outside the power circle, producing marginalisation, massive deprivation and inequalities that would trigger inter-ethnic conflicts as various groups struggled for scarce resources in the state.
Ethnic conflict and distrust is viewed as the major problem for development in Kenya. The most crucial point is the issue of marginalisation and agitation by the various ethnicities. Marginalisation breeds distrust, suspicion, heightens ethnic tension and may eventually lead to conflict over the sharing and allocation of power and national resources. It, therefore, has the potential to drive a people towards conflict. Ethnicity emerged during the colonial period; and at independence, it became the yardstick for measuring contribution to national development efforts -- especially for allocating and distributing power and national resources. As Kenya endeavours to establish a sustainable form of governance, which will address the prevalent issues of marginalisation and regional disparities, there is need to address perceived factors that
30 Ibid

35Regional Disparities and Marginalisation in Kenya
may militate against the success of these efforts. In certain instances, the annulment of democratic transition that resulted in violent conflicts such as witnessed in 1992, 1997, and 2007, is viewed as a product of ethnic sentiments.
Similarly, the 30-month senseless slaughter occasioned by the Nigerian civil war from 1967-1970 was anchored on ethnic rivalry. This was due to the efforts on the part of the predominantly Igbo people in the south eastern region to carve out an independent nation for themselves. In fact, the history of present-day Nigeria is rife with cases of ethno-religious conflict. Since the annulment of the 1993 elections, there have been demands and counter demands for ethnic marginalisation by various ethnic groups in the country. These were worsened as various groups viewed themselves as victims and pointed accusing fingers at other communities (Anugwon, 2000:61-70). Conflict as an aspect of marginalisation is more pronounced in societies where the inter-ethnic competition for scarce resources is intense, particularly when inequality is accepted as a given and wealth is greatly esteemed. In this type of society, no community/group wants to be confined to the periphery. Groups exploit every means in a bid to remain at the top. In a democratic society where the right to chose is the guiding principle, ethnic groups may show undue interest in who gets what, when, and how. In other words, democratic traditions in ethnically plural societies may be influenced by keen competition, ethnic rivalry and jostling for power and resources. These societies may, therefore, witness social protest, which often takes the form of ethnic conflict. While the spirit of competition may be seen as healthy for democracy, anchoring this competition on ethnicity or ethnic factors may be counterproductive to the move towards democracy.
A host of factors -- such as the impact of the global economy driven by the logic of the market, sectarian and particularistic tendencies, ethnic, religious or cultural differences, or political and economic insecurities -- continue to play a significant role in shaping the political process characterised by violence. Since the return of multiparty democracy, the electoral process in Kenya has been attended by violence. This conflict has pitted ethnic groups against each other as the political elite seek to mobilise their groups in order to access power, sometimes employing violence to change the way of society, or justifying the status quo. The conflict is merely over who has access to state resources since power has been viewed as the only way of acquiring wealth. This only leads to further marginalisation of certain groups perceived to be against the government of the day.
The fact that ethnic tensions have only typically evidenced themselves during electoral contests reflects the general agreement in the literature that it is not ethnicity per se

36 Regional Disparities and Marginalisation in Kenya
that is the cause of the conflict, but politicised ethnicity, wherein entrepreneurial and mendacious politicians exploit existing mistrust and feelings of marginalisation to stoke ethnic tensions and conflict for political gain (Ndegwa, 1997).Aapengnuo (2010:2) notes: “Often, it is the politicisation of ethnicity…that stokes the attitudes of perceived injustice, lack of recognition and exclusion that are the source of conflict … People do not kill each other because of ethnic differences; they kill each other when these differences are promoted as a barrier to advancement and opportunity.” In each of the violent election cycles, there exists ample evidence for this sort of political machinations, may it be the 1991 rallies in the Rift Valley where leaders agitated for a return of their “ancestral” land from the “foreigner” Kikuyu (Klopp, 2002); or in 1997 when a prominent Kalenjin cabinet minister warned of dire consequences for Kikuyu in the Rift Valley if Kibaki continued with his electoral challenge (Klopp, 2002); or in 2007 where the elections were framed as a “Kenya against the Kikuyu” or “41 tribes against the Kikuyu” contest (Chege, 2008), Politicians have long used ethnicity to mobilise votes and deliberately create divisions between the Kikuyu (who voted predominantly for Kibaki’s Party of Nation Unity -- PNU) and the Luo and Kalenjin (who voted predominantly for Raila and his Orange Democratic Movement). The ODM strategy was to cause fear over Kikuyu domination, while the PNU focused on disparaging stereotypes about Raila and his ability to lead.
The Commission of Inquiry into Post-Election Violence in 2007 identified four root causes of the violence. First is the personalisation of presidential power and the deliberate weakening of public institutions since independence. Second is land ownership and inequalities among communities in Kenya perceived in ethno-geographic terms. Thirdly, the commission identified the use of political violence by leaders for political ends which has gone on without sanction for a long time, thus creating a culture of impunity. Lastly, the commission also identified the presence of a large number of economically poor, deprived youth who are easily mobilised to create violence (Klopp, 2002).
Politics in Kenya is largely dominated by ethnic calculations and Kenyans see most government activity through an ethnic lens: “This simplification of political dynamics means that too many an anti-corruption crusade becomes an ethnic witch hunt; a policy to invest in marginal areas becomes an attempt to draw certain minorities into an ethnic coalition, whilst policies to invest in high capacity areas appear as food for the Kikuyu. In turn, for many, a lack of development and/or land is seen as being simply the result of marginalisation of their ‘community,’ but other ‘tribes’ or members of a broader ethnic community.” (Lynch, 2006) Elections are, therefore, viewed as opportunities for ethnic elites to seek domination of state organs in order to assure the development of

37Regional Disparities and Marginalisation in Kenya
their tribe (Lynch, 2006). This competition for state control heightens elite tensions as loss of power (or failure to gain it) is seen as a tremendous loss for the elites and the community: “Ethnic conflicts often emerge in multiethnic underdeveloped societies when the behaviour of the state is perceived as dominated by a particular group or community within it, when communities feel threatened with marginalisation or when no recourse for redressing grievances exists. Ethnic thinking and mobilisation generally emerge from the resulting inequitable access to power and resources and not from an intrinsic hatred.” (Aapengnuo , 2010:2) Thus, ethnic mobilisation is likely to thrive in situations of low interpersonal trust (fear of others), little to no interethnic dialogue when individuals feel marginalised, and it is in this sort of environment that nefarious politicians can fuel ethnic tensions that boil up into outright violence.
Managing Marginalisation Struggles against inequalities and injustice have been at the core of political and social conflicts in Kenya from the colonial period. Inequalities that arose during colonial state formation deepened social stratification and at the same time created conditions for struggles against the colonial state. The rise of the peasantry against the colonial mode of rule in the 1950s had its origins in the need to address inequalities at the level of the economy and politics, as well as the need to address injustices in the distribution of social and economic power.
At independence, Kenya had a majimbo (Kiswahili word for federalist) form of government and two main political parties, the Kenya African National Union (KANU) and the Kenya African Democratic Union (KADU). KANU had membership consisting of the Kikuyu and Luo communities while KADU was made up of relatively smaller ethnic groups in the Rift Valley and the coast, such as the Kalenjin, Maasai, Turkana, and Samburu (KAMATUSA). They joined KADU out of fear of domination by the numerically superior ethnic groups in KANU. KANU won the elections in 1963 and upon assuming power, sought to transform the federalist state to the centralised system of governance. KADU dissolved in 1964 and its leaders joined KANU. Factions made up of moderates and radicals emerged within KANU. The radicals, led by the Vice-President Jaramogi Oginga Odinga, a Luo, resigned from government and formed the Kenya Peoples Union (KPU) in 1966. The government, headed by Jomo Kenyatta, a Kikuyu, proscribed the party in 1969. Mistrust between the Kikuyu and Luo ethnic groups continued to shape most of the political events in Kenya. Daniel arap Moi, a Kalenjin, took power in 1978 and proscribed the main ethno-regional associations, including the ones for the Luo, the Abaluhya and the Gikuyu Embu and Meru Association. He targeted the GEMA and its economic outfit, GEMA Holdings

38 Regional Disparities and Marginalisation in Kenya
to undercut the socio-political influence of the Kikuyu, thus sounding a warning that he would henceforth mobilise loyalty through other ethnic groups. He constituted a new group of loyalists, ironically, including the Kikuyu senior politicians who had not been influential during Kenyatta’s period but who did not enjoy wide support within their ethnic group. Moi brought the Luo and Luhya ethnic groups into his political fold, often playing one ethnic group against the other. Poor governance and ethnicisation emerged as the dominant feature of his regime. His deliberate strategy of creating disparities in the distribution of public positions gave rise to the mobilisation of dissent. Dissent was not confined to any ethnic group, although the Kikuyu were more vocal about marginalisation than other groups.
In 1991, bowing to international and local pressure, the government reintroduced multiparty democracy. This transition had its own costs. The Kalenjin elite interpreted this to mean a strategy to hound Moi and the Kalenjin out of power. Consequently, they advocated the creation of federal states (majimbo) whose boundaries would be defined by territorial claims existing before colonial rule. This resulted in ethnic land clashes in which large groups of Kikuyu families were evicted from Rift Valley Province.
Many political parties were formed in 1992 and 1997 to contest the elections. Each of the main ethnic groups was represented in the elections. In 1992, the Kikuyu were represented in the Democratic Party of Kenya (DP) led by Mwai Kibaki, and Kenneth Matiba’s FORD Asili; the Luo had FORD-Kenya, while the Kalenjin were in KANU. The Luhya were represented in both KANU and FORD Asili. In the 1997 General Election, the Kikuyu again were the majority in DP, while the Luo were the majority in the new National Development Party, the Luhya were in FORD-Kenya as the Kalenjin again followed KANU. Both elections produced results that reflected the ethnic composition of the electorate in the different regions of the country. Each ethnic group voted overwhelmingly for the party whose leader came from that region (Kanyinga, 2006).
Equity and equality in resource allocation has been a serious challenge for succeeding regimes in Kenya. This is due to the self-interest of the leadership to tackle poverty and underdevelopment. The political elite has used this to its advantage, ensuring it secures its position in power and only relegates individuals representing these groups to the level of patronage and sometimes excludes them completely in the sharing of the national cake. While the new constitution is ambitious and people-centred, the leadership viewed historically is not known to act in the public interest. This calls for an aggressive approach in ensuring the full implementation of the new constitution in spirit and in the letter. The first step towards catering for the marginalised should

39Regional Disparities and Marginalisation in Kenya
be addressing the inequalities in all sectors of the economy -- at national and county levels. Safeguarding the interests of the marginalised groups is a critical benchmark in the implementation of the new constitution. While the constitution seeks to establish equity and equality in all spheres of government at the county and national levels, achieving them will likely remain a challenge. This begs the question: how can the interests and rights of individuals be safeguarded against potential marginalisation?
Civil society organisations and lobby groups are required to take a leading role in ensuring marginalised groups are protected in the new framework. In a country where awareness and literacy levels are still low, a huge investment in human rights and education is critical; lobby groups and professional bodies can play a key role in protecting the marginalised and minority in the society. Moreover the public is required to take an active role in the process to ensure this does not turn out to be a missed opportunity.
Minority representation in the new constitution was another issue of concern. Women, youth, and persons with disabilities have been marginalised and excluded from many activities of the state for a long time. The cardinal tenet of democracy is the prospect it offers for individual and group rights. This can only occur where democracy is not characterised by negative influences such as conflict. Neither can it be achieved where largely primordial ethnic sentiments are placed above the ideals of democracy. Such situations inhibit the creation of a democracy and the furtherance of societal development. Democracy, in the opinion of Schumpeter, connotes the institutional arrangement for arriving at political decisions in which individuals acquire the power to decide, by means of a competitive struggle for the people’s vote. This definition emphasises one salient feature of democracy: competition. In this type of competition, individuals can exploit whatever loopholes they perceive in their opponents’ political strategy and thereby rise to power.
Kanyinga asserts that “equality is a highly contested concept and that because of its positive meaning, it is a suitable political slogan everywhere. It has certain social and political ideals, which make it an attractive concept for organising against regimes as well as for organising structures for distributive justice. Secondly, equality is a constitutive of social justice and, therefore, good governance. It is an integral part of social justice and a principle constituting the core of egalitarianism. Because of its political and moral importance throughout history, people have used the language of equality to mobilise against regimes that are antithetical to change. Evolving forms of political and economic domination against different groups make equality even more important today. Equality is an important feature of good governance, particularly if

40 Regional Disparities and Marginalisation in Kenya
good governance is defined as the management of public affairs in a manner responsive to the needs of the society, and exercise of just relations between the state institutions and the people. On this basis, accountability of state institutions implies the exercise of legitimate authority and pursuance of policies that seek to remove different forms of societal disparities. Equal access to opportunities and distribution of public resources thus become important attributes of good governance”.
Social institutions and political structures have a role in providing distributive justice and opportunities through which various groups can access justice. Where such institutions and political structures are themselves the basis for injustices and for preventing social justice, societal conflicts and cleavages tend to deepen. They become a threat to social harmony and distributive justice. They also become the basis of contest and protracted conflicts in which protagonists are defined by how well they create opportunities to marginalise and exclude other communities. They become the basis for formation of group identity, which defines a group against the other.
The Constitution of Kenya, 2010, provides that public finance expenditure “shall promote the equitable development of the country, including by making special provisions for marginalised groups and areas”31. The new constitution further sets out an equalization fund under Article 204 that will help improve infrastructure in the marginalised and poor areas of the country in order to improve them to the level of other counties in the country.
The Constitution declares clearly that it safeguards the interests of the marginalised groups. Section 3 (g-h) of the County Governments Act provides that the county government shall seek to ensure cultural and community diversity of a county is reflected within its assembly and executive committees as well as prescribe mechanisms to ensure the promotion and protection of the interests of the minorities within counties32. This is to ensure that marginalised groups and the minorities are protected both at national and county levels. It further dictates that it shall ensure equitable distribution of resources within the county.
Although it has been widely noted that county boundaries were created on ethnic lines influenced by the former district boundaries at independence, a close examination reveals otherwise. The boundaries have not achieved an ethnically pure demarcation. This is because many ethnic groups have been split into different counties while other groups have been joined under one county. Rural-urban and rural-rural migrations
31 Republic of Kenya. The Constitution of Kenya, 2010, Art 201 b (iii).32 Republic of Kenya. The County Governments Act, 2012. Nairobi: Government Printer, 2012.

41Regional Disparities and Marginalisation in Kenya
transcending ethnic borders have also led to mixed ethnic settlement, making pure geographical delineation impossible. Further, boundary review procedures privilege non-ethnic factors such as population density and demographic trends, the cost of administration and views of the communities affected. However, in more than three quarters of the counties, more than two-thirds of the population belongs to one ethnic group.33
Thus, decentralisation through county governments should lead to protection of minority ethnic groups and greater equitable access and control of economic resources for development.34 Centralisation of political power is synonymous with political and economic marginalisation along ethnic lines in Kenya. As such, devolving powers and resources to the ethnic community level may be seen as a solution to the problem. This is because ideally each tribe can pursue its own economic development.35 There is a thin line between recognising ethnic identity and facilitating political balkanisation along ethnic lines. County governments should obviously pursue the former for the sake of national unity.
The Constitution creates a senate or upper house, whose primary duty is to safeguard county governments at the national level and also provides for a rigid procedure to amend the structure and functions of the county government. Further, the Constitution provides for the independence of vital public institution, a lack of which led to the political interference that roused serious ethnic tensions in the past. County governments will then reduce presidential influence by diffusing political attention at the centre.36 This is because political competition will be diverted from the centre to the county government. County government will exercise political power and some level of autonomy, unlike decentralised units under the former constitution, where all political power was concentrated at the centre. The result is that some ethnic based claims expressed politically will be heard in county governments as opposed to the presidency.37
The new Constitution does create some general safeguards against local autocracy. First, there is separation of functions of the different organs of the county government. Secondly there is a term limit for county governors who can only serve for two terms of five years each, and there are provisions for county governments to check each other. Thirdly, there is an independent procedure through which a county government
33 Ibid34 Ibid35 Ibid36 Ibid37 Ibid

42 Regional Disparities and Marginalisation in Kenya
can be suspended. All these measures are meant to ensure that county governments do not entrench autocracy and defeat the objectives of having effective local democracy.38
Section 102 (c) of the County Governments Act further prescribes the protection and integration of the rights and interests of minorities and marginalised individuals and groups within the county planning and development programmes. In addition, section 104(f) of this law further seeks to provide the preconditions for integrating underdeveloped and marginalised areas to bring them to the level generally enjoyed by the rest of the county.39
In order to address the issue of economic inequalities and access to resources, county governments need resources and should utilise the resources available for equitable development. Chapter 12 of the Constitution deals with public finance. It provides that the principles of public finance shall include equitable sharing of revenue among the national and county governments. It also lists factors that need to be considered in sharing national revenue, which include developmental and other needs of the counties, economic disparities within the counties and the need to remedy such disparities and affirmative action in respect of previously disadvantaged areas and groups, among other factors.40
Transitional justice is a key to ensuring that historical and potential regional disparities are addressed, especially on land issues. The presence of a commission on transitional justice, i.e., the Truth Justice and Reconciliation Commission, will play an important role in addressing the perennial historical injustices that have arisen due to marginalisation and conflicts. The fact that this is already in process should encourage stakeholders and role players to support the commission in the discharge of its functions. There is perhaps the need to learn from success stories around the world in places such as South Africa where similar efforts have succeeded. The success of such programmes is highly dependent on the goodwill of the political elite playing a supportive role rather than being saboteurs, which could fan more conflicts. Unlike previous commissions, the TJRC’s report must be implemented fully as a way of addressing marginalisation.
The land policy document released in 2009 should be adopted as this is the major area that has led to the marginalisation of other communities and ethnic groups in the country. There is no doubt that marginalisation and land conflicts share the same platform or reinforce each other whenever one is mentioned. This calls for the
38 Ibid.39 Ibid 40 The constitution of Kenya 2010.

43Regional Disparities and Marginalisation in Kenya
implementation of land reforms in line with the new constitution and the various new laws related to this.
The establishment of counties will ensure that communities or groups have the last say in the way they are governed and managed. The chapter on devolution in the Constitution seeks to establish not a federal system, but a developmental system with a clear relationship on how the national government and the county governments will work together in achieving goals. While this may look like a panacea for marginalisation and underdevelopment, it may turn out as another platform for staging inequalities. The counties could turn out to be new platforms for disparities in resource allocation and potential battle grounds, as has been seen in the local municipal council politics that are perennially characterised by disputes over resources and jostling for positions in order to determine who gets what, when and how, which only breeds corruption and mismanagement of public coffers. There is need for the senate to be vigilant and diligent in its role as the public watchdog over the county government’s performance.
Conclusion and RecommendationThe foregoing discussion traces the causes of the ethnic clashes to Kenyans feeling marginalised by the state, having little trust in the government and in fellow Kenyans, and expecting rewards from their domination of state resources for the benefit of the community. Efforts to deal with ethnic conflict must focus singularly on the generation of opportunities for the exchange of views between people of different backgrounds. These increased contacts should lead to the production of generalised trust, tolerance and a host of other civic values (Anderson & Paskeviciute, 2006). Encouraging Kenyans to develop and engage in community organisations oriented towards issues of common interest, should result in the development of a more trusting populace and voting into public office people who eschew defensive ethnic voting and focus more on issue or policy voting; minimising opportunities for politicians to instill ethnic fear. Militating against ethnic conflict and preventing future eruptions of violence requires a variety of policy interventions, the areas laid out in the 2008 power sharing agreement provided a starting point for the development of a new institutional, legal, constitutional and economic dispensation in Kenya. To effectively deal with the issue, a holistic approach must be adopted. Such an approach should include fully accounting for and punishing those involved in the post-election violence. These efforts should end the impunity of ethnic baiters. The creation of the Truth, Justice and Reconciliation Commission to deal with other past human rights violations is a step toward providing healing for those affected by violence in the past (electoral or otherwise). Publishing

44 Regional Disparities and Marginalisation in Kenya
and a thorough review of the 1992 and 1997 clashes reports and recommendations is also necessary for a full and open accounting of the past. Other actions include the enactment and enforcement of anti-discrimination laws, as well as, an active and enabled National Cohesion and Integration Commission to investigate claims of discrimination and mitigate tribal tensions. Recent attempts by the commission to investigate and prosecute politicians using discriminatory language (bordering on hate speech) have been laudable.
There is no doubt that development comes at a cost. A cost to those in whose interest it is meant to benefit. Every government, in a bid to resolve problems, encounters numerous challenges that undermine solutions or even create new problems altogether. In 2002, the National Alliance Rainbow Coalition government came to power on the platform of change. Little did the enthusiastic Kenyan electorate know that this was going to be ‘another government just like the other one.’ The same can be said of the new Constitution: while many view it as the perfect solution for the problem of marginalisation in Kenya, it may compound the already full basket of problems Kenya is shouldering. Implementing the new Constitution will be hard: pro-status quo forces seek to derail the process as the forces of change strive to make milestones. It is already evident from the foregoing that the political elite is not ready for change and that some of them supported the new Constitution halfheartedly so as to be on the ‘right side of history. Going by the public pronouncements at political rallies, the Kenyan citizen and electorate should be on the lookout as rightwing politicians strive to amend the Constitution in order to suit their desires. This will only leave the country grappling with unaddressed issues.
The advent of the devolved government has been received with enthusiasm and great relief by those who see it as a solution to regional disparities. However, this might not be the case. What the Constitution has done is to create two tiers of government, presenting the citizen with an opportunity for self government while abolishing patronage at the centre. While this might be the solution for regional inequality, given the nature of Kenya’s politics, devolution might see further dispersal of ethnicity, dialects, clannism and nepotism to the county level. With the same players lining up to face off in the political contest, different ethnic groups are likely to field their preferred candidates at the county level, which can only translate into the majority carrying the day while the minorities remain in poverty and economic backwardness. In some counties, such as those dominated by the Kalenjin and Luhya, dialects will form the bargaining ground for governorship and senatorship. Those who will martial support from the different dialects represented in the county will be able to carry the day. In other areas, clans and families will form the basis for mobilisation of votes and support, which will be

45Regional Disparities and Marginalisation in Kenya
rewarded as soon as one ascends to the seat of governorship. The governor’s position is set to attract a lot of attention given the massive resources that will be pumped into each county. The governor is set to be another position for playing patronage politics as it is an executive position that will entail management of funds.
Cumulatively, marginalisation is set to replicate itself in the counties as different groups are dividing along demographic lines and set out to coalesce around individuals. Competition at the county level will be the face of the presidency of yesteryears where ethnicity, clannism/nepotism and dialects constitute the platform for resource allocation. Coupled with an uninformed public, the structural manifestation of marginalisation at the national level will receive a new face at the county level.

46 Regional Disparities and Marginalisation in Kenya
Regional Disparities in Employment and Human Development in Kenya41
ContextRegional inequalities and imbalances have increasingly become a source of political and social conflict. Even though Kenya developed and promulgated a new Constitution in 2010, challenges persist. The country still suffers from traditional power imbalances between the male and female gender; resources distribution continues to entail a dark lining of inequality based on region, ethnicity and class, infrastructural development continues to marginalise the already marginalised communities, and public service continues to exhibit generalised ethnic imbalances in favour of communities whose members have held the presidency, among others.
While the new Constitution promises radical changes in the management of the country’s affairs and gives greater say and opportunity for participation to communities through devolved government, it also creates further avenues through which marginalisation and disparities emerging on the basis of the new county structures can deepen. The greatest allure of a devolved system is in its promise to bring about equitable distribution of national resources and, therefore, address socio-economic inequalities that were inherent in a centralised system for many decades. Yet, the biggest challenge of this system perhaps lies in new emerging fears and, in some cases, old rivalries that were largely submerged by the tight control of the central governance coming out in the form of renewed marginalisation and ethnic nationalism, which if not addressed, could undermine peace, stability, governance and service delivery. As a result, cases of conflicts caused by marginalisation and regional discontent cannot be dismissed, especially in the new governance framework.
Addressing regional disparities in Kenya obviously requires the development and implementation of an alternative approach to development that provides a multifaceted and multi-sectoral framework that will foster a more balanced economic development of the country. Such an approach would, of necessity, revolve around the formulation and implementation of equity-oriented policies and programmes. It would require the the formulation and implementation of an integrated regional development framework, reforms in the legal environment to create a more cohesive framework for addressing regional disparities, and a robust monitoring framework that will develop and track
41 Dr. Jacob Omolo , Lecturer at the School of Economics (Department of Applied Economics), Kenyatta University

47Regional Disparities and Marginalisation in Kenya
the achievement of key indicators and milestones of balanced regional development. Further, the recognition that there exist various actors in regional development is critical. As part of the interventions to promote policy discourse and dialogue, this paper seeks to document the state of regional disparities in employment and earnings, and human development in Kenya.
BackgroundKenya aspires to become a globally competitive country offering a high quality of life to all its citizens by the year 2030. Attaining this aspiration hinges on the extent to which the country is able to create and nurture a competitive and adaptive human resource base that is responsive to the rapidly industrialising and globalising economy. The economic, social and political pillars of the Kenya Vision 2030 are anchored on existence of a skilful, productive, competitive and adaptive human resource base. Creating productive, decent and sustainable employment opportunities is, therefore, at the core of achieving Vision 2030 goals.
The Constitution reaffirms the government’s obligations on employment. It provides for equality in access to employment opportunities. Specifically, Article 41 of the Constitution grants all persons the right to fair labour practices. It guarantees every worker the right to: fair remuneration; reasonable working conditions; form, join or participate in trade union activities and programmes; and undertake strike action. Article 43 of the Constitution provides for economic and social rights, which include the right to social security. The Constitution, therefore, advocate decent work, where freely chosen productive employment is promoted simultaneously with fundamental rights at work, adequate income from work, representation and the security of social protection. Thus, any disparities in employment and earnings -- whether regional or gender related -- would undermine the spirit of the Constitution.
Regional and Gender Disparities in Wage EmploymentEmployment is globally recognised as a means of freeing people from extreme poverty and multiple deprivations. In Kenya, employment varies according to regions as illustrated in Figure 3.1.

48 Regional Disparities and Marginalisation in Kenya
Figure 3.1: Wage Employment by Province (000s)
Source of data: Republic of Kenya (2011; 2010)
Figure 3.1 shows the variations in wage employment over the period 2005-2010. Nairobi claimed the highest number of wage employees, followed by Rift Valley, Central and Coast provinces. North Eastern has the least number of wage employees followed by Western, Eastern and Nyanza.
Trends in wage employment show that the provincial share of wage employment remained almost constant over the 2005-2010 period. According to the data, the proportion of wage employees in Nairobi remained constant at about 25.1 per cent of the national wage employment (Republic of Kenya, 2011; 2010). The comparative figure for Rift Valley was 22.5 per cent, Central 14.2 per cent, Coast 12.4 per cent, Nyanza 9.9 per cent, Eastern 8.3 per cent, Western 6.6 per cent and North Eastern 0.9 per cent. Over the same period, national wage employment grew by 13.7 per cent, or an average of 2.7 per cent per year.
The trends and regional variations in wage employment are a manifestation of the regional disparities in economic activities. They also reflect the unbalanced growth models pursued by the government over time. The constant regional share of wage employment also implies that no meaningful progress has been made in promoting regional balance
2005 2006 2007 2008 2009 2010
2500
2000
1500
1000
500
0
Empl
oym
ent (
000s
)
Nairob
iCoa
st
N. Eas
tern
Easte
rn
Centra
l
R. Va
lley
Nyanza
Wester
nTot
al
Provinces

49Regional Disparities and Marginalisation in Kenya
in access to employment opportunities. Thus, without policy, institutional and legal strategic interventions, the regional imbalances in access to employment will persist, thereby undermining the country’s socio-economic development.
Other wage employment dynamics in Kenya show that the proportion of women in wage jobs increased marginally from 26.2 per cent in 1995 to 29.5 per cent in 2000, but remained constant at 29.6 per cent in the period 2001-2004. It then increased marginally to average 30.2 per cent over the 2006-2008 period, but thereafter declined to 28.7 per cent in 2010 (Republic of Kenya, 2011).
The trends in total employment and share of women in wage employment reveal inequalities in women’s access to wage employment. It shows that even though there was some growth in formal sector employment, averaging 1.98 per cent per annum in 1995-2010, the employment opportunities were not accessed equally by women and men -- as would be expected under the decent work agenda. The negative impact of such inequality in access to wage employment is worsened by the fact that on average, the mean monthly earnings from paid employment for males are about 1.5 times that of females (Republic of Kenya, 2005).
Kenya has been experiencing shifts in forms of employment. This is depicted by casualisation of work, contract engagement, outsourcing of jobs, subcontracting and temporary employment. The proportion of casual workers in wage employment increased gradually from 17.9 per cent in 2000 to 21.2 per cent in 2005 (Republic of Kenya, 2006). The proportion of employees on casual terms increased thereafter to reach an all time high of 32.2 per cent in 2008, before declining marginally to 30.1 per cent in 2010 (Republic of Kenya, 2011). The increase in formal sector employment between 2002 and 2003 was, for example, wholly attributed to the increase in the number of casual workers. Between 2009 and 2010, the number of workers on casual terms of employment increased by 5.4 per cent, as compared to 2 per cent for employees on regular terms.
Casualisation of jobs and other contemporary forms of employment more often than not do not facilitate the workers to enjoy the fundamental rights at work (Omolo, 2010). Such rights include freedom of association and collective bargaining, the right to paid leave, and the right to social protection as provided under the National Social Security Fund (NSSF) and the National Hospital Insurance Fund (NHIF). Even though the NSSF and NHIF have expanded their membership base to include casual and other workers, only a few have joined the schemes. Such forms of employment, if not well checked, impair labour relations and erode worker protection. They also transfer

50 Regional Disparities and Marginalisation in Kenya
additional responsibilities, such as social and trade union protection, job security, and wage negotiations to the worker. This may, however, be at the expense of productivity, national competitiveness and employment creation.
Regional Disparities in Informal Sector EmploymentThe informal sector constitutes an important segment of Kenya’s labour market. Trends in informal sector employment also manifest considerable regional disparities as illustrated in Figure 3.2.
Figure 3.2: Informal Sector Employment by Province (000s)
Source of data: Republic of Kenya (2011)
Consistent with the regional trends in wage employment, and as depicted in Figure 3.2, Nairobi Province has the highest number of informal sector employees. This is followed by Rift Valley, Central, Coast and Nyanza. North Eastern Province still stands out as the province with the least employment.
In terms of informal sector employment proportions or share, Nairobi Province accounts for an average of 24.4 per cent of total informal sector employment. This is compared to 18.9 per cent for Rift Valley, 15.8 per cent for Central and 12.4 per cent
2010 2009 2008 2007 2006 2005
Total
N. Eastern
Coast
Eastern
R. Valley
Western
Nyanza
Central
Nairobi
0 1000 2000 3000 4000 5000 6000 7000 8000 9000
Employment (000s)
Prov
ince

51Regional Disparities and Marginalisation in Kenya
for Coast. Others are Nyanza at 11.7 per cent, Eastern at 9 per cent, Western at 7.3 per cent and North Eastern at 0.5 per cent.
A comparative analysis of the shares of formal and informal sector employment shows that Nairobi, Rift Valley and North Eastern provinces have a relatively higher proportion of wage employees than informal sector ones. However, Central, Nyanza, Eastern and Western provinces have a relatively large proportion of informal sector employees as compared to wage employees. The proportion of wage and informal sector employees in Coast Province is the same, at 12.4 per cent.
In the context of the urban-rural divide, the number of persons engaged in the informal sector in urban areas increased from 33.9 per cent of total informal sector employment in 2005 to about 39 per cent in 2010 (Republic of Kenya, 2011). Over time, the proportion of informal sector employees has been higher in the rural than in the urban areas.
Though a key contributor of jobs in Kenya, informal sector employment is precarious in nature and presents decent work deficits. The jobs are characterised by job insecurity, poor wages and terms and conditions of employment, and absence of institutionalised social protection mechanisms. Other manifestations of decent work deficits in the sector are weak workplace safety and health standards, and low job tenure (Republic of Kenya, 2012).
Disparities in UnemploymentThe employment challenge in Kenya has grown over time. The level of open unemployment in the country increased from 6.7 per cent in 1978 to 14.6 per cent in 1998/1999 before easing to 12.7 per cent in 2005/2006 (Republic of Kenya, 2012). In 2005/2006, Kenya had a disguised or under-employment rate of 21 per cent and a working poor of 46 per cent of the employed. The incidence of Kenya’s open unemployment also varies according to age, region and gender.
Kenya’s unemployment data reveal considerable variations among different age cohorts. Figure 3.3 gives a schematic representation of urban unemployment rates in Kenya by age group over the years 1978, 1986 and 1998/99.

52 Regional Disparities and Marginalisation in Kenya
Figure 3.3: Urban Unemployment Rates by Age (1978, 1986 and 1998/99)
Source of data: National Economic and Social Council (2010)
Figure 3.3 shows that the relationship between the unemployment rate and age takes a U-shape. Urban unemployment is highest among youth, relatively low for the middle aged and, rises thereafter.
Though not directly observable from Figure 3.3, in 1978, the urban unemployment rate among the 15-19 years age cohort was 26.6 per cent compared to 18.5 per cent for the 20-24 years age group and 4.8 per cent for the 25-29 years and 30-34 years age groups. The urban unemployment rate for the 50-54, 55-59 and 60-64 age groups was 1.4 per cent, 1.5 per cent and 3.2 per cent, respectively. In 1998/99, the urban unemployment rates for 15-19, 20-24, 25-29 and 30-34 age groups was 47 per cent, 47.3 per cent, 25.1 per cent and 14.3 per cent, respectively. This is compared to 18.9 per cent, 40.6 per cent and 45.2 per cent for the 50-54, 55-59 and 60-64 age cohorts, respectively, in that order.
Figure 3.4 gives national unemployment rates by age. It also indicates the U-shaped relationship between unemployment rate and age.
50
45
40
35
30
25
20
15
10
5
015-19 20-24 25-29 30-34 35-39 40-44 45-49 50-54 55-59 60-64 Total
Empl
oym
ent R
ate
Age Cohort
1978 1986 1998/99
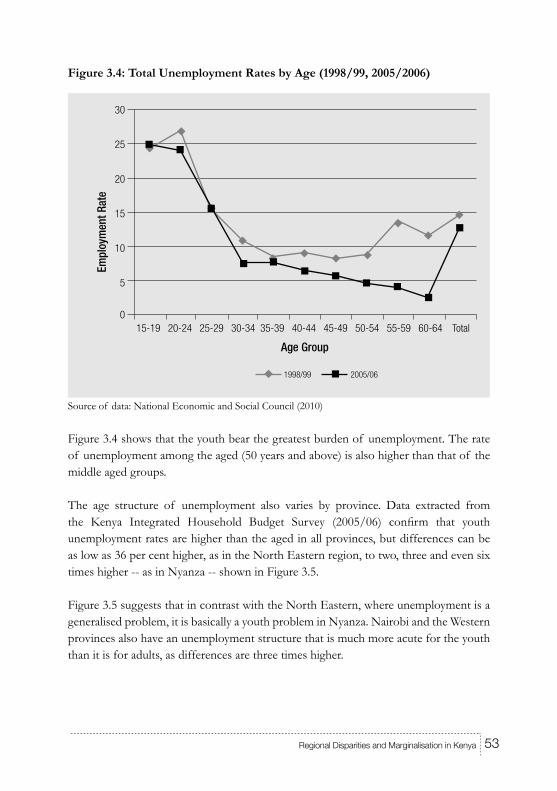
53Regional Disparities and Marginalisation in Kenya
Figure 3.4: Total Unemployment Rates by Age (1998/99, 2005/2006)
Source of data: National Economic and Social Council (2010)
Figure 3.4 shows that the youth bear the greatest burden of unemployment. The rate of unemployment among the aged (50 years and above) is also higher than that of the middle aged groups.
The age structure of unemployment also varies by province. Data extracted from the Kenya Integrated Household Budget Survey (2005/06) confirm that youth unemployment rates are higher than the aged in all provinces, but differences can be as low as 36 per cent higher, as in the North Eastern region, to two, three and even six times higher -- as in Nyanza -- shown in Figure 3.5.
Figure 3.5 suggests that in contrast with the North Eastern, where unemployment is a generalised problem, it is basically a youth problem in Nyanza. Nairobi and the Western provinces also have an unemployment structure that is much more acute for the youth than it is for adults, as differences are three times higher.
1998/99 2005/06
15-19 20-24 25-29 30-34 35-39 40-44 45-49 50-54 55-59 60-64 Total
Empl
oym
ent R
ate
Age Group
30
25
20
15
10
5
0

54 Regional Disparities and Marginalisation in Kenya
Figure 3.5: Youth and Adult Unemployment Rates by Province, 2005/2006
Source of Data: KIHBS (2005/06)
Data extracted from the Kenya Integrated Household Budget Survey (2005/06) also indicates that youth unemployment rates vary greatly from one province to another. The youth unemployment rates are low in Nyanza and Nairobi, relatively high in Central and Eastern provinces, and considerably high in North Eastern Province (Figure 3.6).
Figure 3.6: Youth Unemployment Rates by Province
Source of data: KIHBS (2005/06).
60
50
40
30
20
10
0
Perc
ent
Nairo
bi
Cent
ral
Coas
t
East
ern
North
E.
Nyan
za
Rift
Valle
y
Wes
tern
Key: Youth Unemployment Adult Unemployment
60
50
40
30
20
10
0
Perc
ent
Nyan
za
Nairo
bi
Coas
t
Wes
tern
Rift
Valle
y
Cent
ral
East
ern
North
E.

55Regional Disparities and Marginalisation in Kenya
In Kenya, the 15-19, 20-24 and 25- 29 years youth cohorts represent the entry node into the labour market. The relatively high rates of open unemployment among this entry group emphasise the magnitude of the country’s employment inequities and decent work deficits. While local youth unemployment conditions should guide policy actions, they are also important to have a countrywide vision of how the absolute numbers of unemployed young people are distributed across provinces.
Figure 3.7 shows that Rift Valley Province has the largest number of the unemployed youth: slightly more than 500,000. North Eastern Province has the smallest number of unemployed young people at 148,000. Despite its large size, Nairobi accounts for about 231,000 unemployed youth.
Figure 3.7: Youth Unemployment Province (Number)
Source of data: KIHBS (2005/06)
Figure 3.8 gives the distribution of youth unemployment by province and age. It uses the five-year moving average (age ma5).
Western: 231
Central: 303
Coast: 303
Eastern: 391
Rift Valley: 555
North E.: 148
Nyanza: 199
Nairobi: 231
Thou
sand
s
The Unemployed

56 Regional Disparities and Marginalisation in Kenya
Figure 3.8: Youth Unemployment Rates by Province and Age (per cent)
Source of data: KIHBS (2005/06)
Figure 3.8 shows that Nairobi and North Eastern have high unemployment rates. The unemployment rates for Nairobi and North Eastern are especially high for the youngest age group. Central and Eastern provinces, on the other hand, have relatively low unemployment rates for young people aged 15-19 years. North Eastern and, to a less extent, Coast Province, have high unemployment rates for people aged 30-34 years. The largest number of unemployed youth by age group scatters across various provinces. For ages 15-19, 20-24 and 30-34, the largest number are residents of the Rift Valley (Figure 3.9). In turn, the largest number of unemployed aged 25-29 years is located in the Eastern Province, followed closely by the Rift Valley. The number of unemployed youth aged 30-34 years is small compared to other youth age cohorts.
Nairobi has the smallest number of unemployed youth aged 15-19 years; North Eastern

57Regional Disparities and Marginalisation in Kenya
has the smallest number of unemployed youth aged 20-24 and 25-29 years; and Nyanza the smallest number of the unemployed youth aged 30-34 years.
Figure 3.9: Youth Unemployment Province and Age Groups (Number)
Source of data: KIHBS (2005/06)
The large proportion of unemployed aged 15-19 years in North Eastern Province may be attributed to an unusually low proportion of full time students and low access to informal jobs (Figure 3.10). Unemployment in North Eastern Province can potentially be higher, as the relatively large proportion of young people engaged in other activities could rapidly start looking for a job. Differences in the proportion of unemployed across provinces other than North Eastern may be primarily attributed to the degree to which young people engage in informal activities. Only a small part can be attributed to differences in the proportion of young people that are full time students.
The large proportion of unemployed youth aged 20-24 in North Eastern, Eastern and Central provinces is again due to a combination of low full time student enrolment and the absence of jobs, even in the informal sector. In the case of Central and North
150
100
50
Central Coast Eastern Nairobi North E. Nyanza Rift V. Western
150
100
50
Unem
ploy
ed (t
hous
ands
)
Age Group
Central Coast Eastern Nairobi North E. Nyanza Rift V. Western
25-29 30-34
15-19 20-24

58 Regional Disparities and Marginalisation in Kenya
Eastern provinces, the pressure on labour markets would be higher if it were not for the large proportion of young people engaged in home work and other activities.
The proportion of unemployed youth aged 25-29 is again large in these three provinces, but the mix of activities is different. In Eastern and Central provinces, large unemployment coincides with relatively strong access to formal and informal jobs, suggesting that high unemployment in the regions is associated with low proportions of people in home maker and other activities. In contrast, access to formal and informal jobs is limited in the North Eastern Province. In fact, had it not been for the large proportion of youth engaged as home makers and “other” occupations, the proportion of unemployed could have easily doubled. The main determinant of a moderate proportion of unemployed is access to informal jobs as the proportion of unemployed can be higher or lower regardless of the proportion engaged in formal activities.
The proportion of unemployed youth aged 25-29 years in Nairobi is relatively small. This is attributed to the moderate levels of engagement of Nairobi’s youth in formal and informal activities. Also, the proportion of Nairobi’s youth engaged as home makers and “other” inactive activities is very small. Youth unemployment in Nairobi would be higher without its strong informal sector.
Access to formal jobs is relatively high in the Eastern, Central and Rift Valley provinces, and low in the North Eastern, Western and Coast provinces. The proportion of youth engaged in full time study is similarly low in all provinces except for Western Province, where the proportion is noticeably higher. The proportion of young people aged 25-29 years who are home makers and “other” varies significantly across provinces.
The foregoing analysis suggests that any youth unemployment strategy should be flexible enough to take into account the particular conditions of each province and age group. When setting priorities, policies also need to take into account the fact that unemployment rates by age group do not always reflect the severity of unemployment in terms of absolute numbers. High rates of unemployment in relatively small population groups are not so much of a problem as relatively lower unemployment rates within numerous groups of youth. Many of these differences across provinces might be accounted for by several factors: the disparities in availability of education opportunities for young people (that delay their participation in labour markets); inequalities in the wealth of families (that can support young people longer without working); and the sex composition of youth, together with local traditions in relation to labour market participation, among others.

59Regional Disparities and Marginalisation in Kenya
Figure 3.10: Proportion of Youth by Main Activity and Age Group (per cent)
Source of data: KIHBS (2005/06)
Gender and Regional Disparities in UnemploymentUnemployment rates differ significantly from one province to another, and in terms of gender. According to the Kenya Integrated Household Budget Survey (2005/06) data, unemployment rates are higher for females than for male in all age groups in Central, North Eastern and Rift Valley provinces (Figure 3.11). The largest gap in female-male unemployment is in North Eastern Province.
From Figure 3.11, there are three provinces, Eastern, Western and Nyanza, where female unemployment rates are higher among the younger age groups but similar to the males among the older youth. According to Figure 3.11, Coast and Nairobi have a female unemployment rate that is higher than the male rate, particularly among older young people. The gender variation in the rate of unemployment is a manifestation of decent work deficits in the country, while the regional variation shows the imbalances in growth and development, and the negative effects of rural-urban migration.
100
80
60
40
20
0
100
80
60
40
20
0
Perc
ent
Cent
ral
Coas
t
East
ern
Nairo
bi
North
E
Nyan
za
Rift
V.
Wes
tern
Cent
ral
Coas
t
East
ern
Nairo
bi
North
E
Nyan
za
Rift
V.
Wes
tern
UnemployedFormal
InformalStudent
HomeOther

60 Regional Disparities and Marginalisation in Kenya
Figure 3.11: Unemployment Rates by Province, Age and Sex
Source of data: KIHBS (2005/06)
Regional Disparities in WagesKenya has considerable regional variations in wages. This may be attributed to the wage formation systems the country has adopted. The highest wages are paid in Nairobi in all worker categories, but the biggest difference is among employees of formal private businesses. The narrower differences are among employees of informal business, which constitute the self employed and unpaid family workers (informal-other). Figure 3.12 represents the mean wages by province and type of employer (all ages) in thousands of Kenya shillings.
80
60
40
20
0
80
60
40
20
0
80
60
40
20
0
80
60
40
20
0
20 25 3020 25 30
20 25 30
Unem
ploy
men
t Rat
e %
5 year averages (e.g 17= avg. 15-19, 22=avg. 20-24, 27=avg. 25-29, 32=avg. 30-34)
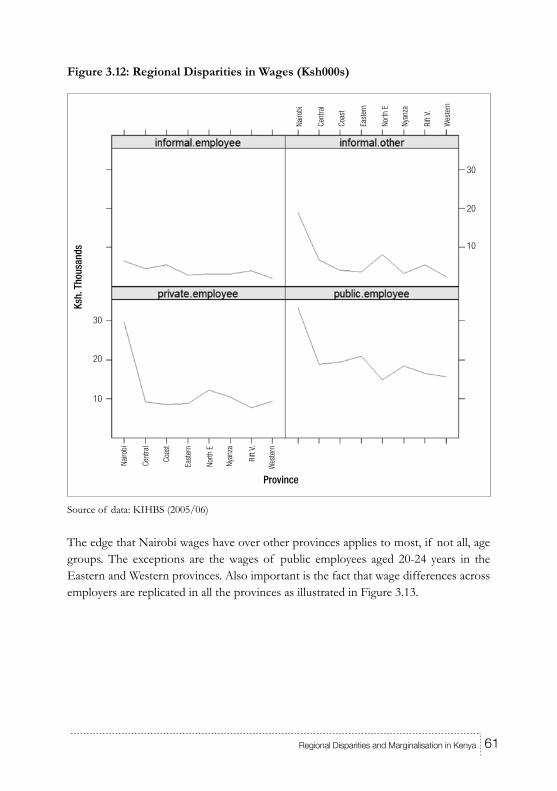
61Regional Disparities and Marginalisation in Kenya
Figure 3.12: Regional Disparities in Wages (Ksh000s)
Source of data: KIHBS (2005/06)
The edge that Nairobi wages have over other provinces applies to most, if not all, age groups. The exceptions are the wages of public employees aged 20-24 years in the Eastern and Western provinces. Also important is the fact that wage differences across employers are replicated in all the provinces as illustrated in Figure 3.13.
30
20
10
30
20
10
Nairo
bi
Cent
ral
Coas
t
East
ern
North
E
Nyan
za
Rift
V.
Wes
tern
Nairo
bi
Cent
ral
Coas
t
East
ern
North
E
Nyan
za
Rift
V.
Wes
tern
Ksh.
Tho
usan
ds
Province

62 Regional Disparities and Marginalisation in Kenya
Figure 3.13: Regional Disparities in Wages by Age Group (Ksh000s)
Source of data: KIHBS (2005/06)
Regional Disparities in Human DevelopmentThe Human Development Index (HDI) is widely used to compare the level of human development between regions and countries (UNDP, 2011). The HDI provides a useful measure of progress toward achieving greater levels of development. The development of the HDI is based on a set of limited indicators that measure the basic dimensions of human development and the enlargement of people’s choices (UNDP, 2010). For the purposes of this study, human development is assessed based on adult literacy rates; healthy living and access to social amenities as measured by access to improved water sources, life expectancy at birth, and standards of living as proxy by the Gross Domestic Product (GDP) per capita in Purchasing Power Parity (PPP) in United States (US) dollar terms. The 2009 Human Development Report is the latest data for Kenya.
Adult Literacy RatesThis indicator assesses the ability of a person to read or write in any language. It is based on self-assessment and not on actual tests. The 2005/2006 KIHBS shows considerable regional disparities in adult literacy rates as illustrated in Figure 3.14.

63Regional Disparities and Marginalisation in Kenya
Figure 3.14: Adult Literacy Rates
Source of data: UNDP (2010)
Figure 3.14 reveals that North Eastern Province had the lowest adult literacy rate at 24.8 per cent. This is compared to the national adult literacy rate of 71.4 per cent. The adult literacy rate for North Eastern Province is 38.1 percentage points below that of Coast (62.9 per cent) and 42.2 per cent points below Rift Valley (67 per cent). According to the data, Nairobi Province had the highest adult literacy rate at 88.1 per cent, followed by Central Province at 79.8 per cent. Table 3.1 gives the regional disparities in adult literacy rates by gender.
Table 3.1: Regional and Gender Disparities in Adult Literacy Rates
Region Male Female % Difference
Nairobi 92.0 84.2 7.8
Central 84.4 75.8 8.6
Coast 73.8 53.0 20.8
Eastern 72.6 64.6 8.0
North Eastern 37.5 11.6 25.9
Nyanza 85.0 69.7 15.3
Rift Valley 71.6 62.3 9.3
90
80
70
60
50
40
30
20
10
0
Perc
ent
Nairob
i
Centra
lCoa
st
Easte
rn
North E
.
Nyanza
Rift V
alley
Wester
nRu
ral
Urban
Nation
Regions
88.1
79.8
62.968.5
24.8
76.9
6772.1 71.3
7371.4

64 Regional Disparities and Marginalisation in Kenya
Western 76.7 67.9 8.8
Rural 77.0 66.0 11.0
Urban 77.5 69.1 8.4
Nation 77.0 66.1 10.9
Source of data: UNDP (2010)
Table 3.1 depicts marked gender disparities in adult literacy rates. The highest differences in the male-female adult literacy rates was recorded in North Eastern Province (25.9 percentage points) followed by Coast Province (20.8 percentage points). The regions with the lowest gender disparities in the adult literacy rates was Nairobi Province (7.8 percentage points) followed by Eastern (8.0 percentage points) and Western (8.8 percentage points). In terms of the rural-urban divide, the gender disparities in the adult literacy rates are higher in the rural (11.0 percentage points) than in the urban areas (8.4 percentage points). The rural male-female difference in adult literacy rates is closer to the national figure of 10.9 percentage points.
Access to Improved Water SourceThe other indicator of human development is healthy living and access to social amenities. In this study, the indicator is measured in terms of access to improved source of water. In this context, water is considered safe if it is piped, or obtained from a borehole protected spring or protected well. This indicator also presents marked disparities in access to safe drinking water. Data from the 2005/2006 KIHBS indicates that at the national level, 57 per cent of the population had access to safe drinking water. In terms of the rural-urban divide, 56.6 per cent of the rural population had access to safe drinking water while 66.1 per cent of the urban population had access to drinking water from sources considered to be safe. Within this framework, the rural-urban variation was 9.5 percentage points. The regional disparity in access to safe drinking water is more pronounced, as illustrated in Figure 3.15.
Figure 3.15 illustrates that access to safe drinking water is highly skewed in Kenya. While 97.1 per cent of the population in Nairobi access drinking water from sources that are considered to be safe, a reverse situation is found in other regions of the country. In North Eastern Province, only 34.6 per cent of the population has access to safe drinking water. This represents a 62.5 percentage points gap between Nairobi and North Eastern. Similarly, only 46.1 per cent of the population in Eastern Province, and 50.6 per cent of Nyanza and Rift Valley provinces has access to safe drinking water. Other regions with modest access to safe drinking water are Central (51.9%), Western (63%) and Coast (63.4%).

65Regional Disparities and Marginalisation in Kenya
Figure 3.15: Regional Disparities in Access to Safe Drinking Water
Source of data: UNDP (2010)
Life Expectancy at BirthThe other indicator of human development is life expectancy at birth. Life expectancy is a summary measure of the average number of additional years a group of individuals can expect to live at a given exact age (UNDP, 2010). Life expectancy at birth is, therefore, a measure of overall quality of life in a country and summarises the mortality at all ages. It can also be used as an indicator of the potential return on investment in human capital.
Data from the 1998/1999 Kenya Population and Housing Census put Kenya’s life expectancy at 56.6 years. In terms of regions, Central, Rift Valley, North Eastern and Eastern had relatively high life expectancies as compared to other provinces. Nyanza Province had the lowest life expectancy (44.8 years), followed by Western Province (52.8 years) and Coast Province (55.1 years). Figure 3.16 illustrates the disparities in life expectancy in Kenya.
100
90
80
70
60
50
40
30
20
10
0
97.1
51.9
63.4
46.1
34.6
50.6 50.6
63
57
Perc
ent
Regions
Nairob
i
Centra
lCoa
st
Easte
rn
North E
aster
n
Nyanza
Rift V
alley
Wester
nNati
on

66 Regional Disparities and Marginalisation in Kenya
Figure 3.16: Regional Disparities in Life Expectancy
Source of data: UNDP (2010)
Figure 3.16 indicates that there exist wide disparities in life expectancy across the provinces in Kenya. As illustrated in Figure 3.16, while an average person born in Central Province would expect to live for 64.2 years, a person born in Nyanza would expect to live for 44.8 years. This gives a life expectation disparity of 19.4 years. In comparison to other provinces, an average person born in Nyanza Province would expect to live for 16.7, 17.1 and 17.9 years shorter than an average person born in Eastern, North Eastern and Rift Valley Provinces, respectively. At the national level, an average Kenyan can live 11.8 years longer than an average person born in Nyanza.
Standards of LivingThe standard of living was measured using the GDP per capita in US dollars purchasing power parity terms. Based on the 2005/2006 KIHBS, Kenya exhibits wide disparities in GDP per capita, with the annual per capita in the rural areas being US$979 as compared to US$2,790 in the urban areas and US$1, 436 at the national level. Figure 3.17 presents the regional variations in GDP per capita.
Nairobi Central Coast Eastern N. Eastern Nyanza R. Valley Western Nation
Life Expectancy (Yrs) 57 64.2 55.1 61.5 61.9 44.8 62.7 52.8 56.6
70
60
50
40
30
20
10
0

67Regional Disparities and Marginalisation in Kenya
Figure 3.17: Regional Disparities in GDP Per Capita
Source of data: UNDP (2010)
As illustrated in Figure 3.17, the GDP per capita in Nairobi Province (US$3,673) is about 1.5 times higher than in Coast Province (US$1,460) and 5.7 times than in North Eastern Province (US$644). North Eastern Province has the lowest GDP per capita, followed by Western (US$903), Eastern (US$1,070) and Nyanza (US$ 1,093) provinces.
Generally, the per capita income of North Eastern Province is less than a fifth of Nairobi’s. It is about two-fifths that of Coast (44.1%), Central (44.6%) and the national economy (44.8%). It is, however, at least half that of Rift Valley (52.4%), Nyanza (58.9%), Eastern (60.2%) and Western (71.3%).
Regional Disparities in Human Development IndexKenya’s HDI has increased gradually from 0.420 in 1980 to 0.509 in 2011 (UNDP, 2011). As of 2009, the country’s HDI was 0.541 based on a global rating (UNDP, 2011) but 0.561 based on the national report (UNDP, 2010). The implication is that the country’s level of human development deteriorated in 2011 as compared to 2009. Kenya exhibited disparities in the level of human development across the eight provinces, based on the 2009 estimates. Figure 3.18 gives the regional disparities in HDI.
4,000
3,500
3,000
2,500
2,000
1,500
1,000
500
0
Nairob
iCoa
st
Centra
l
Rift V
alley
Nyanza
Easte
rn
Wester
n
North E
aster
nNati
on
3,673
GDP
Perc
apita
(US$
PPP
)
Regions
1,460 1,4431,230
1,093 1,070903
644
1,436

68 Regional Disparities and Marginalisation in Kenya
Figure 3.18: Regional Disparities in Human Development Index
Source of data: UNDP (2010)
Figure 3.18 shows that Nairobi Province had a relatively high HDI of 0.653 in 2009. However, North Eastern Province had the lowest HDI of 0.417. The level of human development in the province was some 0.236 indices below that of Nairobi and 1.44 indices below the HDI value for the nation.
In Lieu of a ConclusionKenya still manifests considerable regional disparities in employment and human development. Trends in wage employment show that the proportion of wage employees in Nairobi remained constant at about 25.1 per cent of the national wage employment. The comparative figure for Rift Valley was 22.5 per cent, with Central at 14.2 per cent, Coast at 12.4 per cent, Nyanza at 9.9 per cent, Eastern at 8.3 per cent, Western at 6.6 per cent and North Eastern at 0.9 per cent. Consistent with the regional trends in wage employment, Nairobi has the highest number of informal sector employees, while North Eastern accounts for the lowest levels of informal sector employment. In contrast with the North Eastern, where unemployment is a generalised problem, unemployment in Nyanza, Western and Nairobi provinces is basically a youth problem. Generally, the youth unemployment rates are low in Nyanza and Nairobi, relatively high in Central and Eastern provinces, and considerably high in North Eastern Province.
N. Eastern Nyanza Western Coast Eastern R. Valleyt Central Nairobi Nation
HDI 0.417 0.497 0.52 0.527 0.568 0.574 0.624 0.653 0.561
0.7
0.6
0.5
0.4
0.3
0.2
0.1
0
HDI
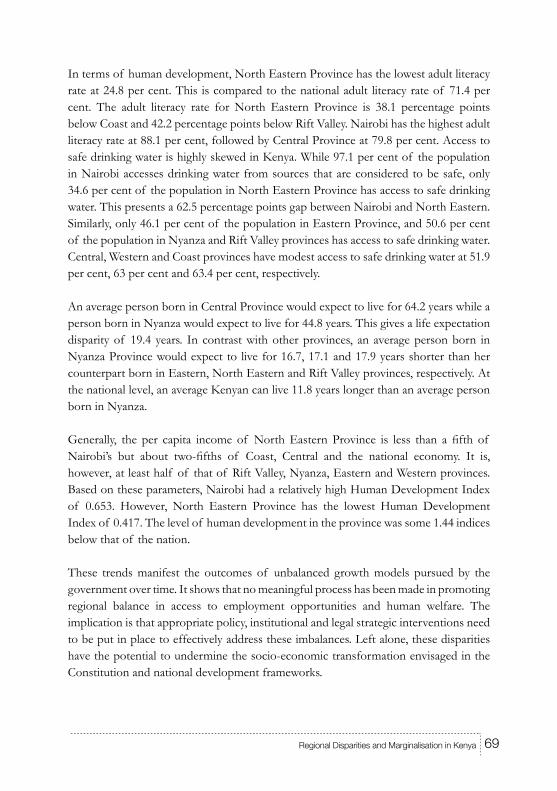
69Regional Disparities and Marginalisation in Kenya
In terms of human development, North Eastern Province has the lowest adult literacy rate at 24.8 per cent. This is compared to the national adult literacy rate of 71.4 per cent. The adult literacy rate for North Eastern Province is 38.1 percentage points below Coast and 42.2 percentage points below Rift Valley. Nairobi has the highest adult literacy rate at 88.1 per cent, followed by Central Province at 79.8 per cent. Access to safe drinking water is highly skewed in Kenya. While 97.1 per cent of the population in Nairobi accesses drinking water from sources that are considered to be safe, only 34.6 per cent of the population in North Eastern Province has access to safe drinking water. This presents a 62.5 percentage points gap between Nairobi and North Eastern. Similarly, only 46.1 per cent of the population in Eastern Province, and 50.6 per cent of the population in Nyanza and Rift Valley provinces has access to safe drinking water. Central, Western and Coast provinces have modest access to safe drinking water at 51.9 per cent, 63 per cent and 63.4 per cent, respectively.
An average person born in Central Province would expect to live for 64.2 years while a person born in Nyanza would expect to live for 44.8 years. This gives a life expectation disparity of 19.4 years. In contrast with other provinces, an average person born in Nyanza Province would expect to live for 16.7, 17.1 and 17.9 years shorter than her counterpart born in Eastern, North Eastern and Rift Valley provinces, respectively. At the national level, an average Kenyan can live 11.8 years longer than an average person born in Nyanza.
Generally, the per capita income of North Eastern Province is less than a fifth of Nairobi’s but about two-fifths of Coast, Central and the national economy. It is, however, at least half of that of Rift Valley, Nyanza, Eastern and Western provinces. Based on these parameters, Nairobi had a relatively high Human Development Index of 0.653. However, North Eastern Province has the lowest Human Development Index of 0.417. The level of human development in the province was some 1.44 indices below that of the nation.
These trends manifest the outcomes of unbalanced growth models pursued by the government over time. It shows that no meaningful process has been made in promoting regional balance in access to employment opportunities and human welfare. The implication is that appropriate policy, institutional and legal strategic interventions need to be put in place to effectively address these imbalances. Left alone, these disparities have the potential to undermine the socio-economic transformation envisaged in the Constitution and national development frameworks.

70 Regional Disparities and Marginalisation in Kenya
Regional Disparities in Social DevelopmentLineth Nyaboke Oyugi
BackgroundRegional disparities led to the struggle for independence in Kenya and, indeed, in most African countries during and after the colonial era. At independence, the Kenyan government inherited a nation characterised by disparities in incomes and well-being, which through the use of fiscal policy the independent government embarked on addressing. “Under colonialism, the people of Kenya had no voice in government; the nation’s natural resources were organised and developed mainly for the benefit of non-Africans; and the nation’s human resources remained largely uneducated, untrained, inexperienced and unbenefited by the growth of the economy” (Republic of Kenya, 1965:1). Basically, the inequalities ‘from the past’ were brought about due to the master-servant relationship that existed between the government and the people prior to independence.
After independence up to date, the inequalities are largely between Kenyans themselves. Inequalities are manifested in different forms, notably: income, land, education, health and infrastructure, and may be defined in terms of outcomes and opportunities. Outcomes, which include levels of wealth, education and employment, are easily observable. However, a sustained component of inequality in peoples’ circumstances do reflect differences in opportunities, with people favoured or disfavoured according to where they live, parental circumstances and gender (Society for International Development, 2004).
Since attaining political independence in 1963, the Kenya Government has been grappling with the persistent problem of unbalanced regional development. The government has attempted, through various policies and interventions, to reverse the discriminative effects of the colonial policies that had created wide disparities and imbalances between regions. However, after decades of experimenting with different economic and social policies, regional disparities and imbalances in economic, social and political developments still persist. A 2007 report on well-being in Kenya, for example, confirmed the persistence of these disparities. This is summarised in Table 4.1.

71Regional Disparities and Marginalisation in Kenya
Table 4.1: Indicators of Regional Inequalities by Province (2005/06)
Region Mean Household size (Number)
Age dependency (%)
School Net attendance ratio (%)
Population without toilet facility (%)
Secondary Gross Enrolment rate (%)
Immun-isation rate (%)
Nairobi 3.8 54.4 89 1.3 11.8 67.4
Central 4.4 71.3 88.2 0.4 37.7 82.7
Coast 5.5 84.5 70.5 30.7 14.4 75.5
Eastern 5.5 85.6 84.7 13.3 23.3 67.3
N. Eastern 6.0 132.3 49.5 42.1 4.5 20.6
Nyanza 5.0 88.0 82.1 23.7 23.5 55.8
R. Valley 5.3 86.9 74.9 21.6 18.3 67.1
Western 5.7 99.4 80.7 3.4 25.1 75.8
Source: Republic of Kenya (2007a), Basic Report on Well-being in Kenya: Kenya Integrated Household Budget Survey 2005/06, Nairobi: Government Printer.
Table 4.1 reveals that Eastern Province has the highest dependency ratio at 132.3 per cent, with the rural ratio (91.2 per cent) exceeding the urban (60.2 per cent). Over the same period, Nairobi had the lowest dependency ratio at 54.4 per cent. The school net enrolment rate was 49.5 per cent in North Eastern Province compared to over 70 per cent in all other provinces. North Eastern also recorded the least immunisation rate (20.6 per cent) and secondary gross enrolment rate (37.7 per cent). Regions also differ in terms of other indicators of development such as poverty, infrastructural development and employment levels.
The various strategies devised and those implemented to address regional disparities have been articulated in the various national development plans and subsequent sessional papers. These include: the Kenyanisation programme in 1960s, which resettled Africans on land previously reserved for European settlers (Republic of Kenya, 1964); introduction of the basic needs programme where the government provided for education, health and housing in the 1960s (Republic of Kenya, 1965); promotion of rapid growth and creation of employment opportunities in the 1960 and 1970s; Special Rural Development Programme (SRDP) and district planning in the early 1970s, through which the government directed an increasing share of resources towards rural areas to establish production centres; District Focus for Rural Development (DFRD) in the 1980s that provided for the involvement of stakeholders in project identification, resource mobilisation and project implementation (Republic of Kenya,,

72 Regional Disparities and Marginalisation in Kenya
1995) and promotion of the informal sector as a high potential source for the creation of employment opportunities (Republic of Kenya,, 1992). These programmes were administered through line ministries to the districts and to communities.
Programme targeting and implementation through line ministries was found to be ineffective due to imperfect coverage and leakages (Republic of Kenya, 2005). In addressing this problem, the government initiated projects and programmes to directly allocate additional resources to districts and communities in addition to other programmes that continued to be implemented through the line ministries. These programmes fall under the category of decentralised funds, which include the following: the Local Authority Transfer Fund (LATF) started in the late 1990s, which moves 5 per cent of income tax revenues to all local authorities to improve service delivery, financial management and debt reduction; the Free Primary Education, which was started in 2003 to enable all children of school going age to access basic education and enable the country to achieve the Millennium Development Goals (MDGs) on education by the year 2015; the Secondary Education Bursary Scheme for poor bright children started in 1993/94 financial year to cushion the country’s poor and vulnerable groups against the high and increasing cost of secondary education, thereby reducing the existing inequalities between the poor and the rich; and the Constituencies Development Fund (CDF), which was started in 2003 to take government resources to local communities to finance local socio-economic investments for poverty reduction and development.
Other recent initiatives, but which focus on addressing gender and generational imbalances, include the Women Enterprise Development Fund started in 2007, and the Youth Enterprise Development Fund started in 2003, which provide concessional loans to women and the youth, respectively. The main objective of the Youth Enterprise Development Fund is to reduce youth unemployment in the country, whereas the Women’s Enterprise Development Fund is a strategic move towards addressing poverty reduction through socio-economic empowerment of women. The fund’s core purpose is to improve women’s access to finance, especially for the micro and small enterprises.
Poverty Analysis
OverviewPoverty in Kenya is pervasive. Efforts to address poverty can be traced back to Kenya’s independence in 1963. Sessional Paper No. 10 of 1965 on African Socialism and Its Application to Planning identified poverty, disease and ignorance as major constraints to human development that needed to be addressed by the post-independence

73Regional Disparities and Marginalisation in Kenya
government. Poverty is a widely defined concept, and many of the definitions are dependent on the multidimensional aspects taken into consideration. According to the World Bank (2000a), poverty is lack of power to command resources -- it is the opposite of well-being. Poverty is a multidimensional phenomenon, a characteristic that makes the poor face multiple deprivations due to the interactions of economic, political and social processes. Beyond the lack of income, the multidimensional concept of poverty refers to disadvantages that those afflicted by it are subjected to in accessing productive resources such as land, credit and services (e.g. health and education), vulnerability (to violence, external economic shocks, natural disasters), powerlessness as well as social exclusion (Gerster & Zimmermann, 2003). The poor lack adequate food, shelter, education and health, deprivations that keep them from leading the kind of life valued by everyone. They are also often exposed to ill treatment at institutions where they seek services and are powerless to influence key decisions.
Despite years of efforts to fight poverty, misconceptions remain about the poor, why they are poor and what is needed to help them to lift themselves out of poverty. The multidimensionality of poverty implies that no uniform standard is available for measuring it. Some groups in the population often face a combination of the predicaments associated with poverty — low income, illiteracy, premature death, early marriage, large families, malnutrition, and illness and injury — dimensions that reinforce each other to lock those afflicted in low standards of living. This notwithstanding, poverty has been measured in several ways: the ones used widely are household income and expenditure.
Multi-indicator measures and surveys are becoming frequent, and the use of participatory and community based monitoring mechanisms are increasing. Numbers and percentages of absolute and relative poverty are typically measured against a national poverty (income) line, but with better data and information on nutrition, health, education understanding of household and individual poverty is gradually becoming clearer in Kenya and the government has initiated sector-specific policies to address the predicaments of the poor (Ayako et al, 1998; Oyugi et al, 2000; Mwabu et al, 1998, 2000; & Republic of Kenya 1998, 2000). Poverty is attributed to a number of factors, including unemployment, lack of assets, inaccessible markets, corruption, poor health, illiteracy, insecurity and economic shocks.
State of Poverty in KenyaKenya has a fairly developed statistical base on poverty and trends in the distribution of household incomes. The Urban Household Budget Survey 1968-69 formed the basis of analysis of urban household income distribution by the ILO Mission to Kenya

74 Regional Disparities and Marginalisation in Kenya
(1972). The Central Bureau of Statistics also conducted a household budget survey in Nairobi in 1974, whose results were analysed extensively and used as a proxy for urban income distribution in Kenya (see, for example, Vandemoortele, 1982, 1987; and Vandemoortele and der Hoeven, 1982).
The earliest estimates of poverty (see World Development Report, 1989) were for 1976, arising from a series of surveys undertaken within the framework of the Integrated Rural Surveys (IRS) (1974/75), 2 (1976), 3 (1977) and 4 (1978). Data on urban household incomes was collected in 1974/7542 (Nairobi Household Budget Survey, unpublished). The source of data on rural household incomes and consumption patterns was IRS-1, as the later IRS cycles did not collect data on income and consumption. The database spurred academic debate on the status of rural and urban household incomes and the distribution of land in Kenya. The principal analysts of the 1974/75 IRS database (namely Greer and Thorbecke) pioneered a mode of analysis that had far-reaching theoretical advancements (Foster, Greer and Thorbecke, 1984), in addition to its application to poverty assessment of Kenya’s smallholder sector (Greer and Thorbecke, 1983, 1986a, 1986b, 1986c).
In the 1980s, CBS undertook five major surveys on land assets, rural and urban household incomes and consumption patterns, and nutritional indicators. The surveys were the Rural Household Budget Survey 1981/82, covering 27 strata/32 districts; the Urban Household Budget Survey 1982/83; the Agricultural Production Survey 1986/87, which covered 24 districts mostly in high and medium potential areas; and two child nutrition surveys – urban (1983) and rural (1987).
The first national Welfare Monitoring Survey (WMS) was conducted during November/December 1992, and summary results were published in the Economic Survey, 1993. The other major output was the Kenya Poverty Profiles, 1982-92, which used the 1982 Rural Household Budget Survey data alongside the WMS-I data (Mukui, 1994a). Finally, WMS II and III were conducted in 1994 and 1997, respectively, and together provided the basis of the poverty analysis for policy making in Kenya since the mid 1990s.
To complement the statistical studies of poverty in Kenya, the government undertook the first Participatory Poverty Assessment (PPA) in the first half of 1994. The purpose of PPA-I was to understand poverty as seen by the poor, as a guide in the design of interventions to alleviate it. The PPA covered communities in seven poor rural districts (Busia, Bomet, Kisumu, Kitui, Kwale, Mandera and Nyamira) and Nairobi
42 Nairobi Household Budget Survey (unpublished). See e.g. John Thongori Mukui. Poverty Analysis in Kenya: Ten Years On. Paper written for Central Bureau of Statistics, Society for International Development and SIDA, 2005.

75Regional Disparities and Marginalisation in Kenya
(in the adjacent slums of Mathare Valley and Korogocho). The main factors seen as increasing poverty were inflation, social breakdown (e.g. emergence of female-headed households), cost-sharing strategy especially in education and health, and demographic pressure (land fragmentation, breakdown of homes, unemployment, and large family sizes). The report shows the social dynamics that create and sustain mass poverty. For example, the feminisation of poverty was attributed to lack of property rights (e.g. loss of property in case of divorce), discrimination at the household level in access to education, and the devastating effects of HIV/Aids. The recommendations were mainly in the areas of access to social services by the poor (mainly education and health), fees payable by the poor for most services (including low-cost water supplies), credit for the poor, and slum upgrading (structures, water and sanitation, road networks, and solid waste management).
The second PPA was carried out during November-December 1996 and covered seven districts (Mombasa, Nakuru, Kisumu, Kajiado, Taita Taveta, Makueni and Nyeri). One of the important findings of PPA-II was the sharp contrast between communities and district-level leaders and decision makers regarding the causes of poverty, poverty alleviation mechanisms, and escape routes: “While communities point to a wide range of physical, economic, institutional factors, district-level decision-makers emphasise community characteristics as the major causes of poverty. District-level leaders think the services provided are leading to poverty reduction while communities think otherwise. Communities see credit and institutional support as paths to poverty reduction while the decision-makers see the removal of socio-cultural obstacles as critical to poverty reduction.”
The third PPA was conducted by the African Medical and Research Foundation (AMREF), Participatory Methodologies Forum in Kenya (PAMFORK) and the Ministry of Finance and Planning in January-February 2001. The study covered 10 randomly selected districts, namely, Baringo, Busia, Homa Bay, Garissa, Kajiado, Kirinyaga, Kitui, Mombasa, Nairobi and Nyamira. PPA-III was conducted as a direct input into the Poverty Reduction Strategy Paper, so that the poor could propose and prioritise suggestions for poverty reduction and thus offer policy recommendations that would have the greatest impact in reducing poverty. The preparation of the district PRSPs involved district-level participation in all districts, and in-depth community participation in the 10 districts. The findings at community level and at district consultative forums were triangulated in the preparation of the district PRSP report. The Poverty Reduction Strategy Paper (PRSP) provided government personnel with a forum, or legitimacy, to talk to the communities on a national scale. The PPAs complemented the welfare

76 Regional Disparities and Marginalisation in Kenya
monitoring surveys, which collected information on money-metric measures of poverty and social indicators.
Analysis of data from the various surveys highlighted is presented in Table 4.1, 4.2 and 4.3. There is clear information from the statistics presented for planners and implementers alike -- that the poverty levels have increased in Kenya over time, poverty varies across different regions and though overwhelmingly a rural problem, it is drastically increasing in urban areas. Table 4.1 gives a summary of the various studies on poverty and estimates of the levels of poverty.
Table 4.1: Summary of Previous Poverty Estimates for Kenya
Author Reference Data Source Poverty incidence
FAO,(1977) N.a Food balance sheet, 1972-74
30% of population
Crawford & Thorbecke, (1978)
1974/75, 1976 IRS (1974/75) 1976 Employment Earnings in the Modern Sector, IRS II
38.5% of households44% of population
Collier and Lal, (1980)
1974/75 IRS I Smallholder 34.2% of smallholder population29% of all population
Vandermoortele 1976 IRS I 1974/75; Nairobi Household Budget Survey (1974); Social Accounting Matrix
33.1% of smallholder15.3% of urban households
Creer & Thorbecke, (1980)
1974/75 IRS (1977) 25% of households
Creer & Thorbecke, (1980),
1974/75 IRS (1977) 38.6% of smallholder
Jamal 1981 1976 N.a 32% of population
Bigsten, 1987 1976 National accounts 40%
World Bank, 1991 1981/82 1981/82 Penal survey and complementary statistics
22% of rural population
World Bank 1995& Mukui, 1993
1981/82 1992 1981/82 Penal survey and 1992 WMS I
Rural 48% for 1981/82 and 46% for 1992; urban 29.3% for 1992
Narayan and Nyamwaya, 1996
1994 Participatory Poverty Assessment
Widespread poverty in rural areas, results similar to 1992 WMS above

77Regional Disparities and Marginalisation in Kenya
Author Reference Data Source Poverty incidence
Republic of Kenya, 1998
1994 1994 WMS I 46.8% rural population29% urban population40% national estimâtes
Mwabu et al, 2000 1994 1994 WMS II 39.7% rural population28.9% of urban population38.8% national population
Government of Kenya, 2000
1997 1997 WMS III 52.9% rural population49.2% urban population52.3% national population
Government of Kenya, 2003
56% national population
Government of Kenya 2005/06
2005/06 Kenya Integrated Household Budget Survey
NA Not Available
Source: First and Second Report on Poverty in Kenya 2000, Manda et al, 2001, GOK, 2003
In the mid 1970s, national absolute poverty was around 42 per cent, while food poverty was 39 per cent, with a high regional variation (Greer and Thorbecke, 1986a, 1986b; Republic of Kenya 1998; Mwabu and Mullei, 1998; and Mwabu et al, 1999). Absolute poverty rates for 1982, 1992, and 1994 has been estimated at 47 per cent, while food poverty rates were estimated at 67 per cent in 1982, 72 per cent in 1992, and 47 per cent in 1994 (Republic of Kenya, 1998). According to Mwabu and Mullei (1998), this does not imply that absolute poverty remained constant over the years; neither did food poverty drop, given that the underlying poverty lines are not comparable and changes in prices between 1982 and 1994 were not accounted for in estimating the rates.
As a result of changes in samples during the different periods of the survey, it has been hard to ascertain whether poverty is increasing or decreasing in different areas. For instance, data presented in Mwabu et al (1998) indicate that: Food poverty has been persistent in Coast and Western provinces since the mid 1970s. Analysis of 1974/75 Integrated Rural Household Survey (IRHS) showed that Coast and Western provinces had the highest food poverty rates of 42 per cent and 45 per cent, respectively. In 1994, the same provinces had the second highest regional poverty rate of 51 per cent and 52 per cent, respectively, with Eastern Province having the highest poverty rate of around 60 per cent, even though it had the lowest rate in 1975. It appears that the difference in food poverty in Eastern Province in 1975 and 1994 rose mainly from including and excluding certain districts in survey samples in the two years, rather than from changes in prices or in the composition of the consumer basket.

78 Regional Disparities and Marginalisation in Kenya
Analysis of survey data from the first and second welfare monitoring surveys by the Republic of Kenya (1997) revealed that 47 per cent of the rural population was food poor in 1994 compared to 72 per cent in 199243. Absolute poverty was estimated at 47 per cent for 1999 and 1994. In urban areas, food and absolute poverty was estimated at 29 per cent. Absolute and food poverty rates were highest in North Eastern and Eastern provinces, estimated at 56 to 58 per cent of the population. Central Province had the lowest absolute and food poverty rates of around 32 per cent whereas Kisumu was the poorest of the urban areas with absolute and food poverty rates of 46 per cent and 44 per cent, respectively and Nairobi had the lowest rates of 27 per cent and 26 per cent for food and absolute poverty, respectively.
The districts with the highest levels of food poverty in 1994 were Marsabit (86%), Turkana (81%), Isiolo (81%), Samburu (79%) Tana River (71%), Makueni (70%), Machakos (66%) Kilifi (65%), and Kitui (64%). These are districts largely in arid and semi-arid areas.
Data from the Kenya Integrated Household Budget Survey (KIHBS) 2005/06 reveals further that the proportion of the population living in absolute poverty declined to 46 per cent in 2005/06 from 55.5 per cent in 2000. The number of those living below the poverty line was estimated to have increased from 13.4 million in 1997 to 16.6 million in 2006 (Republic of Kenya, 2007a). Besides poverty, income inequality also remains high in Kenya. The Kenya Institute for Public Policy Research and Analysis (KIPPRA) report of 2009 revealed that the poorest 10 per cent of rural households in Kenya control only 1.63 per cent of the total expenditure, while the richest 10 per cent control 35.9 per cent of the total household expenditure. The report further noted that cumulatively, the top (richest) 30 per cent rural households control 63.8 per cent of household expenditure. This reinforces the findings of the Society for International Development report of 2004 that ranked Kenya among the 10 most unequal countries in the world and the most unequal in East Africa. According to SID (2004), Kenya’s top 10 per cent households control 42 per cent of total income, while the bottom 10 per cent control a paltry 0.76 per cent.
Poverty estimates have further been disaggregated to regional levels. Table 4.2 indicates that over time, Central Province has always registered lower levels of poverty whereas North Eastern, Nyanza and Coast have the highest levels. Even within a province, large
43 The variance in the results between the years have been questioned due to methodological concerns that may render comparisons untenable. For instance, the timing of surveys was not the same. The 1992 survey was conducted in the months of November and December 1992, while the 1994 survey was conducted from April to June. See e.g. Jane Kakubo-Mararia and Godfrey K. Ndeng’e. Measuring and Monitoring Poverty: The Case of Kenya. A Presentation at the PADI Workshop, Mombasa, Kenya held on May 7-8, 2004.

79Regional Disparities and Marginalisation in Kenya
variations exist across various districts, with the poorest districts being in semi-arid areas, largely inhabited by pastoralists.
Table 4.2: Regional Absolute Poverty Trends44
Region 1982 1984 1992 1994a 1994b 1997 2000 c 2003d 2006
Coast 54.6 43.5 43.5 55.6 41.4 62.1 69.9 68.6
Eastern 47.73 54.2 42.2 57.8 45.0 58.6 65.9 64.7
Central 25.69 35.9 35.9 31.9 31.8 31.4 35.3 34.7
R. Valley 51.05 51.2 51.5 42.9 38.3 50.1 56.4 55.3
Nyanza 57.88 54.7 47.4 42.2 38.3 63.1 71.0 69.7
Western 53.79 54.8 54.2 53.8 40.6 58.8 66.1 64.9
N. Eastern - - - 58.0 51.3 - 73.1 71.7
Rural 46.3 46.8 39.7 52.9 59.6 58.5
Urban 29.3 28.9 28.6 49.2 51.5 50.9
National 46.3 43.8 38.8 52.3 56.8 55.9Source: First Report on Poverty in Kenya 2000, Kimalu et. al. (2002) ; for 1994a and 1994b, see Ibid: 19. Notes to Table 3.0“-“ Not covered during the surveysc Poverty estimates from Kimalu et. al. (2002)d Poverty estimates using the KIPPRA Model for predicting household poverty. Applied an economic growth rate of 1.8%, and a GINI Coefficient of 0.612
Table 3: Indicators of Regional Inequalities by Province
Region Exp. GiniCoeffi.
Unempl-oyment.% 15-64)
Road Density (Length/ Sq. km)
Access to Water (<15 minutes) % of pop.
% of Sec. Gross Enrolment.
Doctor /Patient Ratio
Income Poverty2000 (%)
Life expectancy 1999 Years
Total HIV Prevalence rate (%)
Nairobi 0.565 23.9 3.2 95.9 11.8 - - 61.6 9.9Central 0.514 6.2 2.0 70.9 37.7 1:20,715 35.3 63.7 4.9Coast 0.450 23.4 0.3 63.9 14.4 1:51,155 69.9 52.2 5.8Eastern 0.545 6.8 0.2 38.7 23.3 1:33,446 65.9 62.8 4.0N. Eastern 0.406 34.7 0.1 22.1 4.5 1:120,823 73.1 51.8 0.0Nyanza 0.574 12.2 1.4 31.6 23.5 1:28,569 70.9 47.7 15.1R. Valley 0.561 12.1 0.4 50.5 18.3 1:36,481 56.4 59.5 5.3Western 0.558 27.5 1.4 44.6 25.1 1:39,554 66.1 53.5 4.9Kenya(Av 0.558 14.6 0.3 53.2 22.2 - 52.6 54.7 -
Source: SID Report, 200445
44 Absolute poverty is a state where one cannot raise the income required to meet the expenditure for purchasing a specified bundle of basic requirements.
45 Figures on expenditure inequality and employment calculated from the 1998/99 Integrated Labour Force Survey, figures on access to roads, water, doctor/patient ratio, HIV Prevalence, from Kenya Demographic and Health Survey (2003)

80 Regional Disparities and Marginalisation in Kenya
The geographical dimensions of poverty show that the level of poverty differs across regions. Overall, Central Province has the least level of poverty, estimated at 35.3 per cent while North Eastern Province has the highest at 73.1 per cent. Excluding Nairobi, still most of the regional indicators on inequality are in favour of Central Province in Kenya. These include: Low unemployment rate (6.2%); high road density (2.0%); high access to water (95.9%); and high doctor patient ratio (1:20,715). The data in Table 4.1 portrays North Eastern Province as the least developed region, with a high unemployment rate (34.7%), a low road density (0.1), poor access to water (22.1%), low secondary gross enrollment (4.5%), low doctor/ patient ratio (1:120,823), and low life expectancy (51.8 years).
In Kenya, poverty is widespread across all the districts (Table 4.3). However, the poor can be identified by region and social-economic characteristics. For instance, the majority of the poor are to be found among the subsistence farmers, the illiterate, landless, female-headed households, large households, widows,; polygamous households, pastoralists in drought prone areas, unskilled and semi-skilled casual labourers, informal sector workers, and households with limited access to markets and social amenities (Greer and Thorbecke, 1986a, 1986b; Republic of Kenya 1998; Mwabu and Mullei, 1998; and Mwabu et al, 1999). Further, 60 per cent of the poor are concentrated in 17 of the 47 districts in the country, indicating that the people most afflicted by it can be identified by region of residence and by certain social characteristics. This suggests that properly targeted anti-poverty measures can be effective in reducing overall poverty in the country (Mwabu et al, 1999).
Evolution of Poverty Reduction Policies Since independence, one of the principal goals of Kenya’s development efforts has been to reduce poverty. The government has pursued this through various development strategies emphasising economic growth, employment creation and provision of basic social services. Over the post independence era (1964-2002), Kenya has transited from a high economic growth path in 1960s (6.6% average annual growth over 1964-72) to a declining path (5.2% over 1974-79, 4.0% over 1980-1989, 2.4% over 1990-2002), and the economy is on a recovery path, having registered an impressive 4.9 per cent and 5.8 per cent growth for the year 2004 and 2005, respectively, (Republic of Kenya, 2006). The growth dynamics notwithstanding, poverty is rampant in Kenya and afflicts a large proportion of the population, the majority of who are to be found in the rural areas. It is estimated that of the 56 per cent of the population that live below the poverty line about 52.9 per cent of the population are in the rural areas and 49.2 per cent in the urban areas (ERSWEC, 2003). It is also estimated that about 34.8 per cent of the rural

81Regional Disparities and Marginalisation in Kenya
population and 7.6 per cent of the urban live in extreme poverty and, therefore, cannot meet dietary needs even with their total spending devoted to food.
Though the government realised the importance of addressing poverty right after independence, action started in earnest in the 1980s. Past government policy initiatives to address poverty articulated in various Sessional Papers and five-year development plans include the following: land resettlement schemes in the 1960s; provision of basic needs (education and health) in the 1960s; promotion of rapid growth and creation of employment opportunities in the 1960 and 1970s; District Focus for Rural Development in the 1980s; and promotion of the informal sector in the late 1980s as a sector with a high potential to alleviate poverty through the creation of employment opportunities. The close relationship between unemployment, poverty and inequality in income distribution has generally been acknowledged by the Kenya Government since the mid 1960s as evidenced by the various polices formulated to address the trio. According to Ikiara (1997), the government’s earlier strategies in poverty alleviation suggest that in the focus on ‘redistributive with growth’ policy, there was an implicit assumption that the ‘trickle down’ process could take place to spread the benefits of growth from some of the more dynamic modern sectors to the rest of the economy. Nonetheless, available data indicate that poverty, unemployment and inequality have worsened over time. Virtually all the major indicators of poverty articulated above show that policies formulated in Kenya to deal with poverty, over the past 40 years achieved little in arresting the impoverishment of the population.
In spite of the numerous interventions by the government, the poverty profiles presented above allude to the fear that poverty is still on the increase in Kenya. This raises concerns regarding the comprehensiveness of the policies adopted to tackle poverty and the implementation of the same. The section that follows provides a review of various poverty initiatives so far articulated by the government in its various policy documents.
Rapid Economic Growth PolicyRapid economic growth has been given prominence by the government as a means of alleviating poverty and creating employment opportunities. The rapid growth of the economy has been regarded as a key solution not only to poverty, but also unemployment, poor health, economic exploitation and inequality. It is for this reason that the government’s stated economic policy reflected in various Sessional Papers and the five-year Development Plans tends to place emphasis on the promotion of rapid growth of the economy, equality in the sharing of the economic growth benefits and

82 Regional Disparities and Marginalisation in Kenya
the reduction of extreme imbalances and inequalities in the economy as the main goals of economic development.
This policy stance has been maintained throughout the past four decades. The first two development plans focused emphasis on rapid growth to alleviate poverty and reduce unemployment. However, in the earlier years of independence, the two problems of poverty and unemployment persisted and income inequality widened despite the economy achieving high rates of economic growth. The persistence of these problems led to greater focus on equity and employment generation in the National Development Plan 1974-78. The Sessional Paper No.1 of 1986 put considerable attention to the problem of poverty and unemployment and recommended measures which included rapid economic growth, led by the private sector, with support from a more efficient public sector. This strategy was also supported by the Ndegwa Report and World Bank, (World Bank, 1993a).
The same policy has been maintained with slight deviations. For instance, the government states that it is only through sustainable economic growth that the national wealth can be created to support measures to alleviate poverty, protect vulnerable groups and raise standards of living of the people (Republic of Kenya, 1994). The 8th National Development Plan (1997-2001) shifted emphasis to private sector investment in industrial production with an aim of transforming Kenya from a largely agricultural nation to a newly industrialised country by the year 2020. The Economic Recovery Strategy for Wealth and Employment Creation (ERSWEC, 2003-2007) paper emphasises recovery of the economy through private sector-led growth. Though these plans have kept on changing the source of the growth, they all acknowledge the fact that growth is important to reducing poverty.
The government’s strategy of promoting growth as a means of poverty alleviation is based on an implicit assumption that the ‘trickle down’ process would take place to spread the benefits of growth from some of the more dynamic modern sectors to the rest of the economy and sections of the population. This was the basis of the “redistribution with growth” strategy, which became a popular slogan with the authorities. However, by the mid-1970s, it was realised that the strategy was not having the desired effect -- although the economy had been able to achieve a high growth rate of almost 7 per cent per annum in the 1960s. Despite the rapid growth of the economy in the first 10 years of independence, the problems associated with a rapidly growing population, unemployment and income disparities were more apparent than they were in 1963. The failure of economic growth to solve problems continued to be observed in the 1980s and 1990s. For instance, during 1986-1990, when the economy registered

83Regional Disparities and Marginalisation in Kenya
an annual growth rate of 5 per cent, unemployment remained high -- with only about 48,000 jobs created annually compared with more than 400,000 people joining the labour force every year (World Bank, 1993a).
Due to high levels of inequality, the little gains from economic growth are reaped by only a few individuals while the majority languish in poverty. A report by the Society for International Development (SID, 2004), estimates that 10 per cent of the richest households in Kenya control more than 42 per cent of incomes, while the poorest 10 per cent control just 0.76 per cent. That is, for every shilling earned by the poor, the rich earn 56 shillings. With this realisation, the country has refocused its polices on redistribution.
Economic growth is a necessary condition for meeting basic human wants, but it is not in itself sufficient. Fast growth often helps to reduce poverty, but some growth processes may do so more effectively than others. Also, growth that translates into rising consumption is essential for poverty reduction. Nevertheless, growth is necessary but not sufficient for alleviating poverty given Kenya’s low incomes, high inequality and exclusion. According to the report by the World Bank on attacking poverty (2000/01), the valuable asset of the poor is their labour. Thus, by shifting resources towards rural and labour intensive production activities, the government may be able to address poverty. There is high potential for pro-poor growth through well-designed pro-agricultural interventions (Timmer, 1992 and World Bank, 1993a). There is evidence that rural growth has helped to reduce both rural and urban poverty in India (Ravallion and Datt, 1994) and that agricultural growth can generate sizeable positive spill-over effects on productivity in other sectors (Timmer, 1992). However this calls for strong governance and accountability mechanisms to ensure that public resource transfers to lower levels of government are not misappropriated.
Basic Needs and Rural Development The basic needs approach to development focused on the provision of basic services such as food, water, shelter, and health care for the poor. Since the provision of such basic needs depends on public budgetary outlays, which in turn are based on national economic growth, the “basic needs” approach did not overcome the biases that pervaded all earlier efforts at poverty alleviation. Consequently, the basic needs approach to poverty alleviation attained the connotation of rural development, where the majority of the population and the poor live. This is clearly stated in the 1979/83 National Development Plan, which states that, given that 85 per cent of the population live in the rural areas and that it is in the rural areas that the majority of

84 Regional Disparities and Marginalisation in Kenya
the poor are located, Kenya would opt for a style of development that concentrates on rapid transformation of the rural masses, giving priority to satisfying the needs of the large number of poor people. Rural development as a strategy was designed to improve the economic and social life of the rural poor. However, the rural dimension of poverty alleviation was not combined with explicit reference to social, political, cultural, and environmental concerns, all of which were either mentioned in passing as by-products of mainstream development programmes or completely ignored (Bahemuka et al, 1998).
Land Resettlement Schemes Agriculture is regarded as the backbone of Kenya’s economy. Land, especially agriculturally productive land, is not only scarce; it is also valued for many non-economic reasons. Individuals who have no land have ambitions to have some in the long-run. Land has more than just an economic value since it is a social and almost spiritual entity. Land ownership may be through purchase or inheritance. This means that the landless, who in most cases are poor, are unlikely to own land through these two means. Yet productive land is a resource that guarantees participation in economic development.
Participatory poverty assessment surveys that have been carried out in Kenya indicate that more productive land is what often the poor people say they need most. Spontaneous land expansion has been used in the past as an important response to alleviation of poverty. The direct action of land expansion for the poor in Kenya has been through settlement schemes and land redistribution. In the 1960s and 1970s, the country was able to design and implement some poverty-oriented programmes, which included the settlement schemes in which thousands of landless people and squatters displaced by the colonial settlers were provided with small scale landholdings, especially in the Rift Valley Province. The “million-acre scheme”, made it possible for many poor Kenyans in the former African ‘reserves’ to engage in productive agricultural activities, enabling them to produce for their own needs and a surplus for the market. In total, over a million acres of mixed farm land previously owned by 2,000 Europeans was transferred to 47,000 African smallholders by means of land purchase and development loans (Republic of Kenya, 1999). The scheme was later extended to state and trust lands as well as forestland suitable for farming. This policy has been short-lived and abused, especially as a campaign tool. This has seen squatters settled in trust lands and forestland immediately after elections only to be displaced under the pretext of protecting government land.

85Regional Disparities and Marginalisation in Kenya
Moreover, land as a means of addressing the poverty problem either through re-settlement or re-distribution has limits as an anti-poverty policy. One, the poor have no resources to purchase and invest on good land. Therefore, it is only second rate land that reaches the poor. Two, expansion of farming land is limited as opposed to the population of the poor, which is ever increasing. Third, the poor have no formal training and as such cannot embrace new technology to reduce production cost and increase productivity.
District Focus for Rural Development The District Focus for Rural Development strategy was launched in 1983 with the main objective of allocating resources on a more geographically equitably basis. A more equitable geographical distribution of resources was expected to offer the possibility of social and economic equity and poverty alleviation. More funds were to be allocated to the less developed regions to be spent on projects given priority by the local communities. This was expected to elicit the participation of the local people in the projects funded and help to alleviate poverty. However, due to poor preparation, unfamiliarity of district staff with methods of participatory planning, as well as the absence of monitoring and evaluation combined with the weak commitment of sector staff to inter-sectoral initiatives, a number of decentralised projects were poorly conceived and designed (Republic of Kenya, 1999). Poor performance of the projects was also due to corruption, which led to procurement of unsuitable material, equipment and machinery.
In addition to the problems mentioned above, the strategy did little to alleviate poverty. First, the target beneficiaries, the poor and vulnerable groups, were largely excluded from direct involvement in the process of project design and implementation. As such, the poor saw the projects as imposed on them by the government and thereby did not support them. Thus, the priorities for district projects were explicitly set by politicians and district level staff, with weak local support, ownership or commitment to the projects.
Other Rural Development ProgrammesOther projects in Kenya that were poverty-oriented were land adjudication and consolidating programmes, the Special Rural Development Programmes (SRDP) formulated in the late 1960s, the Livestock Development Programmes, the Rural Development Fund, the Fisheries Development Project, the Youth Polytechnic and Rural Access Roads. Nonetheless, the full potential of these projects in terms of

86 Regional Disparities and Marginalisation in Kenya
reducing poverty and raising incomes of the people was, in most cases, not achieved due to the mismanagement of resources meant for these projects/programmes, poor project implementation, inadequate recurrent budget provisions and lack of commitment and prioritisation by the government. Furthermore, corruption and administrative mistakes reduced the overall effectiveness of the schemes. For instance, in recent years land meant for the poor landless and squatters has been grabbed by politically powerful people through corrupt means, making it difficult to reduce poverty through land redistribution.
The Shift to the Informal Sector From the mid-1980s, the growth of the informal sector started to receive greater attention. The sector was seen as one with high potential to alleviate poverty, through creation of employment opportunities in form of off-farm activities in both the rural and urban areas (Republic of Kenya, 1986 Kimalu, 2000). Unfortunately, the government never really created a truly enabling and supportive environment for the informal sector (Ikiara, 1998). By the early 1990s, this sector created an estimated 60-70 per cent, and is currently estimated to have created a total of 76.5 per cent, of the new job opportunities annually. Though this sector is not heavily taxed, it has been affected by debilitated infrastructure, lack of credit, poor technology, duplication, lack of appropriate premises and proper marketing strategies. This has greatly constrained its ability to reduce poverty and as such cannot be relied on as a vibrant sector for poverty alleviation. The sector is a fallback position for school dropouts, retrenched former employees, and middle level graduates who are unable to find white-collar jobs. In addition, these are smallholdings with a majority employing between one and five employees, whose pay has been characterised by low earnings.
Specially Targeted Projects The desire to reduce poverty has been used to justify various direct policy interventions. Targeting constitutes one of the direct policy interventions through which the government can reach the people in society. The poverty profiles for Kenya have identified the poor by socio-economic characteristics and area of residence up to constituency level using poverty mapping. A number of specially targeted projects have been used in an attempt to achieve poverty alleviation. These include, for instance, the Urban Slums Development Project of the Nairobi city, the Street Children’s Funds, the Education Bursary Programme to assist bright children from poor families, the Micro and Small Enterprises Programme among others. These policies have not been evaluated to document their effectiveness as measures of poverty alleviation.

87Regional Disparities and Marginalisation in Kenya
That notwithstanding, there is generally a feeling that specially targeted programmes are benefiting the rich more than the poor. This is because these are public programme and it is not possible to exclude the rich from benefiting. Thus, regional targeting still entails a leakage of benefits to the non-poor in poor regions and so a cost to the poor in rich regions. Even with marked regional disparities, these effects can wipe out a large share of the aggregate gains to the poor. The prospects of reaching the poor depends on the institutional environment, including local administration capabilities, the incentive facing the local administrators, their social relations with the poor and the extent of empowerment of the poor, through both governmental and non-governmental representation.
Consumption and Production CreditFollowing the implementation of structural adjustment programmes, the government withdrew from the provision of free extension services and subsidised agricultural inputs to farmers. Though the government still finances the Agricultural Finance Corporation, which has over the years been characterised by poor credit disbursement and recovery, credit from the corporation does not reach the poor. Following liberalisation, agricultural inputs and chemicals are no longer affordable for the poor. Micro financing is increasingly considered as a mode of finance that can help to meet the credit needs of the poor. Micro finance includes the semi formal micro finance, for instance, provided by non-governmental organisations like the National Council of Churches of Kenya, K-REP, Kenya Women Finance Trust and Faulu Kenya, and the informal micro finances such as Rotating Savings and Credit Associations (ROSCAS) and savings and credit cooperative societies. These constitute some of the sources where a majority of the poor can get their finance. Credit, however, is not a panacea to poverty. For instance, micro finance does not address the credit needs of the very poor. Also, most of the credit programmes are concentrated in the urban areas and tend to focus on business as compared to agriculture where most of the poor are concentrated.
In order to reach the poor, K-REP recently started a bank that will address the financial needs of the poor. The bank intends to reach the poor through group-based lending schemes such as those used by Grameen Bank in Bangladesh, where until recently the scheme had achieved excellent repayment rates. Village banks and financial associations have been created, which build on the resources of the poor. Under these schemes the poor buy shares to start a village bank. Several districts (Taita Taveta, Kilifi, Suba, Migori, Teso, Makueni, Kitui, Isiolo, Kwale, Marsabit, Turkana, Buret, and Bomet) are now benefiting from this initiative. Thus, an initiative such as the K-REP bank for the

88 Regional Disparities and Marginalisation in Kenya
poor could go a long way in meeting the credit needs of the poor. However, there are some shortcomings to this initiative in that the very poor who cannot afford to buy shares may not benefit.
The EU Community Development Trust Fund (CDTF)The Community Development Trust Fund (CDTF) falls within the family of social funds that normally finance small, participatory investment projects targeted to benefit the poor and the vulnerable in a society, depend on local groups to generate demand, and screen the resulting projects against a set of eligibility criteria (European Commission, 2003b). The first phase of the project put special emphasis on poverty reduction and capacity building, with attention to geographical dimensions of poverty through specific budgetary allocation to areas considered as resource-poor (e.g. ASALs). The project separated the target districts into “poorer” and “less poor” based on poverty statistics from the third welfare monitoring survey. It further required that beneficiary communities in the “poorer” districts contribute a minimum of 25 per cent of project costs and those in the “less poor” districts a minimum of 10 per cent.
Constituencies Development FundsSince independence, the Government of Kenya implemented decentralised anti-poverty programmes designed to distribute assets, cash or services to households, individuals and communities through line ministries. sectoral ministries then decide how to allocate the funds to the various districts and communities. After 40 years of project/programme targeting and implementation through line ministries, it became apparent that channelling funds through ministries was not that effective and that there were many leakages to the extent that many poor communities were marginalised and never reached by the so-called anti-poverty programmes. It is against this background that the Government decided to create alternative windows that allow allocation of additional resources directly to districts and communities without going through line ministries. In the past five years, for instance, there has been a massive increase in resources devoted to constituency and community based development programmes. These include development funds such as the Communities Development Fund, the Roads Fund, the HIV/Aids Fund and the Constituency Education Bursary Fund.
This direct disbursement of funds is intended to improve poverty targeting and project implementation by using local information and encouraging community participation, especially in project identification, implementation and evaluation. The main objective is to achieve better targeting as well as outcomes by involving local communities in the

89Regional Disparities and Marginalisation in Kenya
decision-making process and management of projects. The funds are in their initial stages of implementation. Going by the number of funds the government has put in place to foster development at the district and constituency level, it appears that government is determined to ensure decentralisation goals that started way back in the 1980s are realised.
Today, the average Kenyan at the local level is expected to plan and manage no less than five funds, namely, the Local Authority Transfer Fund (LATF), Constituency Roads Maintenance Levy Fund (RMLF), the Constituency Development Fund (CDF), the Constituency Bursary Fund (BSF), and the Constituency Aids Fund. Community participation through the normal government planning structures is limited and disjointed. However, there have been attempts to include community consultation in preparation of the national agenda, mainly through the PPAs, PRSP, and LASDAP. The PPAs have contributed to subsequent use of participatory approaches in drawing up the national agenda. LASDAP on the other hand is a programme that demands that all the projects funded under LATF must have been prioritised through people’s engagement at the grassroots within the respective local authorities. PRSP on the other hand was conceptualised as a paper to be developed through people’s engagement in the poverty alleviation discussion forums across the country.46
Health Care Good health is seen as reducing poor families’ economic and social vulnerability, thereby providing a healthy and productive labour force for the nation to create broad-based economic growth. The provision of primary health care to all citizens has been one of the goals of the Government of Kenya, which defines health as the mental, physical and social well being of a person and not the mere absence of disease. There is a two-way relationship between health and poverty -- poverty means an increase in health care costs due to disease prevalence caused by lack of education on preventable diseases as well as nutritional habits; on the other hand, sick people will not be economically productive, hence intensifying poverty.
The hardcore poor, who constitute 35 per cent of the rural and 7.5 per cent of the urban populations of Kenya, (GoK, 2000) are vulnerable to disease since they cannot even afford the required daily calorie intake, let alone medical care.
In the effort to improve access to health care systems, there is supposed to be at least one Government hospital in every district, but with the creation of new districts, this is
46 See e.g. siteresources.worldbank.org/INTPCENG/1143251.../PRSPretro.pd

90 Regional Disparities and Marginalisation in Kenya
not always the case. In addition, there is one provincial hospital in all the provinces and two national referral hospitals in the country. Some of the facilities are, however, in a deplorable state and need a major refurbishment. The initial intention of cost sharing in hospitals has been hampered by people’s reluctance to pay fees for prescriptions when there is a lack of drugs.
The initial gains that government achieved after independence in the area of healthcare are now threatened by the onset of HIV/Aids, which is taking away the lives of the economically active age group. The costs of prevention care and support for the infected and affected and mitigation of its socio-economic impacts have placed a heavy burden on an already depressed economy both at household and national level. With the declaration of Aids as a national disaster in late 1999, a lot of resources are being mobilised to fight the epidemic though the gains cannot be ascertained so far. To address the HIV/Aids pandemic, the government established the National Aids Control Council (NACC), which is the overall coordinating body for all the stakeholders. The NACC has attracted many donors, including United Nations Programme on Aids, Department for International Development, GIZ and Japan International Development Agency, who are involved in areas of reproductive health, research, prevention and many others. NACC has facilitated campaigns on HIV/Aids and the formation of associations for those infected and affected by the pandemic. The introduction of cost sharing in 1989 (and its subsequent abandonment and re-introduction) represented a major shift in policy from the initial period of independence, during which time the government operated a system of “free” medical services, alongside a subsidised system. In order to address the plight of the poor, they have continued to receive exemptions in government facilities on a number of diseases. Up to 30 per cent of cost sharing charges, which constitute 7 per cent of the Ministry of Health’s recurrent revenue is reallocated back to the institution as an incentive. In addition, the government has always provided free immunisation to all Kenyans through Kenya Enhanced Programme of Immunisation (KEPI)
EducationEducation plays an important role in human development by empowering people to improve their well being through increasing their productivity and potential to achieve higher standards of living. It is also considered a basic right and basic need. Various studies show that there is a strong correlation between poverty levels and the education of the household head. Volume One of the Second Report on Poverty in Kenya shows that household heads with no education at all reported the highest incidences of poverty in both the rural and urban areas. Poverty generally decreases as the head’s level of

91Regional Disparities and Marginalisation in Kenya
education increases. Despite the identified high potential of education, a brief review of literacy, educational achievement and enrolment figures shows that inequalities are manifold – not just between poor and non-poor, but also between boys and girls; men and women; and urban and rural areas. To address this problem, the Ministry of Education, Science and Technology has articulated its policies in a Master Plan for Education 1997-2010 – which outlines the policy focus on education as being the provision of “Quality Education for National Development”. An inquiry into the educational system in Kenya by the Koech Report47 on the Commission of Inquiry into the Education System of Kenya was released in May 2000, however this has never been fully accepted and there have only been sporadic attempts to implement parts of it – necessitating the institution of a national education forum to update education policy.
Many of the interventions have been designed to respond to the identified priorities of the poor – for example, the cost of education has been identified in both the qualitative and quantitative work as one of the most constraining factors in terms of ensuring that poor people send their children to school (while primary education is nominally free, but it is estimated that at least 45% of the costs of education are borne by the parents). To achieve these goals, a number of specific interventions have been highlighted and undertaken. These include: grants from the Ministry of Education, Science and Technology to poorer districts and divisions; provision of bursaries to poorer children; revision of the pupil-teacher ratio upwards to allow for more efficient utilisation of teachers; and related to this a more equitable distribution of teachers; target out-of-school children, child workers, Aids orphans with non-formal education; rationalisation of the curriculum and reduction in the number of schoolbooks to be purchased; and intensification of school feeding programmes in poverty stricken areas.
Under the project preparation phase for the World Bank sponsored Strengthening of Primary and Secondary Education Programmes (STEPS) progress has already been made on reducing the number of examinable subjects on the primary syllabus down to five. Efforts have also been made in ensuring that there is better teacher management and a more equitable distribution of tutors in the country, and more autonomy has been given to the schools and districts in the recruitment of teachers. Further, there has been acceptance of the need to increase the pupil teacher ratio to 1:34. All of these initiatives will have the effect of reducing the cost to the parent, in terms of facilities, books, equipment and hiring of ancillary teachers.
47 Republic of Kenya. Report of the Commission of Inquiry into the Education System of Kenya. Nairobi: Government Printer, 2000.

92 Regional Disparities and Marginalisation in Kenya
Under the WFP lead Emergency Operations (EMOP) programme in the drought affected ASAL areas, there has been an expansion of the school feeding programme. Furthermore, to ensure that bursaries are well targeted and that they benefit the poorest in society, the government has established the constituency bursaries scheme.
The benefits of educating girls and improved literacy levels for women are clear in terms of lower levels of fertility, lower infant and maternal mortality, and longer life expectancy. A number of initiatives in this area have been supported by United Nations Children’s Fund, under the general heading of Education for All and the Africa Girls Education Initiative, which focus on issues such as improving security for girls, especially in boarding schools, training communities and teachers on gender in education and improving the physical infrastructure, making it more amenable to girls’ education This has impacted on the cultural practices, which have impacted negatively on transition and completion rates among the girl child in some communities in Kenya.
In the year 2003, the government reintroduced the free primary education as an initiative to address the plight of poor families and in its effort to achieve universal primary education. In addition, the bursaries scheme has been enhanced and decentralised further to the constituency level. This has greatly improved the gross enrollment rate to 104 per cent and the net enrollment rate to 84 per cent as of 2004.
The Education Report48 indicated that the proportion of the population living below the absolute poverty line was lowest in Central Province, followed by Rift Valley, Nyanza, Eastern, Western, Coast and North Eastern provinces. The report also indicated that poverty incidence has been increasing over time in Coast and North Eastern provinces. Wide disparities also exist between the urban and rural areas, with 85 per cent of all poor people living in rural areas while the majority of the urban poor live in slums and peri-urban settlements. The percentage of hardcore poverty in the rural areas declined from 34.8 per cent in 1997 to 21.9 per cent 2005/6, while the percentage of urban hardcore poverty increased from 7.6 per cent in 1997 to 8.3 per cent in 2005/6. At the same time, a person born in Nyanza province can expect to live 16 years less than a person born in Central Province. While 93 per cent of adult women in North Eastern Province have no education at all, only 3 per cent of adult women in Central Province have never been to school. These disparities, while narrowing, continue today; only 19 per cent of eligible girls in North Eastern
48 Ibid.

93Regional Disparities and Marginalisation in Kenya
Province were enrolled in primary school in 2005/06, while 87 per cent in Central Province were. Differences between urban and rural conditions are similarly striking, with urban households much more likely to have access to health care, schools, and piped water than those in rural areas.

94 Regional Disparities and Marginalisation in Kenya
Bibliography
Atieno-Odhiambo, “Introduction: The Invention of Kenya” in Ogot, B.A. and William Ochieng’ (eds.) 1995. Decolonization and Independence in Kenya 1940-1993. Nairobi: East African Education Publishers.
Barkan, J., (ed.) 1995. Beyond Capitalism vs. Socialism in Kenya and Tanzania. Nairobi: EAEP
Cooksey, B., David Court, and Ben Makau, “Education for Self-Reliance and Harambee” in Barkan J., (ed.) 1995. Beyond Capitalism vs. Socialism in Kenya and Tanzania. Nairobi: EAEP
Court, D. and Durham Ghai (eds.) 1974. Education, Society and Development: New Perspectives from Kenya. Nairobi: Oxford University Press.
International Labor Organization (ILO). 1972. Employment, Incomes and Equality: A Strategy for Increasing Productive Employment in Kenya, Geneva: ILO Office.
Kanyinga, K. “Governance Institutions and Inequality in Kenya” in SID (ed.) 2006. Readings on Inequality in Kenya: Sectoral Dynamics and Perspectives, Nairobi: SID
Maxon, Robert, “Social and Cultural Changes”, in Ogot, B. A. and William Ochieng’ (eds.) 1995. Decolonization and Independence in Kenya 1940-1993. Nairobi: East African Education Publishers.
National Economic and Social Council, 2010. Unemployment in Kenya: A Situational Analysis. Nairobi.
Ochieng’, W. “Structural and Political Changes”, in Ogot, B. A. and William Ochieng’ (eds.) 1995. Decolonization and Independence in Kenya 1940-1993. Nairobi: East African Education Publishers.
Ogot, B. A. “The Decisive Years: 1956-63”, in Ogot, B. A. and William Ochieng’ (eds.) 1995. Decolonization and Independence in Kenya 1940-1993. Nairobi: East African Education Publishers.

95Regional Disparities and Marginalisation in Kenya
Ogot, B. A. The Politics of Populism”, in Ogot, B. A. and William Ochieng’ (eds.) 1995. Decolonization and Independence in Kenya 1940-1993. Nairobi: East African Education Publishers.
Ogot, B. A. and William Ochieng’ (eds.) 1995. Decolonization and Independence in Kenya 1940-1993. Nairobi: East African Education Publishers.
Omolo, O.J., 2010. “Ripple Effects of Minimum Wages and the Response of Labour Markets in Kenya”, Unpublished PhD Thesis, Nairobi: Kenyatta University.
Republic of Kenya, 2005. Key Gender and Employment Issues in Agriculture and Rural Development as Aspects of Poverty Reduction Strategy: Kenya Country Study. Nairobi: Ministry of Labour and Human Resource Development
Republic of Kenya, 2006. Economic Survey. Nairobi: Government Printer.
Republic of Kenya, 2007. Kenya Integrated Household Budget Survey 2005/2006. Nairobi: Government Printer.
Republic of Kenya, 2010. Economic Survey. Nairobi: Government Printer.
Republic of Kenya, 2011. Economic Survey. Nairobi: Government Printer.
Republic of Kenya, 2012. “Draft Employment Policy and Strategy for Kenya”, Ministry of Labour. Nairobi
Republic of Kenya, 1984. District Focus for Rural Development. Nairobi, Government Printer.
United Nations Development Programme, 2010. Kenya Human Development Report 2009: Youth and Human Development-Tapping the Untapped Resource. Nairobi
United Nations Development Programme, 2011. Human Development Report 2011: Sustainability and Equity-A Better Future for All. New York: Palgrave Macmillan.
Zeleza, T, “The Establishment of Colonial Rule: 1905-1920”, in W. R. Ochieng’ (ed.) 1989. A Modern History of Kenya (Nairobi: Evans Brothers

96 Regional Disparities and Marginalisation in Kenya


Friedrich-Ebert-StiftungPeponi Plaza, 1st Floor, D2, Mwanzi Road off Peponi Road, Westlands P.O Box 14932-00800 Nairobi, Kenya
Phone: 254-20-3748338 Fax: 254-20-3746992 E-Mail: [email protected] www.fes-kenya.org