regional industry focus oil and gas · medco, bcp, sci, ezion, bumi armada, and pantech sell umwog,...
TRANSCRIPT

www.dbsvickers.com
ed-JS / sa- YM , PY
Darkest before dawn
Narrowing supply-demand gap to drive oil price recovery but pace hampered by high inventory levels worldwide
Tipping points for oil services players: oil prices above US$60/bbl; reversal in oil majors’ capex trend
Meanwhile, we see opportunities to accumulate stocks with diversified operations with a competitive edge: Medco, BCP, SCI, Ezion, Bumi Armada, and Pantech
Sell UMWOG, Elnusa on high valuations, avoid Ezra, Nam Cheong, PACRA as balance sheet stress builds up
Oil prices clearly off the bottom now. We raised our oil price forecasts for 2016 and 2017 by US$10 per barrel (bbl) to US$45-50/bbl and US$50-55/bbl respectively as well as our long term oil price by US$5/bbl to US$60-65/bbl. This comes on the back of earlier-than-expected narrowing of the supply-demand gap. We expect the convergence of oil supply-demand trends to gather momentum towards the second half of 2017 and see upside risks stemming from possibility of heightened tensions in the Middle East, production cuts and change in OPEC’s stance.
Inflexion points to watch, bankruptcies on the rise. Increasing bankruptcies and M&A activities are some of the signals of a bottoming in the cycle for oil services companies. While we have yet to see a clear pattern of escalating M&A transactions, we believe there will be more consolidation opportunities in the next 6-12 months as distress builds up in the sector and bankruptcies soar. However, we highlight that any sustained recovery in the industry must originate from the source of cash flows into the ecosystem – in other words the oil majors’ capital expenditures (capex), which will in turn be driven by firmer oil prices. Capex trends could likely start to rise again by the middle of 2017.
Sector trading at steep discount to book, except Thai
upstream plays. Bargain hunt good names. E&P companies are direct winners of any oil price recovery but prospects are probably priced in with the oil price rebound to the US$40 levels. We like diversified oil refiner Bangchak Petroleum [BCP; BUY; TP Bt39], which is a laggard in this space. Singapore rigbuilders possess competitive advantages over their global peers in terms of cost efficiency and R&D focus; We continue to favour SCI [BUY; TP S$3.10] for stability as well as potential re-rating in the marine sector. In Malaysia, we like Pantech [BUY; RM0.64] as the best proxy to ride RAPID; and see value emerging for Bumi Armada [BUY; RM0.85]. In Indonesia, we have upgraded Medco [MEDC; BUY; TP Rp2,000] supported by higher oil prices, operational efficiencies and prudent capital allocation.
Meanwhile, we see more downside for UMW Oil & Gas [UMWOG; FV; TP RM0.80] and Elnusa [FV; TP Rp420], with their rich valuations and high earnings risks. We would also avoid Singapore Offshore Support Vessel (OSV) names like Ezra, Nam Cheong and Pacific Radiance which could be facing near term balance sheet distress.
STI : 2,851.74
Analyst HO Pei Hwa +65 6682 3714; [email protected] Suvro SARKAR +65 6682 3720; [email protected] Chaipat THANAWATTANO +66 2657 7827; [email protected] William SIMADIPUTRA +62 2130 034 939 [email protected] TAN Jianyuan +603 2604 3919; [email protected] Singapore Research Team +65 6327 2288; [email protected]
STOCKS
Source: DBS Bank, DBS Vickers, AllianceDBS., Bloomberg Finance L.P.
DBS Group Research . Equity 6 Sep 2016
Regional Industry Focus
Oil and Gas
Refer to important disclosures at the end of this report
Price Mkt Cap Target Price PB (x) ROE (%)
LCY US$m LCYS$ FY16 FY16 Rating
SINGAPORE S$ S$ Keppel Corporation 5.27 7,050 5.25 0.8 8.5 HOLD Sembcorp Marine 1.28 1,971 1.20 1.0 6.5 FV Sembcorp Industries 2.71 3,569 3.10 0.7 7.3 BUY Yangzijiang 0.77 2,157 1.00 0.6 8.3 BUY Cosco Corporation 0.28 454 0.30 0.9 -18.5 HOLD Ezion Holdings 0.25 381 0.58 0.3 5.4 BUY Ezra Holdings 0.04 90.7 0.06 0.2 -67.7 FV Mermaid Maritime 0.09 95.6 0.09 0.3 3.7 HOLD Nam Cheong Ltd 0.05 71.1 0.04 0.2 -6.1 FV Pacific Radiance 0.15 77.1 0.11 0.2 -10.5 FV PACC Offshore 0.31 413 0.33 0.4 -2.0 HOLD Vard Holdings Ltd 0.14 120 0.18 0.3 -3.3 HOLD Triyards Holdings 0.26 60.8 0.50 0.8 8.5 NR MALAYSIA RM RM Bumi Armada 0.76 1,087 0.85 0.6 2.3 BUY Coastal Contracts 1.48 193 1.65 0.5 8.1 HOLD Dayang Enterprise 1.00 215 0.88 0.8 2.2 FV Dialog Group Bhd 1.53 1,984 1.70 3.6 14.3 HOLD Malaysia Marine & 1.02 401 0.98 0.6 2.5 FV SapuraKencana 1.55 2,280 1.16 0.1 7.0 FV UMW Oil & Gas 0.91 483 0.80 0.8 1.2 FV Deleum Bhd 1.08 106 1.02 0.7 -9.0 HOLD Pantech Group 0.54 81.6 0.64 1.4 8.9 BUY THAILAND Bt Bt Bangchak Petroleum 32.75 1,298 39.00 1.2 16.8 BUY IRPC PCL 4.80 2,824 5.20 1.2 11.41 HOLD PTT 333 27,382 370 1.3 12.1 BUY PTT E&P 79.50 9,086 86.00 0.8 3.5 HOLD PTT Global Chemical 60.25 7,736 70.00 1.1 9.46 BUY Thai Oil PCL 69.50 4,082 65.00 1.4 15.4 HOLD INDONESIA Rp Rp Elnusa 494 274 420 0.2 -19.2 FV Medco Energi 1,495 377 2,000 0.4 -0.3 BUY Logindo 120 23.4 132 1.2 16.0 FV Wintermar Offshore 244 74.6 239 0.5 2.9 HOLD

Regional Industry Focus
Oil and Gas
Page 2
Analysts
HO Pei Hwa +65 6682 3714
[email protected] Suvro SARKAR +65 6682 3720
Chaipat THANAWATTANO +66 2657 7827
[email protected] William SIMADIPUTRA +62 2130 034 939 [email protected]
TAN Jianyuan +603 2604 3919 [email protected] Singapore Research Team +65 6327 2288
Table of Contents Investment Summary 3 Inflexion points: what we want to see before calling a bottom 4 Oil Prices: Supply-demand gap narrowing 9 E&P and Refineries: Winners and losers of oil price rebound 15 Rigbuilders: is it time to turn positive? 17 Oilfield Services: where are we in the sector cycle? 24 Key oil producers in the region 26
Indonesia: Slow energy reform 26
Malaysia: RAPID commitment intact 29
Valuation 31 Company Guides 35
Ezion Holdings 36
Sembcorp Industries 44
Sembcorp Marine 51
Bumi Armada 58
Pantech Group 64
Bangchak Petroleum 71
Elnusa 77
Medco Energi Internasional 84
Page 2

Regional Industry Focus
Oil and Gas
Page 3
INVESTMENT SUMMARY Adjusting our near term oil price expectations. Given the narrowing gap between supply and demand, we now expect oil prices to average between US$45-50/bbl in the second half of 2016 (2H16), a notch higher than YTD average of US$42.55/bbl. In 2017, we expect a further recovery in oil prices to an average of US$50-55/bbl, as convergence of oil supply-demand trends gather momentum in the second half of 2017 (2H17). We believe oil prices will likely move upwards at a faster trajectory towards the end of this decade. Our longer term oil price forecast is currently around US$60-65/bbl, but we reckon there is more upside risk in the longer term than downside risk, in view of the recent massive cuts in capex and marginal cost of oil production. Inflexion points: what we want to see before calling a bottom. Any recovery in the industry must originate from the source of cash flows into the ecosystem – in other words oil prices and oil majors’ capex. Higher cash flows from these ‘top of the waterfall’ sources will then filter down to service players and shipyards through the value chain. Key Inflexion points:
#1: M&A activity leading to industry consolidation. M&A and industry consolidation typically occur at the bottom of the cycle. We think the next 6-12 months will present more consolidation opportunities as more O&G companies are increasingly in distress, creating attractive buyout opportunities
#2: Oil majors increasing capex spend. Oil majors must increase capex budgets, otherwise oilfield equipment services and asset owners will continue to suffer. As oil prices move towards US$60/bbl, we believe oil majors may consider revising up future capex estimates by mid-2017.
#3: Accelerating fleet retirement to scrap older vessels and rigs. For asset owners in particular rig and OSV players, the acceleration of fleet retirement is required to drive market equilibrium in a market which is flooded with oversupply of offshore support vessels.
#4: Higher vessel utilisation and day rates. Rig utilisation typically lagged oil prices by 7-24 months. The lag effect this time could be closer to the two year mark, similar to the 2008 period. This implies a potential recovery for the service asset players only in late-2017 or early-2018.
E&P companies are direct winners but largely priced in;
selective BUYs on laggards. Higher oil prices would directly benefit exploration and production (E&P) companies. However, we believe this has been largely priced in until we see another leg of oil price uplift. The refiners could benefit from near term inventory gains but margin contraction can be expected in the longer term as oil prices creep up. Our top
pick in this segment is BCP (BUY; TP: Bt39) for its undemanding valuation and laggard share price performance. Rigbuilders – a long and harsh winter. While Keppel Corp (Keppel) and Sembcorp Marine (SMM) are trading near AFC valuations, there remains uncertainties revolving the extent of damage from Brazil and potential customer default. In addition, rig orders – the key earnings driver for shipyards, are unlikely to return in the next 1-2 years amidst an unprecedented supply glut. A turnaround for rig orders to return requires the acceleration of rig retirement, cancellations of speculative build and higher oil prices. OSV owners struggling for survival. Many OSV owners are already operating below breakeven levels and it might take 12-24 months before meaningful recovery in utilisation and day rates kick in. As such, the cost competitiveness and balance sheet strength of the OSV players are extremely vital at this stage.
Diversified names are safer picks. Companies have adopted two action plans to combat the weak outlook: Firstly, stepping up their cost-cutting measures and initiatives, and secondly, diversifying beyond the oil & gas sector. SCI (BUY; TP: S$3.10) remains our preferred pick among the large cap O&M plays. SCI offers stability through its utility business and potential re-rating of O&G sector through 61% owned SMM. SCI’s utilities business is valued at an undemanding 0.7x P/B and 8x FY16F PE vs historical mean PE of 11x. Ezion (BUY; TP: S$0.58) has trumpeted its plans to enter the Chinese offshore windfarm market, having forged strategic partnerships with Chinese state-owned power provider, China Huadian and its subsidiary Sinotrans, to facilitate the entry in to the alternative energy business. Malaysia: Commitment on RAPID project intact. While Petronas is cutting capex by RM15–20bn in 2016, and RM50bn over the next four years, its commitment to develop RAPID remains unchanged and we expect a few more petrochemical and tank terminal contracts to roll out for the remainder of 2016. Pantech (BUY; TP: RM0.64) is an ideal proxy to RAPID's ongoing expansion in Pengerang. In large cap space, we continue to like Bumi Armada (BUY; TP: RM0.85) for its undemanding valuation at 2SD below mean, and earnings visibility backed by long-term FPSO contracts. Indonesia: Slow energy reform. Indonesia’s Special Task Force for Upstream Oil and Gas Business (SKK Migas) has admitted that the integration between itself and BP Migas, which has only been 20 months old, will take more time to extract synergies. We also do not see any meaningful incentives from the government in the short term to boost the fortunes of this industry amid the current challenging situation. We have upgraded MEDC (BUY; TP: Rp2,000) to BUY on better crude oil ASP and its new strategy to pursue continuous operational efficiencies and prudent capital allocation.
Page 3

Regional Industry Focus
Oil and Gas
Page 4
Key inflexion points to watch for a recovery As the wave of corporate defaults builds, investor confidence in the sector has waned. For the oil service sector, we believe a recovery is only likely in late-2017 or early-2018, as rebalancing drives oil prices closer to US$60/bbl towards end 2017, incentivising a revival in capex. Amidst the doom and gloom, we highlight several inflexion points that would signal a recovery.
Searching for the tipping point: In this section, we list some of the criteria that we consider are indicators of a bottom at the various stages of the value chain, aligning to companies under our coverage. We note that any recovery in the industry must originate from the source of cash flows into the ecosystem – in other words, the oil price and oil majors’ capex. Higher cash flows from these ‘top of the waterfall’ sources will then filter down to service players and shipyards through the value chain.
Oil & Gas industry recovery and inflexion point waterfall
Source: DBS Bank
Inflexion point #1: Industry consolidation via M&A needs to gather momentum to signal a bottom. M&A and industry consolidation typically occur at the bottom of the cycle, before a gradual improvement in industry fundamentals, driven by a rationalisation of capacity and derived cost synergies. Thus, one of the signals of a cycle bottom is increasing M&A activity. However, we have yet to see a clear pattern of escalating M&A volumes emerging, as seen in the chart below0, where we track the number and size of oil & gas M&A deals over US$100m in value (excluding PE buyouts).
Industry consolidation has been slow, as the industry has just entered into the stage of debt restructuring/bankruptcies while the volatility of oil prices may have caused potential acquirers to throw caution to the wind. The next 6-12 months will present more consolidation opportunities we expect distressed O&G companies to be on the rise, creating attractive buyout opportunities. Oil prices have generally been trending steadily up year-to-date, which should give acquiring managers that marginal boost in confidence.
Cas
h fl
ow d
irect
ion
Oil majors (IOCs and NOCs)
Stage of value chain
Rig owners
OSV owners
Other service players(e.g. ship chandlers)
Subsea vessel owners
Shipyards
Equipment players
Inflextion points
• Shell• ExxonMobil• BP
• Petronas• Pertamina• Saudi Aramco
• Seadrill• Rowan• Ensco
• POSH• PACRA• Ezra
• Ezra• Mermaid Maritime• Technip
• Sinwa Limited• Keppel Corp• Sembcorp Marine• Vard• Nam Cheong
• KTL Global• Nordic Group
Higher capex budgets
Higher utilisation/dayrates
Retirement of older fleet
For shipyards: increase in conversion or newbuilding
contracts
Oil prices >US$60/bbl
M&A/Consolidation to accelerate a recovery
• Bumi Armada• Logindo• Wintermar
Page 4

Regional Industry Focus
Oil and Gas
Page 5
No clear pattern to M&A activity yet
Source: Bloomberg Finance L.P, as of 15 June 2016
Inflexion point #2: Oil majors must increase capex budgets, otherwise service asset owners will continue to suffer. We examined the latest capex budget plans of eight of the largest International Oil Companies (IOCs) to see if the recent rebound in oil prices had loosened their purse strings. The answer was no. There are two salient points to note here: i) Despite oil prices having recovered to close to US$50/bbl from the US$30-40/bbl seen in 1Q16, capex budgets for 2016 have been trimmed even further over the last few months. Shell announced the largest cut on its capex budget for 2016 of 12%, while ConocoPhillips, Total and ExxonMobil announced smaller amounts of less than 5% each.
In aggregate, this means 2016 capex was cut by a further 5%, or US$7bn, over the last few months.
ii) 2017 and 2018 capex budgets are lower than 2016. We estimate that 2017 capex budgets are 10% lower than 2016’s quantum based on the latest disclosures by the IOCs, while 2018 capex looks to be flat y-o-y.
However, given that we are expecting oil prices to average between US$50-55/bbl in 2017, and that capex plans for 2017/18 are likely flexible rather than cast in stone, we think that a bottom in 2017 is possible before a recovery in 2018, in terms of capex spend at least. As oil prices move towards US$60/bbl, we believe oil majors may consider revising up future capex estimates by mid-2017. In the meantime, service players should continue to face pressure on utilisation and dayrates, as many of these players that added assets to their fleets in the boom years will still be fighting over a smaller pie during the trough years of 2016/17. Oil major Eni, in its latest 2016-2019 strategy presentation, made this explicit: it said that “it plans to reduce its total rig fleet by 33% (from 109 to 73) from 2014 to 2017, while the average dayrate on these rigs should be 51% lower in 2017 compared to 2014, at US$4.5m/day.” It plans to renegotiate 1,600 service contracts in 2016; which is bad news for rig owners and by association, OSV owners.
Capex in 2016 expected to be down 21% vs. 2015, and down 37% vs. 2014 in aggregate
Source: Companies
05
101520253035404550
2014 Actual 2015 Actual 2016 target as of Feb'16 2016 target as of Apr/May/Jun'16 2017 2018
-34% -35%
-40%
-26%-67%
-29%
-40%
-34%
*Assuming Shell and BG had merged as of 1 Jan 2014*ENI: using the average of 37bn capex over its 4-year programme (2016-2019)
(in US$bn)
0
5
10
15
20
25
30
35
40
45
50
0
20,000
40,000
60,000
80,000
100,000
120,000
140,000
160,000
1Q14 2Q14 3Q14 4Q14 1Q15 2Q15 3Q15 4Q15 1Q16 2Q16
Value (US$m) No. of deals >US$100m
Skewed by US$53bn Shell-BG megadeal Skewed by US$33bn
Energy-Transfer-Williams megadeal
Total Deal Value (US$m) No. of Deals
Page 5

Regional Industry Focus
Oil and Gas
Page 6
Source: Companies, DBS Bank estimates Inflexion point #3: Higher rig utilisation and day rates are needed, but these may only materialise in 2018. We look at the last two oil price crashes of comparable magnitude to the current downturn, namely the 1997-1998 crash caused by the Asian Financial Crisis (AFC), and the 2008 crash following the onset of the Global Financial Crisis (GFC). During the 1997-1998 period, rig utilisation lagged oil prices by seven months in terms of bottoming out, while in the 2008 period, rig utilisation took two years longer than oil prices to bottom out. A large influx of newbuild rigs over the latter period – a supply-side pressure that was not present during the AFC period – prolonged the lag effect. Another key factor to consider is how soon oil prices hit US$60/bbl again, which is the approximate level needed to incentivise greater exploration and development activity from oil majors. Piecing the information together, given that global rig orderbook levels remain elevated in 2016 and that we are predicting average oil prices of US$60/bbl only from 2018 and beyond, we think the lag effect this time could be closer to the two year mark, similar to the 2008 period. This implies a potential recovery for the service asset players only in late-2017/early-2018 at best. Brent price vs. jackup rig utilisation (AFC – 1997-1998)
Source: Bloomberg Finance L.P., IHS Petrodata
Brent price vs. jackup rig utilisation (GFC – 2008)
Source: Bloomberg Finance L.P., IHS Petrodata
Offshore rig utilisation – waiting for the bottom
Source: IHS Petrodata
(in US$ bn) 2014 Actual 2015 Actual 2016 target as
of Feb'16 2016 target as of Apr/May/Jun'16 2017 2018
Chevron 40.3 34 25-28 25-28 17-22 17-22 Shell + BG* 44.4 35.5 33 29 25-30 25-30 BP 22.9 18.7 18 17 15-17 - ConocoPhillips 17.1 10.1 6.4 5.7 - - TOTAL 26.0 23 19 <19 17-19 17-19 ExxonMobil 38.5 31.1 23.2 23.2 22 - Statoil (NOK bn) 19.6 14.7 13 13 - - ENI 15.3 11.0 9.3 9.3 9.3 9.3
Total (US$ bn) 207.0 165.2 137.0 130.8
0.00
5.00
10.00
15.00
20.00
25.00
30.00
35.00
50556065707580859095
100
Jan
1997
Apr
199
7
Jul 1
997
Oct
199
7
Jan
1998
Apr
199
8
Jul 1
998
Oct
199
8
Jan
1999
Apr
199
9
Jul 1
999
Oct
199
9
Jan
2000
Apr
200
0
Jul 2
000
Oct
200
0
Jan
2001
Jackup utilisation (%, LHS) Brent Price
7-month lag for bottoming out of utilisation rates
0.00
20.00
40.00
60.00
80.00
100.00
120.00
140.00
160.00
50
55
60
65
70
75
80
85
90
95
Jul 2
008
Oct
200
8
Jan
2009
Apr
200
9
Jul 2
009
Oct
200
9
Jan
2010
Apr
201
0
Jul 2
010
Oct
201
0
Jan
2011
Apr
201
1
Jul 2
011
Oct
201
1
Jan
2012
Apr
201
2
Jul 2
012
Jackup utilisation (%, LHS) Brent Price
2-year lag for bottoming out of utilisation rates
0
20
40
60
80
100
120
50%55%60%65%70%75%80%85%90%95%
100%
Jan
2014
Mar
201
4
Ma y
201
4
Jul 2
014
Sep
2014
Nov
201
4
Jan
2015
Mar
201
5
May
201
5
Jul 2
015
Sep
2015
Nov
201
5
Jan
2016
Mar
201
6
Ma y
201
6
Jackup Semisub Drillship Brent (US$/bbl)
Oil pr ice trough in Jan '16
~2 year lagunt il rig
re covery?
Page 6

Regional Industry Focus
Oil and Gas
Page 7
Inflexion point #4: For OSV owners, accelerating fleet retirements of older vessels needed to reduce severe oversupply situation. But these have been few and far between due to low steel prices and cost of scrappage. OSV utilisation rates have fallen to about 50% while day rates have also plunged by at least 40% since the onset of the oil price collapse; many OSV owners are operating below breakeven levels. The anaemic operating environment has been a function of lower demand – from reduced exploration and development activity from oil majors – and oversupply resulting from overinvestment in OSVs during the heydays from 2011 to mid-2014. While the demand-side factors cannot be controlled from the perspective of OSV owners, supply-side factors can be managed especially if the industry acts collectively. In our view, retirement of vessels sends a stronger signal of waning supply-side pressures than stacking, since warm stacked vessels can be brought back to the market fairly quickly, while cold stacked vessels can also be put back to work in the event of attractive contracts. However, we note that retirement of vessels has been minimal since 2014: a total of 78 AHTS and PSVs have been retired since the beginning of 2014 (all of these were at least 30 years old), which is paltry compared to the 1,400+ vessels that are stacked at the moment. We think this has been motivated by i) low scrap values for vessels; and ii) a general reluctance to let go of assets at the bottom of the cycle as vessel owners retain some hope of better times ahead. What could help catalyse retirements? While it is difficult to predict the extent of future retirements, we think two factors will help drive an acceleration in the numbers: Firstly, as the OSV market languishes, older vessels – which account for the lion’s share of stacked vessels – are finding it harder to compete with younger vessels offering competitive day rates; clients are increasingly asking for vessels <15 years of age. Thus, diminished work prospects should drive these vessels to the scrapyard. Secondly, consolidation will help push older vessels out of the market either via a concerted effort by the larger players to retire their older vessels, or via a marginalisation of smaller players with old vessels, such as Swissco. Cumulative number of AHTS and PSVs retired since 2014
Source: Clarksons
AHTS fleet status as of mid-June 2016
Source: Clarksons PSV fleet status as of mid-June 2016
Source: Clarksons Global OSV owner ROEs at all-time lows as the OSV oversupply situation has worsened over the last 1-2 years. As SGX-listed OSV owners generally do not have an operating history long enough since listing to track performance through past crises, we have aggregated the earnings of the global players i.e. Tidewater, SEACOR and Gulfmark Offshore. We have compared earnings to various other key metrics in an attempt to glean some insights. We note the following:
i) For OSV owners, this downturn is the worst in at least three decades. During past periods of crisis, OSV owners’ pre-tax ROE was generally in the positive range. This time, it has trended in increasingly negative territory for about 1.5 years. This agrees with our channel checks as OSV owners we have met are generally in agreement that this crisis is the most severe in a long while.
ii) OSV owners’ profits generally take between 6-9 quarters to reach a trough but have not always rebounded as strongly as rig fundamentals (due to rising OSV-to-rig ratios).
0
1
2
3
4
5
6
7
8
0
10
20
30
40
50
60
70
80
90
AHTS PSV No. of retirements (monthly, RHS)
0 200 400 600 800 1000 1200
Orderbook
0-5
6-10
11-15
16-20
20-25
>26
Stacked In Service Under Construction Retired since Beg-2014
Working fleet count: 2,280Stacked fleet count: 722Retired since Jan 2014: 72
Orderbook as a % of working fleet: 8.2%
0 200 400 600 800 1000
Orderbook
0-5
6-10
11-15
16-20
20-25
>26
Stacked In Service Under Construction Retired since Beg-2014
Working fleet count: 1,774Stacked fleet count: 737Retired since Jan 2014: 24
Orderbook as a % of working fleet: 12.5%
Page 7

Regional Industry Focus
Oil and Gas
Page 8
iii) While the orderbook-to-fleet ratio (of Anchor Handling Tug Supply (AHTSs) and Platform Supply Vessel (PSVs) in aggregate) has eased to ~8% currently, deliveries of newbuild OSVs over the last few years have depressed profitability even while oil prices were at the US$100/bbl levels. OSV-to-rig ratios are at an all time high of 6.6x (as at June 2016). Thus, unless there is a mass exodus of old vessels to the scrapyard, even in a recovery scenario we may not see a strong recovery in ROEs.
Going back to basics, the value of a company is the present value of its future cash flows. ROEs have been depressed since 2008 due to oversupply and this pressure will persist unless owners retire their old vessels to reduce the supply and/or demand surges alongside an oil price spike. Thus, even a modest oil price recovery past the US$60/bbl mark may not be enough to support a case for investment in OSV companies – the supply-side must be addressed in tandem.
OSV-to-rig ratio (PSVs + AHTS) at an all-time high
Source: Clarksons, ODS Petrodata
AHTS-to-rig ratio versus AHTS orderbook-to-fleet ratio
Source: Clarksons, ODS Petrodata PSV-to-rig ratio versus PSV orderbook-to-fleet ratio
Source: Clarksons, ODS Petrodata
Global OSV owner profits in the wake of oil price crises: 6 – 9 quarters’ time from oil price trough to earnings trough
Source: Companies, Clarksons, ODS Petrodata
0.0%
5.0%
10.0%
15.0%
20.0%
25.0%
30.0%
35.0%
3.00
3.50
4.00
4.50
5.00
5.50
6.00
6.50
7.00
1996
-Jan
1997
-Feb
1998
-Mar
1999
-Apr
2000
-Ma y
2001
-Jun
2002
-Jul
2003
-Aug
2004
-Sep
2005
-Oct
2006
-Nov
2007
-Dec
2009
-Jan
2010
-Feb
2011
-Mar
2012
-Apr
2013
-May
2014
-Jun
2015
-Jul
Orderbook to fleet ratio (%) - RHS OSV-to-rig ratio (x) - LHS
-15%
-10%
-5%
0%
5%
10%
15%
20%
25%
30%
35%
0
20
40
60
80
100
120
Jun
1989
Feb
1990
Oct
199
0Ju
n 19
91Fe
b 19
92O
ct 1
992
Jun
1993
Feb
1994
Oct
199
4Ju
n 19
95Fe
b 19
96O
ct 1
996
Jun
1997
Feb
1998
Oct
199
8Ju
n 19
99Fe
b 20
00O
ct 2
000
Jun
2001
Feb
2002
Oct
200
2Ju
n 20
03Fe
b 20
04O
ct 2
004
Jun
2005
Feb
2006
Oct
200
6Ju
n 20
07Fe
b 20
08O
ct 2
008
Jun
2009
Feb
2010
Oct
201
0Ju
n 20
11Fe
b 20
12O
ct 2
012
Jun
2013
Feb
2014
Oct
201
4Ju
n 20
15Fe
b 20
16
Oil Crises OSV orderbook to fleet ratio (%)
Brent (US$/bbl) - LHS Jackup rig utilisation (%, LHS)
OSV owners agg. ex-impairment pre-tax ROE - RHS
6 quarters
9quarters
9quarters
No. of quarters = time from oil price trough to OSV earnings trough
0.0%
5.0%
10.0%
15.0%
20.0%
25.0%
30.0%
35.0%
40.0%
2.002.202.402.602.803.003.203.403.603.80
1996
-Jan
1997
-Feb
1998
-Mar
1999
-Apr
2000
-May
2001
-Jun
2002
-Jul
2003
-Aug
2004
-Sep
2005
-Oct
2006
-Nov
2007
-Dec
2009
-Jan
2010
-Feb
2011
-Mar
2012
-Apr
2013
-May
2014
-Jun
2015
-Jul
AHTS orderbook to fleet ratio (%) - RHS
AHTS-to-rig ratio (x) - LHS
0.0%
5.0%
10.0%
15.0%
20.0%
25.0%
30.0%
1.00
1.50
2.00
2.50
3.00
3.50
1996
-Jan
1997
-Feb
1998
-Mar
1999
-Apr
2000
-Ma y
2001
-Jun
2002
-Jul
2003
-Au g
2004
-Sep
2005
-Oct
2006
-Nov
2007
-Dec
2009
-Jan
2010
-Feb
2011
-Mar
2012
-Apr
2013
-Ma y
2014
-Jun
2015
-Jul
PSV orderbook to fleet ratio (%) - RHS PSV-to-rig ratio (x) - LHS
Page 8

Regional Industry Focus
Oil and Gas
Page 9
Oil Prices: Supply-demand gap narrowing We believe oil market is set on recovery path and expect oil prices to average US$45-50/bbl in 2016; US$50-55/bbl in 2017; and US$60-65/bbl in the longer term. Overall sentiment on oil market has turned more upbeat since May 2016, driven by rebalancing with supply outages in Canada and Nigeria as well as better-than-expected demand for petroleum products from India and China. YTD-2016, Brent crude oil price has averaged around US$42.55/bbl. While prices are currently pulling back from the recent highs of US$52/bbl, with the USD appreciation and gradual resumption of supplies from Canada, we believe oil price is unlikely to test the previous lows seen earlier this year as US shale production seems to have been adequately tempered by the fall in oil prices. However, upside will be capped by overflowing inventory levels worldwide. Adjusting our near term oil price expectations. Given the narrowing gap between supply and demand, we have raised our oil price forecasts. We now expect oil prices to average between US$45-50/bbl in 2H16. In the near term, oil prices are likely to remain below the recent highs of c.US$50/bbl as production outages from Canada, Nigeria, and Libya are gradually restored, putting supply back to the market. The Brexit worries has also pushed USD index higher and the USD strength will also continue to weigh on oil prices for the rest of this year. OPEC’s refusal to vary its production stance and the fast rising supplies from Iran will offset the decline in shale production in 2016 and will continue to delay the rebalancing of the market.
In 2017, we expect a further recovery in oil prices to an average of US$50-55/bbl, driven by the convergence of oil supply-demand trends, which should gather momentum during 2H17. Upside risks could stem from the possibility of heightened tensions in the Middle East, leading to supply chain disruptions. More bullish longer term forecasts. We expect oil prices to move upwards at a faster trajectory towards the end of this decade. Firstly, of course, we consider the fact that more than US$370bn worth of capex for 2016 and 2017 had been cut by upstream developers – according to industry consultant Wood Mackenzie – and further cuts to 2020 will mean that close to 3mbpd (million barrels per day) of supply that was supposed to come onstream by 2020 will now only flow after that. This will help the supply demand equation as we approach 2020. Also, the need to develop oil production in more expensive areas – and the cost of the most expensive last barrel needed to meet demand – should continue to support oil prices. On the cautious side, we note that technological advances have rendered extraction of oil (read: shale oil) more flexible to demand changes with shorter lead time to production, and the global focus on climate change will limit the future exploitation of fossil fuels to an extent. Our longer term oil price forecast is currently around US$60-65/bbl, but we reckon there is more upside risk in the longer term than downside risk.
Oil price trends
Source: Bloomberg Finance L.P., DBS Bank
0
20
40
60
80
100
120
140
Brent WTI
Brent hit a high of US$115/bbl on 19-Jun-14 before collapsing
Brent rallied to US$52/bbl level in May 2016, but seems to have run out steam thereafter
DBS forecast for Brent:2H-2016 average – US$45-50/bbl2017 average – US$50-55/bbl
Long-term price – US$60-65/bbl
Page 9

Regional Industry Focus
Oil and Gas
Page 10
Supply demand curve has narrowed earlier than expected owing to the supply chain disruptions in various parts of the world in 2Q16, which are yet to be fully resolved, as well as slightly better than expected demand growth, especially from China and India in 2016. Global oil inventory build-up is thus likely to slow from 1.8-2.0mmbpd in 2015 to 0.8-1.0mmbpd in 2H16, and reach more balanced levels probably by the middle of 2017. We thus believe that the period of growing inventory looks to be behind us, and it is likely that sustained inventory drawdowns could happen from 2H17 onwards, lending support to slowly recovering oil prices. Global oil production and consumption trend and
forecasts
Source: US Energy Information Administration (EIA), DBS Bank Production outage was the main reason for the recent rise in oil price above US$50/bbl. Supply outages from Canada, Nigeria and Ghana amounting to almost 1.5mmbpd in May 2016 wiped out almost the entire supply-demand gap and along with signals of a production slowdown from the US, leading to a sharp rally in oil prices during the month. Raging forest fires in Canada cut about 1mmbpd of production or 25% of Canada’s production at the peak (0.8mmbpd on average in May 2016). The wildfires have now been contained and production should gradually come back to the market. Over in Nigeria, militant attacks on pipeline infrastructure have affected production severely in 2016. While Nigeria’s outages decreased in June, they still remained high at 0.6mmbpd, according to EIA estimates. While exports from Shell’s Bonny terminal are resuming, another 0.3mmbpd of the disrupted volume remains under force majuere. These unplanned outages have led to an earlier than expected narrowing of the supply-demand curve but the situation may not be sustainable, not with the existing inventory overhang and OPEC production still at record levels. Meanwhile, US production has been falling, as expected. EIA estimates that crude oil production in the US in May 2016 averaged 8.7mmbpd, which is more than 0.2mmbpd below the April 2016 level, and approximately 1mmbpd below the peak 9.7mmbpd level reached in April 2015. Even though
productivity levels have been continuously improving, it is not enough to offset the sharp fall in rig count in the US – down more than 75% from the high of 1929 rigs in November 2014 to 462 working rigs currently. Overall, average US production is expected to decline by 0.6mmbpd y-o-y in 2016 and 0.2mmbpd in 2017. US – monthly production levels Source: EIA, DBS Bank But don’t discount a rebound. As we highlighted in the previous paragraph, productivity gains across the seven main shale oil producing areas in the US has been relentless, as drillers have applied new, innovative technologies to increase output and reduce drilling time. As a result, weighted average productivity per rig in the seven major shale oil producing regions in the US has surged 68% since Oct 2014, when rig counts began their steep decline. This is not a new phenomenon. Tight oil has boasted steady productivity gains since 2007, as evident from the chart below. These productivity gains had offset the decline in drilling rigs in the early stages of this crisis but expiry of hedges, capex reductions and rising balance sheet stress since 2H15 have limited the extent to which productivity gains can make an impact. US weighted average productivity per rig in 7 major shale
regions
Source: EIA, DBS Bank
80.00
82.00
84.00
86.00
88.00
90.00
92.00
94.00
96.00
98.00
100.00
1Q10
3Q10
1Q11
3Q11
1Q12
3Q12
1Q13
3Q13
1Q14
3Q14
1Q15
3Q15
1Q16
3Q16
1Q17
3Q17
World production (mmbpd) World consumption (mmbpd)
7.0
7.5
8.0
8.5
9.0
9.5
10.0
Jan-
2014
Mar
-201
4
Ma y
-201
4
Jul-2
014
Sep-
2014
Nov
-201
4
Jan-
2015
Mar
-201
5
May
-201
5
Jul-2
015
Sep-
2015
Nov
-201
5
Jan-
2016
Mar
-201
6
mmbpd
0
100
200
300
400
500
600
Jan-
07
Jul-0
7
Jan-
08
Jul-0
8
Jan-
09
Jul-0
9
Jan-
10
Jul-1
0
Jan-
11
Jul-1
1
Jan-
12
Jul-1
2
Jan-
13
Jul-1
3
Jan-
14
Jul-1
4
Jan-
15
Jul-1
5
Jan-
16
boepd per rig
Page 10

Regional Industry Focus
Oil and Gas
Page 11
However, what this means is that shale oil can make a faster than ever comeback if oil prices move closer to desirable levels (US$50-60/bbl) and rig counts improve. Indeed, rig counts in the US have gone up in 7 of the last 8 weeks in response to the recent oil price rally seen in May-June 2016. OPEC again fails to reach consensus on output. OPEC members have failed to agree on setting a curb on production levels during their regular semi-annual meeting held in Vienna last week. This is not surprising given Iran’s refusal to participate in a production freeze, and the recovery of oil prices to more reasonable US$50/bbl levels, which may lead OPEC members to think that their market share strategy is paying off. During the meeting, the only decision taken was to appoint Nigerian delegate Mohammed Barkindo as OPEC’s new secretary general, replacing Abdullah al-Badri of Libya. The much vaunted production “freeze” did not work out. Officials from the two of the world’s largest oil producing countries – Saudi Arabia and Russia – along with other OPEC members had met in Doha earlier in April 2016 to formalise a deal to freeze production, but were not able to reach a conclusion. Recently, the Russian Energy Minister indicated that possible coordination with OPEC can be ruled out after the failure earlier in the year. November OPEC meeting unlikely to be any different. When OPEC members meet again in November, it will mark an entire year without an official production target. It seems OPEC has largely disowned its role of swing producer and is happy to let the market balance itself. OPEC production remains above 30mmbpd in recent months. OPEC production has breached the 32mmbpd mark consistently since 2H15, much higher than the target of 30mmbpd set by member nations earlier. Iraq and Saudi Arabia led the initial increase but Iran has taken up the mantle in 2016, following the removal of Western-imposed sanctions earlier this year. Iran is expected to ramp up production by up to 1mmbpd over the next two years. In addition, it has around 42mmbbls of floating oil storage. OPEC production trends
Source: Bloomberg Finance L.P., DBS Bank
Iranian supply ramp up YTD in 2016 faster than expected. Iran – fresh off the lifting of sanctions in early 2016 – continues to push hard to regain lost market share. Iran has already ramped up output to 3.6mmbpd by May 2016, up 0.8mmbpd since the beginning of the year. According to International Energy Agency (IEA) estimates, Iranian exports of crude oil in April were just under 2mmbpd, nearly double the volume at the start of the year. Exports rose to 2.1mmbpd in May, nearly touching pre-sanctions levels. Provisional loading schedules for June indicate that recent levels are being maintained with crude shipments of more than 2mmbpd. Before sanctions were tightened in mid-2012, Iran's crude oil exports totalled about 2.2 mmbpd, and that level should be reached by 2017. Iran crude oil supplies
Source: Bloomberg Finance L.P., DBS Bank
Demand growth in 2016 has exceeded expectations so far. The EIA expects oil consumption to grow by 1.4mmbpd in 2016 and 1.5mmbpd in 2016. This is slightly higher than previous demand forecasts, largely due to demand trends emanating from India and China in the first half of the year. Overall, Asia-Pacific (ex-Japan) is expected to contribute more than 1.0mmbpd of incremental demand over the next couple of years. Among developed economies, growth from US and South Korea is expected to more than offset demand declines in Japan and Europe. Downside risks will stem from the Brexit situation, as it is unclear how this will affect economic growth in the UK and Europe, going forward. India takes the lead in 2016. India is expected to lead oil demand growth in 2016/17 with about 0.4mmbpd of incremental demand p.a., driven by increased demand from the transportation and petrochemical sectors. Globally, India’s GDP growth is one of the bright spots, with expectations of 7.4-7.5% growth over the next two years. The March-June quarter of 2016 (1QFY16-17) saw oil demand growing at 7.8%, the fastest clip for any first quarter in a decade. Diesel consumption was up 4.7% while petrol consumption was up 10% y-o-y during the quarter. As it stands, India is forecast to overtake Japan as the third-largest oil user this year and the International Energy Agency (IEA) estimates that India will be
2.5
2.7
2.9
3.1
3.3
3.5
3.7
Jan-
14
Mar
-14
May
-14
Jul-1
4
Sep-
14
Nov
-14
Jan-
15
Mar
-15
Ma y
-15
Jul-1
5
Sep-
15
Nov
-15
Jan-
16
Mar
-16
Ma y
-16
mmbpd
25
26
27
28
29
30
31
32
33
Jan-
14
Mar
-14
Ma y
-14
Jul-1
4
Sep-
14
Nov
-14
Jan-
15
Mar
-15
Ma y
-15
Jul-1
5
Sep-
15
Nov
-15
Jan-
16
Mar
-16
Ma y
-16
mmbpd
Page 11

Regional Industry Focus
Oil and Gas
Page 12
fastest growing crude customer in the world through 2040, adding 6.0mmbbls of demand, compared to China’s 4.8mmbbls. Increasing income levels for the middle class and the government’s focus on infrastructure building are the key drivers behind this additional demand. India oil consumption trends and forecast
Source: EIA, DBS Bank India’s domestic automobile sales is a key driver
Source: Society of Indian Automobile Manufacturers, DBS Bank Importance of China may be diminishing but in no way fading. China has been the key driver of oil demand for the last decade and more, responsible for close to 50% of all incremental demand from 2005-15. China now accounts for more than 12% of global oil consumption – compared to 8% in 2005 – as oil consumption grew at 5.2% CAGR over the last decade, compared to 1.2% CAGR globally. However, as the manufacturing-based economy transitions to a service-based one, slowdown in industrial activity will have a negative impact on oil demand, and hence, China is expected to lag behind its historical growth rate in future.
China oil consumption trends
Source: EIA, DBS Bank But that does not mean Chinese demand is fading. Chinese oil demand still continues to grow, unlike demand for other commodities like coking coal, iron ore and copper which are mostly used for industrial activities. It is still expected to grow at around 0.4mmbpd in 2016/17, higher than the previous estimate of 0.3mmbpd. Demand is still growing from sectors like petrochemicals and transport, which will increasingly take the bigger sections of the pie. China oil consumption by sector (2015)
Source: IEA, DBS Bank Boost from strategic reserves may be short lived though. We believe the strength in Chinese oil demand since 2015 and even in 1H16 may be partly driven by the government’s strategy of filling up strategic reserves taking advantage of the low oil prices. The Chinese government rarely releases any numbers on strategic reserves, but press reports indicate that the goal is to build up reserves of around 500mmbbls by 2020. It is unclear how much capacity has been built till now, but it announced that strategic reserves had almost doubled within a year to close to 200mmbbls at end-2015. By the end of 2016, reserves could be filled up to current capacity levels, which would not leave much upside on the table. Thus, we expect oil demand from China in 2017 to slow down a notch from 2016 levels.
7%
8%
9%
10%
11%
12%
13%
6,000
7,000
8,000
9,000
10,000
11,000
12,000
05 06 07 08 09 10 11 12 13 14 15
China Petroleum Consumption (mbpd)
% global consumption from China
CAGR 5.2%
Petrochem19%
Road Transport
22%
Aviation5%
Industrial Use29%
Others25%
0500
1,0001,5002,0002,5003,0003,5004,0004,5005,000
05 06 07 08 09 10 11 12 13 14 15 16F 17F
India Petroleum Consumption (mbpd)
-
5
10
15
20
25
2010-11 2011-12 2012-13 2013-14 2014-15 2015-16
million units
Passenger Vehicles Commercial VehiclesThree Wheelers Two Wheelers
CAGR 5.7%
Page 12
Regional Industry Focus
Oil and Gas
Page 13
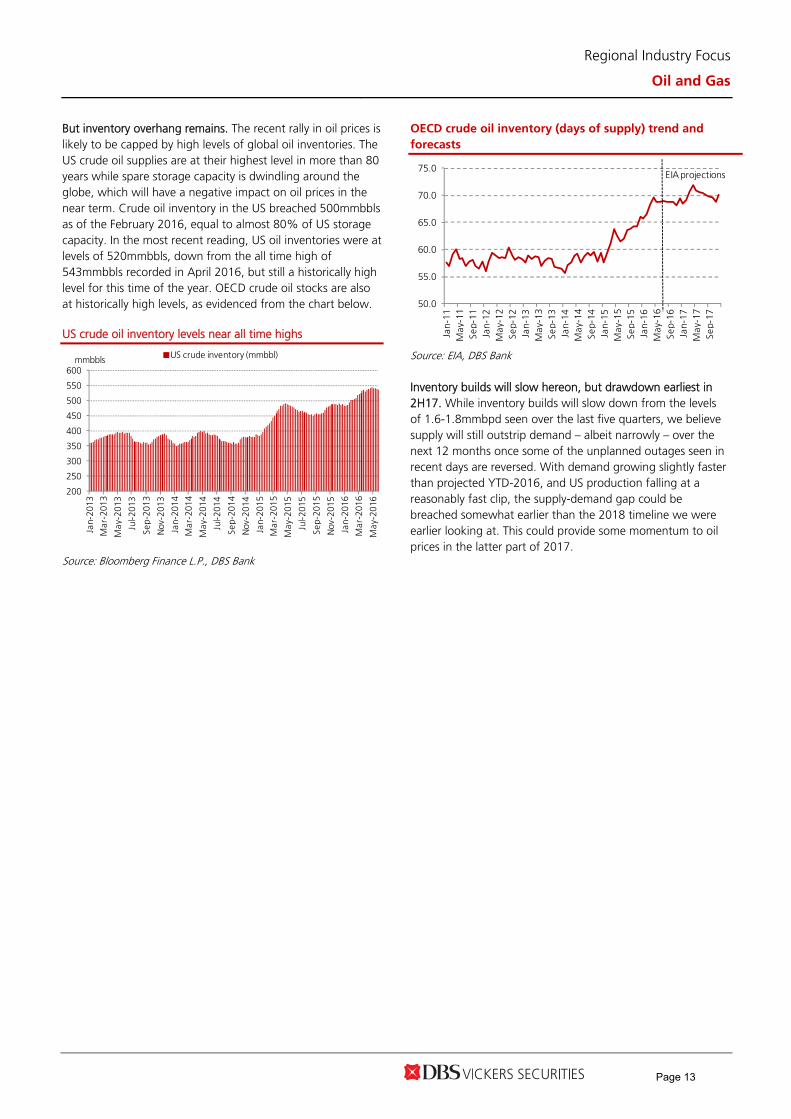
But inventory overhang remains. The recent rally in oil prices is likely to be capped by high levels of global oil inventories. The US crude oil supplies are at their highest level in more than 80 years while spare storage capacity is dwindling around the globe, which will have a negative impact on oil prices in the near term. Crude oil inventory in the US breached 500mmbbls as of the February 2016, equal to almost 80% of US storage capacity. In the most recent reading, US oil inventories were at levels of 520mmbbls, down from the all time high of 543mmbbls recorded in April 2016, but still a historically high level for this time of the year. OECD crude oil stocks are also at historically high levels, as evidenced from the chart below. US crude oil inventory levels near all time highs
Source: Bloomberg Finance L.P., DBS Bank
OECD crude oil inventory (days of supply) trend and
forecasts
Source: EIA, DBS Bank Inventory builds will slow hereon, but drawdown earliest in 2H17. While inventory builds will slow down from the levels of 1.6-1.8mmbpd seen over the last five quarters, we believe supply will still outstrip demand – albeit narrowly – over the next 12 months once some of the unplanned outages seen in recent days are reversed. With demand growing slightly faster than projected YTD-2016, and US production falling at a reasonably fast clip, the supply-demand gap could be breached somewhat earlier than the 2018 timeline we were earlier looking at. This could provide some momentum to oil prices in the latter part of 2017.
50.0
55.0
60.0
65.0
70.0
75.0
Jan-
11M
ay-1
1Se
p-11
Jan-
12M
ay-1
2Se
p-12
Jan-
13M
ay-1
3Se
p-13
Jan-
14M
ay-1
4Se
p-14
Jan-
15M
ay-1
5Se
p-15
Jan-
16M
ay-1
6Se
p-16
Jan-
17M
ay-1
7Se
p-17
EIA projections
200
250
300
350
400
450
500
550
600
Jan-
2013
Mar
-201
3
Ma y
-201
3
Jul-2
013
Sep-
2013
Nov
-201
3
Jan-
2014
Mar
-201
4
Ma y
-201
4
Jul-2
014
Sep-
2014
Nov
-201
4
Jan-
2015
Mar
-201
5
May
-201
5
Jul-2
015
Sep-
2015
Nov
-201
5
Jan-
2016
Mar
-201
6
Ma y
-201
6mmbbls US crude inventory (mmbbl)
Page 13

Regional Industry Focus
Oil and Gas
Page 14
Summary of the impact of the key structural issues so far
Key Issues What has happened since our last report Impact
OPEC Response No curb on production; official production target remains discarded as seen during the last two general meetings; not a good sign as far as supply is concerned. Production has consistently been above 32mmbpd since 2H15, higher than the earlier 30mmbpd cap set by member nations. Earlier talks of a production “freeze” led by Saudi and Russia have completely fallen through.
Profile of US shale production
Shale oil production in the US has been declining gradually since April 2015. Overall US production expected to decline by 0.6mmbbls in 2016 and 0.2mmbls in 2017. The sharp and continuous decline in number of shale rigs has only recently come to a halt, but the trend will need to be closely monitored.
However, increased productivity per well, lower costs and relatively short lead time of bringing unfinished wells into production means that shale production is flexible and can adjust to oil price movements faster than conventional oil. This can cap eventual oil price recovery.
Inventory buildup US crude inventories continue to be near record levels. Overall OECD inventory levels also continue to rise and spare storage capacity is dwindling across the globe. This will thus continue to exert pressure on oil prices in the near future. While inventory drawdowns are expected to start around 2H17, it could take up to three years to reach historical normalised levels. Thus, a sharp recovery in oil price beyond 2017 seems unlikely.
Structural changes in global oil demand
Lower oil prices have not resulted in any significant pickup in demand in the developed world. Climate change concerns, move towards cleaner emissions also weigh on incremental fossil fuel use. A balance in demand-supply could only be achieved in the later part of 2017 and beyond, based on current estimates.
Role of China and India in oil demand
China is still expected to add close to 0.4mmbpd incremental oil demand in 2015/16, but will likely lose the biggest incremental oil consumer tag to India. The ongoing transition to a service-based economy will have repercussions on oil demand but opportunistic additions to strategic reserves continue to support Chinese oil imports in 2016. India is meanwhile emerging as the leader for oil demand, and demand from both countries has been better than expected YTD in 2016.
US dollar strength The US dollar index has been climbing since Brexit concerns have led to a flight from the GBP and Euro currencies. Expectations of US rates are also rising, and hence the corresponding strength in US dollar could be further negatives for oil price.
Geopolitical issues Disruptions to oil supply chain in Nigeria and Libya have already led to significant unplanned outages in 2Q16. Further escalation of tensions in these areas, as well as in the Middle East could lead to higher oil prices.
Response from global oil majors
Capex budgets have already been cut substantially since the oil price collapsed. Oil majors have reduced capex by 35% on average when comparing 2016 budgets with 2014. Wood Mackenzie estimates that close to US$1trillion of global upstream investment will have been cut from 2015-2020. This should help oil prices rise faster towards the end of the decade.
Source: DBS Bank
Page 14

Regional Industry Focus
Oil and Gas
Page 15
E&P and Refineries: Winners and losers of oil price rebound
E&P companies are direct winners but this is largely priced in. Oil price recovery would directly benefit E&P companies, especially those with a higher portion of liquid products (crude oil and condensate) as there is usually a time lag for natural gas price adjustments, based on the long-term pricing formula. For instance, with liquid products accounting for only 30% of its total volume, PTTEP’s average selling price (ASP) has declined by 46% during 2014-1Q16 while Dubai oil price weakened 71% in the same period. Hence, the benefits from rising oil prices could be lower than those with a higher portion of liquid products, whose selling prices are directly linked to crude oil prices. For PTTEP, it normally takes 6-12 months for natural gas selling prices to reflect oil price changes. The benefits of higher oil prices could be diluted by higher operating cost, as cost negotiations with service companies would be more difficult. PTTEP’s average selling price vs. Dubai crude oil price
0
20
40
60
80
100
120
1Q14 2Q14 3Q14 4Q14 1Q15 2Q15 3Q15 4Q15 1Q16
PTTEP's average selling price Dubai oil priceUS$/BOE, US$/bbl
Source: PTTEP, Bloomberg Finance L.P., DBS Bank Risk of asset impairments is likely to ease. E&P companies could also benefit from lower risk of impairment charges that they faced during the oil price downtrend from mid-2014 to late-2015. Note that PTTEP booked impairment charges of US$2.4bn in 2014-15, mainly for its high-cost overseas assets, accounting for c.10% of its total assets. Nonetheless, these impairment charges would not be reversed when oil prices rise but will be recognised as higher revenue from higher selling prices. The correlation between oil prices and share prices of companies in the E&P sector has declined recently from >90% to 85%±, as the market has turned more bullish on them, which could be driven by higher oil prices. We believe current share prices have largely priced in the positive impact on earnings prospects. The upside to share price should be limited in the near term until there is a demand-supply rebalancing that takes place in 2H16, as demand growth would signal a more bullish trend.
High correlation between oil and PTTEP’s share price
0
20
40
60
80
100
120
140
0
20
40
60
80
100
120
140
160
180
200
Jan-12 Jan-13 Jan-14 Jan-15 Jan-16
PTTEP share price Brent oil price (RHS)
Bt/share US$/bbl
Source: Bloomberg Finance L.P., DBS Bank Lower gross refining margin could be offset by stock gains. Oil refiners could benefit from higher oil prices in the near term, mainly from inventory gains as crude oil prices have increased by nearly US$10/bbl from the end of 1Q16. We estimate that these companies could book stock gains of c.US$3/bbl in 2Q16. This would offset lower gross refining margins (GRM) during the quarter of US$2.7/bbl, based on Singapore GRM of Hydrocracking Unit over Dubai crude oil. Nonetheless, higher crude oil prices mean lower margins for oil refiners due to higher processing cost, mainly for fuel used in refinery, and losses in the process. This accounts for 3-6% of total crude intake, depending on the integration of the process. The wider spread for light-heavy crude oil would also increase the processing cost of oil refiners, as most Asian oil refiners still require lighter crude to achieve higher yield of light to middle distillates products (gasoline, diesel and jet fuel). As light crude oil supply enters the market at a slower pace on the back of a decline in US shale oil production, the spread of light and heavy crude oil has widened from an average US$1.2/bbl in 2015 to US$3.4/bbl in 1H16. Light-heavy crude spread
-1
0
1
2
3
4
5
6
Jan-13 Jun-13 Nov-13 Apr-14 Sep-14 Feb-15 Jul-15 Dec-15 May-16
US$/bbl
Source: Energy Policy and Planning Office, DBS Bank
Page 15

Regional Industry Focus
Oil and Gas
Page 16
Impact of lower oil prices on Thailand E&P companies and refineries
Segment/ company
Impact
Earnings sensitivity to
+US$1 change in oil
price
Share price correlation to oil price (6-month)
E&P
PTTEP PTTEP’s earnings would be bolstered by higher oil prices, as 30% of its total sales volume is liquid products (crude oil and condensate), whose prices are linked to Dubai crude oil price (+37% YTD). Assuming a decline of gas price from US$6.09/mmbtu in 1Q16 to c.US$5.9/mmbtu in 2Q16, we estimate its average selling price to increase by 7% q-o-q to US$37.4/BOE. The pricing formula of its gas product is 30% linked to fuel oil price, with a time lag of 6-12 months (which varies for each producing field). The next major price adjustment in Oct 16 is for its key operating assets, i.e. Bongkot and Arthit gas fields. With a higher average Brent oil price assumption of US$45-55/bbl for 2016-18F vs US$35-45/bbl previously, we have revised up our earnings estimates for 2016/17/18F by 80%/73%/58%. We assume that the company’s efforts to reduce operating cost when oil prices are low could sustain its low operating cost, hence the impact of higher oil prices on profitability could be substantial. Our 12-month TP was raised to Bt86/share to reflect this positive development for oil prices, based on DCF valuation with a long-term Brent oil price assumption of US$60/bbl. We upgrade our rating from FULLY VALUED to HOLD.
+5% to +8% 89%
Integrated
PTT PTT could also benefit from 67%-owned PTTEP’s higher earnings performance. Despite increasing oil prices, we estimate that profit contribution from PTTEP could remain low at only c.11-12% of PTT’s net profit in 2016-18F, compared with 35% prior to the recent decline of oil prices from 2H14 to Jan 16. The gas business would continue to play a vital role in bolstering PTT’s profitability during the next three years, partly supported by the liberalisation of domestic fuel prices, mainly LPG and NGV. We have revised up our 2016-187F earnings forecast of PTT by 9%-11% to factor in higher oil price assumptions. Our TP is also raised from Bt320 to Bt370/share, based on sum-of-parts. Our TP implies an undemanding valuation at only 11.4x P/E in 2017F, which represents its 5-year average PE multiple. Maintain BUY.
+0.6% to +0.9% 94%
Refinery
BCP BCP would benefit from stock gains, like its peers but among the oil refiners in Thailand, BCP would be less vulnerable to changes in oil price than its peers, thanks to more stable income from the oil marketing and renewable power businesses. Higher oil prices could be positive for its E&P business and reduce the downside risk from impairment charges. We believe that BCP would benefit from stock gains at a higher magnitude than its peers due to its low-cost inventory, given the planned shutdown during 1Q16. We maintain our earnings forecast for 2016-18F as higher oil prices would have a marginal impact on its operating cost. We also maintain our TP of Bt39/share, based on sum-of-parts, and BUY rating. It is our preferred play for Thailand’s oil refining sector in view of its attractive valuation and dividend yield.
-0.6% -16%
IRPC We estimate that IRPC’s earnings could be affected by higher crude oil prices, especially for light crude oil as the company has to import lighter crude oil to feed to its refinery in order to gain feedstock for its petrochemical complex. The wider spread between light and heavy crude would reduce its cost competitiveness, compared with peers. In addition, higher naphtha prices could hurt its petrochemical product spread. Nonetheless, this could be offset by the operation start-up of its fuel-oil upgrading unit under the Upstream Project For Hygiene And Value Added Products (UHV) project. The upgraded unit would reduce fuel oil output to only 8% of total capacity and enable the company to utilise its oil refinery and petrochemical complex more efficiently. The new facility will increase IRPC’s flexibility in selecting more types of crude oil, including heavy crude, without hurting its product spread and operating margin. We maintain our HOLD rating. As we roll over our valuation, based on 1.3x P/BV, to mid-2017, our TP rises to Bt5.3/share.
-1.6% to -2% 75%
PTTGC Apart from stock gains from higher oil prices, we believe PTTGC should also benefit from higher petrochemical product prices, which normally track oil prices. We also expect the company’s inventory gains in 2Q16 to outperform its peers, given the low-cost crude oil inventory that it acquired ahead of the planned shutdown. Operations-wise, the impact on PTTGC’s earnings should be less severe than TOP because of lower earnings contribution from the refinery business at c.20% of total EBITDA, vs. 73% from the petrochemical business. We think that higher oil prices should favour gas crackers whose feedstock is more competitive than naphtha crackers. We maintain our earnings forecasts for 2016-18F as well as our TP of Bt70, based on 1.3x P/BV. Maintain BUY.
+1% to +1.2% 85%
TOP TOP’s earnings could benefit from rising crude oil prices due to inventory gains in absolute terms. This could provide upside to our earnings forecasts if the higher oil prices are sustained throughout this year. Excluding this impact, we estimate that every US$1 increase in oil prices will erode TOP’s earnings by 1.6-2.6% in 2016-18F, given that its operating unit cost could increase by US$0.03/bbl for every US$1/bbl increase in oil prices. Nonetheless, we estimate that higher oil prices and a wider spread between light and heavy crude oil would affect TOP in the medium term, due to higher fuel costs for its refinery and petrochemical complex. Note that light crude accounts for at least 60% of its total crude intake. We upgrade our rating from FULLY VALUED to HOLD, as we roll over our valuation, based from its average P/BV multiple of 1.3x, to mid-2017 – thus resulting in a higher TP of Bt63/share. We think that the near-term positive impact of higher oil prices on its earnings should be largely priced in.
-1.6% to -2.6% 8%
Source: DBS Bank
Page 16

Regional Industry Focus
Oil and Gas
Page 17
Rigbuilders – is it time to turn positive? NOT YET. While stocks are trading near AFC valuations, there remain uncertainties revolving the extent of damage from Brazil and potential customer default. In addition, rig orders – the key earnings driver for shipyards, are unlikely to return in the next 1-2 years amidst an unprecedented supply glut. A turnaround for rig orders to return requires the acceleration of rig retirement, cancellations of speculative build and higher oil prices.
Valuations near AFC levels
Trading below -2SD. In this downturn, Keppel and SMM’s valuations have been hammered to 2SD below mean valuations, at 0.8x and 1.3x respectively, back to the levels similar to late 1990s post AFC. What’s in the price? Current price levels have probably reflected the bankruptcy of Sete Brasil, a long rigbuilding winter, i.e. low rig orders amid prolonged low oil prices and rig glut, deferments, and cancellations in isolated cases.
Keppel’s PB vs ROE
Source: Bloomberg Finance L.P., DBS Bank
-10%
-5%
0%
5%
10%
15%
20%
25%
30%
35%
0
1
2
3
4
5
6
P/B 1-year forward ROE (%)
(x)
Global financial crisis
Re cession in EU and US
Asian finanical crisis, OPEC excess production
OECD recession
1991 Gulf War, re versal of oil price
spike
Current crisis
Page 17

Regional Industry Focus
Oil and Gas
Page 18
SMM’s PB vs ROE
Source: Bloomberg Finance L.P., DBS Bank Concerns
Are provisions adequate? We estimate that a discount of up to 35% of contract values has been factored in SMM’s S$280m provision for non-Sete projects, which seems sufficient at this point. Keppel could be under pressure to recognise initial provisions for the non-Sete projects, and this could be up to S$200m based on our back-of-the-envelope calculation.
For Sete projects, we believe the milestone payments at ~35% of total contract value, offers a good buffer for the seven units at the advanced stages, thus preventing Sete’s stakeholders from cancelling. Cancellations risks are higher for the six units that are at the <20% completion stage. Singapore rigbuilders hold the view that the provisions made are sufficient to cover the liability to vendors at this point. While the assumptions behind the provisions are not disclosed, in case of cancellations, we believe some flexibility, in terms of equipment delivery and payment etc, could be granted in times like these, out of long-term business relationships.
Provisions made by Singapore rigbuilders
Company Impairment/provisions in 4Q15
Methodology More to come
Shipyards Keppel Corp S$230m for Sete Brasil
projects Net realisable value of rigs under construction, after assessing the construction progress, payments received, payments to vendors and market value of rigs.
Further provisions possible on Sete Brasil rigs; In addition, Keppel has yet to make any provisions for non-Sete projects, which we estimate could be up to US$200m for some of the riskier projects from Grupo R, Fecon and Clearwater.
Sembcorp Marine
S$329m for Sete Brasil projects; and S$280m for non-Sete rigs
Net realisable value of rigs under construction, after assessing the construction progress, payments received, payments to vendors and market value of rigs.
Further provisions possible on Sete Brasil rigs; We believe SMM has made adequate provisions for non-Sete units that are at risk.
Source: Company, DBS Bank
-20%
-10%
0%
10%
20%
30%
40%
50%
0
1
2
3
4
5
6
7
1990
1991
1992
1993
1994
1995
1996
1997
1998
1999
2000
2001
2002
2003
2004
2005
2006
2007
2008
2009
2010
2011
2012
2013
2014
2015
2016
P/B 1-year forward ROE
(x)
Global financial cr isis
Recession in EU and US
Asian finanical crisis,OPEC excess production
OECD recession
1991 Gulf War, re versal of oil price
spike
Current crisis
Page 18

Regional Industry Focus
Oil and Gas
Page 19
Keppel’s outstanding rig orderbook
Date announced
Type of rig / vessel Contract Value, (S$ m)
Orignal Delivery
Rescheduling Customer Comment
SEMI-SUBMERSIBLEs 4-Jun-13 DSS 38M semisubmersible rig 720.0 4Q16 SOCAR
20-Aug-13 KFELS SSAU5000NG accommodation semi 355.6 4Q15 2016 Floatel 22-Dec-11 DSS 38E semisubmersible rig 1,043.6 4Q15 Deferred Sete Brasil
Sete Brasil filed for chapter 11. Keppel has made S$230m provision in 4Q15
7-Aug-12 DSS 38E semisubmersible rig 1,030.0 4Q16 Deferred Sete Brasil
7-Aug-12 DSS 38E semisubmersible rig 1,030.0 3Q17 Deferred Sete Brasil
7-Aug-12 DSS 38E semisubmersible rig 1,030.0 2Q18 Deferred Sete Brasil
7-Aug-12 DSS 38E semisubmersible rig 1,030.0 4Q18 Deferred Sete Brasil
7-Aug-12 DSS 38E semisubmersible rig 1,030.0 3Q19 Deferred Sete Brasil
Actual Provision 230
JACK-Ups 21-Nov-13 KFELS Super A class 330.5 2Q16 2Q18 Ensco PLC One of the largest international drillers
28-Mar-13 KFELS B Class jackup rig 254.7 3Q15 2Q17 Grupo R Pending charter contract from Pemex
28-Mar-13 KFELS B Class jackup rig 254.7 4Q15 2Q17 Grupo R 15-Jul-13 KFELS B Class jackup rig 260.0 4Q15 2Q17 Grupo R 2-Aug-13 KFELS B Class jackup rig 261.6 4Q15 2Q17 Parden Small Mexican player 1-Oct-13 KFELS B Class jackup rig 276.3 4Q15 2016 Clearwater Clearwater Capital
concluded sale of the unit to Arabian Drilling Company in May-2014
1-Oct-13 KFELS B Class jackup rig 276.3 1Q16 3Q17 Clearwater 3-Mar-14 KFELS N class plus 633.9 1Q17 4Q17 TS Offshore Backed by an
international operator (COSL) which was Keppel's customer
13-Feb-14 KFELS B class 274.3 3Q16 2Q17 Fecon International New entrant, established by experienced PE fund (intrepreneur A.P. Dobrov) and an operator that is an existing customer of Keppel
13-Feb-14 KFELS B class 274.3 4Q16 3Q17 Fecon International 13-Feb-14 KFELS B class 274.3 4Q16 4Q17 Fecon International
7-Nov-13 KFELS Super B class
273.5 1Q16 1Q20 Transocean
One of the largest international drillers
7-Nov-13 KFELS Super B class 273.5 2Q16 2Q20 Transocean 7-Nov-13 KFELS Super B class 273.5 4Q16 3Q20 Transocean 7-Nov-13 KFELS Super B class 273.5 1Q17 4Q20 Transocean 7-Nov-13 KFELS Super B class 273.5 3Q17 1Q21 Transocean 31-Oct-14 KFELS Super B class 306.8 4Q16 1Q17 BOT Lease Co., Ltd Backed by Japanese
bank
Est. provision 213
Land Rig 29-Dec-14 Land drilling rig 132.3 mid-2016 CDC
Source: Company, DBS Bank
Page 19

Regional Industry Focus
Oil and Gas
Page 20
SMM’s outstanding rig orderbook
Date announced
Type of rig / vessel(s) Value, Est (S$ m)
Original Delivery
Rescheduling Customer Comment
Drillship 6-Feb-12 Drillship - Jurong Espadon design 983.0 2Q15 Deferred Sete Brasil
Sete Brasil filed for chapter 11. SMM made provision of S$329m in 4Q15
8-Aug-12 Drillship - Jurong Espadon design 1,008.0 4Q16 Deferred Sete Brasil
8-Aug-12 Drillship - Jurong Espadon design 1,008.0 3Q17 Deferred Sete Brasil
8-Aug-12 Drillship - Jurong Espadon design 1,008.0 2Q18 Deferred Sete Brasil
8-Aug-12 Drillship - Jurong Espadon design 1,008.0 4Q18 Deferred Sete Brasil
8-Aug-12 Drillship - Jurong Espadon design 1,008.0 2Q19 Deferred Sete Brasil
29-Nov-12 Drillship - Jurong Espadon design 991.9 3Q16 Deferred Sete Brasil
27-Feb-14 Drillship - Jurong Espadon III design 684.1 2Q17 1Q20 Transocean Reputable client; Market could have recovered then
27-Feb-14 Drillship - Jurong Espadon III design 684.1 1Q18 3Q20 Transocean Reputable client; Market could have recovered then
Provision made in 4Q15 329
Semi-submersible 3-Apr-12 Harsh-environment ultra-deepwater
semi-submersible rig 712.8 1Q2015 1Q17 Seadrill 35% discount to contract
value; buffered by 20% downpayment. Est provision of S$100m
12-Sep-13 Semi-submersible Well Intervention Rig 438.1 mid-2016 Helix 15-Jul-15 Semi-submersible crane vessel 1,292.0 4Q18 Heerema New orders in 2015; delivery
date still far away
Est. provision 100
1,307.8 Jackup 28-Feb-13 Baker Marine Pacific Class 400 jackup rig 257.9 2Q 2015 Technically
accepted in 1Q16
Perisai
Est. provision of S$130m
31-Dec-13 Baker Marine Pacific Class 400 jack up 268.0 3Q2016 Deferred Perisai 18-Mar-13 Baker Marine Pacific Class 400 jackup rig 260.6 End 1Q
2015 Technically accepted in
1Q16
Oro Negro
1-Jul-13 Baker Marine Pacific Class 400 jackup rig 260.6 Jul-15 4Q16 Oro Negro 1-Jul-13 Baker Marine Pacific Class 400 jackup rig 260.6 3Q2015 4Q16 Oro Negro 26-Feb-14 Baker Marine Pacific Class 400 jackup rig 270.9 4Q15 Terminated Marco Polo Est.provision = apporx. 20% of
value or S$50m. 3-Nov-14 Baker Marine Pacific Class 400 jackup rig 306.8 Jan-2017 BOT Lease Backed by Japanese bank
Est. provision 180
Source: Company, DBS Bank
Page 20

Regional Industry Focus
Oil and Gas
Page 21
Catalysts
We await better clarity before turning more positive on the rigbuilding sector. Traditionally, the leading indicators are oil prices and order flows. Oil price recovery. It is widely anticipated that oil prices below US$60/bbl will do little to help to spur demand for newbuild rigs considering the current low utilisation rate of <60% and orderbook-to-fleet ratio of 15-20%. Nevertheless, it could help to reduce deferment and cancellation risks and drive recovery of the sector.
Will history repeat itself? We believe the 1997-2000 period during the AFC is the best historical reference point for comparison. Oil prices were hovering at low levels at US$30-50/bbl (inflationary-adjusted) till mid-2000s, having collapsed >60% from peak. Rigbuilders were churning high single to low teen EBIT margins and ROEs, similar to current results. During 1998-2000, Keppel traded at 0.7-1.0x PB while SMM at 1.1-1.3x on average, before rising to 1.5-1.8x PB during 2003-2004 alongside the strong recovery in oil prices.
Historical trend of oil prices vs rigbuilders’ performance (1997-2004)
1997 1998 1999 2000 2001 2002 2003 2004 OIL PRICE Brent Crude Oil Price (US$/bbl) Average 19.3 13.3 18.0 28.5 24.9 25.0 28.5 38.0 High 24.8 16.6 26.1 34.6 29.9 30.2 34.1 51.6 Low 16.5 9.6 10.1 21.3 17.7 18.4 23.3 28.8
Inflationary Adj Brent Crude Oil Price (US$/bbl)* 2015=100 Average 28.5 19.4 25.7 39.3 33.3 33.0 36.7 47.7 High 36.6 24.1 37.1 47.6 40.0 39.7 43.9 64.7 Low 24.4 14.0 14.3 29.3 23.7 24.3 30.0 36.2 CPI 67.7 68.8 70.3 72.7 74.7 75.9 77.6 79.7
Keppel Corp P/Bv (x) Average 1.3 0.7 1.0 0.8 0.9 1.1 1.3 1.8 High 1.8 1.0 1.3 0.9 1.0 1.2 1.5 2.1 Low 0.9 0.9 0.8 0.7 0.7 0.8 1.0 1.6 ROE (%) 5.0% -6.8% 6.3% 6.0% 12.5% 13.5% 14.2% 15.5% O&M EBIT margins (%) 11.4% 12.9% 10.1% O&M EBIT growth rate (%) 135% 142% -13% 31% EBIT margins (%) 14% -6% 16% 11% 10.6% 8.4% 8.5% 10.3% EBIT growth rate (%) -8% nm nm 8% -38% -26% 9% -19%
Sembcorp Marine P/Bv (x) Average 1.2 1.3 1.3 1.1 1.3 1.4 1.5 1.5 High 1.6 1.4 1.5 1.3 1.5 1.7 1.7 2.0 Low 1.1 0.2 1.1 1.0 1.0 1.2 1.3 1.3 ROE (%) 6.5% 8.9% 9.5% 9.3% 9.1% 9.9% 8.4% 9.9% O&M EBIT margins (%) 8.2% 8.1% 9.9% 10.4% 9.7% 8.9% 7.0% 6.8% O&M EBIT growth rate (%)
62% 40% 21% -22% 5% 8% -17% 25%
Source: Companies, Bloomberg Finance L.P., DBS Bank
Page 21

Regional Industry Focus
Oil and Gas
Page 22
Historical trend of oil prices vs rigbuilders’ performance (2005-present)
2005 2006 2007 2008 2009 2010 2011 2012 2013 2014 2015 2016E OIL PRICE Brent Crude Oil Price (US$/bbl) Average 55.3 66.1 72.7 98.5 62.7 80.3 110.9 111.7 108.7 99.4 53.6 45.0 High 67.7 78.3 95.8 146.1 79.7 94.8 126.7 126.2 118.9 115.1 67.8 52.5 Low 40.5 57.9 51.7 36.6 39.6 69.6 93.3 89.2 97.7 57.3 36.1 27.9
Inflationary Adj Brent Crude Oil Price (US$/bbl)* 2015=100 Average 67.1 77.7 83.1 108.5 69.2 87.3 116.9 115.3 110.6 99.6 53.6 44.3 High 82.2 92.1 109.5 160.8 88.0 103.0 133.5 130.3 121.0 115.2 67.8 51.7 Low 49.2 68.0 59.1 40.3 43.7 75.6 98.3 92.1 99.4 57.4 36.1 27.4 CPI 82.4 85.1 87.5 90.8 90.5 92.0 94.9 96.9 98.3 99.9 100.0 101.6
Keppel Corp P/Bv (x) Average 2.5 2.8 3.9 2.7 1.9 2.3 2.5 2.2 2.1 1.9 1.3 0.9 High 2.9 3.4 4.8 3.7 2.3 2.7 2.9 2.5 2.3 2.1 1.6 1.1 Low 2.1 2.5 3.0 1.2 1.3 2.0 2.0 2.0 1.9 1.5 1.1 0.8 ROE (%) 16.7% 19.1% 24.0% 22.4% 30.7% 24.4% 27.6% 26.4% 19.5% 18.8% 14.2% 9.6% EBIT margins (%)
8.2% 10.6% 10.1% 10.5% 12.3% 17.0% 28.0% 18.8% 17.2% 17.9% 14.7% 16.7%
EBIT growth rate (%)
14% 72% 31% 18% 22% 3% 81% -7% -19% 11% -36% -20%
Sembcorp Marine P/Bv (x) Average 3.3 4.0 4.6 4.4 3.7 4.1 4.1 4.3 3.7 3.0 1.9 1.3 High 4.4 4.7 6.4 6.0 4.8 4.6 5.1 4.7 4.1 3.4 2.3 1.5 Low 2.0 3.5 3.5 1.9 2.1 3.5 3.1 3.4 3.5 2.2 1.2 1.2 ROE (%) 11.9% 19.8% 16.0% 28.7% 43.7% 38.4% 30.0% 22.2% 21.7% 19.9% -10.6% 8.7% O&M EBIT margins (%)
5.9% 6.4% 7.7% 9.9% 15.1% 20.7% 18.6% 12.5% 11.4% 12.1% -3.0% 11.6%
O&M EBIT growth rate (%)
34% 83% 53% 44% 72% 9% -22% -25% 14% 12% -121% nm
Source: Companies, Bloomberg Finance L.P., DBS Bank Vessel Delivery Not all doom and gloom….some successful deliveries as well. YTD, Keppel has delivered four jackup rigs to Gulf Drilling International (GDI) as well as Mexican drillers – Grupo R and Perforadora Central - while SMM delivered the ultra high specification jackup rig to international driller, Noble Corp and JU2000 jackup rig to Maersk (acquired from Hercules). We observed that these rigs had back-to-back charter contracts, or committed sources of funding. Nevertheless, it is encouraging to see oil majors and drillers honouring their contracts despite the challenging environment. Delivery from existing orderbooks is deemed positive for rigbuilders.
Singapore rigbuilders: Delivery of jackup rigs 2016-YTD
Date announced
Type of rig /
vessel(s)
Contract value
(US$ m)
Original Delivery
Actual Delivery
Customer
Keppel 16-Sep-14 KFELS B
class 227 1Q16 Jan-16 Gulf
Drilling Int
28-Mar-13 KFELS B class
205 2Q15 Mar-16 Grupo R
28-Mar-13 KFELS B class
205 3Q15 Mar-16 Grupo R
10-Oct-13 KFELS B class
240 4Q15 Jul-16 Perforadora Central
SMM 21-May-14 F&G JU
2000E 236 2Q16 May-16 Maersk
28-May-13 Gusto MSC CJ70
596 1Q2016 Jul-16 Noble Corp
Source: Companies, DBS Bank
Page 22

Regional Industry Focus
Oil and Gas
Page 23
New orders Iran is reportedly placing newbuild orders for 10 jackup rigs at US$200m each. Russia’s Krasnye Barrikady yard is believed to have signed a deal worth nearly US$1bn to build five offshore rigs to be used in Iran’s sector of the Persian Gulf shelf, while Daewoo Shipbuilding & Marine Engineering (DSME) is also said to be negotiating contracts for at least five jack-up rigs for Iran. The implied price tag of US$200m per rig seems decent. Rig orders unlikely to return in the next 1-2 years. While we do not expect rigbuilding orders to return in a big way soon, the continuous demand for other offshore platforms for development and production, as well as specialised vessels will keep orders flowing in the meantime, albeit small and is insufficient to replace the loss in rig demand. YTD, Singapore rigbuilders have secured c. US$500m worth of non-rig orders.
Trend towards smaller offshore platforms
Singapore rigbuilders are more cost competitive… Relative to their Korean peers who have spilled red ink, Keppel and SMM continue to report positive earnings, though declining with lower orderbook drawdown. We believe the key differentiator are labour and overhead costs as over 70% of the construction cost of a rig, comprising the drilling equipment, other equipment / consumable materials and steel, are similar among shipyards. For instance, while Singapore rigbuilders have reduced their workforce by up to 25% last year in tandem with lower job activities, the Korean peers are constrained by the rigid labour market. … while flexibility and R&D provide the competitive edge. Singapore yards are highly regarded for their R&D efforts and flexibility on rig customisation. They remain the go-to specialists for repairs, conversion, and upgrading projects, which Korean yards tend to shy away from to avoid disruption to their production plans. We believe this gives Singapore rigbuilders an added advantage as O&G value chains strive on cost savings solutions for smaller offshore projects that are viable in the current oil price environment.
Singapore rigbuilders: New orders and orderbook
Source: Companies, DBS Bank
Page 23

Regional Industry Focus
Oil and Gas
Page 24
Oilfield Services: where are we in the cycle? Currently entering distress period – the cycle bottom will see M&As and consolidation
Source: DBS Bank, timeline adapted from WoodMackenzie Low-hanging fruit harvested; time to shed excess fat. Since the onset of the crisis in late-2014, we have seen the offshore oil & gas industry progress through several stages: i) First came the capex cuts, beginning at the top of the
value chain – the oil majors cut capex budgets by ~20% y-o-y in 2015 – then trickling downward as asset owners started to cancel orders, defer deliveries and scrap newbuilding plans.
ii) Players then began slashing opex – reduction in salaries and headcount, stacking of unchartered vessels/rigs have been the norm. For operators (Shell, ExxonMobil etc), this also meant a push for lower dayrates from contractors, who have reluctantly accepted due to low bargaining power.
iii) Next was the wave of joint ventures and partnerships, where players attempted to achieve synergies and expand their market reach. For example, Vard has leveraged on its parent Fincantieri’s cruiseship expertise to secure hull fabrication work for Fincantieri as well as securing letters of intent (LOIs) for exploration cruise vessels, which Fincantieri has prior experience.
Currently entering the distressed portion of the cycle; bankruptcies have accelerated. Since March this year, oil & gas bankruptcies in North America – which we use as an (admittedly) imperfect proxy to global oil & gas bankruptcies – have increased sharply, with May seeing the number of filings crossing 20 for the first time since the beginning of the oil
price collapse. Arguably many of these companies were over-leveraged shale producers, however oilfield services companies have also seen an equally sharp spike in bankruptcy filings.
North American O&G bankruptcies – on the uptrend
Source: Haynes and Boone, LLP
Distressed situations ex North America have picked up this year as well. In Singapore, the oil & gas industry has seen its first two Events of Default (EOD) from listed oil & gas-related companies: AusGroup breached its bond covenant calling for minimum shareholder’s equity of AU$160m due to impairments taken on its inventory, Property, plant and equipment (PP&E), goodwill and receivables, and is now seeking bondholder approval for a waiver of this covenant. Meanwhile Technics Oil & Gas has placed itself under judicial management after reportedly receiving writ of summons on loans totalling S$16.7m from its former director, Hup Seng Offshore Engineering, and its landlord Soilbuild REIT.
BankruptciesM&A/
ConsolidationDebt Restructuring/ Fi re Sale of Assets
Reduced Investment
Streamlining of operations/cost cutting
JVs /Partnerships
•Ezra’s subsea JV with Chiyoda (end-2015);
•Vard’s strategic partnership with parent Fincantieri for cruise vessel construction work (1Q16);
•POSH’s JV with Hmood Al-Khalaf Group to expand presence in the Middle East (1Q16)
• Regional OSV players have cut opex by 20-30% on average. But opex reductions have a limit.
• E.g. we estimate that Wintermarreduced its cash opex by 21% from FY14 to FY15.
• Oil majors have reduced capex by 35% on average when comparing 2016 spend vs. 2014.
• Regional service players have also cut back on newbuilding plans and deferred delivery of vessels
• With cash flows drying up and additional financing becoming increasingly expensive, companies attempt to restructure debt and sell assets to weather the downturn.
•E.g. AusGroup has breached its bond covenant and is seeking a waiver. It is also trying to sell its access and scaffolding business to provide cash flows.
Current Phase
• O&G-related bankruptcies have accelerated in the US/North America in 2016.
• Bankruptcies elsewhere seem to be accelerating as well. (E.g. Technics Oil & Gas placed under judicial management, Harkand Group defaults on debt)
0
20
40
60
80
100
120
140
160
0
5
10
15
20
25
Jan-
15
Feb-
15
Mar
-15
Apr
-15
May
-15
Jun-
15
Jul-1
5
Aug
-15
Sep-
15
Oct
-15
Nov
-15
Dec
-15
Jan-
16
Feb-
16
Mar
-16
Apr
-16
May
-16
No of oilfield services bankruptcies No of oil producer bankruptcies
Cumulative no. of bankruptcies (RHS)
Page 24

Regional Industry Focus
Oil and Gas
Page 25
Distress is slowly surfacing in other areas of the world too, including Singapore
Singapore
Date Company Main business Credit event
29-Jul-16 Swiber Holdings Integrated offshore construction and support services provider
Default on bond; placed under judicial management
17-May-16 AusGroup Diverse range of fabrication, maintenance and other services mainly for the oil & gas sector
Breached bond covenant; seeking waiver
31-May-16 Technics Oil & Gas Limited Design and fabrication of process module and related systems for oil & gas
Placed under judicial management
Rest of the World
Date Company Main business Credit event
18-Aug-16 Perisai Petroleum Owner of offshore drilling, OSVs, offshore construction and offshore production facilities
Bondholder meetings being arranged
5-May-16 Harkand Group Oilfield services - subsea vessels Default on debt
12-Apr-16 Atlantic Offshore OSV owner To file for bankruptcy
31-Mar-16 DryShips Inc Bulk carriers and OSVs with 40% ownership in Ocean Rig (drilling contractor)
Breach of covenants; suspended interest and principal payments
15-Dec-15 Ultrapetrol Owner of vessels; mainly barges but has OSVs and product tankers as well
Missed interest payment in Dec'15; creditors agreed to restructure
4-Mar-15 Afren Plc Upstream crude production primarily in Nigeria Default on debt; missed interest payment.
Source: DBS Bank, Newswires
Page 25

Regional Industry Focus
Oil and Gas
Page 26
DEVELOPMENT OF THE KEY OIL PRODUCERS IN THE REGION: (I) INDONESIA
The waiting game
We think that Indonesian upstream E&P contractors have a high survival rate despite the volatile crude oil prices and Indonesia’s challenging industry dynamics –thanks to continuous efforts to boost operating and capital efficiency. Striving for higher
efficiency also implies that Indonesia’s existing E&P contractors have a low probability of default – coupled with our belief that these contractors are highly disciplined in managing their capital structure, seeking to maximise their cash generation to service their debts. This means that Indonesian upstream E&P players will start to benefit from the ongoing crude oil price recovery, with most of Indonesia’s operating oil and gas blocks (located mostly offshore) still generating positive cash margins.
Indonesian operating blocks’ opex (US$/BOE)
0 5 10 15 20 25 30 35 40 45 50
BP Muturi Holdings BV.BP Berau Ltd.
BP Wiriagar Ltd.Energy Equity Epic (Sengkang) Pty. Ltd.
Medco E&P Tomori Sulawesi ‐ JOBMobil Cepu Ltd.
Petronas Carigali Muriah Ltd.PT. Medco E&P Lematang
Conocophillips (Grissik) Ltd.Pearloil (Sebuku) Ltd.
Total E&P Indonesia ‐ JOATalisman Jambi Merang ‐ JOB
Kangean Energy Indonesia Ltd.Total E&P Indonesie
Manhattan Kalimantan Investment Pte. Ltd.Santos (Sampang) Pty. Ltd.
PT. Medco E&P Indonesia South SumatraPetrochina East Java ‐ JOB
EMP Bentu Ltd.Perusda Benuo TakaPT. PHE ONWJ Ltd.
PT. Odira Energy Karang AgungPremier Oil Natuna Sea BV.
Lapindo Brantas Inc.Conocophillips Indonesia Inc. Ltd.
Petrochina Inter. Jabung Ltd.PT. Chevron Pacific Indonesia
PT. Pertamina EPChevron Rapak Ltd.
PT. Medci E&P Indonesia TarakanOphir Indonesia (Bangkanai) Ltd.
PT. PHE NSBVirginia Indonesia Company (VICO), LLC.
PT. Medco E&P Indonesia RimauPT. PHE North Sumatera Offshore
PT. PHE WMOSantos (Madura Offshore) Pty. Ltd.
Talisman (Ogan Komering) Ltd. ‐ JOBMedco E&P Simenggaris Pty. Ltd. ‐ JOB
BOB ‐ PT. BSP Pertamina HuluSaka Indonesia Pangkah Ltd.
CNOOC S.E.S, Ltd.Petroselat Ltd.
PT. Sarana Pembangunan RiauPT. Pertamina Hulu Energi Siak
Citic Seram Energy Ltd.Petronas Carigali Ketapang II Ltd.
Star Energy (Kakap) Ltd.Petrochina Inter. (Bermuda) Ltd.
Chevron Makassar Ltd.Chevron Indonesia Company
Kalrez Petroleum (Seram) Ltd.Petrochina Salawati JOBCamar Res. Canada Inc.
Tately N.V.Pacific Oil & Gas (Kisaran) Ltd.
PT. PHE Kampar/PT. Medco E&P IndonesiaPetrochina Inter. Bangko Ltd.
Montd'or Oil Tungkal Ltd.EMP Malacca Strait S.A.PT. Tiarabumi Petroleum
PT. Sumatera Persada EnergiGolden Spike Energy Ind. ‐ JOB
PT. Tropik Energi PandanPT. Hexindo Gemilang Jaya
PT. EMP TongaPT. Sele Raya Merangin Dua
Source: SKK Migas, DBS Bank
On the other hand, extracting upstream E&P efficiencies may be detrimental to drilling services companies and OSVs on the back of shrinking/stagnant fees, and/or lower equipment utilisation rates. This could potentially trigger further asset divestments and retirements to maximise the utilisation rates for existing equipment, and raise funds for diversification.
High survival rates, thanks to operational and capital
efficiencies
Cost savings in limelight. Achieving operational efficiency is the primary strategy for most upstream E&P contractors. Indonesia’s lifting cash cost per barrel is expected to decline this year, as major contractors focus only on the most profitable oil and gas blocks and postpone aggressive production plans in high-cost offshore blocks.
Avg US$25 per BOE
Page 26
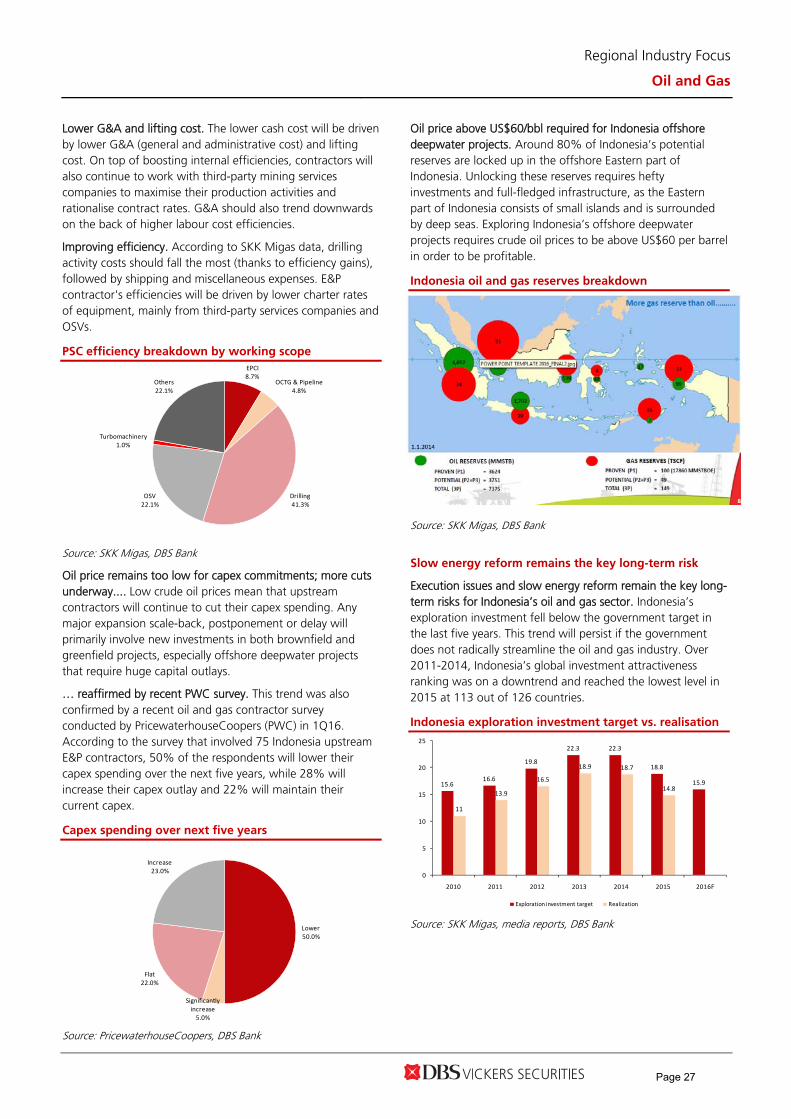
Regional Industry Focus
Oil and Gas
Page 27
Lower G&A and lifting cost. The lower cash cost will be driven by lower G&A (general and administrative cost) and lifting cost. On top of boosting internal efficiencies, contractors will also continue to work with third-party mining services companies to maximise their production activities and rationalise contract rates. G&A should also trend downwards on the back of higher labour cost efficiencies.
Improving efficiency. According to SKK Migas data, drilling activity costs should fall the most (thanks to efficiency gains), followed by shipping and miscellaneous expenses. E&P contractor's efficiencies will be driven by lower charter rates of equipment, mainly from third-party services companies and OSVs.
PSC efficiency breakdown by working scope EPCI8.7%
OCTG & Pipeline4.8%
Drilling41.3%
OSV22.1%
Turbomachinery1.0%
Others22.1%
Source: SKK Migas, DBS Bank
Oil price remains too low for capex commitments; more cuts underway.... Low crude oil prices mean that upstream contractors will continue to cut their capex spending. Any major expansion scale-back, postponement or delay will primarily involve new investments in both brownfield and greenfield projects, especially offshore deepwater projects that require huge capital outlays.
… reaffirmed by recent PWC survey. This trend was also confirmed by a recent oil and gas contractor survey conducted by PricewaterhouseCoopers (PWC) in 1Q16. According to the survey that involved 75 Indonesia upstream E&P contractors, 50% of the respondents will lower their capex spending over the next five years, while 28% will increase their capex outlay and 22% will maintain their current capex.
Capex spending over next five years
Lower50.0%
Significantly increase5.0%
Flat22.0%
Increase23.0%
Source: PricewaterhouseCoopers, DBS Bank
Oil price above US$60/bbl required for Indonesia offshore deepwater projects. Around 80% of Indonesia’s potential reserves are locked up in the offshore Eastern part of Indonesia. Unlocking these reserves requires hefty investments and full-fledged infrastructure, as the Eastern part of Indonesia consists of small islands and is surrounded by deep seas. Exploring Indonesia’s offshore deepwater projects requires crude oil prices to be above US$60 per barrel in order to be profitable.
Indonesia oil and gas reserves breakdown
Source: SKK Migas, DBS Bank
Slow energy reform remains the key long-term risk
Execution issues and slow energy reform remain the key long- term risks for Indonesia’s oil and gas sector. Indonesia’s exploration investment fell below the government target in the last five years. This trend will persist if the government does not radically streamline the oil and gas industry. Over 2011-2014, Indonesia’s global investment attractiveness ranking was on a downtrend and reached the lowest level in 2015 at 113 out of 126 countries.
Indonesia exploration investment target vs. realisation
15.616.6
19.8
22.3 22.3
18.8
15.9
11
13.9
16.5
18.9 18.7
14.8
0
5
10
15
20
25
2010 2011 2012 2013 2014 2015 2016F
Exploration investment target Realization
Source: SKK Migas, media reports, DBS Bank
Page 27

Regional Industry Focus
Oil and Gas
Page 28
The PWC survey in 1Q16 revealed that the investment appetite of the majority of the respondents has declined (65% of total respondents). Low crude oil price is one factor but we believe that execution issues and slow energy reform are headwinds to the outlook for the Indonesian oil and gas industry.
Investment appetite in Indonesia’s oil and gas sector
Decline65.0%
Stagnant22.0%
Increase13.0%
Source: PricewaterhouseCoopers, DBS Bank
We foresee limited progress on Indonesia’s efforts to reform the energy sector, as we believe that the Ministry of Mineral Resources and State-Owned Enterprises is now focusing to revamp the midstream and downstream segments within Indonesia energy holdings establishments via Pertamina and revamping the delayed 35,000MW projects.
Proposed incentives to upstream E&P players may not materialise in the near term. Moreover, the government’s proposed initiatives to provide incentives to the upstream E&P players (mainly for deepwater projects) may also not materialise in the short term. The government will focus its oil and gas revenue allocation towards subsidising natural gas prices as part of the natural gas pricing regulation scheme, to ensure that there is no impact on third-party contractors' revenue that is based on an pre-agreed PSC.
This means that the government has no further budget subsidies for upstream oil and gas contractors, as its oil and gas revenue target is also hampered by production cutbacks by major contractors, coupled with lower crude oil prices. Indonesia's revenue from the oil and gas sector is forecast to decline 16% y-o-y to US$10.6bn in 2016.
Indonesia domestic revenue vs. revenue from O&G
sector
1205
13381438
1635
1793
193 206 181 212 174.15
0
0
0
0
0
0
0
0
0
0
0
200
400
600
800
1,000
1,200
1,400
1,600
1,800
2,000
2011 2012 2013 2014 2015
Domestic revenue Oil and gas revenue % O&G revenue
Source: PricewaterhouseCoopers, Ministry of Finance, DBS Bank
Lack of regulatory coordination between the central and local governments doesn’t help the situation. Execution issues due to uncertainties on the political front pose risks to the sector and the same goes for the lack of regulatory coordination between the central and local governments – as evidenced by the Masela Project delay. Multi-year project delays and project blueprint changes at the final stage can give rise to further potential negative surprises as well as unwanted interventions in running oil and gas businesses in Indonesia. Government intervention at the blueprint level to move gas liquefaction facilities onshore (vs. the previous plan to have floating facilities located offshore) is one of the examples of potential issues that can arise during the project execution process.
The blueprint changes required contractors Shell and Inpex to review the project’s economic feasibility. Both had previously assessed both onshore and floating development (FLNG) options and decided to select the latter – as it was at least US$7bn cheaper than the former. This was further exacerbated by Pertamina’s interest to participate in the project, which would also change the pre-agreed contract terms for both Shell and Inpex.
Pace of energy reform too slow to accelerate E&P activities. We believe Indonesia’s energy reform will proceed at a pace that will not be fast enough to accelerate national oil and gas production, and overall E&P activities. Indonesia’s Special Task Force for Upstream Oil and Gas Business (SKK Migas) has admitted that the integration between itself and BP Migas is only 20 months old and it will take more time to extract synergies (mainly due to administrative matters). This means that oil and gas contractors will not get to enjoy a leaner investment process for accelerating new E&P projects in the meantime.
The campaign to revise Regulation UU No. 21/2001 to revive Pertamina’s role in Indonesia’s oil and gas industry also seems to have dissipated despite the media spotlight in the past year. This means that the new PSC is likely to be signed based on the old regime and current concerns over execution complications (mainly in the early stages) will still exist.
Page 28

Regional Industry Focus
Oil and Gas
Page 29
(II) MALAYSIA
Budget cut but commitment on RAPID intact
As international oil majors continue to cut down on its capital expenditure plan in view of the prolong industry recovery, Malaysia’s Petronas has also announced earlier in February 2016 that it will be cutting expenditure by RM15–20bn in 2016, and RM50bn over the next 4 years. Recall previously that Malaysian government announced in Budget 2016 that RM18bn investment has been allocated for Refinery and Petrochemical Integrated Development (RAPID) project in Pengerang, Johor. Looking at the Exhibit 1 below where we compiled Malaysia O&G players announced contracts flow quarterly on Bursa Malaysia, contract value for 2Q16 to-date reported in at low RM1.42bn (-53.2% q-o-q, -64.5% y-o-y), closest low level we have seen since 1Q12. Judging from this sluggish job flow, we do not rule out the possibility of pushback in some contract awards. On a separate note, PETRONAS has announced its plan to raise US$7.2bn (RM29.5bn) financing for RAPID project which we believe may lead to delay in its implementation timeline. It is not all gloomy as PETRONAS’s commitment to develop RAPID remains unchanged and we understand that there will be a few more petrochemical (refer exhibit 2) and tank terminal contracts award to roll out for the remaining 2016. PETRONAS has thus far dished out three EPCC packages for its petrochemical complex last year, amounting close to RM6bn.
*based on USDMYR exchange rate of 4.30 RAPID contracts flow to exceed 2015
Based on what we compiled, RAPID related contracts make up 32% (translated to RM8bn value) of total announced contract flow in 2015. With the contracts in the pipeline, we are positive that announced RAPID contract will surpassed the number from previous years.
Tender pipeline looking promising
Apart from RAPID, Petronas has held tender briefing for upcoming Pan Malaysia transportation and installation (T&I) contract (taking 2013 package as a guidance – contract value was RM10bn). Besides that, Petronas has open tenders for maintenance, construction and modification (MCM) package which from channel check reveal it to be in the range of RM3 –4bn.
Exhibit 1: Malaysia O&G players’ quarterly contract flow compilation
Source: Bursa Malaysia, DBS Bank
Contract Awarded by RM (‘m)
EPCC of Polypropylene plant Petronas Chemical 2,073 EPCC of LLDPE plant Petronas Chemical 1,312 EPCC of EOEG plant Petronas Chemical 2,481
3488
255 603
5759
540
1020981
3539
1131
4230
460
7189
1601
3833
17162239
8526
14512
4484
16242
11570
16082
5538
2317
9743
42022948
7983
31871491
4472
1Q09
2Q09
3Q09
4Q09
1Q10
2Q10
3Q10
4Q10
1Q11
2Q11
3Q11
4Q11
1Q12
2Q12
3Q12
4Q12
1Q13
2Q13
3Q13
4Q13
1Q14
2Q14
3Q14
4Q14
1Q15
2Q15
3Q15
4Q15
1Q16
2Q16
3Q16
RMm
Page 29

Regional Industry Focus
Oil and Gas
Page 30
Exhibit 2: Petronas’ Petrochemical package to dish out
Source: Petronas, DBS Bank
Page 30

Regional Industry Focus
Oil and Gas
Page 31
REGIONAL SHARE PRICE PERFORMANCE AND STOCK PICKS
Divergence of share price performance. We observed several price trends of the O&G stocks:
1) Share prices of the oil service companies have lagged oil price recovery, which rallied from the low of US$28/bbl to US$40-50/bbl.
2) Outperformance seen in the stronger names which are of larger cap, better earnings visibility and wider economic moat.
3) Upstream-focused names have outperformed, as investors looking to ride the oil price rally have positioned themselves in these direct beneficiaries.
4) Most of the O&G SMCs made new lows over the past few months, driven by rising fears of insolvency.
Singapore - sentiment shaken by Swiber’s event. Swiber filed for wind-up application on 28-Jul but withdrew the next day as management decided to place the company under Judicial Management (ie a temporary court-supervised rescue plan) instead. However, the move has dampened the sentiment on the O&G service providers, which were already plagued by the operation challenges, pressing stock prices to new lows. Malaysia – low contract flows and earnings pressure weigh on share performance. Contract flow announcements disappointed in 2Q16, hitting the lowest levels seen since 3Q11. Thus, a pushback in contract awards is possible. For asset charterers, contracts have been lengthened but at lower day rates. Sector earnings are looking to be dampened, and margin erosion is also a worry. MMHE remains the best performing stock, posting a modest gain of 1%, buoyed by privatisation speculation news in the earlier part of the year. Thailand – rising oil prices catalyse favourable performance. Higher oil prices was the key factor behind the outperformance of the Thai oil and gas sector YTD, with upstream-exposed PTT and PTTEP benefitting the most. The share price performance of oil refiners, however, was hurt by weaker GRM as refined oil product prices increased at a slower pace than crude oil prices amid lower demand on the back of seasonal effects, but the sub-sector still outperformed the service-oriented players in Singapore and Malaysia substantially. Indonesia – higher oil prices benefit upstream-focused names; efficiencies help too. Upstream names have ridden the oil price uptrend, but also outperformed on efficiency gains. For example, Medco Energi has focused capex and production on only the most profitable blocks. Meanwhile, OSV-owner performance is a mixed bag: Wintermar has outperformed YTD on a return to profitability in 2Q16 and good cost management versus peers, while Logindo’s share price performance has been lacklustre as profitability remains elusive.
Bottoming out... We expect share prices of O&G stocks to remain suppressed by the weak operational performance and negative newsflows in the next two quarters, which we believe would be the bottom of the cycle. The recovery in the oil market should gradually filter through the value chain and drive a sector re-rating thereafter. Bargain hunt for good names. E&P companies are direct winners of any oil price recovery but prospects are probably priced in with the oil price rebound to the US$40 levels. We like diversified oil refiner Bangchak Petroleum [BCP; BUY; TP Bt39], which is a laggard in this space. Singapore rigbuilders possess competitive advantages over their global peers in terms of cost efficiency and R&D focus; We continue to favour SCI [BUY; TP S$3.10] for stability as well as potential re-rating in the marine sector. In Malaysia, we like Pantech [BUY; RM0.64] as the best proxy to ride RAPID; and see value emerging for Bumi Armada [BUY; RM0.85]. In Indonesia, we have upgraded Medco [MEDC; BUY; TP Rp2,000] supported by higher oil prices, operational efficiencies and prudent capital allocation.
Meanwhile, we see more downside for UMW Oil & Gas [UMWOG; FV; TP RM0.80] and Elnusa [FV; TP Rp420], with their rich valuations and high earnings risks. We would also avoid Singapore Offshore Support Vessel (OSV) names like Ezra, Nam Cheong and Pacific Radiance which could be facing near term balance sheet distress.
Regional P/BV valuations by sub-sector
Source: Bloomberg Finance L.P
Shipyards P/B
Asset owners/ EP IC cont ractors/ o ilfie ld services P/B
Keppel Corp 0.83 Bumi Armada 0.60
Sembcorp Marine 1.01 Dayang Enterprise Holdings 0.82Sembcorp Industries 0.71 Dialog Group 3.64
Nam Cheong 0.21 Perisai Petroleum Teknologi 0.15Vard Holdings 0.26 SapuraKencana Petroleum 0.75Coastal Contracts 0.49 UMW Oil & Gas 0.69MMHE 0.59 Deleum 1.41Average 0.60 Ezion Holdings 0.28
Ezra Holdings 0.15Manufacturing Mermaid Maritime 0.28Pantech Group 0.65 Pacific Radiance 0.20
POSH 0.39Integrat ed Logindo 0.22PTT PCL 1.25 Wintermar 0.35
Elnusa 1.24Upst ream Average 0.76PTT Exploration & Production 0.77Medco Energi 0.48 Midst ream/Downst reamAverage 0.63 Bangchak Petroleum 1.15
IRPC PCL 1.21PTT Global Chemical PCL 1.13Thai Oil PCL 1.40Average 1.23
Page 31

Regional Industry Focus
Oil and Gas
Page 32
YTD Stock performance – Singapore O&G coverage
Source: Reuters, DBS Bank YTD Stock performance – Thailand O&G coverage
Source: Reuters, DBS Bank
-80
-60
-40
-20
0
20
40
60
1-Ja
n-16
15-J
an-1
6
29-J
an-1
6
12-F
eb-1
6
26-F
eb-1
6
11-M
ar-1
6
25-M
ar-1
6
8-A
pr-1
6
22-A
pr-1
6
6-M
ay-1
6
20-M
a y-1
6
3-Ju
n-16
17-J
un-1
6
1-Ju
l-16
15-J
ul-1
6
29-J
ul-1
6
12-A
u g-1
6
26-A
ug-1
6
B rent +31%
POSH 0%
Keppel -19%SMM -25%
Mermaid -37%Vard -43%
Ezion and PACRA -54%Ezra -58%
Nam Cheong -66%
Average YTD performance = -39%
(%)
-30
-20
-10
0
10
20
30
40
50
60
1-Ja
n-16
15-J
an-1
6
29-J
an-1
6
12-F
eb-1
6
26-F
eb-1
6
11-M
ar-1
6
25-M
ar-1
6
8-A
pr-1
6
22-A
pr-1
6
6-M
ay-1
6
20-M
ay-1
6
3-Ju
n-16
17-J
un-1
6
1-Ju
l-16
15-J
ul-1
6
29-J
ul-1
6
12-A
ug-1
6
26-A
ug-1
6
B rent +32%
PTT +44%PTTEP +41%
PTT Global Chem +22%
IRPC +14%
Thai Oil PCL +6%
Bangchak Petroleum-0.7%
Average YTD performance = +21%
(%)
Page 32

Regional Industry Focus
Oil and Gas
Page 33
Stock performance – Malaysia O&G coverage
Source: Thomson Reuters, DBS Bank Stock performance – Indonesia O&G coverage
Source: Thomson Reuters, DBS Bank
-50
-40
-30
-20
-10
0
10
20
30
40
50
1-Ja
n-16
15-J
an-1
6
29-J
an-1
6
12-F
eb-1
6
26-F
eb-1
6
11-M
ar-1
6
25-M
ar-1
6
8-A
pr-1
6
22-A
pr-1
6
6-M
ay-1
6
20-M
ay-1
6
3-Ju
n-16
17-J
un-1
6
1-Ju
l-16
15-J
ul-1
6
29-J
ul-1
6
12-A
ug-1
6
26-A
ug-1
6
B rent +31%
MMHE +1%Deleum 0%
Coastal Contracts -21%
Dialog -4%Pantech -11%
SapuraKencana -19%
UMWOG - 26%
Bumi Armada -29%
Perisai Petroleum -45%
Dayang -28%
Average YTD performance = -18%
(%)
Elnusa +102%Medco Energi +93%
Wintermar +49%
Brent +32%
Logindo
-60
-40
-20
0
20
40
60
80
100
120
140
160
1-Ja
n-16
15-J
an-1
6
29-J
an-1
6
12-F
eb-1
6
26-F
eb-1
6
11-M
ar-1
6
25-M
ar-1
6
8-A
pr-1
6
22-A
pr-1
6
6-M
ay-1
6
20-M
ay-1
6
3-Ju
n-16
17-J
un-1
6
1-Ju
l-16
15-J
ul-1
6
29-J
ul-1
6
12-A
ug-1
6
26-A
ug-1
6Average YTD performance = +58%
(%)
Page 33

Regional Industry Focus
Oil and Gas
Page 34
Peer comparisons – Offshore Marine/ Oil & Gas Services
Source: Bloomberg Finance L.P., DBS Bank
Name Price Mkt Cap PE Div Yield EV/EBITDA P/B ROE Net Pft CAGR
05 Sep TP Rec (US$m) FY16F FY17F FY16F FY17F FY16F FY17F FY16 FY16 15-17
Singapore
Keppel Corp 5.27 5.25 Hold 7,050 10.1 9.3 4.0 4.3 10.0 9.2 0.8 8.5 -16.6
SMM 1.28 1.20 FV 1,971 16.3 16.0 2.2 2.2 11.7 10.1 1.0 6.5 NM
SCI 2.71 3.10 Buy 3,569 10.0 9.5 3.4 3.4 10.8 10.3 0.7 7.3 -3.7
Yangzijiang 0.77 1.00 Buy 2,157 7.8 9.1 5.1 5.1 2.2 2.5 0.6 8.3 -8.8
COSCO Corp 0.28 0.30 Hold 454 NM NM 0.0 0.0 73.1 12.8 0.9 -18.5 -71.9
Ezion Holdings 0.250 0.58 Buy 381 7.7 6.5 0.0 0.0 7.2 6.8 0.3 5.4 -21.8
Ezra Holdings 0.042 0.06 FV 91 NM NM 0.0 0.0 39.8 75.2 0.2 -67.7 23.4
Mermaid 0.092 0.09 Hold 96 8.0 NM 0.0 0.0 2.8 9.0 0.3 3.7 -89.5
Nam Cheong 0.046 0.04 FV 71 NM NM 0.0 0.0 NM 98.2 0.2 -6.1 NM
Pacific Radiance 0.147 0.11 FV 77 NM NM 0.0 0.0 NM 60.5 0.2 -10.5 NM
POSH 0.310 0.33 Hold 413 NM 67.0 1.6 1.6 16.9 11.2 0.4 -2.0 -40.6
Vard Holdings 0.138 0.18 Hold 120 NM NM 0.0 0.0 NM 98.0 0.3 -3.3 -67.1
Average 10.0 19.6 1.4 1.4 19.4 33.6 0.5 -5.7
Malaysia
Bumi Armada 0.76 0.85 Buy 1,084 26.6 12.1 0.9 2.1 11.1 7.7 0.6 2.3 6.0
Coastal Contracts 1.48 1.65 Hold 192 6.3 5.7 3.2 3.5 5.8 5.5 0.5 8.1 -8.9
Dayang 1.00 0.88 FV 215 38.3 11.4 0.0 0.0 8.7 6.5 0.8 2.2 -22.3
Dialog Group 1.53 1.70 Hold 1,978 30.1 25.4 1.5 1.6 19.3 15.9 3.6 14.3 15.2
MMHE 1.02 0.98 FV 399 23.6 21.1 0.0 0.0 4.9 4.3 0.6 2.5 -5.5
Perisai Petroleum 0.15 0.35 Sell 45 2.2 0.0 0.0 0.0 6.9 0.0 0.1 7.0 -100.0
SapuraKencana 1.55 1.16 FV 2,273 64.6 64.6 0.2 0.2 12.5 12.5 0.8 1.2 -55.2
UMW OG 0.91 0.80 FV 481 NM NM 0.0 0.0 49.0 24.2 0.7 -9.0 95.3
Deleum 1.08 1.02 Hold 106 16.2 10.6 3.1 4.7 5.0 3.9 1.4 8.9 -4.1
Pantech 0.54 0.64 Buy 81 9.7 8.4 5.0 5.3 5.8 5.3 0.6 7.8 1.0
Average 24.2 17.7 1.4 1.7 12.9 8.6 1.0 4.5
Thailand
Bangchak Petrlm. 32.75 39.00 Buy 1,302 7.2 6.6 5.8 6.1 3.9 3.4 1.2 16.8 21.5
IRPC PCL 4.80 5.20 Hold 2,832 11.0 11.6 3.5 3.5 8.5 8.0 1.2 11.41 NM
PTT PCL 333.00 370.00 Buy 27,466 10.8 10.3 3.9 3.9 5.2 5.2 1.3 12.1 -3.9
PTTEP 79.50 86.00 Hold 9,114 21.1 20.2 1.5 2.1 2.9 3.0 0.8 3.5 -0.4
PTT Global Chem 60.25 70.00 Buy 7,760 12.1 10.2 4.6 4.6 7.2 6.1 1.1 9.46 8.20
Thai Oil PCL 69.50 65.00 Hold 4,094 9.5 9.8 4.7 4.6 5.4 5.0 1.4 15.4 NM
Average 11.9 11.5 4.0 4.2 5.5 5.1 1.1 11.4
Indonesia
Logindo 120 132 FV 23 NM NM 0.0 0.0 20.9 27.4 0.2 -19.2 NM
Wintermar 244 239 Hold 75 NM NM 0.0 0.0 6.8 5.9 0.4 -0.3 NM
Elnusa 494 420 FV 273 8.2 9.2 3.5 3.1 3.5 3.7 1.2 16.0 2.0
Medco Energi 1,495 2,000 Buy 377 17.9 7.0 1.1 1.4 5.3 4.1 0.5 2.9 NM
Average 13.0 8.1 1.2 1.1 9.1 10.3 0.6 -0.2
US
Tidewater 3.09 NR NR 150 N/A N/A 0.0 0.0 48.6 27.6 0.1 -9.8 11.65
Hornbeck 5.09 NR NR 187 N/A N/A 0.0 N/A 8.2 19.9 0.1 -4.9 NM
SEACOR 58.57 NR NR 1,020 N/A N/A N/A N/A 13.8 9.0 0.8 N/A -74.2
Gulfmark 2.08 NR NR 61 N/A N/A 0.0 0.0 N/A 45.8 0.1 -9.8 -47.9
Average N/A N/A 0.0 0.0 23.5 25.6 0.3 -8.2
Page 34

Regional Industry Focus
Oil and Gas
Page 35
Company Guide
Page 35

ASIAN INSIGHTS VICKERS SECURITIES ed: JS / sa: JC, PY
BUY Last Traded Price: S$0.29 (STI : 2,869.82) Price Target 12-mth : S$0.58 (101% upside) (Prev S$0.77) Potential Catalyst: Vessel delivery, oil price recovery Where we differ: In line Analyst Pei Hwa Ho +65 6682 3714 [email protected]
What’s New 2Q16 earnings dragged by underperformance of
associates/JVs Trimmed FY16/17 earnings by 19/8% Vessel deliveries to drive sequential improvement in
2H16 Reiterate BUY; TP adjusted to S$0.58
Price Relative
Forecasts and Valuation FY Dec (US$ m) 2014A 2015A 2016F 2017F Revenue 387 351 327 432 EBITDA 309 267 237 253 Pre-tax Profit 226 38 88 67 Net Profit 224 37 85 66 Net Pft (Pre-Ex, Aft Pref Div)*
179 95 49 59
EPS (S cts) 19.0 3.1 5.5 4.3 EPS Pre Ex, Aft Pref Div (S cts)
15.2 8.1 3.2 3.8
EPS Gth (%) 26 (84) 77 (23)
EPS Gth Pre Ex, Aft pref div (%)
21 (47) (61) 19
Net DPS (S cts) 0.1 0.0 0.0 0.0 BV Per Share (S cts) 91.5 93.5 84.3 88.0 PE (X) 1.5 9.3 5.3 6.8 PE Pre Ex, Aft Pref Div (X) 1.9 3.6 9.1 7.7 P/Cash Flow (X) 1.6 1.6 2.3 2.1 EV/EBITDA (X) 5.5 6.9 7.4 7.0 Net Div Yield (%) 0.3 0.0 0.0 0.0 P/Book Value (X) 0.3 0.3 0.3 0.3 Net Debt/Equity (X) 0.9 1.1 0.8 0.8 ROAE (%) 24.5 2.1 6.4 4.4 Earnings Rev (%): (27) (35) Consensus EPS (S cts): 4.5 6.6 Other Broker Recs: B: 7 S: 0 H: 4
Source of all data on this page: Company, DBS Bank, Bloomberg Finance L.P.
2Q hit by underperformance of associate/JV Maintain BUY on Ezion with a TP of S$0.58, based on 0.6x FY16 P/BV. Ezion’s share price has been dragged down by the rights issue and weak sentiment following Swiber’s incident. While Ezion’s net gearing ratio of c.1x (post rights) may appear high, Ezion is among the stronger players with good assets, positive operating cash flow and decent cash balances. Re-rating catalysts stem from earnings recovery with the resumption of service rigs currently under repair/upgrades in 2H16, delivery of newbuild liftboats, and successful diversification of its customer base to win new charter contracts. 2Q16 earnings dragged by underperformance of associate/JV. Ezion reported headline net profit of US$19.8m for 2Q16, boosted by gains on disposal of its 51% stake in its Indonesian unit (for re-flagging) of approx. US$14m. Stripping this out, core profit would have been c.US$6m, lower than US$17m in 1Q16. The underperformance came from a sequential decline in share of associate/JV income, which declined by US$7m to US$1.1m, and an increase of S$3m in cost of sales as Ezion took delivery of unit #9 at end 1Q, but this was taken off the fleet for modification shortly after. We trimmed FY16/17 net earnings by 19%/8% factoring in the weak 2Q, lower associate/JV income and changes in delivery schedule. Windfarm venture shaping up. China had set a target of 5GW of installed offshore wind capacity by 2015 and 30GW by 2020 in its current 5-year plan. It is behind schedule with only approximately 2.5GW offshore wind capacity installed. A liftboat could facilitate installation of 200MW offshore wind capacity a year. Assuming 27.5GW wind capacity to be installed over the next five years or 5.5GW per year, 25-30 liftboats would be required in China. Ezion has signed a MOU with one of the top five IPPs in China – Huadian - and several partners to speed up the installation of offshore windfarms using liftboats. Valuation: We value Ezion based on 0.6x FY16 P/BV, arriving at a target price of S$0.58. This implies 101% upside potential. Key Risks to Our View: Rate reduction and contract terminations We estimate that every 1% decline in average day rates will reduce Ezion’s bottom line by 5%. We have prudently assumed that rates will reduce by 15% p.a. in FY16-17Five service rigs are due for charter renewals in FY16. Besides, the Mexican contracts appear to be at risk of termination as these consist of the few units that are deployed for drilling and there have been several cancellations in that region. Competition may be keener ahead with more new entrants attracted to the growing liftboat market. At A Glance Issued Capital (m shrs) 2,083 Mkt. Cap (S$m/US$m) 604 / 450 Major Shareholders (%) Thiam Keng Chew 13.3 Prudential 8.1 Commonwealth Bank of Austr 5.1
Free Float (%) 73.5 3m Avg. Daily Val (US$m) 4.3 ICB Industry : Oil & Gas / Oil Equipment; Services & Dist
DBS Group Research . Equity 12 Aug 2016
Singapore Company Guide
Ezion Holdings Version 9 | Bloomberg: EZI SP | Reuters: EZHL.SI Refer to important disclosures at the end of this report
Page 36

ASIAN INSIGHTS VICKERS SECURITIES
Company Guide
Ezion Holdings
WHAT’S NEW
2Q16 below
Results review
2Q16 earnings dragged by underperformance of associate/JVs. Ezion reported headline net profit of US$19.8m, boosted by gains on disposal of its 51% stake in Indonesian unit (for re-flagging) of approx. US$14m. Stripping this out, core profit would have been c.US$6m, lower than US$17m in 1Q16. The underperformance came from sequentially lower share of associate/JV income by US$7m to US$1.1m, and higher cost of sales of S$3m as Ezion took delivery of unit #9 at the end of 1Q, but this was taken off the fleet for modification shortly after.
Gross margins contracted by 3.9ppt q-o-q to 21.3%, with the blame on higher cost stemming from depreciation and crew expenses for the newly delivered unit #9 which was not revenue generating after it was sent back to the yard.
Net gearing stood at 1.1x as at end- June 2016, similar to the last two quarters. We estimate that the recent rights issue could bring gearing down to below 1.0x.
Equity fund raising exercises. Ezion raised approximately US$100m through a rights issue at the end of July. Prior to this, Ezion issued and listed 355.2m warrants (1-for-5 bonus issues exercisable within four years) on 27-Apr-2016 at an adjusted exercise price of S$0.45. If fully exercised, its share capital could expand by c.20% and Ezion would receive gross proceeds of c.US$110m.
Key takeaways from briefing
1. Partial divestment and re-flagging of two Indonesiaunits. In 1Q16, Ezion divested a 51% stake in Unit #6 toits Indonesian partner in order to reflag it underIndonesia, resulting in a sizeable disposal gain ofUS$13m. The divestment and reflagging of the secondunit, Unit #4 was completed at end-2Q, resulting inUS$14m disposal gain. Going forward, joint-operationaccounting will apply to these two units.
2. Vessel deliveries. As of Jun-2016, Ezion’s total fleet stoodat 26 units and operating fleet at 17 units, similar to endMar-2016. Ezion is expected to take delivery of twonewbuild units and three to four units underrepair/upgrades; resumption of three units have beenpushed back to next year. We have trimmed FY16/17earnings forecasts by 19/8%, after fine-tuning ourdelivery schedule and factoring lower income fromassociates/JVs.
3. Rate reduction pressure? The pressure has subsided as oilprices have climbs above US$40/bbl. Management holdsthe view that oil majors’ capex cuts will eventually filterthrough to lower production and push up oil prices tomore sustainable levels closer to US$60/bbl, driving aturnaround in the sector by 2018.
4. More provisions? Management believes thatprovisions/impairments made in 4Q15 should suffice atthis point. The risk of further provisions could beheightened if oil prices stay below US$35/bbl and/or thespiraling effect from more corporate failings.
5. Cash is king. Management reassured that there wouldnot be any new major capex apart from those alreadycommitted. Asset acquisitions are also not desirable atthis stage unless an astoundingly lucrative deal comesabout. The top priority now is to ensure that its balancesheet and cash flow remain healthy to weather throughthe downturn.
Page 37

ASIAN INSIGHTS VICKERS SECURITIES
Company Guide
Ezion Holdings
Quarterly / Interim Income Statement (US$m)
FY Dec 2Q2015 1Q2016 2Q2016 % chg yoy % chg qoq
Revenue 90.1 82.1 83.7 (7.0) 2.0
Cost of Goods Sold (58.7) (61.4) (65.9) 12.4 7.3
Gross Profit 31.4 20.7 17.8 (43.3) (13.9)
Other Oper. (Exp)/Inc (5.5) (4.3) (5.4) (2.6) 25.6
Operating Profit 25.9 16.4 12.4 (52.0) (24.2)
Other Non Opg (Exp)/Inc 0.0 0.0 0.0
Associates & JV Inc 9.25 8.22 1.12 (87.9) (86.4)
Net Interest (Exp)/Inc (5.8) (7.6) (6.5) 12.5 (14.0)
Exceptional Gain/(Loss) 0.0 (1.5) 13.8 nm nm
Pre-tax Profit 29.3 15.6 20.8 (29.1) 33.6
Tax (0.4) (0.1) (1.0) 149.3 nm
Minority Interest 0.0 0.0 0.0
Net Profit 29.0 15.5 19.8 (31.5) 28.1
Net profit bef Except. 29.0 17.0 6.07 (79.0) (64.2)
EBITDA 68.4 60.2 50.4 (26.3) (16.3)
Margins (%)
Gross Margins 34.9 25.2 21.3
Opg Profit Margins 28.8 20.0 14.9
Net Profit Margins 32.2 18.9 23.7
Source of all data: Company, DBS Bank
Page 38

ASIAN INSIGHTS VICKERS SECURITIES
Company Guide
Ezion Holdings
CRITICAL DATA POINTS TO WATCH
Earnings Drivers:
Charter-backed fleet expansion. Since the delivery of its first liftboat, the Lewek Leader, in January 2010, Ezion has expanded its fleet rapidly to 26 service rigs (excluding unit #10 that was taken out for conversion into MOPU). Based on the existing schedule, management expects another 2/7/2 units to come onstream in 2016/17/18. All the vessels under construction have already secured back-to-back contracts and will start contributing to earnings upon delivery to customers.
Rate reduction and uncertainty. While we expect sequential improvement from the maiden contribution of the ten new service rigs to be delivered the next three years and resumption of the ten vessels currently under repair / upgrade / conversion at the yards, the pace of earnings growth is dependent on the magnitude of rate reduction. With oil price hovering at current levels, rate renegotiation is inevitable. Against this backdrop, we have factored in a rate reduction of 15% p.a. in 2016-2017.
Pick-up in offshore logistic revenue. Ezion’s Australian offshore logistic fleet comprises ten tugs and 30 ballastable barges. Ballastable barges, which have specially reinforced decks, have been modified to carry heavy offshore platforms and jackets. Demand for such high-end vessels has fallen off the cliff since 4Q14, with the construction of major Australian LNG projects coming to an end. This was exacerbated by depressed oil prices that have discouraged customers from exercising charter options after the initial term of 18 months.
We estimate overhead costs to be around US$15-20m a year, taking into account depreciation, crew costs and interest expense. Upside potential would come from a stronger-than-expected demand or disposal of the fleet, which has a carrying value of around US$250m. However, we believe it is not easy to find buyers in the current climate.
Contract wins from windfarm expansion to fuel growth. During the peak of its contract wins, Ezion won 12/9/7 new charter contracts in 2012/13/14 respectively. The contracting pace is expected to slow down, constrained by Ezion’s stretched balance sheet. But the unexpected collapse in oil prices has accelerated the decline as some customers have held back the award of new contracts or have negotiated down charter rates.
We believe demand will continue to grow in this region as liftboats/service rigs are in early stages of the industry cycle, to substitute workboats and barges that are traditionally used to support offshore production platforms. Ezion enjoys first-mover advantage to tap the industry’s growth. In addition, its recent venture into offshore windfarm could be a medium-term growth engine as well.
Total fleet
Operating fleet
Source: Company, DBS Bank
Page 39

ASIAN INSIGHTS VICKERS SECURITIES
Company Guide
Ezion Holdings
Balance Sheet: High net gearing of 1.1x; backed by charter contracts. Apart from the three to six units that could be redeployed for windfarm business or converted into MOPU, Ezion’s service rigs are backed by charter contracts on hand. Risks of defaults and cancellations are relatively low, given its reputable clientele base that consists largely of NOCs and IOCs.
Relatively better financial health in current climate. Net debt/EBITDA is expected to hover around 6x in 2016. Current ratio of c.1.0x indicates Ezion’s ability to service short-term financing needs that may arise. Ezion should be able to meet its interest payments with c.2x net interest coverage ratio.
Share Price Drivers: Oil price rebound. Oil price is a leading indicator and key re-rating catalyst for O&G sector as the market has widely priced in the weak earnings and new lower norm of oil prices. We believe Ezion is one of the best proxies to ride the recovery, given its earnings resiliency and growth potential.
Vessel deliveries. Besides the delivery rescheduling, ten of Ezion’s service rigs have been withdrawn from its fleet for repairs/upgrades/conversions. The resumption of these rigs in 2016 should drive earnings recovery. In addition, Ezion is expected to take delivery of 2/7/2 vessels in 2016/17/18, driving growth into 2017. Key downside risk is a rate reduction greater than the 15% pa factored into our model.
New contracts/renewals at good rates. Securing new/renewal of charter contracts at good rates would alleviate concerns over contract cancellations and rate reductions and thus lower the risk premium ascribed to the company.
Key Risks: Rising interest rates. About 70% of its debts have been swapped to fixed rates, lowering the sensitivity. We estimate that every 100-bps increase in interest rates could reduce Ezion's net profit by approximately 6%.
Rate reduction and contract terminations. Five service rigs are due for charter renewals in FY16. In terms of termination, the Mexican contracts appear to be at risk as these consist of the few units that are deployed for drilling and PEMEX has exercised early termination clauses on a couple of drilling rigs last year and is facing liquidity crunch because of the oil price collapse.
Keener competition. The rising acceptance and growing demand for liftboats have attracted new entrants to the market. We estimate that there are c.20 new liftboats currently under construction to be delivered largely in 2017. We believe demand growth should outpace supply growth in the under-penetrated Asia-Pacific region.
Company Background Ezion provides service rigs and offshore logistics support services to the offshore oil & gas industry. It was one of the first companies to introduce liftboats in Asia and the Middle East regions. Ezion had a total of 26 service rigs delivered and 17 service rigs in operation as of Jun 2016. The fleet is expected to grow to 28 vessels by end-2016 and 35 by end-2017.
Leverage & Asset Turnover (x)
Capital Expenditure
ROE (%)
Forward PE Band (x)
PB Band (x)
Source: Company, DBS Bank
Page 40

ASIAN INSIGHTS VICKERS SECURITIES
Company Guide
Ezion Holdings
Key Assumptions
FY Dec 2013A 2014A 2015A 2016F 2017F
Total fleet 18.0 21.0 26.0 28.0 35.0 Operating fleet 18.0 18.0 18.0 24.0 35.0
Segmental Breakdown
FY Dec 2014A 2015A 2016F 2017F
Revenues (US$ m) Production and 376 312 272 353 Exploration and 10 38 54 79 Others 0 0 1 1
Total 387 351 327 432 Operating profit (US$ m) Production and 195 26 56 64 Exploration and (8) 0 13 11 Others 0 0 1 1
Others (8) 83 15 15 Total 179 109 85 91 Operating profit Margins Production and 51.8 8.4 20.6 18.1 Exploration and (78.6) 0.1 24.0 14.2 Others 99.7 100.0 100.0 100.0
Total 46.2 31.1 25.8 21.0
Income Statement (US$ m)
FY Dec 2013A 2014A 2015A 2016F 2017F
Revenue 282 387 351 327 432 Cost of Goods Sold (149) (191) (233) (236) (329) Gross Profit 133 196 118 91 104 Other Opng (Exp)/Inc (14) (17) (9) (6) (13) Operating Profit 119 179 109 85 91 Other Non Opg (Exp)/Inc 0 0 0 0 0 Associates & JV Inc 31 28 23 21 24 Net Interest (Exp)/Inc (7) (17) (22) (46) (48) Exceptional Gain/(Loss) 20 36 (72) 28 0 Pre-tax Profit 163 226 38 88 67 Tax (3) (2) (2) (2) (1) Minority Interest 0 0 0 0 0 Net Profit 160 224 37 85 66 Net Profit before Except. 141 188 109 58 66 Preference Dividend (8) (9) (14) (8) (8) Net Pft Pre-Ex, Aft Pref Div 133 179 95 49 59 EBITDA 195 309 267 237 253 Growth Revenue Gth (%) 77.7 37.1 (9.1) (6.8) 32.1 EBITDA Gth (%) 115.7 58.3 (13.6) (11.5) 6.9 Opg Profit Gth (%) 108.5 49.9 (38.9) (22.5) 7.3 Net Profit Gth (%) 103.4 39.4 (83.6) 132.2 (22.6) Net Pft Pre-Ex Aft Perf Div Gth (%)
103.1 34.8 (46.7) (48.4) 18.9
Margins & Ratio Gross Margins (%) 47.2 50.7 33.6 27.8 24.0 Opg Profit Margin (%) 42.3 46.2 31.1 25.8 21.0 Net Profit Margin (%) 56.9 57.9 10.5 26.1 15.3 ROAE (%) 27.2 24.5 2.1 6.4 4.4 ROA (%) 9.4 8.6 0.8 2.5 1.8 ROCE (%) 7.8 7.5 3.7 2.8 3.0 Div Payout Ratio (%) 0.6 0.5 0.0 0.0 0.0 Net Interest Cover (x) 17.5 10.7 5.0 1.9 1.9
Source: Company, DBS Bank
Page 41

ASIAN INSIGHTS VICKERS SECURITIES
Company Guide
Ezion Holdings
Quarterly / Interim Income Statement (US$ m)
FY Dec 2Q2015 3Q2015 4Q2015 1Q2016 2Q2016
Revenue 90 86 85 82 84 Cost of Goods Sold (59) (61) (65) (61) (66) Gross Profit 31 25 20 21 18 Other Oper. (Exp)/Inc (5) 3 (2) (4) (5) Operating Profit 26 28 18 16 12 Other Non Opg (Exp)/Inc 0 0 0 0 0 Associates & JV Inc 9 9 (3) 8 1 Net Interest (Exp)/Inc (6) (6) (6) (8) (7) Exceptional Gain/(Loss) 0 0 (72) (1) 14 Pre-tax Profit 29 31 (63) 16 21 Tax 0 0 0 0 (1) Minority Interest 0 0 0 0 0 Net Profit 29 30 (64) 15 20 Net profit bef Except. 29 30 9 17 6 Preference Dividend 0 0 0 0 0 Net Pft (Pre-Ex, Aft Pref Div) 29 30 9 17 6
EBITDA 68 73 50 60 50
Growth
Revenue Gth (%) (0.1) (4.3) (1.7) (3.1) 2.0 EBITDA Gth (%) (9.8) 6.9 (31.5) 20.2 (16.3) Opg Profit Gth (%) (31.4) 6.7 (35.6) (7.8) (24.2) Net Profit Gth (%) (29.4) 4.8 (309.4) (124.4) 28.1 Margins
Gross Margins (%) 34.9 29.0 23.8 25.2 21.3 Opg Profit Margins (%) 28.8 32.1 21.0 20.0 14.9 Net Profit Margins (%) 32.2 35.2 (74.9) 18.9 23.7
Balance Sheet (US$ m)
FY Dec 2013A 2014A 2015A 2016F 2017F
Net Fixed Assets 1,464 2,136 2,284 2,256 2,345 Invts in Associates & JVs 194 173 204 225 249 Other LT Assets 5 14 12 12 12 Cash & ST Invts 166 372 230 317 244 Inventory 0 0 0 0 0 Debtors 107 160 193 182 197 Other Current Assets 107 128 186 186 186 Total Assets 2,043 2,981 3,108 3,177 3,232
ST Debt 223 288 375 375 375 Creditor 69 70 116 105 158 Other Current Liab 84 69 109 105 104 LT Debt 863 1,208 1,230 1,135 1,079 Other LT Liabilities 4 33 36 36 36 Shareholder’s Equity 800 1,313 1,241 1,421 1,480 Minority Interests 0 0 0 0 0 Total Cap. & Liab. 2,043 2,981 3,108 3,177 3,232
Non-Cash Wkg. Capital 60 148 153 158 120 Net Cash/(Debt) (920) (1,125) (1,375) (1,193) (1,210) Debtors Turn (avg days) 106.5 125.9 183.4 209.2 159.7 Creditors Turn (avg days) 181.0 288.9 345.8 384.2 253.0 Inventory Turn (avg days) N/A N/A N/A N/A N/A Asset Turnover (x) 0.2 0.2 0.1 0.1 0.1 Current Ratio (x) 1.0 1.5 1.0 1.2 1.0 Quick Ratio (x) 0.7 1.2 0.7 0.9 0.7 Net Debt/Equity (X) 1.1 0.9 1.1 0.8 0.8 Net Debt/Equity ex MI (X) 1.1 0.9 1.1 0.8 0.8 Capex to Debt (%) 67.3 34.9 23.8 6.9 15.6 Z-Score (X) 0.9 0.9 0.7 0.8 0.8
Source: Company, DBS Bank
Page 42

ASIAN INSIGHTS VICKERS SECURITIES
Company Guide
Ezion Holdings
Cash Flow Statement (US$ m)
FY Dec 2013A 2014A 2015A 2016F 2017F
Pre-Tax Profit 163 226 38 88 67 Dep. & Amort. 45 103 135 131 138 Tax Paid (2) (2) (4) (7) (2) Assoc. & JV Inc/(loss) (31) (28) (23) (21) (24) Chg in Wkg.Cap. (5) (62) (32) 0 39 Other Operating CF (15) (23) 94 0 0 Net Operating CF 155 214 209 192 218 Capital Exp.(net) (731) (522) (382) (104) (228) Other Invts.(net) 22 (19) (4) 0 0 Invts in Assoc. & JV (19) 15 0 0 0 Div from Assoc & JV 0 0 0 0 0 Other Investing CF (5) 6 8 0 0 Net Investing CF (733) (520) (378) (104) (228) Div Paid (1) (1) (1) 0 0 Chg in Gross Debt 532 290 180 (95) (56) Capital Issues 97 272 (87) 97 0 Other Financing CF (14) (30) (38) (2) (8) Net Financing CF 614 530 54 (1) (63) Currency Adjustments (6) (18) (27) 0 0 Chg in Cash 31 206 (142) 87 (73) Opg CFPS (S cts) 11.3 17.5 15.2 9.2 8.6 Free CFPS (S cts) (40.5) (19.5) (10.9) 4.2 (0.5)
Source: Company, DBS Bank
Target Price & Ratings History
Source: DBS Bank
Analyst: Pei Hwa Ho
Page 43

ASIAN INSIGHTS VICKERS SECURITIES ed: JS / sa:YM
BUY Last Traded Price: S$2.78 (STI : 2,856.67) Price Target : S$3.10 (12% upside) Potential Catalyst: Ramp up of power plant in India, oil price recovery Where we differ: In line Analyst Janice Chua +65 6682 3692 [email protected] Pei Hwa Ho +65 6682 3714 [email protected]
What’s New 2Q16 below, dragged by Sembcorp Marine (SMM)
Trimmed FY16-17F earnings by 6-8% due to SMM;
earnings from its power plant in India to catch up in
2H16 Interim dividend of 4 Scts per share declared Maintain BUY; TP unchanged at S$3.10
Price Relative
Forecasts and Valuation FY Dec (S$ m) 2014A 2015A 2016F 2017F Revenue 10,895 9,545 7,967 7,619 EBITDA 1,612 1,015 1,161 1,228 Pre-tax Profit 1,246 426 694 744 Net Profit 801 549 501 540 Net Pft (Pre Ex.) 801 549 501 540 Net Pft Gth (Pre-ex) (%) (2.4) (31.5) (8.8) 8.0 EPS (S cts) 44.9 30.7 28.0 30.3 EPS Pre Ex. (S cts) 44.9 30.7 28.0 30.3 EPS Gth Pre Ex (%) (2) (32) (9) 8 Diluted EPS (S cts) 44.5 30.5 27.8 30.0 Net DPS (S cts) 16.0 11.0 9.54 9.69 BV Per Share (S cts) 315 360 377 398 PE (X) 6.2 9.0 9.9 9.2 PE Pre Ex. (X) 6.2 9.0 9.9 9.2 P/Cash Flow (X) nm nm 8.2 4.1 EV/EBITDA (X) 6.0 11.6 10.7 10.0 Net Div Yield (%) 5.8 4.0 3.4 3.5 P/Book Value (X) 0.9 0.8 0.7 0.7 Net Debt/Equity (X) 0.4 0.6 0.7 0.6 ROAE (%) 14.8 9.1 7.6 7.8 Earnings Rev (%): (6) (8) Consensus EPS (S cts): 22.9 29.9 Other Broker Recs: B: 9 S: 3 H: 6
Source of all data: Company, DBS Bank, Bloomberg Finance L.P
Look forward to better 2H Valuation of utilities business remains undemanding. Stripping out the fair value of Sembcorp Marine (SMM) and market values of Salalah and Gallant Venture, Sembcorp Industries (SCI)’s utilities business is valued at an undemanding 0.7x P/B and 7.8x FY16F PE vs historical mean PE of 11x. Our SOTP-based TP of S$3.10 translates to 0.9x P/B, which is 20-30% below the troughs seen during the Global Financial Crisis and Asian Financial Crisis. We believe this is undemanding in view of 8% ROE and 3-4% dividend yield. Reiterate BUY.
TPCIL to ramp up in 2H16. SCI’s net profit slid 19% q-o-q to S$86.5m in 2Q16, dragged by Marine (via SMM), which was hit by forex loss and impairment on Cosco shares. Net contribution from Utilities was flattish at S$74.6m. TPCIL - its first Indian power plant that has been fully operational since Sept-2015 and projected to post ~S$15m profit a quarter - made a small loss of <S$1m as the plant was shut down for repair and maintenance since Apr; this was guided for in May. The plant has since commenced operations in June, and profitability should pick up as 86% of the capacity has been contracted on long term Power Purchase Agreements (PPAs) effective Apr. The “loss of generation” in 2Q should be made up for in 2H. We have trimmed our FY16-17F earnings by 6-8%, to reflect our earnings adjustment for SMM.
Emerging markets remain the growth engine. TPCIL is projected to contribute c.9% of FY16F earnings from startup losses of S$22.5m last year. This would help to mitigate the earnings decline from Singapore power plants while other overseas utility businesses are expected to be stable this year. Besides, SCI has also made forays into other emerging markets - Bangladesh and Myanmar - and this should underpin the longer-term growth prospects of its utilities segment. Valuation: Given its diverse earnings stream and various listed assets, we derive our fair value for SCI based on the sum of its different parts: market valuations of its stakes in listed companies Sembcorp Marine (SGX-listed, 60.6% stake), Gallant Venture (SGX-listed, 11.96% stake) and Salalah (Muscat stock exchange, 40% stake) and earnings from utilities and urban development. For its holding company position, we have applied a 10% conglomerate discount to the reappraised net asset value (RNAV). We derive a TP of S$3.10, translating to 0.9x P/B. Key Risks to Our View: Key risks to earnings are further deferments / cancellations of marine projects, deterioration of Singapore power’s spark spreads, and execution hiccups at its Indian power plants. At A Glance Issued Capital (m shrs) 1,787 Mkt. Cap (S$m/US$m) 4,968 / 3,702 Major Shareholders (%) Temasek Holdings Pte Ltd 49.5 Mondrian Investment Partners Ltd 5.0
Free Float (%) 45.5 3m Avg. Daily Val (US$m) 10.6 ICB Industry : Oil & Gas / Oil Equipment; Services & Dist
DBS Group Research . Equity 3 Aug 2016
Singapore Company Guide
Sembcorp Industries Version 8 | Bloomberg: SCI SP | Reuters: SCIL.SI Refer to important disclosures at the end of this report
45
65
85
105
125
145
165
185
205
2.0
2.5
3.0
3.5
4.0
4.5
5.0
5.5
6.0
Aug-12 Aug-13 Aug-14 Aug-15 Aug-16
Relative IndexS$
Sembcorp Industries (LHS) Relative STI INDEX (RHS)
Page 44

ASIAN INSIGHTS VICKERS SECURITIES Page 2
Company Guide
Sembcorp Industries
WHAT’S NEW
2Q16 below
Results review and outlook SCI’s earnings slid 19% y-o-y to S$86.5m in 2Q16, as Marine profits dived from S$33.5m to a mere S$7.1m. In addition, TPCIL’s contribution was also delayed due to nearly two-month shutdown of its second unit due to equipment failure, as guided in early May. Elsewhere, the utilities business was relatively stable. This brings 1H16 net profit to S$193.5m, making up 37% of consensus’ FY16 estimate. Interim dividend of 4Scts was declared, down from 5 Scts last year given the earnings decline. Utilities stable; TPCIL growth deferred to 2H16. Utilities’ profit was stable at S$74.6m in 2Q16. TPCIL made a small loss of <S$1m due to shutdown of its second unit for repair and maintenance since Apr, as guided in May. The plant has since commenced operations in June, and profitability should pick up as 86% of the capacity has been contracted on long term Power Purchase Agreements (PPAs) effective April. We expect TPCIL to contribute S$45m or 9% of FY16F earnings from startup losses of S$22.5m last year. The power plants in India remain the segment’s growth driver in the next two years, mitigating earnings decline from the Singapore power plant, where the operating environment is competitive.
Marine hit by forex and impairment on Cosco shares. SMM’s headline net profit for 2Q16 tumbled 91% y-o-y and 79% q-o-q to S$11.5m (SCI’s share S$7.1m), hit by S$35m forex loss arising from the weaker GBP and USD as well as S$8m impairment charge on Cosco shares. Stripping these out, bottomline would have been c. S$50m, similar to 1Q, in line with expectations. Management believes the eye popping S$609m of provisions made for Sete projects (S$329m) and other rigs (~S$280m) in 4Q15 are adequate for now. We trimmed SMM’s FY16-17F earnings by 26-31% after factoring in the weak 2Q, pushing back the resumption of the Sete projects to 2018 and lowering our order wins assumption from S$2.5bn for this year to S$1.5bn. Urban Development saw sequential jump. Net profit surged from S$1.2m in 1Q to S$6.2m; land sales and margins tend to be lumpy quarter to quarter. Overall, it is expected to deliver a steady operating performance in 2016. In fact, FY16 could be a better year as land quota is expected to increase.
Quarterly / Interim Income Statement (S$m)
FY Dec 2Q2015 1Q2016 2Q2016 % chg yoy % chg qoq
Revenue 2,388 1,895 1,847 (22.7) (2.6)
Cost of Goods Sold (2,035) (1,627) (1,559) (23.4) (4.2)
Gross Profit 353 269 288 (18.4) 7.2
Other Oper. (Exp)/Inc (102) (78.8) (110) 8.0 39.2
Operating Profit 251 190 178 (29.1) (6.1)
Other Non Opg (Exp)/Inc 0.0 0.0 0.0
Associates & JV Inc 58.5 35.6 38.1 (34.9) 6.9
Net Interest (Exp)/Inc (50.1) (76.6) (85.1) (69.8) (11.1)
Exceptional Gain/(Loss) 54.5 12.1 (8.3)
Pre-tax Profit 314 161 123 (60.9) (23.6)
Tax (41.1) (29.9) (28.2) (31.5) (5.7)
Minority Interest (49.6) (24.0) (8.3) (83.3) (65.4)
Net Profit 224 107 86.5 (61.3) (19.2)
Net profit bef Except. 169 95.0 94.8 (44.0) (0.2)
EBITDA 0.0 225 216 nm (4.1)
Margins (%)
Gross Margins 14.8 14.2 15.6
Opg Profit Margins 10.5 10.0 9.7
Net Profit Margins 9.4 5.6 4.7
Source of all data: Company, DBS Bank
Page 45

ASIAN INSIGHTS VICKERS SECURITIES Page 3
Company Guide
Sembcorp Industries
CRITICAL DATA POINTS TO WATCH
Earnings Drivers:
Utilities projects pipeline should progressively add to earnings. New facilities will add to SCI’s power generation and water treatment capacities, which should increase earnings assuming the operations are profitable. A total of 3,800MW of power generation capacity, 140tph of steam capacity and 1.3million m3/day of water treatment capacity is expected to be added from now until 2018. This roughly translates to a 36%, 3% and 14% increase in power, steam and water treatment capacities respectively. Narrowing spark spreads in Singapore hit power generation earnings. Growth in supply of electricity outpacing the growth in consumption led to a 22% y-o-y fall in the Uniform Singapore Energy Price (USEP) in 2013, 21% in 2014 and a further 29% in 2015, shrinking the generator’s spark spreads – a barometer of profits on electricity sales. However, the impact will not be significant, as Singapore power generation only makes up <5% of SCI’s net income. Nonetheless, an increase in USEP prices going forward will help earnings. Greater contribution from non-Singapore power generation facilities would also alleviate the pressure on profitability. Marine business (SMM) earnings are orderbook-driven. Sembcorp Marine (SMM)’s orderbook has declined to S$9.2bn as of Jun-2016, in tandem with the downturn in the offshore oil & gas industry. Order wins of S$3.2bn in 2015 were weak but respectable amid the current environment; 2013 and 2014 saw full-year order wins of S$4.2bn. The current orderbook stretches until 2020, but there is risk of order deferments – which would spread revenues and earnings thinner – given that drilling units account for 75% of its value. Low oil prices led oil majors and asset owners to defer capex spending, hence, a rebound in oil prices should trigger more order wins for SMM, which would be positive for earnings. Urban Development business provides growth opportunities. Urban Development accounts for c.6% of SCI’s bottomline. Thus, a strong performance of this segment will not move the needle too much for now, but represents an avenue for growth. SCI has about 3,500ha of saleable land remaining across China, Indonesia and Vietnam, which it can develop. However, headwinds in the form of delays in China land sales have proven to be a stumbling block recently; better sales momentum, which we are seeing a glimmer of, would give some earnings uplift.
Marine contract wins
SCI Group Net Profit for 1H16 – Total S$193.5m
Utilities 1H16 Net Profit by Geography – Total S$149.9m
Utilities in Singapore 1H16 Net Profits – Total S$58.6m
Source: Company, DBS Bank
4,193 4,192
3,150
2,500
3,000
0
605
1,210
1,815
2,420
3,025
3,630
2013A 2014A 2015A 2016F 2017F
77%
21%
4%7%
-9%
Utilities
Marine
Urban Development
Other Businesses
Corporate
39%
34%2%7%
19%
13%
-14%Singapore
China
India
Rest of Asia
Middle East & Africa
UK & The Americas
Corporate
33%
24%
43%
Energy
Water
On-site Logistics & Solid Waste Management
Page 46

ASIAN INSIGHTS VICKERS SECURITIES Page 4
Company Guide
Sembcorp Industries
Balance Sheet:
SCI’s gearing stood at 0.9x as of June 2016, from 0.8x a quarter ago – a stark contrast to a net cash position in 2013; increasing leverage at SMM has been the main reason for the increase in debt levels. Overall, gearing remains at palatable levels and there is adequate debt headroom of approx S$1-2bn for SCI’s expansion capex and working capital. Share Price Drivers:
Oil price rebound would drive the share price higher. Investors would have greater confidence in the Marine business, as the operating environment improves. While drilling rig orders may lag oil price recovery, we could expect orders for production related facilities to flow through. Order wins in the Marine segment and land sales from Urban Development would bode well for SCI’s share price. While the oil price rebound would be an early indicator, securing contract wins by SMM is more tangible. More momentum in land sales would signal more hope for growth, and be positive to share price. Widening spark spreads at Singapore power plants. Signs of positive and widening spark spreads in Singapore would alleviate a key concern of investors and provide support to the share price. Key Risks:
Increasing competition in the Singapore power market. Total power generation supply in Singapore rose over 9% y-o-y in the past two years, marking the biggest y-o-y jumps since the electricity market started. This has depressed prices and hurt SCI’s bottom line. The oversupply of capacity and over-commitment of gas supply issues will likely continue to plague Singapore power market in the near-to-medium term. Execution of Indian power plants. The availability of coal supply and power purchase agreements (PPA) for SCI’s power plants in India are concerns. We find comfort that the TPCIL plant is up and running, with 86% of capacity committed on long term PPAs and operating using both domestic and imported coal. Company Background
Sembcorp Industries (SCI) is a trusted provider of essential energy and water solutions to both industrial and municipal customers. It has facilities with 10,600 megawatts of gross power capacity and over 10 million cubic metres of water per day in operation and under development. It is also a world leader in marine and offshore engineering (via Sembcorp Marine) as well as an established brand name in urban development (comprising industrial parks as well as business, commercial and residential space) in Vietnam, China and Indonesia.
Leverage & Asset Turnover (x)
Capital Expenditure
ROE (%)
Forward PE Band (x)
PB Band (x)
Source: Company, DBS Bank
0.4
0.5
0.5
0.6
0.6
0.7
0.7
0.8
0.8
0.9
0.9
0.00
0.10
0.20
0.30
0.40
0.50
0.60
0.70
0.80
0.90
2013A 2014A 2015A 2016F 2017F
Gross Debt to Equity (LHS) Asset Turnover (RHS)
0.0
200.0
400.0
600.0
800.0
1,000.0
1,200.0
1,400.0
1,600.0
2013A 2014A 2015A 2016F 2017F
Capital Expenditure (-)
S$m
0.0%
2.0%
4.0%
6.0%
8.0%
10.0%
12.0%
14.0%
16.0%
2013A 2014A 2015A 2016F 2017F
Avg: 12x
+1sd: 13.8x
+2sd: 15.6x
‐1sd: 10.3x
‐2sd: 8.5x
6.5
8.5
10.5
12.5
14.5
16.5
Aug-12 Aug-13 Aug-14 Aug-15 Aug-16
(x)
Avg: 1.53x
+1sd: 2.01x
+2sd: 2.49x
‐1sd: 1.05x
‐2sd: 0.58x0.5
1.0
1.5
2.0
2.5
Aug-12 Aug-13 Aug-14 Aug-15 Aug-16
(x)
Page 47

ASIAN INSIGHTS VICKERS SECURITIES Page 5
Company Guide
Sembcorp Industries
Key Assumptions
FY Dec 2013A 2014A 2015A 2016F 2017F Marine contract wins 4,193 4,192 3,150 2,500 3,000
Segmental Breakdown
FY Dec 2013A 2014A 2015A 2016F 2017F Revenues (S$m) Utilities 5,138 4,850 4,227 4,284 4,379 Marine 5,526 5,831 4,967 3,401 3,011 Industrial Parks 12.5 6.54 7.95 8.61 10.3
Other Businesses & Corporate 122 208 342 274 219
Total 10,798 10,895 9,545 7,967 7,619
Net Profit before EI (S$m)
Utilities 450 408 701 386 426 Marine 337 340 (176) 99.7 101 Industrial Parks 50.2 44.3 33.5 33.8 34.2 Other Businesses & Corporate (16.6) 8.78 (9.7) (18.5) (21.2) Total 820 801 549 501 540
Net Profit before EI Margins (%)
Utilities 8.8 8.4 16.6 9.0 9.7 Marine 6.1 5.8 (3.6) 2.9 3.4 Industrial Parks 401.4 678.1 421.3 392.9 330.7 Other Businesses & Corporate (13.6) 4.2 (2.8) (8.1) (8.0) Total 7.6 7.4 5.8 6.2 7.1
Income Statement (S$m)
FY Dec 2013A 2014A 2015A 2016F 2017F Revenue 10,798 10,895 9,545 7,967 7,619 Cost of Goods Sold (9,510) (9,480) (8,813) (7,074) (6,694) Gross Profit 1,287 1,415 732 893 925 Other Opng (Exp)/Inc (339) (352) (524) (271) (259) Operating Profit 948 1,062 207 622 666 Other Non Opg (Exp)/Inc 212 76.7 418 38.8 38.8 Associates & JV Inc 155 158 6.20 95.7 97.6 Net Interest (Exp)/Inc (101) (50.7) (205) (63.7) (60.9) Exceptional Gain/(Loss) 0.0 0.0 0.0 0.0 0.0 Pre-tax Profit 1,214 1,246 426 694 744 Tax (117) (162) 28.1 (128) (136) Minority Interest (277) (283) 94.5 (64.8) (64.8) Preference Dividend 0.0 0.0 0.0 0.0 0.0 Net Profit 820 801 549 501 540 Net Profit before Except. 820 801 549 501 540 EBITDA 1,619 1,612 1,015 1,161 1,228 Growth Revenue Gth (%) 6.0 0.9 (12.4) (16.5) (4.4) EBITDA Gth (%) 4.6 (0.4) (37.0) 14.3 5.8 Opg Profit Gth (%) (10.5) 12.0 (80.5) 200.2 7.1 Net Profit Gth (Pre-ex) (%) 8.9 (2.4) (31.5) (8.8) 8.0 Margins & Ratio Gross Margins (%) 11.9 13.0 7.7 11.2 12.1 Opg Profit Margin (%) 8.8 9.7 2.2 7.8 8.7 Net Profit Margin (%) 7.6 7.4 5.8 6.3 7.1 ROAE (%) 16.9 14.8 9.1 7.6 7.8 ROA (%) 6.2 5.2 3.0 2.5 2.7 ROCE (%) 9.5 8.3 1.4 3.2 3.3 Div Payout Ratio (%) 37.0 35.7 35.8 34.0 32.0 Net Interest Cover (x) 9.4 21.0 1.0 9.8 10.9
Source: Company, DBS Bank
Page 48

ASIAN INSIGHTS VICKERS SECURITIES Page 6
Company Guide
Sembcorp Industries
Quarterly / Interim Income Statement (S$m)
FY Dec 2Q2015 3Q2015 4Q2015 1Q2016 2Q2016 Revenue 2,388 2,399 2,419 1,895 1,847 Cost of Goods Sold (2,035) (2,110) (2,619) (1,627) (1,559) Gross Profit 353 290 (200) 269 288 Other Oper. (Exp)/Inc (102) (104) (252) (78.8) (110) Operating Profit 251 186 (451) 190 178 Other Non Opg (Exp)/Inc 0.0 0.0 0.0 0.0 0.0 Associates & JV Inc 58.5 21.2 (114) 35.6 38.1 Net Interest (Exp)/Inc (50.1) (57.0) (72.6) (76.6) (85.1) Exceptional Gain/(Loss) 54.5 0.0 371 12.1 (8.3) Pre-tax Profit 314 150 (266) 161 123 Tax (41.1) (10.9) 121 (29.9) (28.2) Minority Interest (49.6) (17.0) 207 (24.0) (8.3) Net Profit 224 122 60.8 107 86.5 Net profit bef Except. 169 122 (310) 95.0 94.8 EBITDA 408 207 (565) 225 216 Growth Revenue Gth (%) 2.1 0.5 0.8 (21.7) (2.6) EBITDA Gth (%) nm nm nm nm (4.1) Opg Profit Gth (%) 17.6 (26.0) nm nm (6.1) Net Profit Gth (Pre-ex) (%) 18.9 (27.7) nm nm (0.2) Margins Gross Margins (%) 14.8 12.1 (8.3) 14.2 15.6 Opg Profit Margins (%) 10.5 7.8 (18.7) 10.0 9.7 Net Profit Margins (%) 9.4 5.1 2.5 5.6 4.7
Balance Sheet (S$m)
FY Dec 2013A 2014A 2015A 2016F 2017F Net Fixed Assets 5,127 7,725 8,685 9,282 9,859 Invts in Associates & JVs 1,852 2,074 2,349 2,375 2,403 Other LT Assets 1,086 1,246 1,273 1,273 1,273 Cash & ST Invts 2,257 1,663 1,609 1,093 1,198 Inventory 2,241 3,205 4,233 3,794 3,463 Debtors 1,140 1,200 1,568 1,593 1,524 Other Current Assets 52.8 63.8 201 201 201 Total Assets 13,754 17,176 19,915 19,607 19,916 ST Debt 414 1,086 1,801 1,801 1,801 Creditor 2,692 2,745 3,388 2,828 2,705 Other Current Liab 1,796 1,526 758 640 638 LT Debt 1,485 3,649 5,032 5,032 5,032 Other LT Liabilities 837 938 894 894 894 Shareholder’s Equity 5,230 5,616 6,433 6,737 7,108 Minority Interests 1,300 1,616 1,610 1,675 1,740 Total Cap. & Liab. 13,754 17,176 19,915 19,607 19,916 Non-Cash Wkg. Capital (1,054) 198 1,856 2,120 1,846 Net Cash/(Debt) 358 (3,071) (5,223) (5,740) (5,635) Debtors Turn (avg days) 39.1 39.2 52.9 72.4 74.7 Creditors Turn (avg days) 109.5 108.3 132.8 170.1 161.0 Inventory Turn (avg days) 81.8 108.4 161.0 219.6 211.2 Asset Turnover (x) 0.8 0.7 0.5 0.4 0.4 Current Ratio (x) 1.2 1.1 1.3 1.3 1.2 Quick Ratio (x) 0.7 0.5 0.5 0.5 0.5 Net Debt/Equity (X) CASH 0.4 0.6 0.7 0.6 Net Debt/Equity ex MI (X) CASH 0.5 0.8 0.9 0.8 Capex to Debt (%) 61.3 27.4 20.2 14.6 14.6 Z-Score (X) 2.0 1.6 1.3 1.2 1.3
Source: Company, DBS Bank
Page 49

ASIAN INSIGHTS VICKERS SECURITIES Page 7
Company Guide
Sembcorp Industries
Cash Flow Statement (S$m)
FY Dec 2013A 2014A 2015A 2016F 2017F Pre-Tax Profit 1,214 1,246 426 693 742 Dep. & Amort. 303 315 405 403 423 Tax Paid (125) (119) (150) (192) (128) Assoc. & JV Inc/(loss) (155) (158) (6.2) (95.7) (97.6) Chg in Wkg.Cap. 141 (1,414) (1,961) (200) 265 Other Operating CF 92.0 72.9 525 0.0 0.0 Net Operating CF 1,470 (57.4) (761) 609 1,205 Capital Exp.(net) (1,164) (1,298) (1,381) (1,000) (1,000) Other Invts.(net) 16.1 4.30 9.98 0.0 0.0 Invts in Assoc. & JV (284) (280) (427) 0.0 0.0 Div from Assoc & JV 94.7 122 129 70.0 70.0 Other Investing CF (21.0) 10.9 471 0.0 0.0 Net Investing CF (1,358) (1,441) (1,199) (930) (930) Div Paid (413) (539) (415) (196) (170) Chg in Gross Debt 393 393 (982) 0.0 0.0 Capital Issues 0.0 0.0 0.0 0.0 0.0 Other Financing CF 81.9 1,049 3,289 0.0 0.0 Net Financing CF 61.8 903 1,892 (196) (170) Currency Adjustments 22.1 1.78 14.7 0.0 0.0 Chg in Cash 196 (594) (53.0) (518) 104 Opg CFPS (S cts) 73.9 76.1 67.3 45.3 52.6 Free CFPS (S cts) 17.0 (76.0) (120) (21.9) 11.5
Source: Company, DBS Bank
Target Price & Ratings History
Source: DBS Bank
Analyst: Pei Hwa Ho
S.No. DateClosing
Price
12-mth Target Price
Rat ing
1: 10 Aug 15 3.72 4.10 BUY
2: 19 Aug 15 3.39 0.98 BUY
3: 31 Aug 15 3.42 4.00 BUY
4: 18 Sep 15 3.50 4.00 BUY
5: 23 Sep 15 3.53 4.00 BUY
6: 30 Oct 15 3.58 4.20 BUY
7: 09 Dec 15 3.04 3.80 BUY
8: 06 Jan 16 2.92 0.91 BUY
9: 22 Jan 16 2.34 3.80 BUY
10: 27 Jan 16 2.23 3.50 BUY
11: 18 Feb 16 2.66 3.30 BUY12: 22 Feb 16 2.70 3.30 BUY13: 11 Mar 16 3.03 3.30 BUY14: 15 Mar 16 3.00 3.30 BUY
Note : Share price and Target price are adjusted for corporate actions. 15: 20 Apr 16 3.06 3.30 BUY16: 03 May 16 2.82 3.30 BUY17: 05 May 16 2.84 3.10 BUY18: 31 May 16 2.79 3.10 BUY
1 2
3
4
5
6
7
8
9
10
11
12 13
14
1516
17
18
2.08
2.58
3.08
3.58
4.08
Aug-15 Dec-15 Apr-16 Aug-16
S$
Page 50

ASIAN INSIGHTS VICKERS SECURITIES ed: JS / sa:AS
FULLY VALUED Last Traded Price: S$1.44 (STI : 2,918.62) Price Target : S$1.20 (-17% downside) (Prev S$1.24) Potential Catalyst: Vessel deliveries, oil price recovery Where we differ: In line Analyst Janice Chua +65 6682 3692 [email protected] Pei Hwa Ho +65 6682 3714 [email protected]
What’s New 2Q16 dragged by forex loss
Delivery of drilling rigs remain a challenge
Interim dividend of 1.5 Scts per share declared
Maintain FULLY VALUED; TP S$1.20
Price Relative
Forecasts and Valuation FY Dec (S$ m) 2014A 2015A 2016F 2017F Revenue 5,833 4,968 3,401 3,011 EBITDA 829 (216) 460 507 Pre-tax Profit 707 (378) 209 214 Net Profit 560 (290) 164 167 Net Pft (Pre Ex.) 560 (290) 164 167 Net Pft Gth (Pre-ex) (%) 4.1 nm nm 1.6 EPS (S cts) 26.8 (13.9) 7.87 8.00 EPS Pre Ex. (S cts) 26.8 (13.9) 7.87 8.00 EPS Gth Pre Ex (%) 4 nm nm 2 Diluted EPS (S cts) 27.0 (13.9) 7.87 8.00 Net DPS (S cts) 13.0 6.00 2.75 2.80 BV Per Share (S cts) 142 120 122 127 PE (X) 5.4 nm 18.2 17.9 PE Pre Ex. (X) 5.4 nm 18.2 17.9 P/Cash Flow (X) nm nm 4.5 6.0 EV/EBITDA (X) 4.6 nm 12.4 10.8 Net Div Yield (%) 9.1 4.2 1.9 2.0 P/Book Value (X) 1.0 1.2 1.2 1.1 Net Debt/Equity (X) 0.2 1.0 0.9 0.8 ROAE (%) 19.9 (10.6) 6.5 6.4 Earnings Rev (%): (26) (31) Consensus EPS (S cts): 9.7 9.5 Other Broker Recs: B: 2 S: 13 H: 5
Source of all data on this page: Company, DBS Bank, Bloomberg Finance L.P
Awaiting signs of turnaround
Reiterate FULLY VALUED rating with TP of S$1.20, based on 1.0x FY16 P/B. Sembcorp Marine (SMM)’s 2Q16 net profit plunged 91% y-o-y to S$11.5m dragged by forex loss of S$35m and S$8m impairment charge on Cosco shares. Stripping these out, results were broadly in line. We have cut FY16-17F earnings by 26-31% factoring in the forex loss in 2Q, pushing back commencement of Sete projects to 2018 and lowering our order win assumption. Environment remains challenging. While SMM had made provisions of S$609m for 75% of the outstanding rig orders in FY15, additional provisions could still be required if the operating environment deteriorates further, especially in Brazil, which accounts for 35% of SMM’s orderbook. Deferment and cancellation risks remain prevalent in the current climate. The delivery of the deferred units (for Sete, Transocean, Oro Negro, Perisai, Seadrill) will have to come through to improve operating cash flow and lower its high net gearing of 1.0x. Declining order book. Its orderbook declined by S$500m q-o-q to S$9.2bn as at the end of June 2016, and is set to decline further as we anticipate order flows to remain sluggish. The orderbook stood at S$6bn excluding Sete’s rig orders. We believe rig orders are unlikely to make a comeback anytime soon, given the supply glut amid the oil crisis. New order wins of S$3.2bn in 2015 came from two sizeable contracts to build a fixed platform and the world’s largest semi-submersible crane vessel. We now expect SMM to secure S$1.5bn in new orders in 2016 (from S$2.5bn earlier). SMM has clinched orders worth S$320m year-to-date. Valuation:
Our target price of S$1.20 is based on 1.0x FY16 P/B, which is justifiable, as ROE is only 10%. SMM’s book value was written down after the massive S$609m provisions in FY15. Key Risks to Our View:
Key downside risks are sustained low oil prices which affect rig count and newbuilding activities, execution risks in protected markets, especially Brazil, and further deferments/cancellations. Upside risk could come from privatisation or M&A activities as well as write-back of the provisions with successful deliveries or vessel sales. At A Glance Issued Capital (m shrs) 2,090 Mkt. Cap (S$m/US$m) 2,999 / 2,215 Major Shareholders (%) Sembcorp Industries Ltd 61.0 Franklin Resources 5.0
Free Float (%) 34.0 3m Avg. Daily Val (US$m) 5.0 ICB Industry : Oil & Gas / Oil Equipment; Services & Dist
DBS Group Research . Equity 29 Jul 2016
Singapore Company Guide
Sembcorp Marine Version 7 | Bloomberg: SMM SP | Reuters: SCMN.SI Refer to important disclosures at the end of this report
28
48
68
88
108
128
148
168
188
208
1.2
1.7
2.2
2.7
3.2
3.7
4.2
4.7
5.2
5.7
Jul-12 Jul-13 Jul-14 Jul-15 Jul-16
Relative IndexS$
Sembcorp Marine (LHS) Relative STI INDEX (RHS)
Page 51

ASIAN INSIGHTS VICKERS SECURITIES Page 2
Company Guide
Sembcorp Marine
WHAT’S NEW
Another weak quarter
Result comments
2Q16 dragged by forex losses. SMM’s headline net profit for 2Q16 tumbled 91% y-o-y to S$11.5m, hit by S$35m forex loss arising from the weaker GBP and USD as well as S$8m impairment charge on Cosco shares. Stripping these out, bottomline would have been c. S$50m, similar to 1Q, in line with expectations. 1H16 earnings of S$66m made up a mere 31% of consensus’ full year estimate.
2Q16 revenue was steady q-o-q at the S$900m level while EBIT margin (excl forex impact) would have been slightly better than 1Q16’s 7.8%.
Key takeaways from briefing
1. No further provisions in 1H16. Management believes that the provisions of S$609m made in FY15 for Sete projects (S$329m) and other rigs (~S$280m) is adequate under current circumstances taking into consideration the net realisable value of these higher risk rig orders.
2. Net gearing crept up to 1.2x as of end-June but reduced to <1.0x in July, following receipts of S$909m from the deliveries of Noble Lloyd Noble jackup rig and fixed platform projects. Working capital is expected to have peaked with declining capex requirements going forward. Capex in 2016 is projected to be less than half of last year’s.
3. Orderbook stood at S$6.0bn (excluding S$3.2bn for Sete’s rigs). SMM has secured a total of S$320m in non-rig orders in 1H16, of which S$180m is a variation order for a FPSO project. To recap, Sete Brasil is undergoing restructuring and exact plans remain unclear. SMM has collected a total of S$2.7bn from Sete Brasil as at Nov-2014, and is marginally in deficit in terms of cash flow as at Jun-2016, and this has been provided for.
Earnings revisions
We cut FY16-17F earnings by 26-31% after factoring the forex loss and impairment in 2Q, pushing back the resumption of the Sete projects to 1Q18 and lowering order win assumption from S$2.5bn to S$1.5bn this year.
Quarterly / Interim Income Statement (S$m)
FY Dec 2Q2015 1Q2016 2Q2016 % chg yoy % chg qoq
Revenue 1,208 918 908 (24.8) (1.1)
Cost of Goods Sold (1,009) (838) (802) (20.5) (4.3)
Gross Profit 199 80.6 106 (46.5) 32.1
Other Oper. (Exp)/Inc (52.1) (8.9) (52.9) 1.7 496.4
Operating Profit 147 71.7 53.6 (63.5) (25.3)
Other Non Opg (Exp)/Inc 0.44 9.50 (8.4) nm nm
Associates & JV Inc (2.6) 2.61 (4.7) (80.4) nm
Net Interest (Exp)/Inc (8.9) (15.6) (21.2) (139.2) (36.6)
Exceptional Gain/(Loss) 0.11 0.0 0.0 nm nm
Pre-tax Profit 136 68.3 19.2 (85.8) (71.8)
Tax (22.8) (12.7) (8.5) (62.7) nm
Minority Interest (3.9) (0.8) 0.72 (118.2) nm
Net Profit 109 54.8 11.5 (89.5) (79.1)
Net profit bef Except. 109 54.8 11.5 (89.5) (79.1)
EBITDA 176 119 76.1 (56.8) (35.8)
Margins (%)
Gross Margins 16.5 8.8 11.7
Opg Profit Margins 12.2 7.8 5.9
Net Profit Margins 9.0 6.0 1.3
Source of all data: Company, DBS Bank
Page 52

ASIAN INSIGHTS VICKERS SECURITIES Page 3
Company Guide
Sembcorp Marine
CRITICAL DATA POINTS TO WATCH
Earnings Drivers:
Declining orderbook. Order wins and orderbook trends are often the key drivers of rigbuilders’ share price and earnings. Based on existing capacity, SMM requires S$4-5bn worth of order replenishments every year. We expect new orders to be 40% of those levels in the coming two years amid sector headwinds, a harbinger of declining orderbook and earnings ahead. SMM’s orderbook stood at S$9.2bn as at June 2016, of which c. 35% comes from the drillship projects with Sete Brasil. While this translates into a book-to-bill ratio of over 2x based on existing delivery schedule, it is vulnerable to deferments and cancellations. Asset deflation underway. Post-GFC, newbuild prices for drilling rigs tumbled 20-30% from 2008-2010. The 5-15% price gain over the past few years could all be given back, if not worse. In this downturn, China is playing a bigger role in global rig market, garnering one-third of the global orderbook. Over 90% of these contracts are built on speculation, without back-to-back charters and on 5:95 balloon payment terms, making it vulnerable to cancellations. We expect fire sales to suppress rig prices as shipyards would be desperate to recoup their construction costs if ship owners walk away. Rig utilisation and dayrates remain weak. Low oil prices is adding fuel to fire, aggravating the already challenging rigbuilding market that is suffering from a massive order backlog and keen competition. Utilisation and day rates have fallen by around 40-50% from June 2014 levels. We believe a gradual recovery in oil prices and rig market towards 2017 will set the stage for rising newbuild demand thereafter. Pace of rigbuilding recovery is dependent on oil price rebound, retirement of old fleets, and cancellations at Chinese yards. An oil price rebound to above US$60/bbl will stimulate E&P activities and thus rig demand, while rig attribution and cancellations will soothe the supply pressure and eventually bring the sector back to equilibrium.
New order wins (S$ m)
Sales Trend
Asset Trend
Profitability Trend
Margin Trends (%)
Source: Company, DBS Bank
4,193 4,192
3,150 2,500
3,000
0
500
1,000
1,500
2,000
2,500
3,000
3,500
4,000
2013A 2014A 2015A 2016F 2017F
- 20.0%
- 10.0%
0.0%
10.0%
20.0%
30.0%
0
1,000
2,000
3,000
4,000
5,000
2013A 2014A 2015A 2016F 2017F
S$ m
Total Revenue Revenue Growth (%) (YoY)
1,000
2,000
3,000
4,000
5,000
6,000
7,000
8,000
9,000
2013A 2014A 2015A 2016F 2017F
S$ m
Net Fixed Assets (Tangible) Total Current Assets
231
281
331
381
431
481
531
581
631
681
2013A 2014A 2015A 2016F 2017F
S$ m
Operating EBIT Pre tax Profit Net Profit
0%
2%
4%
6%
8%
10%
12%
14%
16%
18%
20%
2013A 2014A 2015A 2016F 2017F
EBITDA Margin % EBIT Margin % Net Income Margin %
Page 53

ASIAN INSIGHTS VICKERS SECURITIES Page 4
Company Guide
Sembcorp Marine
Balance Sheet:
Net gearing crept up to 1.2x as at end Jun 2016, from 1.1x a quarter ago, but has reduced to <1.0x in July, following the receipts of S$909m from deliveries of Noble Lloyd Noble jackup rig and fixed platform projects. Gearing level should decline further with the delivery of newbuild vessels. In addition, the completion of the new yard in 2016 will reduce yard capex to a more normalised level of S$400m this year, S$200m next year and S$100m thereafter. Share Price Drivers:
Recovery in oil prices. Rising oil prices typically lift sentiment on rigbuilders. We believe SMM would benefit if oil prices recover to at least the US$60/bbl level, which would trigger more offshore oil & gas capex spending. Order win momentum. Shipyards are orderbook-driven. Strong order flows could push up the share price, as investors reward greater visibility on revenues and earnings. Restructuring of Sete Brasil. The successful restructuring of Brazil will allow Sete Brasil to obtain financing for its rigbuilding programme. This will eliminate an overhang on the rigbuilders. Key Risks:
Sustained low oil price. Brent crude oil prices of below US$60/bbl would defer investments into deepwater projects, and higher cost oilfield projects. This could dampen newbuild demand for drilling rigs, especially floaters. Rig supply glut and competition. A slower order flow is expected, as the market takes time to absorb about 160 rigs scheduled for delivery in the next two years, representing c.20% of its existing fleet. Competition has intensified with the low order backlog of Korean yards and emergence of Chinese shipyards in the offshore space. Company Background
Sembcorp Marine (SMM) is a pure play in the offshore & marine sector. Its principal activities are rig building and offshore engineering, ship conversion, ship repair and shipbuilding of specialised vessels.
Leverage & Asset Turnover (x)
Capital Expenditure
ROE (%)
PB Band (x)
Source: Company, DBS Bank
0.3
0.4
0.5
0.6
0.7
0.8
0.9
0.00
0.20
0.40
0.60
0.80
1.00
1.20
1.40
2013A 2014A 2015A 2016F 2017F
Gross Debt to Equity (LHS) Asset Turnover (RHS)
0.0
100.0
200.0
300.0
400.0
500.0
600.0
700.0
800.0
900.0
1,000.0
2013A 2014A 2015A 2016F 2017F
Capital Expenditure (-)
S$m
0.0%
5.0%
10.0%
15.0%
20.0%
2013A 2014A 2015A 2016F 2017F
Avg: 2.76x
+1sd: 3.7x
+2sd: 4.64x
‐1sd: 1.83x
‐2sd: 0.89x0.8
1.3
1.8
2.3
2.8
3.3
3.8
4.3
4.8
Jul-12 Jul-13 Jul-14 Jul-15 Jul-16
(x)
Page 54

ASIAN INSIGHTS VICKERS SECURITIES Page 5
Company Guide
Sembcorp Marine
Key Assumptions
FY Dec 2013A 2014A 2015A 2016F 2017F New order wins (S$ m) 4,193 4,192 3,128 1,500 2,000
Segmental Breakdown
FY Dec 2013A 2014A 2015A 2016F 2017F Revenues (S$m) Rigs & Floaters 3,564 4,207 3,319 2,052 1,318 Offshore Platforms 1,204 925 1,017 787 1,057 Repairs & Upgrades 681 622 557 482 557 Specialised Shipbuilding 0.0 0.0 0.0 0.0 0.0 Others 76.9 78.6 75.8 80.0 80.0 Total 5,526 5,833 4,968 3,401 3,011
Income Statement (S$m)
FY Dec 2013A 2014A 2015A 2016F 2017F Revenue 5,526 5,833 4,968 3,401 3,011 Cost of Goods Sold (4,818) (4,989) (4,837) (2,948) (2,587) Gross Profit 708 844 131 453 424 Other Opng (Exp)/Inc (78.3) (137) (281) (119) (93.3) Operating Profit 630 707 (150) 334 331 Other Non Opg (Exp)/Inc 1.96 1.19 (18.2) (8.0) 0.0 Associates & JV Inc 15.6 9.86 (174) (26.1) (0.1) Net Interest (Exp)/Inc 0.13 (11.3) (36.0) (90.5) (116) Exceptional Gain/(Loss) 17.8 0.10 0.0 0.0 0.0 Pre-tax Profit 665 707 (378) 209 214 Tax (76.7) (106) 77.6 (37.6) (38.6) Minority Interest (32.5) (41.2) 10.3 (6.9) (8.8) Preference Dividend 0.0 0.0 0.0 0.0 0.0 Net Profit 556 560 (290) 164 167 Net Profit before Except. 538 560 (290) 164 167 EBITDA 744 829 (216) 460 507 Growth Revenue Gth (%) 24.7 5.6 (14.8) (31.5) (11.5) EBITDA Gth (%) 6.0 11.4 nm nm 10.3 Opg Profit Gth (%) 13.6 12.3 nm nm (0.8) Net Profit Gth (Pre-ex) (%) 7.5 4.1 nm nm 1.6 Margins & Ratio Gross Margins (%) 12.8 14.5 2.6 13.3 14.1 Opg Profit Margin (%) 11.4 12.1 (3.0) 9.8 11.0 Net Profit Margin (%) 10.1 9.6 (5.8) 4.8 5.5 ROAE (%) 21.7 19.9 (10.6) 6.5 6.4 ROA (%) 8.5 7.2 (3.3) 1.9 2.0 ROCE (%) 15.9 13.2 (2.6) 4.3 4.1 Div Payout Ratio (%) 48.9 48.5 N/A 35.0 35.0 Net Interest Cover (x) NM 62.9 (4.2) 3.7 2.8
Source: Company, DBS Bank
Page 55

ASIAN INSIGHTS VICKERS SECURITIES Page 6
Company Guide
Sembcorp Marine
Quarterly / Interim Income Statement (S$m)
FY Dec 2Q2015 3Q2015 4Q2015 1Q2016 2Q2016 Revenue 1,208 1,130 1,327 918 908 Cost of Goods Sold (1,009) (1,039) (1,655) (838) (802) Gross Profit 199 90.8 (328) 80.6 106 Other Oper. (Exp)/Inc (52.1) (16.0) (182) (8.9) (52.9) Operating Profit 147 74.8 (510) 71.7 53.6 Other Non Opg (Exp)/Inc 0.44 (17.1) (1.7) 9.50 (8.4) Associates & JV Inc (2.6) (24.4) (150) 2.61 (4.7) Net Interest (Exp)/Inc (8.9) (10.6) (9.4) (15.6) (21.2) Exceptional Gain/(Loss) 0.11 0.0 (0.2) 0.0 0.0 Pre-tax Profit 136 22.6 (671) 68.3 19.2 Tax (22.8) 8.95 118 (12.7) (8.5) Minority Interest (3.9) 0.60 16.7 (0.8) 0.72 Net Profit 109 32.1 (537) 54.8 11.5 Net profit bef Except. 109 32.1 (537) 54.8 11.5 EBITDA 176 65.1 (624) 119 76.1 Growth Revenue Gth (%) (7.4) (6.4) 17.4 (30.8) (1.1) EBITDA Gth (%) 1.8 (63.0) nm nm (35.8) Opg Profit Gth (%) 6.4 (49.1) nm nm (25.3) Net Profit Gth (Pre-ex) (%) 3.2 (70.6) nm nm (79.1) Margins Gross Margins (%) 16.5 8.0 (24.7) 8.8 11.7 Opg Profit Margins (%) 12.2 6.6 (38.4) 7.8 5.9 Net Profit Margins (%) 9.0 2.8 (40.5) 6.0 1.3
Balance Sheet (S$m)
FY Dec 2013A 2014A 2015A 2016F 2017F Net Fixed Assets 2,394 3,009 3,541 3,780 3,803 Invts in Associates & JVs 446 470 312 286 286 Other LT Assets 189 192 231 231 231 Cash & ST Invts 1,695 1,093 690 1,083 1,328 Inventory 2,084 3,005 3,833 2,429 2,151 Debtors 442 469 590 425 376 Other Current Assets 0.20 0.20 3.89 3.89 3.89 Total Assets 7,250 8,238 9,201 8,239 8,180 ST Debt 166 434 915 915 915 Creditor 1,781 1,826 2,519 1,360 1,204 Other Current Liab 1,583 1,189 463 364 342 LT Debt 600 1,308 2,465 2,715 2,715 Other LT Liabilities 310 350 175 175 175 Shareholder’s Equity 2,677 2,965 2,511 2,550 2,660 Minority Interests 132 167 153 160 169 Total Cap. & Liab. 7,250 8,238 9,201 8,239 8,180 Non-Cash Wkg. Capital (838) 459 1,445 1,134 985 Net Cash/(Debt) 929 (648) (2,690) (2,547) (2,302) Debtors Turn (avg days) 30.1 28.5 38.9 54.5 48.6 Creditors Turn (avg days) 134.1 134.9 168.3 253.9 194.2 Inventory Turn (avg days) 147.5 190.4 264.9 410.0 346.8 Asset Turnover (x) 0.8 0.8 0.6 0.4 0.4 Current Ratio (x) 1.2 1.3 1.3 1.5 1.6 Quick Ratio (x) 0.6 0.5 0.3 0.6 0.7 Net Debt/Equity (X) CASH 0.2 1.0 0.9 0.8 Net Debt/Equity ex MI (X) CASH 0.2 1.1 1.0 0.9 Capex to Debt (%) 104.0 42.4 27.6 11.0 5.5 Z-Score (X) 2.0 2.0 1.2 1.4 1.5
Source: Company, DBS Bank
Page 56

ASIAN INSIGHTS VICKERS SECURITIES Page 7
Company Guide
Sembcorp Marine
Cash Flow Statement (S$m)
FY Dec 2013A 2014A 2015A 2016F 2017F Pre-Tax Profit 665 707 (378) 209 214 Dep. & Amort. 101 115 132 161 177 Tax Paid (53.6) (82.8) (104) (46.6) (37.6) Assoc. & JV Inc/(loss) (15.6) (9.9) 174 26.1 0.05 Chg in Wkg.Cap. 243 (1,267) (291) 319 149 Other Operating CF (1.8) 29.5 (521) 0.0 0.0 Net Operating CF 937 (508) (989) 668 502 Capital Exp.(net) (797) (738) (932) (400) (200) Other Invts.(net) 0.0 (26.5) 0.0 0.0 0.0 Invts in Assoc. & JV (0.3) 0.0 0.0 0.0 0.0 Div from Assoc & JV 1.18 0.0 0.0 0.0 0.0 Other Investing CF (1.5) (5.4) 0.0 0.0 0.0 Net Investing CF (798) (770) (932) (400) (200) Div Paid (283) (285) (265) (125) (57.6) Chg in Gross Debt 438 964 1,744 250 0.0 Capital Issues (19.8) (10.8) (11.3) 0.0 0.0 Other Financing CF 0.0 1.99 2.02 0.0 0.0 Net Financing CF 135 670 1,469 125 (57.6) Currency Adjustments 11.2 (7.2) 4.71 0.0 0.0 Chg in Cash 286 (616) (447) 393 245 Opg CFPS (S cts) 33.2 36.3 (33.4) 16.7 16.9 Free CFPS (S cts) 6.71 (59.7) (92.0) 12.8 14.5
Source: Company, DBS Bank
Target Price & Ratings History
Source: DBS Bank
S.No. DateClosing
PriceT arget Price
Rat ing
1: 10 Aug 15 2.67 2.55 HOLD
2: 31 Aug 15 2.39 2.48 HOLD
3: 18 Sep 15 2.40 2.48 HOLD
4: 23 Oct 15 2.46 2.32 HOLD
5: 26 Oct 15 2.41 2.32 HOLD
6: 16 Nov 15 2.22 2.32 HOLD
7: 18 Nov 15 2.20 2.32 HOLD
8: 02 Dec 15 1.97 1.85 FULLY VALUED
9: 11 Jan 16 1.58 1.85 FULLY VALUED
10: 18 Jan 16 1.32 1.85 FULLY VALUED
11: 25 Jan 16 1.50 1.85 FULLY VALUED12: 01 Feb 16 1.50 1.35 FULLY VALUED13: 10 Feb 16 1.47 1.35 FULLY VALUED14: 15 Feb 16 1.46 1.35 FULLY VALUED
Note : Share price and Target price are adjusted for corporate actions. 15: 16 Feb 16 1.57 1.24 FULLY VALUED16: 22 Feb 16 1.64 1.24 FULLY VALUED17: 02 Mar 16 1.58 1.24 FULLY VALUED18: 11 Mar 16 1.73 1.24 FULLY VALUED19: 15 Mar 16 1.68 1.24 FULLY VALUED20: 20 Apr 16 1.85 1.24 FULLY VALUED21: 28 Apr 16 1.69 1.24 FULLY VALUED22: 03 May 16 1.64 1.24 FULLY VALUED
12
3
4
5 6
7 8
91011
121314
15
16
17
18
19
20
21
22
1.24
1.44
1.64
1.84
2.04
2.24
2.44
2.64
2.84
Jul-15 Nov-15 Mar-16 Jul-16
S$
Page 57

ASIAN INSIGHTS VICKERS SECURITIES ed: CK / sa: BC
BUYBUYBUYBUY Last Traded Price: Last Traded Price: Last Traded Price: Last Traded Price: RM0.72 (KLCIKLCIKLCIKLCI : : : : 1,639.98) Price Target :Price Target :Price Target :Price Target : RM0.85 (19% upside) (Prev RM0.85) Potential Catalyst: Potential Catalyst: Potential Catalyst: Potential Catalyst: i) Completion and delivery of all FPSOs under
conversion, ii) replacement contract win for FPSO Claire, iii) turnaround
in OSV segment
Where we Where we Where we Where we differ:differ:differ:differ: Our forecasts are slightly below the consensus band Analyst TAN Jianyuan +603 2604 3919 [email protected]
Price Relative
Forecasts and Valuation FY FY FY FY DecDecDecDec ((((RMRMRMRMmmmm) ) ) ) 2015201520152015AAAA 2016201620162016FFFF 2017201720172017FFFF 2018201820182018FFFF
Revenue 2,180 1,680 2,680 2,745 EBITDA 1,118 1,015 1,347 1,372 Pre-tax Profit (171) 216 483 517 Net Profit (235) 166 367 394 Net Pft (Pre Ex.) 325 166 367 394 Net Pft Gth (Pre-ex) (%) 25.3 (48.8) 120.6 7.2 EPS (sen) (4.0) 2.84 6.26 6.71 EPS Pre Ex. (sen) 5.55 2.84 6.26 6.71 EPS Gth Pre Ex (%) 25 (49) 121 7 Diluted EPS (sen) (4.0) 2.84 6.26 6.71 Net DPS (sen) 1.63 0.71 1.56 1.68 BV Per Share (sen) 124 126 131 136 PE (X) nm 25.2 11.4 10.7 PE Pre Ex. (X) 12.9 25.2 11.4 10.7 P/Cash Flow (X) 7.8 4.5 3.0 4.9 EV/EBITDA (X) 9.6 10.9 7.5 7.1 Net Div Yield (%) 2.3 1.0 2.2 2.3 P/Book Value (X) 0.6 0.6 0.5 0.5 Net Debt/Equity (X) 0.9 0.9 0.8 0.7 ROAE (%) (3.4) 2.3 4.9 5.0 Earnings Rev (%):Earnings Rev (%):Earnings Rev (%):Earnings Rev (%): 0 0 0 Consensus EPS Consensus EPS Consensus EPS Consensus EPS (sen):::: 3.5 7.5 8.7
Other Broker Recs:Other Broker Recs:Other Broker Recs:Other Broker Recs: B: 10 S: 1 H: 9
Source of all data: Company, AllianceDBS Research, Bloomberg Finance L.P
Top BUY call in the big-cap space Currently trading near Currently trading near Currently trading near Currently trading near ----2SD of its 52SD of its 52SD of its 52SD of its 5----year mean P/BV. year mean P/BV. year mean P/BV. year mean P/BV. Bumi Armada’s (BAB) share price has appreciated 10% since we upgraded the stock to a BUY in our 1 June 2016 report. At the current level, the stock still offers 19% upside potential to our target price. In this report, we take the opportunity to cite BAB as our top BUY in the big-cap oil & gas space, as we continue to like its appealing valuation and its business model – whose long-term recurring income nature provides some earnings visibility under the current environment. Earnings will be driven by its RM24.2bn orderbook. Earnings will be driven by its RM24.2bn orderbook. Earnings will be driven by its RM24.2bn orderbook. Earnings will be driven by its RM24.2bn orderbook. While earnings are looking to be weaker compared to the previous year as conversion activities are already near the tail-end, its massive RM24.2bn orderbook will slowly be converted into earnings and cash flow upon completion of its FPSO conversions. Its current orderbook comprise 89% FPSO, while OSV and T&I segments make up the remaining 11%. Extension options are valued at RM12.2bn. Valuation: We continue to be positive on BAB’s long- term earnings prospects. We maintain our BUY call on the stock with an unchanged target price of RM0.85. Our SOP valuation comprises DCF valuation for the FPSO business (WACC: 6%) and 12x PE valuation for the T&I businesses. We did not ascribe any value to the OSV segment due to its negative earnings and we reckon that the OSV market will continue to see weak demand in the current environment. Key Risks to Our View: Delay in current conversion progress and likelihood of Delay in current conversion progress and likelihood of Delay in current conversion progress and likelihood of Delay in current conversion progress and likelihood of contract termination. contract termination. contract termination. contract termination. We do not rule out any potential red flag for the termination of Armada’s other FPSOs, especially if sustained weak oil prices further erode the oilfield economic viability for operators. At A Glance Issued Capital (m shrs) 5,866
Mkt. Cap (RMm/US$m) 4,194 / 1,041
Major Shareholders (%)
Objektif Bersatu Sdn Bhd 34.9%
Skim ASB 7.8%
EPF 7.1% Free Float (%) 50.1%
3m Avg. Daily Val (US$m) 5.3
ICB IndustryICB IndustryICB IndustryICB Industry : Oil & Gas / Industrial Transportation
DBS Group Research . Equity
24 Jun 2016
Malaysia Company Guide
Bumi Armada Version 2 | Bloomberg: BAB MK | Reuters: BUAB.KL Refer to important disclosures at the end of this report
23
43
63
83
103
123
143
163
183
203
0.6
1.1
1.6
2.1
2.6
Jun-12 Jun-13 Jun-14 Jun-15 Jun-16
Relative IndexRM
Bumi Armada (LHS) Relative KLCI INDEX (RHS)
Page 58

ASIAN INSIGHTS VICKERS SECURITIES
Company Guide
Bumi Armada
CRITICAL DATA POINTS TO WATCH
Earnings Drivers:
Steady cash flow stream from FPSO upon conversion Steady cash flow stream from FPSO upon conversion Steady cash flow stream from FPSO upon conversion Steady cash flow stream from FPSO upon conversion
completion. completion. completion. completion. BAB will continue to focus on completing its
current three new FPSOs (Armada Kraken, Olombendo and
Madura), with FSU Malta under conversion this year. This will be
a priority for BAB as it needs to convert its current orderbook
into earnings and generate cash flow.
Legal claimLegal claimLegal claimLegal claimssss ppppertaining to FPSO Claire. ertaining to FPSO Claire. ertaining to FPSO Claire. ertaining to FPSO Claire. Any positive outcome for
the ongoing legal claims against Woodside with regard to the
termination of FPSO Claire will ultimately benefit BAB. We
gathered that BAB has fully settled its outstanding debt on FPSO
Claire and hence, the success in getting claims from Woodside
will boost its cash position. However, we remain rather
conservative and feel that BAB is unlikely to fully recover the
claimed amount of USD283.5m. Note that we have not
incorporated any termination proceeds into our earnings
forecast.
Adverse macroeconomicAdverse macroeconomicAdverse macroeconomicAdverse macroeconomic conditionsconditionsconditionsconditions continue to impact OSV continue to impact OSV continue to impact OSV continue to impact OSV
operations. operations. operations. operations. BAB recorded first OSV segment operating loss of
RM117m in FY15, compared to a profit of RM34.5m in FY14.
The overall fleet utilisation averaged 55% for the year. Moving
forward, its OSV segment is expected to stay weak in the
medium term. We expect its fleet utilisation to decline further to
46%, with more vessels being stacked on top of the current
number of 14 units.
Sum-of-parts table
RM mRM mRM mRM m RemarksRemarksRemarksRemarks
Offshore Support Vessels - 7x P/E, FY16F
Transport & Installation 634 12x P/E, FY16F
FPSO 10,944 DCF
Net Debt (6,504)
Total (RMm)Total (RMm)Total (RMm)Total (RMm) 5,0745,0745,0745,074
Shares Outstanding (m) 5,866
Target Price (RM)Target Price (RM)Target Price (RM)Target Price (RM) 0.850.850.850.85
Source: AllianceDBS
OSV Utilisation (%)
No of operating FPSO
No of FPSO under conversion
T&I Vessels Utilisation (%)
Source: Company, AllianceDBS Research
55
46.743.3
50
0.0
7.9
15.9
23.8
31.7
39.7
47.6
55.6
2015A 2016F 2017F 2018F
6 6 6
9 9
0.00
1.84
3.67
5.51
7.34
9.18
2014A 2015A 2016F 2017F 2018F
3 3 3
0 00.00
0.61
1.22
1.84
2.45
3.06
2014A 2015A 2016F 2017F 2018F
40
3537.5
0.0
8.1
16.2
24.2
32.3
40.4
2016F 2017F 2018F
Page 59

ASIAN INSIGHTS VICKERS SECURITIES
Company Guide
Bumi Armada
Balance Sheet:
Bumi Armada’s net debt level has increased slightly from
RM6.5bn as at 4Q15 to RM6.6bn in 1Q16, taking the gearing
level to 1x. 20% of its total debt profile is short term. Currently,
73% of its loans are denominated in USD, while 27% are in
MYR.
We expect BAB’s operating cash flow to show a significant
jump in FY17, with three other FPSO coming onstream that will
progressively reduce its gearing level moving forward.
Share Price Drivers:
BAB’s share price is currently trading close to BAB’s share price is currently trading close to BAB’s share price is currently trading close to BAB’s share price is currently trading close to ----2SD of its 52SD of its 52SD of its 52SD of its 5----yyyyear ear ear ear
historical mean.historical mean.historical mean.historical mean. We believe this has already priced in risks of
more FPSO terminations. Any improvement in macroeconomics
or ongoing legal claim success could help re-rate the share
price.
New replacement contract win for the recently terminated FPNew replacement contract win for the recently terminated FPNew replacement contract win for the recently terminated FPNew replacement contract win for the recently terminated FPSO SO SO SO
ClaireClaireClaireClaire could most certainly restore some investor confidence.
Key Risks:
Economic viability. Economic viability. Economic viability. Economic viability. Offshore oil & gas capital expenditure is
largely dependent on the crude oil price outlook, which will
ultimately determine contracts in the pipeline. FPSO demand
depends on the economic viability of oilfields. If oil prices can
no longer justify the field production cost, operators may
decide to pull the plug – resulting in the termination of FPSO.
Susceptible to demand and supply cycles in the OSV market. Susceptible to demand and supply cycles in the OSV market. Susceptible to demand and supply cycles in the OSV market. Susceptible to demand and supply cycles in the OSV market.
More new OSV deliveries globally are slowing chartering
activity, especially for older vessels. Periods of weak crude oil
prices would also discourage drilling activity, which would in
turn reduce the demand for OSVs.
Volatility in USD exchange rate.Volatility in USD exchange rate.Volatility in USD exchange rate.Volatility in USD exchange rate. Any further strengthening in
MYR would negatively affect BAB’s earnings, as its revenue
and cash flow are denominated mainly in USD.
Company Background
Bumi Armada charters and operates FPSOs, OSV and provides
transport and installation services.
Leverage & Asset Turnover (x)
Capital Expenditure
ROE (%)
Forward PE Band (x)
PB Band (x)
Source: Company, AllianceDBS Research
0.0
0.1
0.1
0.2
0.2
0.3
0.3
0.00
0.20
0.40
0.60
0.80
1.00
1.20
2014A 2015A 2016F 2017F 2018F
Gross Debt to Equity (LHS) Asset Turnover (RHS)
0.0
500.0
1,000.0
1,500.0
2,000.0
2,500.0
3,000.0
3,500.0
4,000.0
4,500.0
2014A 2015A 2016F 2017F 2018F
Capital Expenditure (-)
RMm
0.0%
1.0%
2.0%
3.0%
4.0%
5.0%
2014A 2015A 2016F 2017F 2018F
Avg: 28.9x
+1sd: 40.3x
+2sd: 51.7x
-1sd: 17.5x
-2sd: 6x5.4
15.4
25.4
35.4
45.4
55.4
Jun-12 Jun-13 Jun-14 Jun-15
(x)
Avg: 1.36x
+1sd: 1.81x
+2sd: 2.26x
-1sd: 0.91x
-2sd: 0.47x0.4
0.9
1.4
1.9
2.4
Jun-12 Jun-13 Jun-14 Jun-15
(x)
Page 60

ASIAN INSIGHTS VICKERS SECURITIES
Company Guide
Bumi Armada
Key Assumptions
Segmental Breakdown
FY FY FY FY DecDecDecDec 2014201420142014AAAA 2015201520152015AAAA 2016201620162016FFFF 2017201720172017FFFF 2018201820182018FFFF
Revenues (RMm) Offshore Support Vessels 655 538 350 327 364
FPSO 949 1,306 878 1,937 1,913
Transport & Installation 794 336 452 415 467
TotalTotalTotalTotal 2,3972,3972,3972,397 2,1802,1802,1802,180 1,6801,6801,6801,680 2,6802,6802,6802,680 2,7452,7452,7452,745
Operating Profit (RMm) Offshore Support Vessels 34.5 (117) (47.3) (14.7) 5.83
FPSO 304 310 176 425 431
Transport & Installation (1.0) 39.7 52.8 53.9 62.3
Oilfield Services 39.6 0.0 0.0 0.0 0.0
TotalTotalTotalTotal 377377377377 232232232232 181181181181 464464464464 499499499499
Profit Margins (%) Offshore Support Vessels 5.3 (21.8) (13.5) (4.5) 1.6
FPSO 32.1 23.7 20.0 22.0 22.5
Transport & Installation (0.1) 11.8 11.7 13.0 13.3
TotalTotalTotalTotal 15.715.715.715.7 10.710.710.710.7 10.810.810.810.8 17.317.317.317.3 18.218.218.218.2
Income Statement (RMm)
FY FY FY FY DecDecDecDec 2014201420142014AAAA 2015201520152015AAAA 2016201620162016FFFF 2017201720172017FFFF 2018201820182018FFFF
Revenue 2,397 2,180 1,680 2,680 2,745
Cost of Goods Sold (1,820) (1,766) (1,049) (1,270) (1,320)
Gross ProfitGross ProfitGross ProfitGross Profit 578578578578 414414414414 631631631631 1,4101,4101,4101,410 1,4251,4251,4251,425 Other Opng (Exp)/Inc (175) (90.7) (450) (946) (926)
Operating ProfitOperating ProfitOperating ProfitOperating Profit 402402402402 323323323323 181181181181 464464464464 499499499499
Other Non Opg (Exp)/Inc 11.4 137 0.0 0.0 0.0
Associates & JV Inc 35.9 51.5 120 128 136
Net Interest (Exp)/Inc (99.2) (123) (85.4) (109) (117)
Exceptional Gain/(Loss) (41.0) (560) 0.0 0.0 0.0
PrePrePrePre----tax Profittax Profittax Profittax Profit 309309309309 (171)(171)(171)(171) 216216216216 483483483483 517517517517 Tax (84.8) (70.4) (53.9) (121) (129)
Minority Interest (5.7) 7.21 4.80 5.20 5.90
Net ProfitNet ProfitNet ProfitNet Profit 219219219219 (235)(235)(235)(235) 166166166166 367367367367 394394394394 Net Profit before Except. 260 325 166 367 394
EBITDA 925 1,118 1,015 1,347 1,372
Growth Revenue Gth (%) 15.6 (9.1) (22.9) 59.5 2.4
EBITDA Gth (%) (6.9) 20.8 (9.2) 32.7 1.8
Opg Profit Gth (%) (26.1) (19.7) (43.9) 156.5 7.4
Net Profit Gth (Pre-ex) (%) (39.8) 25.3 (48.8) 120.6 7.2
Margins & Ratio Gross Margins (%) 24.1 19.0 37.6 52.6 51.9
Opg Profit Margin (%) 16.8 14.8 10.8 17.3 18.2
Net Profit Margin (%) 9.1 (10.8) 9.9 13.7 14.3
ROAE (%) 4.0 (3.4) 2.3 4.9 5.0
ROA (%) 1.9 (1.4) 0.9 2.1 2.2
ROCE (%) 2.7 2.2 0.8 2.2 2.4
Div Payout Ratio (%) 43.7 N/A 25.0 25.0 25.0
Net Interest Cover (x) 4.1 2.6 2.1 4.2 4.3
Source: Company, AllianceDBS Research
FY FY FY FY DecDecDecDec 2014201420142014AAAA 2015A2015A2015A2015A 2016201620162016FFFF 2017201720172017FFFF 2018201820182018FFFF
OSV Utilisation (%) 73.6 55.0 46.7 43.3 50.0 No of operating FPSO 6 6 6 9 9
No of FPSO under conversion 3 3 3 0 0
T&I Vessels Utilisation (%) N/A N/A 40.0 35.0 37.5
Growth from three new FPSOs
Page 61

ASIAN INSIGHTS VICKERS SECURITIES
Company Guide
Bumi Armada
Quarterly / Interim Income Statement (RMm)
FY FY FY FY DecDecDecDec 1Q1Q1Q1Q2015201520152015 2Q2Q2Q2Q2015201520152015 3Q3Q3Q3Q2015201520152015 4Q4Q4Q4Q2015201520152015 1Q1Q1Q1Q2016201620162016
Revenue 572 459 559 589 431
Cost of Goods Sold (384) (362) (462) (559) (350)
Gross ProfitGross ProfitGross ProfitGross Profit 188188188188 97.597.597.597.5 97.897.897.897.8 30.430.430.430.4 80.880.880.880.8 Other Oper. (Exp)/Inc (43.4) 12.2 16.1 (75.7) (22.7)
Operating ProfitOperating ProfitOperating ProfitOperating Profit 144144144144 110110110110 114114114114 (45.3)(45.3)(45.3)(45.3) 58.158.158.158.1 Other Non Opg (Exp)/Inc (111) 425 (28.5) 274 20.3
Associates & JV Inc 1.10 16.2 25.9 8.31 38.1
Net Interest (Exp)/Inc (40.3) (400) (38.0) (67.0) (40.2)
Exceptional Gain/(Loss) 111 (425) 28.5 (274) (20.3)
PrePrePrePre----tax Profittax Profittax Profittax Profit 105105105105 (274)(274)(274)(274) 102102102102 (104)(104)(104)(104) 55.955.955.955.9 Tax (32.2) (24.6) (30.8) 17.2 (34.8)
Minority Interest (1.0) 7.40 (1.0) 1.78 2.27
Net ProfitNet ProfitNet ProfitNet Profit 72.172.172.172.1 (292)(292)(292)(292) 70.070.070.070.0 (85.1)(85.1)(85.1)(85.1) 23.423.423.423.4 Net profit bef Except. (38.5) 133 41.5 189 43.7
EBITDA 176 694 270 400 116
Growth Revenue Gth (%) (18.5) (19.8) 21.9 5.3 (26.9)
EBITDA Gth (%) 32.4 293.8 (61.1) 48.1 (70.9)
Opg Profit Gth (%) nm (24.1) 3.7 nm nm
Net Profit Gth (Pre-ex) (%) 23.6 nm (68.9) 355.4 (76.9)
Margins Gross Margins (%) 32.8 21.2 17.5 5.2 18.7
Opg Profit Margins (%) 25.3 23.9 20.3 (7.7) 13.5
Net Profit Margins (%) 12.6 (63.5) 12.5 (14.4) 5.4
Balance Sheet (RMm)
FY FY FY FY DecDecDecDec 2014201420142014AAAA 2015201520152015AAAA 2016201620162016FFFF 2017201720172017FFFF 2018201820182018FFFF
Net Fixed Assets 8,460 14,144 14,907 14,551 14,214
Invts in Associates & JVs 453 536 492 619 755
Other LT Assets 239 236 119 119 119
Cash & ST Invts 3,303 1,526 678 1,184 1,141
Inventory 141 161 141 162 144
Debtors 1,846 1,459 1,003 1,181 1,364
Other Current Assets 9.21 10.9 10.9 10.9 10.9
Total AssetsTotal AssetsTotal AssetsTotal Assets 14,45214,45214,45214,452 18,07318,07318,07318,073 17,35017,35017,35017,350 17,82817,82817,82817,828 17,74717,74717,74717,747
ST Debt 1,018 1,770 1,440 1,351 1,241
Creditor 926 1,503 1,200 1,797 1,837
Other Current Liab 33.1 95.8 95.8 95.8 95.8
LT Debt 5,175 6,259 6,049 5,749 5,449
Other LT Liabilities 583 1,148 1,148 1,148 1,148
Shareholder’s Equity 6,685 7,257 7,382 7,658 7,953
Minority Interests 32.3 38.3 33.5 28.3 22.4
Total Cap. & Liab.Total Cap. & Liab.Total Cap. & Liab.Total Cap. & Liab. 14,45214,45214,45214,452 18,07318,07318,07318,073 17,35017,35017,35017,350 17,82817,82817,82817,828 17,74717,74717,74717,747
Non-Cash Wkg. Capital 1,038 31.8 (141) (538) (413)
Net Cash/(Debt) (2,890) (6,504) (6,812) (5,916) (5,550)
Debtors Turn (avg days) 251.9 276.7 267.4 148.7 169.3
Creditors Turn (avg days) 202.6 382.3 1,476.0 1,063.8 1,138.8
Inventory Turn (avg days) 24.9 47.6 165.0 107.7 96.0
Asset Turnover (x) 0.2 0.1 0.1 0.2 0.2
Current Ratio (x) 2.7 0.9 0.7 0.8 0.8
Quick Ratio (x) 2.6 0.9 0.6 0.7 0.8
Net Debt/Equity (X) 0.4 0.9 0.9 0.8 0.7
Net Debt/Equity ex MI (X) 0.4 0.9 0.9 0.8 0.7
Capex to Debt (%) 34.4 44.4 53.1 5.6 6.0
Z-Score (X) 1.1 0.6 0.5 0.6 0.7
Source: Company, AllianceDBS Research
Page 62

ASIAN INSIGHTS VICKERS SECURITIES
Company Guide
Bumi Armada
Cash Flow Statement (RMm)
FY FY FY FY DecDecDecDec 2014201420142014AAAA 2015201520152015AAAA 2016201620162016FFFF 2017201720172017FFFF 2018201820182018FFFF
Pre-Tax Profit 309 (171) 216 483 517
Dep. & Amort. 476 607 714 755 738
Tax Paid (68.0) (110) (53.9) (121) (129)
Assoc. & JV Inc/(loss) 83.7 487 (120) (128) (136)
Chg in Wkg.Cap. (63.6) (167) 173 397 (125)
Other Operating CF (57.3) (110) 0.0 0.0 0.0
Net Operating CFNet Operating CFNet Operating CFNet Operating CF 680680680680 535535535535 929929929929 1,3871,3871,3871,387 865865865865 Capital Exp.(net) (2,129) (3,568) (3,977) (400) (400)
Invts in Assoc. & JV (77.2) (18.0) 0.0 0.0 0.0
Div from Assoc & JV 2.32 0.0 0.0 0.0 0.0
Other Investing CF 96.2 67.2 0.0 0.0 0.0
Net Investing CFNet Investing CFNet Investing CFNet Investing CF (2,107)(2,107)(2,107)(2,107) (3,519)(3,519)(3,519)(3,519) (3,977)(3,977)(3,977)(3,977) (400)(400)(400)(400) (400)(400)(400)(400)
Div Paid (95.3) (95.6) (41.6) (91.8) (98.4)
Chg in Gross Debt 2,199 975 2,242 (389) (410)
Capital Issues 1,959 0.0 0.0 0.0 0.0
Other Financing CF (0.6) 0.6 0.0 0.0 0.0
Net Financing CFNet Financing CFNet Financing CFNet Financing CF 4,0624,0624,0624,062 880880880880 2,2002,2002,2002,200 (481)(481)(481)(481) (508)(508)(508)(508) Currency Adjustments 33.8 326 0.0 0.0 0.0
Chg in Cash 2,669 (1,778) (848) 506 (43.9)
Opg CFPS (sen) 12.7 12.0 12.9 16.9 16.9
Free CFPS (sen) (24.7) (51.7) (52.0) 16.8 7.92
Source: Company, AllianceDBS Research
Target Price & Ratings History
Source: AllianceDBS Research
S.No.S.No.S.No.S.No. DateDateDateDateClosing Closing Closing Closing
PricePricePricePrice
Target Target Target Target
PricePricePricePriceRat ing Rat ing Rat ing Rat ing
1: 28 Aug 15 0.86 0.90 HOLD
2: 26 Oct 15 0.97 0.90 HOLD
3: 16 Nov 15 1.00 0.90 HOLD
4: 20 Nov 15 1.05 0.90 HOLD
5: 11 Jan 16 0.94 0.90 HOLD
6: 18 Jan 16 0.94 0.90 HOLD
7: 25 Jan 16 0.92 0.90 HOLD
8: 01 Feb 16 1.04 0.90 HOLD
9: 10 Feb 16 0.99 0.90 HOLD
10: 15 Feb 16 1.00 0.90 HOLD
11: 22 Feb 16 1.04 0.90 HOLD
12: 11 Apr 16 0.73 0.90 HOLD
13: 03 May 16 0.77 0.90 HOLD
14: 19 May 16 0.72 0.90 HOLD
Note Note Note Note : Share price and Target price are adjusted for corporate actions. 15: 01 Jun 16 0.67 0.85 BUY
1
2
3
4
5
6
7
8
9
10
11
12
13
14
150.61
0.71
0.81
0.91
1.01
1.11
1.21
Jun-15 Oct-15 Feb-16 Jun-16
RMRMRMRM
Capex guidance by management
Page 63

ASIAN INSIGHTS VICKERS SECURITIES ed: CK / sa:WMT
BUYBUYBUYBUY
Last Traded Price: Last Traded Price: Last Traded Price: Last Traded Price: RM0.58 (KLCIKLCIKLCIKLCI : : : : 1,657.54) Price Target :Price Target :Price Target :Price Target : RM0.64 (10% upside) (Prev RM0.70) Potential Catalyst: Potential Catalyst: Potential Catalyst: Potential Catalyst: New RAPID project orders
Where we differ:Where we differ:Where we differ:Where we differ: First house to recommend BUY on the investment
thesis that Pantech will be one of key beficiaries of RAPID project.
Analyst TAN Jianyuan +60 326043913 [email protected]
What’s New • 1QFY17 earnings below expectation, dragged by
weaker manufacturing earnings. Cut FY17/18F earnings by 6%/3%.
• Declared 1st DPS of 0.5 sen.
• Maintain BUY with revised TP of RM0.64 (from RM0.70 previously)
Price Relative
Forecasts and Valuation FY FY FY FY FebFebFebFeb ((((RMRMRMRM m) m) m) m) 2016201620162016AAAA 2017201720172017FFFF 2018201820182018FFFF 2019201920192019FFFF
Revenue 513 557 608 645 EBITDA 76.0 81.5 91.5 98.7 Pre-tax Profit 53.1 58.7 67.8 73.0 Net Profit 38.0 44.1 50.9 54.8 Net Pft (Pre Ex.) 38.0 44.1 50.9 54.8 Net Pft Gth (Pre-ex) (%) (12.0) 16.0 15.5 7.7 EPS (sen) 5.58 6.41 7.40 7.97 EPS Pre Ex. (sen) 5.58 6.41 7.40 7.97 EPS Gth Pre Ex (%) (15) 15 15 8 Diluted EPS (sen) 5.58 6.41 7.40 7.97 Net DPS (sen) 2.71 2.86 3.30 3.56 BV Per Share (sen) 83.5 87.3 92.3 97.6 PE (X) 10.4 9.1 7.8 7.3 PE Pre Ex. (X) 10.4 9.1 7.8 7.3 P/Cash Flow (X) 4.3 7.5 7.1 11.2 EV/EBITDA (X) 6.2 5.7 4.9 4.7 Net Div Yield (%) 4.7 4.9 5.7 6.1 P/Book Value (X) 0.7 0.7 0.6 0.6 Net Debt/Equity (X) 0.1 0.1 0.1 0.1 ROAE (%) 7.8 8.4 9.2 9.4 Earnings Rev (%):Earnings Rev (%):Earnings Rev (%):Earnings Rev (%): (6) (3) Consensus EPS Consensus EPS Consensus EPS Consensus EPS (sensensensen):::: 7.0 7.8 8.7 Other Broker Recs:Other Broker Recs:Other Broker Recs:Other Broker Recs: B: 2 S: 1 H: 2
Source of all data: Company, AllianceDBS, Bloomberg Finance L.P
Well-positioned to benefit from RAPID Reiterate BUY.Reiterate BUY.Reiterate BUY.Reiterate BUY. We believe Pantech is one of the key beneficiaries of RAPID contract flows. Valuations are attractive at 8x 2018F EPS. Pantech also offers one of the higher dividend yields at 5% in our oil & gas universe. Together with its dividend yield, the stock offers a total upside potential of 15%. Pantech remains our top small cap pick. RAPID project to drive earnings in FY17.RAPID project to drive earnings in FY17.RAPID project to drive earnings in FY17.RAPID project to drive earnings in FY17. 1QFY17 net profit was below expectations mainly due to weak manufacturing earnings but this was partly offset by solid trading contributions. 2QFY17 results are likely to mirror 1QFY17, as the manufacturing segment will continue to be sluggish on weaker global sector demand. We expect earnings to pick up pace in 3QFY17 as earlier secured RAPID orders filter through. China authorities’ move to cut 45m tonnes of steel capacity this year and 10%/15% by 2018/2020 may lead to higher steel prices and a positive boost to earnings. RAPID beneficiary.RAPID beneficiary.RAPID beneficiary.RAPID beneficiary. Pantech has a dominant local market share of 40% for supply of pipes, valves and fittings (PVF). Coupled with its move to set up a warehouse in Pengerang, we believe Pantech is well-positioned to benefit from more RAPID orders. Pantech is also building a new galvanising plant in Tanjung Langsat, Johor. This plant, scheduled for completion by end-2017, will have a targeted capacity of 48,000 tonnes per annum. Valuation: Our revised target price of RM0.64 is based on 10x FY17 EPS. In addition, the stock offers a dividend yield of about 5%. We reiterate our BUY call. Key Risks to Our View: Weaker global demand will impact the sales of its manufacturing segment; while any slowdown in RAPID will impact its trading segment. At A Glance Issued Capital (m shrs) 610
Mkt. Cap (RMm/US$m) 354 / 87.0
Major Shareholders (%)
CTL Capital Holding 17.9% GL Management Agency 12.9% Koperasi Permodalan 9.8% Free Float (%) 59.2%
3m Avg. Daily Val (US$m) 0.04
ICB IndustryICB IndustryICB IndustryICB Industry : Basic Materials / Industrial Metals & Mining
DBS Group Research . Equity
22 Jul 2016
Malaysia Company Guide
Pantech Group Version 3 | Bloomberg: PGHB MK | Reuters: PTNE.KL Refer to important disclosures at the end of this report
86
106
126
146
166
186
206
0.4
0.5
0.6
0.7
0.8
0.9
1.0
1.1
1.2
Jul-12 Jul-13 Jul-14 Jul-15 Jul-16
Relative IndexRM
Pantech Group (LHS) Relative KLCI INDEX (RHS)
Page 64

ASIAN INSIGHTS VICKERS SECURITIES
Company Guide
Pantech Group
WHAT’S NEW
1QFY17 earnings fall short of expectations
Higher revenue and net profit qHigher revenue and net profit qHigher revenue and net profit qHigher revenue and net profit q----oooo----q q q q but but but but fell short fell short fell short fell short of of of of our our our our
expectationexpectationexpectationexpectationssss.... Pantech recorded 1QFY17 revenue of RM123.9m
(-10.6% y-o-y, +13.6% q-o-q) and net profit of RM8.0m
(-12.1% y-o-y, +8.3% q-o-q). Net profit for the quarter
accounts for 18% of our and consensus estimates. The
deviation from our forecast was mainly due to the weak
manufacturing segment as a result of poor global demand.
Pantech declared 0.5 sen dividend, similar to 1QFY16.
Weaker manufacturing earningsWeaker manufacturing earningsWeaker manufacturing earningsWeaker manufacturing earnings. . . . Manufacturing revenue fell
22.4% y-o-y and 0.3% q-o-q to RM44.3m. This was partially
mitigated by higher trading revenue of RM79.7m (-2.3% y-o-y,
+23.2% q-o-q). Weakness in the manufacturing segment
continues to be pronounced. 1QFY17 manufacturing PBT fell
39.5% y-o-y and 40.2% q-o-q to RM3.9m given the poor
manufacturing production that was affected by the decline in
global demand. Overall PBT margins fell to 8.3% from 9.8% in
1QFY16 and 10.2% in 4QFY16. This was due to the
deterioration in manufacturing and trading margins.
Earnings to pick up in 3QFY17Earnings to pick up in 3QFY17Earnings to pick up in 3QFY17Earnings to pick up in 3QFY17.... 2QFY17 results are likely to
mirror the current quarter’s before picking up pace in 3QFY17
once earlier secured RAPID orders flow through. We cut our
FY17/18F profit forecasts by 6%/3%, factoring in the weaker
results. We also introduce our FY19 earnings forecast.
Maintain Maintain Maintain Maintain BUYBUYBUYBUY withwithwithwith RM0.64RM0.64RM0.64RM0.64 TP.TP.TP.TP. We prefer Pantech among our
small cap coverage, given its exposure to RAPID and leading
position in the local market. Maintain BUY with revised target
price of RM0.64. We believe valuations are attractive at 8x
2018F EPS. Pantech also offers one of the higher dividend
yields at 5% in our O&G universe.
Quarterly / Interim Income Statement (RMm)
FY FY FY FY FebFebFebFeb 1Q1Q1Q1Q2016201620162016 4Q4Q4Q4Q2016201620162016 1Q1Q1Q1Q2017201720172017 % chg yoy % chg yoy % chg yoy % chg yoy % chg qoq% chg qoq% chg qoq% chg qoq
Revenue 139 109 124 (10.6) 13.6
Operating ProfitOperating ProfitOperating ProfitOperating Profit 15.715.715.715.7 13.113.113.113.1 12.112.112.112.1 (22.7)(22.7)(22.7)(22.7) (7.5)(7.5)(7.5)(7.5)
Associates & JV Inc 0.06 (0.2) 0.0 nm 87.4
Net Interest (Exp)/Inc (2.2) (1.8) (1.8) 19.7 (0.7)
PrePrePrePre----tax Profittax Profittax Profittax Profit 13.513.513.513.5 11.211.211.211.2 10.310.310.310.3 (23.7)(23.7)(23.7)(23.7) (7.5)(7.5)(7.5)(7.5)
Tax (4.4) (3.8) (2.3) (47.6) (38.6)
Net ProfitNet ProfitNet ProfitNet Profit 9.129.129.129.12 7.407.407.407.40 8.028.028.028.02 (12.1)(12.1)(12.1)(12.1) 8.38.38.38.3
Net profit bef Except. 9.12 7.40 8.02 (12.1) 8.3
EBITDA 19.4 12.9 12.1 (37.7) (6.4)
Margins (%)
Opg Profit Margins 11.3 12.0 9.8
Net Profit Margins 6.6 6.8 6.5
Segmental Breakdown (RMm)
FY FY FY FY FebFebFebFeb 1Q1Q1Q1Q20162016201620166666 1Q1Q1Q1Q2017201720172017 1Q20171Q20171Q20171Q2017 % chg yoy % chg yoy % chg yoy % chg yoy % chg qoq% chg qoq% chg qoq% chg qoq
Revenue breakdownRevenue breakdownRevenue breakdownRevenue breakdown
Trading 81.6 64.7 79.7 (2.3) 23.2
Manufacturing 57.1 44.4 44.3 (22.4) (0.3)
TotalTotalTotalTotal 138.6 138.6 138.6 138.6 109.1 109.1 109.1 109.1 123.9 123.9 123.9 123.9 (10.6)(10.6)(10.6)(10.6) 13.6 13.6 13.6 13.6
PBT breakdownPBT breakdownPBT breakdownPBT breakdown
Trading 9.6 4.6 8.0 (16.5) 71.9
Manufacturing 6.5 6.6 3.9 (39.5) (40.2)
Others (2.5) (0.1) (1.6)
TotalTotalTotalTotal 13.513.513.513.5 11.211.211.211.2 10.310.310.310.3 (23.7)(23.7)(23.7)(23.7) (7.5)(7.5)(7.5)(7.5) Source of all data: Company, AllianceDBS
Page 65

ASIAN INSIGHTS VICKERS SECURITIES
Company Guide
Pantech Group
CRITICAL DATA POINTS TO WATCH
Earnings Drivers:
Refinement of operations.Refinement of operations.Refinement of operations.Refinement of operations. Pantech has a dominant local market
share of 40% for supply of pipes, valves and fittings (PVF).
Coupled with its move to set up a warehouse in Pengerang, we
believe Pantech is well-positioned to benefit from more RAPID
orders. Pantech has secured RM60m RAPID orders out of its
RM100m internal target set for the year. For now, we have
conservatively assumed new orders of RM100m for FY17 and
RM150m for FY18.
JV’s galvanising plant by endJV’s galvanising plant by endJV’s galvanising plant by endJV’s galvanising plant by end----2017.2017.2017.2017. Pantech is in the midst of
building a new galvanising plant with a JV partner (EMSB) in
Tanjung Langsat, Johor. This plant, when completed, will have a
targeted capacity of 48,000 tonnes per annum. We understand
that the capex amounts to around RM30m. Pantech owns a
51% stake in the JV while EMSB holds the remaining 49%.
Based on our back-of-envelope calculation, the RAPID project
requires 1m tonnes. Assuming completion by end-2017 and a
higher operating margin of 20% (management has guided for
margins that are superior to current manufacturing margins),
the additional capacity from the plant could boost our FY18
earnings by 4%.
Strategic footing.Strategic footing.Strategic footing.Strategic footing. We expect the galvanising plant to benefit
from the demand from RAPID. However, in line with our
conservative stance, we have yet to incorporate any earnings
from the additional capacity.
Beneficiary of stronger USD.Beneficiary of stronger USD.Beneficiary of stronger USD.Beneficiary of stronger USD. Pantech will benefit from a
stronger USD, as 65% of its manufacturing revenue is
denominated in USD, while the remaining 35% in RM. Pantech
adopts a cost-plus pricing approach.
Trading segment margin (%)
Manufacturing segment margin (%)
Carbon steel utlisation capacity (%)
Stainless steel utilisation capacity (%)
Source: Company, AllianceDBS
10.4
9.5
10.511 11
0.0
1.6
3.2
4.8
6.3
7.9
9.5
11.1
2015A 2016A 2017F 2018F 2019F
17.6
14.2 14 14.3 14.5
0.0
3.6
7.2
10.8
14.4
18.0
2015A 2016A 2017F 2018F 2019F
6570
75 75
0.0
15.3
30.6
45.9
61.2
76.5
2016A 2017F 2018F 2019F
6570
75 75
0.0
15.2
30.3
45.5
60.6
75.8
2016A 2017F 2018F 2019F
Page 66

ASIAN INSIGHTS VICKERS SECURITIES
Company Guide
Pantech Group
Balance Sheet:
The company has a net debt of RM63.4m, which translates into
0.12x net gearing as at end-1QFY17. This is lower compared to
0.16x as at end-4QFY16. We expect FY17 capex spending to
come in at RM25m, with the JV galvanising plant to take up
c.RM15m while the rest is earmarked for maintenance capex.
Share Price Drivers:
RAPIDRAPIDRAPIDRAPID----fuelled growth. fuelled growth. fuelled growth. fuelled growth. Pantech is targeting RM100m and
RM150 new orders from RAPID for FY17 and FY18 respectively.
Higher orders would result in upward revisions to our current
forecast. We reckon that our current plant utilisation
assumptions are rather conservative and hence, any
improvement in the macroeconomic environment could result in
the re-rating of Pantech.
Key Risks:
Project delays. Project delays. Project delays. Project delays. The O&G sector is susceptible to project delays,
especially during periods of weak crude oil prices, and this
could lead to lumpy earnings, especially for the trading
division. The group is also at the mercy of RAPID’s progress in
Pengerang, whose potential delays could push the recognition
of some earnings into FY18.
Changes in regulations. Changes in regulations. Changes in regulations. Changes in regulations. Changes in import export regulations
and duties could affect the group’s operations. The imposition
of anti-dumping duties on certain products manufactured by
the group has occurred before, which led to temporary
earnings disruptions.
IIIIndustry cycles. ndustry cycles. ndustry cycles. ndustry cycles. Pantech’s high exposure to the O&G industry
also means that it is not immune to the industry’s broad cycles.
An industry downturn, which is led by persistently low crude
oil prices following a sharp drop, would dampen its revenue
and earnings.
Company Background
Pantech Group Holdings Bhd (Pantech) trades and
manufactures carbon steel, stainless steel and nickel alloy
pipes, valves and fittings (PVF) largely for the oil & gas onshore
and offshore industry.
Leverage & Asset Turnover (x)
Capital Expenditure
ROE (%)
Forward PE Band (x)
PB Band (x)
Source: Company, AllianceDBS
0.6
0.7
0.7
0.8
0.8
0.9
0.9
0.00
0.10
0.20
0.30
0.40
0.50
2015A 2016A 2017F 2018F 2019F
Gross Debt to Equity (LHS) Asset Turnover (RHS)
0.0
5.0
10.0
15.0
20.0
25.0
30.0
2015A 2016A 2017F 2018F 2019F
Capital Expenditure (-)
RMm
0.0%
1.0%
2.0%
3.0%
4.0%
5.0%
6.0%
7.0%
8.0%
9.0%
2015A 2016A 2017F 2018F 2019F
Avg: 11.6x
+1sd: 14.7x
+2sd: 17.7x
-1sd: 8.5x
-2sd: 5.4x4.8
6.8
8.8
10.8
12.8
14.8
16.8
18.8
Jul-12 Jul-13 Jul-14 Jul-15
(x)
Avg: 0.98x
+1sd: 1.21x
+2sd: 1.44x
-1sd: 0.76x
-2sd: 0.53x
0.4
0.6
0.8
1.0
1.2
1.4
1.6
Jul-12 Jul-13 Jul-14 Jul-15
(x)
Page 67

ASIAN INSIGHTS VICKERS SECURITIES
Company Guide
Pantech Group
Key Assumptions
FY FY FY FY FebFebFebFeb 2015201520152015AAAA 2016201620162016AAAA 2017201720172017FFFF 2018201820182018FFFF 2019201920192019FFFF
Trading segment margin (%)
10.4 9.48 10.5 11.0 11.0 Manufacturing segment margin (%)
17.6 14.2 14.0 14.3 14.5 Carbon steel utlisation capacity (%)
88.0 70.0 70.0 75.0 75.0 Stainless steel utilisation capacity (%)
80.0 80.0 70.0 75.0 75.0 Segmental Breakdown
FY FY FY FY FebFebFebFeb 2015201520152015AAAA 2016201620162016AAAA 2017201720172017FFFF 2018201820182018FFFF 2019201920192019FFFF
Revenues (RMm) Trading 298 317 346 377 411
Manufacturing 228 196 211 231 234
TotalTotalTotalTotal 526526526526 513513513513 557557557557 608608608608 645645645645
Operating profit (RMm) Trading 31.0 30.1 36.3 41.5 45.2
Manufacturing 40.1 27.7 29.5 33.0 34.0
Others (2.7) 3.8 0.0 0.0 0.0
TotalTotalTotalTotal 68.468.468.468.4 61.661.661.661.6 65.865.865.865.8 74.574.574.574.5 79.279.279.279.2
Profit Margins (%) Trading 10.4 9.5 10.5 11.0 11.0
Manufacturing 17.6 14.2 14.0 14.3 14.5
TotalTotalTotalTotal 12.912.912.912.9 12.012.012.012.0 11.811.811.811.8 12.312.312.312.3 12.312.312.312.3
Income Statement (RMm)
FY FY FY FY FebFebFebFeb 2015201520152015AAAA 2016201620162016AAAA 2017201720172017FFFF 2018201820182018FFFF 2019201920192019FFFF
Revenue 526 513 557 608 645
Cost of Goods Sold (399) (396) (421) (463) (492)
Gross ProfitGross ProfitGross ProfitGross Profit 127127127127 118118118118 135135135135 145145145145 153153153153 Other Opng (Exp)/Inc (58.5) (56.2) (69.6) (70.2) (73.8)
Operating ProfitOperating ProfitOperating ProfitOperating Profit 68.68.68.68.4444 61.661.661.661.6 65.865.865.865.8 74.574.574.574.5 79.279.279.279.2 Associates & JV Inc 0.0 (0.2) (0.2) (0.2) (0.2)
Net Interest (Exp)/Inc (9.7) (8.4) (6.9) (6.4) (6.0)
PrePrePrePre----tax Profittax Profittax Profittax Profit 58.758.758.758.7 53.153.153.153.1 58.758.758.758.7 67.867.867.867.8 73.073.073.073.0 Tax (15.6) (15.1) (14.7) (17.0) (18.3)
Minority Interest 0.0 0.03 0.03 0.03 0.03
Net ProfitNet ProfitNet ProfitNet Profit 43.243.243.243.2 38.038.038.038.0 44.144.144.144.1 50.950.950.950.9 54.854.854.854.8 Net Profit before Except. 43.2 38.0 44.1 50.9 54.8
EBITDA 82.0 76.0 81.5 91.5 98.7
Growth Revenue Gth (%) (8.7) (2.4) 8.4 9.2 6.2
EBITDA Gth (%) (15.2) (7.4) 7.3 12.3 7.8
Opg Profit Gth (%) (20.2) (9.9) 6.8 13.1 6.4
Net Profit Gth (Pre-ex) (%) (21.0) (12.0) 16.0 15.5 7.7
Margins & Ratio Gross Margins (%) 24.1 22.9 24.3 23.8 23.7
Opg Profit Margin (%) 13.0 12.0 11.8 12.3 12.3
Net Profit Margin (%) 8.2 7.4 7.9 8.4 8.5
ROAE (%) 9.7 7.8 8.4 9.2 9.4
ROA (%) 6.0 5.2 6.0 6.8 7.1
ROCE (%) 7.7 6.5 7.3 8.0 8.3
Div Payout Ratio (%) 52.0 43.6 40.0 40.0 40.0 Net Interest Cover (x) 7.1 7.4 9.5 11.6 13.3
Source: Company, AllianceDBS
Page 68

ASIAN INSIGHTS VICKERS SECURITIES
Company Guide
Pantech Group
Quarterly / Interim Income Statement (RMm)
FY FY FY FY FebFebFebFeb 1Q1Q1Q1Q2016201620162016 2Q2Q2Q2Q2016201620162016 3Q3Q3Q3Q2016201620162016 4Q4Q4Q4Q2016201620162016 1Q1Q1Q1Q2017201720172017
Revenue 139 121 144 109 124
Operating ProfitOperating ProfitOperating ProfitOperating Profit 15.715.715.715.7 16.116.116.116.1 16.816.816.816.8 13.113.113.113.1 12.112.112.112.1 Associates & JV Inc 0.06 0.02 (0.1) (0.2) 0.0
Net Interest (Exp)/Inc (2.2) (2.3) (2.1) (1.8) (1.8)
PrePrePrePre----tax Profittax Profittax Profittax Profit 13.513.513.513.5 13.813.813.813.8 14.614.614.614.6 11.211.211.211.2 10.310.310.310.3 Tax (4.4) (3.4) (3.5) (3.8) (2.3)
Net ProfitNet ProfitNet ProfitNet Profit 9.129.129.129.12 10.410.410.410.4 11.111.111.111.1 7.407.407.407.40 8.028.028.028.02 Net profit bef Except. 9.12 10.4 11.1 7.40 8.02
EBITDA 19.4 19.8 20.4 12.9 12.1
Growth Revenue Gth (%) 6.9 (12.4) 18.6 (24.2) 13.6
EBITDA Gth (%) 10.6 1.9 3.1 (36.7) (6.4)
Opg Profit Gth (%) 13.5 2.5 4.6 (22.1) (7.5)
Net Profit Gth (Pre-ex) (%) 18.8 14.3 6.4 (33.3) 8.3
Margins Opg Profit Margins (%) 11.3 13.2 11.7 12.0 9.8
Net Profit Margins (%) 6.6 8.6 7.7 6.8 6.5
Balance Sheet (RMm)
FY FY FY FY FebFebFebFeb 2015201520152015AAAA 2016201620162016AAAA 2017201720172017FFFF 2018201820182018FFFF 2019201920192019FFFF
Net Fixed Assets 198 200 209 217 223
Invts in Associates & JVs 3.15 3.03 2.83 2.62 2.42
Other LT Assets 38.1 46.3 36.0 36.0 36.0
Cash & ST Invts 57.7 77.0 77.8 78.4 57.3
Inventory 289 253 275 280 297
Debtors 154 123 122 129 151
Other Current Assets 6.21 17.3 17.3 17.3 17.3
Total AssetsTotal AssetsTotal AssetsTotal Assets 747747747747 720720720720 740740740740 760760760760 784784784784
ST Debt 150 116 111 106 101
Creditor 34.8 21.1 25.9 25.0 26.5
Other Current Liab 28.5 27.6 27.6 27.6 27.6
LT Debt 55.7 36.7 31.7 26.7 21.7
Other LT Liabilities 11.2 9.76 5.89 5.89 5.89
Shareholder’s Equity 467 509 538 569 601
Minority Interests (0.4) 0.0 (0.1) (0.1) (0.1)
Total Cap. & Liab.Total Cap. & Liab.Total Cap. & Liab.Total Cap. & Liab. 747747747747 720720720720 740740740740 760760760760 784784784784
Non-Cash Wkg. Capital 387 345 361 373 411
Net Cash/(Debt) (148) (75.6) (64.8) (54.1) (65.3)
Debtors Turn (avg days) 98.9 98.8 80.6 75.5 79.1
Creditors Turn (avg days) 32.6 26.8 21.2 20.8 19.9
Inventory Turn (avg days) 256.1 260.0 237.9 227.0 222.6
Asset Turnover (x) 0.7 0.7 0.8 0.8 0.8
Current Ratio (x) 2.4 2.9 3.0 3.2 3.4
Quick Ratio (x) 1.0 1.2 1.2 1.3 1.3
Net Debt/Equity (X) 0.3 0.1 0.1 0.1 0.1
Net Debt/Equity ex MI (X) 0.3 0.1 0.1 0.1 0.1
Capex to Debt (%) 5.4 4.9 17.5 18.9 20.4
Z-Score (X) 2.9 3.0 3.1 3.2 NA
Source: Company, AllianceDBS
Page 69

ASIAN INSIGHTS VICKERS SECURITIES
Page 7
Company Guide
Pantech Group
Cash Flow Statement (RMm)
FY FY FY FY FebFebFebFeb 2015201520152015AAAA 2016201620162016AAAA 2017201720172017FFFF 2018201820182018FFFF 2019201920192019FFFF
Pre-Tax Profit 58.7 53.1 58.7 67.8 73.0
Dep. & Amort. 14.0 14.9 15.9 17.3 18.7
Tax Paid (17.5) (14.9) (14.7) (17.0) (18.3)
Assoc. & JV Inc/(loss) 0.03 0.20 0.20 0.20 0.20
Chg in Wkg.Cap. (49.6) 41.5 (6.6) (12.4) (37.9)
Other Operating CF (10.0) (7.4) (6.9) (6.4) (6.0)
Net Operating CFNet Operating CFNet Operating CFNet Operating CF 6.506.506.506.50 91.391.391.391.3 53.553.553.553.5 56.056.056.056.0 35.835.835.835.8 Capital Exp.(net) (11.0) (7.5) (25.0) (25.0) (25.0)
Other Invts.(net) (2.4) 0.0 0.0 0.0 0.0
Invts in Assoc. & JV (2.4) (3.8) 0.0 0.0 0.0
Net Investing CFNet Investing CFNet Investing CFNet Investing CF (15.8)(15.8)(15.8)(15.8) (11.3)(11.3)(11.3)(11.3) (25.0)(25.0)(25.0)(25.0) (25.0)(25.0)(25.0)(25.0) (25.0)(25.0)(25.0)(25.0) Div Paid (23.6) (13.4) (17.6) (20.4) (21.9)
Chg in Gross Debt 13.4 (53.0) (10.0) (10.0) (10.0)
Net Financing CFNet Financing CFNet Financing CFNet Financing CF 5.045.045.045.04 (65.4)(65.4)(65.4)(65.4) (27.6)(27.6)(27.6)(27.6) (30.4)(30.4)(30.4)(30.4) (31.9)(31.9)(31.9)(31.9) Currency Adjustments (0.1) 4.63 0.0 0.0 0.0
Chg in Cash (4.3) 19.3 0.89 0.61 (21.2)
Opg CFPS (sen) 8.53 7.32 8.75 9.94 10.7
Free CFPS (sen) (0.7) 12.3 4.15 4.50 1.57
Source: Company, AllianceDBS
Target Price & Ratings History
Source: AllianceDBS
S.No.S.No.S.No.S.No. DateDateDateDateClosing Closing Closing Closing
PricePricePricePrice
Target Target Target Target
PricePricePricePriceRat ing Rat ing Rat ing Rat ing
1: 22 Oct 15 0.63 0.95 BUY
2: 11 Apr 16 0.58 0.70 BUY
3: 27 Apr 16 0.57 0.70 BUY
4: 03 May 16 0.57 0.70 BUY
5: 24 Jun 16 0.59 0.70 BUY
6: 27 Jun 16 0.58 0.70 BUY
Note Note Note Note : Share price and Target price are adjusted for corporate actions.
1
2
3
4
56
0.45
0.50
0.55
0.60
0.65
0.70
0.75
Jul-15 Nov-15 Mar-16 Jul-16
RMRMRMRM
Page 70

ASIAN INSIGHTS VICKERS SECURITIES ed: CK / sa: JC
BUY Last Traded Price: Bt33.00 (SET : 1,452.59) Price Target: Bt39.00 (18% upside) Potential Catalyst: Pick-up of gross refining margin Where we differ: We are more positive on GRM Analyst Chaipat THANAWATTANO +66 2657 7827 [email protected]
Price Relative
Forecasts and Valuation FY Dec (Btm) 2015A 2016F 2017F 2018F Revenue 151,140 120,537 144,670 157,273 EBITDA 11,542 13,748 13,896 13,805 Pre-tax Profit 4,770 7,434 8,030 8,254 Net Profit 4,151 6,292 6,795 6,985 Net Pft (Pre Ex.) 4,600 6,292 6,795 6,985 Net Pft Gth (Pre-ex) (%) 671.7 36.8 8.0 2.8 EPS (Bt) 3.01 4.57 4.94 5.07 EPS Pre Ex. (Bt) 3.34 4.57 4.94 5.07 EPS Gth Pre Ex (%) 672 37 8 3 Diluted EPS (Bt) 3.01 4.57 4.94 5.07 Net DPS (Bt) 2.00 1.90 2.00 2.10 BV Per Share (Bt) 25.8 28.4 31.4 34.4 PE (X) 10.9 7.2 6.7 6.5 PE Pre Ex. (X) 9.9 7.2 6.7 6.5 P/Cash Flow (X) 3.7 2.8 4.7 4.2 EV/EBITDA (X) 5.8 4.0 3.6 3.1 Net Div Yield (%) 6.1 5.8 6.1 6.4 P/Book Value (X) 1.3 1.2 1.1 1.0 Net Debt/Equity (X) 0.6 0.2 0.1 CASH ROAE (%) 12.1 16.9 16.5 15.4 Earnings Rev (%): 0 0 0 Consensus EPS (Bt): 3.95 4.21 4.45 Other Broker Recs: B: 11 S: 2 H: 4
Corporate Governance CG Rating Anti-corruption Progress Indicator Certified
Source of all data: Company, DBS Vickers, Bloomberg Finance L.P
Laggard play in energy space Stronger performance in 2Q16 could be share price catalyst. BCP’s share price has underperformed its peers and the market YTD, down 9% compared with +9% to +14% for other refiners and +10% for SET. We believe this reflects market’s anxiety over its E&P business and weak performance in 1Q16 due to planned maintenance shutdowns. This should be overdone in our view given that its 2Q16F performance should improve strongly q-o-q, as its refinery has resumed normal operation which was also positive for its gross refining margin (GRM). The upside to this is inventory gain from higher oil price. The company remains our top pick for the sector on attractive valuation and laggard share price performance. We maintain our 12-month TP at Bt39/share. BCP’s GRM could ease to sustainable level. We expect BCP’s market gross refining margin (GRM) to ease to more sustainable levels of US$8.8-9/bbl for 2016-17F, down from US$9.1/bbl in 2015 when it was driven by an abnormally high crack spread for gasoline in 2015. Its oil marketing and solar power businesses would continue to generate stable cash flow. These two segments are the key factors in reducing BCP’s earnings volatility in the longer term.
Valuation:
BCP’s valuation is undemanding at 6.7x 2017 PE, compared with 10x average for regional peers. We also expect the company to maintain its dividend yield of >6% in the next two years. We rate the stock a BUY with a sum-of-parts TP of Bt39, comprising Bt27 for the refinery and Bt12 for the solar business. Key Risks to Our View:
Volatile oil price is the key risk Refiners’ earnings are volatile because of inventory gains/losses following changes in crude oil prices each quarter. BCP mitigates this volatility by hedging and has a good track record. BCP has a policy of hedging up to 30% of its output. At A Glance Issued Capital (m shrs) 1,377 Mkt. Cap (Btm/US$m) 45,438 / 1,291 Major Shareholders (%) PTT 27.2 Ministry of Finance 10.0 Thai NVDR 4.6
Free Float (%) 62.7 3m Avg. Daily Val (US$m) 4.1 ICB Industry : Oil & Gas / Oil & Gas Producers
DBS Group Research . Equity 8 Jul 2016
Thailand Company Guide
Bangchak Petroleum Pcl Version 3 | Bloomberg: BCP TB | Reuters: BCP.BK Refer to important disclosures at the end of this report
86
106
126
146
166
186
206
19.3
24.3
29.3
34.3
39.3
Jul-12 Jul-13 Jul-14 Jul-15 Jul-16
Relative IndexBt
Bangchak Petroleum Pcl (LHS) Relative SET INDEX (RHS)
Page 71

ASIAN INSIGHTS VICKERS SECURITIES
Company Guide
Bangchak Petroleum Pcl
CRITICAL DATA POINTS TO WATCH
Earnings Drivers:
Crude run could decline on maintenance shutdown. BCP’s crude run in 2015 was at its record, at 113kbd (94% utilisation rate) compared to its average of 87kbd (73% utilisation) in the past five years. The higher crude run was driven by the new crude distillate unit (CDU), which was installed in 2014 to replace the one damaged by fire in 2012. The new CDU increases BCP’s crude distillation capacity by 20kbd to 140kbd. BCP has optimised crude run to capture favourable GRM in 2015 but its crude run would decline to 95kbd in 2016F due to planned maintenance shutdowns in 1Q16.
GRM should normalise in 2016-17 after its peak in 2015. GRM is the critical factor for BCP’s earnings from oil refining business. We expect its abnormally high GRM in 2015 to ease to more sustainable level at US$8.8-9/bbl in 2016-17F. There would be upside from inventory gain in 2016 from higher crude oil prices in 1H16. Nonetheless, we expect GRM to be somewhat affected by the capacity additions in the region, especially for middle distillate products.
Oil marketing business will continue to benefit from low oil prices. BCP’s marketing margins should be sustainable at Bt0.7/litre, after registering a strong Bt0.76/litre in 2015, following the sharp decline in oil prices as well as energy price deregulation and restructuring in Thailand. The outlook for BCP’s marketing business is solid, given its strong foothold in the retail oil market (with the second largest market share after PTT). Stable earnings from the marketing business will be able to offset volatile profits from the oil refining segment.
More solar capacity to be added into portfolio. The capacity of BCP’s solar farms will continue to increase after the company acquired SunEdison Japan with incremental capacity of 198MW. Only 13MW was in operation currently, with 27MW more under construction and coming onstream during 2016-17. We assume only 13MW additional capacity in our earnings forecast. Management is keen on expanding the total capacity of the renewable power business to 500MW by 2020, including solar farms and a geothermal power plant in Indonesia.
EBITDA contribution from solar business will gradually increase from new capacity in Japan. We estimate the EBITDA contribution from the solar business will be steady at Bt3bn p.a. for the next three years. This will account for 21% of 2016-17F group EBITDA. The EBITDA contribution from the solar power business will gradually increase when new capacity of the business in Japan comes online in 2016.
Crude run (kbd)
Base GRM (US$/bbl)
Marketing margin (Bt/litre)
Total capacity - Solar (MW) YE
EBITDA contribution - Solar (Bt, mn)
Source: Company, DBS Vickers
86
113
95
105 105
0
16
33
49
65
81
98
114
2014A 2015A 2016F 2017F 2018F
6.96
9.05 8.88 9.06 9.24
0.00
1.89
3.77
5.66
7.54
9.43
2014A 2015A 2016F 2017F 2018F
0.710.76
0.7 0.7 0.7
0.00
0.16
0.31
0.47
0.62
0.78
2014A 2015A 2016F 2017F 2018F
118 118
131 131 131
0
26
53
79
106
132
2014A 2015A 2016F 2017F 2018F
2,572
3,005 3,026 3,026 3,026
0
611
1,222
1,833
2,445
2014A 2015A 2016F 2017F 2018F
Page 72

ASIAN INSIGHTS VICKERS SECURITIES
Company Guide
Bangchak Petroleum Pcl
Balance Sheet:
Improving financials. BCP’s financial position is expected to improve gradually, as its D/E ratio drops from 0.9x to 0.6x by 2017, driven by continuous profit growth – thanks to stable earnings from the marketing and solar power businesses. Asset turnover could dip in 2016, following a 46-day planned maintenance shutdown to further improve refinery efficiency under its 3E (Efficiency, Energy and Environment) improvement programme. The programme will be implemented over the next three years up to 2018, when its refinery is upgraded to one of the most complex in Thailand.
Share Price Drivers:
Attractive valuation and yield. BCP is trading at less than 7x P/E based on forecast earnings for the next three years, compared with >10x for regional peers. And the stock offers good dividend yields of >6% over the same period. This could attract investors who are looking for beneficiaries of rising oil demand in the domestic market. BCP’s profit will be less volatile than that of oil refineries which do not have retail outlets. The stable cash flow from its solar business could also cushion the impact of volatile oil prices.
Recurring income from alternative energy business. BCP plans to consolidate its stakes in alternative energy businesses under new subsidiary, BCPG. Management plans to list this subsidiary on the stock exchange by 4Q16 to unlock the value of BCP’s power business, which is overlooked by the market.
Key Risks:
Earnings exposed to crude oil volatility. Refiners’ earnings are volatile due to inventory gains/losses, following changes in crude oil prices each quarter. BCP mitigates the volatility by hedging and has a good track record, booking hedging gains over the past seven quarters. The company has a policy of hedging up to 30% of its output. Another risk is impairment charge of its E&P business if oil price continues its downward trend.
Company Background
BCP operates a 120-kbd oil refinery located in Bangkok. Its refined oil products are distributed via petrol stations under its retail marketing segment. BCP also invests in alternative energy, mainly solar and bio fuel.
Leverage & Asset Turnover (x)
Capital Expenditure
ROE (%)
Forward PE Band (x)
PB Band (x)
Source: Company, DBS Vickers
1.4
1.6
1.8
2.0
2.2
2.4
0.00
0.20
0.40
0.60
0.80
1.00
2014A 2015A 2016F 2017F 2018F
Gross Debt to Equity (LHS) Asset Turnover (RHS)
0.0
1,000.0
2,000.0
3,000.0
4,000.0
5,000.0
6,000.0
7,000.0
8,000.0
2014A 2015A 2016F 2017F 2018F
Capital Expenditure (-)
Btm
0.0%
2.0%
4.0%
6.0%
8.0%
10.0%
12.0%
14.0%
16.0%
2014A 2015A 2016F 2017F 2018F
Avg: 15.1x
+1sd: 26.4x
+2sd: 37.7x
‐1sd: 3.9x
-6.6
3.4
13.4
23.4
33.4
43.4
53.4
63.4
Jul-12 Jul-13 Jul-14 Jul-15 Jul-16
(x)
Avg: 1.29x
+1sd: 1.44x
+2sd: 1.59x
‐1sd: 1.14x
‐2sd: 1x
0.8
1.0
1.2
1.4
1.6
1.8
Jul-12 Jul-13 Jul-14 Jul-15 Jul-16
(x)
Page 73

ASIAN INSIGHTS VICKERS SECURITIES
Company Guide
Bangchak Petroleum Pcl
Key Assumptions
FY Dec 2014A 2015A 2016F 2017F 2018F
Crude run (kbd) 86.5 113 95.0 105 105 Base GRM (US$/bbl) 6.96 9.05 8.88 9.06 9.24 Marketing margin (Bt/litre) 0.71 0.76 0.70 0.70 0.70 Total capacity - Solar 118 118 131 131 131 EBITDA contribution - 2,572 3,005 3,026 3,026 3,026
Income Statement (Btm)
FY Dec 2014A 2015A 2016F 2017F 2018F
Revenue 183,016 151,140 120,537 144,670 157,273 Cost of Goods Sold (178,473) (139,686) (108,139) (131,635) (144,378) Gross Profit 4,543 11,454 12,398 13,035 12,895 Other Opng (Exp)/Inc (4,480) (5,175) (4,127) (4,954) (5,385) Operating Profit 63.1 6,279 8,271 8,081 7,509 Other Non Opg (Exp)/Inc 1,197 543 696 991 1,428 Associates & JV Inc 5.15 12.4 12.7 12.9 13.2 Net Interest (Exp)/Inc (1,427) (1,615) (1,545) (1,055) (697) Exceptional Gain/(Loss) 99.8 (449) 0.0 0.0 0.0 Pre-tax Profit (61.5) 4,770 7,434 8,030 8,254 Tax 691 (673) (1,079) (1,166) (1,198) Minority Interest 66.9 53.4 (63.6) (68.6) (70.6) Preference Dividend 0.0 0.0 0.0 0.0 0.0 Net Profit 696 4,151 6,292 6,795 6,985 Net Profit before Except. 596 4,600 6,292 6,795 6,985 EBITDA 4,579 11,542 13,748 13,896 13,805 Growth
Revenue Gth (%) (1.9) (17.4) (20.2) 20.0 8.7 EBITDA Gth (%) (52.2) 152.1 19.1 1.1 (0.7) Opg Profit Gth (%) (98.7) 9,854.4 31.7 (2.3) (7.1) Net Profit Gth (Pre-ex) (%) (87.1) 671.7 36.8 8.0 2.8 Margins & Ratio
Gross Margins (%) 2.5 7.6 10.3 9.0 8.2 Opg Profit Margin (%) 0.0 4.2 6.9 5.6 4.8 Net Profit Margin (%) 0.4 2.7 5.2 4.7 4.4 ROAE (%) 2.0 12.1 16.9 16.5 15.4 ROA (%) 0.9 5.2 7.5 7.7 7.6 ROCE (%) (1.3) 4.3 6.5 7.6 8.0 Div Payout Ratio (%) 197.9 66.3 41.6 40.5 41.4 Net Interest Cover (x) 0.0 3.9 5.4 7.7 10.8
Source: Company, DBS Vickers
Page 74

ASIAN INSIGHTS VICKERS SECURITIES
Company Guide
Bangchak Petroleum Pcl
Quarterly / Interim Income Statement (Btm)
FY Dec 1Q2015 2Q2015 3Q2015 4Q2015 1Q2016
Revenue 39,445 41,357 35,203 35,136 30,276 Cost of Goods Sold (37,082) (36,390) (33,118) (33,097) (29,327) Gross Profit 2,363 4,967 2,085 2,039 949 Other Oper. (Exp)/Inc (1,057) (1,314) (1,133) (1,672) (1,212) Operating Profit 1,307 3,653 952 367 (264) Other Non Opg (Exp)/Inc 104 139 201 98.8 126 Associates & JV Inc 11.5 (1.0) (1.8) 3.71 12.6 Net Interest (Exp)/Inc (411) (401) (391) (412) (373) Exceptional Gain/(Loss) 136 12.8 (332) (266) 305 Pre-tax Profit 1,147 3,403 429 (208) (193) Tax (90.6) (594) (5.6) 17.2 167 Minority Interest (19.1) (14.9) 8.72 78.6 72.0 Net Profit 1,037 2,794 432 (112) 46.6 Net profit bef Except. 901 2,781 764 154 (259) EBITDA 2,474 5,024 2,356 1,689 973
Growth
Revenue Gth (%) (13.8) 4.8 (14.9) (0.2) (13.8) EBITDA Gth (%) nm 103.1 (53.1) (28.3) (42.3) Opg Profit Gth (%) nm 179.5 (73.9) (61.4) nm Net Profit Gth (Pre-ex) (%) nm 208.5 (72.5) (79.9) nm Margins
Gross Margins (%) 6.0 12.0 5.9 5.8 3.1 Opg Profit Margins (%) 3.3 8.8 2.7 1.0 (0.9) Net Profit Margins (%) 2.6 6.8 1.2 (0.3) 0.2
Balance Sheet (Btm)
FY Dec 2014A 2015A 2016F 2017F 2018F
Net Fixed Assets 38,136 40,044 36,775 33,464 30,110 Invts in Associates & JVs 762 774 783 792 801 Other LT Assets 5,773 7,324 7,338 7,352 7,366 Cash & ST Invts 8,577 12,390 22,514 26,733 32,276 Inventory 14,059 13,945 10,996 13,566 14,958 Debtors 5,835 5,234 4,954 5,945 6,463 Other Current Assets 3,824 2,230 2,235 2,239 2,244 Total Assets 76,966 81,942 85,596 90,093 94,219
ST Debt 1,312 1,026 1,312 1,000 1,000 Creditor 5,774 4,994 7,080 8,687 9,556 Other Current Liab 4,223 4,468 4,468 4,468 4,468 LT Debt 28,886 32,632 30,262 29,262 28,262 Other LT Liabilities 2,804 2,838 2,841 2,844 2,847 Shareholder’s Equity 33,309 35,481 39,067 43,198 47,381 Minority Interests 657 502 566 635 705 Total Cap. & Liab. 76,966 81,942 85,596 90,093 94,219
Non-Cash Wkg. Capital 13,720 11,947 6,636 8,596 9,641 Net Cash/(Debt) (21,621) (21,268) (9,059) (3,529) 3,015 Debtors Turn (avg days) 14.5 13.4 15.4 13.7 14.4 Creditors Turn (avg days) 18.0 14.6 21.3 22.7 23.9 Inventory Turn (avg days) 32.5 37.9 44.0 35.3 37.3 Asset Turnover (x) 2.4 1.9 1.4 1.6 1.7 Current Ratio (x) 2.9 3.2 3.2 3.4 3.7 Quick Ratio (x) 1.3 1.7 2.1 2.3 2.6 Net Debt/Equity (X) 0.6 0.6 0.2 0.1 CASH Net Debt/Equity ex MI (X) 0.6 0.6 0.2 0.1 CASH Capex to Debt (%) 24.3 13.8 4.8 5.0 5.1 Z-Score (X) 3.7 3.4 2.9 3.2 3.3
Source: Company, DBS Vickers
Page 75

ASIAN INSIGHTS VICKERS SECURITIES
Company Guide
Bangchak Petroleum Pcl
Cash Flow Statement (Btm)
FY Dec 2014A 2015A 2016F 2017F 2018F
Pre-Tax Profit (61.5) 4,770 7,434 8,030 8,254 Dep. & Amort. 3,313 4,708 4,768 4,811 4,854 Tax Paid 691 (673) (1,079) (1,166) (1,198) Assoc. & JV Inc/(loss) (5.2) (12.4) (12.7) (12.9) (13.2) Chg in Wkg.Cap. 157 1,773 5,311 (1,960) (1,044) Other Operating CF 2,027 1,586 (62.1) (66.9) (68.6) Net Operating CF 6,121 12,153 16,359 9,636 10,784 Capital Exp.(net) (7,350) (4,645) (1,500) (1,500) (1,500) Other Invts.(net) 0.0 0.0 0.0 0.0 0.0 Invts in Assoc. & JV (5.2) (12.4) (8.9) (9.0) (9.2) Div from Assoc & JV 0.0 0.0 0.0 0.0 0.0 Other Investing CF (2,687) (6,686) 0.0 0.0 0.0 Net Investing CF (10,042) (11,343) (1,509) (1,509) (1,509) Div Paid (1,946) (2,039) (2,706) (2,664) (2,802) Chg in Gross Debt 9,369 3,460 (2,085) (1,312) (1,000) Capital Issues 0.0 0.0 0.0 0.0 0.0 Other Financing CF (2,075) (2,313) 63.6 68.6 70.6 Net Financing CF 5,348 (893) (4,727) (3,908) (3,731) Currency Adjustments 0.0 0.0 0.0 0.0 0.0 Chg in Cash 1,427 (82.4) 10,124 4,219 5,543 Opg CFPS (Bt) 4.33 7.54 8.02 8.42 8.59 Free CFPS (Bt) (0.9) 5.45 10.8 5.91 6.74
Source: Company, DBS Vickers
Target Price & Ratings History
Source: DBS Vickers
Corporate Governance CG Rating
Score Range Number of Logo Description
90-100 Excellent
80-89 Very Good
70-79 Good
60-69 Satisfactory
50-59 Pass
<50 No logo given N/A
S.No. DateClosing
PriceTarget
PriceRat ing
1: 22 Jul 15 35.50 39.00 BUY
2: 10 Aug 15 33.50 39.00 BUY
3: 20 Aug 15 34.25 39.00 BUY
4: 29 Oct 15 36.00 39.00 BUY
5: 10 Nov 15 35.00 39.00 BUY
6: 04 Feb 16 28.75 39.00 BUY
7: 24 Feb 16 30.25 39.00 BUY
8: 07 Apr 16 29.75 39.00 BUY
9: 20 Apr 16 30.75 39.00 BUY
10: 26 Apr 16 31.00 39.00 BUY
11: 03 May 16 30.50 39.00 BUY12: 13 May 16 30.00 39.00 BUY13: 19 May 16 30.00 39.00 BUY14: 27 Jun 16 30.25 39.00 BUY
Note : Share price and Target price are adjusted for corporate actions.
1 2
3
4
5
6 7
8
910
11
12
13
14
26.83
28.83
30.83
32.83
34.83
36.83
38.83
Jul-15 Nov-15 Mar-16 Jul-16
Bt
Page 76

ASIAN INSIGHTS VICKERS SECURITIES ed: CK / sa:MA, PY
FULLY VALUED Last Traded Price: Rp494 (JCI : 5,357.00) Price Target 12-mth: Rp420 (-15% downside) (Prev Rp400) Potential Catalyst: Quarterly financial performance Where we differ: We believe the share price rally is unjustifiable in view of its challenging business outlook going forward
Analyst
William SIMADIPUTRA +62 2130034939 [email protected]
What’s New Lift earnings forecasts for our new oil price view
Clients' efficiencies trend will cap its growth
Slow new contracts roll out
Slightly higher TP, maitain FULLY VALUED
Price Relative
Forecasts and Valuation FY Dec (Rp m) 2015A 2016F 2017F 2018F Revenue 3,775 3,716 3,675 3,572 EBITDA 732 868 810 779 Pre-tax Profit 513 631 562 518 Net Profit 376 440 391 362 Net Pft (Pre Ex.) 376 440 391 362 Net Pft Gth (Pre-ex) (%) (8.9) 17.1 (11.1) (7.5) EPS (Rp) 51.5 60.3 53.6 49.6 EPS Pre Ex. (Rp) 51.5 60.3 53.6 49.6 EPS Gth Pre Ex (%) (9) 17 (11) (8) Diluted EPS (Rp) 51.5 60.3 53.6 49.6 Net DPS (Rp) 14.9 17.4 15.5 14.3 BV Per Share (Rp) 356 399 437 473 PE (X) 9.6 8.2 9.2 10.0 PE Pre Ex. (X) 9.6 8.2 9.2 10.0 P/Cash Flow (X) 7.5 4.3 9.7 5.8 EV/EBITDA (X) 4.7 3.5 3.7 3.6 Net Div Yield (%) 3.0 3.5 3.1 2.9 P/Book Value (X) 1.4 1.2 1.1 1.0 Net Debt/Equity (X) CASH CASH CASH CASH ROAE (%) 14.6 16.0 12.8 10.9 Earnings Rev (%): 19 24 28 Consensus EPS (Rp): - - - Other Broker Recs: B: 0 S: 3 H: 0
Source of all data on this page: Company, DBS Vickers, Bloomberg Finance L.P
Better equipment utilisation outlook but valuation seems lofty
Raise our TP for new earnings forecast, maintain FULLY VALUED. We lift our DCF-based target price to Rp420 (FY16F PE of 7.8x, WACC 14.2%, TG 0%) for higher earnings forecasts. But we retain our FULLY VALUED call as we remain convinced that ELSA’s valuation is demanding – it is currently trading at +1SD of its 5-year average PE, which we believe is unjustifiable given the current efficiency trend for upstream E&P contractors. This trend will negatively impact the business and earnings outlook of oil and gas services companies like ELSA, mainly due to contract renegotiation pressures from clients and project discontinuation risks. Lift earnings forecasts for better crude oil price outlook. We raise our earnings forecasts mainly for our new crude oil price assumption. Higher oil prices will lead to better equipment utilisation rates, thus ultimately resulting in higher revenue and profitability. Our new FY16 and FY17 earnings are Rp440bn (-18.6% y-o-y) and Rp391bn (-14.6% y-o-y), respectively, 19% and 24% higher than our previous forecasts. We have pencilled in better profitability in the upstream oil segment, mainly thanks to ELSA’s continuous efficiency efforts in the face of contract fee pressure from clients. We also raise our top-line forecasts on the back of better overall equipment utilisation rates that are underpinned by a better crude oil price outlook. Valuation:
Our DCF-based target price of Rp420 (WACC of 14.2% and terminal growth rate of 0%) implies an FY17F PE of 7.8x. Key Risks to Our View:
Softer-than-expected contract re-pricing. If the contract renegotiation process outcome is more positive than our expectation, ELSA should book better-than-expected top-line and earnings growth relative to our forecasts. At A Glance Issued Capital (m shrs) 7,299 Mkt. Cap (Rpm/US$m) 3,605,459 / 273 Major Shareholders (%) Pertamina Persero PT (%) 41.1Dana Pensiun Pertamin (%) 17.8Prudential Life Assurance (%) 8.4
Free Float (%) 32.73m Avg. Daily Val (US$m) 2.2 ICB Industry : Health Care / Mining
DBS Group Research . Equity 6 Sep 2016
Indonesia Company Guide
Elnusa Version 3 | Bloomberg: ELSA IJ | Reuters: ELSA.JK Refer to important disclosures at the end of this report

ASIAN INSIGHTS VICKERS SECURITIES Page 2
Company Guide
Elnusa
WHAT’S NEW
Raise our TP for new earnings forecasts, maintain FULLY VALUED
We raise our DCF-based target price to Rp420 (FY16F PE of 7.8x, WACC 14.2%, TG 0%) for higher earnings forecasts. On the other hand, we retain our FULLY VALUED call as we remain convinced that ELSA’s valuation is demanding – it is currently trading at +1SD of its 5-year average PE and EV/EBITDA of 10.0x and 5.0x, respectively, which we believe are unjustifiable given the current efficiencies trend for upstream E&P contractors. This trend will negatively impact the business and earnings outlook of oil and gas services companies like ELSA, mainly due to contract renegotiation pressures from clients and project discontinuation risks.
Our top-line revision is mainly driven by the better revenue growth forecasts for the upstream oil and gas services segment, mainly on the back of better drilling activities. We expect ELSA’s equipment utilisation rate to trend up on higher
production activities for its clients, given the improving oil price outlook. This segment is supported by onshore drilling services and oilfield maintenance services, whose activities rise and fall in tandem with oil prices.
We raise our earnings forecasts mainly for our new crude oil price assumption. Higher oil prices will lead to better equipment utilisation rates, thus ultimately resulting in higher revenue and profitability. Our new FY16 and FY17 earnings are Rp440bn (-18.6% y-o-y) and Rp391bn (-14.6% y-o-y), respectively, 19% and 24% higher than our previous forecasts.
We have pencilled in better profitability in the upstream oil segment, mainly thanks to ELSA’s continuous efficiency efforts in the face of contract fee pressure from clients. We also raise our top-line forecasts on the back of better overall equipment utilisation rates that are underpinned by a better crude oil price outlook.
Earnings revision summary
2016F 2017F 2018F
Old New Changes Old New Changes Old New Changes
Revenue (US$m) 3,580 3,715 4% 3,480 3,675 6% 3,345 3,572 7% Gross profit (US$m) 711 819 15% 677 799 18% 637 764 20% Operating profit (US$m) 546 649 19% 465 575 24% 417 529 27% EBITDA (US$m) 766 868 13% 700 810 16% 666 779 17% NPAT (US$m) 369 440 19% 314 391 24% 284 362 28%
Integrated upstream services (US$m)
1,893 1,997 6% 1,774 1,915 8% 1,632 1,783 9%
Upstream support services (US$m) 205 221 8% 194 218 12% 185 216 17%
Downstream services (US$m)
1,483 1,497 1% 1,513 1,542 2% 1,528 1,573 3%
Source: Company, DBSVickers

ASIAN INSIGHTS VICKERS SECURITIES Page 3
Company Guide
Elnusa
CRITICAL DATA POINTS TO WATCH
Earnings Drivers:
Flattish top-line growth outlook. We expect ELSA’s top-line to gradually trend down on contract renegotiation fee impact from its clients. Oil and gas services contract fee renegotiation is on the contractors’ agenda to minimise their lifting cash cost per barrel this year. We assume that ELSA will enjoy stable profitability given its continuous efforts to improve efficiency, as seen in 1Q16. Our revenue and NPAT assumptions imply CAGR of -2% and -9% over 2016-2018, respectively. Downtrend in drilling rig revenue trend in drilling rig revenue. We expect flattish drilling rig revenue this year as ELSA will rely on the existing drilling projects but its revenue will drop by 8% y-o-y to Rp898bn in FY17 on lower drilling services fee. We have assumed the absence of new drilling projects going forward given the low crude oil prices will render many Indonesia major oil and gas projects not feasible – mainly the offshore blocks which have an average lifting cash cost per barrel of above US$40 per barrel. Seismic data collection activity will also stagnate. We also see soft demand for seismic data collection services for this year and beyond, as such activity is part of the exploration stage. Contractors in general will cut exploration activities as the part of their efficiencies effort, and focus on maximising their existing producing blocks for capital efficiencies. Stable downstream segment. We assume stable downstream revenues on the back of flattish oil throughput volume and transmission fee. Our assumption is in line with the prospects for drilling services revenue (flattish outlook), as the downstream segment is integrated into ELSA’s upstream services. Capex kept at minimal levels on soft new projects rollout. The downtrend in capex spending is consistent with our assumption that only maintenance capex spending will be incurred in the absence of new project rollouts. ELSA will only purchase new equipment or vessels if it can secure new contract wins going forward.
Drilling rig revenue (Rpbn)
Seismic data collection, 2D & 3D (sqkm)
Throughput volume (mn kL)
EBITDA Margin (%)
Capex (Rpbn)
Source: Company, DBS Vickers

ASIAN INSIGHTS VICKERS SECURITIES Page 4
Company Guide
Elnusa
Balance Sheet:
Lowly geared balance sheet. ELSA’s balance sheet is unlevered as it has no significant capex spending going forward, as mentioned earlier. This is positive for ELSA, in our view, as it would not face cash flow pressures in the event of significant contract fee renegotiation. Share Price Drivers:
Share price trend is tracking crude oil price outlook. ELSA’s share price movement is in line with the crude oil price trend, as crude oil price is a key driver for its business, especially upstream oil and gas services. Demanding valuation. Currently, ELSA is trading at +1SD of its 5-year average PE. We believe its current valuation is demanding given the bleak crude oil price outlook and the negative impact of low oil prices on the oil and gas services sector – mainly due to contract renegotiation pressures from clients and project discontinuation risks. Key Risks:
Softer-than-expected contract re-pricing. If the contract renegotiation process outcome is more positive than our expectation, ELSA should book better-than-expected top-line and earnings growth relative to our forecasts. Better-than-expected upstream oil & gas investment trend and new project rollouts. If the oil & gas investment trend (mainly for exploration projects) exceeds our expectation, ELSA may obtain new contracts and renew its existing contracts at competitive fees. In this scenario, ELSA's top-line and earnings growth should trump our forecasts. Better-than-expected diversification strategy, mainly for its overseas ventures. We assume only modest contribution from overseas projects on the back of execution risk concerns. However, if ELSA can deliver positive results from its overseas projects, this will offset the weak performance of domestic oil & gas projects. Company Background
An integrated oil services company that offers geophysical data, drilling and oil field services.
Leverage & Asset Turnover (x)
Capital Expenditure
ROE (%)
Forward PE Band (x)
PB Band (x)
Source: Company, DBS Vickers
Rpb

ASIAN INSIGHTS VICKERS SECURITIES Page 5
Company Guide
Elnusa
Key Assumptions
FY Dec 2014A 2015A 2016F 2017F 2018F Drilling rig revenue (Rpbn) 964 980 980 898 898 Seismic data collection, 1,982 1,000 1,000 1,000 800 Throughput volume (mn 11.9 12.1 12.5 12.9 13.1 EBITDA Margin (%) 15.8 17.9 23.4 22.1 21.8 Capex (Rpbn) 296 447 270 257 286
Segmental Breakdown
FY Dec 2014A 2015A 2016F 2017F 2018F Revenues (Rpm) Integrated Upstream Oil 2,454 1,976 1,997 1,915 1,783 Upstream Oil and Gas 219 220 221 218 216 Downstream Oil and Gas 1,549 1,580 1,497 1,542 1,573 Total 4,221 3,775 3,716 3,675 3,572 Operating profit (Rpm) Integrated Upstream Oil 186 305 246 248 238 Upstream Oil and Gas 39.9 12.9 13.0 13.1 12.9 Downstream Oil and Gas (30.4) 20.2 20.6 19.6 20.2 Total 195 338 279 281 271 Operating profit Margins Integrated Upstream Oil 7.6 15.4 12.3 13.0 13.4 Upstream Oil and Gas 18.3 5.9 5.9 6.0 6.0 Downstream Oil and Gas (2.0) 1.3 1.4 1.3 1.3 Total 4.6 9.0 7.5 7.6 7.6
Income Statement (Rpm)
FY Dec 2014A 2015A 2016F 2017F 2018F Revenue 4,221 3,775 3,716 3,675 3,572 Cost of Goods Sold (3,461) (3,057) (2,896) (2,876) (2,808) Gross Profit 760 719 819 799 765 Other Opng (Exp)/Inc (200) (249) (171) (224) (236) Operating Profit 560 470 649 575 529 Other Non Opg (Exp)/Inc 0.0 55.4 0.0 0.0 0.0 Associates & JV Inc 0.0 0.0 0.0 0.0 0.0 Net Interest (Exp)/Inc 0.10 (12.6) (17.2) (13.7) (11.0) Exceptional Gain/(Loss) 0.0 0.0 0.0 0.0 0.0 Pre-tax Profit 560 513 631 562 518 Tax (142) (133) (191) (170) (157) Minority Interest (5.7) (3.9) 0.0 0.0 1.00 Preference Dividend 0.0 0.0 0.0 0.0 0.0 Net Profit 412 376 440 391 362 Net Profit before Except. 412 376 440 391 362 EBITDA 696 732 868 810 779 Growth Revenue Gth (%) 2.7 (10.6) (1.6) (1.1) (2.8) EBITDA Gth (%) 24.3 5.2 18.6 (6.7) (3.9) Opg Profit Gth (%) 51.3 (16.0) 37.9 (11.3) (8.1) Net Profit Gth (Pre-ex) (%) 73.2 (8.9) 17.1 (11.1) (7.5) Margins & Ratio Gross Margins (%) 18.0 19.0 22.1 21.8 21.4 Opg Profit Margin (%) 13.3 12.5 17.5 15.7 14.8 Net Profit Margin (%) 9.8 10.0 11.8 10.6 10.1 ROAE (%) 17.2 14.6 16.0 12.8 10.9 ROA (%) 9.6 8.7 9.9 8.7 7.8 ROCE (%) 13.2 10.7 13.5 11.8 10.2 Div Payout Ratio (%) 28.9 28.9 28.9 28.9 28.9 Net Interest Cover (x) NM 37.3 37.8 41.9 48.2
Source: Company, DBS Vickers

ASIAN INSIGHTS VICKERS SECURITIES Page 6
Company Guide
Elnusa
Quarterly / Interim Income Statement (Rpm)
FY Dec 1Q2015 2Q2015 3Q2015 4Q2015 1Q2016 Revenue 925 879 816 1,156 921 Cost of Goods Sold (767) (741) (670) (878) (707) Gross Profit 158 138 146 278 214 Other Oper. (Exp)/Inc (66.4) (42.6) (84.9) (54.8) (45.6) Operating Profit 91.2 95.2 61.0 223 169 Other Non Opg (Exp)/Inc 0.0 0.0 69.8 (14.4) (24.1) Associates & JV Inc 0.0 0.0 0.0 0.0 0.0 Net Interest (Exp)/Inc (2.4) (1.7) (3.8) (4.7) (5.2) Exceptional Gain/(Loss) 0.0 0.0 0.0 0.0 0.0 Pre-tax Profit 88.8 93.5 127 204 139 Tax (23.0) (24.4) (32.1) (19.1) (36.8) Minority Interest (0.6) (1.6) (1.3) (4.7) (8.8) Net Profit 65.2 67.5 93.6 180 93.8 Net profit bef Except. 65.2 67.5 93.6 180 93.8 EBITDA 91.2 95.2 131 208 145 Growth Revenue Gth (%) (23.0) (5.0) (7.1) 41.6 (20.3) EBITDA Gth (%) (46.5) 4.4 37.5 59.2 (30.6) Opg Profit Gth (%) (64.6) 4.4 (35.9) 265.1 (24.3) Net Profit Gth (Pre-ex) (%) (47.5) 3.6 38.7 92.1 (47.9) Margins Gross Margins (%) 17.0 15.7 17.9 24.0 23.3 Opg Profit Margins (%) 9.9 10.8 7.5 19.3 18.3 Net Profit Margins (%) 7.0 7.7 11.5 15.6 10.2
Balance Sheet (Rpm)
FY Dec 2014A 2015A 2016F 2017F 2018F Net Fixed Assets 1,240 1,481 1,531 1,553 1,588 Invts in Associates & JVs 0.0 0.0 0.0 0.0 0.0 Other LT Assets 769 848 848 848 848 Cash & ST Invts 1,060 935 951 888 1,071 Inventory 115 128 96.1 95.4 93.1 Debtors 930 790 819 957 930 Other Current Assets 131 227 227 227 227 Total Assets 4,246 4,408 4,470 4,567 4,756 ST Debt 244 444 156 125 100 Creditor 305 218 255 158 154 Other Current Liab 829 787 924 902 889 LT Debt 249 296 159 127 102 Other LT Liabilities 35.5 27.8 27.8 27.8 27.8 Shareholder’s Equity 2,552 2,601 2,914 3,192 3,450 Minority Interests 31.5 34.3 34.3 34.3 33.3 Total Cap. & Liab. 4,246 4,408 4,470 4,567 4,756 Non-Cash Wkg. Capital 42.5 140 (37.2) 219 206 Net Cash/(Debt) 567 195 635 636 869 Debtors Turn (avg days) 81.6 83.2 79.0 88.2 96.4 Creditors Turn (avg days) 33.5 33.5 32.3 28.5 22.2 Inventory Turn (avg days) 11.9 15.5 15.3 13.2 13.5 Asset Turnover (x) 1.0 0.9 0.8 0.8 0.8 Current Ratio (x) 1.6 1.4 1.6 1.8 2.0 Quick Ratio (x) 1.4 1.2 1.3 1.6 1.8 Net Debt/Equity (X) CASH CASH CASH CASH CASH Net Debt/Equity ex MI (X) CASH CASH CASH CASH CASH Capex to Debt (%) 60.1 60.5 85.6 101.9 141.5 Z-Score (X) 0.0 0.0 0.0 0.0 0.0
Source: Company, DBS Vickers

ASIAN INSIGHTS VICKERS SECURITIES Page 7
Company Guide
Elnusa
Cash Flow Statement (Rpm)
FY Dec 2014A 2015A 2016F 2017F 2018F Pre-Tax Profit 560 513 631 562 518 Dep. & Amort. 105 206 220 235 250 Tax Paid (142) (65.9) (54.4) (191) (170) Assoc. & JV Inc/(loss) 0.0 0.0 0.0 0.0 0.0 Chg in Wkg.Cap. (24.4) (85.5) 39.9 (235) 25.3 Other Operating CF (78.5) (86.6) 0.0 0.0 0.0 Net Operating CF 421 481 837 371 623 Capital Exp.(net) (296) (447) (270) (257) (286) Other Invts.(net) 0.0 0.0 0.0 0.0 0.0 Invts in Assoc. & JV 0.0 0.0 0.0 0.0 0.0 Div from Assoc & JV 0.0 0.0 0.0 0.0 0.0 Other Investing CF (58.0) (78.3) 0.0 0.0 0.0 Net Investing CF (354) (526) (270) (257) (286) Div Paid (119) (109) (127) (113) (104) Chg in Gross Debt (412) 247 (424) (63.1) (50.5) Capital Issues 0.0 (219) 0.0 0.0 0.0 Other Financing CF 192 0.0 0.0 0.0 0.0 Net Financing CF (338) (81.0) (551) (176) (155) Currency Adjustments 12.4 0.0 0.0 0.0 0.0 Chg in Cash (260) (125) 15.5 (62.5) 183 Opg CFPS (Rp) 61.0 77.7 109 82.9 81.9 Free CFPS (Rp) 17.1 4.67 77.6 15.6 46.3
Source: Company, DBS Vickers
Target Price & Ratings History
Source: DBS Vickers
Analyst: William SIMADIPUTRA

ASIAN INSIGHTS VICKERS SECURITIES ed: CK / sa:MA, PY
BUY (Upgrade from HOLD)
Last Traded Price: Rp1,495 (JCI : 5,357.00) Price Target 12-mth: Rp2,000 (34% upside) (Prev Rp1,350) Potential Catalyst: Quarterly financial result, M&A announcement Where we differ: We believe MEDC will deliver robust operational profitability, thanks to its internal efficiencies
Analyst
William SIMADIPUTRA +62 2130034939 [email protected]
What’s New Raise earnings forecasts for new ASP assumption
Maximising profitability is the key theme this year
Batu Hijau asset acquisition is earnings accretive
Upgrade to BUY, with higher TP of Rp2,000
Price Relative
Forecasts and Valuation FY Dec (US$ m) 2015A 2016F 2017F 2018F Revenue 629 555 611 675 EBITDA 231 222 275 327 Pre-tax Profit (146) 34.2 87.6 127 Net Profit (182) 21.1 54.1 78.3 Net Pft (Pre Ex.) (2.8) 21.1 54.1 78.3 Net Pft Gth (Pre-ex) (%) nm nm 156.4 44.8 EPS (Rp) (721) 83.7 214 310 EPS Pre Ex. (Rp) (11.1) 83.7 214 310 EPS Gth Pre Ex (%) nm nm 156 45 Diluted EPS (Rp) (721) 83.7 214 310 Net DPS (Rp) 0.0 16.7 21.4 62.1 BV Per Share (Rp) 2,772 3,094 3,474 3,722 PE (X) nm 17.9 7.0 4.8 PE Pre Ex. (X) nm 17.9 7.0 4.8 P/Cash Flow (X) nm 2.4 2.3 2.0 EV/EBITDA (X) 5.5 5.3 4.1 3.3 Net Div Yield (%) 0.0 1.1 1.4 4.2 P/Book Value (X) 0.5 0.5 0.4 0.4 Net Debt/Equity (X) 1.3 1.0 0.8 0.7 ROAE (%) (22.6) 2.9 6.5 8.6 Earnings Rev (%): 56 131 59 Consensus EPS (Rp): 46.6 93.2 273.1 Other Broker Recs: B: 2 S: 0 H: 2
Source of all data on this page: Company, DBS Vickers, Bloomberg Finance L.P
Sustaining robust profitability
Raise TP for new management strategy. We upgrade MEDC to a BUY with a new target price of Rp2,000, mainly for new ASP assumption and continuous efficiency efforts that could lead to better profitability and FCFF generation. We believe MEDC’s low cost structure will ensure its survival, following the bottoming of crude oil prices. It will also focus on its most profitable blocks, mainly the onshore blocks such as Rimau – given its low cost structure. Revising forecasts for lower lifting cash cost and capex. We bump up our EBITDA by 6%, 22% and 17% for FY16, FY17 and FY18 to US$222m, US$275m and US$327m, respectively, for our new ASP assumption, higher gas production outlook, and stable lifting cost per barrel assumption. Our new assumption implies EBITDA margins of 44% in FY17 and 49% in FY18, higher than FY16's 39%. Stable cash lifting costs and a higher ASP allow MEDC to achieve better economies of scale and hence, margin expansion. Batu Hijau NNT asset acquisition is earnings accretive. We believe the acquisition of Batu Hijau NNT (Newmont NusaTenggara) mining assets is earnings accretive, given Batu Hijau is in a healthy financial position. It booked revenue of US$1.6bn with estimated EBIT of US$749m in FY15. However, MEDC has not disclosed the transaction structure yet. Valuation:
We have a Buy call with a higher DCF-based target price of Rp2,000 per share 5.5x FY17F EV/EBTDA). We assume WACC of 9.4% and a terminal growth rate of 0%. Our valuation is based on our earnings forecast, consisting of MEDC's existing business only (ex. M&A). Key Risks to Our View:
Execution risk. Our earnings forecast also depends on MEDC’s execution capability to maintain its cash cost per barrel at low levels, enhance its depleted existing reserves and achieve successful exploration investments. At A Glance Issued Capital (m shrs) 3,332 Mkt. Cap (Rpm/US$m) 4,982,015 / 377 Major Shareholders (%) Encore Energy Pte Ltde 50.7Credit Suisse Group AG 20.7Prudential Life Assurance 9.9
Free Float (%) 18.73m Avg. Daily Val (US$m) 0.61 ICB Industry : Oil & Gas / Oil & Gas Producers
DBS Group Research . Equity 6 Sep 2016
Indonesia Company Guide
Medco Energi Internasional Version 3 | Bloomberg: MEDC IJ | Reuters: MEDC.JK Refer to important disclosures at the end of this report

ASIAN INSIGHTS VICKERS SECURITIES Page 2
Company Guide
Medco Energi Internasional
WHAT’S NEW
Sustaining robust profitability
Revising forecasts for new ASP and gas production volume. We bump up our EBITDA by 6%, 22% and 17% for FY16, FY17 and FY18 to us$222m, US$275m and US$327m, respectively, for our new ASP assumption, and 3% lower lifting cost per barrel from FY18. Moreover, we lifted our gas production outlook as Senoro-Toili Gas field started to fully operate this year. Our FY17 and FY18 earnings forecasts rise by 131% and 59% to US$54m and US$78m, respectively, on the back of stable financing costs – we do not see the need for MEDC to drawdown its debt facility for significant expansion. Our new ASP assumption implies EBITDA margins of 45% in FY17 and 48% in FY18, higher than FY16's 40%. Stable cash lifting costs and a higher ASP allow MEDC to achieve better economies of scale and hence, margin expansion. It will also focus on its most profitable blocks, mainly the onshore blocks such as Rimau – given its low cost structure. We maintain our
overall oil and gas lifting target this year. As MEDC will remain conservative on its production expansion, it will continue to focus on reducing its cash margin per barrel. Our new forecast also results 58% and 23% higher FCFF in FY17 and FY18. Higher ASP is positive for MEDC cash flow; every US$10 per barrel of higher ASP, MEDC can take home extra US$45m cash inflows to its pocket. Moreover, we maintain our capex forecast, as management will prioritise only the maintenance capex of existing production blocks. We continue to believe that MEDC capex will be minimum as it has 17 years of reserves life index. We believe the acquisition of Batu Hijau NNT is earnings accretive, given Batu Hijau is in a healthy financial position. It booked revenue of US$1.6bn with estimated EBIT of US$749m in FY15. However, MEDC has not disclosed the transaction structure yet.
Earnings revision summary
2016F 2017F 2018F
Old New Changes Old New Changes Old New Changes
Revenue (US$mn) 540 555 3% 540 611 13% 613 675 10% Gross profit (US$mn) 197 212 8% 219 281 28% 280 337 21% EBITDA (US$mn) 210 222 6% 225 275 22% 280 327 17% Net profit (US$mn) 13 21 56% 23 54 131% 49 78 59%
Oil ASP (US$/bbl) 45 45 0% 45 50 11% 55 57 4% Gas ASP (US$/MMBTU) 5.9 5.9 0% 6.0 6.0 0% 6.2 6.2 0% Oil prod (MBOPD) 19.8 19.8 0% 18.8 19.8 5% 18.8 19.8 5% Gas prod (BBTUPD) 123.6 132 7% 127.3 141.2 11% 131.1 148.3 13% Cash cost (US$/boe) 12.0 12.0 0% 12.0 12.0 0% 12.4 12.0 -3% Capex (US$mn) 121 121 0% 141.3 141.3 0% 121.6 121.6 0%
FCFF (US$mn) 96.7 107.0 11% 66.9 105.6 58% 129.3 159.3 23%
Source : DBS Vickers

ASIAN INSIGHTS VICKERS SECURITIES Page 3
Company Guide
Medco Energi Internasional
CRITICAL DATA POINTS TO WATCH
Earnings Drivers:
Flattish oil and gas lifting target on profitability prioritisation. Our forecast is in line with management’s guidance on oil and gas lifting target, as management adopts a more defensive stance for its production plan. Management will only focus on the most profitable shore blocks such as Rimau to keep its cash cost at the lowest level. Meanwhile we see higher gas production volume going forward as Senoro-Toili gas field started to fully operate this year. Lower ASP in line with global crude oil price trend. We are raising our ASP by around US$5 per barrel to obtain our crude oil price forecasts of US$50 per barrel in FY17. Our crude oil ASP trend is largely in line with our in-house oil price forecast of US$45 per barrel in FY16 with a gradual recovery to US$50 per barrel in 2017, and US$57 per barrel thereafter. On the other hand, we see natural gas ASP being more stable going forward, as MEDC’s gas pricing is based on long-term contracts (in some cases, inflation-adjusted). Lower lifting cash cost will keep margins stable. We are lowering our lifting cash cost per barrel to US$12 per barrel, which is still higher than management’s guidance of US$10 per barrel this year. MEDC will halt its offshore and other high cost blocks to further lower its cost structure this year. We believe the low cash cost per barrel will sustain for the next three years, as the Rimau block can still maintain its production momentum without significant additional reserve enhancement programmes in the medium term. Slash capex further. MEDC will slash its capex further this year or around one third of our previous forecast. MEDC will focus only on the maintenance capex for its existing projects and cut unnecessary spending on exploration programmes. This will not harm MEDC’s business in the long run, as it has a remaining oil and gas reserve life of 17 years.
Oil production (MMBOPD)
Gas production (BBUPD)
Crude oil ASP (US$/bbl)
Lifting cost (US$/bbl)
Net capex (US$mn)
Source: Company, DBS Vickers

ASIAN INSIGHTS VICKERS SECURITIES Page 4
Company Guide
Medco Energi Internasional
Balance Sheet:
Balance sheet is solid, no liquidity issues. We also do not see any liquidity issue for MEDC, as it had US$400 cash balance in 1Q16, with the maturing debt this year at US$253m. Moreover, we also expect its EBITDA to interest to remain above 2.0x going forward, given MEDC’s low operating cash cost structure Share Price Drivers:
MEDC’s share price trend is in line with the global crude oil price outlook, as crude oil price is one of the key drivers of MEDC’s overall drilling activities, expansion strategy and earnings growth. Its share price tumbled last year in tandem with crude oil prices, though it has rebounded in the past month on the back of speculation that MEDC will acquire the Newmont's Batu Hijau Indonesia mining assets. Key Risks:
Crude oil price. If the crude oil price dips below our price range, the impact on Indonesia’s oil and gas industry could be larger than expected. This would translate into lower ASP for MEDC and hence, lead to weaker-than-expected earnings growth. Execution risk. Our earnings forecast also depends on MEDC’s execution capability to maintain its cash cost per barrel at low levels, enhance its depleted existing reserves and achieve successful exploration investments. Worse-than-expected oil and gas lifting performance. We assume natural gas production volume would still be able to offset the oil production volume going forward. If MEDC cuts natural gas production, its operational and financial performance will come in below our expectations. Company Background
MEDC is an integrated energy company that is in involved in oil and gas exploration and production activities in Indonesia and internationally.
Leverage & Asset Turnover (x)
Capital Expenditure
ROE (%)
Forward EV/EBITDA (x)
PB Band (x)
Source: Company, DBS Vickers
Average
+1 stdev
+2 stdev
-1 stdev
1.0
2.0
3.0
4.0
5.0
6.0
7.0
8.0
9.0
Jan-13 Jul-13 Jan-14 Jul-14 Jan-15 Jul-15 Jan-16
(x)

ASIAN INSIGHTS VICKERS SECURITIES Page 5
Company Guide
Medco Energi Internasional
Key Assumptions
FY Dec 2014A 2015A 2016F 2017F 2018F Oil production (MMBOPD) 22.2 22.0 19.8 19.8 19.8 Gas production (BBUPD) 141 130 132 141 148 Crude oil ASP (US$/bbl) 97.8 49.0 45.0 50.0 57.0 Lifting cost (US$/bbl) 13.8 14.2 12.0 12.0 12.0 Capex (US$mn) (308) 282 (121) (141) (122)
Segmental Breakdown
FY Dec 2014A 2015A 2016F 2017F 2018F Revenues (US$m) Oil and gas sales 701 574 517 572 637 Chemicals and other 36.1 32.6 17.0 17.0 17.0 Services 13.2 21.5 21.5 21.5 21.5 Total 751 629 555 611 675
Income Statement (US$m)
FY Dec 2014A 2015A 2016F 2017F 2018F Revenue 751 629 555 611 675 Cost of Goods Sold (480) (420) (343) (330) (338) Gross Profit 271 208 212 281 338 Other Opng (Exp)/Inc (106) (119) (108) (109) (121) Operating Profit 165 89.5 104 172 217 Other Non Opg (Exp)/Inc 0.0 7.20 0.0 0.0 0.0 Associates & JV Inc 7.10 7.20 7.20 7.20 7.20 Net Interest (Exp)/Inc (61.0) (71.2) (77.0) (91.4) (97.0) Exceptional Gain/(Loss) 0.0 (179) 0.0 0.0 0.0 Pre-tax Profit 111 (146) 34.2 87.6 127 Tax (97.8) (33.5) (12.0) (30.7) (44.4) Minority Interest (3.6) (2.0) (1.1) (2.8) (4.1) Preference Dividend 0.0 0.0 0.0 0.0 0.0 Net Profit 9.60 (182) 21.1 54.1 78.3 Net Profit before Except. 9.60 (2.8) 21.1 54.1 78.3 EBITDA 259 231 222 275 327 Growth Revenue Gth (%) (15.3) (16.3) (11.6) 10.0 10.6 EBITDA Gth (%) (27.6) (10.7) (3.9) 23.8 18.7 Opg Profit Gth (%) (33.7) (45.7) 16.1 65.3 26.1 Net Profit Gth (Pre-ex) (%) (72.5) nm nm 156.4 44.8 Margins & Ratio Gross Margins (%) 36.1 33.1 38.2 46.0 50.0 Opg Profit Margin (%) 22.0 14.2 18.7 28.1 32.1 Net Profit Margin (%) 1.3 (28.9) 3.8 8.9 11.6 ROAE (%) 1.1 (22.6) 2.9 6.5 8.6 ROA (%) 0.4 (6.5) 0.7 1.9 2.6 ROCE (%) 0.8 3.5 2.6 4.3 5.2 Div Payout Ratio (%) 52.5 N/A 20.0 10.0 20.0 Net Interest Cover (x) 2.7 1.3 1.4 1.9 2.2
Source: Company, DBS Vickers
Flattish oil production outlook as MEDC will focus on maximising its profitability and cashflow

ASIAN INSIGHTS VICKERS SECURITIES Page 6
Company Guide
Medco Energi Internasional
Quarterly / Interim Income Statement (US$m)
FY Dec 1Q2015 2Q2015 3Q2015 4Q2015 1Q2016 Revenue 128 146 144 210 145 Cost of Goods Sold (78.0) (101) (80.2) (161) (87.0) Gross Profit 49.8 45.0 64.1 48.9 57.6 Other Oper. (Exp)/Inc (32.1) (16.3) (39.7) (30.7) (23.2) Operating Profit 17.6 28.7 24.4 18.3 34.4 Other Non Opg (Exp)/Inc 0.0 0.0 (23.9) (148) (5.8) Associates & JV Inc 2.20 1.60 2.50 0.90 0.50 Net Interest (Exp)/Inc (15.6) (18.8) (15.5) (21.4) (23.7) Exceptional Gain/(Loss) 0.0 0.0 0.0 0.0 0.0 Pre-tax Profit 4.20 11.6 (12.5) (150) 5.40 Tax (5.5) (4.1) (14.6) (9.3) 5.60 Minority Interest (1.2) (0.5) (1.6) 1.30 (0.8) Net Profit (1.5) (16.1) (27.0) (144) 10.2 Net profit bef Except. (1.5) (16.1) (27.0) (144) 10.2 EBITDA 44.9 52.6 60.4 58.4 65.0 Growth Revenue Gth (%) (35.8) 14.4 (1.2) 45.5 (31.1) EBITDA Gth (%) 6.4 17.1 14.9 (3.3) 11.2 Opg Profit Gth (%) (60.8) 62.9 (15.1) (25.1) 88.1 Net Profit Gth (Pre-ex) (%) nm (998.9) (68.2) (432.1) nm Margins Gross Margins (%) 39.0 30.8 44.4 23.3 39.8 Opg Profit Margins (%) 13.8 19.7 16.9 8.7 23.8 Net Profit Margins (%) (1.1) (11.0) (18.7) (68.4) 7.1
Balance Sheet (US$m)
FY Dec 2014A 2015A 2016F 2017F 2018F Net Fixed Assets 1,396 986 996 1,041 1,060 Invts in Associates & JVs 0.0 0.0 0.0 0.0 0.0 Other LT Assets 556 879 879 879 879 Cash & ST Invts 475 692 561 716 770 Inventory 39.3 40.1 28.1 27.0 27.7 Debtors 102 98.5 75.2 82.6 91.4 Other Current Assets 135 217 217 217 217 Total Assets 2,702 2,913 2,756 2,963 3,045 ST Debt 184 258 230 344 344 Creditor 91.9 77.4 65.7 63.1 64.7 Other Current Liab 192 191 192 211 224 LT Debt 922 1,322 1,123 1,100 1,100 Other LT Liabilities 392 360 360 360 360 Shareholder’s Equity 911 699 780 876 939 Minority Interests 9.60 5.10 6.20 9.10 13.2 Total Cap. & Liab. 2,702 2,913 2,756 2,963 3,045 Non-Cash Wkg. Capital (8.2) 87.5 62.8 53.0 47.2 Net Cash/(Debt) (631) (888) (791) (728) (674) Debtors Turn (avg days) 59.6 58.1 57.1 47.2 47.0 Creditors Turn (avg days) 86.6 105.5 112.5 100.7 99.3 Inventory Turn (avg days) 35.5 49.5 53.6 43.1 42.5 Asset Turnover (x) 0.3 0.2 0.2 0.2 0.2 Current Ratio (x) 1.6 2.0 1.8 1.7 1.7 Quick Ratio (x) 1.2 1.5 1.3 1.3 1.4 Net Debt/Equity (X) 0.7 1.3 1.0 0.8 0.7 Net Debt/Equity ex MI (X) 0.7 1.3 1.0 0.8 0.7 Capex to Debt (%) 27.8 (17.9) 8.9 9.8 8.4 Z-Score (X) 1.1 0.9 0.9 0.9 1.0
Source: Company, DBS Vickers
Earnings hit by one-off impairment charges despite core earnings being still positive
Strong balance sheet will guarantee MEDC’s survival in the current low oil price environment

ASIAN INSIGHTS VICKERS SECURITIES Page 7
Company Guide
Medco Energi Internasional
Cash Flow Statement (US$m)
FY Dec 2014A 2015A 2016F 2017F 2018F Pre-Tax Profit 111 (146) 34.2 87.6 127 Dep. & Amort. 87.0 127 111 96.0 103 Tax Paid (97.8) (33.5) (12.0) (30.7) (44.4) Assoc. & JV Inc/(loss) (7.1) 0.0 0.0 0.0 0.0 Chg in Wkg.Cap. 28.7 (53.0) 24.7 9.70 5.90 Other Operating CF 41.5 (32.3) 0.0 0.0 0.0 Net Operating CF 163 (138) 158 163 191 Capital Exp.(net) (308) 282 (121) (141) (122) Other Invts.(net) (27.3) (6.2) 0.0 0.0 0.0 Invts in Assoc. & JV 0.0 128 0.0 0.0 0.0 Div from Assoc & JV 0.50 (451) 0.0 0.0 0.0 Other Investing CF 21.0 0.0 0.0 0.0 0.0 Net Investing CF (314) (47.2) (121) (141) (122) Div Paid (5.0) 0.0 (4.2) (5.4) (15.7) Chg in Gross Debt 205 474 (228) 92.1 0.0 Capital Issues 20.5 (23.4) 64.2 47.0 0.0 Other Financing CF (127) (6.4) 0.0 0.0 0.0 Net Financing CF 93.9 444 (168) 134 (15.7) Currency Adjustments (0.7) 0.0 0.0 0.0 0.0 Chg in Cash (57.3) 259 (131) 155 53.8 Opg CFPS (Rp) 534 (337) 528 607 734 Free CFPS (Rp) (574) 572 148 84.9 276
Source: Company, DBS Vickers
Target Price & Ratings History
Source: DBS Vickers
Analyst: William SIMADIPUTRA
S.No. Da teClos ing
Pric eTa rge t Pri c e
Ra ting
1 15 Dec 15 765 820 HOLD
2 01 Apr 16 1435 820 HOLD
3 20 Apr 16 1385 1350 HOLD
4 01 Jul 16 1870 1350 BUY
Note : Share price and Target price are adjusted for corporate actions.
1
23
4
636
836
1036
1236
1436
1636
1836
Sep-15 Jan-16 May-16 Sep-16
Rp
Our capex forecast is in line with management’s capital efficiency strategy and guidance

Regional Industry Focus
Oil and Gas
Page 36
DBS Bank Ltd recommendations are based an Absolute Total Return* Rating system, defined as follows:
STRONG BUY (>20% total return over the next 3 months, with identifiable share price catalysts within this time frame)
BUY (>15% total return over the next 12 months for small caps, >10% for large caps)
HOLD (-10% to +15% total return over the next 12 months for small caps, -10% to +10% for large caps)
FULLY VALUED (negative total return i.e. > -10% over the next 12 months)
SELL (negative total return of > -20% over the next 3 months, with identifiable catalysts within this time frame)
Share price appreciation + dividends
Completed Date: 6 Sep 2016 07:33:00
Dissemination Date: 6 Sep 2016 08:59:46
GENERAL DISCLOSURE/DISCLAIMER This report is prepared by DBS Bank Ltd. This report is solely intended for the clients of DBS Bank Ltd, DBS Vickers Securities (Singapore) Pte Ltd, its respective connected and associated corporations and affiliates only and no part of this document may be (i) copied, photocopied or duplicated in any form or by any means or (ii) redistributed without the prior written consent of DBS Bank Ltd. The research set out in this report is based on information obtained from sources believed to be reliable, but we (which collectively refers to DBS Bank Ltd, its respective connected and associated corporations, affiliates and their respective directors, officers, employees and agents (collectively, the “DBS Group”)) do not make any representation or warranty as to its accuracy, completeness or correctness. Opinions expressed are subject to change without notice. This document is prepared for general circulation. Any recommendation contained in this document does not have regard to the specific investment objectives, financial situation and the particular needs of any specific addressee. This document is for the information of addressees only and is not to be taken in substitution for the exercise of judgement by addressees, who should obtain separate independent legal or financial advice. The DBS Group accepts no liability whatsoever for any direct, indirect and/or consequential loss (including any claims for loss of profit) arising from any use of and/or reliance upon this document and/or further communication given in relation to this document. This document is not to be construed as an offer or a solicitation of an offer to buy or sell any securities. The DBS Group, along with its affiliates and/or persons associated with any of them may from time to time have interests in the securities mentioned in this document. The DBS Group may have positions in, and may effect transactions in securities mentioned herein and may also perform or seek to perform broking, investment banking and other banking services for these companies. Any valuations, opinions, estimates, forecasts, ratings or risk assessments herein constitutes a judgment as of the date of this report, and there can be no assurance that future results or events will be consistent with any such valuations, opinions, estimates, forecasts, ratings or risk assessments. The information in this document is subject to change without notice, its accuracy is not guaranteed, it may be incomplete or condensed and it may not contain all material information concerning the company (or companies) referred to in this report and the DBS Group is under no obligation to update the information in this report. This publication has not been reviewed or authorized by any regulatory authority in Singapore, Hong Kong or elsewhere. There is no planned schedule or frequency for updating research publication relating to any issuer. The valuations, opinions, estimates, forecasts, ratings or risk assessments described in this report were based upon a number of estimates and assumptions and are inherently subject to significant uncertainties and contingencies. It can be expected that one or more of the estimates on which the valuations, opinions, estimates, forecasts, ratings or risk assessments were based will not materialize or will vary significantly from actual results. Therefore, the inclusion of the valuations, opinions, estimates, forecasts, ratings or risk assessments described herein IS NOT TO BE RELIED UPON as a representation and/or warranty by the DBS Group (and/or any persons associated with the aforesaid entities), that: (a) such valuations, opinions, estimates, forecasts, ratings or risk assessments or their underlying assumptions will be achieved, and (b) there is any assurance that future results or events will be consistent with any such valuations, opinions, estimates, forecasts, ratings or risk
assessments stated therein. Please contact the primary analyst for valuation methodologies and assumptions associated with the covered companies or price targets. Any assumptions made in this report that refers to commodities, are for the purposes of making forecasts for the company (or companies) mentioned herein. They are not to be construed as recommendations to trade in the physical commodity or in the futures contract relating to the commodity referred to in this report. DBS Vickers Securities (USA) Inc ("DBSVUSA")"), a U.S.-registered broker-dealer, does not have its own investment banking or research department, has not participated in any public offering of securities as a manager or co-manager or in any other investment banking transaction in the past twelve months and does not engage in market-making.
Page 91

Regional Industry Focus
Oil and Gas
Page 37
ANALYST CERTIFICATION
The research analyst(s) primarily responsible for the content of this research report, in part or in whole, certifies that the views about the companies and their securities expressed in this report accurately reflect his/her personal views. The analyst(s) also certifies that no part of his/her compensation was, is, or will be, directly, or indirectly, related to specific recommendations or views expressed in the report. The DBS Group has procedures in place to eliminate, avoid and manage any potential conflicts of interests that may arise in connection with the production of research reports. As of 6 Sep 2016, the analyst(s) and his/her spouse and/or relatives who are financially dependent on the analyst(s), do not hold interests in the securities recommended in this report (“interest” includes direct or indirect ownership of securities). The research analyst(s) responsible for this report operates as part of a separate and independent team to the investment banking function of the DBS Group and procedures are in place to ensure that confidential information held by either the research or investment banking function is handled appropriately. COMPANY-SPECIFIC / REGULATORY DISCLOSURES
1. DBS Bank Ltd., DBS Vickers Securities (Singapore) Pte Ltd (“DBSVS”), their subsidiaries and/or other affiliates have proprietary positions in Keppel Corporation, Sembcorp Marine, Sembcorp Industries, Yangzijiang Shipbuilding, Cosco Corporation, Ezion Holdings, Ezra Holdings, The Bangchak Petroleum, IRPC Pcl, PTT, PTT Exploration & Production, PTT Global Chemical, Thai Oil PCL as of 31 Jul 2016.
2. DBS Bank Ltd does not market make in equity securities of the issuer(s) or company(ies) mentioned in this Research Report.
3.
Compensation for investment banking services: DBS Bank Ltd., DBSVS, their subsidiaries and/or other affiliates of DBSVUSA have received compensation, within the past 12 months for investment banking services from Keppel Corporation, Ezion Holdings, Ezra Holdings, Nam Cheong Ltd, Pacific Radiance Ltd, Medco Energi International as of 31 Jul 2016. DBS Bank Ltd., DBSVS, their subsidiaries and/or other affiliates of DBSVUSA, within the next 3 months, will receive or intend to seek compensation for investment banking services from Ezion Holdings as of 31 Jul 2016. DBS Bank Ltd., DBSVS, their subsidiaries and/or other affiliates of DBSVUSA have managed or co-managed a public offering of securities for Keppel Corporation, Ezion Holdings, Pacific Radiance Ltd, Medco Energi International in the past 12 months, as of 31 Jul 2016. DBSVUSA does not have its own investment banking or research department, nor has it participated in any public offering of securities as a manager or co-manager or in any other investment banking transaction in the past twelve months. Any US persons wishing to obtain further information, including any clarification on disclosures in this disclaimer, or to effect a transaction in any security discussed in this document should contact DBSVUSA exclusively.
4. Directorship/trustee interests Danny Teoh Leong Kay, a member of DBS Group Holdings Board of Directors, is a Director of Keppel Corporation as of 30 June 2016.
RESTRICTIONS ON DISTRIBUTION
General This report is not directed to, or intended for distribution to or use by, any person or entity who is a citizen or resident of or located in any locality, state, country or other jurisdiction where such distribution, publication, availability or use would be contrary to law or regulation.
Australia This report is being distributed in Australia by DBS Bank Ltd. (“DBS”) or DBS Vickers Securities (Singapore) Pte Ltd (“DBSVS”), both of which are exempted from the requirement to hold an Australian Financial Services Licence under the Corporation Act 2001 (“CA”) in respect of financial services provided to the recipients. Both DBS and DBSVS are regulated by the Monetary Authority of Singapore under the laws of Singapore, which differ from Australian laws. Distribution of this report is intended only for “wholesale investors” within the meaning of the CA.
Hong Kong This report is being distributed in Hong Kong by or on behalf of, and is attributable to DBS Vickers (Hong Kong) Limited which is licensed and regulated by the Hong Kong Securities and Futures Commission and/or by DBS Bank (Hong Kong) Limited which is regulated by the Hong Kong Monetary Authority and the Securities and Futures Commission. Where this publication relates to a research report, unless otherwise stated in the research report(s), DBS Bank (Hong Kong) Limited is not the issuer of the research report(s). This publication including any research report(s) is/are distributed on the express understanding that, whilst the information contained within is believed to be reliable, the information has not been independently verified by DBS Bank (Hong Kong) Limited. This report is intended for distribution in Hong Kong only to professional investors (as defined in the Securities and Futures Ordinance (Chapter 571 of the Laws of Hong Kong) and any rules promulgated thereunder.) For any query regarding the materials herein, please contact Paul Yong (CE. No. ASE988) at [email protected].
Indonesia This report is being distributed in Indonesia by PT DBS Vickers Securities Indonesia.
Page 92

Regional Industry Focus
Oil and Gas
Page 38
Malaysia This report is distributed in Malaysia by AllianceDBS Research Sdn Bhd ("ADBSR"). Recipients of this report, received from
ADBSR are to contact the undersigned at 603-2604 3333 in respect of any matters arising from or in connection with this report. In addition to the General Disclosure/Disclaimer found at the preceding page, recipients of this report are advised that ADBSR (the preparer of this report), its holding company Alliance Investment Bank Berhad, their respective connected and associated corporations, affiliates, their directors, officers, employees, agents and parties related or associated with any of them may have positions in, and may effect transactions in the securities mentioned herein and may also perform or seek to perform broking, investment banking/corporate advisory and other services for the subject companies. They may also have received compensation and/or seek to obtain compensation for broking, investment banking/corporate advisory and other services from the subject companies.
Wong Ming Tek, Executive Director, ADBSR
Singapore This report is distributed in Singapore by DBS Bank Ltd (Company Regn. No. 196800306E) or DBSVS (Company Regn No. 198600294G), both of which are Exempt Financial Advisers as defined in the Financial Advisers Act and regulated by the Monetary Authority of Singapore. DBS Bank Ltd and/or DBSVS, may distribute reports produced by its respective foreign entities, affiliates or other foreign research houses pursuant to an arrangement under Regulation 32C of the Financial Advisers Regulations. Where the report is distributed in Singapore to a person who is not an Accredited Investor, Expert Investor or an Institutional Investor, DBS Bank Ltd accepts legal responsibility for the contents of the report to such persons only to the extent required by law. Singapore recipients should contact DBS Bank Ltd at 6327 2288 for matters arising from, or in connection with the report.
Thailand This report is being distributed in Thailand by DBS Vickers Securities (Thailand) Co Ltd. Research reports distributed are only intended for institutional clients only and no other person may act upon it.
United Kingdom
This report is produced by DBS Bank Ltd which is regulated by the Monetary Authority of Singapore. This report is disseminated in the United Kingdom by DBS Vickers Securities (UK) Ltd, ("DBSVUK"). DBSVUK is authorised and regulated by the Financial Conduct Authority in the United Kingdom. In respect of the United Kingdom, this report is solely intended for the clients of DBSVUK, its respective connected and associated corporations and affiliates only and no part of this document may be (i) copied, photocopied or duplicated in any form or by any means or (ii) redistributed without the prior written consent of DBSVUK. This communication is directed at persons having professional experience in matters relating to investments. Any investment activity following from this communication will only be engaged in with such persons. Persons who do not have professional experience in matters relating to investments should not rely on this communication.
Dubai
This research report is being distributed in The Dubai International Financial Centre (“DIFC”) by DBS Bank Ltd., (DIFC Branch) having its office at PO Box 506538, 3rd Floor, Building 3, East Wing, Gate Precinct, Dubai International Financial Centre (DIFC), Dubai, United Arab Emirates. DBS Bank Ltd., (DIFC Branch) is regulated by The Dubai Financial Services Authority. This research report is intended only for professional clients (as defined in the DFSA rulebook) and no other person may act upon it.
United States This report was prepared by DBS Bank Limited. DBSVUSA did not participate in its preparation. The research analyst(s) named on this report are not registered as research analysts with FINRA and are not associated persons of DBSVUSA. The research analyst(s) are not subject to FINRA Rule 2241 restrictions on analyst compensation, communications with a subject company, public appearances and trading securities held by a research analyst. This report is being distributed in the United States by DBSVUSA, which accepts responsibility for its contents. This report may only be distributed to Major U.S. Institutional Investors (as defined in SEC Rule 15a-6) and to such other institutional investors and qualified persons as DBSVUSA may authorize. Any U.S. person receiving this report who wishes to effect transactions in any securities referred to herein should contact DBSVUSA directly and not its affiliate.
Other jurisdictions
In any other jurisdictions, except if otherwise restricted by laws or regulations, this report is intended only for qualified, professional, institutional or sophisticated investors as defined in the laws and regulations of such jurisdictions.
DBS Bank Ltd.
12 Marina Boulevard, Marina Bay Financial Centre Tower 3 Singapore 018982 Tel. 65-6878 8888
e-mail: [email protected] Company Regn. No. 196800306E
Page 93