regional inequality and economic: development...
TRANSCRIPT

Regional inequality and economic development in Brazil
Item Type text; Thesis-Reproduction (electronic)
Authors Zombek, John Joseph, 1938-
Publisher The University of Arizona.
Rights Copyright © is held by the author. Digital access to this materialis made possible by the University Libraries, University of Arizona.Further transmission, reproduction or presentation (such aspublic display or performance) of protected items is prohibitedexcept with permission of the author.
Download date 06/07/2018 05:09:43
Link to Item http://hdl.handle.net/10150/318487

REGIONAL INEQUALITY AND ECONOMIC: DEVELOPMENT
IN BRAZIL
by
John J . Zombek
A Thesis Submitted to the Faculty of the
DEPARTMENT OF AGRICULTURAL ECONOMICS
In Partial Fulfillment of the Requirements For the Degree of
MASTER OF SCIENCE
In the Graduate College
THE UNIVERSITY OF ARIZONA
1966

STATEMENT BY AUTHOR
This thesis has been submitted in partial fulfillment of requirements for an advanced degree at The University of Arizona and is deposited in the University Library to be made available to borrowers under rules of the Library.
Brief quotations from this thesis are allowable without special permission, provided that accurate acknowledgment of source is made. Requests for permission for extended quotation from or reproduction of this manuscript in whole or in part may be granted by the head of the major department or the Dean of the Graduate College when in his judgment the proposed use of the material is in the interests of scholarship. In all other instances, however, permission must be obtained from the author.
SIGNED:
APPROVAL BY THESIS DIRECTOR
This thesis has been approved on the date shown below:
-I'W J. 5WLROBERT S. FIRCH / M t e
Associate Professor of Agricultural Economics

ACKNOWLEDGEMENTS
The writer wishes to express his sincere appreciation and
thanks to Dr. Robert S. Firch.for his guidance, direction, assistance,
helpful criticism and editorial comments during the preparation of
this thesis. In addition, it was his encouragement which became a
source of.incentive for the writer throughout his graduate study
program, ■
Sincere appreciation is also extended to the thesis committee
members, Drs. Jimmye S. Hillman, Roger Fox, and Thomas Curtis for
constructive comments and suggestions.
Grateful acknowledgment is expressed to Dr. Donald L.
Sternitzke for his assistance in the beginning phases of the project
and to Mrs. Jean Firch for her assistance in preparing the computer
program used in connection with the analysis portion of the thesis.

TABLE■OF CONTENTS
Page
LIST OF TABLES . . . . . . , . . , . . . . . . . . . ... . . , . vi
LIST OF'ILLUSTRATIONS. . . . . . . . . . . . . . . . . . . . . . . . . vii
LIST OF APPENDIX: TABLES. . . . . . . . . . . . , . . . . .. . viii
LIST OF APPENDIX ILLUSTRATIONS . .. . . . . . . . . . . . . . . . . . . . . ix
ABSTRACT x
Chapter
I . INTRODUCTION. . . . ... ... » . . . .... . « « . . » . . .1
S C Ope ... . . . . . . . is. » e . e • 9 e e- . • 6 e • I
Perspective of Regional Economic Inequality . . . . 4
II DEVELOPMENT THEORIES OF REGIONAL.ECONOMIC GROWTH. . . . 11
Location Theory . . . . . . . . . . . . . . . . . . 11
Sector and Development Stages Theories. . . . . . . . 13
The Export Base Theory.. . . . . . . . . . . . . . . 16
III THE BRAZILIAN EXAMPLE .. . . . : ' 20
Historical Evolution of the Brazilian Economy . . . 21
The Two Regions . . . . . . . .. . . . . . . . . . . . 24
The Contrasting Economies . . . . . . . . . . . . . 28Agriculture . . . . . . . . . . . . . . . . . . 28Industry. .......... 35Mining. . . . . . . . . . . . . . . 40
Summary . . . . . . . . . . . . . . . . . . . . . . . 42
. IV REGIONAL INCOME.ANALYSIS. . . . . . . . . . . . . . . . 44
Limitations to the Use of Per Capita Income Data. . 44

V
Chapter PageSources of Bata .. . . . . . . . . . . . . . . . . . 47
Statistical Analysis. , ........ . . . . . . . . . 49Technique Employed. .......... . 49Restatement of: Hypotheses . . . . . . . . . . . 53Approaches. . . . . . . . . . . . . . . . . . . . 54Results of Statistical Analysis--Model 1. . . . 55Results of Statistical Analysis--Model 2. . . . 60
Summary . . .......... .. . . . . . . ; 64
V INTERNAL MIGRATIONS . . . . . . . . . . . . . . . . . . 66
Brazilian Migration Patterns. .............. 66General Characteristics. . . . . . . . . . . . . 66Trend of Migrations . . .......... 69Types of Migrations . . . . . . . .i. . . . . . 69Reasons for Migrations. . . . . . . . . . . . . 72Internal Migrations and Income Inequality . . . 74
Outlook . . . . . . . . . . . . . . . . . . . . . . 77
VI SUMMARY. AND CONCLUSIONS . . . . . . . . . . . . . . . . 79
Comparison with Williamson's Results. . . . . . . . 79
Scope of Regional Inequality and Government Programs 80
LIST OF REFERENCES . . . . . . . . . . . , . . . . . 84
APPENDIX . . . . . . . . . . . . . . . . . , . . . . . . . . . . 88

LIST OF TABLES
Table Page1 Area and Population of Brazilian States and Regions. » . 26
2 Agricultural Mechanization . . . . . . . . . . . . . . . 30
3 Employment in Agriculture in Thousands . . . . . . . . . 34
4 Value of Industrial Production in Cr$l,000 . . . . . . . 35
5 Industrial Establishments by States and Regions forSelected Years.'. . . . . . . . . . ..................... 38
6 Real Index of Industrial Growth of the Central-East andNortheast (excluding Maranhab) 1955=100 . . . . . . . . 39
7 Results of Current Money Per Capita Income Analysis ofModel 1.................................. 55
8 Results of Deflated Per Capita Income Analysis ofModel 1 . . ............................. 57
9 Results of Deflated Total Regional Income Analysis ofModel 1 ................................ 60
10 Results of Regression Analysis of Model 2. . . . . . . . 62
11 Results of Internal Migrations in Brazil, 1940 and 1950. 68

LIST OF ILLUSTRATIONS
Figure Page1 Trend of Regional Iricome Diversity . . . . . . . . . . . 9
2 Brazi1--Geo-Economic Regions . . . . . . . . . . . . . . 25
3 Percent of Disposable Income from Agriculture by Regions,1950-1960 . . . . . . . . . . . . . . . . . . 32
4 Value of Regional Mineral Production .......... 41
5 Statistical Model 1................ . . . . . . . . . . . 51
6 Statistical Model 2. . 52
7 Values of Regression Coefficients for Current Money PerCapita Income Analysis, Model 1 . . . . . . . . . . . . 56
8 Values of Regression Coefficients for Deflated PerCapita Income Analysis, Model 1 .......... . . . . . 58
9 Values of Regression Coefficients for Deflated TotalRegional Income Analysis, Model 1 . . . . .......... 59
10 Values of Regression Coefficients for Income Analysis,Model 2 . . .............'. . . . . . . . . . . . . . 61
11 Relationship of Farm-Nonfarm Wage Differentials andMigrations. . 1............ 73
vii

LIST.' OF APPENDIX TABLES
Table Page1 Percent of Total Domestic Income from Agriculture, * ;
by States and Regions. . . . . . . . . . . ........... 89
2 Value of Regional Mineral Production in Cr$l,000 . . . . 90
3 Results of Current Dollar Per Capita Income Analysis ofModel 1 of the United States. . . . » . . .......... 91
4 Results of Current Dollar Per Capita Income Analysis ofModel 2 of the United States ............ 92
5 Brazilian Regional Income^ 1928-36, 1947-60♦ 93
6 Exchange of Population Between Brazilian States Based on1950 Census Data Shewing State of Birth and State of Residence . . . . . . . . . . ... * * ............ 94
7 Proportion of the Population 10 Years of Age and OverClassified as Able to Read and Write, by States, 1940and 1950, . . . . . . . . . . . . , . . . . . . . . . 99
viii

LIST OF APPENDIX ILLUSTRATIONS
Figure Page1 Growth in Regional Current Money and Deflated Per
Capita Income in Cruzeiros, 1947-1960 .......... 100
2 Growth in Regional Current Money and Deflated PerCapita Income in Contos de Reis, 1928-1936. . . . . . . 101
3 Regional Population in Thousands ........... 102
ix

ABSTRACT
Regional economic inequalities have been found to exist in
economies of all stages of development. The "North-South" problem, as
it has come to be referred to, has become a major social problem of
some emerging nations.
It was the principal objective of this research to determine
the degree of regional economic inequality in the two most populous
regions of the Brazilian nation. A general survey of the regional
economies of the Northeast and Central-East was followed by an investi
gation of the regional disparities problem. This was accomplished by' - . • i
examining the growth rates of the three economic sectors of agriculture,
industry, and mining.• : {
Income inequalities between the Northeast and the Central-East
were investigated by means of regression analysis, The hypotheses of
Chapter I were tested by means of statistical models.
This measurement of the - extent. of the ^North-Soulth1’ problem of
the Brazilian economy resulted in findings that seem to indicate, contrary
to popular opinion, that recent economic growth rates of the "stagnant**
Northeast region are in many cases greater than those of the "dynamic"
Central-East„ It was concluded that it is not the lagging rates of
expansion of the Northeast economy as much as the very large absoluteI
differences in current levels of economic development that is the major
problem in the regional inequalities issue.
x
CHAPTER I
INTRODUCTION
Scope
The persistence of regional economic inequalities within the
borders of a nation has not, until recently, been given much significance
in the literature of the field of economic development. The "North-
South** problem, as it is commonly referred to, has been found to occur
in economies at all stages of growth--the United States, Italy, Brazil,
India, though not to the same extent.
At first the regional disparity was believed to be a short
transitory st^ge in a growing economy before endogenous economic pres
sures would result in a trend toward equalization. Extreme economic
disparities, especially in income levels, could not long endure because
of price and wage flexibility and factor mobility within the country.
Its extensive global occurrence has recently resulted in some economists
concluding that it forms a necessary and unavoidable step in the indus
trial development of a nation. Regional economic differentials will be
intensified in the primary stages of development, but this tendency
will be diminished by the "spread" or centrifugal effects of the expan
sionary momentum from the growing to the lagging sectors of the1economy.
1. Myrdal, Gunnar, Economic Theory and Underdeveloped Regions, London: Duckworth & Co. Ltd., 1957, p. 31.

Regional economic diversity has persisted in Brazil in spite of
rapid national development and considerable federal government expendi
tures in the lagging areas. The subjective evaluations made in recent
literature have been varied and controversial in their interpretation
of trends and predictions of future diversity. To date there has not
been any intensive effort to analyze this problem in an objective
manner. Although many investigations have been conducted on the prob
lem in the United States, the author is aware of only one general
quantitative study that has been made on its occurrence in the less2developed nations and its role in national development.
This proposed research will attempt to add to the general body
of knowledge on regional inequality insofar as the problem applies to
Brazilian economic development. In particular, the main objectives of
this study will be:
1. A review of the literature in the field of regional economic
disparity with emphasis on causes and interpretation of the role of this
diversity in the economic development of a nation.
2. A comparison of the growing Central-East and the lagging
Northeast areas of the Brazilian economy by means of industrial, agri
cultural and mineral production figures, labor force productivity, and
the rates of change in each region.
2. Williamson, Jeffrey G., Regional Inequality and the Process of National Development: A Description of the Patterns, Economic Development and. International Economics Workshop Paper 6401. Social Systems Research Institute, University of Wisconsin, 1964.

3
3, An examination of this persistent economic inequality in light
of. the various theories advanced in the field of Regional Economicss and
an assessment of the role and effect of this unbalanced regional growth
on the national economy»
4. An investigation by means of regression analysis of per
capita income data of the two regions in question in order to attempt to
determine the extent and trend of this diversity.
The maldistribution of economic activity resulting in unequal
; regional income distribution has been emphasized by some authors as one
of the most pressing problems facing Brazil in its present stage of3 4economic development. Robock, on the other hand, considers the wide
variance of income within the Northeast area most important. Although
there are many other interesting facets in this area of inquiry, the
scarcity of usable data has limited this project to only those objectives
listed above.
3o 11 One of the most pressing problems Brazil faces is the inequality in her geographic income distribution. In 1960 the state of Sab Paulo, with 18 percent of the total population, earned 30 percent of the domestic income; the entire Northeast, with 25 percent of the population, earned only 11 percent. In the same year seven states in the Central-South accounted for 17 percent of the national area, 54 percent of the population, and 78 percent of the domestic income. ’1 Inter-American Development Bank, Fourth Annual Report 1964, Social Progress Trust Fund, Washington, D 0 G0, February 26, 1965, p. 175. See also Conselho de DesenvoIvimento do Nordeste (Codeno), A Policy for the Economic Development of the Northeast, Presidencia de Republica, 1959, p. 1, and Harry Stark, Infirmities of Per Capita National Income Estimates When Employed to Compare Levels of Living Between Developed and Retarded Areas, Coral Gables: University of Miami Press, 1961, preface.
4. Robock, Stefan C ., Brazil's Developing Northeast: A Study ofRegional Planning and Foreign Aid, The Brookings Institution, Washington, D. C., 1963, p. 15.

Perspective of Regional Economic Inequality
History has shown that the process of economic development has
occurred quite unevenly not only among nations but also among regions
within a nation. This, has been especially noticeable in countries
encompassing a relatively large geographic area--the United States, the
Soviet Union9 Germany9 and France, No general theory has yet been
devised that gives a satisfactory identification of the causes of unequal
national growth rates. The number of variables that would have to be
taken into consideration during a single time period would make this
unfeasible. The major simplification made in examining this phenomenon
is to inspect regional difference within one nation. Many of the restric
tions that prevail between nations "tariffs and quotas on goods, and
barriers to migrations of peoples--are thus nonexistent when.dealing5 ,with a single national area.
It can be safely, assumed that regional economic inequalities
exist during all stages of the economic"development of nations. Whatever
determinants for measurement.of potential growth are used, by their very
nature these factors will not be of uniform quantity or quality in all
areas--as, for instance, natural resource endowment, transportation
possibilities, market access for industries, external economies, char
acter of the leading industries, degree of technological development,
capital accumulation, investment.opportunities, levels of skills of the
5. Myrdal, in his Economic Theory and Underdeveloped Regions follows this pattern in investigating differences among nations.

labor force3 internal market size, pattern and character of national
economic growth, and share and shift of the individual regions.in this
growth. Taken together these factors have been referred to as the6"relative cumulative advantage*' of a region, i.e., an assessment of the
overall potential of an area to develop economically according to some
prescribed pattern.
Sociologically, some of the factors that probably affect economic
growth include the society8s system of values, religion, institutions,1 , ichanges in the composition of the population, and society’s ability to
adapt successfully to increasing rates of technological change.
Regional development differentials may further be increased by
certain national or international factors as changes in taste, income. 5
distribution, techriology, governmental policy, and organization. These
are the elements which initiate change in the economic activity of the
various subregions of a nation. Certain industries expand, stagnate,
and regress as a result not only of the. relative cumulative advantage of
the region of their location but also of the exogenous change -inducing
factors mentioned above.
Economic disparities between regions or nations are dynamic in
nature and tend to be either cumulative, and thus compounding to the
original differential, or regressive, thus reducing the original imbal-' v .' ■1 - 7 8
ance. The former have been called "backwash" or "polarization" effects.
6 . Perloff, Harvey S., How A Region Grows, Supplementary PaperNo. 17, Committee for ..Economic Development, New York, March 1963, p. 21.
7. Myrdal, p. 27.8 . Hirschman, Albert 0., The Strategy of. Economic Development. New
Haven: Yale University Press, 1960, p. 187.

The tendency has been for the play of market forces, selective migration,
capital movement, trade, and noneconomic factors to concentrate economic
activity around growth poles, or locational matrices. Such spatial con
centration of economic growth around initial starting points has appeared
in almost all nations, but is most prominent in those nations of large
geographic area and experiencing the primary stages of development--
Brazil, Colombia, Italy. Such centripetal forces may depress poor
regions in still, another way. High cost industries in the developing
area are granted protection by the federal government through the use of
tariffs, quotas, and embargos. The impoverished area thus becomes a cap
tive market for the "infant" industries of the developing area of the
nation. Some suggest that such growth poles are a necessity for growth
itself in the development process. Thus, economic growth will be neces
sarily unbalanced at least in a geographical sense.
On the other hand, we find forces acting to reverse this trend.
Labeled "spread"^ or "trickling down"effects, they have behaved in
such a way as to decrease the imbalance between regions. By far the
most important of these has been the absorption by the richer area of
some of the disguised unemployment that usually plagues a stagnant or
slowly growing area. This is not to be confused with the element of
selective migration mentioned earlier which acts in the opposite direc
tion. Although selective in nature, migrations will also include a large
9. Myrdal, p. 31.
10. Hirschman,. p. 183.

proportion with essentially none of the skills needed in the more
advanced area. These individuals tend to swell the ranks of some service
industries as domestic help and menial labor. However, by the very fact
of their migration, the marginal productivity of labor and capital con
sumption levels in the poorer region are elevated. Much of the "growth**
in such depressed areas can be-directly attributable to a stationary or
decreasing population.
An analysis of these two contrasting forces in nations during
the various stages of economic development will reveal a pattern of
increasing inequalities in the - emerging nations. The centripetal effects
will be maximized.in.an economy lacking adequate transportation and com
munication facilities, while at the same time the centrifugal forces will
be minimized. A developed economy is characterized by an improved trans
portation and communication system, higher levels of education, and a
more dynamic exchange of ideas. This contributes to the diffusion of
economic expansion throughout a country. Concomitantly, a low average
level of development will cause a weakening in these "spread" effects.
In general, it appears that the tendency toward regional inequalities is
much greater in underdeveloped then developed regions.
Per capita income data will be used to investigate the regional
economic imbalance. It is the contention of this writer that a quanti
tative study of regional income differentials might yield valuable
information on the relative degree of this general economic divergence
of the two areas. The long-run pattern of income diversity described
by Williamson (Footnote 2) tends to follow a course through national

/
8
economic growth of increasing divergence, then reaches a point of maximum
diversity just before commencing on a long-run trend of convergence
(Figure 1)*
The statistical analysis in this study is intended to test the
Brazilian experience for consistency with the pattern of regional dispar
ity that has just been outlined* .The following hypotheses will be tested:
1* During an early period the.Central-East region had a signifi
cantly higher rate of growth than the Northeast region which resulted in
increasing disparity of incomes *
2 *.In recent years the relationship has been reversed with the
Northeast region having a significantly higher fate of growth than the
. Central-East region which results in a ..convergence of income *
3, It is possible•to identify the turning point separating - the
'period of divergence from the period of convergence*
. The description and analysis which follows will be an attempt
to determine the existence of regional economic disparities in the
. Brazilian nation and to•analyze by means of regression analysis this
diversity in terms of per capita income* Chapter II presents the various
development theories;advanced to explain regional economic diversities *
Chapter III outlines in general terms the Brazilian economy in
reference to.the two regions in question* An investigation is made, into
the economic disparity of the agricultural, industrial, and mining sectors
of the regions*
Chapter IV is concerned with the analysis of regional income
data* This measure of economic development was used to determine the

IncreasingDiversity
Figure 1. Trend of Regional Income Diversity
Time
VO
growth rates;and trends of the regional economies and to test the hypo
theses of Chapter I. Chapter V provides:a short exposition of the role
of internal migrations in national income distribution.
The concluding:Chapter (VI) will attempt to summarize the find
ings of this investigation and analysis as it pertains to the present
trends of Brazilian regional diversity.

c
CHAPTER II
DEVELOPMENT THEORIES OF REGIONAL ECONOMIC GROWTH
In order to identify the causes of regional, or subnational,
growth a body of economic theory has originated in recent years which
has become known as Regional Economics. The need for such analysis was!
initiated by the occurrence of a slackening rate of growth in.developed
countries, and has been heightened by the existence of enduring regional
disparities in developing nations.
The body of thought known as regional economic theory currently
has many divisions and variations. Since this study will not be a
general critique on regional economics, the more prominent theories
which stress different growth aspects will be discussed, primarily for
comparison purposes.
- Location Theory
Since the publication of Von Thunen1s The Isolated State in 1826,
in which the author called attention to theoretical considerations of
the location of agriculture, location theory (also known as space economics)1 1 'has been expanded to include such diverse concepts, as the Weber-Losch
12location theory, Florence1s work on industrial agglomeration. Hoover?s
11. Losch, August, The Economics of Location, New Haven: YaleUniversity Press, 195.4, and Weber, Alfred, Theory of the Location of Industries, Chicago: University of Chicago Press, 1962.
12. Florence, Sargant P., Investment., Location, and Size of Plant, Cambridge, England: Cambridge University Press, 1948.
11

1213theory of location of industry9 the writings of Predohl3 Weigman9
14Palander3 and Lefeber and presently the works of Walter Isard on
Regional Science, Although the seeds of a general theory were present16in Von Thunen s writing) it is Alfred Weber who has been credited with
the construction of a general location theory. In his Theory of Loca
tion of Industries, he attempted to develop a general basis upon which
an economy orients itself by investigating the operative forces of an :
isolated economic system in a heretofore undeveloped country. By far9
the greater portion of thought and investigation in the field of regional
economics has been in this area of location theory.
Most of the early contributions to location theory came from the
German School. The Classical School with its base in England was not
impressed by the existing subnational economic differences. Great
Britain's dominant international stature and vigorous industrial develop-17ment at the time further served as a hindrance to the economists vision.
13, Hoover3 Edgar M. * The Location of Economic Activity, New York; McGraw-Hill) 1948.
14. Lefeber3 Louis3 Allocation in Space, Production, Transport, and Industrial Location, Amsterdam; North Holland Publishing Company3 1958.
15o Isard) Walter< Location and Space Economy, New York: TheTechnology Press of the Massachusetts Institute of- Technology and John Wiley & Sons3 Inc;3 1956. Other - Methods of Regional Analysis: An Introduction to Regional Science, New York: The Technology Press of the Massachusetts Institute of Technology and John Wiley 6 c Sons9 Inc., 1960.
16. Von ThM§&?;r^X'Hv, Per Isolierte Staat in Beziehung, aufLandwirtschaft and Nationalokonomie„ Hamburg, 1826.
17. Isard, Walter,,Location and Space Economy, p. 25.

13
As presently formulated, this theory suggests that growth in a
given area's volume of economic activities is a function of two factors:
(1 ) its access to the factors of production at competitive costs, and (2 )
its access to product markets at competitive costs. Production activity
can be classified as market oriented, material oriented, and "footloose11.
Market orientation will tend to be the outstanding factor in the deter
mination of the location of light industries producing for consumer
markets. Material oriented industries as mining, farming, forestry,
and fishing will tend to have their geographic location determined by
factor markets. Those industries oriented to intermediate sites are
referred to as "footloose" industries. Neither or both the product and
factor markets will affect the industrial location. The best example of.
this type of productive activity is the electronics industry.
In general, it can be said that the theory of location and space
economy is focused upon all economic activity, but examines this phenome
non in the light of geographic aspects of distribution of factor and
product markets and variations of costs and prices.
Sector and Development Stages Theories
18From empirical analysis comes the sector theory of Golin Clark 19and Allan G. B„ Fisher. A rise in national or regional per capita
18. Clark, Colin, The Conditions of Economic Progress", London: Macmillan, 1940. \ •
19. Fisher, Allan G. Bo, "Production, Primary, Secondary, andTertiary," Economic Record, Vol. 15 (June 1939), pp. 24-38.

14
incomes is usually associated with a decline in the proportion of the
labor force in the agricultural sector and a rise in the proportion of
employment in secondary activities at first5 followed by an increase in
tertiary or service industries» This outcome follows from rising incomes
and different income elasticities of demand for the products:of the three
• sectors„ Regional income differentials arise because the resource bases
of different areas within a nation and the play of comparative advantage
dictate different mixes of the three sectors in geographic areas of a
nation.
Internal5 rather than external, development is the focal point
of this theory. The specialization and division of labor is seen as the
stimulus in economic growth. Sector shifts are seen by the proponents
of this theory as providing the main force of economic advance both in ,
terms of growth in the volume of economic activities and in terms of
improvements in per capita incomes.
United with location theory proposals, the sector theory has come
to be referred to as the theory of development stages, i.e., a theory
alluding to the "'normal'' sequence of stages through which nations , or
regions experience economic growth. Essentially, the stages viewed by20 21 Perloff were those traditional stages used by Hoover and.other
20. Perloff, Harvey S., Edgar Dunn, Jr., Eric Lampard, and Richard F . Muth, Regions, Resources, and Economic Growth, Baltimore:The John Hopkins Press, 1960„
21, Hoover, Edgar M., The Location of Economic Activity, New York: McGraw-Hill, 1963.
15
developmental theorists employing the stages approach. It is proposed
that economic development in most regions is characterized by the follow
ing sequence: (1) the subsistence agriculture phase9 (2) the development
of transportation and establishment of trade which results in growth of
production of primary products, (3) the inception of secondary industries
such as manufacturing which follow from diminishing returns to primary
activities and increased population pressures, (4) the establishment of
a more diversified industrialization and a shift away from processing
primary goods, and (5) the specialization in tertiary industries (export
of capital, specialized personnel, and services to less developed regions)
as a sign of an advanced stage of economic development.
This theory implies that the conduct and actions of private
groups and government, can influence to a large extent the rate at which
a regional economy evolves from one stage to another. For example, a
government can institute a building program of certain social overhead
facilities in order to attract outside capital. If successful, such a
policy would strengthen the evolutionary forces of an economy toward a
more advanced stage of growth.
Implicit in this theory is a constantly rising level of education
and technical training. In addition, the strategic element--income
elasticity of demand--presupposes an economy where per capita income is
rising. The relevant question for underdeveloped regions caught in
the vicious circle of overpopulation and underproductivity is how to

1622achieve this initial rise in per capita income.
The Export Base Theory
In attempting to explain regional disparity, Douglas C . North has
:concentrated on the role and character of the regional export indus*23trieso His export base theory emphasizes the fact that growth in a
given area is.initiated by the response of the industries within the
■ area to an increase in demand arising-: outside the region, itself» The
distinction here is between export industries producing commodities
especially for sale outside the region and domestic goods.industries
producing for the internal market. The exportable commodities and services24play the key role in the•economic growth of,a region. The relevance
of this theory in explaining the economic progress.of a region seems to
depend upon the size of the region in question-“the larger the area, the
smaller is the effect of the exports and the greater is the oversimpli
fication, in designating exports.as the growth-inducing variable. The rate
22. Thomas, Morgan D., 6-The Export Base and Development Stages Theories of Regional Economic Growth: An Appraisal,M Land Economics, November, 1964, pp. 421-432.
23. -North, Douglas C., ’•Location Theory and Regional ■ Economic Growth/ 1 Journal of Political Economy, Vol. LXXXI, No. 3, June, 1955, pp. 243-258.
24. In contrast to the underdeveloped countries, there is no clear dividing line between the two sorts;of industries in the more advanced countries. There, is no export sector per se. The same goods are both exported and consumed in large amounts within the country. Any specialize^ tion that occurs for the export market is in terms of specific products rather than different sectors of -.production. Economic Commission for Latin America, ’The Growth and Decline of Input Substitution in Brazil,” Economic Bulletin for Latin America, Vol. IX, No. 1, March 1964, p. 2.

17
at which it grows depends on the rate at which.the:export base expands
in line with the increase in the demand for the region's exportable goods0
The role of the export product is to generate an ihcome flow directly to
the export industry in the exporting region.
It is believed that the nature of the export industry will pre
determine the potency of the export base stimulus to growth3 because it
determines the disposition of the income flow when the export earnings
are expended in the producing region. Thus, in a labor-intensive indus
try, the income stream generated by the export industries will have a
multiplier effect similar to the investment multiplier. On the other
hand, a capital-intensive industry,coupled with a high propensity to save
on the part of those receiving the income, would yield a smaller multiplier
and thereby reduce the potential of the-domestic.goods industries to expand.
In addition9 the rate of economic expansion will also depend on
the character of the ^backward1' and "forward-linked11 industries which the
leading sector.(export sector) is capable of attracting to the region•
The former are industries which supply the inputs for the major
economic activity, when the major industry is of a nonprimary type. If,
on the other hand, major economic activity is not one that caters exclu
sively to final demand, then its output will be utilized as inputs in
new activities called, "forwardslinked" industries. Thus, once the leading
industry of the•export sector is established, the growth of such."satellite"
industries will influence to a very great extent the general economic25progress of the region. If the sources of factors and markets for
25. Perloff, Regions, Resources, and Economic Growth, p. 94, and Hirschman, pp. 100-102

18products are wholly,external, ceteris paribus, the industry's effect on
the total growth of a region will not be as great as one which has its
sources of factors and/or product markets within the region* An indus
try with exogenous input and output ties--as textile industries of some
nations--will have a minimum of close "linkages" with other industries
of the region. Expansion of such an industry will have smaller growth
effects than a similar expansion of a domestic goods industry. On the
other hand, any expansion in an industry^ such as steel, whose input and
output ties are wholly within the region, would have a multiple effect
on the total growth of its region.
. Export industries of most underdeveloped regions consist of
unfinished primary products which are subject to the vicissitudes of the
(external markets, Concomitantly, a region specialized in only one or a
few export products will probably be more susceptible to exogenous
changes in economic activity than one with a broad export base. If exter
nal demand changes in a negative direction, the region can suffer economic
reverses and, if demand has a continuous downward trend, a. continuous26economic decline would result.
• _ t)Implied very strongly in this theory is the dual idea of natural
resource endowment and comparative advantage. Resources provide the base
from which exogenous demands for certain products and services,can be
satisfied. Other determinants of growth are: the level of technology,
internal factors, institutions, population, and the situation of the
26. Hartley, Delmar, "A Subregional Application of Regional Economic Growth Theory," unpublished dissertation, University of Nebraska, 1963, p. 5.

regional economy relative to markets„
According to most critics3 the most prominent shortcoming of the27export base theory is its oversimplification. It implies that only
exogenous stimuli can.alter regional economic development, In addition,
the complicated multiplier effects within a region are acknowledged but
are not sufficiently encompassed in the explanation for growth advanced
through this theory. Another much discussed limitation has been North's
assumption of an export industry in a region.at the very beginning of
development. The export.industry is the base upon which the residentiary
industries depend and are established. This latter phenomenon has been
confirmed, however, by examples from economic history. However, exports
may not be the dominant or sole generator of growth in some regions.
Economic growth can continue despite a net decline in the size
of the export sector. An exogenous injection of investment can occur
to completely nullify the harmful effects of a contraction of exports.
Also, the residentiary or domestic goods industries, whose input-output
orientation is strictly within the borders of the region in question, can
grow in sufficient volume to compensate for the decline in the export
industries. Lastly, an improvement in the region^ terms of trade can
be a compensatory force in balancing out a decrease in exports.
27. Tiebout, Charles, ^Exports and Regional Economic Growth,81 Journal of Political Economy, April 1956, p. 161. See also. Hartley, p. 54.

CHAPTER III
THE BRAZILIAN EXAMPLE
Brazil has been called the land of contrasts in the literature
of the past several decades. Although this has been mainly in reference
to her geology, geography, social.heritage, ethnic makeup, and racial
composition, it has also been very apparent in the economic sphere.
Regional differentials in industrial and agricultural development and
productivity, and per capita income have become so large that world
attention has focused upon the nation. Brazil has become a prime28example of a country experiencing North-South dualism.
Physiographically, the nation ranks fifth among the nations of
the world in size with 3,287,195 square miles. The estimated 1964 popu-29lation was nearly 80 million. This amounts to roughly 50% of the
total population of all South.America. The national population as a
whole was 64% rural, 25% urban, and 11% suburban in 1960. The trend
has been toward urbanization; between 1940 and 1950 the rural popula-i
tion increased by only 17%, whereas the urban-suburban population 30
increased 46%.
28. Williamson, pp. 10 and 23.
29. Obtained by projecting the 1960 census results with an average annual rate of national increase of 2.6%.
30. Patriota, Antonio, ’'The Economic Development of Brazil," The Hispanic American Report, Special Issue, Palo Alto: Stanford UniversityPress, 1961, p.'^Sv ' ;’•
'' X ': : 20 '

21
Historical Evolution of the Brazilian Economy
The regional approach to investigating the problems of Brazil is
natural, especially because,of the country's immense size. Strong
regional interests have always existed. Brazil has long considered
itself an assemblage of regions from an economic, social, political, and
geographical point of view. One of the stronger evidences of this in an
historical sense is that at first Brazil was a group of separate colonies
called capitanias or donatarias, each of which was almost a distinct
state subordinate to Lisbon only. For over a century the capitanias
functioned as separate political entities with their own regional economy
and way of life. The first two centuries of colonial rule was marked by
the nearly complete lack of communication among the various regions of
Brazil, The direction of the prevailing winds made it easier to sail to
Europe than from north to south along the coast of Brazil. Travel by
land was nearly impossible. Until the widespread use of the airplane,
the only means of transportation between coastal cities was by boat.
Railway systems were, and in many ways still are, mere links between,
large coastal cities and the immediate hinterland. A minimal inter
regional system of highways and roads was finally developed during the
construction of the new .capital of Brasilia in the late 19501s. At the
present time, the national system of transportation and communication
is still far from satisfactory.
During the colonial period, intercolonial trade was prohibited.
It was not until 1815 that the Brazilian ports were opened to ships of
any and all flags. This occurred when.Joab IV, King of Portugal, and

22
his entourage arrived in Brazil to escape Napoleon's -subjugation of the
Iberian peoples. The colonial period is largely associated with sugar
production on a slave labor base and the plantation system in the Norths
and a subsistence type of agriculture in the South. The Golden Age of
the Northeast blossomed.forth, matured, and perished in the three-century
period extending from 1500 to the end of the 18th century. After the
discovery of gold and diamonds, the Central-East became the leading area
and it has.retained this lead ever since.
In the time of the Empire (1822-1889), and later in the Republican
period (1889-present), coffee and cotton became the leading export commod
ities. The center for production of both crops has been, until recently,
the state of Sab Paulo.
In historical perspective, the extreme instability of world com
modity demands and prices have, in general, shaped the- national economy
of Brazil from the very beginning. The Ministry of Foreign Affairs lists
the major crop phases of the Brazilian economic evolution in the following
sequence:
1. Brasilwood^-1500-1550
2. Sugar Cane— 1600-1800
3-. Gold--1690-1770
4. Diamonds--1729“1800
5. Coffee--1830-1940
6. Rubber— 1860-1910317 i Industry--1914-present
31. Ministry of Foreign Affairs, Brazil 1943: Resources and Possibilities , Rio de Janeiro, Itamaraty, 1944, pp. 13-19.

23Certain regions of the country with the necessary resource advan
tage became the suppliers of various commodities during times of emergency
when prices were high and responded with quantity rather than quality.
It was the more efficient sugar production of the Dutch West Indies and
other Caribbean Islands that dealt the fatal blow to the plantations of
the Northeast. This occurred soon after the expulsion of the Dutch from32the capitania of Pernambuco in . 1654. The Amazon basin was the chief
supplier of raw rubber in the world until the plantations of the East
Indies came into production around the turn of the century. Although
the plant was indigenous to the Amazon basin, the method of collecting33from the widely spaced trees in their natural habitat by seringueiros
proved to be very inefficient and costly. As the latest example, the
share of the world market for Brazilian coffee has diminished mainly
because of its inferior quality. The demand for milder varieties is
tending to increase the total market share for the Central American
nations and Golombia— at the expense of Brazil. On the other hand, the
newly emerging nations of West Africa have been able to undersell Brazilian
producers in markets for cheaper grades of coffee.
It must not, however, be thought that the failure of Brazil to
retain her export position in these commodities was entirely the fault
of the federal government and/or the individual producers * For some-
gold, diamonds-"-it was due to the exhaustion of the resources. In the
case of others— cotton, tobacco, and sugar--the-colonial policies of the
32. Boxer, G..R., The Dutch in Brazil, Oxford: Clarendon Press, 1957, p. 241.
33. The rubber collectors of the Amazon basin. -
24European nations were critical at certain times» Some markets, for. sugar
34cane were closed due to protection of the national sugar beet industry.
These factors,when combined with the lagging level of techniques of
Brazilian producers, have resulted in total or partial market exclusion
for Brazil in some agricultural products. Most recently, the prejudicial
attitude of the Common Market nations toward the importation of tropical
commodities can be cited. Preferential treatment by lower tariffs is
afforded the African nations which were former colonial areas or were in
.any way associated with the EEC nations before their newly won independ
ence . This, for all intents and purposes, excludes most of the tropical
products of the Latin American nations from one of the largest consumer
markets:of the world.
The Two Regions
The two geo-economic regions selected for comparison purposes.in
this study are illustrated in Figure 2. Collectively, both areas account
for only 30% of the total land area, but contain 74% of the national popu
lation (Table 1). The greater portion of these inhabit a narrow coastal
strip 100 miles in width from.Fortaleza, Geara in the North to Sab Paulo
in the Southo
34. Kuznets, Simon, Wilbert Moore, and Joseph Spengler, Eds., Economic Growth: Brazil, India, Japan, Durham, M*C.: Duke UniversityPress, 1955, pp. 33-34.

25
Northeast
Central-East
Figure 2. Brazil--Geo-Economic Regions

26Table 1.. Area and Population of Brazilian States and Regions
State or Region 2Km
% of Total
1964 Pop. in 1000's
% of Total
Maranhao 328,663 3.86 2,965 3.71Piau^ 253,548 2.98 1,351 1.69Cear^ 148,016 1.74 3,611 4.52Rio Grande do Norte 53,015 .62 1,234 1.54Paraiba 56,372 . 66 2,145 2.69Pernambuco 98,281 1.16 4,453 5.58Alagoas 27,731 .33 1,343 1.68Sergipe 21,994 .26 809 1.01Bahia 561,026 6.59 6,487 8.12
Northeast Total 1,548,646 18.20 24,398 30.54
Minas Gerais 593,401 6.97 10,705 13.41Espiritu Santo 39,368 .46 1,343 1.68Rio de Janeiro 42,912 .50 3,952 4.95Guanabara 1,356 .02 3,740 4.68Sao Paulo 247,898 2.91 14,824 18.57
Central-East Total 924,935 10.86 34,564 43.29
Total Both Regions 2,473,581 29.06 58,962 73.83
Source: Institute Brasileiro de Geografia e Estatistica, Anu^rioEstatistico do Brasil - 1963, Conselho Nacional de Estatistica, Rio de Janeiro, 1963, pp. 12, 27.
The Ministries of Aeronautics, War, Navy, Agriculture, Mines,
Health, and other various governmental departments each have a different
classification of the regions of Brazil. The classification used in
this study is that employed by the National Bank for Economic Development 35(BNDE). It was selected because special attention was given to defin
ing regions which are as homogeneous as possible in terms of history.
35. BNDE Departamento Economico, Classifica^ao da Regioes Geo- Economicas , mimeo., Rio de Janeiro, May 1964, p. 15.

27
geography5 economy, culture, and politics, and which comprise an integral
unit. The only major restriction was that states were included wholly
within regional boundaries.
The Northeast region is comprised of the states of Maranhab,
Paiui, Ceardf, Rio Grande do Norte, Paraiba, Pernambuco, Alagoas, Sergipe,
and Bahia. The Central-East (classified as Southeast by the BNDE) encom
passes the states of Minas Gerais, Espiritu Santo, Rio de Janeiro,
Guanabara (Old Federal District), and Sao Paulo.
The role which the Northeast has played in national development
in Brazil resembles that of the New England region in the national life.36of the United States. The analogy, however, is valid only insofar as
both were the early centers of development and culture from which the
nation received.its first growth impetus. Through the years, the regions
have become seats of tradition-based society in both cultures. From
being originally the quintessence of the nation in nearly all respects,
both regions have declined in significance. The Brazilian Northeast has
been overshadowed in great measure by the phenomenal development of the
Central^East region and by its own languishing economy.
Salvador and Recife were the centers of the plantation system
which existed from the late 15005 s to 1800. The entire history of the
region is intimately connected with the sugar culture, slavery, pastoral
settlement.of inland areas, and more recently--cacao. The decline of
the sugar cycle ushered in general economic stagnation which, with minor
exceptions, has lasted to the present.
36. James, Preston E., Latin America, New York: Odyssey Press,1959, p. 409.

28The Central-East was at first a region of secondary value and
was condemned to a subsistence type economy. It has now become the
agricultural, industrial, and cultural heartland of Brazil. The turning
point in the development of the Central-East region came with the dis*-
covery of gold and diamonds in the state of Minas Gerais.in the 1700's.
The growth was furthered by the spread of the coffee culture in Sao Paulo
in the 19th century, and later by the industrial phase following World
War I.
The Contrasting Economies
Agriculture
The major economic activity in the Northeast is agriculture,
accounting for about two-thirds of the total regional employment and37almost one-half of the total regional income. Cultivated field crops,
livestock, and livestock products account for over 90% of the farm income.
Extractive agriculture, such as the collection of cashew nuts, baba^u
and.oiticica oil, coroa fibre, and carnauba wax from noncultivated areas,
generates the remaining portion. The most.important crops are cotton,
sugar, manioc, beans, and cacao, and account for over 68% of the total
value of agricultural production. Cacao and cacao products were the top
exports from the region. Although cotton accounted for over three times
as much income generated, its share in exports is small. The major
37. In 1960, income from agriculture accounted for 45.9% of the total income in the Northeast, as compared to 23.2% in the Central-East. Gonselho Nacional de Economia, Exposigao Geral da Situaqao Econdmica do Brasil 1962, Rio de Janeiro, 1963, pp. 276 and 278.
portion of cotton exports of Brazil come from the South.
Although it is known primarily as the.industrial nucleus of
Brazil, the Central-East region has primarily an agricultural base. Due
mainly to its coffee production, this area has led the rest of Brazil in
total value of agricultural production. Other crops in order of import
ance are: cotton, corn, rice, citrus fruits, sugar cane, beans, and
manioc. Historically, the growing of food crops has been second in
importance to the cultivation of export cash crops.
Such strong reliance on agriculture by both regions does not
necessarily connote any type .of balance between the regions in this
economic activity. The cultural and economic heritage of these regions
has led them along divergent paths of development. Associated with the
system of sugar plantations for centuries, the Northeast has not extri
cated itself as yet from the bonds of the less productive type of exten
sive agriculture. The Central-East, on the other hand, has had no such
strong cultural drawbacks. In no other phase is this imbalance in agri
cultural techniques illustrated better than in the field of mechanization.
Although both regions specialize in crops which do not lend themselves
readily to mechanization--coffee,.cacao, sugar cane--the farms of the
Central-East possess an overwhelming portion of tractors and plows.
This is shown in Table 2. Whereas both regions gained rapidly in the
absolute number of tractors between the years 1940 and 1960, their
portion of the Brazilian total declined because of the phenomenal agri
cultural development in the Southern states of Rio Grande do Sul,
Santa Catarina, and Paran^. The increase in the number of plows.

Table 2. Agricultural Mechanization.
State or Number of 7o of Number of Plows % ofRegion Tractors Total in Hundreds Total
1940 1950 1960 1940 1950 1960 1940 1950 1960 1940 1950 1960
Maranhab 7 16 41 .7 .8 1.2Piaui 4 20 59 1.3 5.0 14.0Ceara 37 32 316 7.3 8.2 13.1Rio G. do N. 10 17 246 5.7 4.1 3.1Paraiba 13 62 361 5.0 5.3 6.1Pernambuco 72 142 999 32.1 39.0 58.6Alagoas 34 35 296 10.1 26.8 56.1Sergipe 31 45 96 5.7 8.1 6.7Bahia 43 82 575 16.5 46.5 52.9
Northeast Total 251 451 2989 7.4 5.4 4.7 84.4 144.8 211.8 1.7 1.9 2.1
Minas Gerais 253 763 5024 495.7 739.7 930.4Espiritu Santo 24 58 490 7.1 16.7 24.6Rio de Janeiro 140 457 1469 82.5 120.2 123.1Guanabara 8 58 123 2.5 2.6 1.7Sab Paulo 1410 3819 28101 1680.7 2249.5 2865.8
Gen.-East Total 1835 5155 35207 54.3 61.6 55.5 2268.5 3128.7 3945.6 45.2 43.8 38.2
Brazil 3380 8372 63493 100.0 100.0 100.0 5008.5 7142.6 10319.3 100.0 100.0 100.0
Source: Institute Brasileiro de Geografia e Estatistica, Anudxio Estatistico do Brasil - 1963,Conselho Nacional de Estatistica, Rio de Janeiro, 1963, p. 58.
u>o

31however, gives a somewhat different picture. The rate of increase for
the Central^East was about one-half that for the Northeast. In addition,
where the Northeast8s share of the total remained essentially the same,
the share of the Central-East declined. The reason again was the tremen
dous rate of increase in the Southern states.
Recently, the agricultural sector of the two regions has undergone
a major change.in economic fortunes. The Northeast, tied largely to
price and production trends in this major sphere of economic activity,
has gained in agricultural production. During the. coffee boom from 1950
to 1955, the agricultural sector of the Northeast lagged behind that.of
the Central-East. Since that time, however, the rapidly expanding crops—
beans, cotton, bananas, sugar cane, tobacco, sisal, cacao, and corn—
have been the important crops of the Northeast. The lagging crops for
Brazil are coffee, rice, manioc, and wheat. Only manioc has any import-* '
ance in the Northeast region. However, all of these crops have been
intimately associated with the Central-East. Consequently, since 1955,
farm income pf the Northeast has increased threefold, whereas, for the.
nation as a whole it has only doubled. Except for the drought year.of
1958, the farm sector of this region has been expanding at a more rapid
rate than the rest of the nation. Figure 3 and Table 1 of the Appendix
show the changes that have taken place in the state and regional shares
:of domestic income from the agricultural sector. The tendency has been
one-of convergence, especially within the last five-year period.
The, effects of such.improvement in the leading sector of the
regional economy has not been recognized for two major reasons. Since

Cent]al-East% of D. I.
50
Northeast
1958 195919571960
196019561954 19551953195219511950Figure 3. Percent of Disposable Income from Agriculture by Regions, 1950-1960.1950Agriculture by RegionsfromDisposableof IncomePercent
Source: Conselho N^cional de Economia, Exposicao Geral da Situacao Econdmica do Brasil, Rio de Janeiro, 1963, pp. 263-266.

33the agricultural industry is dispersed geographically much more than the
manufacturing industry, the•effects:of improvements will be less apparent.
In addition, such improvements always call forth comparisons on a regional
basis rather than on the absolute progress of a region.
Economic growth in general, and industrial growth in particular,
is associated with.a decline in the proportion of persons employed in
agriculture. Movement away from this low income sector is usually asso
ciated with economic development. Table 3 shows the favorable effects
.of the rapid growth of industrialization in the Central-East. That of
the Northeast has not been as favorable. Employment in agriculture
decreased, for the former region, from.,41^4% of the total for all Brazil
in 1920 to 27.6% in 1960. In the same span of years, the Northeast*s
participation increased from 39.48% to 42.9% of the total. Even when
considering only the total population of the two regions, we find that
the Central-East had 42% of its population engaged in agricultural pur-38suits in 1960 in comparison to 65.6% for the Northeast. The rate.of
growth.of this portion of the regional population is also quite interest
ing. While both regions had essentially the same increase in total popu-39
lation between the years 1920 and 1960, agricultural employment
increased 164% in the Central-East but, for the Northeast, the increase
was 267%. The increase for Brazil in general was 246%.
38. Conselho Nacional de Economia, Exposigao Gera1 da Situagao Econdmica do Brasil 1962, Rio de Janeiro, 1963, pp. 276 and 278.
39. 201% for the Central-East arid 199% for the Northeast.

Table 3. Employment in Agriculture in Thousands
State or Region 1920 1940 1950 1960
Abs.No. % of Tot. Abs.No. % of Total Abs.No. % of Tot. Abs. No. 7o of Total
Maranhao 208 313 363 929Piaui 124 209 247 355Cear^ 281 515 597 817Rio Grande do Norte 113 212 209 296Paraiba 216 403 404 545Pernambuco 474 695 738 1258Alagoas 220 250 260 364Sergipe 104 134 140 243Bahia 752 1053 1068 1858
Northeast Total 2492 39.48 3784 40.03 4026 40.72 6666 42.9
Minas Gerais 1247 1652 1618 2076Espiritu Santo 133 204 202 269Rio de Janeiro 339 342 298 241Guanabara 29 19 18 19Sao Paulo 865 1529 1449 1683
Central-East Total 2613 41.40 3746 39.62 3585 36.26 4289 27.6
Brazil 6312 100.00 9454 100.00 9887 100.00 15522 100.0
Source: Joint Brazil-United States Economic Development Commission, The Development ofBrazil, Institute of Inter-American Affairs, Foreign Operations Administration, Washington, D. C.,1953, p. 310.
u>
35
The tremendous out-migration to the South and Central-East during
the recent history of the nation has proved to be advantageous for the
Northeast. The developing areas of the eastern states, and the regions
to the south, have siphoned off some of the excess population. Thus,
while the Northeast region has a higher birth rate in common with other
less developed regions, total population has increased at a somewhat
slower pace than in the Central-East.
Industry
The Northeastern industrial sector is small when compared to
that of the Central-East, but it is not insignificant. The amount of
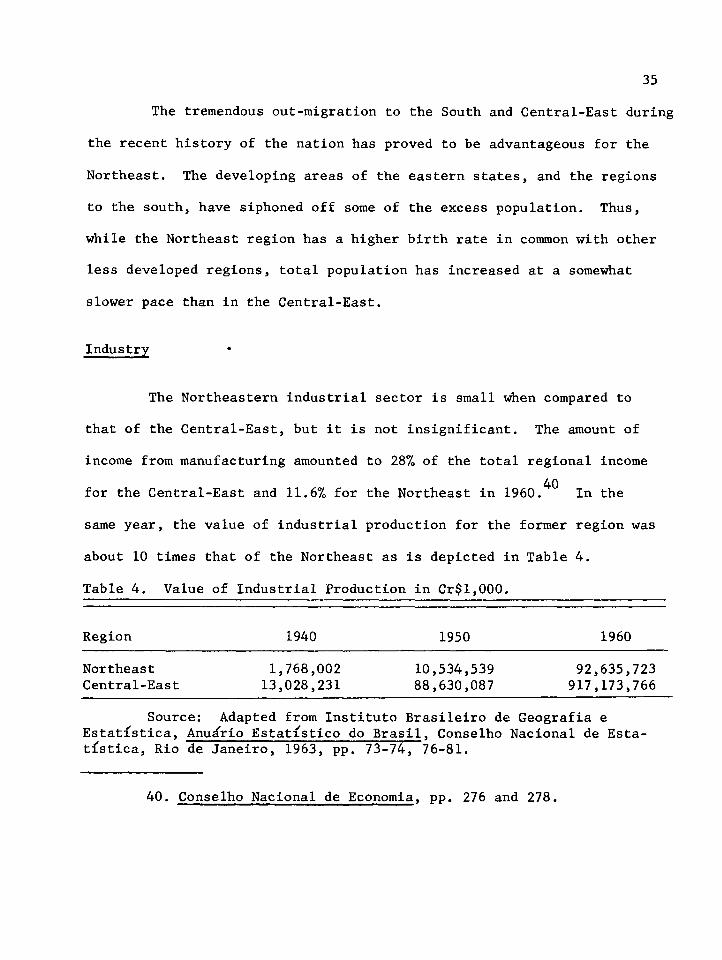
income from manufacturing amounted to 28% of the total regional income40for the Central-East and 11.6% for the Northeast in 1960. In the
same year, the value of industrial production for the former region was
about 10 times that of the Northeast as is depicted in Table 4.
Table 4. Value of Industrial Production in Cr$l,000.
Region 1940 1950 1960
NortheastCentral-East
1,768,00213,028,231
10,534,53988,630,087
92,635,723917,173,766
Source: Adapted from Institute Brasileiro de Geografia eEstatistica, Anudrio Estatistico do Brasil, Conselho Nacional de Esta- tfstica, Rio de Janeiro, 1963, pp. 73-74, 76-81.
40. Conselho Nacional de Economia, pp. 276 and 278.

36If a comparison.is made with the developing nations of the world9
the industrial establishment of the Northeast appears to be quite exten
sive. It compares very favorably with that of the Philippines which41ranks near the top in rate of industrialization for emerging nations.
Nevertheless5 in terms of regional income9 industry accounted for only
one-fourth as much as the agricultural sector.
In the 19th century9 the Northeast was the principal manufactur
ing region of Brazil with six of Brazil's nine cotton mills in 1866.
With the transfer.of the national capital from Bahia to Rio de Janeiro
and the upsurge of the coffee culture in Sab Paulo 9 the Northeast lost
its pre-eminence in manufacturing to the Central-East. Industrialization
was further hampered by the slavery-dominated plantation agriculture which
lasted until 1888. The traits of individuals in a tradition-based soci
ety as that of the Northeast seem to be highly inflexible to change.
The widespread adherence to personalismo (here meaning specifically the
personal relationship between employer and employee) has adversely
affected the establishment and acceptance of large industrial firms by
the Northeastern population. Impersonal associations tend to be avoided
at all costs.
41. "The Philippines had a population of about 26 million in 1960 as compared to 22 million for Northeast Brasil. The Philippines rank near the top in rate of industrialization for underdeveloped countries and is considered to have a substantial industrial sector. In 19589 the Philippines had 2289000 workers in manufacturing establishments as compared to 1639000 for Northeast Brazil. Thus Northeast Brazil with a population.equal to 84 percent of that of the Philippines had factory employment equal to 72 percent of that of the PhilippinesStefan.H. Robock9 Brazil's Developing Northeast: A Study of Regional Planning andForeign-Aid9 The Brookings Institution9 Washington9 D, C.9 19639 pp. 50-51.

37
The profit motive3 which is a strong psychological individual
trait in most of the Western nations 3 does not seem to hold the same
attraction for those individuals who are products of a plantation system
and who possess different values, beliefs, and goals.
Many -of the forces limiting.industrialization are still in evi- .
dence. As a result, the- Northeast region has only small pockets of
.industries scattered along the populous littoral area. This.is in con
trast to the district of Sab Paulo and Rio de Janeiro which is acclaimed
to be the largest and most diversified complex of the Southern Hemisphere
and one of the largest in the world. Table 5 gives data for selected
years on the number of business establishments and employees. The
Central-East outstripped.the Northeast in the rate of growth of.employ
ment in the period shown, due primarily to the advent of large steel and
automobile manufacturing industries, although the Northeast had a higher
rate of growth in the number of establishments. Small food processing,
textile, and chemical plants account for the major portion of factory
employment of the industrial sector of the Northeast.
The rates.of growth of the industrial sectors of the regions
have been.extremely uniform. Increases in.the industrial production of
both regions for the decade 1950-1959 have been quite similar, as is
shown in Table 6. The greatest diversity is to be found in the value
of industrial production. For the year 1949, the figure for the Central-
East was eight times that of the Northeast (Cr$81,619,860,000 compared
to Cr$10,060,915,000). In 1959, however, this ratio was almost ten to one42(Cr$917,173,766,000 to Cr$92,635,723,000).
42. XBGE - Gonselho Nacional de Estatistica, Anuario Estatistico do Brasil 1963, Rio de Janeiro, pp. 76-81. c '

Table 5. Industrial Establishments by States and Regions for Selected Years.
State or Region Number of Establishments Number of Employees
1920 1940 1950 1960 1920 1940 1950 1960
Maranhao 90 703 1054 2430 3575 6425 8757 13828Piaui 56 164 439 1187 1175 1590 1913 4332Gear/ 295 789 2831 2223 4717 7859 17352 20069Rio Grande do Norte 197 593 1249 1158 2146 4879 12034 12944Paraiba 253 737 1891 1146 3295 13210 26215 17108Pernambuco 496 1877 3844 3559 22248 57327 76483 72035Alagoas 367 687 1261 1566 7930 12563 22143 19641Sergipe 307 743 1377 1882 7708 11438 14532 14268Bahia 511 1766 4270 5929 16698 23361 35719 50050
Northeast Total 2572 8059 18216 21070 69492 138652 215148 224275
Minas Gerais 1248 6224 11950 12259 18848 74267 111513 139835Espiritu Santo 77 984 1951 1608 1109 4066 7214 9725Rio de Janeiro 496 2405 4006 4534 20714 45483 78631 109478Guanabara 1541 4169 5693 5306 56229 123459 171463 178354Sao Paulo 4157 14225 25016 36129 85466 272865 488633 828182
Central-East Total 7519 28007 48616 59836 182366 520140 857454 1065574
Source: Conselho Nacional de Estatistica, 0 Brasil em Numeros (Apendice do Anuirio Estatisticodo Brasil-1960), Rio de Janeiro, 1960, p. 42.
u>00

39
Table 6. Real Index of Industrial Growth of the Central-East and Northeast (excluding Maranhao) 1955 = 100
Year Northeast Central-East
1950 71.6 68.51951 73.6 75.31952 76.6 75.41953 80.9 82.01954 92.1 87.91955 100.0 100.01956 114.0 110.81957 122.0 115.31958 124.4 136.31959 151.4 153.8
Source: Conselho Nacional de Economia, Exposi^ao Geral daSituapao Economica do Brasil, Rio de Janeiro, 1963, p. 269.
Through the decade of the 1950's the rate of industrial growth
in the Northeast was one of the highest in the Western hemisphere. How
ever, the growth rate of industrial expansion in the Northeast has been
greatly overshadowed by the phenomenal growth rate in the Sao-Paulo-
Rio de Janeiro area. With the continued rapid rate of public investment
in social overhead capital projects, such as irrigation, transportation,
and regional hydroelectric plants, total industrial expansion should
continue at an increasing rate. It must be remembered that up until the
mid-19501s the manufacturing sector of the Northeast was relatively stag
nant. Much of the investment in the latter part of the decade went into
replacing outdated machinery. The industrial growth thus could have been
much higher had not the factories needed so much rehabilitation.
40
Mining
Although the minerals and fuels sector of the regional economies
does not account for much of the total income, historically, the mining
sector has been an important source of export earnings„ In addition,
with more intensive exploration and production methods, this sector will
contribute.much more to economic growth. Petroleum production in Bahia
and the mining of vast iron deposits,of Minas state have been assuming
greater importance within the last decade. The present world situation
would seem to indicate that the latter will assume much more importance
in the coming years. In 1960 the,value of mineral products was about43one-tenth that of cotton production in the Northeast. That of the
Central-East is probably a figure of less significance for the regional
economy.
Figure 4 and Table 2 of the Appendix gives the value of regional 44mineral production for the period 1938 to 1962. With the addition of
petroleum production since 1950, which is wholly situated in the state
of Bahia, the total value of mineral production for the Northeast would
approach that of the Central-East. The two most.important minerals of
the Northeast are sea salt and tungsten ore. The two make up 74% of the
total value of mineral production. Iron ore from Minas Gerais accounted
for nearly 60% of the total for the Central-East. Present trends seem to
43. Robock, p. 75.
44. The minerals included are: asbestos, coal, quartz crystal, marble, lead, iron ore, manganese, sea salt, tungsten, and phosphate rock.

Cr.6800
6400
6000
5600
5200
4800
4400
4000
3600
3200
2800
2400
2000
1600
1200
800
400
19:gure. <
Central-East______ _________: ---- Northeast40 42 44 46 48 50 52 54 56 58 60Value of Regional Mineral Production, 1938-1962. tree: Adapted from Conselho Nacional de Estatistica, A
Estatfstico do Brasil-1963, Institute Brasileiro Geografia e Estatistica, Rio de Janeiro, 1963, pp. 128.

42
indicate that both petroleum and iron ore will assume much greater pro
portions in the mining sectors of these regional economies.
Summary
After a critical review of the historical, geographical and
economic literature of Brazilian development, it appears that Brazilian
regional growth experience is most consistent with the export base
theory. An overwhelming amount of evidence clearly illustrates the fact
that the economic growth of the regions of Brazil has been closely geared
to the growth of their export industries. The nation’s economy was of a
reflex” type in the full meaning of the term. Not only was it affected
by crises in the economic sectors on which it was dependent, but it was
also highly vulnerable to fluctuations in world prices.of its few export
commodities.
It is not obvious that this is the sole or superior explanation
for growth, but it does.offer a clearer explanation of growth phenomena
than any other single existing theory, as the remainder of; this paper
will attempt to demonstrate.;
An examination of the agricultural, industrial, and mining sec
tors of the two regions leads to the following conclusions:
(1) In all three sectors the growth rates of the ’’stagnant”
Northeast region have been comparable, and in some instances more favor
able, than those of the ’’growth” or Central-East region.
(2) Presently, the most promising sector is agriculture, followed
by the mining sector, with petroleum production included. The major pro
ducing areas of the expanding crops are in the Northeast, while those of

' 43
the lagging crop--coffee--are found almost wholly in the South and
Central-East.
(3) The industrial sector of the Northeast, although quite
small when compared with that of the Central-East, has made rapid strides
in growth,, especially during the decade of the 1950?s. Expansion rates
of both region^ are among the highest in Latin America,
(4) As.a result of these growth points, the Northeast has gained
on the Central-East, as well as the rest of the nation, oveir the last
eight years. It has.also achieved a growth rate of at least 2.5 percent,
per person, per year suggested as the minimum goal in the Alliance for
Progress„

CHAPTER IV
REGIONAL INCOME ANALYSIS
In Chapter III regional inequalities were studied in terms of
production data--value of production for the agricultural, industrial,
and mining sectors. It was concluded that the degree of.imbalance
.occurring in these sectors in the two geo-economic regions was not
excessive, especially when growth rates of the various sectors were
compared. Where, then, is the great. Brazilian diversity so often
referred to in recent literature?
Despite the lack of extensive time series of data, it seems
that the greatest economic disparity between the Northeast and the
Central-East occurs in the various measures.of income. This chapter
focuses.on regional income disparity because it was felt that such
an investigation could give a more accurate indication of the trend of
regional disparity in the Brazilian economy than any other single
measurement. No single measurement has yet been devised that gives a
very representative view of a nation’s.or region’s economic.growth, but
the one that has gained widest acceptance is per capita income.
Limitations to the Use of Per Capita Income Data
Some of the more obvious restrictions to this type of analysis
.are: .
(1) The data used was average per capita income; i.e., it was
derived by dividing total estimated regional income by the population.44

There are no statistics available on the distribution.of income among
.individuals. Thus, if a small proportion of the population receives a
large share of the regional income3 the earnings:of the majority of pop
ulation are significantly lower than the average„ It has generally been
found that income is more unequally distributed in a poorer region
(Northeast) than a richer and more industrialized region (Central-East)9
and a higher percentage of.individuals in less developed areas receive
incomes below the median than.in the more developed areas, This tends
to make the gap in living levels between the retarded and developed areas
appear narrower than it actually is.
(2) The data do not include any consideration of nonmarket income»
Only money income is used in deriving regional income estimates. Real
income.in the form of untraded items as homemade clothing, home-produced
foods and beverages, home-laundering, owner constructed dwellings, self
performed services, and items supplied by relatives or neighbors are not
includedo
In addition, money wages do not include a great amount of farm
income since a great portion of the rural labor force works as share-45croppers and receives a share of the harvest rather than money wages.
The distortion in income comparisons arises from the fact that
these untraded items and the traditional system of sharecropping account
for a much greater percentage - of the total economy in underdeveloped
45. Greenfield, Sidney M., and Edgard de Vasconcelos Barros,"Rural Labor and Economic Development in B r a z i l Inter-American Economic Affairs, Vol. 19, No. 1, Summer 1965, pp. 75-81.

46regions than in more highly developed regions« Thus s the per capita
income of the less developed areas would tend to be underestimated.
(3) As a result of a well-established custom, private individuals
and companies intentionally understate incomes when reporting them to the
government. The people of Brazil, and Latin America in general, harbor a
feeling that the information given to any government body may be used in
an injurious manner against the giver of the information. This traditionA6has gained in strength since the advent of the income tax.
In addition, there is some unintentional understatement from the
absence of personnel and established procedures to record certain trans
actions even though accompanied by an exchange of currency. The degree of
understatement seems to bear a direct relationship to the degree of under
development in an area--the higher the state of underdevelopment, the
greater will be the degree of understatement.
(4) Differentials in the cost of living in the various regions of
a nation may be overstated by per capita income figures. It is generally
conceded that poorer, underdeveloped areas tend to possess lower costs of
living than the developed areas.in.a country. Thus, per capita income4figures would reflect a greater economic diversity than $s really present.
The foregoing restrictions suggest that real per capita income in
underdeveloped areas may be greater than money income statistics
46. Stark, Harry, Infirmities of Per Capita National Income Estimates When Employed to Compare Levels of Living Between Developedand Retarded Areas, Coral Gables: University of Miami Press, 1961, pp. 13,17-18, 21, 26, 28-29,
47. tSmith, T . Lynn,- Brazil: People and Institutions, Baton Rouge: Louisiana State University Press, 1963, p. 214.
47indicate* With the exception of the first5 all the limitations of per
capita income estimation.seem to indicate the existence of a general
bias which maximizes rather than minimizes the estimates.of disparity
between an advanced and underdeveloped region. With full realization
of these limitations, this analysis will be quite specific in the evalu
ation and application of the results.
Sources of Data
A scarcity of reliable data sources has made it necessary to
rely mostly upon the yearly publication of the Brazilian National Bureau
of Statistics entitled Anuario Estatlstieo do Brasil^ for the sole
source of income and population data. Its reliability is based upon the
fact that it is the official dispensing organ of census information of
the federal government. Although.in recent years the type and reliability
of data.are relatively accurate, the data for years prior to 1947 leave
much to be desired. This lack of reliable data is common for all Latin
American countries.
Lack of long time series and abrupt and unexplained changes in
the data series is common. Large discrepancies in population estimates
of individual' states in the various issues of reporting publications was
also a major shortcoming of the data sources.
State income figures were found for only two periods: 1928 to
1936 and 1947 to 1960. Regional per capita income was derived by
48. Conselho Nacional de Estatistica, Anuario Estatistico do Brasil Ano II, V, VI, XXIV, Instituto Brasileiro de Geografia e Estatistica, Rio de Janeiro, Brasil.

aggregating the state, incomes for the regions and dividing the total by
the regional population.
Specifically9 income for the times series 1928-1936 was in
centos de refs and was obtained from the 1937 edition of the Anuario49
Estatfstieo do Brasil. Data for the later series was found in the
1958-60 edition for the years 1947 to 1957, and in the 1963 edition for
the years 1958-1960. The later series was given.in cruzeiros.
State population estimates are from the following sources: 1900-
1915 from Anuario 1939-40; 1916-1919 from .Anuario 1937; 1920-1927, 1928,
1930, 1932, 1934 from Anuirlo 1936; 1929, 1931, 1933, 1936 from Brazil
1937^; 1937-1940 from Anuario 1941; 1941-1960 from 0 Brasil em ,Numeros~^
and 1961-I9fe4 from Anuario 1963.. - , 52
Cost .of living, indices for the municipios containing the state
capitals were obtained from the following.sources: 1948-1959 from
0 Brasil em.Numeros; 1960 from Anuario 1963. That for the cost of
living.in Rio de Janeiro for 1928^1936 was. obtained from the .Anuario
1939-40.
49. Hereafter; it will be referred to as Anuarioj
50. Ministry of Foreign Affairs3 Brazil 1937, Rio de Janeiro: Economic and Commercial Division, Itamaraty, 1938.
51. Conselho Nacional de Estatfstica, 0 Brasil em Numeros (Apendice do Anuirio Estatfstieo do Brasil-1960), Instituto Brasileiro de Geografia e Estatfstica, Rio de Janeiro.
52. Municfpip is equivalent to a county in political terms but is usually much smaller in geographic extent.

49Regional incomes were deflated by the following method. The
price levels for each municipio were adjusted by making the base year
1948 equal to 100.
The raw data were in terms of deviations from the Brazilian
national average. The state incomes were then individually deflated by
the cost of living indices for the various years. The aggregate of
these was thus the deflated total regional income. Per capita regional
income was derived by dividing the total regional income by regional
population.
Statistical Analysis
Technique Employed
The two objectives of this analysis are: (1) to estimate the
rate of income growth in the two regions for various time periods, and
(2) to determine those time periods for which there are statistically
significant differences in the growth rates in the two regions.
For the first objective, the regression equation is of the form:
Loge Yt = a + bXt
where Yt is per capita income in year t and refers to the years in
question. When Yt is transformed to natural logarithms the regression
coefficient will be the average percentage year-to-year change in Y. And,
the percentage change in this case has the interesting feature of being
equivalent to having a base which is half way between the start and the
end of the year-to-year change.
50Graphically, the hypothesis takes the form illustrated in
Figure 5, where I and II refer to two different time periods and
refers to per capita income of one region, while Y2 refers to that of the other region. This would determine the rate of change in Y^ and
Yg in each of the time periods. In the text and analysis which follow,
this hypothesis will be referred to as Model 1.
A second method, hereafter called Model 2, could be used to deter
mine the relative rates of growth in the two regions for each of the time
periods. The second regression equation is of the form:
Loge Y2 = a + b loge Y i
If the incomes in the two regions are growing at the same rate in one
time period b = 1. Since the objective is to identify the existence of
different rates of growth in the regions, the test of regression coefficient
logically must be for values that are significantly different from 1.
Graphically, the hypothesis takes the form of that illustrated
in Figure 6. In time period I, the ratio between the changes in income
of the two regions would be less than 1 since the rate of change in Y^
would be greater than that of Y^. In time period II, this would be
reversed and b would take on a value larger than 1.
Historically, it has only been the developed countries--and that
in very recent times--that have been characterized by a narrowing of
income inequality, insofar as the scanty empirical evidence allows us to
make such a statement. The broad classes of incomes in the United States,
England, and Germany have been moving toward equality only since the

I
Log Y l
Figure 5. Statistical Model 1t
in
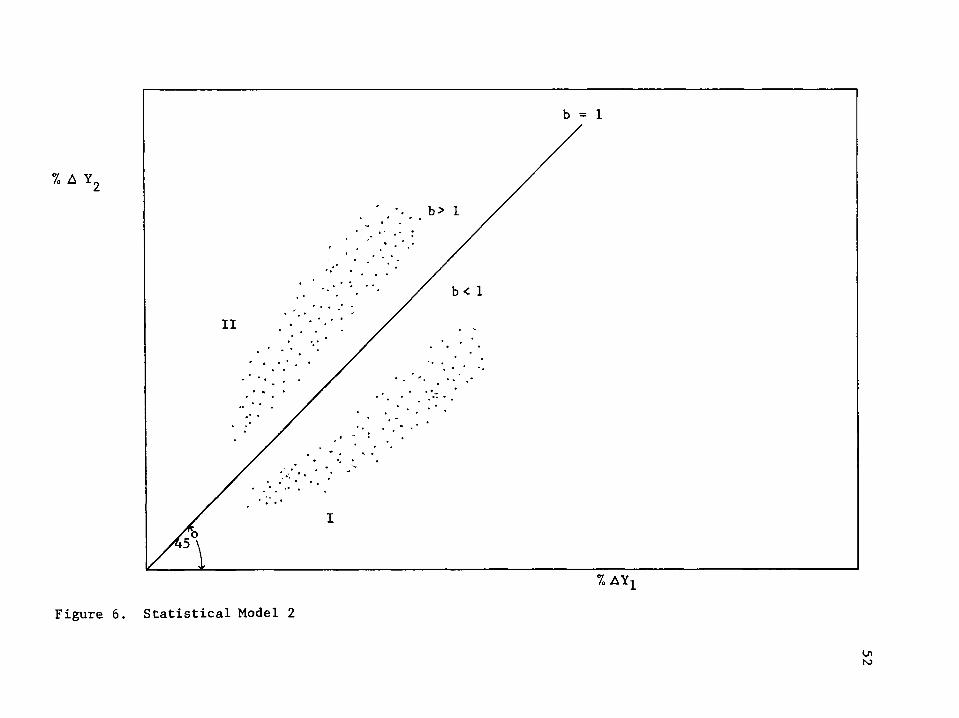
b>
II
% AY
Figure 6. Statistical Model 2
V it o

535319201 s. It has been the general impression that there has not been
such a tendency in the less developed nations in recent decades. The
foregoing analysis will attempt to investigate the Brazilian experience
of recent years.
Restatement.of Hypotheses
The hypotheses regarding the Brazilian experience.of regional
income disparity were already presented in the first chapter. When
applied to Model 1 of the preceding:section we would expect the rate
of growth.of per capita income to be increasing at a faster rate for
the Central-East region than the Northeast region .in the earlier period
(1928-36)3 designated by I in our model. This tendency would then
reverse itself in the later period (1947-60), designated by II in the
model with the Northeast having the higher rate of growth. In our
model, refers to the Central-East region and to the Northeast
region.
In Model 2 the rate of growth of per capita income of the North
east is measured relative to the rate of growth of per capita income of
the Central-East. If the hypothesis is correct we would expect to find
53. A test was made using data for the states east of theMississippi River divided into North and South regions. Only currentmoney per capita.income figures were used. Both regions had significant growth rates throughout most of the series tested as results of Model 1 illustrate (Table 3 Appendix). Table 4 -of the Appendix seems to indicate that beginning with the 1932-1940 period through the period of 1953-1961 (with the exception of a few intervening periods), the rate of growth of per capita income in the South was significantly greater than that.obtained in the North (Model 2).
54the regression coefficients (b values) to be less than 1 in the earlier
period and greater than 1 in the later period, as was illustrated earlier
in the Chapter.
Approaches -
Three different types of income series were analyzed by the method
explained above. The first was per capita income measured in current
money. In the second, per capita income was deflated for price level ,54changes using regional price indices described in the preceding section.
The third and last approach was that of constant dollar total regional
income. The regional income was deflated by the cost of living indices
of the municipios.of capitals for the period 1947-1960 and by the cost
of living index of Rio de Janeiro for the earlier period 1928-36.
54. The cost of living indices had a 1948 base equal to 100. Since an earlier time series, which included the year 1947, did not have the same base year nor an overlap in years after 1947, it was not possible to connect the two time series of cost of living data. It was extremely important to include a value for the year 1947 in the 1947-60 cost of living series because of the existing short time span (14 years) and methodology used in the analysis, namely the use of a nine-year moving average.
. A cursory examination of the free market exchange rate between the Brazilian cruzeiro and UeS». dollar showed no significant change between the years 1947 and 1948. In addition, only a slight increase in the cost of living indices were indicated immediately before and after these years. It was therefore assumed that no significant change in the cost of living occurred in the various -state capitals between 1947 and 1948.
Since it was not possible to secure this detailed information for the earlier series (1928-36) a deflated income was arrived at by adjusting both regional income figures by the cost of living figures with base year 1928 equal to 100 for the national capital-^Rio de Janeiro.

Results of Statistical Analysis--Model 155
Table 7 presents the results of analyzing the rates of growth
of the two regions independent of each other for the per capita income
approach. (See also Figure 7).
Table 7. Results of Current Money Per Capita Income Analysis of Model 1
Northeast Central-East2 a 2 aYears b R t b R t
1928-36 15.92 .92 9.01** 12.10 .831 5.87**
1947-55 12.66 .98 17.79** 15.53 .988 24.52**1948-56 14.44 .97 15.29** 16.83 .990 26.40**1949-57 16.07 .98 16.76** 17.48 .994 33.82**1950-58 16.87 .98 19.75** 17.90 .996 42.07**1951-59 18.92 .99 22.44** 18.72 .996 39.87**1952-60 21.11 .99 23.36** 19.79 .995 38.22**
a. * Significant at 5% level where t > 2.365** Significant at 1% level where t > 3.499
The indicated b value is an estimate of the average annual per
centage change in income. Thus, the Northeast appears to have had a
growth rate of nearly 16 percent for the period 1928-36). The Central-
East region appears to have a steady growth rate which is greater
throughout most of the periods analyzed. The Northeast achieved its
highest growth rate during the period 1952-61. From 1947-55 to 1952-60
there was an increase in the growth rate of per capita income, finally
surpassing that of the Central-East in the periods 1951-59 and 1952-60.
The second approach--deflated per capita income--yielded much
different results (Table 8). Except for the early period (1928-36),

22
ue
21
20
19
18
17
16
15
14
13
12
e 7
(Centra: .-East 1
Nortl least J
Values of Regression Coefficients for Current Money Pei Capita Income Analysis. Model 1.Values of nine-year moving periods ending with indicate year.
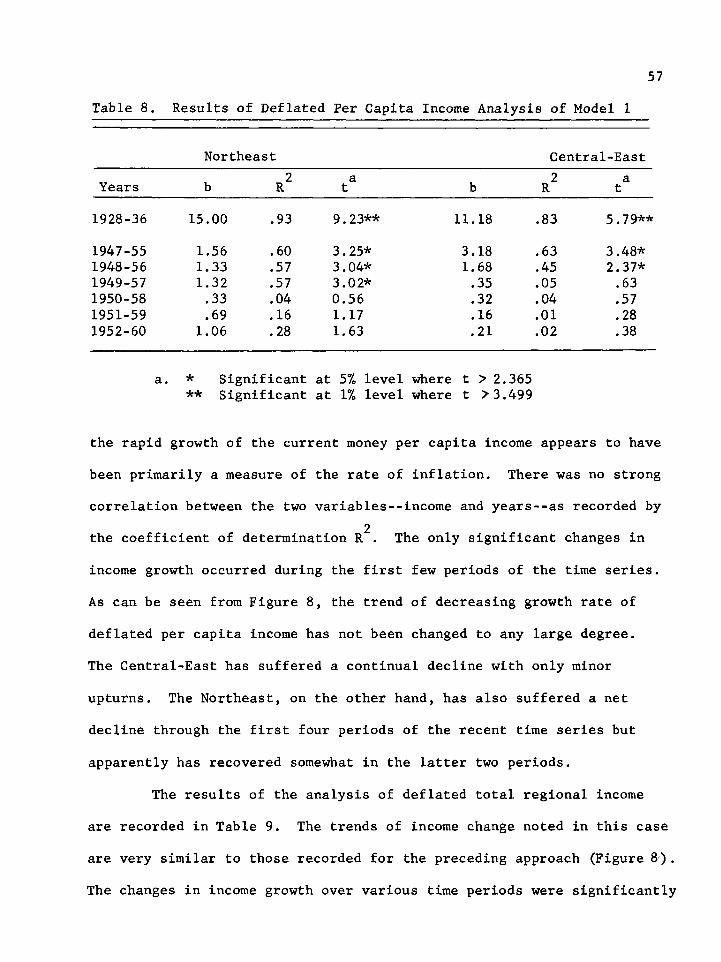
57Table 8. Results of Deflated Per Capita Income Analysis of Model 1
Northeast Central-EastYears R 2 at b R2
1928-36 15.00 .93 9.23** 11.18 .83 5.79**
1947-55 1.56 .60 3.25* 3.18 .63 3.48*1948-56 1.33 .57 3.04* 1.68 .45 2.37*1949-57 1.32 .57 3.02* .35 .05 .631950-58 .33 .04 0.56 .32 .04 .571951-59 .69 .16 1.17 .16 .01 .281952-60 1.06 .28 1.63 .21 .02 .38
a. * Significant at 5% level where t > 2.365** Significant at 1% level where t >3.499
the rapid growth of the current money per capita income appears to have
been primarily a measure of the rate of inflation. There was no strong
correlation between the two variables--income and years--as recorded by2the coefficient of determination R . The only significant changes in
income growth occurred during the first few periods of the time series.
As can be seen from Figure 8, the trend of decreasing growth rate of
deflated per capita income has not been changed to any large degree.
The Central-East has suffered a continual decline with only minor
upturns. The Northeast, on the other hand, has also suffered a net
decline through the first four periods of the recent time series but
apparently has recovered somewhat in the latter two periods.
The results of the analysis of deflated total regional income
are recorded in Table 9. The trends of income change noted in this case
are very similar to those recorded for the preceding approach (Figure 8).
The changes in income growth over various time periods were significantly

b Value
Centra 1-East
1936 1955 1956 1957 1958 1959 1960Figure 8. Values of Regression Coefficients for Deflated Per Capita
Income Analysis. Model 1. a. Values of nine-year moving periods ending with indicated
year.

59
16.
Centra .-East
Northeast
1955 1956 1957 1958 1959 19601936Figure 9. Values of Regression Coefficients for Deflated Total Regional
Income Analysis. Model 1. a. Values of nine-year moving periods ending with indicated year.

60Table 9. Results of Deflated Total Regional Income Analysis of Model 1
Northeast Central-EastYears b R2 t3 b
1928-36 16.79 .94 10.48** 13.80 .73 4.34**
1947-55 3.82 .90 7.85** 5.26 .83 5.83**1948-56 3.58 .90 8.14** 3.77 .81 5.40**1949-57 3.57 .90 8.13** 2.46 .73 4.39**1950-58 2.56 .72 4.28** 2.43 .74 4.43**1951-59 2.94 .78 4.97** 2.25 .70 4.00**1952-60 3.31 .79 5.07** 2.31 .72 4.22**
a. * Significant at 5% level where t> 2.365** Significant at 1% level where t > 3.499
different from zero. All t values were significant at the 1% level. A
higher coefficient of determination in this case, as compared to the
preceding, results from the large population growth at fairly uniform
rates in each of the regions.
Results of Statistical Analysis--Model 2
In the application of Model 2 the three income approaches yielded
different results. As an estimate of the average annual percentage change
in income of the Northeast measured in terms of income growth of the
Central-East, the b values show that in the early period the Northeast
had a higher rate of growth than the Central-East in per capita and
deflated per capita income (1.23 and 1.24) and essentially the same (.99)
in terms of deflated total regional income (Figure 10). After a
decline in the period for which data is lacking (1937-46), per capita
income in the latter series (1947-1960)

61
Per Capita
Deflated Total
Deflated Per apita
1959 19601936 1955 1956 1957 1958Figure 10. Values of Regression Coefficients for Income Analysis.
Model 2.a. Values of nine-year moving periods ending with indicated
year.
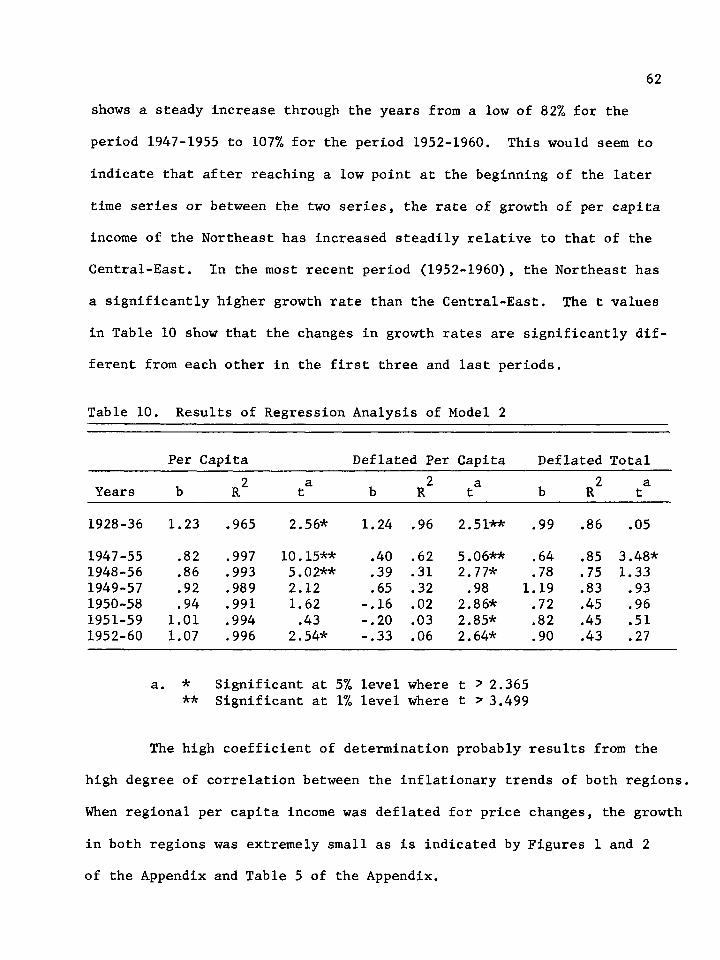
62
shows a steady increase through the years from a low of 82% for the
period 1947-1955 to 107% for the period 1952-1960. This would seem to
indicate that after reaching a low point at the beginning of the later
time series or between the two series, the rate of growth of per capita
income of the Northeast has increased steadily relative to that of the
Central-East. In the most recent period (1952-1960), the Northeast has
a significantly higher growth rate than the Central-East. The t values
in Table 10 show that the changes in growth rates are significantly dif
ferent from each other in the first three and last periods.
Table 10. Results of Regression Analysis of Model 2
Per Capita Deflated Per Capita Deflated Total
Years b R 2 at b R 2 t3 2 a b R t
1928-36 1.23 .965 2.56* 1.24 .96 2.51** .99 .86 .05
1947-55 .82 .997 10.15** .40 .62 5.06** .64 .85 3.48*1948-56 .86 .993 5.02** .39 .31 2.77* .78 .75 1.331949-57 .92 .989 2.12 .65 .32 .98 1.19 .83 .931950-58 .94 .991 1.62 -.16 .02 2.86* .72 .45 .961951-59 1.01 .994 .43 -.20 .03 2.85* .82 .45 .511952-60 1.07 .996 2.54* -.33 .06 2.64* .90 .43 .27
a. * Significant at 5% level where t > 2.365 ** Significant at 1% level where t > 3.499
The high coefficient of determination probably results from the
high degree of correlation between the inflationary trends of both regions.
When regional per capita income was deflated for price changes, the growth
in both regions was extremely small as is indicated by Figures 1 and 2
of the Appendix and Table 5 of the Appendix.

63As expected5 the lines joining the values of regression coeffi
cients of deflated total income and deflated per capita income follow
virtually the same trend6 The continual differential in the later series
is due to similar increasing population patterns of both regions. The
significant increase between the nine-year period ending in 1955 and that
ending in 1957 indicates that the rate of inflation as indicated by the
previously described price indices was greater in the Central-East region.
This was followed by a period characterized by the reverse situation,
and then (1950-1958 to 1952-1960) by a period in which the inflationary
tendencies appear to be greater in. the industrial Central-East» The nega
tive b values for the last three nine-year periods for the[deflated |
per capita income results indicate that the rate of increase of income
growth was positive in the Northeast and negative in the Central-East.
For every one percent decline in income of the Central-East, the Northeast
recorded a .16, „20, and .33 percent increase in per capita income growth
in the three successive periods. However, the vastly different movements
of the price indices may be more a reflection of poor measurement of
prices rather than substantial real differences between the two regions.
In contrast to the high correlation between the two variables in
the first approach, the values for the coefficients of determination are
lower in the last two approaches, Deflating the total regional income
still results in a fairly high coefficient of determination (.86 to .43).
This is mainly due to the high correlation between the population trends
of both regions as illustrated in Figure 3 of the Appendix.
Most of the changes in income growth during the nine-year periods
appear to be significant in per capita and deflated per capita income but

64not in the deflated total regional income approach.as reported in Table 10.
. Summary
Questionable reliability of Brazilian data and extremely short
time periods make it difficult to render any strong conclusions on the
general trends of income growth in the two regions. The inconclusive
evidence from.this analysis seems to indicate that the rate of.growth.of
income of the Northeast was greater than that.of the Central-East in
the early period (1928-36), was less in the following years examined,
reached a low point in the intervening period (1937=46) or the first
analyzed period of the new series, and finally surpassed the growth rate
of the Central-East during the last two periods of the later time series.
This inconclusiveness is further enhanced by the fact that the growth
rate of the Northeast was significantly different from 1 only for the
last measured period. Table 10 shows that for the preceding period its
recorded growth rate, which was somewhat greater than that of the Central-
East, was not great enough to be of significance.
Because of the intervening period of unrecorded changes (1937-
46), it was not possible to locate the point of greatest diversity or
the point.of the lowest reported growth, rate for per capita income in
the Northeast and the highest rate for the Central-East
The first hypothesis--the existence of a higher growth rate in
the Central-East-^must be rejected unless only the 1947-60 data in con
sidered, since in 1928-36 the Northeast appears to have had a higher rate
of income growth than the Central-East.

65The second hypothesis^-the existence e£ a higher growth rate in
the Northeast“-can be accepted only if the 1947-60 data is considered.
In the last analyzed period (1952-60) the growth rate of the Northeast
surpassed that of the Central-East and was significantly different from 1.
The third hypothesis--the identification of the point separating
the above two periods--like the second, can be accepted only when the
1947-60 data is considered. The turning point separating the period of
divergence from the period of convergence was identified in the analysis
as that point in Figure 6 where the line tracing the b values had a
value of 1. Since this occurred in the second to last nine-year period
analyzed, no strong evidence can be marshalled for the continuing ten
dency of convergence in per capita incomes..
The results of the analysis indicate the general trend of income
inequality described by Williamson in Chapter I. After an initial period
of convergence in 1928-36, there was a definite downturn marked by increas
ing divergence during the unreported period. Beginning with the period
1947-55, regional per capita income seems to have commenced on a trend
of convergence.
CHAPTER V
INTERNAL MIGRATIONS
Brazilian Migration Patterns
One of the most important factors affecting the geographic
imbalance of per capita income distribution has been interregional55 56 57labor migration. Williamson, Myrdal, and Singer, have stressed
the harmful effects of population reallocation from stagnant to growing
regions. Being selective in nature, the labor migrations will tend to
drain the poorer region of its skilled and professional workers. Possess
ing a population of great mobility in contrast with most nations at a
similar stage of economic development and degree of communication and
transportation, Brazil should approximate such a circumstance. A short
investigation into Brazilian migration patterns will be presented in
this Chapter.
General Characteristics
Where 3.4 million Brazilians were residing in states other than
those of their birth in 1940, this figure increased to 5.2 million in 1950.
5 5 o Williamson, p. 10
56. Myrdal, p. 27
57. Singer, p. 245
58. Echavarria, Jose Medina and Benjamin Higgins, Social Aspects of Economic Development in Latin America, Vol. II, UNESCO, Paris, 1963,p. 202.

Table 11 illustrates the great.number of internal migrants for the census
years 1940 and 1950. With the exception of Maranhao5 all the states of.
the Northeast had net out-migrations. The migration pattern of the
i Central-East region.is much more complex. Minas Gerais, with the largest
out-migration of all the states of Brazil, and the state of Rio de Janeiro
both had negative balances for the two years. On the other hand,
Guanabara (Old Federal District) and S3b Paulo were the largest receivers
of migrants in the nation because of the attraction of the cities of
Rio de Janeiro and Sao Paulo. Espiritu Santo, the least developed
state of the Central-East3 had a net in-migration in 1940, but the net
movement was reversed in the later census.
This exchange of population is illustrated in Table 6 of the
Appendix. With the exception of Piaux and Maranhifp, a great proportion
of the migrants from the Northeastern states ultimately settled in the
Central-East region, especially in the states, of Sao Paulo and Guanabara.
^ The five northern.states of Maranhao, Piaux, Ceara, Rio Grande do Norte,
and Paraxba.also conducted a mass exchange among themselves. However,
the volume was not as large as that of the Central-East. Minas state,
with the largest net out-migration, sent more than one-half, nearly
788,000 to the neighboring states of Guanabara, Sao Paulo, Rio de Janeiro,
and Espfritu Santo. Thus, most of the state out-migrants of the Central-
East settled within the same region, while there was a substantial net
population transfer from the Northeast to the Central-East.
59. Distinction must be hade between the state of Rio de Janeiroand the city of Rio de Janeiro. Since the opening of the new capital—- Bras ilia--the latter has become the new state of Guanabara.

Table 11. Results of Internal Migrations in Brazil, 1940 and 1950
1940 1950
State or Region
Born Out of State
Born in State and Living in Others Balance
Born Out of State
Born in State and Living in Others Balance
Maranhab 131,019 81,105 + 49,914 161,969 100,189 + 61,780Piaui 66,646 114,416 - 47,770 86,831 144,946 - 58,115Cear^ 89,618 205,661 -116,043 109,493 268,486 - 158,993Rio Grande do Norte 63,512 73,521 - 10,009 77,752 103,669 - 25,917Paraiba 104,183 158,755 - 54,572 101,365 246,780 - 145,415Pernambuco 131,410 244,665 -113,255 210,010 311,193 - 101,183Alagoas 60,147 134,920 - 74,773 103,143 207,250 - 104,107Sergipe 33,737 75,848 - 42,111 36,462 107,479 - 71,017Bahia 105,888 339,848 -233,960 144,055 430,217 - 286,162
Total Northeast 786,160 1,428,739 -642,579 1,031,080 1,920,209 - 889,129
Minas Gerais 195,792 778,605 -582,813 215,806 1,367,239 -1 ,151,433Espfritu Santo 109,981 59,093 + 50,888 93,199 147,854 - 54,655Rio de Janeiro 202,981 432,428 -259,439 368,747 504,130 - 135,383Guanabara 633,686 82,658 +551,028 942,812 142,053 + 800,759Sao Paulo 726,492 231,330 +495,162 1,080,428 507,248 + 573,180
Total Central-East 1,868,940 1,584,114 +284,826 2,700,992 2,668,524 + 32,468
Source: Compiled and adapted from T. Pompeu Accioly Borges, Migrapoes Internas no Brasil,Commissao Nacional de Politica Agraria, Rio de Janeiro, 1955, p. 29.
<T>00

69Trend.of Migrations
Another illustration of the tremendous.importance of internal
migrations to the national economy and regional redistribution of popu
lation is the case of the phenomenal population increase of the city of
Sa© Paulo. Between the 1940 and 1950 censuses9 the number of inhabitants
increased by 871,835. This growth was made up of the following incre
ments: 19,944 or 2.3% by immigration from abroad; 327,848 or 37.6% by60natural increase; and 524,043 or 60.1% by internal migrations. >
The state of Sao Paulo has long had an inflow of laborersAt :
first the need for farm hands for the production of coffee, cotton, and
sugar was the attractive force for migrants. Later, after World War I,
industrial expansion continued the demand for labor. A total of 2,215,639
migrants entered the state between the years 1900 and 1939— 60% of these
were placed in agricultural pursuits. Pre-World War II found most of
the migrants coming from the state of Bahia (between 1935 and 1940 they>
accounted for 49%$of the total). Since then Minas Gerais has accounted61for the largest increment--26%. Refer to Table 6. of the Appendix for
results of 1950 interstate migrations. .
Types of Migrations
Smith classifies four distinct types of internal migrations in
Brazil: (1) rural-urban; (2) pushing forward the agricultural frontier;
60. Smith, T. Lynn, Brazil: People and Institutions, Baton Rouge,Louisiana: LSU Press, 1963, p. 150.
61. Ibid,, p. 177.

70
(3) seasonal; and (4) flight from the secas:or droughts„̂ In sheer
numbers9 the first and last are overwhelmingly the most important* As
in other nations 3 long-distance migrations whether rural-urban or rural-
rural were selective of young male adults. In the late 19308s there63were 198 males to every 100 females in this type of migration. In
addition, the great majority--around 75%--traveled as members of family
groups. Short distance rural-urban movements, as from the surrounding
countryside to the nearby cities, were selective of females. Presently,
however, distance does not seem to be a deciding factor in sex selectivity.
No definite pattern can be identified.
There seems to be some pattern or progression of the rural-rural
and rural-urban movements. The move is usually not into an urban area
from a distant rural area. Migrants, who are all basically rural, from
the Northeastern states characteristically move into rural areas of
other states near large cities as Ban Paulo and Rio de Janeiro. A lack
of industrial skills and their strong rural orientation compel a great
majority of migrants to seek employment in the agricultural sector. Most
in-migration to the cities originates in the areas nearest the industrial
centers where the "pull” or attraction is most apparent- -Minas Gerais,
Espiritu Santo, and Rio de Janeiro. These are also the states with the
largest number of migrants in proportion to native-born state population
(see Table 12). Those states experiencing a "push," or where economic
62. Ibid, p. 145. . ,
63, Ibid,. p. 147.

Table 12. Population in 1950 Classified According to State of Birth and State of Residence
Number Born in State
Residing in Residing % of Those Born No. Born and State or 1950 State of in Other in State Living Residing in StateRegion Population Total Birth States Out of State as °£ of 1950 Pop.
Maranhao 1,583,248 1,520,377 1,420,188 100,189 6.6 89.7Piaui 1,045,696 1,103,534 958,588 144,946 13.1 91.7Ceard- 2,695,450 2,852,855 2,584,369 268,486 9.4 95.9Rio Grande do Norte 967,921 993,334 889,655 103,669 10.4 91.9Parafba 1,713,259 1,858,103 1,611,323 246,780 13.3 94.0Pernambuco 3,395,185 3,491,249 3,180,111 311,138 8.9 93.7Alagoas 1,093,137 1,232,802 1,025,552 207,250 16.8 93.8Sergipe 644,361 715,114 607,635 107,479 15.0 94.3Bahia 4,834,575 5,112,440 4,682,223 430,217 8.4 96.8
Total Northeast 17,972,832 18,879,808 16,959,654 1,920,154 10.2 94.4
Minas Gerais 7,877,864 8,877,833 7,510,378 1,367,455 15.4 95.3Espiritu Santo 861,562 909,623 761,769 147,854 16.3 88.4Rio de Janeiro 2,297,194 2,393,863 1,889,733 504,130 21.1 82.3Guanabara 2,377,451 1,365,513 1,223,460 142,053 10.4 51.5Sab Paulo 9,134,423 7,867,588 7,360,340 507,248 6.4 80.6
Total Central-East 22,548,494 21,414,420 18,745,680 2,668,740 12.5 83.1
Source: Censo Demogr^fico, VI Recenseamento Geral Do Brasil, 1950, Rio de Janeiro,pp. 72-79.

72
conditions in general were the poorests were not as important in the64 ,population movemento.
Rural-urban migrations are typical of those of the United States
and other parts of the world. This is illustrated in Figure 11* Brazil
follows a pattern that is common to other countries and has a natural
rate of increase in the labor force in rural areas exceeding that of
urban areas. While the demand for labor grows slowly or diminishes over
time in the rural areas, it tends to increase more rapidly in urban
areas. The amount of labor migration will increase as the differential
in wages rates between the regions increases. The lower illustration
points out the fact that a certain wage differential is necessary before
any migration will take place.
Reasons for Migrations
Rural-urban migration, although most apparent in the South and
Central-East, is characteristic of all Brazil as it is in all nations of
the world. Coastal cities of Salvador, Recife, and Fortaleza in the
Northeast have had rapid increases in population. A large proportion of
this increase has come from the de-population of the nearby rural areas.
The ,fpulllf of urban employment opportunities has been the major attract
ing force for the rural people. The International Labour Organization
finds the main causes of movement out of agriculture to be better jobs
(meaning better pay), shorter hours, better educational and housing
64. Echavarria, p. 203.

73
Wages
Figure
Rural Sector with No Migration
Wages
Urban Sector with No Migration
nf f
MigrationLI. Relationship of Farm-Nonfarm Wage Differentials and Migrations.
74facilities3 and the difficulty of supporting a family on a very small
65land holding.
Internal Migrations and Income Inequality
Presupposing that all interregional population migrations are
selective in nature9 Myrdal^ and others^ assert that population
mobility tends to widen regional income inequality. Not enough data
are available to conclude that the migrants from the Northeast are the
more skilled and talented ones, which would result in a net drain on68human resources in the region. On the contrary, data for in-migrants
to the state of Sab Paulo indicate that the late 1930 *s the percentage69of illiteracy was 76% for 1937, 81% for 1939, and 83% for 1940. No
figures are available for later years. Though no generalization can be
65. Why Labour Leaves the L^nd: A Comparative Study of theMovement of Labour Out of Agriculture, Geneva: International LabourOrganization, 1960, pp. 13-14.
66. ?lThe localities and regions where economic activity is expanding will attract net immigration from other parts of the country.As migration is always selective, at least with.respect to the migrant*s age, this movement by itself tends to favour the rapidly growing,communities and disfavour the others.fl , Myrdal, p. 27. See also Singer, Hans W., International Development: Growth and Change, New York: McGraw-HillBook Company, 1964, p. 245.
67. Singer, p. 245, and Williamson, p. 10.
68. Baer, Werner, Industrialization and Economic Development in Brazil, The Economic Growth Center, Yale University: Richard D. IrwinInc., Homewood, Illinois, 1965, p. 174.
69. Smith,. p. 182.
75
made for increasing illiteracy of migrants to the Central-East9 there
certainly exists less data to support the opposite theory. Thus, there
does not seem to be any great detrimental effects in the Brazilian case
up to this time.
Information for the years 1940 and 1950 contained in Table 7 of
the Appendix indicates that the percentage of literacy of the North
eastern population was much lower than that of the Central-East, In
general, this would mean that migrants from the Northeast have most
likely a lower degree of literacy than the citizens of the recipient
areas in the Central-East, The effect of such migrations would tend
to lower the percent of literacy in the recipient areas. Migrants from
the Northeast were from the lower category of an already poorly educated
population. Selectivity in migration in Brazil has been in the direction
of the least educated. The foregoing case would seem to contradict the
argument advanced by Myrdal,
With the presence of a large degree of underemployment in a
population in which 77% of the labor force is currently engaged in
agricultural pursuits, the productivity can be assumed to be very low.
Emigration from such a labor force, regardless of age distribution,
would result in little diminution of total income. Thus, per capita
income may well rise. A reduction in the labor force would be welcome
in a population where the fecundity and fertility is so great as to
threaten a superpopulation of the area. De-populating the region of its
productive class— those between the ages of 20 and 40--would not seem
to be a great detriment to its long run development since those of lower

76age brackets would continue to enter this ^productive*' class over the
span of years.
The recipient region of the migrations s although benefiting
from the increased labor supply, will be adversely affected by the
migrants' lack.of skills and lower average output which may offset the
positive influence of the rise in the total number of the labor force
in the short run. Being married or of marriageable.age, migrants will
tend to increase the population and reduce the proportion of the popu
lation in the labor force, thus offsetting, to a degree the positive .70effect on this proportion of the workers themselves. Concomitantly,
the proportion of the population of this age group will be reduced in
the region of origin, thus.dampening the crude birth rate. That group
consisting of the unproductive pre-labor force individuals will con
sequently be reduced.
Migration from the stagnant to the growing region will benefit
the former in both the short and long run. In the short run it will■ 5 '•
tend to increase the per capita rate of economic growth in the stagnant
region by decreasing the population, thus diminishing the rate of widen-
inequality between the two regions. Reducing the birth rate of the
stagnant region while increasing that of the growing region will be
beneficial to the former in the long run.
Depending.on the actual rates of in-migration relative to the
rate of regional investment, the increase in the labor force may prove-
70. Okun, Bernard atid Richard W. Richardson, ^'Income Inequality and Internal Migration,V in Regional Development and Planning: A Reader,edited by John Friedman and William Alonso, Cambridge: MassachusettsInstitute of Technology, 1964, p. 307.

77
to be either an aid or detriment to the growing region. If it is a
detriment to the regional economy9 it will be in the short run while
capital may not be available in large enough quantities to be able to71absorb the increase in the labor force„
Outlook
If national and regional economic development is to continue at
a rapid pace in Brazil9 such a stopgap effort at reducing regional
inequalities cannot be depended upon to be as valuable in the future as
it has been in the past. During the period of agricultural expansion
in the late 19th and early 20th centuries, and later during the outset
of industrial growth in.Sab Paulo in the interwar period, this region72suffered from a very definite falta de braces. Continuing industrial
expansion in the Central-East will not be able to supply jobs to all the
people of low productivity of the. Northeast.
The overcrowding,of slum areas,or favelas of Rio de Janeiro and
Sab Paulo is an indication of the surplus of unskilled and uneducated
laborers who have been unable to find employment.in the unskilled and
service industries. In Rio alone, a total of nearly one million live in
squalor in the hillside favelas.
Since the jobs available in an industrializing economy continually
demand more - education and training, employment opportunities for unskilled
71. Ibid, pp. 310 and 317.
72. Literally **lack of arms,̂ referring to labor shortage.

will continue to decline in proportion to the total labor force and
and probably in proportion to the tremendous number of. in-migrants of
marginal and sub-marginal skills and training. Only a rise in the
general level of education will begin to alleviate such structural
imbalances in the nation and insure a more egalitarian income distri
bution.

CHAPTER VI
SUMMARY AM) CONCLUSIONS
Comparison with Williamson's Results
Using the individual states as units of comparison for regional
economic diversity, WilliamsonJs results" d© not show any recent signi-73fleant changes in per capita income levels for the Northeastern states.
The aggregate measure used/^which, is affected by fluctuations in income
levels of all states 9 tends to reduce the value of regional comparisons»
Although total diversity among the states has been decreasing since the
• early 1950's, with a few minor■exceptions3 the results.do not introduce
any reliable evidence representing a general trend towards convergence
in regional per capita income levels.
Working only with two regions and treating each as a unit of
comparison, the results of this study stressed much more strongly a
possible lessening of regional per capita income inequality. The fluc
tuations of per capita income levels of other states, notably Rio Grande
do Sul which had a tremendous increase during.the recent decade, and the
North Central states which underwent severe declines were not included
in this study because they lie outside the regions studied, A comparison
of the regions provided a better focus on Brazilian regional diversity - 1
73, Williamson, pp. 49=50,
74, Ibid, p, 32,
79
80in spite of the fact that only 14 of the 21 states were included. An
effort was made to concentrate on the regional disparities issue by
using the two regions of interest in the recent literature on the topic.
Scope of Regional Inequality and Government Programs
75Contrary to popular opinion the most serious problem in
Brazilian regional disparity is not the lagging economic growth rate of
the Northeast in comparison to the dynamic Central-East. Our investiga
tion has shown that in all sectors of the economy--agriculture5 industry,
and mining--the rate of growth has been greater than or comparable to
that of the Central-East. The measurement of economic well-being used
in this study--per capita income--has shown that the rate of the
^dynamic" Central-East has been surpassed by the "lagging** Northeast.
The results of this study seem to indicate that the general trend of
regional income inequalities recently has been towards convergence.
Polarization of economic activity in the Central-East was the
precedent which was set during the coffee boom of the late 19th and
early 20th centuries. In the inter-war period and later in the post
war period, the industrialization effort was concentrated principally in
the Sao Paulo area. The result of such great initial centralization of
75. "The rate of growth of the Northeastern economy, in the last score of years has been substantially slower than that in the Center- South. From 1948 onwards the rate of growth of the Northeast has been half that of the Center-South," The Brazilian Northeast: Problems andProspects, Brazilian Embassy, Washington, D, C«, March 1961, p. 1. See also SUDENE, The Brazilian Northeast, Presidencia de Republica, Recife, 1962, p. 6.

81
economic activity has been a compounding of past industrial and agricul
tural growth« The product has been the great structural imbalance of
the national economy and an overwhelming superiority and advantage for
further economic development in the Central-East.
Economic policies of the federal government have recently been
established in an attempt to stem the tide of widening inequalities, and
may be increasing the economic growth of the Northeast as appears in the
results of the analysis of this thesis.. Where only temporary expedients
in the form of programs to alleviate the drought conditions^ were the
main, and in many cases the only, concern of the national government .
before the Vargas era, it was in the late 19508s that public planning
of all types of economic aid by the federal government became ,a reality.
Such a delay was not, by any means, conducive to establishing or further
ing, a healthy economic atmosphere in the ..Northeast, much less to increas
ing the productive capacity of the region.
The interest with which the federal government has now undertaken
this problem of regional inequalities emphasizes the priority given it
as a major issue in the economic development of the nation. No >other
country at a similar level of per capita national,income and development
has devoted so much public attention to it at the expense of other
national goals. Clearly then, the federal government has committed
itself to a long-range plan of public investment in the less developed
76. 11 With the exception of the state of Maranhao and the inclusion of a portion of the state of Minas Gerais, the Northeast region as defined in this thesis conforms to the "drought polygon" of.Brazil. See Rebeck, pp. 70-74.

82region of the Northeast* It has stipulated by constitutional amendment
77a .sum of 6 percent of total yearly tax revenues to be spent on social
overhead capital projects in this area in order to develop an economic
base for further investment and development* The results of the under
taking have so far been difficult to gauge* Not enough time has elapsed
for the effects to be fully evident* Since returns from such invest
ments are deferred in nature, the stream of returns will widen over time.
Each, additional investment may add to the returns which will not yield
benefits till some fairly distant date.
There exists two main requisites for the complete realization
of an overall plan to curb extreme economic disparities and development
of lagging regions of the economy* The political structure of government
must be stable enough to hand down through.succeeding administrations
the legacy for such a long-run plan*. Frequent illegal changes of ruling
bodies, as is common in all Latin American nations, will not be conducive
to such a long-range plan of public investment. The second requisite
is a thorough understanding, of the present trends of economic growth*
If these trends are favorable, as they presently appear to be, govern
mental policies can be designed to take advantage of such tendencies to
aid in compounding beneficial results» Cognizance of such trends could
77, HThe constitution now earmarks 3 percent of total tax revenues... for the Northeast (shared by DNOCS and BNB) and 1 percent for the San Francis,co Valley. In addition, the SUDENE law grants the Northeast an additional 2 percent of the total federal revenues.n Rebock, p. 151.

greatly influence policy makers and possibly increase.the degree of
success,of many programs. Through such means:the federal government
may be able to curb some of the great inequalities in the nationfs
level of economic development.

LIST OF REFERENCES
Aguiar, Pinto de, Integragao e Desenvolvimento Economico, Salvador: Editora Progress©3 19580
BNDE, Classificagao das Regioes Geo-Economicas5 mimeo„, Rio de Janeiro, 1964.
Baer, Werner, Industrialization and Economic Development in Brazil,The Yale Economic Growth Center, Yale University, Homewood: Richard D . Irwin, Inc., 1965.
Banco do Nordeste, Aspectos Regionais do Desenvolvimento Economico:Uma Experiencia no Nordeste do Brasil, Rio de Janeiro, 1956.
Borges, T. Pompeu Accioly, Migragoes Internas No Brasil, Commissao Nacional de Politica Agraria, Rio de Janeiro, 1955.
Boxer, C. R*, The Dutch in Brazil, Oxford: Clarendon Press, 1957.
Clark, Colin, The Conditions of Economic Progress, London: Macmillan,1940.
Conselho de Desenvolvimento do Nordeste, A Policy for the Economic. Development of the Northeast, Presidencia de Republica,Rio de Janeiro, 1959.
Conselho Nacional de Economia, Exposigao Geral da Situagao Economica do Brasil, 1962, Rio de Janeiro, 1963.
Conselho Nacional de Estatistica, Anuario Estatxstico do Brasil ̂ 1936-1963, Ano I-XXIV, Presidencia de Republica, Institute Brasileiro de Geografia e Estatistica, Rio de Janeiro.
, 0 Brasil em Numeros, (Apendice de Anuario Estatxsticodo Brasil-1960), Institute Brasileiro de Geografia e Estatistica, Rio de Janeiro, 1960.
Echavarrxa, Jos^ Medina and Benjamin Higgins, Social Aspects of Economic Development in Latin America, Vol. II, UNESCO, Paris, 1963.
Economic Commission, for Latin America, 8eThe Growth. and Decline ofImport Substitution in Brazil,ff Economic Bulletin for Latin America, Vol. IX, No. 1, March 1964.
84

85
Fisher 3 Allan G, B.o 3 ^Production3 Primary3 Secondary3 and Tertiary3 ,r Economic Record3 Vol. 15 (June 1939) 9 pp..24-38.
Florence5 Sargant9 Investments Location) and Size of Plant, Cambridge3 1948.
Furtado, Celso, The Economic Growth of Brazil, Berkeley: University ofCalifornia Press, 1963.
Greenfield, Sidney and Edgard de Vasconcelos Barros, "Rural Labor andEconomic Development in Brazil," Inter-American Economic Affairs, Vol. 19, No. 1, Summer 19653 pp. 75-81.
Hartley, Delmar, "A Subregional Application of Regional Economic Growth Theoryunpublished dissertation. University of Nebraska, 1963.
Hirschman, Albert 0., The Strategy of Economic Development, New Haven:The Yale University Press, 1960.
Hoover, Edgar M., The Location of Economic Activity, New York: McGraw-Hill, 1963.
Institute of Inter-American Affairs, The Development of Brazil, Report of Joint Brazil-United States Economic Development Commission, Foreign Operations Administration, Washington, D0 C o, 1953.
Inter-American Development Bank, Fourth Annual Report 1964, Social Progress Trust Fund., Washington, D0 Co-, 1965.
Isard, Walter, Location and Space Economy, New York: John Wiley andSons, Inc., 1956.
____________ , Methods.of Regional Analysis: An Introduction to RegionalScience, New York: John Wiley and Sons, Inc., 1960.
, "Regional Science, the Concept of a Region, and RegionalStructure," Regional Science Association, Papers and Proceedings, Vol. II, 1956, pp. 1-14. IJames, Preston E., Latin America, New York: The Odyssey Press, 1959.
Jensen, Merril, ed., Regionalism in.America, Madison; The University of Wisconsin Press, 1950.
Kuznets, Simon, "Economic Growth and Income Inequality," American Economic Review, Vol. XLV,. No. 1, pp. 1-28.
, Wilbert E. Moore, and Joseph Spengler, eds., Economic Growth; Brazil, India, Japan, Durham: Duke University Press,1955.
86
Lambert9 Jacques9 Os Deis Brasis9 Ministerio da Educa^a© e Cultura,Rio de Janeiro9 1959.
Lefebers Louis5 Allocation in Space9 Production, Transport9 and Industrial Location, Amsterdam: North Holland Publishing.Company3
1958.
Lo.schj August9 The Economics of Location, New Haven: Yale UniversityPress3 1954.
Ministry of Foreign Affairs3 Brazil 1937 9 Rio de Janeiro; Economic and Commercial Division Ltamaraty9 1938.
9. Brazil 1943 Resources and Possibilities, Rio de Janeiro: Economic and Commercial Division ltamaraty, 1944*
Morgan, Thomas D. , !iThe Export Base and Development Stages Theories of Regional Economic Growth: An Appraisal," Land Economics,November 1964, pp. 421-432.
Myrdal, Gunnar, Economic Theory and Underdeveloped Regions, London:Gerald Duckworth and Company, Ltd., 1957.
North, Douglas C., "Agriculture in.Regional Economic Growth," Journal . of Farm Economics, Vol. XLI, No. 5, pp. 943-951.
, "Location Theory and Regional Economic Growth," Journal of Political Economy, Vol. 64, No. 2, pp. 243-258.
Okun, Bernard and Richard W. Richardson, "Income Inequality and Internal Migration," in Regional Development and Planning: A Reader,edited by John Friedman and William.Alonso, Cambridge: Massachusetts Institute of Technology Press, 1964, pp. 303-318.
Patriota, Antonio, "The Economic Development of Brazil," Hispanic American Report Special Issue, Palo Alto: Stanford University Press,1961.
Perloff, Harvey S., How a Region Grows, Committee for Economic Development Supplementary Paper No- 17, New York, 1963.
Edgar Dunn, Jr., Eric E. Lampard, and Richard F . Muth, Regions9 Resources, and Economic Growth, Baltimore: The JohnsHopkins Press, 1960.
Rebeck, Stefan H., Brazil's Developing Northeast: A Study of RegionalPlanning and Foreign Aid, Washington: The Brookings Institution,1963.

87Rebeck"'Recent Econemic Trends . in N„E» Btazi 1,11 Inter-American Ecenemic
Affairs, Vol. 16, No. 3, 1962, pp. 65-89.
, "Regional Aspects.of Economic Development," Regional Science Association Papers and,Proceedings, Vol. II, 1956, pp. 51-63.
Singer, Hans W., International Development: Growth and Change, New York: McGraw-Hill Book Company, 1964.
Smith, TV liynn, Brazil: People and Institutions, Baton Rouge: LouisianaState University Press, 1963.
Stark, Harry, Infirmities of Per Capita National Income Estimates When Employed to Compare Levels of Living Between Developed and Retarded.Areas, Coral Gables: University of Miami Press, 1961.
Tlebout, G, kL, "Exports and Regional Economic Growth," Journal of Political Economy, Vol. 64, No. 2, April 1956, pp. 160-164.
Von Thunen, J. H., Per Isolierte Staat in Beziehung auf Landwirtschaft und Nationalokonomie, Hamburg, 1926.
Wagley, Charles,,An Introduction to Brazil, New York: Columbia UniversityPress, 1963,
• ~ , "Regionalism and Cultural Unity in Brazil," in Readings inLatin American Social Organizations and Institutions, edited by Olin E. Leonard and Charles P. Loomis, East Lansing: MichiganState University Press, 1953, pp. 15-21.
Weber,. Alfred, Theory of Location of Industries, Chicago: Universityof Chicago Press,1962.
iWhittlesey, Derwent, "The Regional Concept and the Regional Method,"
American Geography: . Inventory and Prospect, edited by Preston E. James and Clarence Jones, Syracuse: Syracuse University Press,1954.
Williamson, Jeffrey G . , Regional Inequality and the Process of NationalDevelopment: A Description of the Patterns, Economic Developmentand International Economics Workishop Paper 6401, Madison: University of Wisconsin, 1964.

APPENDIX

Table 1. Percent of Total Domestic Income from Agriculture by States and Regions.
State or Region 1950 1951 1952 1953 1954 1955 1956 1957 1958 1959 1960
Maranhao 1.1 1.3 1.4 1.5 1.4 1.3 1.4 1.4 1.6 1.9 2.0Piaui .7 .6 .7 .5 .5 .5 .7 .7 .6 .7 .7Ceara 3.4 2.2 2.6 2.0 2.0 2.0 2.5 2.6 1.0 2.8 2.9Rio Grande do Norte 1.5 1.6 1.4 .9 1.0 1.1 1.2 1.1 .8 1.4 1.5Paraiba 2.6 2.4 2.2 1.7 1.9 2.0 2.1 1.9 1.7 2.4 2.9Pernambuco 3.9 4.0 3.2 3.4 3.2 2.9 3.4 3.7 4.0 3.7 3.8Alagoas 1.2 1.3 1.2 1.1 1.0 1.0 1.2 1.4 1.6 1.5 1.4Sergipe .6 .7 .7 .7 . 6 .5 .7 .7 .9 .8 .8Bahia 5.2 4.9 4.4 5.0 6.3 5.2 5.3 5.0 5.3 5.7 6.1
Total Northeast 20.2 19.0 17.8 16.8 17.9 16.5 18.5 18.5 17.5 20.9 22.1
Minas Gerais 16.3 17.0 15.5 17.0 16.5 14.7 15.6 15.5 14.3 13.9 13.8Espiritu Santo 2.1 3.0 2.0 2.1 2.1 2.0 1.9 2.0 1.7 1.6 1.6Rio de Janeiro 3.8 3.7 3.8 3.7 3.4 3.2 3.6 3.4 4.0 4.1 4.1Guanabara . , 1.0 .6 .6 .5 .5 .5 .4 .8 .7 . 6 .5Sao Paulo 29.3 29.7 31.6 27.4 29.8 28.6 26.7 27.7 26.4 23.7 23.0
Total Central-East 52.5 54.0 53.5 50.7 52.3 49.0 48.2 49.4 47.1 43.9 43.0
Source: Conselho Nacional de Economia, Exposicao Geral da Situacao Econdmica do Brasil 1962,Rio de Janeiro, 1963, pp. 263-266.
ooVO
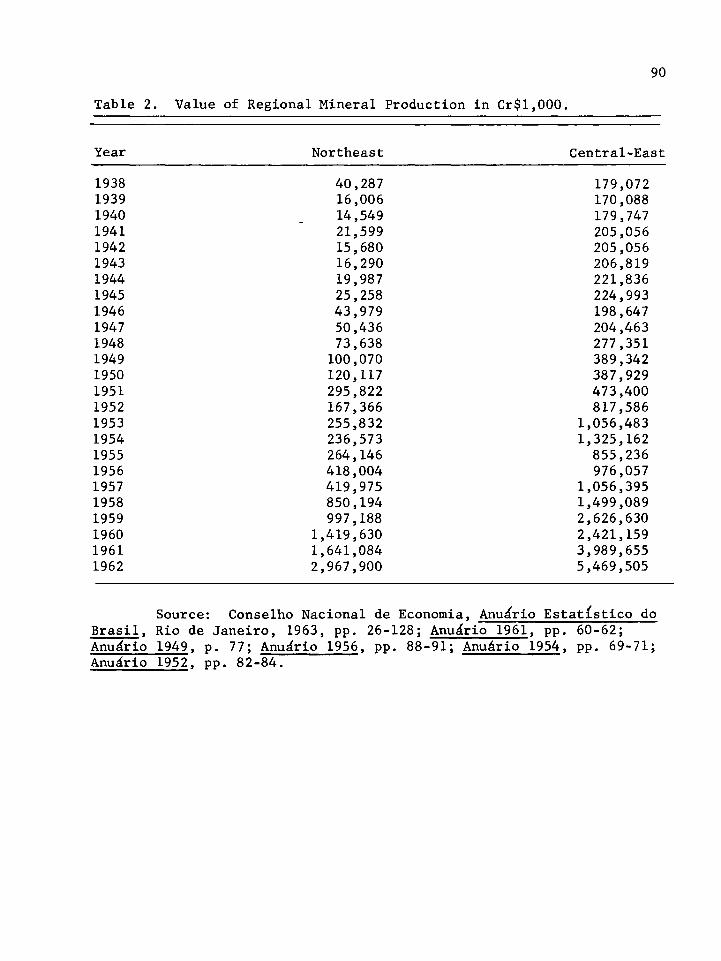
Table 2. Value of Regional Mineral Production in Cr$l,000.90
Year Northeast Central-East
1938 40,287 179,0721939 16,006 170,0881940 14,549 179,7471941 21,599 205,0561942 15,680 205,0561943 16,290 206,8191944 19,987 221,8361945 25,258 224,9931946 43,979 198,6471947 50,436 204,4631948 73,638 277,3511949 100,070 389,3421950 120,117 387,9291951 295,822 473,4001952 167,366 817,5861953 255,832 1,056,4831954 236,573 1,325,1621955 264,146 855,2361956 418,004 976,0571957 419,975 1,056,3951958 850,194 1,499,0891959 997,188 2,626,6301960 1,419,630 2,421,1591961 1,641,084 3,989,6551962 2,967,900 5,469,505
Source: Conselho Nacional de Economia, Anu^rio Estatistico doBrasil, Rio de Janeiro, 1963, pp. 26-128; Anudrio 1961, pp. 60-62; Anudrio 1949, p. 77; Anudrio 1956, pp. 88-91; AnuArio 1954, pp. 69-71; Anudrio 1952, pp. 82-84.

91Table 3. Results of Current Dollar Per Capita Income Analysis
of the United Statesof Model 1
South North2 a 2 aYears b R t b R t
1929-37 -. 88 .02 .34 -2.86 •14 1.06,1930-38 2.25 .15 1.10 0.00 .00 .001931-39 4.52 .56 2.97* 2.88 .30 1.731932-40 6.32 .87 6.90** 5.10 .82 5.74**1933-41 7.47 .88 7.19** 6.08 .86 6.45**1934-42 8.98 .82 5.59** 6.83 .82 5.73**1935-43 11.30 .82 5.66** 8.47 .81 5.50**1936-44 13.31 .86 6.51** 9.92 .85 6.26**1937-45 14.93 .92 8.76** 11.17 .91 8.44**1938-46 15.39 .94 10.17** 11.78 .95 11.13**1939-47 13.81 .88 7.27** 10.72 .91 8.38**1940-48 11.54 .82 5.73** 9.23 .87 6.88**1941-49 7.92 .76 4.70** 6.64 .82 5.63**1942-50 5.15 .82 5.69** 4.82 .87 6.73**1943-51 4.26 .91 8.45** 4.19 .94 10.13**1944-52 4.40 .90 8.09** 4.42 .93 9.84**1945-53 4.97 .93 9.84** 4.88 .95 11.73**1946-54 5.16 .95 11.77** 4.72 .94 10.23**1947-55 5.15 .95 11.68** 4.48 .93 9.36**1948-56 4.98 .95 11.25** 4.37 .92 9.08**1949-57 4.73 .93 9.36** 4.40 .92 9.23**1950-58 4.16 .94 10.62** 3.55 .93 9.33**1951-59 3.80 .97 14.77** 3.05 .96 12.59**1952-60 3.78 .97 14.75** 2.98 .96 12.30**1953-61 3.88 .97 16.03** 2.88 .95 11.39**
a. * Significant at 5% level where t > 2.365 ** Significant at 1% level where t > 3.499
b. less than .005

92Table 4. Results of Current Dollar Per Capita Income Analysis of
Model 2 of the United States
Years b R2 ta
1929-37 .87 .919 1.311930-38 .88 .850 .831931-39 1.11 .927 .911932-40 1.20 .993 5.30**1933-41 1.21 .995 6.67**1934-42 1.32 .993 7.37**1935-43 1.32 .996 10.80**1936-44 1.33 .997 12.72**1937-45 1.33 .998 13.91**1938-46 1.31 .998 15.19**1939-47 1.30 .997 10.60**1940-48 1.28 .994 7.24**1941-49 1.23 .989 4.80**1942-50 1.09 .988 1.971943-51 1.02 .984 .481944-52 1.01 .989 .201945-53 1.03 .992 .761946-54 1.08 .994 2.57*1947-55 1.13 .995 4.24**1948-56 1.12 .995 3.94**1949-57 1.11 .995 3.56**1950-58 1.19 .989 3.99**1951-59 1.26 .984 4.21**1952-60 1.26 .983 4.14**1953-61 1.31 .982 4.62**
a. * Significant at 5% level where t > 2.365 ** Significant at 1% level where t > 3.499

Table 5. Brazilian Regional Income, 1928-36, 1947-6093
Northeast Central-East
Current Money Deflated Money Current Money Deflated MomYear Per Capita Per Capita Per Capita Per Capita
1928 410 410 3,046 3,0461929 458 462 3,274 3,3071930 366 406 2,420 2,6881931 616 708 3,804 4,3731932 632 710 3,530 3,9671933 814 935 5,226 6,0071934 889 956 5,470 5,8821935 1,109 1,120 6,241 6,3041936 1,376 1,217 7,085 6,269
1947 1,440 1,442 4,310 4,3081948 1,580 1.578 4,810 4,8131949 1,720 1,516 5,460 5,2471950 2,000 1,651 6,250 5,7241951 2,200 1,585 7,370 6,0011952 2,400 1,554 8,290 5,5071953 2,740 1,601 9,900 5,5601954 3,410 1,736 12,410 5,8841955 4,090 1,677 15,040 5,8581956 5,220 1,737 18,510 5,7431957 6,270 1,683 21,060 5,5101958 7,020 1,551 25,130 6,2091959 9,980 1,717 32,980 5,6761960 13,530 1,827 42,290 5,531
a. The series 1928-36 is given in contos de reis; the series 1947-1960 is given in cruzeiros.
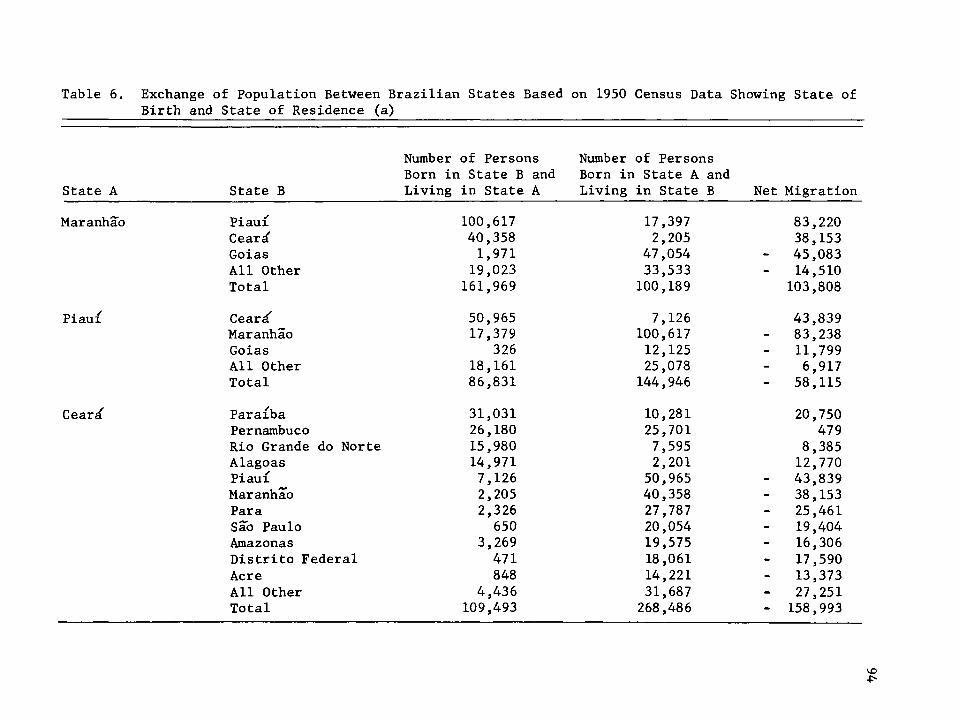
Table 6. Exchange of Population Between Brazilian States Based on 1950 Census Data Showing State of Birth and State of Residence (a)
State A
Maranhao
Piaui
Cearsf
State B
Number of Persons Born in State B and Living in State A
Number of Persons Born in State A and Living in State B Net Migration
Piaui 100,617 17,397 83,220Cear^ 40,358 2,205 38,153Goias 1,971 47,054 - 45,083All Other 19,023 33,533 - 14,510Total 161,969 100,189 103,808
Ceard' 50,965 7,126 43,839Maranhao 17,379 100,617 - 83,238Goias 326 12,125 - 11,799All Other 18,161 25,078 - 6,917Total 86,831 144,946 - 58,115
Paraiba 31,031 10,281 20,750Pernambuco 26,180 25,701 479Rio Grande do Norte 15,980 7,595 8,385Alagoas 14,971 2,201 12,770Piaui 7,126 50,965 - 43,839Maranhao 2,205 40,358 - 38,153Para 2,326 27,787 - 25,461Sab Paulo 650 20,054 - 19,404Amazonas 3,269 19,575 - 16,306Distrito Federal 471 18,061 - 17,590Acre 848 14,221 - 13,373All Other 4,436 31,687 - 27,251Total 109,493 268,486 - 158,993
<o-F>

Table 6. (cont.) (b)
State A State B
Number of Persons Born in State B and Living in State A
Number of Persons Born in State A and Living in State B Net Migration
Rio Grande do Norte Paraiba 60,654 30 151 30 503Ceari 7,595 15 980 - 8 385Distrito Federal 483 13 648 - 13 165All Other 9,020 43 890 - 34 870Total 77,752 103 669 - 25 917
Paraiba Pernambuco 54,384 89 849 35 465Rio Grande do Norte 30,151 60 654 - 30 503Ceard' 10,281 31 031 - 20 750Distrito Federal 163 23 209 - 23 046Sao Paulo 201 10 712 - 10 511All Other 6,185 31 325 - 25 140Total 101,365 246 780 - 145 415
Pernambuco Paraiba 89,849 54 384 35 465Alagoas 60,387 52 509 7 878Ceard 25,701 26 180 - 479Rio Grande do Norte 10,100 4 464 5 636Sao Paulo 1,678 62 745 - 61 067Distrito Federal 1,177 45 157 - 43 980Bahia 6,537 17 734 - 11 197Rio de Janeiro 1,751 12 166 - 10 415All Other 12,282 35 799 - 23 517Total 209,462 311 138 - 101 676
Alagoas Pernambuco 52,509 60 387 _ 7 878Sao Paulo 542 56 788 - 56 246Distrito Federal 217 27 267 27 050

Table 6. (cont.) (c)
State A State B
Number of Persons Born in State B and Living in State A
Number Born in Living
of Persons i State A and in State B Net Migration
Alagoas Bahia 1,289 10,708 9,419All Other 12,586 52,100 - 39,514Total 67,143 207,250 - 140,107
Sergipe Alagoas 16,379 5,067 11,312Bahia 15,202 44,365 - 29,163Sab Paulo 377 25,035 - 24,658Distrito Federal 305 20,089 - 19,784All Other 4,199 12,923 - 8,724Total 36,462 107,479 - 71,017
Bahia Minas Gerais 44,996 56,649 _ 11,653Sergipe 44,365 15,202 29,163Pernambuco 17,374 6,537 10,837Alagoas 10,708 1,289 9,419Sab Paulo 2,130 189,685 - 187,555Distrito Federal 1,200 44,936 - 43,736Goias 582 44,277 - 43,695Mato Grosso 260 18,890 - 18,630Parana 175 18,764 - 18,589All Other 22,265 33,988 - 11,723Total 144,055 430,217 - 286,162
Espiritu Santo Minas Gerais 50,919 29,163 21,748Rio de Janeiro 28,407 32,054 - 3,647Distrito Federal 1,357 55,746 - 54,389All Other 12,524 30,891 - 18,367Total 93,199 147,854 - 54,655
VOOv

Table 6. (cont.) (d)
State A State B
Number of Persons Born in State B and Living in State A
Number of Persons Born in State A and Living in State B Net Migration
Rio de Janeiro Minas Gerais 152 909 36,794 116 115Distrito Federal 102 108 360,324 - 258 216Espiritu Santo 32 054 28,407 3 647Sao Paulo 18 685 56,076 37 391Pernambuco 12 156 1,751 10 405All Other 50 835 20,778 30 057Total 368 747 504,130 - 135 383
Sao Paulo Ceara 29 054 650 28 404Paraiba 10 712 201 10 511Pernambuco 62 745 1,678 61 067Alagoas 56 788 542 56 246Sergipe 25 033 377 24 656Bahia 189 685 2,130 187 555Minas Gerais 512 736 45,554 467 182Rio de Janeiro 56 076 18,685 37 391Distrito Federal 18 172 46,990 28 818Par and’ 32 709 352,471 - 319 762All Other 70 295 37,879 32 416Total 1,064 005 507,157 556 848
Distrito Federal Rio de Janeiro 360 324 102,108 258 216Minas Gerais 191 197 9,691 182 226Espiritu Santo 55 746 1,357 54 389Sao Paulo 46 990 18,172 28 818Pernambuco 45 157 1,177 43 980Bahia 44 936 1,200 43 736Alagoas 27 267 217 27 050
'VO

Table 6. (cont.) (e)
State A State B
Number of Persons Born in State B and Living in State A
Number of Persons Born in State A and Living in State B Net Migration
Distrito Federal Paraiba 23,209 163 23,046Sergipe 20,089 305 19,784Ceara 18,061 471 17,590All Other 109,116 2,763 106,353Total 942,812 137,624 805,188
Minas Gerais Sao Paulo 45,554 512,736 - 467,182Parana 1,258 156,848 - 155,590Distrito Federal 9,691 191,197 - 182,226Rio de Janeiro 36,794 152,909 - 116,115Espiritu Santo 29,163 50,919 21,748Bahia 59,649 44,996 14,653Pernambuco 3,880 687 3,193Rio Grande do Norte 2,730 199 2,531All Other 22,130 164,735 - 142,605Total 210,849 1,275,938 -1,065,089
Source: T. Lynn Smith, Brazil: People and Institutions« Baton Rouge: Louisiana StateUniversity Press, 1963,
VO00

99Table 7. Proportion of the Population 10 Years of Age and Over Classi
fied as Able to Read and Write, by States, 1940 and 1950.
State Percentage Able to Read and Write
1940 1950
NortheastMaranhSb 27 25Piaui 27 26Cear^ 32 31Rio Grande do Norte 31 32Parafba 26 29Pernambuco 31 32Alagoas 23 24Sergipe 32 34Bahia 32 32
Central-EastMinas Gerais 43 44Espjfritu Santo 53 47Rio de Janeiro 54 56Distrito Federal 87 85Sab Paulo 65 65
Source: T. Lynn Smith, Brazil: People and Institutions,Baton Rouge: Louisiana State University Press, 1963, p. 492.

50,000
45,000
40,000
35,000
30,000
25,000
20,000
15,000
Per Capita Current Money C,10,000
Defeated ler Capita C.5,000 — Per Capita Cun ent Mcney Nil Deflated Per Capi ta NE
1947 1948 1949 1950 1951 1952 1951 T954 1955 1956 1957 1958 1959 I960Figure I . Growth in Regional Current Money and Deflated Per Capita Income in Cruzeiros, 1947-1960.
100

10,000
lontos de Reis9,000
8,000
7,000
6,000
Deflated Per C pita C.E5,000a pitaffurrent Money C.EPer C
4,000
3,000
2,000
1,000 Deflated Per Capit<i_NEa )ita Current Money IE
1935193419331928 1929 1930 1931 1932Figure 2. Growth in Regional Current Money and Deflated Per Capita Income in Contos de ReisContos ReisCapita IncomeDeflated Per in
1928-1936.
101

30,000
Population25,000
20,000
Central-East
15,000
Northeast10,000
5,000
T96019301900Figure 3. Regional Population in Thousands.