regional transportation authority customer satisfaction study
TRANSCRIPT

55 Railroad Row White River Junction, Vermont 05001 TEL 802.295.4999 FAX 802.295.1006 www.rsginc.com
Regional Transportation Authority Customer Satisfaction
Study
RTA Regional Report
14 May 2012
Submitted by Resource Systems Group
in cooperation with MKC Associates,
cmQue, and AREA
RTA Customer Satisfaction Study: RTA Report Page 1
TABLE OF CONTENTS
1.0 EXECUTIVE SUMMARY ................................................................................ 3
2.0 SURVEY QUESTIONNAIRE DESIGN .................................................................. 4
3.0 SURVEY ADMINISTRATION ........................................................................... 8
4.0 DATA PROCESSING AND EXPANSION .............................................................. 9
4.1 Data Processing ........................................................................................................................................ 9
4.2 Data Expansion ......................................................................................................................................... 9
5.0 RESULTS ................................................................................................. 9
5.1 Demographics and Trip Details .............................................................................................................. 10
5.1.1 Demographics ................................................................................................................................... 10
5.1.2 Trip Characteristics ........................................................................................................................... 12
5.2 Regional Service ..................................................................................................................................... 14
5.2.1 Key Regional Drivers of Overall Regional Transit Satisfaction .......................................................... 16
5.3 Detailed Service Attributes..................................................................................................................... 19
5.3.1 Satisfaction with Detailed Service Attributes .................................................................................... 19
5.3.2 Key Drivers of Overall Customer Satisfaction ................................................................................... 27
5.4 Customer Loyalty .................................................................................................................................... 31
6.0 CONCLUSIONS ........................................................................................ 32

RTA Customer Satisfaction Study: RTA Report Page 2
LIST OF FIGURES
Figure 1: Customer Satisfaction Measurement Scale .................................................................................................... 4
Figure 2: Example Subset of Categories Rated on Metra Paper Survey ........................................................................ 5
Figure 3: Example Customer Loyalty Question on Metra Paper Survey ........................................................................ 5
Figure 4: Example Trip Detail and Demographic Questions on Pace Paper Survey....................................................... 6
Figure 5: Screenshot of Example Language Option Question from CTA Web-Based Survey ........................................ 6
Figure 6: Front Cover of Metra Paper Survey ................................................................................................................ 7
Figure 7: Screenshot of Example Attribute Satisfaction Rating Question in CTA Web-Based Survey ........................... 8
Figure 8: Age by Service Board .................................................................................................................................... 11
Figure 9: Household Income by Service Board ............................................................................................................ 11
Figure 10: County of Residence by Service Board ....................................................................................................... 12
Figure 11: Car Availability by Service Board ................................................................................................................ 12
Figure 12: Duration of Regular Ridership by Service Board ......................................................................................... 13
Figure 13: Ridership Frequency by Service Board ....................................................................................................... 13
Figure 14: Number of Transfers by Service Board ....................................................................................................... 14
Figure 15: Satisfaction with Regional Service Attributes ............................................................................................. 15
Figure 16: Derived Attribute Importance Coefficients for Overall Regional Service Satisfaction ............................... 16
Figure 17: Key Drivers of Regional Satisfaction Quadrant Chart ................................................................................. 18
Figure 18: Key Drivers of Regional Satisfaction Quadrant Chart by Service Board ..................................................... 19
Figure 19: Satisfaction with Travel Time and Reliability Attributes ............................................................................. 21
Figure 20: Satisfaction with Safety and Security Attributes ........................................................................................ 22
Figure 21: Satisfaction with Safety and Security Attributes by Regular Usage Duration ............................................ 22
Figure 22: Satisfaction with Information Attributes .................................................................................................... 23
Figure 23: Satisfaction with Communication Attributes .............................................................................................. 24
Figure 24: Satisfaction with Cleanliness Attributes ..................................................................................................... 24
Figure 25: Satisfaction with Employee Performance Attributes ................................................................................. 25
Figure 26: Satisfaction with Comfort Attributes .......................................................................................................... 25
Figure 27: Satisfaction with Overall Value and Satisfaction Attributes ....................................................................... 26
Figure 28: Satisfaction with Overall Value and Service Attributes by Regular Usage Duration .................................. 27
Figure 29: Satisfaction with Overall Value and Service Attributes by Frequency of Use............................................. 27
Figure 30: CTA Key Drivers of Overall Satisfaction Quadrant Chart ............................................................................ 29
Figure 31: Metra Key Drivers of Overall Satisfaction Quadrant Chart ......................................................................... 30
Figure 32: Pace Key Drivers of Overall Satisfaction Quadrant Chart ........................................................................... 31
Figure 33: Likelihood to Recommend Service ............................................................................................................. 32
LIST OF TABLES
Table 1: Survey Response Summary, Weighted and Un-Weighted by Service Board ................................................. 10
Table 2: Satisfaction with Travel Time and Reliability Attributes by County of Residence ......................................... 15
Table 3: Understanding a Quadrant Chart ................................................................................................................... 17
Table 4: Attribute Satisfaction Rankings by Service Board .......................................................................................... 20
RTA Customer Satisfaction Study: RTA Report Page 3
1.0 EXECUTIVE SUMMARY
In 2010, the Regional Transportation Authority (RTA) convened a Customer Satisfaction Survey (CSS) Task Force with representatives from Chicago Transit Authority (CTA), Metra, and Pace in order to construct a consistent set of customer satisfaction questions and sampling methods. The RTA aimed to collect customer satisfaction data to satisfy the State Legislature’s reporting requirements and to understand customer perceptions of service quality from a regional perspective, which had never been done before. To that end, a common set of eighteen service attributes to measure were agreed upon, and an additional set of seven attributes related to regional aspects of service (e.g., overall transit service in the region, ease of transfers between services). In 2011, the studies designed by the CSS Task Force were implemented by each Service Board.
This report summarizes the aggregated regional findings of the 2011 RTA Customer Satisfaction studies conducted on behalf of CTA, Metra, and Pace. The Pace study was conducted by PTV NuStats in the spring of 2011 and the CTA and Metra studies were conducted by Resource Systems Group, Inc. (RSG) in the fall and early winter of 2011. Each of the studies followed the methodologies and survey designs agreed upon during the previous phase of the project. The combined results of these studies will help to evaluate RTA system performance and to prioritize future service adjustments with regional mobility and accessibility in mind. This report contains the key findings from the three Service Boards’ survey efforts with particular emphasis on regional satisfaction levels.
A total of 32,317 weekday survey responses were collected for this regional analysis; riders were recruited onboard buses and trains and additionally via email lists from CTA and Pace (CTA and Pace weekend survey responses and Metra survey responses recruited from email lists will be analyzed separately). Following the completion of the data collection efforts, survey responses were cleaned and expanded (weighted) to reflect the total number of weekday boardings for each Service Board. This expansion process allows for analysis to be conducted at the regional level and ensures each Service Board is accurately represented relative to established ridership volumes.
An analysis of riders’ satisfaction with the common service measures, regional service measures, and their respective importance was conducted to identify areas where customers are most and least satisfied with services. These tabulations were also conducted across important subsets of customers, including Service Board used, auto availability, ridership frequency, and how long riders have been a customer. Additionally, key driver analyses were done for each Service Board to understand how the individual service attributes influenced a customer’s evaluation of overall satisfaction.
It should be noted that the Service Boards serve very different areas, trip types, and customers, and these differences must be considered when interpreting customer satisfaction results. CTA customers tend to be somewhat younger and have lower household incomes than those using other Service Boards; they are also less likely to have a car available for their trip and are more likely to live in the City of Chicago. Metra customers tend to be slightly older and have higher household incomes; the vast majority of riders have a car available for their trip and nearly half live in a Collar County. Pace customers tend to have somewhat lower household incomes, are the least likely to have a car available for their trip, and nearly half live in Suburban Cook.
Overall, customers are satisfied with the services provided, both at the regional level and Service Board level. The vast majority of riders (91%) would recommend using the services to others. In general, customers have the highest levels of satisfaction with attributes in the Safety and Employee
Performance categories and somewhat lower satisfaction with attributes in the Comfort and
RTA Customer Satisfaction Study: RTA Report Page 4
Cleanliness categories. Throughout the report, several possible areas for improvement have been detailed for each Service Board.
2.0 SURVEY QUESTIONNAIRE DESIGN
In 2010, RTA convened a Customer Satisfaction Survey (CSS) Task Force with representatives from CTA, Metra, and Pace in order to identify a consistent set of customer satisfaction questions and sampling methods. The CSS Task Force agreed upon a core set of eighteen common service attributes that each agency would measure and a set of seven regional aspects of service that would be measured (e.g., overall transit service in the region, ease of transfers between services). The CTA and Metra surveys contained an additional five attributes in common that were not relevant to Pace and thus not rated by Pace customers.
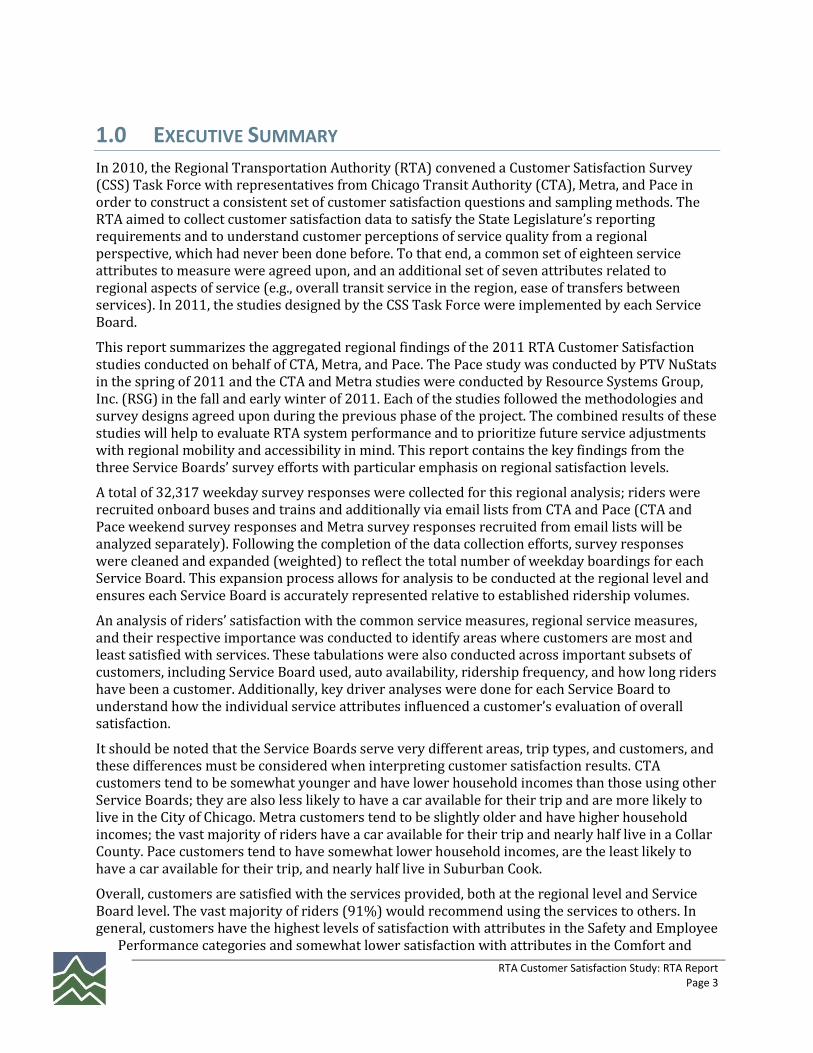
Additionally, the same measurement scale would be used across all three agencies (Figure 1). The scale would range from 1 to 10 with four groupings—very dissatisfied, dissatisfied, satisfied, and very satisfied—clearly delineated, along with a “not applicable” option. Prior to 2011, none of the three agencies used this scale in their customer satisfaction surveys and the scales in use were different between agencies. Therefore, the 2011 satisfaction data is not exactly comparable to satisfaction data collected in past years. However, it was necessary to make these changes in order to create a unified scale and consistent set of data that could be aggregated to a regional level to understand satisfaction from a regional perspective.
Figure 1: Customer Satisfaction Measurement Scale
Aside from the common attributes, each Service Board could add other attributes and customized questions for their unique services. The customer satisfaction survey questions were organized according to their respective service dimension, as illustrated in Figure 2. The common service dimensions included:
Travel Time and Reliability
Safety and Security
Information
Communications
Cleanliness
Employees’ Performance
Comfort
Overall Service
Regional Satisfaction

RTA Customer Satisfaction Study: RTA Regional Report Page 5
Figure 2: Example Subset of Categories Rated on Metra Paper Survey
Another common question for the three agencies was the inclusion of a question regarding how likely customers would be to recommend the Service Board to others (Figure 3).
Figure 3: Example Customer Loyalty Question on Metra Paper Survey
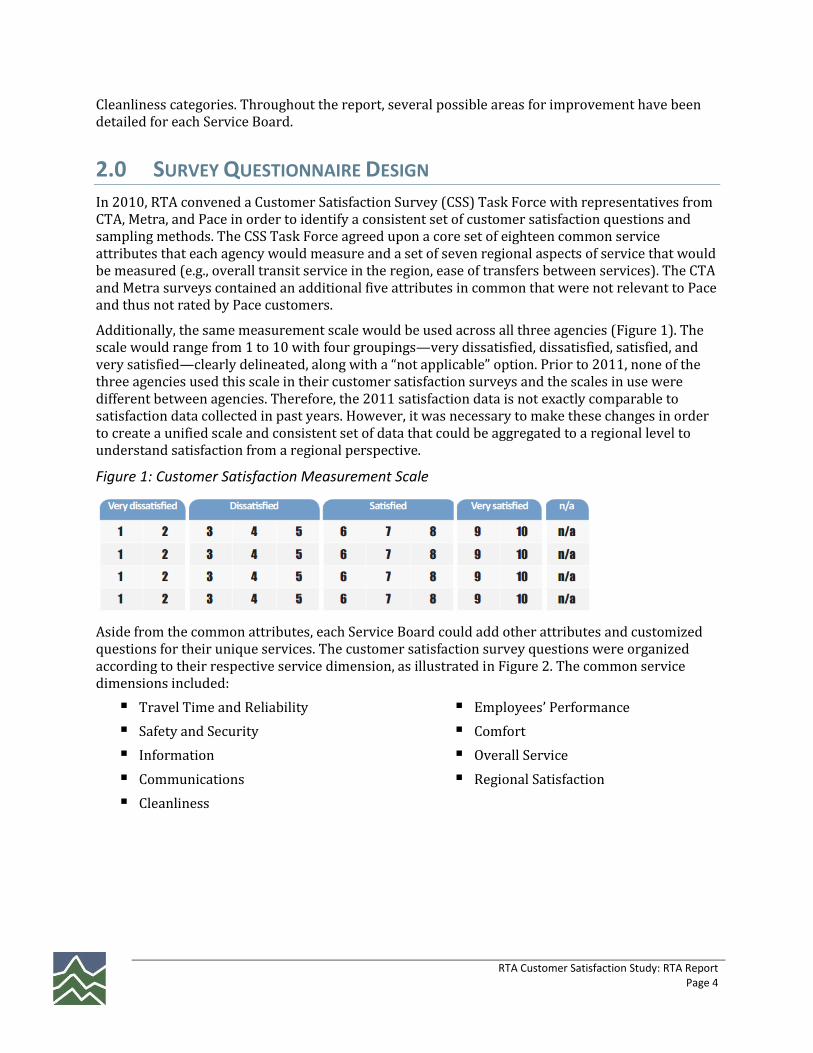
Additionally, the Service Boards collected details of customers’ trips, which were used to better understand customer satisfaction among various segments of their ridership (Figure 4). Finally, customers were asked to fill out some basic demographic information as well.
RTA Customer Satisfaction Study: RTA Regional Report Page 6
Figure 4: Example Trip Detail and Demographic Questions on Pace Paper Survey
The surveys were provided in several languages, customized to each Service Board’s customer base (Figure 5). The Metra survey was available in English and Spanish; the Pace survey was available in English, Spanish, and Polish; and the CTA survey was available in English, Spanish, Korean, Polish, and Chinese.
Figure 5: Screenshot of Example Language Option Question from CTA Web-Based Survey
Two versions of the questionnaire were designed: a paper-based version and a web-based version. The paper-based version served as the primary recruitment tool on-board buses and trains.

RTA Customer Satisfaction Study: RTA Regional Report Page 7
When customers completed the paper survey they could either return it to one of the surveyors on-board their train or mail it back, postage-paid. Alternatively, customers had the option to complete the survey online using a link and unique password provided on the cover of the paper survey (Figure 6). The unique password ensured that each customer could only take the survey once. Finally, CTA and Metra customers could also complete the survey over the phone by calling a toll-free number, but very few customers chose to use this option.
Figure 6: Front Cover of Metra Paper Survey
ME1294bq
The web-based surveys were designed to mirror the paper survey in order to obtain consistent responses between the two methods (Figure 7). For CTA and Metra, the web-based survey was programmed using RSG’s proprietary software which allows for survey customization for each respondent in order to improve the quality of the data being collected and reduce respondent burden and fatigue. The Pace survey used similar techniques and was programmed by PTV NuStats. Skip logic and customized question text were implemented in the surveys based on answers to previous questions. For example, customers who did not drive to access the transit service were not shown the follow-up questions asking about parking fees.

RTA Customer Satisfaction Study: RTA Regional Report Page 8
Figure 7: Screenshot of Example Attribute Satisfaction Rating Question in CTA Web-Based Survey
3.0 SURVEY ADMINISTRATION
The survey administration plans for all three Service Boards used similar methods to allow for merging and analysis of a regional dataset. The primary recruitment effort was conducted on-board buses and trains throughout the region to only sample riders currently using each system. Service Boards also conducted additional email, social media, customer newsletter, and website-based publicity efforts to complement the on-board data collection effort.
Metra’s on-board response rate was quite high (42%), due likely in part to riders making longer trips in which they had more time to fill out the survey. Metra also conducted a supplementary email and social media/website recruitment effort to provide all Metra customers an opportunity to respond to the survey. The dataset developed from the supplementary recruitment will be analyzed separately to determine if there is consistency between the two samples; only those recruited on-board Metra trains are included in the analyses that follow.
CTA and Pace’s response rates on-board were lower than Metra’s (20% for CTA, 23% for Pace) and thus it was necessary to also include the data from customers recruited via their email lists in the analyses in this report. CTA and Pace likely had a lower response rate due to the fact that trips are shorter and on some routes/lines the conditions can be more crowded, making it difficult to fill out a survey. CTA’s supplementary recruitment effort involved emailing invitations to Chicago Card Plus customers who previously signed up to participate in CTA Market Research studies. The CTA dataset was then carefully weighted by fare type and route/line to ensure the Chicago Card Plus riders were not over-represented. Pace also supplemented its sample via rider email lists and promoted the survey on their website and social media sites; the dataset was weighted to bus route

RTA Customer Satisfaction Study: RTA Regional Report Page 9
division to ensure the sample accurately reflected Pace customers.
For each Service Board, a set of survey completion quotas was established to obtain sufficient sample sizes for all service segments of interest. For CTA, minimum sample sizes were set by bus route group or train line, time period, and day of week (weekend v. weekday); surveying was conducted throughout the day. For Metra, targets were roughly proportional to ridership by line, time period, and direction; surveying was only conducted during the morning for both peak and off-peak because ridership is primarily bi-directional commuting. Pace targets were roughly proportional to ridership by service division and surveys were conducted throughout the day.
Pace and CTA included surveys of their weekend customers for their Service Board-specific analyses. For this surveying effort, Metra focused on the weekday commuter to ensure they could achieve adequate sampling of each line by peak and midday periods. In order to allow for comparisons at the regional level, only weekday riders have been included in this regional analysis (32,317 surveys).
Further details on the survey administration and sampling plans can be found in each Service Board’s individual report.
4.0 DATA PROCESSING AND EXPANSION
4.1 Data Processing
The datasets from each of the three Service Boards were merged into one dataset for the regional analysis. The merged data set included variables for all common satisfaction attributes and a portion of trip characteristics and demographic questions. Unique questions in each Service Board’s survey were not included in the regional dataset.
As mentioned, weekend surveys were removed from the dataset for analysis because Metra did not have a weekend sample from on-board surveying.
4.2 Data Expansion
Data were expanded (weighted) to match average weekday boardings for each Service Board; this expansion will allow for a regional analysis to be conducted that represents all weekday riders in the region proportional to actual ridership. Each Service Board had a slightly different expansion approach:
Pace: expanded to weekday boardings by service division
Metra: expanded to weekday boardings by line, direction, and time period
CTA: expanded to weekday boardings by bus route group/train line and fare payment
method
The resulting weighted survey counts can be found in Table 1. Further details on the expansion schemes can be found in each Service Board’s individual report.
5.0 RESULTS
This section includes the findings of the combined CTA, Metra, and Pace weekday customer surveys and is divided into three sub-sections: Demographics and Trip Details, Regional Service, and

RTA Customer Satisfaction Study: RTA Regional Report Page 10
Detailed Service Attributes. This section highlights the important and substantive details of the regional survey results. All tabulations in this section were conducted on the weighted regional dataset. Further detail about specific Service Boards are presented in each individual Service Board report.
5.1 Demographics and Trip Details
A total of 32,317 surveys were completed by weekday bus and train passengers of CTA, Metra, and Pace and prepared for analysis. Data from paratransit and vanpool passengers were not available for analysis in this report. The final sample of riders was expanded to reflect weekday ridership for each Service Board so final analysis reflected a typical weekday of transit activity in RTA’s six-county region. Table 1 shows the expanded distribution of unlinked trips across each Service Board. Also reported are un-weighted counts which represent the number of surveys filled out by respondents on paper, by telephone, or online. The final column shows the margin of error for each Service Board’s weighted dataset at the 95% confidence level. When the data sets are merged, there is an overall margin of error of +/-0.6% at the 95% confidence level.
Table 1: Survey Response Summary, Weighted and Un-Weighted by Service Board
Service Board Weighted
Count Weighted Percent
Un-weighted Count
Un-weighted Percent
Margin of Error
(95% conf level)
CTA 1,762,513 81% 12,042 37% +/- 0.9%
Metra 325,266 15% 11,698 36% +/- 0.9%
Pace 100,475 5% 8,577 27% +/- 1.0%
Total 2,188,253 100% 32,317 100% +/- 0.6%
Note: the numbers may not sum to 100% due to rounding.
5.1.1 Demographics
Respondents were roughly evenly split by gender, with 54% female and 46% male. Overall, RTA’s ridership is distributed across age groups, with Metra customers being somewhat older than CTA and Pace customers (Figure 8). The median age falls in the 35-44 year old category overall and for CTA and Pace; the median age of Metra customers falls in the 45-54 year old category.

RTA Customer Satisfaction Study: RTA Regional Report Page 11
Figure 8: Age by Service Board
2% 3% 4%
14% 16%8%
15%
26% 28%
17%
19%
18%17%
21%
21%
18% 17%
27%
21%
14% 13% 21%15%
7% 8% 6% 6%
0%
10%
20%
30%
40%
50%
60%
70%
80%
90%
100%
Overall CTA Metra Pace
Age by Service Board
65 or older
55-64
45-54
35-44
25-34
18-24
Under 18
Figure 9 shows household income of all respondents. Over 20% of respondents indicated they come from a household earning more than $100,000, while a similar number of respondents come from a household earning under $15,000 per year, demonstrating RTA’s wide range of services and customers throughout the region. Metra customers tend to have higher household income levels than the other Service Boards’ customers, while Pace customers tend to have comparatively lower incomes.
Figure 9: Household Income by Service Board
19% 21%
3%
26%
9% 9%
3%
17%14%15%
5%
18%15%
15%
12%
17%
10%10%
11%
9%
11%10%
17%
6%22% 19%
50%
7%
0%
10%
20%
30%
40%
50%
60%
70%
80%
90%
100%
Overall CTA Metra Pace
Household Income by Service Board
$100,000 or more
$75,000 - $99,999
$60,000 - $74,999
$40,000 – $59,999
$25,000 - $39,999
$15,000 - $24,999
Less than $15,000
Figure 10 shows the percentage of respondents that reside in the City of Chicago, Suburban Cook County (all cities except Chicago), and the five Collar Counties within RTA’s service area. The majority of respondents live in Cook County, which is consistent with the fact that Cook County is the most populous county in the Chicago area. Most CTA riders live in Chicago, while Pace riders are more likely to live in Suburban Cook County and Metra riders in the five Collar Counties.

RTA Customer Satisfaction Study: RTA Regional Report Page 12
Figure 10: County of Residence by Service Board
73%84%
18%29%
17%
13%
36%
45%
10%3%
46%
26%
0%
25%
50%
75%
100%
Overall CTA Metra Pace
County of Residence by Service Board
Collar Counties
Suburban Cook
City of Chicago
5.1.2 Trip Characteristics
Half of all riders indicated they have a car available to use, meaning that many customers of RTA’s Service Boards ride because they chose to and not because they have to (Figure 11). However, Metra riders were considerably more likely to report they could use a car for the trip they were on than were CTA and Pace riders.
Figure 11: Car Availability by Service Board
50%
45%
84%
40%
Overall
CTA
Metra
Pace
Percent with Car Available for Trip by Service Board
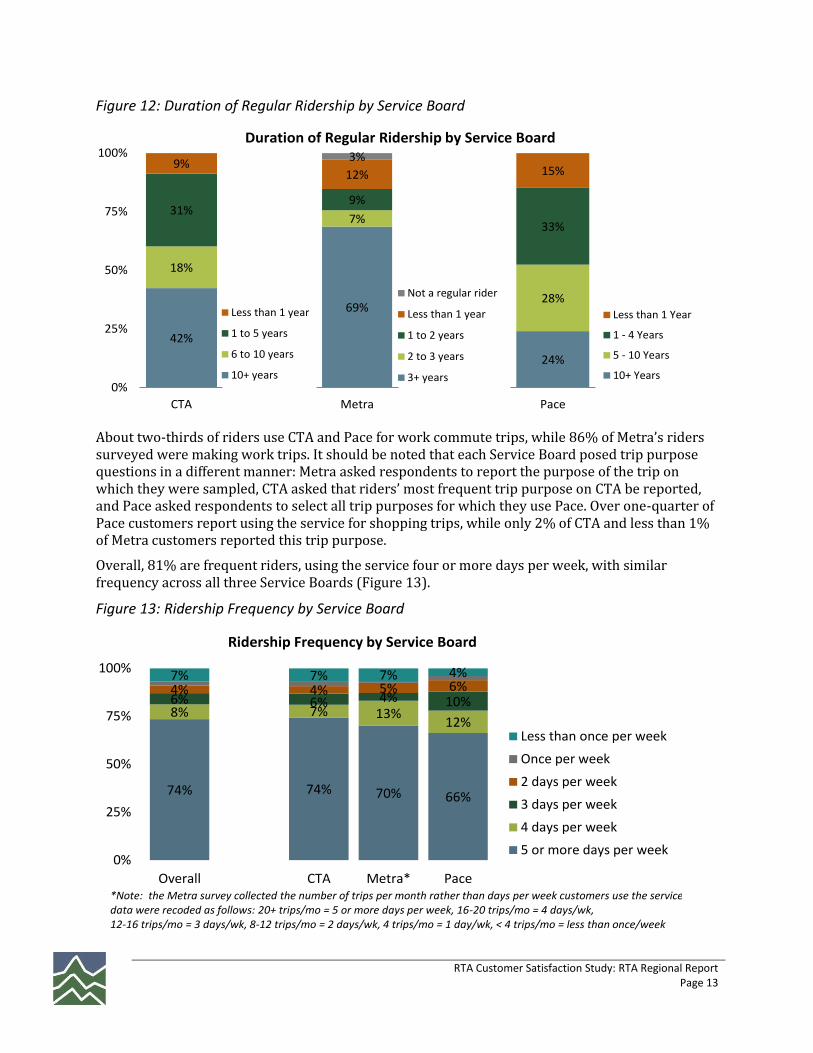
The vast majority of riders (91%) have been regular transit riders for more than one year, with CTA having the highest percentage of customers that used the services more than one year (91%) and Pace the lower percentage (85%). Forty-percent of CTA customers and 24% of Pace customers have been riders for over ten years; 69% of Metra customers have been riders for over three years (Figure 12). It is important to note that this question was not a common question, thus the categories of ridership duration were not the same.
RTA Customer Satisfaction Study: RTA Regional Report Page 13
Figure 12: Duration of Regular Ridership by Service Board
42%
18%
31%
9%
0%
25%
50%
75%
100%
CTA
Less than 1 year
1 to 5 years
6 to 10 years
10+ years
69%
7%
9%
12%
3%
Metra
Not a regular rider
Less than 1 year
1 to 2 years
2 to 3 years
3+ years
24%
28%
33%
15%
Pace
Less than 1 Year
1 - 4 Years
5 - 10 Years
10+ Years
Duration of Regular Ridership by Service Board
About two-thirds of riders use CTA and Pace for work commute trips, while 86% of Metra’s riders surveyed were making work trips. It should be noted that each Service Board posed trip purpose questions in a different manner: Metra asked respondents to report the purpose of the trip on which they were sampled, CTA asked that riders’ most frequent trip purpose on CTA be reported, and Pace asked respondents to select all trip purposes for which they use Pace. Over one-quarter of Pace customers report using the service for shopping trips, while only 2% of CTA and less than 1% of Metra customers reported this trip purpose.
Overall, 81% are frequent riders, using the service four or more days per week, with similar frequency across all three Service Boards (Figure 13).
Figure 13: Ridership Frequency by Service Board
74% 74% 70% 66%
8% 7% 13%12%
6% 6% 4% 10%4% 4% 5% 6%7% 7% 7% 4%
0%
25%
50%
75%
100%
Overall CTA Metra* Pace
Ridership Frequency by Service Board
Less than once per week
Once per week
2 days per week
3 days per week
4 days per week
5 or more days per week
*Note: the Metra survey collected the number of trips per month rather than days per week customers use the service, and Metra data were recoded as follows: 20+ trips/mo = 5 or more days per week, 16-20 trips/mo = 4 days/wk, 12-16 trips/mo = 3 days/wk, 8-12 trips/mo = 2 days/wk, 4 trips/mo = 1 day/wk, < 4 trips/mo = less than once/week

RTA Customer Satisfaction Study: RTA Regional Report Page 14
Figure 14 shows the number of transfers made for each Service Board. Metra customers are much less likely to transfer for their trip (17% of riders), while Pace and CTA have similar numbers of customers needing to make a transfer (50% of riders). Additionally, there are some differences between the Service Boards in terms of whether customers make trips using multiple Service Boards; 16% of Metra customers transfer to CTA and/or Pace on their trip, while 32% of Pace customers transfer to CTA and/or Metra. For CTA, 50% of customers make at least one transfer in their journey. The CTA survey did not ask customers to distinguish between transfers made within CTA services or to Pace and Metra; therefore, the proportion that transfers to another Service Board is unknown.
Figure 14: Number of Transfers by Service Board
50% 50% 50%
83%
36% 38%27%
16%11% 10%17%
1%3% 2% 7%
0%
25%
50%
75%
100%
Overall CTA Pace Metra
Number of Transfers by Service Board
3 or More
2
1
No transfer
The above analysis of demographics and trip characteristics suggests that the populations who use transit in Chicago and the types of service utilized by these riders vary widely by Service Board and these differences should be kept in mind when interpreting the customer satisfaction results described in the sections that follow.
5.2 Regional Service
A key piece of the RTA Customer Satisfaction project was to measure satisfaction with regional aspects of transit service to gain a better understanding of how well transit service is serving the six counties. This section of the report details customer satisfaction with these regional attributes.
Figure 15 shows satisfaction with attributes belonging to the Regional Service category. Overall, 79% of customers were satisfied with transit service in the six-county region. The satisfaction percentages are similar between all attributes in this service dimension, and all have relatively high satisfaction rates. Coordination of schedules among Metra, CTA, and Pace when transferring and availability of parking were rated slightly less positively than the other attributes.
It should be noted that attributes concerning transferring and coordination between Service Boards are likely more relevant to those actually making a transfer between services on their trip. On average, nearly half (49%) of Metra customers report that these attributes are “not applicable” to them, while 23% of CTA customers report the attributes are “not applicable” and only 6% of Pace customers did so. Of those who felt these attributes were applicable to them, Pace customers tend to be more satisfied with regional service (eleven percentage points higher than average), particularly when it comes to inter-agency coordination. CTA and Metra customers are similarly satisfied, though Metra customers are less satisfied with the signs directing customers to other

RTA Customer Satisfaction Study: RTA Regional Report Page 15
services when transferring (five percentage points lower than average). However, it should be noted that 51% of Metra customers did not feel the signage directing customers to other services was applicable to their trip; meanwhile, 27% of CTA respondents felt it was not applicable.
Figure 15: Satisfaction with Regional Service Attributes
Customers residing throughout the six-county region have generally similar levels of satisfaction with the regional services being provided. Table 2 below provides a breakdown of results by the City of Chicago, Suburban Cook County, and the Collar Counties.
Table 2: Satisfaction with Travel Time and Reliability Attributes by County of Residence % Satisfied Overall City of
Chicago Suburban
Cook Collar
Counties
Availability of public transportation throughout the six-county Chicago region when and where you need to travel
77% 78%↑ 77% 73%↓
Ease of transferring to other transit services 79% 79%↑ 77%↓ 77%↓
Coordination of schedules among Metra, CTA, and Pace for transfers 70% 70% 69% 69%
Ease of paying for transfers 76% 75%↓ 78%↑ 80%↑
The signs directing you to other Service Boards when transferring 75% 76%↑ 73% 69%↓
Availability of parking when taking public transportation 68% 67% 68% 70%↑
Overall Public Transportation in the Six County Chicago Region 79% 79% 80% 77%↓
↑↓ indicates statistically significant difference from the average for an attribute at the 95% confidence level

RTA Customer Satisfaction Study: RTA Regional Report Page 16
5.2.1 Key Regional Drivers of Overall Regional Transit Satisfaction
To obtain a clear picture of the key drivers of regional satisfaction, a derived importance analysis was conducted. Derived importance measures are arrived at through statistically testing the influence a collection of attributes have on overall satisfaction. Derived importance can help provide further understanding of the underlying factors driving overall customer satisfaction that a respondent may not explicitly state.
For this analysis, individual aspects of regional service were modeled as predictors that influence overall satisfaction with regional transit services. A multiple regression model was used to estimate the derived importance coefficients, with larger coefficients having a greater influence on regional satisfaction. The final regression coefficients are charted in Figure 16. The horizontal axis displays the coefficient values for each attribute’s impact on overall regional satisfaction. The model showed strong explanatory power with an adjusted R2 of .75, reasonably high for this type of transit service research.
The key driver of customer satisfaction with overall regional service is simply the availability of transit service when and where customers want to travel. The remaining five regional attributes have significantly lower coefficients indicating lower levels of importance. Availability of parking and coordination of schedules came out as the second and third rated drivers of regional customer satisfaction.
Figure 16: Derived Attribute Importance Coefficients for Overall Regional Service Satisfaction
Figure 17 is a quadrant chart showing regional customer satisfaction and derived customer importance for the set of seven regional attributes. Quadrant charts are a useful way to visualize service priorities by placing customer satisfaction into context with overall importance. The vertical (Y) axis represents the derived importance of the service attributes. Derived importance increases

RTA Customer Satisfaction Study: RTA Regional Report Page 17
from the bottom of the chart to the top. The horizontal (X) axis represents the portion of respondents who indicated they were satisfied with each service attribute.
The chart can be interpreted by noting the values in the four corners, each marking a single quadrant bounded by the average importance and satisfaction lines. Table 3 summarizes how the quadrant chart is interpreted.
Table 3: Understanding a Quadrant Chart Quadrant Location Satisfaction Level Importance Action
1 Top left Relatively low Relatively high Attributes for improvement
2 Top right Relatively high Relatively high Attributes to maintain
3 Bottom left Relatively low Relatively low Attributes to monitor
4 Bottom right Relatively high Relatively low Attributes with no immediate action
The first quadrant of Figure 17 indicates areas that need improvement because customers rate the attributes as highly important, but give lower scores on satisfaction. In the overall regional results, only one attribute came in the first quadrant, the availability of parking, though it should be noted that Pace customers did not rate this attribute. In the second quadrant, where customers rate attributes as both high in importance and high in satisfaction, RTA service ranked well in the availability of transit in the six-county region. This is an important area to maintain. In the third quadrant, customers expressed both low importance and low satisfaction regarding coordination of schedules among service boards. This quadrant represents an area to monitor and try to improve in satisfaction, but it does not need the priority of the more important rated measures. The fourth quadrant represents attributes that have a high satisfaction level, but which customers consider less important. Signs directing customers to other Service Boards, ease of transferring, and ease of paying for transfers scored well in this quadrant.
RTA Customer Satisfaction Study: RTA Regional Report Page 18
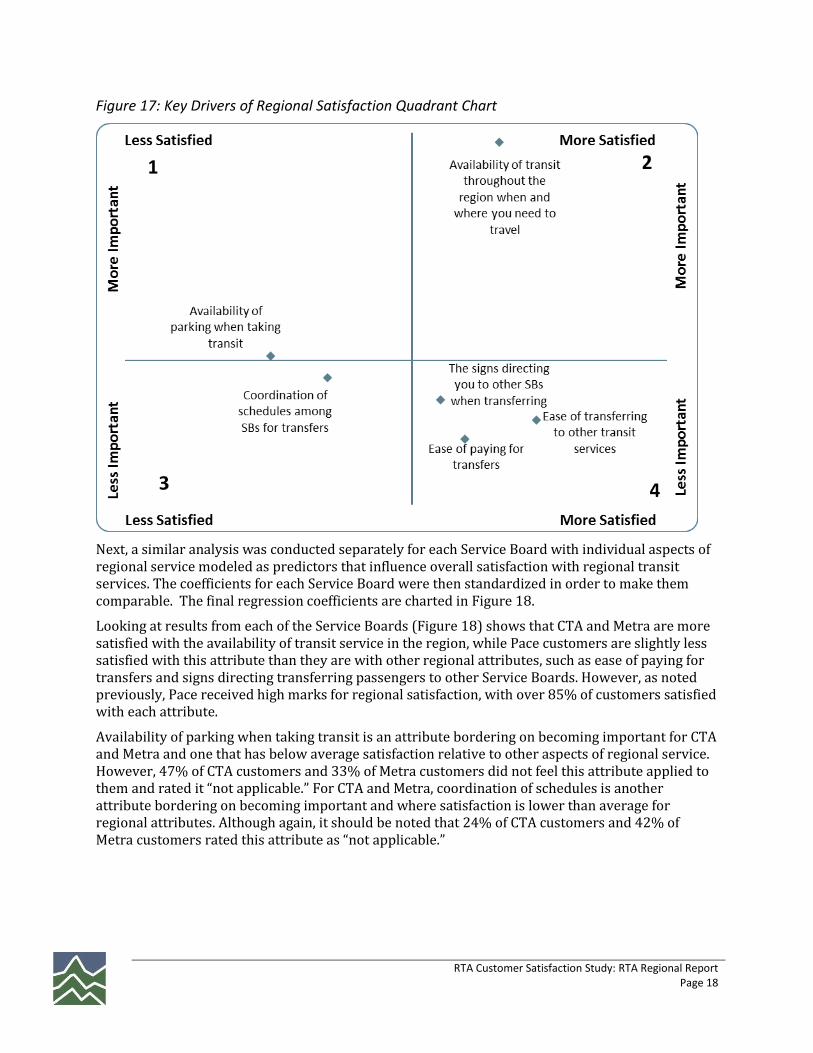
Figure 17: Key Drivers of Regional Satisfaction Quadrant Chart
Next, a similar analysis was conducted separately for each Service Board with individual aspects of regional service modeled as predictors that influence overall satisfaction with regional transit services. The coefficients for each Service Board were then standardized in order to make them comparable. The final regression coefficients are charted in Figure 18.
Looking at results from each of the Service Boards (Figure 18) shows that CTA and Metra are more satisfied with the availability of transit service in the region, while Pace customers are slightly less satisfied with this attribute than they are with other regional attributes, such as ease of paying for transfers and signs directing transferring passengers to other Service Boards. However, as noted previously, Pace received high marks for regional satisfaction, with over 85% of customers satisfied with each attribute.
Availability of parking when taking transit is an attribute bordering on becoming important for CTA and Metra and one that has below average satisfaction relative to other aspects of regional service. However, 47% of CTA customers and 33% of Metra customers did not feel this attribute applied to them and rated it “not applicable.” For CTA and Metra, coordination of schedules is another attribute bordering on becoming important and where satisfaction is lower than average for regional attributes. Although again, it should be noted that 24% of CTA customers and 42% of Metra customers rated this attribute as “not applicable.”

RTA Customer Satisfaction Study: RTA Regional Report Page 19
Figure 18: Key Drivers of Regional Satisfaction Quadrant Chart by Service Board
5.3 Detailed Service Attributes
In addition to rating satisfaction with regional service attributes, customers of each Service Board were also asked to rate a series of more detailed service attributes. For these attributes, customers focused on rating the Service Board for which they received the survey. The following section provides the results for customer satisfaction with each of these attributes and details which of the attributes are key drivers of overall satisfaction with service.
5.3.1 Satisfaction with Detailed Service Attributes
Table 4 shows the overall satisfaction regionally and the relative ranking of the highest and lowest ranked attributes ranked in terms of satisfaction within each Service Board. The rankings are relative to only the other common attributes rated; Service Board-specific attributes are not included in this ranking. In other words, the common attribute that riders were most satisfied with for a Service Board will receive a ranking of one, while the attribute riders were least satisfied with would receive a ranking of twenty-three for the overall, CTA, and Metra rankings and an eighteen for Pace. CTA and Metra had an additional five attributes in common that were not relevant to Pace and thus not rated by Pace customers. Reviewing how attributes ranked relative to other attributes within a Service Board allows for a comparison between the Service Boards while understanding that absolute percentages may be different between them due to the different nature of services offered and the populations who are served.

RTA Customer Satisfaction Study: RTA Regional Report Page 20
In general, there is some consistency in the top five attributes between the Service Boards, with how safely the vehicle is operated ranking in the top five for all Service Boards and availability of information on the websites, availability of schedule/route information, and on-board personnel knowledge all ranking in the top five for two of the three Service Boards.
Additionally, the attributes receiving the lowest satisfaction scores are also somewhat consistent between Service Boards, with comfort at the station/stop and the number of non-rush hour trains/buses both ranking in the bottom five of the common attributes for all Service Boards.
Metra and Pace customers give higher satisfaction scores (relative to other common attributes) to safety than CTA customers do; however, at least 70% of customers for all Service Boards are satisfied with safety attributes. Pace receives lower than its average satisfaction score for getting to the destination on time; however, 80% of customers of each Service Board are satisfied with this attribute. Availability of seating on-board is ranked lower than other attributes for CTA than it is for Metra and Pace, where it ranks towards the middle of all attributes rated.
Table 4: Attribute Satisfaction Rankings by Service Board Service Dimension Attribute
Regional % Satisfied
Regional Rank
CTA Rank
Metra Rank
Pace Rank
Travel Time and Reliability
Getting to destination on time 81% Bottom 5
The number of scheduled trains/buses in rush-hour 72% Bottom 5
The number of scheduled trains/buses in non-rush-hour 60% Bottom 5 Bottom 5 Bottom 5 Bottom 5
Total travel time for your trip 76%
Safety and Security
How safely the train/bus is operated 88% Top 5 Top 5 Top 5 Top 5
Personal safety on train/bus 80% Top 5 Top 5
Personal safety at boarding station/stop 76% Top 5
Information
Availability of schedule and route information 86% Top 5 Top 5 Top 5
Availability of service information at SB’s website 89% Top 5 Top 5 Top 5
Notification of service changes 75% Bottom 5 Bottom 5
Clarity of signage at station/stop 84% Top 5
Commun-ication
On-board announcements of stations/stops while riding 84% Top 5 Top 5
On-board communications during service delays 74% Bottom 5
Announcements regarding delays at station/stop 68% Bottom 5 Bottom 5
Cleanliness Cleanliness of train/bus interior 68% Bottom 5 Bottom 5
Cleanliness of station/stop 72% Bottom 5
Employee Performance
On-board personnel courtesy 82%
Station personnel courtesy at station/stop 82%
On-board personnel knowledge of system to assist passengers
85% Top 5 Top 5 Top 5
Station/stop personnel knowledge of system to assist passengers at station/stop
84%
Comfort
Availability of seats on train/bus 68% Bottom 5 Bottom 5
Comfortable temperature of train/bus 81% Top 5
Comfort while waiting at a station/stop 60% Bottom 5 Bottom 5 Bottom 5 Bottom 5
Top 5 Ranked Attributes
Bottom 5 Ranked Attributes

RTA Customer Satisfaction Study: RTA Regional Report Page 21
5.3.1.1 Travel Time and Reliability
Figure 19 summarizes the levels of satisfaction with attributes belonging to the Travel Time and Reliability service dimension. Satisfaction rates in this dimension tend to be critical to the overall opinion riders have with transit service. Riders are satisfied with their ability in getting to their destination on time with 81% reporting that they are satisfied, but customers are less satisfied with bus and train scheduling during both peak and off-peak periods. Satisfaction with the number of off-peak trains/buses scheduled is the second lowest rated attribute across all attributes tested, although nearly two-thirds of customers are satisfied.
Figure 19: Satisfaction with Travel Time and Reliability Attributes
Getting to a destination on time and total travel time are top drivers of overall customer satisfaction for all three Service Boards and thus should be an important attribute to maintain and even improve (see Section 5.3.2 Key Drivers of Overall Customer Satisfaction for details on the key drivers of overall satisfaction). CTA and Metra have above average satisfaction levels for getting to the destination on time, while Pace is somewhat below average compared to other attributes. Meanwhile, CTA and Pace have above average satisfaction levels for total travel time and Metra has somewhat below average levels of satisfaction. This result is most likely related to Metra’s longer average trip length compared to shorter trip lengths on CTA and Pace. However, it should be noted that satisfaction with both of these attributes is high, with at least three quarters of each Service Board’s customers satisfied.
The number of buses/trains scheduled in both peak and off-peak received lower satisfaction ratings than the other measures. For each of the Service Boards, service frequency in peak periods was considered more important than in the off-peak. For CTA neither the service in peak or off-peak was found to be a key driver of overall satisfaction, while for Metra peak service was weighted at the average level of importance, and for Pace, peak service was a key driver of overall satisfaction.
Frequent customers (those riding at least 4 days per week) are generally less satisfied with Travel Time and Reliability, likely because they simply have a greater probability of encountering problems or service delays. Not surprisingly, customers who had a car available to make the trip they are on were more likely to be satisfied with these attributes. This is likely due to the fact that they choose to ride transit and if they were not satisfied with these attributes they may choose to

RTA Customer Satisfaction Study: RTA Regional Report Page 22
drive instead; it could also be because they have the first-hand experience with driving for this trip and have experienced traffic congestion and recognize transit may be more reliable in getting them to their destination on time.
5.3.1.2 Safety and Security
Figure 20 illustrates customer satisfaction with the Safety and Security service dimension. Customers are very satisfied with how safely the transit vehicle is operated, with nearly 90% satisfied overall. This is an important driver of satisfaction for all Service Boards and also one of the attributes customers are most satisfied with. Satisfaction with personal safety on-board and at station-stops is also high with about 80% of customers satisfied.
Figure 20: Satisfaction with Safety and Security Attributes
Figure 21 indicates customer satisfaction for safety-related attributes according to the length of time the respondent has been a regular customer. Customers who have been regular riders for longer than one year are less likely to be satisfied with Safety and Security, potentially reflecting that personal experiences on some transit routes or vehicles may diminish some individuals’ perception of safety.
Figure 21: Satisfaction with Safety and Security Attributes by Regular Usage Duration
5.3.1.3 Information
Figure 22 reports total customer satisfaction with the Information service dimension. Satisfaction rates for all Information attributes are high, but customers are less satisfied with the notification of

RTA Customer Satisfaction Study: RTA Regional Report Page 23
service changes relative to the other Information attributes. These attributes tend to be important to Pace customers and are areas in which satisfaction is somewhat lower than average for the availability of schedule/route information and notification of service changes. However, it should be noted that satisfaction is high for this attribute, with all Service Boards receiving a rating of over 80%.
Figure 22: Satisfaction with Information Attributes
Respondents were more likely to be satisfied with the notification of service changes, as well as the other information attributes, if they have been regular passengers for less than one year. This likely reflects that these customers have experienced fewer problems with the service since they have been riding it for a shorter time.
5.3.1.4 Communication
Figure 23 illustrates total customer satisfaction with attributes that relate to the Communication service category. Overall, customers are highly satisfied with the regular onboard announcements of stations/stops, but are less satisfied with communications relating to delays. Three-quarters of customers are satisfied with on-board communications during service delays, and just over two-thirds of customers are satisfied with announcements regarding delays at the station or stop.

RTA Customer Satisfaction Study: RTA Regional Report Page 24
Figure 23: Satisfaction with Communication Attributes
5.3.1.5 Cleanliness
Figure 24 displays total customer satisfaction with the Cleanliness service dimension. These attributes tended to be among the lower rated attributes in comparison to other service dimensions on a regional basis. Cleanliness on-board trains/buses is a key driver of satisfaction that performs below average for CTA and to a lesser extent for Metra. Pace customers rated cleanliness of bus interior as above average in both importance and level of satisfaction. Metra customers rated the cleanliness of both the boarding and destination stations they used; however, since results were very similar between the two, these attributes were combined for the regional analysis. Metra customers are very satisfied with station cleanliness relative to other attributes (both boarding and destination stations have a satisfaction level of 88%), while CTA performs below average and this attribute is a key driver of satisfaction for CTA customers.
Figure 24: Satisfaction with Cleanliness Attributes
5.3.1.6 Employee Performance
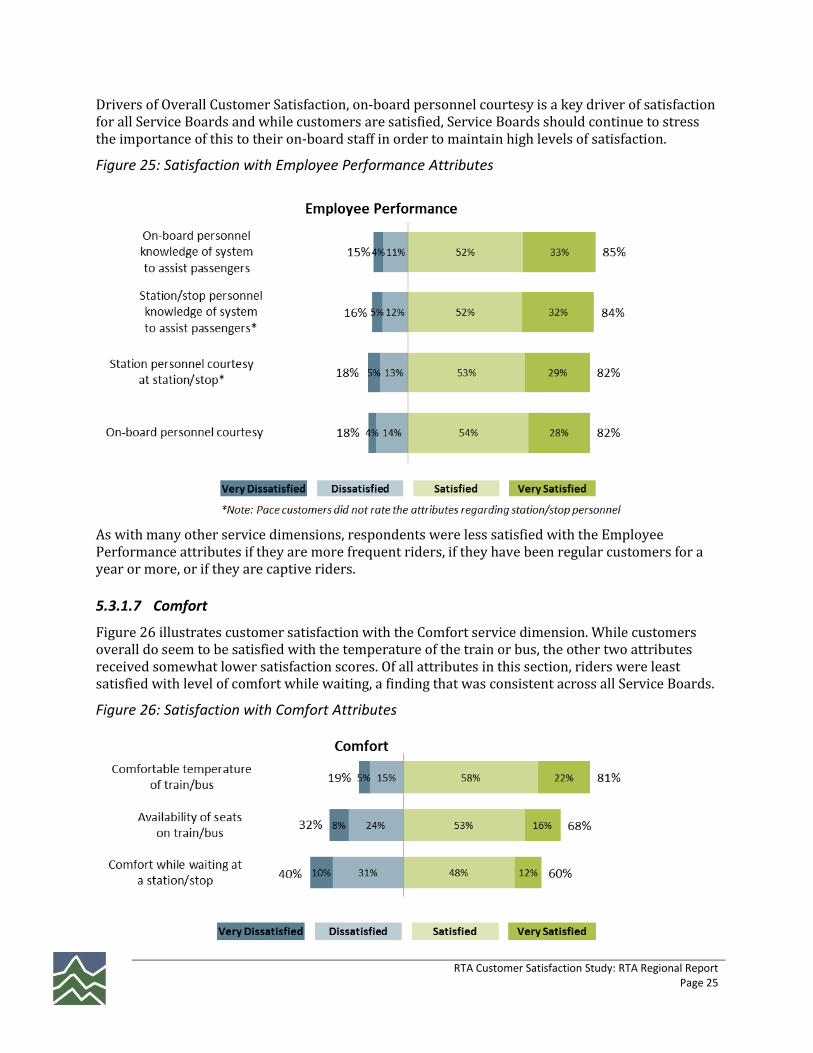
Figure 25 summarizes the satisfaction respondents had with the attributes belonging to the Employee Performance service dimension. The results are fairly constant among each attribute, with each one receiving a high satisfaction rate. They show that both on-board and station personnel are knowledgeable and courteous for RTA’s Service Boards. Approximately 12-18% of customers rated employee performance at stations/stops as “not applicable” to them, likely because they do not interact with staff at stations/stops. As noted below, in Section 5.3.2 Key
RTA Customer Satisfaction Study: RTA Regional Report Page 25
Drivers of Overall Customer Satisfaction, on-board personnel courtesy is a key driver of satisfaction for all Service Boards and while customers are satisfied, Service Boards should continue to stress the importance of this to their on-board staff in order to maintain high levels of satisfaction.
Figure 25: Satisfaction with Employee Performance Attributes
As with many other service dimensions, respondents were less satisfied with the Employee Performance attributes if they are more frequent riders, if they have been regular customers for a year or more, or if they are captive riders.
5.3.1.7 Comfort
Figure 26 illustrates customer satisfaction with the Comfort service dimension. While customers overall do seem to be satisfied with the temperature of the train or bus, the other two attributes received somewhat lower satisfaction scores. Of all attributes in this section, riders were least satisfied with level of comfort while waiting, a finding that was consistent across all Service Boards.
Figure 26: Satisfaction with Comfort Attributes

RTA Customer Satisfaction Study: RTA Regional Report Page 26
Seating availability, a key driver of customer satisfaction for CTA, is ranked below average relative to other attributes (see Section 5.3.2 Key Drivers of Overall Customer Satisfaction for details of key drivers of overall satisfaction). Additionally, on-board temperature was a key driver of satisfaction for Metra and Pace; Metra customers had slightly lower levels of satisfaction for on-board temperature and Pace had above average levels of satisfaction. At least 80% of each Service Board’s customers were satisfied with on-board temperature.
As with some other service dimensions, frequent riders, passengers that have been regular customers for a year or longer, and those who do not have a car available were less satisfied with attributes belonging to the Comfort service dimension.
5.3.1.8 Overall Value and Satisfaction
Finally, respondents were asked to rate their satisfaction with the transit service overall for the Service Board they were surveyed on and with the value of service for the fare paid. In total, 83% of customers are satisfied with the overall service and 77% are satisfied with the value for the fare paid (Figure 27). All Service Boards received an overall satisfaction rating of over 80%. It should be kept in mind that the survey was conducted prior to Metra’s fare increase in February of 2012.
Figure 27: Satisfaction with Overall Value and Satisfaction Attributes
Comparing Overall Value and Satisfaction to ridership frequency and how long respondents have been a customer yield similar results to many of the other service dimensions. Customers are less likely to be satisfied with the Overall attributes if they have been a regular customer for a year or more. Figure 28 shows the Overall Value and Satisfaction attributes compared with the respondents’ duration of regular usage. There is a considerable difference between the overall satisfaction of those who have been riding for less than a year and those who have been riding for longer, with those riding for a shorter time recording higher satisfaction levels.

RTA Customer Satisfaction Study: RTA Regional Report Page 27
Figure 28: Satisfaction with Overall Value and Service Attributes by Regular Usage Duration
Frequent riders tend to have lower levels of satisfaction with both overall service and value (Figure 29). Satisfaction is highest among those traveling 2-3 days a week and lowest among those traveling 5 or more days per week.
Also similar to other service dimensions, respondents were more likely to be satisfied with Overall Value if they have a car available.
Figure 29: Satisfaction with Overall Value and Service Attributes by Frequency of Use
5.3.2 Key Drivers of Overall Customer Satisfaction
In order to obtain a picture of the key drivers of overall satisfaction, a quadrant chart analysis was conducted for each of the three Service Boards. For the Metra and CTA analysis, a derived importance analysis was conducted using regression models, while Pace conducted this analysis on stated importance. For CTA and Pace this analysis included data from weekend customers, which should be kept in mind when reviewing these results. In addition, this analysis was conducted using all of the attributes, including regional, common, and unique questions from each Service Board’s survey.
The charts below (Figure 30 to Figure 32) summarize the results of the key driver quadrant chart analysis and show the attributes in each of the quadrants by Service Board. The attributes are listed in order of importance to overall customer satisfaction. The first quadrant in these charts

RTA Customer Satisfaction Study: RTA Regional Report Page 28
represents the attributes that have above average importance for customers in terms of overall satisfaction, but below average satisfaction scores. These are areas on which to focus improvements, as increasing satisfaction with the attributes should increase overall satisfaction and help maintain riders. The areas in which each Service Board needs to improve differ, with only cleanliness on-board spanning more than one Service Board (CTA and Metra).
The second quadrant represents attributes that are important to customers and attributes that have above average levels of satisfaction. How safely the bus/train is operated and on-board personnel courtesy both fall in this quadrant for all three Service Boards. Getting to the destination on time is of above average importance and satisfaction for both Metra and CTA, while it is in the first quadrant for Pace. Meanwhile, travel time for the trip is in the second quadrant for CTA and Pace, but in the first quadrant for Metra.
The third quadrant contains attributes of below average importance and below average satisfaction levels. These attributes should be monitored, as they have below average satisfaction and could become important to customers in the future. The number of trains/buses in the rush and non-rush hour is in this quadrant for all three Service Boards. Additionally, comfort while waiting at the station/stop is in this category for all three Service Boards.
Finally, the fourth quadrant represents attributes with below average importance but above
average satisfaction levels. Attributes in this quadrant require no immediate attention.
In general, there is consistency between Service Boards in terms of what attributes drive overall satisfaction (attributes falling in the first or second quadrant). The following attributes are important drivers for all three Service Boards:
Getting to destination on time
Total travel time for your trip
How safely the bus/train is operated
Cleanliness on-board
On-board personnel courtesy
Each Service Board has areas in which improvements can be made and further details about these
attributes and other important attributes not listed here can be found in the individual Service
Board-specific reports.
RTA Customer Satisfaction Study: RTA Regional Report Page 29
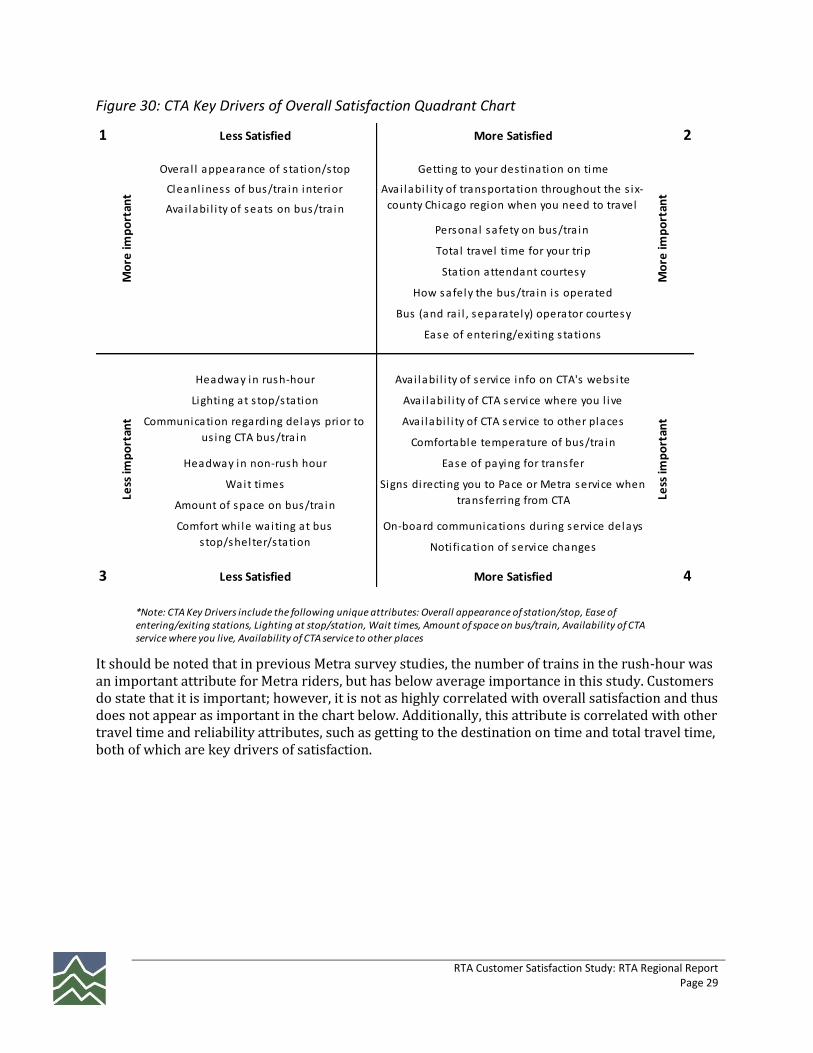
Figure 30: CTA Key Drivers of Overall Satisfaction Quadrant Chart
1 Less Satisfied More Satisfied 2
Overal l appearance of s tation/stop Getting to your destination on time Cleanl iness of bus/tra in interior Avai labi l i ty of seats on bus/tra in
Personal safety on bus/tra in
Total travel time for your trip
Station attendant courtesy
How safely the bus/tra in i s operated
Bus (and ra i l , separately) operator courtesy
Ease of entering/exi ting s tations
Headway in rush-hour Avai labi l i ty of service info on CTA's webs ite
Lighting at s top/station Avai labi l i ty of CTA service where you l ive
Avai labi l i ty of CTA service to other places
Comfortable temperature of bus/tra in
Headway in non-rush hour Ease of paying for transfer
Wait times
Amount of space on bus/tra in
On-board communications during service delays
Noti fication of service changes
3 Less Satisfied More Satisfied 4
*Note: CTA Key Drivers include the following unique attributes: Overall appearance of station/stop, Ease of entering/exiting stations, Lighting at stop/station, Wait times, Amount of space on bus/train, Availability of CTAservice where you live, Availability of CTA service to other places
Mo
re im
po
rtan
tLe
ss im
po
rtan
t
Mo
re im
po
rtan
tLe
ss im
po
rtan
t
Avai labi l i ty of transportation throughout the s ix-
county Chicago region when you need to travel
Comfort whi le waiting at bus
s top/shelter/station
Signs directing you to Pace or Metra service when
transferring from CTA
Communication regarding delays prior to
us ing CTA bus/tra in
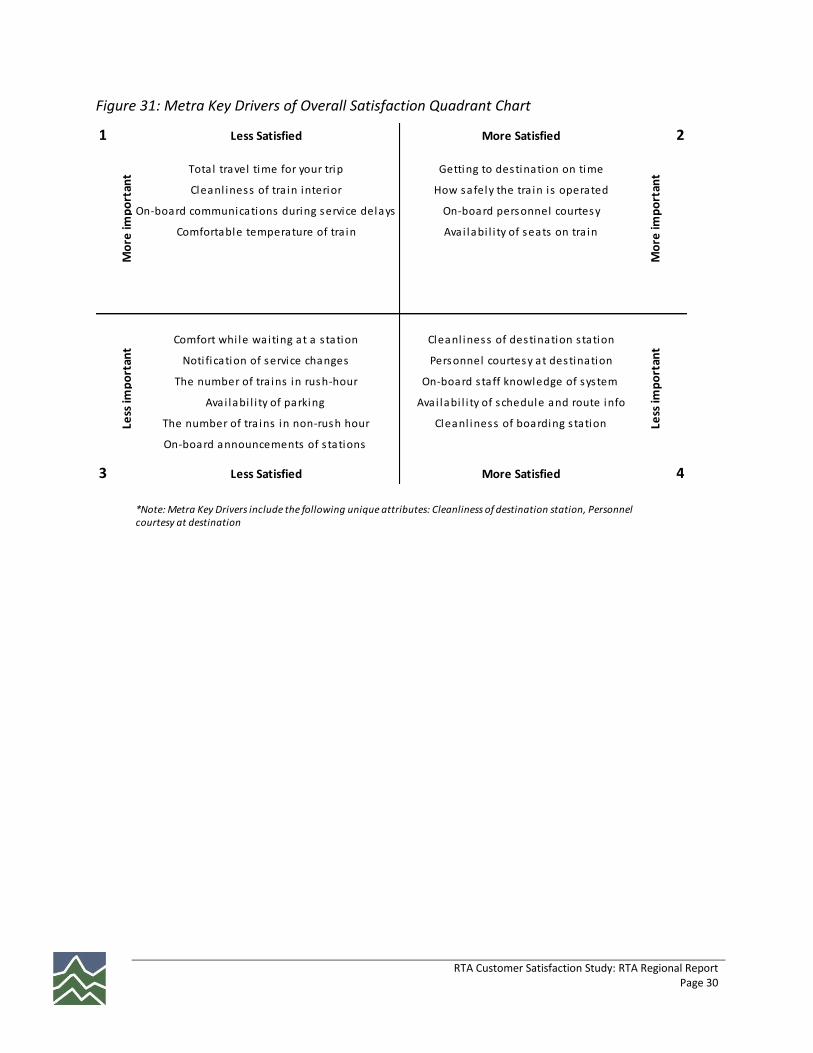
It should be noted that in previous Metra survey studies, the number of trains in the rush-hour was an important attribute for Metra riders, but has below average importance in this study. Customers do state that it is important; however, it is not as highly correlated with overall satisfaction and thus does not appear as important in the chart below. Additionally, this attribute is correlated with other travel time and reliability attributes, such as getting to the destination on time and total travel time, both of which are key drivers of satisfaction.
RTA Customer Satisfaction Study: RTA Regional Report Page 30
Figure 31: Metra Key Drivers of Overall Satisfaction Quadrant Chart
1 Less Satisfied More Satisfied 2
Total travel time for your trip Getting to destination on time
Cleanl iness of tra in interior How safely the tra in i s operated
On-board communications during service delays On-board personnel courtesy
Comfortable temperature of tra in Avai labi l i ty of seats on tra in
Comfort whi le waiting at a s tation Cleanl iness of destination s tation
Noti fication of service changes Personnel courtesy at destination
The number of tra ins in rush-hour On-board s taff knowledge of system
Avai labi l i ty of parking Avai labi l i ty of schedule and route info
The number of tra ins in non-rush hour Cleanl iness of boarding s tation
On-board announcements of s tations
3 Less Satisfied More Satisfied 4
*Note: Metra Key Drivers include the following unique attributes: Cleanliness of destination station, Personnelcourtesy at destination
Mo
re im
po
rtan
t
Mo
re im
po
rtan
t
Less
imp
ort
ant
Less
imp
ort
ant

RTA Customer Satisfaction Study: RTA Regional Report Page 31
Figure 32: Pace Key Drivers of Overall Satisfaction Quadrant Chart
1 Less Satisfied More Satisfied 2
Avai labi l i ty of schedule/route info Driver's safe driving
Noti fication of service changes Personal safety on bus
Buses running on time Ease of understanding routes/schedules
How driver obeys and enforces rules
Buses in good working order
Frequency of bus service in rush-hour Ease of fare payment
Transfer waiting time and rel iabi l i ty Comfortable temperature of bus
Value of service for fare paid
Driver courtesy
Personal safety at s top
Cleanl iness of bus interior
Driver's wi l l ingness to ass is t me
Accuracy of schedule/route info
Total travel time for your trip
Driver's knowledge of system to ass is t me
Service avai lable to place I need to go
Cleanl iness of bus s top Distance to nearest s top
Avai labi l i ty of service info at Pace's webs ite Avai labi l i ty of seats on bus
Pace customer service On-board announcements of bus s tops
Comfort whi le waiting at bus s top
Frequency of bus service in non-rush hour
Avai labi l i ty of bus shelters
3 Less Satisfied More Satisfied 4
*Note: Pace Key Drivers used stated importance and include the following unique attributes: Transfer waiting time and reliability, Ease of understanding routes/schedules, How driver obeys and enforces rules, Buses in good working order, Ease of fare payment, Driver's willingness to assist me, Accuracy of schedule/route info, Service available to place I need to go, Pace customer service, Availability of bus shelters, Distance to nearest stop
Mo
re im
po
rtan
t
Mo
re im
po
rtan
t
Less
imp
ort
ant
Less
imp
ort
ant
Avai labi l i ty of transportation throughout the s ix-
county Chicago region when you need to travel
Coordination of schedules among Pace, CTA,
and Metra for transfers
5.4 Customer Loyalty
Respondents were also asked how likely they would be to recommend the transit service to a friend (Figure 33). A total of 91% of respondents reported that they would recommend the services they ride to another person. All Service Boards had similarly high customer likelihood to recommend service. This is a very positive response and shows that a very large percentage of customers are satisfied with services.

RTA Customer Satisfaction Study: RTA Regional Report Page 32
Figure 33: Likelihood to Recommend Service
44%
46%
6% 3%
Likelihood to Recommend Service
Very Likely
Likely
Unlikely
Very Unlikely
6.0 CONCLUSIONS
Overall, RTA’s Service Boards are providing service that most customers (83%) are satisfied with and would recommend to others (91%). Customers are also pleased with overall transit in the six-county region, with over three-quarters of customers satisfied with regional service overall.
Overall, customers are most satisfied with Information and Communication attributes and with Employee Performance. Relative to other attributes, customers are somewhat less satisfied with aspects of Travel Time and Reliability and Cleanliness. Each of the Service Boards is performing well overall and each has some areas in which some improvements can be made.
Across the three Service Boards, several consistent attributes were identified to be key drivers of overall satisfaction:
Getting to destination on time
Total travel time for your trip
How safely the bus/train is operated
Cleanliness on-board
On-board personnel courtesy
Additional key drivers of satisfaction for CTA include availability of seats on-board, appearance of the station/stop, service when you need it, and personal safety on-board, among others. Other key drivers for Metra include on-board communications during service delays, comfortable on-board temperature, and availability of seating on-board. Finally, additional drivers of satisfaction for Pace include availability of schedule/route information, notification of service changes, service when you need it, personal safety on-board, ease of understanding routes/schedules, buses in good working order, ease of fare payment, and comfortable temperatures on-board, among other attributes.
Individual Service Board reports are currently being produced for a more detailed evaluation of each agency’s service. The 2011 data for the three Service Boards have provided a robust and consistent base for the 2011 analysis and a base from which studies can be conducted in future years and compared back to 2011 to understand how satisfaction with various attributes is changing over time and benchmark improvements for each of the Service Boards.