regional travel survey
TRANSCRIPT

Atlanta Regional Commission
Regional Travel Survey Final Report
206 Wild Basin Rd., Suite A-300 (512) 306-9065
Austin, Texas 78746 fax (512) 306-9077
Contact: Jeff Livingston, Project Manager www.ptvnustats.com
Project conducted by PTV NuStats in association with GeoStats
November 2011

Table of Contents
Executive Summary i
Survey Methods 1
Objectives and Approach 1
Survey Design 2
Sample Design 4
Data Collection 11
Data Processing, Coding, and Correction 16
Response Rates 26
GPS Subsample 27
Data Weighting and Expansion 38
Household Weight 39
Person Weight 42
Limitations of the Survey 43
Survey Results 44
Household Characteristics 44
Travel Behavior 55
Appendix A: Recruitment CATI Survey 60
Appendix B: Recruitment WEB Survey 83
Appendix C: Retrieval CATI Survey 106
Appendix D: Retrieval WEB Survey 121
Appendix E: Interviewer Training Manual 131
Appendix F: Final Data Matrix 161
Appendix G: Recruitment Item Unweighted Frequencies 182
Appendix H: Retrieval Item Unweighted Frequencies 192
Appendix I: Survey Materials 196
Appendix J: GPS Materials 201

List of Tables and Figures
Table 1: Overall Completed Survey Summary i
Table 2: Participation Statistics by GPS Sample Type i
Figure 1: Household Travel Survey Study Area 1
Table 4: Distribution of Households in Study Area 4
Figure 2: Sampled Household Locations (Map of ARC Region) 5
Table 5: Stratification Scheme 6
Figure 3: Area Type Stratification 7
Table 6: Distribution of Area Types 7
Figure 4: Transit Oversampling Area 8
Table 7: Socioeconomic Stratification 9
Table 8: Target County Distribution of Completed Surveys 9
Table 9: Participant Household Locations (Map of ARC Region) 10
Table 10: Sample Detail 11
Table 11: Recruitment Summary (Pre-Test) 12
Figure 5: Continuous Data Flow (CDF) Process 13
Table 12: Recruitment Mode 14
Table 13: Recruitment Interview Length and Average Call
Attempts/Household, by Household Size 14
Table 14: Retrieval Mode 15
Table 15: Retrieval Interview Length and Average Call
Attempts/Household, by Household Size 15
Figure 6: Data Processing Flow Chart 17
Table 16: Final: Household Variables Item Non-Response 18
Table 17: Final: Person Variables Item Non-Response 19
Table 18: Final: Vehicle Variables Item Non-Response 19
Table 19: Final: Retrieval Variables Item Non-Response 19
Table 20: Edit Checks 20
Table 21: County Distribution 23
Figure 7: Participating Household Locations (Map of ARC Region) 24
Table 22: Demographic Results Compared to Census 25
Table 23: Response Rates by County 26
Table 24: Response Rate Comparison to Other Surveys 27
Figure 8: QStarz BT-Q1000X Travel Recorder 28
Figure 9: GlobalSat DG-100 GPS Data Logger 29
Table 25: Recruitment and Deployment Statistics by GPS Sample Type 30
Table 26: Participation Statistics by GPS Sample Type 31
Table 27: Disposition of GPS and Diary Retrieval Outcomes 31

Table 28: Trip Frequencies for Perfect Matches at Vehicle Level 33
Table 29: Trip Frequencies for Missing GPS and Missing Diary Trips (Vehicle
GPS) 34
Table 30: Trip Frequencies for Perfect Matches at Person Level 35
Table 31: Trip Frequencies for Missing GPS and Missing Diary Trips
(Wearable GPS) 36
Table 32: GPS and Diary Trip Counts for Vehicle and Wearable GPS
Samples 37
Table 33: Missing Trip Rates 37
Table 34: List of Travel Modes Included in the Matching Process 38
Table 35: Raking Adjustment at Household Level 40
Table 36: Raking Adjustment at Person Level 42
Table 37: Household Size (Weighted) 44
Table 38: Household Number of Vehicles (Weighted) 44
Table 39: Vehicle Age (Weighted) 45
Table 40: Household Ethnicity (Weighted) 45
Table 41: Hispanic or Latino Households (Weighted) 45
Table 42: Household Residence Type (Weighted) 46
Table 43: Ownership of Household Residence (Weighted) 46
Table 44: Landlines in Household (Weighted) 46
Table 45: Household Income (Weighted) 47
Table 46: Household Number of Students (Weighted) 47
Table 47: Household Number of Workers (Weighted) 48
Table 48: Number of Licensed Drivers in Household (Weighted) 48
Table 49: Average Number of Children in Household (Weighted) 49
Table 50: Respondent Gender (Weighted) 49
Table 51: Respondent Age Distribution (Weighted) 49
Table 52: Respondent Disability Status (Weighted) 50
Table 53: Respondents with Valid Driver's License (Weighted) 50
Table 54: Respondent Employment Status (Weighted) 50
Table 55: Respondent Volunteer Status (Weighted) 50
Table 56: Respondent Works (Weighted) 50
Table 57: Respondent Unemployment Status, if Does Not Work (Weighted) 51
Table 58: Respondent Number of Jobs (Weighted) 51
Table 59: Respondent Work Locations (Weighted) 51
Table 60: Respondent Number of Days Worked per Week (Weighted) 52
Table 61: Percent Employer Provided Parking (Weighted) 52
Table 62: Percent Employer Subsidizes Transit Pass (Weighted) 52
Table 63: Educational Attainment (Weighted) 53
Table 64: Household Member Frequency of Walk or Bike to Work/School in
Last Week (Weighted) 53

Table 65: Vehicle Body Type (Weighted) 53
Table 66: Vehicle Fuel Type (Weighted) 54
Table 67: Vehicle Ownership Type (Weighted) 54
Table 68: Household and Person Trip Rates (Weighted) 55
Table 69: Trip Rates by Household Size (Weighted) 55
Table 70: Trip Rates by Number of Household Workers (Weighted) 55
Table 71: Trip Rates by Household Income (Weighted) 56
Table 72: Primary Trip Purpose (Weighted) 56
Table 73: All Trip Modes (Weighted) 57
Table 74: Mode to Work (Weighted) 58
Table 75: Mode to School (Weighted) 58
Figure 10: Trip Departure Times 59
Table 76: Travel by Day of Week (Weighted) 59
Table H-1: Household Size (Unweighted) 182
Table H-2: Household Number of Vehicles (Unweighted) 182
Table H-3: Vehicle Age (Unweighted) 182
Table H-4: Household Ethnicity (Unweighted) 183
Table H-5: Hispanic or Latino Households (Unweighted) 183
Table H-6: Household Residence Type (Unweighted) 183
Table H-7: Ownership Stats of Household Residence (Unweighted) 184
Table H-8: Landlines in Household (Unweighted) 184
Table H-9: Household Income (Unweighted) 184
Table H-10: Household Number of Students (Unweighted) 185
Table H-11: Household Number of Workers (Unweighted) 185
Table H-12: Number of Licensed Drivers in Household (Unweighted) 185
Table H-13: Average Number of Children in Household (Unweighted) 186
Table H-14: Respondent Gender (Unweighted) 186
Table H-15: Respondent Age Distribution (Unweighted) 186
Table H-16: Respondent Disability Status (Unweighted) 186
Table H-17: Respondents with Valid Driver's License (Unweighted) 187
Table H-18: Respondent Employment Status (Unweighted) 187
Table H-19: Respondent Volunteer Status (Unweighted) 187
Table H-20: Respondent Works (Unweighted) 187
Table H-21: Respondent Unemployment Status, if Does Not Work
(Unweighted) 188
Table H-22: Respondent Average Number of Jobs (Unweighted) 188
Table H-23: Respondent Work Locations (Unweighted) 188
Table H-24: Respondent Average Number of Days Worked per Week
(Unweighted) 189
Table H-25: Percent Employer Provided Parking (Unweighted) 189
Table H-26: Percent Employer Subsidizes Transit Pass (Unweighted) 189

Table H-27: Educational Attainment (Unweighted) 190
Table H-28: Household Member Frequency of Walk or Bike to Work/School
in Last Week (Unweighted) 190
Table H-29: Vehicle Body Type (Unweighted) 190
Table H-30: Vehicle Fuel Type (Unweighted) 191
Table H-31: Vehicle Ownership Type (Unweighted) 191
Table I-1: Primary Trip Purpose (Unweighted) 192
Table I-2: Trip Mode – All Trips, Work Trips, School Trips (Unweighted) 193
Table I-3: Total Persons Traveling on Trip (Unweighted) 193
Table I-4: Household Members Traveling on Trip (Unweighted) 194
Table I-5: Non-Household Members Traveling on Trip (Unweighted) 194
Table I-6: Reason for No Trips on Travel Day (Unweighted) 195
Table I-7: Parking Location (Unweighted) 195
Table I-8: Paid to Park (Unweighted) 195

PTV NuStats i ARC Regional Travel Survey Final Report
Executive Summary
The Atlanta Regional Commission (ARC) contracted with the team of PTV NuStats, GeoStats and PB
Americas, Inc to conduct a comprehensive study of the demographic and travel behavior characteristics
of residents within the 20-county study area. The purpose of the 2011 Regional Travel Survey was to
improve the ARC travel demand forecasts, in both its aggregate four-step trip-based model and its
disaggregate activity-based model. The goal was to obtain demographic and trip data from a minimum
of 10,000 households, including a subsample of 1,000 households that would also provide global
positioning system (GPS) data. The final data set contains information for 10,278 households, of which
1,061 households also provided GPS data.
Table 1: Overall Completed Survey Summary
County Number of
Completed Surveys
Percent Completed
Surveys
Barrow 128 1%
Bartow 176 2%
Carroll 216 2%
Cherokee 396 4%
Clayton 469 5%
Cobb 1,359 14%
Coweta 229 2%
DeKalb 1,458 15%
Douglas 229 2%
Fayette 196 2%
Forsyth 305 3%
Fulton 1,946 19%
Gwinnett 1,373 14%
Hall 311 3%
Henry 348 3%
Newton 175 2%
Paulding 254 3%
Rockdale 149 1%
Spalding 125 1%
Walton 158 2%
Total 10,000 100%

PTV NuStats ii ARC Regional Travel Survey Final Report
Table 2: Participation Statistics by GPS Sample Type
Sample Type Goal Retrievals
Vehicle GPS 667 727
Wearable GPS 333 334
Total 1000 1061
The survey design employed a nationally accepted research method for household travel surveys.
Additionally a subsample of households equipped with global positioning system (GPS) equipment, both
vehicle and wearable, to provide an independent measure of travel. All household members were asked
to keep track of all trips for a specified 24-hour period using a specially designed diary.
A stratified sampling approach was used where the survey universe was divided into smaller groups
and a random sample was chosen within each group. The approach allowed PTV NuStats to oversample
at the certain geographic and demographic level to capture the diversity of the population according to
specific factors affecting travel behavior in the study area, while meeting the county distribution goals.
The pre-test, designed to test the materials, processes, and procedures for the full study, was conducted
from November 2010 through January 2011 and included sample from each county in the study area. In
total, demographic and travel data were collected and completed for 291 households. The results of the
pre-test provided information used to refine the survey procedures, programs, and materials.
Data collection activities for the full study began in February 2011 and continued through October
2011, with a break during the summer, and included seven main stages: (1) advance notification, (2)
reminder postcard, (3) recruitment, (4) placement of materials, (5) reminder call, (6) travel data
retrieval, and (7) data processing. The majority of sampled households1 were initially contact by an
advance letter that introduced the household to the survey purpose and invited them to participate in
the recruitment survey either by phone or online. Households that were not mailed an advance letter
were initially contacted by telephone. Once the household agreed to participate, key household and
person level information was collected. Eighty-five percent of households completed the recruitment
survey via telephone. The remaining 15 percent completed recruitment online. Once a GPS household
was recruited, GeoStats managed the deployment and recovery of the GPS devices, as well as the GPS
data processing. All recruited households, including those participating in the GPS portion of the survey,
were then mailed personalized diaries to report their travel for an assigned 24-hour period. PTV NuStats
retrieved the travel information by telephone (42 percent), online (29 percent), or by mail (29 percent).
Once retrieved, household travel details were processed and then subjected to quality control checks.
Data Processing took place on a daily basis throughout the study, beginning with the release of sample
for recruitment, to processing recruitment data for the respondent mail-out, to appending the retrieval
data to the master tables, and to performing initial quality control measures on the data. All trip-ends
and habitual addresses were geocoded during the retrieval through the Trip Builder software.
Results
General
10,278 of the 16,374 households that were recruited completed the survey, achieving a 103 percent
of the project goal, with an overall retrieval rate2 of 62.8 percent. These households yielded
information for 25,810 Persons, 21,270 Vehicles, and 93,713 Trips.
The average interview length (23.2 minutes) was the same for recruitment and retrieval.
1 380,290 household were sampled for full-study data collection and 151,324 households received an advance letter 2 Total number of retrieved household divided by the total number of recruited households

PTV NuStats iii ARC Regional Travel Survey Final Report
Travel days were evenly distributed among each weekday: Monday (21 percent), Tuesday (22
percent), Wednesday (19 percent), Thursday (18 percent), and Friday (20 percent).
Person Data
Twenty-eight percent of respondents were age 18 or younger; eight percent were between 18-24
years of age; 44% were between 25–54 years of age, 11% were between 55-64 years of age, and 9%
were aged 65+.
Six percent of respondents reported having a disability.
Nearly 89 percent of respondents reported having a driver‘s license.
The average number of days worked per week by respondents who reported they were employed is
4.45.
Eighty-eight percent of workers have parking provided to them by their employer, and 16 percent
reported that their employers subsidize transit passes.
Household Data
The average household size is 2.63 household members. In Census 2010 average household size is
2.78 household members
On average, households reported 1.99 vehicles, with 6 percent reporting zero-vehicle, 27 percent of
households reporting one vehicle, 40 percent of household reporting two vehicles, 17 percent of
households reporting three vehicles, and 9 percent reporting four or more vehicles.
Households reported having an average of 1.3 workers. 0-workers household (17 percent), 1-
workers household (43 percent), 2-workers household (33 percent) were also reported.
The average number of children per household was 0.7, with two-thirds (64 percent) of households
reporting they have zero children living in the household. As per ACS 2010 3 year estimates
average number of children per household (0.66 percent).
Trip Data
Households reported an average of 9.12 daily household trips and 3.63 daily person trips.
Eighty-three percent of all trips were made by automobile either as the driver or passenger.
Non-motorized transportation mode for all trips included walk (7.3 percent) and bike (0.3 percent).
For work trips transportation mode as walk is (1.3 percent) and bike (0.4 percent). Overall, Non-
motorized transportation mode for work trips is (1.7 percent).
Transit transportation mode for all trips included MARTA train (1.4 percent), local bus (1.4
percent), and express bus (0.2 percent). Overall Transit as transportation to work trip is (5.3
percent)
The average number of household members traveling in a group was 1.35. Overall, average vehicle
occupancy is 1.85.

PTV NuStats 1 ARC Regional Travel Survey Final Report
Survey Methods
Objectives and Approach
The ARC Regional Travel Survey was a comprehensive study of the demographic and travel behavior
characteristics of residents within the region comprising Barrow, Bartow, Carroll, Cherokee, Clayton,
Cobb, Coweta, DeKalb, Douglas, Fayette, Forsyth, Fulton, Gwinnett, Hall, Henry, Newton, Paulding,
and Rockdale Counties. Sponsored by the Atlanta Regional Commission, the data collected in the 2011
survey will be used to improve the ARC travel demand forecasts, in both its aggregate four-step trip-
based model and its disaggregate activity-based model. The project was conducted by PTV NuStats, in
association with GeoStats.
The Regional Travel Survey was conducted in three phases: design, pre-test, and full study data
collection. The design phase took place September to November 2010 and included the development of a
work plan, the identification of data elements, materials design, and database programming. The pre-
test effort took place between November 2010 and January 2011; this effort included a dress rehearsal of
all processes planned for the full study. The full study was conducted in two phases during the spring
and fall of 2011, which included a data collection break during the summer. Spring data collection for the
full study was conducted between February 2011 and June 2011. Fall data collection was conducted
between July 2011 and October 2011. The purpose of this report is to document the methodology, study
materials, and results of the full study.
The project was designed as a traditional household travel survey with a subsample of households
equipped with global positioning system (GPS) equipment to provide an independent measure of travel.
As such, sampled households were contacted by telephone to secure their participation in the study and
were then mailed personalized diaries to report their travel for an assigned 24-hour period. Their travel
details were retrieved by telephone, online, or by mail. Once retrieved, their travel details were
processed and then subjected to standard quality control checks. For the GPS subsample, respondents
were also contacted by telephone to secure their participation. They received their diaries and GPS units
via mail, and then reported their travel details by telephone, online, or by mail. Respondents then
mailed the GPS units to GeoStats. A subsequent check on the GPS household data included a
comparison of what was reported by telephone versus trips detected in the GPS data streams.
Figure 1: Household Travel Survey Study Area

PTV NuStats 2 ARC Regional Travel Survey Final Report
Survey Design
The goal of the survey was to collect data from a minimum of 10,000 regional households that included a
sub-sample of 1,000 GPS completes. Demographic information (obtained during the recruitment
interview) and detailed travel information (obtained during the retrieval interview) were collected for all
household members. The final data set contains demographic and trip information for 10,278 households
with 1,061 households providing wearable and vehicle GPS data.
The survey employed a generally accepted research method for household travel behavior research, in
which household members age 14 and older recorded all trips for a specified 24-hour period (from 3:00
a.m. to 2:59 a.m.) using a specially designed travel diary. In the survey materials and interview scripts,
respondents were assured that their responses would be kept confidential and that their responses
would be analyzed in the aggregate only. As a result, the data files were structured such that a 7-digit
unique identifier (―sample number‖) would be used to link each household‘s data together and
documentation prepared to ensure the public use data files would be stripped of all identifying
information prior to its release. Households were randomly assigned to non-Holiday weekdays for
recording their travel (Monday–Friday). The final distribution of households by day of week is shown in
Table 3, which shows a fairly equal distribution of completed households among the days of the week.
Table 3: Distribution of Households by Day of Week
Day of Week Frequency Percent
Monday 2,174 21.2%
Tuesday 2,138 20.8%
Wednesday 1,988 19.3%
Thursday 1,876 18.3%
Friday 2,102 20.5%
Total 10,278 100.0%
The study began with an in-depth review of data needs that would satisfy the modeling requirements
and analysis plans that would be relying on the survey data. This resulted in the identification of the
following variables:
1) Household Data – Core household characteristics included the following:
Geocoded household address
Home Travel Analysis Zone (TAZ)
Household size
Household vehicle ownership
Household income
Household race and Hispanic ethnicity
Residence type
Owner/Renter status
Presence of a land-based telephone service in the household
Day and date of travel
Summary variables that indicated the number of trips made by household members, the
number of workers and students, the number of license holders, and the number of
household children.
Household life cycle

PTV NuStats 3 ARC Regional Travel Survey Final Report
2) Person Data – Demographic information was collected for all household members to help
explain the impact of household dynamics on personal travel in the region. The person-level
variables are:
Age and sex of all household members
Relationship among household members
Disability status
Cellular telephone ownership
Licensed driver status (age 16+)
Employment status (age 16+) or categorization of primary activity if not employed
If employed: industry and occupation, geocoded work address, typical mode to work, # days
and hours worked per week, both at a work location and through telecommuting, whether
the employer of the respondent provided transit pass and/or parking
Level of education attainment
Student status
If student: geocoded school address, typical mode to school, type of school attended
Frequency of transit use
Type of transit pass use
Bicycle usage
A summary of the number of trips recorded or an explanation for non-travel, if applicable
3) Vehicle data – The recruitment instrument included questions about the vehicles available to
the household:
Year
Make
Model
Body
Fuel type
Ownership status
Whether vehicle was used on travel day and an explanation for non-use, if applicable
4) Trip data – Trip data were collected for each household member during the retrieval
interview with travel information being collected by proxy for all respondents under the age of
14. These data are the primary source of information to support the data needs of the travel
demand model and analysis in mode choice, land use, origin-destination patterns, and
transportation facility use. Trip data collected included the following:
An anchor point for the start of the day and to provide the origin information for the first
trip of the 24-hour period (pinpointing the location of each household member at 3:00 a.m.)
Geocoded address information for each location visited throughout the 24-hour period
Trip start and end times
Travel mode:
If personal auto was used, an indication of which household vehicle was used, how
many were in the vehicle, and whether they were household members or not
If personal auto was used, parking information including location and cost to park

PTV NuStats 4 ARC Regional Travel Survey Final Report
If transit was used, the number of transfers made, the bus fare, and whether a vehicle
was available when transit was chosen as mode
Activity at place (trip purpose)
Summary variables to provide trip and activity duration
Sample Design
Survey Universe
The survey population represents all households residing in the 20-county region of Atlanta Regional
Commission. The population, or the study universe, comprises 1,867,492 households. Table 4 provides
the distribution of households by county. The sample size for the full study is 10,000 completed surveys.
Table 4: Distribution of Households in Study Area
County Number of
Households
Percent
Households
Barrow 23,846 1%
Bartow 32,968 2%
Carroll 40,290 2%
Cherokee 73,914 4%
Clayton 87,541 5%
Cobb 253,787 14%
Coweta 42,742 2%
DeKalb 272,223 15%
Douglas 42,762 2%
Fayette 36,659 2%
Forsyth 56,888 3%
Fulton 363,426 19%
Gwinnett 256,481 14%
Hall 58,159 3%
Henry 65,049 3%
Newton 32,646 2%
Paulding 47,434 3%
Rockdale 27,791 1%
Spalding 23,365 1%
Walton 29,521 2%
Total 1,867,492 100%
Source: American Community Survey, 2007–2009

PTV NuStats 5 ARC Regional Travel Survey Final Report
Figure 2: Sampled Household Locations (Map of ARC Region)
Sampling Frame
A dual sampling frame approach was used that combined the strengths of two sampling frames—
Address-based frame and Listed Residential frame.
An address-based frame includes all residential addresses that receive U.S. Mail delivery. Its main
advantage is its reach into population groups that typically participate at lower-than-average levels,
largely due to coverage bias (such as households with no phones or cell phone-only households). For
efficiency of data collection, the addresses were matched to telephone numbers and had a listed name of
the household appended to it. Addresses were generated and matched by MSG, a third-party vendor.
This sampling frame ensured coverage of all types of households irrespective of their telephone
ownership status, including households with no telephones (estimated at less than 3 percent of
households in the U.S.).
The Listed Residential frame, on the other hand, included listed telephone numbers from working blocks
of numbers in the U.S. for which the name and address associated with the telephone number are
known. The Listed Residential frame was used to strengthen the coverage of households with listed
landlines. The advantage of drawing sample from this frame is its efficiency in conducting the survey
effort—being able to directly reach households and secure their participation in the survey in a direct
and active approach. The samples were procured from the sample provider, Marketing Systems Group
(MSG), based in Fort Washington, PA.

PTV NuStats 6 ARC Regional Travel Survey Final Report
Sample Method
The selection of an appropriate sampling method is critical for an effective sample design that guards
against unplanned selectiveness and produces a robust data set that is representative of the population.
To ensure adequate representation, a sample needs to be drawn scientifically so that each person in the
population has a measurable chance of selection. This way, the results can be reliably projected from the
sample to the larger population with known levels of certainty and precision.
In this study, we employed a stratified probability sample of households. Stratified sampling is a type of
random or probability sampling, the methods of which are well grounded in statistical theory and the
theory of probability. Specifically, stratified sampling is a probability sampling method where the survey
universe is divided into smaller groups and a random sample is chosen within each group (i.e., every
sampling unit has some non-zero probability of being selected into the sample). This method results in
oversampling for some strata to ensure that we capture the diversity of the population according to
specific factors affecting travel behavior in the study area. Thus, within strata, households were selected
randomly (i.e., with equal probabilities), but the combined sample (across strata) comprised an unequal
probability sample of households. The stratification scheme is discussed in the following section.
Stratification Scheme
To support the modeling needs, TAZ-level stratification was conducted to reflect the environment in
which travel took place, defined by population and job densities, with higher densities reflecting the
more urbanized portions of the region.
Stratification that considers the environment in which travel takes place is highly relevant to the
development of a valid model. Studies show that levels of non-motorized travel are higher in higher
density areas, as there are more destinations within walking or biking distance, while travel in the lower
density areas tends to be predominantly by auto and include higher proportions of trip chaining. In
addition, the types of households found in the different settings are related to differences in travel
patterns as well. Households with children tend to settle in the lower density areas (suburbs), while
those household comprising workers only might be found closer to the areas with high employment
densities.
To capture the environment of travel, we utilized the stratification scheme employed in the Atlanta
model. This scheme stratifies the study area into seven area types based on the floating population and
employment densities (see Table 5). Figure 3 displays the stratification by area type in the study area.
Table 5: Stratification Scheme
Population Density
(per acre)
Employment Density (per acre)
<0.05 0.05–0.31 0.32–6.65 6.65–12.43 12.44–25.09 25.10–57.96 >57.96
< 0.43 7 7 6 4 4 3 2
0.43–0.77 7 6 6 4 3 3 2
0.78–2.37 7 6 5 4 3 2 2
2.38–3.47 6 5 5 4 3 2 2
3.48–5.39 6 5 5 4 3 2 1
5.40–8.06 5 5 5 3 3 2 1
>8.06 5 5 5 3 2 2 1
Source: Atlanta Regional Commission
1 – CBD; 2- Urban Commercial; 3 – Urban Residential; 4 - Suburban Commercial; 5 – Suburban Residential; 6 –
Exurban; 7 – Rural

PTV NuStats 7 ARC Regional Travel Survey Final Report
Figure 3: Area Type Stratification
Table 6 shows the distribution of the households by area types in the study area. Because of the
unavailability of household level information at the TAZ level, we aligned census blocks with TAZs.
Following this, household level information at the census block level from Census 2000 was aggregated
at the TAZ level and projected using 2007–2009 ACS data. As shown in the table, CDB and urban area
residents represent about 6 percent of the households. We over-sampled residents from CBD and urban
areas, and under-samples residents from suburban and rural areas to ensure adequate representation by
area type.
Table 6: Distribution of Area Types
Area Type Percent of Total Households
(2000 Census)
Percent of Total Households
(Projected to 2007- 09 ACS)
CBD 0.2% 0.2%
Urban Commercial 1.3% 1.5%
Urban Residential 3.2% 3.9%
Suburban Commercial 1.7% 1.5%
Suburban Residential 65.1% 64.8%
Exurban 14.9% 14.8%
Rural 13.7% 13.3%
Total 100.0% 100.0%

PTV NuStats 8 ARC Regional Travel Survey Final Report
In addition, we oversampled TAZs with a high concentration of transit-using households. We used data
from the 2009 ARC on-board survey to inform the definition of the oversampling area for bus riders. In
Addition, we oversampled transit riders that reside within a 0.5-mile buffer of the MARTA rail stations.
Figure 4 shows the area for oversampling bus and rail riders.
Figure 4: Transit Oversampling Area
We also employed a socioeconomic stratification among the target areas to set demographic controls. In
particular, the study area was stratified by household size and employment status of the members in the
household into the following:
1-person worker households
1-person non-worker households
2-person households with at least one worker
2-person non-worker households
3-or-more-person households
Table 7 presents the distribution of households by household size and employment status based on
2007–2009 American Community Survey (ACS) data. The observed socioeconomic distribution of the
completed surveys was monitored and reviewed to ensure that they fall within the expected ranges.

PTV NuStats 9 ARC Regional Travel Survey Final Report
Table 7: Socioeconomic Stratification
Household Size and
Employment Status
Number of Total
Households
Percent of Total
Households
1-person/worker 331,348 17.7%
1-person/non-worker 166,776 8.9%
2-person/worker 454,660 24.3%
2-person/non-worker 123,040 6.6%
3+ person 791,668 42.4%
Total 100.0% 100.0%
Source: American Community Survey 2007–2009
Note that the geographic and socioeconomic stratifications were monitored separately. The sample
performance was monitored to ensure that we have adequate representation of difficult-to-reach
demographic groups including low-income households, zero-vehicle households, renters, large
households, one-person worker households, and Hispanic households. In cases of under-representation,
the specifications of the subsequent sample orders were adjusted to oversample these demographic
groups.
Sample Size
The sample size for the full study was 10,000 completed surveys. Table 8 shows the distribution of the
completed surveys by county of residence.
Table 8: Target County Distribution of Completed Surveys
County Number of Completed
Surveys
Percent Completed
Surveys
Barrow 128 1%
Bartow 176 2%
Carroll 216 2%
Cherokee 396 4%
Clayton 469 5%
Cobb 1,359 14%
Coweta 229 2%
DeKalb 1,458 15%
Douglas 229 2%
Fayette 196 2%
Forsyth 305 3%
Fulton 1,946 19%
Gwinnett 1,373 14%
Hall 311 3%
Henry 348 3%
Newton 175 2%

PTV NuStats 10 ARC Regional Travel Survey Final Report
County Number of Completed
Surveys
Percent Completed
Surveys
Paulding 254 3%
Rockdale 149 1%
Spalding 125 1%
Walton 158 2%
Total 10,000 100%
Effect of Multi-Modal Data Collection on Sampling
Multi-modal data collection does not have significant consideration in sampling. For recruitment,
Computer-Assisted Telephone Interview (CATI) and Web instruments were available for data collection.
For retrieval, CATI, Web, and mail-back options were available. Multi-modal data collection helps reach
a diversified, and representative, sample not possible though one survey mode. For example, we know
young respondents are more likely to use the Internet; therefore, an online survey option is an effective
means of communicating with this group. Additionally, as previously described, unmatched sample do
not have a phone number. We mailed advance letters to 100 percent of the unmatched sample inviting
them to participate in the study and encouraged them to go online or call the hotline survey to complete
survey. Table 9 shows that 5 percent of recruits and retrievals were generated through unmatched
sample. The retrieval rate for unmatched sample is about 62 percent.
Table 9: Participant Household Locations (Map of ARC Region)
Sample Type
Recruitment Retrieval
Count Percent of
Recruitments Count
Percent of
Retrieved
Address Based Unmatched 818 5.0% 509 5.0%
Sample Generation and Processing
The planned sampling approach for the ARC Regional Travel Study combined the strengths of address-
based sampling frame and listed residential frame. The address-based frame permitted differential
sampling rates by land-use type, and the listed residential frame strengthened the coverage and
enhanced the efficiency of data collection from hard-to-reach population groups. With the address-based
sampling frame, the randomly sampled addresses were divided into two categories: (a) those with
telephone numbers (‗matched‘) and (b) those without telephone numbers (unmatched). The address-
based sampling frame consists of a current listing of city- and rural-route residential postal addresses for
the study area from the delivery sequence file (DSF) of the United States Postal Service. Its main
advantage is its reach into population groups that typically participate at lower-than-average levels,
largely due to coverage bias (such as households with no phones or cell-phone-only households). The
listed residential frame, on the other hand, includes listed telephone numbers from working blocks of
numbers for which the name and address associated with the telephone number are known. The
advantage of drawing sample from this frame is its efficiency in conducting the survey effort—being able
to directly reach households and secure their participation in the survey in a direct and active approach.
The sample from both frames was ordered from a private supplier, Marketing Systems Group (MSG).
The address-based sample was systematically drawn from the ADVO frame. ADVO is a direct mail
media company that has a proprietary database of up-to-date and deliverable resident/occupant mailing
address lists based on the DSF. MSG matched the sampled residential addresses to obtain landline
telephone numbers; then, the sample file was forwarded to Direct List for name matching.

PTV NuStats 11 ARC Regional Travel Survey Final Report
A total of 385,673 sample pieces were ordered for the study area. Sample orders were placed in different
waves (phases) and specification based on sample analysis and performance. The following table shows
the distribution of the overall sample order by sample type for the full study.
Table 10: Sample Detail
Sample Type Count Percent
Address Based Matched 156,565 40.6%
Address Based Unmatched 80,378 20.8%
Listed General 52,726 13.7%
Listed Large HH 29,713 7.7%
Spanish Surname 24,834 6.4%
Listed Low-Income 23,837 6.2%
Transit Over Sample Tracts 8,117 2.1%
CBF Over Sample Tracts 9,503 2.5%
Total 385,673 100.0%
Data Collection
Pre-Test
The pre-test was conducted from November 2010 through January 2011. The pre-test households were
sampled from each county in the study area. Household recruitment took place from November 6
through December 11, with assigned travel dates on the weekdays from Wednesday, November 10
through Friday, December 17 (excluding Thanksgiving weekend). Retrieval calls began Friday
November 11 and continued through January 9 (the entry of mail-back surveys continued until January
14). A total of 11 interviewers worked on the recruitment portion of the pre-test, and 10 interviewers
worked on retrieval.
The purpose of the pre-test phase of the study was to test survey instruments and materials planned for
the full study in order to assess respondent reaction, data collection processes, and budget assumptions.
The main objectives of the pre-test phase were:
1) To test the respondent materials to ensure they were applicable and understood by all
respondent groups, despite differences in geography and demographics.
2) To program and test the core programs and processes.
3) To program and test the GPS processes and to ensure that the GPS component was properly
designed to yield the desired data.
4) To evaluate project team performance and respondent participation rates in light of original
cost assumptions.
Methods and Design
The pre-test survey was designed to test the materials, processes, and procedures for the full study. To
do so, the data collection goal was to recruit a sufficient number of households in order to obtain
complete and usable data from 300 households. The ARC Regional Travel Survey pre-test consisted of all
necessary data collection activities required to produce a data set. These activities included sample
generation, advance notification, recruitment, placement of respondent materials, reminder calls,
retrieval, quality assurance, and data delivery. The pre-test focused on all counties within the full study
area. In total, 461 households were recruited into the pre-test study; complete and usable data were
obtained from 291 households.

PTV NuStats 12 ARC Regional Travel Survey Final Report
Throughout all pre-test activities, the focus was to target areas for improvement prior to the start of the
full study. The role of the pre-test was critical in the study—it was not designed to make everyone
―comfortable,‖ as that approach would have resulted in inadequate and insufficient evaluation of the
process. The pre-test was referred to as a ―dress rehearsal‖ specifically for this reason it was a road test
of all systems and respondent materials to ensure everything was in place and ready for full
implementation. As such, the pre-test households were not included as part of the final data set.
The modes of data collection are shown in Table 11 with CATI used for 87 percent of recruitment and 55
percent of retrieval.
Table 11: Recruitment Summary (Pre-Test)
Phase % CATI % WEB % MAIL TOTAL
Recruitment 87% 13% N/A 461
Retrieval 55% 2% 43% 291
Impact of Pre-Test on Final Survey Design
Processes and Procedures: Overall, the pre-test was successful in terms of the procedures and
collection of necessary data.
1) The targeted sample was fairly successful in finding under-performing demographic groups;
however, it was closely monitored during the full study because some cells in the pre-test were
too small to draw conclusions from.
2) The initial shifts of retrieval in the pre-test were more difficult than usually experienced
because of internal technology enhancements. These enhancements were completed in the full
study.
3) The pre-test experienced low retrieval rates for both GPS and non-GPS sample types overall.
The pre-test was conducted during the busy holiday season, and this may have been a major
factor in the low retrieval rates. Although additional sample was fielded near the end of pre-
test recruitment in order to boost the number of households recruited, the overall number of
households retrieved and deliverable fell short of the goal (291 compared to a goal of 300).
4) The pre-test data set was skewed to older respondents. This was monitored carefully, and
households with all members 75 years of age and older were randomly terminated from
participation.
5) The long-distance question caused some confusion for respondents because of its length and its
complex sentence structure.
Materials: Changes to the materials were made following qualitative research (focus groups) conducted
in December 2010. These changes included:
1) To make the logos more noticeable, they were enlarged and printed in a darker blue.
2) The text on the advance envelope was revised in an attempt to appeal to more respondents.
3) The diary cover for the pre-test was printed on gray paper; for the full study, the paper stock
was changed to yellow to make it stand out. The activity list was revised to delete ―from car‖
after ―drop off passenger‖ and ―pick-up passenger‖.
Incentives: The pre-test employed a complicated incentive strategy aimed at recruiting households via
Web, incentivizing GPS households, and offering targeted incentives to traditionally difficult-to-reach
demographic groups. To streamline and simplify the full study, households were offered $25 for each
category, i.e., $25 for completing recruitment via Web, or $25 per device for using GPS, or $25 per
household for targeted demographic groups. The incentives were not cumulative, so a household was
only offered $25 per household or $25 per GPS device.

PTV NuStats 13 ARC Regional Travel Survey Final Report
Full Study
Data collection activities began in February 2011 and continued through October 2011 with a break
during the summer. These activities centered around seven main stages: advance notification, reminder
postcard, recruitment, placement of materials, reminder call, travel data retrieval, and processing and
geocoding. The details regarding each stage are provided in this section and illustrated in the following
figure.
Figure 5: Continuous Data Flow (CDF) Process
Advance Notification
A study letter, brochure, and postcard were mailed to a portion of households for which a name and
address were known prior to the recruitment call, as well as to households with no phone number. This
mailing served as advance notification to the household that it had been randomly selected and would be
receiving a call regarding the study, or were given the option of calling PTV NuStats or going online to
participate in the survey. The mailing also provided information about the study sponsor, introduced
PTV NuStats as the company that would be contacting them, and provided the Website address and a
telephone number where additional information could be obtained.

PTV NuStats 14 ARC Regional Travel Survey Final Report
Reminder Postcard
In addition to the advance mailing, reminder postcards were mailed to all unmatched sample records, or
those without a telephone number. Reminder postcards were mailed three days after the advance
mailing. See Appendix I for an image of the reminder postcard.
Recruitment
The recruitment interview was administered using a Computer-Assisted Telephone Interviewing (CATI)
program. At that time, each household was telephoned by an interviewer to determine if they would
participate in the study. If the household did agree to participate, demographic information was collected
including income, household size, vehicle ownership, and other household characteristics. In addition,
demographic characteristics were obtained for each member of the household, including age, gender,
employment, and school status (see Appendix A for the recruitment questionnaire).
Table 12: Recruitment Mode
Phase % CATI % Web % Mail Total
Recruitment 85% 15% N/A 16375
The recruitment calls for the full study began on February 24, 2011 and continued through May 16,
2011, before taking a break for the summer. Recruitment resumed July 18, 2011 and concluded on
September 12, 2011. Overall, 16,375 households were recruited. The average length of the recruitment
call was 23.2 minutes. It took an average of 3.6 call attempts to reach a household for recruitment. Table
13 shows the average interview length and the average number of call attempts required to reach each
household based on household size. As indicated, the larger the household, the longer the interview
length. The table also shows that it took fewer call attempts to reach households with fewer members.
Table 13: Recruitment Interview Length and Average Call Attempts/Household, by
Household Size
Household Size N Average Call
Duration (in min.)
Average Call
Attempts
1 3,246 16.8 3.5
2 5,585 21.7 3.5
3 3,041 25.3 3.6
4+ 4,503 28.3 3.8
Overall 16,375 23.2 3.6
Respondent Packet Mailing
The day following recruitment, the demographic information was processed into the master data set, and
packets were assembled for each recruited households. These packets included a cover letter, travel
diary with instructions and an example, and a postage-paid envelope to return the completed diaries
after the retrieval interview (see Appendix I). Travel days were scheduled 7–10 days after recruitment to
allow for sufficient time for packets to reach the households using First-Class mail.

PTV NuStats 15 ARC Regional Travel Survey Final Report
Reminder Call
The night prior to the assigned travel day, reminder calls were made to the households. This reminder
call served three key purposes:
1) Confirm that the household received the packet and answer any questions respondents might
have about using the travel diary and recording their travel,
2) Schedule an appointment to conduct the retrieval interview, and
3) Increase the likelihood that the household will follow through with recording their travel by
reiterating the importance of the study and the household‘s commitment to participate.
For those instances where an answering machine was reached, the interviewers left brief messages that
referenced a toll-free number for respondents to call if they had questions.
Retrieval
The day after an assigned travel day or at an agreed-upon time, telephone calls were made to retrieve
the travel data recorded by each eligible household member in his/her travel diary. The interviews were
guided using CATI programs of the retrieval instrument (see Appendix C). The average interview length
was 23.2 minutes, and it took 3.6 call attempts to complete retrieval, on average.
Table 14: Retrieval Mode
Phase % CATI % WEB % MAIL TOTAL
Retrieval 42% 29% 29% 10278
Travel days for the full study were assigned between March 9, 2011 and May 27, 2011, with a break
during the summer, and resumed between August 1, 2011 and September 16, 2011. Retrieval interviews
began on March 8, 2011 and continued through June 26, 2011. Retrieval interviews resumed August 2,
2011 and concluded on October 6, 2011. Data were collected from all household members for the 10,278
households that completed the full study. The retrieval instrument had minimal item non-response, as
indicated in the unweighted frequencies contained in Appendix H of this report.
Table 15: Retrieval Interview Length and Average Call Attempts/Household, by Household
Size
Household Size N Average Call
Duration (in min.)
Average Call
Attempts
1 2,336 17.8 3.5
2 3,712 22.7 3.4
3 1,830 26.7 3.6
4+ 2,400 29.6 3.7
Overall 10,278 23.2 3.6

PTV NuStats 16 ARC Regional Travel Survey Final Report
Data Processing, Coding, and Correction
Data processing took place on a daily basis throughout the study, beginning with the release of sample
for recruitment, to processing recruitment data for the respondent mail-out, to appending the retrieval
data to the master tables, and to performing initial quality control measures on the data. A master
control file tracked the progress of each household through the various survey stages, with codes to allow
immediate identification of problem cases that were not progressing according to schedule, as well as
confirmation that cleared cases moved along as appropriate. Routine data checks included the following:
Data range checks to ensure data were inside the expected ranges for each variable and that there
was agreement across data files (for example, if the household had four persons and two vehicles,
there should be four records in the person file and two records in the vehicle file).
If a person reported no travel, the household was flagged for manual review to confirm the reason
for non-travel was appropriate based on the demographic characteristics of the household member.
Those cases for which the reason for non-travel was suspect or did not make sense within the
context of the available demographic information were flagged and returned to the Research Team
for confirmation or replacement.
Within the travel data itself, several items were checked. The following are examples of conditions
researched within the trip data:
Did each trip begin and end at a different location? Loop trips (those that have the same origin
and destination) might be neighborhood walks, which were treated as at-home non-work
activities rather than a trip.
Did each person return home at the end of the travel day? If not, did the final recorded
destination make sense within the context of the household and person characteristics?
For all instances where a respondent reported traveling with other household members, was
the shared trip reported for all other household members?
For all trips with ―auto-driver‖ as the reported mode, was the respondent a licensed driver?
For all trips reported as ―auto-passenger‖, did another household member report the same trip
as an auto-driver? If not, did the passenger report riding in a non-household vehicle with at
least one other person making the trip?

PTV NuStats 17 ARC Regional Travel Survey Final Report
Figure 6: Data Processing Flow Chart

PTV NuStats 18 ARC Regional Travel Survey Final Report
Real-Time Geocoding with Trip Builder
All trip-ends and habitual addresses were geocoded during the retrieval telephone and Web interviews
with the Trip Builder software. The Trip Builder software was designed to provide interviewers or
respondents using the Web program with study area details (road names, landmark references, etc.
using Google interface). Interviewers used this additional detail to confirm respondent-reported locations
in real time. An additional benefit of the use of the Trip Builder software was that once the interview
was completed, full address information, with matching X/Y coordinates, for 100 percent of the locations,
was immediately available.
Assessment of Survey Quality
For the full study, the survey quality was improved when compared to the pre-test. Non-response items
in Household, Person, Vehicles, and Retrieval items had a decreased non-response rate for the key
variable compared to pretest.
Non-Response Analysis
The following is a summary of item non-response for the recruitment effort. The percentages indicated
are the proportion of responses that were ―don‘t know‖ and/or ―refused.‖ At the household level, income
refusals were the highest with 8.3 percent of all recruited households refusing to answer this question.
Other data items such as race/ethnicity, landline telephone in household, and home ownership resulted
in minimal non-response. In reference to the pre-test data set, the full study saw a significant decrease
in the percentage of non-response. See Table 16 for more information on Household Variables Item Non-
Response.
Table 16: Final: Household Variables Item Non-Response
Household File % Non-
Response
Race/Ethnicity 1.6%
Home ownership 0.3%
Landline telephone 0.2%
Household income 8.3%
At the person level, the 8.5 percent non-response rate for the question asking whether the employer
provided a transit pass largely reflects uncertainty or inability to answer, rather than refuse, the
question. All other items are within reasonable bounds and are comparable to other studies of this type.
Table 17 shows all variables at the person level that experienced item non-response.

PTV NuStats 19 ARC Regional Travel Survey Final Report
Table 17: Final: Person Variables Item Non-Response
Person File % Non-Response
Age 2.5%
Disability 0.4%
Employment 0.2%
Volunteer 1.7%
Status of unemployment 2.1%
Days worked per week 5.0%
Mode of travel to work 0.7%
Flexible work schedule 3.0%
Employer provided parking 2.3%
Employer provided transit pass 8.5%
Level of education 0.2%
Student status 0.5%
Frequency of travel to work/school by bike/walk in last week 2.4%
In the vehicle file, none of the items presented a significant degree of refusal. See Table 18 for more
information on vehicle variable item non-response.
Table 18: Final: Vehicle Variables Item Non-Response
Vehicle File % Non-
Response
Vehicle year 1.9%
Vehicle make 0.6%
Vehicle ownership 0.9%
Finally, the following is a summary of item non-response for the retrieval effort. The percentages
indicated are the level of responses that were ―don‘t know‖ and/or ―refused.‖ All items are within
reasonable bounds and are comparable to other studies of this type.
Table 19: Final: Retrieval Variables Item Non-Response
Place File % Non-
Response
Reason for making no trips 1.1%
Parking location 0.4%
Paid to park 1.8%

PTV NuStats 20 ARC Regional Travel Survey Final Report
Edit Checks
The Edit Check module is used by analysts to check data for consistency and accuracy, as well as to
transform data to the final delivery format and perform summaries on this data. For the Edit Check
section, there are a number of queries that are run to check the quality of the data and update the status
flags for any existing data and other queries. The following table details the automated edit checks
performed on the full-study data set.
Table 20: Edit Checks
Error
Code Message Treatment FILE
1 Arrival before departure (TRIP) Check to see if TRPDU is >0, If not there is a time
error between this row and the previous row
TRIP
2 Departure before arrival (TRIP) Check to see if ACTDU is >0, If not there is a time
error between ARRIVAL and DEPATURE
TRIP
3 TOP PRIORITY--First place does not start at 3am
(TRIP)
Check the ARRIVAL time of PLANO=1, it should be
300, if not maybe the first trip is missing or there is a
reporting error
TRIP
4 TOP PRIORITY--Last place does not end at 2:59am
(TRIP)
Check the DEPART time of the last trip, it should be
259, if not maybe there is a numbering error
between trips or the last trip has a reporting error
TRIP
5 Last place not home- confirm (TRIP) Confirm with last place description TRIP
6 TOP PRIORITY--Need location information
(LOCNO=0 or is NULL) (TRIP)
Look for shared trips, look in RET data TRIP
7 Day Time Totals <> 1439 (TRIP) One of the TRPDUR/ACTDUR's is false TRIP
8 Need reason for no travel/filled in and should not
be (PER)
Check NOGO/O_NOGO PER
10 HHSIZ (HH) not equal to person count (PER) Check PER data to see if everyone is a valid
person , then modify HHSIZ
HH/PER
11 HHVEH (HH) not equal to vehicle count (VEH) Check VEH data to see if vehicle is a valid vehicle
, then modify HHVEH
HH
12 UPDATE WORKS Check Per data to see if Emply =1 or Volun =1
and Works <>1
PER
12 HHWRK (HH) not equal to workers count (PER) Check PER data to see if everyone >15 has a valid
EMPLY code, then modify HHWRK
HH/PER
12 HHWRK (HH) not equal to workers count (PER) Check PER data to see if everyone >15 has a valid
EMPLY code, then modify HHWRK
HH/PER
14 HTRIPS (HH) does not match number of household
trips (TRIP)
Make sure only valid HH members >15 have trip
data
HH/TRIP
15 INCOM is missing or is out of range (HH) Check INCOM, look in REC data HH
16 ASSN or DAY is missing or invalid (HH) Check ASSN, make sure it is a valid number, look
in REC data
HH
18 RESTY missing or is out of range (Including RESTO) Check RESTY and RESTO, look in REC data HH
20 HHSTU does not match number of HHSTU RERUN PRECLEAN HH
21 TRIP - Person without Drivers License Driving Check Person Roster PER
22 TRIP - Person Making Trips not in PER file (PER/TRIP) Check Trip file or Person Roster for inconsistency TRIP
26 Person is missing from trip file (PER/TRIP) This person is missing from the trip file, look in RET
data and if unresolved send to research (this
person may have been deleted RET)
PER/TRIP
28 TRIP-person traveling together (TRIP) TRIP
29 AGE and/or GENDER is missing or out of range
(PER)
Check AGE and GENDER, one could be missing,
RET (addper) and REC data
PER
36 PROXY or INTRV missing Check PROXY and PER (addper) can also check
RET look for interviewed variable
PER
37 PERSON not in HH file There is no HH in the HH table for this PERSON,
check REC and RET or send to RESEARCH
HH/PER

PTV NuStats 21 ARC Regional Travel Survey Final Report
Error
Code Message Treatment FILE
40 Work marked as "home" (WLOC) but
WADD<>HHADDR (PER/HH), IF NOT CHECK, if
WADDR is Missing from PER file.
Check if WLOC is not home PER
41 Work trip address does not match WADDR
(PER/TRIP)
Check WLOC, maybe 2 works PER/TRIP
43 Unemployed person working or work related on
travel day (PER/TRIP)
Check to see if work is valid activity, if no work is in
PER, update PER with WORK information (add per)
PER/TRIP
45 School info missing (PER) - SCHOL is Null Check PER school data, update from RET (add
per)
PER
45 School info missing (PER) - SCHOL is not Null Check PER school data, update from RET (add
per)
PER
45 SNAME, SXCORD is missing when SLOC is not
home or vice versa
Check PER school data, update from RET (add
per)
PER
47 School trip address does not match SADDR
(PER/TRIP)
Maybe the school is in there twice as 2 different
locnos or there are 2 schools.
PER/TRIP
50 Trip duration (TRPDU) is out of range or does not
agree with PLANO (TRIP)
Check Arrival time of current place and
departure time of previous place, PLANO=1
should have a null TRPDU
TRIP
53 Travel in (TRIP) file does not correspond to a
person (PER)
Extra TRIP data, this person is not in per. Check to
see if PERNO's changed in RET (add per and del
per)
PER/TRIP
54 PTRIPS (PER) does not match number of person
trips (TRIP)
RERUN PRECLEAN PER/TRIP
55 Home trip does not match HHADDR (HH/TRIP) Repull LOC , check TRIP and LOCNO of PTYPE 1 HH/TRIP
58 MODE does not agree with PLANO or is a refusal
(TRIP)
PLANO 1 should not have a mode, there should
be a MODE for all other PLANO's
TRIP
60 Non-student doing school activities on travel day
(PER/TRIP)
Check ACT1/ACT2 in TRIP, Check AGE, if a
student add student variables to PER, if not,
change activity to match place
PER/TRIP
62 Number of household members traveling together
is larger than household size
Check HHMEM in TRIP it is too large TRIP
65 ACTIVITY DURATION =0 Check If TRIP if it is loop trip TRIP
68 LOOPTRIP-Weird trip purpose or extra trips Review TRIP data TRIP
69 LOOPTRIP2-Confirm either TPURP or TPUR2 are 96 Review TRIP data TRIP
78 VEH YEAR is missing or is out of range (VEH) Check Rec data VEH
94 PER - Employment Verification
(EMPLY,VOLUN,WORKS) - Part 1
Check REC and RET PER tables PER
96 PER - WORKER (WLOC, OCCUP, INDUS) - Part 3 Check REC and RET PER tables PER
98 PER - WORKER (WNAME,WMODE,O_WMODE,
WADDR) - Part 5
Check REC and RET PER tables PER
104 PER - STUDENT (SMODE,O_SMODE,SLOC, SNAME,
SADDR, SXCORD)
Check REC and RET PER tables PER
108 EMPLY=1 but VOLUN is not null Update VOLUN to NULL PER
116 PER -AGE is Null OR AGEB is NOT NULL Update AGEB to NULL PER
117 PER - DISAB is null or DTYPE,DSLIC,TWEXT is null Check REC and RET PER tables PER
120 PER - WKSTAT is null Check Work Status PER
121 PER - WKSTAT is not null Check Work Status PER
122 PER - WDAYS is null Check Work Status PER
126 VEH - MODEL or MAKE is DK/RF and BODY is null Check REC and RET VEH tables VEH
128 TRIP - PARTY is >0 and HHMEM is null Review TRIP Trip

PTV NuStats 22 ARC Regional Travel Survey Final Report
Error
Code Message Treatment FILE
129 TRIP - PERTP is null and HHMEM > 0 Review TRIP Trip
136 PER-OCCUP Contains Will Provide Check RET PER PER
137 HH - Zero-trip household - Confirm Obtain travel info from day where trips were
made
TRIP
138 PER - School-aged person not a student Obtain school information, or reason not in school PER
139 TRIP - Auto passenger riding alone Include driver in PARTY or change to driver TRIP
140 PER - Person under 14 years old is PROXY=1. PROXY
shuld be 2.
Change PROXY to 2 and get the proxy person #
from tb_personextended table
PER
152 Update PTYPE to 1 Check If PNAME = Home and PTYPE<>1. TRIP
153 Look for home xycoordinates in trip table or
geocode haddr
HH/TRIP
154 Transit Trip - Missing Access and/or Egress Trip. Flagged for Research TB
155 Out of area hosuehold - Need Out of Area Addr
and needs to be geocoded
TB
156 Speed is too fast(Place is wrongly geocoded or
mode is wrong or travel time is wrong)
TB
157 O_NOGO is missing or O_NOGO not required Check O_NOGO TB
158 CHECK TPURP, O_TPURP TB
159 CMPLG missing Flag for Research TB
160 ROUTE SERVC missing Flag for Research TB
161 Under 15 Driving Check If LIC=1 in PER. Per/TRIP

PTV NuStats 23 ARC Regional Travel Survey Final Report
Geographic Coverage
The Table 21 describes the geographic distribution of recruitment completes, retrieval completes,
progress to goal, and percentage of retrieval refusal. Overall, the survey achieved 103 percent progress to
goal with a 63 percent retrieval rate and 60 percent retrieval refusal rate.
Table 21: County Distribution
County Retrieval
Goal Recruits Retrievals % of Goal
Retrieval
Rate
Retrieval
Refusal Rate
Barrow 128 198 111 86.70% 56.10% 78.62%
Bartow 176 292 187 106.30% 64.00% 60.89%
Carroll 216 373 203 94.00% 54.40% 74.01%
Cherokee 396 604 391 98.70% 64.70% 56.04%
Clayton 469 874 503 107.20% 57.60% 45.92%
Cobb 1359 2,226 1417 104.30% 63.70% 62.20%
Coweta 229 379 240 104.80% 63.30% 46.30%
DeKalb 1458 2,337 1481 101.60% 63.40% 54.32%
Douglas 229 356 210 91.70% 59.00% 65.67%
Fayette 196 299 210 107.10% 70.20% 47.44%
Forsyth 305 498 328 107.50% 65.90% 44.09%
Fulton 1946 3,110 1986 102.10% 63.90% 60.32%
Gwinnett 1373 2,267 1439 104.80% 63.50% 65.48%
Hall 311 527 323 103.90% 61.30% 57.83%
Henry 348 552 319 91.70% 57.80% 67.71%
Newton 175 246 151 86.30% 61.40% 60.99%
Paulding 254 477 326 128.30% 68.30% 43.96%
Rockdale 149 215 124 83.20% 57.70% 79.04%
Spalding 125 224 132 105.60% 58.90% 75.18%
Walton 158 320 197 124.70% 61.60% 55.27%
Total 10000 16,374 10278 102.80% 62.80% 59.62%

PTV NuStats 24 ARC Regional Travel Survey Final Report
Figure 7 shows all the retrieved or completed households by county in the ARC region.
Figure 7: Participating Household Locations (Map of ARC Region)

PTV NuStats 25 ARC Regional Travel Survey Final Report
Demographic Coverage
The full-study effort continually tracked the demographic representation to inform sampling procedures
in an effort to reach a representative sample. Table 22 shows the distribution of demographic
characteristics of participating households as compared to 2000 Census data. The sampling approach
resulted in a household distribution that varied from the Census in some areas, while matching in
others. Low-income households were somewhat under-represented, but overall household income tracks
with census data.
Table 22: Demographic Results Compared to Census
Demographic Retrieval General population
Data
Total Households 10,278 1,867,492
Household size 1 23.4% 26.7%
2 35.9% 30.9%
3 17.9% 17.1%
4+ 22.9% 25.3%
Household vehicles 0 4.1% 6.0%
1 25.3% 33.6%
2 42.9% 40.1%
3+ 27.8% 20.3%
Household Income Less than $10,000 4.1% 5.9%
$10,000 - $19,999 6.6% 4.2%
$20,000 - $29,999 6.9% 8.7%
$30,000 - $39,999 7.5% 9.8%
$40,000 to $49,999 7.0% 14.2%
$50,000 to $59,999 6.6% 19.7%
$60,000 to $74,999 8.1% 13.2%
$75,000 to $99,999 17.3% 13.8%
$100,000 to $149,999 16.4% 5.2%
$150,000 or more 11.1% 5.3%
Income Refusals 8.3% --
Residence Type Rent 16.2% 31.8%
Own 83.8% 68.2%
Type of Phone for
Household3
Cell Only 7.4% 15.5%
Other 92.6% 84.5%
Ethnicity White 54.4% 51.7%
African American 31.2% 31.1%
Other 14.4% 17.1%
Hispanic Yes 13.2% 10.8%
No 86.8% 89.2%
Respondent Gender4 Male 47.0% 49.4%
Female 53.0% 50.6%
Respondent Age5 <18 years old 23.3% 27.3%
18– 24 5.1% 8.9%
25 – 54 43.8% 45.9%
55 – 64 16.8% 9.7%
65+ 11.0% 8.3%
Age Refusals 2.5% -
3 Reference data: CDC/NCHS, National Health Interview Survey, 2007. Only state-wide data are available.
4 Reference table: ACS 2007-09, B01001. Sex by age - Universe: Total population 5 Reference table: ACS 2007-09, B01001. Sex by age - Universe: Total population

PTV NuStats 26 ARC Regional Travel Survey Final Report
Response Rates
The response rate calculation entails the calculation of two rates, which are then multiplied together to
form a third rate. The first rate is the recruitment rate, which reflects the proportion of the sample that
was recruited into the study. There are two approaches to calculating recruitment rates: 1) that which is
prescribed by the Council of American Survey Research Organizations (referred to herein as the
recruitment rate), which tends to underestimate the real response rate, and 2) the simpler estimation of
participation rate, which is the ratio of all recruited households to all sample eligible for recruitment,
which tends to over-estimate the recruitment rate. The true recruitment rate lies somewhere in between.
The second rate is the retrieval rate, calculated as the proportion of all retrieved households to all
recruited households. The final response rate is derived by multiplying the recruitment rate (or
participation rate) by the retrieval rate.
Geographically, there were widely varying response, participation, and retrieval rates across the
counties. Table 23 shows the recruitment rate, participation rate, retrieval rate, and final response and
participation rates for the survey based on county. Overall, the survey had a final response rate of 6
percent and final participation rate of 34 percent; thus, the true response rate lies somewhere in
between.
Table 23: Response Rates by County
County Recruitment Rate Retrieval Rate Final Response
Rate
Recruitment Rate
(Participation)
Final Participation
Rate
Barrow 9.20% 62.01% 5.71% 51.14% 31.71%
Bartow 12.30% 68.50% 8.43% 55.49% 38.01%
Carroll 10.10% 57.34% 5.79% 51.01% 29.25%
Cherokee 9.70% 70.63% 6.85% 49.91% 35.25%
Clayton 9.80% 61.44% 6.02% 52.95% 32.53%
Cobb 7.30% 72.08% 5.26% 43.79% 31.56%
Coweta 8.20% 67.99% 5.58% 47.38% 32.21%
DeKalb 9.00% 71.92% 6.47% 51.84% 37.28%
Douglas 8.20% 65.31% 5.36% 49.16% 32.10%
Fayette 8.20% 78.87% 6.47% 45.61% 35.97%
Forsyth 9.40% 71.93% 6.76% 49.46% 35.57%
Fulton 8.80% 71.14% 6.26% 49.10% 34.93%
Gwinnett 8.00% 72.31% 5.78% 46.50% 33.62%
Hall 8.50% 65.72% 5.59% 49.25% 32.37%
Henry 8.10% 64.91% 5.26% 46.25% 30.02%
Newton 8.70% 67.41% 5.86% 49.23% 33.19%
Paulding 7.60% 74.43% 5.66% 43.54% 32.41%
Rockdale 8.50% 65.61% 5.58% 47.85% 31.39%
Spalding 9.80% 63.29% 6.20% 54.33% 34.38%
Walton 7.10% 64.80% 4.60% 47.13% 30.54%
Overall 8.50% 69.78% 5.93% 48.33% 33.73%

PTV NuStats 27 ARC Regional Travel Survey Final Report
The response rates for the ARC Regional Travel Study full-study effort are shown in Table 24, along
with those from other recent studies. The ARC Regional Travel Study full study response and
participating rates are similar to other studies.
Table 24: Response Rate Comparison to Other Surveys
Study Year Final Response and
Participation Rate
ARC Regional Travel Survey 2011 5.9% - 34%
CALTRANS HH Travel Survey 2011 5.5%
ARC Regional Travel Survey Pre-Test 2010 11% - 31%
Central Indiana Full Study 2010 41%
Oregon Full Study – Region 4 2009 39%
Oregon Full Study – Region 2 2009 44%
Central Indiana Pre-Test 2008 10%-36%
Oregon 1-day Pre-Test 2008 15%-46%
Chicago Full Study 2007–2008 10%-31%
Chicago Pre-Test 2006 9%-29%
GPS Subsample
In 2010, the Atlanta Regional Commission (ARC) contracted PTV NuStats, LLC to conduct the Regional
Travel Survey to support the planning data needs of the Atlanta region. GeoStats, a subcontractor to
PTV NuStats, was responsible for implementing the GPS component of this survey.
The objective of the GPS component of the full-study effort was to deploy GPS data loggers to at least
1500 households, with a target goal of obtaining 1,000 GPS/Diary complete households. The purpose of
the GPS component was to collect detailed information about all trips made by the GPS subsample and
to estimate levels of trip underreporting in this subsample that could be applied to the larger, non-GPS
sample. A split design was recommended, with the objective to obtain 667 complete households with in-
vehicle GPS data and the remaining 333 complete households with wearable GPS data. The GPS devices
were to be used for seven days by the vehicle sample and three days by the wearable sample, with the
first day coinciding with the assigned diary/travel day.
This split technology design allowed for the collection of seven days of highly accurate vehicle-based data
with minimal respondent burden while focusing the use of the wearable GPS device to those households
that report some incidence of transit use for the work or school commute. Households selected for the
wearable GPS component were deployed for three days with all household members between the ages of
16 and 75 (inclusive) receiving GPS equipment. As an Atlanta-based firm, GeoStats handled all
equipment deployments (both shipping and returns) from their west-midtown office. A $25 incentive per
instrumented vehicle or person was offered to all recruited GPS households for successful reporting of
travel data, for use of all GPS devices provided, and for return of all devices.
To test the methods and systems to be used in the full-study effort, PTV NuStats and GeoStats
conducted a pre-test in the fall of 2010. Based on the results of the pre-test, materials and protocols were
updated, and the full study began in 2011. The spring phase of the main study was fielded between
March and May 2011. The fall phase of the main study was fielded in August and September 2011. This
report documents the GPS data collection and processing methods used in the main study.

PTV NuStats 28 ARC Regional Travel Survey Final Report
Deployment Methods and Results
This section of the report will describe the GPS equipment used, will review the methods employed to
distribute and collect the GPS devices, and will present the results of the deployment effort.
In-Vehicle GPS Equipment
The QStarz BT-Q1000x Travel Recorder (Figure 8) was used for the in-vehicle GPS component of this
study. This device captures date, time, latitude, longitude, speed, and other standard GPS variables, and
can be configured to collect additional variables including heading, horizontal dilution of precision
(HDOP), and number of satellites. This recent entry in the market was tested thoroughly by GeoStats
staff in late 2009 and was successfully deployed in the recent large-scale Front Range Travel Counts
survey (conducted in Pikes Peak and Denver, Colorado) to collect one week of GPS in-vehicle data. In the
Atlanta Regional Travel Survey main study, this device was provided to participants with a vehicle
power cable and power splitter so that participants could also charge other personal devices if needed.
The power cable also has a small suction cup attached so that the participant could secure the cable and
device on the dashboard near the windshield to prevent slippage. GeoStats provided 460 QStarz BT-
Q1000x devices to support the deployment of 1,000 households to meet the in-vehicle GPS deployment
goals. Over the course of the full study, 800 GlobalSat devices were provided to support deployment of
1,277 households to meet the in-vehicle GPS completion goals.
Figure 8: QStarz BT-Q1000X Travel Recorder
Wearable GPS Equipment
The GlobalSat GPS Data Logger is a rugged yet simple GPS data logging device (see Figure 9) that has
been deployed by GeoStats in eight household travel studies and physical activity studies conducted
since 2007. The GlobalSat device is lightweight (6 oz.) and small (2.75‖x3.15‖x.7‖). It can be worn on the
waist, clipped to a purse or backpack, or dropped in a suit jacket pocket.
This device can log at various frequencies, can log all valid GPS points or only those valid points for
which the speed is greater than one MPH (to screen out non-movement events), and has a 60,000 GPS
point storage capacity. For the purpose of this study, the logging frequency was 4-second intervals with
the speed screen activated. The standard GPS data stream elements recorded by the GlobalSat include
date, time, latitude, longitude, and speed. These elements are stored in the logger in standard NMEA
units and are converted into user-specified units and formats upon download. At the start of the study,
230 GlobalSat devices were provided to support deployment of 500 households to meet the in-vehicle
GPS deployment goals. Over the course of the full study, 400 GlobalSat devices were provided to
support deployment of 661 households to meet the wearable GPS completion goals.

PTV NuStats 29 ARC Regional Travel Survey Final Report
Figure 9: GlobalSat DG-100 GPS Data Logger
Deployment Procedures
The deployment team conducted the deployment process out of the GeoStats office because of its location
within the study area. Households were recruited into the travel survey at least 10 days prior to their
assigned travel date. As GPS households were recruited, GeoStats pulled recruitment details (such as
names, addresses, phone numbers, and person rosters) daily and imported this information into its
database. This recruitment information was then available on the GPS Study Management Website for
use by the in-house deployment team.
The deployment team members signed on to the password-protected Website on a daily basis to review
upcoming deployments. The lead time between the posting of recruited households to the Website and
the assigned travel date is typically seven days, allowing sufficient time to prepare the necessary
documents, diaries, and equipment, and to ship them to arrive prior to the assigned travel date.
Simple printed instructions were shipped with the devices; these instructions also listed the assignment
of each logger to each household vehicle or household member (for either the vehicle or wearable GPS
sample, respectively) based on the logger identification number. A sticker was affixed to each GPS device
with the vehicle year and model for households recruited into the vehicle study or the first name of the
household member printed on the sticker for households recruited into the wearable study. The
instructions also emphasized the need to use the diaries to record travel on the assigned travel date. A
return device sheet was also provided on which the household members were asked to record if they used
the devices, and if not, to list the reason(s) why. Examples of the GPS device instructions and return
sheets can be seen in Appendix J following the cover letter (these three pages were sent as a set with the
equipment and diaries).
GPS devices and were shipped via FedEx. Participant instructions, equipment, diaries, and a pre-paid
return FedEx Pak were placed in a cardboard box and secured with packing material. The equipment
was delivered to the household two business days prior to the assigned travel day. After the assigned
GPS data collection period, households were instructed to place all of the equipment and the return
device sheet in the original box, to insert that box in the FedEx Pak, and to either put the package into a
FedEx drop box or call 1-800-GoFedEx to schedule a pick-up at their home. Outbound and return
equipment packages were tracked on the FedEx Website, with tracking information loaded on the GPS
Study Management website. GeoStats requested that the participants hold on to their diaries, either
reporting travel over the phone, reporting travel online, or returning the diaries in the pre-paid return
envelope provided with the diaries.
The deployment team was instructed to prepare and ship equipment packages for each household listed
on the deployment website and to update the household deployment status when appropriate. The
default status for deployment when recruit information was first loaded was ‗Recruit‘. They could then
change this status to reflect the current state of the deployment process; the following is a list of all
household deployment status codes:
Recruited

PTV NuStats 30 ARC Regional Travel Survey Final Report
Shipped
Deployed
Complete (deployed and retrieved)
Invalid Address
Returned Refused (elected not to participate)
Not Returned/Lost
Over-recruit
The first four statuses reflect the natural progression of a successful deployment, whereas the final four
statuses reflect GPS recruits that did not result in a useful deployment. The last status, Over-recruit,
was assigned when a household was recruited without enough lead time for the equipment to be shipped
(and they were not able to be rescheduled) or when there were no qualifying vehicles or persons in a
given household due to a recruitment error.
After receiving the returned equipment, the deployment staff downloaded the GPS data from the loggers
and then cleared the device memory for redeployment. The downloaded GPS files were then imported
into the project database at the GeoStats office, where all further GPS data processing occurred.
Deployment personnel were also responsible for updating the person-level equipment usage status fields
as reported by each household and for recording any household or person-level comments on the Website.
Deployment Results
Equipment was deployed (i.e., successfully delivered) to 1,839 households. GeoStats developed an
equipment retrieval management system in Microsoft Access to coordinate follow up with all GPS
households that did not immediately return their GPS equipment as instructed. First, a phone call was
placed to the home telephone number for all households that did not return their GPS devices within one
week after the last GPS travel date. When a person answered or an answering machine picked up, a
message was delivered thanking the household for their participation and requesting that the GPS
equipment be returned in the pre-paid FedEx envelope. A toll-free number was left if the household had
any questions. If no person or answering machine was reached, additional calls were attempted.
If equipment still had not been returned by three weeks after the last GPS travel day, a letter was sent
to the home. A second equipment retrieval letter was mailed to the household if equipment was still
outstanding after five weeks. During the final week of the study, phone calls were made and letters were
mailed simultaneously in an attempt to retrieve as much equipment as possible. See Appendix J for an
example of the letter sent as a reminder to households that did not return equipment.
At the time of this report, there were 93 households across both vehicle and wearable GPS recruits that
had not returned the GPS devices sent to them. Table 25 shows the final totals for each deployment
disposition category by sample type. The counts for Returned Refused are included in the Total Returned
numbers. Households that were not deployed (19 vehicle and 8 wearable) because of recruitment issues
are not included in these tables.
Table 25: Recruitment and Deployment Statistics by GPS Sample Type
Sample Type Total Deployed Deployed,
Returned
Still Deployed /
Not Returned % Not Returned
Vehicle GPS 1277 1222 55 4%
Wearable GPS 661 623 38 6%
Total 1938 1845 93 5%

PTV NuStats 31 ARC Regional Travel Survey Final Report
Participation Results
Table 26 shows the results of the GPS component with respect to collecting both Diary and GPS data on
the assigned travel date based on sample type.
Table 26: Participation Statistics by GPS Sample Type
Sample Type GPS Statistics Diary Statistics
GPS and Diary
Combined
Deploy Return % Return Deploy Return % Return Deploy Return % Return
Vehicle GPS 1277 1222 96% 963 75% 916 72% 727 57%
Wearable GPS 661 623 94% 483 73% 419 63% 334 51%
Total 1938 1845 95% 1446 75% 1335 69% 1061 55%
As seen in Table 27, complete GPS and diary data were collected from 1,061 households out of the 1,938
households deployed in this study, which is a 55 percent completion rate. A complete (GPS and diary)
household is defined as one in which diary data were retrieved for the household and GPS data were
either collected from each instrumented vehicle or person on the assigned travel date, or, if not collected
from a given vehicle or person on the assigned travel date, then the diary data confirmed no travel for
that vehicle or person.
Table 27 shows the overall data collection disposition of all households participating in the GPS
component by study type (vehicle or wearable). There are categories (or levels) of participation other
than full GPS and diary completion that are also useful for analysis. In fact, beyond the combined 1,061
GPS/Diary complete households, an additional 392 households collected complete GPS data without
reporting diary data.
Table 27: Disposition of GPS and Diary Retrieval Outcomes
Participation Outcome
Frequency
Vehicle % Vehicle
Frequency
Wearable % Wearable
Complete (GPS + Diary) 727 57% 334 51%
Full GPS data but no Diary data 233 18% 146 22%
Partial GPS data but no Diary data 0 0% 0 0%
Partial GPS data and full Diary data 106 8% 48 7%
No GPS data but full Diary data 80 7% 34 5%
No GPS data and no Diary data 128 10% 96 15%
GPS + Diary data on different dates 3 0% 3 0%
Total 1277 100% 661 100%
GPS and Diary Trip Matching Results
There were a total of 1,422 GPS vehicles in the 727 complete vehicle GPS households and 649 GPS
persons in the 334 wearable GPS households. The 1,422 GPS vehicles captured 6,366 GPS trips on the
assigned travel days, compared to 5,430 reported trips for these same vehicles. The 649 GPS persons
captured 3,601 GPS trips on their assigned travel day compared to 3,281 reported trips for these same
participants. Therefore, across both the vehicle and wearable GPS samples, a total of 9,967 GPS trips
were collected compared to 8,711 reported trips for the same vehicles or persons.

PTV NuStats 32 ARC Regional Travel Survey Final Report
Reporting Exceptions
In some household travel surveys, work-related trips (i.e., commercial use of personal auto) and external-
to-external trips (i.e., those that have origins and destinations outside of the planning region) are not
reported in the travel diary and not collected during the retrieval interview. Other unreported trip types
include loop trips (i.e., those that start and end at the same location) and on-site travel (i.e., trips that
are conducted on the premises of one property, like a hospital or apartment complex). It should be noted
that in the Atlanta Regional Travel Survey full study, participants were instructed to report all trips,
with no reporting exceptions.
Given that participants in this study were instructed to report all trips, the remainder of the missed trip
analyses will present results that include the reporting exceptions. At the end of the analyses, a
summary table showing the difference in missed trip rates if these reporting exceptions are excluded is
provided. First, a breakdown of matching results by vehicle GPS and wearable GPS are presented.
Matching Results – Vehicle GPS Households
The results of the trip matching process for the vehicle GPS sample fell into the following three
categories:
1) 100 Percent Matched Trips. Any vehicle instrumented with GPS that captured the same
GPS trips as reported in diary were considered to be a perfect match. This category also
includes no travel vehicles, which had no GPS data collected on the travel date and no trips
reported for that vehicle on the assigned travel date. Of the 1,422 vehicles instrumented with
GPS devices in the 722 vehicle GPS/Diary complete households, 290 vehicles recorded no GPS
trips and were confirmed as not driven on the assigned travel day (20.4 percent of all
instrumented vehicles).
Of the 1,422 instrumented vehicles, 861 had perfect matches between the diary and GPS trip
data. The breakdown of this number includes the 290 vehicles that did not travel and 571
vehicles that made at least one trip. This represents a perfect match (or reporting rate) for 60.5
percent of all instrumented vehicles and for 2,452 of the 5,430 diary-reported trips (45.2
percent).

PTV NuStats 33 ARC Regional Travel Survey Final Report
Table 28 contains the trip frequency statistics for the vehicles included in this category.
Table 28: Trip Frequencies for Perfect Matches at Vehicle Level
# Trips Frequency Percent
Cumulative
Percent
0 290 33.7% 33.7%
1 13 1.5% 35.2%
2 161 18.7% 53.9%
3 70 8.1% 62.0%
4 100 11.6% 73.6%
5 76 8.8% 82.5%
6 58 6.7% 89.2%
7 37 4.3% 93.5%
8 23 2.7% 96.2%
9 15 1.7% 97.9%
10 9 1.0% 99.0%
11 2 0.2% 99.2%
12 4 0.5% 99.7%
13 2 0.2% 99.9%
14 0 0.0% 99.9%
15 1 0.1% 100.0%
Total 861 100.0% 100.0%
2) Trips reported by diary but not captured by GPS. The second comparison identifies diary
trips that had no corresponding GPS vehicle trips. During the matching process, 357 diary
trips were identified that had no corresponding GPS trip (which represents 5.3 percent of all
GPS trips). This typically happens when respondents install the vehicle GPS device after
travel has started on the assigned travel day or when the power supply is removed from the
device and there is insufficient internal charge to continue powering the device. It is also
possible that the device was not switched on throughout the travel day.
3) Trips captured by GPS but not reported by diary. The last category in the matching
process contains those cases where vehicle trips were identified within the GPS data stream
but not reported within the diary data. These 1,293 ―missed‖ diary trips were either single
links within a trip chain, multiple links within a trip chain, or complete round-trips missing all
links in a tour, based on characteristics of adjacent trips. Based on the total of 5,430 diary trips
reported, the missing 49 diary trips reflect a 19.2 percent missing trip rate across the vehicle
GPS sample. There were 245 typical reporting exceptions found in the missing diary trips. If
these 245 trips are excluded from the missed trip analysis, the missed trip rate falls to 16.2
percent. Further regression analyses are needed to generate specific correction factors at the
vehicle, person, household, and trip type levels for the overall pre-test sample.

PTV NuStats 34 ARC Regional Travel Survey Final Report
Table 29 shows the frequency of missing GPS and diary trip counts detected for the 561 vehicles that did
not have perfect matches between the diary and GPS data.
Table 29: Trip Frequencies for Missing GPS and Missing Diary Trips (Vehicle GPS)
# Trips Missing Missing GPS
Frequency
Missing Diary
Frequency
1 86 210
2 44 104
3 25 57
4 10 33
5 4 16
6 2 9
7 2 9
8 1 4
9 0 6
10 0 5
11 0 6
12 0 2
13 0 2
14 1 1
15 0 1
16 0 0
17 0 0
18 0 3
19 0 1
20 0 0
21 0 1
Total 175 470
Matching Results – Wearable GPS Households
The results of the trip matching process for the wearable GPS sample fell into similar categories:
1) 100 Percent Matched Trips. Any person instrumented with GPS that captured the same
GPS trips as reported by diary were considered to be a perfect match. This category also
includes no travel persons, or those for whom no GPS data were collected on the travel date
and no trips reported on the assigned travel date. Of the 649 persons instrumented with GPS
devices in the 334 wearable GPS/diary complete households, 61 persons had no GPS data and
were confirmed as no travel in the diary data (9.4 percent of all instrumented persons).
Of all trips made by the 649 instrumented persons, 277 persons had perfect matches between
the diary and GPS trip data. The breakdown of this number includes the 61 persons who did
not travel and 216 persons who made at least one trip. This represents a perfect match (or

PTV NuStats 35 ARC Regional Travel Survey Final Report
reporting rate) for 42.7 percent of all instrumented persons and 1,054 of the 3,281 diary-
reported trips (32.1 percent).
Table 30 contains the trip frequency statistics for the persons included in this category.
Table 30: Trip Frequencies for Perfect Matches at Person Level
# Trips Frequency Percent
Cumulative
Percent
0 61 22.0% 22.0%
1 0 0.0% 22.0%
2 45 16.2% 38.3%
3 35 12.6% 50.9%
4 34 12.3% 63.2%
5 34 12.3% 75.5%
6 18 6.5% 81.9%
7 13 4.7% 86.6%
8 12 4.3% 91.0%
9 7 2.5% 93.5%
10 9 3.2% 96.8%
11 6 2.2% 98.9%
12 1 0.4% 99.3%
13 1 0.4% 99.6%
14 1 0.4% 100.0%
Total 277 100.0% 100.0%
2) Trips reported by diary but not captured by GPS. The second comparison identifies diary
trips that had no corresponding GPS trips. During the matching process, 478 diary trips were
identified that had no corresponding GPS trip (which represents 11.7% of all GPS trips). This
typically happens when respondents place the GlobalSat device in a position in which it cannot
receive GPS satellite signals (such as in a purse or backpack) or forget to confirm that it is
powered on.
3) Trips captured by GPS but not reported by diary. The last category in the matching
process contains those cases where trips were identified within the GPS data stream but not
within the diary data. These 798 ―missed‖ diary trips were either single links within a trip
chain, multiple links within a trip chain, or complete round-trips missing all links in a tour,
based on characteristics of adjacent trips. Based on the total of 3,281 diary trips reported, the
missing 798 Diary trips reflect a 19.6 percent missing trip rate across the entire sample.
However, when the typical reporting exceptions are excluded from this analysis, the missed
trip rate falls to 14.6 percent for the person GPS sample. As mentioned previously, further
regression analyses are needed to generate specific correction factors at the person, household,
and trip type levels for the overall sample.

PTV NuStats 36 ARC Regional Travel Survey Final Report
Table 31 shows the frequency of missing GPS and diary trip counts detected for the 372 persons who
were not perfect matches.
Table 31: Trip Frequencies for Missing GPS and Missing Diary Trips (Wearable GPS)
# Trips Missing Missing GPS
Frequency
Missing Diary
Frequency
1 77 107
2 53 56
3 26 33
4 8 17
5 18 16
6 4 12
7 4 3
8 0 7
9 1 3
10 0 2
11 2 0
12 1 1
13 0 0
14 0 2
15 0 1
16 0 0
17 0 0
18 0 0
19 0 0
20 0 0
21 0 0
22 0 0
23 0 0
24 0 0
25 0 0
26 0 2
27 0 0
28 0 0
29 0 1
Total 194 263

PTV NuStats 37 ARC Regional Travel Survey Final Report
Overall Matching Results
Table 32 shows the GPS-detected and diary reported trip counts for each GPS sample. The raw
difference between the two has also been calculated; however, these raw counts do not reflect missing
trip counts given that there may be missing GPS and diary trips for a given vehicle or person.
Table 32: GPS and Diary Trip Counts for Vehicle and Wearable GPS Samples
# GPS trips
# DIARY
trips
raw
difference
Vehicle GPS 6,366 5,430 936
Wearable GPS 3,601 3,281 320
Total 9,967 8,711 1256
Table 33 shows the missing GPS and missing diary trip rates by GPS sample type. The first set of
columns lists the missing GPS rates, the second set lists the missing diary trip rates (including any of
the 484 trips that are sometimes excluded in reporting, although not in this study), and the third set
lists the missing trips rates if the exceptions are not counted
Table 33: Missing Trip Rates
GPS Missing Trips Diary Missing Trips
(including exceptions)
Diary Missing Trips
(excluding exceptions)
# missed
GPS % missed
# missed
DIARY % missed
# missed
DIARY % missed
Wearable GPS 478 11.7% 798 19.6% 559 14.6%
Vehicle GPS 357 5.3% 1,293 19.2% 1048 16.2%
Total 835 7.7% 2,091 19.4% 98 15.6%
Link Matching
Another task included in the GPS component of this study was link matching the GPS points confirmed
as valid trips to GIS spatial layers. Consequently, upon completion of the GPS trip review process, the
files were run though a link matching routine. This routine compared GPS point sequences with linear
spatial databases representing different elements from the study area‘s transportation infrastructure.
Process Description
The algorithm used to perform the matching was based on the one proposed by Marshal, Hackney and
Axhausen6, with the added feature of performing shortest network paths on gaps found in the final
routes. The spatial layer used in this process was obtained from ARC7 in ESRI Shapefile format; prior to
processing, they were imported into PostGIS for more efficient access by the matching routine. Each
record in the Shapefile received a unique id in PostGIS, which matched its position in the original file;
this field (uid) was used to associate the GPS points with the link features.
6 F. Marchal, J. Hackney, K. W. Axhausen, Efficient Map Matching of Large Global Positioning System Data Sets: Tests on Speed-
Monitoring Experiment in Zürich, Transportation Research Record: Journal of the Transportation Research Board,
Transportation Research Board of the National Academies, 2006. 7 Obtained from the Atlanta Regional Commission‘s Atlanta Regional Information System (ARIS)

PTV NuStats 38 ARC Regional Travel Survey Final Report
The link layer was stored using the NAD 1983 Georgia West State Plane projection in Feet. The GPS
points were matched based on the travel modes they were associated with in TIAS, only modes bound to
the street network were matched (Table 34).
Table 34: List of Travel Modes Included in the Matching Process
Mode Id Description
3 Auto / Van / Truck Driver
4 Auto / Van / Truck Passenger
5 Local Bus
6 Express Bus
8 Dial-a-Ride / Paratransit
9 Taxi / Limo
10 School Bus
11 Motorcycle / Moped
Spatial operations were performed in the layer‘s original local projection with GPS coordinates projected
on the fly. The match tolerance was set at 150 feet (approximately 50 meters). This value was selected
based on the spatial resolution and detail of the street networks and also by iteratively running the
matching routines and reviewing results.
The GPS points were associated with links by intersecting lines perpendicular to the points‘ trajectories
with the route‘s links. Linear referencing measurements were computed by calculating the distance
along the routes‘ individually matched segments to the point snaps. Distances were saved in meters.
The output of this process was saved to the gpslinks table, which shows the link sequence used to
complete a given trip. The time stamps in this table can be used to select individual GPS points
associated with the links. The data dictionary that appears in Appendix D contains detailed field
descriptions for this table.
Data Weighting and Expansion
From a finite population sampling theory perspective, analytic weights are needed to develop estimates
of population parameters and, more generally, to draw inferences about the population that was
sampled. Without the use of analytic weights, population estimates are subject to biases of unknown
(possibly large) magnitude. Consequently, analytic weights are crucial to obtain survey estimates with
minimal bias.
The weighting approach used in this study accounts for the biases associated with sampling and
robustness of the data collected. Specifically, the components of the analytic weights generated using
this method are as follows:
Sampling weights
Raking adjustments
The analytic weights are computed at the household and person level. These weights adjust the relative
importance of responses to reflect the different probabilities of selection of respondents and align the
sample distributions to population distributions. This section discusses the components of the household
weight and person weight in detail.

PTV NuStats 39 ARC Regional Travel Survey Final Report
Household Weight
Sampling Weight
The sampling weight reflects the probability of selection of an address from the sampling frame.
Considering the dual-frame sampling framework employed in this study, separate sampling weights
were calculated for the address-based and listed residential samples. Specifically, the sampling weight
for a sampling unit j in the sampling frame, denoted as ,j SampFrW , is simply the reciprocal of the selection
probability of the sampling unit.
,
,
1
Probj SampFr
j SampFr
W
where,
Sampling unit j is an address in the Address-based sampling frame and the Listed Residential
frame.
Sampling frame SampFr is Address-based or Listed Residential sampling frame.
Given that each sampling unit has an address associated with it, all sampling weight computations were
made by geography. Specifically, county-level sampling weights were computed for the address-based
sample and listed residential sample. To illustrate, sampling weight for each county in the address-
based sample was computed as the number of addresses in the county in the address-based frame
divided by the number of sample pieces ordered from the frame for that county. The sampling weights
adjust for oversampling of specific geographies or demographic groups of interest (that can be identified
by geography) for which we had implemented controls to make sure that we have adequate observations
in these groups.
Raking Adjustment
Raking improves the reliability of the survey estimates; hence, raking adjustments were used to align
the weighted sample to population statistics from 2008–10 American Community Survey (ACS) data and
2010 Census. These adjustments were made using raking variables. In particular, the aforementioned
weights were adjusted so that the sums of the adjusted weights are equal to known population totals for
certain subgroups of the population defined by demographic characteristics and geographic variables.
The variables and variable categories used for raking at the household level are as follows:
Household size (1, 2, 3, 4, 5, or more)
Household income (<20,000; 20,000–40,000; 40,000–60,000; 60,000–75,000; 75,000–100,000;
100,000–150,000, >150,000)
Total number of workers8 in the household (0, 1, 2, 3, or more)
Number of vehicles owned by the household (0, 1, or more)
County of residence
Area type of residence (CBD, Urban Commercial, Urban Residential, Suburban Commercial,
Suburban Residential, Exurban, Rural)
Note that the census distributions of household size, county, and area type of residence were obtained
from Census 2010. For the remaining variables, census distributions were obtained from 2008–10 ACS
data. These variables were chosen as the raking variables due to significant differences in the coverage
by categories of these variables. Therefore, it is reasonable to expect that maximum bias reduction would
be achieved using these variables. It is important to note that the missing values in the raking variables
8 Note that workers were defined as people who are employed full-time or part-time.

PTV NuStats 40 ARC Regional Travel Survey Final Report
were imputed to calculate the raking adjustments. The raking procedure is based on an iterative
proportional fitting procedure and involves simultaneous ratio adjustments to two or more marginal
distributions of the population counts. The raking procedure is undertaken in a sequence of adjustments.
First, the base weights are adjusted to one marginal distribution and then to the second marginal
distribution, and so on. One sequence of adjustments to the marginal distributions is known as a cycle or
iteration. The procedure is repeated until convergence is achieved. Following the raking procedure, the
inordinately large weights, a by-product of raking, were capped. In particular, the ―very large‖ weights
were capped to equal a maximum of five times the mean weight.
Table 35 shows the survey and population distributions by demographic and geographic raking variables
for the study area. A comparison of the unweighted difference before raking and weighted difference
after raking between the survey data and the census indicates that the raking procedure has aligned the
sample statistics to the population statistics.
Table 35: Raking Adjustment at Household Level
Raking Variable Census Survey Data Difference (% points)
Before Raking After Raking Before Raking After Raking
Household Size
1 25.3% 23.5% 25.4% 1.8% -0.1%
2 30.0% 35.9% 30.3% -5.9% -0.3%
3 17.3% 17.8% 17.4% -0.5% -0.1%
4 15.1% 15.2% 15.2% -0.1% -0.1%
5 or more 12.3% 7.6% 11.8% 4.7% 0.5%
Household Income9
$0–$19,999 15.4% 11.7% 16.1% 3.7% -0.7%
$20,000–$39,999 19.3% 15.7% 19.9% 3.6% -0.6%
$40,000–$59,999 17.5% 14.8% 16.5% 2.7% 1.0%
$60,000–$74,999 10.9% 8.8% 9.2% 2.1% 1.7%
$75,000–$99,999 12.9% 18.9% 12.2% -6.0% 0.7%
$100,000–$149,999 13.6% 17.9% 14.8% -4.3% -1.2%
$150,000 or more 10.3% 12.1% 11.2% -1.8% -0.9%
Workers in the Household
0 19.4% 21.8% 19.6% -2.4% -0.2%
1 44.4% 40.8% 44.4% 3.6% 0.0%
2 30.4% 32.7% 30.4% -2.3% 0.0%
3 or more 5.7% 4.6% 5.6% 1.1% 0.1%
Number of Vehicles Owned by
Household
0 6.2% 4.1% 6.0% 2.1% 0.2%
1 or more 93.8% 95.9% 94.0% -2.1% -0.2%
9 The weighted survey data distribution for household income excludes the refusals.

PTV NuStats 41 ARC Regional Travel Survey Final Report
Raking Variable Census Survey Data Difference (% points)
Before Raking After Raking Before Raking After Raking
County of Residence
Barrow County 1.2% 1.1% 1.2% 0.1% 0.0%
Bartow County 1.9% 1.8% 1.9% 0.1% 0.0%
Carroll County 2.0% 2.0% 2.0% 0.0% 0.0%
Cherokee County 3.9% 3.8% 3.9% 0.1% 0.0%
Clayton County 4.7% 4.9% 4.7% -0.2% 0.0%
Cobb County 13.5% 13.8% 13.5% -0.3% 0.0%
Coweta County 2.4% 2.3% 2.4% 0.1% 0.0%
DeKalb County 14.1% 14.4% 14.1% -0.3% 0.0%
Douglas County 2.4% 2.0% 2.4% 0.4% 0.0%
Fayette County 2.0% 2.0% 2.0% 0.0% 0.0%
Forsyth County 3.1% 3.2% 3.1% -0.1% 0.0%
Fulton County 19.5% 19.3% 19.4% 0.2% 0.1%
Gwinnett County 13.9% 14.0% 13.9% -0.1% 0.0%
Hall County 3.1% 3.1% 3.1% 0.0% 0.0%
Henry County 3.6% 3.1% 3.6% 0.5% 0.0%
Newton County 1.8% 1.5% 1.8% 0.3% 0.0%
Paulding County 2.5% 3.2% 2.5% -0.7% 0.0%
Rockdale County 1.6% 1.2% 1.5% 0.4% 0.1%
Spalding County 1.2% 1.3% 1.2% -0.1% 0.0%
Walton County 1.5% 1.9% 1.5% -0.4% 0.0%
Area Type of Residence
CBD 0.2% 0.3% 0.2% -0.1% 0.0%
Urban Commercial 1.7% 2.2% 1.7% -0.5% 0.0%
Urban Residential 3.7% 3.5% 3.7% 0.2% 0.0%
Suburban Commercial 1.4% 1.4% 1.4% 0.0% 0.0%
Suburban Residential 57.3% 55.3% 57.2% 2.0% 0.1%
Exurban 18.2% 19.0% 18.3% -0.8% -0.1%
Rural 17.5% 18.2% 17.6% -0.7% -0.1%
Total 100.0% 100.0% 100.0% 0.0% 0.0%

PTV NuStats 42 ARC Regional Travel Survey Final Report
Final Household Weight
The final analytic weight is simply the product of sampling weight and raking adjustment. Following the
computation of this weight, an expansion procedure was undertaken to get the final ‗expanded‘ analytic
weight. The expansion process simply takes the weighted total households and multiplies each
household by a factor, when applied, expands the data to represent the universe of households in the
study area as defined by Census 2010. To derive the expansion factor, a simple division was used:
Expansion Factor = N(Universe)/ N(Surveyed). This translates to a survey universe of 1,928,783
households.
Person Weight
The person weight is a product of the final household weight and the person-level raking weight.
Specifically, the person data weighted by the ‗final household weight‘ was raked to align it to the
population statistics from 2010 Census data. The raking procedure is based on an iterative proportional
fitting procedure. The variables used for raking at the person level are as follows:
Hispanic Status/Race (Hispanic, Non-Hispanic White, Non-Hispanic African-American, and
Non-Hispanic Other)
Age (Younger than 20 years, 20–24 years, 25–34 years, 35–54 years, 55–64 years, 65+ years)
Following the raking procedure, the very large weights were capped. The weights were then expanded to
reflect the total number of persons residing in the study area as defined by Census 2010. This translates
to a survey universe of 5,260,436 residents. Table 36 shows the survey and population distribution by
the aforementioned raking variables. A comparison of the unweighted difference before raking and
weighted difference after raking between the survey data and the census indicates that the raking
procedure has aligned the sample statistics to the population statistics.
Table 36: Raking Adjustment at Person Level
Raking Variable10 Census Survey Data Difference (% points)
Before Raking After Raking Before Raking After Raking
Hispanic Status/Race
Hispanic 11.2% 5.8% 10.9% 5.4% 0.3%
Non-Hispanic White 50.1% 70.7% 51.0% -20.6% -0.9%
Non-Hispanic African-American 31.6% 19.3% 31.1% 12.3% 0.5%
Non-Hispanic Other 7.1% 4.1% 7.0% 3.0% 0.1%
Age
Under 20 years 29.4% 25.5% 29.6% 3.9% -0.2%
20–24 years 6.5% 3.3% 6.3% 3.2% 0.2%
25–34 years 14.5% 7.7% 14.0% 6.8% 0.5%
35–54 years 30.4% 35.8% 30.2% -5.4% 0.2%
55–64 years 10.4% 16.7% 10.7% -6.3% -0.3%
65 years and over 8.8% 11.0% 9.2% -2.2% -0.4%
Total 100.0% 100.0% 100.0% 0.0% 0.0%
10 The weighted survey data distribution for Hispanic status/Race and Age excludes the refusals.

PTV NuStats 43 ARC Regional Travel Survey Final Report
Limitations of the Survey
1) Response Rate and Survey Non-Response. Some level of non-response occurs in every
voluntary survey. Low response rates are attributable to a variety of factors, including growing
resistance among U.S. householders to surveys in general and telephone surveys in particular;
the changing patterns of telephone access in American households; and the growing number of
households in which English is not a first language—making telephone communication for
survey respondents who are not native English speakers difficult.11 Household travel surveys
are particularly susceptible to non-response. These surveys are complex, requiring a two-stage
interview process plus the completion of a travel diary by all household members. Since each
interview stage has an accompanying level of non-response, the overall response rate is the
product of a recruitment rate and a retrieval rate.
2) Under-Reporting of Trips. An important determinant of data quality is the accuracy of the
reported trips. To enhance reporting accuracy, most household travel surveys rely on travel
diaries in which respondents are asked to record each trip for a specific time period (e.g., 24
hours). Yet even with the use of diaries, under-reporting of trips by survey respondents is a
well-documented occurrence. Memory decay, failure to understand or to follow survey
instructions, unwillingness to report full details of travel, and simple carelessness all
contribute to the incomplete collection of travel data. After the data have been weighted and
expanded, the trip rates will need to be assessed relative to prior surveys and other
metropolitan areas.
3) Response Bias. Surveys are prone to non-response errors because certain types of households
selected in a sample do not participate in surveys or individual household members fail to
answer an item in an interview.
Recommendations for Study Improvement
Travel behavior study innovations are in continuous development by various research organizations.
Sponsors typically focus concerns on multiple elements relevant to their existing or planned models.
Future studies should consider each element and weigh the importance by priority and financial
investment. The indexing of priority, innovation, value, and cost is a difficult task, even for experienced
model coordinators.
Hispanic Outreach: Despite targeted sampling, response from Hispanic households was low. Based on
recent household travel survey experience in large metropolitan areas, its believed that robust public
outreach efforts involving the sponsoring agency and the research firm are necessary in order to
effectively communicate and generate interest with Hispanic communities. Public outreach efforts
should include press releases through community new media and messaging efforts through community
leaders, with the sponsoring agency providing the local presence and expertise.
Non-Response Follow-Up. Conducting in-person non-response efforts can increase the quality of the
study and decrease coverage bias. In-person interviews tend to be more expensive in cost. However,
conducting a limited non-response effort can allow for bias correction, through weighting the difference
in travel behavior from those that originally participate.
11 The survey was designed to include English and Spanish speakers only.

PTV NuStats 44 ARC Regional Travel Survey Final Report
Survey Results
The 10,278 regional households that participated in the Atlanta Regional Commission Regional Travel
Survey had many characteristics in common. In addition to living in the central portion of the state, they
were willing to take the time to record their travel and provide demographic information about their
households. These households provided data about their household composition, housing type and
ownership, and income. They provided details about their 25,810 household members, including age,
gender, disability status, and employment and student status. They divulged the year, make, and model
for each of their 21,270 vehicles. In addition, they willingly provided trip destinations, travel times,
travel modes, and the reasons for visiting 119,480 places during their respective 24-hour period. In all,
the households reported an average of 11.43 daily household trips and 4.22 daily person trips.
The purpose of this section is to summarize the characteristics of participating households and
understand the ways in which they are similar and how they vary, at both the person and the household
level. These differences are important in understanding their travel behavior, which is presented in the
second section of this chapter. Details about their trip characteristics comprise the third section, followed
by a more detailed look at mode choice and travel times reported by respondents, including travel
destinations during specific time periods.
Household Characteristics
Thirty percent of households reported having two household members, and just over 27 percent live in a
large household of four or more persons.
Table 37: Household Size (Weighted)
Household Size Frequency Percent
1 2,612 25.4%
2 3,110 30.3%
3 1,785 17.4%
4+ 2,771 27.1%
Total 10,278 100
Over 40 percent of household have two vehicles, 27 percent had at-least one vehicle, and 6 percent
households have no vehicles.
Table 38: Household Number of Vehicles (Weighted)
Number of Vehicles Frequency Percent
0 620 6.0%
1 2,819 27.4%
2 4,141 40.3%
3 1,792 17.4%
4+ 906 8.9%
Total 10,278 100.0%

PTV NuStats 45 ARC Regional Travel Survey Final Report
Thirty-four percent of the vehicles are 6–10 years old, while 3.2 percent had vehicles less than 1 year old.
Overall, 64 percent of the vehicles are at most 10 years old.
Table 39: Vehicle Age (Weighted)
Vehicle Age Frequency Percent
Less than 1 year 647 3.2%
1–5 years 5,760 28.7%
6–10 years 6,763 33.8%
11–20 years 5,716 28.5%
> 20 years 1,152 5.5%
Total 20,038 100.0%
Regarding ethnicity of the participating households, 68 percent were White, 25 percent were African
American, 2 percent Hispanic, while another and 5 percent belong to other ethnicities.
Table 40: Household Ethnicity (Weighted)
Ethnicity Frequency Percent
White 6,924 68.4%
African American 2,503 24.7%
Asian 216 2.1%
Native American, Alaskan Native 55 .5%
Pacific Islander, Native Hawaiian 10 .1%
Multi-Racial 182 1.8%
Hispanic, Mexican 211 2.1%
Other (Specify) 22 .2%
Total 10,122 100.0%
Overall participation by Hispanic or Latino household in the study was 5 percent.
Table 41: Hispanic or Latino Households (Weighted)
Hispanic Status Frequency Percent
Yes 477 4.7%
No 9,730 95.3%
Total 10,207 100.0%

PTV NuStats 46 ARC Regional Travel Survey Final Report
Overall, 77 percent of households reported living in Single-family Detached homes, 16 percent reside in a
Building with two or more Apartments or Condos, while and 5 percent live in a Single-family Attached
house.
Table 42: Household Residence Type (Weighted)
Ethnicity Frequency Percent
Single-family Detached House 7,927 77.2%
Single-family Attached House 508 4.9%
Building with 2 or more Apartments or Condos 1,679 16.3%
Mobile Home or Trailer 147 1.4%
Other(Specify) 8 0.1%
Total 10,269 100.0%
Seventy-nine percent of household reported owning their homes, while 21 percent are renters.
Table 43: Ownership of Household Residence (Weighted)
Ownership of Household Residence Frequency Percent
Rent 2,171 21.2%
Own/Buying (Paying Off Mortgage) 8,066 78.7%
Other (Specify) 11 0.1%
Total 10,248 100.0%
As shown in the Table 44, 92 percent of the participating households have landline telephone connection.
Table 44: Landlines in Household (Weighted)
Landlines in Household Frequency Percent
Yes 9,384 91.5%
No 871 8.5%
Total 10,255 100.0%
Over all household income distribution, 20 percent of the households have income in the range of
$20,000 to $40,000; 17 percent of the households have income in the range of $40,000 to $ 60,000; 16
percent of households have income less than $20,000; while another 15 percent of the households have
income in the range of $100,000 to $150,000. See Table 45 for more information about household income
distribution.

PTV NuStats 47 ARC Regional Travel Survey Final Report
Table 45: Household Income (Weighted)
Household Income Frequency Percent
Less than $10,000 589 6.2%
$10,000 to $19,999 944 9.9%
$20,000 to $29,999 892 9.4%
$30,000 to $39,999 995 10.5%
$40,000 to $49,999 791 8.3%
$50,000 to $59,999 775 8.2%
$60,000 to $74,999 876 9.2%
$75,000 to $99,999 1,162 12.2%
$100,000 to $149,999 1,409 14.8%
$150,000 or more 1,061 11.2%
Total 9,494 100.0%
In the Table 46, 57 percent of the households had no students, 19 percent have one student in the
household, 15 percent have two students in the household, and 9 percent had more than three students
in the household.
Table 46: Household Number of Students (Weighted)
Number of Students Frequency Percent
0 5,893 57.3%
1 1,932 18.8%
2 1,536 14.9%
3 668 6.5%
4 198 1.9%
5 35 0.3%
6 9 0.1%
7 7 0.1%
8 1 0.0%
Total 10,278 100.0%

PTV NuStats 48 ARC Regional Travel Survey Final Report
Overall, 43 percent of household reported having one worker, 33 percent reported having two workers,
17 percent reported having no workers in the household, while 7 percent had more than three workers.
Table 47: Household Number of Workers (Weighted)
Number of Workers Frequency Percent
0 1,731 16.8%
1 4,417 43.0%
2 3,434 33.4%
3 611 5.9%
4 79 0.8%
5 7 0.1%
Total 10,278 100.0%
Forty-nine percent of household reported having two licensed drivers in the household, 31 percent
reported having only one licensed driver, 16 percent reported having three or more licensed drivers, and
4 percent reported having not licensed drivers at all.
Table 48: Number of Licensed Drivers in Household (Weighted)
Number of Household
License Holders Frequency Percent
0 371 3.6%
1 3,168 30.8%
2 5,072 49.3%
3 1,267 12.3%
4 333 3.2%
5 53 0.5%
6 13 0.1%
7 1 0.0%
Total 10,278 100.0%

PTV NuStats 49 ARC Regional Travel Survey Final Report
Overall, the average number of children reported per household is one. Sixty-four percent of the
participating households reported that there were no children in the household, while 14 percent
reported having one or two children, respectively.
Table 49: Average Number of Children in Household (Weighted)
Number of Children Frequency Percent
0 6,532 63.6%
1 1,425 13.9%
2 1,450 14.1%
3 628 6.1%
4 181 1.8%
5 50 0.5%
6 7 0.1%
7 3 0.0%
8 1 0.0%
10 1 0.0%
Total 10,278 100.0%
Average 0.71
Fifty-four percent of survey respondents are female; the remaining 46 percent are male.
Table 50: Respondent Gender (Weighted)
Gender Frequency Percent
Male 11,741 45.7%
Female 13,970 54.3%
Total 25,711 100.0%
The overall age distribution is presented in Table 51. Forty-four percent of respondents are between the
ages of 25 and 54 (working age group), 28 percent are younger than 18 years of age, 9 percent are 65
years of age or older, while 8 percent of respondents are between the ages of 18 and 24.
Table 51: Respondent Age Distribution (Weighted)
Age Distribution Frequency Percent
<18 years 6,944 27.5%
18–24 years 2,116 8.4%
25–54 years 11,148 44.2%
55–64 years 2,686 10.7%
65+ years 2,317 9.2%
Total 25212 100.0%

PTV NuStats 50 ARC Regional Travel Survey Final Report
Overall survey, 6 percent of respondents reported having a disability.
Table 52: Respondent Disability Status (Weighted)
Disability Status Frequency Percent
Yes 1,456 5.7%
No 24,267 94.3%
Total 25,723 100.0%
Overall survey, 89 percent of respondents reported having a valid driver‘s license.
Table 53: Respondents with Valid Driver's License (Weighted)
Valid Driver’s License Frequency Percent
Yes 17321 88.6%
No 2223 11.4%
Total 19544 100.0%
Sixty percent of respondents reported being employed, while another 10 percent reported being
volunteers. See Tables 54 and 55.
Table 54: Respondent Employment Status (Weighted)
Employment Status Frequency Percent
Yes 11,639 59.8%
No 7,834 40.2%
Total 19,474 100.0%
Table 55: Respondent Volunteer Status (Weighted)
Volunteer Status Frequency Percent
Yes 747 9.6%
No 6,999 90.4%
Total 7,746 100.0%
Table 56: Respondent Works (Weighted)
Works Frequency Percent
Treated as Worker 12,386 63.4%
Non-Worker 7,138 36.6%
Total 19,524 100.0%

PTV NuStats 51 ARC Regional Travel Survey Final Report
Most the unemployed respondents are retired (32 percent); 23 percent are students, while 17 percent are
unemployed but looking for work.
Table 57: Respondent Unemployment Status, if Does Not Work (Weighted)
Unemployment Status Frequency Percent
Retired 2,222 31.8%
Homemaker 1,124 16.1%
Unemployed but Looking for Work 1,209 17.3%
Unemployed, Not Seeking Employment 341 4.9%
Student (Part-time or Full-time) 1,591 22.8%
Other (Specify) 493 7.1%
Total 6,980 100.0%
The average number of jobs per employed respondent is one. The majority of respondents (92 percent)
have one job, while 7 percent have two jobs and 1 percent has three or more jobs.
Table 58: Respondent Number of Jobs (Weighted)
Number of Jobs Frequency Percent
1 11371 92.4%
2 794 6.5%
3 106 0.9%
4 21 0.2%
5 5 0.0%
6 1 0.0%
8 2 0.0%
Total 12301 100.0%
Average 1.1
Overall, 78 percent of the employed respondents have a fixed work location. For 13 percent of the
respondents, the work location varies; finally, 9 percent of the employed respondents work from home.
Table 59: Respondent Work Locations (Weighted)
Work Locations Frequency Percent
Fixed 9618 77.6%
Home 1101 8.9%
Varies 1668 13.5%
Total 12386 100.0%

PTV NuStats 52 ARC Regional Travel Survey Final Report
On average, survey respondent work is 4.5 days per week. Sixty-one percent of respondents reported
working five days per week, 12 percent reported working four days per week, while another 7 percent
reported working six to seven days per week.
Table 60: Respondent Number of Days Worked per Week (Weighted)
Number of Days
Worked Frequency Percent
One 479 4.0%
Two 637 5.4%
Three 1,172 9.9%
Four 1,427 12.1%
Five 7,259 61.4%
Six 634 5.4%
Seven 214 1.8%
Total 11,822 100.0%
Average 4.4
Overall, 88 percent of respondents reported that their employers provided parking, while another 8
percent reported that their employer provides subsidized transit passes. See Tables 61 and 62 for more
information.
Table 61: Percent Employer Provided Parking (Weighted)
Employer Provided Parking Frequency Percent
Yes 10,558 87.6%
No 1,493 12.4%
Total 12,051 100.0%
Table 62: Percent Employer Subsidizes Transit Pass (Weighted)
Employer Subsidizes Transit Pass Frequency Percent
Yes 125 8.4%
No 1,363 91.6%
Total 1,488 100.0%
Just over half of all respondents reported having some level of college education or some type of college
degree, but 32 percent of respondents (including very young children) reported not having attainted a
high school degree.

PTV NuStats 53 ARC Regional Travel Survey Final Report
Table 63: Educational Attainment (Weighted)
Educational Attainment Frequency Percent
Not a high school graduate, 12 grade or less (this includes very young children) 8,166 32.0%
High school graduate (High school diploma or GED) 3,927 15.4%
Some College Credit but no Degree 3,401 13.3%
Associate or Technical School Degree 1,791 7.0%
Bachelor's or Undergraduate Degree 4,877 19.1%
Graduate Degree (Professional Degree like MD, DD, JD) 3,315 13.0%
Other (Specify) 23 0.1%
Total 25,501 100.0%
Only 7 percent of the respondents reported that they walked or biked to work/school at least once in the
previous week.
Table 64: Household Member Frequency of Walk or Bike to Work/School in Last Week
(Weighted)
Walk or Bike to Work/School Frequency Percent
0 Times (Never) 17,547 93.2%
Once or Twice 355 1.9%
3 or 4 Times 291 1.5%
5 or More Times 627 3.3%
Total 18,820 100.0%
Most respondents (46 percent) reported owning a sedan; 21 percent reported owning a sports utility
vehicle (SUV), while 15 percent reported owning pick-up trucks.
Table 65: Vehicle Body Type (Weighted)
Vehicle Body Type Frequency Percent
Auto Sedan 9,384 46.0%
Auto 2-Seat 766 3.8%
Van 1,945 9.5%
Recreational Vehicle 117 0.6%
Sport Utility Vehicle 4,278 21.0%
Station Wagon 381 1.9%
Pick-up Truck 3,060 15.0%
Motorcycle 380 1.9%
Moped/Scooter (e.g. Vespa) 56 0.3%
Other (Specify) 26 0.1%
Total 20,393 100.0%

PTV NuStats 54 ARC Regional Travel Survey Final Report
Overall, 97 percent of respondents‘ vehicles‘ fuel type is gas; only 1 percent of respondents‘ vehicles use
diesel, are a hybrid, or use other type of fuel, respectively.
Table 66: Vehicle Fuel Type (Weighted)
Vehicle Fuel Type Frequency Percent
Gas 19,883 97.3%
Diesel 247 1.2%
Hybrid 185 0.9%
Flex Fuel 92 0.4%
Other (Specify) 22 0.1%
Total 20,429 100.0%
Most respondents (98 percent) reported that they own or lease their vehicle, and only 1 percent reported
that their employer provides their vehicle.
Table 67: Vehicle Ownership Type (Weighted)
Vehicle Ownership Type Frequency Percent
Household Owned/Leased 19,891 98.2%
Employer Provided 285 1.4%
Rental Car 15 0.1%
Borrowed From Friend or Relative 58 0.3%
Total 20,248 100.0%

PTV NuStats 55 ARC Regional Travel Survey Final Report
Travel Behavior
The previous section provided a summary of the demographic characteristics for the participating
households. The variations among participating households based on the county of residence suggest
that travel behavior also varies throughout the region. The purpose of this section is to review the travel
behavior reported by the 10,278 participating households in order to document the extent to which the
travel behavior does vary. This section includes summaries of trip rates by the different household and
person characteristics in the total study area.
Table 68: Household and Person Trip Rates (Weighted)
Trip Rate
Household Trip rate 11.43
Person Trip Rate12 4.23
The overall trip rate by household is 11.43 trips. Large household indicated higher trip rates. One-person
households reported 4.63 trips; two-person households reported 8.14 trips; three-person households
reported 12.93 trips; four-person households reported 17.9 trips; and finally, five-or-more-person
households reported 23.99 trips.
Table 69: Trip Rates by Household Size (Weighted)
Number of Household
Workers
Weighted HH
Count
Weighted
TRIP Count
Weighted HH
Trip Rate
1 2,612 12,090 4.63
2 3,110 25,308 8.14
3 1,785 23,077 12.93
4 1,561 27,934 17.90
5+ 1,210 29,027 23.99
Total 10,278 117,436 11.43
For household with three or more workers, the average trip rate is 19 trips; two-worker households
reported a trip rate of 14.05; one-worker households reported a trip rate of 10.57; and households with no
workers reported the fewest trips, at 7.13 trips.
Table 70: Trip Rates by Number of Household Workers (Weighted)
Number of Household
Workers
Weighted HH
Count
Weighted
TRIP Count
Weighted HH
Trip Rate
0 2,012 14,335 7.13
1 4,569 48,297 10.57
2 3,122 43,862 14.05
3+ 576 10,942 19.00
Total 10,278 117,436 11.43
12 Person Trip rates doesn‘t include Out of Area cases in the trip rate calculation

PTV NuStats 56 ARC Regional Travel Survey Final Report
Table 71 shows trip rates by household income. Overall, households with an annual income of $100,000–
$149,999 have the highest trip rate of 13.06 trips; households making less than $10,000 reported the
fewest trips, 9.31.
Table 71: Trip Rates by Household Income (Weighted)
Income
Weighted HH
Count
Weighted
TRIP Count
Weighted HH
Trip Rate
Less than $10,000 589 5,484 9.31
$10,000 to $19,999 944 9,487 10.05
$20,000 to $29,999 892 10,990 12.32
$30,000 to $39,999 995 10,070 10.12
$40,000 to $49,999 791 9,184 11.61
$50,000 to $59,999 775 8,637 11.14
$60,000 to $74,999 876 9,919 11.32
$75,000 to $99,999 1,162 14,562 12.53
$100,000 to $149,999 1,409 18,396 13.06
$150,000 or more 1,061 13,514 12.74
Total 9,496 110,243 11.61
Table 72: Primary Trip Purpose (Weighted)
Primary Trip Purpose Frequency Percent
Working at Home (For Pay or Volunteer) 928 1.0%
Shopping (Online, Catalog or by Phone) 45 0.1%
Any Other Activities at Home 28,828 31.4%
Change Travel Mode/Transfer 5,685 6.2%
Dropped off Passenger from Car 4,576 5.0%
Picked up Passenger from Car 3,982 4.3%
Drive Through (ATM, Bank, Fast Food, etc.) 1,629 1.8%
Work/Doing my Job 9,161 10.0%
Other Work-Related Activities at Work 150 0.2%
Volunteer Work/Activities 161 0.2%
Attending Class/Studying 5,909 6.4%
All Other Activities at School (Eat Lunch, Recreational, etc.) 235 0.3%
Work-Related (Meeting, Sales Call, Delivery) 2,752 3.0%
Service Private Vehicle (Getting Gas, Oil, Lube, Repairs) 1,531 1.7%
Grocery/Food Shopping 4,300 4.7%
Other Routine Shopping (Clothing, Convenience Store, Household Maintenance) 3,997 4.4%
Shopping for Major Purchases or Specialty Items 486 0.5%

PTV NuStats 57 ARC Regional Travel Survey Final Report
Primary Trip Purpose Frequency Percent
Household Errands (Bank, Dry Cleaning, etc.) 1,689 1.8%
Health Care (Doctor, Dentist, etc.) 1,914 2.1%
Personal Business (Visit Government Office, Attorney, Accountant) 2,210 2.4%
Eat Meal Out at Restaurant/Diner 3,543 3.9%
Civic or Religious Activities 967 1.0%
Indoor Recreation ( Yoga, GYM, etc.) or Outdoor Recreation (Jogging, Biking, Walking) 2,840 3.1%
Attend Major Sporting Event 152 0.2%
Social/Visit Friends/Relatives 8,814 3.1%
Loop Trip 225 0.2%
Other (Specify) 960 1.0%
Total 91,669 100.0%
Of all trips, 59 percent of the trips were reported as being made by auto/van/truck driver; 23 percent
were reported as being made by auto/van/truck passenger, while 7 percent were reported as walk trips
and 3 percent as transit trips.
Table 73: All Trip Modes (Weighted)
Trip Mode Frequency Percent
Walk 6,698 7.3%
Bike 273 0.3%
Auto/Van/Truck Driver 54,381 59.3%
Auto/Van/Truck Passenger 21,439 23.4%
Local Bus (Regular, Standard, City) 1,308 1.4%
Express Bus (Suburban, Commuter, Inter-city) 185 0.2%
MARTA Train 1,241 1.4%
Dial-a-ride/Paratransit Service 124 0.1%
Taxi/Limo 137 0.1%
School Bus 5,453 6.0%
Motorcycle/Moped 87 0.1%
Other(Specify) 318 0.3%
Total 91,642 100.0%

PTV NuStats 58 ARC Regional Travel Survey Final Report
For all trips to work, 86 percent were reported as being made by auto/van/truck driver; 6 percent were
reported as being made as an auto/van/truck passenger; 5 percent were made via transit, and 1 percent
were made by walking.
Table 74: Mode to Work (Weighted)
Work Trip Mode Frequency Percent
Walk 150 1.3%
Bike 44 0.4%
Auto/Van/Truck Driver 9608 85.8%
Auto/Van/Truck Passenger 714 6.4%
Local Bus (Regular, Standard, City) 150 1.3%
Express Bus (Suburban, Commuter, Inter-city) 101 0.9%
MARTA Train 330 2.9%
Dial-a-ride/Paratransit Service 15 0.1%
Taxi/Limo 27 0.2%
School Bus 12 0.1%
Motorcycle/Moped 27 0.2%
Other(Specify) 18 0.2%
Total 11195 100.0%
For all trips to school, 38 percent were made by school bus, 35 percent were made as an auto/van/truck
passenger, 5 percent were made via transit, and 4 percent were made by walking.
Table 75: Mode to School (Weighted)
School Trip Mode Frequency Percent
Walk 292 3.8%
Bike 38 0.5%
Auto/Van/Truck Driver 1457 19.0%
Auto/Van/Truck Passenger 2648 34.5%
Local Bus (Regular, Standard, City) 246 3.2%
Express Bus (Suburban, Commuter, Inter-city) 16 0.2%
MARTA Train 136 1.8%
Dial-a-ride/Paratransit Service 4 0.0%
Taxi/Limo 0 0.0%
School Bus 2810 36.7%
Motorcycle/Moped 3 0.0%
Other(Specify) 17 0.2%
Total 7667 100.0%

PTV NuStats 59 ARC Regional Travel Survey Final Report
As part of the ARC Regional Travel Survey, respondents were asked to record the arrival and departure
times for all locations visited during their designated 24-hour travel period. All travel days began at 3:00
a.m. and ended at 2:59 a.m. the following day. As shown in Figure 10, travel in the region has two major
peaks, occurring between 6:00 a.m. and 9:00 a.m., and between 3:00 p.m. and 6:00 p.m. There is also a
smaller peak that occurs during the lunch hours, between 11:00 a.m. and 1:00 p.m. Seventeen percent of
all trips took place during the morning peak hours, and 26 percent of all trips took place during the
afternoon peak hours.
Figure 10: Trip Departure Times
Table 76: Travel by Day of Week (Weighted)
Day of Week Frequency Percent
Monday 2,119 20.6%
Tuesday 2,227 21.7%
Wednesday 2,011 19.6%
Thursday 1,814 17.7%
Friday 2,107 20.5%
Total 10,278 100.0%
0.0%
2.0%
4.0%
6.0%
8.0%
10.0%
12.0%
01 02 03 04 05 06 07 08 09 10 11 12 13 14 15 16 17 18 19 20 21 22 23 24
Pe
rce
nta
ge o
f Tr
ips
Origin Departure Hours

PTV NuStats 60 ARC Regional Travel Survey Final Report
Appendix A: Recruitment CATI Survey
Acronym Dictionary
DK = Don’t Know
RF = Refusal
NA = Not applicable
GTYPE=1 GPS
GTYPE=2 Non-GPS
GTYPE=3 Refused or
disqualified GPS
GFLAG=1 Wearable Random
GFLAG=2 Wearable Target
GFLAG=3 Vehicle
Wearable GPS (both random and target) in the four core counties: Fulton, Gwinnett,
DeKalb and Cobb (NOT in Clayton) to household members age 16-65
(inclusive)
Vehicle GPS will be distributed proportionally over the 20 county study area.
Maximum of three vehicles equipped with GPS devices per household.
Note: THE CONVENTION FOR THIS SCRIPT IS THAT ANY TEXT IN ALL CAPS
WILL NOT BE READ BY THE INTERVIEWER; Text in upper and lower case
will be read by the interviewer.
Introduction / Screening
INT01 (S1A) Hi, this is _________. I‘m calling on behalf of the Georgia Department of Transportation
and the Atlanta Regional Commission about improving transportation in your area.
May I please speak with an adult age 18 or older in the household?
INTERVIEWER NOTE: IF NEW PERSON IS PUT ON THE LINE, REPEAT INTRO1 (S1A) BUT SKIP
THE PART ABOUT ASKING FOR AN ADULT.

PTV NuStats 61 ARC Regional Travel Survey Final Report
S_RES CALL OUTCOMES
CP PARTIAL COMPLETE
RP PARTIAL COMPLETE REFUSAL
PC PARTIAL COMPLETE
R1 1ST REFUSAL
RF FINAL REFUSAL
QO OVER QUOTA
WC WILL COMPLETE ONLINE
KH CALLBACK, GENERAL
KB CALLBACK, SPECIFIC
KL CALLBACK ON LANDLINE
KN NEW NUMBER
NA NO ANSWER
AM ANSWERING MACHINE
BZ BUSY
PM CALLER ID
SH SPANISH CALLBACK, GENERAL
SB SPANISH CALLBACK, SPECIFIC
SN SPANISH NO ANSWER
SA SPANISH ANSWERING MACHINE
SZ SPANISH BUSY
IG BUSINESS/GOVERNMENT
IL LANGUAGE BARRIER, DEAF/TTY
ID DISCONNECT
IM FAX/MODEM
RH HANGUP
RC REFUSES TO CONTINUE ON CELL-PHONE
QP REFUSED NUMBER OF HH PERSONS
QV REFUSED NUMBER OF HH VEHICLES
QA INVALID COUNTY
QW REFUSED WORK ADDRESS
QS REFUSED SCHOOL ADDRESS
CM COMPLETE
CW WEB COMPLETE
ADVLT [IF ADLTS=1] We recently sent a letter to your home to tell you about this important
project. The Georgia Department of Transportation and ARC are the survey sponsors
and are responsible for planning and improving transportation in the region. Did you
receive the letter?
1 YES [SKIP TO HHSIZ]
2 NO [SKIP TO PRVEW]
8 DON‘T KNOW [SKIP TO PRVEW]
9 REFUSED [SKIP TO PRVEW]
PRVEW (S3) We are doing a very important study about people‘s travel patterns and transportation
needs. Planning agencies in your region will use data collected to make decisions about
how to improve the region‘s transportation system. As a participating study household,
everyone who lives in your home will record their travel for 24-hours in a special diary.
All data is strictly confidential and will be used only for research purposes.

PTV NuStats 62 ARC Regional Travel Survey Final Report
CKFIP In what county do you live?
IF NO: Which county do you live in?
[List of 20 in-area counties]
99997-Other, Specify CKFIP_TERM
99998-Don‘t Know CKFIP_TERM
99999-Prefer not to respond CKFIP_TERM
CADDR (S2) Before we get started, please verify your address is still [ADDRESS].
[PROGRAMMER NOTE: DISPLAY ADDRESS]
01 Yes, this is my address SKIP TO HHSIZ
02 No, this is not my current address [COLLECT CURRENT PHYSICAL
ADDRESS]
HADDR What is your physical address? NO P.O. BOXES ALLOWED
<HSUIT>: __________________
<HCITY> City: _____________
<HZIP> Zip Code: ____________
<HSTAT> State: ____________
Household Roster
CKFIP_TERM(INT02) Not in Study Area
We‘re sorry but we only need to interview households in selected counties. Thank you
for your time.
Please press next to exit the survey
CODE S_RES= QA
HHSIZ Before we begin the survey, we would like to ask you for some general information about
your household. This information will help us make sure we include all types of
households in your area.
How many people, including yourself, live in your home?
IF NEEDED: Without this information, your household will not be eligible to
participate in this study.
We understand your concerns regarding this question, however research planners
would be interested in seeing if there is a correlation between the size of
households and the trips they make.
INTERVIEWER NOTE: PLEASE CLARIFY WITH RESPONDENT. DOES THIS
NUMBER INCLUDE ALL PERSONS WHO LIVE AT THIS HOME? HH MEMBERS
LIVE AND EAT SEPARATELY FROM ANY OTHER PERSONS IN THE BUILDING
AND HAVE DIRECT ACCESS TO THEIR HOME FROM THE OUTSIDE OF THE
BUILDING OR THROUGH A COMMON HALL. HH MEMBERS SHARE MEALS
AND LIVING EXPENSES. HH MEMBERS MAY BE A SINGLE FAMILY, TWO OR
MORE FAMILIES LIVING TOGETHER, OR ANY OTHER GROUP OF RELATED
OR UNRELATED PERSONS WHO SHARE LIVING ARRANGEMENTS. HH
MEMBERS MUST SPEND THE NIGHT AT LEAST 3 TIMES A WEEK IN THE
HOUSE.

PTV NuStats 63 ARC Regional Travel Survey Final Report
ENTER NUMBER [RANGE 1-15]
98 DON‘T KNOW THANK AND TERMINATE [DISPO=QP REFUSED 3 OF HH
PERSONS]
99 REFUSED THANK AND TERMINATE
LTELE Does your home have standard land-based telephone service?
1 YES
2 NO
9 REFUSED
RESTY Do you live in a…
1 Single-family detached house
2 Single-family attached house
3 Building with 2 or more apartments or condos
4 Mobile home or trailer
5 BOAT, RV, VAN, ETC.
6 DORM ROOM, FRATERNITY, OR SORORITY
7 Other, SPECIFY
8 DON‘T KNOW
9 REFUSED
OWN Do you own or rent your home?
1 Rent
2 Own/Buying (Paying off Mortgage)
7 Other, SPECIFY
8 DON‘T KNOW
9 REFUSED
[AAGE2 maximum age changed from 75 to 65 on 5/12/11]
[AAGE2 maximum age changed from 75 to 65 on 3/31/11]
AAGE2 Is there at least one person in your household who is between 16 and 55 years of age?
1 Yes [GO TO HHVEH]
2 No [TERMINATE HOUSEHOLD FROM BOTH GPS SAMPLE AND SURVEY
(GO TO DEMDQ)]
8 DON‘T KNOW [TERMINATE HOUSEHOLD FROM GPS SAMPLE AND
SURVEY (GO TO DEMDQ)]
9 REFUSED [TERMINATE HOUSEHOLD FROM GPS SAMPLE AND
SURVEY (GO TO DEMDQ)]
HHVEH Including all cars, trucks, vans, motorcycles and recreational vehicles, whether owned or
leased or provided by an employer, how many vehicles are presently available to the
members of your household?
ENTER NUMBER [RANGE 0-15]
0 NONE
98 DON‘T KNOW THANK AND TERMINATE
99 REFUSED THANK AND TERMINATE

PTV NuStats 64 ARC Regional Travel Survey Final Report
VEHOP [IF HHVEH>0] How many of these vehicles are operational and used regularly during
the week? PROGRAMMER CHECK: [HHVEH] < [VEHOP], HAVE ERROR POP UP
ENTER NUMBER [RANGE 0-15]
0 NONE
98 DON‘T KNOW THANK AND TERMINATE
99 REFUSED THANK AND TERMINATE
[IF VEHOP >0 and GTYPE =1] GO TO VEHOP variable
[IF VEHOP >0 and GTYPE =2] GO TO WLANG variable
ERROR TEXT
―I‘m showing that there are <HHVEH> vehicles in the household and
that <VEHOP> vehicles are used and operated daily. What should be
corrected?
a. Go back to number of household vehicles question to fix
b. Go back to number of operational vehicles question to fix
ENTER NUMBER [RANGE 0-15]
IF 0 – SKIP TO WRGPS IF GPS SAMPLE OR SKIP TO YEAR IF
NON GPS SAMPLE
98 Don‘t know THANK AND TERMINATE
99 Prefer not to respond THANK AND TERMINATE
TERMINATION TEXT:
We‘re sorry - without this information, your household will not be eligible to participate
in this study.
Transportation planners are interested in seeing if there is a relationship between the
number of vehicles available for a household and the trips people make.
Can you tell me how many vehicles are operational and used regularly during the week?
REFUSAL TURN-AROUND: The number of trips made by a household is often
directly related to the number of vehicles.
ANSWER CHOICES:
1- Back to vehicles question- Skips back to VEHOP
2- Exit the survey- Skips out and ends.
[Dispo=QV – Refused # of household vehicles]
VEHPR [IF GTYPE=1 AND GFLAG=3 AND VEHOP>0] Of the vehicles that are operational and
used regularly during the week, how many have a working power outlet or cigarette
lighter socket? [PROGRAMMER CHECK: [VEHOP] < [VEHPR], HAVE ERROR POP
UP.]
ERROR TEXT
I‘m showing that there are <VEHOP> vehicles in the household that
are used and operated daily and that there are <VEHPR> vehicles
that have cigarette lighters. What should I correct?

PTV NuStats 65 ARC Regional Travel Survey Final Report
1-Go back to number of operational vehicles question to fix
2-Go back to number of vehicles with cigarette lighter question to fix
ENTER NUMBER [RANGE 0 -15]
0 UPDATE GTYPE 3
98 DON‘T KNOW THANK AND TERMINATE
99 REFUSED THANK AND TERMINATE
INT06 [TERMINATION SCREEN] Thank you, those are all the questions we have for you
today. Have a good afternoon/evening! [CODED AS QE]
WRGPS [IF GTYPE=1 AND GFLAG=1 AND IF AAGE2=1 AND CKFIP=(13067 OR 13089 OR
13121 OR 13135)]: Your household has been qualified to participate in the GPS portion of
this study. We are asking you and all household members between 16 and 65 years old to
wear a GPS device for 3 consecutive days, starting on your diary day. The GPS device
allows us to not only collect information about where people are traveling, but also the
actual path taken, which is very useful in transportation planning. To show our
appreciation for your time and effort, we are offering each GPS user $25. To receive this
payment, we just ask that everyone in your household use and return their GPS device,
and then provide their travel diary information in a separate interview. IF NEEDED: We
will ask you to wear or carry your GPS units with you when you travel. The devices are
small and easy to carry (you can clip them onto your belt, backpack, or purse) and they
collect details of your travel routes during your travel day. It is very important to the
survey that households like yours participate.
1 Yes [CONTINUE]
2 No [Go to <WRGP1>]
WRGP1 [IF WRGPS=2] SET GTYPE = 3 AND CONTINUE AS NON-GPS
VHGPS [IF GTYPE=1 AND GFLAG=3]: Your household has been qualified to participate in the
GPS portion of this study. We will send you a GPS device for each working vehicle (up to
a maximum of three vehicles) and ask you to use the devices in each vehicle for seven
consecutive days, starting on your diary day. The GPS device allows us to not only collect
information about where people are traveling, but also the actual path taken. This is
very useful in transportation planning. We are offering $25 for each GPS device used, in
appreciation of your time and effort, if everyone in your household reports their travel
diary information in the separate interview portion of the study and each working vehicle
(maximum of three vehicles) in your household is equipped with a GPS device for seven
days. IF NEEDED: The devices are small and easy to place in your vehicle, and they
collect details of your travel routes during your travel day. It is very important to the
survey that households like yours participate.
1 Yes Continue
2 No Continue
VHGP1 [IF VHGPS=2] SET GTYPE = 3 AND CONTINUE AS NON-GPS
Vehicle Roster-
YEAR [IF HHVEH>0] Ok, now I‘d like to get some information about your vehicle(s).
What is the year of <VEHNO>?
ENTER YEAR OF VEHICLE __ __ __ __ [RANGE=1930-2011]
9998 DON‘T KNOW

PTV NuStats 66 ARC Regional Travel Survey Final Report
9999 REFUSED
MAKE [IF HHVEH>0] What is the make of <VEHNO>?
USE CODE LIST FROM PROGRAM
MODEL [IF HHVEH>0] What is the model of that vehicle?
[PROGRAMMER NOTE: ADD MODEL TYPE LIST]
BODY [IF HHVEH>0] What type of vehicle is that?
1 AUTO SEDAN
2 AUTO 2-SEAT
3 VAN
4 RECREATIONAL VEHICLE
5 SPORT UTILITY VEHICLE
6 STATION WAGON
7 PICK-UP TRUCK
8 MOTORCYCLE
9 MOPED/SCOOTER (e.g., VESPA)
97 OTHER, SPECIFY
98 DON‘T KNOW
99 REFUSED
VOPERATE Is this vehicle operational and used regularly during the week?
1 Yes (VEHICLE IS FLAGGED FOR GPS)
2 No (VEHICLE IS NOT FLAGGED FOR GPS)
FUEL [IF HHVEH>0] What type of fuel does this vehicle use?
1 Gas
2 Diesel
3 Hybrid
4 Flex Fuel
7 Other, SPECIFY
8 DON‘T KNOW
9 REFUSED
CIGLT Does this vehicle have a working power outlet or cigarette lighter?
1 Yes
2 No
8 DON‘T KNOW
9 REFUSED
VEOWN [IF HHVEH>0] Is it owned or leased by a household member, an employer, or is it a
rental car?
1 HOUSEHOLD OWNED/LEASED
2 EMPLOYER PROVIDED
3 RENTAL CAR
4 BORROWED FROM FRIEND OR RELATIVE

PTV NuStats 67 ARC Regional Travel Survey Final Report
7 OTHER, SPECIFY
8 DON‘T KNOW
9 REFUSED
EZPAS [IF HHVEH>0] Does <VEHNO> have a working Cruise Card tag in it?
1 Yes, Vehicle has Cruise Card Tag
2 No, Vehicle does not have Cruise Card Tag
8 DON‘T KNOW
9 REFUSED
COMPUTE VGTYP=1 IF VEHICLE IS FLAGGED FOR GPS (GTYPE=1 AND GFLAG=3) AND
CIGLT=1; ELSE COMPUTE VGTYP=2
VEHICLE ROSTER TO BE REPEATED FOR EACH VEHICLE, UP TO EIGHT
VEHICLES
Person Roster
FNAME Great! Now I will ask a few questions to get information about each person in your
household so that we can prepare individual travel diaries. Again, I want to assure you
that this information is for research purposes only and will be kept strictly confidential.
Earlier, you indicated there were <HHSIZ> persons in your household. What is your first
name? /
[IF ONLY 2 PERSONS IN THE HOUSEHOLD ASK: What is your first name? THEN
ASK: What is the other person‘s first name?]
ENTER NAME
What is the name of the next oldest person in the household? [IF RELUCTANT: Initials
are okay at this point.]
What is the name of the next oldest person? [IF RELUCTANT: Initials are okay at this
point.] [PROGRAMMER NOTE: GET NAMES FOR ALL HOUSEHOLD MEMBERS]
LNAME What last name should we use for your household when mailing the materials?
ENTER THE LAST NAME: __________
THE FOLLOWING QUESTIONS ARE ASKED FOR EACH HOUSEHOLD
MEMBER
GEND And what is [NAME]‘s gender? [INTERVIEWER NOTE: DO NOT ASK RESPONDENT
ABOUT HIS/HER GENDER]
1 MALE
2 FEMALE
9 REFUSED
RELAT [NOTE: NOT ASKED OF RESPONDENT] What is this person‘s relationship to you?
1 SELF
2 Spouse
3 Son/Daughter

PTV NuStats 68 ARC Regional Travel Survey Final Report
4 Father/Mother
5 Brother/Sister
6 Grandparent
7 Grandchild
8 Live-in-help
9 Roommate/Other Non-Related
10 Other Related
98 DK
99 RF
AGE What is [his/her/your] age in years?
ENTER AGE [RANGE: 0-98] [PERSON 1 - ANSWERING INTERVIEW MUST BE 18
OR OLDER]
99 99 years or older
998 DK
999 RF
AGEB [IF AGE=998 or 999] Can you tell me, is/are [you/he/she] between the ages of 16 and 65?
1 LESS THAN 16 OR OVER 65
2 BETWEEN 16 AND 65 [TREAT AS ADULT]
9 RF
GCONF [IF AGEB=9 and GTYPE=1] In order for your household to qualify for the GPS portion of
the study, we really need to know whether <YOU> is over the age of 16 and under the
age of 65. PAUSE AND GIVE OPPORTUNITY FOR RESPONDENT TO GIVE AGE
1 YES – OVER 16 AND UNDER 65
2 NO – UNDER 16 OR OVER 65 [PERSON DOES NOT RECEIVE WEARABLE
GPS]
9 IF STILL REFUSED UPDATE GTYPE3 (CANCEL THE HOUSEHOLD FROM
GPS)
HISP [IF PERNO=1] Are you of Hispanic, Latino, or Spanish origin?
1 YES
2 NO
8 DON‘T KNOW
9 REFUSED
HISP2 [IF PERNO=1 and HISP>1 and HHSIZ>1] Are any other members of your household of
Hispanic, Latino, or Spanish origin?
1 YES
2 NO
8 DON‘T KNOW
9 REFUSED
COMPUTE HPFLG=1 IF HISP=1 OR HISP2=1
RACE [IF PERNO=1] I'm going to read a list of races. [IF NECESSARY: In addition to being
Hispanic] Please tell me which describes your race.

PTV NuStats 69 ARC Regional Travel Survey Final Report
1 White
2 African-American
3 Asian
4 Native American, Alaskan Native
5 Pacific Islander, Native Hawaiian
6 MULTI-RACIAL
7 HISPANIC, MEXICAN
97 OTHER, SPECIFY
98 DON‘T KNOW
99 REFUSED
LIC [IF AGE>15 and AGEB<>1][Does/Do] [he/she/you] have a valid driver‘s license?
1 YES
2 NO
8 DON‘T KNOW
9 REFUSED
CTELE [IF AGE>15 and AGEB<>1] [Does/Do] [he/she/you] personally have a cell phone?
1 YES
2 NO
8 DON‘T KNOW
9 REFUSED
DISAB [Does/Do] [he/she/you] have a disability that limits the type of transportation
[he/she/you] can use?
1 YES
2 NO
8 DON‘T KNOW
9 REFUSED
DTYPE [IF DISAB=1] What type of disability? [MULTIPLE RESPONSE]
1 Visually impaired or blind
2 Hearing impaired or deaf
3 Cane or walker
4 Wheelchair non-transferable
5 Wheelchair transferable
6 Mentally or emotionally disabled
7 Other, SPECIFY
8 DK
9 RF
EMPLY [IF AGE>15] [Is/Are] [he/she/you] employed either full-time or part-time?
1 YES
2 NO
8 DON‘T KNOW
9 REFUSED
VOLUN [IF EMPLY>1] [Does/Do] [he/she/you] do any type of volunteer work on a regular basis?
1 YES [TREAT AS EMPLOYED]
2 NO

PTV NuStats 70 ARC Regional Travel Survey Final Report
8 DON‘T KNOW
9 REFUSED
WORKS [CALCULATED]
1 [IF EMPLY=1 OR VOLUN=1] TREATED AS WORKER
2 NON-WORKER
WKSTAT [IF WORKS<>1] Which of the following best describes [his/her/your] status?
1 Retired
2 Homemaker
3 Unemployed but looking for work
4 Unemployed, not seeking employment
5 Student (Part-time or full-time)
7 Other, SPECIFY
8 DON‘T KNOW
9 REFUSED
JOBS [IF WORKS=1] How many jobs [does/do] [he/she/you] have?
ENTER NUMBER: [RANGE 1-10]
HOURS [IF WORKS=1] How many hours [does/do] [he/she/you] work per week at the job where
[he/she/you] spend the most time?
ENTER NUMBER: [RANGE 1-150]
HOUR2 [IF JOBS>1] How many hours [does/do] [he/she/you] work per week at [his/her/your]
second job?
ENTER NUMBER: [RANGE 1-150]
HOUR3 [IF JOBS>2] How many hours [does/do] [he/she/you] work per week at [his/her/your]
third job?
ENTER NUMBER: [RANGE 1-150]
TELWK [IF WORKS=1] Regardless of whether [he/she/you] [does/do] telecommute, is
telecommuting offered at [his/her/your] main workplace?
1 Yes
2 No
9 DK/RF
PRIMJ Now, I‘m going to ask you some questions about [his/her/your] primary job, where
[he/she/you] [works/work] <HOURS> per week.
TCHRS [IF TELWK=1] Of the total job hours, how many does [he/she/you] telecommute, meaning
that [he/she/you] work(s) from home in lieu of traveling to [his/her/your] workplace, on a
regular basis?
ENTER NUMBER: [RANGE 0-150]
998 DON‘T KNOW
999 REFUSED
WSTRT [IF WORKS=1] What time [does/do] [he/she/you] typically start work at [his/her/your]
primary job? [PROGRAMMING NOTE: ADD MILITARY TIME EXAMPLES]
ENTER MILITARY TIME: _ _ : _ _
9998 DON‘T KNOW

PTV NuStats 71 ARC Regional Travel Survey Final Report
9999 REFUSED
WEND [IF WORKS=1] What time [does/do] [he/she/you] typically end work at [his/her/your]
primary job? [PROGRAMMING NOTE: ADD MILITARY TIME EXAMPLES]
ENTER MILITARY TIME: _ _ : _ _
9998 DON‘T KNOW
9999 REFUSED
SCHED [IF WORKS=1] Are [his/her/your] start and end times at this job about the same every
day?
1 YES
2 NO
8 DON‘T KNOW
9 REFUSED
WDAYS [IF WORKS=1] On average, how many days per week does [he/she/you] travel to
[his/her/your] work location to work?
1 One
2 Two
3 Three
4 Four
5 Five
6 Six
7 Seven
8 DK
9 RF
COMPR [IF WORKS=1] [Does/Do] [he/she/you] work a compressed work week, such as 40 hours
in 4 days or 80 hours in 9 days?
1 4/40
2 9/80
3 No
7 Other, SPECIFY
8 DON‘T KNOW
9 REFUSED

PTV NuStats 72 ARC Regional Travel Survey Final Report
INDUS [IF WORKS=1] What type of business or company [does he/she / do you] work for in
[his/her/your] primary job?
11 AGRICULTURE, FORESTRY, FISHING AND HUNTING
21 MINING, QUARRYING, AND OIL AND GAS EXTRACTION
22 UTILITIES
23 CONSTRUCTION
31 MANUFACTURING
44 RETAIL TRADE
48 TRANSPORTATION AND WAREHOUSING
42 WHOLESALE TRADE
51 INFORMATION
52 FINANCE AND INSURANCE
53 REAL ESTATE AND RENTAL AND LEASING
54 PROFESSIONAL, SCIENTIFIC, AND TECHNICAL SERVICES
55 MANAGEMENT OF COMPANIES AND ENTERPRISES
56 ADMINISTRATIVE AND SUPPORT AND WASTE MANAGEMENT AND
REMEDIATION SERVICES
61 EDUCATIONAL SERVICES
62 HEALTH CARE AND SOCIAL ASSISTANCE
71 ARTS, ENTERTAINMENT, AND RECREATION
72 ACCOMMODATION AND FOOD SERVICES
81 OTHER SERVICES (EXCEPT PUBLIC ADMINISTRATION)
92 PUBLIC ADMINISTRATION
97 OTHER, SPECIFY
98 DON‘T KNOW
99 REFUSED
OCCUP [IF WORKS=1] What kind of work [does he/she / do you] do at that employer?
11 MANAGEMENT OCCUPATIONS
13 BUSINESS AND FINANCIAL OPERATIONS OCCUPATIONS
15 COMPUTER AND MATHEMATICAL OCCUPATIONS
17 ARCHITECTURE AND ENGINEERING OCCUPATIONS
19 LIFE, PHYSICAL, AND SOCIAL SCIENCE OCCUPATIONS
21 COMMUNITY AND SOCIAL SERVICES OCCUPATIONS
23 LEGAL OCCUPATIONS
25 EDUCATION, TRAINING, AND LIBRARY OCCUPATIONS
27 ARTS, DESIGN, ENTERTAINMENT, SPORTS, AND MEDIA OCCUPATIONS
29 HEALTHCARE PRACTITIONERS AND TECHNICAL OCCUPATIONS
31 HEALTHCARE SUPPORT OCCUPATIONS
33 PROTECTIVE SERVICE OCCUPATIONS
35 FOOD PREPARATION AND SERVING RELATED OCCUPATIONS
37 BUILDING AND GROUNDS CLEANING AND MAINTENANCE
OCCUPATIONS
39 PERSONAL CARE AND SERVICE OCCUPATIONS
41 SALES AND RELATED OCCUPATIONS
43 OFFICE AND ADMINISTRATIVE SUPPORT OCCUPATIONS
45 FARMING, FISHING, AND FORESTRY OCCUPATIONS

PTV NuStats 73 ARC Regional Travel Survey Final Report
47 CONSTRUCTION AND EXTRACTION OCCUPATIONS
49 INSTALLATION, MAINTENANCE, AND REPAIR OCCUPATIONS
51 PRODUCTION OCCUPATIONS
53 TRANSPORTATION AND MATERIAL MOVING OCCUPATIONS
55 MILITARY SPECIFIC OCCUPATIONS
97 OTHER, SPECIFY
98 DON‘T KNOW
99 REFUSED
EMPLR [IF WORKS=1] Is [his/her/your] employer…
1 A private company
2 Government
3 Non-profit
4 Self-employed
7 Other, SPECIFY
8 DK
9 RF
EPARK [IF WORKS=1] Does [his/her/your] employer provide parking at no charge?
1 YES
2 NO
8 DON‘T KNOW
9 REFUSED
EPPK2 [IF EPARK>1] Does [his/her/your] employer offer reimbursement for parking?
1 YES
2 NO
8 DON‘T KNOW
9 REFUSED
UPARK [IF EPPK2=1] Does [he/she/you] use this benefit for travel to/from work?
1 YES
2 NO
8 DON‘T KNOW
9 REFUSED
ETRANS [IF WORKS=1] Does [his/her/your] employer offer reimbursement for, or subsidize,
transit use?
1 YES
2 NO
8 DON‘T KNOW
9 REFUSED
WLOC [IF WORKS=1] And is [his/her/your] work address fixed, is it your home, or does it vary
from day to day or week to week? (IF NEEDED: This is the work location where the
respondent spends the most time.)
1 Fixed
2 Home
3 Varies

PTV NuStats 74 ARC Regional Travel Survey Final Report
WNAME [IF WORKS=1 AND WLOC=1 OR 3] What is the name of [his/her/your]
[employer/volunteer] location?
ENTER RESPONSE: ____________
CWADD [IF WORKS=1 AND WLOC=1 OR 3] What is the address of [his/her/your] current or
most recent workplace?
1 COMPLETE STREET ADDRESS KNOWN GO TO WADDR
2 CROSS STREETS KNOWN
8 DK
9 RF
WSXTR [IF WORKS=1 AND WLOC=1 OR 3 AND CWADD=2] Can you tell me the nearest cross
streets of this work location?
ENTER RESPONSE: ____________ [COLLECTED IN TWO FIELDS]
WADDR [IF WORKS=1 AND (WLOC=1 OR 3) AND CWADD=1] (IF NEEDED: What is the
address of [his/her/your] current or most recent workplace?)
Address: ____________
<WSUIT>: ______________
<WCITY> City: _____________
<WSTAT> State: ____________
<WZIP> Zip Code: ____________
WMODE [IF WLOC=1 OR 3] What mode of transportation [does/do] [he/she/you] most often use to
get to work?
1 WALK
2 BIKE
3 AUTO/VAN/TRUCK DRIVER
4 AUTO/VAN/TRUCK PASSENGER
5 LOCAL BUS (REGULAR, STANDARD, CITY)
6 EXPRESS BUS (SUBURBAN, COMMUTER, INNER-CITY)
7 MARTA TRAIN
8 DIAL-A-RIDE/PARATRANSIT
9 TAXI/LIMO
10 SCHOOL BUS
11 MOTORCYCLE/MOPED
97 Other, SPECIFY
98 DON‘T KNOW
99 REFUSED
Z What level of education [has/have] [he/she/you] completed?
1 Not a high school graduate, 12th grade or less (THIS INCLUDES VERY YOUNG
CHILDREN TOO)
2 High school graduate (high school diploma or GED)
3 Some college credit but no degree
4 Associate or technical school degree
5 Bachelor‘s or undergraduate degree
6 Graduate degree (includes professional degree like MD, DD, or JD)

PTV NuStats 75 ARC Regional Travel Survey Final Report
7 Other, SPECIFY
8 DON‘T KNOW
9 REFUSED
STUDE Is (he, she, you) currently enrolled in any type of school, including daycare, technical
school, or university? [IF AGE 18+, FOLLOW UP WITH: IS THAT FULL-TIME OR
PART-TIME?]
1 Yes – FULL TIME
2 YES – PART TIME
3 No
8 DON‘T KNOW
9 REFUSED
SCHOL [IF STUDE<3] What school grade or level does this person attend? [PROGRAMMING
NOTE: CHECK AGE OF PERSON BEFORE ASKING CHOICES 1-4]
1 DAYCARE
2 NURSERY SCHOOL/PRE-SCHOOL
3 KINDERGARTEN TO GRADE 8
4 GRADE 9 TO 12
5 TECHNICAL/VOCATION SCHOOL
6 2-YEAR COLLEGE (COMMUNITY COLLEGE)
7 4-YEAR COLLEGE OR UNIVERSITY
8 GRADUATE SCHOOL/PROFESSIONAL
97 OTHER, SPECIFY
98 DON‘T KNOW
99 REFUSED
SLOC [IF SCHOL<5] And [is/are] [he/she/you] home schooled?
1 Yes
2 No
8 DK
9 RF
SONLN [IF SCHOL=4-8] Is your school an online-only school?
1 Yes
2 No
8 DK
9 RF
SNAME [(IF STUDE =1 OR 2) AND (SLOC<>1 OR SONLN<>1)] What is the name of
[his/her/your] school?
ENTER NAME: ___________
CSADD [(IF STUDE =1 OR 2) AND (SLOC<>1 OR SONLN<>1)] What is the address of
[his/her/your] school?
1 COMPLETE STREET ADDRESS KNOWN GO TO SADDR
2 CROSS STREETS KNOWN
8 DK
9 RF

PTV NuStats 76 ARC Regional Travel Survey Final Report
SXST1 [(IF STUDE =1 OR 2) AND (SLOC<>1 OR SONLN<>1)AND CSADD=2] What are the
nearest cross streets of this school?
ENTER RESPONSE: ____________ [COLLECTED IN TWO FIELDS]
SADDR [(IF STUDE =1 OR 2) AND (SLOC<>1 OR SONLN<>1) AND CSADD=1]
(IF NEEDED: What is the address of this school?)
<SADDR> Address: __________
<SSUIT>:Suite:____________ep it
<SCITY> City: _________
<SSTAT> State: ___________
<SZIP> Zip Code: ___________
SMODE [(IF STUDE =1 OR 2) AND (SLOC<>1 OR SONLN<>1)] On a typical day, how do you get
to school?
1 Walk
2 Bike
3 Auto/Van/Truck Driver
4 Auto/Van/Truck Passenger
5 Local Bus (Regular, Standard, City)
6 Express Bus (Suburban, Commuter, Inner-City)
7 MARTA Train
8 Dial-a-ride/Paratransit
9 Taxi/Limo
10 School Bus
11 Motorcycle/Moped
97 Other, SPECIFY
98 DON‘T KNOW
99 REFUSED
RIBUS [IF AGE>15 and AGEB<>1] How often [does/do] [he/she/you] use public transit?
1 Nearly every day [GO TO <BREZ>]
2 Once or twice a week [GO TO <BREZ>]
3 Once or twice a month
4 Almost never
5 Never
8 DK
9 RF
BREZ [IF RIBUS=1 OR 2] [Does/Do] [he/she/you] own a Breeze card?
1 YES
2 NO
8 DON‘T KNOW
9 REFUSED
BREZF [IF BREZ=1] The last time [he/she/you] added value to the card or purchased a card,
did [he/she/you]:

PTV NuStats 77 ARC Regional Travel Survey Final Report
1 Purchase a 30-day pass
2 Purchase a 7-day pass
3 Purchase 20 trips
4 Purchase 10 trips
5 Purchase less than $20 in fares
6 The card is purchased through a special fare program
7 Other, Specify
8 DON‘T KNOW
9 REFUSED
GRTA [IF RIBUS=1 OR 2] [Does/Do] [he/she/you] own a GRTA Xpress bus pass?
1 YES
2 NO
8 DON‘T KNOW
9 REFUSED
GRTAF [IF GRTA=1] The last time [he/she/you] purchased [he/his/your] GRTA Xpress bus pass,
did [he/she/you]:
1 Purchase a 31-day pass
2 Purchase a 40-ride pass
3 Purchase 20-ride pass
4 Purchase a round-trip fare
5 Purchase a 1-way fare
6 The Xpress bus pass purchased through a special fare program
8 DON‘T KNOW
9 REFUSED
CGTP [IF RIBUS=1 OR 2 AND IF RESIDENT OF COBB COUNTY OR GWINNETT COUNTY]
Do you own a [Cobb/Gwinnett] County Transit pass? [IF YES: Is that for local, express or
paratransit service?]
1 Yes, for local service
2 Yes, for express service
3 Yes, for paratransit service
4 No
8 DON‘T KNOW
9 REFUSED
CGTPF [IF CGTP<4] The last time [he/she/you] purchased [his/her/your] [Cobb/Gwinnett]
County Transit pass, did [he/she/you]:
1 Purchase a 31-day or monthly pass
2 Purchase a 20-ride pass
3 Purchase a 10-ride pass
4 The County Transit pass is purchased through a special fare program
8 DON‘T KNOW
9 REFUSED

PTV NuStats 78 ARC Regional Travel Survey Final Report
DISFR [IF BREZ=1 or GRTA=1 or CGTP<4] [Does/Do] [he/she/you] participate in a discounted
fare program? [IF YES: What kind of discounted fare is it?]
1 NO DISCOUNTED FARE
2 YES, THROUGH AN EMPLOYER
3 YES, THROUGH A UNIVERSITY PASS (U-PASS) PROGRAM
4 YES, THROUGH A K-12 STUDENT PASS PROGRAM
5 YES, DISCOUNTED FARE FOR SENIOR CITIZENS, DISABLED RIDERS, OR
MEDICARE RECIPIENTS
7 OTHER DISCOUNTED FARE, SPECIFY
8 DON‘T KNOW
9 REFUSED
FBKTW [IF STUDE<3 OR WORKS=1] How frequently did [he/she/you] travel to work/school last
week by walking or biking?
1 Zero times (Never)
2 Once or twice
3 Three or four times
4 Five or more times
8 DK
9 RF
COMPUTE PGTYP=1 IF PERSON IS FLAGGED FOR GPS (GTYPE=1 AND GFLAG=1 OR 2) AND
AGE IS 16 TO 65 INCLUSIVE; ELSE COMPUTE PGTYP=2
TRNM CALCULATED: SUM OF HH MEMBERS THAT USE TRANSIT OR NON-MOTOR TO
WORK OR SCHOOL [RIBUS<3 OR FBKTW=2,3,4]
Finalizing Recruitment
WTGPS [IF GTYPE=1 AND GFLAG=2 AND TRNM>=1]: Your household has been qualified to
participate in the GPS portion of this study. We are asking you and all household
members between 16 and 65 years old to wear a GPS device for 3 consecutive days,
starting on your diary day. The GPS device allows us to not only collect information
about where people are traveling, but also the actual path taken, which is very useful in
transportation planning. To show our appreciation for your time and effort, we are
offering each GPS user $25. To receive this payment, we just ask that everyone in your
household use and return their GPS device, and then provide their travel diary
information in a separate interview. IF NEEDED: We will ask you to wear or carry your
GPS units with you when you travel. The devices are small and easy to carry (you can
clip them onto your belt, backpack, or purse) and they collect details of your travel routes
during your travel day. It is very important to the survey that households like yours
participate.
1 Yes [CONTINUE]
2 No [Go to <WTGP1>]
WTGP1 [IF WTGPS=2 OR IF GFLAG=2 AND TRNM=0] SET GTYPE = 3 AND CONTINUE AS
NON-GPS
INCA To ensure our study is representative of all income groups in the area, could you tell me
if your household‘s total income for last year was above or below $30,000?

PTV NuStats 79 ARC Regional Travel Survey Final Report
[INTERVIEWER NOTE: HOUSEHOLD INCOME NOT ONLY ALLOWS US TO
VERIFY THAT WE ARE INCLUDING ALL TYPES OF HOUSEHOLDS FROM THE
REGION, BUT IT ALSO HAS BEEN FOUND TO BE RELATED TO THE TYPES OF
TRIPS HOUSEHOLDS TYPICALLY MAKE.]
11 BELOW $30,000
22 AT OR ABOVE $30,000
99 DK/RF [SKIP TO INCRF]
INCB [IF INCA=11] Is it…
[INTERVIEWER NOTE: HOUSEHOLD INCOME NOT ONLY ALLOWS US TO
VERIFY THAT WE ARE INCLUDING ALL TYPES OF HOUSEHOLDS FROM THE
REGION, BUT IT ALSO HAS BEEN FOUND TO BE RELATED TO THE TYPES OF
TRIPS HOUSEHOLDS TYPICALLY MAKE.]
01 Less Than $10,000
02 $10,000-$19,999
03 $20,000-$29,999
99 DK/RF [SKIP TO INCRF]
INCC [IF INCA=22] Is it above or below $75,000?
[INTERVIEWER NOTE: HOUSEHOLD INCOME NOT ONLY ALLOWS US TO
VERIFY THAT WE ARE INCLUDING ALL TYPES OF HOUSEHOLDS FROM THE
REGION, BUT IT ALSO HAS BEEN FOUND TO BE RELATED TO THE TYPES OF
TRIPS HOUSEHOLDS TYPICALLY MAKE.]
44 BELOW $75,000
55 AT OR ABOVE $75,000
99 DK/RF [SKIP TO INCRF]
INCD [IF INCD=44] Was it….
[INTERVIEWER NOTE: HOUSEHOLD INCOME NOT ONLY ALLOWS US TO
VERIFY THAT WE ARE INCLUDING ALL TYPES OF HOUSEHOLDS FROM THE
REGION, BUT IT ALSO HAS BEEN FOUND TO BE RELATED TO THE TYPES OF
TRIPS HOUSEHOLDS TYPICALLY MAKE.]
04 $30,000 to $39,999 [SKIP TO INCOM]
05 $40,000 to $49,999 [SKIP TO INCOM]
06 $50,000 to $59,999 [SKIP TO INCOM]
07 $60,000- $74,999 [SKIP TO INCOM]
99 REFUSED [SKIP TO INCRF]
INCE [IF INCD=55] Was it…
[INTERVIEWER NOTE: HOUSEHOLD INCOME NOT ONLY ALLOWS US TO
VERIFY THAT WE ARE INCLUDING ALL TYPES OF HOUSEHOLDS FROM THE
REGION, BUT IT ALSO HAS BEEN FOUND TO BE RELATED TO THE TYPES OF
TRIPS HOUSEHOLDS TYPICALLY MAKE.]
08 $75,000-$99,999
09 $100,000 to $149,999
10 $150,000 or more
99 REFUSED [SKIP TO INCRF]

PTV NuStats 80 ARC Regional Travel Survey Final Report
INCRF I appreciate your concerns about providing this information, but I only need to properly
identify your household as belonging to one of the following categories: [READ
APPROPRIATE RANGES]
01 Less than $10,000
02 $10,000-$19,999
03 $20,000-$29,999
04 $30,000-$39,999
05 $40,000-$49,999
06 $50,000-$59,999
07 $60,000-$74,999
08 $75,000-$99,999
09 $100,000 to $149,999
10 $150,000 or more
99 REFUSED
INCOM COMPUTED INCOME
01 Less than $10,000
02 $10,000-$19,999
03 $20,000-$29,999
04 $30,000-$39,999
05 $40,000-$49,999
06 $50,000-$59,999
07 $60,000-$74,999
08 $75,000-$99,999
09 $100,000 to $149,999
10 $150,000 or more
99 REFUSED
ASSN1 [IF GTYPE=1 AND GFLAG=1 OR 2] Thank you for agreeing to participate in this study.
As I mentioned earlier, understanding your household‘s travel and activities is very
important for improving transportation in your area. We will send a GPS device for each
member of your household between the ages of 16 and 65 and ask that they wear the
device for three consecutive days. We will also send a diary for each member of your
household to keep track of their travel and activities on <DAY AND DATE>.
1 YES
2 NO – Well let‘s try a different time. How about <ALT DAY AND DATE>?
ENTER ASSIGNMENT NUMBER <ASSN>
ASSN2 [IF GTYPE=1 AND GFLAG=3] Thank you for agreeing to participate in this study. As I
mentioned earlier, understanding your household‘s travel and activities is very
important for improving transportation in your area. We will send you a GPS device for
up to 3 working vehicles in your household to use for seven consecutive days. We will also
send a diary for each member of your household so that they can record their travel and
activities on <DAY AND DATE>.
1 YES
2 NO – Well let‘s try a different time. How about <ALT DAY AND DATE>?
ENTER ASSIGNMENT NUMBER <ASSN>
ASSN [GTYPE>1] Thank you for agreeing to participate in this study. As I mentioned at the
beginning of the interview, understanding your household‘s travel and activities is very
important for improving transportation in your area. We will send you a diary for each

PTV NuStats 81 ARC Regional Travel Survey Final Report
member of your household to keep track of your travel and activities on <DAY AND
DATE>.
1 YES
2 NO – Well let‘s try a different time. How about <ALT DAY AND DATE>?
ENTER ASSIGNMENT NUMBER <ASSN>
Ryan-All three of these ASSN screens will be on one screen called ASSN with
different, variant text.
For all counties except Barrow and Spaulding, BLOCK OUT April 4 – 8 (these are not
valid travel dates).
For Barrow and Spaulding, BLOCK OUT April 18 – 22.
Last travel day of May 20 for the following counties: Barrow, Bartow, Carroll, Clayton,
DeKalb, Hall and Walton
SHOW 6 ASSN DAYS FOR SCHEDULING PURPOSES
INCT1 [IF NON-GPS INCEN HOUSEHOLD (GTYPE>1 AND INCEN=1)] We are offering
$<INAMT> in appreciation of your efforts, but only if EVERYONE in your household
completes a travel diary and reports your travel information by <ASN10>. Once all travel
information is complete and confirmed for EVERYONE in your household, we will mail
you a check.
INCT2 [IF GPS INCEN HOUSEHOLD(GTYPE=1)] We are offering $<INAMT> in appreciation
of your efforts, but only if EVERYONE in your household who is assigned a GPS device,
uses it as instructed, and completes a travel diary so that we have good travel
information by <ASN10>. Once all travel information is complete and confirmed for
EVERYONE in your household, we will mail you a check.
HHNME To whom should we address the envelope?
PROGRAMMING NOTE: IMPORT FNAME AND LNAME COLLECTED EARLIER
AND CONFIRM LISTED NAME. IF NULL OR INCORRECT COLLECT NEW.
FIRST NAME: ___________ LAST NAME: ___________
9 INDICATE THAT INFORMATION IS NECESSARY, IF STILL REFUSE,
TERMINATE.
INTERVIEWER NOTE: CONFIRM SPELLING AND READ BACK
MADDR In order to mail the survey materials to you, I need to confirm your mailing address.
GTYPE=1 The travel diaries and the GPS devices will be shipped to you within the
next week. After your travel date, you can return the GPS devices by Fedex using the
return envelope provided with the equipment.
Is your home address the best place for us to have these items delivered to you?
NOTE:PO BOXES ARE NOT VALID SHIPPING ADDRESSES FOR FEDEX.
GTYPE=2 Is this also your mailing address?
SLANG [FULL STUDY ONLY] In which language should I send your diary materials?
1 ENGLISH

PTV NuStats 82 ARC Regional Travel Survey Final Report
2 SPANISH
CATSI After your travel day, we will ask you to report details about the places you visited.
Would you prefer to report them by telephone interview, or via website?
1 Telephone Interview
2 Web Interview
REMN1 Please note that we will contact you to remind you about your travel date on the day
before <ASSN> and to provide you with additional instructions during your
participation. Would you like to be reminded by phone, text, or email? [INTERVIEWER
NOTE: IF RESPONDENT REFUSES, SELECT 1=PHONE]
1 PHONE
2 TEXT
3 EMAIL
RMPHN [IF REMN1=1] Can we confirm this telephone number as the number to call?
[PROGRAMMER NOTE: DISPLAY PHONE]
1 Correct
2 Not Correct [PROGRAMMER NOTE: ALLOW NEW PHONE TO BE
ENTERED]
RMTXT [IF REMN1=2] Can we confirm the best telephone number for us to send a reminder
text?
1 ENTER CELL NUMBER: _ _ _ - _ _ _ - _ _ _ _
RMEML [IF REMN1=3] Can you tell me the email address where you would like to receive a
reminder email?
1 ENTER EMAIL ADDRESS: ________________
CBACK When we call back to collect your travel and activities, we will not ask to speak with
anyone under 16 years old, but we would like to ask about their travel. Who would be the
best person to give that information?
ENTER PERSON NUMBER
CONCLUSION
THANK Thank you for participating in the Regional Travel Survey. Please tell the other members
of your household how important their participation is for the success of the study. We
look forward to talking with you again. If you have any questions or comments, I have a
toll free number where you can reach us. Would you like that number? IF THEY WANT
THE NUMBER: 888-222-7734. Thank you and have a good afternoon/evening.
ILANG CODE LANGUAGE OF INTERVIEW
1 ENGLISH
2 SPANISH

PTV NuStats 83 ARC Regional Travel Survey Final Report
Appendix B: Recruitment WEB Survey
Acronym Dictionary
DK = Don’t know
RF = Prefer not to respond
NA = Not applicable
Wearable GPS (both random and target) in the four core counties: Fulton, Gwinnett, DeKalb and
Cobb (NOT in Clayton) to household members age 16-65 (inclusive)
Vehicle GPS will be distributed proportionally over the 20 county study area. Maximum of three
vehicles equipped with GPS devices per household.
Introduction/Screening
WELCOME Welcome to the Regional Travel Survey conducted on behalf of the Georgia Department of
Transportation and the Atlanta Regional Commission Thank you for your participation.
The purpose of this study is to understand why, when, and where people travel in the region. To do
this, we're asking households to record their travel for a 24 hour period.
The following survey will collect important data on your household and household members to
make sure that we're talking to all types of households in the region and to prepare personalized
travel diaries, which will be mailed to your household.
After your household records travel and activities for the agreed upon travel day, you can enter
your travel data online or simply mail back your travel diaries. Everything asked is for research
purposes only and will be held in strict confidence.
To start the survey, please click the “Begin” button below.
Introduction for Returning to Survey
“Welcome back. Our records indicate that you have completed a portion of your survey. Would you like to
continue where you left off, or restart from the beginning?”
1 Continue from the last saved question
2 Restart from the beginning of the survey
AGEV (S1) First, please verify your age.
01 18 years old or older GO TO CKFIP
02 Younger than 18 years old
AGEV2 (S1A) It‘s important that an adult age 18 or older answer this survey. Is there a
member of the household who is 18 years or older available to proceed?
01 Yes

PTV NuStats 84 ARC Regional Travel Survey Final Report
02 No THANK and TERMINATE
98 Don’t know THANK and TERMINATE
99 Prefer not to respond THANK and TERMINATE
TERMINATION TEXT:
We’re sorry but the survey must be completed by an adult.
We appreciate your time!
CKFIP In what county do you live?
IF NO: Which county do you live in?
[List of 20 in-area counties]
99997-Other, Specify CKFIP_TERM
99998-Don’t Know CKFIP_TERM
99999-Prefer not to respond CKFIP_TERM
CADDR Please verify your current address is [ADDRESS].
If only your apartment number has changed, please select the first choice below.
[PROGRAMMER NOTE: DISPLAY ADDRESS]
01 Yes, this is my address [SKIP TO HHSIZ]
02 No, this is not my current address [COLLECT CURRENT PHYSICAL ADDRESS]
HADDR What is your physical address?
Please do not enter a P.O. Box. Please enter your current physical address.
<HSUIT>: __________________
<HCITY> City: _____________
<HZIP> Zip Code: ____________
<HSTAT> State: ____________
If you prefer not provide your zip code, enter 99999
DEACTIVATE: HH_TERM (S3) Not a Sampled Address
Since we selected an individual at this address for inclusion in the survey and we are not following
people when they move, no interview is needed of you at this time. Thank you for your time.
Please press next to exit the survey
Household Questions
CKFIP_TERM Not in Study Area
We’re sorry but we only need to interview households in selected counties. Thank you for your
time.
Please press next to exit the survey
CODE S_RES= QA

PTV NuStats 85 ARC Regional Travel Survey Final Report
HHSIZ How many people, including yourself, live in your home?
This number includes all persons who live at this home. Household members live and
eat separately from any other persons in the building and have direct access to their
home from the outside of the building or through a common hall. Household members
share meals and living expenses. Household members may be a single family, two or
more families living together, or any other group of related or unrelated persons who
share living arrangements. Household members must spend at least three nights per
week in the house.
ENTER NUMBER [RANGE 1-15]
98 Don’t know THANK AND TERMINATE [DISPO=QP REFUSED 3 OF HH
PERSONS]
99 Prefer not to respond THANK AND TERMINATE
TERMINATION TEXT:
We’re sorry - without this information, your household will not be eligible to participate in this study. Transportation planners are interested in seeing if there is a relationship between household size and the trips people make. Please select 'Back to household size question' and enter the size of your household or select "Exit Survey" if you wish not want to continue.
We appreciate your time!
ANSWER CHOICES:
1- Back to household size question- Skips back to HHSIZ
2- Exit the survey- Skips out and ends.
LTELE Does your home have standard land-based telephone service?
3 Yes
4 No
10 Don’t know
11 Prefer not to respond
RESTY Do you live in a…
10 Single-family detached house
11 Single-family attached house
12 Building with 2 or more apartments or condos
13 Mobile home or trailer
14 Boat, RV, Van, etc.
15 Dorm room, Fraternity, or sorority
16 Other, specify in box below:

PTV NuStats 86 ARC Regional Travel Survey Final Report
17 Don’t know
18 Prefer not to respond
OWN Do you own or rent your home?
3 Rent
4 Own/Buying (Paying off Mortgage)
10 Other, specify in box below:
11 Don’t know
12 Prefer not to respond
[AAGE2 maximum age changed from 75 to 65 on 3/31/11]
AAGE2 [IF GTYPE=1] Is there at least one person in your household who is between 16 and 65
years of age?
3 Yes [GO TO <HHVEH>]
4 No [TERMINATE HOUSEHOLD FROM BOTH GPS SAMPLE AND SURVEY (GO TO
DEMDQ)]
8 Don’t know [TERMINATE HOUSEHOLD FROM GPS SAMPLE AND SURVEY (GO
TO DEMDQ)]
9 Prefer not to respond [TERMINATE HOUSEHOLD FROM GPS SAMPLE AND
SURVEY (GO TO DEMDQ)]
HHVEH Including all cars, trucks, vans, motorcycles and recreational vehicles, whether owned or
leased or provided by an employer, how many vehicles are presently available to the
members of your household?
ENTER NUMBER [RANGE 0 -15]
0 NONE
98 Don’t know THANK AND TERMINATE
99 Prefer not to respond THANK AND TERMINATE
VEHOP [IF HHVEH>0] How many of these vehicles are operational and used regularly during
the week? PROGRAMMER CHECK: [HHVEH] < [VEHOP], HAVE ERROR POP UP.
ERROR TEXT
―We found a small problem. You entered that there are <HHVEH> vehicles
in the household and that there are <VEHOP> vehicles that are used and operated
daily.
Please fix this information before you continue with the survey.”
a. Go back to number of household vehicles question to fix
b. Go back to number of operational vehicles question to fix
ENTER NUMBER [RANGE 0-15]
0 NONE
IF 0 – SKIP TO WRGPS IF GPS SAMPLE OR SKIP TO YEAR IF NON GPS
SAMPLE
100 Don’t know THANK AND TERMINATE
101 Prefer not to respond THANK AND TERMINATE
102
[PROGRAMMING NOTE: [IF VEHOP >0 and GTYPE =2] GO TO WLANG]

PTV NuStats 87 ARC Regional Travel Survey Final Report
TERMINATION TEXT:
We’re sorry - without this information, your household will not be eligible to participate in this study. Transportation planners are interested in seeing if there is a relationship between the number of vehicles available for a household and the trips people make. Please select 'Back to Vehicles Used question' and enter the number of vehicles that are operational and used regularly or select "Exit Survey" if you wish not want to continue.
We appreciate your time!
ANSWER CHOICES:
1- Back to vehicles question- Skips back to VEHOP
2- Exit the survey- Skips out and ends [Dispo=QV – Refused # of household vehicles]
VEHPR [IF GTYPE=1 AND GFLAG=3 AND VEHOP>0] Of the <RECALL NUMBER OF
VEHICLES FROM VEHOP> vehicles that are operational and used regularly during the
week, how many have a working power outlet or cigarette lighter socket?
[PROGRAMMER CHECK: [VEHOP] < [VEHPR], HAVE ERROR POP UP.]
ERROR TEXT We found a small problem. You entered that there are <VEHOP> vehicles in the
household that are used and operated daily and that there are <VEHPR> vehicles
that have cigarette lighters.
Please fix this information before you continue.
1-Go back to number of operational vehicles question to fix
2-Go back to number of vehicles with cigarette lighter question to fix
ENTER NUMBER [RANGE 0-15]
0 [PROGRAMMER NOTE: UPDATE GTYPE 3]
98 Don’t know THANK AND TERMINATE
99 Prefer not to respond THANK AND TERMINATE
INT06 [TERMINATION SCREEN] Thank you, those are all the questions we have for you
today. Have a good day!
“Please press 'NEXT' to exit the survey.”
WRGPS [IF GTYPE=1 AND GFLAG=1 AND IF AAGE2=1 AND CKFIP=(13067 OR 13089 OR
13121 OR 13135)]: In addition to completing your travel diary, we are asking you and all

PTV NuStats 88 ARC Regional Travel Survey Final Report
household members between 16 and 65 years old to wear a GPS device for 3 consecutive
days, starting on your diary day. The GPS device allows us to not only collect information
about where people are traveling, but also the actual path taken, which is very useful in
transportation planning. To show our appreciation for your time and effort, we are
offering each GPS user $<INAMT>. To receive this payment, we just ask that everyone
in your household use and return their GPS device, and then provide their travel diary
information in a separate interview. We will ask you to wear or carry your GPS units
with you when you travel. The devices are small and easy to carry (you can clip them
onto your belt, backpack, or purse) and they collect details of your travel routes during
your travel day. It is very important to the survey that households like yours participate
3 Yes, I agree to participate in the additional GPS portion of the study
CONTINUE
4 No, I’d prefer not to participate in the additional GPS portion of the study
[Go to <WRGP1>]
WRGP1 [IF WRGPS=2] SET GTYPE = 3 AND CONTINUE AS NON-GPS
VHGPS [IF AAGE2=1 AND GTYPE=1 AND VEHPR>0 AND GFLAG=3?] Your household has
been qualified to participate in the GPS portion of this study. We will send you a GPS
device for each working vehicle (up to a maximum of three vehicles) and ask you to use
the devices in each vehicle for seven consecutive days, starting on your diary day. The
GPS device allows us to not only collect information about where people are traveling,
but also the actual path taken. This is very useful in transportation planning. We are
offering $25 for each GPS device used, in appreciation of your time and effort, if everyone
in your household reports their travel diary information in the separate interview portion
of the study and each working vehicle (maximum of three vehicles) in your household is
equipped with a GPS device for seven days. The devices are small and easy to place in
your vehicle, and they collect details of your travel routes during your travel day. It is
very important to the survey that households like yours participate.
1 Yes, I agree to participate in the additional GPS portion of the study
CONTINUE
3 No, I’d prefer not to participate in the additional GPS portion of the study
VHGP1 [IF VHGPS=2] SET GTYPE = 3 AND CONTINUE AS NON-GPS
Vehicle Roster
YEAR [IF HHVEH>0] Next, we need to collect some information about your vehicle(s).
Please enter the year of your vehicle in the space below. (The valid range of years is 1930
to 2011)
9998 Don’t know
9999 Prefer not to respond
MAKE [IF HHVEH>0] What is the make of vehicle number <VEHNO>?

PTV NuStats 89 ARC Regional Travel Survey Final Report
USE CODE LIST FROM PROGRAM97 Other, please specify in box below:
98 Don’t know
99 Prefer not to respond
MODEL [IF HHVEH>0] What is the model of that vehicle?
[PROGRAMMER NOTE: ADD MODEL TYPE LIST]
BODY [IF HHVEH>0] What type of vehicle is that?
01 Auto Sedan
02 Auto 2-seat
03 Van
04 Recreational Vehicle
05 Sport Utility Vehicle (SUV)
06 Station Wagon
07 Pick-up Truck
08 Motorcycle
09 Moped/Scooter (e.g., Vespa)
97 Other, please specify in box below:
98 Don’t know
99 Prefer not to respond
VOPERATE Is this vehicle operational and used regularly during the week?
1 Yes (VEHICLE IS FLAGGED FOR GPS)
2 No (VEHICLE IS NOT FLAGGED FOR GPS)
FUEL [IF HHVEH>0] What type of fuel does this vehicle use?
1 Gas
2 Diesel
3 Hybrid
4 Flex Fuel
7 Other, specify in box below:
8 Don’t know
9 Refused
CIGLT Does this vehicle have a working power outlet or cigarette lighter?
1 Yes
2 No
8 DON’T KNOW
9 REFUSED
VEOWN [IF HHVEH>0] Is it owned or leased by a household member, an employer, or is it a
rental car?
1 Household Owned/Leased
2 Employer Provided
3 Rental Car

PTV NuStats 90 ARC Regional Travel Survey Final Report
4 Borrowed from a friend or relative
7 Other, specify in box below:
8 Don’t know
9 Prefer not to respond
EZPAS [IF HHVEH>0] Does this vehicle have a working Cruise Card tag in it?
1 Yes, this Vehicle has an Cruise Card Tag
2 No, this vehicle does not have an Cruise Card Tag
8 Don’t know
9 Prefer not to respond
COMPUTE VGTYP=1 IF VEHICLE IS FLAGGED FOR GPS (GTYPE=1 AND GFLAG=3) AND CIGLT=1; ELSE
COMPUTE VGTYP=2
VEHICLE ROSTER TO BE REPEATED FOR EACH VEHICLE, UP TO EIGHT VEHICLES
Person Roster
FNAME Next are questions about each person in your household so that we can prepare
individual travel diaries. Again, we want to assure you that this information is for
research purposes only and will be kept strictly confidential. Earlier, you indicated there
were <HHSIZ> persons in your household. What is your first name?
Enter name: ________________
What is the name of the next oldest person in the household? (Initials are okay at this
point.)
What is the name of the next oldest person?
Enter name: ________________
[PROGRAMMER NOTE: GET NAMES FOR ALL HOUSEHOLD MEMBERS]
LNAME What last name should we use for your household when mailing the materials?
Enter the last name for your household in the space below: __________
THE FOLLOWING QUESTIONS ARE ASKED FOR EACH HOUSEHOLD MEMBER
GEND And what is [YOUR/NAME]‘s gender?
1 Male
2 Female
9 Prefer not to respond
RELAT [NOTE: NOT ASKED OF PERNO1] What is this person‘s relationship to you?
1 SELF [PROGRAMMER NOTE: DO NOT DISPLAY FOR PERNO>1]
2 Spouse
3 Son/Daughter
4 Father/Mother
5 Brother/Sister

PTV NuStats 91 ARC Regional Travel Survey Final Report
6 Grandparent
7 Grandchild
8 Live-in-help
9 Roommate/Other Non-Related
10 Other Related
98 Don’t know
99 Prefer not to respond
AGE What is [his/her/your] age in years?
Enter Age [RANGE: 0-98]: _____
99 99 years or older
998 Don’t know
999 Prefer not to respond
AGEB [IF AGE=998 or 999] Is/Are [he/she/you] between the ages of 16 and 65?
1 less than 16 or over 65
2 between 16 and 65 [TREAT AS ADULT]
9 Prefer not to respond
GCONF [IF AGEB=9 and GTYPE=1] In order for your household to qualify for the GPS portion of
the study, we really need to know whether <YOU/NAME> is over the age of 16 and
under the age of 65.
1 Yes – Over 16 and under 65
2 No – Under 16 or over 65 [PERSON DOES NOT RECEIVE WEARABLE GPS]
9 Prefer not to respond [IF STILL REFUSED UPDATE GTYPE3 (CANCEL THE
HOUSEHOLD FROM GPS)]
HISP [IF PERNO=1] Are you of Hispanic, Latino, or Spanish origin?
1 Yes
2 No
8 Don’t know
9 Prefer not to respond
HISP2 [IF PERNO=1 and HISP>1 and HHSIZ>1] Are any other members of your household of
Hispanic, Latino, or Spanish origin?
1 Yes
2 No
8 Don’t know
9 Prefer not to respond
COMPUTE HPFLG=1 IF HISP=1 OR HISP2=1
RACE [IF PERNO=1] Which best describes your race/ethnicity:
1 White
2 African-American
3 Asian

PTV NuStats 92 ARC Regional Travel Survey Final Report
4 Native American, Alaskan Native
5 Pacific Islander, Native Hawaiian
6 Multi-Racial
7 Hispanic, Mexican, Latino
97 Other, specify in box below:
98 Don’t know
99 Prefer not to respond
LIC [IF AGE>15 and AGEB<>1][Does/Do] [he/she/you] have a valid driver‘s license?
1 Yes
2 No
8 Don’t know
9 Prefer not to respond
CTELE [IF AGE>15 and AGEB<>1] [Does/Do] [he/she/you] personally have a cell phone?
1 Yes
2 No
8 Don’t know
9 Prefer not to respond
DISAB [Does/Do] [he/she/you] have a disability that limits the type of transportation
[he/she/you] can use?
1 Yes
2 No
8 Don’t know
9 Prefer not to respond
DTYPE [IF DISAB=1] What type of disability? Select all that apply. [MULTIPLE RESPONSE]
1 Visually impaired or blind
2 Hearing impaired or deaf
3 Cane or walker
4 Wheelchair non-transferable
5 Wheelchair transferable
6 Mentally or emotionally disabled
7 Other, specify in box below:
8 Don’t know
9 Prefer not to respond
EMPLY [IF AGE>15] [Is/Are] [he/she/you] employed either full-time or part-time?
1 Yes
2 No
8 Don’t know
9 Prefer not to respond
VOLUN [IF EMPLY>1] [Does/Do] [he/she/you] do any type of volunteer work on a regular basis?
1 Yes [TREAT AS EMPLOYED]
2 No
8 Don’t know
9 Prefer not to respond

PTV NuStats 93 ARC Regional Travel Survey Final Report
WORKS [CALCULATED]
3 TREATED AS WORKER
4 NON-WORKER
WKSTAT [IF WORKS<>1] Which of the following best describes [his/her/your] status?
1 Retired
2 Homemaker
3 Unemployed but looking for work
4 Unemployed, not seeking employment
5 Student (Part-time or full-time)
7 Other, specify in box below
8 Don’t know
9 Prefer not to respond
JOBS [IF WORKS=1] How many jobs [does/do] [he/she/you] have?
Enter Number: [RANGE 1-10] ___________
99 Prefer not to respond
HOURS [IF WORKS=1] How many hours [does/do] [he/she/you] work per week at the job where
[he/she/you] spend the most time?
Enter Number: [RANGE 1-150] ___________
999 Prefer not to respond
HOUR2 [IF JOBS>1] How many hours [does/do] [he/she/you] work per week at [his/her/your]
second job?
Enter Number: [RANGE 1-150] ___________
999 Prefer not to respond
HOUR3 [IF JOBS>2] How many hours [does/do] [he/she/you] work per week at [his/her/your]
third job?
Enter Number: [RANGE 1-150] ___________
999 Prefer not to respond
TELWK [IF WORKS=1] Regardless of whether [he/she/you] [does/do] telecommute, is
telecommuting offered at [his/her/your] main workplace?
1 Yes
2 No
9 Prefer not to respond
PRIMJ Next are some questions about [his/her/your] primary job, where [he/she/you]
[works/work] <HOURS> per week.
TCHRS [IF TELWK=1] Of the total job hours, how many does [he/she/you] telecommute, meaning
that [he/she/you] work(s) from home in lieu of traveling to [his/her/your] workplace, on a
regular basis?
Enter Number: [RANGE 0-150] ___________
998 Don’t know
999 Prefer not to respond

PTV NuStats 94 ARC Regional Travel Survey Final Report
WSTRT [IF WORKS=1] What time [does/do] [he/she/you] typically start work at [his/her/your]
primary job? Note: Please enter your time in military time. [PROGRAMMER NOTE:
PROVIDE EXAMPLES OF MILITARY TIME]
Military time is in the format of HHMM. Here are some examples:
0030 = 12:30am
1200 = Noon
1530 = 3:30pm
2359 = 11:59pm
ENTER MILITARY TIME: _ _ : _ _
9998 Don’t know
9999 Prefer not to respond
WEND [IF WORKS=1] What time [does/do] [he/she/you] typically end work at [his/her/your]
primary job? [PROGRAMMER NOTE: PROVIDE EXAMPLES OF MILITARY TIME] Military time is in the format of HHMM. Here are some examples:
0030 = 12:30am
1200 = Noon
1530 = 3:30pm
2359 = 11:59pm
ENTER MILITARY TIME: _ _ : _ _
9998 Don’t know
9999 Prefer not to respond
SCHED [IF WORKS=1] Are [his/her/your] start and end times at this job about the same every
day?
1 Yes
2 No
8 Don’t know
9 Prefer not to respond
WDAYS [IF WORKS=1] On average, how many days per week does [he/she/you] travel to
[his/her/your] work location to work?
1 One
2 Two
3 Three
4 Four
5 Five
6 Six
7 Seven
8 Don’t know
9 Prefer not to respond
COMPR [IF WORKS=1] [Does/Do] [he/she/you] work a compressed work week, such as 40 hours
in 4 days or 80 hours in 9 days?
1 4/40
2 9/80
3 No
7 Other, specify in box below:

PTV NuStats 95 ARC Regional Travel Survey Final Report
8 Don’t know
9 Prefer not to respond
INDUS [IF WORKS=1] What type of business or company [does he/she / do you] work for in
[his/her/your] primary job?
72 Accommodation and Food Services
56 Administrative and Support and Waste Management and Remediation
Services
11 Agriculture, Forestry, Fishing and Hunting
71 Arts, Entertainment, and Recreation
23 Construction
61 Educational Services
52 Finance and Insurance
62 Health Care and Social Assistance
51 Information
55 Management of Companies and Enterprises
31 Manufacturing
21 Mining, Quarrying, and Oil and Gas Extraction
81 Other Services (except Public Administration)
54 Professional, Scientific, and Technical Services
92 Public Administration
53 Real Estate and Rental and Leasing
44 Retail Trade
48 Transportation and Warehousing
22 Utilities
42 Wholesale Trade
97 Other, specify in box below:
98 Don’t know
99 Prefer not to respond
OCCUP [IF WORKS=1] What kind of work [does he/she / do you] do at that employer?
17 Architecture and Engineering Occupations
27 Arts, Design, Entertainment, Sports, and Media Occupations
37 Building and Grounds Cleaning and Maintenance Occupations
13 Business and Financial Operations Occupations
21 Community and Social Services Occupations
15 Computer and Mathematical Occupations
47 Construction and Extraction Occupations
45 Farming, Fishing, and Forestry Occupations
35 Food Preparation and Serving Related Occupations
25 Education, Training, and Library Occupations
29 Healthcare Practitioners and Technical Occupations
31 Healthcare Support Occupations
49 Installation, Maintenance, and Repair Occupations
23 Legal Occupations
19 Life, Physical, and Social Science Occupations
11 Management Occupations
55 Military Specific Occupations
43 Office and Administrative Support Occupations

PTV NuStats 96 ARC Regional Travel Survey Final Report
39 Personal Care and Service Occupations
51 Production Occupations
33 Protective Service Occupations
41 Sales and Related Occupations
53 Transportation and Material Moving Occupations
97 Other, specify in box below:
98 Don’t know
99 Prefer not to respond
EMPLR [IF WORKS=1] Is [his/her/your] employer…
1 A private company
2 Government
3 Non-profit
4 Self-employed
7 Other, specify in box below:
8 Don’t know
9 Prefer not to respond
EPARK [IF WORKS=1] Does [his/her/your] employer provide parking at no charge?
1 Yes
2 No
8 Don’t know
9 Prefer not to respond
EPPK2 [IF EPARK>1] Does [his/her/your] employer offer reimbursement for parking?
1 Yes
2 No
8 Don’t know
9 Prefer not to respond
UPARK [IF EPPK2=1] Does [he/she/you] use this benefit for travel to/from work?
1 Yes
2 No
8 Don’t know
9 Prefer not to respond
ETRANS [IF WORKS=1] Does [his/her/your] employer offer reimbursement for, or subsidize,
transit use?
1 Yes
2 No
8 Don’t know
9 Prefer not to respond
WLOC [IF WORKS=1] Is [his/her/your] work address fixed, is it your home, or does it vary from
day to day or week to week??
1 Fixed
2 Home
3 Varies

PTV NuStats 97 ARC Regional Travel Survey Final Report
WNAME [IF WORKS=1 AND WLOC=1 OR 3] What is the name of [his/her/your]
[employer/volunteer] location?
Enter Response: ____________
CWADD [IF WORKS=1 AND WLOC=1 OR 3] Do you know the full address or nearby cross
streets of <your/his/her> current or most recent workplace?
1 I know the complete address WADDR
2 I know the cross streets but not the full address
8 Don’t Know
9 Prefer not to respond
WSXTR [IF WORKS=1 AND WLOC=1 OR 3 AND CWADD=2] What are the nearest cross streets
of this work location?
Enter Response: ____________ [COLLECT IN TWO FIELDS]
WADDR [IF WORKS=1 AND (WLOC=1 OR 3) AND CWADD=1] What is the address of [his/her/your]
current or most recent workplace?
Street Address: ____________
Is there a suite number? Leave this answer blank if there is no suite number.
<WSUIT> Suite: _____________
[PROGRAMMER NOTE: ALWAYS ASK CITY, STATE, ZIP AFTER WSXTR OR WADDR]
<WCITY> City: _____________
<WSTAT> State: ____________
<WZIP> Zip Code: ____________
If you prefer not to provide your zip code, please enter 99999 for this response.
WMODE [IF WLOC=1 OR 3] What mode of transportation [does/do] [he/she/you] most often use to
get to work?
1 Walk
2 Bike
3 Auto/Van/Truck Driver
4 Auto/Van/Truck Passenger
5 Local Bus (Regular, Standard, City)
6 Express Buss (Suburban, Commuter, Inner-City)
7 MARTA Train
8 Dial-a-ride/Paratransit
9 Taxi/Limo
10 School Bus
11 Motorcycle/Moped
97 Other, specify in box below:
98 Don’t know
99 Prefer not to respond
EDUCA What level of education [has/have] [he/she/you] completed?

PTV NuStats 98 ARC Regional Travel Survey Final Report
1 Not a high school graduate, 12th grade or less (this includes young children
too)
2 High school graduate (high school diploma or GED)
3 Some college credit but no degree
4 Associate or technical school degree
5 Bachelor’s or undergraduate degree
6 Graduate degree (includes professional degree like MD, DD, or JD)
7 Other, specify in box below:
8 Don’t know
9 Prefer not to respond
STUDE [Is/Are] [he, she, you] currently enrolled in any type of school, including daycare,
technical school, or university? If so, is that full-time or part-time?
1 Yes – Full Time
2 Yes – Part Time
3 No
8 Don’t know
9 Prefer not to respond
SCHOL [IF STUDE<3] What school grade or level [do/does] [you/this person] attend?
[PROGRAMMING NOTE: CHECK AGE OF PERSON BEFORE SHOWING CHOICES
1-4]
1 Daycare
2 Nursery school/pre-school
3 Kindergarten to grade 8
4 Grade 9 To12
5 Technical/Vocation school
6 2-year college (community college)
7 4-year college or university
8 Graduate school/professional
97 Other, specify in box below:
98 Don’t know
99 Prefer not to respond
SLOC [IF SCHOL<5] And [is/are] [he/she/you] home schooled?
1 Yes
2 No
8 Don’t know
9 Prefer not to respond
SONLN [IF SCHOL=4-8] Is the school an online-only school?
1 Yes
2 No
8 Don’t know
9 Prefer not to respond
SNAME [(IF STUDE =1 OR 2) AND (SLOC<>1 OR SONLN<>1)] What is the name of the school?
Enter Name: ____________

PTV NuStats 99 ARC Regional Travel Survey Final Report
CSADD [(IF STUDE =1 OR 2) AND (SLOC<>1 OR SONLN<>1)] Do you know the complete
address or nearby cross streets of the school?
1 I know the complete address GO TO SADDR
2 I know the cross streets but not the full address
8 Don’t know
9 Prefer not to answer
SXST1 [(IF STUDE =1 OR 2) AND (SLOC<>1 OR SONLN<>1) What are the nearest cross
streets of this school?
ENTER RESPONSE: ____________ [COLLECTED IN TWO FIELDS]
SADDR [(IF STUDE =1 OR 2) AND (SLOC<>1 OR SONLN<>1) AND CSADD=1] What is the address of
this school?
<SADDR> Street Address: __________
<SSUIT>: Is there a suite number? Leave this answer blank if there is no suite
number. :____________
[PROGRAMMER NOTE: ALWAYS ASK CITY, STATE, ZIP AFTER SSXTR OR SADDR]
<SCITY> City: _________
<SSTAT> State: ___________
<SZIP> Zip Code: ___________
If you prefer not to provide your zip code, please enter 99999 for this response.
SMODE [(IF STUDE =1 OR 2) AND (SLOC<>1 OR SONLN<>1)] On a typical day, how [does/do]
[he/she/you] get to school?
1 Walk
2 Bike
3 Auto/Van/Truck Driver
4 Auto/Van/Truck Passenger
5 Local Bus (Regular, Standard, City)
6 Express Bus (Suburban, Commuter, Inner-City)
7 MARTA Train
8 Dial-a-ride/Paratransit
9 Taxi/Limo
10 School Bus
11 Motorcycle/Moped
97 Other, specify in box below:
98 Don’t know
99 Prefer not to respond
RIBUS [IF AGE>15 and AGEB<>1] How often [does/do] [he/she/you] use public transit?
6 Nearly every day [GO TO <BREZ>]
7 Once or twice a week [GO TO <BREZ>]
8 Once or twice a month
9 Almost never
10 Never

PTV NuStats 100 ARC Regional Travel Survey Final Report
8 Don’t know
9 Prefer not to respond
BREZ [IF RIBUS=1 OR 2] [Does/Do] [he/she/you] own a Breeze card?
1 Yes
2 No
8 Don’t know
9 Prefer not to respond
BREZF [IF BREZ=1] The last time [he/she/you] added value to the card or purchased a card, did
[he/she/you]:
1 Purchase a 30-day pass
2 Purchase a 7-day pass
3 Purchase 20 trips
4 Purchase 10 trips
5 Purchase less than $20 in fares
6 The card is purchased through a special fare program
7 Other, specify in box below
8 Don’t know
9 Prefer not to respond
GRTA [IF RIBUS=1 OR 2] [Does/Do] [he/she/you] own a GRTA Xpress bus pass?
1 Yes
2 No
8 Don’t know
9 Prefer not to respond
GRTAF [IF GRTA=1] The last time [he/she/you] purchased [he/his/your] GRTA Xpress bus pass,
did [he/she/you]:
1 Purchase a 31-day pass
2 Purchase a 40-ride pass
3 Purchase 20-ride pass
4 The Xpress bus pass purchased through a special fare program
7 Other, specify
8 Don’t know
9 Prefer not to respond
CGTP [IF RIBUS=1 OR 2] [IF RESIDENT OF COBB COUNTY OR GWINNETT COUNTY] Do
you own a [TOGGLE: Cobb/Gwinnett] County Transit pass? If so, is that for local,
express, or paratransit service?
1 Yes, for local service
2 Yes, for express service
3 Yes, for paratransit service
4 No
8 Don’t know
9 Prefer not to respond
CGTPF [IF RIBUS=1 OR 2] [IF CGTP<4] The last time [he/she/you] purchased [his/her/your]
[TOGGLE: Cobb/Gwinnett] County Transit pass, did [he/she/you]:
1 Purchase a 31-day or monthly pass

PTV NuStats 101 ARC Regional Travel Survey Final Report
2 Purchase a 20-ride pass
3 Purchase a 10-ride pass
4 The County Transit pass is purchased through a special fare program
8 Don’t know
9 Prefer not to respond
DISFR [IF BREZ=1 or GRTA=1 or CGTP<4] [Does/Do] [he/she/you] participate in a discounted
fare program? [IF YES: What kind of discounted fare is it?]
1 No, Discounted Fare
2 Yes, through an employer
3 Yes, through a university pass (U-pass) program
4 Yes, through a K-12 student pass program
5 Yes, discounted fare for senior citizens, disabled riders, or Medicare recipients
7 Other, specify in box below:
8 Don’t know
9 Prefer not to respond
FBKTW [IF STUDE<3 OR WORKS=1] How frequently did [he/she/you] travel to work/school last
week by walking or biking?
5 Zero times (Never)
6 Once or twice
7 Three or four times
8 Five or more times
8 Don’t know
9 Prefer not to respond
COMPUTE PGTYP=1 IF PERSON IS FLAGGED FOR GPS (GTYPE=1 AND GFLAG=1 OR 2) AND AGE IS 16
TO 65 INCLUSIVE; ELSE COMPUTE PGTYP=2
TRNM CALCULATED: SUM OF HH MEMBERS THAT USE TRANSIT OR NON-MOTOR TO
WORK OR SCHOOL [RIBUS<3 OR FBKTW=2,3,4]
Finalizing Recruitment
WTGPS [IF GTYPE=1 AND GFLAG=2 AND IF AAGE2=1 AND IF TRNM>=1 AND
CTFIP=CORE COUNTY]: In addition to completing your travel diary, we are also asking
you and all adult members of your household to use a GPS device on the same travel day
we assign to you as well as 2 additional consecutive days. The GPS device allows us to
not only collect where people are traveling to, but the actual path taken, which is very
useful in transportation planning. If everyone in your household provides valid travel
information for the GPS and telephone interview portions of the study, we are offering
$<INAMT> for each device used, in appreciation of your time and effort. We will ask you
to wear or carry your GPS units with you when you travel. The devices are small and
easy to carry (you can clip them onto your belt, backpack, or purse) and they collect
details of your travel routes during your travel day. It is very important to the survey
that households like yours participate.
5 Yes, I agree to participate in the additional GPS portion of the study
CONTINUE

PTV NuStats 102 ARC Regional Travel Survey Final Report
6 No, I’d prefer not to participate in the additional GPS portion of the study
[Go to <WTGP1>]
WTGP1 [IF WTGPS=2] SET GTYPE = 3 AND CONTINUE AS NON-GPS
INCOM To ensure our study is representative of all income groups in the area, could you
estimate your household‘s total income for last year as one of the following?
01 Less than $10,000
02 $10,000-$19,999
03 $20,000-$29,999
04 $30,000-$39,999
05 $40,000-$49,000
06 $50,000-$59,999
07 $60,000-$74,999
08 $75,000-$99,999
09 $100,000 to $149,999
10 $150,000 or more
99 Prefer not to respond
ASSN1 [IF GTYPE=1 AND IF GFLAG=1 or 2] Thank you for agreeing to participate in this
study. Understanding your household‘s travel and activities is very important for
improving transportation in your area. In addition to sending you a GPS device for each
member of your household age 16+ to keep track of your travel and activities for three
consecutive days, we will also send a diary for each member of your household to keep
track of your travel and activities on <DAY AND DATE>.
3 Yes
4 No – Well let’s try a different time. How about <ALT DAY AND DATE>?
Select a day and date that works for you: <ASSN>
ASSN2 [IF GTYPE=1 AND IF GFLAG=3] Thank you for agreeing to participate in this study.
Understanding your household‘s travel and activities is very important for improving
transportation in your area. We will send you a GPS device for up to 3 working vehicles
in your household to use for seven consecutive days. We will also send a diary for each
member of your household to keep track of your travel and activities on <DAY AND
DATE>.
1 Yes
2 No – Well let’s try a different time. How about <ALT DAY AND DATE>?
Select a day and date that works for you: <ASSN>
ASSN [IF non-GPS Sample] Thank you for agreeing to participate in this study. Understanding
your household‘s travel and activities is very important for improving transportation in
your area.
We will be sending a diary for each member of your household so that they can record details about
their travel and activities for one full day. Please select a date from the list below that would be best for
your household to do this.
3 YES
4 NO – Well let’s try a different time. How about <ALT DAY AND DATE>?
Select a day and date that works for you: <ASSN>

PTV NuStats 103 ARC Regional Travel Survey Final Report
[PROGRAMMING NOTE: For all counties except Barrow and Spaulding, BLOCK
OUT April 4 – 8 (these are not valid travel dates).
For Barrow and Spaulding, BLOCK OUT April 18 – 22.
Last travel day of May 20 for the following counties: Barrow, Bartow, Carroll,
Clayton, DeKalb, Hall and Walton]
SHOW 6 ASSN DAYS FOR SCHEDULING PURPOSES
INCT1 [IF NON-GPS INCEN HOUSEHOLD] We are offering $<INAMT> in appreciation of
your efforts, but only if EVERYONE in your household completes a travel diary and
reports your travel information by <ASN10>. Once all travel information is complete and
confirmed for EVERYONE in your household, we will mail you a check.
INCT2 [IF GPS INCEN HOUSEHOLD] We are offering $<INAMT> in appreciation of your
efforts, but only if EVERYONE in your household who is assigned a GPS device, uses it
as instructed, and completes a travel diary so that we have good travel information by
<ASN10>. Once all travel information is complete and confirmed for EVERYONE in your
household, we will mail you a check.
HHNME To whom should we address the envelope?
PROGRAMMING NOTE: IMPORT FNAME AND LNAME COLLECTED EARLIER AND CONFIRM LISTED
NAME. IF NULL OR INCORRECT COLLECT NEW.
RESPF FIRST NAME: ___________
RESPL LAST NAME: ___________
9 INDICATE THAT INFORMATION IS NECESSARY, IF STILL REFUSE, TERMINATE.
TERMINATION TEXT:
We’re sorry - without this information, your household will not be eligible to participate in this study. Please select ”Back to add name information” or "Exit Survey" if you wish not want to continue.
We appreciate your time!
ANSWER CHOICES:
1- Back to name information Skips back to HHNME
2- Exit the survey Skips out and ends
CHMAD In order to mail the survey materials to you, we need to confirm your mailing address.
GTYPE=1 The travel diaries and the GPS devices will be shipped to you within the
next week. After your travel date, you can return the GPS devices by Fedex using the
return envelope provided with the

PTV NuStats 104 ARC Regional Travel Survey Final Report
Note: We cannot ship survey materials to PO Boxes because FedEx can not deliver to
them.
WE MUST HAVE A TELEPHONE NUMBER FOR FEDEX DELIVERIES
[PROGRAMMER NOTE: ASK OF BOTH GTYPE=1 and 2]:
Is this correct?
1 YES GO TO CHECK ADDRESS TO MAKE SURE FULLY COMPLETE
2 NO [IF NO ASK MTYPE, MNAME, MADDR, MSUIT, MCITY, MSTAT, MZIP]
SLANG [FULL STUDY ONLY] In which language should we send your diary materials?
3 English
4 Spanish
CATSI After your travel day, we will ask you to report details about the places you visited.
Would you prefer to report them by telephone interview, or via website?
3 Telephone Interview
4 Web Interview
REMN1 Please note that we will contact you to remind you on the day before your travel date
(your travel date is <ASSN>) and to provide you with additional instructions for your
participation. Would you like to be reminded by phone, text, and/or email? You can select
more than one option.
MULTIPLE RESPONSE
1 PHONE
2 TEXT
3 EMAIL
RMPHN [IF RMNEW=1] Is this telephone number the best number to call? [PROGRAMMER
NOTE: DISPLAY PHONE]
1 Yes
2 No, please enter correct phone number in box below: [PROGRAMMER
NOTE: ALLOW NEW PHONE TO BE ENTERED]
RMTXT [IF RMNEW=2] Please provide the best telephone number for us to send a reminder
text?
1 Enter Cell Number: _ _ _ - _ _ _ - _ _ _ _
RMEML [IF RMNEW=3] Please enter the email address where you would like to receive a
reminder email?
1 Enter Email Address: ________________
CBACK [IF ANY PERSON IS UNDER AGE 16] When we recontact you to collect your travel
and activities, we will not ask to speak with anyone under 16 years old, but we would
like to ask about their travel. Who would be the best person to give that information?
Enter Person Number: _________
CONCLUSION
THANK Thank you for participating in the Regional Travel Survey to improve your
transportation future. Please tell the other members of your household how important
their participation is for the success of the study. If you have any questions or comments,
the toll free number where you can reach us is 888-222-7734. Thank you again.

PTV NuStats 105 ARC Regional Travel Survey Final Report
[PROGRAMMING NOTE: PLEASE BE SURE THE WEB SURVEY CAN NOT BE REACCESSED ONCE
COMPLETED.]

PTV NuStats 106 ARC Regional Travel Survey Final Report
Appendix C: Retrieval CATI Survey
Acronym Dictionary
DK = Don’t Know
RF = Refusal
NA = Not applicable
ADD HPFLG
Reminder Call
Sample Number: «SAMPN» Telephone #: «PHONE» Preferred time: «PTIME» COUNTY: «COUNT» FIPSCODE:«FIPS» PIN Number: <<PINNO>> [Project Website]
[INT01]: Hi, this is _____ with the Regional Travel Survey conducted on behalf of the Georgia
Department of Transportation and the Atlanta Regional Commission. May I speak to
<RESPF> <RESPL>?
[IF RESPONDENT ON PHONE] I was just calling to remind you that your household
will be participating in the Regional Travel Survey and also to see if you had any
questions about the study. Please keep in mind that each member of your household
must record all their trips on <ASSN>. This will help improve transportation in your
area.
Programming Note Add: Recruited on [Recruit CM Day] at_[Recruit Time]____
ASSN:________
RC CONTINUE Skip to PACKT
RN NO ANSWER
RZ BUSY
RA ANSWERING MACHINE
LM LEFT MESSAGE
IM COMPUTER/FAX MACHINE
IG BUSINESS/GOVERNMENT
ID DISCONNECT
PM CALLER ID
RR REMINDER REFUSAL
RH HUNG UP (W/O A WORD)
WN WRONG NUMBER (NEED TO RESEARCH)
WV RESPONDENT HAS MOVED
RC RESP WILL CM ONLINE
RT RESCHEDULE, CALLBACK
RM RESCHEDULE, REMAIL
PRNGP – Variations:

PTV NuStats 107 ARC Regional Travel Survey Final Report
1. Non-GPS – GTYPE>1
2. Wearable and targeted wearable - GTYPE=1 and GFLAG=1 or 2
3. Vehicle GPS - GTYPE =1 and GFLAG=3
PACKT [IF PRNGP=1] Did your household receive the travel diaries packet that we sent to you?
[IF PRNGP=2] Did your household receive the packet containing travel diaries and GPS
devices that we sent to you?
[IF PRNGP=3] Did your household receive the packet containing travel diaries and GPS
devices that we sent to you?
1 YES Skip to ANYQU
2 NO
INT04 [IF PACKT=2] Your participation is very important, could you download your diaries
from the project website?
The site address is: www.ImproveGeorgiaTravel.com.
IF NEEDED, RESCHEDULE. [PROGRAMMER NOTE: USE RM DISPOSITION AND
ALLOW 7 DAYS FOR MATERIALS TO BE PROCESSED AND MAILED OUT]
IF RF: Let me assure you that your information is confidential and used only for research
purposes. IF NEEDED: We would really like to include your household in this important
project. Let me set up a new travel day for your home. SELECT "RM".
RC CONTINUE Skip to ANYQU
RT RESCHEDULE
RM CANNOT DOWNLOAD, REMAIL VERIFY MADDR
RF FINAL REFUSAL

PTV NuStats 108 ARC Regional Travel Survey Final Report
PRN16 – Variations
1. Non-GPS – GTYPE>1
2. Wearable and targeted wearable - GTYPE=1 and GFLAG=1 or 2
3. Vehicle GPS - GTYPE =1 and GFLAG=3
ANYQU [IF PRN16=1] Do you have any questions about the diaries or what we're asking you to
do?
Just to reiterate, we would like everyone in the household to record where they go on
<ASSN>. Each person should have received a diary to enter what places they visit or
stops they make, including complete addresses, and accurate arrival and departure
times, as well as how they got there and the purpose of the trip.
IF NEEDED: This information will be kept confidential and will be used to improve
transportation planning in the area.
IF PRN16=2 Do you have any questions about the travel diaries or GPS devices or what
we're asking you to do?
Just to reiterate, we would like everyone who received a GPS device to carry or wear it
throughout the day for three consecutive days starting on <ASSN>. Each member of your
household should also use the diaries provided to enter what places they visit or stops
they make during the course of the day on <ASSN>. Please include complete addresses,
and accurate arrival and departure times, as well as how they got to each place and the
purpose of the trip.
IF NEEDED: This information will be kept confidential and will be used to improve
transportation planning in the area.
IF NEEDED: The GPS study allows us to not only collect where people are traveling
to, but the actual path taken, which is very useful in transportation planning.
IF PRN16=3 Do you have any questions about the GPS devices or the travel diaries and
what we're asking you to do?
Just to reiterate, you will place one GPS device in each assigned vehicle for seven
consecutive days beginning on <ASSN>. Each member of your household should also use
the diaries provided to enter what places they visit or stops they make during the course
of the day on <ASSN>. Please include complete addresses, and accurate arrival and
departure times, as well as how they got to each place and the purpose of the trip.
IF NEEDED: This information will be kept confidential and will be used to improve
transportation planning in the area.
IF NEEDED: The GPS study allows us to not only collect where people are traveling
to, but the actual path taken, which is very useful in transportation planning.
CATSI Once you have completed recording your travel details, you previously indicated you
would prefer to do the final interview by <telephone interview/ via the website>. Is that
still your preference?
1 Telephone interview

PTV NuStats 109 ARC Regional Travel Survey Final Report
2 WEB interview
RINCE [IF INCEN=1] – REMINDER INCENTIVE. Just a reminder, your household is being
offered $<INAMT> if EVERYONE in the household completes the study with valid travel
information by <ASN10>, we will send your household a check for $<INAMT> in the next
8-10 weeks.
1 CONTINUE
PRNCB – Variations
1. CATSI=1 and GTYPE=1
2. CATSI=1 and GTYPE>1
3. CATSI=2 and GTYPE=1[CALBC]
4. CATSI=2 and GTYPE>1
[IF PRNCB=1] After your household records travel information, we‘ll call you back. Ideally, we
would like to speak with you, but if not, we'd like to speak to someone age 18 or older. What is
the best time of day to reach you? [INTERVIEWER NOTE: SET UP CALLBACK THE DAY
AFTER TRAVEL IF POSSIBLE]
Thank you very much for your participation in this important study. Please hang on to your
survey materials INCLUDING THE TRAVEL DIARY until we call you to retrieve your travel
information. Once we've collected your travel details, you may recycle or retain them for your
records. You should continue to use your GPS devices for <X based on GLFAG> days after that.
Have a great day/evening!
[PROGRAMMER NOTE: ADD PROJECT WEBSITE AND PINNO AT THIS SCREEN]
[IF PRNCB=2] After your household records travel information, we‘ll call you back. Ideally, we
would like to speak with you, but if not, we'd like to speak to someone age 18 or older. What is
the best time of day to reach you? [INTERVIEWER NOTE: SET UP CALLBACK THE DAY
AFTER TRAVEL IF POSSIBLE]
Thank you very much for your participation in this important study. Please hang on to your
survey materials INCLUDING THE TRAVEL DIARY until we call you to retrieve your travel
information. Once we've collected your travel details, you may recycle or retain them for your
records.
Have a great day/evening!
[PROGRAMMER NOTE: ADD PROJECT WEBSITE AND PINNO AT THIS SCREEN]
[IF PRNCB=3] After your travel date is complete, please log into the survey website to report
your household travel information. If possible, you should schedule a time on <BGDAT> to do
this.
Thank you very much for your participation in this important study. Please hang on to your
survey materials INCLUDING THE TRAVEL DIARY until the time when you log in to report
your travel information. Once you have reported your data you may recycle or retain the
materials for your records. You should continue to use your GPS devices for <X based on
GFLAG> days after that.
Have a great day/evening!
[PROGRAMMER NOTE: ADD PROJECT WEBSITE AND PINNO AT THIS SCREEN]
[IF PRNCB=4] After your travel date is complete, please log into the survey website to report
your household travel information. If possible, you should schedule a time on <BGDAT> to do
this.
Thank you very much for your participation in this important study. Please hang on to your
survey materials INCLUDING THE TRAVEL DIARY until the time when you log in to report
your travel information. Once you have reported your data you may recycle or retain the
materials for your records.
Have a great day/evening!
[PROGRAMMER NOTE: ADD PROJECT WEBSITE AND PINNO AT THIS SCREEN]

PTV NuStats 110 ARC Regional Travel Survey Final Report
Retrieval Script
INT02 Hi, this is __________ from the Regional Travel Survey conducted on behalf of the
Georgia Department of Transportation and ARC. We recently spoke with <FNAME>
<LNAME> and are calling back to conduct the interview he/she agreed to complete a few
days ago. May I please speak with <FNAME>?
1 HAVE RESPONDENT CONTINUE
2 RESPONDENT NOT AVAILABLE GO TO CALBK
3 RESCHEDULE CALLBACK (RT)
4 RESCHEDULE REMAIL (RM)
CALBK Earlier we spoke with you about the travel survey and asked you to record your travel
day on <ASSN>. Can we collect the details about your travel day now?
OK CONTINUE CE ENTERING A MAIL-IN ML RESPONDENT WILL MAIL IN LOGS HM RESPONDENT HAS MAILED IN LOGS WC RESPONDENT WILL COMPLETE
ONLINE(ONLY CHOOSE IF THEY PROMISE TO
GO ONLINE) [PROGRAMMER NOTE: IF
SELECTED, GO TO POP-UP SCREEN WHERE
INTERVIEWER CAN READ WEBSITE AND
PINNO] LR LOGS RECEIVED NA NO ANSWER BZ BUSY AM ANSWERING MACHINE LM LEFT MESSAGE ID DISCONNECT IM COMPUTER/FAX MACHINE IG BUSINESS/GOVERNMENT PM CALLER ID IW WRONG NUMBER, NEED TO RESEARCH KB SPECIFIC CALLBACK KH GENERAL CALLBACK K5 CALL BACK IN 5 MINUTES KN NEW NUMBER (HAVE NEW NUMBER) R1 1ST REFUSAL R2 2ND REFUSAL RH HUNG UP (W/O A WORD) H2 2ND HANG UP
PROGRAMMER NOTE: SHOW TEXT IF HOUSEHOLD QUALIFIES FOR INCENTIVE. <INCEN>/<INAMT>
Just a reminder, your household is being offered <INAMT> to thank you for your
participation in this study. If EVERYONE in the household completes the study with
valid travel information by <ASN10>, we will send your household <INAMT> in the next
8-10 weeks.

PTV NuStats 111 ARC Regional Travel Survey Final Report
SCPT1 Last week, we spoke with you about the travel survey and asked you to record your travel on
<ASSN>. We would like to collect your trip information now.
VADD: Let‘s start by verifying the address where you live. Our records show that your address is:
RECALL INFORMATION FROM RECRUITMENT FOR INTERVIEWER TO REFERENCE:
<FNAME> <LNAME>
<ADDRESS>
<CITY> <STATE> <ZIP>
Travel Day: <TDAY>
ASSN: <ASSN>
VERIFY INFO BELOW COLLECTED IN RECRUITMENT
HHSIZ Our records show that there is/are <OHSIZ> person/people living in your household. Is
that correct? ENTER A NEW NUMBER BELOW IF NEEDED
1 One
2 Two
3 Three
4 Four
5 Five
6 Six
7 Seven
8 Eight or more
98 DK
99 RF
SIZ08 Household Size Follow-up [IF HHSIZE = 8]
Please enter the total number of people in your household: [Range: 8 to 20]
ENTER NUMBER
1 I prefer not to answer
Household Member Characteristics Verification
HOUSEHOLD MEMBER CHARACTERISTICS (AGE, WORKER STATUS, WORK LOCATION, STUDENT
STATUS, SCHOOL LOCATION)
LKPER Okay, now I need to confirm the name, age, gender, employment status, and student
status we have for each household member. VERIFY PERSON INFORMATION BY
CLICKING ON PERSON SUMMARY BUTTON. SELECT THE PERSON(S) YOU NEED
TO MAKE CHANGES TO.
1 NO CHANGES NEEDED THIS PERSON
2 EDIT THIS PERSON
3 ADD THIS PERSON
4 DELETE THIS PERSON
WHATC What are you changing?
1 PERSONAL INFORMATION (NAME, AGE, LICENSE)

PTV NuStats 112 ARC Regional Travel Survey Final Report
2 EMPLOYMENT INFORMATION STATUS
3 EMPLOYMENT ADDRESS
4 STUDENT INFORMATION (STATUS, SCHOOL ADDRESS, EDUCATION, ETC)
5 GO TO LOG QUESTIONS (skip to CMPLG)
CMPLG Did <NAME> complete their travel diary? (PROGRAMMING NOTE ASK OF ALL)
1 YES (COMPLETED)
2 NO (NOT COMPLETED)
3 DID NOT RECEIVE MATERIALS
8 DK
9 RF
HVLOG Do you have the completed diary to refer to? (PROGRAMMING NOTE ASK OF ALL)
1 Yes
2 No
9 REFUSED
HHVEH In terms of vehicles available to your household, we show that you have <HHVEH>
available. Is that right? (MAKE CHANGES BELOW BY SELECTING TH NEW
NUMBER AS NEEDED)
0 Zero
1 One
2 Two
3 Three
4 Four
5 Five
6 Six
7 Seven
8 Eight or more
98 DK
99 RF
VEH08 Vehicle number: [IF HHVEH = 8]
Please enter the number of vehicles in the household. (Range: 8-20)
99 I prefer not to answer
CONFIRM HOUSEHOLD VEHICLE INFORMATION (YEAR, MAKE, MODEL, BODY,
FUEL)
LKVEH Okay, now I need to confirm the year and body type we have for each household vehicle.
VERIFY VEHICLE INFORMATION BY CLICKING ON VEHICLE SUMMARY
BUTTON.
1 NO CHANGES NEEDED FOR VEHICLES
2 EDIT THIS VEHICLE
3 ADD THIS VEHICLE
4 DELETE THIS VEHICLE
NOTE: IF VEHICLES ARE ADDED, COLLECT ALL VEHICLE DATA ASKED IN RECRUITMENT

PTV NuStats 113 ARC Regional Travel Survey Final Report
INCOM [IF RECRUITMENT INCOM=99] And to make sure your household properly represents
other in the region, can you pick the option from the following categories which best
represents your total household income last year? We understand if you feel
uncomfortable answering this question. However, we only ask about income to ensure all
households are equally represented in our survey. Income has been found to be related to
the types of trips households make, and we need to make sure we get information for all
types of trips and income levels.
01 Less than $10,000
02 $10,000-$19,999
03 $20,000-$29,999
04 $30,000-$39,999
05 $40,000-$49,000
06 $50,000-$59,999
07 $60,000-$74,999
08 $75,000-$99,999
09 $100,000 to $149,999
10 $150,000 or more
99 REFUSED
Verify Habituals (home, work, school).
Person Roster
TTBUT (INTERVIEWER NOTE CLICK ON LINK TO LAUNCH TRIPBUILDER)
TRAVEL INFORMATION HAS TO BE COLLECTED FOR ALL HH MEMBERS,
EXCEPT FOR HOUSEHOLDS WITH 4+ HOUSEHOLD MEMBERS, N-1 WILL BE
ALLOWED FOR UP TO 5 PERCENT OF OVERALL CASES,
A PROXY IS REQUIRED FOR PERSONS AGE 15 AND UNDER. WE MUST ATTEMPT
TO SPEAK DIRECTLY TO PERSONS AGE 16 AND OLDER AT LEAST THREE TIMES
BEFORE WE OBTAIN PROXY INFORMATION.
IF ALL MEMBERS OF THE HOUSEHOLD ARE UNRELATED COLLEGE STUDENTS,
A VALID COMPLETE IS ALL TRAVEL FOR THE MAIN RESPONDENT WHO
ACTUALLY GOES TO COLLEGE/UNIV CLASS ON THE TRAVEL DAY AND AS
MANY OF THE OTHER HH MEMBERS AS POSSIBLE. NON-RELATED HH WILL BE
FLAGGED AND INTERVIEWER WILL KNOW PRIOR TO CALLING THE
HOUSEHOLD IF THIS IS A NON-RELATED
OBTAIN DETAILS FOR ALL TRIPS, EVEN THOSE THAT ARE WORK-RELATED OR
FOR WORK PURPOSES EXCEPT WHEN THE JOB IS DELIVERY (I.E. UPS DRIVER,
THEN COLLECT TRIPS TO AND FROM MAIN WORK LOCATION)
TRIP ROSTER (TRIP BUILDER)
Ok, thank you for verifying the information you provided to us during the previous interview. Next, we
will ask you to provide details about the trip/activity information that your household recorded for your
travel day.

PTV NuStats 114 ARC Regional Travel Survey Final Report
PROXY SELECT THE PERSON YOU ARE SPEAKING WITH. (INDICATE IF TRIP
INFORMATION IS BEING PROVIDED BY THE INFORMANT OR BY PROXY)
[COMPUTED]
1 INFORMANT
2 PROXY
NTRVI [IF PROXY=2] Select who you are speaking with: ____________
HABITUAL COLLECTION: We will now use an interactive mapping tool to map your home, work and
school locations.
Please search for your household's locations to place them on the map OR click the "Set Location" button
to mark them on the map directly. Follow STEP 1 and STEP 2 for each location.
PTYPE We will now use a similar tool to collect information about the places you visited on your
assigned travel day. IF PLACE 1: Okay, where were you at 3 am on [ASSN]?
OTHERWISE: Where did you go next?
1 Home
2 Primary Job
3 Second Job
4 School
5 Transit Stop
7 Other Place (Specify)
ADDRESS INFORMATION CAPTURED IN TRIPBUILDER
[INTERVIEWER NOTE: PLACE NAME SHOULD INCLUDE INFORMATION
DESCRIBING THE PLACE IF IT IS UNCERTAIN. EXAMPLE: ―NOVEL IDEAS‖
SHOULD BE ―NOVEL IDEAS BOOKSTORE‖. ASK ―WHAT TYPE OF PLACE IS
THIS?‖ IF YOU DO NOT KNOW THE TYPE OF THE PLACE]
PNAME [PTYPE=03, 04, 05, 07] LOCATION NAME: What was that place?
ADDR [PTYPE=03, 04, 05, 07] What is the street address of that place?
CITY And the city?
STATE Is that in STATE OF RESIDENCE?
ZIP Do you know the zip code?
DEPTM What time did you leave this place? MILITARY TIME
DO NOT ASK STOPS AS SEPARATE QUESTION: DISPLAY NOTE IN TB: ―If you made any stops
before your next destination (such as to stop for fuel, pick up food, or to pick up drop
off someone), please ADD these as separate places.‖
ARRTM What time did you arrive there? MILITARY TIME
TRPDUR TRIP DURATION CALCULATED
MODE How did you get there?
1 Walk

PTV NuStats 115 ARC Regional Travel Survey Final Report
2 Bike
3 Auto / Van / Truck driver
4 Auto / Van / Truck Passenger
5 Local bus (Regular, Standard, City)
6 Express bus (Suburban, Commuter, Inter-City)
7 MARTA Train
8 Dial-a-ride/Paratransit
9 Taxi / Limo
10 School bus
11 Motorcycle/Moped
97 Other, SPECIFY
98 Don't Know
99 Refused
PARTY How many others traveled with <YOU>? [NOT INCLUDING THIS RESPONDENT]
HHMEM [IF PARTY>0] Of these, how many were household members?
PERTP [IF HHMEM>0] Who were the household members? [ENTER ALL PERNOS]
COMPUTE ALL NON-HH MEMBERS [NONHH]
COMPUTER [TOTTR]=PARTY+1
VEHNO [IF MODE=3 OR 4] Which vehicle did <YOU> use?
ENTER VEHNO: _______
97 Non-household vehicle
HOVL [IF MODE=3 OR 4] Did you use a HOV lane on this trip? [INTERVIEWER NOTE: An
HOV lane is a ―High Occupancy Vehicle Lane‖ or ―Carpooling‖ lane, reserved for vehicles
with a driver and 1 or more passengers]
1 YES
2 NO
9 DON’T REMEMBER/REFUSED
TOLL [IF MODE=3 OR 4] Did you use a toll lane on this trip? [FOR FULL STUDY,
TRIPBUILDER WILL ASK BASED ON TOLL HIGHWAY USAGE]
1 YES
2 NO
9 DON’T REMEMBER/REFUSED
DYGOV [IF MODE=3 OR 4 AND PTYPE<>1] Did you get out of your vehicle at this place?
1 YES
2 NO [INTERVIEWER NOTE: Would be appropriate for dropping off passengers,
drive through, etc.]
9 DK/RF
PLOC [IF MODE=3 AND DYGOV=1] Did you park at this destination or off-site?
1 At this destination
2 Off-site
9 DK/RF
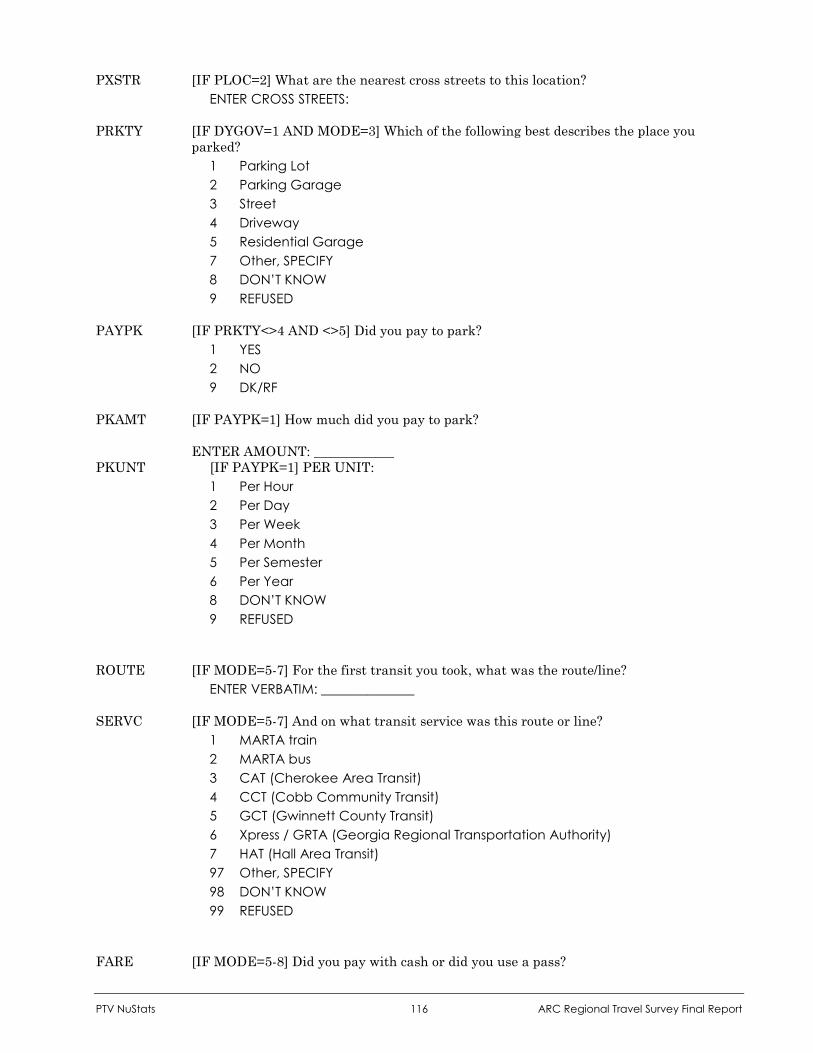
PTV NuStats 116 ARC Regional Travel Survey Final Report
PXSTR [IF PLOC=2] What are the nearest cross streets to this location?
ENTER CROSS STREETS:
PRKTY [IF DYGOV=1 AND MODE=3] Which of the following best describes the place you
parked?
1 Parking Lot
2 Parking Garage
3 Street
4 Driveway
5 Residential Garage
7 Other, SPECIFY
8 DON’T KNOW
9 REFUSED
PAYPK [IF PRKTY<>4 AND <>5] Did you pay to park?
1 YES
2 NO
9 DK/RF
PKAMT [IF PAYPK=1] How much did you pay to park?
ENTER AMOUNT: ____________
PKUNT [IF PAYPK=1] PER UNIT:
1 Per Hour
2 Per Day
3 Per Week
4 Per Month
5 Per Semester
6 Per Year
8 DON’T KNOW
9 REFUSED
ROUTE [IF MODE=5-7] For the first transit you took, what was the route/line?
ENTER VERBATIM: ______________
SERVC [IF MODE=5-7] And on what transit service was this route or line?
1 MARTA train
2 MARTA bus
3 CAT (Cherokee Area Transit)
4 CCT (Cobb Community Transit)
5 GCT (Gwinnett County Transit)
6 Xpress / GRTA (Georgia Regional Transportation Authority)
7 HAT (Hall Area Transit)
97 Other, SPECIFY
98 DON’T KNOW
99 REFUSED
FARE [IF MODE=5-8] Did you pay with cash or did you use a pass?

PTV NuStats 117 ARC Regional Travel Survey Final Report
1 Cash
2 Used Pass
8 DON’T KNOW
9 REFUSED
FAREC [IF FARE=1] How much did you pay?
ENTER AMOUNT VERBATIM:__________________
TPURP [ALL MODES] What was <YOUR> main activity there?
TPUR2 What else did you do there?
LIST FOR TPURP AND TPUR2:
0 NO OTHER ACTIVITIES [ONLY OPTION FOR TPUP2]
ACTIVITIES AT HOME:
1 WORKING AT HOME (FOR PAY OR VOLUNTEER)
2 SHOPPING (ON-LINE, CATALOG, OR BY PHONE)
3 ANY OTHER ACTIVITIES AT HOME
ACTIVITIES WHILE TRAVELING:
4 CHANGE TRAVEL MODE/TRANSFER (FROM CAR TO BUS/TRAIN, WALK TO
BUS/TRAIN, ETC)
5 DROPPED OFF PASSENGER
6 PICKED UP PASSENGER
7 DRIVE THROUGH (ATM, BANK, FAST FOOD, ETC).
ACTIVITES AT WORK:
8 WORK/DOING MY JOB
9 OTHER WORK-RELATED ACTIVITIES AT WORK
10 VOLUNTEER WORK/ACTIVITIES
ACTIVITES AT SCHOOL:
11 ATTENDING CLASS/STUDYING
12 ALL OTHER ACTIVITIES AT SCHOOL (EAT LUNCH, RECREATIONAL, ETC)
ACTIVITES AT ALL OTHER PLACES:
13 WORK RELATED (MEETING, SALES CALL, DELIVERY)
14 SERVICE PRIVATE VEHICLE (GETTING GAS, OIL, LUBE, REPAIRS)
15 GROCERY/FOOD SHOPPING
16 OTHER ROUTINE SHOPPING (CLOTHING, CONVENIENCE STORE, HOUSEHOLD
MAINTENANCE)
17 SHOPPING FOR MAJOR PURCHASES OR SPECIALTY ITEMS (APPLIANCES,
ELECTRONICS, NEW VEHICLE, MAJOR HH REPAIRS, ETC)
18 HOUSEHOLD ERRANDS (BANK, DRY CLEANING, ETC.)
19 HEALTH CARE (DOCTOR, DENTIST, ETC)
20 PERSONAL BUSINESS (VISIT GOVERNMENT OFFICE, ATTORNEY, ACCOUNTANT)
21 EAT MEAL OUT AT RESTAURANT/DINER
22 CIVIC OR RELIGIOUS ACTIVITIES
23 INDOOR RECREATION (YOGA, GYM, ETC) OR OUTDOOR RECREATION
(JOGGING, BIKING, WALKING)
24 ATTEND MAJOR SPORTING EVENT
25 SOCIAL/VISIT FRIENDS/RELATIVES
97 OTHER, SPECIFY

PTV NuStats 118 ARC Regional Travel Survey Final Report
DEPTM IF LAST PLACE OF THE DAY, ENTER 0259. OTHERWISE: What time did <YOU>
leave for the next place? ENTER IN MILITARY TIME
ENTER TIME: ____________
End of Trip Roster
NOGOWHY Reason for No Travel [IF MAX PLANO=1] So, [you, he, she] made no trips, including
for work or school. Is this correct? [INTERVIEWER NOTE: REFER PARTICIPANT TO
FRONT OF DIARY IF NEEDED]
[IF TRUE]: Why not?
[IF NEEDED: We just need to make a note about days when people don‘t travel. It would
help if you would let me know the reason you didn‘t make any trips on your assigned
travel day.]
01 PERSONALLY SICK
02 VACATION OR PERSONAL DAY
03 CARETAKING SICK KIDS
04 CARETAKING SICK OTHER
05 HOME-BOUND ELDERLY OR DISABLED
06 WORKED AT HOME FOR PAY
07 NOT SCHEDULED TO WORK
08 WORKED AROUND HOME (NOT FOR PAY)
09 OUT OF AREA
10 NO TRANSPORTATION AVAILABLE
11 WEATHER
97 OTHER, SPECIFY 99 REFUSED [We just need to make a note about days when people don’t travel. It would help if you would let me know the reason you didn’t make any trips on your assigned travel day.]
[IF FALSE: OBTAIN TRAVEL]
IF HHSIZ>1 – GO BACK TO <PNAME> FOR NEXT HH MEMBER UNTIL ALL HH MEMBER
TRAVEL COLLECTED
IF HHSIZ=1 OR LAST PERSON IN HOUSEHOLD, GO TO CNTV
End of Person Roster
[AT THE END OF SURVEY, CHECK TO SEE IF ALL HH VEHICLES WERE USED. IF NOT:]
CNTV Did anyone drive the [VEHICLE YEAR, MAKE, MODEL] on TRAVEL DAY?
1 YES
2 NO – Why not? (Please Specify) [O_CNTV]
9 REFUSED

PTV NuStats 119 ARC Regional Travel Survey Final Report
Thank you for participating in the Regional Travel Survey. At this point, I wish to reiterate how
important your participation was for the success of the study.
Follow-Up
FUTUR Are you willing to participate in future surveys?
1 YES
2 NO
9 REFUSED
Closing
[IF GTYPE=1 AND GFLAG<3 AND CURRENT DATE IS LESS THAN <ASSN + 3 DAYS>]:
L1 Please remember to keep wearing your GPS devices each day and mail them back on
<ASSN + 3 days> in the FedEx packaging.
[IF GTYPE=1 AND GFLAG<3 AND CURRENT DATE IS GREATER THAN OR EQUAL TO <ASSN + 3
DAYS>]:
L2 Have you returned your GPS equipment yet? (IF NOT: You can drop the package in
any Fedex drop box or call 1-800-GOFEDEX for a pickup).
1 YES
2 NO
9 DON’T KNOW / REFUSE
[IF GTYPE=1 AND GFLAG=3 AND CURRENT DATE IS LESS THAN <ASSN + 7 DAYS>]:
L3 Please remember to keep using the GPS devices in your vehicle each day and mail
them back on <ASSN + 7 days>.
[IF GTYPE=1 AND GFLAG=3 AND CURRENT DATE IS GREATER THAN OR EQUAL TO <ASSN + 7
DAYS>]:
L4 Have you returned your GPS equipment yet? (IF NOT: You can drop the package in
any Fedex drop box or call 1-800-GOFEDEX for a pickup).
1 YES
2 NO
9 DON’T KNOW / REFUSE
[IF INCEN=1]: Once all of your travel information is reviewed and confirmed for consistency, you should
receive your check for $<INAMT> in the mail in about 8-10 weeks.
RESPF/RESPL VERIFY NAME THAT WILL APPEAR ON CHECK: The name that will appear on the
check is: _________________________ - is this correct?

PTV NuStats 120 ARC Regional Travel Survey Final Report
THANK If you have any questions or comments, I have a phone number where you can reach us.
Would you like that number? WAIT FOR THEM TO WRITE: You can reach us at 888-
222-7734. Thank you and have a good afternoon/evening.
ILANG LANGUAGE OF INTERVIEW: CODE LANGUAGE OF TYPE INTERVIEWER
INSTRUCTIONS HERE IN ALL CAPS.
1 ENGLISH
2 SPANISH

PTV NuStats 121 ARC Regional Travel Survey Final Report
Appendix D: Retrieval WEB Survey
INT02 Introduction
Welcome back to the Regional Travel Survey.
Please click ―Next‖ to continue.
SCPT0 Verify Respondent
If you are not <RESPF> <RESPL>, then select your name from the list.
1 Person Name #1
2 Person Name #N
SCPT1 Report Travel
Previously you provided data about your household and agreed to record your travel on
<ASSN>. Press ‗NEXT‘ to report your trip information.
PRON1 Incentive Reminder
Just a reminder, your household is being offered $<INAMT> to thank you for your
participation in this study. If EVERYONE in the household completes the study with
valid travel information, we will send your household $<INAMT> in the next 8-10
weeks.
VADD Verify Address
Start by verifying the address where you live. Our records show that your address is:
Address: <HADDR>
Apt #: <HSUIT>
City: <HCITY>
State: <HSTAT>
Zip: <HZIP>
1 Yes, address is correct
2 No, address needs to be updated Will be collected in next screen
MADDR Verify Address 2
Please very your mailing address information:
Address: <MADDR>
Apt #: <MSUIT>
City: <MCITY>
State: <MSTAT>
Zip: <MZIP>
1 Yes, address is correct
2 No, address needs to be updated Will be collected in next screen
HHSIZ Household Size
Our records show that there is/are <HHSIZ> person/people living in your household.
Is this correct? If this is not correct, please indicate a new number of people living in
your household:

PTV NuStats 122 ARC Regional Travel Survey Final Report
We want to ensure that everyone in your household has the opportunity to record their travel. If your household size or any of your household members worker or student status has changed since the previous interview, please call our survey hotline to have one of our experienced representatives assist you 888-222-7734.
1 One
2 Two
3 Three
4 Four
5 Five
6 Six
7 Seven
8 Eight or more
98 Don’t know
99 I prefer not to answer
SIZ08 Household Size Follow-up [IF HHSIZE = 8]
Please enter the total number of people in your household: [Range: 8 to 20]
ENTER NUMBER
1 I prefer not to answer
Household Member Characteristics Verification
HOUSEHOLD MEMBER CHARACTERISTICS (AGE, WORKER STATUS, STUDENT STATUS)
LKPER Please confirm the name, age, gender, employment status, and student status for each
household member.
PROVIDE SUMMARY TABLE FOR EACH PERSON WITH OPTION TO EDIT EACH FIELD. WE
CAN HAVE A DROP-DOWN MENU WITH EACH PERSON. WHEN SELECTED, THE PERSON
TABLE WILL BE UPDATED TO SHOW INFO FOR THAT PERSON
CMPLG Completed Travel Diary
Did <FNAME> complete a travel diary?
1 Yes - completed
2 No - not completed
3 Did not receive materials
4 Don’t know
5 I prefer not to answer
HVLOG Completed Travel Diary 2 [IF CMPLG=1]
Do you have the completed diary with you now to refer to?
1 Yes Skip to 1.7 to verify each person
2 No
9 I prefer not to answer
NOLOG Continue with Survey [IF CMPLG=2 OR HVLOG=2]
We will continue with the survey. Please try to recall the information as best you can.
Press Next to Continue.

PTV NuStats 123 ARC Regional Travel Survey Final Report
VERIFY EACH PERSON
HHVEH Verify Number of Household Vehicle
In terms of vehicles available to your household, we show that you have <HHVEH>
available. Is that right? Make changes below by selecting the new number as needed.
0 No household vehicles
1 One
2 Two
3 Three
4 Four
5 Five
6 Six
7 Seven
8 Eight or more
98 Don’t know
99 I prefer not to answer
VEH08 Vehicle number: [IF HHVEH = 8]
Please enter the number of vehicles in the household. (Range: 8-20)
99 I prefer not to answer
LKVEH Verify Vehicle
Confirm the YEAR, MAKE, MODEL, EZPAS, BODY, FUEL, CIGLT for each vehicle
PROVIDE SUMMARY TABLE FOR EACH VEHICLE WITH OPTION TO EDIT EACH FIELD. WE
CAN HAVE A DROP-DOWN MENU WITH EACH VEHICLE. WHEN SELECTED, THE VEHICLE
TABLE WILL BE UPDATED TO SHOW INFO FOR THAT VEHICLE
NOTE: IF VEHICLES ARE ADDED, COLLECT ALL VEHICLE DATA ASKED IN RECRUITMENT
INCOM [IF RECRUITMENT INCOM=99] Household Income
And to make sure your household properly represents others in the region, can you
pick the option from the following categories which best represents your total
household income last year?
01 Less than $10,000
02 $10,000-$19,999
03 $20,000-$29,999
04 $30,000-$39,999
05 $40,000-$49,999
06 $50,000-$59,999
07 $60,000-$74,999
08 $75,000-$99,999
09 $100,000 to $149,999
10 $150,000 or more
98 Don’t know
99 I prefer not to answer

PTV NuStats 124 ARC Regional Travel Survey Final Report
Person Roster
NOTE: TTBUT – LAUNCH TRIPBUILDER
TRAVEL INFORMATION HAS TO BE COLLECTED FOR ALL HH MEMBERS,
EXCEPT FOR HOUSEHOLDS WITH 4+ HOUSEHOLD MEMBERS, N-1 WILL BE
ALLOWED FOR UP TO 5 PERCENT OF OVERALL CASES,
A PROXY IS REQUIRED FOR PERSONS AGE 15 AND UNDER. WE MUST ATTEMPT
TO SPEAK DIRECTLY TO PERSONS AGE 16 AND OLDER AT LEAST THREE TIMES
BEFORE WE OBTAIN PROXY INFORMATION.
IF ALL MEMBERS OF THE HOUSEHOLD ARE UNRELATED COLLEGE STUDENTS,
A VALID COMPLETE IS ALL TRAVEL FOR THE MAIN RESPONDENT WHO
ACTUALLY GOES TO COLLEGE/UNIV CLASS ON THE TRAVEL DAY AND AS
MANY OF THE OTHER HH MEMBERS AS POSSIBLE. NON-RELATED HH WILL BE
FLAGGED AND INTERVIEWER WILL KNOW PRIOR TO CALLING THE
HOUSEHOLD IF THIS IS A NON-RELATED
OBTAIN DETAILS FOR ALL TRIPS, EVEN THOSE THAT ARE WORK-RELATED OR
FOR WORK PURPOSES EXCEPT WHEN THE JOB IS DELIVERY (I.E. UPS DRIVER,
THEN COLLECT TRIPS TO AND FROM MAIN WORK LOCATION)
BEGIN TRIP BUILDER
Ok, thank you for verifying the information you provided to us during the previous interview. Next, you
will be asked to provide details about the trip and activity information that your household recorded on
your travel day.
Trip Roster
PTYPE Place Type
IF PLACE 1: Ok, where were you at 3:00 am on [ASSN]?
OTHERWISE: Where did you go next?
01 Home
02 Primary Job
03 Secondary Job
04 School
05 Transit Stop
07 Other Place (specify)
IF PLACE 1, SKIP TO TPURP
ADDRESS INFORMATION CAPTURED IN TRIPBUILDER
Please include information describing each place visited. For example, if you visited
―Novel Ideas‖, please enter ―Novel Ideas Book Store.‖
PNAME Place Name, Universe: PTYPE = 03, 04, 05, 07
What was the name of that place?
ENTER PLACE NAME: ______

PTV NuStats 125 ARC Regional Travel Survey Final Report
ADDR Place Address, Universe: PTYPE = 03, 04, 05, 07
What is the street address of that place?
STREET: _____
APT #: _____
CITY: _____
STATE: _____
ZIP: _____
DEPTM Departure Time
What time did you leave this place? MILITARY TIME
ENTER TIME
DO NOT ASK STOPS AS SEPARATE QUESTION: DISPLAY NOTE IN TB: ―If you made any stops
before your next destination (such as to stop for fuel, pick up food, or to pick up drop
off someone), please ADD these as separate places.‖
ARRTM Arrive at Place
What time did you arrive at this place?
ENTER MILITARY TIME: _____
98 Don’t know
99 I prefer not to answer
TRPDUR TRIP DURATION CALCULATED
MODE Mode
How did you get there?
1 Walk
2 Bike
3 Auto / Van / Truck driver
4 Auto / Van / Truck Passenger
5 Local bus (Regular, Standard, City)
6 Express bus (Suburban, Commuter, Inter-City)
7 MARTA Train
8 Dial-a-ride/Paratransit
9 Taxi / Limo
10 School bus
11 Motorcycle/Moped
97 Other, Specify
98 Don't Know
99 I prefer not to answer
PARTY Travel Party
Not including yourself, how many others traveled with you?
ENTER NUMBER: _____
HHMEM Household Members in Travel Party
[IF PARTY > 0] Of those, how many were household members?
ENTER NUMBER: _____
PERTP Identify Household Members
Who were the household members?
SELECT PERSON NUMBERS/NAME

PTV NuStats 126 ARC Regional Travel Survey Final Report
COMPUTE ALL NON-HH MEMBERS [NONHH]
COMPUTER [TOTTR]=PARTY+1
VEHNO Vehicle Used for Trip: [IF MODE=3 OR 4]
Which vehicle did <YOU> use?
ENTER VEHNO: _______
97 Non-household vehicle
HOVL High Occupancy Vehicle Use: [IF MODE=3 OR 4]
Did you use a HOV lane on this trip? An HOV lane is a ―High Occupancy Vehicle
Lane‖ or ―Carpooling‖ lane, reserved for vehicles with a driver and 1 or more
passengers.
1 Yes
2 No
9 Don't remember / I prefer not to answer
TOLL Toll Usage [IF MODE=3 OR 4]
Did you use a toll lane on this trip?
1 Yes
2 No
9 Don't remember / I prefer not to answer
DYGOV Exit Vehicle [IF MODE=3 OR 4 AND PTYPE<>1]
Did you get out of your vehicle at this place?
1 Yes
2 No
9 Don't remember / I prefer not to answer
PLOC Parking [IF MODE=3 AND IF DYGOV=1]
Did you park at this destination or off-site?
1 At this destination
2 Off-site
9 Don’t know / I prefer not to answer
PXSTR Cross-Streets [IF PLOC=2]
What are the nearest cross streets to this location?
ENTER CROSS STREETS:
PRKTY Parking Description [IF DYGOV=1 AND MODE=3]
Which of the following best describes the place you parked?
1 Parking Lot
2 Parking Garage
3 Street
4 Driveway
5 Residential Garage
7 Other, SPECIFY
8 Don’t know
9 I prefer not to answer
PAYPK Parking Fee [IF PRKTY<>4]
Did you pay to park?

PTV NuStats 127 ARC Regional Travel Survey Final Report
1 Yes
2 No
9 Don’t know / I prefer not to answer
PKAMT Parking Fee 2 [IF PAYPK=1]
How much did you pay to park?
ENTER AMOUNT: ____________
PKUNT Parking Fee Unit [IF PAYPK=1] [PROGRAMMER NOTE: PKUNT AND
PKAMT SHOULD BE ON SAME SCREEN]
What was the unit of payment for the amount indicated in the previous question?
1 Per Hour
2 Per Day
3 Per Week
4 Per Month
5 Per Semester
6 Per Year
8 Don’t know
9 I prefer not to answer
ROUTE Transit Route/Line [IF MODE=5-8]
For the first transit you took, what was the route/line?
ENTER VERBATIM: ______________
SERVC Transit Service [IF MODE=5-8]
And on what transit service was this route or line?
1 MARTA train
2 MARTA bus
3 CAT (Cherokee Area Transit)
4 CCT (Cobb Community Transit)
5 GCT (Gwinnett County Transit)
6 Xpress / GRTA (Georgia Regional Transportation Authority)
7 HAT (Hall Area Transit)
97 Other, Specify
98 Don’t know
99 I prefer not to answer
FARE Transit Fare Payment [IF MODE=5-8]
Did you pay with cash or did you use a pass?
1 Cash
2 Used pass
8 Don’t know
9 I prefer not to answer
FAREC Transit Fare Amount [IF FARE=1]
How much did you pay?
ENTER AMOUNT VERBATIM:__________________

PTV NuStats 128 ARC Regional Travel Survey Final Report
TPURP Trip Purpose/Activity
What was [you, his, her] main activity there?
TPURP2 Trip Purpose/Activity 2
What else did you do there?
LIST FOR BOTH TPURP AND TPURP2
00 No other activity
AT MY HOME
01 Working at home (for pay or volunteer)
02 Shopping (online, catelog, or by phone)
03 Any other activities at home
CHANGE MEANS OF TRAVEL/TRANSFER
04 Change travel mode/transfer (from car to bus/train, walk to bus/train, etc)
05 Drop off passenger
06 Pick up passenger
07 Drive through (ATM, bank, fast food, etc.)
AT MY WORK/VOLUNTEER LOCATION
08 Work/doing my job
09 Other work-related activities at work
10 Volunteer work/activities
AT MY SCHOOL, DAYCARE, OR COLLEGE
11 Attending class/studying
12 All other activities at school (eat lunch, recreational, etc)
AT OTHER PLACES
13 Work related (meeting, sales call, delivery)
14 Service private vehicle (getting gas, oil, lube, repairs)
15 Grocery/food shopping
16 Other routine shopping (clothing, convenience store, household
maintenance)
17 Shopping for major purchases or specialty items (appliances, electronics, new
vehicle, major household repairs, etc)
18 Household errands (bank, dry cleaning, etc)
19 Health care (doctor, dentist, etc)
20 Personal business (visit government office, attorney, accountant, etc)
21 Eat meal out at restaurant/diner
22 Civic or religious activities
23 Indoor recreation (gym, yoga, etc) or outdoor recreation (jogging, biking,
walking)
24 Attend major sporting event
25 Social/visit friends/relatives
97 Other, specify
DEPTM Departure Time
[IF LAST PLACE OF THE DAY, ENTER 0259, OTHERWISE:] What time did [you,
he, her] leave for the next place?
ENTER MILITARY TIME: ______

PTV NuStats 129 ARC Regional Travel Survey Final Report
NOGOWHY Reason for No Travel [IF MAX PLANO=1] So, [you, he, she] made no trips,
including for work or school. Please tell us why not. (If [you/he/she] did make trips,
please go back and enter the trips).
01 Personally sick
02 Vacation or personal day
03 Caretaking sick kids
04 Caretaking sick other
05 Home-bound elderly or disabled
06 Worked at home for pay
07 Not scheduled to work
08 Worked around the home (not for pay)
09 Out of area
10 No transportation available
11 Weather
97 Other, specify
99 I prefer not to answer [It’s helpful to transportation planners to know why
people do not travel. Please enter the reason you did not travel on the
assigned travel day. Thank you.]
IF HHSIZ>1 – GO BACK TO PNAME FOR NEXT HH MEMBER UNTIL ALL HH MEMBER TRAVEL COLLECTED
IF HHSIZ=1, CNTV
END TRIP BUILDER
CNTV Drive Household Vehicle
Did anyone drive the [VEHICLE YEAR, MAKE, MODEL] on TRAVEL DAY?
1 Yes
2 No
8 Don’t know
9 I prefer not to answer
CNTV2 Drive Household Vehicle 2 [IF CNTV = 2]
Why did anyone not drive the [VEHICLE YEAR, MAKE, MODEL] on TRAVEL DAY?
SPECIFY
Thank you for participating in the Regional Travel Survey. At this point, I wish to reiterate how
important your participation was for the success of the study.
FUTUR Future Surveys
Would you be interested in participating in future surveys?
1 Yes

PTV NuStats 130 ARC Regional Travel Survey Final Report
2 No
9 I prefer not to answer
Closing
GTYPEL1 [IF GTYPE=1 AND GFLAG<3 AND CURRENT DATE IS LESS THAN <ASSN +
3 DAYS>]:
Please remember to keep wearing your GPS devices each day and mail them back on
<ASSN + 3 days> in the FedEx packaging.
GTYPEL2 [IF GTYPE=1 AND GFLAG<3 AND CURRENT DATE IS GREATER THAN OR
EQUAL TO <ASSN + 3 DAYS>]:
Have you returned your GPS equipment yet? If not, you can drop the package in any
Fedex drop box or call 1-800-GOFEDEX for a pickup.
1 Yes
2 No
8 Don’t know
9 I prefer not to answer
GTYPEL3 [IF GTYPE=1 AND GFLAG=3 AND CURRENT DATE IS LESS THAN <ASSN +
7 DAYS>]: Please remember to keep using the GPS devices in your vehicle each day and mail
them back on <ASSN + 7 days>.
GTYPEL4 [IF GTYPE=1 AND GFLAG=3 AND CURRENT DATE IS GREATER THAN
OR EQUAL TO <ASSN + 7 DAYS>]: Have you returned your GPS equipment yet? If not, you can drop the package in any
Fedex drop box or call 1-800-GOFEDEX for a pickup.
1 Yes
2 No
8 Don’t know
9 I prefer not to answer
VNAME Incentive [IF INCEN=1]
Once all of your travel information is reviewed and confirmed for consistency, you
should receive your check for $<INAMT> in the mail in about 8-10 weeks. The name
that will appear on the check is:
<FNAME> <LNAME>
Is this correct?
1 Yes
2 No
LEAVE Conclusion
If you have any questions or comments you can reach us at 888-222-7734.
Thank you. Please press NEXT to exit the survey.

PTV NuStats 131 ARC Regional Travel Survey Final Report
Appendix E: Interviewer Training Manual
Interviewer Training Manual
ARC Household Travel Survey
Prepared by:
Daniel Montemayor
NuStats
Prepared for:
July 2011

PTV NuStats 132 ARC Regional Travel Survey Final Report
Table of Contents
Acronyms 133
Recruitment Training Outline 133
Regional Household Travel Survey- Project Information 134
Client Information- Background 135
ARC HHTS - The Travel Study Process 136
Example of Advance Letter (matched) 137
Frequently Asked Questions (FAQ) 139
One 24 hr day Travel Diary 144
CATI Program Review 145
Introduction Training 146
Refusal Conversion 147
Protocols for Handling Difficult Respondents 148
Supplemental Training/Common Interviewer Questions 149
Q and A 151
Regional Household Travel Survey Quiz 151
Retrieval Training Outline 152
Retrieval Protocols 153
Reminder Call Process 154
Proxy Protocols 154
Reconstruction, Reschedule 155
Introduction / Dispositions 155
CATI Review 156
Retrieval Demonstration 156
TripBuilder - Retrieval 156
Diary Example 158
Retrieval Practice/ Role Play 160
Valid Travel 160

PTV NuStats 133 ARC Regional Travel Survey Final Report
Acronyms
This list of acronyms will help clarify the meanings of abbreviated words:
CATI Computer-Assisted Telephone Interviewing
GPS Global Positioning System
HH Household
ARC Atlanta Regional Commission
Recruitment Training Outline
I. Project Information Sheet
a. Purpose and Qualifications
b. Study Area
c. Project Goals
d. Survey Website
II. Client Information
a. Informational website
b. Confidentiality
III. Travel Study Process
a. Sample Generation and Geocoding
b. Advance Letter
c. Recruitment call
d. Mail packet (Travel diary)
e. Reminder strategies
f. Retrieval call stage (Travel Diary)
g. Prompted Recall for GPS
IV. Review Letter Content
a. Explanation and Process
b. Steps to Participating
V. Frequently Asked Questions
VI. One 24 Hour Travel Diary
VII. CATI Program
a. Standard Dispositions
b. Program Review
c. Household Scenarios
d. Role Play, Mock Interviews
VIII. Introduction
a. Intro Review
b. Explanation of Study (purpose)
c. Overturning Refusals
d. How to handle difficult respondents
e. Supplemental Documentation
IX. Questions and Follow-up
X. Recruitment Training Quiz

PTV NuStats 134 ARC Regional Travel Survey Final Report
Regional Household Travel Survey- Project Information
Purpose: The ARC Regional Travel Survey is a household travel behavior study that captures
travel data from households in 20 counties in Georgia. The data collected from participating
households will be statistically summarized to describe typical daily activities and the resulting
travel patterns. For example, what people do, how they travel, where these trips come from and go
to, what methods of transport are used on these trips, at what time of day are the trips made, and so
on. This information is vital and will be used to assess the future transportation needs of the region.
Qualifications: Households will be selected for the survey by a random selection process that
considers all residential addresses in the study area. All participants in the study will receive an
invitation to participate over the telephone or by mail. Households are not required to take part,
however each household represents many other households, so input is extremely important to the
integrity of the study.
Study Area: 20-county area:
DeKalb, Fulton, Douglas, Cobb, Gwinnett, Rockdale, Clayton, Henry, Fayette, Coweta, Carroll,
Paulding, Bartow, Cherokee, Forsyth, Hall, Barrow, Walton, Newton, Spalding.
Project Dial Code: ED 3055 SM 2055
Training Program
Name: http://voxcoweb1/survey/intweb.dll/vcc
Live Program: http://voxcoweb1/survey/intweb.dll/vcc
Time Zones: Eastern
Primary Dialing
Hours: 5-9 pm Eastern
Avg Survey Length: 15 min recruitment, 32 min retrieval
Project Goal Main Survey 11,657 Completes
Language: English & Spanish

PTV NuStats 135 ARC Regional Travel Survey Final Report
Client Information- Background
ARC
The Atlanta Regional Commission (ARC) has contracted with the NuStats team to
conduct the Regional Travel Survey. The ARC is an association of governments,
transportation providers and environmental agencies that is the Metropolitan
Planning Organization for the greater Atlanta region. The role and objective of ARC is
to form the basis for a robust and rigorously developed set of activity/travel behavior
models, which will be used to conduct policy analysis and forecast future travel
behavior under a variety of scenarios.
GDOT
The Georgia Department of Transportation (GDOT) plans, constructs,
maintains and improves the state's road and bridges;
provides planning and financial support for other modes of
transportation such as mass transit and airports; provides
airport and air safety planning; and provides air travel to
state departments.
Survey Methods: Cati, Web, Mailback
Production
Coordinator: George Uribe
QC Coordinator: Daniel Montemayor
Toll Free Project
Hotline: 1-888-222-7734

PTV NuStats 136 ARC Regional Travel Survey Final Report
Client Contact:
Official Client Contact: Jeff Livingston, Email: [email protected], Phone: 1-800-447-
8287, ext 2256 Respondents may contact NuStats Field Supervisors at (1-888-222-7734) for any
questions, concerns, or issues with the study. If respondents wish to be directed to our
main client contact, supervisors on shift will provide client contact information.
Project / Public Website: www.ImproveGeorgiaTravel.com
The project website is a valuable and efficient resource for respondent questions and/or concerns
regarding travel survey participation. Some key information typically available would be:
a. What participation involves
b. Benefits of participation
c. FAQ‘s
d. Contact information (NuStats and ARC)
e. Survey Privacy
f. Results/Use of Data
Confidentiality:
Confidentiality is of the utmost importance for all respondents and clients. NuStats strictly adheres to
industry best practices in protecting the privacy of all respondents and clients through various protocols
and procedures beginning with confidentiality agreements signed by all interviewers. In terms of
alleviating concerns voiced by respondents, interviewers are instructed to respond, ―We respect your
privacy and promise to protect it. The information your household provides will be kept strictly
confidential. Your name and personal information will be separated from your responses for analysis.‖
ARC HHTS - The Travel Study Process
The Travel Survey consists of 7 main stages:
Sample Generation and Geocoding-Sample will be generated and analyzed to determine the
amount of sample needed to meet project goals. Ten percent of all sample records will be flagged
as GPS-selected. Prior to data collection, all sampled addresses will be geocoded and mapped.
Advance Letter – Beginning November 2010, will be mailed a letter explaining the travel
survey before we call them. The purpose of this letter is to give them some information about the
survey and to inform them we‘ll be calling their area soon. Two different advance letters will be
sent to sample records that have been (1) matched to a landline telephone number and (2) not
matched to a landline telephone number. Letters in this secondary category will make reference
to a ―thank you‖ incentive. For GPS-selected addresses, the letter text will describe the unique
terms of the GPS survey along with the monetary incentive. Advance mailings shall be done in
batches approximately 5 to 8 days prior to start of recruitment so that the materials arrive
within a day or so of the recruitment call.
Recruitment Call – The recruitment survey will be available in CATI, web, and mail. CATI
surveys will be administered by interviewers with respondents via phone, while self-
administered options via web and mailback will also be available. Respondents for whom we
have a matched telephone number will be called and invited to participate in the household
travel survey. Interviewers will provide details regarding the study, and collect basic household
demographic information for the household. In addition, the CATI program is designed to guide

PTV NuStats 137 ARC Regional Travel Survey Final Report
the interviewer and respondent to identify a ―reference‖ person in each household. The person is
given the responsibility of ensuring that all members of the household complete travel logs
and/or wear the GPS devices on the assigned travel day (or days if GPS). At the conclusion of the
recruitment interview, the interviewer asks the respondent to record their household‘s travel for
24-hour period on a specific day of the week or to wear GPS devices for a specific 72-hour period.
Note: GPS households with a Friday travel assignment will keep and be asked to wear the
devices for 4 consecutive days, Friday through Monday.
Each member of the household will then be mailed a personalized travel diary or will have GPS
devices delivered to their home. All household members will then use the diaries or wear the
devices to record any travel that occurs for the assigned day(s). GPS instructions will be
delivered to the household with the devices. GPS will be deployed for a 3-day period. The first
day to carry the unit will be the assigned travel day. For households with a Friday travel day,
the units will be deployed for 4-days (Friday-Monday). Recruitment shall begin about 8 to 10
days prior to the assigned travel day.
Mailing Travel Diaries – Approximately 7-10 days prior to each designated travel day, travel
diaries will be mailed to all recruited households. It‘s very important that we verify the
respondent‘s name and address to ensure the packet arrives on time. All GPS households will
receive a packet containing a GPS unit for every household member 16+ years and a diary for
those under 16.
Reminder Call - On the night before the respondent‘s travel day, interviewers from Nustats
will contact the respondent to remind them about their travel day and also to confirm that their
household travel diaries / GPS units were received. Interviewers will clarify and assist
respondent‘s questions during the call. Interviewers will be able to direct the respondent to the
project website if additional information is needed. Messages will be left on answering machines
if contact cannot be made with a household member.
Retrieval Call- Retrieval begins the day after the assigned travel day. Nustats interviewers will
contact the respondent and collect the household‘s travel info for that day. Travel data is
collected using a combination of CATI software and a map-based software program that will
enable real time geocoding of locations visited on the travel day. All household members age 16
and older will complete their own diaries; proxy reporting will be accepted for persons under the
age of 16. The reference person shall be able to give travel data for other adult household
members only when the travel diaries are present. The CATI program will be able to prevent
inaccurate reporting.
Example of Advance Letter (matched)
The pre-notification letter describes the survey objectives, identifies what they survey entails, provides a
project website address, provides a 1-800 toll free number, and specifies a password-protective link to an
Internet version of the recruitment questionnaire. See example below:

PTV NuStats 138 ARC Regional Travel Survey Final Report

PTV NuStats 139 ARC Regional Travel Survey Final Report
Frequently Asked Questions (FAQ)
Who is sponsoring this survey?
The Georgia Department of Transportation (GDOT) plans, constructs, maintains and improves
the state's road and bridges; provides planning and financial support for other modes of
transportation such as mass transit and airports; provides airport and air safety planning; and
provides air travel to state departments.
The Atlanta Regional Commission (ARC) is dedicated to unifying the region's collective resources
to prepare the metropolitan area for a prosperous future. It does so through professional
planning initiatives, the provision of objective information and the involvement of the
community in collaborative partnerships.
NuStats is a nationally recognized survey expert in travel behavior studies. Since 1984, NuStats
has conducted more than 400 surveys across the United States and abroad. The firm was
brought on to administer the Regional Travel Survey.
What will be done with the data collected from the survey?
The data collected from participating households will be summarized to describe typical daily
activities and the resulting travel patterns. For example, what people do, how they travel, where
these trips come from and go to, what modes of transportation are used on these trips, at what
time of day are the trips made and so on. This information is vital in assessing our future
transportation needs.
Will the information from the survey be available to the public?
Your specific activities and travel patterns will remain strictly confidential, as will any contact
information (your name, phone number, email address, etc.). The travel information collected
from the thousands of participating households in the region will be summarized to describe
how, why, where and when people travel. Some sample charts include:

PTV NuStats 140 ARC Regional Travel Survey Final Report
Who will be surveyed?
Households will be selected for the survey by a random process that considers all residential
addresses in the study area, which is the 20-county region. Refer to the map on the home page to
see all of the counties included in the survey area.
Is the survey mandatory?
Residents of the 20-county region included in the survey area are invited and encouraged to
voluntarily participate in the study. Households are not required to take part, however, each
household represents many other households so your input is extremely important to the study.
What if I don't feel comfortable answering some of the questions?
Answer only questions you feel comfortable answering. Please understand that we take many
steps to protect your identity. The data we collect will only be used for purposes of the research.
We will never sell, rent or lend any information to a third party. Please read our Privacy
Statement here.
What if I don't drive a car?
Many people in the region do not routinely drive a vehicle. Yet even those without a car still
travel and make trips in and around the area for things like work, grocery shopping, doctor
appointments, and recreational activities. This travel study is for all types of trips made by a
variety of people using many different modes such as walking, bicycling, bus, MARTA train,
motorcycle, etc. Your data is important even if you do not drive a car.
What if I want to speak to a real person about this survey?
We invite you to call the Regional Travel Survey Hotline at 1-888-222-7734. This hotline will be
staffed with live interviewers during the survey. You may also contact Jeff Livingston, at
NuStats, by calling 1-800-447-8287, ext. 2256, between the hours of 10 a.m. and 6 p.m. (EST)
weekdays. He will return your call as soon as possible if he is not available at the time of your
call. To speak with someone in person immediately, the hotline is your best option. Please also
review all of the questions on this page as we may have already answered your question.
How are households selected for the survey?
Households are selected for the survey using a random sample design approach. We have
purchased a listing of household addresses in the 20-county study area, then attempted to match
addresses to a phone number. Households will receive a letter describing the study, so even
households with no phone number are eligible to take part in this important research effort.

PTV NuStats 141 ARC Regional Travel Survey Final Report
What is expected of me and my household?
Following a brief telephone call or web survey to gather some basic household information,
participants will be invited to take part in the diary portion of the study. A few days later, you
will receive personalized travel diaries by mail for all household members. Each person keeps
track of his or her travel for a 24-hour period. Parents/guardians should complete diaries for
children.
What is the travel period?
All households in the survey record travel and activities for a 24-hour period on an assigned
travel day. (Though remember about 8 of those hours are generally spent sleeping!)
What is meant by "travel" and "activity"?
We define travel as the places people go during a 24-hour period, where each change of address—
including transit stops—is considered a new place. Activities are the types of things people do at
each of those places, such as eat, shop, work, exercise, etc.
Why do you want to know about my activities?
From a travel behavior viewpoint, it is helpful for transportation planners to learn as much as
they can about how and where people travel, including what modes of travel they chose—car,
transit, walking, biking, etc.—for which purposes, and the travel time between each place.
Why is the travel and activity diary so important?
Recording your travel helps with several issues: You can use the diary as a way to write down
key information about each trip so you can more easily recall it later during the retrieval
interview. Or if you prefer to enter your travel data on the web, the diary is a great reference for
remembering all your trips in the 24-hour period of your assigned travel day. The diary also asks
key questions about how you traveled, times, more.
Why do I need to record a stop for coffee or to get gas on the way to work in my diary?
Each place you go during your 24-hour assigned travel day is considered a new place. Those
quick stops for coffee or going to a drive-thru restaurant are important for transportation
modelers and planners. It helps them better understand the choices people make.
How much detail is needed on each place I visit?
The travel diary asks about what you were doing at each place (activity), as well as the length of
time (duration). If you see the diary, it asks what you were doing at 3 a.m., then asks
information about each place you went to after that point in time. Think of it this way: Where
did you go, what time did you arrive, what travel mode did you use to get there, what did you do
there, what time did you leave? We also ask about things like parking and other information.

PTV NuStats 142 ARC Regional Travel Survey Final Report
Information for GPS Participants
What do you do with the GPS data captured?
The data will be used to update traffic models which can assist transportation planners in your
region with congestion management and will help them make better informed decisions about
transportation improvements.
Is information about where I live and where I go linked to my name?
No, there is no connection between your name and your data. Your household is assigned an ID
number that is supplied with the data, but this ID is not attached to your name.
Can you tell where I am all the time?
No, the GPS device you have is a passive data logger, not a tracking device. It cannot transfer
data wirelessly, so no one can know where you are in real time.
How heavy / bulky is the GPS device?
The GPS weighs less than 6 ounces and is smaller than a Blackberry.
How will I use the device?
Some households are asked to use wearable devices that have a belt clip, which you can wear on
your belt, pants, bag or purse. Participants from prior studies have reported that the device is
convenient to carry because of its small size and weight. Other households will be asked to place
GPS devices in their vehicles and use them for one week.
What do I have to do to get the GPS devices so that I can participate?
If your household is selected for this part of the survey, you will take part in a brief interview
where we will verify your physical mailing address and gather some basic information about
your household. Next, we will send you the devices and materials by FedEx to arrive prior to
your assigned travel date. After you are finished with your assignment, you will place the devices
back in the box, put the box in the return envelope which you can then place in a FedEx drop
box, take to any FedEx/Kinkos, or call FedEx for a free pick up at your home. There is no cost to
you to carry or to return the GPS device.

PTV NuStats 143 ARC Regional Travel Survey Final Report
Incentives Breakdown for
GPS & NON-GPS Households
GTYPE STYPE Advance Letter
Type Incentive
FULL STUDY TEXT in Advance Letter as of 7/6/11
GPS MATCHED MEG $25 per device (vehicle or wearable)
IMPORTANT! We are offering households that are selected to use GPS devices $25 per device once we confirm travel information for all household members.
GPS UNMATCHED UMEG $25 per device (vehicle or wearable)
IMPORTANT! We are offering households that are selected to use GPS devices $25 per device once we confirm travel information for all household members.
NON-GPS MATCHED ME-NG $25 per HH for WEB REC and $25 per HH for WEB RET, cumulative
Earn up to $50! If you complete Step 1 ONLINE before <RESONDBY> AND your entire household reports complete travel information in Step 3, you earn $25. To earn an additional $25, simply complete Step 3 ONLINE!
NON-GPS UNMATCHED UME-NG
$25 per household for REC (CATI or WEB) and $25 per household for WEB RET, cumulative
Earn up to $50! If you complete Step 1 online or by phone before <RESPONDBY> AND your entire household reports complete travel information in Step 3, you earn $25. To earn an additional $25, simply complete Step 3 ONLINE!

PTV NuStats 144 ARC Regional Travel Survey Final Report
One 24 hr day Travel Diary
(Diary example will be provided to the team)
Personalized travel diary logs are mailed to each household member. Diaries are to be received prior to
the assigned travel date. A reminder call is conducted prior to the assigned travel date to ensure the
diary was received, remind the respondent of the assigned travel date, and to answer any questions the
respondent may have.
Respondents are requested to use the travel diary to record their trips.
Interviewers will confirm the spelling of first and last name in the recruitment interview
to ensure materials are addressed to the referenced person within the household.
The diary packet will be addressed to the head of the household, but personalized diaries
are provided for each household member for their assigned travel date. First and last
names are preferred, but initials can be used if preferred so that we can ensure the
diaries are labeled for each household member.
Interviewers will confirm the mailing address to ensure the travel diary arrives at the
correct location and is received before the assigned travel day.
Diary instructions will explain in depth how the diaries are to be used to record
information about all the places you visited on respondents‘ assigned travel day. They
will specify the need to record all places visited, the type of place, time of arrivals, and
departures, mode of travel to each place, other travel information, and activities at each
place.
The assignment date for travel, also known as the ―ASSN‖ or cohort will be documented
on the diary as a reminder of the assigned travel date.
Diary examples are also provided in the logs.
Diaries can be printed through the project website.

PTV NuStats 145 ARC Regional Travel Survey Final Report
CATI Program Review
The CATI program review involves hands-on training with the program and practice to ensure that
interviews are conducted within the strict design structure intended. Interviewers will run through the
program to get practice and familiarize themselves with the introduction, each question, and how the
interview design flows. Role- playing will involve different household scenarios and different
demographics to simulate a ―live‖ dialing experience to the extent possible.
Log on procedures – Each interviewer will be assigned an interviewer identity number to
access the program. Each call record can be tracked to the
interviewer for review or past call attempts.
Introduction script – Each interviewer will spend time reviewing the intro and working
on a professional delivery to gain cooperation.
Explanation of current dispositions or call outcomes:
CP PARTIAL COMPLETE
RP PARTIAL COMPLETE REFUSAL
PC SPANISH PARTIAL COMPLETE
R1 1ST
REFUSAL
RF FINAL REFUSAL
QO OVER QUOTA
WC WILL COMPLETE ONLINE
KH CALLBACK, GENERAL
KB CALLBACK, SPECIFIC
KL CALLBACK ON LANDLINE
KN NEW NUMBER
NA NO ANSWER
AM ANSWERING MACHINE
BZ BUSY
PM CALLER ID
SH SPANISH CALLBACK, GENERAL
SB SPANISH CALLBACK, SPECIFIC
SN SPANISH NO ANSWER
SA SPANISH ANSWERING MACHINE
SZ SPANISH BUSY
IG BUSINESS/GOVERNMENT
IL LANGUAGE BARRIER, DEAF/TTY
ID DISCONNECT
IM FAX/MODEM
RH HANGUP
RC REFUSES TO CONTINUE ON CELL-PHONE
QP REFUSED NUMBER OF HH PERSONS
QV REFUSED NUMBER OF HH VEHICLES
QA INVALID COUNTY
QW REFUSED WORK ADDRESS
QS REFUSED SCHOOL ADDRESS
CM COMPLETE
CW WEB COMPLETE
Explanation of each question and choices follows- Reading verbatim is very important

PTV NuStats 146 ARC Regional Travel Survey Final Report
and it is needed to ensure the respondent hears and understands each question in an unbiased
manner.
Choice Clarification- Large, fully capitalized words indicates to interviewers that such text does
not get read but is there to guide them through key sections or to provide supportive text that
may be needed depending on respondent questions or responses. Small cap words indicate the
interviewers read the choices to the respondent.
Introduction Training
Protocols for reading the introduction:
Interviewers are expected to be professional at all times
Interviewers should not sound monotone
Interviewers should read in a conversational way
Interviewers should project a positive attitude
Interviewers should read at a steady pace but not too quickly; always be attentive to
respondent reaction and adjust talking speed as appropriate
Each interviewer is evaluated on how they read each introduction based on the above criteria. A
professional delivery approach for the main introduction and any explanation screen is required. The
following introduction screens are examples of where it is vital to follow the protocols for reading the
introduction.
INTRO
Hi, this is ________. I'm calling on behalf of the Georgia Department of Transportation and the Atlanta
Regional Commission about improving transportation in your area.
May I please speak with an adult age 18 or older in the household?
EXPLA
We are doing a very important study about people's travel patterns and transportation needs. Planning
agencies in your region will use data collected to make decisions about how to improve the region's
transportation system. As a participating study household, everyone who lives in your home will record
their travel for 24-hours in a special diary. All data is strictly confidential and will be used for research
purposes.

PTV NuStats 147 ARC Regional Travel Survey Final Report
Refusal Conversion
Due to the nature of this recruitment effort and the tendency for potential respondents to often provide
initial, typical reasons not to participate, interviewers are expected to make consistent but professional
efforts to overcome initial soft refusals. Interviewers will focus on quickly educating respondents on the
purpose and benefits of participation in the study as well as overcoming any concerns or fears that
potential respondents may have. Remaining professional at all times as well as friendly and courteous
are all stressed as part of this crucial training. Interviewers are always taught to be tactful, pleasant,
sincere, and well prepared. Interviewers are expected to attempt to find out the reason for the refusal
and work with it from that aspect. Some of the most common refusals are listed below with some
appropriate responses:
NOT INTERESTED:
Your participation will help make sure that future transportation projects reflect what your
community needs and that future tax dollars are spent wisely.
I DON’T HAVE TIME:
I am sorry for the inconvenience, but this study is essential for improving transportation in your community. It doesn’t take much of your time.
If no:
When would be a better time and day to call back?
I DON’T TRAVEL:
Although you may not travel extensively (far or often,) your travel habits will be representative of others in your region that do not travel as much as others.
WHY ARE YOU CALLING FROM TEXAS?
Our company is PTV NuStats, we specialize in travel studies and were contracted by our client,
based on our expertise in this field.
VEHICLE INFORMATION REFUSAL
We need this information to see the patterns between vehicle type and travel.
INCOME REFUSAL
We need to make sure we‘re including all types of households in the area.
NAME REFUSAL
We print the name on the diaries that way we know whose travel it is.
CHILDREN INFORMATION REFUSAL
It is known that children‘s activities can affect other household members‘ travel.

PTV NuStats 148 ARC Regional Travel Survey Final Report
Protocols for Handling Difficult Respondents
How do we handle a call where the Respondent is insecure and wants more
information about the study?
1) Offer the project website for additional information.
www.ImproveGeorgiaTravel.com
2) Offer NuStats Supervisor assistance/ Project hotline phone number.
1-888-222-7734
3) Offer NuStats project manager contact.
Julie Paasche, 1-800-447-8287 ext 2241 (M-F 9 am to 6 pm Eastern)
How should you handle a respondent that is difficult to speak with, even after you
provide additional information as noted above, or who asks to speak with someone
else?
Interviewers can ask for a Supervisor to take over the call and assist the respondent with
any further questions. If respondents do not want to speak with field supervisors then
the next step is to refer them to NuStats‘ project manager, Julie Paasche. The final
reference would be to the client contact. In addition, the website will be referenced so
that the respondent can get some additional information about the study.
How should you handle a respondent that only wishes to speak with the client?
Suggested Script:
“You may contact Jeff Livingston through email: [email protected]. And if you need additional information about the study to make a decision in terms of participating, we have a website that you can go to www.ImproveGeorgiaTravel.com.
Interviewer Notes:
Detailed interviewer notes will be documented on the call record in situations where the respondent is very difficult and wants to issue out a complaint about the study or receiving a call.

PTV NuStats 149 ARC Regional Travel Survey Final Report
Supplemental Training/Common Interviewer Questions
Does everyone in the household have to participate?
Yes, everyone in that household MUST participate in order for this to be a valid complete. If a
respondent tells you that their spouse will not participate, we must rebuttal efficiently and explain the
importance of the survey. If they still inform you that they won‘t do the travel logs then we cannot
continue with the survey. We need to collect information for every household member.
If I have a respondent on the phone and notice there is a pattern of refusals,
should I continue with the survey?
No, if we notice a pattern in refusals, we want to end the survey immediately. Past experience shows
that such respondents have a higher likelihood of non-response at the retrieval stage.
I have enough info to complete the recruitment survey but the person told me they weren’t
interested in the diary portion of the survey. Should I complete it? While completing the survey
is very important, data quality should also be taken into account. If you force a survey to go through and
we never contact the respondent because they told us they didn‘t want to record their travel, we have
wasted valuable time (ours and theirs). If you feel you can turn the respondent around and they agree to
the diary or GPS portion of the study, you can complete the recruitment interview. Otherwise, do not
complete it.
Respondents I call seem wary and suspicious of the call – how do I break the ice? The key to
gaining cooperation is to give respondents a reason to stay on the phone. The first 10 seconds after
someone answers the phone are the most critical. Use a friendly tone of voice and be polite. Be sure not
to let every sentence you speak go up at the end like a question, e.g., Hi, this is Joe? I‘m calling on behalf
of the Atlanta Regional Commission? This makes people sound immature. Instead, speak with a
confident voice and don‘t read every sentence like a question.
Also, be prepared. Your ability to answer questions about the study with ease will help you educate your
respondent. In the intro, we say our first name which helps maintain a personal yet comfortable level.
You need to be able to explain who the client is, why you are calling, and how the data will be used. You
must also assure confidentiality and provide contact/project website information when requested. The
worst thing you can do is to sound like you are reading a script. Good interviewers engage and guide
respondents in a scripted conversation rather than just reading a script.
Some respondents are asking me how to verify what I’m saying is true, how do I do that? The
best way to do this is to offer them access to additional information by calling a travel study hotline,
giving them access to the project website or by referring them to the client or a project manager.
Do I need to collect children’s information? Absolutely! We are interested in the travel patterns of
all household members. Travel patterns of a married couple with no children are very different from a
couple with children. Also, children have their own travel patterns that affect their parent‘s travel.

PTV NuStats 150 ARC Regional Travel Survey Final Report
Do I need to collect school address information if children are out for the summer? Yes,
although many children are not in school during the summer or between breaks, we are looking for
habitual travel locations. While children may not go to school for 3 months out of the year, they are going
to these locations the other 9 months and we need to have their information in order to have the most
accurate picture of habitual travel for the areas we are currently collecting travel information.
If a respondent does not want to provide work/school address information,
what do I do next? You must collect cross-street information, if that information is not provided then you must verify with
the respondent that this information will be collected in the travel diary and at the retrieval call. This
information must then be recorded in notes and should only be accepted from strong recruits.
What do we mean by “Travel”? By travel we mean daily commuting by car as a driver or as a
passenger or by other means such as public transportation. We do not mean going on vacation trips, on a
cruise or out of town at all.
If a respondent says that they do not travel what do I say?
Let the respondent know that it does not mean taking extensive trips, their travel habits will be
representative of others in their region, and daily travel is what we are looking for.
Do I need to be accurate when collecting work and school locations? Yes, as explained before
this is a location based travel behavior survey. We are interested in locations. We want to locate these
places in a map and the starting point is a good name. So you need to be exact when collecting the name
of the places they work and go to school.
If a respondent says that their work/school location varies, what do I do next?
Then we must collect the main office/location in which the respondent works at most of the time.
Do I need to collect full address information?
Yes, you must collect FULL address information at all times, if that is not possible then you must probe
to collect cross-street information. Make sure to leave the address box blank when collecting cross streets
and put the cross-street information in its appropriate screen. No PO BOXES are allowed for home,
work, and school addresses.
Why do we ask about Telephones? Most recent household travel studies have employed random
telephone samples, which means that non-telephone and cellular-only households are excluded from the
sample. Since our research aims to represent all types of households, it is very important to determine if
the phone number associated with each piece of sample is a landline or a cell phone. In addition to this,
we want to know what areas may have more land-based coverage than cellular coverage so that we know
the best way of securing participation in that area (passive vs. active recruitment). There are also
differences in travel patterns that have been documented that are associated to households having or not
having a landline. It has been found that households without cell phones will not travel as much as those
with cell phones.

PTV NuStats 151 ARC Regional Travel Survey Final Report
Q and A
Regional Household Travel Survey Quiz
1. Who is the agency sponsoring the study?
2. What is the purpose of the study?
3. Who is the client contact?
4. Do we have a website that a respondent can look at?
Yes No
5. Where is the client contact and website located in your materials?
6. Why do we ask for children‘s information in the household?
7. Why do we ask for the income of the household?
8. Why do you need to know respondents‘ names?
9. What if a respondent does not wish to provide a name?
10. What are we asking the respondents to do for us?
11. How do we handle a call where the Respondent is undecided and wants more information about
the study?
What would we offer first? _____________________________
What would we offer second? ___________________________
What would we offer third? _____________________________
12. How should you handle a respondent that is difficult to speak with, even after you -
provide additional information as noted above, or who asks to speak with someone else?
13. What incentive is being offered and to whom?
14. Does everyone in the household get an incentive?

PTV NuStats 152 ARC Regional Travel Survey Final Report
Retrieval Training Outline
I. Retrieval Protocols
II. Reminder Call Process
III. Proxy Protocols
IV. Difference between RD- reconstructing a travel day, RT -rescheduling
V. Introduction and Dispositions
VI. CATI Review
a. Review functionality
b. Review interview flow
VII. Retrieval Demonstration
a. Lead or Rep II complete mock scenario for group
VIII. Retrieval Practice and Role Play
a. Practice/Role Play
b. Travel Scenarios
IX Valid Travel
X. QA

PTV NuStats 153 ARC Regional Travel Survey Final Report
Retrieval Protocols
Retrieval of travel information will be interviewer-mediated (CATI) or respondent self- administered
(internet and mail). CATI retrieval shall begin the day after the travel and shall continue no more than
7-10 days past the travel day period. Possible exceptions include large households or those with a lagging
household member. GPS-prompted recall will also be conducted via CATI or internet.
The result of each telephone contact attempt will be one of seven outcomes:
Complete: The household is completed when 100% of all adults age 16 and older have provided
their travel information (non-proxy), and information has been collected on all non-adults (via
proxy or not).
Proxy: Travel data has been collected from some but not all adults and / or from all non-adults
(via proxy or not). After three contacts without getting adult‘s information, a proxy report will be
accepted for the adults in the household. “May we call back to speak directly to Bob to get the
answers to questions you weren’t able to give us”.
Partial: There is household, person, vehicle, and trip/activity information for all (n) household
members who are employed, in school or day care, and there is complete activity for (n-1)
members. The purpose of this definition is to provide a mechanism for retaining data from larger
households in which a single person may not report travel/activity data. Partial trip records will
be accepted only for those households with four or more members.
Some household members will not travel on their assigned travel day. This is acceptable because
it is reflective of what happens in reality. At the same time, some respondents will report ―no
travel‖ as a way of reducing their personal reporting burden. For this reason, standards are set
for percent of households (no more than 10 percent) and percent of people (no more than 18
percent) that may report ―no travel.‖ These percentages will be monitored during data collection,
and the reason for ―no travel‖ will be captured to assess the plausibility of no travel given the
person‘s age, employment, school, disability status, and other relevant variables.
Refusal: Initial refusals will be attempted one time during a five-day period for one refusal
conversion attempt. On the second refusal, sample will be rested and recycled after a period of
three months. When sample is recycled and subsequently re-contacted, if amenable, recruitment
data will be verified (to see if anything has changed) and a new travel day will be assigned.
Appointment Callback: Consultant shall ensure that all callback appointments are met. If the
initial retrieval effort includes more than five appointment callbacks that do not result in an
interview, partial interview, or a final outcome, the sample will be rested and recycled after a
period of three months following the protocol noted above after the next missed appointment
attempt.
Non-contact: There will be no more than eight consecutive non-contact outcomes and no more
than 12 call attempts to each sampled record. All non-contact samples will be called at least one
alternate time during the present shift; and then on different days of the week and different
times of the day. Voicemail messages will be left on answering machines informing the
respondent that a telephone attempt has been made and directing the respondent to the website
to schedule an interview appointment (this will be unique from recruitment) or to a toll free
number for the interview. After the eight consecutive non-contact outcomes, sample will be
rested and recycled after a period of three months following the protocol noted above.
Hang-ups: Hang-ups will not be treated as an initial refusal. Hang-ups will be treated like a non-
contact.

PTV NuStats 154 ARC Regional Travel Survey Final Report
Reminder Call Process
Reminder /support calls will be placed to all households within 2 days prior to their assigned travel date.
Scripted messages will be left on answering machines and cell phone voicemails when household
members cannot be reached. In addition, in an effort to maximize the benefit of the important reminder
stage, during the pre-test phase some targeted testing will be done by sending script e-mail and/or text
messages.
Example of the reminder call:
I was just calling to remind you that your household will be participating in the Regional Travel Survey
and also to see if you had any questions about the study. Please keep in mind that each member of your
household must record all their trips on <ASSN>. This will help improve transportation in your area.
Explanation of current dispositions or call outcomes:
RC- reached respondent
RN- No Answer
RZ- Busy
RA- Answer Machine
LM- Left Message (used on the second non-contact attempt for voice mail)
RT- Reschedule assignment day without mailing diaries
RM- Reschedule assignment day with mailing diaries
(IMPORTANT TO ALLOW 7-10 days for re-mailing)
During the reminder call if the respondent did not receive the diary packet, interviewers will provide the
respondent the project website to download logs. The home address and mailing address is also verified
before ending the call.
Proxy Protocols
Interviewers are required to speak to each person 16 years of age or older for a household to be accepted
as a complete. There are only two instances when a household can be completed with Proxy data: 1)
information for the missing adult exists in a completed travel log and another person is willing to read
off the recorded information, 2) the travel data can be obtained through the GPS unit. In both situations
we are required to make a minimum of three call attempts within a seven-day period before a household
can be finalized as a complete with proxy data.
Therefore, by definition, a Proxy Complete (CY) contains travel data collected directly from most adults
in the household but contains some proxy reporting for some of the adults and / or from all non-adults
(via proxy for persons under 16). If the record remains as a partial after all attempts are made, the
record will be finalized as a Partial Proxy or KX. If informant refuses to provide proxy information the
record will be finalized as Proxy Refusal or RX.
The data collection team is trained to attempt to obtain travel information directly from the household
member but when an adult household member is unavailable the representative will attempt to set up a
day and time to speak directly with the missing person. This pending complete will be coded as a KX
(Partial Proxy). Representatives will make up to three call attempts within a seven-day window to
attempt to complete the missing information with the person on the phone.
The retrieval program is designed to not allow the rep to complete the household when they select that
they are not speaking directly with the household member; in this situation they can only code the
record as a KX.

PTV NuStats 155 ARC Regional Travel Survey Final Report
Representatives will continue to attempt to contact this person for a minimum of three call attempts and
a length of seven days. If, after at least three call attempts and seven days after the KX disposition has
been set, representatives are still unable to reach the missing household member, the data may be
collected via proxy and the record coded as a proxy complete (CY).
When the household has received enough call attempts to be considered a valid Proxy Complete the
program will ―release‖ the record for completion on the next call attempt. At that time the representative
knows to accept travel information.
Reconstruction, Reschedule
Reconstruction: can be conducted if the respondent did not fill out the travel diary. Effort to reach every
adult in the household is required.
Reschedule: if the respondent forgot to fill out the diary for the assigned travel day and cannot
reconstruct but is willing to record travel for a future day.
If it‘s been more than one week then reconstructs cannot be done, reschedules may be offered
Reconstructs will not be done for large households (3+), reschedules may be offered
Depending on zero trip rates per person and at a household level, reconstructs/reschedules may
be offered. Zero trip rates will be tracked throughout the study to determine
rescheduling/reconstruction protocols.
Introduction / Dispositions
The introduction for the retrieval CATI program asks for the reference person or the person we spoke
with during the recruitment interview. Incentive text reminder is mentioned if the respondent was
offered an incentive. Below is an example of the introduction:
Hi, this is __________ from the Regional Travel Survey conducted on behalf of the Georgia
Department of Transportation and ARC. We recently spoke with <FNAME> <LNAME> and are
calling back to conduct the interview he/she agreed to complete a few days ago. May I please
speak with <FNAME>?
Explanation of current dispositions or call outcomes
CP PARTIAL COMPLETE
RP PARTIAL COMPLETE REFUSAL
PC SPANISH PARTIAL COMPLETE
R1 1ST
REFUSAL
RF FINAL REFUSAL
QO OVER QUOTA
WC WILL COMPLETE ONLINE
KH CALLBACK, GENERAL
KB CALLBACK, SPECIFIC
KL CALLBACK ON LANDLINE
KN NEW NUMBER
NA NO ANSWER
AM ANSWERING MACHINE
BZ BUSY
PM CALLER ID
SH SPANISH CALLBACK, GENERAL
SB SPANISH CALLBACK, SPECIFIC

PTV NuStats 156 ARC Regional Travel Survey Final Report
SN SPANISH NO ANSWER
SA SPANISH ANSWERING MACHINE
SZ SPANISH BUSY
IG BUSINESS/GOVERNMENT
IL LANGUAGE BARRIER, DEAF/TTY
ID DISCONNECT
IM FAX/MODEM
RH HANGUP
RC REFUSES TO CONTINUE ON CELL-PHONE
QP REFUSED NUMBER OF HH PERSONS
QV REFUSED NUMBER OF HH VEHICLES
QA INVALID COUNTY
QW REFUSED WORK ADDRESS
QS REFUSED SCHOOL ADDRESS
CM COMPLETE
CW WEB COMPLETE
CATI Review
Interviewers undergo hands on training to understand the functionality of the retrieval program. Each
question and choices are thoroughly reviewed with an understanding of how to edit data if needed. The
retrieval program will include the following:
Household variables
Person variables
Vehicle variables
Trip / Activity variables
Interviewers will verify person information, vehicle information, and habitual locations before collecting
travel data. Interviewers will have a complete understanding of how the interview flows with some
additional role-playing and mock interviews.
Retrieval Demonstration
NuStats supervisors demonstrate for interviewers how to perform a retrieval call using the CATI
program. Interviewers are expected to conduct the interview with a steady pace to minimize respondent
burden.
TripBuilder - Retrieval
TripBuilder is our web-based retrieval software designed to map all locations visited and capture details
about each location. The components and basic structure includes:
Trip Summary: (all places)
Location name is entered
Mode- how they traveled there
Arrival time
Departure time
Duration in minutes- how long the trip took
When we enter into Tripbuilder we must understand the basic functions of each button:
Insert Before- allows to insert a trip before a place in the case the respondent forgot to
report

PTV NuStats 157 ARC Regional Travel Survey Final Report
Insert After- allows to insert a trip after a place in the case the respondent forgot to report
Add New Place- allows to start the next location the respondent visited
Remove Place- allows you to delete a place that is wrong
Search- Allows you to see results of the address or cross streets of a place visited
Edit location- Allows you to renter the place: name, address, or cross streets
Previous Place- allows you to view the previous place details
Next Place- allows you to view the next place that was entered
Submit- TBD
Add New Location- TBD
Undo- allows you to erase the last change made
Redo- allows you to redo the last change made
Done- allows you to submit all recorded places
Map Functions:
Zoom All- allows you to view all recorded places
Zoom to Place- allows you to view a recorded place
Set Location- allows you to select a place on the map
Pan- allows you to maneuver the map left, right, up or down
+, - allows you to zoom in or zoom out
Help Tool- Click Zoom All to view all of the places you've visited. Click Zoom to Place
to zoom into the map to see the selected place. Click on Set Location then
click on the map to set the current place's coordinates on the map. You can
also drag and drop the currently selected place on the map to adjust its
location.
Fields:
Is it a common location- records and saves places that are common for the respondent
includes work, volunteer, and school locations.
Previously visited locations- records and save places previously visited in the case it is
needed for a future place or for another respondent.
Location Name- allows entry for the name of the location
Address- allows entry of an address
Intersection- allows entry of cross streets

PTV NuStats 158 ARC Regional Travel Survey Final Report
Search- provides results for addresses or cross streets entered
Diary Example
Respondents have the option of mailing in their travel information, i.e., their diaries. In addition to
informing the respondent how to provide their travel information and diary instructions, the diaries
collect the following information for each place:

PTV NuStats 159 ARC Regional Travel Survey Final Report

PTV NuStats 160 ARC Regional Travel Survey Final Report
Retrieval Practice/ Role Play
Mock interviews are also conducted to ensure interviewers have the practice time and experience with
the CATI program. The following travel scenarios are used to capture typical travel patterns.
Person stayed home on travel day, person was out of area
Loop trip
1 person traveled, 2 people traveled
Person traveled by walking
Person traveled by auto
Person traveled by transit (highly focused and emphasized)
In addition, interviewers will run through the different modes of travel to get a clear understanding
of questions tied into mode of travel. To assist with transit trips, interviewers will be provided with
detailed, up to date information on the regions‘ transit providers/systems which consist of subways,
rail lines, buses, ferries, bridges, tunnel crossings and major connections.
Valid Travel
Whether diary or GPS, all out-of-home activities for all household members will be collected during
retrieval. The definition of an out-of-home activity is a ―change of address or building.‖ So travel from
one address to another is captured, such as home to work. However, travel from the parking garage of
one‘s employment (same address) is not captured. Movement from floor 12 to floor 1 of the same office
building is not captured. If at a shopping mall, movement among stores is not captured, whereas travel
to and from the shopping mall is captured. Travel from an alighting bus stop to one‘s employment
(different address) is captured. Trip making will include all motorized and non-motorized modes,
including walking and biking. Loop trips-that is trips that start and end at the same location such as
walking for leisure around the neighborhood with no real destination point- will be captured by GPS but
not delivered as a trip. Another criterion for the capture of a walk trip is that the walk trip must be
longer than 5 minutes. A walk to visit a next-door neighbor might also be captured if it occurs outdoors
especially if they appear in the GPS data.

PTV NuStats 161 ARC Regional Travel Survey Final Report
Appendix F: Final Data Matrix
Household Data
Variable Label Values SAMPN Household Identifier RECMODE Recruit Mode 1 CATI 2 WEB RETMODE Retrieval Mode 1 CATI 2 WEB 3 Mail Back CTFIP County FIPS 13013 Barrow
13015 Bartow 13045 Carroll 13057 Cherokee 13063 Clayton 13067 Cobb 13077 Coweta 13089 DeKalb 13097 Douglas 13113 Fayette 13117 Forsyth 13121 Fulton 13135 Gwinnett 13139 Hall 13151 Henry 13217 Newton 13223 Paulding 13247 Rockdale 13255 Spalding 13297 Walton
AREAT Area Type 1 CBD 2 Urban Commercial 3 Urban Residential 4 Suburban Commercial 5 Suburban Residential 6 Exurban 7 Rural ASSN Assigned Travel Day 11168 Tuesday, March 8 11169 Wednesday, March 9 11170 Thursday, March 10 11171 Friday, March 11 11172 Saturday, March 12 11173 Sunday, March 13 11174 Monday, March 14 11175 Tuesday, March 15 11176 Wednesday, March 16 11177 Thursday, March 17 11178 Friday, March 18
11179 Saturday, March 19

PTV NuStats 162 ARC Regional Travel Survey Final Report
11180 Sunday, March 20 11181 Monday, March 21 11182 Tuesday, March 22 11183 Wednesday, March 23 11184 Thursday, March 24 11185 Friday, March 25 11186 Saturday, March 26 11187 Sunday, March 27 11188 Monday, March 28 11189 Tuesday, March 29 11190 Wednesday, March 30 11191 Thursday, March 31 11192 Friday, April 1 11193 Saturday, April 2 11194 Sunday, April 3 11195 Monday, April 4 11196 Tuesday, April 5 11197 Wednesday, April 6 11198 Thursday, April 7 11199 Friday, April 8 11200 Saturday, April 9 11201 Sunday, April 10 11202 Monday, April 11 11203 Tuesday, April 12 11204 Wednesday, April 13 11205 Thursday, April 14 11206 Friday, April 15 11207 Saturday, April 16 11208 Sunday, April 17 11209 Monday, April 18 11210 Tuesday, April 19 11211 Wednesday, April 20 11212 Thursday, April 21 11213 Friday, April 22 11214 Saturday, April 23 11215 Sunday, April 24 11216 Monday, April 25 11217 Tuesday, April 26 11218 Wednesday, April 27 11219 Thursday, April 28 11220 Friday, April 29 11221 Saturday, April 30 11222 Sunday, May 1 11223 Monday, May 2 11224 Tuesday, May 3 11225 Wednesday, May 4 11226 Thursday, May 5 11227 Friday, May 6 11228 Saturday, May 7 11229 Sunday, May 8 11230 Monday, May 9 11231 Tuesday, May 10 11232 Wednesday, May 11 11233 Thursday, May 12 11234 Friday, May 13 11235 Saturday, May 14 11236 Sunday, May 15 11237 Monday, May 16 11238 Tuesday, May 17

PTV NuStats 163 ARC Regional Travel Survey Final Report
11239 Wednesday, May 18 11240 Thursday, May 19 11241 Friday, May 20 11242 Saturday, May 21 11243 Sunday, May 22 11244 Monday, May 23 11245 Tuesday, May 24 11246 Wednesday, May 25 11247 Thursday, May 26 11248 Friday, May 27
DOW Day of Week 1 Monday 2 Tuesday 3 Wednesday 4 Thursday 5 Friday ILANG Code Language of Interview 1 English 2 Spanish GTYPE GPS Households 1 Yes 2 No GFLAG [GTYPE=1] GPS Type 1 Wearable Random 2 Wearable Target 3 Vehicle RESTY Residence Type 1 Single-family Detached House 2 Single-family Attached House
3 Building with 2 or more Apartments/Condos 4 Mobile Home or Trailer 5 Boat, RV, Van, etc. 6 Dorm Room, Frat or Sorority House 7 Other (Specify) 8 DK 9 RF O_RESTY [RESTY=7] Other, Residence Type OWN Own or rent? 1 Rent
2 Own/Buying(Paying off Mortgage) 7 Other (Specify)
8 DK 9 RF
O_OWN [OWN=7] Other, Own HHSIZ Household Size
NONRELAT [RELAT = 8 OR 9 AND HHSIZ>1] Presence of Non-household members 1 YES 2 NO HHVEH Number of Household Vehicles

PTV NuStats 164 ARC Regional Travel Survey Final Report
VEHOP [HHVEH>0] Number of Household Vehicles Used Regularly During the Week VEHPR [IF GTYPE=1 AND GFLAG=3 AND VEHOP>0] Number of Operation Vehicles with Working Power Outlet or Cigarette Lighter Socket LTELE Land-Based Telephone Service 1 Yes 2 No 9 RF INCOME Household Income 1 Less than $10,000 2 $10,000 to $19,999 3 $20,000 to $29,999 4 $30,000 to $39,999 5 $40,000 to $49,999 6 $50,000 to $59,999 7 $60,000 to $74,999 8 $75,000 to $99,999 9 $100,000 to $149,999 10 $150,000 or more 99 RF HISP Hispanic Origin 1 Yes 2 No 8 DK 9 RF HISP2 [IF HISP>1 and HHSIZ>1] Hispanic Origin, Household 1 Yes 2 No 8 DK 9 RF RACE Race/Ethnicity 1 White 2 African-American 3 Asian 4 Native American, Alaskan Native 5 Pacific Islander, Native Hawaiian 6 Multiracial 7 Hispanic, Mexican 97 Other (Specify) 98 DK 99 RF O_RACE [RACE=97] Other, Race/Ethnicity INCEN Incentive Offered, Households 1 Household was Offered Incentive 2 Household Not Offered Incentive HHSTU Number of Household Students [COMPUTED] HHWRK Number of Household Workers [COMPUTED] HHLIC Number of Household License Holders [COMPUTED] HHCHD Number of Household Children [COMPUTED - Number of Household Members that RELAT=3
and (AGE<22 or AGEB=1)]

PTV NuStats 165 ARC Regional Travel Survey Final Report
HHLIFE Household Life Cycle [COMPUTED] 1. One Adult, No Children, Not Retired 2. 2+ Adults, No Children, Not Retired 3. One Adult, Youngest Child 0-5 4. 2+ Adults, Youngest Child 0-5 5. One Adult, Youngest Child 6-15 6. 2+ Adults, Youngest Child 6-15 7. One Adult, Youngest Child 16-21 8. 2+ Adults, Youngest Child 16-21 9. One Adult, At least one Retired, No Children 10. 2+ Adults, At least one Retired, No Children **Households with the age of children as unknown, but AGEB=1 (under 16), were flagged as 5 or 6** HTRIPS Total Number of Trips [COMPUTED] FUTUR Willingness to participate in future surveys 1 Yes 2 No 9 Refused HTAZ Home Travel Analysis Zone 7777 Out of Area HXCORD Home X Coordinate HYCORD Home Y Coordinate HHPARTIAL Partial Completed Households. 4 or more size Household (n-1) completed the survey 0 No 1 Yes HHWGT Household Weight EXPHHWGT Expanded Household Weight

PTV NuStats 166 ARC Regional Travel Survey Final Report
Person Data
Variable Label Values SAMPN Household Identifier PERNO Unique Person Identifier GENDER Gender 1 Male 2 Female 9 RF AGE Age 99 99 Years or Older 998 DK 999 RF AGEB [AGE=998 or 999] Between Age 16 and 65 1 Less than 16 or Over 65 2 Between 16 and 65 9 RF LIC [IF AGE>16 and AGEB<>1] License 1 Yes 2 No 8 DK 9 RF CTELE [IF AGE>16 and AGEB<>1] Cellular Telephone 1 Yes 2 No 8 DK 9 RF RELAT Relationship 1 Self 2 Spouse 3 Son/Daughter 4 Father/Mother 5 Brother/Sister 6 Grandparent 7 Grandchild 8 Live-in Help 9 Roommate/Other Non-related 10 Other Related 98 DK 99 RF DISAB Disability 1 Yes 2 No 8 DK 9 RF DTYPE1 [DISAB=1] Disability Type 1 DTYPE2 [DISAB=1] Disability Type 2 DTYPE3 [DISAB=1] Disability Type 3 1 Visually Impaired or Blind DTYPE4 [DISAB=1] Disability Type 4 2 Hearing Impaired or Deaf DTYPE5 [DISAB=1] Disability Type 5 3 Cane or Walker 4 Wheelchair Non-Transferable 5 Wheelchair Transferable 6 Mentally or Emotionally Disabled 7 Other (Specify) 8 DK 9 RF

PTV NuStats 167 ARC Regional Travel Survey Final Report
O_DTYPE [DTYPE=7] Other, Disability Type EMPLY [If AGE > 16 or If AGEB = 2] Employed 1 Yes 2 No 8 DK 9 RF VOLUN [If AGE > 16 or If AGEB = 2 AND EMPLY<>1] Volunteer 1 Yes 2 No 8 DK 9 RF WORKS [If EMPLY =1 or VOLUN =1] Work Status [COMPUTED] 1 Treated as Worker 2 Non-Worker WKSTAT [If WORKS <>1] Unemployment Status 1 Retired 2 Homemaker 3 Unemployed but Looking for Work 4 Unemployed, Not Seeking Employment 5 Student (Part-time or Full-time) 7 Other (Specify) 8 DK 9 RF O_WKSTAT [WKSTAT=7] Other, Unemployment Status JOBS [WORKS=1] Number of Jobs 99 RF HOURS [WORKS=1] Number of Hours Worked at Primary Job 999 RF HOURS2 [WORKS=1] Number of Hours Worked at Second Job 999 RF HOURS3 [WORKS=1] Number of Hours Worked at Third Job 999 RF TELWK [WORKS=1] Telecommuting Offered at Workplace
1 Yes 2 No 9 DK/RF
TCHRS [TELWRK=1] Telecommute Hours 998 DK 999 RF WSTRT [WORKS =1] Work Start Time 9998 DK 9999 RF WEND [WORKS =1] Work End Time 9998 DK 9999 RF SCHED [WORKS =1] Work Schedule 1 Yes 2 No 8 DK 9 RF

PTV NuStats 168 ARC Regional Travel Survey Final Report
WDAYS [WORKS=1] Work Days 1 One 2 Two 3 Three 4 Four 5 Five 6 Six 7 Seven 8 DK 9 RF COMPR [WORKS=1] Compressed Work Week 1 4/40 2 9/80 3 No 7 Other (Specify) 8 DK 9 RF O_COMPR [COMPR=7] Other, Compressed Work Week INDUS [WORKS=1] Industry
11 AGRICULTURE, FORESTRY, FISHING AND HUNTING 21 MINING, QUARRYING, AND OIL AND GAS EXTRACTION 22 UTILITIES 23 CONSTRUCTION 31 MANUFACTURING 42 WHOLESALE TRADE 44 RETAIL TRADE 48 TRANSPORTATION AND WAREHOUSING 51 INFORMATION 52 FINANCE AND INSURANCE 53 REAL ESTATE, RENTAL AND LEASING 54 PROFESSIONAL, SCIENTIFIC AND TECHNICAL SERVICES 55 MANAGEMENT OF COMPANIES AND ENTERPRISES 56 ADMINISTRATIVE AND SUPPORT AND WASTE MANAGEMENT AND
REMEDIATION SERVICES 61 EDUCATIONAL SERVICES 62 HEALTH CARE AND SOCIAL ASSISTANCE 71 ARTS, ENTERTAINMENT, AND RECREATION 72 ACCOMODATION AND FOOD SERVICES 81 OTHER SERVICES (EXCEPT PUBLIC ADMINISTRATION) 92 PUBLIC ADMINISTRATION 97 OTHER (SPECIFY) 98 DK 99 RF
O_INDUS [INDUS=97] Other, Industry OCCUP [WORKS=1] Occupation
11 MANAGEMENT OCCUPATIONS 13 BUSINESS AND FINANCIAL OPERATIONS OCCUPATIONS 15 COMPUTER AND MATHEMATICAL OCCUPATIONS 17 ARCHITECTURE AND ENGINEERING OCCUPATIONS 19 LIFE, PHYSICAL, AND SOCIAL SCIENCE OCCUPATIONS 21 COMMUNITY AND SOCIAL SERVICES OCCUPATIONS 23 LEGAL OCCUPATIONS 25 EDUCATION, TRAINING, AND LIBRARY OCCUPATIONS

PTV NuStats 169 ARC Regional Travel Survey Final Report
27 ARTS, DESIGN, ENTERTAINMENT, SPORTS, AND MEDIA OCCUPATIONS
29 HEALTHCARE PRACTITIONERS AND TECHNICAL OCCUPATIONS 31 HEALTHCARE SUPPORT OCCUPATIONS 33 PROTECTIVE SERVICE OCCUPATIONS 35 FOOD PREPARATION AND SERVING RELATED OCCUPATIONS 37 BUILDING AND GROUNDS CLEANING AND MAINTENANCE
OCCUPATIONS 39 PERSONAL CARE AND SERVICE OCCUPATIONS 41 SALES AND RELATED OCCUPATIONS 43 OFFICE AND ADMINISTRATIVE SUPPORT OCCUPATIONS 45 FARMING, FISHING, AND FORESTRY OCCUPATIONS 47 CONSTRUCTION AND EXTRACTION OCCUPATIONS 49 INSTALLATION, MAINTENANCE, AND REPAIR OCCUPATIONS 51 PRODUCTION OCCUPATIONS 53 TRANSPORTATION AND MATERIAL MOVING OCCUPATIONS 55 MILITARY SPECIFIC OCCUPATIONS 97 OTHER (SPECIFY) 98 DK 99 RF
O_OCCUP [OCCUP=97] Other, Occupation EMPLR [WORKS=1] Employer 1 A Private Company 2 Government 3 Non-Profit 4 Self-Employed 7 Other (Specify) 8 DK 9 RF O_EMPLR [EMPLR=7] Other, Employer EPARK [WORKS=1] Employer Provided Parking 1 Yes 2 No 8 DK 9 RF EPPK2 [EPARK>1] Employer Subsidized Parking 1 Yes 2 No 8 DK 9 RF
UPARK [EPPK2=1] Employer Subsidized Parking Use 1 Yes 2 No 8 DK 9 RF ETRANS [WORKS=1] Employer Subsidized Transit 1 Yes 2 No 8 DK 9 RF WLOC [WORKS=1] Work Location 1 Fixed 2 Home 3 Varies

PTV NuStats 170 ARC Regional Travel Survey Final Report
WNAME [WLOC=1 or 3] Name of Employer WTAZ [WLOC=1 or 3] Work Travel Analysis Zone 7777 Out of Area WXCORD [WLOC=1 or 3] Work X Coordinate WYCORD [WLOC=1 or 3] Work Y Coordinate WMODE [WLOC=1 or 3] Mode of Transport to Work 1 Walk 2 Bike 3 Auto/Van/Truck Driver 4 Auto/Van/Truck Passenger 5 Local Bus (Regular, Standard, City) 6 Express Bus (Suburban, Commuter, Inter-City) 7 MARTA Train 8 Dial-a-Ride/Paratransit 9 Taxi/Limo 10 School Bus 11 Motorcycle/Moped 97 Other (Specify) 98 DK 99 RF O_WMODE [WMODE=97] Other, Mode of Transport to Work
EDUCA Educational Attainment 1 Not a high school graduate, 12 grade or less (this
includes very young children) 2 High School Graduate (High School Diploma or
GED) 3 Some College Credit but no Degree 4 Associate or Technical School Degree 5 Bachelor's or Undergraduate Degree 6 Graduate Degree (Includes Professional Degree like
MD, DD, JD) 7 Other, SPECIFY 8 DK 9 RF
O_EDUCA [EDUCA=7] Other, Educational Attainment STUDE Student Status 1 Yes - Full Time 2 Yes - Part Time 3 No 8 DK 9 RF SCHOL [STUDE=1 or 2] Level of School 1 Daycare 2 Nursery/Pre-school 3 Kindergarten to Grade 8 4 Grade 9 to 12 5 Vocational/Technical School 6 2-Year College (Community College) 7 4-Year College or University 8 Graduate School/Professional

PTV NuStats 171 ARC Regional Travel Survey Final Report
97 Other (Specify) 98 DK 99 RF O_SCHOL [SCHOL=97] Other, Level of School SLOC [SCHOL=1-4] Home Schooled 1 Yes 2 No 8 DK 9 RF SONLN [IF SCHOL=5-8] School Online 1 Yes 2 No 8 DK 9 RF SNAME [STUDE=1 or 2 and SLOC<>1 or SONLN<>1] School Name STAZ [STUDE=1 or 2 and SLOC<>1 or SONLN<>1] School Travel Analysis Zone 7777 Out of Area SXCORD [STUDE=1 or 2 and SLOC<>1 or SONLN<>1] School X Coordinate SYCORD [STUDE=1 or 2 and SLOC<>1 or SONLN<>1] School Y Coordinate SMODE [IF SLOC>1 OR SONLN>1] Mode of Transport to School 1 Walk 2 Bike 3 Auto/Van/Truck Driver 4 Auto/Van/Truck Passenger 5 Local Bus (Regular, Standard, City)
6 Express Bus (Suburban, Commuter, Inter-City)
7 MARTA Train 8 Dial-a-Ride/Paratransit 9 Taxi/Limo 10 School Bus 11 Motorcycle/Moped 97 Other (Specify) 98 DK 99 RF O_SMODE [SMODE=97] Other, Mode of Transport to School RIBUS [AGE>15 and AGEB<>1] Public Transit Use 1 Nearly every day 2 Once or twice a week 3 Once or twice a month 4 Almost never 5 Never 8 DK 9 RF
BREZ [RIBUS=1 or 2] Breeze Card 1 Yes 2 No 8 DK 9 RF BREZF [BREZ=1] Value Added to Breeze Card 1 Purchase a 30-day pass

PTV NuStats 172 ARC Regional Travel Survey Final Report
2 Purchase a 7-day pass 3 Purchase 20 trips 4 Purchase 10 trips 5 Purchase less than $20 in fares 6 The card was purchased through a special
fare program 7 Other (Specify) 8 DK 9 RF O_BREZF [BREZF=7] Other, Value Added to Breeze Card GRTA [RIBUS=1 or 2] GRTA Xpress Bus Pass 1 Yes 2 No 8 DK 9 RF
GRTAF [GTRA=1] Type of GRTA Xpress Bus Pass 1 Purchase a 31-day pass 2 Purchase a 40-ride pass 3 Purchase 20-ride pass 4 Purchase a round-trip fare 5 Purchase a one-way fare
6 The Xpress bus pass purchased through a special fare program
8 DK 9 RF CGTP [IF RIBUS=1 OR 2 AND IF RESIDENT OF COBB COUNTY OR GWINNETT COUNTY] Cobb or
Gwinett County Transit Pass 1 Yes, for local service 2 Yes, for express service 3 Yes, for paratransit service 4 No 8 DK 9 RF CGTPF [IF CGTP<4] Type of Cobb or Gwinett County Transit Pass
1 Purchase a 31-day or Monthly Pass 2 Purchase a 20-day Pass 3 Purchase a 10-day Pass 4 The county transit pass is purchased through
a special fare program 8 DK 9 RF
DISFR [IF BREZ=1 or GRTA=1 or CGTP<4] Discounted Fare Program Participation 1 NO DISCOUNTED FARE 2 YES, THROUGH AN EMPLOYER 3 YES, THROUGH A UNIVERSITY PASS (U-
PASS) PROGRAM 4 YES, THROUGH A K-12 PROGRAM 5 YES, DISCOUNTED FARE FOR SENIOR
CITIZENS, DISABLED RIDERS, OR MEDICARE RECIPIENTS
7 OTHER DISCOUNTED FARE, SPECIFY 8 DK 9 RF O_DISFR [DISFR=7] Other, Discounted Fare Program Participation

PTV NuStats 173 ARC Regional Travel Survey Final Report
FBKTW [IF STUDE<3 OR WORKS=1] Frequency of Bike Travel 1 0 Times (Never) 2 Once or Twice 3 3 or 4 Times 4 5 or More Times 8 DK 9 RF INTRV Person Being Interviewed [RET] 1 Yes 2 No PROXY [IF INTRV<>1] Proxy Flag [RET] [PERNO] Person serving as Proxy CMPLG Completed Log [RET] 1 Yes 2 No 3 Did not travel on that day 4 Valid Partial 8 DK 9 RF HVLOG Completed Diary [RET] 1 Yes 2 No 3 Did not travel on that day 4 Valid Partial 9 RF PTRIPS Number of Trips [COMPUTED] NOGO [PTRIPS=0] Reason for No Trips [RET] 1 Personally Sick 2 Vacation or Personal Day 3 Caretaking Sick Children 4 Caretaking Sick Other 5 Home-bound Elderly or Disabled 6 Worked at Home for Pay 7 Not Scheduled to Work 8 Worked Around Home (Not for Pay) 9 Out of Area 10 No Transportation Available 11 Weather 97 Other (Specify) 99 RF O_NOGO [NOGO=97] Other, Reason for No Trips [RET]
INCOMPLETE_FLAG Person Belongs To Partial Complete 0 COMPLETE 1 INCOMPLETE VALID PARTIAL CTFIP County FIPS 13013 Barrow
13015 Bartow 13045 Carroll 13057 Cherokee 13063 Clayton 13067 Cobb 13077 Coweta 13089 DeKalb

PTV NuStats 174 ARC Regional Travel Survey Final Report
13097 Douglas 13113 Fayette 13117 Forsyth 13121 Fulton 13135 Gwinnett 13139 Hall 13151 Henry 13217 Newton 13223 Paulding 13247 Rockdale 13255 Spalding 13297 Walton
PWGT Person Weight EXPPWGT Expanded Person Weight
Vehicle Data
Variable Label Values SAMPN Household Identifier VEHNO Vehicle Number YEAR Year of Vehicle 9998 DK 9999 RF MAKE Make of Vehicle
11 ACURA 12 AUDI 13 BMW 14 BUICK 15 CADILLAC 16 CHEVROLET 17 CHRYSLER 18 DAEWOO 19 DODGE 20 FORD 21 GEO 22 GMC 23 HARLEY DAVIDSON 24 HONDA 25 HUMMER 26 HYUNDAI 27 INFINITI 28 ISUZU 29 JAGUAR
30 JEEP 31 KAWASAKI 32 KIA 33 LEXUS 34 LINCOLN 35 MAZDA 36 MERCEDES 37 MERCURY 38 MITSUBISHI 39 NISSAN 40 OLDSMOBILE 41 PLYMOUTH 42 PONTIAC 43 PORSCHE 44 RANGE ROVER 45 SAAB 46 SATURN 47 SCION 48 SUBARU

PTV NuStats 175 ARC Regional Travel Survey Final Report
49 SUZUKI 50 TOYOTA 51 VOLKSWAGEN 52 VOLVO
53 YAMAHA 97 OTHER, SPECIFY 98 DK 99 RF
O_MAKE [MAKE=97] Other, Make of Vehicle MODEL Model of Vehicle BODY Body of Vehicle 1 AUTO SEDAN 2 AUTO 2-SEAT 3 VAN 4 RECREATIONAL VEHICLE 5 SPORT UTILITY VEHICLE 6 STATION WAGON 7 PICK-UP TRUCK 8 MOTORCYCLE 9 MOPED/SCOOTER (e.g., VESPA) 97 OTHER (SPECIFY) 98 DK 99 RF O_BODY [BODY=97] Other, Body of Vehicle FUEL Type of Fuel 1 Gas 2 Diesel 3 Hybrid 4 Flex Fuel 7 Other (Specify) 8 DK 9 RF O_FUEL [FUEL=7] Other, Type of Fuel CIGLIT Working Power Outlet or Cigarette Lighter 1 Yes 2 No 8 DK 9 RF VEHOWN Ownership Status of Vehicle 1 Household Owned/Leased 2 Employer Provided 3 Rental Car 4 Borrowed from Friend or Relative 7 Other (Specify) 8 DK 9 RF O_VEHOWN [VEHOWN=7] Other, Ownership Status of Vehicle EZPAS EZPass Tag 1 Yes, Vehicle has Cruise Card Tag
2 No, Vehicle does not have Cruise Card Tag 8 DK 9 RF

PTV NuStats 176 ARC Regional Travel Survey Final Report
CNTV Vehicle Used on Travel Day 1 [RET] 1 Yes 2 No 9 RF O_CNTV [CNTV=2] Reason Not Used [RET]
HHWGT Household Weight EXPHHWGT Expanded Person Weight Place Data
Variable Label Values SAMPN Household Identifier PERNO Person Number PLANO Place Number [RET] PNAME Place Name [RET] TPURP Primary Trip Purpose [RET]
1 WORKING AT HOME (FOR PAY OR VOLUNTEER) 2 SHOPPING (ON-LINE, CATALOG, OR BY PHONE) 3 ANY OTHER ACTIVITIES AT HOME 4 CHANGE TRAVEL MODE/TRANSFER (FROM CAR TO BUS/TRAIN,
WALK TO BUS/TRAIN, ETC) 5 DROPPED OFF PASSENGER FROM CAR 6 PICKED UP PASSENGER FROM CAR 7 DRIVE THROUGH (ATM, BANK, FAST FOOD, ETC). 8 WORK/DOING MY JOB 9 OTHER WORK-RELATED ACTIVITIES AT WORK 10 VOLUNTEER WORK/ACTIVITIES 11 ATTENDING CLASS/STUDYING 12 ALL OTHER ACTIVITIES AT SCHOOL (EAT LUNCH,
RECREATIONAL, ETC) 13 WORK RELATED (MEETING, SALES CALL, DELIVERY) 14 SERVICE PRIVATE VEHICLE (GETTING GAS, OIL, LUBE,
REPAIRS) 15 GROCERY/FOOD SHOPPING 16 OTHER ROUTINE SHOPPING (CLOTHING, CONVENIENCE
STORE, HOUSEHOLD MAINTENANCE) 17 SHOPPING FOR MAJOR PURCHASES OR SPECIALTY ITEMS
(APPLIANCES, ELECTRONICS, NEW VEHICLE, MAJOR HH REPAIRS, ETC)
18 HOUSEHOLD ERRANDS (BANK, DRY CLEANING, ETC.)

PTV NuStats 177 ARC Regional Travel Survey Final Report
19 HEALTH CARE (DOCTOR, DENTIST, ETC) 20 PERSONAL BUSINESS (VISIT GOVERNMENT OFFICE,
ATTORNEY, ACCOUNTANT) 21 EAT MEAL OUT AT RESTAURANT/DINER 22 CIVIC OR RELIGIOUS ACTIVITIES 23 INDOOR RECREATION (YOGA, GYM, ETC) OR OUTDOOR
RECREATION (JOGGING, BIKING, WALKING) 24 ATTEND MAJOR SPORTING EVENT 25 SOCIAL/VISIT FRIENDS/RELATIVES 96 LOOP TRIP (for interviewer only – not listed in diary) 97 OTHER (SPECIFY)
O_TPURP [TPURP=97] Other, Trip Purpose [RET] TPUR2 Secondary Trip Purpose [RET]
0 NO OTHER ACTIVITIES [TPURP2 ONLY] 1 WORKING AT HOME (FOR PAY OR VOLUNTEER) 2 SHOPPING (ON-LINE, CATALOG, OR BY PHONE) 3 ANY OTHER ACTIVITIES AT HOME 4 CHANGE TRAVEL MODE/TRANSFER (FROM CAR TO BUS/TRAIN,
WALK TO BUS/TRAIN, ETC) 5 DROPPED OFF PASSENGER FROM CAR 6 PICKED UP PASSENGER FROM CAR 7 DRIVE THROUGH (ATM, BANK, FAST FOOD, ETC). 8 WORK/DOING MY JOB 9 OTHER WORK-RELATED ACTIVITIES AT WORK 10 VOLUNTEER WORK/ACTIVITIES 11 ATTENDING CLASS/STUDYING 12 ALL OTHER ACTIVITIES AT SCHOOL (EAT LUNCH,
RECREATIONAL, ETC) 13 WORK RELATED (MEETING, SALES CALL, DELIVERY) 14 SERVICE PRIVATE VEHICLE (GETTING GAS, OIL, LUBE,
REPAIRS) 15 GROCERY/FOOD SHOPPING 16 OTHER ROUTINE SHOPPING (CLOTHING, CONVENIENCE
STORE, HOUSEHOLD MAINTENANCE) 17 SHOPPING FOR MAJOR PURCHASES OR SPECIALTY ITEMS
(APPLIANCES, ELECTRONICS, NEW VEHICLE, MAJOR HH REPAIRS, ETC)
18 HOUSEHOLD ERRANDS (BANK, DRY CLEANING, ETC.) 19 HEALTH CARE (DOCTOR, DENTIST, ETC) 20 PERSONAL BUSINESS (VISIT GOVERNMENT OFFICE,
ATTORNEY, ACCOUNTANT) 21 EAT MEAL OUT AT RESTAURANT/DINER 22 CIVIC OR RELIGIOUS ACTIVITIES 23 INDOOR RECREATION (YOGA, GYM, ETC) OR OUTDOOR
RECREATION (JOGGING, BIKING, WALKING) 24 ATTEND MAJOR SPORTING EVENT 25 SOCIAL/VISIT FRIENDS/RELATIVES 96 LOOP TRIP (for interviewer only – not listed in diary) 97 OTHER (SPECIFY)

PTV NuStats 178 ARC Regional Travel Survey Final Report
O_TPURP2 [TPURP2 =97] Other, Trip Purpose [RET] MODE [PLANO>1] Mode of Transport
1 Walk 2 Bike 3 Auto/Van/Truck Driver 4 Auto/Van/Truck Passenger 5 Local Bus (Regular, Standard, City) 6 Express Bus (Suburban, Commuter, Inter-City) 7 MARTA Train 8 Dial-a-Ride/Paratransit 9 Taxi/Limo 10 School Bus 11 Motorcycle/Moped 97 Other (Specify) 98 DK 99 RF
O_MODE [MODE=97] Other, Mode of Transport TOTTR [PLANO>1] Total number of People [RET] HHMEM [TOTTR>1] Number of Household Members on Trip [RET] PER1 [HHMEM>0] Person Number on Trip [RET] PER2 [HHMEM>1] Person Number on Trip [RET] PER3 [HHMEM>2] Person Number on Trip [RET] PER4 [HHMEM>3] Person Number on Trip [RET] PER5 [HHMEM>4] Person Number on Trip [RET] NONHH [TOTTR>1] Non-Household Members on Trip [COMPUTED] VEHNO [MODE=3 or 4] Vehicle Number [RET] RANGE 97 Non household vehicle HOVL [IF MODE=3 OR 4] Used HOV Lane [RET] 1 Yes 2 No 9 DK/RF TOLL [IF MODE=3 OR 4] Used TOLL Lane [RET] 1 Yes 2 No 9 DK/RF DYGOV [IF MODE=3 OR 4 AND PNAME<>HOME] Exit Vehicle [RET] 1 Yes 2 No PLOC [MODE=3 AND DYGOV=1] Parking Location [RET] 1 At This Destination 2 Off-Site 9 DK/RF

PTV NuStats 179 ARC Regional Travel Survey Final Report
PRKTY [MODE=3 AND DYGOV=1] Parking Description [RET] 1 Parking Lot 2 Parking Garage 3 Street 4 Driveway 5 Residential Garage 7 Other (Specify) 8 DK 9 RF
O_PRKTY [PRKTY=7] Other, Parking Description [RET] PAYPK [MODE=3 AND DYGOV=1 and PRKTY<>4 OR <>5] Pay to Park [RET] 1 Yes 2 No 9 DK/RF PKAMT [PAYPK =1] Pay to Park Amount [RET] PKUNT [PAYPK =1] Pay Unit [RET] 1 Per Hour 2 Per Day 3 Per Week 4 Per Month 5 Per Semester 6 Per Year 8 DK 9 RF ROUTE [MODE>4 and MODE<8] Route/Line Number for Transit Trips [RET] SERVC [MODE>4 and MODE<8] Transit Service [RET] 1 MARTA train 2 MARTA bus 3 CAT (Cherokee Area Transit) 4 CCT (Cobb Community Transit) 5 GCT (Gwinnett County Transit) 6 Xpress / GRTA (Georgia Regional Transportation
Authority) 7 HAT (Hall Area Transit) 97 Other (Specify) 98 DK 99 RF O_SERVC [SERVC=97] Other, Transit Service [RET] FARE [MODE>4 and MODE<9] Transit Fare Type [RET] 1 Cash 2 Used Pass 7 Other (Specify) 8 DK 9 RF FAREC [FARE =1] Transit Fare Cash [RET] ARR_HR Arrival Hour [RET] ARR_MIN Arrival Minute [RET]

PTV NuStats 180 ARC Regional Travel Survey Final Report
DEP_HR Departure Hour [RET] DEP_MIN Departure Minute [RET] ACTDUR Activity Duration [TB] TRPDUR [PLANO>1] Trip Duration in Minutes [TB] TRIPDIST [PLANO>1] Trip Distance [TB] PTAZ Place Travel Analysis Zone 7777 Out of Area XCORD Place Longitude [TB] YCORD Place Latitude [TB] TRIPNO Trip Number PTRIPS Number of Person Trips [COMPUTED] ACCESSMODE Transit Access Mode
1 Walk 2 Bike 3 Auto/Van/Truck Driver 4 Auto/Van/Truck Passenger 5 Local Bus (Regular, Standard, City) 6 Express Bus (Suburban, Commuter, Inter-City) 7 MARTA Train 8 Dial-a-Ride/Paratransit 9 Taxi/Limo 10 School Bus 11 Motorcycle/Moped 97 Other (Specify) 98 DK 99 RF
O_ACCESSMODE [ACCESSMODE =97]
Other, Transit Access Mode EGRESSMODE Transit Egress Mode
1 Walk 2 Bike 3 Auto/Van/Truck Driver 4 Auto/Van/Truck Passenger 5 Local Bus (Regular, Standard, City) 6 Express Bus (Suburban, Commuter, Inter-City) 7 MARTA Train 8 Dial-a-Ride/Paratransit 9 Taxi/Limo 10 School Bus 11 Motorcycle/Moped 97 Other (Specify) 98 DK 99 RF
O_ EGRESSMODE [EGRESSMODE=97]

PTV NuStats 181 ARC Regional Travel Survey Final Report
Other, Transit Egress Mode OPNAME Origin Place Name DPNAME Destination Place Name OTAZ Origin Travel Analysis Zone 7777 Out of Area DTAZ Destination Travel Analysis Zone 7777 Out of Area ORIGIN_LONG Origin Longitude ORIGIN _LAT Origin Latitude DEST_LONG Destination Longitude DEST _LAT Destination Latitude ORIGIN_DEPTIME Departure Time DEST_ARRTIME Destination Arrival Time PWGT Person Weight EXPPWGT Expanded Person Weight

PTV NuStats 182 ARC Regional Travel Survey Final Report
Appendix G: Recruitment Item
Unweighted Frequencies
Table H-1: Household Size (Unweighted)
Household Size Frequency Percent
ACS 2010 3-
Year
estimate
1 2411 23.5 26.2
2 3689 35.9 30.9
3 1832 17.8 17.1
4+ 2346 22.8 25.8
Total 10278 100.0 100.0
Table H-2: Household Number of Vehicles (Unweighted)
Household Number of
Vehicles Frequency Percent
ACS 2008 -
2010
0 426 4.1% 6.2
1 2595 25.2% 33.6
2 4403 42.8% 40.0
3 1933 18.8% 14.6
4+ 921 9.0% 5.6
Total 10278 100.0 100.0
Table H-3: Vehicle Age (Unweighted)
Vehicle Age Frequency Percent
Less than 1 year 702 3.1
1 - 5 years 6216 27.6
6 - 10 years 7052 31.3
11 - 20 years 6906 30.7
> 20 years 1223 5.4
DK/RF 407 1.8
Total 22506 100.0

PTV NuStats 183 ARC Regional Travel Survey Final Report
Table H-4: Household Ethnicity (Unweighted)
Ethnicity Frequency Percent
White 7270 70.7
African American 2212 21.5
Asian 191 1.9
Native American, Alaskan Native
50 0.5
Pacific Islander, Native Hawaiian
11 0.1
Multi-Racial 164 1.6
Hispanic, Mexican 201 2.0
Other (Specify) 17 0.2
DK 7 0.1
RF 155 1.5
Total 10278 100.0
Table H-5: Hispanic or Latino Households (Unweighted)
Hispanic Status Frequency Percent
Yes 478 4.7
No 9729 94.7
DK 11 0.1
RF 60 0.6
Total 10278 100.0
Table H-6: Household Residence Type (Unweighted)
Ethnicity Frequency Percent
Single-family Detached House
8267 80.4
Single-family Attached House
497 4.8
Building with 2 or more Apartments or Condos
1384 13.5
Mobile Home or Trailer
119 1.2
Other(Specify) 4 0.0
DK 2 0.0
RF 5 0.0
Total 10278 100.0%

PTV NuStats 184 ARC Regional Travel Survey Final Report
Table H-7: Ownership Stats of Household Residence (Unweighted)
Ownership Frequency Percent
Rent 1675 16.3
Own/Buying (Paying Off Mortgage)
8564 83.3
Other (Specify) 9 0.1
DK 4 0.0
RF 26 0.3
Total 10278 100.0
Table H-8: Landlines in Household (Unweighted)
Landlines in
Household Frequency Percent
Yes 9500 92.4%
No 757 7.4%
RF 21 .2%
Total 10278 100.0%
Table H-9: Household Income (Unweighted)
Income Frequency Percent
Less than $10,000 419 4.1%
$10,000 to $19,999 682 6.6%
$20,000 to $29,999 711 6.9%
$30,000 to $39,999 771 7.5%
$40,000 to $49,999 718 7.0%
$50,000 to $59,999 679 6.6%
$60,000 to $74,999 832 8.1%
$75,000 to $99,999 1783 17.3%
$100,000 to $149,999
1688 16.4%
$150,000 or more 1137 11.1%
RF 858 8.3%
Total 10278 100.0%

PTV NuStats 185 ARC Regional Travel Survey Final Report
Table H-10: Household Number of Students (Unweighted)
Number of Students Frequency Percent
0 6257 60.9%
1 1895 18.4%
2 1470 14.3%
3 502 4.9%
4 124 1.2%
5 21 .2%
6 4 .0%
7 4 .0%
8 1 .0%
Total 10278 100.0%
Table H-11: Household Number of Workers (Unweighted)
Number of Workers Frequency Percent
0 1890 18.4
1 4089 39.8
2 3709 36.1
3 526 5.1
4 60 0.6
5 4 0.0
Total 10278 100.0
Table H-12: Number of Licensed Drivers in Household (Unweighted)
Number of Licensed
Drivers Frequency Percent
0 258 2.5%
1 2949 28.7%
2 5561 54.1%
3 1205 11.7%
4 264 2.6%
5 33 .3%
6 7 .1%
7 1 .0%
Total 10278 100.0%

PTV NuStats 186 ARC Regional Travel Survey Final Report
Table H-13: Average Number of Children in Household (Unweighted)
Number of Children Frequency Percent
0 6832 66.5%
1 1436 14.0%
2 1425 13.9%
3 436 4.2%
4 114 1.1%
5 27 .3%
6 4 .0%
7 2 .0%
8 1 .0%
10 1 .0%
Total 10278 100.0%
Average 0.6
Table H-14: Respondent Gender (Unweighted)
Gender Frequency Percent
Male 12039 46.6%
Female 13687 53.0%
RF 84 .3%
Total 25810 100.0%
Table H-15: Respondent Age Distribution (Unweighted)
Age Distribution Frequency Percent
<18 years 5966 23.1%
18– 24 years 1265 4.9%
25 – 54 years 10962 42.5%
55 – 64 years 4210 16.3%
65+ years 2767 10.7%
Age Refusals 640 2.5%
Total 25810 100.0%
Table H-16: Respondent Disability Status (Unweighted)
Disability Status Frequency Percent
Yes 1326 5.1%
No 24397 94.5%
DK 22 .1%
RF 65 .3%
Total 25810 100.0%

PTV NuStats 187 ARC Regional Travel Survey Final Report
Table H-17: Respondents with Valid Driver's License (Unweighted)
Valid Driver's License Frequency Percent
Yes 18956 92.5%
No 1499 7.3%
DK 5 .0%
RF 27 .1%
Total 20487 100.0%
Table H-18: Respondent Employment Status (Unweighted)
Employment Status Frequency Percent
Yes 12388 60.6%
No 8015 39.2%
DK 9 .0%
RF 37 .2%
Total 20449 100.0%
Table H-19: Respondent Volunteer Status (Unweighted)
Volunteer Status Frequency Percent
Yes 953 11.8%
No 6968 86.4%
DK 36 .4%
RF 104 1.3%
Total 8061 100.0%
Table H-20: Respondent Works (Unweighted)
Works Frequency Percent
Treated as Worker 13341 65.2%
Non-Worker 7108 34.8%
Total 20449 100.0%

PTV NuStats 188 ARC Regional Travel Survey Final Report
Table H-21: Respondent Unemployment Status, if Does Not Work (Unweighted)
Unemployment Status Frequency Percent
Retired 2895 40.7%
Homemaker 1166 16.4%
Unemployed but Looking for Work
963 13.5%
Unemployed, Not Seeking Employment
287 4.0%
Student (Part-time or Full-time)
1213 17.1%
Other (Specify) 434 6.1%
DK 27 .4%
RF 123 1.7%
Total 7108 100.0%
Table H-22: Respondent Average Number of Jobs (Unweighted)
Number of Jobs Frequency Percent
1 12281 92.1%
2 826 6.2%
3 124 .9%
4 26 .2%
5 8 .1%
6 1 .0%
8 2 .0%
RF 73 .5%
Total 13341 100.0%
Average 1.1
Table H-23: Respondent Work Locations (Unweighted)
Work Locations Frequency Percent
Fixed 10168 76.2%
Home 1362 10.2%
Varies 1811 13.6%
Total 13341 100.0%

PTV NuStats 189 ARC Regional Travel Survey Final Report
Table H-24: Respondent Average Number of Days Worked per Week (Unweighted)
Days Work per Week Frequency Percent
One 620 4.6%
Two 756 5.7%
Three 1278 9.6%
Four 1508 11.3%
Five 7752 58.1%
Six 584 4.4%
Seven 210 1.6%
DK 468 3.5%
RF 165 1.2%
Total 13341 100.0%
Average 4.07
Table H-25: Percent Employer Provided Parking (Unweighted)
Employer Provided
Parking Frequency Percent
Yes 11444 85.8%
No 1589 11.9%
DK 187 1.4%
RF 121 .9%
Total 13341 100.0%
Table H-26: Percent Employer Subsidizes Transit Pass (Unweighted)
Employer Subsidizes
Transit Pass Frequency Percent
Yes 163 8.6%
No 1436 75.7%
DK 181 9.5%
RF 117 6.2%
Total 1897 100.0%

PTV NuStats 190 ARC Regional Travel Survey Final Report
Table H-27: Educational Attainment (Unweighted)
Educational Attainment Frequency Percent
Not a high school graduate, 12 grade or less (this includes very young children)
6879 26.7%
High school graduate (High school diploma or GED)
3448 13.4%
Some College Credit but no Degree 3337 12.9%
Associate or Technical School Degree 1819 7.0%
Bachelor's or Undergraduate Degree 5759 22.3%
Graduate Degree (Professional Degree like MD, DD, JD)
4279 16.6%
Other (Specify) 21 .1%
DK 90 .3%
RF 178 .7%
Total 25810 100.0%
Table H-28: Household Member Frequency of Walk or Bike to Work/School in Last Week
(Unweighted)
Walk or Bike to Work/School Frequency Percent
0 Times (Never) 17691 91.7%
Once or Twice 335 1.7%
3 or 4 Times 225 1.2%
5 or More Times 543 2.8%
DK 41 .2%
RF 463 2.4%
Total 19298 100.0%
Table H-29: Vehicle Body Type (Unweighted)
Vehicle Body Type Frequency Percent
Auto Sedan 9711 45.7%
Auto 2-Seat 845 4.0%
Van 1838 8.6%
Recreational Vehicle 135 .6%
Sport Utility Vehicle 4544 21.4%
Station Wagon 398 1.9%
Pick-up Truck 3220 15.1%
Motorcycle 426 2.0%
Moped/Scooter (e.g. Vespa) 51 .2%
Other (Specify) 26 .1%
DK 51 .2%
RF 25 .1%
Total 21270 100.0%

PTV NuStats 191 ARC Regional Travel Survey Final Report
Table H-30: Vehicle Fuel Type (Unweighted)
Vehicle Fuel Type Frequency Percent
Gas 20621 96.9%
Diesel 287 1.3%
Hybrid 199 .9%
Flex Fuel 94 .4%
Other (Specify) 23 .1%
DK 25 .1%
RF 21 .1%
Total 21270 100.0%
Table H-31: Vehicle Ownership Type (Unweighted)
Vehicle Ownership Type Frequency Percent
Household Owned/Leased 20690 97.3
Employer Provided 309 1.5
Rental Car 12 0.1
Borrowed From Friend or Relative 51 0.2
Don’t Know 10 0.0
Refused 198 0.9
Total 21270 100.0

PTV NuStats 192 ARC Regional Travel Survey Final Report
Appendix H: Retrieval Item Unweighted
Frequencies
Table I-1: Primary Trip Purpose (Unweighted)
Primary Trip Purpose Frequency Percent
Working at Home (For Pay or Volunteer) 1240 1.3%
Shopping (Online, Catalog or by Phone) .56 .1%
Any Other Activities at Home 29314 31.3%
Change Travel Mode/Transfer 3977 4.2%
Dropped off Passenger from Car 4435 4.7%
Picked up Passenger from Car 3851 4.1%
Drive Through (ATM, Bank, Fast Food, etc.) 1808 1.9%
Work/Doing my Job 9991 10.7%
Other Work-Related Activities at Work 160 .2%
Volunteer Work/Activities 216 .2%
Attending Class/Studying 5054 5.4%
All Other Activities at School (Eat Lunch, Recreational, etc)
221 .2%
Work-Related (Meeting, Sales Call, Delivery) 3191 3.4%
Service Private Vehicle (Getting Gas, Oil, Lube, Repairs)
1621 1.7%
Grocery/Food Shopping 4424 4.8%
Other Routine Shopping (Clothing, Convenience Store, Household Maintenance)
4457 4.8%
Shopping for Major Purchases or Specialty Items 491 .5%
Household Errands (Bank, Dry Cleaning, etc.) 1981 2.1%
Health Care (Doctor, Dentist, etc.) 2010 2.1%
Personal Business (Visit Government Office, Attorney, Accountant)
2290 2.4%
Eat Meal Out at Restaurant/Diner 4351 4.6%
Civic or Religious Activities 1070 1.1%
Indoor Recreation ( Yoga, GYM, etc.) or Outdoor Recreation (Jogging, Biking, Walking)
3213 3.4%
Attend Major Sporting Event 178 .2%
Social/Visit Friends/Relatives 2763 2.9%
Loop Trip 220 .2%
Other (Specify) 1030 1.1%
Total 93713 100.0%

PTV NuStats 193 ARC Regional Travel Survey Final Report
Table I-2: Trip Mode – All Trips, Work Trips, School Trips (Unweighted)
Trip Mode Frequency Percent
Walk 5014 5.4%
Bike 315 .3%
Auto/Van/Truck Driver 61274 65.4%
Auto/Van/Truck Passenger 20278 21.6%
Local Bus (Regular, Standard, City) 720 .8%
Express Bus (Suburban, Commuter, Inter-city)
184 .2%
MARTA Train 884 .9%
Dial-a-ride/Paratransit Service 91 .1%
Taxi/Limo 91 .1%
School Bus 4344 4.6%
Motorcycle/Moped 128 .1%
Other(Specify) 358 .4%
Total 93681 100.0%
Table I-3: Total Persons Traveling on Trip (Unweighted)
Total Persons Traveling on Trip Frequency Percent
1 52574 56.1%
2 24275 25.9%
3 9659 10.3%
4 3947 4.2%
5 1320 1.4%
6 420 .4%
7 167 .2%
8 94 .1%
9 24 .0%
10 or more 1201 1.3%
Total 93681 100.0%

PTV NuStats 194 ARC Regional Travel Survey Final Report
Table I-4: Household Members Traveling on Trip (Unweighted)
Household Members Traveling on Trip Frequency Percent
0 7206 17.5%
1 22039 53.6%
2 8015 19.5%
3 2734 6.7%
4 826 2.0%
5 195 .5%
6 56 .1%
8 36 .1%
9 21 .1%
Total 41107 100.0%
Table I-5: Non-Household Members Traveling on Trip (Unweighted)
Non-Household Members Traveling on
Trip Frequency Percent
0 30547 74.3%
1 6695 16.3%
2 1585 3.9%
3 630 1.5%
4 251 .6%
5 108 .3%
6 55 .1%
7 53 .1%
8 25 .1%
10 or more 1137 2.8%
Total 41107 100.0%

PTV NuStats 195 ARC Regional Travel Survey Final Report
Table I-6: Reason for No Trips on Travel Day (Unweighted)
Reason for No Trips Frequency Percent
Personally Sick 415 10.8%
Vacation or Personal Day 266 6.9%
Caretaking Sick Children 43 1.1%
Caretaking Sick Other 51 1.3%
Home-bound Elderly or Disabled 661 17.2%
Worked at Home for Pay 358 9.3%
Not Scheduled to Work 292 7.6%
Worked Around Home (Not for Pay) 753 19.6%
Out of Area 190 4.9%
No Transportation Available 103 2.7%
Weather 8 .2%
Other (Specify) 662 17.2%
RF 41 1.1%
Total 3843 100.0%
Table I-7: Parking Location (Unweighted)
Parking Location Frequency Percent
At This Destination 33996 98.9%
Off-Site 223 .6%
DK/RF 139 .4%
Total 34358 100.0%
Table I-8: Paid to Park (Unweighted)
Paid to Park Frequency Percent
Yes 1165 3.6%
No 30352 94.5%
DK/RF 585 1.8%
Total 32102 100.0%

PTV NuStats 196 ARC Regional Travel Survey Final Report
Appendix I: Survey Materials
Figure J1: Advance Letter (Non-GPS)

PTV NuStats 197 ARC Regional Travel Survey Final Report
Figure J2: Advance Brochure

PTV NuStats 198 ARC Regional Travel Survey Final Report
Figure J3: Diary Letter (Non-GPS)

PTV NuStats 199 ARC Regional Travel Survey Final Report
Figure J5: Diary

PTV NuStats 200 ARC Regional Travel Survey Final Report

PTV NuStats 201 ARC Regional Travel Survey Final Report
Appendix J: GPS Materials

PTV NuStats 202 ARC Regional Travel Survey Final Report
John Doe 123 Main Street
Atlanta, GA 30308 March 10th, 2011
Thank you for participating in the Regional Travel Survey! The information you provide will help ensure that
future transportation projects reflect what your community needs and that transportation funds are spent wisely.
Remember that we value your input, no matter how much or how little you travel.
4) Thank you for completing the Household Questionnaire in Step 1. Now, it‘s time for Step 2.
5) Record your daily travel information on your assigned day.
First, review the Instructions and Example inside your travel diary.
Next, record your daily travel for 24 hours on Wednesday, March 16.
6) Enclosed are travel diaries for all household members. Each person should carry the travel diary throughout
your travel day to record details for each place they go to and stop they make, whether in town or out of town.
We ask that an adult help anyone under age 16 fill out their travel diary.
Also, use the GPS devices from Wednesday, March 16 to Friday, March 18.
7) Read the enclosed ―GPS Device Instructions for Use‖ and use the devices as instructed and for the specified
time period. Please return the GPS equipment (in the pre-paid FedEx package) immediately after your travel
period. Please hold on to your travel diaries for Step 3.
8)
9) Report your travel information to us in ONE of the following ways:
Online: Go to www.ImproveGeorgiaTravel.com, click ―Report Travel‖ and enter PIN# 1234567ZE Each
person should enter their own travel information. An adult can enter travel information for anyone under age
16.
Mail: Use the enclosed postage-paid envelope to return your completed travel diaries. If you choose this
option, we may need to call you to clarify or collect any missing information.
Phone: PTV NuStats will call after your travel day to collect your household‘s travel information.
Or, call toll-free 1-888-222-7734 to provide the information at your convenience.
Don’t forget! Once we have collected and confirmed travel information for all household
members, we will send your $25 check for participating in the survey within 8–10 weeks.
The survey is being conducted for the Georgia Department of Transportation and the Atlanta Regional Commission by PTV
NuStats, a professional survey company. All information collected will be held strictly confidential and used only in
combination with information provided from other participating households.
If you have questions about the survey or how to participate, visit www.ImproveGeorgiaTravel.com, or call our toll-
free survey hotline at 1-888-222-7734 (10am–9pm EST weekdays and 11am–6pm EST weekends).
Thank you again for providing the details that will help improve transportation choices for our region.
Sincerely,
Charles Krautler
Director, Atlanta Regional Commission
GPS Device Instructions for Use (Vehicle)
Travel Diary Date: Wednesday, March 16 GPS Study Dates: Wednesday, March 16, through Tuesday, March 22 (one full week)

PTV NuStats 203 ARC Regional Travel Survey Final Report
Welcome to the GPS component of the Regional Travel Survey, conducted by your regional planning agency. As mentioned when we first contacted you, the GPS portion of this survey will collect additional travel-related details needed for this study. We greatly appreciate your willingness to help us with this component. This package contains one GPS logging device for operating vehicle in your household. The following pictures show the GPS device and a side view showing the power switch in the On position.
GPS Device Assignment
The GPS devices should be provided to each vehicle as shown in the table below. The GPS Unit ID appears on the side of each GPS logger. The name of each vehicle and a unique color have also been placed on each GPS device.
Vehicle Year Make Model GPS Unit ID Color Code
1 1998 SUBARU FORESTER 31680
2 2003 HONDA ODYSSEY 31652 When and How to Install
You should install each GPS device into the vehicle as assigned in the above table. Please do this at the start of your travel diary day.
To install the GPS device, simply plug the power cord provided into your vehicle's power outlet or cigarette lighter socket (a red light should appear on the base that is inserted into the outlet if the connection is secure) and connect the other end of the power cable to the side of the GPS device.
Place the GPS device on your dashboard with the QStarz name facing upward.
The power cable has been provided with a small suction cup mount that you should affix to your windshield. This will keep the GPS device on the dashboard and will prevent it from sliding off.
Once everything is connected properly, please turn on the GPS device if it is not already on. To do this, move the
switch on the side of the device to the On position -- when it is powered on, the yellow lines on the switch and base of the device should appear as a continuous line (see image above). At least one of the lights on the top of the unit (near the red button) should be illuminated.
A power splitter has been provided in case you need to use your power outlet to power other devices (such as your phone or iPod) during your travel week. If you use it, please make sure all connections are secure and that the red power light at the base of the power cord is illuminated.
It is very important that you confirm that the GPS device is powered on and that the power cable is securely connected throughout your assigned travel week.
If you have any questions regarding the GPS equipment, please call GeoStats toll-free at 1-866-436-7828 between 8:30 AM and 5:30 PM (ET).
GeoStats is our contractor for the GPS component of the Regional Travel Survey.
PLEASE RETURN THIS PAGE WITH YOUR EQUIPMENT
GPS Device Return Instructions Please return the GPS devices, along with this page, immediately after your participation is complete.
As soon as possible after Tuesday December 7, collect all GPS devices, cables, and AC adapters provided for your household, place them in the packaging material and box in which they arrived, and place the box inside the pre-paid FedEx Pak (and seal the Pak). You may drop the FedEx package at any FedEx store/drop box, or you can call 1-800-GoFedEx for a pick-up at your home. Please DO NOT RETURN your travel diaries with your GPS equipment. You will need the diaries to report your travel by phone, or by mail (using the return envelope provided). Please complete this table and return this page with your equipment in the box and FedEx Pak provided.
Vehicle
Year
Make
Model
Used Equipment
(Yes/No)
1 1998 SUBARU FORESTER
2 2003 HONDA ODYSSEY

PTV NuStats 204 ARC Regional Travel Survey Final Report
Please provide any additional comments here: Return Checklist
All GPS Devices, power cables, and AC adapters
Packing materials / Original Box
This page
Remember, in order to receive your participation award, you must:
Use the enclosed travel diaries
Report your travel details by phone or mail
Use the enclosed GPS devices
Return GPS devices via FedEx.
As explained above, to return the equipment, place the box with the equipment inside the pre-paid FedEx Pak (and seal the Pak). You may drop the FedEx package at any FedEx store/drop box, or you can call 1-800-GoFedEx for a pick-up at your home.
Thanks for your participation! GPS Device Instructions for Use (Page 1, Wearable)
Travel Diary Date: Wednesday, March 16 GPS Study Dates: Wednesday, March 16, through Friday, March 18 (three complete days)
Welcome to the GPS component of the Front Range Travel Counts Study, conducted by your regional planning agency. As mentioned when we first contacted you, the GPS portion of this survey will collect additional travel-related details needed for this study. We greatly appreciate your willingness to help us with this component. This package contains one GPS logging device for each person of age 16 or older in your household. The following pictures show the GPS device and how it can be worn.
GPS Device Assignment
The GPS devices should be provided to each person as shown in the table below. The GPS Unit ID appears on the back of each GPS logger. The name of each person and a unique color have also been placed on each GPS device.
Person Name Age GPS Unit ID Color Code
1 JOHN 35 32981
2 JANE 34 33011
When and How to Wear
You should wear the GPS device whenever you travel outside of your home starting on your assigned travel date (this is also the day that you are recording your travel in the travel diary) and continuing through the four days of your GPS study period.
When walking, biking or riding public transportation, you should wear the GPS device on your waist or clipped to your bag or purse. If you are riding inside a vehicle such as a car or truck, you can continue to wear the GPS device on your waist or place your bag or purse on the seat.
Charge the GPS Device Battery Daily or Nightly, Including the Day or Night before your Travel Diary Date
Charge the device. Plug one end of the enclosed cable (the end with the larger connector) into the cable on the side
of the GPS device. Connect the opposite end of the cable into the wall plug adaptor and plug the adapter into the wall. If the connection is right, the bottom light on the GPS device will light up in amber/yellow indicating that it is charging.
Confirm device is ready for use. Unplug the GPS device in the morning and make sure the green light (the top light
nearest the large silver power button) is illuminated. If it is not, press the power button for four to five seconds until all lights appear. If they do not appear, please try again by first releasing and then pressing and holding the power button for four to five seconds until all lights appear. Once all lights appear, you can release the button. The green
GPS device
clipped to Belt
on Waist

PTV NuStats 205 ARC Regional Travel Survey Final Report
and red lights should remain illuminated, meaning the device is ready to collect data. The green light will flash when data is being collected. The mode switch on the side of the device is not used and can be set to a, b or c.

PTV NuStats 206 ARC Regional Travel Survey Final Report
March 16, 2011
Jane Smith
123 West Main Street
Atlanta, GA 30308
Dear Jane Smith,
Thank you for your participation in the GPS portion of the Regional Travel Survey
conducted on behalf of the Atlanta Regional Commission (ARC).
Our records indicate that we have not received your GPS device(s) and we need your
help to get the unit(s) back. Please return the equipment in the box in which it was
sent, using the pre-paid FedEx envelope provided in the box. If you need a replacement
envelope, please give us a call at 1-866-GeoStats (1-866-436-7828) so we can arrange to
have one sent to you. If you have already returned the GPS device(s), we would greatly
appreciate your calling us anyway to let us know.
Thanks again for your participation. We hope you will consider being a part of future
ARC studies.
Sincerely,
Jean Wolf
President
GeoStats
HHID: 1000000
March 16, 2011
John Doe
123 Main Street
Atlanta, GA 30308

PTV NuStats 207 ARC Regional Travel Survey Final Report
Dear John Doe,
Thank you for your participation in the GPS portion of the Regional Travel Survey
conducted on behalf of the Atlanta Regional Commission (ARC) and the Georgia
Department of Transportation (GDOT). Enclosed is a $50 participation gift for your
assistance with this important study.
Your participation will help us build a more accurate picture of transportation needs,
and enable the Atlanta region to get the most value out of future transportation
investments. We hope you will consider being a part of future ARC/GDOT studies.
Sincerely,
Jean Wolf
President
GeoStats