regression testing challenges and solutions an industry...
TRANSCRIPT

Regression Testing Challenges and Solutions
An Industry-Academia Perspective
Nasir Mehmood Minhas


Blekinge Institute of Technology Licentiate Dissertation Series No 2019:02
Regression Testing Challenges and Solutions
An Industry-Academia Perspective
Nasir Mehmood Minhas
Licentiate Dissertation in Software Engineering
Department of Software EngineeringBlekinge Institute of Technology
SWEDEN

2019 Nasir Mehmood Minhas Department of Software EngineeringPublisher: Blekinge Institute of TechnologySE-371 79 Karlskrona, SwedenPrinted by Exakta Group, Sweden, 2019ISBN: 978-91-7295-365-9ISSN:1650-2140urn:nbn:se:bth-17381

AbstractBackground: Software quality assurance (QA) is an essential activity in the softwaredevelopment life cycle. Among the different QA activities, regression testing is achallenging task for large-scale software development. Regression testing is a well-researched area, and a large number of techniques have been proposed to fulfill theneeds of industry. Despite the extensive research, the adoption of proposed regressiontesting techniques in the industry is limited. Studies show that there is a visible gapbetween research and practice.
Objective: This work aims at reducing the gap between industry and academia inregression testing. To fulfill this aim we have the following objectives: 1) Understand-ing the practitioners’ goals regarding regression testing. 2) Understanding the currentstate of regression testing practice and challenges in the industry. 3) Investigating thetesting research applicable in an industrial context.
Method: We conducted multiple studies using different methods. To explore theindustry perspective on regression testing we used focus group and interview-basedstudies. To explore solutions from the literature, we used the systematic literature re-view and systematic mapping study.
Results: This thesis presents the practitioners’ specific regression testing goals.The identified goals are confidence, controlled fault slippage, effectiveness, efficiency,and customer satisfaction. The challenges identified in the thesis are of two categories,1) management related challenges and 2) technical challenges. Technical challengesrelate to test suite maintenance, test case selection, test case prioritization, evaluationof regression testing. We have mapped 26 empirically evaluated regression testingtechniques to the context, effect, and information taxonomies, and provided a guideto the practitioners regarding the adoption of the techniques in an industrial setting.We have also classified 56 model-based test case generation techniques regarding theirstrengths/limitations, input/intermediate models used, and relevance to the industrialcontext.
Conclusions: The challenges identified in this study are not new for research andpractice. There could be two reasons regarding the presence of recurring challenges:1) regression testing techniques proposed in the literature do not fit the companies’context, 2) or, companies are not aware of the availability of the techniques that couldbe suitable for their context. To support the adoption of existing research on regres-sion testing in industry, we have presented three taxonomies. These taxonomies allow
v

the characterization of regression testing techniques and enable to determine which ofthese techniques might be suitable in a given context. Furthermore, the identificationof information needs for these techniques would be helpful to learn the implicationsregarding the cost of adoption. Regarding the test case generation, we conclude thatcurrent research on interaction model-based test case generation techniques did notillustrate the use of rigorous methodology, and currently, model-based test case gener-ation techniques have low relevance for the industrial problems.
vi

AcknowledgementsFirst of all, i would like to thank my supervisors Prof. Jurgen Borstler and Prof. KaiPetersen for their support, guidance and feedback on my work. I have learned a lotfrom our discussions and their critique on my work. I acknowledge the support ofProf. Claes Wohlin and Dr. Nauman Ali during the earlier phase of my work. I amthankful to the co-authors of my studies and EASE Theme-E team. I am also thankfulto the representatives of the companies who participated in my studies.
I must say thanks to my colleagues at SERL Sweden for providing a healthy andconstructive work environment. In particular, I would like to express my sincere grat-itude to Dr. Muhammad Usman, Dr. Nauman Ghazi, for all the great times we had onand off work.
I am grateful to my parents for their encouragement, love, and sacrifice to supportme in my work. I am also thankful to my wife (Nayla) for her continuous supportthroughout this period. I would not have been able to complete this thesis without thepatience and love of Nayla and our children.
Karlskrona, December 18, 2018
vii

viii
PublicationsPapers included in this thesis:
Chapter 2 (Study 1) Nasir Mehmood Minhas, Kai Petersen, Nauman Bin Ali, andKrzysztof Wnuk. “Regression testing goals – View of practitioners and researchers”,In 24th Asia-Pacific Software Engineering Conference Workshops (APSECW) EAST-17, pp. 25–32. IEEE, 2017.
Chapter 3 (Study 2) Nasir Mehmood Minhas, Kai Petersen, Jurgen Borstler, andKrzysztof Wnuk. “A qualitative study on regression testing practices, challenges, im-provements, and goals”, to be submitted to Information and Software Technology 2018.
Chapter 4 (Study 3) Nauman bin Ali, Emelie Engstrom, Masoumeh Taromirad, Mo-hammad Reza Mousavi, Nasir Mehmood Minhas, Daniel Helgesson, Sebastian Kunze,and Mahsa Varshosaz. “On the search for industry-relevant regression testing re-search”, Empirical Software Engineering (Accepted 2018).
Chapter 5 (Study 4) Nasir Mehmood Minhas, Sohaib Maqsood, Kai Petersen, andAamer Nadeem. “A Systematic Mapping of Test Case Generation Techniques UsingUML Interaction Diagram”, Journal of Software: Evolution and Process (Submitted2018)
Papers that are related to but not included in this thesis
Paper 1. Hasan Javed, Nasir Mehmood Minhas, Ansar Abbas, and Farhad MuhammadRiaz “Model Based Testing for Web Applications: A Literature Survey Presented”,Journal of Software (JSW) 11.4 (2016):347–361.
Paper 2. Asad Masood Qazi, Adnan Rauf, and Nasir Mehmood Minhas “A System-atic Review of Use Cases based Software Testing Techniques”, International Journalof Software Engineering and Its Applications 10.11 (2016):337–360.
Other Papers not included in this thesis
Paper 1. Jefferson Seide Mollri, Nauman bin Ali, Kai Petersen, Nasir Mehmood Min-has, and Panagiota Chatzipetrou “Teaching students critical appraisal of scientific lit-erature using checklists”, In Proceedings of the 3rd European Conference of SoftwareEngineering Education, Pages 08–17, 2018.
ix

Paper 2. Ricardo Britto, Muhammad Usman, and Nasir Mehmood Minhas “A quasi-experiment to evaluate the impact of mental fatigue on study selection process”, InProceedings of the 21st International Conference on Evaluation and Assessment inSoftware Engineering, Pages 264–269, 2017.
Contribution statementNasir Mehmood Minhas is the lead author of studies 1, 2 and 4. He led the design,execution, and reporting of these studies.
In Study 1, the co-authors provided feedback during the planning, execution andreporting stages. In this study, the second and third co-authors also participated in thedata collection phases (i.e. focus group).
In Study 2, the second and the fourth authors participated in the data collectionphases (i.e. interviews). The second author provided his feedback during the dataanalysis and reporting phases. He also reviewed the menu script in two iterations. Thethird author mainly reviewed the menu script he also contributed to the preparationof the menu script. The fourth author reviewed the menu script and provided inputregarding the required updates.
In study 3, the first and second authors conceived, organized, and led the study. Theco-authors mainly contributed to the study execution process. Nasir Mehmood Minhascontributed to the following phases of research: Study design, data collection, dataanalysis, drafting and review of the manuscript, and along with the first two authors heparticipated in the two revisions of the study.
In study 4, the first and second authors are the main contributors to the design ofstudy protocol, selection of primary studies, data analysis, and reporting the results.The third author mainly contributed in review and updates of menu script, he alsoprovided his input during some phases of analysis. Whereas the fourth author reviewedand updated the study protocol, he also reviewed the menu script and provided inputregarding the required updates.
x

Contents
1 Introduction 11.1 Overview . . . . . . . . . . . . . . . . . . . . . . . . . . . . . . . . 11.2 Background . . . . . . . . . . . . . . . . . . . . . . . . . . . . . . . 3
1.2.1 Industry academia collaboration . . . . . . . . . . . . . . . . 31.2.2 Regression testing . . . . . . . . . . . . . . . . . . . . . . . 3
1.3 Research gaps and contributions . . . . . . . . . . . . . . . . . . . . 51.4 Research questions . . . . . . . . . . . . . . . . . . . . . . . . . . . 71.5 Research methods . . . . . . . . . . . . . . . . . . . . . . . . . . . . 8
1.5.1 Case study . . . . . . . . . . . . . . . . . . . . . . . . . . . 91.5.2 Systematic literature review . . . . . . . . . . . . . . . . . . 111.5.3 Systematic mapping study . . . . . . . . . . . . . . . . . . . 11
1.6 Summary of studies included in the thesis . . . . . . . . . . . . . . . 121.6.1 Regression testing goals – view of practitioners and researchers 121.6.2 Regression testing for large-scale embedded software develop-
ment . . . . . . . . . . . . . . . . . . . . . . . . . . . . . . 131.6.3 On the search for industry-relevant regression testing research 141.6.4 A systematic mapping of test case generation techniques using
UML interaction diagram . . . . . . . . . . . . . . . . . . . 141.7 Conclusions and future work . . . . . . . . . . . . . . . . . . . . . . 15
1.7.1 Industry-academia perspective challenges vs. solutions . . . . 161.7.2 Regression test evaluation . . . . . . . . . . . . . . . . . . . 18
1.8 References . . . . . . . . . . . . . . . . . . . . . . . . . . . . . . . . 19
2 Regression Testing goals - view of practitioners and researchers 232.1 Introduction . . . . . . . . . . . . . . . . . . . . . . . . . . . . . . . 232.2 Related Work . . . . . . . . . . . . . . . . . . . . . . . . . . . . . . 242.3 Methodology . . . . . . . . . . . . . . . . . . . . . . . . . . . . . . 25
xi

Contents
2.3.1 Planning the research. . . . . . . . . . . . . . . . . . . . . . 252.3.2 Designing the focus groups. . . . . . . . . . . . . . . . . . . 262.3.3 Conducting the focus group session. . . . . . . . . . . . . . . 262.3.4 Analyzing the data and reporting the results. . . . . . . . . . . 27
2.4 Threats to Validity . . . . . . . . . . . . . . . . . . . . . . . . . . . . 282.5 Results and Analysis . . . . . . . . . . . . . . . . . . . . . . . . . . 29
2.5.1 Defining Regression Testing. . . . . . . . . . . . . . . . . . . 292.5.2 GQM Activity. . . . . . . . . . . . . . . . . . . . . . . . . . 30
2.6 Conclusions . . . . . . . . . . . . . . . . . . . . . . . . . . . . . . . 372.7 References . . . . . . . . . . . . . . . . . . . . . . . . . . . . . . . . 38
3 Regression testing for embedded software development – exploring thestate of practice 413.1 Introduction . . . . . . . . . . . . . . . . . . . . . . . . . . . . . . . 413.2 Related Work . . . . . . . . . . . . . . . . . . . . . . . . . . . . . . 423.3 Methodology . . . . . . . . . . . . . . . . . . . . . . . . . . . . . . 45
3.3.1 Research Questions . . . . . . . . . . . . . . . . . . . . . . . 463.3.2 Case Companies . . . . . . . . . . . . . . . . . . . . . . . . 473.3.3 Data Collection . . . . . . . . . . . . . . . . . . . . . . . . . 493.3.4 Interpreting, Analyzing and Validating Interview Scripts . . . 50
3.4 Threats to Validity . . . . . . . . . . . . . . . . . . . . . . . . . . . . 523.5 Results and Discussion . . . . . . . . . . . . . . . . . . . . . . . . . 53
3.5.1 The practitioners’ Perceptions of Regression Testing (RQ1) . 533.5.2 Regression Testing Practices (RQ2) . . . . . . . . . . . . . . 553.5.3 Suggested Improvements for Regression Testing (RQ3) . . . . 603.5.4 Goals and Criteria for Successful Regression Testing (RQ4) . 62
3.6 Summary and Conclusions . . . . . . . . . . . . . . . . . . . . . . . 633.7 References . . . . . . . . . . . . . . . . . . . . . . . . . . . . . . . . 65
Appendix A Interview guide 69
4 On the search for industry-relevant regression testing research 734.1 Introduction . . . . . . . . . . . . . . . . . . . . . . . . . . . . . . . 734.2 Related work . . . . . . . . . . . . . . . . . . . . . . . . . . . . . . 75
4.2.1 Evaluation of the industry relevance of research . . . . . . . . 754.2.2 Reviews of regression testing research . . . . . . . . . . . . . 76
4.3 Research questions . . . . . . . . . . . . . . . . . . . . . . . . . . . 774.4 Method . . . . . . . . . . . . . . . . . . . . . . . . . . . . . . . . . 78
4.4.1 Practitioners’ involvement . . . . . . . . . . . . . . . . . . . 78
xii

Contents
4.4.2 Need for a literature review . . . . . . . . . . . . . . . . . . 794.4.3 Pilot study . . . . . . . . . . . . . . . . . . . . . . . . . . . 804.4.4 Search strategy . . . . . . . . . . . . . . . . . . . . . . . . . 804.4.5 Selection of papers to include in the review . . . . . . . . . . 824.4.6 Taxonomy extension . . . . . . . . . . . . . . . . . . . . . . 834.4.7 Taxonomy evaluation . . . . . . . . . . . . . . . . . . . . . . 854.4.8 Mapping of techniques to taxonomy . . . . . . . . . . . . . . 85
4.5 Limitations . . . . . . . . . . . . . . . . . . . . . . . . . . . . . . . 854.5.1 Coverage of regression testing techniques: . . . . . . . . . . . 864.5.2 Confidence in taxonomy building process and outcome . . . . 864.5.3 Accuracy of the mapping of techniques and challenges . . . . 86
4.6 RQ1 – Regression testing problem description . . . . . . . . . . . . . 874.6.1 Investigated context factors . . . . . . . . . . . . . . . . . . . 874.6.2 Desired effects . . . . . . . . . . . . . . . . . . . . . . . . . 90
4.7 RQ2 – Regression testing solution description in terms of utilised in-formation sources . . . . . . . . . . . . . . . . . . . . . . . . . . . . 934.7.1 Requirements . . . . . . . . . . . . . . . . . . . . . . . . . . 944.7.2 Design artefacts . . . . . . . . . . . . . . . . . . . . . . . . . 944.7.3 Source code . . . . . . . . . . . . . . . . . . . . . . . . . . . 944.7.4 Intermediate and binary code . . . . . . . . . . . . . . . . . . 954.7.5 Issues . . . . . . . . . . . . . . . . . . . . . . . . . . . . . . 954.7.6 Test cases . . . . . . . . . . . . . . . . . . . . . . . . . . . . 964.7.7 Test executions . . . . . . . . . . . . . . . . . . . . . . . . . 964.7.8 Test reports . . . . . . . . . . . . . . . . . . . . . . . . . . . 96
4.8 RQ3 – Mapping of current research . . . . . . . . . . . . . . . . . . 974.8.1 Addressed context factors . . . . . . . . . . . . . . . . . . . 974.8.2 Desired effects . . . . . . . . . . . . . . . . . . . . . . . . . 974.8.3 Information sources . . . . . . . . . . . . . . . . . . . . . . 97
4.9 Suggestions for practitioners . . . . . . . . . . . . . . . . . . . . . . 994.10 Recommendations for researchers . . . . . . . . . . . . . . . . . . . 1004.11 Conclusion . . . . . . . . . . . . . . . . . . . . . . . . . . . . . . . 1014.12 References . . . . . . . . . . . . . . . . . . . . . . . . . . . . . . . . 103
5 A Systematic mapping of test case generation techniques using UML in-teraction diagram 1115.1 Introduction . . . . . . . . . . . . . . . . . . . . . . . . . . . . . . . 1115.2 Related work . . . . . . . . . . . . . . . . . . . . . . . . . . . . . . 1125.3 Research method . . . . . . . . . . . . . . . . . . . . . . . . . . . . 114
5.3.1 Planning and conduction the mapping . . . . . . . . . . . . . 114
xiii

Contents
5.3.2 Validity threats . . . . . . . . . . . . . . . . . . . . . . . . . 1205.4 Results . . . . . . . . . . . . . . . . . . . . . . . . . . . . . . . . . . 120
5.4.1 RQ1: What are various proposed MBT test case generationapproaches based on UML interaction diagrams? . . . . . . . 121
5.4.2 RQ2: What capabilities and limitations are observed in relationto the approaches? . . . . . . . . . . . . . . . . . . . . . . . 129
5.4.3 RQ3: How strong the evidence with respect to rigor and rel-evance to support the outcome of various test case generationtechniques? . . . . . . . . . . . . . . . . . . . . . . . . . . . 130
5.5 Discussion . . . . . . . . . . . . . . . . . . . . . . . . . . . . . . . . 1325.5.1 Analysis of research questions . . . . . . . . . . . . . . . . . 132
5.6 Conclusion . . . . . . . . . . . . . . . . . . . . . . . . . . . . . . . 1365.7 References . . . . . . . . . . . . . . . . . . . . . . . . . . . . . . . . 137
Appendix B Treatment of databases 143
Appendix C Publication Venues 145
xiv
List of Figures
1.1 Thesis overview: Research questions, chapters, and contributionsRT: Regression testing, TCS: Test case selection, TCP: Test case prior-itization . . . . . . . . . . . . . . . . . . . . . . . . . . . . . . . . . 9
2.1 GQM Representation . . . . . . . . . . . . . . . . . . . . . . . . . . 312.2 Goal-Question-Measure Mapping . . . . . . . . . . . . . . . . . . . 35
3.1 Mind-map used for data management and classification. . . . . . . . . 503.2 Relationship between RT challenges. . . . . . . . . . . . . . . . . . . 58
4.1 A description of the flow of activities including alternately review-ing the literature and interacting with practitioners from the researchproject EASE. . . . . . . . . . . . . . . . . . . . . . . . . . . . . . . 79
5.1 Publishing Venues of Primary Studies . . . . . . . . . . . . . . . . . 1215.2 Year and Venue Wise Distribution of Primary Studies . . . . . . . . . 1225.3 Distribution of studies according to input model used . . . . . . . . . 1225.4 Distribution of studies according to testing types covered . . . . . . . 1235.5 Solutions using sequence diagram (SD) as input . . . . . . . . . . . . 1255.6 Solutions using collaboration diagram (CD) as input . . . . . . . . . . 1275.7 Solutions using interaction diagram and some other UML diagram (H)
as input . . . . . . . . . . . . . . . . . . . . . . . . . . . . . . . . . 1285.8 Sum of Rigor and Relevance Scores (X-Axis) and Year Published (Y-
Axis) . . . . . . . . . . . . . . . . . . . . . . . . . . . . . . . . . . 133
xv

List of Figures
xvi

List of Tables
1.1 Research questions and thesis chapters . . . . . . . . . . . . . . . . . 71.2 Research methods and thesis chapters . . . . . . . . . . . . . . . . . 121.3 Mapping of Regression testing techniques for embedded systems in
taxonomies . . . . . . . . . . . . . . . . . . . . . . . . . . . . . . . 17
2.1 Focus Group Participants . . . . . . . . . . . . . . . . . . . . . . . . 262.2 GQM-Template for Evaluation of Regression Testing . . . . . . . . . 272.3 Defining Regression Testing . . . . . . . . . . . . . . . . . . . . . . 292.4 Regression Testing Goals . . . . . . . . . . . . . . . . . . . . . . . . 322.5 Allocated Priorities to the Goals . . . . . . . . . . . . . . . . . . . . 332.6 G5. Questions (Information Needs) . . . . . . . . . . . . . . . . . . 342.7 Measures . . . . . . . . . . . . . . . . . . . . . . . . . . . . . . . . 352.8 Measures Found in Literature . . . . . . . . . . . . . . . . . . . . . . 37
3.1 Summary of related work. The first column indicates the subsection inSection 3.2 (GTP: General Testing Practices, TMT: Testing Methodsand Tools, AT: Automated Testing, RT: Regression Testing). . . . . . 46
3.2 Literature findings on RT state of practice . . . . . . . . . . . . . . . 473.3 Overview of interviewees. Column Perspective refers to the area/branch
the interviewee is working in. . . . . . . . . . . . . . . . . . . . . . . 483.4 Analysis procedure adopted for step2 and step 3. . . . . . . . . . . . 513.5 The practitioners’ definitions of regression testing, as response to in-
terview question “What is regression testing for you?”. . . . . . . . . 543.6 Regression testing practices. . . . . . . . . . . . . . . . . . . . . . . 553.7 Test selection and prioritization criteria. . . . . . . . . . . . . . . . . 573.8 Information sources utilized for test selection and prioritization. . . . 573.9 Regression testing challenges. . . . . . . . . . . . . . . . . . . . . . 59
xvii

List of Tables
3.10 Identified Improvements. . . . . . . . . . . . . . . . . . . . . . . . . 613.11 Regression testing Success goals. . . . . . . . . . . . . . . . . . . . . 623.12 Regression testing Success criteria. . . . . . . . . . . . . . . . . . . . 63
4.1 Systematic literature studies used as start-set for snowball sampling . 814.2 The list of papers included in this study . . . . . . . . . . . . . . . . 844.3 Data extraction form . . . . . . . . . . . . . . . . . . . . . . . . . . 844.4 A taxonomy of context, effect and information factors addressed in the
included papers and considered relevant by our industry partners . . . 884.5 Mapping of techniques to the taxonomy . . . . . . . . . . . . . . . . 98
5.1 Existing Secondary Studies on MBT . . . . . . . . . . . . . . . . . . 1135.2 Research questions . . . . . . . . . . . . . . . . . . . . . . . . . . . 1145.3 Search terms . . . . . . . . . . . . . . . . . . . . . . . . . . . . . . . 1155.4 Database results . . . . . . . . . . . . . . . . . . . . . . . . . . . . . 1175.5 List of Primary Studies . . . . . . . . . . . . . . . . . . . . . . . . . 1175.6 Overview of Solutions . . . . . . . . . . . . . . . . . . . . . . . . . 1245.7 Capabilities in relation to MBT approaches . . . . . . . . . . . . . . 1305.8 Limitations . . . . . . . . . . . . . . . . . . . . . . . . . . . . . . . 1315.9 Rigor and relevance scores: Sequence Diagrams . . . . . . . . . . . . 1325.10 Rigor and relevance scores: Collaboration Diagrams . . . . . . . . . 1335.11 Rigor and relevance scores: Hybrid . . . . . . . . . . . . . . . . . . . 1345.12 Primary Studies referring to each other . . . . . . . . . . . . . . . . . 135
C.1 Publication types (J = Journal, C = Conference, S = Symposium, W =Workshop) and publication venues of the primary studies . . . . . . . 146
xviii
Chapter 1
Introduction
1.1 Overview
Testing is an essential activity for any software development organization. It ensuresquality and reliability of the developed software by identifying defects. Testing is acomplex and costly task and consumes up to 50% of the total software developmentcost [1, 3, 4, 7]. For large scale system development with continuous integration anddelivery, the most challenging task is regression testing, and a significant share of thetotal testing cost is the cost of regression testing [1, 17, 38]. Regression testing is aretest activity that is performed after changes or between release cycles. The goal is toprovide confidence that changes have not impacted the system negatively [2]. It impliesthat after changes or modifications, by applying regression testing, it can be ensuredthat unchanged parts of the system are working correctly as these were working beforethe change.
Considering the goal of regression testing a straightforward choice is to executeall test cases (retest-all). It is possible to adopt a retest-all policy for smaller projects,where test suites consist of fewer test cases. Contrarily, in the large-scale softwaredevelopment test suites are significantly large [7]. Therefore, running all test cases inlarge-scale software development is often infeasible. The alternative of the retest-allpolicy is selective regression testing (SRT), comprising test suite minimization, testcase prioritization, and test case selection. Various authors proposed techniques insupport of SRT. In a literature survey [2], Yoo and Harman presented 159 studies onthe approaches related to SRT. There is a large body of research on regression testing,but few approaches have been adopted in industry [2, 17]. The main reason for this is
1
Chapter 1. Introduction
the lacking evaluation of the proposed techniques in an industrial context [5]. For theresearchers, the primary challenge is to propose solutions for regression testing on thebasis of actual industrial problems. The primary step in this regard is to understandthe current state of research and practice and identify the issues related to regressiontesting that practitioners are facing.
This work is the result of industry-academia collaboration (IAC), and the aim is toreduce the industry-academia gap regarding regression testing. Together with testingpractitioners from the EASE1 platform, we identified seven (7) software testing chal-lenges in three (3) companies. These companies operate in mobile-communications,surveillance, and embedded software systems. The identified challenges were mainlyrelated to regression testing.
In this regard, we have conducted two qualitative studies to identify the industrygoals and challenges regarding regression testing. The first study is the result of a fo-cus group of practitioners and researchers, and the second study presents the results ofa multi-case study with two large companies. These two studies present the regressiontesting state of practice and goals. To link the findings of these two studies we con-ducted a systematic literature review (SLR) and a systematic mapping study (SMS). Inthe SLR we have synthesized the regression testing techniques, on the basis of threefacets namely context (it refers to the applicability constraints of the technique), effect(it relates to the desired outcomes/improvements achieved by applying the technique),and information (it refers to the utilized information sources (entities) by the tech-niques). The goal was to enable the practitioners to determine which of the regressiontesting techniques could be applicable in a given industrial context and to learn theimplication of the cost of adoption of these techniques. In the SMS we explored theModel based test case generation techniques, goal was to identify such techniques thatcan facilitate the practitioners regarding the test case generation.
The rest of this chapter is organized as follows: Section 1.2 presents a brief descrip-tion of the concepts used in the thesis. Research gaps and contributions of this workare discussed in Section 1.3, whereas Section 1.4 describes the research questions thathave been investigated in this work. The methods used in the studies included in thisthesis are discussed in Section 1.5 and summaries of the included studies are presentedin Section 1.6. Section 1.7 concludes the chapter and discusses future work.
1EASE – the Industrial Excellence Centre for Embedded Applications Software Engineering http://ease.cs.lth.se/about/
2

1.2 BackgroundThis section presents a brief description of the basic concepts that have been used inthis thesis.
1.2.1 Industry academia collaborationIndustry-academia collaboration (IAC) is a widely discussed topic in the software en-gineering community since the early days of software engineering. IAC is crucial forboth communities (academia and industry), as it benefits the industry in terms of im-provements in their methods and it is essential for the researchers to produce industry-relevant research. Success stories regarding IAC in the field of software engineering arelimited [32]. Garousi and Felderer [31] argue, that differences in objectives, less scien-tific value in industry-related problems, and limited applicability of methods proposedin academia are hindrances for industry-academia collaboration. The communicationgap between researchers and practitioners is one of the key challenges that can lowerthe motivation in collaboration. To improve the communication between software test-ing researchers and practitioners, Engstrom et al. [15] proposed a taxonomy (SERPtest). The taxonomy comprises four facets; 1) Intervention (using a technique or aprocess change to improve or access testing), 2) Effect (desired target/outcome of theintervention, i.e. what should be achieved, e.g., improving effectiveness), 3) Scope(where should the intervention be applied? e.g., test planning, test design, test analysis,and/or test execution), and 4) Context (referring to the constraints/factors restrictingthe applicability of an intervention). The taxonomy is useful as a framework for bothdirect communication (industry-academia collaboration) and indirect communication(reporting of research results to the industry).
1.2.2 Regression testingRegression testing is an important testing activity, which is applied to a system un-der test after any change including a defect fix or adding a new feature. The IEEESystems and Software Engineering Vocabulary defines regression testing as: “the se-lective retesting of a system or component to verify that modifications have not causedunintended effects and that the system or component still complies with its specified re-quirements” [6]. Regarding testing levels (i.e. unit, integration, & system), regressiontesting could be performed at all levels of testing. The goals of regression testing areto find defects and to obtain confidence about the quality of the systems under test.
Practitioners prefer to run a selected scope for regression testings, and the primarychallenge for a testing practitioner is to determine the scope of regression testing (i.e.
3

Chapter 1. Introduction
which tests to include in the regression test suite) [1, 7]. Running all tests (retest-all) isa feasible choice for smaller systems. However, in large scale software development,running all tests is not a viable solution, as running all tests will require plenty of timeand might cause a delay of releases. An alternative to a retest-all policy is selectiveregression testing (SRT). SRT refers to running regression testing with a smaller scope,where the key concern in this regard is the size of the test suite [7]. Test case selection,test case prioritization, and test suite minimization are of primary concern in SRT [2, 8].While performing SRT, another relevant aspect is to measure its success, i.e. whetherthe desired goals have been achieved.
Test case selection
Researchers use the terms test case selection or regression test selection interchange-ably. The concept refers to selecting a subset of test cases from existing test suites totest the modified parts of the system under test (SUT). Test case selection techniquesare modification aware, as only those test cases are selected which are relevant to themodified parts of the SUT [2, 24].
Test case prioritization
Test case prioritization refers to the reordering of test cases in an existing test suite, toensure to run the most critical test cases at priority. The goal of test case prioritizationis to maximize the fault detection rate. Test case prioritization does not involve anyprocedure to select a test case; it only reorders the test cases on the basis of somepredefined criteria [2, 37].
Test case minimization
For large-scale systems, test suites can be very large, and grow further when the soft-ware undergoes changes. New test cases can be added for new or updated features.Continuously growing test suites can contain redundant and obsolete test cases. A testcase becomes obsolete, if the requirement associated to it is removed or updated dur-ing the changes in the software. Adding of new test cases can cause some existing testcases to become redundant given that new test cases satisfy the same testing require-ments. Removal of redundant test cases does not effect the testing coverage [40]. Thepresence of redundant and obsolete test cases in a test suite increases the costs for testexecution. Such test cases need to be identified and eliminated. Test case minimiza-tion techniques are meant to reduce the size of the test suites by eliminating redundantand/or obsolete test cases [2, 23].
4

Test case generation
Among the other testing activities, a crucial step is test case generation, which is anintellectually challenging task [22]. Test case generation is the process of creatingnew test cases to build or augment a test suite. Changes in a program can affect itsoverall behavior, and sometimes it is not possible to test the changed behavior withthe existing test cases. Therefore, identifying and adding new test cases to cover themodified behavior of the program after the changes, is a required activity for regressiontesting [33].
1.3 Research gaps and contributions
Regression testing is a well-researched area, however, the adoption of the proposedtechniques in industry is limited. This has two main reasons: 1) lack of empiricalevaluation of the techniques in industry [5] and, 2) the differences in goals betweenresearcher and practitioners [15, 16]. This indicates that there is a gap between researchand practice of regression testing.
The primary objective of this thesis is to reduce the gap between research and prac-tice of regression testing. Its main contribution is a presentation of the current state ofregression testing practice, and a synthesis of the existing research with respect to itsapplicability in industry.
While designing study 1 (Chapter 2), the consideration was to see if there are anydifferences in the goals between researchers and practitioners. Chapter 2 contributes interms of the identification of regression testing goals and measures required to evaluatethe success.
Researchers and practitioners have different perspectives and objectives while ad-dressing the regression testing challenges, which is a hurdle for the utilization of re-gression testing research in industry. The researchers need to work on the regressiontesting challenges that are of actual concern to the practitioners. It is therefore impor-tant to work in close collaboration while identifying the challenges [8, 15]. The focusof Chapter 3 (Study 2) is to identify the challenges, which are critical for the practi-tioners. The contributions of Chapter 3 are the identification of: 1) the current state ofregression testing practice, 2) challenges faced by the practitioners, 3) improvementssuggestions, and 3) regression testing goals and criteria to evaluate the success. An im-portant issue for the adoption of regression testing research in industry is that researchresults are not accessible due to discrepancies in terminology between industry andacademia [5, 39]. Efforts are needed to identify and synthesize the existing researchon regression testing concerning the relevance and applicability in industry. More im-
5
Chapter 1. Introduction
portantly, results are supposed to be presented in terminology that practitioners canunderstand easily. To enable the practitioners to compare the research proposals andaccess their applicability and usefulness for their specific context, Chapter 4 (Study 3)reviews the regression testing techniques from the aspect of industrial relevance. Thecontributions of Chapter 4 are: 1) design of three taxonomies to support the commu-nication of regression testing research with respect to industrial relevance and applica-bility, and 2) a mapping of 26 industrially evaluated regression testing techniques withthe taxonomies.
Test case generation is a challenging task that becomes harder for large and com-plex systems [19, 22]. Traditional code based test case generation methods sufferfrom the problems of scalability and traceability. Better scalability and traceabilityare among the benefits of model-based testing [42]. Model based testing (MBT) pro-vides a systematic mechanism to generate test cases from the design models. Alongwith the systematic procedure of test case generation, MBT can be used for test resultevaluation [25, 26]. The ability to generate test cases systematically and to evaluate thetest results makes MBT a choice for regression testing [41, 42]. One class of modelsthat could be used to generate test cases is UML interaction diagrams.
Researchers have proposed various techniques to generate test cases from UMLinteraction diagrams. Existing literature reviews did not put their primary focus on testcase generation techniques based on interaction models [20, 26], instead authors arefocusing on the overall MBT approaches or domain-specific MBT approaches. Shiroleand Rajeev [21] conducted a survey of test generation techniques based on UML be-havioral models. The survey was conducted in 2013 and covers all behavioural models.Furthermore the authors of the existing reviews did not focus on the industry relevanceof the proposed techniques. A critical review of existing MBT techniques based onUML Interaction diagrams with a focus on industry relevance could be helpful:
1) for the researchers who are intending to propose new approaches using interac-tion diagrams, and
2) for the practitioners who are intending to adopt test case generation techniquesbased on interaction diagrams. Chapter 5 (Study 4) contributes in terms of classifi-cation of test case generation techniques based on interaction diagrams. It comparesthe techniques on the basis of their capabilities and limitations, and it also assesses thestudies for industrial relevance.
The contributions of this thesis can be summarized as follows:
C1. Identification of regression testing goals and measures of success (Chapter 2 &3).
C2. Identification of regression testing challenges and improvements from an indus-
6
try perspective (Chapter 3).
C3. Context specific synthesis of regression testing techniques (Chapter 4).
C4. Classification of test case generation techniques (Chapter 5).
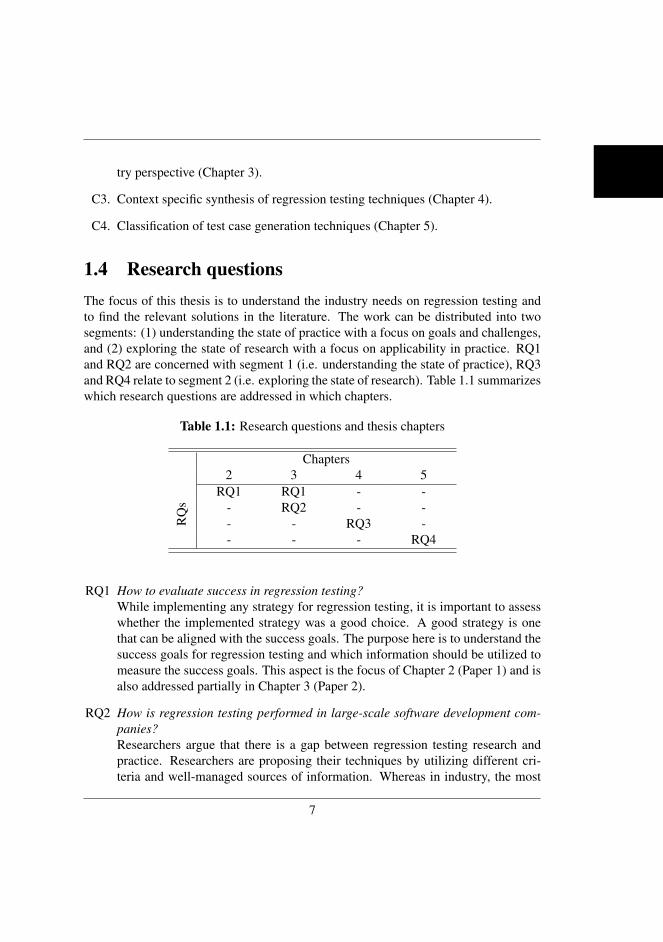
1.4 Research questionsThe focus of this thesis is to understand the industry needs on regression testing andto find the relevant solutions in the literature. The work can be distributed into twosegments: (1) understanding the state of practice with a focus on goals and challenges,and (2) exploring the state of research with a focus on applicability in practice. RQ1and RQ2 are concerned with segment 1 (i.e. understanding the state of practice), RQ3and RQ4 relate to segment 2 (i.e. exploring the state of research). Table 1.1 summarizeswhich research questions are addressed in which chapters.
Table 1.1: Research questions and thesis chapters
Chapters2 3 4 5
RQ
s
RQ1 RQ1 - -- RQ2 - -- - RQ3 -- - - RQ4
RQ1 How to evaluate success in regression testing?While implementing any strategy for regression testing, it is important to assesswhether the implemented strategy was a good choice. A good strategy is onethat can be aligned with the success goals. The purpose here is to understand thesuccess goals for regression testing and which information should be utilized tomeasure the success goals. This aspect is the focus of Chapter 2 (Paper 1) and isalso addressed partially in Chapter 3 (Paper 2).
RQ2 How is regression testing performed in large-scale software development com-panies?Researchers argue that there is a gap between regression testing research andpractice. Researchers are proposing their techniques by utilizing different cri-teria and well-managed sources of information. Whereas in industry, the most
7

Chapter 1. Introduction
crucial criteria is the experience of the practitioners involved, and the best sourceof information is their knowledge about the system under test. The goal here is tounderstand the practices that practitioners utilize during regression testing, howthey select and/or prioritize the tests, what are the challenges that practitionersface while running regression tests, how they address the challenges and howthey measure the success of regression testing. These aspects are the considera-tion of Chapter 3 (Paper 2).
RQ3 How can existing research on regression testing techniques be utilized in prac-tice?There is a large body of research on regression testing, researchers are focusingon mainly three areas: 1) test case selection, 2) test case prioritization, and 3)test suite minimization. There are only few studies that have been empiricallyevaluated on large-scale systems. The purpose of Chapter 4 (Paper 3) is to iden-tify and synthesize the industry relevant research on regression testing to providerecommendations for future research and to provide guidelines for practitionersregarding the choice of regression testing methods.
RQ4 To which extent are model-based test case generation techniques applicable inan industrial context?In software testing, test case creation is a challenging task, and it becomes morechallenging for large-scale projects. Model-based testing (MBT) is one of theparadigms that facilitate a systematic test case generation mechanism. MBT uti-lizes the system models to generate the test cases, mainly behavioral models areused to generate the test cases. Chapter 5 (Paper 4) reviews the MBT techniqueswith the focus of industry relevance. The goal was to identify test case generationtechniques applicable to the industrial context.
1.5 Research methods
This thesis is the outcome of exploratory research and utilizes three research methods,1) case study, 2) systematic literature review, and 3) systematic mapping study. Ta-ble 1.2 summarizes the methods used in different studies (chapters) It also shows theinvolvement of companies in the studies. Figure 1.1 describes an overall view of thethesis regarding a relationship between research questions, thesis chapters, researchmethods, and contributions.
8

C1
C2
C3
C4
Chapter 2 (Study 1)
Focus: RT goals industry-academia perspective
Method used: Focus group
Chapter 3 (Study 2)
Focus: RT practices, challenges and goals -An industry perspective
Method used: Case study
Chapter 4 (Study 3)
Focus:Synthesis of RT research on TCS and TCP
Method used: Systematic literature review
Chapter 5 (Study 4)
Focus: Scoping of model based test casegeneration techniques
Method used: Systematic mapping study
RT goals and measures
RT challenges and improvements in industry perspective
Context specific synthesis of RT techniques
Classification of test case generation techniques
Motivated the investigation of RT practice in industryMotivated the investigation of
industry relevant RT techniques
Motivated the investigation of techniques
on test case generation
C1
RQ1
RQ1 RQ2
RQ3
RQ4
C2
C1 C3
C4
Regression testing challenges and solutions: An industry academia perspective
Figure 1.1: Thesis overview: Research questions, chapters, and contributionsRT: Regression testing, TCS: Test case selection, TCP: Test case prioritization
1.5.1 Case study
To address the first two research questions a focus group based study (Paper 2) and amulti-case study (Paper 3) were conducted.
Case studies enable the researcher to get an in-depth understanding of the phe-nomenon under investigation [10]. A case study could be exploratory, descriptive, orexplanatory [11]. Mostly case studies are based on qualitative data and are meant toprovide a deeper insight into some aspects of the study [10]. Yin [11] argues that a casestudy would be a suitable choice when: 1) research questions are based on how or why,2) the researcher has no or little control over the behavioral events, and 3) the focus ofthe study is on contemporary events.
Regarding the data collection for case studies, Runeson and Host [10] suggest touse multiple sources of data collection for a case study, since it will improve the validityof the results. The data collection methods adopted in the studies of this thesis are focusgroup, interviews, and archival data.
9

Chapter 1. Introduction
Focus group
Focus group is a convenient method for data collection from a group of individualswhen it is required to obtain the viewpoints of participants on a topic of shared interest.It allows people to sit together and have an open discussion about a specified topic.The role of the moderator is crucial for the success of a focus group.
A focus group should be conducted with at least three participants, the suggestedupper limit for a focus group is twelve participants [9]. The data collection for Chapter2 (Paper 1) was done by using focus groups. The first objective of the study was toidentify the goals for the success of regression testing, whereas the second objectivewas to investigate whether there are any disparities of thoughts between researchersand practitioners. Senior researchers and practitioners participated in the study, themethod was adopted mainly because of the second objective.
Interviews
Interviews are vital tools for data collection in software engineering case studies. Theyprovide an opportunity for the researcher to have direct interaction with the subjectsand to get a deeper insight into the phenomenon under study. Interview methods can beclassified into three classes: 1) unstructured, 2) semi-structured, and 3) fully-structured.Conventionally, a semi-structured interview method is used in case studies [10] Insemi-structured interviews, the researcher formulates the interview questions and pre-pares a guide/plan to conduct the interviews. The order of asking questions is flexiblein semi-structured interviews. The purpose is to be able to adjust the order accordingto the expertise/interest of the subject [10]. Interviews were the primary data collectionmethod for Chapter 3 (Paper 2). To conduct the interviews, a semi-structured approachwas adopted. The objective of this study was to understand the current state of regres-sion testing practice.
Archival data
Archival data refers to the procedural documents, historical data/metrics, and docu-mentation related to management activities (e.g., minutes of meetings), etc. [10]. Thistype of data enables the researcher to understand the working environment of the casecompany, their processes, and previous history regarding the execution of the meth-ods. Using archival data, a researcher can validate information obtained by interviews.Archival data was the secondary source of information for Paper 2 (Chapter 3). Theprimary purpose was to validate some of the data points collected through interviews.
10

1.5.2 Systematic literature reviewA systematic literature review (SLR) provides a way to collect the research evidencein a systematic way [12]. This method was adopted in software engineering from themedical research. With the help of this method, a researcher can collect, evaluate andinterpret the available research relevant to a topic or phenomenon. The guidelines forconducting SLRs suggested by Kitchenham [13] propose three phases of a systematicreview: 1) planning the review, 2) conducting the review, and 3) reporting the review.
Planning
The crucial phase in systematic reviews is the planning phase. As a part of planning theresearcher needs to establish the need for a SLR. In the planning phase, the researcherhas to prepare a review protocol which includes research questions, search strategy,criteria for the selection of primary studies, quality assessment criteria, data extraction,and synthesis strategy.
Conducting
After planning the next step is to conduct the review. In this phase, a researcher followsthe strategies defined in the planning phase to execute the review process. This phaseconsists of identification of relevant research from various research databases, selectionof primary studies in the light of inclusion and exclusion criteria, quality assessment ofthe studies, data extraction, and data synthesis.
Reporting
The results collected during the previous phase need to be documented carefully andpublished in the form of a report or a paper.
To investigate RQ3, we conducted a systematic literature review of empiricallyevaluated regression testing techniques. The findings regarding RQ3 are presentedin Chapter 4 (Paper 3). Regarding the study selection process a snowball samplingtechnique was followed [14].
1.5.3 Systematic mapping studySystematic mapping studies provide an overview of a research area. They classify andcount the contribution about the categories of that classification. A systematic mappingstudy provides a systematic way to search the literature and along with the publicationvenues for the area of research. It investigate the topics that have been reported in the
11

Chapter 1. Introduction
literature [34, 35]. Systematic literature reviews and systematic mapping studies sharesome common characteristics, for instance, searching and selecting of studies. Butthere is a visible difference in the goals and thus approaches to data analysis. The focusof a systematic literature review is to synthesize the evidence, and it also considers thestrength of evidence. Whereas, systematic mapping studies are mainly focused on thestructuring of a research area [34].
To investigate RQ4 we conducted a systematic mapping study of UML interactionmodel based test case generation techniques. The findings regarding RQ4 are presentedin Chapter 5 (Paper 4). Regarding the study selection process, a search string baseddatabase search method was adopted [13, 36].
Table 1.2: Research methods and thesis chapters
ChaptersResearch method 2 3 4 5 CompaniesQS (Focus Group) ! - - - Sony & AxisCS (Interviews) - ! - - Sony & AxisSLR (Snowballing) - - ! - Sony & AxisSMS (Database Search) - - - ! None
1.6 Summary of studies included in the thesisEach chapter of this thesis is based on an individual study, which are summarized inthe following subsections.
1.6.1 Regression testing goals – view of practitioners and researchersAs mentioned previously, the aim of the studies included in this thesis is to bridge thegap between industry and academia regarding regression testing. Our first study wasa step forward in the identified direction, with a focus on understanding the regressiontesting goals. The objective of this study was to explore the views of researchers andpractitioners about the goals for regression testing.
To elicit the views of industry and academia testing experts, we conducted a focusgroup based workshop. A total of 7 testing experts participated in the study. Theparticipants were the representatives of two large companies and two universities. Theworkshop was designed according to the GQM philosophy, and it was divided into
12
three stages. We identified a prioritized list regression testing goals, “Confidence”was marked as the highest priority regression testing goal. Other goals identified inthis study are, “High precision”, “Fault slippage to the customer”, “Efficiency”, and“Inclusiveness”. We also identified the information needs to be required to evaluatethe success in regression testing in terms of “Confidence”. Finally, we elicited themeasures corresponding to the identified information needs. We found a certain levelof agreement between the participants regarding the regression testing definitions andgoals. Regarding priorities in regression testing goals, we noticed visible differencesamong the practitioners and researchers. Lesson learned out of this study is, that it istrue that there is a gap between industry and academia. Such an environment whereboth can sit together could be of great value regarding the setting of a shared researchagenda.
1.6.2 Regression testing for large-scale embedded software devel-opment
A majority of the regression testing techniques proposed by the research have not beenadopted in industry. To increase adoption rates, we need to better understand the practi-tioners’ perspectives on regression testing. This study aims at exploring the regressiontesting state of practice in the large-scale embedded software development. The studyhas two objectives, 1) to highlight the potential challenges in practice, and 2) to iden-tify the industry-relevant research areas regarding regression testing. We conducted aqualitative study in two large-scale embedded software development companies, wherewe carried out semi-structured interviews with representatives from five software test-ing teams. We did conduct the detailed review of the process documentation of thecompanies to complement/validate the findings of the interviews.
We found that mostly, the practitioners run regression testing with a selected scope,the selection of scope depends upon the size, complexity, and location of the change.Test cases are prioritized on the basis of risk and critical functionality. The practition-ers rely on their knowledge and experience for the decision making regarding selectionand prioritization of test cases. The companies are using both automated and manualregression testing, and mainly they rely on in-house developed tools for test automa-tion. The challenges identified in the companies are: time to test, information man-agement, test suite maintenance, lack of communication, test selection/prioritization,lack of strategy, lack of assessment, etc. Majority challenges identified in the study aremanagement related, and there is a dependency among the identified challenges. Theproposed improvements are in line with the identified challenges. Regression testinggoals identified in this study are customer satisfaction, critical defect detection, confi-
13

Chapter 1. Introduction
dence, effectiveness, efficiency, and controlled slip through of faults.Considering the current state of practice and identified challenges we conclude that
there is a need to reconsider the regression test strategy in the companies. As a mostof the identified challenges are either management related or have a dependency to teststrategy. We further suggest that researchers need to analyze the industry perspectivewhile proposing new regression testing techniques. The industry-academia collabora-tion projects would be a good platform in this regard.
1.6.3 On the search for industry-relevant regression testing researchRegression testing is a means to assure that a change in the software, or its executionenvironment, does not introduce new defects. It involves the expensive undertakingof re-running test cases. Several techniques have been proposed to reduce the numberof test cases to execute in regression testing, however, there is no research on how toassess industrial relevance and applicability of such techniques. We conducted a sys-tematic literature review with the following two goals: firstly, to enable researchersto design and present regression testing research with a focus on industrial relevanceand applicability and secondly, to facilitate the industrial adoption of such researchby addressing the attributes of concern from the practitioners’ perspective. Using areference-based search approach, we identified 1068 papers on regression testing. Wethen reduced the scope to only include papers with explicit discussions about relevanceand applicability (i.e. mainly studies involving industrial stakeholders). Uniquely inthis literature review, practitioners were consulted at several steps to increase the like-lihood of achieving our aim of identifying factors important for relevance and appli-cability. We have summarized the results of these consultations and an analysis of theliterature in three taxonomies, which capture aspects of industrial-relevance regardingthe regression testing techniques. Based on these taxonomies, we mapped 38 papersreporting the evaluation of 26 regression testing techniques in industrial settings.
1.6.4 A systematic mapping of test case generation techniques us-ing UML interaction diagram
Testing plays a vital role for assuring software quality. Among the activities performedduring testing process, test cases generation is a challenging and labor intensive task.Test case generation techniques based on UML models are getting attention of re-searchers and practitioners.
The aim of this study was to identify and synthesize the selected studies and pro-vide an up to date overview of test case generation techniques based on interaction di-agrams. In this work test case generation techniques were reviewed to compare them,
14

identify their capabilities and limitations, and to assess the reporting quality. We fol-lowed the process of conducting systematic mapping as suggested by Kitchenham andCharters [36], and Petersen et al. [34]. It has been revealed that UML interaction di-agrams based techniques are mainly used for integration testing. The majority of thetechniques are using sequence diagrams as input models, while some are using col-laboration. A notable number of techniques are using interaction diagram along withsome other UML diagram for test case generation. These techniques are mainly focus-ing on interaction, scenario, operational, concurrency, synchronization and deadlockrelated faults. Our study revealed the need for tool support to facilitate the transfer ofsolutions to industry. So far studies did not demonstrate the evaluation of solutions inan industrial context, which is facilitated by tool support.
1.7 Conclusions and future workResearchers argue that there is a gap between industry and academia [15, 31, 32]. Inthis thesis our aim was to understand and reduce the industry-academia gap concerningregression testing. In total, we have conducted four studies. In the first two studies(Chapter 2 and Chapter 3) the aim was to understand the state of regression testingpractice, whereas the objective of the last two studies (Chapter 4 and Chapter 5) wasto explore the literature to identify and classify industry-relevant solutions. From ourcase studies (Chapter 2 and Chapter 3), we learned that, in practice, the primary goalof regression testing is confidence, whereas other important goals are the controlledfault slippage, effectiveness, and efficiency. For the selection, prioritization and otherdecisions related to regression testing, the practitioners rely on their experience andknowledge about the system under test. The companies are using in-house built toolsfor the automation of regression testing. Various challenges have been identified inthis thesis. Excluding some management related challenges, most of the challengeshave already been reported in the literature. The most crucial challenges are lack ofcommunication, the time to test, information management, dealing with obsolete testcases, test case prioritization, and evaluating and improving regression testing. Thepotential areas of improvements identified are i) test suite maintenance, ii) regressiontest optimization (selection, prioritization, and minimization), and iii) mechanism toevaluate success in regression testing.
In the SLR (Chapter 4), we found 26 industrially evaluated regression testing tech-niques proposed to provide solutions for large-scale software development. We havedesigned three taxonomies to capture aspects of industrial-relevance, and to supportthe communication of the identified solutions to the industry. We also mapped theidentified techniques to these taxonomies.
15

Chapter 1. Introduction
The results of the mapping study (Chapter 5) on the test case generation techniquesbased on UML interaction diagrams revealed that a majority of the reviewed techniquescan generate test paths. Only a few techniques generate test data and executable testcases. The reviewed techniques lack in rigor and relevance, and we conclude that thereis a need to evaluate the proposed techniques in an industry context.
From the findings of the current thesis we can infer the following areas for futureresearch:
• Regression test optimization: Efforts are needed to investigate and introducethe techniques on the issues of test case selection, test case prioritization, and testsuite minimization to optimize the regression testing for a given context. Study3 (Chapter 4) is a step forward in this direction.
• Evaluation of regression testing: During our exploratory studies with the test-ing practitioners, we learned that our practitioners don’t follow systematic pro-cedures to evaluate their success of regression testing. They set goals for regres-sion testing success, but not follow up them with actual measurements. There isa need to introduce a mechanism to evaluate the regression testing in the indus-trial context on the basis of defined success goals and measures. The goals andmeasures identified in Study 1 and Study 2 provide a basis for such a mechanism.
• Test suite maintenance: Another issue identified in Study 2 (Chapter 3) is thehandling of obsolete test cases and adding relevant new test cases. There is aneed to introduce methods for identifying obsolete test cases. It is also of criticalimportance to investigate and introduce test case generation techniques. Study4 (Chapter 5) is an effort in this direction, although we could not find suitablesolutions from our selected domain of techniques.
Regression test optimization and evaluation of regression testing would be the mainfocus for our future research. These areas are discussed in more detail in the followingsubsections.
1.7.1 Industry-academia perspective challenges vs. solutionsThe primary focus of this work is to reduce the gap between industry and academia re-garding regression testing. As a first step, we have created three taxonomies (Context,Effect, and Information) to communicate regression testing research to the industry.We also mapped 26 regression testing techniques reported in 38 papers with these tax-onomies. Context taxonomy classifies the techniques according to the domain of ap-plicability (e.g., type of system, size, and complexity). Regarding the type of system,
16

we identified techniques applicable to web-based systems, real-time systems, embed-ded systems, database systems, and component-based systems. Our current contactcompanies are working in the domain of large-scale embedded systems.
From our exploratory studies with the companies, we have learned that key areaswhere the companies are seeking improvements are related to test case selection, pri-oritization, and minimization. In chapter 4, we have identified five studies, which areaddressing the test case selection and prioritization issues for regression testing in em-bedded systems [18, 27–30]. Some common characteristics of these studies are that thesystems under test consist of several million lines of code and development processesare iterative in their nature. Four studies [18, 27, 29, 30] have been carried out in thetelecommunication domain, while the study presented in [28], was conducted in theautomotive domain.
The technique presented in [30] works for test case selection and prioritization,while other mentioned techniques work for test case selection. Test case selection andprioritization are the challenges identified in our multicase study presented in Chapter3. Desired effects addressed in these techniques (effectiveness, efficiency, and im-proved precision) could be mapped to the regression testing goals identified in Chap-ter 2 (Study 1). The detail about the mentioned techniques with respect to three tax-onomies context, effect, and information is presented in Table 1.3.
In our future work, we aim to test implementations of the identified methods inindustry and check if there is a need for improvement to scale the technique(s) for theindustry needs.
SID Scope Context Effect Information[18] Selection Heterogeneous em-
beddedEffectiveness & Ef-ficiency, improvedprecision
Source code & Testreports
[27] Selection Product-line em-bedded
Effectiveness & Effi-ciency
Source code & Is-sues
[28] Selection embedded Effectiveness & Effi-ciency
Design Artifacts
[29] Selection Product-line em-bedded
Test suite reduction, im-proved precision
Source code & Is-sues
[30] Selection/ prioriti-zation
Product-line em-bedded
Effectiveness & Effi-ciency
Test reports
Table 1.3: Mapping of Regression testing techniques for embedded systems in tax-onomies
17

Chapter 1. Introduction
1.7.2 Regression test evaluationThe primary focus of Study 1 and a partial focus of Study 2 was the evaluation ofsuccess in regression testing. For this, we have already identified the success goals andsome factors that have a central position for the successful application of regressiontesting. The primary goal for the testing practitioners is confidence. Further significantsuccess goals are precision, efficiency, effectiveness, no issue leakage/ no fault slippage(Study 1, Study 2). Precision refers to the ability of a technique to exclude test casesrelated to non affected areas. Efficiency means to finish regression testing in a limitedtime and low cost. Effectiveness corresponds to early fault detection and finding ofnew faults. The goal of ‘issue leakage or fault slippage’ means that no issues or faultsshould slip through to customer use. Confidence refers to whether testers are confidentabout the successful completion of regression testing and the achieved quality of thesystem under test. To accomplish the confidence goal it is essential to achieve allother goals, but it is difficult to measure levels of confidence. Rothermel and Harrold[24] proposed an evaluation framework for regression test selection techniques. Thisframework covers two of our identified goals (precision & efficiency). We aim to devisea mechanism to measure the other success goals, considering the underlying successfactors.
18

1.8 References[1] E. Engstrom and P. Runeson, “A qualitative survey of regression testing prac-
tices,” in Proceedings of the International Conference on Product Focused Soft-ware Process Improvement. Springer, 2010, pp. 3–16.
[2] S. Yoo and M. Harman, “Regression testing minimization, selection and priori-tization: a survey,” Software Testing, Verification and Reliability, vol. 22, no. 2,pp. 67–120, 2012.
[3] P. K. Chittimalli and M. J. Harrold, “Recomputing coverage information to assistregression testing,” IEEE Transactions on Software Engineering, vol. 35, no. 4,pp. 452–469, 2009.
[4] S. Banitaan, M. Alenezi, K. Nygard, and K. Magel, “Towards test focus selec-tion for integration testing using method level software metrics,” in Tenth In-ternational Conference on Information Technology: New Generations (ITNG),2013. IEEE, 2013, pp. 343–348.
[5] G. M. Kapfhammer, “Empirically evaluating regression testing techniques:Challenges, solutions, and a potential way forward,” in Proceedings of theFourth International Conference on Software Testing, Verification and Valida-tion Workshops (ICSTW), 2011, pp. 99–102.
[6] I. ISO, “Ieee, systems and software engineering–vocabulary,” ISO/IEC/IEEE24765: 2010 (E)) Piscataway, NJ: IEEE computer society, Tech. Rep., 2010.
[7] P. Ammann and J. Offutt, Introduction to software testing. Cambridge Univer-sity Press, 2016.
[8] X. Lin, “Regression testing in research and practice,” Computer Science andEngineering Department University of Nebraska, Lincoln, pp. 1–402, 2007.
[9] J. Kontio, J. Bragge, and L. Lehtola, “The focus group method as an empiricaltool in software engineering,” in Guide to advanced empirical software engi-neering. Springer, 2008, pp. 93–116.
[10] P. Runeson and M. Host, “Guidelines for conducting and reporting case study re-search in software engineering,” Empirical software engineering, vol. 14, no. 2,p. 131, 2009.
[11] R. K. Yin, “Case study research: Design and methods (applied social researchmethods),” London and Singapore: Sage, 2009.
19

REFERENCES
[12] B. Kitchenham, O. P. Brereton, D. Budgen, M. Turner, J. Bailey, andS. Linkman, “Systematic literature reviews in software engineering–a system-atic literature review,” Information and software technology, vol. 51, no. 1, pp.7–15, 2009.
[13] B. Kitchenham, “Procedures for performing systematic reviews,” Keele, UK,Keele University, vol. 33, no. 2004, pp. 1–26, 2004.
[14] C. Wohlin, “Guidelines for snowballing in systematic literature studies and areplication in software engineering,” in Proceedings of the 18th internationalconference on evaluation and assessment in software engineering. ACM, 2014,p. 38.
[15] E. Engstrom, K. Petersen, N. bin Ali, and E. Bjarnason, “Serp-test: a taxonomyfor supporting industry–academia communication,” Software Quality Journal,pp. 1–37, 2016.
[16] V. Garousi, K. Petersen, and B. Ozkan, “Challenges and best practices inindustry-academia collaborations in software engineering: A systematic litera-ture review,” Information and Software Technology, vol. 79, pp. 106–127, 2016.
[17] R. H. Rosero, O. S. Gomez, and G. Rodrıguez, “15 years of software regressiontesting techniquesa survey,” International Journal of Software Engineering andKnowledge Engineering, vol. 26, no. 05, pp. 675–689, 2016.
[18] E. D. Ekelund and E. Engstrom, “Efficient regression testing based on test his-tory: An industrial evaluation,” in Proceedings of IEEE International Confer-ence on Software Maintenance and Evolution, ICSME, 2015, pp. 449–457.
[19] A. K. Jena, S. K. Swain, and D. P. Mohapatra, “Model based test case genera-tion from uml sequence and interaction overview diagrams,” in ComputationalIntelligence in Data Mining-Volume 2. Springer, 2015, pp. 247–257.
[20] R. Singh, “Test case generation for object-oriented systems: A review,” in FourthInternational Conference onCommunication Systems and Network Technologies(CSNT), 2014. IEEE, 2014, pp. 981–989.
[21] M. Shirole and R. Kumar, “Uml behavioral model based test case generation: asurvey,” ACM SIGSOFT Software Engineering Notes, vol. 38, no. 4, pp. 1–13,2013.
20

[22] P. Samuel, R. Mall, and P. Kanth, “Automatic test case generation from umlcommunication diagrams,” Information and software technology, vol. 49, no. 2,pp. 158–171, 2007.
[23] G. Rothermel, M. J. Harrold, J. Von Ronne, and C. Hong, “Empirical studiesof test-suite reduction,” Software Testing, Verification and Reliability, vol. 12,no. 4, pp. 219–249, 2002.
[24] G. Rothermel and M. J. Harrold, “Analyzing regression test selection tech-niques,” IEEE Transactions on software engineering, vol. 22, no. 8, pp. 529–551, 1996.
[25] I. K. El-Far and J. A. Whittaker, “Model-based software testing,” Encyclopediaof Software Engineering, 2002.
[26] M. Utting, A. Pretschner, and B. Legeard, “A taxonomy of model-based testingapproaches,” Software Testing, Verification and Reliability, vol. 22, no. 5, pp.297–312, 2012.
[27] G. Wikstrand, R. Feldt, J. K. Gorantla, W. Zhe, and C. White, “Dynamic regres-sion test selection based on a file cache an industrial evaluation,” in Proceedingsof the International Conference on Software Testing Verification and Validation,ICST. IEEE, 2009, pp. 299–302.
[28] S. Vost and S. Wagner, “Trace-based test selection to support continuous inte-gration in the automotive industry,” in Proceedings of the International Work-shop on Continuous Software Evolution and Delivery, CSED, 2016, pp. 34–40.
[29] E. Engstrom, P. Runeson, and G. Wikstrand, “An empirical evaluation of re-gression testing based on fix-cache recommendations,” in Proceedings of the3rd International Conference on Software Testing, Verification and Validation,ICST, 2010, pp. 75–78.
[30] E. Engstrom, P. Runeson, and A. Ljung, “Improving regression testing trans-parency and efficiency with history-based prioritization - an industrial casestudy,” in Proceedings of the 4th IEEE International Conference on SoftwareTesting, Verification and Validation, ICST, 2011, pp. 367–376.
[31] V. Garousi and M. Felderer, “Worlds apart: Industrial and academic focus areasin software testing,” IEEE Software, no. 5, pp. 38–45, 2017.
21

REFERENCES
[32] V. Garousi, M. M. Eskandar, and K. Herkiloglu, “Industry–academia collab-orations in software testing: experience and success stories from canada andturkey,” Software Quality Journal, vol. 25, no. 4, pp. 1091–1143, 2017.
[33] R. Santelices, P. K. Chittimalli, T. Apiwattanapong, A. Orso, and M. J. Harrold,“Test-suite augmentation for evolving software,” in Automated Software Engi-neering, 2008. ASE 2008. 23rd IEEE/ACM International Conference on. IEEE,2008, pp. 218–227.
[34] K. Petersen, S. Vakkalanka, and L. Kuzniarz, “Guidelines for conducting sys-tematic mapping studies in software engineering: An update,” Information andSoftware Technology, vol. 64, pp. 1–18, 2015.
[35] K. Petersen, R. Feldt, S. Mujtaba, and M. Mattsson, “Systematic mapping stud-ies in software engineering.” in EASE, vol. 8, 2008, pp. 68–77.
[36] B. Kitchenham and S. Charters, “Guidelines for performing systematic literaturereviews in software engineering,” 2007.
[37] S. Elbaum, A. G. Malishevsky, and G. Rothermel, “Test case prioritization: Afamily of empirical studies,” IEEE transactions on software engineering, vol. 28,no. 2, pp. 159–182, 2002.
[38] A. K. Onoma, W.-T. Tsai, M. Poonawala, and H. Suganuma, “Regression testingin an industrial environment,” Communications of the ACM, vol. 41, no. 5, pp.81–86, 1998.
[39] M. J. Harrold and A. Orso, “Retesting software during development and main-tenance,” in Proceedings of Frontiers of Software Maintenance FoSM. IEEE,2008, pp. 99–108.
[40] M. J. Harrold, R. Gupta, and M. L. Soffa, “A methodology for controlling thesize of a test suite,” ACM Transactions on Software Engineering and Methodol-ogy (TOSEM), vol. 2, no. 3, pp. 270–285, 1993.
[41] K. Prabhakar, A. A. Rao, K. V. G. Rao, S. S. Reddy, and M. Gopichand, “Costeffective model based regression testing,” in Proceedings of the World Congresson Engineering, vol. 1, 2017.
[42] Q.-u.-a. Farooq and M. Riebisch, “Model-based regression testing: Process,challenges and approaches,” IGI Global, pp. 254–297, 2011.
22

Chapter 2
Regression Testing goals - viewof practitioners and researchers
2.1 Introduction
Regression testing is a well-researched area. However, the majority regression testing techniquesproposed by the researchers are not getting the attention of the practitioners [5]. Communica-tion gaps between industry and academia, and disparity in the regression testing goals are themain reasons. Close collaboration can help in bridging the communication gaps and resolvingthe disparities. A close collaboration between industry and academia is important to both sides,and this collaboration should be based on similar views of the studied problems and their im-portance [12]. Setting common goals and achieving a shared understanding is important for suc-cessful industry-academia collaboration. Having consensus on goals for collaborative research isa real challenge [21]. For a successful regression testing, it is essential to be able to manage theconstraints. The key constraint of regression testing is the maintenance of the test suite (addingnew test cases or updating or deleting obsolete test cases) [8, 11]. Test suite maintenance is notan easy task and if not done in a correct manner, utility of the test suite will be decreased andassociated risks will be amplified [10]. To measure the success of regression testing, we needto define the regression testing goals. Chernak [17] emphasizes that test suite evaluation is thebasis for the improvement of the overall testing process.
In earlier work Engstrom et al. [5] investigated regression testing practices and challengesusing the focus group meeting and an online questionnaire with the industry practitioners. Wecomplement these findings by exploring the value for practitioners and researchers alike. Theobjective is to reflect on how to evaluate regression testing. By choosing the right measures for
23

Chapter 2. Regression Testing goals - view of practitioners and researchers
the goals of a successful regression testing. From the EASE 1 platform, together with the testingpractitioners, we identified seven software testing challenges in 3 companies. These companiesoperate in mobile-communications, surveillance, and embedded software systems. To identifythe testing challenges at the companies, we utilized the SERP-test taxonomy. The SERP-testis designed to support the industry-academia collaboration [6]. The identified challenges wererelated to test planning, test design, and test execution. Out of these challenges, three wererelated to regression test selection, regression test prioritization, and test suite minimization.With the consultation of companies' representatives, we find that companies were more interestedto cope with the regression testing challenges. This study is a step forward in the identifieddirection, with a focus on understanding the regression testing goals. The broad objective of thestudy is to obtain the answer to the following question:
RQ : What are the views of academics and practitioners about regression testing?
The study aims at exploring the views of academics and practitioners about the goals ofregression testing. The purpose is to investigate the commonalities and differences in their view-points and defining some common goals for the success of regression testing. We conducteda focus group study with industry and academic participants. Seven experts participated in thestudy. Among the participants, 4 were representatives of testing practitioners from 2 large com-panies, and 3 were senior researchers from 2 universities. The contributions of this study couldbe listed as, a) regression testing definition, b) success goals, c) information needed (questions)to evaluate the success and d) measures to answer the questions.
The reminder of this paper is structured as follows: Section 2.2 presents the related work,Section 2.3 presents the detail about the methodology (i.e. planning, design, and conduct of thefocus group). Threats to validity have been discussed in Section 2.4. Study results have beendiscussed in Section 2.5, and conclusions on key findings have been presented in Section 2.6.
2.2 Related WorkResearchers believe that industry-academia collaboration in software engineering is very low [19–21]. Garousi et al. [19] emphasize the importance of collaboration between industry and academiato support improvement and innovation in the industry. Ramler et al. [18], suggest the collab-oration between industry and academia for the improvement and innovation of software testingin the industry. This collaboration could be the basis for transferable and empirically evalu-ated results. To facilitate the collaboration between industry and academia, Engstrom et al. [26]proposed a taxonomy of testing. The taxonomy can assist to improve communication betweenpractitioners and researchers. It can work for both types of communication (i.e. direct commu-nication and indirect communication).
1EASE- the Industrial Excellence Centre for Embedded Applications Software Engineering http://ease.cs.lth.se/about/
24

Kapfhammer [7] pointed out the limited adoption of regression testing techniques, the reasonidentified is the lack of empirical evaluations. Chernak [17] stresses the importance of test suiteevaluation as a basis for improving the test process. Chernak emphasizes that objective measuresshould be defined and built into the testing process to improve the overall quality of testing.Rothermel & Harrold [1, 2], proposed a 5 step framework to evaluate the regression testingtechniques.
Engstrom et al. [6] suggested that more empirical evaluations conducted in industrial settingsare required to facilitate the adoption of RT research in practice. The authors concluded that inorder to enable practitioners to utilize the outcomes of research on testing, these outcomes mustbe evaluated in the actual environment. Through a focus group and an online questionnaire,Engstrom & Runeson [5] conducted a survey on regression testing practices, authors investigatedwhat is considered regression testing by practitioners i.e. the definition, purpose and scope ofit. They further investigated the challenges practitioners face with respect to regression testing.Our work complements the results of [5], as our subjects are the representatives of both sides(i.e. industry and academia). It is comparatively more focused, as purpose was to identify theregression testing goals.
We conducted an exploratory study to systematically elicit the goals, information needs andmeasures. We are focusing on industry-academia collaboration within regression testing chal-lenges. The current focus is on regression test suite evaluation, as the first step in this study wetried to establish the regression testing goals.
2.3 Methodology
Focus groups are used to acquire the viewpoints of a group on some defined topic, which is acommon area of interest for all group members. The key role in the focus groups is the moderator,who is responsible for guiding, facilitating and making sure that the discussion stays focused.Different guidelines are available for focus groups, Kontio et al. [4], [3] have deduced softwareengineering specific guidelines for conducting focus groups. Our approach to conducting thefocus group was aligned with [4], a brief description about each step is given in the followingsub sections.
2.3.1 Planning the research.
It is essential to make sure, that the focus group is suitable for the planned work [4]. Consider-ing the research question presented in Section 3.1, our intention was to know the viewpoints ofacademics and practitioners about regression testing. Focus group was selected as it facilitatesdiscussion, immediate reflection and it helps find the depth of the problem and some potentialideas for future research. As part of planning, we acquired the informed consent of the partici-pants. We did also inform all participants about the purpose of the activity.
25

Chapter 2. Regression Testing goals - view of practitioners and researchers
2.3.2 Designing the focus groups.Focus group can comprise 3 to 12 participants, but a suitable number is between 4 and 8 [4]. Weinvited 7 participants from 2 Sweden based companies and 2 Swedish universities. Among theinvited participants, 4 were testing practitioners from the companies (2 from each). 3 participantswere senior academics from 2 universities. It is important to mention that all 3 academics areactively involved in software testing research. A brief description of the participants is shown inTable 2.1.
We followed the GQM approach for the focus group. GQM is an established method forplanning and executing software engineering research and capturing software engineering relatedphenomena [25]. We phrased the questions using the interview guide formulated by Petersen etal. [9]. Table 2.2 shows the GQM template for the evaluation of regression testing, the template isdivided into 5 activities (i.e. A1. A2, A3, A4, & A5). The purpose of A1 and A2 was to identifyand prioritize the regression testing goals respectively, whereas A3 was to elicit the informationneeds (questions) corresponding to the identified goals. A4 was to capture the measures thatcould be used to answer the questions of related goal(s), while the objective of A5 was to knowabout the measures that the industry experts are actually using for the evaluation of test suites.
Table 2.1: Focus Group Participants
P.Id. Organization Participant’s Expertise
P1. Sony Mobile Communications Testing/ DevelopmentP2. Sony Mobile Communications Testing/DevelopmentP3. Axis Communications Testing/DevelopmentP4. Axis Communications TestingP5. Blekinge Institute of Techology SE & Testing ResearchP6. Lund University RE & Testing ResearchP7. Lund University Regression Testing Research
2.3.3 Conducting the focus group session.A focus group may last for 2 to 3 hours and it should have a predefined schedule. Withinone session, the number of issues to be focused should be limited so that participants can havesufficient time to give their opinion on every aspect of the topic [4]. We allocated 2 hours for theactivity, 30 minutes were assigned for setting up the focus group environment and introducingthe basic purpose to the participants, although the overall objective was already communicated.We used the following schedule in the focus group:
1. Introduction: Short introduction to the goals of the workshop.
2. Round-the-table: What is regression testing in your view? Describe in one to 2 sentences.
3. Summarizing, presenting and verifying.
4. GQM-Activity (Table 2.2).
26

Table 2.2: GQM-Template for Evaluation of Regression Testing
Activity Question Rational
A1 Regression Testing is successful when a), b), c)...Complete the sentence (e.g. Regression testing issuccessful if it is a) efficient.)
Capture the goals
A2 Which success factors/goals are most important toyou? Prioritize.
Prioritize success factors and goals andhence determine which measures shouldreally be collected and whether thismatches to what is collected today.
A3 What information is needed to evaluate success?Formulate as a question (e.g. How complex are ourtest cases, How many test cases are we running ina given test period?)
Capture the information needs (ques-tions)
A4 What measures do we need to collect to answer thequestions? (e.g. #test-steps for complexity)
Capture the measures that allow to quan-tify (and hence automate) the analysis ofresults
A5 What are you collecting today (measurements) ofwhat has been identified in #4
Learn about input we already have avail-able for evaluating test suites
5. Summarizing, presenting and verifying (after every GQM, i.e. A1....A5).
6. Closing (Any other reflection or discussion points? Next steps).
We used color stickers (green and yellow) for data collection, green stickers were used by thepractitioners and yellow stickers were used by the researchers. Discussion points were recordedby 2 of the authors. We took several breaks in between to collect the answers (to gather the stickynotes), cluster similar answers, put logical labels on clusters. Reflect on the names of the clustersand also whether individual sticky notes belong in it. Finally, we presented the initial results andasked the participants to verify the labels according to their given options.
2.3.4 Analyzing the data and reporting the results.We followed the inductive approach for data analysis. It is a systematic approach for analyzingqualitative data [22, 23].
According to Thomas [22],“inductive analysis refers to approaches that primarily use de-tailed readings of raw data to derive concepts, themes, or a model through interpretations madefrom the raw data by an evaluator or researcher”.
The inductive approach allows the findings to emerge from the raw data without imposingany restrictions, the approach revolves around 3 steps: 1) data reduction, 2) data visualizationand 3) conclusions and verifications .
We collected the sticky notes from the participants and made the groups of the responsesalong with the labels (reduction). We displayed the results to the participants and asked them
27

Chapter 2. Regression Testing goals - view of practitioners and researchers
to verify the labels with reference to their options. For example, we received the 43 optionsfor regression testing goals, we reduced the options to 10 by making the clusters of the optionson the basis of similarities. After the clustering of the data, results were displayed and theparticipants were invited to verify the labels according to their given options. In the secondphase, together with the authors, results were reviewed by all participants in a separate reviewmeeting, resultantly identified anomalies were fixed in the results.
The inductive approach provided us with the required flexibility to understand the viewpointsof the experts. The outcomes of focus group study are presented in Section 2.5.
2.4 Threats to Validity
This study presents the viewpoints of academics and practitioners about the goals, informationneeds and measures of regression testing. The results presented here are of an exploratory nature.We addressed the threats to validity according to guidelines of Runeson and Host [24].
Construct Validity: This aspect of validity is regarding the underlying operational measures,concepts and terms of the study. One potential threat to construct validity for our study is the sub-jects of the study representing 2 different working environments (i.e. academics and industry).Potentially they can have different understanding of concepts and terms. To mitigate the threatsto this aspect of validity, we started with the exploration of the perception of participants aboutregression testing. To ensure the common understanding about the concept and terms during theentire focus group meeting.
Internal Validity: This aspect of validity threat is important if causal relations are examined.Generally, we can state that studying causal relationships was not in the scope of this study. Itis a descriptive/interpretive study, as it presents the viewpoints of the participants. We created amapping between information needs and measures, that is the only causal relationship presentedin the study. The mapping created between information needs and measures requires empiricalevaluation to determine the validity of relationships between information needs and measures.
External Validity: This aspect of the validity refers to the generalization of findings. We se-lected subjects of the study from academics and industry, to ensure the acceptability of results forboth communities (i.e. practitioners and researchers). But as the practitioners were representingonly 2 companies, so acceptability of results cannot be ensured in all companies working in thefield of telecommunication. Further analytical generalization of results is possible, to supportthis we have reported the information of the participants in Table 2.1.
Reliability: To ensure the reliability of the study, we triangulated the results, as we presentedand verified the initial results to the participants during the focus group meeting. Later after thecomplete analysis, results were presented to all participants in a review meeting. For detailplease refer to the Section 2.3.4. Goals and measures identified in this study have not beenverified through actual implementations.
28

2.5 Results and Analysis2.5.1 Defining Regression Testing.As a kick-off activity, we asked the experts to give their opinion about, [What is regression testing in your view?].The purpose was to elicit the definition of regression testing with respect to participants’ percep-tion/experience. 5 out of 7 people came up with their definitions, presented in Table 2.3. Herean interesting fact that can be drawn from the individual definitions is the agreement betweenthe views of academics and practitioners. We find that, the definitions presented at S.No. 1, 2and 5 are almost the same and could be grouped together. Similarly, definitions at 3 and 4 are onsame lines and we can group these 2 as well. After collecting the 5 definitions, we presented thedefinitions to the participants. Participants were agreed with our grouping scheme i.e. to group1,2, & 5 and 3 & 4 in the form of the following 2 definitions:
1. Regression testing is an activity which gives us confidence in what we have done and atrust that we have not broken anything.
2. Regression testing is an activity which makes sure that everything is working correctlyafter the changes in the system and it is a guarantee to continue in future.
Table 2.3: Defining Regression Testing
S.No. Perspective Definition
1. Academic Make sure that we have not broken anything.2. Academic Trust on what you have done3. Industry To make sure that everything else work correctly4. Industry To make future work possible, it is a guarantee to continue in future5. Industry Trust on what you have done and make sure that we have not broken anything
Regression Testing Definitions Presented in the Literature
We selected 3 definitions from the literature to compare with the definitions presented by ourexperts. First definition was selected from a study presented by Engstrom and Runeson [5].We selected this definition as it represents the practitioners' perspective and it could be regardedcloser to our concept. Second and third are the standard definitions taken from IEEE softwareEngineering terminology [13], and IEEE, Systems and software engineering – vocabulary [14]respectively.
1. “Regression testing involves repetitive tests and aims to verify that previously workingsoftware still works after changes to other parts. Regression testing shall ensure that
29

Chapter 2. Regression Testing goals - view of practitioners and researchers
nothing has been affected or destroyed” [5].
2. “Regression testing is defined as retesting a system or component to confirm that changescannot introduce any new bugs or causes other code errors, and the system or componentcan still follow the prescribed requirement specification” [13].
3. “Regression testing is the selective retesting of a system or component to verify that mod-ifications have not caused unintended effects and that the system or component still com-plies with its specified requirements” [14].
We observed that the definitions finalized in our study are closer to the definition presentedby Engstrom and Runeson [5]. The distinctive factor of the definition proposed in our study isthat it presents the viewpoints of both practitioners and researchers, while Engstrom’s definitionpresents the viewpoints of practitioners only. On the other hand IEEE standard definitions isabout that after the modification modified system or component still conforms to the specifiedrequirements. That is system or component still works correctly after the changes. Our seconddefinition conforms with the standard definitions. If we look at the individuals’ definitions pre-sented in Table 2.3 3 words (make sure, guarantee, and trust) are prominent. This indicates thatthrough regression testing our experts are seeking some assurance about the system’s correct-ness, a guarantee that future work is possible and a trust on what they have done. Moreover,the results indicate that practitioners and researchers have similar viewpoints on the definition ofregression testing that addresses one of the challenges highlighted in Section 2.2.
Regression Testing Definition Adopted
During the second phase of the study (i.e. presentation of results and obtaining feedback fromthe participants), it was decided to adopt a single definition for the study. The agreed uponopinion was to merge the two definitions into a single definition in a way that it should representthe viewpoint of all participants. Later on, we combined the both definitions and created thefollowing definition:
Regression testing is an activity which makes sure that everything is working correctlyafter the changes to the system. It builds the trust, that nothing has broken in the systemand it guarantees to continue work in the future.
2.5.2 GQM Activity.To execute the GQM (Goal, Question, Metric) theme, we used the GQM template, the templateof questions used here are the inspiration from [9]. We divided this activity as A1, A2, ...,A5 as listed in Table 2.2. The purpose of A1 was to elicit the goals and A2 was to prioritizethe goals. A3 was for the elicitation of information needs (questions) to achieve the regressiontesting goals. With the A4 we intended to collect measures for answering the questions related
30

Goal:A1+A2
Question: A3
Measure:A4+A5
Figure 2.1: GQM Representation
to information needs. Finally, with the A5 intention was to know about the measures that arecurrently used by the practitioners. The concept followed in the study is represented in Figure 1.
A1–Goals Identification
To identify the goals, participants were asked to complete the following sentence, [RegressionTesting is successful when a), b), c) ?]. Here a), b), c) indicate that the participants can statemore than one goal regarding the success of regression testing. A total of 43 different optionsfor goals were identified by the experts, we find that majority of the options were similar. Forexample we had the following options for G1 (Fault slippage to the customer):
1. No fault slippage through.
2. The customer/user finds no further bugs/flaws.
3. No issue leakage.
4. Ensure that the system fulfills the desired properties and no stopping bug slipped away.
5. We have no issue leakage on release.
With the consent of participants, we decided to group the identified goals on the basis of simi-larities and assign an appropriate label for each group. Hence the identified goals were restrictedinto 10 regression testing goals. The final list of the goals along with the description about eachgoal is shown in Table 2.4.
There are some goals identified by the participants, which are either irrelevant or too genericin scope. For example, visual overview could be taken as irrelevant or too broad in scope. Sim-ilarly, automation could be subsumed in efficiency. Achieving desired pass fail rate has beenhighlighted by 4 participants, if we see the goal description it can be subsumed by the effective-ness goal. It is important to highlight that visual overview and automation were identified byonly one participant.
31

Chapter 2. Regression Testing goals - view of practitioners and researchers
Table 2.4: Regression Testing Goals
G.Id. Options Goal Goal description
G1. 5 Fault slippage to customer The customer/user finds no further bugs/flaws
G2. 3 High precision Non affected test cases excluded
G3. 3 Inclusiveness Have run the most effective tests first
G4. 5 Achieved desired coverage All desired modules have been executed when a re-gression test suite runs
G5. 7 Confidence Stakeholders are confident with the reached qualityand/or We can ensure that nothing is broken
G6. 7 Efficiency Finished retesting with the limited time and lowcost
G7. 7 Effectiveness Costly faults detected early and/or finding new de-fects in old code
G8. 1 Visual overview Visualization of complete software is displayed
G9. 1 Automation Being able to automate
G10. 4 Achieving desired pass fail rate When the expected tests pass and/or fail
Confidence, Efficiency, and Effectiveness are the goals identified by the majority of partici-pants. Here it is important to mention that a goal identified by more participants does not refer toits importance, rather it only shows how may subjects have pointed out a particular goal. G5 (i.e.confidence) was identified by all 7 participants, but with varying descriptions. For example, someof the perceptions can be summarized as, ”Stakeholders are confident with the reached qualityand/or we can ensure that nothing is broken.” To measure the desired quality or to determinethat nothing is broken, requires multiple testing metrics.
A2–Goals Prioritization
Next task was to assign the priority order to the elicited goals. The question asked to the partici-pants was, [Which success factors/goals are most important to you? Prioritize]. The participantswere asked to assign priorities against every goal, each participant was given 10 points to pri-oritize. We used colored markers for priority assignment, red for researchers and Black forpractitioners. As the distribution of experts was not equal on both sides (i.e. 3 researchers and 4practitioners), we decided to normalize the priority of both sides. For normalization we devisedan equation presented at (2.1).
NP = AP/N ∗4 (2.1)
Here NP = Normalized Priority, AP = Actual Priority and N = No. of Experts.
32

Table 2.5: Allocated Priorities to the Goals
G. Id A Priority I Priority Total Priority
G1. 9 5 14G2. 8 9 17G3. 4 3 7G4. 3 0 3G5. 9 12 21G6. 7 3 10G7. 0 0 0G8. 0 5 5G9. 0 3 3G10. 0 0 0
The normalized priorities along with the total points are shown in Table 2.5. G5 (i.e. Con-fidence) was marked with 21 total points, G2 (i.e. High precision) was given 17 points whileG1 (i.e. Fault slippage to customer) was third in the list with 14 points. It was observed that inmost cases there was a sort of agreement between researchers and practitioners. But there wasa complete disagreement regarding the priority of some goals. We can see that for researchersG1 & G5 are the highest priority goals with equal priority, whereas for Practitioners G5 is thehighest priority. Similarly, G8 and G9 are somewhat important for practitioners but researchersassigned zero to both the goals. An interesting fact, that we think is important to mention hereis that the participants on both sides marked zero priority for G7 (i.e. effectiveness). Althoughthis goal was identified by all 7 participants. And it is among the goals which have been cited inthe literature by different authors [16, 17]. We found similarity in views of both sides, regardingthe top 3 goals (i.e G5, G2, & G1 respectively). As G5 (Confidence) was ranked as the highestpriority goal by the participants, and considering its generic nature we decided to elicit the in-formation needs for G5, in the next phase of the focus group (i.e. A3). During the final reviewmeeting participants were agreed to consider G1, G2, G3, G5, & G6 as the final list of goals.
A3–Questions (Information Needs Elicitation)
To elicit questions (information needs), participants were asked to answer the question, [Whatinformation is needed to evaluate the success?]. We decided to elicit information needs only forG5 (i.e. confidence), we took the decision because of the following reasons:
1. Because of the generic nature of the goal.
2. It was ranked as the highest priority goal by the participants.
3. It was highlighted that, to achieve this goal multiple metrics need to be evaluated.
47 questions (information needs) were identified by the participants. During analysis, we findthat a majority questions are similar. On the basis of identified similarity, we grouped these 47questions (information needs) into 10. The final list of information needs questions is shown in
33

Chapter 2. Regression Testing goals - view of practitioners and researchers
Table 2.6: G5. Questions (Information Needs)
Q.Id. Question Extracted from
Q1. What are the changes to the system? 5 similar optionsQ2. What is the experience of development and testing? 3 similar optionsQ3. Have critical parts been covered? 16 similar optionsQ4. Have modifications been tested? 5 similar optionsQ5. What are the test outcomes? 10 similar optionsQ6. What is the perception of team about confidence? 3 similar optionsQ7. What is the nature of defects in the product? 2 similar optionsQ8. What is the balance between pass fail? 1 optionQ9. What is the complexity of the product under test? 1 optionQ10. What has been blocked by the tests? 1 option
Table 2.6. The questions with most options were, Have critical parts been covered? (16 options),and What are the test outcomes? (10 options). A majority of information needs listed in Table 2.6are quantifiable, but some information needs are relatively generic in nature. Information needlisted at Q2 (Team Experience) cannot be taken as a direct testing metric, but it is importantwith regard to confidence. Similarly, Q6 (Confidence perception) is not a specific metric, still itcan affect the measure of other factors. Product characteristics listed as Q9 can determine thecomplexity of the product, this can also affect confidence perception. We can draw a correlationbetween Q2, Q6, and Q9. After finishing with the clustering, the final list of grouped informationneeds was presented to the participants for the verification of the clusters. Later in the resultsreview meeting, all the stakeholders were agreed to consider Q1, Q3, Q4, Q5, and Q7 as thefinal list of information needs to achieve the confidence goal. Participants were agreed about thesubjective importance of Q2 and Q7 with respect to the underlying goal of confidence.
A4–Measures Identification
The aim here was to identify the suitable measures to collect the information needs and ulti-mately achieve the defined goal (i.e. Confidence). We asked, [What measures do we need tocollect to answer the questions?]. Our experts identified 5 measures presented in the Table 2.7.Later together with the experts we started a brainstorming activity to find the possible mappingbetween the questions and measures. We carried the activity in a step wise manner. That is,for every single goal we asked the experts to map it with possible measure(s). 4 measures (i.e.M1,M2,M3, & M4) were mapped to 7 questions (i.e. Q1, Q3, Q4, Q5, Q7, Q8, and Q10). Thefinalized GQM (goal-question-measure) mapping is shown in Figure 2.
A5–Available Measures
The last activity was to know about the actual measures that are being used in the companies. Weasked the question, [What are you collecting today? (measurements) of what has been identifiedin A4]. This question was to know about the actual state of the implementation of measurement
34

Table 2.7: Measures
MID Measure
M1 #LOC changedM2 #Defect fixes from testM3 #Changed LOC coveredM4 #defect history/changeM5 #Affected Non-changed LOC/Modules
Q1
M1 M2 M3 M4
Q3 Q4 Q5 Q7 Q8 Q10
G5
Figure 2.2: Goal-Question-Measure Mapping
program regarding the evaluation of regression testing in the industry. Therefore we asked prac-titioners to answer this question. We requested the researchers to sit as observers and providetheir feedback on the activity. Practitioners expressed, that they do not use any explicit measures.There is no predefined measurement mechanism regarding the evaluation of regression testingthat could be used. Instead, they rely on their experience, to evaluate the success. Their agreed-upon statement about the measurement was, it is a gut feeling, that we have tested enough andwe are successful. To further continue and to come up with some substantial outcome, we addedanother question.
Do, we actually need to evaluate the success of regression testing?
We asked the participants to provide their opinion about the need for measuring the regres-sion testing. There was a consensus among the participants about the importance of measuringthe success of regression testing. It was emphasized that suitable measures need to be definedand used in the companies. It was also highlighted, that participating companies are interestedto implement an evaluation mechanism/framework to measure the success.
35

Chapter 2. Regression Testing goals - view of practitioners and researchers
Related Measures Presented in the Literature
To make a way towards the identification/implementation of evaluation framework, we decidedto identify the measures from literature and test the identified measures in the partner companies.As a starting point we identified some measures from literature to further strengthen our findings.
Rothermel and Harrold [1, 2] presented a complete framework for the evaluation of theregression testing techniques. They suggested inclusiveness, precision, efficiency, generality,& accountability as measures to evaluate the regression testing. Horvath et al. [10] used codecoverage & partition metrics for measuring fault detection capability and fault localization. Theydefined coverage metric (Cov) as a ratio of the number of procedures in a code group P that arecovered by test group T. Whereas they defined partition metric (Part) to express the average ratioof procedures that can be distinguished from any other procedures in terms of coverage. outputuniqueness is defined by Alshahwan and Harman [15], who define the output uniqueness as ifthe 2 test cases yield different kinds of output. The authors believe that this metric can help ineffective fault detection capability, it also works for fault finding consistency.
Vidacs et al. [11] uses the code coverage, efficiency & uniqueness for Assessing the Testsuites of large system. The authors argue that better coverage or partitioning can be achievedusing more test cases, provided test cases are different. But, in case if such test cases are added tothe test suite, which covers the same code, they will increase the test suite size possibly with littleadditional benefit. They suggested measuring the efficiency, that (refer to the relative numberof test cases in test suite), to measure efficiency, they defined coverage efficiency (EFFCOV)and partitioning efficiency (EFFPART). Coverage efficiency refers to the average number ofprocedures covered by a test case, while partitioning efficiency shows that on average, howmuch a single test contributes to the partitioning capability of whole functional unit. To measureuniqueness authors used 2 metrics (specialization metric SPEC and uniqueness metric UNIQ).SPEC shows how specialized a test group is to a code group, while the UNIQ metric measureswhat portion of the covered elements is covered only by a particular test group.
To measure the effectiveness, Chernak [17] named his measure as defect, which is the ratiobetween the number of defects covered by a test suite to the number of defects missed by thetest suite. Athanasiou et al. [16] argued that test code quality has 3 dimensions completeness,effectiveness, and maintainability. They defined assertion density as a measure of calculatingthe effectiveness of test code to detect the defects. For the effectiveness of test code authors alsosuggested directness as measure, they defined directness as it measures the extent to which theproduction code is covered directly. Test suite evaluation metrics and corresponding measuresselected from literature are presented in Table 2.8.
Mapping between Focus Group and Literature Findings
As we mentioned already, due to the time constraint, we investigated only one goal (G5) in thesubsequent steps of the focus group session. Therefore we decided, to create a mapping betweenthe goals presented in the Table 2.4, and metrics/measures we find in the literature. Majoritygoals listed in the Table 2.4 are specific and measurable. Measures presented in the literature canbe mapped to identified goals. For instance, G1 can be mapped to the metric “Fault detection
36

Table 2.8: Measures Found in Literature
S.No. Metric Measure Reference
1. Effectiveness Defects, TestCaseEscaps, AssertionDensity, Directness [16, 17]2. Fault Detection Capability CodeCoverage, OutputUniqaueness [10, 11, 15, 16]3. Fault localiztion Partition [10]4. Effeciency EffCov, EffPart [11]5. Uniqueness UNIQ, SPEC [11]
capability” , related measures have been discussed in the following studies [10, 15, 16]. G2 &G3 can be mapped to the metrics “precision ” and “inclusiveness” defined in [1, 2]. Similarly,G6 can be linked to the metric “Efficiency” presented in [1, 2, 11]. Finally, G7 can be mappedto “effectiveness” metric discussed in [16, 17].
The measures identified from literature can also be mapped to some of the questions listedin Table 2.6. For example, Q5 could be mapped to No. of Defects, TestCaseEscaps, & Out-putUniqueness, similarly Q7 can be mapped with No. of Defects & CodeCoverage, Q3 can bemapped with AssertionDensity & Directness.
2.6 ConclusionsIn this paper, we presented the results of our exploratory study. The study presents the views ofpractitioners and researchers about the regression testing definition, goals of regression testing,information needed (questions) to evaluate the success, and the measures to reveal the requiredinformation. For the elicitation of information, we used the focus group method, a total of sevenexperts (representatives of industry and academia) participated in the study. We have identifiedthe five priority goals for the success of regression testing including fault slippage to the cus-tomer, high precision, inclusiveness, confidence, and efficiency. The top priority and commongoal among all participants was confidence’ (about the system integrity). We identified informa-tion (seven questions) needed to achieve this goal. We also elicited the measures correspondingto these information needs. Finally, a mapping among goal, questions, and measures was created.
While defining the concepts and goals of regression testing, we did not observe any signif-icant difference of opinion between researchers and practitioners. However, there were visibledifferences in the priority of goals. We believe that such platforms where industry and academiacan sit together can be beneficial for both. Resultantly, researchers can work on actual industryproblems and practitioners could be able to cope with the real challenges by using the relevantresearch.
37

REFERENCES
2.7 References[1] G. Rothermel and M. J. Harrold, “A framework for evaluating regression test selection
techniques,” in Proceedings of the 16th International Conference on Software Engineer-ing, ICSE-16., 1994. IEEE, 1994, pp. 201–210.
[2] G. Rothermel and M. J. Harrold, “Analyzing regression test selection techniques,” IEEETransactions on software engineering, vol. 22, no. 8, pp. 529–551, 1996.
[3] J. Kontio, L. Lehtola, and J. Bragge, “Using the focus group method in software engi-neering: obtaining practitioner and user experiences,” in Proceedings of the InternationalSymposium on Empirical Software Engineering, ISESE’04. 2004. IEEE, 2004, pp. 271–280.
[4] J. Kontio, J. Bragge, and L. Lehtola, “The focus group method as an empirical tool insoftware engineering,” in Guide to advanced empirical software engineering. Springer,2008, pp. 93–116.
[5] E. Engstrom and P. Runeson, “A qualitative survey of regression testing practices,” inProceedings of the International Conference on Product Focused Software Process Im-provement. Springer, 2010, pp. 3–16.
[6] E. Engstrom, P. Runeson, and M. Skoglund, “A systematic review on regression test selec-tion techniques,” Information and Software Technology, vol. 52, no. 1, pp. 14–30, 2010.
[7] G. M. Kapfhammer, “Empirically evaluating regression testing techniques: Challenges,solutions, and a potential way forward,” in Proceedings of the IEEE Fourth InternationalConference on Software Testing, Verification and Validation Workshops (ICSTW), 2011.IEEE, 2011, pp. 99–102.
[8] L. S. Pinto, S. Sinha, and A. Orso, “Understanding myths and realities of test-suite evolu-tion,” in Proceedings of the ACM SIGSOFT 20th International Symposium on the Foun-dations of Software Engineering. ACM, 2012, p. 33.
[9] K. Petersen, C. Gencel, N. Asghari, and S. Betz, “An elicitation instrument for opera-tionalising gqm+ strategies (gqm+ s-ei),” Empirical Software Engineering, vol. 20, no. 4,pp. 968–1005, 2015.
[10] F. Horvath, B. Vancsics, L. Vidacs, A. Beszedes, D. Tengeri, T. Gergely, and T. Gyimothy,“Test suite evaluation using code coverage based metrics,” pp. 46–60, 2015.
[11] L. Vidacs, F. Horvath, D. Tengeri, and A. Beszedes, “Assessing the test suite of a large sys-tem based on code coverage, efficiency and uniqueness,” in Proceedings of the IEEE 23rdInternational Conference on Software Analysis, Evolution, and Reengineering (SANER),2016, vol. 2. IEEE, 2016, pp. 13–16.
[12] S. Masuda, “Software testing in industry and academia: A view of both sides in japan,” inProceedings of the IEEE International Conference on Software Testing, Verification andValidation Workshops (ICSTW), 2017. IEEE, 2017, pp. 40–41.
38

[13] I. S. C. Committee et al., “Ieee standard glossary of software engineering terminology(ieee std 610.12-1990). los alamitos,” CA: IEEE Computer Society, 1990.
[14] I. ISO, “Ieee, systems and software engineering–vocabulary,” ISO/IEC/IEEE 24765: 2010(E)) Piscataway, NJ: IEEE computer society, Tech. Rep., 2010.
[15] N. Alshahwan and M. Harman, “Coverage and fault detection of the output-uniquenesstest selection criteria,” in Proceedings of the International Symposium on Software Testingand Analysis 2014. ACM, 2014, pp. 181–192.
[16] D. Athanasiou, A. Nugroho, J. Visser, and A. Zaidman, “Test code quality and its relationto issue handling performance,” IEEE Transactions on Software Engineering, vol. 40,no. 11, pp. 1100–1125, 2014.
[17] Y. Chernak, “Validating and improving test-case effectiveness,” IEEE software, vol. 18,no. 1, pp. 81–86, 2001.
[18] R. Ramler, M. Felderer, T. Kitamura, and D. Marinov, “Industry-academia collabora-tion in software testing: An overview of taic part 2016,” in Proceedings of the IEEENinth International Conference on Software Testing, Verification and Validation Work-shops (ICSTW), 2016. IEEE, 2016, pp. 238–239.
[19] V. Garousi, M. M. Eskandar, and K. Herkiloglu, “Industry–academia collaborations insoftware testing: experience and success stories from canada and turkey,” Software Qual-ity Journal, pp. 1–53, 2016.
[20] V. Garousi and K. Herkiloglu, “Selecting the right topics for industry-academia collabora-tions in software testing: an experience report,” in Proceedings of the IEEE InternationalConference on Software Testing, Verification and Validation (ICST), 2016. IEEE, 2016,pp. 213–222.
[21] V. Garousi, K. Petersen, and B. Ozkan, “Challenges and best practices in industry-academia collaborations in software engineering: A systematic literature review,” Infor-mation and Software Technology, vol. 79, pp. 106–127, 2016.
[22] D. R. Thomas, “A general inductive approach for analyzing qualitative evaluation data,”American journal of evaluation, vol. 27, no. 2, pp. 237–246, 2006.
[23] L. Liu, “Using generic inductive approach in qualitative educational research: A casestudy analysis,” Journal of Education and Learning, vol. 5, no. 2, p. 129, 2016.
[24] P. Runeson and M. Host, “Guidelines for conducting and reporting case study research insoftware engineering,” Empirical software engineering, vol. 14, no. 2, p. 131, 2009.
[25] V. Caldiera and H. D. Rombach, “The goal question metric approach,” Encyclopedia ofsoftware engineering, vol. 2, no. 1994, pp. 528–532, 1994.
[26] E. Engstrom, K. Petersen, N. bin Ali, and E. Bjarnason, “Serp-test: a taxonomy for sup-porting industry–academia communication,” Software Quality Journal, pp. 1–37, 2016.
39
REFERENCES
40
Chapter 3
Regression testing for embeddedsoftware development –exploring the state of practice
3.1 IntroductionTesting is an essential aspect of any software development project. The companies are facing var-ious testing challenges, especially for large and complex products [3, 17]. The most challengingtesting activity in large-scale systems development is regression testing, which can consume upto 80% of the total testing cost [20, 25]. Regression testing (RT) is a retest activity to ensure thatsystem modifications do not affect other parts of the system and that the unchanged parts of thesystem are still working as they did before a change.
RT is a challenge for the software industry, especially for large-scale embedded softwaredevelopment companies in the context of systems with continuous integration and delivery.Considering the recent systematic literature review studies conducted on the topic of regres-sion testing [24, 27, 32, 33] we can conclude that it is a well-researched area and a large numberof techniques have been proposed in the literature. Despite extensive research on RT, researchresults are not finding their way into practice. There are several reasons, like differences in ter-minology, availability of research results and a lack of empirical evaluation of RT techniques inreal industrial environments [19, 25].
Other factors that affect the transition of research to the industry are, communication-gap be-tween practitioners and researchers, consideration of testing challenges at the different level ofabstraction, and differences in the vocabulary and context regarding the concepts of testing [26].It is essential that researchers must consider real-world situations. Without a focus on real indus-
41

Chapter 3. Regression testing for embedded software development – exploring thestate of practice
trial needs and practices, a majority of new techniques proposed in the literature will not fit withexisting practices. Testing is not only a technical challenge, but it is a socio-technical issue [17].
In this paper, we have investigated the current state of regression testing practice in twolarge-scale embedded software development companies. The contributions of this study are asfollows:
• Regression testing definition: presenting the perspective of practitioners.
• Regression testing practices: the purpose was to understand that how practitioners under-take the regression testing activity in the companies. Along with the regression testingpractices, we identified selection and prioritization criteria, and the challenges regardingthe regression testing practices.
• Improvement suggestions to overcome the identified challenges.
• Regression testing goals and success criteria.
The remainder of this paper is structured as follows. Section 3.2 discusses the related work.Section 3.3 describes our research methodology. Threats to validity are discussed in Section 3.4.Results of the study are presented and discussed in Section 3.5. A summary, organized along ourresearch questions, as well as conclusions can be found in Section 3.6.
3.2 Related WorkThere is a large body of research on software testing ( [1, 4]), but most of this research is focusedon methods and tools. There is only little work on the perspectives of testing practitioners inindustry on regression testing. We found only 13 articles [10–16, 18, 22–25, 29] related to ourwork, which we discuss further below. Out of these 13 studies, eight deal specifically withregression testing, whereas five have a broader focus. Other than regression testing specificstudies, we included those papers in the related work, where authors are discussing any aspectof regression testing.
With respect to the main focus of the related works, we organized them into four groups: (1)general testing practices, (2) testing methods and tools, (3) automated testing, and (4) regressiontesting.
General Testing Practices Two studies, both of them surveys, investigated general testingpractices ( [11, 12]). Dias-Neto et al. [11] conducted a survey-based study to identify the soft-ware testing practices in South America. The study was carried out with the practitioners fromBrazil and Uruguay. The authors highlight the testing practices that the practitioners consider asessential and beneficial. For instance, the practitioners think testing documentation as useful forcurrent and future testing activities. The practitioners acknowledge the importance of test man-agement and error reporting tools. The essential testing types are system and regression testing.The authors also highlight some weaknesses of the companies. For example, they indicate thatthe companies do not measure their testing activity and the tendency of using test automationtools is not encouraging.
42

Kassab et al. [12] conducted a web-based survey to explore how software practitioners areusing testing. The focus of their research was to study the overall testing practices. Authorsindicate that the use of black box testing techniques is more common as compared to white boxtesting. Regression testing is one of the testing levels getting more attention of the companies.There is a trend in the companies to outsource the regression testing activity. Among the sur-veyed companies majority of telecommunication and gaming companies prefer the outsourcingof regression testing, and they are satisfied with this practice. The authors highlight requirementcoverage as the most used metric in the companies, followed by the test execution rate. Teststopping criteria for the majority of the companies is the deadline of the project.
Testing Methods and Tools Ng et al. [18] investigated software testing practices in ICTcompanies in Australia. Their focus was on testing methodologies/techniques, tools, metrics,and standards. The authors highlighted that the training share for testing staff is low, accordingto the results presented in the study, universities and training colleges offer only 10.7% of thetotal training courses for testing staff. Regarding regression testing, the authors report that 69.2%of the organizations are using regression testing for all of the applications they are developing.Regarding the frequency of regression testing, 53.3% of the organizations repeat regression test-ing for every new version of the product and 28.9 % reported the use of regression testing afterevery change.
Automated Testing Two studies focused on the state of practice in testing automation( [13, 15]). Rafi et al. [13] highlighted the benefits and challenges of automated testing us-ing a systematic literature review followed by a practitioner survey. They found only few studiesdiscussing the benefits and limitations of automated testing. The authors conclude that automa-tion is beneficial in an environment where excessive regression testing is performed and it helpsin improving test coverage. The key limitations are initial setup costs, training, and availabilityof reliable testing tools. Furthermore, a majority of testers believe that automated testing cannotreplace manual testing.
Kasurinen et al. [15] studied the current state of practice and required improvements insoftware test automation in an interview-based empirical study. The authors suggest that mostof the practitioners are satisfied with their current test policy and testing practices, and they arenot thinking of any change in it. Regarding automation, the authors reveal that only 26% of thetest cases were automated, and the majority of these test cases are related to unit and regressiontesting. The automation of regression testing is a common practice among the companies, andregression testing was the most practiced testing type in the sample organizations.
Regression Testing Eight studies focused specifically on regression testing aspects ( [10,14, 16, 22–25, 29]). Brahneborg et al. [29] extracted the challenges corresponding to the ex-isting methods of regression testing from a set of empirical studies. The authors classified thechallenges into two categories, 1) method related challenges, 2) Organization related challenges.Among method related challenges they highlighted, handling failures, performance measure-ment, handling fault distribution, scalability of techniques, and tool support. Whereas regarding
43

Chapter 3. Regression testing for embedded software development – exploring thestate of practice
organization related challenges, the authors describes existence of a structured test suite (testsuite maintenance), information availability, knowledge and skills of testers and developers, andmanagement support.
Minhas et al. [10] conducted a focus group based study to investigate the views of industrypractitioners and software engineering researchers concerning regression testing. The authorsexplore the perceptions of both communities about the scope of regression testing. They alsoidentify the regression testing success goals. The authors listed confidence, high precision, andfault-slippage as the essential goals of regression testing. They conclude that the perceptionof the practitioners and researchers about regression testing is alike, and there are similaritiesin views concerning regression testing goals. Finally, the authors indicate the need for a mea-surement of regression testing task to enable the testers for measuring their success. The goalsidentified in the study are given in Table 3.2.
Parsons et al. [23] conducted case-studies and an online survey to investigate the adoptionof regression testing strategies in agile development. The authors analyzed different contextualfactors that can have an impact on regression testing strategy. The focus of their research wasto identify the organizational maturity regarding regression testing and operational aspects ofregression testing in the surveyed organizations. The authors found that the maturity of the orga-nization is the primary factor for successful regression testing. The authors conclude that orga-nizations can get potential benefits of investments in regression testing. The authors highlightedthe need for investigations in the areas of change and risk management regarding regressiontesting.
Yoo and Harman [24] surveyed the literature on regression test case minimization, selection,and prioritization. They specified the state of the art, trends and issues concerning these areas ofregression testing. The authors conclude that the trend to evaluate regression testing techniquesis getting a significant increase in the research. However, the majority of empirical studies arecarried out with systems under test of less than 10,000 lines of code and test suite sizes of lessthan 1,000 test cases. They also found that almost 60% of the empirical studies on regressiontesting are using programs from the software infrastructure repository (SIR1) ( [5]). It indicatesthat evaluation of regression testing techniques in real industrial context is limited. The authorsargued that there is a potential risk of over-fitting the research on regression testing techniques tothe programs that are readily available. They suggested that for the future research on regressiontesting, researchers should opt for alternative data sources and focus should be on the transfer oftechnology to industry.
Juergens et al. [14] carried out an industry case study to highlight the challenges concerningregression test selection techniques when applied in manual system tests. They suggest thatthe testing effort could exceed the expected limit when applying selective regression testingtechniques on manual testing. The authors also think that under-specification of manual testscan reduce the conclusiveness of results. Finally, they suggest strategies to improve the manualregression test selection.
Engstrom and Runeson [16] investigated regression testing practices and challenges and
1http://sir.unl.edu/portal/index.php
44

pointed out that a majority of the challenges are related to testability issues and good practicesare related to test automation. The authors note that most findings of their study are related totesting in general and are not specific to regression testing. However, there was a consensusamong the practitioners regarding the concept and importance of regression testing. Some keyfindings of this study are provided in Table 3.2.
Harrold and Orso [25] analyzed the state of research and practice in regression testing. Theauthors conducted the review of research on regression testing and informal survey with theresearchers and practitioners. They concluded that hardly a few methods and tools proposedin the research are in use of industry. The authors identified various issues that are hinderingthe transition of proposed techniques to practice. They also highlighted the technical/conceptualissues, needed to be addressed by the research. Issues identified by Harrold and Orso are listedin Table 3.2.
Lin [22] conducted a literature-based survey on the regression testing research and recentpractices. Their goal was to identify the gaps in regression testing research and its industrialpractices. The author suggests that there are some gaps and efforts should be made towards theimplementation of regression testing research in industry. Addressing these gaps should be thefuture direction in research.
Summary A summary of related work is presented in Table 3.1. Of the 11 studies discussedabove, only 6 focused on aspects of regression testing. Overall, the related work shows that thereis a gap between research and practice. New techniques should have to be evaluated in the realindustrial context. The researchers should work on technology transfer of the regression testingtechniques.
In order to build a mapping between the existing literature and findings of our study, weextracted related information from some of the studies presented in the related work. Consideringthe scope and method the studies that could be regarded as closely relevant to our work are [16,25]. Both studies are of exploratory nature and purpose to investigate the current state of practiceconcerning RT. We extracted information related to practices, selection and prioritization criteriaand challenges from these studies. We did extract some information regarding the selection andprioritization criteria from the literature survey by Yoo and Harman [24]. For the regressiontesting challenges, we also utilized the study by Brahneborg et al. [29]. Regarding RT goalswe extracted the information from [10, 31]. We have listed the key findings of these studies inTable 3.2. It is essential to specify that the literature findings are not exhaustive because findingpractices, challenges, etc. from the literature was not the goal of this study.
3.3 MethodologyWe conducted a multi-case study in two large companies to investigate the current state of prac-tice regarding regression testing. Data were mainly collected through interviews, and the reviewof process documentation complemented the findings. Interviews provide an opportunity fordirect interaction with the respondents and resolving issues with interpretations during the inter-
45

Chapter 3. Regression testing for embedded software development – exploring thestate of practice
Table 3.1: Summary of related work. The first column indicates the subsection inSection 3.2 (GTP: General Testing Practices, TMT: Testing Methods and Tools, AT:Automated Testing, RT: Regression Testing).
Ref. Methods Year RT1 Focus of the study
GT
P [11] Survey 2017 No Characterizing the testing practices in South America.[12] Survey 2017 No Overall testing practices.
TM
T [18] Survey 2004 No Current state of testing practices, testing methodolo-gies/techniques, testing tools, metrics, and standards in Aus-tralian ICT companies.
AT
[13] SLR and Sur-vey
2012 No Benefits and challenges of automated testing.
[15] Interviews 2010 No Current state and required improvement in test automation.
RT
[29] Literaturestudy
2017 Yes Identification of regression testing challenges.
[10] Focus Group 2017 Yes Regression Testing goals, information needs and metrics.[23] Case study and
survey2014 Yes Regression testing strategies and the factors that influence the
adoption.[24] Literature Sur-
vey2012 Yes A detailed analysis of trends and issues in regression testing
concerning minimization, selection and prioritization.[14] Case study 2011 Yes Regression test selection challenges when applied to system
manual tests.[16] Focus group
and survey2010 Yes Regression testing practices and challenges.
[25] Literaturereview andsurvey
2008 Yes An analysis of the state of the research and the state of thepractice.
[22] Literature sur-vey
2007 Yes Identification of gaps between the regression testing researchand practice.
1Whether the work focuses on regression testing aspects.
view sessions. We choose to conduct semi-structured interviews, since it allows improvisationand exploration of the studied objects [9].
3.3.1 Research QuestionsRQ1 How is regression testing perceived by the practitioners in industry?
RQ2 What is the current state of regression testing practice in industry?
RQ2.1 How are the practitioners selecting and prioritizing test cases?
RQ2.2 What are the key challenges for the practitioners regarding regression testing?
RQ3 What are the possible improvements regarding regression testing practices suggested bythe practitioners?
RQ4 How do the practitioners evaluate their success in regression testing?
46

Table 3.2: Literature findings on RT state of practice
Aspect ID Description Ref
RT
Prac
tices
LPr1. In industry test suite maintenance is largely manual. [25]LPr2. For RT, many organizations rerun all test cases (retest all). [16, 25]LPr3. A most common approach is running core set of test cases. [16, 25]LPr4. In large number of organization, test case are selected randomly on the basis
of experience of testers.[25]
LPr5. Mostly organizations use in-house build techniques and tools [25]LPr6. Some practitioners prefer to run as many as possible. [16]LPr7. Start RT as early as possible. [16]LPr8. Run RT before each release. [16]LPr9. Complete re-test for critical parts. [16]LPr10. Focus is on functional test cases [16]LPr11. Selection of test cases depends on the situation. [16]LPr12. The amount and frequency of RT depends upon the various factors. [16]
Prio
ritiz
atio
n LPc1. Change. [16, 24, 25]LPc2. Cost. [25]LPc3. Running time. [25]LPc4. Criticality. [25]LPc5. Complexity of the test cases. [25]
Sele
ctio
n LSc1. Change. [16, 24, 25]LSc2. Historical test data on test case effectiveness. [24, 25]LSc3. Timing data on the last time a test case was run. [25]LSc4 Traceability between requirements to test cases. [24, 25]LSc5. Situation based selection. [16]LSc6. Areas affected by the changes. [16]
Cha
lleng
es
LC1. Identification of obsolete test cases. [25]LC2. Selection of relevant test cases. [16, 25]LC3. Test case prioritization. [25]LC4. Test suite augmentation. [25]LC5. Removing redundant test cases. [16, 25]LC6. Creating effective test cases. [16, 25]LC7. Manual testing (expensive and time consuming). [25]LC8. information maintenance. [25, 29]LC9. Test suite maintenance. [16, 25, 29]LC10. Test suite assessment. [25]LC11. Time to RT. [16]LC12. Balance between manual and automated RT. [16]LC13. Execution of automated RT. [16]LC14. Time to analyze results. [16]LC15. Management support. [29]
Goa
ls
LG1 Increasing rate of fault detection (effectiveness) [10, 31]LG2 Increasing coverage of test suite (coverage) [10, 31]LG3 Increasing confidence regarding the system reliability (confidence) [10, 31]LG4 Identifying high risk (critical) faults [31]LG5 Identifying change specific faults (effected areas) [31]LG6 The customer should not find fault in the product (fault slippage to the cus-
tomer)[10]
LG7 Finishing RT in limited time and low cost (efficiency) [10]LG8 Running most effective test cases (inclusiveness) [10]LG9 Excluding non effective test cases (precision) [10]
3.3.2 Case CompaniesWe conducted this study from the platform of EASE 2 (An industry-academia collaborationproject).The companies participated in this study are Sony Mobile Communications AB and
2EASE- the Industrial Excellence Centre for Embedded Applications Software Engineering http://ease.cs.lth.se/about/
47
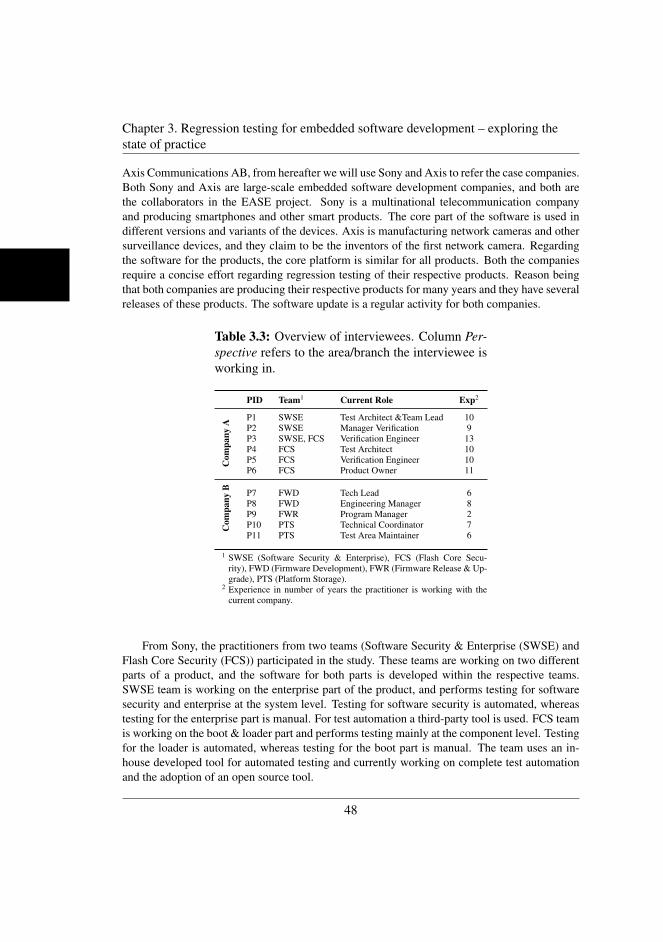
Chapter 3. Regression testing for embedded software development – exploring thestate of practice
Axis Communications AB, from hereafter we will use Sony and Axis to refer the case companies.Both Sony and Axis are large-scale embedded software development companies, and both arethe collaborators in the EASE project. Sony is a multinational telecommunication companyand producing smartphones and other smart products. The core part of the software is used indifferent versions and variants of the devices. Axis is manufacturing network cameras and othersurveillance devices, and they claim to be the inventors of the first network camera. Regardingthe software for the products, the core platform is similar for all products. Both the companiesrequire a concise effort regarding regression testing of their respective products. Reason beingthat both companies are producing their respective products for many years and they have severalreleases of these products. The software update is a regular activity for both companies.
Table 3.3: Overview of interviewees. Column Per-spective refers to the area/branch the interviewee isworking in.
PID Team1 Current Role Exp2
Com
pany
A P1 SWSE Test Architect &Team Lead 10P2 SWSE Manager Verification 9P3 SWSE, FCS Verification Engineer 13P4 FCS Test Architect 10P5 FCS Verification Engineer 10P6 FCS Product Owner 11
Com
pany
B P7 FWD Tech Lead 6P8 FWD Engineering Manager 8P9 FWR Program Manager 2P10 PTS Technical Coordinator 7P11 PTS Test Area Maintainer 6
1 SWSE (Software Security & Enterprise), FCS (Flash Core Secu-rity), FWD (Firmware Development), FWR (Firmware Release & Up-grade), PTS (Platform Storage).
2 Experience in number of years the practitioner is working with thecurrent company.
From Sony, the practitioners from two teams (Software Security & Enterprise (SWSE) andFlash Core Security (FCS)) participated in the study. These teams are working on two differentparts of a product, and the software for both parts is developed within the respective teams.SWSE team is working on the enterprise part of the product, and performs testing for softwaresecurity and enterprise at the system level. Testing for software security is automated, whereastesting for the enterprise part is manual. For test automation a third-party tool is used. FCS teamis working on the boot & loader part and performs testing mainly at the component level. Testingfor the loader is automated, whereas testing for the boot part is manual. The team uses an in-house developed tool for automated testing and currently working on complete test automationand the adoption of an open source tool.
48

From Axis, practitioners from three teams (Firmware Development (FWD), Firmware Re-lease & Upgrade (FWR), and Platform Storage (PTS)) participated in the study. FWD team isresponsible for the new product development and new feature additions to products. They per-form testing at unit, integration, and system level. Mainly regression testing is automated exceptthe testing of new features.
FWR team works on upgrades and new releases. Their primary responsibility is pre-release(Beta testing), performance, and stability testing. Performance and stability testing is automated,but complemented by manual exploratory testing. Regression testing is regarded as input torelease. PTS team is responsible for the storage part of the platform and performs testing at theunit and system level. For regression testing, the policy of the team is to run all test suits duringnightly trials. The automation framework is common for the whole platform.
3.3.3 Data CollectionThe data was mainly collected through interviews, and it was complemented by the processdocumentation provided by the companies.
Selection of Participants
Before the actual study, with the help of project contact persons, we conducted two separateworkshops at both companies. The purpose was to present our research objectives to the man-agers and potential participants. We did highlight the required experience and roles of the po-tential participants. These workshops enabled us to understand the overall hierarchy of the com-panies, their team structures, and the working procedures. The selection of the participants wasbased on convenience sampling [30]. Convenience sampling is a non-probability non-randomsampling method. We refer our selection as convenience sampling because we selected thoseparticipants who were fulfilling our selection criteria of role and experience, and who were will-ing to participate. A summary of the participants is presented in Table 3.3.
Interview Design
Based on the research questions, we prepared an interview guide consisting of open-ended ques-tions. We did not restrict ourselves to the pre-defined questions, we added/improvised the in-terview questions during the sessions. The first author developed the interview guide, while thesecond author helped during the revisions, and an independent researcher reviewed the inter-view guide. The interview guide consists of seven sections: introduction, background, currentpractices, selection and prioritization, challenges and improvements, and success criteria. Thecomplete interview guide is presented in A.
Interview Execution
In total, we conducted eleven interviews (five at Axis, and six at Sony) with the representativesof five teams. The first and second author participated in the interviews at Axis, whereas the
49

Chapter 3. Regression testing for embedded software development – exploring thestate of practice
first and fourth author participated in the interviews at Sony. The first author guided all theeleven interviews, while the second and fourth authors assisted in their respective sessions. Ob-server triangulation was utilized during all interviews. Besides the person guiding an additionalresearcher took the interview notes.
Each interview took about one hour and was audio-recorded with the consent of the partici-pants. During the interview, we complemented our documentation with mind-maps and free textnotes. The template of mind-map used for this study is presented in Figure 3.1. The templateconsists of six nodes, five nodes represent the main topics of our study (i.e., current practices, se-lection and prioritization criteria, challenges, improvements, and evaluation), whereas one nodeof the mid-map shows the background information of the participant.
Figure 3.1: Mind-map used for data management and classification.
Process Documentation
The primary source of information for our study was the interviews, to complement our findingswe requested both companies to provide us their process documentation under NDA agreement.The documentation was mainly related to test cases, test management tools, test strategy/plan,internal presentations, and training materials. We have undergone the review of these documentsin detail and extracted the relevant information. The extracted information complemented someof the practices defined by the practitioners (reuse of existing test cases, when to create new testcases, at which level regression testing is performed in the companies, distribution of manualand automated work, and etc.), selection / prioritization criteria (criteria to select the scope, risks,effected areas, change related measures, and etc.,), organizational goals related to testing, and thesuccess criteria (i.e., when to stop regression testing?). The analysis of process documentationhelped us to understand the testing procedures adopted at the companies, and to validate thefindings of the interviews further.
3.3.4 Interpreting, Analyzing and Validating Interview ScriptsTo minimize misunderstands and misinterpretations, we documented the interviews by threedifferent means: structured mind-maps, free text notes, and audio recordings. The mid-map was
50

the master document for the recording of interview results. Based on the research questions,we already structured the mind-maps according to the main themes of our study (See Figure3.1). For the analysis of interview notes and audio transcribed transcripts we followed the stepsdefined by Cruzes and Dyba [8]. We also took inspiration from the method followed by thePetersen and Wohlin in their study [28].
Step 1: Transcribing the Interview Recordings The first step was to finalize the inter-view scripts. In this step we transcribed the audio recordings, the first author transcribed all theaudio records and the second author randomly verified these transcripts. We did use the free textnotes and process documentation as a separate source of raw data.
Step 2: Clustering of Categories The second step was to cluster the raw data into mean-ingful groups. We used color coding to separate the concepts in the scripts and identified thesimilarities and differences in the themes of different scripts. For example, the statements weregrouped according to the categories, “current practices”, “selection and prioritization criteria”,“challenges”, etc. As an example, we have listed some statements of interviewees in the in Table3.4. We clustered the raw data separately for each participating team.
Table 3.4: Analysis procedure adopted for step2 and step 3.
SNo Original Statement Category Subcategory Restructured Statement
1 i) Working very close with our develop-ment team, Developers cannot merge anything with out the approval of testersii) Decision making approach: Beforeheavy documents and test plans. Scopedout a lot of overhead, now it is withinthe project, in collaboration with the de-velopers and with the project managerand QA (decision within the develop-ment team).
Practice Process Developers and testers collab-orate while deciding the scopefor the testing of changes andnew features.
2 i) If we don’t find issues with regressiontesting, we try exploratory to find some-thingii) We do some exploratory testing to findnew issues.
Practice Testing type Use of exploratory testing asan alternative to RT.
3. i) Usually when we are closer to thefreeze of the code deadline we try tomake a little bigger scope.ii) We run full scope at the of devel-opment, when developers cannot makechanges.iii) If there is a change in the core of theproduct we run the full scope.
Practice Process Regression testing is per-formed with full/bigger scopeat code-freeze, before release,or in case of changes in thecore of the system.
4. We tag our test cases like sanity, scope,mandatory, tagged test cases are supposeto be really important test cases.
Practice Prioritization Use of priority tags for the testcases with respect to the rele-vant importance.
51

Chapter 3. Regression testing for embedded software development – exploring thestate of practice
Step 3: Clustering of Subcategories In the third step, we assigned the labels (themes) tothe statements already clustered in step 2. In this step, beside the labeling process, we also didrestructure the statements where it was necessary. Table 3.4 presents the labels along with therestructured statements.
Step 4: Mapping categories and subcategories to mind-maps In this step we mappedthe results generated from free text notes and audio generated transcripts to the mind-maps.Resultantly we did the necessary updates in the min-maps.
Step 5: Generation of Results From the final copy of mind-maps we generated Tables(3.5, 3.6, 3.7, 3.8, 3.9, 3.10, 3.11, & 3.12) of results according to the research questions presentedin the section 3.3.1.
Step 6: Validation of Results In qualitative studies, the researcher’s bias can influence theinterpretation of the results. It can be avoided by validating the interpretations from the sources.
As a first validation step, we compared the results with the information extracted from theprocess documentation. Although the process documentation did not cover the complete results,however, at some extent it provided us confidence about the correctness of the results that wehad collected through interviews.
To validate our interpretation of results, we conducted two workshops with the participantsof our study and the representatives of the companies at EASE. We used validation sheets torecord the issues regarding the interpretation of the results. Feedback of the study participantsand companies representatives was positive, they identified a few minor revisions (mainly relatedto the RT practices), which we adjusted accordingly. Lately, we provided the final results to thecompanies representatives for the final verification, their response was encouraging, and they didnot raise any issue in the final results.
3.4 Threats to ValidityThis study is exploratory and based on the experience and perceptions of industry practitioners.The data was collected through semi-structured face-to-face interviews. We asked open-endedquestions to capture viewpoints without any restriction. The purpose was to avoid researcherbias and get insight into current industry practices. Furthermore to triangulate the data sources,along with the interviews we also utilized the process documentation provided by the companies.In our discussion of threats to validity, we follow the guidelines by Runeson and Host [9].
Construct Validity This aspect of validity is regarding the underlying operational measures,concepts, and terms of the study. In our case, the selection of the participants regarding theircompetence and relatedness to the study area was a potential threat. Similarly, missing anycritical aspect from the interview design could also be a threat. To mitigate these, we conductedpre-study workshops, the goal of these workshops was to explain the purpose of the study to
52

the focal persons in the companies and resultantly to select appropriate participants for the study(Ref: Section 3.3.3). Regarding the interview design, we have carefully designed and reviewedthe interview guide (See Section 3.3.3 and A).
Internal Validity This aspect of validity threat is essential if causal relations are examined.Generally, we can state that studying causal relationships was not in the scope of this study.Therefore we did not consider this aspect of validity threat.
External Validity This aspect of the validity refers to the generalization of findings. Partici-pants of this study were representing five different teams of two large companies. The findings ofthis study represent the communication-based companies working on embedded software sys-tems. To ensure the applicability in a larger population, we have linked our finding with theexisting literature. Further analytical generalization of results is possible, to support this wehave presented a detail discussion on the cases under study in Section 3.3.
Reliability To ensure the reliability of the results, we assured the correctness of the collecteddata and interpretation of the results. Sections 3.3.3 and 3.3.4 present the detail in this regard. Foreach round of interview two authors participated. To triangulate what was said in the interviewswe reviewed the process documentation of the participating companies. We did ensure the resultstriangulation, by involving multiple authors in the results interpretations, and we did validate theresults in two workshops with the participants of the study.
3.5 Results and DiscussionThis section presents the results regarding the practitioners’ perspectives on regression testing,test case selection and prioritization criteria, challenges, improvements, and success criteria. Thesubsections are organized according to the research questions presented in Section 3.3.
3.5.1 The practitioners’ Perceptions of Regression Testing (RQ1)The purpose of our first research question was to elicit what participants think about regressiontesting. Our first interview question was “What is regression testing for you?”. Instead ofstandard definitions of regression testing [6, 7], our participants provided practical descriptionsof regression testing with close relations to the perspectives (teams) they were representing.
From Table 3.5, we can see that the practitioners covered three aspect while defining regres-sion testing: 1) The timing or frequency of regression testing, 2) the scope of regression testing,and 3) the overall goal of regression testing. Regarding timing, the participants define the needfor regression testing after changes or fixes, before release, whereas some participants suggestrunning regression testing continuously. About the scope of RT, the practitioners are flexible,some of the participants describe running RT with smaller scope, whereas some prefer to adopta “re-test all” policy. Finally, the participants are agree on the goal of RT, (i.e. to get confidence
53
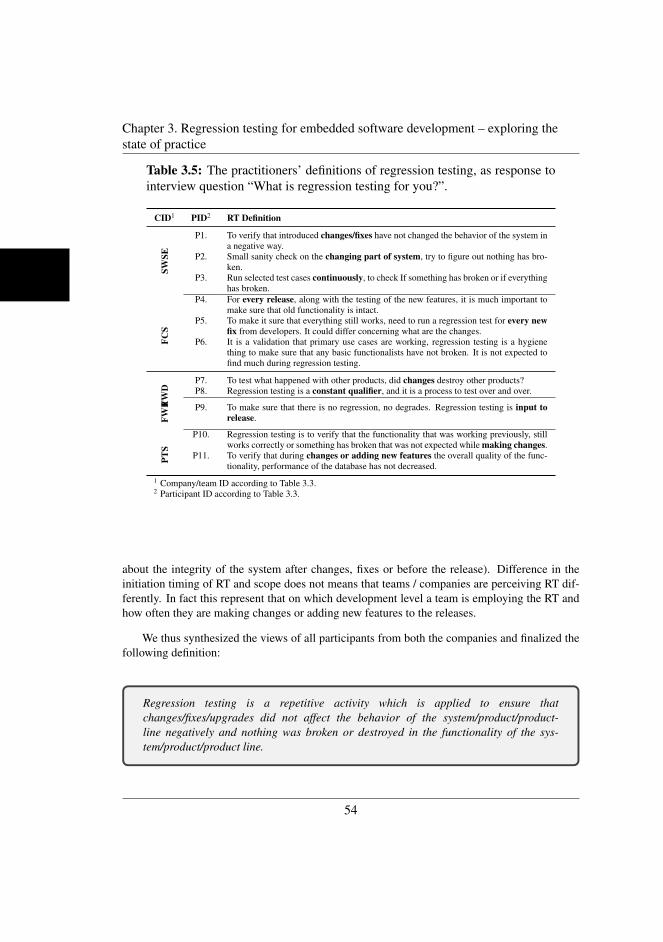
Chapter 3. Regression testing for embedded software development – exploring thestate of practice
Table 3.5: The practitioners’ definitions of regression testing, as response tointerview question “What is regression testing for you?”.
CID1 PID2 RT Definition
SWSE
P1. To verify that introduced changes/fixes have not changed the behavior of the system ina negative way.
P2. Small sanity check on the changing part of system, try to figure out nothing has bro-ken.
P3. Run selected test cases continuously, to check If something has broken or if everythinghas broken.
FCS
P4. For every release, along with the testing of the new features, it is much important tomake sure that old functionality is intact.
P5. To make it sure that everything still works, need to run a regression test for every newfix from developers. It could differ concerning what are the changes.
P6. It is a validation that primary use cases are working, regression testing is a hygienething to make sure that any basic functionalists have not broken. It is not expected tofind much during regression testing.
FWD
P7. To test what happened with other products, did changes destroy other products?P8. Regression testing is a constant qualifier, and it is a process to test over and over.
FWR P9. To make sure that there is no regression, no degrades. Regression testing is input to
release.
PTS
P10. Regression testing is to verify that the functionality that was working previously, stillworks correctly or something has broken that was not expected while making changes.
P11. To verify that during changes or adding new features the overall quality of the func-tionality, performance of the database has not decreased.
1 Company/team ID according to Table 3.3.2 Participant ID according to Table 3.3.
about the integrity of the system after changes, fixes or before the release). Difference in theinitiation timing of RT and scope does not means that teams / companies are perceiving RT dif-ferently. In fact this represent that on which development level a team is employing the RT andhow often they are making changes or adding new features to the releases.
We thus synthesized the views of all participants from both the companies and finalized thefollowing definition:
Regression testing is a repetitive activity which is applied to ensure thatchanges/fixes/upgrades did not affect the behavior of the system/product/product-line negatively and nothing was broken or destroyed in the functionality of the sys-tem/product/product line.
54

3.5.2 Regression Testing Practices (RQ2)
The objective of second research question was to understand how the practitioners conduct re-gression testing in their projects. Table 3.6 summarize regression testing practices identified inour study.
Table 3.6: Regression testing practices.
ID Description of practice SWSE FCS FWD FWR PTS CPL 1
Pr1. Collaboration: Developers and testers collaborate whiledeciding the scope for the testing of changes and newfeatures.
X X X X X
Pr2. Execution frequency: The frequency of executing testsdepends upon the type/importance of the functionality.
X
Pr3. Execution frequency: Testing as much as possible withselected test cases near the completion of the project.
X LPR6
Pr4. Reuse of test cases: Using existing test cases for the test-ing of changes.
X X
Pr5. Adding new test cases: New test cases are added for newfeatures and issue leakage.
X X
Pr6. Running full scope: Regression testing is performedwith full/bigger scope at code freeze, before release, orin case of changes in the core of the system.
X X X X LPr2
Pr8. Nightly testing: RT is executed with full scope in nightlyruns.
X X LPr2
Pr7. Day time testing: Select a scope that should run (fast) ina day time and cover bigger part.
X X X
Pr9. Weekly round or RT: Run a weekly round of RT with asmaller scope.
X
Pr10. Scope Selection: Mostly run RT with selected scope be-cause of time constraint.
X
Pr11. Running fix suite: Using fix set of test cases (that coverthe core/basic functionality) for RT.
X LPr3
Pr12. RT Automation: The companies are using both manualand automated RT.
X X X
Pr13. Testing tools: For test automation using third party tools. XPr14. Testing tools: For test automation using in-house devel-
oped tool.X X X X LPR5
Pr15. RT suite size: Regression test suites are fairly large. X XPr16. Exploratory testing: Use of exploratory testing to com-
plement RT.X X X X
Pr17. Test strategy: For every new project a detailed test strat-egy / plan is developed.
X X X X
Pr18. Priority tags: Using tags with test cases to determine thepriority.
X
Pr20. Traceability labels: Use of test case labels to link withrespective modules.
X
Pr19. Tickets: Use of tickets for highlighting the issues, ithelps to identify the type and nature of the error.
X
Pr21. When to introduce RT: Sometime early start of regres-sion testing is preferred to catch defects at early stages.
X X LPr7
P22. RT level: Applying RT at System level. X X XP23. RT level: Applying RT at Component level. XPr24. RT goal: The goal of regression testing is to have confi-
dence that product is in good shape.X X
CPL: Corresponding practice(s) in literature.
55
Chapter 3. Regression testing for embedded software development – exploring thestate of practice
From Table 3.6, it is evident that the practitioners do collaborate with each other whilemaking any decision regarding RT. The companies are using a mix of automated and manual RT,at Sony the practitioners specified that almost 50% of their testing activity is automated, whereasparticipants from Axis claimed that majority of the RT is automated. For test automation thecompanies are using in-house build test tools, except one team who is currently using a thirdparty tool. At Axis all three teams are using the same test automation and management tool. Thescope of RT depends on change/fix and time-line of the project. For changes, testers prefer torun the smaller scope (selected test cases), in case of complex changes (e.g., in the core) theytry to opt for a wider scope. Near the completion of project (code freeze or near the release)the practitioners favor the execution of RT with full scope (re-test all). The practitioners at Axisalso highlighted that during day time they run selected test cases and during nightly testing theyprefer to run full scope. The participants from SWSE (Sony) highlighted that they run weeklyrounds of RT with selected scope, whereas FCS (Sony) adopt the selection of scope because oftime constraints.
The practitioners reuse of existing test cases as regression test suite, they do augment newtest cases in the existing test suites in case of adding of new functionality or any issue leak-age. The practitioners label the test cases with “test tags” and/or “test case labels” accordingto the respective importance and/or modules. The use of labels conceptually differs in both thecompanies, at Sony labels are used to highlight the relative priority of the test case, and at Axislabels are used to link the test cases with respective modules. Regarding test strategy or testplanning, two teams SWSE (Sony) and PTS (Axis) highlighted this aspect, both teams claimedit a company wide activity. At Sony, a high level test strategy exists that serves the basis for thedesign of detailed test strategy. For every new project test architect design the detailed strategy,it includes the details about the modules to test, scope of testing, test cases, and etc. At (Axis),there exists an organization wide test plan. Preparing and updating the project specific test planand test scripts is the responsibility of the QA team. Some of the practices identified in our studyare already defined in the existing literature (See table 3.2), we have created the mapping ofliterature identified practices in the last column of Table 3.6. Considering the results of a survey-based study conducted by Dias-Neto et al. [11] in which authors surveyed the overall softwaretesting practices we can conclude that practices identified in our study are purely regression test-ing related. As opposed to the survey conducted by Engstrom and Runeson [16] where authorsspecified that the practices identified in their survey are general testing practices.
Test Case Selection and Prioritization (RQ2.1)
An important aspect of regression testing practices is test case selection and prioritization, whichwe investigated in RQ2.1. A summary of selection and prioritization criteria along with theinformation sources used for decision making can be found in Tables 3.7 and 3.8, respectively,we did map the information sources with the selection/prioritization criteria in Table 3.7 underthe column heading “UIS”. The last column “CCrL” in Table 3.7 lists the selection/prioritizationcriteria available in the literature (Literature findings are listed in Table 3.2).
The primary criteria for test selection and prioritization for regression test suite is the
56

Table 3.7: Test selection and prioritization criteria.
ID1 Criteria SWSE FCS FWD FWR PTS UIS2 CCrL3
SPCr1. Change (size, complexity,andlocation).
X X X X IS1,IS2,IS7
LPc1,LPc5
PCr2. Risk. X X X IS2,IS4
PCr3. Critical functionality. X X IS1,IS2,IS3,IS7
LPc4
PCr4. Defect priorities. X IS6SCr5. Situation based scope assess-
ment.X IS2,
IS7LSc5
SCr6. Coverage(feature/module). X X IS2,IS5
SCr7. Affected areas. X X IS1,IS2
LSc6
SCr8. Deadlines. X X X IS8SCr9. Least recently used test cases. X IS2,
IS5SCr9. Most frequently failed test
cases.X IS2,
IS51 SPCr: Selection/Prioritization Criteria, PCr:Prioritization Criteria, SCr: Selection Criteria2 UIS: Utilized Information Sources.3 CCrL: Corresponding Criteria in Literature
Table 3.8: Information sources utilized for test selection and prioritization.
ID Information sources SWSE FCS FWD FWR PTS
IS1. Developers’ feedback. X X X XIS2. Experience and Knowledge of system. X X X XIS3. Issue ranking. XIS4. Team meetings. X X XIS5. Test history. XIS6. Test tags. XIS7. Feature to test traceability. X XIS8. Project managers. X X X
‘change’. The practitioners assess the size, complexity, and location (area) of change. Theparticipants from all the teams highlighted this criterion. Feedback from developers, and expe-rience and knowledge of the practitioner about the system are the information sources used toassess the change. Experience and knowledge of system and feedback from developers are theprimary sources of information for majority selection/prioritization criteria. For instance, scope
57

Chapter 3. Regression testing for embedded software development – exploring thestate of practice
C13
C2
C1 C11
C4
C9
C7
C3
C12
C5
C6
C10
C1: Time to testC2: Information MaintenanceC3:Test Suite MaintenanceC4: Communication C5: Test case selectionC6: Test case prioritization C7: Lack of assessment C8: Low coverageC9: Lack of strategy C10: Traceability C11: Developer interest in testingC12: Tool supportC13: Management Support
C8
Figure 3.2: Relationship between RT challenges.
assessment, fix regression test suite, critical functionality, and coverage are the criteria where thepractitioners are using their experience to access these criteria.
Other relevant criteria that are used for the test selection or prioritization are risk, deadlines,and critical functionality. Three out of five teams are using these criteria. Measurement of riskis based on change (area and complexity of change), the practitioners are sometimes using issueranking to prioritize the risk. Knowledge of the practitioner about risk areas is another source ofinformation for risk measurement. Deadlines are central concerning the scope selection. If theproject is on schedule and deadlines are relaxed then testers prefer to run full scope (completetest suite) for regression testing. If deadlines are tight (often, it is the case), then the practitionersopt for an adaptive (selected) scope. In this case, they do prioritize the test cases on the basis ofthe critical (essential) functionality. The selected scope consists of the test cases that cover thecritical functionality and the primary use cases (basic functionality). The companies are usinga predefined test suite that covers the primary use cases (basic functionality). They update thissuite (add new test case) in case developers add new functionality (features) or if they think thatsomething (test case) is missing.
Some selection criteria are team specific. For instance, SWSE team select the test cases thathave not been executed recently (least recently used test cases), they do choose the test casesconcerning the date of use. The testers at FWD team are using most recently failed test casesand most frequently failed test cases during the selection process.
Key Challenges in Regression Testing (RQ2.2)
Table 3.9 summarizes the regression testing challenges reported by the practitioners.The identified challenges can be classified into two categories, 1) management related chal-
lenges, and 2) technical challenges. Management related challenges include “C1: Time to test”,
58

Table 3.9: Regression testing challenges.
ID Challenge SWSE FCS FWD FWR PTS CCL1
C1 Time to test: Too much testing in a short time.Lack of time is the primary hindrance for the as-sessments and innovation of RT.
X X X X LC11
C2 Information management: Because of poor infor-mation maintenance and lack of documentation itis hard to extract the required information.
X X X X LC8
C3 Obsolete test cases:There are tests which are notfailing for a long time, a big challenge as it effectthe efficiency and effectiveness.
X X X X LC9
C4 Communication:Lack of information about thechanges and upcoming plans from the other teams.
X X X X
C5 Test case selection: Instead of the dynamic testscope focus is on fixed test suites. Adding value tothe scope by selecting relevant test cases is a chal-lenge.
X X X X X
C6. Test case prioritization: Inappropriate assumptionsabout the priorities and what to select.
X X X LC3
C7 Evaluating and improving: Lessons learned on aproject are often broad in nature, not possible to re-flect on the success. Time to test is one the factorsthat limits the option of evaluations and improve-ments.
X X X X LC10
C8 Low coverage: Detection of new bugs is a chal-lenge this is because of, running the same test casesfor a long time that is causing the low test coverage.
X X X
C9 Lack of strategy: Focus is on project success in-stead of organizational success, no long-term strat-egy.
X X
C10 Traceability: Finding trace-links between tests andother artifacts is a challenge.
X X
C11 Developers interest in testing: Developers’ least in-terest in quality, delivering their code without test-ing.
X
C12 Tool support: The testers have to go through exces-sive manual work in RT because of the unavailabil-ity of good verification tools.
X LC13
C13 Management support: Lack of understandingabout the importance of verification.
X LC15
1 CCL: Corresponding challenges in literature
“C2: Information management”, “C4: Communication”, “C9: Lack of strategy”, “C11: Devel-opers interest in testing”, and “C13: Management support”. Whereas technical challenges are“C3: Obsolete test cases (Test suite maintenance)”, “C5: Test case selection”, “C6: Test caseprioritization”, “C7: Evaluating and improving (Lack of assessment)”, “C8: Low coverage”,“C10: Traceability”, and “C12: Tool support”. Figure 3.2 presents the relationship between theidentified challenges, from the figure we can see that the central challenge is C13 (i.e., Man-agement support) and it could cause all other related problems. Time to test (C1), information
59

Chapter 3. Regression testing for embedded software development – exploring thestate of practice
management (C2), and lack of strategy (C9) are the root cause of technical challenges. Amongthe technical challenges C7 (i.e., Lack of assessment) is the basis of other technical challengesincluding C3, C5, C6, C8, & C12). Similarly, C10 (i.e., traceability) can effect the C5 (selection)and C6 (prioritization). Finally C3, C5, C6, & C10 cause the low coverage (C8).
In the last column of Table 3.9 we mapped the challenges identified from the literature (SeeTable 3.2) with the challenges identified in our study. Seven challenges (C1, C2, C3, C6, C7,C12, & C13) identified in our study are similar to the challenges identified in the studies [16, 25,29]. Interesting aspect is that first study by Engstrom and Runeson [16] was conducted in 2010and the other study by Harrold and orso [25] was carried out in 2008. Despite the voluminousnessresearch on regression testing [24], it is evident that the challenges are not fully addressed after10 years. It is an indicator that either published research is not fulfilling the industrial needs orthe industrial stakeholders are unable to exploit the intended benefits from the available research.Along with the identification of challenges with the help of practitioners, it is also important towork on improvements in a close collaboration with the practitioners.
3.5.3 Suggested Improvements for Regression Testing (RQ3)In RQ3, we investigated improvements that the practitioners seek in their testing environment.Table 3.10 summarize the possible improvements we identified with the help of the practitioners.
A majority of identified improvements correspond to the challenges presented in Table 3.9.Last column (CC) of Table 3.10 list the challenges that could be addressed by the respectiveimprovements. There is often a one-to-one mapping between the challenges and the suggestedimprovements. For instance, C2 (information management) is identified as a challenge in boththe companies, the practitioners even who did not recognize it as challenge agree to build andmaintain a standard information repository (I-1). Similarly, C3 (test suite maintenance) is high-lighted as a challenge. To address the issue, the practitioners suggest to work on the eliminationof irrelevant and obsolete test cases (I-2: Test suite minimization) and updating test suites byadding new relevant test cases (I-3: Test suite augmentation). Working on test suite minimiza-tion will also be helpful for reduction of testing time, that ultimately will be helpful to copewith the challenge of time to test (C1). Another important suggestion that can be helpful for thereduction in time to test is to introduction of parallelized testing (I-12). Overall test optimization(I-14) will also improve the situation.
Availability of good verification tools (C12) is an issue of concern for the companies, be-cause of this fact testers have to do a lot of manual work in RT. In this regard, it is suggestedto identify and adopt the verification tools (I-4) appropriate for the companies environment. Tocope with the challenge of communication (C4), the practitioners think that there is a need towork for the improved collaboration (I-5). Although, the practitioners (developers and testers)do have a certain level of communication, but there is no formal mechanism for the communica-tion. Specifically, with reference to information sharing regarding changes and change plan. Inthe presence of well maintained information repository this issue should be minimized. Test caseselection and test case prioritization are of central importance in regression testing, especially forthe large-scale development. Because right selection with appropriate priority order can improve
60

Table 3.10: Identified Improvements.
ID Improvements SWSE FCS FWD FWR PTS CC1
I-1. Information repository: Need to build and maintaina standard information repository, to make infor-mation extraction easier and faster.
X X X X C2
I-2. Removing irrelevant test cases: Need to identifyand remove irrelevant/obsolete test cases, to reducethe test cost and improve the efficiency and effec-tiveness.
X X X X C1,C3
I-3. Test suite augmentation: Need to update test suitesby adding new relevant test cases, to improve thecoverage and effectiveness.
X C3
I-4. Good verification tools: Need to identify and addgood verification tools, to reduce the dependenceon manual testing.
X X C12
I-5. Improved collaboration: There is a need to regu-late the collaboration mechanism between develop-ers and tester, to improve the information sharing(What developers are changing? and what testershave to test?)
X X X X C4
I-6. More exploratory testing: To find new bugs, needto do more exploratory testing.
X X C8
I-7. Evaluate: To measure success and improve RT,need to collect test execution statistics and evalu-ate.
X X X C7
I-8. Improved test strategy: Need to improve the testingstrategy and innovate testing methods.
X C9
I-9. Test History: Need to maintain test execution his-tory dynamically, so that it could be reused to inno-vate testing.
X X C5,C6
I-10. Early start of regression testing: To ensure the sta-bility, need to introduce early start of regressiontesting.
X C1
I-11. Test case classification: To classify test cases ac-cording to severity, need to introduce a standardtemplate for error reporting, that should allow link-ing tests to errors.
X C6,C10
I-12. Parallelized testing:To cope with the time con-straints, need to introduce the concept of paral-lelized testing.
X C1
I-13. Selective RT: Need to improve the selection mech-anism of test cases, selection should be without anycompromise.
X C5
I-14. Test optimization: To shorten the release cycle,need to work on overall optimization of RT.
X C1,C3,C5,C6
1 CC: Corresponding challenge(s).
the coverage and defect detection rate. The companies lack in both areas (C5: Test case selectionand C6: Test case prioritization). From the identified improvement (I-7, I-8) provides the basisfor the improvement in selection and prioritization methods. Exploratory testing (I-6) could bean immediate solution choice for the practitioners.
61
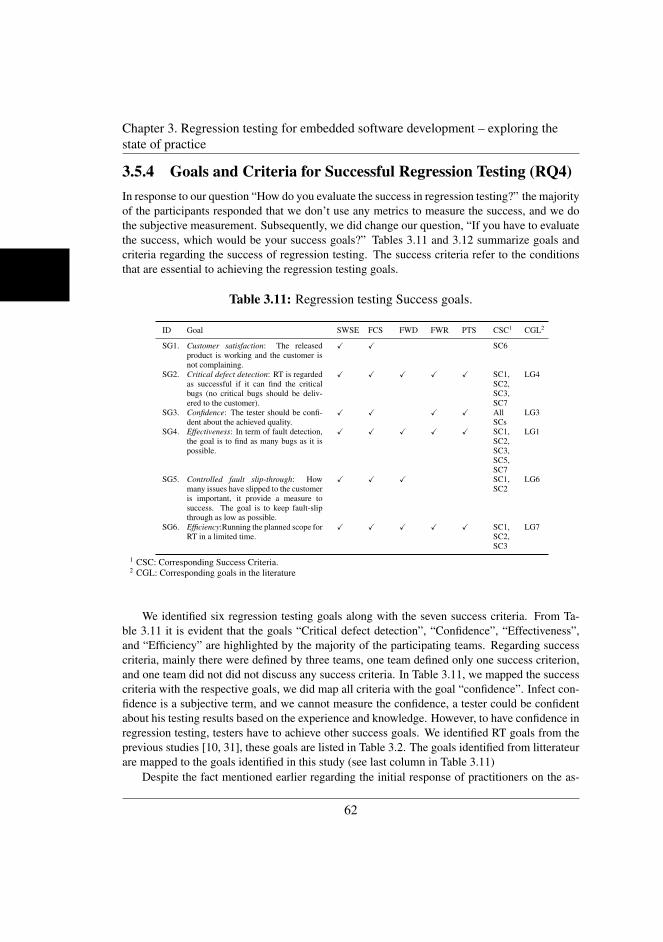
Chapter 3. Regression testing for embedded software development – exploring thestate of practice
3.5.4 Goals and Criteria for Successful Regression Testing (RQ4)In response to our question “How do you evaluate the success in regression testing?” the majorityof the participants responded that we don’t use any metrics to measure the success, and we dothe subjective measurement. Subsequently, we did change our question, “If you have to evaluatethe success, which would be your success goals?” Tables 3.11 and 3.12 summarize goals andcriteria regarding the success of regression testing. The success criteria refer to the conditionsthat are essential to achieving the regression testing goals.
Table 3.11: Regression testing Success goals.
ID Goal SWSE FCS FWD FWR PTS CSC1 CGL2
SG1. Customer satisfaction: The releasedproduct is working and the customer isnot complaining.
X X SC6
SG2. Critical defect detection: RT is regardedas successful if it can find the criticalbugs (no critical bugs should be deliv-ered to the customer).
X X X X X SC1,SC2,SC3,SC7
LG4
SG3. Confidence: The tester should be confi-dent about the achieved quality.
X X X X AllSCs
LG3
SG4. Effectiveness: In term of fault detection,the goal is to find as many bugs as it ispossible.
X X X X X SC1,SC2,SC3,SC5,SC7
LG1
SG5. Controlled fault slip-through: Howmany issues have slipped to the customeris important, it provide a measure tosuccess. The goal is to keep fault-slipthrough as low as possible.
X X X SC1,SC2
LG6
SG6. Efficiency:Running the planned scope forRT in a limited time.
X X X X X SC1,SC2,SC3
LG7
1 CSC: Corresponding Success Criteria.2 CGL: Corresponding goals in the literature
We identified six regression testing goals along with the seven success criteria. From Ta-ble 3.11 it is evident that the goals “Critical defect detection”, “Confidence”, “Effectiveness”,and “Efficiency” are highlighted by the majority of the participating teams. Regarding successcriteria, mainly there were defined by three teams, one team defined only one success criterion,and one team did not did not discuss any success criteria. In Table 3.11, we mapped the successcriteria with the respective goals, we did map all criteria with the goal “confidence”. Infect con-fidence is a subjective term, and we cannot measure the confidence, a tester could be confidentabout his testing results based on the experience and knowledge. However, to have confidence inregression testing, testers have to achieve other success goals. We identified RT goals from theprevious studies [10, 31], these goals are listed in Table 3.2. The goals identified from litterateurare mapped to the goals identified in this study (see last column in Table 3.11)
Despite the fact mentioned earlier regarding the initial response of practitioners on the as-
62

Table 3.12: Regression testing Success criteria.
ID Criteria SWSE FCS FWD FWR PTS
SC1. Right selection: Based on requirements selectingand defining the right test cases. Selection of ap-propriate test cases is the key for successful RT.
X X X
SC2. Knowledge of changes: For successful regressiontesting, QA should be well aware of changes in thesystem.
X X
SC3. Early start of RT:The success criteria in RT is tostart of RT as early as possible.
X
SC4. Coverage: Coverage is one the criteria to evaluatethe success.
X X X
SC5. Tester’s Experience: Knowledge and experience oftester is the subjective measure of confidence in RT.
X X
SC6. Customer’s feedback: The customer feedback isthe measure of confidence in the software testing.
X X
SC7. Quality of test cases: Carefully designed test casescan guarantee the finding issues and good coverage.
X X X
sessment of success, the results are encouraging. The practitioners are aware of the importanceof success, and they know how to measure the success. Presently, they are not making any objec-tive assessments because of environment support, availability of resources, and an appropriatemechanism for the assessment.
3.6 Summary and ConclusionsWe have conducted an interview-based study in two large communication companies and in-vestigated various aspects of regression testing in practice. In the following, we summarize ourfindings regarding each research question.
The definition of RT that emerged from the practitioners (RQ1) (see Section 3.5.1) is in linewith the standard definition presented in ISO, IEEE, system and software engineering vocabu-lary [7]. The goal of regression testing is to get confidence that the system changes have notintroduced unwanted system behavior rather than to find errors. The scope of regression test-ing depends on the timing in the projects (e.g.small fix or a major release) and risk analysis forincoming changes. This study confirms our previous viewpoints [10] and Engstrom et al. [16].
Looking at the regression testing practices (RQ2), our respondents are using manual andautomated regression testing, there is a lot of manual work that practitioners have to do. Fortest automation mainly the companies are relying on in-house developed tools. Inability to finda third party tool is an interesting findings that points towards specific testing requirements orprocesses that can not be captured by a general regression testing tool support. Another possibleexplanation is that our respondents prefer to change the tools rather than wait for tool vendorsto provide the necessary adaptations. This allows for faster and better alignment between thetesting process, testing strategy and the tool support. Test strategy definition seems to be an ad
63

Chapter 3. Regression testing for embedded software development – exploring thestate of practice
hoc practice among our respondent which confirms the need for in-house and flexible tooling.The testers and developers collaborate in the decision making regarding various aspects of
RT. Only SWSE and FWR respondents confirmed to reuse test cases. This may explain whoexploratory testing is used as a replacement for regression testing when they fail to find issueswith fixed regression suites. Greater test reuse seems to be hindered by a lack of traceabilitylabels (mentioned by one group) or tickets (also mentioned by one group), see Table 6 for details.
The scope and time of change drive regression testing activities. Our practitioners mostlyrun a static regression testing scope that cover the basic/core functionality of the respective sys-tems. Size, position and complexity of change drive test case selection, supported by domainknowledge and experience and dialog with developers. When pressed by short deadlines, ourpractitioners limit the scope of regression testing. The selection/prioritization criteria identi-fied in our study is closely related to the selection/prioritization criteria available in the relatedstudies [16, 24, 25].
Looking at the 12 identified challenges (RQ2.2), information management, test suite main-tenance, communication, test case selection, and test case prioritization are common to both thecompanies. We identified fourteen challenges from the related studies [16, 25]. There are sixchallenges identified in our study are also available in the related work (See Table 3.9). Interest-ingly, communication is frequently mentioned by traceability is mentioned only by one group.This may mean that our respondents underestimate the role of traceability mechanisms in enrich-ing and supporting communication between the roles involved in regression testing. Similarly,traceability could be supporting test suite maintenance mentioned by almost all respondents in-volved. We believe that more research should be directed towards understanding the relationsbetween the challenges and how the solutions can mitigate them.
We identified two improvement categories for regression testing practices (RQ3): 1) Im-provements related to the management affairs, 2) improvements related to technical interven-tions, these improvements are related to test case selection, test case prioritization, test suite min-imization, test suite augmentation, and assessment of regression testing. Yoo and Harman [24]presented a literature survey of 159 papers on test case selection, minimization and prioritiza-tion techniques, it includes a large number of techniques proposed in these three areas. Despitethe lot of work in these areas, the practitioners still think that there is a need for improvement.Which indicates either the techniques proposed in the literature are not fulfilling the requirementsof industry or the practitioners are not aware of these techniques. Surprisingly, our respondentpointed good verification tools as a necessary improvement despite developing in-house andheavily tailored solutions themselves. Another interesting aspect is the identification of irrele-vant or obsolete test cases that appears to be a similar challenge that the identification of obsoletesoftware requirements surveyed by Wnuk et al. where over 80% of the respondents confirmednegative influence of obsolescence on their processes [2].
The success goals identified in our study are, customer satisfaction, critical defect detection,confidence, effectivenss, controlled fault slip-through, and efficiency (RQ4). Our study alsoreveals some preconditions which can guarantee the success of RT. For instance, right selectionof test cases, and knowing the changes are the conditions that are essential for the success ofRT. Regarding goals findings of this study complement the findings of previous studies [10,
64

31]. Similarity in the success goals identified in two different studies indicate that there is anawareness and urge in the industry regarding evaluating the success of regression testing.
AcknowledgmentsThe authors would like to thank the practitioners from Sony Mobile Communications AB andAxis Communications AB, who participated in all sessions of the study. We are also thank-ful to all facilitators who helped us in organizing the study. The funding agency Vinnova, aswell as Sony Mobile Communications, Axis and Softhouse support the work through the EASEIndustrial Excellence Center (reference number 2015-03235).
3.7 References[1] A. Bertolino, “Software testing research: Achievements, challenges, dreams,” in Proceed-
ings of the Workshop on the Future of Software Engineering (FOSE07, 2007, pp. 85–103.
[2] K. Wnuk, T. Gorschek, and S. Zahda, “Obsolete software requirements,” Informationand Software Technology, vol. 55, no. 6, pp. 921 – 940, 2013. [Online]. Available:http://www.sciencedirect.com/science/article/pii/S0950584912002364
[3] N. B. Ali, K. Petersen, and M. V. Mantyla, “Testing highly complex system of systems:an industrial case study,” in Empirical Software Engineering and Measurement (ESEM),2012 ACM-IEEE International Symposium on. IEEE, 2012, pp. 211–220.
[4] A. Orso and G. Rothermel, “Software testing: a research travelogue (2000–2014),” inProceedings of the Workshop on Future of Software Engineering (FOSE14), 2014, pp.117–132.
[5] H. Do, S. Elbaum, and G. Rothermel, “Supporting controlled experimentation with testingtechniques: An infrastructure and its potential impact,” Empirical Software Engineering,vol. 10, no. 4, pp. 405–435, 2005.
[6] I. S. C. Committee et al., “Ieee standard glossary of software engineering terminology(ieee std 610.12-1990). los alamitos,” CA: IEEE Computer Society, 1990.
[7] ISO/IEC, “ISO/IEC/IEEE24765:2010: Systems and software engineering–vocabulary,”2010.
[8] D. S. Cruzes and T. Dyba, “Recommended steps for thematic synthesis in software en-gineering,” in Empirical Software Engineering and Measurement (ESEM), 2011 Interna-tional Symposium on. IEEE, 2011, pp. 275–284.
[9] P. Runeson and M. Host, “Guidelines for conducting and reporting case study research insoftware engineering,” Empirical software engineering, vol. 14, no. 2, p. 131, 2009.
65

REFERENCES
[10] N. M. Minhas, K. Petersen, N. B. Ali, and K. Wnuk, “Regression testing goals-viewof practitioners and researchers,” in 24th Asia-Pacific Software Engineering ConferenceWorkshops (APSECW), 2017. IEEE, 2017, pp. 25–31.
[11] A. C. Dias-Neto, S. Matalonga, M. Solari, G. Robiolo, and G. H. Travassos, “Towardthe characterization of software testing practices in south america: looking at brazil anduruguay,” Software Quality Journal, vol. 25, no. 4, pp. 1145–1183, 2017.
[12] M. Kassab, J. F. DeFranco, and P. A. Laplante, “Software testing: The state of the prac-tice,” IEEE Software, vol. 34, no. 5, pp. 46–52, 2017.
[13] D. M. Rafi, K. R. K. Moses, K. Petersen, and M. V. Mantyla, “Benefits and limitationsof automated software testing: Systematic literature review and practitioner survey,” inProceedings of the 7th International Workshop on Automation of Software Test. IEEEPress, 2012, pp. 36–42.
[14] E. Juergens, B. Hummel, F. Deissenboeck, M. Feilkas, C. Schlogel, and A. Wubbeke,“Regression test selection of manual system tests in practice,” in Proceedings of the 15thEuropean Conference on Software Maintenance and Reengineering (CSMR), 2011, pp.309–312.
[15] J. Kasurinen, O. Taipale, and K. Smolander, “Software test automation in practice: em-pirical observations,” Advances in Software Engineering, vol. 2010, 2010.
[16] E. Engstrom and P. Runeson, “A qualitative survey of regression testing practices,” inProceedings of the International Conference on Product Focused Software Process Im-provement. Springer, 2010, pp. 3–16.
[17] J. Rooksby, M. Rouncefield, and I. Sommerville, “Testing in the wild: The social andorganisational dimensions of real world practice,” Computer Supported Cooperative Work(CSCW), vol. 18, no. 5-6, p. 559, 2009.
[18] S. Ng, T. Murnane, K. Reed, D. Grant, and T. Chen, “A preliminary survey on softwaretesting practices in australia,” in Software Engineering Conference, 2004. Proceedings.2004 Australian. IEEE, 2004, pp. 116–125.
[19] G. M. Kapfhammer, “Empirically evaluating regression testing techniques: Challenges,solutions, and a potential way forward,” in Proceedings of the Fourth International Con-ference on Software Testing, Verification and Validation Workshops (ICSTW), 2011, pp.99–102.
[20] E. Engstrom, P. Runeson, and G. Wikstrand, “An empirical evaluation of regression test-ing based on fix-cache recommendations,” in Proceedings of the Third International Con-ference on Software Testing, Verification and Validation (ICST), 2010. IEEE, 2010, pp.75–78.
[21] V. Garousi, K. Petersen, and B. Ozkan, “Challenges and best practices in industry-academia collaborations in software engineering: A systematic literature review,” Infor-mation and Software Technology, vol. 79, pp. 106–127, 2016.
66

[22] X. Lin, “Regression testing in research and practice,” Computer Science and EngineeringDepartment University of Nebraska, Lincoln, pp. 1–402, 2007.
[23] D. Parsons, T. Susnjak, and M. Lange, “Influences on regression testing strategies in agilesoftware development environments,” Software Quality Journal, vol. 22, no. 4, pp. 717–739, 2014.
[24] S. Yoo and M. Harman, “Regression testing minimization, selection and prioritization: asurvey,” Software Testing, Verification and Reliability, vol. 22, no. 2, pp. 67–120, 2012.
[25] M. J. Harrold and A. Orso, “Retesting software during development and maintenance,” inProceedings of Frontiers of Software Maintenance FoSM. IEEE, 2008, pp. 99–108.
[26] E. Engstrom, K. Petersen, N. B. Ali, and E. Bjarnason, “SERP-test: a taxonomy forsupporting industry-academia communication,” Software Quality Journal, vol. 25, no. 4,pp. 1269–1305, 2017.
[27] R. Kazmi, D. N. A. Jawawi, R. Mohamad, and I. Ghani, “Effective regression test caseselection: A systematic literature review,” ACM Comput. Surv., vol. 50, no. 2, pp. 29:1–29:32, 2017.
[28] K. Petersen and C. Wohlin, “A comparison of issues and advantages in agile and incre-mental development between state of the art and an industrial case,” Journal of systemsand software, vol. 82, no. 9, pp. 1479–1490, 2009.
[29] D. Brahneborg, W. Afzal, and A. Causevic, “A pragmatic perspective on regression test-ing challenges,” in Software Quality, Reliability and Security Companion (QRS-C), 2017IEEE International Conference on. IEEE, 2017, pp. 618–619.
[30] B. Kitchenham and S. L. Pfleeger, “Principles of survey research: part 5: populations andsamples,” ACM SIGSOFT Software Engineering Notes, vol. 27, no. 5, pp. 17–20, 2002.
[31] S. Jafrin, D. Nandi, and S. Mahmood, “Test case prioritization based on fault dependency,”International Journal of Modern Education and Computer Science, vol. 8, no. 4, p. 33,2016.
[32] M. Khatibsyarbini, M. A. Isa, D. N. Jawawi, and R. Tumeng, “Test case prioritization ap-proaches in regression testing: A systematic literature review,” Information and SoftwareTechnology, 2017.
[33] S. U. R. Khan, S. P. Lee, N. Javaid, and W. Abdul, “A systematic review on test suitereduction: Approaches, experiment’s quality evaluation, and guidelines,” IEEE Access,vol. 6, pp. 11 816–11 841, 2018.
67
REFERENCES
68

Appendix A
Interview guide
IntroductionPersonal introduction Interviewers tell the participant about themselves, their backgroundand training, and interest in the area of software testing.
Study goal The lead interviewer explains the study goal to the participant.
Goal: The goal of the study is to know the state of regression testing practice in the large-scale embedded software development. The purpose is to know that how companies are manag-ing their test systems, specially with reference to regression testing. The following points are thefocus of the interview.
◦ Current Practices ,◦ Test Selection and prioritization,◦ Challenges and issues,◦ Improvements, and◦ Evaluation of success goals.
Benefit: This study will provide the basis for improving the different aspects of regres-sion testing considering the different views of people within the organization. We believe youropinion is valuable. This investigation gives you (interviewee) a chance to contribute to theimprovement of the regression testing environment.
Interview process Interviewer describes the overall process, that how the interview will takeplace.◦ Interview duration: The interview will be completed in about an hour time.
69

Chapter A. Interview guide
◦ Interview questions: there may be some questions that the interviewee perceives as stupid,silly, or difficult to answer. It is possible that an appropriate question for one person may not besuitable for the other.◦ Counter questions: The interviewee may feel free to ask counter questions for the clarifi-
cation of an interview question and can disagree with any statement of the interviewer.◦ Answers: We believe that in an interview, we can not rate any answer as right or wrong.
The interviewee need not worry about in this regard, and we expect he/she will answer thequestions on the basis of knowledge and experience.
Respondent BackgroundThe purpose of this section is to know about the participant’s professional background, currentrole and responsibilities.Question 1: Could you please briefly describe on your professional background?◦ Your qualification,◦ Overall Experience,◦ Time in the current company.
Question 2: How you will define your expertise?◦ Software Engineering,◦ Software Development,◦ Software testing.
Question 3: Please specify about your current job.◦ Your current team,◦ Your role in the team.
Question 4: Can you please brief us about your current project(s).
Interview Part to explore the RT state of practiceThis is the central part of this interview, and we are interested to know about the current practice,selection and prioritization criteria, challenges, and improvements regarding regression testing.In the final part of the interview, we will discuss the regression testing success goals. We willstart by asking our questions regarding current practices. Please feel free to add detail at anypoint of the interview that you think we missed to ask or you forget to describe.
Defining regression testing The purpose is not to get the academic definition of regressiontesting. The interviewers are interested to know the perception of the practitioner.Question 1: What is regression testing for you?
Questions regarding current practices The aim is to know how practitioner’s team isperforming regression testing.Question 1: Can you please give us a walk-through of overall process and highlight where andhow often regression testing is performed?
70

Question 2: Have you been involved in decision making regarding (When to do regression test-ing? Which test cases should be executed? How to select a subset of candidate test cases?)?Question 3: In your team regression testing is manual or automated?Question 4: For automation which tools are in use of your company / team?Question 5: Decision are taken by the individuals or by the QA team? (Who are the peopleinvolved in decision making?)
Selection and prioritization Although, selection and prioritization are regarding as the partof practice. Considering the importance of selection and prioritization, we are asking focusedquestions.Question 1: Do you use some predefined criteria for the selection and / or prioritization of testcases?Question 2: Which information you use while making decisions for selection and/or prioritiza-tion?Question 3: Do you or your team maintain the required information? Is this information readilyavailable?Question 4: When have you made the right selection of test cases?Question 5: How do you evaluate / know whether the selection was right?
Challenges and Improvements Challenges are the obstacles that can hinder the smoothand successful execution of the operations. Like other working environments, practitioners work-ing in software development organizations are facing different issues. Our interest is to knowthose issues which are recurring and require attention.Question 1: What are the challenges for testers regarding regression testing?Question 2: Do you have any mitigation strategies to overcome these challenges?Question 3: What are the challenges, you think need to pay more attention?Question 4: Considering the underlying challenges, can you identify the areas of improvement?
Success Criteria To determine the success of any activity, we measure it with the predefinedgoals, that is, if the goals have met or not.Question 1: What is your criteria of success of regression testing? Do you measure the success?Question 2: At your company / team do you define success goals?Question 3: For a successful regression testing what are the goals that should be achieved?Question 4: How will you determine that the desired goals have been achieved?
Closing Questions We mentioned earlier that the goal of this research is to identify potentialproblems and come up with suggested solutions. Your opinion counts!Question 1: In your opinion which is the most important area that should have to be the focus ofthis research?
71

Chapter A. Interview guide
Question 2: Do you want to share some more information which you think is important toconsider, that we may have missed?
Lorem ipsum dolor sit amet, consectetuer adipiscing elit. Etiam lobortis facilisis sem. Nul-lam nec mi et neque pharetra sollicitudin. Praesent imperdiet mi nec ante. Donec ullamcorper,felis non sodales commodo, lectus velit ultrices augue, a dignissim nibh lectus placerat pede.Vivamus nunc nunc, molestie ut, ultricies vel, semper in, velit. Ut porttitor. Praesent in sapien.Lorem ipsum dolor sit amet, consectetuer adipiscing elit. Duis fringilla tristique neque. Sed in-terdum libero ut metus. Pellentesque placerat. Nam rutrum augue a leo. Morbi sed elit sit ametante lobortis sollicitudin. Praesent blandit blandit mauris. Praesent lectus tellus, aliquet aliquam,luctus a, egestas a, turpis. Mauris lacinia lorem sit amet ipsum. Nunc quis urna dictum turpisaccumsan semper.
72
Chapter 4
On the search forindustry-relevant regressiontesting research
4.1 IntroductionRegression testing remains an unsolved and increasingly significant challenge in industrial soft-ware development. As a major step towards quality assurance, regression testing poses an impor-tant challenge for the seamless evolution (e.g., continuous integration and delivery) of large-scalesoftware. Similarly, dealing with variability (e.g., in software product lines/product variants)makes regression testing of industrial software a non-trivial matter. Testing is highly repeti-tive at all levels and stages of the development, and for large and complex systems precision inregression test scoping becomes crucial.
These challenges have led to a large body of academic research. There is even a multitudeof systematic literature reviews classifying and analysing the various proposed techniques for re-gression testing. For example, there are eleven literature reviews on regression testing publishedsince 2010 ( [16, 17, 36, 39, 43, 54, 66, 70, 72, 78, 79]).
Despite this extensive body of research literature, research results have shown to be hardto adopt for the practitioners ( [5–8, 74, 76]). First of all, some results are not accessible forpractitioners due to the discrepancies in terminology between industry and academia, which inturn makes it hard to know what to search for in the research literature. Furthermore, manyempirical investigations are done in controlled experimental settings that have little in commonwith the complexity of an industrial setting. Hence, for practitioners, the relevance of such resultsis hard to assess. [74] surveyed regression testing practices, which highlighted the variation in
73

Chapter 4. On the search for industry-relevant regression testing research
regression testing contexts and the need for holistic industrial evaluations.There are today a significant number of industrial evaluations of regression testing. Unfor-
tunately, also these results are hard to assess for the practitioners, since there are no conceptualmodels verified by practitioners to interpret, compare, and contrast different regression testingtechniques. [8] conducted an in-depth case study on the procedures undertaken at a large soft-ware company to search for a relevant regression testing technique and to evaluate the benefitsof introducing it into the testing process at the company. This study further emphasises theneed for support in matching the communication of empirical evidence in regression testing withguidelines for identifying context constraints and desired effects that are present in practice.
To respond to this need, in this paper, we review the literature from a relevance and applica-bility perspective. Using the existing literature reviews as a seed set for snowball sampling [20],we identified 1068 papers on regression testing, which are potentially relevant for our study. Togain as many insights as possible about relevance and applicability we have focused the reviewon large-scale industrial evaluations of regression testing techniques, as these studies in manycases involve stakeholders and are more likely to report these issues.
Both relevance and applicability are relative to a context, and we are not striving to find ageneral definition of the concepts. In our study, we are extracting factors that may support a prac-titioner (or researcher) in assessing relevance and applicability in their specific cases. We definerelevance as a combination of desired (or measured) effects and addressed context factors andinclude every such factor that have been reported in the included studies. Similarly, applicabil-ity, or the cost of adopting a technique, may be assessed by considering the information sourcesand entities utilised for selecting and/or prioritising regression tests. For each of these facets,we provide a taxonomy to support classification and comparison of techniques with respect toindustrial relevance and applicability of regression testing techniques.
The original research questions stem from an industry-academia collaboration1 (involvingthree companies and two universities) on decision support for software testing. Guided by theSERP-test taxonomy [75], a taxonomy for matching industrial challenges with research resultsin software testing, we elicited nine important and challenging decision types for testers, ofwhich three are instances of the regression testing challenge as summarised by [17]: regressiontest minimisation, selection, and prioritisation. These challenge descriptions (i.e., the genericproblem formulations enriched with our collaborators’ context and target descriptions) guidedour design of the study.
To balance the academic view on the regression testing literature, we consulted practition-ers in all stages of the systematic review (i.e., defining the research questions, inclusion andexclusion criteria, as well as the taxonomies for mapping selected papers).
The main contributions provided in this report are:
• three taxonomies designed to support the communication of regression testing researchwith respect to industrial relevance and applicability, and
1EASE- the Industrial Excellence Centre for Embedded Applications Software Engineering http://ease.cs.lth.se/about/
74

• a mapping of 26 industrially evaluated regression testing techniques (in total 38 differentpapers) to the above-mentioned taxonomies.
The remainder of the paper is structured as follows: Section 4.2 summarises previous re-search on assessing the industrial relevance of research. It also presents an overview of existingsystematic literature reviews on regression testing. Research questions raised in this study arepresented in Section 4.3. Section 4.4 and Section 4.5 detail the research approach used in thestudy and its limitations, respectively. Sections 4.6 to 4.8 present the results of this research.Section 4.9 and Section 4.10 present advice for practitioners and academics working in the areaof regression testing. Section 4.11 concludes the paper.
4.2 Related workIn this section, we briefly describe related work that attempts to evaluate the relevance of softwareengineering research for practice. We also discuss existing reviews on regression testing with aparticular focusing on the evaluation of the industrial relevance of proposed techniques.
4.2.1 Evaluation of the industry relevance of researchSoftware engineering being an applied research area continues to strive to establish the industrialpractice on scientific foundations. Along with the scientific rigour and academic impact, severalresearchers have attempted to assess the relevance and likely impact of research on practice.
[62] proposed a method to assess the industrial relevance of empirical studies included ina systematic literature review. The criteria for judging relevance in thier proposal evaluates therealism in empirical evaluations on four aspects: 1) subjects (e.g. a study involving industrialpractitioners), 2) context (e.g. a study done in an industrial settings), 3) scale (e.g. evaluation wasdone on a realistic size artifacts) and 4) research method (e.g. use of case study research). Severalsystematic reviews have used this approach to assess the applicability of research proposals inindustrial settings (e.g. [1, 85]).
Other researchers have taken a different approach and have elicited the practitioners’ opiniondirectly on individual studies ( [59–61]). In these studies, the practitioners were presented asummary of the articles and were asked to rate the relevance of a study for them on a Likertscale.
The Impact project was one such initiative aimed to document the impact of software en-gineering research on practice [46]. Publications attributed to this project, with voluntary par-ticipation from eminent researchers, covered topics like configuration management, inspectionsand reviews, programming languages and middle-ware technology. The approach used in theproject was to start from a technology that is established in practice and trace its roots, if possi-ble, to research [46]. However, the last publications indexed on the project page2 are from 2008.
2https://www.sigsoft.org/impact.html
75

Chapter 4. On the search for industry-relevant regression testing research
One of the lessons learned from studies in this project is that the organisations wanting to repli-cate the success of other companies should “mimic successful companies’ transfer guidelines”( [40, 46]). Along those lines, the study presently read attempts to identify regression testingtechniques with indications of value and applicability from industrial evaluations [57].
To address the lack of relevance, close industry-academia collaboration is encouraged ([19, 46, 57]). One challenge in this regard is to make research more accessible to practition-ers by reducing the communication-gap between industry and academia [75]. SERP-test [75] isa taxonomy designed to support industry academia communication by guiding interpretation ofresearch results from a problem perspective.
4.2.2 Reviews of regression testing researchWe identified eleven reviews of software regression testing literature ( [16, 17, 36, 39, 43, 54,66, 70, 72, 78, 79]). Most of these reviews cover regression testing literature regardless ofthe application domain and techniques used. However, the following four surveys have a nar-row scope: [43] and [16] target testing web-based applications, and [70] focus on identifyingsecurity-related issues, while [79] only considers literature where researchers have used GeneticAlgorithms for regression testing. The tertiary study by [68] only maps the systematic literaturestudies in various sub-areas of software testing including regression testing. Instead of focusingonly on regression testing research, [47] reviewed the literature on test case selection in general.They identified that only six of the selected studies were performed on large-scale systems, andonly four of these were industrial applications.
In the most recent literature review, [54] reviewed empirical research on regression testingof industrial and non-industrial systems of any size. They mapped the identified research to thefollowing dimensions: evaluation metrics used in the study, the scope of the study, and what theyhave termed as the theoretical basis of the study (research questions, regression testing technique,SUT, and the dataset used). Their approach indicates a similar aim as other literature reviews:to identify “the most effective” technique considering the measures of “cost, coverage and faultdetection”. However, they do not take into consideration the aspect of the relevance and likelyapplicability of the research for industrial settings.
Among the identified reviews, only five discuss aspects related to the industrial application( [17, 36, 66, 72, 78]). [78] found that 64% of the included 120 papers used datasets from in-dustrial projects in their evaluation. They further recommend that future evaluations should bebased on non-proprietary data sets that come from industrial projects (since these are represen-tative of real industrial problems) [79]. [17] identified that a large majority of empirical studiesuse a small set of subjects largely from the SIR3 repository. They highlight that it allows com-parative/replication studies, and also warn about the bias introduced by working with the samesmall set of systems. Similarly, [72] concluded that most empirical investigations are conductedon small programs, which limits the generalisation to large-systems used in industry. [36] alsofound that 50% of the 65 selected papers on regression test prioritisation included in their review
3Software Infrastructure Repository http://sir.unl.edu/
76

use SIR systems. Furthermore, 29% of the studies use the same two systems from the repository.[66] reviewed the state of research and practice in regression testing. Authors presented
the synthesis of main regression testing techniques and found that only a few techniques andtools developed by the researchers and practitioners are in use of industry. They also discussedthe challenges for regression testing and divided the challenges into two sets (transitioning chal-lenges and technical/conceptual issues). Along with the review of research on regression testingauthors also presented the results of their discussions (an informal survey) with researchers andpractitioners. They were intended to understand the impact of existing regression testing researchand the major challenges to regression testing.
Unlike existing literature reviews, this study has an exclusive focus on research conducted inindustrial settings. This study provides taxonomies to assist researchers in designing and report-ing research to make the results more useful for practitioners. Using the proposed taxonomiesto report regression testing research, will enable synthesis in systematic literature reviews andhelp to take the field further. One form of such synthesis will be the technological-rules [33](as extracted in this paper) with an indication of the strength-of-evidence. For practitioners,these taxonomies allow reasoning about the applicability of research for their own unique con-text. The study also presents some technological-rules that are based on the results of this studywhich practitioners can consider research-informed recommendations from this study.
4.3 Research questionsIn this study, we aggregate information on regression testing techniques that have been evaluatedin industrial contexts. Our goal is to structure this information in such a way that it supportspractitioners to make an informed decision regarding regression testing with a consideration fortheir unique context, challenges, and improvement targets. To achieve this goal we posed thefollowing research questions:RQ1: How to describe an industrial regression testing problem? Regression testing challengesare described differently in research ( [38]) and practice ( [74]). To be accessible and relevant forpractitioners, research contributions in terms of technological rules ( [33]) need to be interpretedand incorporated into a bigger picture. This, in turn, requires alignment in both the abstrac-tion level and the terminology of the academic and industrial problem descriptions. To providesupport for such alignment, we develop taxonomies of desired effects and relevant context fac-tors by extracting and coding knowledge on previous industrial evaluations of regression testingtechniques.RQ2: How to describe a regression testing solution? Practitioners need to be able to compareresearch proposals and assess their applicability and usefulness for their specific contexts. Forthis purpose, we extract commonalities and variabilities of research proposals that have beenevaluated in industry.RQ3: How does the current research map to such problem description? To provide an overviewof the current state of the art, we compare groups of techniques through the lens of the tax-onomies developed in RQ1 and RQ2.
77

Chapter 4. On the search for industry-relevant regression testing research
4.4 MethodTo capture what information is required to judge the industrial-relevance of regression testingtechniques, we relied on: 1) industrial applications of regression testing techniques reported inthe literature, 2) existing research on improving industry-academia collaboration in the area ofsoftware testing, 3) and close cooperation with practitioners.
To develop the three taxonomies presented in Section 4.6 and 4.7 and arrive at the resultspresented in Section 4.8 we conducted a systematic literature review of regression testing re-search, interleaving interaction with industry practitioners throughout the review process.
The process followed can be divided into six steps, which are visualised in Figure 4.1. Re-search questions were initially formulated within a research collaboration on decision supportfor software testing (EASE). To validate the research questions and the approach of constructinga SERP taxonomy [75] a pilot study was conducted (Step 1, Section 4.4.3). Based on the pilotstudy, a preliminary version of the taxonomy was presented to the researchers and practitionersin EASE, together with a refined study design for the extensive search. Through the extensivesearch of the literature (Step 2, Section 4.4.4) we identified 1068 papers on regression testing.This set was then reduced (Step 3, Section 4.4.5) by iteratively coding and excluding paperswhile refining the taxonomy (Step 4, Section 4.4.6). Finally, the constructed taxonomies wereevaluated in a focus group meeting (Step 5, Section 4.4.7) and the regression testing techniquesproposed in the selected papers were mapped to the validated version of the taxonomies (Step 6,Section 4.4.8).
4.4.1 Practitioners’ involvementAs shown in Figure 4.1 (ovals with shaded background), practitioners were involved in threesteps. For validating the selection criteria (Step 3a) a subset of selected papers was validatedwith practitioners. In Step 4a, the initial taxonomy was presented to EASE partners in a meeting.This meeting was attended by five key stakeholders in testing at the case companies. In Step 5,for taxonomy evaluation, we relied on a focus group with three key practitioners. The threepractitioners came from two companies which develop large-scale software-intensive productsand proprietary hardware. The participating companies are quite different from each other; SonyMobile Communications has a strict hierarchical structure, well-established processes and tools,and is globally distributed, while the development at Axis Communications AB, Sweden stillhas the entrepreneurial culture of a small company and has less strictly defined processes. Theprofiles of the practitioners involved in the study are briefly summarized below:
Practitioner P1 is working at Axis. He has over eight years of experience in software de-velopment. At Axis, he is responsible for automated regression testing from unit to system-testlevels. His team is responsible for the development and maintenance of the test suite. Thecomplete regression test suite comprises over 1000 test cases that take around 7 hours to exe-cute. He was also involved in previous research-based initiatives to improve regression testing atAxis [76].
Practitioner P2 also works at Axis communications. He has over 12 years of software de-
78
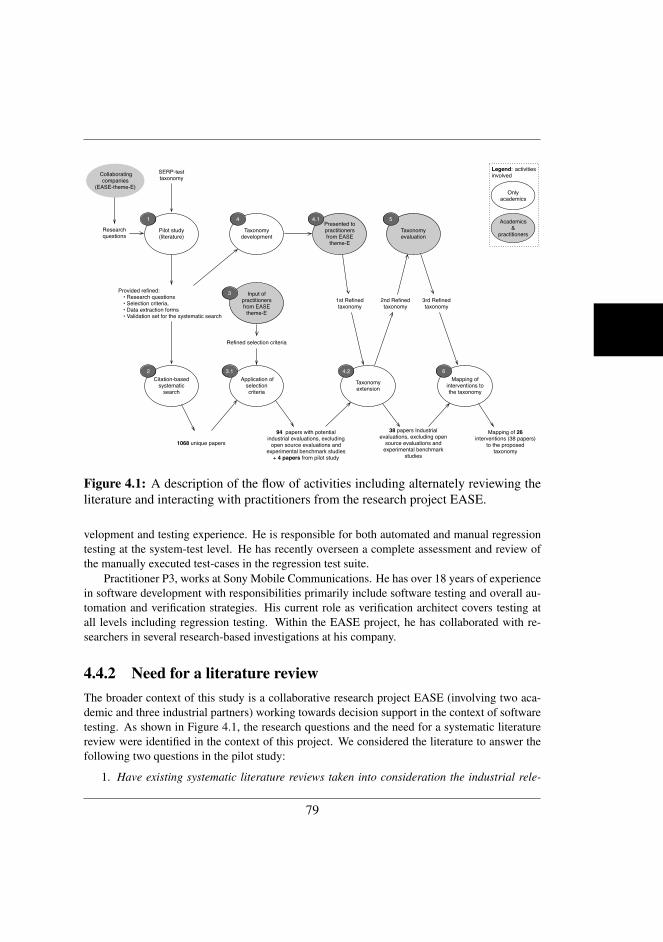
Collaborating companies
(EASE-theme-E)
Research questions
SERP-test taxonomy
Pilot study (literature)
1st Refined taxonomy
Provided refined:• Research questions• Selection criteria, • Data extraction forms • Validation set for the systematic search
Citation-based systematic
searchTaxonomy extension
2nd Refined taxonomy
Taxonomy evaluation
3rd Refined taxonomy
38 papers Industrial evaluations, excluding open
source evaluations and experimental benchmark
studies
Mapping of 26 interventions (38 papers)
to the proposed taxonomy
1068 unique papers
Presented to practitioners from EASE
theme-E
Input of practitioners from EASE
theme-E
Application of selection criteria
Refined selection criteria
4.11
2 3.1
94 papers with potential industrial evaluations, excluding
open source evaluations and experimental benchmark studies
+ 4 papers from pilot study
4.2Mapping of
interventions to the taxonomy
5
6
3
Taxonomy development
4
Legend: activities involved
Academics &
practitioners
Only academics
Figure 4.1: A description of the flow of activities including alternately reviewing theliterature and interacting with practitioners from the research project EASE.
velopment and testing experience. He is responsible for both automated and manual regressiontesting at the system-test level. He has recently overseen a complete assessment and review ofthe manually executed test-cases in the regression test suite.
Practitioner P3, works at Sony Mobile Communications. He has over 18 years of experiencein software development with responsibilities primarily include software testing and overall au-tomation and verification strategies. His current role as verification architect covers testing atall levels including regression testing. Within the EASE project, he has collaborated with re-searchers in several research-based investigations at his company.
4.4.2 Need for a literature reviewThe broader context of this study is a collaborative research project EASE (involving two aca-demic and three industrial partners) working towards decision support in the context of softwaretesting. As shown in Figure 4.1, the research questions and the need for a systematic literaturereview were identified in the context of this project. We considered the literature to answer thefollowing two questions in the pilot study:
1. Have existing systematic literature reviews taken into consideration the industrial rele-
79

Chapter 4. On the search for industry-relevant regression testing research
vance and applicability of regression testing techniques? We identified 11 systematicliterature studies ( [16, 17, 36, 39, 43, 54, 66, 70, 72, 78, 79]), and they have been brieflydiscussed in Section 4.2. These studies have not addressed the research questions of in-terest for the current study.
2. Are there sufficient papers reporting an industrial evaluation of regression testing tech-niques? Once we had established the need to analyse the existing research from theperspective of industrial relevance, we conducted a pilot study to:
• identify if there are sufficiently many published papers to warrant a systematic lit-erature review,
• develop an initial taxonomy that serves as a data extraction form in the main litera-ture review, and
• identify a set of relevant papers that serve as a validation set for our search strategyin the main literature review.
4.4.3 Pilot studyBy manually searching through recent publications of key authors (identified in previous litera-ture reviews discussed in Section 4.2) and by skimming through the top most-relevant results ofkeyword-based searches in Google Scholar, we identified 36 papers. Using a data extraction formbased on the SERP-test taxonomy [75], data were extracted from these papers. Data extractionwas done independently by at least two reviewers and results were consolidated by discussion.This validation was considered useful for two reasons: firstly, through the cross-validation, wedeveloped a shared understanding of the process. Secondly, since the results were to be used as aguide for data extraction in the main literature review, it was necessary to increase the reliabilityof this initial step.
The pilot study indicated that sufficient literature exists to warrant a systematic literaturereview. The results of analysing the extracted information were useful for formulating the dataextraction forms for the main literature review.
4.4.4 Search strategyUsing the following search string, we identified the existing systematic literature studies on re-gression test optimization as listed in Table 4.1:(“regression test” OR “regression testing”) AND (“systematic review” OR “research review”OR “research synthesis” OR “research integration” OR “systematic review” OR “systematicoverview” OR “systematic research synthesis” OR “integrative research review” OR “inte-grative review” OR “systematic literature review” OR “systematic mapping” OR “systematicmap”))
Additionally, we also used [17] survey as it has a thorough coverage (with 189 references)and is the most-cited review in the area of regression testing. Using the references in the paperslisted in Table 4.1, and the citations to these papers were retrieved in August 2016 from Google
80

Scholar. We identified a set of 1068 papers as potentially relevant papers for our study. One ofthe systematic reviews, by [54] as discussed in Section 4.2, was not used for snowball-samplingas it was published yet when the search was conducted.
Table 4.1: Systematic literature studies used as start-set for snowball sampling
ID No. of References. No. of Citations
[70] 75 5[43] 69 1[16] 71 0[79] 24 4[36] 80 14[78] 24 25[72] 73 135[47] 46 1[39] 59 0[17] 189 515
Using the 36 papers identified in the pilot-study (see Section 4.4.3) as the validation-setfor this study, we calculated the precision and recall ( [15, 53]) for our search strategy. 36papers in a validation-set are reasonable for assessing the search strategy of a systematic literaturereview [53].
Recall = 100 * (# of papers from the validation-set identified in the search) / (total # of pa-pers in the validation set).
Precision = 100 * (total # of relevant papers (after applying the selection criteria) in thesearch results) / (total # of search results).
Recall =3236∗100 = 89%
Only four of the papers in the pilot-study were not identified by our search strategy ( [18, 37, 48,49]). These papers neither cite any of the literature reviews nor were they included by any of theliterature reviews comprising the starting set for search in this study. We also included these fourpapers to the set of papers considered in this study.
As shown in Figure 4.1, after applying the selection criteria 94 relevant papers were iden-tified. These papers were used to extend the taxonomy. Using this number, we calculated theprecision of our search strategy as follows:
Precision =94
1068∗100 = 8%
An optimum search strategy should maximise both precision and recall. However, our searchstrategy had high recall (with 89% recall it falls in the high recall range, i.e. ≥ 85% [15]) andlow precision. The precision value was calculated considering the 94 papers that were used inextending the taxonomies.
81

Chapter 4. On the search for industry-relevant regression testing research
The value of recall being well above the acceptable range [15] of 80% adds confidence toour search strategy. Furthermore, such low value of precision is typical of systematic literaturereviews in software engineering e.g. approx. 5% [79] approx. 2% ( [9, 85]), and below 1%( [36, 43, 72]).
4.4.5 Selection of papers to include in the reviewWe applied a flexible design of the study and inclusion criteria were iteratively refined. Thenotion of “industrial” was further elaborated after the first iteration. To make the set of papersmore manageable, we decided to exclude open source evaluations and industrial benchmarkstudies. The assumption was that such reports contain less information about application contextand limitations in terms of technology adoption. The following inclusion-exclusion criteria werethe ones finally applied:
• Inclusion criteria: peer-reviewed publications that report empirical evaluations of re-gression testing techniques in industrial settings. It was detailed as the following, includepapers that:
– are peer-reviewed (papers in conferences proceedings and journal articles)
– report empirical research (case studies, experiments, experience reports ...)
– report research conducted in industrial settings (i.e. uses a large-scale softwaresystem, involves practitioners or reports information on the real application contextincluding the process).
– investigate regression testing optimization techniques (i.e. regression test selection,prioritization, or minimization/ reduction/ maintenance)
• Exclusion: exclude papers that:
– are non-peer reviewed (Ph.D. thesis, technical reports, books etc.)
– report a non-empirical contribution (analytical/ theoretical/ proposals)
– report evaluation in non-industrial settings.
We decided to use lines of code (LOC), if reported, as an indicator for the scale of theproblem instead of the number of test cases in the test suite or turnaround time of a test suite(and similar metrics) for the following reasons:
• LOC/kLOC is the most commonly reported information regarding the size of a SUT.
• Size and execution time of individual test cases in a test suite varies a lot, therefore, anaggregate value reporting the number of test cases or the execution time of test cases isnot very informative.
Techniques that work well on a small program may work on large programs. However,this is yet to be demonstrated. Practitioners seem to trust the results of research conducted inenvironments similar to their [2]. Previous research on assessing the industrial relevance of
82
research has also relied on the realism in the evaluation setting regarding the research method,scale, context and users ( [62, 85]).
We performed pilot selection on three papers to validate the selection criteria and to developa shared understanding among the authors. Each author independently applied the selectioncriteria on the these randomly chosen papers. We discussed the decisions and reflected on thereasons for any discrepancies among the reviewers in a group format.
After the pilot-selection, remaining papers were assigned to each author randomly to applyselection criteria. Inclusion-exclusion was performed at three levels of screening: ‘Titles only’,‘Titles and abstracts only’, and ‘Full text’. If in doubt, the general instruction was to be moreinclusive and defer the decision to the next level. Each excluded paper was evaluated by at leasttwo reviewers.
Additionally, to validate that the studies we were selecting were indeed relevant, during thepaper selection phase of this study, a sample of eight papers from the included papers was sharedwith practitioners. They labelled the paper as relevant or irrelevant for their companies andalso explained their reasoning to us. This helped us to improve the coverage of information thatpractitioners are seeking, which they consider will help them make informed decisions regardingregression testing.
After applying the selection criteria on 1068 paper and excluding open source and industrialbenchmarks we had 94 remaining papers. Four papers from the pilot-study were also added tothis list. These 98 papers were randomly assigned to the authors of this paper for data-extractionand taxonomy extension. After full-text reading and data extraction, 38 papers were includedas relevant papers (see list in Table 4.2), which represent 26 distinct techniques. All excludedpapers were reviewed by an additional reviewer.
4.4.6 Taxonomy extensionTable 4.3 presents an abstraction of the data extraction form, which was based on the first versionof our taxonomy that was developed in the pilot study (see Step-4 onwards in Figure 4.1 that pro-duced the “1st Refined taxonomy” and Section 4.4.3 for details of the pilot study). We followedthe following steps to validate the extraction form and to develop a shared understanding of it:
1. Select a paper randomly from the set of potentially relevant papers.2. All reviewers independently extract information from the paper using the data extraction
form.3. Compare the data-extraction results from individual reviewers.4. Discuss and resolve any disagreements and if needed update the data extraction form.
This process was repeated three times before we were confident in proceeding with dataextraction on the remaining set of papers.
The extracted information was used to develop extensions of SERP-test taxonomy [75] rel-evant to our focus on regression testing techniques. Separate taxonomies for “addressed contextfactors”, “evaluated effects” and “utilised information sources” were developed (shown as step4.2 in Figure 4.1). The initial version of these taxonomies was developed in a workshop where
83

Chapter 4. On the search for industry-relevant regression testing research
Study ID Reference. Study ID Reference.
S1 [76] S20 [41]S2 [37] S21 [52]S3 [48] S22 [32]S4 [49] S23 [58]S5 [81] S24 [71]S6 [35] S25 [21]S7 [23] S26 [73]S8 [22] S27 [30]S9 [13] S28 [63]S10 [11] S29 [34]S11 [14] S30 [64]S12 [12] S31 [45]S13 [24] S32 [65]S14 [27] S33 [51]S15 [28] S34 [84]S16 [26] S35 [50]S17 [29] S36 [77]S18 [25] S37 [80]S19 [42] S38 [67]
Table 4.2: The list of papers included in this study
Table 4.3: Data extraction form
Item Value Remarks
1) Meta information2) Description of testing technique3) Scope of technique4) High-level Effect/Purpose5) Characteristics of the SUT6) Characteristics of the regression testing process7) Required sources of information8) Type of required information9) Is this an industrial study?10) If yes, could the SUT be categorised as closed source?11) Is the paper within the scope of the study? If not, please explain the reason.
84

six of the authors participated. Each of the taxonomies were then further refined by two of theauthors and reviewed independently by a different pair of authors. This resulted in what is re-ferred to as “2nd refined taxonomy” in Figure 4.1. This version of the taxonomy was furthervalidated with practitioners, which is discussed in the following section.
4.4.7 Taxonomy evaluation
Once data analysis was complete, and we had created the three taxonomies presented in Sec-tion 4.6, Section 4.7 and Section 4.8, we conducted a focus group with three key stakeholdersfrom the companies (brief profiles are presented in Section 4.4.1). In this focus group, mod-erated by the second author, we systematically collected practitioners’ feedback on the contextand effect taxonomies because these two taxonomies are supposed to describe the practitioners’need.
Practitioners were asked to assess the relevance of each of the nodes in the taxonomies (aspresented in Table 4.4) and grade these from 1 to 3, where 1) means very relevant (i.e. we areinterested in this research), 2) possibly relevant and 3) means irrelevant (i.e. we are not interestedin such research). The practitioners were asked to respond based on their experience and not onlybased on their current need.
The feedback from the practitioners was taken into account, and some refinements to thetaxonomies were made based on it. As this is primarily a literature review, we decided not toadd factors that were not presented in the included papers although initial feedback pointed us torelevant factors in the studies. Neither did we remove factors completely from the taxonomies(although we removed some levels of detail in a couple of cases). The feedback was mainly usedto evaluate and improve understandability of the taxonomies and changes were mainly structural.
4.4.8 Mapping of techniques to taxonomy
As shown in Figure 4.1 after incorporating the feedback from the practitioners in the taxonomy,we mapped the 26 techniques to our multi-faceted taxonomy. The reviewer(s) (one of the authorsof the study) who were responsible for data extraction from the papers reporting the techniquemapped the paper to the taxonomy. Two additional reviewers validated the mapping, and dis-agreements were resolved through discussion and by consulting the full-text of the papers. Theresults of the mapping are presented in Table 4.5.
4.5 Limitations
In this section, we discuss validity threats, our mitigation actions, and the limitations of the study.
85

Chapter 4. On the search for industry-relevant regression testing research
4.5.1 Coverage of regression testing techniques:To identify regression testing techniques that have been evaluated in industrial settings, we usedsnowball sampling search strategy. Snowball sampling has been effectively used to extend sys-tematic literature reviews ( [69]). The decision to pursue this strategy was motivated by thelarge number of systematic literature studies (as discussed previously in Section 4.2) availableon the topic. Some of these reviews (e.g. [17] and [72]) are well cited, indicating visibility in thecommunity. This increases the likelihood of finding recent research on the topic.
The search is not bound to a particular venue and is restricted to citations indexed by Scopusand Google Scholar before August 2016. We choose Scopus and Google scholar because of theircomprehensive coverage of citations [4]. We are also confident in the coverage of the study asout of the 36 papers in the validation set, only four were not found (see Section 4.4).
To reduce the possibility of excluding relevant studies, we performed pilot selection on arandomly selected subset of papers. Furthermore, all excluded papers were reviewed indepen-dently by at least two of the authors of this paper. In cases of disagreement, the papers wereincluded in the next phase of the study, i.e. data extraction and analysis.
4.5.2 Confidence in taxonomy building process and outcomeThe taxonomies presented in this paper were based on data extracted from the included studies.To ensure that no relevant information was omitted, we tested the data extraction form on asample of papers. This helped to develop a shared understanding of the form.
Furthermore, to increase the reliability of the study, the actual data extraction (from all se-lected papers) and the formulation of facets in the taxonomies were reviewed by two additionalreviewers (authors of this paper).
As shown in Figure 4.1, the intermediate versions of the taxonomy were also presented topractitioners and their feedback was incorporated in the taxonomy. Possible confounding effectsof their participation is due to their representativeness. The impact of practitioner feedback wasmainly on the understandability and level of detail of the proposed taxonomies and a confoundingeffect could be that the understandability of the taxonomy is dependant of dealing with a contextsimilar to our practitioners’. The two companies are large-scale and the challenges they face aretypical for such contexts [75, 86]. All participants have many years of experience of testing (asdescribed in Sec 4.4.1). Therefore, their input is considered valuable for improving the validityof our study, which focuses on regression testing research of large-scale software systems.
The taxonomies presented were sufficient to capture the description of challenges and pro-posed techniques in the included studies and the practitioners consulted in this study. However,new facets may be added by both researchers and practitioners to accommodate additional con-cerns or aspects of interest.
4.5.3 Accuracy of the mapping of techniques and challengesAll mappings of included papers to the various facets of the three taxonomies were reviewedby an additional reviewer. Disagreements were discussed, and the full-text of the papers was
86
consulted to resolve them. Despite these measures, there is still a threat of misinterpretation ofthe papers, which could be further reduced for example by consulting the authors of the papersincluded in this study to validate our classification. However, due to practical reasons we did notimplement this mitigation strategy.
4.6 RQ1 – Regression testing problem descriptionIn response to RQ1, we created taxonomies of addressed context factors and desired effectsinvestigated in the included papers.
The taxonomies created in this study follow the SERP-taxonomy architecture [3], i.e. theycover four facets, intervention, context constraints, objective/effect and scope. A SERP-taxonomy,should include one taxonomy for each facet. In our case, we create the regression testing tax-onomies by extending an existing SERP-taxonomy (i.e. SERP-test [75]) by adding the detailsspecific to regression testing. More precisely, we develop extensions for three out of fourSERP facets: context factors (extends context in SERP-test), desired effects (extends objec-tive\improvements in SERP-test) and utilised information entities and attributes (extends inter-vention in SERP). We do not extend the scope taxonomy further since regression testing is initself a scope entity in SERP test, which all reviewed techniques target.
The taxonomy creation was done in three steps (considering both the researcher’s and thepractitioner’s perspective on the regression testing challenge): firstly we, together with our indus-try partners, defined an initial set of factors and targets which were important to them; secondlywe extracted information regarding these factors in the included papers and extended the tax-onomies with details provided in the reports, and finally we evaluated the extended taxonomiesin a focus group meeting with our industry partners to get feedback on its relevance and under-standability to them in their search for applicable regression testing techniques. The items of thefinal taxonomies are visible in Table 4.4
At the highest abstraction level, all categories of our proposed taxonomies were consideredrelevant when describing a regression testing challenge (i.e. characteristics of the system, thetesting process and test suite and people related factors in the context taxonomy and similarlyimproved coverage, efficiency, effectiveness and awareness in the effect taxonomy).
The taxonomies reported in this paper are the revised version that addresses the feedbackfrom this focus group. Due to the dual focus when creating the taxonomies, we believe they couldprovide guidelines for both researchers and practitioners in defining the real-world regressiontesting problems they address, or wish to address consistently to support the mapping betweenresearch and practice.
4.6.1 Investigated context factorsThe purpose of the context taxonomy can be summarised as: Provide support for identifyingcharacteristics of an industrial environment that make regression testing challenging and hencesupport the search for techniques appropriate for the context.
87

Chapter 4. On the search for industry-relevant regression testing research
Table 4.4: A taxonomy of context, effect and information factors addressed in theincluded papers and considered relevant by our industry partners
Context taxonomy Factors along Study ID
System-relatedfactors
Size e.g. Large-scale S1, S2, S5 – S35Complexity e.g. Heterogeneneous S1, S6, S9 – S12, S19, S20, S26, S29, S30, S31, S35 orCustomizeable or using product-line approach S3, S4, S6, S13 – S18, S24 – S26, S35, S38Type of the system e.g. Web-based/SOA S3, S4, S6, S30, S31, S36 Real time S3, S4, S7,S8,S13 – S18, S27 Embedded S1, S24 – S27 Database applications S19, S20, S36 Component-based S6, S9,S10,S11,S12, S31
Process-relatedTesting process (e.g. Continuous S1, S3, S4, S26)Test technique e.g. Manual testing S5, S33, Combinatorial S19, S20 Scenario-based testingS6 or Model-based testing S35
People-relatedfactors
Cognitive factors e.g. lack of experience S13 – S18, S26 or that new tools need to be easyto implement and use S22Organizational factors (e.g. Distributed development S6)
Inve
stig
ated
cont
extf
acto
rs
Effect taxonomy References
Test CoverageFeature-coverage S3,S4, S13 – S18Input (Pairwise) S19,S20
Efficiency and ef-fectiveness
Reduction of test suite S5 – S18, S23 – S25, S27 S28, S30 – S32, S35 – S37Reduced testing time S1, S3, S4, S5, S7, S8, S13 – S18, S23, S28, S29, S30, S32, S33, S36Improved precision S1, S7 – S12, S24, S25Decreased time for fault detection S2 – S4, S21, S22, S26, S29, S37Reduced need for resources S2, S13 – S18, S29, S30Fault detection capability S7, S8, S13 – S21 – S4, S24 – S26, S28, S29, S34Severe fault detection S3, S4, S21Reduced cost of failure S9 – S12, S19, S20, S33
AwarenessTransparency of testing decisions S26
Des
ired
effe
cts
Information taxonomy References
RequirementsNo. of changes in a requirement, Fault impact, Subjective implementation complexity,Perceived completeness, Perceived traceability S21Customer assigned priority S21, S33
Design artefactsSystem models S13 – S18, S27, S35Code dependencies S19,S20S37
Source codeCode changes/ Revision history S1, S2, S5, S7,S8, S24, S25, S38Source file S2, S7, S8, S30, S37No. of Contributors S32
Intermediate codeClass dependencies S6Code changes (method or class) S2, S6, S28
Binary codeRevision history S6, S29Component changes S9 – S12, S31Binary files S6, S9 – S12, S23, S29
Test casesTarget variant S26 Type of test S26 Model coverage S13 – S20 Functionality coverageS3, S4Static priority S26 Age S26 Fault detection probability (estimated) S22, S29, S33Execution time (estimated) S22, S29 Cost (estimated) S22, S33 Link to requirementsS21, S22 Link to faults S21 – S4 Link to source code S6 – S8
Test ExecutionExecution time S29, S32 Database-states S36 Invocation counts S28 Invocation chainsS28, S31 Runtime component coverage S31 Method coverage S28 Code coverage S5,S23, S29, S37 [67] S38 Browser statesS36 Class coverage S6
Test reportsExecution time S4, S13 – S18, S3, S28 Verdicts S1 – S4, S13 – S18, S26, S32, S34Severity S28, S33 Link to packages and their revisions S1 Link to branch S32 Buildtype S32 Link to failure S13 – S18 Test session S13 – S18, S26 Variant under test S32
IssuesLink to fixed file / link to source code S24, S25Fix-time S32Link to test case S24, S25, S37Failure severity S3, S4
Util
ised
info
rmat
ion
entit
iesa
ndat
trib
utes
88

Table 4.4 shows a taxonomy of contextual factors that were investigated in the includedpapers, as well as considered relevant by our industry partners. To be classified as an investigatedcontext factor the mere mentioning of it in general terms was not considered sufficient, only incases where the authors of the study include a discussion or explanation of the effect a factorhas on regression testing and why it is considered in their study we include it as an investigatedcontext factor.
Since we only include factors that have been discussed in the literature, the context taxonomyis not extensive but can still be used as a guideline for describing regression testing problemsand solutions. We identified three main categories of relevant contextual factors (system related,process related, and people related) that have been addressed in the included papers.
System related context factors
System related context factors include factors regarding the system (or subsystem) under test,such as size, complexity and type. How size and complexity are measured varies in the studies,but a common measure of size is lines of code. Factors that are reported to add to the complexityare heterogeneity and variability (e.g. in software product lines). Some techniques are designedto address the specific challenges of applying regression testing to a certain type of systems(e.g. web-based systems, real-time systems, embedded systems, databases or component-basedsystems).
In the focus group meeting, embedded systems as a type of system were considered to be arelevant factor, characterising the regression testing challenges, but the other suggested systemtypes were not - mainly on account of them not being applicable to the specific situation ofthe practitioners in the group. We interpret that the abstraction level is relevant and choose tokeep the system types in the context taxonomy only where an explanation of what makes thecontext challenging from a regression testing perspective is given in any of the included studies(i.e. system types that are mentioned but not explained from a regression testing challengeperspective are removed from the taxonomy). A similar approach was used for the other systemrelated factors of which only one, variability, was considered very important by the practitioners.
Process related context factors
Process related context factors include factors of the development or testing process that mayaffect the relevance of a regression testing technique, such as currently used processes and testingtechniques. Some regression testing techniques address new regression testing challenges arisingwith highly iterative development strategies such as continuous integration (which also was thefirst and main challenge identified by our collaborators and a starting point for this literaturereview). How testing is designed and carried out (e.g. manual, black-box, combinatorial ormodel based) may also be crucial for which regression testing technique is relevant and effective.
Of the testing process characteristics, use of a specific tool was considered irrelevant whilethe use of testing technique (all three examples) was considered very important. Thus, we re-moved the testing tool as a context characteristic and kept the examples of testing techniques,
89

Chapter 4. On the search for industry-relevant regression testing research
manual testing, and combinatorial testing. Black box testing was removed as it is covered by theinformation taxonomy. From the literature, we added two more examples of test techniques thataffect the applicability of regression testing solutions, Scenario based testing and Model basedtesting. The frequency of full regression test (i.e. how often is the complete regression test suiterun) was considered important, and we rephrased it to continuous testing in the final taxonomy.Also, size and long execution times of test suites were considered important but since it is coveredby the desired effects, we removed it from the context taxonomy.
People related context factors
People related context factors refer to factors that may cause, or are caused by, distances betweencollaborating parties and stakeholders in the development and testing of the software system. Theterminology used stems from [82]. Cognitive context factors include the degree of knowledgeand awareness, while organisational factors include factors that may cause, or are caused by,differences in goals and priorities between units.
People related issues were important to all participants in the focus group, but the messageabout which factors were most important was mixed. Ease of use got the highest score. A newnode Cultural distances was proposed as well, however, we have not found any such considera-tions in the selected set of papers, and thus did not include it in the taxonomy. This branch of thetaxonomy showed to have overlaps with the effect taxonomy (e.g. Lack of awareness and Needfor quick feedback), and we decided to remove such nodes from the context taxonomy and addthem to the effect taxonomy instead.
General reflection
A reflection about the overall context taxonomy is that it is not obvious which characteristicsare relevant to report from a generalisation perspective. Even in industrial studies, the problemdescriptions are in many cases superficial and many context factors are mentioned without anyfurther explanation as to why they are relevant from a regression testing perspective. Somefactors mentioned are crucial only to the technology being evaluated, and not necessarily anobstacle preventing the use of other technologies. One such example is the type of programminglanguage - it was initially added to the taxonomy, as it is a commonly reported aspect of the casesused for empirical evaluation. However, it was finally removed as it was considered a part of theconstraints of a solution, rather than characterising trait of the addressed problem context.
4.6.2 Desired effectsThe desired effect of a technique is basically about the reported types of improvement(s) achievedby applying the technique, such as ‘improving efficiency’ or ‘decreasing execution time’. To berecognised as a desired effect, in our setting, the effect of the technique has to be evaluatedin at least one (industrial/large scale) case study, rather than just being mentioned as a target
90

of the technique without any evidence. Accordingly, the effect has to be demonstrated as ameasurement showing the effect of the proposed technique on regression testing.
Table 4.4 shows a taxonomy of effect (-target) factors. The proposed effect taxonomy pro-vides a categorisation of the various effects (improvements) identified in the research while si-multaneously, it meets the level of information (or detail) required (or considered relevant) byour industrial partners. The improvements (effects) of techniques are categorised into three maincategories: Improved test coverage, Improved efficiency and effectiveness and increased aware-ness.
Improved test coverage
Improved coverage refers to the effects aiming at improving (increasing) the coverage of anytype of entity by the selected test suite. The type of entity, which is under consideration, dependson the context and the proposed solution. We identified two main desired effects for coveragein the included papers, namely increased feature coverage and improved combinatorial-inputcoverage (Pairwise).
Improved efficiency and effectiveness
Efficiency and effectiveness cover cost reduction factors such as reduced number of test casesand reduced execution time with a consideration for how comprehensively faults are detected. Inprinciple, efficiency does not look into how well a testing technique reveals or finds errors andfaults. Improving only the efficiency of a technique will lead to a testing activity that requiresless amount of time or computational resources, but it may not be effective (i.e. comprehensivelydetect faults). Efficiency and Effectiveness are often distinguished in the research literature,while in practice they are equally important objectives and are most often targeted at the sametime. Thus, we treat them as one class in our taxonomy. Reduction of test suite often leads toa set of test cases requiring less resource (memory) and less amount of time to be generated,executed, and analysed. Note that test suite reduction in the research literature is often referredto as a technique as such ( [17]). It is then used interchangeably with test suite maintenancereferring to the permanent removal of test cases in contrast to the temporary removal or orderingof test cases in “test case selection” or “test case prioritisation. However, “reduction of thenumber of test cases” is at the same time the most common measure of the effectiveness of aregression test selection technique in industrial evaluations. It is used in evaluation of regressiontesting techniques when comparing with the current state of practice (both in the maintenancecase and the selection case) in a particular context. Thus, we add it as a desired effect in ourtaxonomy.
Reduction of testing time considers any time/resource-related aspect, also referred to as ‘cost’in some studies. Improved precision refers to the ability of a selection technique in avoiding non-fault revealing test cases in the selection. High precision results in a reduction of test suite whileit also indicates a large proportion of fault detecting test cases. Hence, precision is considered ameasure of both efficiency and effectiveness. Decreased time for fault detection i.e. the aim is
91
Chapter 4. On the search for industry-relevant regression testing research
to reduce the time it takes to identify faults, which is relevant when reflecting on the outcomesof a prioritisation technique for regression testing. Reduced need for resources i.e. reduces theconsumption of a resource e.g. memory consumption. Improved fault detection capability alsoreferred to as ‘recall’ or ‘inclusiveness’, measures how many faults are detected regardless oftheir severity. Improved detection of severe faults refers to the extent to which a technique canidentify severe faults in the system. Reduced cost of failures, here the focus is on the consequence(measured in cost factors) of false negatives in the selection.
Increased awareness
Increased awareness refers to improvements related to the testing process (activities) per se andthe people involved in the process. Improved transparency of testing decisions has been con-sidered in the existing research and identified as a relevant target by our industrial partners. Itaims at transparently integrating regression testing techniques into daily/normal developmentactivities such that the stakeholders understand the working of the technique and trust the rec-ommendations regarding the test-cases they produce.
General reflection
A general reflection regarding the effect-taxonomy is that “what is measured in research is notalways what matters in practice”. The taxonomy was initially based solely on the different vari-ants of measurements used in the studies and rather fine-grained in some aspects. Different levelsof code coverage are for example a popular measurement in literature but were not consideredrelevant by the practitioners in the focus group. All proposed coverage metrics except featurecoverage were considered irrelevant by the participants. Our interpretation is not that code cov-erage is considered useless as a test design technique, but that improving code coverage is not adriver for applying regression testing (not for the practitioners and not for any of the stakeholdersin the industrial evaluations). Although code coverage is not presented as a desired effect in ourtaxonomy, it still appears as a characteristic of a technique (information attribute) since there aresome examples of techniques in our included papers that utilise measures of code coverage topropose a regression testing scope.
Regarding the variants of measurements under effectiveness and efficiency, the granularitylevel was considered too high and many of the nuances in the measurements were hard to in-terpret from a practical point of view. Only three of the low-level categories were consideredrelevant for at least one of the participants, ‘detection of severe faults’ was important for all threewhile ‘precision’ and ‘test suite reduction’ were important to one of the participants.
92

4.7 RQ2 – Regression testing solution description interms of utilised information sources
To answer RQ2, i.e., “how to describe a regression testing solution?”, we considered the follow-ing choices for developing a taxonomy: 1) based on the underlying assumptions (e.g., history-based and change-based), 2) based on the techniques (e.g., firewall, fixed-cache, and model-based), or 3) based on the required information (e.g., test case execution information, code com-plexity, and version history).
We decided in favour of the third option, in particular, because it allows for reasoning aboutwhat information is required to implement a regression testing technique. From a practitioner’spoint of view the concerns regarding: a) whether a technique would work in his/her context,and b) whether it can help achieve the desired effect, are already covered with the context andthe effect taxonomy. Thus, while the effect and context taxonomies enable narrowing downthe choice of techniques, the aim of the information taxonomy is to support practitioners inreasoning about the technical feasibility and the estimated cost of implementing a technique intheir respective unique context.
Hence, the purpose of the information taxonomy can be summarised as to provide supportin comparing regression testing solutions by pinpointing relevant differences and commonali-ties among regression testing techniques (i.e., the characteristics affecting the applicability ofa technique). We consider this classification particularly useful for practitioners as it helps oneidentify relevant techniques in their context. For example, if a certain test organisation does nothave access to source code, they can focus on techniques that do not require it.
Similarly, knowing what information is required to implement a technique, the interestedreader can: 1) identify if this information is currently available in their organisation 2) investi-gate how to derive it from other available information sources, or 3) analyse the feasibility ofcollecting it. Hence, a practitioner can make an informed decision about the applicability of atechnique in their context by considering the possibility and the cost of acquiring the requiredinformation.
The information taxonomy (as shown in Table 4.4) uses the structure <entity, information>to identify what information is required to use a certain technique. Thus, we coded the entitiesand the utilised information about their various attributes/facets used by each of the techniques.Some examples of entities, in this case, are design artefacts, requirements or source code. Therespective information about the various attributes/facets of these three example entities may in-clude dependencies between various components, the importance of a requirement to a customeror code metrics.
From the papers included in this review, the following nine entities (and different informationregarding them) were used by the regression testing techniques: 1) Requirements, 2) Designartefacts, 3) Source code 4) Intermediate code, 5) Binary code, 6) Closed defect reports, 7) Testcases, 8) Test executions, and 9) Test reports.
93

Chapter 4. On the search for industry-relevant regression testing research
4.7.1 RequirementsVery few regression testing techniques included in this study have used information related torequirements (such as the importance of required functionality for the customer). Only twopapers explicitly make use of information regarding the requirements [51, 52]. Such informationcan be coupled with requirement coverage (i.e., the number of requirements exercised by a testcase) to optimise regression testing with respect to the actual operational use of the SUT [32, 52].
The information about several attributes of requirements such as their priority and the com-plexity of their implementation are stored in requirement management systems. However, theinformation regarding requirement coverage may as well be stored in the test management sys-tem with respect to their corresponding test cases.
One reason for the lack of techniques utilizing requirements as input for regression testingcould be that often the traceability information from requirements to source code to test cases isnot maintained [31]. Furthermore, it is significantly more difficult to recreate these traceabilitylinks than, e.g., linking source code to test cases.
The following five techniques are based on the requirements and feature coverage by test-cases: RTrace [52], MPP [48, 49], TEMSA [25, 26, 29], and FTOPSIS [32].
FTOPSIS [32] uses multi-criteria decision-making as well as fuzzy logic, where both ob-jective and subjective (expert judgement) data about requirements can be used to prioritise testcases in a regression suite. Krishnamoorthi and Mary’s approach RTrace [52] expects an explicitlink between test cases and requirements for their proposal. However, they do not describe howthe case companies were documenting this information. They also do not suggest how such linkscan be generated. TEMSA [25, 26, 29] develop and use feature models and component familymodels, to ensure feature coverage in regression test selection of a software product line sys-tem. MPP [48, 49] uses the coverage of functionality of the system by individual test cases as acriterion to prioritise test cases.
4.7.2 Design artefactsWang et al. [24–29] use feature models and component feature models. These models along withan annotated classification of test cases are used for test case selection. Similar to the approachof Wang et al., Lochau et al. [50] also exploit models (in their case, delta-oriented component testmodels and integration test models). They also used existing documentation from the industrialpartners and interviews with practitioners to develop and validate these models.
For an automotive embedded system, Vost and Wagner [30] propose the use of system archi-tecture (system specifications) for test case selection. System specifications and test case traceswere used to create a mapping between components and test cases using them.
4.7.3 Source codeIn IEEE standard for software test documentation, regression testing is defined as: “selectiveretesting of a system or component to verify that modifications have not caused unintended ef-fects and that the system or components still complies with its specified requirements” [10].
94

Therefore, several regression testing techniques attempt to leverage available information to lo-calise changes in a software system that can then inform the decision of which test cases torun and in which order. Some such techniques, work with source code and its version historyto identify the change. Using source code has two advantages, first, several static and dynamicapproaches exist to link test-cases to source code (e.g. once we have localised the change, identi-fying change traversing test-cases to select or prioritise is possible). The second advantage is thatmost commercial organisations use a configuration management system. Thus, the techniquesthat utilise revision history are relevant for industrial settings.
For example, FaultTracer [67], CCB [81], Fix-cache [21, 71], EFW [22, 23], and Difference-Engine [76] utilise revision history of source code for regression testing. Similarly, THEO [65]uses the number of contributors to the code base as input.
Several techniques require access to actual source code to work. Carlson et al. [80] proposethe use of a clustering approach that computes and uses code metrics as one of the criteria fortest case prioritisation. REPiR [37] uses information retrieval techniques to prioritise test casesthat cover the changes in source code. It relies on the likelihood that similar keywords are usedin source code literal and comments as in the test cases.
GWT-SRT [64] instruments source code to be able to generate traces that are used to connecttest-cases and source code. This information along with control flow graphs (to isolate codechanges) are used for selective regression testing in the context of web applications.
4.7.4 Intermediate and binary codeIn cases when the source code is either not available, or it is not feasible to use it, there aresome techniques that work on intermediate and binary code instead of source code to localisechange between two versions of a software system. REPiR [37] and CMAG [63] use intermediatecode to identify changes. While I-BACCI [11–14], Echelon [34], OnSpot [58] and Pasala andBhowmick’s proposed technique [45] work with binaries to localise change.
4.7.5 IssuesSome techniques utilise information typically residing in issue management systems [21, 65, 71].Provided that an issue originates in a fault revealed by a test case, the attributes of that issue maybe used to recreate a link between the said test case and the source files that were updated tofix the issue [21, 71]. Herzig et al. [65] utilise information about the closed defect reports (e.g.the time it took to fix the issue) in a cost model weighing the cost of running a test case againstskipping it. The technique described by Marijan et al. [48, 49] uses the severity information fromdefect reports, prioritising test cases that reveal faults of high severity.
Among the included papers, no proposal presents an approach to recreate links betweendefect reports and mapping to related test cases. Therefore, if practitioners want to use one ofthe techniques that leverage fault coverage by test cases or other fault-related information (likethe severity of faults etc.) they must document and maintain the links between these artefacts.
95

Chapter 4. On the search for industry-relevant regression testing research
4.7.6 Test cases
Test cases refer to the specification of the tests and are static information entities (i.e., the infor-mation is documented at the design of the test and stored and maintained in a repository typicallya test management system). 50% of the evaluated techniques rely on such information. Whatattributes of the test specifications being used vary between the different techniques, but it couldbe divided into traceability information and properties of the test case per se.
Traceability information is typically used for coverage optimisation selection [11, 22, 26,32, 35, 42, 49, 52, 80, 81]; e.g. links to other information entities such as source code andrequirements, or explicit coverage targets such as model coverage [26, 42] or functionality cov-erage [49].
Three techniques utilise the property attributes of the test cases (e.g age and estimated cost)solely for test prioritisation [34, 51, 73] and hence they are not dependent on static traceabilitylinks. Two are risk-based [51, 73] while one recreates traceability links dynamically [34], seeSection 4.7.7.
4.7.7 Test executions
Test executions refer to an implicit information entity, meaning that its information attributes maybe dynamically collected but are not stored and maintained for other purposes. Just as for the‘Test cases’ described above the attributes of the ‘Test executions’ could be divided into coverageinformation (e.g. ‘invocation chains’ [45, 63], ‘covered system states’ [77], ‘runtime componentcoverage’ [45] and ‘code coverage’ [34, 35, 58, 63, 67, 80, 81] ) and intrinsic properties of theexecutions (e.g. ‘execution time’ [34, 65], or ‘invocation counts’ [63])
Dynamically collected coverage information is used for similarity-based and coverage-basedoptimisation of regression tests [77, 80, 81] as well as change-based prediction of regressionfaults [34, 58, 67] while dynamically collected property attributes of the test executions aretypically used for history-based cost optimisation of regression tests faults [63, 65].
4.7.8 Test reports
Test reports refer to the static records of the test executions, this information could either beautomatically captured or entered manually by the testers. Such attributes are used for history-based optimisation of regression tests and most commonly used for regression test optimisationare verdicts [26, 49, 65, 73, 76, 84], time stamps [26, 49, 63] and links to the tested systemconfiguration [65, 76]. Several information attributes of the test reports are similar to the testexecution attribute or the test case attribute, but differ in how it is derived and maintained. Asan example, test execution time could be an attribute of all three test information entities but asan attribute of a test case it is an estimation; as an attribute of a test execution, it is measured atruntime; and as an attribute of the test report, it is further recorded and maintained.
96

4.8 RQ3 – Mapping of current research
26 different techniques (reported in 38 papers) were classified under three taxonomies: context,effect and information (see Table 4.4). This mapping (see Table 4.5) helps to select techniquesthat address relevant context factors and deliver the target benefits for a given scope (regressiontest selection, prioritization or minimization). The information taxonomy helps to reason aboutwhether the information is available or can be reasonably acquired in the unique context of aparticular company. We demonstrate the use of this taxonomy in Section 4.9 in the form oftechnological rules [33] derived from this mapping (see Section 4.9.
4.8.1 Addressed context factors
In terms of system-related factors, when describing the context where the proposed techniquesare applicable, 22 of the included techniques consider the scalability of techniques for large-scalesoftware systems. Another 13 techniques take the complexity and the type of system under testinto account. 9 techniques consider process related context factors. While only 4 techniquesconsider people-related factors.
4.8.2 Desired effects
Most techniques (25 out of the total 26) target improved effectiveness and efficiency in termsof finding known faults. Three techniques focus on improving coverage (which is considered aproxy for achieving confidence in the testing or confirming the quality of a system). Only onetechnique targets increased awareness in the decision-making process in the scope of regressiontesting.
4.8.3 Information sources
Except regression testing techniques that rely solely on the history of test-cases, most techniquesuse information beyond the test cases to select, prioritise or minimise the regression testing suite.Such approaches rely on documented/generated links between test cases and other artefacts.The 26 techniques included in this study utilise information contained in nine different types ofsoftware engineering artefacts.
Only two and five techniques use information related to requirements and design artefacts,respectively. Attributes of source code are used in nine techniques while seven techniques onlyrely on intermediate or binary code among other information sources. Ten techniques use infor-mation about test cases. Moreover, ten and eight techniques use information from test executionsand test reports. Only four techniques make use of the issue reports.
97

Chapter 4. On the search for industry-relevant regression testing research
Table 4.5: Mapping of techniques to the taxonomy
Technique Study ID ScopeAddressedcontext fac-tors
Desiredeffects
Utilised information (entities)
Sele
ctio
n
Prio
ritiz
atio
n
Min
imiz
atio
n
Syst
em-r
elat
ed
Proc
ess-
rela
ted
Peop
le-r
elat
ed
Test
cove
rage
Effi
cien
cyan
dE
ffec
tiven
ess
Aw
aren
ess
Req
uire
men
ts
Des
ign
arte
fact
s
Sour
ceco
de
Inte
rmed
iate
code
Bin
ary
code
Test
case
s
Test
exec
utio
n
Test
repo
rts
Issu
es
TEMSA S13 – S18 ! ! ! ! ! ! ! ! ! !
History based prioritization(HPro)
S26 ! ! ! ! ! ! ! ! !
classification tree testing(DART)
S19, S20 ! ! ! ! ! ! !
I-BACCI S9 – S12 ! ! ! !
Value based S33 ! ! ! ! ! ! !
multi-perspective prioritisa-tion (MPP)
S3, S4 ! ! ! ! ! ! ! !
RTrace S21 ! ! ! ! !
Echelon S29 ! ! ! ! ! !
Information retrieval(REPiR)
S2 ! ! ! ! !
EFW S7, S8 ! ! ! ! ! !
Fix-cache S24, S25 ! ! ! ! !
Most Frequent Failures S34 ! ! ! !
Continuous Multi-scale Ad-ditional Greedy prioritisa-tion (CMAG)
S28 ! ! ! ! ! ! !
GWT-SRT S30 ! ! ! !
Clustering (based on cover-age, fault history and codemetrics)
S37 ! ! ! ! ! ! !
FTOPSIS S22 ! ! ! ! !
Difference engine S1 ! ! ! ! ! !
Change and coverage based(CCB)
S5 ! ! ! ! ! !
Similarity based minimisa-tion
S36 ! ! ! !
THEO S32 ! ! ! ! ! ! !
DynamicOverlay / OnSpot S23 ! ! ! ! !
Class firewall S6 ! ! ! ! ! ! ! ! !
model-based architecturalregression testing
S35 ! ! ! ! !
component interaction graphtest case selection
S31 ! ! ! ! !
keyword-based-traces S27 ! ! ! !
FaultTracer S38 ! ! ! !
98

4.9 Suggestions for practitioners
Practitioners may utilise the results of this study in different ways. The mappings of techniquesto each category may guide the practitioner looking for relevant research. The taxonomies couldalso be used to compare a set of possible solutions found in the research, or those designed byengineers at a company.
In Table 4.4, three taxonomies for describing regression testing problems and techniqueswere introduced. In Table 4.5, we present a mapping of the included papers to the three tax-onomies. A practitioner can use the taxonomies and the mapping to identify recommendationsthat are likely to help them design a solution in their unique context. The mapping of techniquesto the three taxonomies may be read as technological rules [33] i.e., “To achieve <effect> in<context> apply <technique>”, which in turn should be interpreted as recommendations (oradvise) extracted from research.
Such rules could be formulated in detail for a single technique (i.e. one row in the mapping,as in example TR1) or with fewer details for a set of techniques (by including only the commondenominators for that set, TR2) or in more general terms by selecting nodes at a higher level inthe taxonomy (TR3). Three illustrative examples (TR1-3) are given:
TR 1: To reduce the regression test suite and testing time when regression testing large scalesoftware systems utilise the following information attributes: #contributors of a piece ofcode, measured execution time, verdict, build type, variant under test and link to testedbranch from test reports and fix time in issue reports. This example was extracted froman evaluation of a tool called THEO ( [65]).
TR 2: To increase feature coverage, reduce testing time and improve fault detection capabil-ity when regression testing customisable, real-time systems, utilise information aboutverdicts and execution time in test reports. (This rule is based on the intersection ofthe classification of two different techniques, Multi-perspective prioritisation [49] andTEMSA [28], which have been evaluated in several studies [24–29, 48, 49].)
TR 3: To improve efficiency and effectiveness when regression testing large scale complex sys-tems, utilise information attributes of the test reports. (This rule is a generalisation of TR2and is supported by the same studies and another two [73, 76].)
From the research communication perspective, we argue that formulating such rules (albeitby compromising some details) will help to communicate our research in particular to industrypractitioners.
By selecting the most important aspects of the two problem-defining taxonomies (i.e. de-sired effects and addressed context factors), for the organisation, one or more research-basedrecommendations (in terms of technological rules) may be extracted from the mapping in thisstudy together with pointers to the matching literature. These recommendations could then beused as input to the design of the specific solution for the organisation.
99

Chapter 4. On the search for industry-relevant regression testing research
4.10 Recommendations for researchersAs for testing, in general, the value of a regression testing technique could be measured eitherin terms of its ability to increase confidence in testing or in terms of its ability to improve faultdetection with limited time and resources. Those high-level goals are shared by researchersand practitioners but with some variations when it comes to details and priorities [88]. Therecommendations given here are based on our comparison of what we found in the literature andthe feedback from our industry partners.
Evaluate coverage of regression testing techniques at the feature level Confidenceis achieved by measuring any type of coverage. However, of the facets of our effect taxonomy,coverage was the least important for the practitioners and at the detailed level of our taxonomyonly feature coverage was considered relevant. This is also reflected in the literature [26, 37, 49].Few techniques were evaluated with respect to coverage and of the few the majority focused onfeature coverage.
Focus evaluation on the detection of severe faults and reduction of cost From thepractitioners’ perspective, the ability of a technique to detect severe faults and to reduce costin terms of man- and machine-time was considered more important. While confidence, andcoverage, always being priorities in the design of new tests, the pursuit of trust in the regressiontest suite is often the root cause of increasing costs and decreasing the effectiveness of regressiontesting - as more and more test cases are added just in case [74]. Hence, the main driver formost industrial studies on regression testing is cost reduction and precision of regression testing.70% of the techniques in our study were evaluated with respect to cost reduction. Furthermore,effectiveness should be considered in terms of the number of severe faults, rather than in thenumber of faults in general as there is also a cost-benefit trade-off in the issue backlog. Only40% of the techniques in our study were evaluated with respect to fault detection and of thoseonly two considered severity [49, 52].
Report addressed context factors in industrial evaluations To support generalisa-tion of results between industrial contexts, relevant contextual factors need to be identified andclearly reported. Here relevant context factors denote context factors that are either causing theproblems to be solved or affecting the applicability or effect of the solution. Such relevance maybe observed or assumed by the stakeholder or the researcher.
Despite being a selection of industrial evaluations, reporting the context factors seems to beof low priority. In 10% of the evaluations, we did not find any context descriptions at all. Forthe remaining 90% at least system factors such as size, complexity and type of system under testare reported. Only 30% described the current process, which will affect (or be affected by) theadoption of the technique and only 15% reported people-related factors.
Rather than providing a general and extensive description of the case context, as proposed inprevious research [44] we recommend a careful selection of context factors to report and discuss.Such selection could be guided by the context-taxonomy provided in Table 4.4.
100

Study if and how the proposed context factors are relevant In most cases, the rel-evance of the context factors described in the included papers is assumed rather than observed.Furthermore, they are described on a rather high abstraction level. Thus, there is room for moreresearch on the relevance of various context factors for regression testing.
Study people-related factors As a research area struggling to gain traction in indus-try [55, 56, 83] we believe that there is a need to investigate people-related factors. The needfor transparency and understandability that leads to trust in the results of regression testing tech-niques was highlighted by the industry partners. Only one study in our included set has inves-tigated these factors [73]. Future research in this direction that takes into account the needsand concerns of potential users may increase the likelihood of successful adoption of regressiontesting techniques in the industry.
4.11 ConclusionIn this paper, we report an extensive search for and an in-depth analysis of applicability and rel-evance of regression testing techniques reported in the literature. We focused on techniques thathave been applied to large-scale software systems in industrial contexts. Based on the literaturereview and in collaboration with our industrial partners, we propose three taxonomies that enablepractitioners and researchers to assess and compare the relevance and applicability of regressiontesting techniques for a given industrial context.
The taxonomies extend three out of the four facets of the SERP-test taxonomy [75]: i.e.addressed context factors, desired improvements and characteristics of the techniques from anapplicability point of view (required information and underlying assumptions). It allows for char-acterisation of regression techniques and helps to determine which of these techniques could besuitable in a given context and to indicate what benefits could be expected from its application.The identification of information needs for these techniques further assists a reader to reasonabout the implications regarding the cost of adoption [87]. In this report, we apply the tax-onomies on the 38 papers that are included in the review. However, initially, we identified morethan 1000 papers on regression testing and there are many techniques, not included in the review,that may still be relevant and applicable in some industrial contexts. The aim of the taxonomiesis to support assessment also of them and of new proposals or adaptations of techniques.
In our interaction with the practitioners, we identified some discrepancies in researchersfocus and the perceived needs in the industry. One such example is the commonly used measureof effectiveness in terms of various levels of code coverage. Some types of information (suchas coverage information) that are extensively studied in the literature were found to be onlypartially relevant to the practitioners (e.g., only at the feature level) for evaluating the benefits of aregression testing technique. At the same time, some extremely relevant information in choosingtechnique (e.g. the context information) is completely neglected in some existing studies.
For academia, this study can help to use evaluation criteria and contexts that are representa-tive of industrial needs. This work also supports reporting the research results to facilitate readers
101

Chapter 4. On the search for industry-relevant regression testing research
making an informed decision with a consideration for relevance to their context, potential bene-fits and the likely investment required to use the technique.
AcknowledgementsThe authors would like to thank the industry partners from Axis Communications AB, Swe-den and Sony Mobile Communications, Sweden for their time, input and feedback throughoutthis study. We also thank Serge Demeyer for reviewing the manuscript and providing improve-ment proposals. This work has been supported by ELLIIT, a Strategic Area within IT andMobile Communications, funded by the Swedish Government. Support has also come fromEASE, the Industrial Excellence Centre for Embedded Applications Software Engineering. Thework of Mohammad Reza Mousavi and Masoumeh Taromirad has been partially supported by(Vetenskapsradet) award number: 621-2014-5057 (Effective Model-Based Testing of ConcurrentSystems) and by the Swedish Knowledge Foundation (Stiftelsen for Kunskaps- och Kompeten-sutveckling) in the context of the AUTO-CAAS HOG project (number: 20140312).
102

4.12 References[1] H. Munir, M. Moayyed, and K. Petersen, “Considering rigor and relevance
when evaluating test driven development: A systematic review,” Information andSoftware Technology, vol. 56, no. 4, pp. 375–394, Apr. 2014. [Online]. Available:http://linkinghub.elsevier.com/retrieve/pii/S0950584914000135
[2] M. V. Zelkowitz, D. R. Wallace, and D. Binkley, “Culture conflicts in software engineeringtechnology transfer,” in NASA Goddard Software Engineering Workshop. Citeseer, 1998,p. 52.
[3] K. Petersen and E. Engstrm, “Finding relevant research solutions for pracitical problems- the SERP taxonomy architecture,” in International Workshop on Long-term IndustrialCollaboration on Software Engineering (WISE 2014).
[4] M. Thelwall and K. Kousha, “ResearchGate versus Google Scholar: Which finds moreearly citations?” Scientometrics, vol. 112, no. 2, pp. 1125–1131, Aug. 2017. [Online].Available: https://link.springer.com/article/10.1007/s11192-017-2400-4
[5] A. Rainer, T. Hall, and N. Baddoo, “A preliminary empirical investigation of the use ofevidence based software engineering by under-graduate students.” in Proceedings of the10th International Conference on Evaluation and Assessment in Software Engineering.[Online]. Available: https://uhra.herts.ac.uk/dspace/handle/2299/2270
[6] A. Rainer, D. Jagielska, and T. Hall, “Software engineering practice versus evidence-based software engineering research,” in Proceedings of the ACM Workshop on Realisingevidence-based software engineering (REBSE ’05), pp. 1–5. [Online]. Available:http://doi.acm.org/10.1145/1082983.1083177
[7] A. Rainer and S. Beecham, “A follow-up empirical evaluation of evidence based soft-ware engineering by undergraduate students,” in Proceedings of the 12th InternationalConference on Evaluation and Assessment in Software Engineering.
[8] E. Engstrm, R. Feldt, and R. Torkar, “Indirect effects in evidential assessment: a casestudy on regression test technology adoption,” in 2nd international workshop on Eviden-tial assessment of software technologies, pp. 15–20.
[9] H. Edison, N. B. Ali, and R. Torkar, “Towards innovation measurement in the softwareindustry,” Journal of Systems and Software, vol. 86, no. 5, pp. 1390–1407, 2013.
[10] IEEE standard for software test documentation IEEE Std. 829-1983, IEEE Std., 1998.
[11] J. Zheng, L. Williams, and B. Robinson, “Pallino: automation to support regression testselection for cots-based applications,” in Proceedings of the 22nd IEEE/ACM Interna-tional Conference on Automated Software Engineering, ASE, 2007, pp. 224–233.
[12] J. Zheng, B. Robinson, L. Williams, and K. Smiley, “Applying regression test selection forcots-based applications,” in Proceedings of the 28th International Conference on SoftwareEngineering, ICSE, 2006, pp. 512–522.
103

REFERENCES
[13] ——, “A lightweight process for change identification and regression test selectionin using COTS components,” in Proceedings of the 5th International Conference onCommercial-off-the-Shelf (COTS)-Based Software Systems, ICCBSS, 2006, pp. 137–143.
[14] J. Zheng, “In regression testing selection when source code is not available,” in Proceed-ings of the 20th IEEE/ACM International Conference on Automated Software Engineer-ing, ASE, 2005, pp. 452–455.
[15] H. Zhang, M. A. Babar, and P. Tell, “Identifying relevant studies in software engineering,”Information & Software Technology, vol. 53, no. 6, pp. 625–637, 2011.
[16] A. Zarrad, “A systematic review on regression testing for web-based applications,” JSW,vol. 10, no. 8, pp. 971–990, 2015.
[17] S. Yoo and M. Harman, “Regression testing minimization, selection and prioritization: asurvey,” Softw. Test., Verif. Reliab., vol. 22, no. 2, pp. 67–120, 2012.
[18] Z. Xu, Y. Kim, M. Kim, M. B. Cohen, and G. Rothermel, “Directed test suite augmen-tation: an empirical investigation,” Softw. Test., Verif. Reliab., vol. 25, no. 2, pp. 77–114,2015.
[19] C. Wohlin, “Empirical software engineering research with industry: top 10 challenges,”in Proceedings of the 1st International Workshop on Conducting Empirical Studies inIndustry, CESI, 2013, pp. 43–46.
[20] ——, “Guidelines for snowballing in systematic literature studies and a replication insoftware engineering,” in Proceedings of the 18th International Conference on Evaluationand Assessment in Software Engineering, EASE, 2014, pp. 38:1–38:10.
[21] G. Wikstrand, R. Feldt, J. K. Gorantla, W. Zhe, and C. White, “Dynamic regression testselection based on a file cache an industrial evaluation,” in Proceedings of the Interna-tional Conference on Software Testing Verification and Validation, ICST. IEEE, 2009,pp. 299–302.
[22] L. J. White and B. Robinson, “Industrial real-time regression testing and analysis usingfirewalls,” in Proceedings of the 20th International Conference on Software Maintenance,ICSM, 2004, pp. 18–27.
[23] L. J. White, K. Jaber, B. Robinson, and V. Rajlich, “Extended firewall for regressiontesting: an experience report,” Journal of Software Maintenance, vol. 20, no. 6, pp. 419–433, 2008.
[24] S. Wang, A. Gotlieb, S. Ali, and M. Liaaen, “Automated test case selection using featuremodel: An industrial case study,” in Proceedings of the 16th International Conference onModel-Driven Engineering Languages and Systems, MODELS, 2013, pp. 237–253.
[25] S. Wang, D. Buchmann, S. Ali, A. Gotlieb, D. Pradhan, and M. Liaaen, “Multi-objectivetest prioritization in software product line testing: an industrial case study,” in Proceedingsof the 18th International Software Product Line Conference, SPLC, 2014, pp. 32–41.
104

[26] S. Wang, S. Ali, T. Yue, . Bakkeli, and M. Liaaen, “Enhancing test case prioritization in anindustrial setting with resource awareness and multi-objective search,” in Proceedings ofIEEE/ACM 38th International Conference on Software Engineering Companion, ICSE-C,2016-05, pp. 182–191.
[27] S. Wang, S. Ali, A. Gotlieb, and M. Liaaen, “Automated product line test case selection:industrial case study and controlled experiment,” Software and System Modeling, vol. 16,no. 2, pp. 417–441, 2017.
[28] S. Wang, S. Ali, and A. Gotlieb, “Cost-effective test suite minimization in product linesusing search techniques,” Journal of Systems and Software, vol. 103, pp. 370–391, 2015.
[29] ——, “Minimizing test suites in software product lines using weight-based genetic al-gorithms,” in Proceedings of the Genetic and Evolutionary Computation Conference,GECCO, 2013, pp. 1493–1500.
[30] S. Vost and S. Wagner, “Trace-based test selection to support continuous integration inthe automotive industry,” in Proceedings of the International Workshop on ContinuousSoftware Evolution and Delivery, CSED, 2016, pp. 34–40.
[31] E. J. Uusitalo, M. Komssi, M. Kauppinen, and A. M. Davis, “Linking requirements andtesting in practice,” in Proceedings of the 16th IEEE International Requirements Engi-neering, RE. IEEE, 2008, pp. 265–270.
[32] S. Tahvili, W. Afzal, M. Saadatmand, M. Bohlin, D. Sundmark, and S. Larsson, “Towardsearlier fault detection by value-driven prioritization of test cases using fuzzy TOPSIS,” inInformation Technology: New Generations, S. Latifi, Ed. Springer International Pub-lishing, 2016, pp. 745–759.
[33] M. D. Storey, E. Engstrom, M. Host, P. Runeson, and E. Bjarnason, “Using a visual ab-stract as a lens for communicating and promoting design science research in softwareengineering,” in Proceedings of ACM/IEEE International Symposium on Empirical Soft-ware Engineering and Measurement, ESEM, 2017, pp. 181–186.
[34] A. Srivastava and J. Thiagarajan, “Effectively prioritizing tests in development environ-ment,” in Proceedings of ACM SIGSOFT International Symposium on Software Testingand Analysis, ser. ISSTA ’02. ACM, 2002, pp. 97–106.
[35] ——, “A case study of the class firewall regression test selection technique on a largescale distributed software system,” in Proceedings of the International Symposium onEmpirical Software Engineering, ISESE, 2005, pp. 74–83.
[36] Y. Singh, A. Kaur, B. Suri, and S. Singhal, “Systematic literature review on regressiontest prioritization techniques,” Informatica (Slovenia), vol. 36, no. 4, pp. 379–408, 2012.
[37] R. K. Saha, L. Zhang, S. Khurshid, and D. E. Perry, “An information retrieval approachfor regression test prioritization based on program changes,” in Proceedings of the 37thIEEE/ACM International Conference on Software Engineering, ICSE, 2015, pp. 268–279.
[38] G. Rothermel and M. J. Harrold, “Analyzing regression test selection techniques,” IEEETrans. Software Eng., vol. 22, no. 8, pp. 529–551, 1996.
105
REFERENCES
[39] R. H. Rosero, O. S. Gomez, and G. D. R. Rafael, “15 years of software regression testingtechniques - A survey,” Int. J. Software Eng. Knowl. Eng., vol. 26, no. 5, pp. 675–690,2016.
[40] H. D. Rombach, M. Ciolkowski, D. R. Jeffery, O. Laitenberger, F. E. McGarry, andF. Shull, “Impact of research on practice in the field of inspections, reviews and walk-throughs: learning from successful industrial uses,” ACM SIGSOFT Software EngineeringNotes, vol. 33, no. 6, pp. 26–35, 2008.
[41] E. Rogstad, L. C. Briand, and R. Torkar, “Test case selection for black-box regressiontesting of database applications,” Information & Software Technology, vol. 55, no. 10, pp.1781–1795, 2013.
[42] E. Rogstad and L. C. Briand, “Cost-effective strategies for the regression testing ofdatabase applications: Case study and lessons learned,” Journal of Systems and Software,vol. 113, pp. 257–274, 2016.
[43] D. Qiu, B. Li, S. Ji, and H. K. N. Leung, “Regression testing of web service: A systematicmapping study,” ACM Comput. Surv., vol. 47, no. 2, pp. 21:1–21:46, 2014.
[44] K. Petersen and C. Wohlin, “Context in industrial software engineering research,” in Pro-ceedings of the 3rd International Symposium on Empirical Software Engineering andMeasurement, ser. ESEM ’09. Washington, DC, USA: IEEE Computer Society, 2009,pp. 401–404.
[45] A. Pasala and A. Bhowmick, “An approach for test suite selection to validate applicationson deployment of COTS upgrades,” in Proceedings of the 12th Asia-Pacific Software En-gineering Conference, APSEC, 2005, pp. 401–407.
[46] L. J. Osterweil, C. Ghezzi, J. Kramer, and A. L. Wolf, “Determining the impact of soft-ware engineering research on practice,” IEEE Computer, vol. 41, no. 3, pp. 39–49, 2008.
[47] E. N. Narciso, M. E. Delamaro, and F. de Lourdes dos Santos Nunes, “Test case selection:A systematic literature review,” Int. J. Software Eng. Knowl. Eng., vol. 24, no. 4, pp.653–676, 2014.
[48] D. Marijan, A. Gotlieb, and S. Sen, “Test case prioritization for continuous regressiontesting: An industrial case study,” in Proceedings of IEEE International Conference onSoftware Maintenance, 2013, pp. 540–543.
[49] D. Marijan, “Multi-perspective regression test prioritization for time-constrained environ-ments,” in Proceedings of IEEE International Conference on Software Quality, Reliabilityand Security, QRS, 2015, pp. 157–162.
[50] M. Lochau, S. Lity, R. Lachmann, I. Schaefer, and U. Goltz, “Delta-oriented model-basedintegration testing of large-scale systems,” Journal of Systems and Software, vol. 91, pp.63–84, 2014.
[51] Q. Li and B. Boehm, “Improving scenario testing process by adding value-based prior-itization: an industrial case study,” in Proceedings of the International Conference onSoftware and System Process. ACM, 2013, pp. 78–87.
106

[52] R. Krishnamoorthi and S. A. S. A. Mary, “Factor oriented requirement coverage basedsystem test case prioritization of new and regression test cases,” Information & SoftwareTechnology, vol. 51, no. 4, pp. 799–808, 2009.
[53] B. A. Kitchenham, D. Budgen, and P. Brereton, Evidence-Based Software Engineeringand Systematic Reviews. Chapman & Hall/CRC, 2015.
[54] R. Kazmi, D. N. A. Jawawi, R. Mohamad, and I. Ghani, “Effective regression test caseselection: A systematic literature review,” ACM Comput. Surv., vol. 50, no. 2, pp. 29:1–29:32, 2017.
[55] G. M. Kapfhammer, “Empirically evaluating regression testing techniques: Challenges,solutions, and a potential way forward,” in Proceedings of the 4th IEEE InternationalConference on Software Testing, Verification and Validation, ICST, 2011, pp. 99–102.
[56] N. J. Juzgado, A. M. Moreno, and S. Vegas, “Reviewing 25 years of testing techniqueexperiments,” Empirical Software Engineering, vol. 9, no. 1-2, pp. 7–44, 2004.
[57] S. T. R. Jr. and W. E. Riddle, “Software technology maturation,” in Proceedings of the 8thInternational Conference on Software Engineering, 1985, pp. 189–200.
[58] M. U. Janjua, “Onspot system: test impact visibility during code edits in real soft-ware,” in Proceedings of the 10th Joint Meeting on Foundations of Software Engineering,ESEC/FSE, 2015, pp. 994–997.
[59] D. Lo, N. Nagappan, and T. Zimmermann, “How practitioners perceive the relevanceof software engineering research,” in Proceedings of the 2015 10th Joint Meeting onFoundations of Software Engineering - ESEC/FSE 2015. Bergamo, Italy: ACM Press,2015, pp. 415–425. [Online]. Available: http://dl.acm.org/citation.cfm?doid=2786805.2786809
[60] X. Franch, D. M. Fernandez, M. Oriol, A. Vogelsang, R. Heldal, E. Knauss, G. H.Travassos, J. C. Carver, O. Dieste, and T. Zimmermann, “How do PractitionersPerceive the Relevance of Requirements Engineering Research? An OngoingStudy,” in 2017 IEEE 25th International Requirements Engineering Conference(RE). Lisbon, Portugal: IEEE, Sep. 2017, pp. 382–387. [Online]. Available:http://ieeexplore.ieee.org/document/8049144/
[61] J. C. Carver, O. Dieste, N. A. Kraft, D. Lo, and T. Zimmermann, “How PractitionersPerceive the Relevance of ESEM Research,” in Proceedings of the 10th ACM/IEEEInternational Symposium on Empirical Software Engineering and Measurement -ESEM ’16. Ciudad Real, Spain: ACM Press, 2016, pp. 1–10. [Online]. Available:http://dl.acm.org/citation.cfm?doid=2961111.2962597
[62] M. Ivarsson and T. Gorschek, “A method for evaluating rigor and industrial relevance oftechnology evaluations,” Empirical Software Engineering, vol. 16, no. 3, pp. 365–395,2011.
[63] S. Huang, Y. Chen, J. Zhu, Z. J. Li, and H. F. Tan, “An optimized change-driven regressiontesting selection strategy for binary java applications,” in Proceedings of ACM symposiumon Applied Computing. ACM, 2009, pp. 558–565.
107

REFERENCES
[64] M. Hirzel and H. Klaeren, “Graph-walk-based selective regression testing of web appli-cations created with google web toolkit,” in Gemeinsamer Tagungsband der Workshopsder Tagung Software Engineering (SE), 2016, pp. 55–69.
[65] K. Herzig, M. Greiler, J. Czerwonka, and B. Murphy, “The art of testing less withoutsacrificing quality,” in Proceedings of the 37th International Conference on Software En-gineering, ser. ICSE ’15. IEEE Press, 2015, pp. 483–493.
[66] M. J. Harrold and A. Orso, “Retesting software during development and maintenance,” inProceedings of Frontiers of Software Maintenance FoSM. IEEE, 2008, pp. 99–108.
[67] M. Gligoric, S. Negara, O. Legunsen, and D. Marinov, “An empirical evaluation andcomparison of manual and automated test selection,” in Proceedings of ACM/IEEE Inter-national Conference on Automated Software Engineering, ASE, 2014, pp. 361–372.
[68] V. Garousi and M. V. Mantyla, “A systematic literature review of literature reviews insoftware testing,” Information & Software Technology, vol. 80, pp. 195–216, 2016.
[69] K. R. Felizardo, E. Mendes, M. Kalinowski, . F. d. Souza, and N. L. Vijaykumar, “Usingforward snowballing to update systematic reviews in software engineering,” in Proceed-ings of the 10th ACM/IEEE International Symposium on Empirical Software Engineeringand Measurement, ESEM, 2016, pp. 53:1–53:6.
[70] M. Felderer and E. Fourneret, “A systematic classification of security regression testingapproaches,” International Journal on Software Tools for Technology Transfer, vol. 17,no. 3, pp. 305–319, 2015.
[71] E. Engstrom, P. Runeson, and G. Wikstrand, “An empirical evaluation of regression test-ing based on fix-cache recommendations,” in Proceedings of the 3rd International Con-ference on Software Testing, Verification and Validation, ICST, 2010, pp. 75–78.
[72] E. Engstrom, P. Runeson, and M. Skoglund, “A systematic review on regression test se-lection techniques,” Information & Software Technology, vol. 52, no. 1, pp. 14–30, 2010.
[73] E. Engstrom, P. Runeson, and A. Ljung, “Improving regression testing transparency andefficiency with history-based prioritization - an industrial case study,” in Proceedings ofthe 4th IEEE International Conference on Software Testing, Verification and Validation,ICST, 2011, pp. 367–376.
[74] E. Engstrom and P. Runeson, “A qualitative survey of regression testing practices,” inProceedings of the 11th International Conference on Product-Focused Software ProcessImprovement PROFES, 2010, pp. 3–16.
[75] E. Engstrom, K. Petersen, N. B. Ali, and E. Bjarnason, “SERP-test: a taxonomy forsupporting industry-academia communication,” Software Quality Journal, vol. 25, no. 4,pp. 1269–1305, 2017.
[76] E. D. Ekelund and E. Engstrom, “Efficient regression testing based on test history: An in-dustrial evaluation,” in Proceedings of IEEE International Conference on Software Main-tenance and Evolution, ICSME, 2015, pp. 449–457.
108

[77] P. Devaki, S. Thummalapenta, N. Singhania, and S. Sinha, “Efficient and flexible GUI testexecution via test merging,” in Proceedings of the International Symposium on SoftwareTesting and Analysis, ISSTA, 2013, pp. 34–44.
[78] C. Catal and D. Mishra, “Test case prioritization: a systematic mapping study,” SoftwareQuality Journal, vol. 21, no. 3, pp. 445–478, 2013.
[79] C. Catal, “On the application of genetic algorithms for test case prioritization: a system-atic literature review,” in Proceedings of the 2nd international workshop on Evidentialassessment of software technologies. ACM, 2012, pp. 9–14.
[80] R. Carlson, H. Do, and A. Denton, “A clustering approach to improving test case prioriti-zation: An industrial case study,” in Proceedings of the 27th IEEE International Confer-ence on Software Maintenance, ICSM. IEEE, 2011, pp. 382–391.
[81] G. Buchgeher, C. Ernstbrunner, R. Ramler, and M. Lusser, “Towards tool-support for testcase selection in manual regression testing,” in Workshops proceedings of the 6th IEEEInternational Conference on Software Testing, Verification and Validation, ICST, 2013,pp. 74–79.
[82] E. Bjarnason, K. Smolander, E. Engstrom, and P. Runeson, “A theory of distances insoftware engineering,” Information & Software Technology, vol. 70, pp. 204–219, 2016.
[83] A. Bertolino, “Software testing research: Achievements, challenges, dreams,” in Proceed-ings of the Workshop on the Future of Software Engineering, FOSE, 2007, pp. 85–103.
[84] J. Anderson, S. Salem, and H. Do, “Improving the effectiveness of test suite through min-ing historical data,” in Proceedings of the 11th Working Conference on Mining SoftwareRepositories. ACM Press, 2014, pp. 142–151.
[85] N. B. Ali, K. Petersen, and C. Wohlin, “A systematic literature review on the industrialuse of software process simulation,” Journal of Systems and Software, vol. 97, pp. 65–85,2014.
[86] N. B. Ali, K. Petersen, and M. Mantyla, “Testing highly complex system of systems: anindustrial case study,” in Proceedings of ACM-IEEE International Symposium on Empir-ical Software Engineering and Measurement, ESEM, 2012, pp. 211–220.
[87] N. B. Ali, “Is effectiveness sufficient to choose an intervention?: Considering resourceuse in empirical software engineering,” in Proceedings of the 10th ACM/IEEE Interna-tional Symposium on Empirical Software Engineering and Measurement, ESEM, 2016,pp. 54:1–54:6.
[88] N. M. Minhas, K. Petersen, N. B. Ali, and K. Wnuk, “Regression testing goals-viewof practitioners and researchers,” in 24th Asia-Pacific Software Engineering ConferenceWorkshops (APSECW), 2017. IEEE, 2017, pp. 25–31.
109

REFERENCES
110

Chapter 5
A Systematic mapping of testcase generation techniquesusing UML interaction diagram
5.1 IntroductionTesting is an integral part of the software development life cycle to improve the quality and reli-ability of software [36]. It is one of the most expensive and labour intensive tasks. Organizationsspend more than 50% of their total budget to test the software [21, 65]. Testing can be automatedto various degrees, such as completely manual, semi-automated or fully automated. Automatedtesting has a benefit in terms of cost reduction, ease of use and better coverage [21, 61].
The main objective of testing is to verify that the software meets the acceptance criteria asdocumented in requirements specifications [30]. There are two main aspects of this objective (1)to demonstrate that the requirements specifications are correct and (2) to demonstrate that designand code of software fulfills with requirements [30].
Among several testing activities the generation of test cases is an intellectually challengingtask [7, 10, 36, 61]. In recent times, the complexity of software is increasing rapidly, whichrequires sufficient testing mechanisms to identify and eliminate the defects. Researchers andpractitioners proposed various automated test case generation techniques during the last decade.Model Based Testing (MBT) is one of testing techniques. In the MBT approach, Unified Mod-eling Language (UML) models are commonly used as a means to generate test cases. Differentsystem aspects could be tested from different UML models. UML models can be classified ac-cording to static or dynamic aspects of a system (c.f. [74]). Static aspects of a system can berepresented by the structural models whereas dynamic aspects of the system can be represented
111

Chapter 5. A Systematic mapping of test case generation techniques using UMLinteraction diagram
by the behavioral models. Interaction diagrams fall under the category of behavioral models.Other diagrams related to this category are use case diagram, stat chart diagram and activitydiagram. Whereas, structural models are represented by class diagram, component diagram,deployment diagram, object diagram, package diagram, profile diagram, and composite dia-gram [74]. In this study we focus on dynamic models as testing focuses on the dynamic aspectsof the system during its execution. Interaction diagrams are of high relevance in later testingactivities (such as integration testing) as the interaction between different components have to beconsidered.
The first step to test software automatically is to describe its behavior or structure eitherstatically or dynamically by using UML models [45, 61]. By using UML models, practitionersmay perform unit [43, 65], integration [38, 40, 57, 58], system [22, 26, 30] and conformancetesting [50].
Looking at existing literature reviews, the reviews so far did not put their main focus on inter-action diagrams, and the reviews did not follow a documented systematic procedure [8, 15, 48].Practitioners and researchers have proposed various techniques to generate test cases from UMLinteraction diagrams during the past few years. We believe that a classification of existing MBTtechniques based on UML Interaction diagrams is essential for researchers before proceedingtoward proposing new approaches using interaction diagrams. Furthermore, practitioners andresearchers currently utilizing interaction diagrams have an inventory of results as well as a doc-umentation of their capabilities and limitations. Furthermore, the quality of the study is assessed.In order to complement the existing literature reviews, we investigate the use of interaction dia-grams making the following contributions:
• C1: Identify the approaches for MBT test case generation proposed in the literature.• C2: Identify the capabilities and limitations of the approaches.• C3: Characterize the study quality using the rigor and relevance scoring framework by
Ivarsson and Gorschek [67].As a research method we utilized the guidelines for systematic mappings by Petersen et
al,. [75, 76]. Furthermore, for quality assessment the rigor and relevance scoring frameworkby Ivarsson and Gorschek [67] was used. Rigor focuses on the scientific quality with regard tothe research process and method used. Relevance is focused on whether evaluations have beenconducted in a realistic environment with regard to scale, context, and subjects.
The rest of this paper is structured as section: Section 5.2 discusses the related work regard-ing the already presented surveys/ reviews in area of model base testing. Section 5.3 describesthe research methodology. The MBT test case generation approaches along with their capabili-ties and limitations compared and the results of the quality assessment are presented in Section5.4. The results are summarized and discussed in Section 5.5. Section 5.6 concludes the paper.
5.2 Related workA number of literature reviews related to model based testing have been published. An overviewof related literature reviews is provided in Table 5.1. The table states the objectives, the research
112
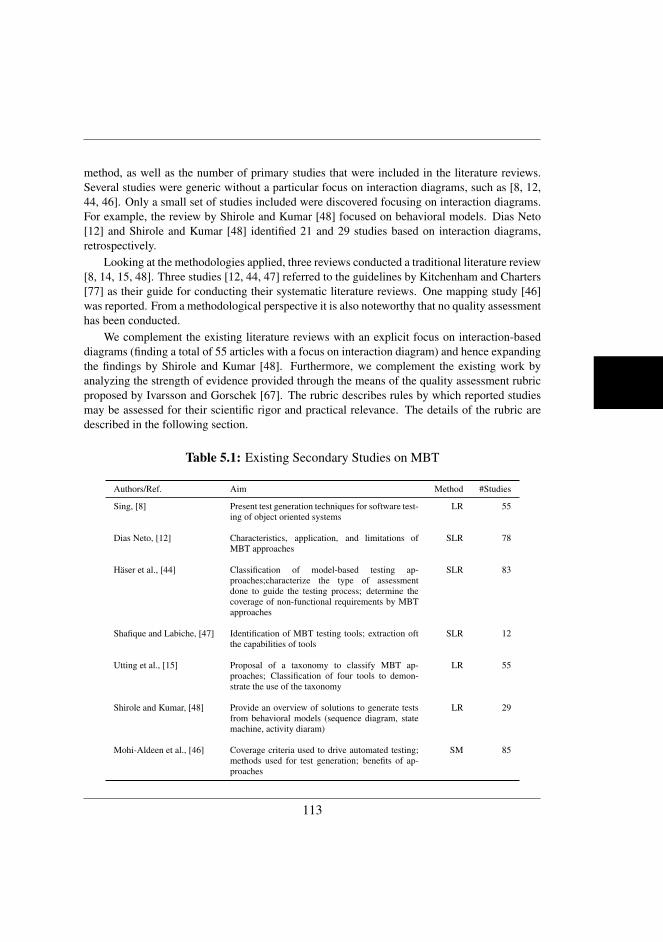
method, as well as the number of primary studies that were included in the literature reviews.Several studies were generic without a particular focus on interaction diagrams, such as [8, 12,44, 46]. Only a small set of studies included were discovered focusing on interaction diagrams.For example, the review by Shirole and Kumar [48] focused on behavioral models. Dias Neto[12] and Shirole and Kumar [48] identified 21 and 29 studies based on interaction diagrams,retrospectively.
Looking at the methodologies applied, three reviews conducted a traditional literature review[8, 14, 15, 48]. Three studies [12, 44, 47] referred to the guidelines by Kitchenham and Charters[77] as their guide for conducting their systematic literature reviews. One mapping study [46]was reported. From a methodological perspective it is also noteworthy that no quality assessmenthas been conducted.
We complement the existing literature reviews with an explicit focus on interaction-baseddiagrams (finding a total of 55 articles with a focus on interaction diagram) and hence expandingthe findings by Shirole and Kumar [48]. Furthermore, we complement the existing work byanalyzing the strength of evidence provided through the means of the quality assessment rubricproposed by Ivarsson and Gorschek [67]. The rubric describes rules by which reported studiesmay be assessed for their scientific rigor and practical relevance. The details of the rubric aredescribed in the following section.
Table 5.1: Existing Secondary Studies on MBT
Authors/Ref. Aim Method #Studies
Sing, [8] Present test generation techniques for software test-ing of object oriented systems
LR 55
Dias Neto, [12] Characteristics, application, and limitations ofMBT approaches
SLR 78
Haser et al., [44] Classification of model-based testing ap-proaches;characterize the type of assessmentdone to guide the testing process; determine thecoverage of non-functional requirements by MBTapproaches
SLR 83
Shafique and Labiche, [47] Identification of MBT testing tools; extraction oftthe capabilities of tools
SLR 12
Utting et al., [15] Proposal of a taxonomy to classify MBT ap-proaches; Classification of four tools to demon-strate the use of the taxonomy
LR 55
Shirole and Kumar, [48] Provide an overview of solutions to generate testsfrom behavioral models (sequence diagram, statemachine, activity diaram)
LR 29
Mohi-Aldeen et al., [46] Coverage criteria used to drive automated testing;methods used for test generation; benefits of ap-proaches
SM 85
113

Chapter 5. A Systematic mapping of test case generation techniques using UMLinteraction diagram
5.3 Research method
In this study, we have adopted the systematic mapping study (SMS) as our research method.Systematic mapping studies are meant to provide an overview of a research area. SMS classifyand count the contribution about the categories of that classification. Like systematic literaturereview, it provides a systematic way to search the literature, to know what are the topics thathave been reported in the literature and what are the publication venues for the area of research[75, 76].
We followed the guidelines provided in [76], in these guidelines the authors included someimportant aspects from the SLR guidelines proposed by Kitchenham and Charters [77].
5.3.1 Planning and conduction the mapping
This section describes the decision making regarding the conduct of systematic mapping study.
Research Questions
The objective of this paper is to analyze the research on UML interaction diagram based testcase generation. Research questions and objectives are highlighted in Table 5.2. The researchquestions map directly to the objectives stated in the introduction, namely to identify approachesfor MBT test case generation (RQ1), extraction of merits and demerits (RQ2) and assessment ofthe quality of the studies with respect to rigor and relevance (RQ3).
Table 5.2: Research questions
ID Research question
RQ1 What are various proposed MBT test case generation approaches based on UMLinteraction diagrams?
RQ1.1 What are the publication trends of test case generation approaches based on UMLinteraction diagrams?
RQ1.2 How can we classify the test case generation techniques based on UML interactiondiagrams?
RQ2 What capabilities and limitations are observed in relation to the approaches?
RQ3 What is the rigor and relevance of the included primary studies according to therigor and relevance scoring rubric proposed by Ivarsson and Gorschek?
RQ3.1 How primary studies refer to each other?
114

Developing and validating the study protocol
The development and validation of study protocol is critical. The developed protocol is criti-cally reviewed by the fourth author, who is an experienced researcher. He has more than 80research publications, mainly from the testing domain. He has published 15 survey/ review pa-pers. He has 28 years of industrial, teaching and research experience. He is serving as an asso-ciate professor at Faculty of Computing Capital University of Science and Technology (CUST),Islamabad, Pakistan. Modifications were suggested in research question, publication selection,inclusion/exclusion criteria and data extraction phase. After modifying this suggestion, the sameexpert again critically reviewed developed protocol. Thus, this was a means of using observertriangulation to increase the quality of the research.
Identifying the related literature
To identify the relevant literature, the main and alternative search term were identified in Table5.3 by specifying the Population and Intervention. Even though Comparison and Outcome wereproposed to consider during the search, additional search terms are likely to reduce the set ofidentified studies, as the Comparison and Outcome variables may not be mentioned in the ab-stract and title [16, 17]. In our case the Population is “UML diagrams” and the Intervention is“test case generation. Major terms used to search the literature include “test case generation”,“sequence diagram”, “collaboration diagram”, “model based testing” and “UML diagrams”.
Table 5.3: Search terms
Main search Terms Alternative search
Test Case Generation Automated Test case generation, Test Path generation
Sequence Diagram UML sequence Diagram, Interaction Diagrams, UML Interaction diagrams
Collaboration diagram UML collaboration diagram, Communication diagram, UML interaction diagrams
Model based testing Testing using UML models
UML diagrams UML models, UML behavioural diagram
Search string construction
Three different search strings have been constructed. One search string focuses on sequencediagrams (Category “SD”), one on collaboration diagrams (“CD”), and one to identify testingfor UML diagrams in general, combining sequence and collaboration diagrams and other UMLmodels (“Combination/ Hybrid”). The search strings were as follows:
115

Chapter 5. A Systematic mapping of test case generation techniques using UMLinteraction diagram
• Sequence diagrams (SD): (“Test case generation” OR “Automated test generation” OR“Test Path Generation”) AND “Model based testing” AND (“Sequence diagram” OR“UML sequence diagram” OR “UML interaction diagrams”)
• Collaboration diagrams (CD): (“Test case generation” OR “Automated test generation”OR “Test Path Generation”) AND “Model based testing” AND ( “Collaboration diagram”OR “UML collaboration diagram” OR “Communication diagram” OR “UML interactiondiagrams”)
• Hybrids (H): (“Test case generation” OR “Automated test generation” OR “Test PathGeneration”) AND “Model based testing” AND (“UML diagrams” OR “UML models”OR “UML behavioural models”)
How the individual databases have been used for the search is specified in Appendix B. Tocollect the required literature the search strings were executed on various online resources. Table5.4 summarizes the selection procedure adopted as well as the number of papers identified andselected. Title and abstract screening was performed on the identified publications. If a publi-cation’s title is related to testing (test case generation) and UML models, then this publicationis selected further for abstract screening. During abstract screening we determined whether thepublication is relevant to model based test case generation and it is using interaction diagrams.A total of 55 primary studies were selected (See Table 5.5). Among these 55 studies, 25 studieswere found directly from the publishing databases (i.e. 17 from IEEE, 3 from Elsevier, & 5 fromACM). While other 30 primary studies were found through Google Scholar. Out of these 30studies, 10 were from Springer, 8 from Scopus indexed journals, and 12 studies were selectedfrom other sources. The following inclusion criteria were applied:
• IC1: Publication must be related to model based testing.
• IC2: Studies that proposed model based testing by the means of interaction diagrams.
• IC3: Studies that describe the capability of model based testing with respect to interactiondiagrams
• IC4: Surveys (e.g. questionnaires or interviews) performed on MBT test case generationtechniques
• IC5: Select only those studies written in English language
The following studies have been excluded:
• EC1: Studies which do not use interaction diagram although they belong to MBT tech-nique
• EC2: Studies that are duplicated (i.e. If the same study found from more than one searchengine)
• EC3: Studies with missing full-text
• EC4: Secondary studies (e.g. systematic reviews or mapping studies)
116

Table 5.4: Database results
Database Search results Selected(title screening) Selected(abstract screening)
IEEE 250 65 17Science Direct (Elsevier) 110 24 3ACM 347 54 5Google Scholar 656 107 30
Total 1363 240 55
Table 5.5: List of Primary Studies
Reference Study ID Reference Study ID[73] S1 [59] S29[68] S2 [60] S30[69] S3 [61] S31[71] S4 [62] S32[72] S5 [7] S33[10] S6 [64] S34[29] S7 [9] S35[23] S8 [24] S36[13] S9 [19] S37[58] S10 [37] S38[28] S12 [56] S39[31] S13 [22] S40[27] S14 [30] S41[50] S15 [54] S42[53] S16 [32] S43[18] S17 [63] S44[55] S18 [26] S45[35] S19 [49] S46[52] S20 [51] S47[40] S21 [11] S48[21] S22 [36] S49[34] S23 [42] S50[57] S24 [65] S51[20] S25 [33] S52[55] S26 [43] S53[39] S27 [66] S54[38] S28 [41] S55
To reduce the threats of biases and potential mistakes in the selection of studies the studyselection was carried out by the first and second authors jointly, studies included or excluded bythe first author were crosschecked by the second author, while studies included or excluded byfirst author were crosschecked by the second author. Duplicate studies were eliminated duringthe crosscheck. Finally, a random crosscheck was applied by the fourth author.
117

Chapter 5. A Systematic mapping of test case generation techniques using UMLinteraction diagram
Quality assessment
To assess the quality of the included primary studies we utilized the scoring rubric proposed byIvarsson and Gorschek [67]. Rigor was evaluated based on three criteria (the description of con-text, study design and validity). Relevance was evaluated based on four criteria (subject, context,scale and research method). The criteria for rigor were scored on an ordinal scale as suggestedby [67], namely strong, medium and weak description. The first author scored the studies, whichwere all reviewed by the third author. In case of corrections proposed, these were discussed andagreed upon with the first author. In the following the quality evaluation criteria are explained.
Rigor:The research rigor criteria check whether the methodology is described in a way sothat the rigor of the research may be judged [67].
Context (C):
• Strong description: Context is strongly described and comparable with other context.We emphasize the subjects type (academic, industrial), development methodology andexperience of subjects. If these factors are presented, then C evaluates to 1.
• Medium description: In absence of any factor (see strong description) C evaluates to 0.5.
• Weak description: If these factors are completely ignored then C evaluates to 0.
Study design (D):
• Strong description: The research design is clear to readers by documenting expectedoutcomes, measurement criteria, data selection and collection, etc., then D evaluates to 1.
• Medium description: In absence of an essential factor in the research design C evaluatesto 0.5.
• Weak description: No description of the research design is provided, then D evaluates to0.
Validity threats (V):
• Strong description: If internal, external, construct, and conclusion validity threats arehighlighted then V evaluates to 1.
• Medium description: In case of subset of these threats are provided then V evaluates to0.5.
• Weak description: If validity threats are not discussed then V evaluates to 0.
Relevance: Several measures are used to evaluate academic relevance in research. The im-pact of industrial relevance is hard to measure. The assessment criteria proposed by Ivarsson andGorschek [67] assume that the relevance is higher if the study is conducted with realistic sub-jects, scale, and using research methods that facilitate investigations in realistic environments.
Subjects (U):
118

• Contribution to relevance: Subjects or users are delegate of real user such as for industryprofessional, then U evaluates to 1.
• Partially contribute to relevance: If subjects are researchers or students, then U evaluatesto 0.5
• No contribution: If subjects are not mentioned, then U evaluates to 0.
Context (C):
• Contribution to relevance: The study is conducted in a real industrial setting, then Cevaluates to 1.
• No contribution: The study is not conducted in a real industrial setting, then C evaluatesto 0.
Scale (S):
• Contribution to relevance: The used application is representative of real (industry) sys-tems in terms of scale, then S evaluates to 1.
• No contribution: Application is a toy example or down-scaled, then S evaluates to 0.
Data extraction and analysis
The selected studies are saved for the purpose of data extraction. The data extraction was per-formed jointly by authors. The second and third author randomly selected included primarystudies and reviewed the results produced by the first author. The data extraction comprised ofthe following elements:
• Publication data: Publication ID, publication title, year of publication, type of publica-tion, source of publication, author name, keywords
• Test scope: Type of testing, test objective
• Input to tests: UML model used, intermediate models constructed for test data generation
• Data generation approach: Description of test data generation process, algorithms used,tool support
• Assessment: Coverage criteria, research method, rigour and relevance scores
• Outcome: Merits and demerits, proposed future works and identified gaps
We utilized content analysis to group and assign studies to categories (e.g. categorizing thestudies with regard to testing type, and type of intermediate models for test data generation). Thisshows which areas are covered by the literature, and is similar to the intent of a mapping studywhere an overview of an area is provided. Furthermore, narrative summaries for the differenttypes of test generation approaches are provided.
119

Chapter 5. A Systematic mapping of test case generation techniques using UMLinteraction diagram
5.3.2 Validity threatsThe limitations of the study are discussed with regard to different types of validity threats, namelytheoretical (internal) validity, generalizability, objectivity, and interpretive validity.
Theoretical validity: The scoring rubric used in this study assesses the reporting of stud-ies, while the actual study design may not be described completely. Thus, the actual rigor andrelevance may not be determined, but rather what is possible to judge from the presentationin the paper. The rubric favors results reported from practical applications. This is not to saythat the results are not of value for practice, though given the current presentation evidence of awide-spread technology transfer to industry was not found.
Generalizability: Generalizability is concerned with the ability to generalize the findingsfrom this study to the population of studies. Given that searches are limited and may not alwaysfind all relevant studies the threat is relevant to this study. However, the results obtained fromthe papers are consistent and reveal a pattern of how test case generation approaches based oninteraction diagrams are designed, consisting of the main steps of creating an intermediate formand applying an algorithm to generate test paths, and in some cases test cases. We also did notlimit our search with regard to the evaluation done (e.g. only including case studies).
Objectivity: Objectivity determines the degree to which we can report our observations accu-rately reflecting the reality of the field. Multiple threats are of relevance here, which are shortlydiscussed:
• Missing relevant studies: Our search focused on interaction diagram types and not model-based testing in general. Thus, some studies from the population might have been missed.However, the search returned a high number of relevant studies with little noise. We alsoincluded a much larger set of studies on the topic when compared to previous previousliterature reviews (see Section 5.2). This indicates that the systematic search helped tocover a larger portion of the population. However, given that the search terms were veryspecific, there is a risk of still missing studies from the population
• Biases in study selection, data extraction and analysis: The selection, data extraction andanalysis activities are prone to biases and mistakes. Thus, multiple researchers have beeninvolved and cross-checking of the studies has been done among the authors of the paper.The use of a research protocol is also a means of reducing bias. Though, the researchprotocol itself was only evaluated by one researcher, hence posing a threat to objectivity.
Interpretative validity: From the findings of the study conclusions are drawn. We utilizedobserver triangulation and discussed the implications and key findings among the authors. Thisreduces the threat of drawing wrong conclusions from the data.
5.4 ResultsThis section presents the findings of our study. We have organized the presentation of the resultsaccording to the research questions listed in Table 5.2.
120

5.4.1 RQ1: What are various proposed MBT test case generationapproaches based on UML interaction diagrams?
RQ1 was divided into two sub-questions (RQ1.1 & RQ1.2). The purpose of the first sub-questionwas to see the trends of test case generation techniques which are using interaction diagrams asinput. Whereas the second sub-question was designed to classify these test case generationtechniques by different factors, for instance, by the input model, intermediate model, and theoutcome of the techniques.
10
5
17
3
8
12
0
2
4
6
8
10
12
14
16
18
Springer ACM IEEE Elsevier OtherScopusIndexed
Other
Figure 5.1: Publishing Venues of Primary Studies
RQ1.1:What are the publication trends of test case generation approaches basedon UML interaction diagrams?
In response to this research question, we present the demographics of the studies, including thenumber of publications over time, and the publication forums targeted.
A majority of the primary studies (65%) included in this study are from the four publishingvenues (IEEE, Springer, ACM, and Elsevier). Figure 5.1 presents the distribution of primarystudies with respect to publishing venues. An increasing trend in the number of publications isseen with peaks in 2007 and 2014 (Figure 5.2). The publication trend shows that the researcharea is growing gradually. A complete list of primary studies and the corresponding publicationvenues is presented in Table C.1 (See Appendix C). It is apparent that only a few well knownjournals in the field of software engineering have been published in (e.g. Information and Soft-ware Technology and ACM SIGSOFT Software Engineering Notes). In addition, many differentpublication forums have been targeted. Hence, no clear recommendation could be given where
121

Chapter 5. A Systematic mapping of test case generation techniques using UMLinteraction diagram
2000 2002 2003 2005 2006 2007 2008 2009 2010 2011 2012 2013 2014 2015 2016 2017Symposium 0 0 0 0 0 0 1 0 0 0 0 0 2 0 0 0
Workshop 0 0 0 0 1 0 0 0 0 0 0 0 0 0 0 0
Conference 1 1 3 2 1 6 3 1 2 1 1 2 2 1 1 0
Journal 1 0 0 0 0 2 0 1 2 1 2 4 3 3 3 2
0123456789
Journal Conference Workshop Symposium
Figure 5.2: Year and Venue Wise Distribution of Primary Studies
to start to look for papers on the topic.
SD48%
CD7%
H45%
Figure 5.3: Distribution of studies according to input model used
122

84%
8% 8%
75%
25%
0%
62%
38%
0%
Integration System Functional
SD CD H
Figure 5.4: Distribution of studies according to testing types covered
RQ1.2: How can we classify the test case generation techniques based on UMLinteraction diagrams?
The selected UML interaction diagram based testing techniques are reviewed regarding theirsimilarities and differences. The majority of the techniques reported in the literature use UMLsequence diagram as input for test case generation and are marked as category “SD”, in theselected primary studies 48% techniques are based on sequence diagram. UML collaborationdiagram based approaches are also identified and marked as category “CD”, only 7% of theselected primary studies belong to this category. 45% of the selected studies are using interactiondiagrams along with some other UML model as input for test case generation, we refer thesetechniques as hybrid solutions and mark as category “H”. Figure 5.3 shows the distribution ofthe primary studies according to the type of test case generation techniques.
Regarding the testing types, 84% of the SD-based studies are proposed for the integrationtesting, while 8% for the functional, and 8% studies are proposed for the system testing. Sim-ilarly, 75% of the CD-based studies are proposed for integration testing, and 25% for systemtesting. Finally, 62% of the hybrid solution based studies are proposed for integration testing,and 38% of these solution work for system testing. Figure 5.4 presents the classification of pro-posed techniques according to the testing types covered. A complete overview of the categoriesof techniques with regard to their testing types and intermediate models generated is presented inTable 5.6. The models form the basis to generate the test paths. Some techniques only determinethe test paths that should be covered. However, in order to execute the paths the test data stillneeds to be generated (e.g. in the case of a decision node, the two input values for it to eitherevaluate to true or false need to be determined). The input values are also referred to as test data,i.e. concrete inputs to be given to the system under test.
123

Chapter 5. A Systematic mapping of test case generation techniques using UMLinteraction diagram
Table 5.6: Overview of Solutions
Category Testing type Intermediate model References
SD
Integration
Graph [13, 18, 20, 31, 34, 40, 50, 52, 53, 55, 58, 68, 69]XMI [38, 39]Dependency table [27, 28]Tree [21]SLT [73]ETDA [71]
System Graph [35]Activity [72]
Functional Graph [23, 29]Conformance Graph [50]
CD Integration Graph [59, 60]Tree [61]
System Graph [62]
HIntegration
Graph [7, 11, 36, 37, 49, 63, 65]XMI [9, 33, 51, 54]Tree [19],Petal files [32]SCOTEM [64]
System Graph [22, 24, 26, 30, 42, 56, 70]Activity Diagram [41, 66]
In the following sub-sections we provide a synthesis of how the approaches proposed in theliterature (SD, CD and H) are structured.
Solutions Using SD
We found a total of 26 studies that are using the sequence diagram as an input model, Figure 5.5presents an overview of these. The activity diagram shows the different possibilities describedin the literature. The references in the diagram show how the techniques in the papers are struc-tured. The first step towards the test case generation is that sequence diagram is transformed intointermediate forms, which are then used as a basis for generating the tests.
Common intermediate forms are LTS (Labelled Transition Systems) [29], XML MetadataInterchange (XMI) [38, 39], sequence dependency table [27, 28] and graphs [10, 13, 18, 20, 21,23, 27, 31, 34, 35, 40, 52, 53, 55, 68, 69]. Two studies [58, 72] transform the sequence diagraminto activity diagram. One study [73] generates the stimulus link table (SLT) from the sequencediagram. The techniques presented in [50, 55, 57] do not use an intermediate form. While thetechnique presented in [71] make use of event deterministic finite automata (ETDA).
SD based Solutions Using Graph and its variants as intermediate form: Graphs are the mostcommonly used intermediate form, 65% of the SD based solutions use the graph as intermediateform, though the type of graph differs, as is shown in Figure 5.5.
Bao-Lin et al. [21] converted the sequence diagram into a tree representation. The tree istraversed to select the conditional predicates. Bao-Lin et al. use of OCL to describe the pre- andpost-conditions. Finally, function minimization is used to generate test data from conditional
124

Input Model
Studies using SD as input [S1-S10, S12-S28]
Intermediate form
LTS[S7]
XMI [S27, S28]
Dependency Tables[S12, S14]
Trees[S22]
SLT[S1]
ETDA[S4]
Graph [S2, S3, S6, S8S11,
S13, S14, S16-S21, S23, S25]
Activity[S5, S10]
Test Paths/Test cases
[S1-S10, S12-S28]
Manual[S6, S24, S26]
Automated[S13,S22, S25, S28]
Executable Test case
Figure 5.5: Solutions using sequence diagram (SD) as input
predicates.A wait-for graph was used by Patnaik et al. as well as Fraikin and Leonhardt [38, 53] to
identify deadlock points. The primary objective of their techniques is to identify concurrencyissues. Both techniques [38, 53] only generate test paths.
Hoseini and Jalili [34] generated a control flow graph and thereafter used a prime path extrac-tion algorithm to generate the test paths. A message control flow graph is used as an intermediateform by Jena et al. as well as Lei and Lin [10, 52]. Thereafter the graph is traversed using thedepth first search algorithm. Lei and Lin [52] also provide an automated tool that can trans-form sequence diagrams into control flow graphs and then generate the test paths automatically.Their technique also works for test case generation. The techniques presented in [10, 34] usea genetic algorithm to calculate the fitness value for generated test paths to optimize them. Asequence graph was used by Samulatah et al. [40] as an intermediate form. The sequence graphwas traversed using genetic algorithm to generate the test paths. A fitness function was definedcalculating the fitness value of the generated test paths. Chandnani et al. [68] presented a modelbased test case generation technique to test the interaction of objects. A sequence dependencytable form the sequence diagrams is created and then a control flow graph is generated. Theintermediate graph is traversed into depth first manner to obtain test paths. Finally test casesare generated using particle a swarm optimization algorithm (PSO). Rhmann and Saxena [69]converted sequence diagram into message flow graphs. They used a depth first search algorithmto traverse the message flow graph and generated the test paths.
The technique presented by Shirole and Kumar [58] uses activity diagrams as an intermediatemodel. Test scenarios are generated by using concurrent queue search (CQS). Test scenariosgenerated here are useful for detecting data safety errors. Seo et al. [72] presented a test casegeneration technique based on sequence diagrams. The sequence diagram is transformed into anactivity diagram, which represents the scenario of sequence diagram. In the next step, the activity
125

Chapter 5. A Systematic mapping of test case generation techniques using UMLinteraction diagram
diagram was fragmented into sub activities. UML testing-profile based test case were designed,on the basis of the principal that each individual activity represents a test scenario. A concurrentcomposite graph was used by Khandai et al. [18] who generated test paths by traversing the graphwith the help of a message sequence graph algorithm. Khandai et al. also make use of the ObjectConstraint Language (OCL). Both techniques [18, 58] are meant to detect concurrency errors.
A sequence dependency graph was used as an intermediate form in multiple studies [20, 23,27, 31, 35] . Dhineshkumar et al [23] define pre-and-post conditions using OCL. Test paths aregenerated by traversing the sequence dependency graph with the help of an iterative depth firstsearch algorithm. Panthi and Mohapatra [31] also use the depth first search algorithm to traversethe message sequence graph and predicate are selected. Using the selected predicates the sourcecode is produced and then test cases are generated. The sequence dependency graph is traversedby the algorithm and test sequences are generated in [35]. Sequence dependency graph was alsoused as intermediate form by Samuel et al. [20]. They use the concept of dynamic slicing to gen-erate test cases automatically. Priya and Malarchelvi [27] generate a sequence dependency tablefrom the sequence diagram, which is further transformed into a sequence dependency graph.The depth first search algorithm is used to generate test paths from the sequence dependencygraph. A sequence dependency table is also used by Shanti and Khumar [28] who use a geneticalgorithm to generate test paths from the dependency table.
SD based Solutions Using other intermediate forms: XMI is used as intermediate form byBeyer et al. and Frain and Leonhardt [38, 39]. A test case generation tool called “MaTeLo” hasbeen proposed by Beyer et al. [39]. The tool makes use of Markov chains as an intermediatemodel. It converts the sequence diagram into XMI format, thereafter using the Markov ChainMarkup Language (MCML) to generate a Markov Chain Usage Model (MCUM). The main ob-jective is to derive test cases compatible with the Testing and Test Control Notation version 3(TTCN-3). This approach mainly focuses on statistical usage testing. A test tool for object ori-ented applications has been presented by Frain and Leonhardt [38]. They transform a Sequencediagram into XMI format. Their “SeDiteC” tool extracts the necessary information from XMI.The tool enables early testing and provide facilities such as automatic test stub generation andinitialization of objects. Cartaxo et al. [29] introduced the functional (feature) test case gener-ation method.In this method sequence diagrams are converted into a labeled transition system(LTS). In a LTS transitions are represented as states. Loops and alternative flows are also mod-eled in LTS. Cartaxo et al. used a depth first search (DFS) to generate test paths from the LTS.SD based Solutions without any intermediate forms: Furthermore, solutions were available thatdid not use any intermediate form. The technique presented in [57] does not use any intermedi-ate form, instead it makes use of a genetic algorithm to generate valid and invalid test paths andrelated test cases. To test the web applications a method has been suggested by Cho et al. [55].Test cases are generated for single, mutual and integrated web pages. For single web pages, testcases are generated from self-call message in the sequence model. For mutual web pages testcases are extracted from messages passed between web pages. Integrated test cases are designedfrom messages, which are passed to the system. Moreover, a tool has been proposed, though itis not available online. Lund and Stolen [50] proposed an algorithm to derive test cases fromUML sequence diagram. The sequence diagram is specified using neg (unary operator to specify
126

negative behavior) and assert (operator used to specify universal behavioral) operators. Lund andStolen propose the STAIRS semantic, which is used for conformance testing. Zhang et al. [71]presented a test case generation approach based on sequence diagrams and event deterministicfinite atuomata (ETDA). The objects participating in the sequence diagram are transformed intoETDA. Propositional projection temporal logic (PPTL) was used for model checking and theETDA is verified. Finally, they get the composite automata by synthesis rules and generated thetest cases. Mani and Prasanna [73] proposed a test case generation approach using sequencediagrams. A stimulus liking table (SLT) is generated from the sequence diagram. Using SLT thestimulus paths are derived and from the stimulus paths test cases were generated. Finally, theyused boundary value analysis for test case reduction.
Input Model
Studies using CD as input [S29 - S32]
Intermediate form
Trees[S31]
Graph [S29, S30, S32]
Test Paths/Test cases
S29- S32
Executable Test case
Automated [S31]
Manual[N/A]
Figure 5.6: Solutions using collaboration diagram (CD) as input
Solutions Using CD
Test case generation techniques using collaboration diagrams as input models are presentedin [59–62] (see Figure 5.6). All the techniques presented in [59–61] use different variants ofgraphs as an intermediate form. Trees are used by Samuel et al. [61] while a weighted graphis used by Ahmed et al. and Prasanna et al. [59, 60]. The weighted graph is then traversedusing Prims and Dijkstra algorithms. An advantage of [60] over [59] is that mutation analysisis performed to evaluate the effectiveness of the proposed technique. Samuel et al. [61] converta collaboration diagram into tree format. The predicates are selected from the tree structure inan iterative manner. At the end, a function minimization technique is applied to generate testdata for the selected predicates. Abdurazik and Offutt [62] identified four items that could beused for static checking. The items that have been identified are classifier roles, collaboratingpairs, message or stimulus, and local variable definition usage link pairs. For dynamic testing,they make use of message sequence paths. It is stated that message sequence paths includes allvariable def-use link pairs, object def-use link pairs, object creation-usage link pairs, and objectusage-destruction link pairs. The techniques proposed by [59, 60, 62] only generate test paths,the only technique which generates test data and test cases is proposed by Samuel et al. [61].
127

Chapter 5. A Systematic mapping of test case generation techniques using UMLinteraction diagram
Hybrid Solutions
In this study, we found 24 techniques which are presenting hybrid solutions (combining inter-action diagram with some other UML model) for integration testing [7, 9, 11, 19, 22, 24, 26,30, 32, 33, 36, 37, 41–43, 49, 51, 54, 56, 63–66, 70]. An overview of the solutions is shownin Figure 5.7. Hybrid solution refer to techniques utilizing two or more input models. In-teraction diagrams (sequence or collaboration) are the main input model along with anotherUML model type. The models which are being used as input for integration testing alongwith the interaction models are: class diagrams, state charts, activity diagrams, use case di-agrams, and interaction overview diagrams. Among the investigated techniques there are 19techniques [7, 11, 19, 22, 24, 26, 30, 32, 33, 36, 37, 41–43, 49, 51, 54, 56] which are usingsequence diagram along with some other UML diagram as input model. Four solutions [63–66]use collaboration diagrams along with some other UML model. Figure 5.7 shows the combina-tions of UML diagrams used as input (e.g. sequence diagrams are combined with class diagrams,state charts, etc.).
First input Model
Studies using SDas input
[S33, S36 - S40, S42, S43, S45-S50, S52, S53,
S55 ]
Studies usingCD as first input [S34, S44, S51,
S54]
Second input model
Class [S38, S42, S45,
S47, S52]
State Chart [S40, S46, S48,
S53]
Class and Activity(S35]
Interactionoverview
[S33]
Use case andClass
[S37, S43, S49,S50, S55]
Activity[S39 ]
State Chart
[S34, S44, S54]
Class[S51]
Intermediate form
Petal Files[S34]
XMI [S35, S42, S47,
s52]
PCOMDAG
Graph [S33, S36, S38-S41, S44-S46,
S48-S50]
Non Deterministic [S48, S51, S54,
S55 ]
SCOTEM
[S34]
Graph[S44, S51]
Automated [S38, S45, S46,
S52]
Executable Test case
-
Manual [S33, S34, S44,
S47, S48, ]
Test Paths/Test cases
[S33, S36 - S40, S42,S43, S45-S50, S52, S53,
S55 ] [S34, S44, S51, S54]
Figure 5.7: Solutions using interaction diagram and some other UML diagram (H) asinput
All the hybrid solutions convert each primary input model into some intermediate forms andthen convert these intermediate forms into final intermediate form, from which test paths aregenerated. The final intermediate forms used are XMI [9, 33, 43, 54], Petal files [32], “statecollaboration test model” (SCOTEM) [64], “polymorphisms class object method acyclic graph”(PECOMDAG) [37], “system testing graph” [22, 42, 56], sequence diagram graph [24], activity-sequence graph [30], sequence interaction graph [7], test model grap [63], concurrent controlflow [49], Extended Variable Assignment Graph (EVAG) [49], structured composite graph [26],and tree [19].
Twenty-two out of twenty-four techniques generate test paths. One technique presented byWu et al. [66] does not generate test paths. Instead it derives a test adequacy criteria based oninput diagrams, that is collaboration and state chart diagrams. Only a subset of techniques used
128

algorithms for the generation of test paths:
• Depth first search algorithm (DFS) [7, 10, 41]• Breadth first search algorithm (BFS) [24, 26, 30]• Traversing algorithms [37, 42, 54]• Genetic Algorithm (GA) [22]• Parsers [32, 51]
The techniques function in a similar way to the approaches described in Section 5.4.1. Given thesimilarity they are not explained in the same detail as the “SD”-based solutions.
Nine techniques [7, 11, 26, 33, 37, 49, 51, 63, 64] provide solutions for generating testdata. Four techniques [26, 33, 37, 49] generate test data automatically while five techniques[7, 11, 51, 63, 64] rely on manual test data generation. An overview of the techniques based onhybrid solutions is presented in Figure 5.7.
5.4.2 RQ2: What capabilities and limitations are observed in rela-tion to the approaches?
To respond RQ2 the capabilities and limitations of selected approaches are highlighted. Table 5.7provides an overview of the capabilities. A subset of approaches (39%) supports the generationof test paths. Only very few studies (6%) also support the automated execution in connection tothe generation.
The types of faults possible to detect are interaction, scenario and operational faults. Onlyfor SD the ability of detecting concurrency problems has been highlighted. While test scenariosare generated, only a subset of solutions also provide support to generate test input data, eithermanually or automatically.
An important feature of the approaches proposed in the literature is the degree to which theywere evaluated. The most commonly stated methods used for the evaluation are case studiesand experiments. Furthermore, to demonstrate the merits of the approaches proof of conceptshave been used, though they represent the weakest form of evaluation. Overall, 26 papers statedthat they present evaluations either using case studies or experiments. In the following sectionpresenting RQ3, the completeness of reporting with regard to rigor and relevance is assessedusing the rubric by Ivarsson and Gorschek [67].
Coverage criteria were defined for the approaches, and the most commonly targeted criterionwas path coverage, 43% of the selected studies are using this criterion. Among the other criteria,condition coverage was used by 13%, message coverage was used by 19%, and model coveragewas used by 7% of the selected primary studies. While 18% of the studies are either using othercriteria or they did not mention any.
The limitations are summarized in Table 5.8. The lack of tool support, test data genera-tion, and test case execution are commonly highlighted. Furthermore, high complexity has beenstressed as an issue. Every technique has to follow some specified step to generate test cases. Atechnique has high complexity if it is manual, semi-automated (with a number of different steps)and no tool support.
129

Chapter 5. A Systematic mapping of test case generation techniques using UMLinteraction diagram
Table 5.7: Capabilities in relation to MBT approaches
Capabilities SD CD H
TestingStatic, dynamic test-ing
[62] [9]
Test paths (sce-nario) generation
[10, 18, 34, 68, 69,71, 72]
[60] [22, 26, 30, 32, 36,41, 42, 54, 56, 63–65, 70]
Test case execution [51, 63, 64]
Detection of faults Interaction, sce-nario, operational
[10, 23, 27–29, 31,40, 52, 57, 68, 69]
[60, 61] [7, 22, 24, 33, 36,42, 51, 54, 64, 70]
Concurrency (e.g.deadlock)
[13, 18, 53, 58]
Test input generation Manual [10, 52, 57] [7, 49, 51, 63, 64]Automated (Effi-cient)
[20, 21, 31, 38] [61] [26], [33], [36]
Stated methodExperiment [21, 28, 34, 57, 58] [60] [24]Case Study [10, 27–29, 31, 40,
68, 69][59] [7, 22, 30, 32, 36,
37, 49, 51, 54, 64,65, 70]
Proof of Concept [13, 18, 20, 23, 35,38, 52, 53, 72, 73]
[61, 62] [9, 19, 26, 33, 41,42, 56, 63]
Coverage criteria
Path [23, 28, 29, 34, 37,40, 52, 68, 69, 71,72]
[59, 61] [7, 22, 24, 30, 41,56, 63, 64, 70]
Predicates/ condi-tions
[20, 31] [59] [19, 26, 36, 37]
Messages [10, 57, 58] [62] [33, 42, 43, 51, 54,66]
Transitions [35]Model [38] [9, 32, 65]
5.4.3 RQ3: How strong the evidence with respect to rigor and rele-vance to support the outcome of various test case generationtechniques?
The main objective of this section is to provide the score of individual selected publication ac-cording to rigor and relevance. The complete results of each publication containing an empiricalstudy (i.e. case study or experiment) with respect to rigor and relevance are summarized in Tables5.9 to 5.11. The tables show the studies that either stated that a case study or experiment, i.e. anempirical study has been conducted. It is evident that a high number of studies in all categoriesscored only the rating “0” according to the rubric by Ivarsson and Gorschek. The reason for theassessment can be found in the article by Wohlin [6], who highlights that “case study is oftena misused research method. In many papers, the authors actually mean example or illustrationand not a case study in the way it is defined”. In particular, Wohlin highlights the references byYin and Runeson and Host [4] as a guide to follow. Similarly, experiment was frequently used asa means to present results from operations on an example system. Though, many important partsof experimental research have not been documented. In particular the guidelines by Basili [3],Wohlin et al. [2] and Juristo [1] are to be highlighted here. None of the case studies referred to a
130

Table 5.8: Limitations
Limitations SD CD HNo tool support [10, 13, 18, 23, 27, 28, 34, 35,
40, 50, 53, 57, 58, 68, 69, 71–73]
[59, 61, 62] [7, 19, 22, 24, 26, 30, 41–43,63, 65, 66, 70]
No test datageneration
[13, 18, 23, 27–29, 34, 35, 40,53, 58]
[59, 60, 62] [9, 19, 22, 24, 30, 32, 37, 42,43, 54, 56, 65, 66]
High complexity [10, 13, 18, 20, 28, 31, 34, 35,50, 53, 68, 69, 71]
[59, 60] [19, 22, 26, 41, 42, 56, 63]
No test caseexecution
[10, 13, 18, 23, 27, 28, 34, 35,40, 50, 53, 57, 58, 68, 69, 72]
[59, 61, 62] [7, 9, 19, 22, 30, 32, 36, 41–43, 54, 56, 70]
More test casegeneration
[18, 27] [37]
Issues intransforming modelinto intermediateform
[10, 23, 29, 34, 35, 53] [19, 24, 26]
Restriction inproposed methods
[38] [61, 62] [37, 49]
guide for the research method. Hence, a key area for improvement is to utilize guidelines and tocorrectly label the research method used. In many cases, the correct label (example or proof ofconcept) was used. In Table 5.11 we can see some good scores in the rigor column. Similarly,the relevance score is comparatively better for the studies presented during recent years. In Ta-ble 5.9 we can see the presence of rigor score for the years 2016 and 2017. So we can infer twofacts, 1) quality of the recent studies regarding rigor score is slightly better, 2) hybrid solutionshave better relevance score. These facts indicate that from an industry perspective hybrid solu-tion (i.e., test case generation techniques using a combination of interaction diagrams along withsome other model) are more relevant. However, regarding the overall results, it is visible that noclear trend of scores with respect to years can be seen in Tables 5.9 to 5.11 as we found paperswith high and low scores for both new and old papers (see Figure 5.8).
RQ3.1: How primary studies refer to each other?
Another interesting factor is to see how the studies are related to each other. Of the 54 primarystudies, only 26 studies are referred by the other primary studies. Generally, studies are said to berelated with each other if authors are referring the other studies while defining their methodology.We found only two studies ( [37] is citing [38], and [59] is citing [60]) in their methodologydirectly and explicitly drawing ideas from them. Other studies are referring each other mainlyin the related work section or in the introduction section. Furthermore, it is of interest to seewhether studies conduct a comparative analysis. Again, we found only two studies in whichauthors compared their work with already existing studies ( [54] compared with [43] and [36]compared with [26]). A complete mapping of the references of the primary studies with eachother are presented in Table 5.12.
131
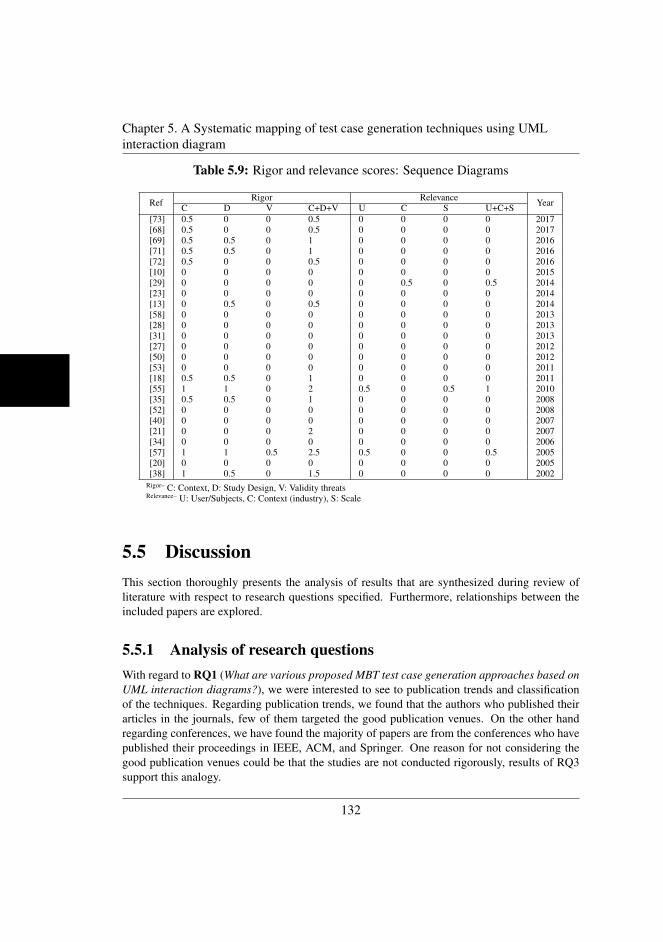
Chapter 5. A Systematic mapping of test case generation techniques using UMLinteraction diagram
Table 5.9: Rigor and relevance scores: Sequence Diagrams
Ref Rigor Relevance YearC D V C+D+V U C S U+C+S[73] 0.5 0 0 0.5 0 0 0 0 2017[68] 0.5 0 0 0.5 0 0 0 0 2017[69] 0.5 0.5 0 1 0 0 0 0 2016[71] 0.5 0.5 0 1 0 0 0 0 2016[72] 0.5 0 0 0.5 0 0 0 0 2016[10] 0 0 0 0 0 0 0 0 2015[29] 0 0 0 0 0 0.5 0 0.5 2014[23] 0 0 0 0 0 0 0 0 2014[13] 0 0.5 0 0.5 0 0 0 0 2014[58] 0 0 0 0 0 0 0 0 2013[28] 0 0 0 0 0 0 0 0 2013[31] 0 0 0 0 0 0 0 0 2013[27] 0 0 0 0 0 0 0 0 2012[50] 0 0 0 0 0 0 0 0 2012[53] 0 0 0 0 0 0 0 0 2011[18] 0.5 0.5 0 1 0 0 0 0 2011[55] 1 1 0 2 0.5 0 0.5 1 2010[35] 0.5 0.5 0 1 0 0 0 0 2008[52] 0 0 0 0 0 0 0 0 2008[40] 0 0 0 0 0 0 0 0 2007[21] 0 0 0 2 0 0 0 0 2007[34] 0 0 0 0 0 0 0 0 2006[57] 1 1 0.5 2.5 0.5 0 0 0.5 2005[20] 0 0 0 0 0 0 0 0 2005[38] 1 0.5 0 1.5 0 0 0 0 2002
Rigor– C: Context, D: Study Design, V: Validity threatsRelevance– U: User/Subjects, C: Context (industry), S: Scale
5.5 DiscussionThis section thoroughly presents the analysis of results that are synthesized during review ofliterature with respect to research questions specified. Furthermore, relationships between theincluded papers are explored.
5.5.1 Analysis of research questionsWith regard to RQ1 (What are various proposed MBT test case generation approaches based onUML interaction diagrams?), we were interested to see to publication trends and classificationof the techniques. Regarding publication trends, we found that the authors who published theirarticles in the journals, few of them targeted the good publication venues. On the other handregarding conferences, we have found the majority of papers are from the conferences who havepublished their proceedings in IEEE, ACM, and Springer. One reason for not considering thegood publication venues could be that the studies are not conducted rigorously, results of RQ3support this analogy.
132

Table 5.10: Rigor and relevance scores: Collaboration Diagrams
Ref Rigor Relevance YearC D V C+D+V U C S U+C+S[59] 0 0 0 0 0 0 0 0 2013[60] 0.5 1 0 1.5 0.5 0 0 0.5 2011[61] 1 1 0 2 0 0 0 0 2006[62] 0.5 0 0 0.5 0 0 0 0 2000
Rigor– C: Context, D: Study Design, V: Validity threatsRelevance– U: User/Subjects, C: Context (industry), S: Scale
2004
2006
2008
2010
2012
2014
2016
2018
0 0.5 1 1.5 2 2.5 3 3.5 4 4.5
Figure 5.8: Sum of Rigor and Relevance Scores (X-Axis) and Year Published (Y-Axis)
Regarding the classification of the techniques, we found that majority (48%) of the pro-posed test case generation approaches belong to category “SD” transforming UML sequencediagrams into intermediate forms such as control flow graph, sequence dependency graph, or se-quence diagram graph. The integration level testing has been the main focus of the approaches.The main objective for which techniques have been proposed includes, detection of faults suchas interaction, operational, scenario [10, 20, 23, 27, 28] to address concurrency issues such asdeadlock detection and synchronization [13, 18, 53, 58], and test paths generation with highcoverage [31, 34, 35]. To generate a Markov chain model [39], the testing of web pages [55],to the test object oriented application [20, 38] were also achieved through these approaches.Commonly used traversing algorithms are depth first search [10, 18, 23, 27, 29, 31, 52] heuristicalgorithm used in [28, 34, 34, 40, 40], breadth first search [18] and other algorithms that areproposed [13, 20, 35, 50, 53, 58].
During Review of literature, it has been noted that a few techniques (only 7%) have beenidentified in which input model is a UML collaboration model. The main objective of thesetechniques is to increase reliability and detection of faults (interaction). The intermediate repre-
133
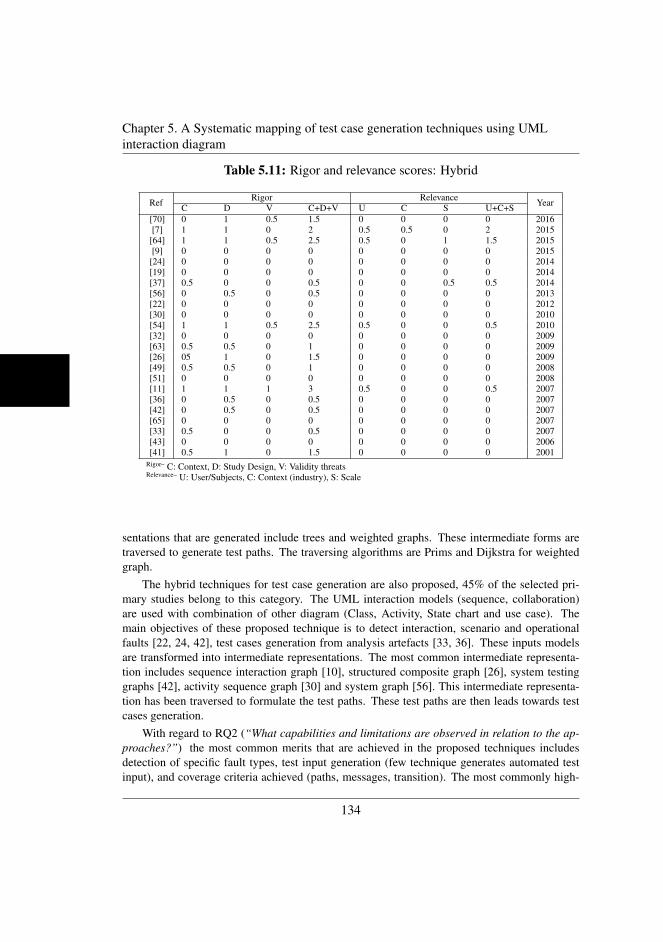
Chapter 5. A Systematic mapping of test case generation techniques using UMLinteraction diagram
Table 5.11: Rigor and relevance scores: Hybrid
Ref Rigor Relevance YearC D V C+D+V U C S U+C+S[70] 0 1 0.5 1.5 0 0 0 0 2016[7] 1 1 0 2 0.5 0.5 0 2 2015[64] 1 1 0.5 2.5 0.5 0 1 1.5 2015[9] 0 0 0 0 0 0 0 0 2015[24] 0 0 0 0 0 0 0 0 2014[19] 0 0 0 0 0 0 0 0 2014[37] 0.5 0 0 0.5 0 0 0.5 0.5 2014[56] 0 0.5 0 0.5 0 0 0 0 2013[22] 0 0 0 0 0 0 0 0 2012[30] 0 0 0 0 0 0 0 0 2010[54] 1 1 0.5 2.5 0.5 0 0 0.5 2010[32] 0 0 0 0 0 0 0 0 2009[63] 0.5 0.5 0 1 0 0 0 0 2009[26] 05 1 0 1.5 0 0 0 0 2009[49] 0.5 0.5 0 1 0 0 0 0 2008[51] 0 0 0 0 0 0 0 0 2008[11] 1 1 1 3 0.5 0 0 0.5 2007[36] 0 0.5 0 0.5 0 0 0 0 2007[42] 0 0.5 0 0.5 0 0 0 0 2007[65] 0 0 0 0 0 0 0 0 2007[33] 0.5 0 0 0.5 0 0 0 0 2007[43] 0 0 0 0 0 0 0 0 2006[41] 0.5 1 0 1.5 0 0 0 0 2001
Rigor– C: Context, D: Study Design, V: Validity threatsRelevance– U: User/Subjects, C: Context (industry), S: Scale
sentations that are generated include trees and weighted graphs. These intermediate forms aretraversed to generate test paths. The traversing algorithms are Prims and Dijkstra for weightedgraph.
The hybrid techniques for test case generation are also proposed, 45% of the selected pri-mary studies belong to this category. The UML interaction models (sequence, collaboration)are used with combination of other diagram (Class, Activity, State chart and use case). Themain objectives of these proposed technique is to detect interaction, scenario and operationalfaults [22, 24, 42], test cases generation from analysis artefacts [33, 36]. These inputs modelsare transformed into intermediate representations. The most common intermediate representa-tion includes sequence interaction graph [10], structured composite graph [26], system testinggraphs [42], activity sequence graph [30] and system graph [56]. This intermediate representa-tion has been traversed to formulate the test paths. These test paths are then leads towards testcases generation.
With regard to RQ2 (“What capabilities and limitations are observed in relation to the ap-proaches?”) the most common merits that are achieved in the proposed techniques includesdetection of specific fault types, test input generation (few technique generates automated testinput), and coverage criteria achieved (paths, messages, transition). The most commonly high-
134

Table 5.12: Primary Studies referring to each other
Referred to Referring Primary StudiesPrimary Study Introduction Related Work Methodology Comparison
[62] [7, 21, 59, 63] [23, 24, 31, 40, 49, 61,64]
[64] [10, 63], [60][54] [18, 34, 36, 40][49] [27, 57][39] [29, 35][41] [43] [23, 36, 49, 64][29] [36, 60] [18, 57, 58]
[38] [31] [22, 24, 29, 35–37, 40,50, 52, 57, 61, 64] [37]
[45] [64] [33, 35, 61][11] [27, 57][18] [34] [58][21] [18, 32, 40, 60][50] [35][13] [9][26] [36][31] [34] [32][60] [27] [59][27] [9][35] [18, 34][61] [52][42] [7, 18, 36, 59, 60][28] [27, 59] [32][43] [27, 35, 54] [54][30] [27][36] [7, 18, 23, 60][56] [22]
lighted drawback was the lack of support for test data generation, no tool support, complexity oftest generation steps, no support for test case execution. Furthermore, issues while convertinginput models into intermediate representations have been highlighted. In particular, high com-plexity and lack of tool support have been highlighted as hinders for a transfer of research resultsto industry practice [21]. Thus, this is an important focus of future research to address.
The rigor and relevance of studies has been assessed to answer RQ3 (“What is the rigor andrelevance of the included primary studies according to the rigor and relevance scoring rubricproposed by Ivarsson and Gorschek?”) With regard to rigor of the primary studies only fewstudies received scores higher than “0”. The main reason may be that no research guidelinehas been followed, and the research method has been wrongly labeled. As mentioned earlier,Wohlin [6] pointed out that in many cases illustrations or examples are presented instead ofstudies following the methodological guidelines. Hence, the clear need for empirical studiesfollowing the guidelines for experimentation [1–3] and case studies [4, 5] should be highlighted.In particular, empirical comparisons between different approaches presented here are of interest.For future work we propose to compare studies within the categories shown in Table 5.6. With
135
Chapter 5. A Systematic mapping of test case generation techniques using UMLinteraction diagram
regard to relevance, given that examples have been used, no real users or industrial systemshave been used as the system under test (SUT). Hence, seeking collaboration with industry is animportant future endeavor encouraged for future work on MBT with collaboration diagrams.
Furthermore, our results reveal that the proposed techniques are not related to each other. Wedefine the relatedness as if the authors are referring to the other techniques in their methodologyor they are comparing their technique(s) with the existing techniques. We found only four studiesthat are referred by the other authors in this regard. The least relatedness is considered if theauthors are referring to other techniques in their related work section. In this regard 14 studiesare there that are referred by the other authors in the related work of their studies. This showsthat test case generation using interaction diagrams is not a well researched and mature area.
5.6 ConclusionThis paper presents a mapping of model based testing techniques based on UML interaction dia-grams. It has been explored that UML interaction diagrams are being used mostly for integrationtesting. It is also discovered that interaction diagrams are being used as standalone model togenerate test cases, at the same time there are some techniques which are combining interactionmodels with some other UML model (class, state chart, etc.). The proposed solutions have vari-ous capabilities claimed in the papers. Approaches from all investigated categories (SD, CD andH) are capable of generating test paths, though the needed inputs (test data) are only generatedby a few approaches. The techniques also support detecting different types of defects, such asinteraction and concurrency problems. It is also important to point out that solutions from se-quence diagrams are applicable to collaboration diagrams if the collaboration diagrams includetemporal information (numbering of messages).
The study shows that the practical usefulness of the proposed solutions still needs to bedemonstrated. Key issues highlighted by the authors were the lack of tool support and the com-plexity of the approaches proposed. Thus, the transfer of the approaches to industry would befacilitated through developing tools that can be integrated into existing development frameworks.Furthermore, studies did not follow guidelines when conducting and reporting case studies or ex-periments. The systematic use of guidelines will aid in further improving the rigor of studies.
In summary, the following work should be focused on in the future:
• Provide tool support to enable practitioners to integrate the solutions into their develop-ment processes and development tools.
• Within an academic environment, empirically compare different types of solutions (suchas different intermediate models) with respect to ease of use, efficiency (number of testsrun in a specific time frame) and effectiveness (defect detection ability) through experi-mentation. The results provide preliminary insights of which solutions have potential forpractical use.
• Empirically compare and study the solutions in real industrial contexts through case stud-ies and action research.
136

With these steps taken, different forums may be targeted, such as Empirical Software Engineer-ing primarily focusing on empirical studies.
5.7 References[1] N. Juristo and A. M. Moreno, Basics of software engineering experimentation. Springer
Science & Business Media, 2013.
[2] C. Wohlin, P. Runeson, M. Host, M. C. Ohlsson, B. Regnell, and A. Wesslen, Experimen-tation in software engineering. Springer Science & Business Media, 2012.
[3] V. R. Basili, R. W. Selby, and D. H. Hutchens, “Experimentation in software engineering,”IEEE Transactions on software engineering, no. 7, pp. 733–743, 1986.
[4] P. Runeson and M. Host, “Guidelines for conducting and reporting case study research insoftware engineering,” Empirical software engineering, vol. 14, no. 2, pp. 131–164, 2009.
[5] R. K. Yin, Case study research: Design and methods. Sage publications, 2013.
[6] C. Wohlin, “Writing for synthesis of evidence in empirical software engineering,” in Pro-ceedings of the 8th ACM/IEEE International Symposium on Empirical Software Engi-neering and Measurement. ACM, 2014, p. 46.
[7] A. K. Jena, S. K. Swain, and D. P. Mohapatra, “Model based test case generation fromuml sequence and interaction overview diagrams,” in Computational Intelligence in DataMining-Volume 2. Springer, 2015, pp. 247–257.
[8] R. Singh, “Test case generation for object-oriented systems: A review,” in Fourth Interna-tional Conference onCommunication Systems and Network Technologies (CSNT), 2014.IEEE, 2014, pp. 981–989.
[9] B. Kumar and K. Singh, “Testing uml designs using class, sequence and activity dia-grams,” International Journal for Innovative Research in Science and Technology, vol. 2,no. 3, pp. 71–81, 2015.
[10] A. K. Jena, S. K. Swain, and D. P. Mohapatra, “Test case creation from uml sequencediagram: a soft computing approach,” in Intelligent Computing, Communication and De-vices. Springer, 2015, pp. 117–126.
[11] S. Kansomkeat, J. Offutt, A. Abdurazik, and A. Baldini, “A comparative evaluation oftests generated from different uml diagrams,” in Ninth ACIS International Conference onSoftware Engineering, Artificial Intelligence, Networking, and Parallel/Distributed Com-puting, 2008. SNPD’08. IEEE, 2008, pp. 867–872.
[12] A. C. Dias Neto, R. Subramanyan, M. Vieira, and G. H. Travassos, “A survey on model-based testing approaches: a systematic review,” in Proceedings of the 1st ACM interna-tional workshop on Empirical assessment of software engineering languages and tech-nologies: held in conjunction with the 22nd IEEE/ACM International Conference on Au-tomated Software Engineering (ASE) 2007. ACM, 2007, pp. 31–36.
137

REFERENCES
[13] A. Mallick, N. Panda, and A. A. Acharya, “Generation of test cases from uml sequencediagram and detecting deadlocks using loop detection algorithm,” International Journalof Computer Science and Engineering, vol. 2, pp. 199–203, 2014.
[14] M. Khandai, A. A. Acharya, and D. P. Mohapatra, “A survey on test case generation fromuml model,” International Journal of Computer Science and Information Technologies,vol. 2, no. 3, pp. 1164–1171, 2011.
[15] M. Utting, A. Pretschner, and B. Legeard, “A taxonomy of model-based testing ap-proaches,” Software Testing, Verification and Reliability, vol. 22, no. 5, pp. 297–312,2012.
[16] P. Brereton, B. A. Kitchenham, D. Budgen, M. Turner, and M. Khalil, “Lessons from ap-plying the systematic literature review process within the software engineering domain,”Journal of systems and software, vol. 80, no. 4, pp. 571–583, 2007.
[17] B. Kitchenham, R. Pretorius, D. Budgen, O. P. Brereton, M. Turner, M. Niazi, andS. Linkman, “Systematic literature reviews in software engineering–a tertiary study,” In-formation and Software Technology, vol. 52, no. 8, pp. 792–805, 2010.
[18] M. Khandai, A. A. Acharya, and D. P. Mohapatra, “A novel approach of test case genera-tion for concurrent systems using uml sequence diagram,” in 3rd International Conferenceon Electronics Computer Technology (ICECT), 2011, vol. 1. IEEE, 2011, pp. 157–161.
[19] Y. Li and L. Jiang, “The research on test case generation technology of uml sequencediagram,” in 2014 9th International Conference on Computer Science & Education, 2014.
[20] P. Samuel, R. Mall, and S. Sahoo, “Uml sequence diagram based testing using slicing,” in2005 Annual IEEE India Conference-Indicon. IEEE, 2005, pp. 176–178.
[21] B.-L. Li, Z.-s. Li, L. Qing, and Y.-H. Chen, “Test case automate generation from umlsequence diagram and ocl expression,” in International Conference onComputational In-telligence and Security, 2007. IEEE, 2007, pp. 1048–1052.
[22] N. Khurana and R. Chillar, “Test case generation and optimization using uml models andgenetic algorithm,” Procedia Computer Science, vol. 57, pp. 996–1004, 2015.
[23] M. Dhineshkumar et al., “An approach to generate test cases from sequence diagram,” in2014 International Conference on Intelligent Computing Applications (ICICA). IEEE,2014, pp. 345–349.
[24] M. Sarma, D. Kundu, and R. Mall, “Automatic test case generation from uml sequencediagram,” in International Conference on Advanced Computing and Communications,2007. ADCOM 2007. IEEE, 2007, pp. 60–67.
[25] D. Kundu, D. Samanta, and R. Mall, “Automatic code generation from unified modellinglanguage sequence diagrams,” IET Software, vol. 7, no. 1, pp. 12–28, 2013.
[26] A. Nayak and D. Samanta, “Automatic test data synthesis using uml sequence diagrams,”journal of Object Technology, vol. 9, no. 2, pp. 75–104, 2010.
138

[27] S. S. Priya and P. S. K. Malarchelvi, “Test path generation using uml sequence diagram,”International Journal of Advanced Research in Computer Science and Software Engineer-ing, vol. 3, no. 4, 2013.
[28] A. Shanthi and G. M. Kumar, “Automated test cases generation from uml sequence dia-gram,” in International Conference on Software and Computer Applications, 2012.
[29] E. G. Cartaxo, F. G. Neto, and P. D. Machado, “Test case generation by means of uml se-quence diagrams and labeled transition systems,” in 2007 IEEE International Conferenceon Systems, Man and Cybernetics. IEEE, 2007, pp. 1292–1297.
[30] V. M. Sumalatha and G. Raju, “Uml based automated test case generation technique usingactivity-sequence diagram,” The International Journal of Computer Science & Applica-tions (TIJCSA), vol. 1, no. 9, 2012.
[31] V. Panthi and D. P. Mohapatra, “Automatic test case generation using sequence diagram,”in Proceedings of International Conference on Advances in Computing. Springer, 2013,pp. 277–284.
[32] A. Verma and M. Dutta, “Automated test case generation using uml diagrams based onbehavior,” International Journal of Innovations in Engineering and Technology (IJIET),vol. 4, no. 1, pp. 31–39, 2014.
[33] Z. Li and T. Maibaum, “An approach to integration testing of object-oriented programs,”in Seventh International Conference on Quality Software (QSIC 2007). IEEE, 2007, pp.268–273.
[34] B. Hoseini and S. Jalili, “Automatic test path generation from sequence diagram usinggenetic algorithm,” in 7th International Symposium on Telecommunications (IST), 2014.IEEE, 2014, pp. 106–111.
[35] P. Samuel and A. T. Joseph, “Test sequence generation from uml sequence diagrams,”in Ninth ACIS International Conference on Software Engineering, Artificial Intelligence,Networking, and Parallel/Distributed Computing, 2008. SNPD’08. IEEE, 2008, pp.879–887.
[36] S. K. Swain, D. P. Mohapatra, and R. Mall, “Test case generation based on use case andsequence diagram,” International Journal of Software Engineering, vol. 3, no. 2, pp. 21–52, 2010.
[37] H. Zhou, Z. Huang, and Y. Zhu, “Polymorphism sequence diagrams test data automaticgeneration based on ocl,” in The 9th International Conference for Young Computer Scien-tists, 2008. ICYCS 2008. IEEE, 2008, pp. 1235–1240.
[38] F. Fraikin and T. Leonhardt, “Seditec-testing based on sequence diagrams,” in 17th IEEEInternational Conference on Automated Software Engineering, 2002. ASE 2002. IEEE,2002, pp. 261–266.
[39] M. Beyer, W. Dulz, and F. Zhen, “Automated ttcn-3 test case generation by means of umlsequence diagrams and markov chains,” in 12th Asian Test Symposium, 2003. ATS 2003.IEEE, 2003, pp. 102–105.
139

REFERENCES
[40] V. M. Sumalatha and G. Raju, “Object oriented test case generation technique using ge-netic algorithms,” International Journal of Computer Applications, vol. 61, no. 20, 2013.
[41] L. Briand and Y. Labiche, “A uml-based approach to system testing,” in InternationalConference on the Unified Modeling Language. Springer, 2001, pp. 194–208.
[42] M. Sarma and R. Mall, “Automatic test case generation from uml models,” in 10th Inter-national Conference on Information Technology,(ICIT 2007). IEEE, 2007, pp. 196–201.
[43] D. Sokenou, “Generating test sequences from uml sequence diagrams and state diagrams.”in GI Jahrestagung (2). Citeseer, 2006, pp. 236–240.
[44] F. Haser, M. Felderer, and R. Breu, “Software paradigms, assessment types and non-functional requirements in model-based integration testing: a systematic literature re-view,” in Proceedings of the 18th International Conference on Evaluation and Assessmentin Software Engineering. ACM, 2014, p. 29.
[45] J. Hartmann, C. Imoberdorf, and M. Meisinger, “Uml-based integration testing,” in ACMSIGSOFT Software Engineering Notes, vol. 25, no. 5. ACM, 2000, pp. 60–70.
[46] S. M. Mohi-Aldeen, S. Deris, and R. Mohamad, “Systematic mapping study in automatictest case generation.” in SoMeT, 2014, pp. 703–720.
[47] M. Shafique and Y. Labiche, “A systematic review of model based testing tool support,”Carleton University, Canada, Tech. Rep. Technical Report SCE-10-04, 2010.
[48] M. Shirole and R. Kumar, “Uml behavioral model based test case generation: a survey,”ACM SIGSOFT Software Engineering Notes, vol. 38, no. 4, pp. 1–13, 2013.
[49] A. Bandyopadhyay and S. Ghosh, “Test input generation using uml sequence and statemachines models,” in International Conference on Software Testing Verification and Val-idation. IEEE, 2009, pp. 121–130.
[50] M. S. Lund and K. Stølen, “Deriving tests from uml 2.0 sequence diagrams with neg andassert,” in Proceedings of the 2006 international workshop on Automation of softwaretest. ACM, 2006, pp. 22–28.
[51] T. Maibaum and Z. J. Li, “A test framework for integration testing of object-orientedprograms,” in Proceedings of the 2007 conference of the center for advanced studies onCollaborative research, IBM Corp. ACM, 2007, pp. 252–255.
[52] L. Y. and L. N., “Test case generation based on sequence diagrams,” in InternationalComputer Symposium, ICS2008, 2008, pp. 349–355.
[53] A. A. A. DebashreePatnaik and D. P. Mohapatra, “Generation of test cases using uml se-quence diagram in a system with communication deadlock,” (IJCSIT) International Jour-nal of Computer Science and Information Technologies, vol. 3, pp. 1187–1190, 2011.
[54] S. Asthana, S. Tripathi, and S. K. Singh, “A novel approach to generate test cases usingclass and sequence diagrams,” in International Conference on Contemporary Computing.Springer, 2010, pp. 155–167.
140

[55] Y. Cho, W. Lee, and K. Chong, “The technique of test case design based on the umlsequence diagram for the development of web applications,” in International Conferenceon Computational Science and Its Applications. Springer, 2005, pp. 1–10.
[56] A. Tripathy and A. Mitra, “Test case generation using activity diagram and sequence dia-gram,” in Proceedings of International Conference on Advances in Computing. Springer,2013, pp. 121–129.
[57] M. Shirole and R. Kumar, “A hybrid genetic algorithm based test case generation using se-quence diagrams,” in International Conference on Contemporary Computing. Springer,2010, pp. 53–63.
[58] M. Shirole and R. Kumar, “Testing for concurrency in uml diagrams,” ACM SIGSOFTSoftware Engineering Notes, vol. 37, no. 5, pp. 1–8, 2012.
[59] S. U. Ahmed, S. A. Sahare, and A. Ahmed, “Automatic test case generation using collab-oration uml diagrams,” World Journal of Science and Technology, vol. 2, 2013.
[60] M. Prasanna, K. R. Chandran, and K. Thiruvenkadam, “Automatic test case generation foruml collaboration diagrams,” IETE Journal of research, vol. 57, no. 1, pp. 77–81, 2011.
[61] P. Samuel, R. Mall, and P. Kanth, “Automatic test case generation from uml communica-tion diagrams,” Information and software technology, vol. 49, no. 2, pp. 158–171, 2007.
[62] A. Abdurazik and J. Offutt, “Using uml collaboration diagrams for static checking and testgeneration,” in International Conference on the Unified Modeling Language. Springer,2000, pp. 383–395.
[63] D. Barisas and E. Bareisa, “A software testing approach based on behavioral uml models,”Information Technology and Control, vol. 38, no. 2, 2015.
[64] S. Ali, L. C. Briand, M. J.-u. Rehman, H. Asghar, M. Z. Z. Iqbal, and A. Nadeem, “A state-based approach to integration testing based on uml models,” Information and SoftwareTechnology, vol. 49, no. 11, pp. 1087–1106, 2007.
[65] Y. Wang and M. Zheng, “Test case generation from uml models,” in 45th Annual MidwestInstruction and Computing Symposium, Cedar Falls, Iowa, vol. 4, 2012.
[66] Y. Wu, M.-H. Chen, and J. Offutt, “Uml-based integration testing for component-basedsoftware,” in International Conference on COTS-Based Software Systems. Springer,2003, pp. 251–260.
[67] M. Ivarsson and T. Gorschek, “A method for evaluating rigor and industrial relevance oftechnology evaluations,” Empirical Software Engineering, vol. 16, no. 3, pp. 365–395,2011.
[68] K. Chandnani, C. P. Patidar, and M. Sharma, “Automatic and optimized test case gener-ation using model based testing based on sequence diagram and discrete particle swarmoptimization algorithm,” International Refereed Journal of Engineering & Technology(IRJET), vol. 1, no. 2, pp. 1–6, 2017.
141

REFERENCES
[69] W. Rhmann and V. Saxena, “Generation of test cases from uml sequence diagram basedon extenics theory,” British Journal of Mathematics & Computer Science, vol. 16, no. 1,2016.
[70] N. Khurana, R. S. Chhillar, and U. Chhillar, “A novel technique for generation and opti-mization of test cases using use case, sequence, activity diagram and genetic algorithm,”Journal of Software (JSW), vol. 11, no. 3, pp. 242–250, 2016.
[71] C. Zhang, Z. Duan, B. Yu, C. Tian, and M. Ding, “A test case generation approach basedon sequence diagram and automata models,” Chinese Journal of Electronics, vol. 25,no. 2, pp. 234–240, 2016.
[72] Y. Seo, E. Y. Cheon, J.-A. Kim, and H. S. Kim, “Techniques to generate utp-basedtest cases from sequence diagrams using m2m (model-to-model) transformation,” inIEEE/ACIS 15th International Conference on Computer and Information Science (ICIS),2016. IEEE, 2016, pp. 1–6.
[73] P. Mani and M. Prasanna, “Test case generation for embedded system software using umlinteraction diagram,” Journal of Engineering Science and Technology, vol. 12, no. 4, pp.860–874, 2017.
[74] A. Files, “Omg unified modeling language tm (omg uml),” 2013.
[75] K. Petersen, S. Vakkalanka, and L. Kuzniarz, “Guidelines for conducting systematic map-ping studies in software engineering: An update,” Information and Software Technology,vol. 64, pp. 1–18, 2015.
[76] K. Petersen, R. Feldt, S. Mujtaba, and M. Mattsson, “Systematic mapping studies in soft-ware engineering.” in EASE, vol. 8, 2008, pp. 68–77.
[77] B. Kitchenham and S. Charters, “Guidelines for performing systematic literature reviewsin software engineering,” 2007.
142

Appendix B
Treatment of databases
Databases often provide different settings ans possibilities for searches. In the following wespecify how the different databases have been used to retrieve the articles. Google Scholar hasbeen used as an index database. The university library only provided access to these databases,other databases (such as Scopus) were not available to the authors.
• IEEE Search Criteria: The default search option is used to search the related publications.No advanced options are used such as the researcher do not set at specific criteria to searchonly title, key words and abstract etc.
• Science Direct: The advance search option is used to identify the related publications. Thedatabase did not include options for conferences, but rather only for books and journals.Reference works (secondary studies) have been excluded.
• ACM: The advance search option is used to identify the related publications from ACMdigital library. The filter is also applied during executing the search string and only titleis selected to match with search sting. Moreover, we search the publications from ACMfull text selection.
• Google scholar: The advance search option is used to identify the related publicationsfrom Google scholar. The first filter that is applied is search only “in the title of thearticle”. From the “find article” option “with the exact phrase” and “with at least oneword” has been selected. More specifically, the search string is (test case generation)AND (Model based testing), and thereafter test case generation were searched with exactphrase and model based testing with at least one word in the phrase.
143

Chapter B. Treatment of databases
144

Appendix C
Publication Venues
145

Chapter C. Publication Venues
Table C.1: Publication types (J = Journal, C = Conference, S = Symposium,W = Workshop) and publication venues of the primary studies
Ref# Type Venue Year[68] J International Refereed Journal of Engineeering & Technology 2017[73] J Journal of Engineering Science and Technology 2017[69] J British Journal of Mathematics & Computer Science 2016[71] J Chinese Journal of Electronics 2016[70] J Journal of Software 2016[7] J Computational Intelligence in Data Mining 2015[22] J Procedia Computer Science 2015[9] J International Journal for Innovative Research in Science and Technology 2015[13] J International Journal of Computer Science and Engineering 2014[32] J International Journal of Innovations in Engineering and Technology 2014[59] J World Journal of Science and Technology 2013[27] J International Journal of Advanced Research in Computer Science and Software Engi-
neering2013
[40] J International Journal of Computer Applications 2013[25] J IET Software 2013[30] J The International Journal of Computer Science & Applications (TIJCSA) 2012[58] J ACM SIGSOFT Software Engineering Notes 2012[60] J IETE Journal of research 2011[53] J International Journal of Computer Science and Information Technologies 2011[26] J Journal of Object Technology 2010[36] J International Journal of Software Engineering 2010[63] J Information Technology and Control 2009[61] J Information and Software Technology 2007[64] J Information and Software Technology 2007[45] J ACM SIGSOFT Software Engineering Notes 2000
[72] C International Conference on Computer and Information Science 2016[10] C Intelligent Computing, Communication and Devices 2015[23] C International Conference on Intelligent Computing Applications (ICICA) 2014[19] C International Conference on Computer Science & Education 2014
[31, 56] C International Conference on Advances in Computing 2013[28] C International Conference on Software and Computer Applications 2012[18] C International Conference on Electronics Computer Technology (ICECT) 2011
[54, 57] C International Conference on Contemporary Computing 2010[49] C International Conference on Software Testing Verification and Validation 2009[37] C International Conference for Young Computer Scientists 2008[35] C International Conference on Software Engineering, Articial Intelligence, Networking,
and Parallel/Distributed Computing2008
[29] C International Conference on Systems, Man and Cybernetics 2007[21] C International Conference on Computational Intelligence and Security 2007[33] C International Conference on Quality Software 2007[51] C Conference of the center for advanced studies on Collaborative research 2007[24] C International Conference on Advanced Computing and Communications 2007[42] C International Conference on Information Technology 2007[43] C GI Jahrestagung 2006[55] C International Conference on Computational Science and Its Applications 2005[20] C Annual IEEE India Conference-Indicon 2005[39] C Asian Test Symposium, ATS 2003 2003[66] C International Conference on COTS-Based Software Systems 2003[41] C International conference on the Unified modeling Language 2003[38] C International Conference on Automated Software Engineering, ASE 2002[62] C International conference on the Unified modeling Language 2000
[34] S International Symposium on Telecommunications (IST) 2014[65] S Annual Midwest Instruction and Computing Symposium 2014[52] S International Computer Symposium 2008
[50] W International workshop on software test 2006
146