reinventing construction: a route to … · methodology examines microeconomic industry trends ......
TRANSCRIPT
EXECUTIVE SUMMARY
FEBRUARY 2017
IN COLLABORATION WITHMCKINSEY’S CAPITAL PROJECTS & INFRASTRUCTURE PRACTICE
REINVENTING CONSTRUCTION: A ROUTE TO HIGHER PRODUCTIVITY
Copyright © McKinsey & Company 2017
Since its founding in 1990, the McKinsey Global Institute (MGI) has sought to develop a deeper understanding of the evolving global economy. As the business and economics research arm of McKinsey & Company, MGI aims to provide leaders in the commercial, public, and social sectors with the facts and insights on which to base management and policy decisions. For the second year running, The Lauder Institute at the University of Pennsylvania ranked MGI the number-one private-sector think tank in the world in its annual 2016 Global Go To Think Tank Index.
MGI research combines the disciplines of economics and management, employing the analytical tools of economics with the insights of business leaders. Our “micro-to-macro” methodology examines microeconomic industry trends to better understand the broad macroeconomic forces affecting business strategy and public policy. MGI’s in-depth reports have covered more than 20 countries and 30 industries. Current research focuses on six themes: productivity and growth, natural resources, labor markets, the evolution of global financial markets, the economic impact of technology and innovation, and urbanization.
Recent reports have assessed the economic benefits of tackling gender inequality, a new era of global competition, Chinese innovation, and digital globalization. MGI is led by four McKinsey & Company senior partners: Jacques Bughin, James Manyika, Jonathan Woetzel, and Frank Mattern, MGI’s chairman. Michael Chui, Susan Lund, Anu Madgavkar, Sree Ramaswamy, and Jaana Remes serve as MGI partners. Project teams are led by the MGI partners and a group of senior fellows, and include consultants from McKinsey offices around the world. These teams draw on McKinsey’s global network of partners and industry and management experts. Input is provided by the MGI Council, which coleads projects and provides guidance; members are Andres Cadena, Sandrine Devillard, Richard Dobbs, Katy George, Rajat Gupta, Eric Hazan, Eric Labaye, Acha Leke, Scott Nyquist, Gary Pinkus, Shirish Sankhe, Oliver Tonby, and Eckart Windhagen. In addition, leading economists, including Nobel laureates, act as research advisers.
The partners of McKinsey fund MGI’s research; it is not commissioned by any business, government, or other institution. For further information about MGI and to download reports, please visit www.mckinsey.com/mgi.
McKinsey’s Capital Projects & Infrastructure PracticeMcKinsey’s Capital Projects & Infrastructure Practice is a leading adviser on the planning, financing, construction delivery, and operation of infrastructure, energy, mining, real estate, and other large capital projects and portfolios worldwide. We help clients improve on-time and on-budget delivery of major projects and get the most out of existing capital assets. Working alongside owners, developers, contractors, and financiers, we have experience across all markets, asset classes, and stages of the project life cycle. McKinsey provides our clients with a unique combination of strategic advisers, practitioners with deep sector and market knowledge, and senior technical experts with decades of industry experience in design and construction. Over the past five years, we have delivered impact across more than 3,000 engagements, including work on 150 megaprojects collectively valued at more than $1 trillion. Our unique ability to partner with our clients and drive fundamental change is rooted in our independent perspective, our alignment with client goals, a deep commitment to innovation and impact, and the depth and breadth of our expertise and experience.

Filipe Barbosa | Houston
Jonathan Woetzel | Shanghai
Jan Mischke | Zurich
Maria João Ribeirinho | Lisbon
Mukund Sridhar | Singapore
Matthew Parsons | Philadelphia
Nick Bertram | London
Stephanie Brown | Minneapolis
FEBRUARY 2017
REINVENTING CONSTRUCTION: A ROUTE TO HIGHER PRODUCTIVITY
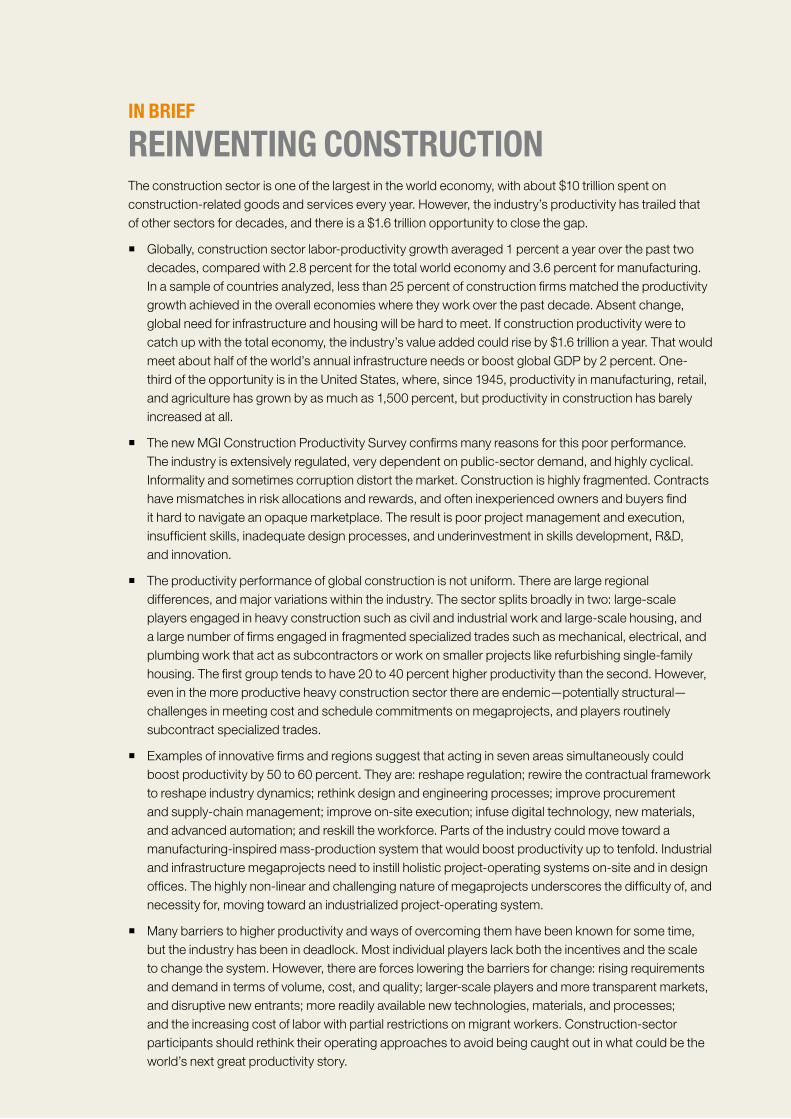
IN BRIEF
REINVENTING CONSTRUCTION The construction sector is one of the largest in the world economy, with about $10 trillion spent on construction-related goods and services every year. However, the industry’s productivity has trailed that of other sectors for decades, and there is a $1.6 trillion opportunity to close the gap.
� Globally, construction sector labor-productivity growth averaged 1 percent a year over the past two decades, compared with 2.8 percent for the total world economy and 3.6 percent for manufacturing. In a sample of countries analyzed, less than 25 percent of construction firms matched the productivity growth achieved in the overall economies where they work over the past decade. Absent change, global need for infrastructure and housing will be hard to meet. If construction productivity were to catch up with the total economy, the industry’s value added could rise by $1.6 trillion a year. That would meet about half of the world’s annual infrastructure needs or boost global GDP by 2 percent. One-third of the opportunity is in the United States, where, since 1945, productivity in manufacturing, retail, and agriculture has grown by as much as 1,500 percent, but productivity in construction has barely increased at all.
� The new MGI Construction Productivity Survey confirms many reasons for this poor performance. The industry is extensively regulated, very dependent on public-sector demand, and highly cyclical. Informality and sometimes corruption distort the market. Construction is highly fragmented. Contracts have mismatches in risk allocations and rewards, and often inexperienced owners and buyers find it hard to navigate an opaque marketplace. The result is poor project management and execution, insufficient skills, inadequate design processes, and underinvestment in skills development, R&D, and innovation.
� The productivity performance of global construction is not uniform. There are large regional differences, and major variations within the industry. The sector splits broadly in two: large-scale players engaged in heavy construction such as civil and industrial work and large-scale housing, and a large number of firms engaged in fragmented specialized trades such as mechanical, electrical, and plumbing work that act as subcontractors or work on smaller projects like refurbishing single-family housing. The first group tends to have 20 to 40 percent higher productivity than the second. However, even in the more productive heavy construction sector there are endemic—potentially structural—challenges in meeting cost and schedule commitments on megaprojects, and players routinely subcontract specialized trades.
� Examples of innovative firms and regions suggest that acting in seven areas simultaneously could boost productivity by 50 to 60 percent. They are: reshape regulation; rewire the contractual framework to reshape industry dynamics; rethink design and engineering processes; improve procurement and supply-chain management; improve on-site execution; infuse digital technology, new materials, and advanced automation; and reskill the workforce. Parts of the industry could move toward a manufacturing-inspired mass-production system that would boost productivity up to tenfold. Industrial and infrastructure megaprojects need to instill holistic project-operating systems on-site and in design offices. The highly non-linear and challenging nature of megaprojects underscores the difficulty of, and necessity for, moving toward an industrialized project-operating system.
� Many barriers to higher productivity and ways of overcoming them have been known for some time, but the industry has been in deadlock. Most individual players lack both the incentives and the scale to change the system. However, there are forces lowering the barriers for change: rising requirements and demand in terms of volume, cost, and quality; larger-scale players and more transparent markets, and disruptive new entrants; more readily available new technologies, materials, and processes; and the increasing cost of labor with partial restrictions on migrant workers. Construction-sector participants should rethink their operating approaches to avoid being caught out in what could be the world’s next great productivity story.

Reshape regulation
Rewire contracts
Rethink design
Improve onsite execution
Infuse technology and innovation
Reskill workers
Improve procurement and supply chain
... but has a long record of poor productivity
The productivity opportunity in construction
13% 1%
5–10x productivity boostpossible for some parts of the industry by moving to a manufacturing-style production system
Action in seven areas can boost sector productivity by
50–60%
Construction is a sector of two halvesFragmented specialized trades drag down the productivity of the sector as a whole
$1.6 trillionmeeting half the world’s infrastructure need
of additional value added could be created through higher productivity,
Total
100 104119 124
79
Building Civil Industrial Specialized
Construction productivity by subsectorValue added per employee, indexed total sector=100, 2013
% of construction value added
Construction matters for the world economy
of the world’s GDP
Construction-related spending accounts for
...but the sector’s annual productivity growth has only increased
over the past 20 years
23 21 4 52

viii McKinsey Global Institute
One person with construction helmet looks of a 100-story skyscraper on a 88-story skyscraper in the center of Shanghai
© Steffen Schnur /Getty Images

EXECUTIVE SUMMARY
Every year, there is about $10 trillion in construction-related spending globally, equivalent to 13 percent of GDP. This makes construction one of the largest sectors of the world economy. The sector employs 7 percent of the world’s working population and, by building the structures in which we live and work, which create our energy, materials, and goods, and on which we travel, has an impact well beyond its own boundaries. Construction matters.
However, construction has suffered for decades from remarkably poor productivity relative to other sectors.1 Other sectors have transformed themselves, boosting productivity. In retail, the mom-and-pop stores of half a century ago have been replaced by large-scale modern retailers such as Aldi and Walmart, with global supply chains and increasingly digitized distribution systems and customer-intelligence gathering. In manufacturing, lean principles and aggressive automation have been transformative. In comparison, much of construction has evolved at a glacial pace.
It is not easy to make assumptions about how productive a sector should be in comparison with others, but global labor-productivity growth in construction has averaged only 1 percent a year over the past two decades (and was flat in most advanced economies). Contrasted with growth of 2.8 percent in the world economy and 3.6 percent in manufacturing, this clearly indicates that the construction sector is underperforming. The United States highlights the industry’s challenge. While many US sectors including agriculture and manufacturing have increased productivity ten to 15 times since the 1950s, the productivity of construction remains stuck at the same level as 80 years ago. Current measurements find that there has been a consistent decline in the industry’s productivity since the late 1960s.2
If construction labor productivity were to catch up with the progress made by other sectors over the past 20 years or with the total economy (and we show that it can), we estimate that this could increase the construction industry’s value added by $1.6 trillion a year. This is equivalent to the GDP of Canada, or meeting half of global infrastructure needs, or boosting global GDP by 2 percent a year.
Yet despite the substantial benefits that would come from raising the sector’s productivity, and despite the fact that the challenges are well known and have long been discussed in the industry, progress has been limited. The industry operates in a way that seems to evolve only very slowly at best, and it is beset with misaligned incentives among owners and contractors and with market failures such as fragmentation and opacity. There is a question around how much the move from “patient capital” toward “quarterly earnings” has affected the industry’s ability to invest in itself. Some governments have now begun to address the poor productivity of construction head-on and are attempting to break the deadlock in which the industry appears to find itself. The industry needs a more productive approach—
1 The McKinsey Global Institute has studied productivity in more than 20 countries and 30 industries, including construction. All reports are available in the productivity, competitiveness, and growth section of www.mckinsey.com/mgi.
2 Revisions to labor-productivity metrics in the United States are ongoing; see Leo Sveikauskas et al., “Productivity growth in construction,” Journal of Construction Engineering and Management, volume 142, issue 10, October 2016. Early indications suggest that changes to measured prices will lead to an increase in measured labor-productivity growth particularly in subsectors such as highways, industrial construction, and homebuilding. This is consistent with patterns we observe in the divergence in productivity development, and level between heavy construction work and specialized trades (subcontracting) and repairs (see Chapter 2). For a discussion of measurement issues relating to construction, see the technical appendix.

2 McKinsey Global Institute Executive summary
demand for construction is rising. And the tools for that more productive approach are increasingly available through digital technologies and new materials.
In this report, we first look at the sector’s poor historical record on productivity and performance, homing in on ten root causes. We then look in some detail at seven ways that, in combination, could improve the productivity of the sector by 50 to 60 percent and estimate the value that could be created with concerted action. We discuss the potential for larger parts of the industry to shift toward a higher-productivity production system in which the bulk of a construction project is built from prefabricated standardized components off-site in a manufacturing facility. In the case of industrial and infrastructure megaprojects, we see the need to move away from a primarily process-driven project system to a more holistic project-operating system in order to improve the industry’s poor current performance on cost, schedule, and predictability. Recognizing and managing variance (plan conformance), flow, and inventory becomes critical. Finally, we explore which parts of the industry may be ripe for disruption and what measures each player might take to make change happen.
CONSTRUCTION HAS AN INTRACTABLE PRODUCTIVITY PROBLEMToday, around $10 trillion a year is being spent on the buildings, infrastructure, and industrial installations that are the backbone of the global economy, and demand is rising. By 2025, that amount is projected to total $14 trillion. However, the industry could produce more for this investment if productivity were higher, leading to a fundamental improvement in the world’s infrastructure and the quality of life of citizens.
Globally, labor-productivity growth in construction has averaged only 1 percent a year over the past two decades, compared with growth of 2.8 percent for the total world economy and 3.6 percent in the case of manufacturing (Exhibit E1).3 In a sample of countries analyzed, over the past ten years less than one-quarter of construction firms have matched the productivity growth achieved in the overall economies in which they work, and there is a long tail of usually smaller players with very poor productivity. Many construction projects suffer from overruns in cost and time.
3 Measuring productivity is challenging. We have used gross value added as our measure and used sector deflators to account for price fluctuations. For further detail, see the technical appendix. Our analysis refers to 41 countries that generate 96 percent of global GDP.
Exhibit E1
Globally, labor-productivity growth lags behind that of manufacturing and the total economy
SOURCE: OECD; WIOD; GGCD-10, World Bank; BEA; BLS; national statistical agencies of Turkey, Malaysia, and Singapore; Rosstat; McKinsey Global Institute analysis
ConstructionESmc 0221
160
200180
12010080
140
Real gross value added per hour worked by persons engaged, 2005 $Index: 100 = 1995
1020001995 201405
3.6
2.7
1.0
+2.6
$39$37$25
1 Based on a sample of 41 countries that generate 96% of global GDP.
Global productivity growth trends1
Hourly rate
Compound annual growth rate, 1995–2014%
Construction Total economy Manufacturing
REPEATS in report
Total economy
Manufacturing
Construction Constr
Mfg
Total
3McKinsey Global Institute Reinventing construction: A route to higher productivity
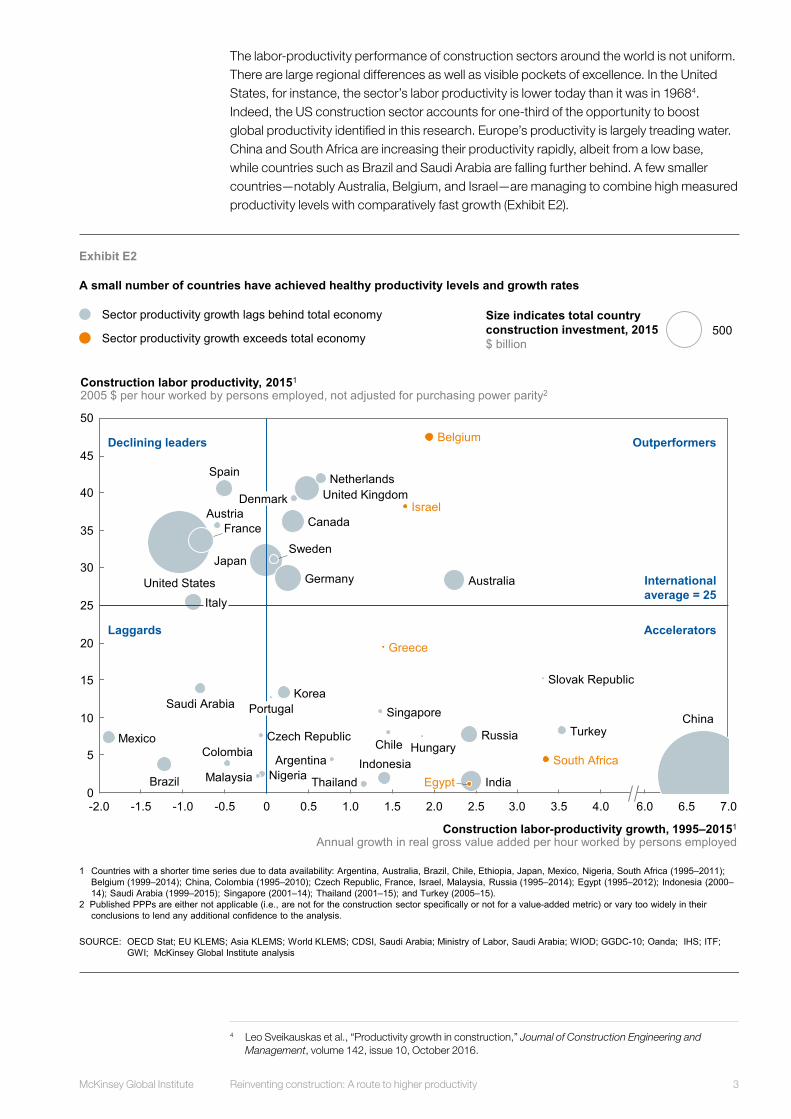
The labor-productivity performance of construction sectors around the world is not uniform. There are large regional differences as well as visible pockets of excellence. In the United States, for instance, the sector’s labor productivity is lower today than it was in 19684. Indeed, the US construction sector accounts for one-third of the opportunity to boost global productivity identified in this research. Europe’s productivity is largely treading water. China and South Africa are increasing their productivity rapidly, albeit from a low base, while countries such as Brazil and Saudi Arabia are falling further behind. A few smaller countries—notably Australia, Belgium, and Israel—are managing to combine high measured productivity levels with comparatively fast growth (Exhibit E2).
4 Leo Sveikauskas et al., “Productivity growth in construction,” Journal of Construction Engineering and Management, volume 142, issue 10, October 2016.
Exhibit E2
A small number of countries have achieved healthy productivity levels and growth rates
SOURCE: OECD Stat; EU KLEMS; Asia KLEMS; World KLEMS; CDSI, Saudi Arabia; Ministry of Labor, Saudi Arabia; WIOD; GGDC-10; Oanda; IHS; ITF; GWI; McKinsey Global Institute analysis
1 Countries with a shorter time series due to data availability: Argentina, Australia, Brazil, Chile, Ethiopia, Japan, Mexico, Nigeria, South Africa (1995–2011); Belgium (1999–2014); China, Colombia (1995–2010); Czech Republic, France, Israel, Malaysia, Russia (1995–2014); Egypt (1995–2012); Indonesia (2000–14); Saudi Arabia (1999–2015); Singapore (2001–14); Thailand (2001–15); and Turkey (2005–15).
2 Published PPPs are either not applicable (i.e., are not for the construction sector specifically or not for a value-added metric) or vary too widely in their conclusions to lend any additional confidence to the analysis.
6.0 7.03.5 6.5-0.5-1.0-2.0 -1.5 1.0 2.51.50.50 3.0 4.02.0
25
30
5
20
0
10
15
50
35
45
40
Spain
Korea
Mexico
Sweden
Malaysia
Czech Republic
Greece
Egypt
South Africa
Portugal
Israel
Belgium
Denmark
BrazilIndonesia
Italy
Austria
ArgentinaChileColombia
SingaporeSaudi Arabia
ThailandNigeria
Canada
GermanyJapan
Slovak Republic
United States
United Kingdom
Russia
India
France
Netherlands
TurkeyHungary
Construction labor productivity, 20151
2005 $ per hour worked by persons employed, not adjusted for purchasing power parity2
Construction labor-productivity growth, 1995–20151
Annual growth in real gross value added per hour worked by persons employed
Australia
500Sector productivity growth lags behind total economy
Sector productivity growth exceeds total economy
Size indicates total country construction investment, 2015$ billion
China
International average = 25
Declining leaders
Laggards
Outperformers
Accelerators
REPEATS in report
4 McKinsey Global Institute Executive summary
The low labor productivity of the construction industry is an important issue (see Box E1, “Why labor productivity in construction matters”). If construction sector productivity were to catch up with that of the total economy—and we will show that it can—this would boost the sector’s value added by an estimated $1.6 trillion, adding about 2 percent to the global economy a year. This would correspond to an increase in construction value added using the same resources of almost 50 percent.
A TALE OF TWO INDUSTRIES: CONSTRUCTION HAS TWO DISTINCT PARTS, EACH OF WHICH IS AFFECTED DIFFERENTLY BY A RANGE OF MARKET FAILURES The construction sector is not homogeneous. It splits more or less in half between large-scale players engaged in heavy construction such as civil and industrial work and large-scale housing, and a large number of fragmented specialized trades such as mechanical, electrical, and plumbing that act as subcontractors or work on small projects such as single-family housing or, increasingly, particularly in Europe and the United States, refurbishment and repair work. The first group tends to have much higher productivity than the second.
In the first group, contractors involved in industrial infrastructure have, on average, the highest productivity at 124 percent of the figure for the industry as a whole, followed by civil construction players at 119 percent and large-scale building contractors at 104 percent.5 Trades subcontractors, which are responsible for a large share of value in small real estate and refurbishment projects, are typically relatively small; their productivity is about 20 percent lower than the sector average. The higher-productivity large-scale half of the industry is not immune to the low productivity of the other half. Large-scale players routinely subcontract to smaller specialized players, and, in the United States, the productivity in civil, industrial, and buildings including trades subcontractors drops by 12, 26, and 28 percent, respectively. Therefore, any action to boost sector productivity needs to apply to the entire supply chain and to both parts of the market—each of which lags behind manufacturing in its productivity (Exhibit E3).
5 We calculated construction sector productivity using productivity data for 18 countries: Australia, Canada, the European Union (EU) 15, and the United States. We calculated the average productivity of construction in each country, then indexed that to the total economy level. See the technical appendix for more detail on our methodology.
Box E1. Why labor productivity in construction mattersWe focus this report on labor productivity, defined as the value added by construction workers (output in terms of structures created minus purchased materials) per hour of work and its growth over time, adjusted for inflation. An increase means that higher value can be provided to customers with the same or fewer resources, which translates into a desirable mix of higher-quality structures at lower cost for owners, higher profitability for contractors, and higher wages for workers. Any one or two of these objectives can also be achieved without productivity growth—for instance, squeezing wages or margins to lower costs or raising prices for owners to be able to meet wage requirements—but the combination of all three requires productivity growth. High labor productivity often also goes hand in hand with shorter and more reliable schedules.

5McKinsey Global Institute Reinventing construction: A route to higher productivity
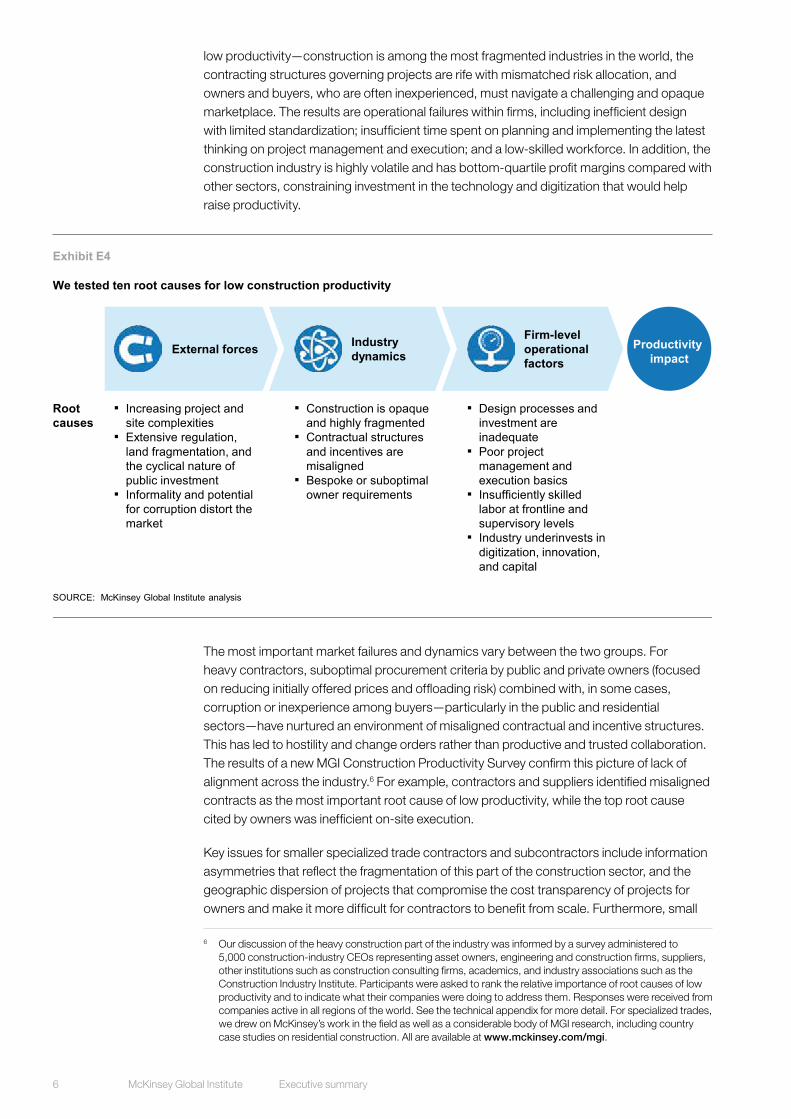
We identified ten causes of low productivity and market failures in the construction industry (Exhibit E4).
At the macro level, projects and sites are becoming increasingly complex and brownfield-, refurbishment-, or repairs-oriented, and are challenged by geographic dispersion and fragmented land markets. In addition, the construction industry faces extensive regulation and dependency on public-sector demand. Informality, and sometimes outright corruption, distorts the market. Compounding these issues are industry dynamics that contribute to
Exhibit E3
400
-0.5-1.5-3.0-3.5 -2.5 -1.0 0.5-2.0
320
200
380
340
360
100
120
160
140
1.0 3.01.5 2.52.0
180
0
60
40
80
3.5
Roofing
Industrial1
Framing
Automobilemanufacturing
Single-familyhousing
Housing for-salebuilders
Electrical
Commercialand institutional
Plumbing, HVAC
Drywall
Multifamilyhousing
Productivity, 2012$ thousand per person employed, 2015 $
Water and sewer
Pouredconcrete
Painting
Heavyindustrial
Power andcommunications
Productivity compound annual growth rate, 2002–12Annual growth in real gross value added per person employed, %2
Residentialremodelers
Site preparation
Highway,street,bridge
Oil and gaspipeline
Smaller trades trail on productivity levels and growth
SOURCE: US Economic Census; McKinsey Global Institute analysis
20
1 Manufacturing plants and warehouses.2 All subsectors deflated with overall construction sector deflators, not subsector-specific prices.
US example
NOT EXHAUSTIVE
Size indicates economic value added, 20122015 $ million Building
Specialty
Industrial
CivilUS construction average
Small trades
REPEATS in report
Heavy construction
6 McKinsey Global Institute Executive summary
low productivity—construction is among the most fragmented industries in the world, the contracting structures governing projects are rife with mismatched risk allocation, and owners and buyers, who are often inexperienced, must navigate a challenging and opaque marketplace. The results are operational failures within firms, including inefficient design with limited standardization; insufficient time spent on planning and implementing the latest thinking on project management and execution; and a low-skilled workforce. In addition, the construction industry is highly volatile and has bottom-quartile profit margins compared with other sectors, constraining investment in the technology and digitization that would help raise productivity.
The most important market failures and dynamics vary between the two groups. For heavy contractors, suboptimal procurement criteria by public and private owners (focused on reducing initially offered prices and offloading risk) combined with, in some cases, corruption or inexperience among buyers—particularly in the public and residential sectors—have nurtured an environment of misaligned contractual and incentive structures. This has led to hostility and change orders rather than productive and trusted collaboration. The results of a new MGI Construction Productivity Survey confirm this picture of lack of alignment across the industry.6 For example, contractors and suppliers identified misaligned contracts as the most important root cause of low productivity, while the top root cause cited by owners was inefficient on-site execution.
Key issues for smaller specialized trade contractors and subcontractors include information asymmetries that reflect the fragmentation of this part of the construction sector, and the geographic dispersion of projects that compromise the cost transparency of projects for owners and make it more difficult for contractors to benefit from scale. Furthermore, small
6 Our discussion of the heavy construction part of the industry was informed by a survey administered to 5,000 construction-industry CEOs representing asset owners, engineering and construction firms, suppliers, other institutions such as construction consulting firms, academics, and industry associations such as the Construction Industry Institute. Participants were asked to rank the relative importance of root causes of low productivity and to indicate what their companies were doing to address them. Responses were received from companies active in all regions of the world. See the technical appendix for more detail. For specialized trades, we drew on McKinsey’s work in the field as well as a considerable body of MGI research, including country case studies on residential construction. All are available at www.mckinsey.com/mgi.
Exhibit E4
SOURCE: McKinsey Global Institute analysis
We tested ten root causes for low construction productivity
Productivity impact
External forces Industry dynamics
Firm-level operational factors
▪ Increasing project and site complexities
▪ Extensive regulation, land fragmentation, and the cyclical nature of public investment
▪ Informality and potential for corruption distort the market
▪ Construction is opaque and highly fragmented
▪ Contractual structures and incentives are misaligned
▪ Bespoke or suboptimal owner requirements
▪ Design processes and investment are inadequate
▪ Poor project management and execution basics
▪ Insufficiently skilled labor at frontline and supervisory levels
▪ Industry underinvests in digitization, innovation, and capital
Root causes
7McKinsey Global Institute Reinventing construction: A route to higher productivity
and specialized trade contractors offering higher-productivity solutions are held back by competition from contractors using less productive but cheaper informal labor and by regulation such as heterogeneous zoning and building codes. Many players in the industry benefit from today’s market failures, earning a substantial share of revenue and profits from change orders and claims, and reducing exposure to competition in an opaque market.
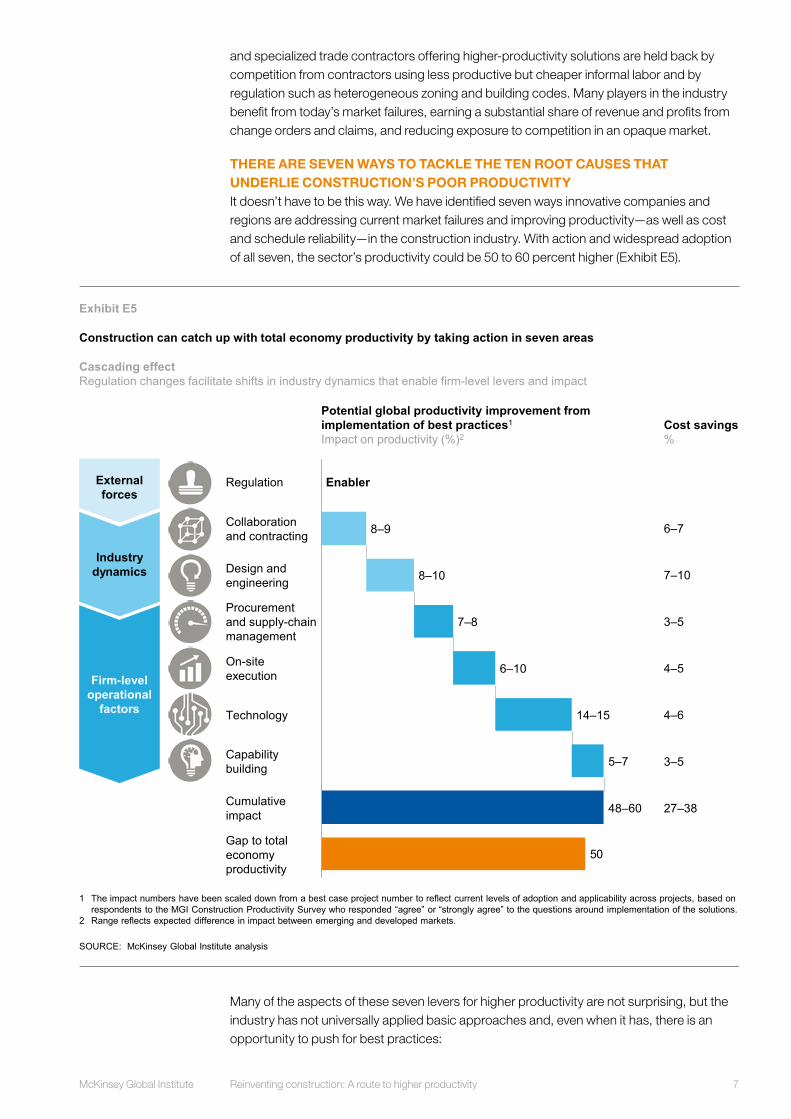
THERE ARE SEVEN WAYS TO TACKLE THE TEN ROOT CAUSES THAT UNDERLIE CONSTRUCTION’S POOR PRODUCTIVITYIt doesn’t have to be this way. We have identified seven ways innovative companies and regions are addressing current market failures and improving productivity—as well as cost and schedule reliability—in the construction industry. With action and widespread adoption of all seven, the sector’s productivity could be 50 to 60 percent higher (Exhibit E5).
Many of the aspects of these seven levers for higher productivity are not surprising, but the industry has not universally applied basic approaches and, even when it has, there is an opportunity to push for best practices:
Exhibit E5
SOURCE: McKinsey Global Institute analysis
50
48–60
5–7
14–15
Gap to totaleconomyproductivity
Capabilitybuilding
Technology
Procurementand supply-chainmanagement
Design andengineering
Cumulativeimpact
8–10
6–10
7–8
Enabler
8–9
Regulation
On-siteexecution
Collaborationand contracting
Construction can catch up with total economy productivity by taking action in seven areas
1 The impact numbers have been scaled down from a best case project number to reflect current levels of adoption and applicability across projects, based on respondents to the MGI Construction Productivity Survey who responded “agree” or “strongly agree” to the questions around implementation of the solutions.
2 Range reflects expected difference in impact between emerging and developed markets.
Cascading effectRegulation changes facilitate shifts in industry dynamics that enable firm-level levers and impact
External forces
Industry dynamics
Firm-level operational
factors
Cost savings%
Potential global productivity improvement from implementation of best practices1
Impact on productivity (%)2
6–7
7–10
3–5
4–5
4–6
3–5
27–38
REPEATS in report
8 McKinsey Global Institute Executive summary
� Reshape regulation and raise transparency. Actions include streamlining permitting and approvals processes, as Australia has done; reducing informality and corruption; and encouraging transparency on cost and performance, as the International Construction Measurement Standards project does.7 Many governments allocate grants for innovation and training. Germany’s Federal Ministry of Transport and Digital Infrastructure (formerly the Federal Ministry of Transport, Building, and Urban Development), for instance, supports R&D through studies in building materials. Best-practice regulation would include moving toward outcome-based, more standardized building codes, and consolidating land to promote scale. Examples include Singapore’s move to allow cross-laminated timber (CLT) for high-rise structures and Japan’s promotion of scale through land pooling.
� Rewire the contractual framework. There is a need to move away from the hostile contracting environment that characterizes many construction projects to a system focused on collaboration and problem solving. To achieve this, tendering processes can be based on best value and past performance rather than cost alone, and public processes streamlined. Establishing a “single source of truth” on projects for monitoring progress early, potentially supported by collaborative technology, helps to minimize misalignments and enable joint corrective action. The data already exist to fundamentally improve the accuracy of cost and schedule estimates. Where players continue to use traditional contracts, they should introduce incentives that significantly improve performance and alignment not at a trade or package level, but at the project-outcome level. To move toward best practices, appropriate alternative contracting models such as integrated project delivery (IPD) help build long-term collaborative relationships. Relational contracts will need to become more prevalent than transactional contracts. Sufficient investments in up-front planning incorporating all parties’ input have been shown to raise productivity substantially.
� Rethink design and engineering processes. Institutionalizing value engineering into the design process with a greater focus on constructability, and pushing for repeatable design elements in those projects that do not require bespoke solutions would make a contribution to boosting productivity. The biggest impact on productivity would come from moving toward thinking about construction as a production system, where possible encouraging off-site manufacture, minimizing on-site construction through the extensive use of pre-cast technology, assembling panels in factories and then finishing units on-site. To indicate the scale of the opportunity, only 50 percent of respondents to the MGI Construction Productivity Survey said that their firms had a standard design library.8 In asset classes for which standardization might not be the panacea, the opportunity for parameter specification rather than individual company specifications is significant. Our analysis of sectors such as deepwater oil and gas underscores what a highly significant and largely uncaptured opportunity this is. The automobile and aerospace industries provide insight into how tighter integration with contractors might evolve.
� Improve procurement and supply-chain management. A combination of best practices seen in other industries and innovative, digitally enabled approaches can deliver substantial change. Improved planning and increased transparency among contractors and suppliers would reduce delays significantly. Properly skilled central procurement teams can drive economies of scale for certain products across those
7 This is a coalition established to develop transparency on costs internationally and the ability to benchmark between them.
8 MGI surveyed 5,000 construction-industry CEOs representing asset owners, engineering and construction firms, suppliers, and other institutions such as construction consulting firms, academics, and industry associations. Participants were asked to rank the relative importance of root causes of low productivity, and indicate what their companies were doing to address them. Responses were received from companies active in all regions of the world.

9McKinsey Global Institute Reinventing construction: A route to higher productivity
sites. Best practice in areas such as digitizing procurement and supply-chain workflows will enable more sophisticated logistics management and just-in-time delivery. Katerra, for instance, recently launched a data-enhanced global sourcing model to help develop a supply chain that reacts to potential disruptions and market dynamics with predictive replenishment of supplies informed by inventories connected to the Internet of Things (such as wearable devices, radio frequency ID tags, and sensor technology). The construction sector ranks in the lower range of sophistication in the Global Purchasing Excellence Survey published by McKinsey’s Procurement Practice, suggesting ample room for improvement.
� Improve on-site execution. There are four key approaches that are well known in the industry but have not been universally adopted. First is the introduction of a rigorous planning process—the Last Planner® System (LPS) is a useful tool—to ensure that key activities are achieved on time and on budget.9 The use of integrated planning tools on a large-scale oil and gas project, for instance, achieved a 70 percent increase in the project’s productivity. Second is reshaping the relationship and interactions between owners and contractors, and key performance indicators (KPIs) being agreed on and used at regular performance meetings at which on-site issues are resolved. Complementing commonly used KPIs with additional forward-looking plan conformance metrics to identify, and subsequently reduce, variance is critical. Third is improving the mobilization for new projects by ensuring that all pre-work (for instance, obtaining approvals and developing project milestones) has been completed prior to starting on-site. Finally, there is a need for careful planning and coordination of different disciplines on-site along with the application of lean principles to reduce waste and variability. At the heart of this issue is a need to move from systems that rely primarily on process and command-and-control toward a more holistic operating system. The sheer complexity and variability of today’s megaprojects require a project-operating approach that integrates technical and management systems and fully harnesses workers’ capabilities. In the future, new forms of digital collaboration, notably the Internet of Things and advanced analysis, will combine to enable tracking of equipment and materials and therefore greater transparency.
� Infuse digital technology, new materials, and advanced automation. Companies can start by making 3D building information modeling (BIM) universal within the company alongside use of digital collaboration tools, drones, and unmanned aerial vehicles for scanning, monitoring, and mapping. They can put themselves at the cutting edge by using platforms such as 5D BIM to establish transparency in design, costing, and progress visualization; advanced analytics enabled by the Internet of Things to improve on-site monitoring of materials, labor, and equipment productivity; and digital collaboration and mobility tools (such as construction management apps loaded on mobile devices) to better track progress and collaborate in real time. On-site productivity can be increased by as much as 50 percent by implementing a cloud-based control tower that rapidly assembles accurate data in near real time that is both backward-looking and predictive (for example, using plan conformance and other variability and inventory metrics). Importantly, owners need to ensure that the right data flow through the various owner, contractor, and subcontractor systems. Big data also has a significant role to play. Techniques and data that are readily available today can produce large improvements in the accuracy of cost and schedule estimates as well as engineering productivity. Developing new lightweight materials and construction methodologies such as prefabricated pre-finished volumetric construction can further facilitate off-site fabrication. Advanced automated equipment and tools such as bricklaying and tiling robots can accelerate on-site execution. The introduction of predictive analytics and
9 Registered to the Lean Construction Institute.
10 McKinsey Global Institute Executive summary
pattern recognition has enabled far more sophisticated monitoring of construction projects; one example is the network of sensors installed to track the impact of tunneling works for London’s Crossrail project. MGI’s productivity survey indicated that the biggest barriers to innovation by construction companies are underinvestment in IT and technology more broadly, and a lack of R&D processes. Establishing innovation officers can make a difference for technology adoption.
� Reskill the workforce. Change in the construction sector cannot be achieved without investment in retooling a workforce that is aging and changing its makeup through migration. Construction firms and workers need to continuously reskill and train to use the latest equipment and digital tools. In the mix should be apprenticeship programs such as the one run by Siemens in the United Kingdom, training frontline workers in core skills that are currently underdeveloped; and increasing stability in the workforce by breaking seasonality and cyclicality.
THERE IS AN OPPORTUNITY FOR PARTS OF THE CONSTRUCTION INDUSTRY TO MOVE TO A PRODUCTION SYSTEM—AND BOOST PRODUCTIVITY UP TO TENFOLD The seven areas that need to be addressed can boost productivity on projects by some 50 to 60 percent. However, if construction were to depart from entirely project-based approaches to more consistently employ a manufacturing-like system of mass production with much more standardization and manufacturing of modules and parts in factories off-site, the productivity boost could be an order of magnitude greater.
Examples of firms that are moving to a production system suggest that a productivity boost of five to ten times could be possible. For instance, Barcelona Housing Systems, which builds replicable four-story multifamily buildings, aims to have a full production system in place in 2018 that can build five to ten times more units than traditional construction with the same amount of labor. Finnish industrial company Outotec has stated that its mobile flotation plant for small mines requires 20 percent less capital investment and 30 percent less labor, and is 30 percent faster to install than alternatives. Broad Sustainable Buildings of China, which has erected a 30-story hotel in just 15 days, estimates that its buildings cost 10 to 30 percent less than structures erected in the traditional way. Dramatic time and cost savings reported—or aspired to—by these firms add up to much higher productivity. A broader shift to a production system would negate the majority of market failures that we identify in Chapter 2, simplifying and streamlining the construction ecosystem and making it more efficient.
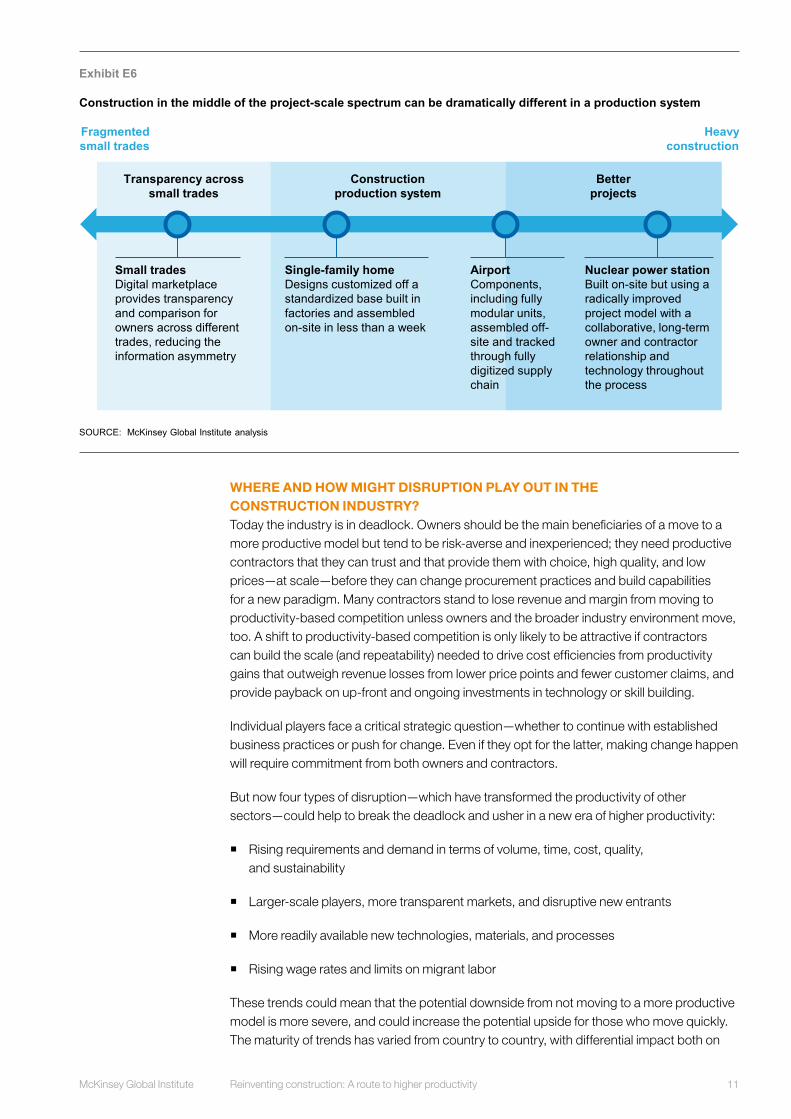
The shift to a production system will not be possible for the entire sector. For some parts of the industry, the answer is a more effective and efficient project-based system, but many players could embrace a much more radical approach. Construction projects cover a broad spectrum in size and complexity, and change of different forms is possible along the breadth of that spectrum (Exhibit E6).
11McKinsey Global Institute Reinventing construction: A route to higher productivity
WHERE AND HOW MIGHT DISRUPTION PLAY OUT IN THE CONSTRUCTION INDUSTRY? Today the industry is in deadlock. Owners should be the main beneficiaries of a move to a more productive model but tend to be risk-averse and inexperienced; they need productive contractors that they can trust and that provide them with choice, high quality, and low prices—at scale—before they can change procurement practices and build capabilities for a new paradigm. Many contractors stand to lose revenue and margin from moving to productivity-based competition unless owners and the broader industry environment move, too. A shift to productivity-based competition is only likely to be attractive if contractors can build the scale (and repeatability) needed to drive cost efficiencies from productivity gains that outweigh revenue losses from lower price points and fewer customer claims, and provide payback on up-front and ongoing investments in technology or skill building.
Individual players face a critical strategic question—whether to continue with established business practices or push for change. Even if they opt for the latter, making change happen will require commitment from both owners and contractors.
But now four types of disruption—which have transformed the productivity of other sectors—could help to break the deadlock and usher in a new era of higher productivity:
� Rising requirements and demand in terms of volume, time, cost, quality, and sustainability
� Larger-scale players, more transparent markets, and disruptive new entrants
� More readily available new technologies, materials, and processes
� Rising wage rates and limits on migrant labor
These trends could mean that the potential downside from not moving to a more productive model is more severe, and could increase the potential upside for those who move quickly. The maturity of trends has varied from country to country, with differential impact both on
Exhibit E6
Transparency across small trades
Better projects
Construction production system
Small tradesDigital marketplace provides transparency and comparison for owners across different trades, reducing the information asymmetry
Single-family homeDesigns customized off a standardized base built in factories and assembled on-site in less than a week
Nuclear power stationBuilt on-site but using a radically improved project model with a collaborative, long-term owner and contractor relationship and technology throughout the process
Construction in the middle of the project-scale spectrum can be dramatically different in a production system
SOURCE: McKinsey Global Institute analysis
Fragmented small trades
Heavy construction
REPEATS in report
AirportComponents, including fully modular units, assembled off-site and tracked through fully digitized supply chain
12 McKinsey Global Institute Executive summary
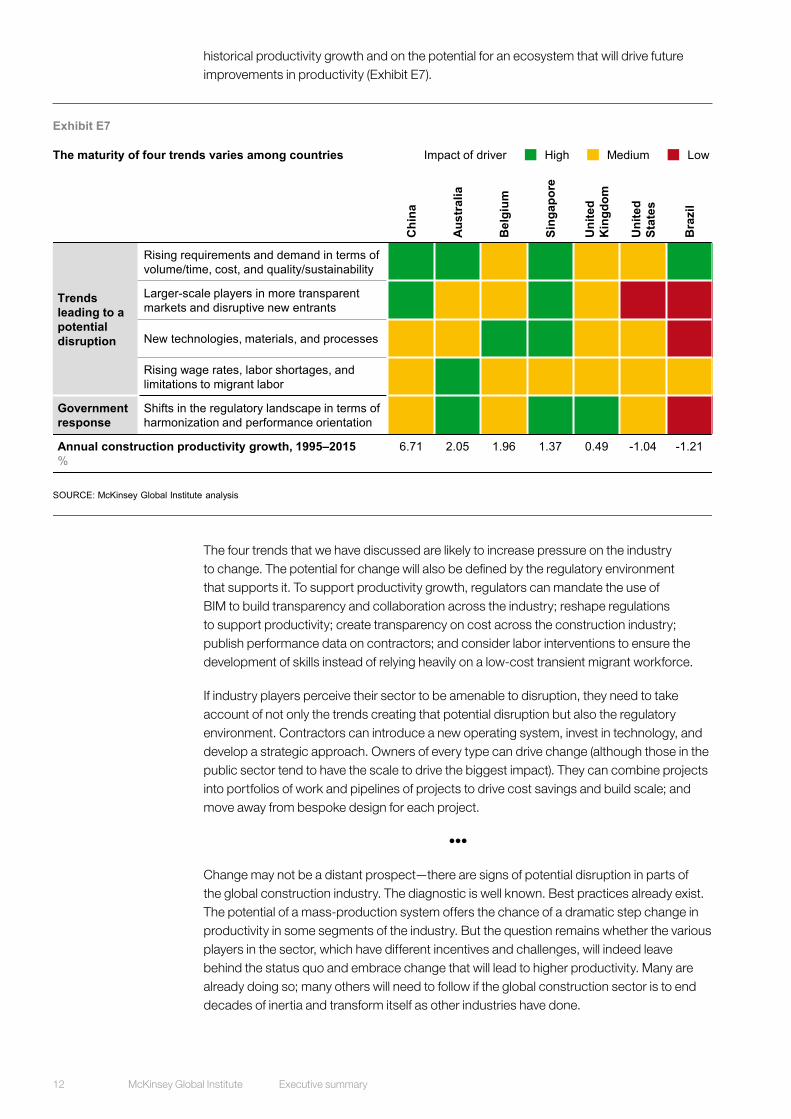
historical productivity growth and on the potential for an ecosystem that will drive future improvements in productivity (Exhibit E7).
The four trends that we have discussed are likely to increase pressure on the industry to change. The potential for change will also be defined by the regulatory environment that supports it. To support productivity growth, regulators can mandate the use of BIM to build transparency and collaboration across the industry; reshape regulations to support productivity; create transparency on cost across the construction industry; publish performance data on contractors; and consider labor interventions to ensure the development of skills instead of relying heavily on a low-cost transient migrant workforce.
If industry players perceive their sector to be amenable to disruption, they need to take account of not only the trends creating that potential disruption but also the regulatory environment. Contractors can introduce a new operating system, invest in technology, and develop a strategic approach. Owners of every type can drive change (although those in the public sector tend to have the scale to drive the biggest impact). They can combine projects into portfolios of work and pipelines of projects to drive cost savings and build scale; and move away from bespoke design for each project.
•••
Change may not be a distant prospect—there are signs of potential disruption in parts of the global construction industry. The diagnostic is well known. Best practices already exist. The potential of a mass-production system offers the chance of a dramatic step change in productivity in some segments of the industry. But the question remains whether the various players in the sector, which have different incentives and challenges, will indeed leave behind the status quo and embrace change that will lead to higher productivity. Many are already doing so; many others will need to follow if the global construction sector is to end decades of inertia and transform itself as other industries have done.
Exhibit E7
SOURCE: McKinsey Global Institute analysis
Chi
na
Aust
ralia
Bel
gium
Sing
apor
e
Uni
ted
Kin
gdom
Uni
ted
Stat
es
Bra
zil
Trendsleading to a potential disruption
Rising requirements and demand in terms of volume/time, cost, and quality/sustainability
Larger-scale players in more transparent markets and disruptive new entrants
New technologies, materials, and processes
Rising wage rates, labor shortages, and limitations to migrant labor
Government response
Shifts in the regulatory landscape in terms of harmonization and performance orientation
Annual construction productivity growth, 1995–2015%
6.71 2.05 1.96 1.37 0.49 -1.04 -1.21
REPEATS in report
The maturity of four trends varies among countries High Medium LowImpact of driver

13McKinsey Global Institute Reinventing construction: A route to higher productivity

McKinsey Global InstituteFebruary 2017 Copyright © McKinsey & Company www.mckinsey.com/mgi
@McKinsey_MGI McKinseyGlobalInstitute

HOUSING AFFORDABILITY: A SUPPLY-SIDE TOOL KIT FOR CITIESBRIEFING NOTEPREPARED FOR CITYLAB PARISOCTOBER 2017
One feeling unites billions of people in cities around the world: a sense of sticker shock whenever they attempt to find a new home. From London to Lagos, housing costs are creating financial stress for a large share of the world’s urban residents. Rents and home prices have risen far faster than incomes in most countries, particularly in big cities where many people want to live and where job opportunities are concentrated. The issue affects everyone from slum residents living on the margins to middle-income households.
At the heart of the issue is an extreme imbalance in supply and demand. Population growth, the continuing trend toward urbanization, and rising global incomes are all fueling steady demand increases. In 1950, New York City and Tokyo were the only two cities on earth with populations of more than 10 million; today there are more than 20 cities of that size. The world’s urban population has been rising by an average of 65 million people a year over the last three decades, led by breakneck urbanization in China and India.
The housing stock of expensive urban centers around the world has not expanded quickly enough to keep up with this surge in demand. Research from the McKinsey Global Institute (MGI) has examined the scope of the affordable housing gap. California, for instance, added 544,000 households but only 467,000 net housing units from 2009 to 2014. Its cumulative housing shortfall has expanded to two million units. With
home prices and rents hitting all-time highs, nearly half of the state’s households struggle to afford housing in their local markets. In New York City, MGI estimates that 1.5 million households cannot afford the cost of what we define as a decent apartment at market rates. This puts the city’s total “affordability gap” at $18 billion a year or 4 percent of the city’s GDP. As London’s economy has boomed over the past two decades, the city’s annual home completions increased by just over 10 percent, falling far short of demand and driving home prices five times higher.
Worldwide, MGI has estimated that some 330 million urban households currently live in substandard housing or stretch to pay housing costs that exceed 30 percent of their incomes. This number could rise to 440 million households by 2025 if current trends are not reversed. Beyond the human toll, this issue eventually constrains economic growth. Investment in housing construction remains below its potential, and households with a disproportionate share of monthly income going toward rent or mortgage payments have to limit other forms of consumption. Returning to our example in California, MGI estimates that the housing shortage causes the state to lose $140 billion in annual output, or 6 percent of state GDP.
The legitimate interests of investors, particularly in a low-interest-rate environment, can add fuel to the fire. Foreign capital flocks into global hubs, and

Housing affordability: A supply-side tool kit for cities2 McKinsey Global Institute
residents feel compelled to leverage up to achieve home ownership or add hard assets that are appreciating in price. In the hottest markets, these trends are sometimes amplified by speculative behavior such as land hoarding or fast-paced property flipping.
Some governments have taken steps to cool real estate markets that are overheated by investors. These approaches include China’s moves to discourage land hoarding by imposing a tax on idle land; additional taxes on value gain and limits on foreign and secondary home ownership in Switzerland; Canada’s recent imposition of stress tests for home loans and tighter rules for mortgage insurance; and Germany’s limits on loan-to-value financing ratios. These types of measures work best when they are complemented by flourishing rental markets that allow average citizens to save for down payments without facing a shortage of housing options.
National and local governments around the world often address housing gaps by focusing on the demand and financing side. Strategies such as housing subsidies, privileged financing, or various forms of rent control offer much-needed relief to the low-income households they cover, and they are legitimate policy choices if carefully designed. But they are expensive and difficult to sustain—and they do not address the core issue of an underlying housing shortfall.
It will take a dramatic increase in the number of available housing units to achieve greater affordability. Of course, the simplicity of this statement belies the complexity of executing on it. Because progress has been so elusive, this briefing note will focus solely on supply-side solutions, addressing three challenges that all cities have in common: finding available land, removing barriers, and making the construction sector more productive.
1. FIND THE LANDAccess to land is typically the biggest constraint on housing development and one of the major drivers of cost. In places such as Rio de Janeiro and Auckland, the cost of land often exceeds 40 percent of total property prices. In extreme cases such as San Francisco, land is so scarce that it can account for as much as 80 percent of a home’s price. Globally, we estimate that unlocking land to the fullest extent could reduce the cost of owning a standard housing unit by
up to 20 percent. A comprehensive citywide mapping and inventory exercise can unearth many opportunities. Based on our past work in urban environments, we have identified seven places to focus.
Prioritizing transit-oriented developmentIt is critical for congested cities to promote density around transit rather than encouraging sprawl and longer commutes. Transit-oriented development may involve redeveloping existing residential structures or encouraging new builds by permitting higher floor-space ratios, loosening height restrictions, or allowing greater density in specific target zones. These zones can be selected to promote local objectives, such as reduced dependence on private vehicles or the development of mixed-use, pedestrian-friendly cityscapes. Places such as Hong Kong and Seoul have already intensified land use around transit stops. Seoul allows floor-area ratios that are up to 20 times higher in better-connected neighborhoods than in more distant areas. Other cities can follow this approach. Analysis in San Diego, for example, found that increasing the density of residential developments in a half-mile radius around public transport nodes could expand the city’s housing stock by close to 30 percent.
Getting more out of underutilized sitesIn many cases, cities may not even need to increase density thresholds. They can build out on residential parcels that are not taking advantage of currently allowed density. Sites that are underutilized can be identified as priorities for redevelopment. Incentives (such as expedited permitting, relief from parking requirements, or investment in public parking) can make these types of projects more attractive to developers. MGI’s analysis in Los Angeles found that 28 percent of parcels zoned for multifamily development are underutilized; maximizing them could add more than 300,000 units to the city’s housing stock.
Putting vacant urban parcels to workAnother strategy involves building infill housing on vacant parcels. Even dense neighborhoods may have empty lots that could serve as viable sites. A surprising amount of land sits idle in the face of huge unmet housing demand. Our analysis finds, for example, that Riyadh, Saudi Arabia, has some 40 square kilometers that are zoned residential but are not being utilized, while about 40 percent of
3McKinsey Global Institute Housing affordability: A supply-side tool kit for cities
all zoned residential land within Nairobi is vacant. Taxes on idle land can create an incentive to build.
Making public land availableWhere appropriate, governments can earmark unused public lands for housing development. Transit authorities may own property surrounding busy transport nodes. Decommissioned sports facilities, military bases, or transit hubs may also be viable sites. It is often easier to facilitate low- or middle-income housing on these types of sites than on typical residential parcels, since public authorities can make the transfer or sale of the land contingent on the development of affordable housing. They may even directly subcontract development of housing in these areas. Turkey’s Mass Housing Administration (TOKI) has managed to open up some 4,120 square kilometers of unused land (or 4 percent of total urban land) from other government agencies for housing development. San Diego could add roughly 4,000 housing units by converting disused sports facilities into mixed-use commercial and residential developments.
Transforming industrial sitesSome cities may have opportunities to convert light industrial sites. Large unused industrial parcels (such as shuttered factories) can offer tremendous development potential. But converting them to residential use should involve careful consideration of the impact on jobs and whether any commercial activity on surrounding sites would pose issues for residents.
Going greenfield Cities surrounded by undeveloped or agricultural land can invest in greenfield housing projects on their outskirts. Although greenfield developments typically involve building infrastructure, roads, and new neighborhoods, they may still be cheaper than infill projects if the land is more affordable and if there is room to achieve economies of scale on multi-acre sites. Greenfield developments open up the possibility of building single-family homes, which are less feasible in dense urban cores. In California alone, we estimate that greenfield developments could provide more than 600,000 additional housing units. Despite their advantages, cities should learn from mistakes made in locations as diverse as Cairo and Mexico City; if greenfield developments are built too far from existing employment centers or transit hubs, they can fail to attract or retain residents.
Adding accessory dwelling unitsFinally, many cities can encourage the owners of single-family homes to add accessory dwelling units. These may include garage apartments, basement apartments, or backyard cottages. It does not matter whether they house extended family or renters. Accessory dwelling units are inherently affordable because they use existing land, buildings, and infrastructure, resulting in a sort of “invisible density.” MGI’s research in California found that homeowners could add up to 790,000 housing units across the state from such structures.
2. CITIES HAVE TO REMOVE THE BARRIERS Cities have to develop governance structures that represent all stakeholders (not just the most entrenched, powerful, or vocal) and streamline the actual execution. Several approaches can help.
Aligning for better delivery: Delivery labs and integrated housing agenciesHousing strategies are enormously complex, involving initiatives and policies across financing, urban planning, infrastructure development, land use regulation, building codes, delivery and contracting approaches, and more. But stakeholders from different parts of the system rarely work together to smooth frictions and focus on the broader goal of getting more affordable housing built quickly.
The “delivery lab” model addresses this lack of coordination by bringing together 30 to 40 people across these specialties for fast-paced, intensive working events. Labs are designed to translate high-level housing strategies into detailed initiatives, implementation plans, and key performance indicators. In these settings, public- and private-sector stakeholders can address misperceptions and arrive at joint solutions. Labs can produce integrated plans that clarify expectations and synchronize timelines for what each player agrees to deliver. Getting the right people around the table is critical. Sessions should be well-facilitated, with consultation from external topic experts. Each stakeholder should be represented by someone with enough seniority to make quick decisions, and the top sponsor (for example, a city mayor) should personally attend and guide key sessions.
The delivery lab approach has had a major positive impact on the housing market in Saudi Arabia. The government invited all stakeholders across the

Housing affordability: A supply-side tool kit for cities4 McKinsey Global Institute
public sector (all ministries and government entities related to housing) and private sector (including representatives from real estate developers and banks). Citizens’ voices were also heard through the use of social media and focus groups.
These events took a multidisciplinary approach to identifying the key challenges in the housing sector and devising solutions with clear targets, implementation plans, accountability, and budgets. The labs have aligned stakeholders around high-impact ideas that take practical considerations into account. To give just one example, the labs identified last-mile infrastructure connectivity as an issue that was delaying the development of large land parcels and creating uncertainty that deterred developers. Cross-disciplinary problem-solving quickly came up with solutions, such as an infrastructure company focused on building these last-mile connections using a build-operate-transfer model.
The outcomes from successful labs are a good foundation, but actual implementation is crucial. A city government can accelerate progress by empowering an agency or unit with a mandate to guide housing delivery from end to end. This type of unit needs exceptional talent with good problem-solving skills, stakeholder management and communication skills, and significant decision-making power or direct access to the top decision-maker. San Diego’s Housing Commission, for instance, hires private-sector talent, has an in-house real estate development team, and invests in marketing and communications. Turkey’s TOKI agency has wide-ranging control over land resources, and it uses both public-private partnerships and direct contracting to ensure that housing units are built for citizens across the income spectrum.
Engaging more stakeholders and overcoming NIMBYismAlthough most people agree in the abstract that more affordable housing would be a good thing, opposition often halts specific proposals. Existing residents may be concerned about the changing character of their neighborhoods, the prospect of lower home values, congestion, and crowding in schools. To accommodate these concerns, many jurisdictions have established processes such as public hearings or ballot initiatives that carry veto power. While the intent to give the community a voice is noble, the result is often that very little housing gets built.
Cities need to take an inclusive approach to providing housing for people of all incomes, ages, and demographic groups. People who come to a city to work need to be able to find an affordable place to live there. But the voices of existing homeowners who want to preserve the status quo often drown out those of newcomers, young adults, low-income service workers, and renters who need more housing. After a 2009 audit found that neighborhood councils were not representative of the city’s broader population, Seattle replaced these bodies with a central Community Involvement Commission that includes mayoral and council appointees chosen to represent a broader set of stakeholders.
Cities can also mandate a larger role for employers in the community input process. Companies have a very real stake in housing issues, since the availability of housing directly affects their ability to attract talent. Amid the extreme housing crunch throughout Silicon Valley, for example, Facebook has advanced plans for a mixed-use, mixed-income residential and commercial campus in Menlo Park.
While many cities hold public hearings and disclose minutes of meetings, there are ways to make the planning process more dynamic and inclusive. Widely distributed digital surveys and the use of analytics tools (such as City Voices) to track citizen sentiment and real-world use patterns can keep housing decisions more in tune with the actual needs of the community and lessen the influence of smaller entrenched interest groups. Creating an open-source map of all city parcels overlaid with development opportunities can foster debate about priorities. Tools such as Owlized can help residents visualize proposed projects in their neighborhood in 3D.
Speeding upA maze of regulation is typically associated with land acquisition, zoning, and building codes. In many jurisdictions, developers need to go through extensive environmental studies, design approvals, and public hearings. These safeguards are well intended, but they can add inefficiencies. Wrongful manipulation of the approval process can result in multiyear delays and millions of dollars in added development costs. This increases the risk premium associated with building projects, driving up costs for renters and would-be homeowners and preventing some projects from being undertaken at all.
5McKinsey Global Institute Housing affordability: A supply-side tool kit for cities
Cities can streamline their processes to fast-track land use approval and permitting, creating a more predictable and less burdensome process. Establishing “single-window” clearance (that is, consolidating approvals from multiple agencies into one clear interface) and digitizing permit applications and status tracking are clear places to start. Cities around the world, from Singapore to Nairobi, have had success with this approach. Simplifying the required permits can provide significant relief. Australia, for example, was able to cut the number of regulatory procedures and speed up permit approvals by over two months, all while maintaining high construction quality.
Cities could consider establishing “by-right” special development zones in select areas where deviations from city zoning and land use codes are permitted with minimal review. Blanket environmental reviews could clear requirements for future developers in entire zones. Governments could also create appeals boards at the local level for faster resolution of project rejections or mitigation proposals.
Local governments can also bring a new approach to building codes. Today these codes tend to be highly prescriptive about the choice of equipment, materials, and designs that construction companies must use. This can stifle innovation and make it difficult to achieve meaningful improvements in productivity by adopting new practices. Instead, cities could opt for “outcome-based” regulation that requires safe, sound results (such as structural integrity) but give construction firms the flexibility to decide how to achieve them.
Scaling up and creating incentives for efficiency and innovationBuilding projects on a larger scale can dramatically change the productivity and cost of delivering housing, making it possible to employ techniques such as repeatability and offsite fabrication. A number of companies take this approach while trying to incorporate design quality and variability as well as sustainability. Cities can support industry innovation by providing the land and infrastructure that allow for scale, tendering out city-scale developments, and consolidating high-volume demand.
Where cities themselves invest in housing or supporting infrastructure, contracts can be a powerful lever for raising construction productivity. In an MGI global survey, construction executives, suppliers, and project owners pointed to misaligned incentives and contracts as impediments. Projects are often awarded to the lowest bidder with limited regard to quality, change orders, and claims that might arise after the fact. The planning stage may be given short shrift, while overly detailed specifications can limit flexibility when problems arise. Risks are often misallocated, and contracts generally fail to take the inherent uncertainty of projects into account. Furthermore, relationships may be adversarial, creating an environment that lacks trust and genuine collaboration.
Moving to value-based tendering (which places greater emphasis on the quality and past performance of suppliers), adding contractor and owner incentives to traditional contracts, and making provisions to improve transparency and collaboration can deliver tremendous value. An even bolder approach involves contracts with an integrated project delivery (IPD) model. When arrangements with multiple contractors are transactional, they can easily turn hostile. But the IPD model encourages multiple stakeholders to collaborate closely on a project, sharing its profits or losses while maintaining their separate business identities. Tired of missed deadlines and budget overruns on early projects, Sutter Health, a not-for-profit health system with dozens of medical centers, took this approach to tighten up its $7 billion capital improvement project. The company designed an IPD model, assigning contracts to integrated teams of designers, consultants, and builders rather than to individual parties. The new approach has yielded projects that came in on time and under budget.
Finally, by mandating use of efficient technologies and innovations in their procurement contracts, cities can hasten private-sector adoption and investment in cost-saving tools. Requiring contractors to submit models in building information modeling (BIM) software, which has a track record of fewer errors and reduced rework, can solidify better industry standards and practices.
Housing affordability: A supply-side tool kit for cities6 McKinsey Global Institute
3. THE CONSTRUCTION INDUSTRY HAS TO EVOLVEEven when land is available and there is no community opposition, construction itself poses risks. Too many projects come in late, over budget, or fraught with problems. Productivity within the construction sector is consistently poor around the world. Labor productivity growth averaged 1.0 percent a year over the past two decades, compared with 2.8 percent for the total world economy and 3.6 percent for manufacturing. The picture is particularly dismal in advanced economies. In the United States, for instance, labor productivity as measured today is lower than it was half a century ago.
Some of this is due to external factors such as cumbersome building codes and permitting processes as well as cyclical swings in public and private demand. Informality and corruption sometimes distort the market. At the industry level, construction is highly fragmented, contracts have misaligned incentives, and inexperienced owners and buyers find it hard to navigate an opaque marketplace. At the firm level, we often see poor project management, inadequate design processes, and a lack of investment in technology, R&D, and workforce skills.
Pushing forward with best practices to boost productivityWhile cities can create a more efficient environment and incentives for innovation, construction firms also have to up their game. The best-performing firms take a value engineering approach to the design process, pushing for repeatable design elements whenever possible. They also avoid delays by focusing on procurement and supply-chain management for just-in-time delivery.
Several approaches can improve onsite execution, starting with a rigorous planning process and the completion of all prework before starting onsite. To ensure that key activities are achieved on time and on budget, companies should agree on key performance indicators, particularly for subcontractors, and hold regular performance meetings to monitor progress and solve issues. It takes careful planning and coordination of different disciplines onsite along with the application of lean principles to reduce waste and rework.
The construction industry also needs to accelerate digital adoption. This includes the use of BIM tools for design as well as analytics and the Internet of Things for onsite monitoring of materials, labor,
and equipment productivity. Cloud-based control towers can coordinate large-scale, complex projects, assembling data in near real time that is both backward-looking and predictive. They can keep information flowing to owners, contractors, and subcontractors. Techniques and data that are readily available today can produce large improvements in the accuracy of cost and schedule estimates as well as engineering productivity. Advanced automated equipment such as bricklaying and tiling robots can accelerate onsite execution. MGI’s productivity survey indicated that the biggest barriers to innovation by construction companies are underinvestment in technology and a lack of R&D.
Transitioning to a production system approachConstruction is almost always approached as a series of discrete and bespoke projects. But the biggest boost in productivity comes with the concept of a manufacturing-inspired mass-production system. This involves more standardized elements, panels manufactured and assembled offsite, and limited finishing work conducted on site.
Barcelona Housing Systems, for instance, has improved productivity by up to 10-fold by moving away from traditional onsite construction to large-scale industrial delivery and prefabrication. The company aims to develop more than 10,000 housing units per project, helping to amortize the cost of manufacturing facilities. It uses a replicable design of four-story multifamily buildings that mix housing, retail, and service-oriented office space, varying some facade and design elements without changes to the structural design. All necessary housing components are assembled from prefabricated modules built in a factory on-site or nearby, and the components are simple enough to be built by non-skilled workers with minimal training.
The Value & Budget Housing Corporation, a modular housing provider from India, designs prefabricated room components that can easily convert one-bedroom units to two- or three-bedroom units, saving costs by avoiding extra aluminum framework. Such construction techniques can be applied in a variety of different housing contexts, including prefabricated single-family homes as well as detached dwelling units and modules for multifamily infill projects.
7McKinsey Global Institute Housing affordability: A supply-side tool kit for cities
Modular home construction is gaining traction in the United Kingdom as well. A company called Legal & General, for instance, is building one of the largest modular production facilities in the world near Leeds, where it expects to produce up to 4,000 units a year. The £3 billion UK Home Building Fund explicitly calls for and supports the funding of such techniques.
US-based Katerra uses modular construction techniques while delivering construction services to customers in an end-to-end model. The Silicon Valley startup takes sole responsibility for design, sourcing materials from a global supply chain, and assembling final products. The company is focused on using new building materials and finding process improvements by deploying the Internet of Things.
Other technology breakthroughs are being applied as well. Shanghai-based WinSun automates construction through 3D printing. Although relatively new, the technique has already been used in a few cities: Saudi Arabia has signed a contact with Win-Sun to develop 30 million square meters of real estate, on the heels of the company’s development of a 3D-printed office building in Dubai.
•••
Finding an affordable place to call home has become an issue for citizens around the world. Subsidies and financing solutions alone cannot close the gap. Cities urgently need to ramp up home building to improve residents’ quality of life, remain inclusive, and ensure that housing shortages do not become a drag on economic growth. The tools and strategies outlined here can be pursued in parallel—and given the extent of unmet demand today, there is no time to lose.
REFERENCES AND FURTHER READINGMcKinsey Global Institute research is available for download at www.mckinsey.com/mgi. This briefing note draws on the following reports.
Reinventing construction: A route to higher productivity (February 2017)
A tool kit to close California’s housing gap: 3.5 million homes by 2025 (October 2016)
Urban world: Meeting the demographic challenge (October 2016)
A blueprint for addressing the global affordable housing challenge (October 2014)
This briefing note was authored by Jonathan Woetzel, a director of the McKinsey Global Institute (MGI) and a senior partner of McKinsey & Company in Shanghai; Sangeeth Ram, a McKinsey partner in Dubai; Shannon Peloquin, a McKinsey associate partner in San Francisco; Mourad Limam, a McKinsey associate partner in Dubai; and Jan Mischke, an MGI senior fellow in Zurich.

McKinsey Global Institute | Copyright © McKinsey & Company 2017www.mckinsey.com/mgi @McKinsey_MGI McKinseyGlobalInstitute
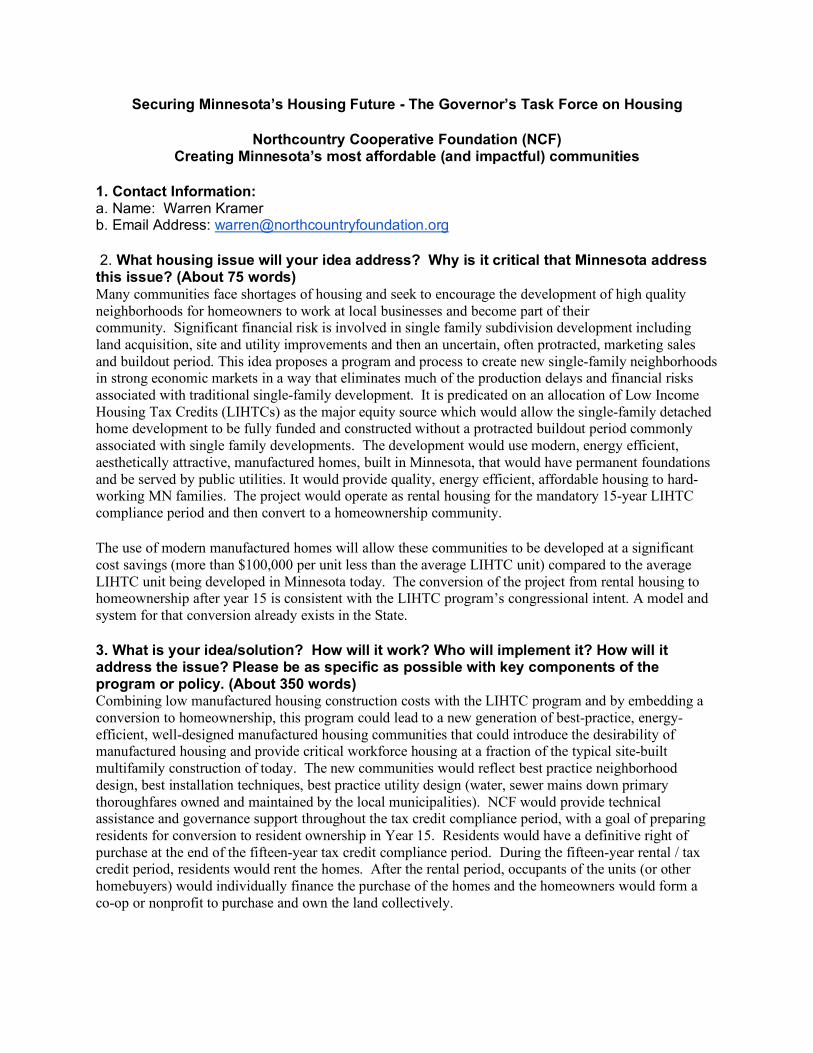
Securing Minnesota’s Housing Future - The Governor’s Task Force on Housing
Northcountry Cooperative Foundation (NCF) Creating Minnesota’s most affordable (and impactful) communities
1. Contact Information: a. Name: Warren Kramer b. Email Address: [email protected] 2. What housing issue will your idea address? Why is it critical that Minnesota address this issue? (About 75 words) Many communities face shortages of housing and seek to encourage the development of high quality neighborhoods for homeowners to work at local businesses and become part of their community. Significant financial risk is involved in single family subdivision development including land acquisition, site and utility improvements and then an uncertain, often protracted, marketing sales and buildout period. This idea proposes a program and process to create new single-family neighborhoods in strong economic markets in a way that eliminates much of the production delays and financial risks associated with traditional single-family development. It is predicated on an allocation of Low Income Housing Tax Credits (LIHTCs) as the major equity source which would allow the single-family detached home development to be fully funded and constructed without a protracted buildout period commonly associated with single family developments. The development would use modern, energy efficient, aesthetically attractive, manufactured homes, built in Minnesota, that would have permanent foundations and be served by public utilities. It would provide quality, energy efficient, affordable housing to hard-working MN families. The project would operate as rental housing for the mandatory 15-year LIHTC compliance period and then convert to a homeownership community. The use of modern manufactured homes will allow these communities to be developed at a significant cost savings (more than $100,000 per unit less than the average LIHTC unit) compared to the average LIHTC unit being developed in Minnesota today. The conversion of the project from rental housing to homeownership after year 15 is consistent with the LIHTC program’s congressional intent. A model and system for that conversion already exists in the State. 3. What is your idea/solution? How will it work? Who will implement it? How will it address the issue? Please be as specific as possible with key components of the program or policy. (About 350 words) Combining low manufactured housing construction costs with the LIHTC program and by embedding a conversion to homeownership, this program could lead to a new generation of best-practice, energy-efficient, well-designed manufactured housing communities that could introduce the desirability of manufactured housing and provide critical workforce housing at a fraction of the typical site-built multifamily construction of today. The new communities would reflect best practice neighborhood design, best installation techniques, best practice utility design (water, sewer mains down primary thoroughfares owned and maintained by the local municipalities). NCF would provide technical assistance and governance support throughout the tax credit compliance period, with a goal of preparing residents for conversion to resident ownership in Year 15. Residents would have a definitive right of purchase at the end of the fifteen-year tax credit compliance period. During the fifteen-year rental / tax credit period, residents would rent the homes. After the rental period, occupants of the units (or other homebuyers) would individually finance the purchase of the homes and the homeowners would form a co-op or nonprofit to purchase and own the land collectively.
Our modeling suggests that these projects could be fully funded with debt financing and equity from an allocation of 9% credits alone and require no soft debt / gap subsidy. Most LIHTC projects require debt, LIHTC equity and a significant level of gap/subsidy. Understanding the competitiveness for 9% credits, 4% credit manufactured housing projects would still demand much less soft money from funders compared to site-built affordable housing projects. We believe that this program could dramatically reduce the cost of the production of affordable housing, deliver a neighborhood that residents and neighboring communities would find aesthetically desirable with very affordable rental housing for fifteen years converting to home ownership in Year 15. At conversion – our modeling suggests that the monthly cost of ownership would be less than the rental costs creating an economic incentive for residents during the rental period to become homeowners. 4. What would be the potential benefits and positive outcomes of the idea/solution? (About 250 words) New neighborhoods could be developed relatively quickly, with little or no subsidy (beyond the LIHTC equity), that would serve markets with housing shortages with a high quality, innovative solution. The new communities would be wonderful additions to the existing municipalities in terms of aesthetics, utilizing state of the art site planning, design and construction. The homes and entire neighborhood would be built and developed after the project’s financing was put in place, eliminating delays of time and financial expense. The homes would provide affordable rental housing for the mandatory rental period (15 years) but after that the project would revert to a home ownership development in which individuals own their own homes and the homeowners’ collectively own the real estate under the homes. This “alternative” homeownership arrangement can be accomplished through a cooperative or nonprofit model. True homeownership would provide an asset building and wealth creation platform for the buyers of these homes. Cities and towns and the employers in them would get the high quality neighborhoods they need and want. Workers in the local market get an affordable, high quality, home - both while the project is a rental development and after, when it reverts to homeownership. Minnesota companies that manufacture the homes benefit from increased productivity. The State gains recognition for finding a way to make productive use of a housing type that’s vastly less expensive than other options and that has been historically underutilized and underappreciated. 5. What would be the potential costs, hurdles, burdens, and negative outcomes of the idea/solution? (About 250 words). Potential hurdles might be to overcome the negative bias associated with and stigma attached to the housing type. Much of the negative reaction to manufactured housing is related to the ownership of the land beneath the homes. Some people think manufactured homes automatically depreciate just because they’re manufactured homes. Studies confirm that depreciation or appreciation is much more associated with the ownership of the land - not the house. There is mounting evidence that manufactured homes appreciate just as much as any other type of home - if the owner of the home also owns the land beneath it. Classification too, affects the value of homes. Site built homes are titled as real property and typically have access to mainstream single family loan products characterized by long terms and low, fixed interest rates. Manufactured and mobile homes in Minnesota are titled as personal property or chattel and receive a title rather than a deed. Personal property or chattel loans typically have much shorter terms and much higher interest rates, making financing less affordable. There is a process by which manufactured homes can be titled as real property in Minnesota and this proposed program would title the homes as such. There were several legal/technical issues related to the tax credit financing too, that represented changes from how previous LIHTC deals get done. We’ve explored these issues with legal counsel and believe they can be overcome. The competitive scoring process of the 9% tax credit allocation would likely need to change in order for these projects to score high enough to effectively compete for allocations under Minnesota’s Qualified Allocation Plan (QAP). In particular, priority and higher points would need to be awarded under the QAP for cost containment and for projects that end up in resident ownership, in order

for this program idea to be effectively implemented. Perhaps an allocation could be awarded as a demonstration to test what we believe to be all the obvious upsides to this proposed model. 6. Has this idea/solution been implemented elsewhere? If yes, where and how well did it work? Please cite the specific community or state where it was implemented, the official program or policy name, and any evaluations or reports documenting the program/policy and outcomes. Feel free to include hyperlinks to polices, statutes, reports, and/or other relevant documents. (About 300 words) To our knowledge this program has not been done in the US. There have been several LIHTC projects that were developed as acquisition of existing scattered sites or newly built single family detached developments that were also planned to ultimately be sold to the residents. We’re not aware of LIHTC developments that used manufactured homes and then were designed to be sold in the way we’re proposing. The hyperlink below describes several projects developed with the similar objective of selling the homes to the residents after the 15 year compliance period, but no projects that we’re aware of are using manufactured housing. https://drive.google.com/file/d/1C2sAQVPoM-ArWzXZAkozCTVXb8rqf-lB/view?usp=sharing https://drive.google.com/file/d/16FGl0FcKg1HuuRhSJCKXVmTygCdJlRI-/view?usp=sharing http://services.housingonline.com/nhra_images/TCA%20Nov%202012%20-%20niche%20development%20including%20veterans.pdf 7. Please provide any additional information that would indicate: (1) the likelihood that your idea/solution would be successful in Minnesota, and (2) the size of the net benefit in Minnesota. (About 250 words) We developed some preliminary architectural drawings to help communicate what these communities would look like. We’ve worked with tax lawyers and accountants and tax credit syndicators to confirm that the project could perform the way we intend it to. We’ve met with several LIHTC developers about this concept / idea, and across the board they are interested in it. We’ve met with numerous HRA directors and community officials who would love to see one of these projects be developed in their region/community. We’ve discussed the concept with affordable housing funders, including MN Housing and have been encouraged to keep pursuing the idea. This Task Force seems to be the perfect place for an innovative idea like this to be explored. If this program delivers what we believe it’s capable of, quality, aesthetically attractive, super energy efficient homes at a fraction of what the typical LIHTC unit costs, and that becomes homeownership at the end of the rental period the way Congress intended, we think that’d be a pretty good outcome and worthy of public investment in.

Securing Minnesota’s Housing Future The Governor’s Task Force on Housing
Call for Ideas -- Submittal
1. Contact Information a. Paul Grahovac b. [email protected] 2. Rental Housing Without adequate work-force housing, workers will go elsewhere, and the State’s economy will suffer. 3. What is your idea/solution? How will it work? Who will implement it? How will it address the issue? By reducing the cost of tenant energy use, tenants have more money to pay higher rents which allows the construction of more housing. Pennsylvania and several other States have added points for high energy efficiency Passive House performance to their Affordable Housing project acceptance criteria for apartment buildings. This reduces the tenant utility allowance which increases rent, increases operating income, improves financing arrangements, increases net fees, and thus makes it possible to build more housing. This is according to a nonprofit developer in the program. Some private-sector, non-subsidized developers are incentivized to build projects, because they can receive more than market-rate rent by building to Passive House performance levels, setting rent at the value of the space plus what the tenant would be paying for energy if they lived in less energy efficient housing, paying tenant utilities, and paying the power company the low cost of energy for a Passive House building. I am emphasizing the need to build more housing. If there is a desire to temper this with a goal of reducing tenant costs, the tenant utility allowance applicable to Affordable Housing projects could be re-adjusted upwards after the developer recovers their investment in energy efficiency.
4. What would be the potential benefits and positive outcomes of the idea/solution? Familiarizing developers, designers, and contractors with Passive House construction in the State’s Affordable Housing program will cause the private apartment building market to adopt such construction which will result in more such housing being built, because developers can achieve higher rents and profits by paying tenant utilities. Some recoil at the idea of tenants financing their own housing. More housing is not going to happen unless there is a financial incentive for developers to build it. Rather than assuming to know tenant needs and preferences, I suggest some focus groups be utilized to assess how tenants and tenant-oriented organizations feel about this. It may be that after they learn the tenants are either going to be paying the same amount of money to the power company (with no additional housing) or to the Passive House developer (with resulting additional housing), they might prefer the money go to the developer, so that more housing can be built – which under the laws of supply and demand will eventually reduce overall housing rents. 5. What would be the potential costs, hurdles, burdens, and negative outcomes of the idea/solution? Developers, designers, and contractors who have business models based on construction of merely-to-code structures that are not energy efficient will lose market share to those who adopt the more modern approach. When Passive House points are added to the acceptance criteria, Pennsylvania found it prudent and successful to invite Passive House speakers to present to developers. 6. Has this idea/solution been implemented elsewhere? If yes, where and how well did it work? Pennsylvania Housing Finance Agency Qualified Allocation Plan: “Passive House – ten (10 points may be awarded to those developments which meet Passive House Requirements (nationally or internationally) for energy efficiency. (See Multifamily Housing Application and Guidelines and www.passivehouse.us or www.passivehouseacademy.com for additional guidance.)” https://www.phfa.org/forms/multifamily_news/news/2017/2017_2018_qap_final.pdf At an environmental conference in Philadelphia (Delaware Valley Green Building Council 2017 New Gravity Housing Conference), a non-profit developer provided Mission First Housing Group slides relating to increased net income and fees on their 49-unit project stating:
• “Passive House Makes us Money!!”

• “Passive House lets you borrow/leverage more money to build more housing”
• “Higher net fees mean we can house more people”
Other States that have reportedly adopted Passive House in their project acceptance criteria: Illinois Delaware Ohio Rhode Island Idaho New York Massachusetts New Jersey 7. Please provide any additional information that would indicate: (1) the likelihood that your idea/solution would be successful in Minnesota, and (2) the size of the net benefit in Minnesota. The Pennsylvania Affordable Housing developer referenced above describes an increase in loan funds from one million dollars to one million three-hundred thousand dollars and an increase of three-hundred thousand dollars in net fees. Our modeling and calculations indicate that, accounting for the additional materials cost of construction, the financial benefits of faster construction using prefabricated wall panels with factory-installed windows, and the increase in revenues due to higher rents, a Minneapolis building owner of the same 49-unit project referenced above but operated in the private market with no tenant utility allowance rather than as Affordable Housing would receive an additional seventy-eight thousand dollars per year with a payback of 3.74 years. This does not account for the $120,000 reduction in building cost resulting from decreased cost of the HVAC system. This would further increase cash flow and further decrease payback time. Attached are charts that show the energy consumption difference between non-Passive House and Passive House construction, and how the energy savings of the tenants is used to finance and incentivize the construction of additional private market housing.

White Paper
Building Philadelphia’s Whitehall in Minneapolis, Minnesota
A Cost, Revenue & Net Cash Flow Comparison of Passive House vs. Code
Construction
Code-compliant building cost: $7,783,196 Passive House building cost: $8,075,493 Cost difference (investment): $292,297 (not adjusted for Passive House savings
addressed below) Percent cost increase: 3.76%
49-unit apartment building: Annual Revenue
Builds
to code
Builds to Passive House & pays tenant HVAC
HVAC electricity use common areas
HVAC electricity use living units
Tenant rent
Tenant total cost
Owner net revenue
Apt. Bldng. Owner A
x 166,513 kWH $19,240
451,247 kWh $51,217
$588,000 $639,217 $568,760
Apt. Bldng. Owner B
x 11,281kWh $1,280
29,817 kWh $3,384
$639,217 $639,217 $634,553
Assumes all-electric Heating, Ventilation, and Air Conditioning (HVAC). kWh cost is Minnesota average $0.1135/kWh. http://www.electricitylocal.com/states/minnesota/ Total conditioned area: 41,259sqft. Common area: 11,325sqft. DOES NOT INCLUDE $120,000 REDUCTION IN BUILDING COST RESULTING FROM DECREASED COST OF THE HVAC SYSTEM. THIS WOULD FURTHER INCREASE CASH FLOW AND FURTHER DECREASE PAYBACK TIME.

49-unit apartment building: Passive House Annual Net Cash Flow Moving from left to right, each case assumes the previous case is adopted. Case Base
case. See previous chart.
Fixed windows1 $34,250
Construction loan interest decrease $42,400
Contractor profit & overhead2
$161,510
Rents start sooner $103,646
20 year window replacement avoided3 $456,500 Present value $208,159
Net annual cash flow attributable to Passive House construction and energy savings
$51,760
$53,404
$55,400
$61,466
$68,170
$78,163
Years to Payback
5.65yrs 5.47yrs 5.27yrs 4.76yrs 4.29yrs 3.74yrs
1 Operable windows in bedrooms retained. Fixed windows lower maintenance costs and reduce falling risks. 2 Owner captures in contract negotiations or bidding process. 3 State affordable housing manuals and most experts maintain windows should be replaced every 20 years. Passive House certified windows are of exceptional quality, have a 20-year warranty, and are expected to last the life of the building.
Securing Minnesota’s Housing Future - The Governor’s Task Force on Housing Right-Size Project reserves
Endorsed by Twin Cities LISC
1. Contact Information a. Name: Jim Steiner, National Equity Fund (NEF)
Name: Chris Wilson, Project for Pride in Living (PPL)
b. Email Address: [email protected] Email Address: [email protected]
Right-size Project Reserves Concept: “Insure” individual affordable housing projects in the same way that Insurance Companies insure individual human beings. Aggregating risk will allow for cost savings without increasing the risk to individual projects. Specifically, in lieu of large project reserves, provide the Limited Partner with a guarantee for some portion of the reserve amount. The guarantee could be provided by Minnesota Housing, an insurance company, a foundation, or an investor. The guarantee would likely need to be a cash equivalent in order to be acceptable to the Limited Partner, so the risk would need to be borne by the guarantor. (Triple A- rated was the phrase used at the Minnesota Affordable Housing Conference.) The guarantor could use a portion of the cost savings to collateralize the guarantee across the entire portfolio. Ideally, anything left over could be taken as a cost savings to the project. Alternatively, the remainder could be invested to yield a more robust return than the basic bank rate with some portion of that increased yield returning to the project. The guaranteed portion of the reserves could be sized in accordance with the calculated risk for a particular project. That risk could be assessed based on project type, size, location and finances, the track record of the developer, the track record of the property management, the risk tolerance of the guarantor, etc. Additionally, reserves that are intended to be spent, such as replacement reserves, would be poor candidates for this approach. Typically, businesses, investors, philanthropic organizations and even individuals manage their assets in a fashion similar to this, through some sort allocation based on risk. In terms of on-going operations, the guarantor would monitor the projects across its portfolio. If the “non-guaranteed” portion of the reserves of a particular project were being significantly eroded, the guarantor could, with the cooperation of the Limited Partner, begin to take appropriate action, but at no time could the Limited Partner’s easy access to the guarantee funds be diminished. That action may be limited to making funds available for projected losses, but it could be more robust depending on the structure of the guarantor’s relationship with the Limited
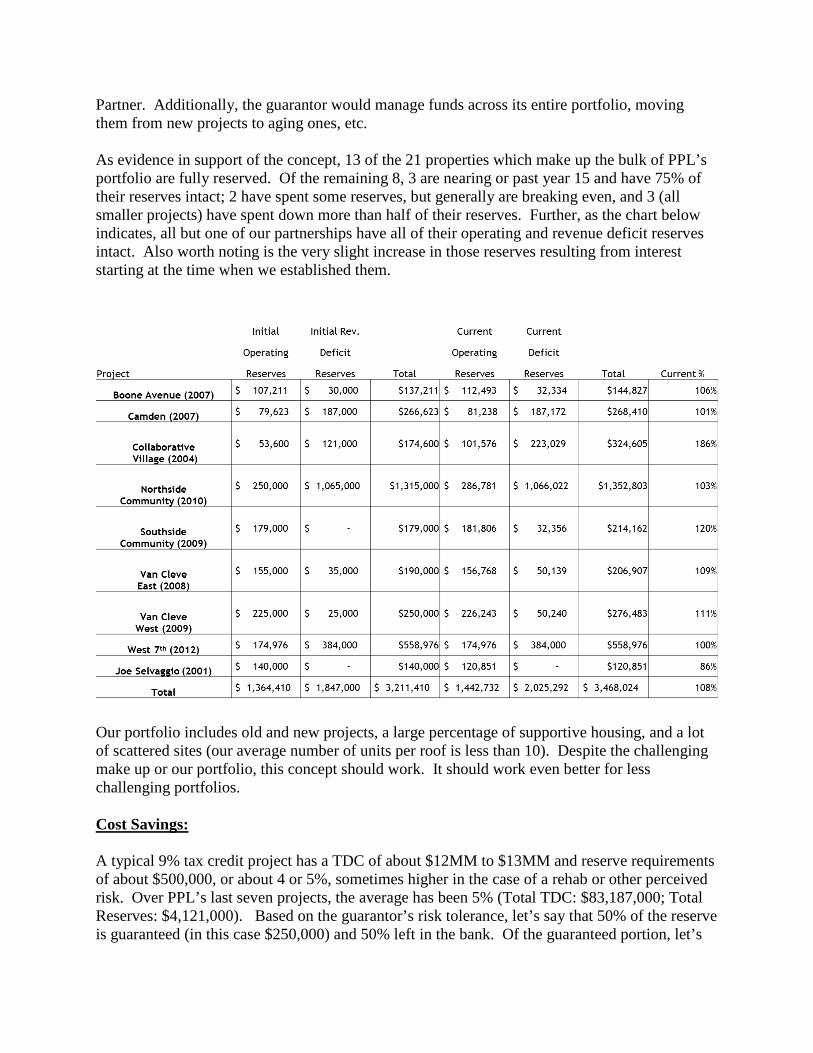
Partner. Additionally, the guarantor would manage funds across its entire portfolio, moving them from new projects to aging ones, etc. As evidence in support of the concept, 13 of the 21 properties which make up the bulk of PPL’s portfolio are fully reserved. Of the remaining 8, 3 are nearing or past year 15 and have 75% of their reserves intact; 2 have spent some reserves, but generally are breaking even, and 3 (all smaller projects) have spent down more than half of their reserves. Further, as the chart below indicates, all but one of our partnerships have all of their operating and revenue deficit reserves intact. Also worth noting is the very slight increase in those reserves resulting from interest starting at the time when we established them.
Our portfolio includes old and new projects, a large percentage of supportive housing, and a lot of scattered sites (our average number of units per roof is less than 10). Despite the challenging make up or our portfolio, this concept should work. It should work even better for less challenging portfolios. Cost Savings: A typical 9% tax credit project has a TDC of about $12MM to $13MM and reserve requirements of about $500,000, or about 4 or 5%, sometimes higher in the case of a rehab or other perceived risk. Over PPL’s last seven projects, the average has been 5% (Total TDC: $83,187,000; Total Reserves: $4,121,000). Based on the guarantor’s risk tolerance, let’s say that 50% of the reserve is guaranteed (in this case $250,000) and 50% left in the bank. Of the guaranteed portion, let’s

keep $75,000 as collateral against problems in the whole portfolio. This potentially leaves $175,000 which can could be used as a project cost reduction or invested at a higher rate of return with the proceeds or some portion of the proceeds being put back into the project. Invested at 4%, it would generate $7,000 a year. As a second example, let’s look at PPL’s partnerships. Per the above chart, our operating and revenue deficit reserves total $3,468,024. In addition, we have $1,996,579 in replacement reserves for a total of $5,464,603. In this example, let’s leave the replacement reserves out of the calculation. Since our track record is pretty good and HUD has been reasonably consistent in renewing Section 8, as a guarantor, one might be comfortable leaving only 30% of our operating and revenue deficit reserves in the bank, though obviously that needs to be negotiated with the Limited Partner/Investor. (That’s $1,040,407 in ready cash for a rainy day.) In addition, you’ll want to cross collateralize the rest of your portfolio against a really bad event that might involve one of the groups you’re guaranteeing. Let’s say that 10% or $346,802. That leaves you as the guarantor with $2,080,814 to invest as you see fit. Most likely, you would invest that in some combination of CD’s, bonds, stocks and other instruments that would supply the yield you are seeking within your risk tolerance. (If you were a public or philanthropic agency, you might want to reinvest it in the production of more affordable housing by loaning it to your fine non-profit partners at a very favorable interest rate.) Of course, these assumptions need to be tested. My point here is that the savings/investment potential could be fairly substantial, depending largely on the risk tolerance of the guarantor. If the guarantor were a public or philanthropic entity, a project savings of 1 to 1-1/2% is not inconceivable. Impact on Housing: As this concept is essentially an exercise in risk shifting, the level of quality, durability, and sustainability of projects should not be affected in any way nor should the resident experience be altered. Further, the current mode of production, including the relationships that have been formed between investors, developers, and the Government, could remain almost completely unaltered. The one circumstance where there would be an impact would be if the entire affordable rental market collapsed and the guarantor were unable to fund the reserves. Reinsuring the guarantor would lessen even this risk. Implementation: In order to implement this strategy, it would first be necessary to examine a larger data set to assess its feasibility and determine what the parameters of the guarantee might be. We have had a close look at PPL’s portfolio and have gotten anecdotal information regarding other providers’ portfolios which would support the concept. However, a more in depth analysis to better assess risk would be warranted. This would be a first step in implementing a final version of the concept. Our initial conversations with syndicators and other investors, particularly at the Minnesota Affordable Housing Conference, have indicated support for this concept. What exactly that means in terms of the rating of the Guarantor, the amount of reserves under consideration, etc. varied somewhat among investors and would require more detailed conversations to define. A

solid understanding of risk as described above would be warranted in order to negotiate these items with confidence. However, more investor conversation could help determine the parameters of that discussion. That conversation would want to occur in parallel with the investigative portion of the implementation. Similarly, the Guarantor must be approached and engaged. The most cost savings could be realized if the Guarantor were a public or philanthropic entity. However, two separate investors at the Conference approached me after the discussion and indicated a willingness to discuss functioning in that role, so there is a private path, should it be needed. Again, much more detail remains to be worked out, so the next step would be to meet with the potential public and philanthropic partners. There is some logic to combining that conversation with the investigative portion of the implementation as these entities have access to considerably more data than we do. Final implementation would include the production of legal documents that would be acceptable to the syndicator/investor and guarantor and working with the financing entities and development community to make this part of the normal financing procedure. Barriers to the implementation would include difficulty accessing sufficient data, institutional inertia and risk aversion, and possibly difficulty in identifying a guarantor. We feel that these obstacles can be overcome and that this concept could be readily implemented. Barring any strident resistance, this approach could reasonably be incorporated into the 2015 funding cycle. Issues: At the Minnesota Affordable Housing Conference, it was noted that if banks or other single investors are participating in several aspects of a deal, the reduction of project reserves might negatively influence the price of the credits or other project debt being provided by the investor or a related entity. Presumably, the surety of the reserve cash and the value to the investor of being able to capture the return on that cash are being reflected in more aggressive equity pricing and/or more favorable loan terms. In other words, the “more robust investment” variation of our concept is already, to some extent, being carried out in these types of deals. If that is in fact the case, then a more inventive use or reduction of the reserves may cause negative ripples in other aspects of the project. That being the case, one would need to examine the entire project to determine which of the inter-related financial pieces is more sensitive to adjustment. The value to the Guarantor of “not providing” the reserve cash quite conceivably could outweigh equity benefit accruing to the project. Additionally, many projects do not have single investors, so this approach doesn’t apply in those cases. Proposal Team: Finance: Jim Steiner, National Equity Fund In 2002 Mr. Steiner started a real estate consulting business specializing in the financing and development of housing supportive housing, and the project management services.

From 1993 through 2002, Mr. Steiner was an underwriter, acquisitions manager, and the Director of Assisted Living for the National Equity Fund. From 1993 through 2013 he has underwritten and closed 90 tax credit projects, investing over $470 million of equity in projects totaling over 4,700 units of housing with a total development cost of $760 million. These projects have included inner city, suburban and rural housing; with focuses ranging from multi-family, to supportive housing with services, assisted living and affordable artist housing. In 1999 Mr. Steiner became NEF’s Director for Assisted Living, and has underwritten 15 assisted living projects for the National Equity Fund. Mr. Steiner has specialized in supportive housing working with a variety of non-profit organizations to finance 50 supportive housing projects serving a the frail elderly, homeless youth, adults and families, chronically mentally ill, persons with HIV/AIDS, chronic inebriates, chemically dependent, and hearing impaired. Developer: Leslie Seaberg, Asset Manager As Asset Manager, Leslie Seaberg protects the owners’ interests in all properties. From maintaining the legal documents, capital needs, to managing reserves, she develops long-term goals and evaluates the performance of each property. Ms. Seaberg is a housing professional with 19 years experience managing affordable housing programs. Her areas of affordable management expertise ranges from the Low Income Housing Tax Credit Program, Project-based Section 8, Shelter Plus Care, HOME, and Rural Housing 515 and various combinations of each. Prior to becoming PPL’s Asset Manager in 2010, Ms. Seaberg served PPL as the Assistant Director of PMD Operations. She spent her first 10 years in the Minneapolis market managing a portfolio of 1500 units for a private investor working out HUD mark-to-market plans, substantial rehabilitation projects, nurturing a substantial tax credit portfolio and generally making a good return on investments. Ms. Seaberg holds several current affordable housing program certifications and has a B.A. in Economics and International Studies from the University of Washington. Chris Wilson – Director of Real Estate Development At PPL, Chris Wilson is responsible for all commercial and housing development activity from project inception through completion. PPL currently has under construction or recently completed projects totaling in excess of 30 million dollars with additional projects totaling about 50 million dollars in the pipeline. Mr. Wilson has been with PPL since 1996, joining the organization in a Construction Management role after previous service overseeing the Summer Youth Program. Mr. Wilson also oversees the Emergency Repair Program, which provides repair services to low income homeowners. Mr. Wilson has more than twenty-five years of project management and architectural experience. He holds an Architecture degree from the University of Minnesota and a B.A. in English from the University of Chicago. In addition to team members, our concept has been reviewed by PPL’s upper management, including Vice Presidents Barbara McCormick, Jack Katzmark, and Julie Brekke. (Our Executive Director, Paul Williams, was not on board at the time.) Additionally, we have talked

to Kent Paulson and Dan Metz from Wells Fargo and Sarah Berke from (at that time) the Housing Partnership Network.