relatedness, diversification and institutions in the … countries specializing in products that are...
TRANSCRIPT
Relatedness, Diversification
and Institutions in the EU-27
Ron Boschma#*, Gianluca Capone* and Riccardo Cappelli*
January 2014
# CIRCLE, Lund University
*URU, Utrecht University
Abstract
In this empirical study, we propose to bridge two separate streams of literature on economic growth,
that is, the literature on industrial diversification and the literature on institutions. Starting from the
assumption of diversification as a path-dependent process driven by product relatedness, we claim
that the constraints of path-dependence are not equally binding for all countries: while some
capabilities are important only for specific products or groups of products, there are also general-
purpose capabilities that are relevant for all products, that are country specific, and that make it
easier to jump for countries to any new product, reducing the importance of product relatedness as
driver of diversification. Institutions may be regarded as important general-purpose capabilities of a
country: they shape and constraint the behavior of individuals at all levels and in all sectors. In our
empirical study on diversification of many countries worldwide, we consider a wide range of
institutions, like economic and political institutions, rules governing the educational system, the
technological environment, and the relations between social and economic actors, and norms and
values. Our preliminary empirical results show that different types of institutions have indeed an
impact on the diversification process. Institutions either reinforce path-dependency, or they provide
countries with more degrees of freedom in their evolution within the product space.
This is a first draft.
Please do not quote or circulate without permission.
Acknowledgments: we acknowledge financial support from the European Union Seventh
Framework Program FP7/2007-2013 for the research project ‘Policy Incentives for the Creation of
Knowledge: Methods and Evidence’ (PICK-ME) under grant agreement no. SSH-CT-2010-266959.

2

3
Introduction
Understanding the nature and causes of economic prosperity and growth has been an important
objective of the modern economic science since its inception (Smith, 1776). Several explanations
have been advanced over time for the existence and persistence of big differences in per-capita
incomes across countries, including the accumulation of physical (Solow, 1956) and human capital
(Lucas, 1988), endogenous technical change (Romer, 1990), openness to international trade
(Frankel and Romer,1999), geography (Diamond, 1997; Sachs, 2001), religion (Weber, 1930) and
social capital (Knack and Keefer, 1997).
Although all these factors might play some role in the process of growth, two different theories
have gained a growing consensus about the deep determinants of sustained economic growth. The
first of these theories claims that institutions, and in particular economic institutions, are the
fundamental cause of long run growth (Acemoglu et al., 2005). Institutions, in this perspective, are
conceived as “rules of the game” that shape and constraint human behavior, by encouraging or
dampening their efforts to work, to invest, and to innovate (North, 1990). The basic argument can
be summarized as follows: economic institutions can be either inclusive or exclusive. Inclusive
institutions, that guarantee property rights, ensure the enforcement of contracts, and sustain the rule
of law, allow people to freely choose their occupation and to efficiently allocate their talents.
Extractive institutions benefit only a restricted set of people that exploit the remaining part of the
population. Economic institutions are determined by the distribution of political power, that is by
political institutions: inclusive political institutions, such as democracy and pluralism, favor the
emergence and persistence of inclusive economic institutions, while extractive economic
institutions are typically the rule under absolutism and dictatorship (Acemoglu and Robinson,
2012).
The second theory, instead, focuses on the productive structure of countries. There is a strong
heterogeneity in what countries produce, and this heterogeneity is relevant because it determines the
potential income that nations may obtain. In fact, the product space has a core-periphery structure:

4
countries specializing in products that are very close to each other and offer important opportunities
for exploiting the advantages of the division of the labor will have better growth opportunities
(Hidalgo et al., 2007). Moving from the periphery to the core of the product space is very difficult:
the evolution of the productive structure of countries exhibits a strong path-dependence, since
products require specific capabilities and these are not easily transferred across countries. If a
country does not have most of the capabilities needed to produce a new good, it can be very
difficult to start producing it (Hidalgo and Hausmann, 2009). Countries that already produce related
products – that is, products that require similar capabilities – will have a clear advantage in the
diversification process (Hausmann and Klinger, 2007).
Both theories provide reasonable explanations for the inequalities in countries income and are
supported by sound empirical analyses; however, they provide no explicit link with each other.
In this working paper, we propose some ideas to bridge these two streams of literature. Our starting
point is the relatedness and diversification literature. Our main claim is that the constraints of path-
dependence are not equally binding for all countries: while some capabilities are important only for
specific products or groups of products (e.g. specific technological knowledge), there are also
general-purpose capabilities that are relevant for all products, and are also country specific.
Countries characterized by stronger general-purpose capabilities could find it easier to jump to any
new product: therefore, the importance of product relatedness would be much lower in this case. On
the contrary, countries characterized by weaker general-purpose capabilities would rely much more
strongly on the links between products in order to jump into new industries. Institutions are the
most evident form of general-purpose capabilities of a country: they shape and constraint the
behavior of individuals at all levels and in all sectors. This role is not limited to economic or
political institutions: the discovery of new products is also affected by the rules governing the
educational system, the technological environment, or the relations between social and economic
actors. Moreover, we also consider elements that are not formally or legally expressed, such as
norms or values, that also differ across nations and are very stable over time.

5
In the next section, we present the basic theoretical framework. Then we specify our hypotheses
about the effects of specific institutions. In the subsequent section, we illustrate the methodology
and the data. In the results section, we first discuss the outcomes of our empirical analysis. We
conclude by discussing the policy and theoretical implications. A simulation model supporting our
theoretical arguments can be found in the appendix.
The structure of the product space, diversification and relatedness
The idea that the product space has a complex structure has important implications for our
understanding of the diversification process that characterizes world countries, since it implies that
the achievement of a comparative advantage in a new product can be subject to many constraints
and limitations (Hausmann and Klinger, 2007). The evolution of the productive structure of a
country is driven by its own history, because countries develop products that are not too far from
what they are currently doing. This argument relies strongly on the concept of capabilities.
Capabilities might refer to different levels of analysis. At the firm level they identify complex
routines or collection of routines that give an organization a set of options for producing specific
outputs (Winter, 2003). They provide firms competitive advantage because they cannot be easily
imitated (Dosi, Nelson and Winter, 2000). At the country level, they refer to specific infrastructure,
skills, knowledge, institutions or norms, and provide advantage for countries because they are not
internationally tradable (Hausmann and Hidalgo, 2010). If a country is specialized in a certain
product, it clearly has the capabilities to produce it, as well as most of the capabilities necessary to
produce similar products. Therefore, countries specialized in products located in the dense part of
the product space will have more opportunities to redeploy their capabilities in new products and
will have higher growth rates. Recent empirical evidence indirectly confirms the role played by
capabilities in the diversification process. Industry case studies show that the most successful firms
in new industries are founded by entrepreneurs with experience in related industries: many carriage-
makers were able to redeploy their experience in complex assembly in the newly born automobile

6
industry (Klepper, 2002), and the dominant firms in the radio industry were also able to dominate
the television receiver industry (Klepper and Simons, 2000). Boschma et al. (2012) show that the
diversification process is much stronger at the regional rather than country level, which is
compatible with the concept of non-tradable and localized capabilities.
As we just mentioned, at the country level capabilities might refer also to institutions or norms.
However, institutions and norms do not necessarily pertain to specific products: they can affect
different groups of products and even all sectors in a country. Therefore, they might be considered
as general-purpose capabilities, that are country specific rather than product specific. The
diversification process in countries with strong general-purpose capabilities will be less affected by
the existence of product specific capabilities. However, in countries with weak general-purpose
capabilities the only way to move to new industries would be to exploit the existing product specific
capabilities. So, the path-dependent process driving the diversification into new industries might
offer different degrees of freedom in different countries. In countries where general purpose
capabilities are stronger, we will observe a weaker role for relatedness between products; in
countries with weaker capabilities we will observe the opposite pattern.
Institutions as general-purpose capabilities
As we mentioned before, institutions might be considered as an example of capabilities at the
country level, since they affect the behavior of individuals and organizations, and cannot be traded
internationally. As the term “institutions” has been used in different contexts, we need to specify
what we have in mind. We follow North (1991) definition of institutions as “the humanly devised
constraints that structure political, economic and social interaction”. They can be either formal or
informal rules, and are distinct from actors that follow them. As our analysis is at the level of the
economic system, we consider organizations as actors rather than institutions, although we are
aware that the internal rules of organizations can also be considered as institutions (Hodgson, 2006).
Actors generally follow the rules of the game for different motives, that can be cognitive, normative
7
or explicitly self-interested, and they can also actively operate to change these rules, although
usually this process is quite slow. As it may be expected, the work in the economic field has
focused mostly on the importance of economic or political institutions for the performance of
economic systems. However, the rules governing other aspects of social life, such as the educational
system or innovation systems, can also have important implications for the diversification process
of a country, and therefore we will consider a broader set of institutions that goes beyond the purely
economic and political realm.
Economic Institutions
Economic institutions refer to the rules that directly affect the economic system. Although this
definition can be very inclusive, the current literature has focused mostly on two variables: property
right institutions, that protect common citizens against expropriation by the government and by
other powerful citizens, and contracting institutions, that allow and favor the enforcement of
contracts (Acemglu and Johnson, 2005). Although generally are considered separately, we can
include within the set of economic institutions also the rules governing international trade, and
determining the degree of trade openness of a country. All these institutions share a strong and
direct impact on the emergence of markets, either domestic or international. There is now a broad
consensus on the role that economic institutions play in the process of economic growth (Acemoglu
et al., 2001), with a specific preeminence of property rights and rule of law over contract rules
(Acemoglu and Johnson, 2005) and trade integration (Rodrik et al., 2004). Moreover, it is also quite
clear to understand that in presence of good economic institutions individuals and organizations
have strong incentives to innovate in order to gain profits from their activities. However, here we
claim that in presence of these institutions the diversification process will be less constrained by the
existing productive structure. There are at least two rationales for this proposition: first, an economy
with good economic institutions favors the entry and the investments by foreign firms that may
possess capabilities that are far from the current set available in a country. Second, the search for
8
new capabilities is costly, and the more so the farther the capabilities are from what is currently
known (Hausmann et al., 2007): good economic institutions provide a strong incentive to incur
these costs, since they also guarantee secure profits in case of success.
Political Institutions
Political institutions are the rules that shape and constraint actors in the political sphere. The most
important element of political institutions is the form of government (democracy versus autocracy),
but there are several important aspects to consider, such as the constraints on the executive action,
the level of corruption, or the presence of general freedoms, such as the freedom of press and
association. There is no conclusive evidence of a link between political institutions and economic
outcomes: democracy could even have a negative direct effect on economic growth (Barro, 1996),
but transition to less democratic form of government can also impact negatively income (Persson
and Tabellini, 2007). There is more consensus on the indirect effects of political institutions via
economic institutions: democratic forms of government and ample freedoms for citizens provide
ample guarantees on the persistence of good economic institutions (Acemoglu and Robinson, 2012).
The link with diversification is also weaker than in the case of economic institutions. However,
there is recent evidence that political rights have a selective positive effect on the growth of sectors
that are close to the technological frontier (Aghion et al., 2007). This effect is due to the lower
barriers to entry associated with democracy because of a weaker protection of vested interests:
therefore, it should also lead to the discovery of new products that are far from the current
productive structure of a country.
Coordination Institutions
If it is true that economic institutions supporting property rights and contract enforcement are
positive for growth, it must also be recognized that these objectives can be pursued through
different institutional arrangements that are equally effective (Rodrik, 2008). The stream of

9
literature that goes under the label of “Varieties of Capitalism” has its focus exactly on the
institutional differences within the group of advanced countries (Hall and Soskice, 2001). The basic
discrimination element is given by the rules governing the firms coordination problems in with their
working force, with the investors, and with the other firms. Although these coordination problems
arise in different realms, the solutions adopted by firms tend to be similar because of institutional
complementarities, and determine two types of political economies: in liberal market economies
(LME) firms coordinate their activities through hierarchies and market arrangements, while in
coordinated market economies (CME) firms rely on non-market relations and strategic interactions.
The main prediction of this theory is that coordinated market economies are better at supporting
incremental innovation: workers are more secure of their job and can reach higher levels of
industry-specific technical skills; the coordinated system of corporate governance reduces the
importance of getting immediate profits from breakthrough innovations to avoid hostile takeovers.
Liberal market economies, however, are better at supporting radical innovations: firms can easily
find on the market both workers (or even companies) with the necessary skills and financial
resources to pursue riskier projects.
Although the distinction between the two groups of countries has been challenged (Geffen and
Kenyon, 2006), also because institutional arrangements underwent major changes in many
developed countries (Schneider and Paunescu, 2012), empirical findings support the idea of
institutional complementarities (Hall and Gingerich, 2009). However, the prediction about the link
between institutions and innovation is strongly debated: some case studies suggest that the
mechanisms advanced by the varieties of capitalism position are actually at work (Hall and Soskice,
2001), but large scale empirical works do not support its claims (Taylor, 2004; Akkermans et al.,
2009).
Our work provides an alternative setting in which the varieties of capitalism hypothesis can be
tested. Rather than drawing a distinction between radical and incremental innovations, we consider
the possibility that CME tend to diversify mostly in related sectors while LME have higher

10
probability to engage and succeed in less related diversification. The mechanisms at work are very
similar to what described by Hall and Soskice (2001). However, CME might also be successful in
radical innovations, if these take place in related sectors: this is very much in line with the evidence
by Akkermans et al. (2009).
Educational Institutions
An institutional domain that can be relevant for the development of new products is the educational
system of a country (Lundvall, 1992): the presence of people with strong skills and advanced
competences (as signaled by the completion of higher education) is important, as well as the
existence of a majority of the population that has at least a basic formal education (Crescenzi and
Rodriguez-Pose, 2011). There is now a quite supportive evidence that the quality of education is
more important for growth than the simple number of years spent at school (Barro, 2013; Hanushek
and Woessmann, 2010); however, even an imperfect measure of education as the level of education
attainment shows important results (Krueger and Lindahl, 2001).
Suggesting an impact of educational variables on the patterns of diversification is not an easy task.
Higher levels of education should have a positive impact on diversification, especially in
knowledge-demanding fields: some form of knowledge is necessary to move towards both related
fields and unrelated fields. However, since secondary education is often concerned with practical
knowledge, it is possible that countries with a relatively high share of secondary education will have
stronger propensity to related diversification, while countries with a higher share of tertiary
education will diversify also in less related products.
Technology and Innovation Institutions
The literature on markets for technologies (Arora et al., 2001) and more generally on markets for
inventions (Conti et al., 2013) has pointed out the importance of allowing the innovation process to
take place also outside the organizational boundary of a firm. In presence of well-developed

11
markets for technologies specialization and division of labor are enhanced, supporting the
diversification process of a country (Arora and Gambardella, 1994). However, the development of
markets for technologies is the outcome of the interaction of formal and informal institutions,
including effective intellectual property rights, appropriate contracts, and social norms.
Countries with well developed markets for technologies should be less constrained in their
diversification process: firms might pursue innovative projects without needing downstream
capabilities for the commercialization. Moreover, the presence of markets for technologies
determines an easier access to knowledge favoring the recombination of existing skills to produce
novelty (Chesbrough, 2003).
Culture
In the economic literature about institutions and growth, culture is typically considered as an
unconvincing explanation for the observed patterns. The culture variable is often operationalized
through very specific variables, such as common language, religion, or juridical system (Acemoglu
et al., 2001). However, if include in the concept of institutions also informal rules and social norms,
then we cannot exclude the idea of culture as “the collective programming of the mind
distinguishing the members of one group or category of people from another” (Hofstede, 1980). The
research stream developed by Geert Hofstede has shown that it is possible to identify cultural traits
at the national level that affect the values and the behavior of the majority of the population. Over
time, Hofstede et al. (2010) identified 6 dimensions of national culture: four of them are certainly
relevant in our context.
First, the Uncertainty Avoidance dimension reflects the preference and the tolerance of a society for
uncertainty and ambiguity. A quite direct link might be suggested: since engaging in the
development of products that are not so related to the current activities is a very uncertain process,
we can expect that countries avoiding uncertainties might be more strongly constrained by the
current productive structure in the process of industrial diversification.

12
Second, the Individualism dimension reflects the expectation of a society that an individual is able
to look after himself and is not strongly integrated in his origin group. Here considerations similar
to what were developed in the case of coordinated and liberal market economies can be applied:
more collectivistic countries should be more constrained in their innovation activities.
There is suggestive evidence that these two dimensions are correlated with more radical and
creative innovations (Acemoglu et al., 2014).
Third, the Masculinity dimension reflects the importance in society played by competition and
assertiveness: people can therefore pursue their projects without caring about consensus and
expecting to be rewarded for their achievements.
Finally, the Long-Term Orientation dimension reflects the propensity of people to save and invest
for the future, and to be persistent in their endeavours, characteristics that can be very important
when trying to develop ideas and products that are not very related with the current activities. On
the contrary, short term oriented cultures have a weaker propensity to abandon traditions and to
open to diversity.
Methodology and Data
In order to represent the product space we follow quite closely the approach outlined by Hidalgo et
al. (2007) and Hidalgo and Hausmann (2009). Our starting point is the concept of revealed
comparative advantage developed by Balassa (1965). A country has a comparative advantage in a
product i when the share of this product in its exports is larger than the share of the product in the
world exports.
The next step is to provide a measure of the proximity between industries. The proximity (ϕ)
between two products (i and j) in a given year t can be formally expressed as:
𝜑𝑖𝑗𝑡 = 𝑚𝑖𝑛{𝑃(𝑥𝑖,𝑡|𝑥𝑗,𝑡), 𝑃(𝑥𝑗,𝑡|𝑥𝑖,𝑡)} (1)
that is, the proximity between product i and j in year t is the minimum between the conditional
probability of having a comparative advantage in product i given a comparative advantage in
13
product j, and the conditional probability of having a comparative advantage in product j given a
comparative advantage in product i. The rationale behind the proximity measure is that if two
products are related because they require similar institutions, infrastructure, productive inputs,
organizational routines and capabilities, and technology, then they will be probably produced
together. Conditional probabilities rather than joint probabilities must be used, so that the measure
is not affected by the relevance of the products in the world trade. The minimum between
conditional probabilities is used in order to ensure a symmetric and conservative measure.
Proximity is a property referring to the link between two products. In order to analyze countries we
need to place them in this space. This can be done by using a density indicator, that measures how
close a product is to the current productive structure of a country or a region. Formally, density can
be expressed as follows:
𝑑𝑖,𝑐,𝑡 =∑ 𝑥𝑘,𝑐,𝑡 ∙ 𝜑𝑖,𝑘,𝑡𝑘
∑ 𝜑𝑖,𝑘,𝑡𝑘 (2)
where ϕ represents proximity (between product i and product k) and x takes the value of 1 if country
c has a comparative advantage in product k at time t, and zero otherwise. So, density around a
product will be high if a country has a comparative advantage in most of the products related to the
focal one; at the very extreme, it will be equal to 1, if a country has a comparative advantage in all
products with a non-zero proximity to the focal product. Conversely, density around a product will
be low (zero) if a country does not have a comparative advantage in most (any) of the products
related to the focal one.
In order to calculate the density indicator, we use country-level world trade data from the BACI
database for the period 1995-2010 (Gaulier and Zignago, 2010). This database is based on the UN
Comtrade data, and is developed using a procedure that reconciles the declarations of the exporter
and the importer, allowing to extend considerably the number of countries with available trade data.
Moreover, data are available at an high level of product disaggregation (6-digit Harmozized
14
System), although for the current analysis we use a 4-digit level, which includes 1241 different
products1.
We estimate the following econometric model:
𝑥𝑖,𝑐,𝑡+5 = 𝛼 + 𝛽𝑥𝑖,𝑐,𝑡 + 𝛽𝑜(𝑥𝑖,𝑐,𝑡) ∙ 𝑑𝑖,𝑐,𝑡 + 𝛽𝑛(1 − 𝑥𝑖,𝑐,𝑡) ∙ 𝑑𝑖,𝑐,𝑡 +
+ 𝛾𝑜(𝑥𝑖,𝑐,𝑡) ∙ 𝑑𝑖,𝑐,𝑡2 + 𝛾𝑛(1 − 𝑥𝑖,𝑐,𝑡) ∙ 𝑑𝑖,𝑐,𝑡
2 +
+ 𝛿𝑜𝐼𝑛𝑠𝑡 ∙ (𝑥𝑖,𝑐,𝑡) ∙ 𝑑𝑖,𝑐,𝑡 + 𝛿𝑛𝐼𝑛𝑠𝑡 ∙ (1 − 𝑥𝑖,𝑐,𝑡) ∙ 𝑑𝑖,𝑐,𝑡 +
+ 𝜋𝑋 + 휀𝑖,𝑐,𝑡 (3)
where the dependent variable takes value 1 if country c has a comparative advantage in product i at
time t + 5 and zero otherwise, 𝑑𝑖,𝑐,𝑡 denotes the density around product i in country c at time t, Inst
is the institutional indicator measured in the specific context, and X is a vector of country-year and
product-year dummy variables, which control for any time-varying country or product
characteristics. The coefficient 𝛿𝑜and 𝛿𝑛capture any eventual difference in the impact of density on
having a comparative advantage in current and new products depending on the level of the
institutional indicator. Density is normalized by subtracting the mean and dividing by the standard
deviation. All results are obtained from OLS estimation with standard errors clustered at the country
level.
Results
In this section we present the results of our analysis. For each group of institutions identified in the
theory section, we will consider different indicators, in order to provide robust results. When
possible, we will use a continuous indicator (Cts), and we will also dichotomize it around the
median (Med) and the third quartile (3Qt) in order to ease the interpretation and to capture possible
non-linear effects.
1 We use 4-digit data rather than 6-digit because the computation of conditional probabilities is highly demanding for
memory. However, even as it is, our analysis is more fine-grained than what can be found in previous studies: Hausmann and Klinger (2007) use a specification with 1006 products, while Boschma et al. (2012) have 775 products.

15
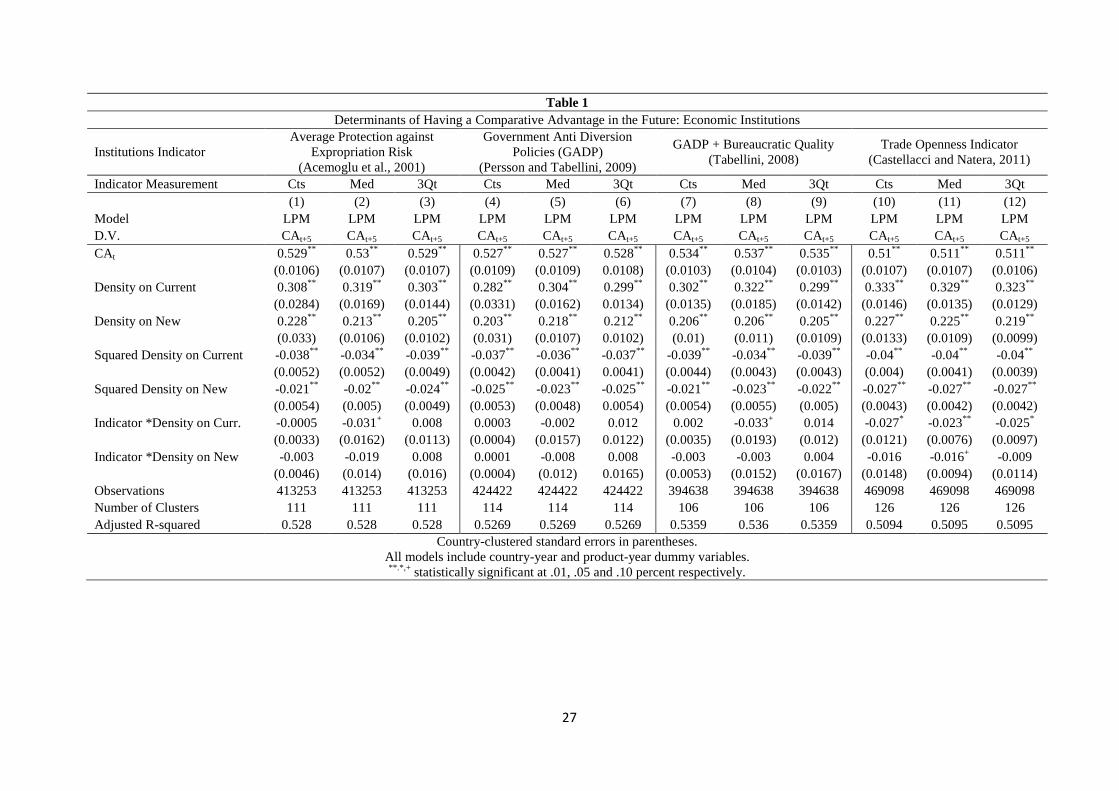
Economic Institutions
We start our analysis from economic institutions. In the first three columns of Table 1 we use the
Average Protection against Expropriation Risk, as a measure of the property rights enforcement in a
country that is taken from Political Risk Services and used by Acemoglu et al. (2001). In columns 4
to 6, we use the index of government’s anti-diversion policies, which is a weighted average of five
indicators (law and order, bureaucratic quality, corruption, risk of expropriation, and government
repudiation of contracts. The measure has been developed by Hall and Jones (1999) and used by
Persson and Tabellini (2009). We use also a different combination of this variable employed by
Tabellini (2008) in columns 7 to 9. In all cases, there is no interaction between our institutional
indicators and density: economic institutions, and especially those related to property rights
enforcement, are not correlated with strength of the path dependence process of industrial
diversification. In the last three columns of Table 1 we consider a different dimension of economic
institutions: trade openness, which is simply the ratio of Imports and Exports over GDP (Castellacci
and Natera, 2011). Countries open to international trade are able to keep producing products even if
these are not perfectly related to their industrial structure, confirming the findings by Boschma and
Capone (2014) about the role of trade partners. However, the impact on the development of new
products is quite limited.
Overall, although economic institutions have a well-known effect on economic growth, they do not
seem to affect the process of industrial diversification of countries.
Political Institutions
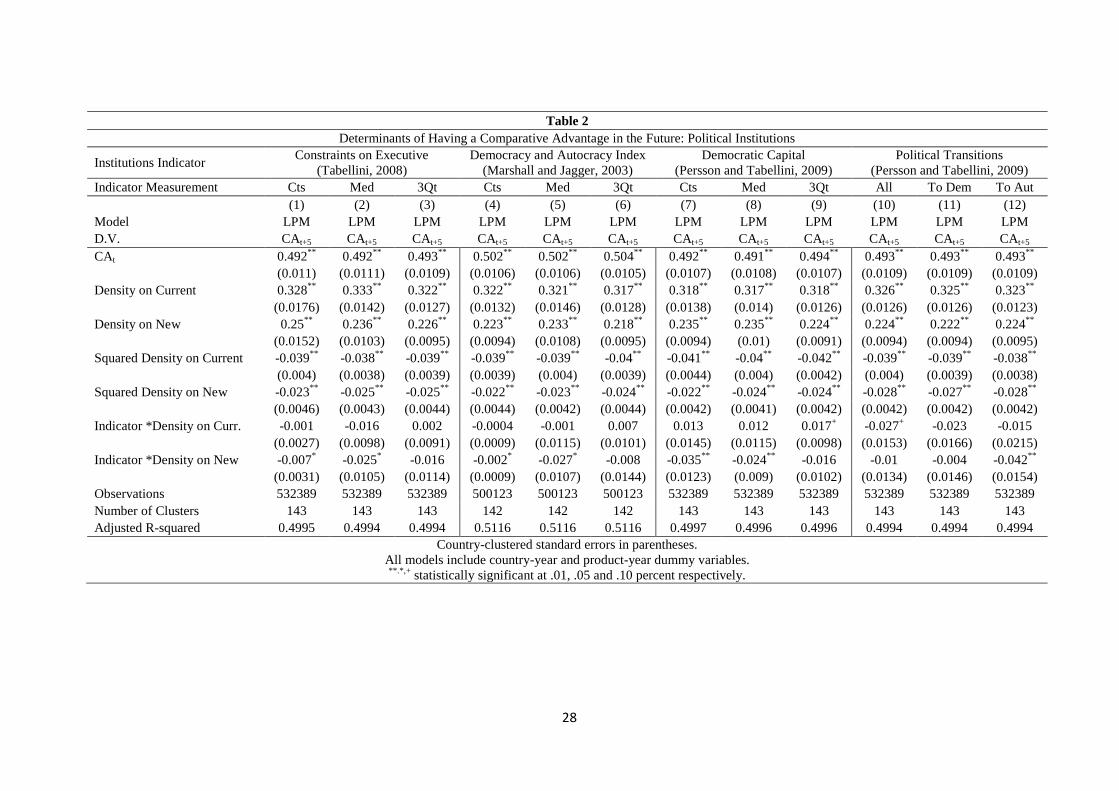
In Table 2 we analyze the effect of political institutions on the process of industrial diversification.
As in the case of economic institutions, we use different measures of political institutions. First, we
employ an average measure of the constraints on the executive: governments with a limited amount
of power do not have many possibilities to expropriate the citizens and therefore might favor

16
diversification in less related areas. Our second measure is the well known Democracy and
Autocracy Index developed within the Polity IV Project: this is a measure of the current political
conditions in a country. To take into account also the political history of countries, and the fact that
there is lower uncertainty when democracy is established since long, we use the concept of
democratic capital developed by Persson and Tabellini (2009): countries will accumulate this
capital when democracy is the rule, and will depreciate it when there is an autocratic government.
Whatever the measure, we find a quite relevant effect: countries with political institutions above the
median tend to be less constrained by their current productive structure when developing new
products.
A more surprising finding emerges from the last three columns (10 to 12). Here we consider the
political transitions (from autocracy to democracy or viceversa) occurring in the previous 5 years,
and we find a very strong effect of moving from democracy to autocracy on the development of
new products in more distant fields, although we would have expected a more positive role of
democracy. This result might be due to the limited number of transitions in our sample, and
therefore further robustness checks are necessary. It is also possible that trade data around period of
transitions might not be perfectly reliable, and therefore sectors that were already present in a
country are considered as new.
Educational Institutions
A third group of institutions we consider refer to the educational system. In the literature about
education and economic growth, there are two different set of variables. Measures of the quantity of
education are easy to obtain and quite reliable, but they do not take into account the differences in
the contents of education. Measures of the quality of education address exactly this issue, but they
are less precise and not easily comparable across countries.
Our measures for quantity (Gross Enrolment Ratio for Primary, Secondary and Tertiary Level, and
Public Expenditure) show only a limited impact on industrial diversification (Table 3). Countries

17
with higher secondary and tertiary education, however, tend to be less constrained by density in
keeping their production in sectors less related to the current productive structure. Our measures of
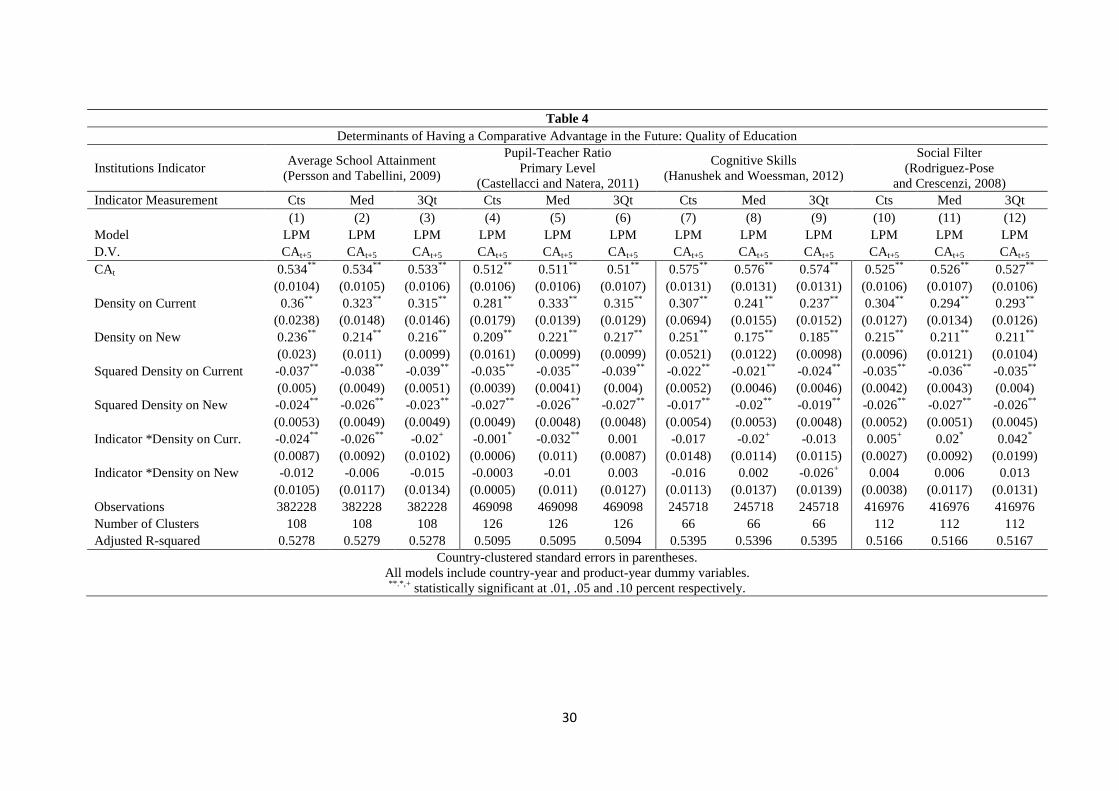
quality of education (Table 4) confirm and reinforce this result: average school attainment is a more
precise measure of the current stock of knowledge available in the country, while the ratio between
pupils and teacher is a general proxy for the quality of the school. They both show significant
effects. The impact of cognitive skills, as measured by international tests, is quite similar, although
statistically less significant. Finally, we also employ the concept of social filter, which refers to the
conditions that favor learning and innovations and includes education achievement, the productive
employment of human capital, and the demographic structure of a region or a country (Rodriguez-
Pose and Crescenzi, 2008). The three dimensions are merged in a single indicator by employing
principal component analysis. As can be seen in columns 10 to 12 of Table 4, the social filter2 has a
stronger effect in the third quartile column: countries with very low educational levels and a bad
allocation of human capital tend to lock into products that are already strongly related to what they
produce.
Coordination Institutions
In Table 5 we analyze the role of coordination institutions. The generic distinction between liberal
market economies , coordinated market economies and mixed market economies does not produce
any significant interaction with the effect of density (column 1 to 3). However, if we use measures
of the specific dimensions of coordination, such as labor relations and corporate governance, we
find results in the direction we would have expected. It is particularly relevant the role of labor
markets: since in coordinated economies they are less fluid, firms have higher costs in jumping into
new products, and therefore will tend to diversify into more related fields. The effect is weaker in
the case of corporate governance, and also when considering both indicators together, although the
2 The principal component indicator takes higher values for worse educational performance and allocation of human
capital.
18
last case is probably due to a problem of collinearity given the very high correlation between the
two indicators.
Finally, it is import to remark that this analysis is heavily limited by data availability, since the
information about labor relations and corporate governance coordination are available only for 20
countries.
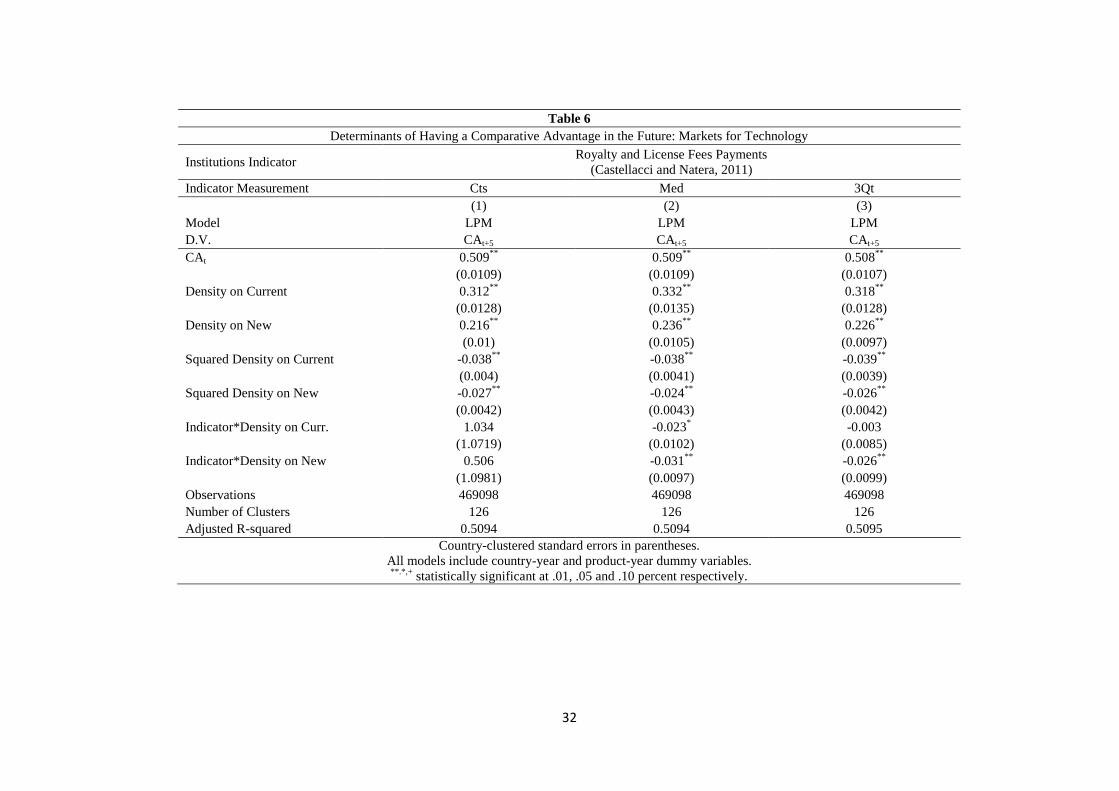
Technological Institutions
In Table 6 we analyze the role that markets for technology play in the diversification process. As a
proxy for the development of markets for technology, we employ the amount of royalty and license
fees payments, although this measure does not consider other channels through which technology
might be traded. Our results are quite in line with our expectations: markets for technology matter
mostly for the development of new products, and this is particularly relevant in the case of
countries with highly developed markets (column 3 of Table 6).
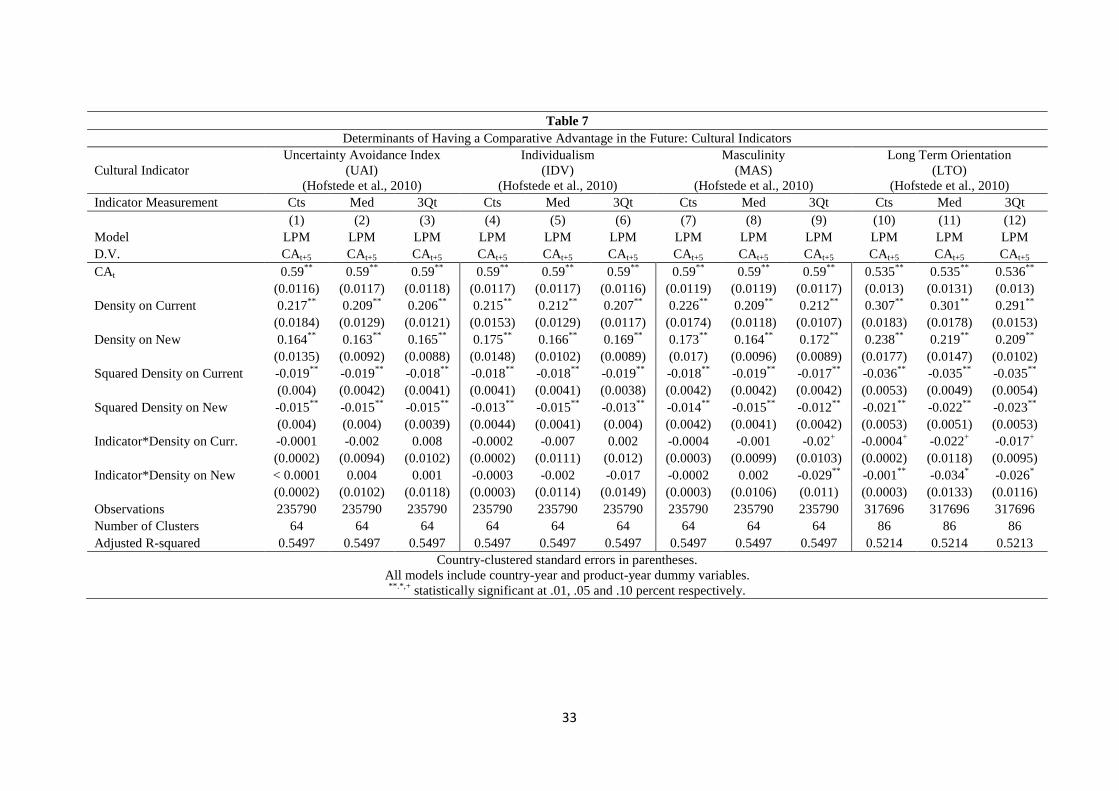
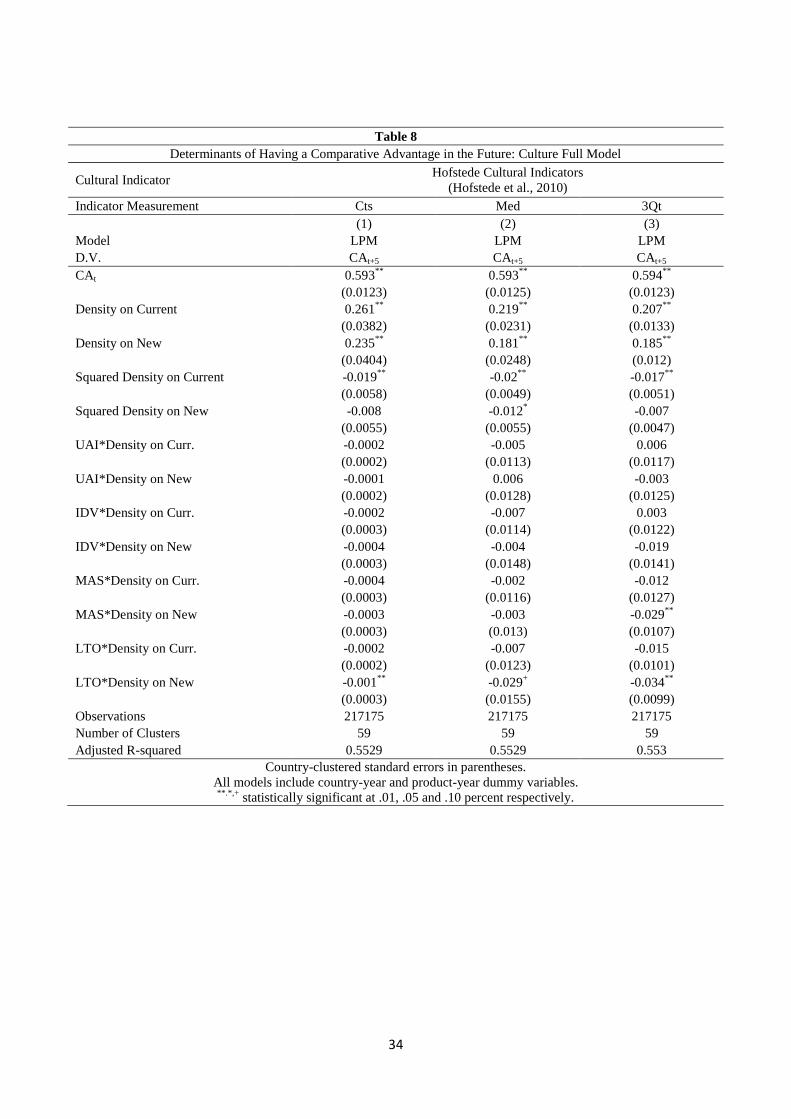
Culture
In Table 7 we consider four different dimensions of culture identified by Hofstede et al. (2010):
uncertainty avoidance, individualism, masculinity and long-term orientation. Quite surprisingly,
uncertainty avoidance and individualism do not show any interaction with density. The impact of
masculinity is limited to countries with very high values (column 9 of Table 7). However, long term
orientation is associated to a lower impact of density for both the development of new products and
the retention of current products. These results are confirmed also in a model that consider all
cultural dimensions together (Table 8).
Conclusions
In this paper we investigated the role of institutions in the process of industrial diversification. In
the theoretical section, we proposed to consider institutions as general-purpose capabilities that are
19
relevant not for specific sectors, but for whole regions and countries. We then identified the
potential effect of different sets of institutions pertaining to different dimensions (economic,
political, coordination, educational, technological, cultural). With notable exceptions for economic
institutions and some cultural traits, our empirical results confirm the theoretical expectations:
they show that different institutions pertaining to different domains may have an impact on the
diversification process, and can either reinforce the path-dependency or provide the countries with
more degrees of freedom in their evolution within the product space.
Quite surprisingly, economic institutions, that are recognized as fundamental elements to start and
foster the growth process (Acemoglu et al., 2005), are the less relevant dimension for the
diversification process. Trade openness is the only element that plays a role, and it confirms that the
entry in new areas of the product space that are far from the current productive structure of a
country may be easier if the country is well embedded in the network of international trade
(Boschma and Capone, 2014).
Political institutions, instead, play a very important role: democracy, especially if established since
long, favors the diversification in distant products. Within the restricted set of developed countries,
coordination in labor relations strengthen the path-dependence, while coordination in the corporate
governance domain is less important.
Educational institutions reduce the importance of the current productive structure only for products
that have been already established in the past: they reflect the education of the majority of the
population rather than the frontier of the knowledge. Markets for technology work in the expected
direction, since they favor the diversification into less related products. Finally, among the cultural
dimensions we consider, only long term orientation affects in a relevant and consistent way the
process of diversification.
Our work contributes to the studies about the determinants of economic growth by providing a
bridge between two different streams of literature that have emerged in this field, that focus on
institutions (Acemoglu et al., 2005) and industrial diversification (Hidalgo et al., 2007). Institutions
20
have an important impact on the diversification process, but a major role is played by political,
educational, and technological dimensions, and not by the immediate characteristics of the
economic environment. This result is consistent with the idea that institutions less directly related to
the economic system can have an important indirect effect on the economic performance of
countries: the speed and the direction of industrial diversification would represent an important
mechanism through which their action takes actually place.
Our results on the institutions governing the coordination problems of the firms provide an
interesting contribution to the literature about the Varieties of Capitalism (Hall and Soskice, 2001).
Rather than focusing on the characteristics of the innovation output (radical versus incremental), we
show that more coordinated economies, especially in the labor relations, tend to be more
constrained in the diversification process jumping to more related sectors. Although we did not
investigate this aspect, our result is agnostic about the type of innovation that could emerge within
these sectors.
Third, we also contribute to the evolutionary economic geography research program by explicitly
introducing institutional differences in the evolutionary process through which countries develop
new products and industries. The role of institutions within evolutionary economic geography has
been at the center of the recent debate (Frenken and Boschma, 2009; MacKinnon et al., 2009). Our
work support the idea that at the regional and national level institutions can play an important role
to generate, reinforce and select the path-dependent routines behind the behavior of firms
(Essletzbichler and Rigby, 2007) and provides an example of how institutions can be included in an
evolutionary framework, alongside the attention to institutional proximity as a driver of evolution
(Balland et al., 2014).
Drawing policy implications is a very delicate exercise with respect to the analysis conducted so far.
Our study, in fact, confirms the strong path-dependence in the diversification process of countries
emerging from previous work (Hausmann and Klinger, 2007; Boschma et al., 2013): the productive
structure of the past keeps exerting its influence many years later, and the position of countries in

21
the product space is very stable over the whole period under analysis. Therefore, policy
interventions should take into account that effects might display only over a long time period.
Policy aimed at improving and speeding up the diversification process should consider that in
countries with low institutional quality, this could be obtained mostly by favoring the development
of nearby sectors. Directly favoring the creation of very distant industries might result in severe
failures, since the lack of necessary supporting infrastructure and institutions may doom these
initiatives before positive diffusion effects may occur. Such policies might actually have a positive
effect only in presence of a good education system, that enables countries to keep producing also in
sectors less related to its current productive structure.
Together with these interventions focused on nearby industries, policy makers might also consider
actions aimed at improving the quality of the supporting institutions. Creating an environment
where firms can emerge and grow more easily or returns from innovation can be better
appropriated, might provide stronger incentives and opportunities for diversification even in very
far products and therefore boost the future growth of countries. A particular relevance must be
placed on the role of political institutions: reforms of the political system aimed at increasing the
degree of democracy could have a very important impact on the development of new products.
There are obviously some aspects that we did not consider in this work and ore open to further
research. First, it would be important to study the extent to which some institutions might be
relevant only for some specific sectors, distinguishing high-tech from low-tech, as suggested by the
literature on sectoral systems of innovation (Malerba, 2004). The presence of sectoral institutions
could actually be a fundamental driver for the emergence and success of some sectors, because of
their institutional proximity (Balland et al., 2014).
Another interesting aspect to investigate is the existence of institutional complementarities, with
some sets of institutions that become relevant only when also other elements are present (Lipsey,
2009). A first step in this direction was our analysis of coordination mechanisms. Finally, an
important issue to consider is institutional change: although institutions change slowly, there are

22
also historical cases of abrupt change that can have long-lasting consequences on the process of
industrial diversification and on the economic performance of countries.

23
References
Acemoglu, D., Akcigit, A., and Celik, M.A., 2014. Young, Restless and Creative: Openness to
Disruption and Creative Innovations. PIER Working Paper, 14-004.
Acemoglu, D., Johnson, S., and Robinson, J.A., 2001. The Colonial Origins of Comparative
Development: An Empirical Investigation. American Economic Review, 91: 1369-1401.
Acemoglu, D., Johnson, S., and Robinson, J.A., 2005. Institutions as a Fundamental Cause of Long-
Run Growth. In Aghion, P. and Durlauf, S.N., Handbook of Economic Growth, Volume 1A, 385-
472. Amsterdam: Elsevier.
Acemoglu, D., and Johnson, S., 2005. Unbundling Institutions. Journal of Political Economy, 113:
949-995.
Acemoglu, D., and Robinson, J.A., 2012. Why Nations Fail: The Origins of Power, Prosperity and
Poverty. New York: Random House.
Aghion, P., Alesina, A., and Trebbi, F., 2007. Democracy, Technology, and Growth. NBER
Working Papers, 13180.
Akkermans, D., Castaldi, C., and Los, B., 2009. Do “Liberal Market Economies” Really Innovate
More Radically Than “Coordinated Market Economies”? Hall and Soskice Reconsidered. Research
Policy, 38: 181-191.
Arora, A., Fosfuri, A., and Gambardella, A., 2001. Markets for Technology and their Implications
for Corporate Strategy. Industrial and Corporate Change, 10: 417-449.
Arora, A., and Gambardella, A., 1994. The Changing Technology of Technical Change: General
and Abstract Knowledge and the Division of Innovative Labour. Research Policy, 23: 523-532.
Bahar, D., Hausmann, R., and Hidalgo, C.A., 2012. International knowledge diffusion and the
comparative advantage of nations. CID Working Paper, No. 235. Cambridge, MA: Center for
International Development, Harvard University.
Balassa, B., 1965. Trade liberalization and revealed comparative advantage. Manchester School of
Economics and Social Studies, 33: 99-123.
Balland, P.A., Boschma, R., and Frenken, K., 2014. Proximity and Innovation: From Statics to
Dynamics. Regional Studies, forthcoming.
Barro, R.J., 1996. Democracy and Growth. Journal of Economic Growth, 1: 1-25.
Barro, R.J., 2013. Education and Economic Growth. Annals of Economics and Finance, 14: 329-
366.
Boschma, R., and Capone, G., 2014. Relatedness and Diversification in the EU-27 and ENP
Countries. Papers in Evolutionary Economic Geography, 14.07.
Boschma, R., and Iammarino, S., 2009. Related variety, trade linkages and regional growth.
Economic Geography, 85: 289-311.
24
Boschma, R., Minondo, A., and Navarro, M., 2013. The emergence of new industries at the regional
level in Spain: A proximity approach based on product relatedness. Economic Geography, 89: 29-
51.
Castellacci, F., and Natera, J.M., 2011. A New Panel Dataset for Cross-Country Analyses of
National Systems, Growth and Development (CANA). Innovation and Development, 1:
Chesbrough, H., 2003. Open Innovation: The New Imperative for Creating and Profiting from
Technology. Boston, MA: Harvard Business School Press.
Conti, R., Gambardella, A., and Novelli, E., 2013. Research on Markets for Inventions and
Implications for R&D Allocation Strategies. The Academy of Management Annals, 7: 717-774.
Crescenzi, R. and Rodríguez-Pose, A. (2011) Innovation and regional growth in the European
Union, Berlin: Springer.
Diamond, J.M., 1997. Guns, Gems and Steel: The Fate of Human Societies. New York: Norton.
Dosi, G., Nelson, R.R., and Winter, S.G. (Eds), 2000. The Nature and Dynamics of Organizational
Capabilities. Oxford: Oxford University Press.
Essleztbichler, J., and Rigby, D., 2007. Exploring Evolutionary Economic Geographies, Journal of
Economic Geography, 7: 549-571.
Frankel, J.A., and Romer, D.H., 1999. Does Trade Cause Growth? American Economic Review, 89:
379-399.
Gaulier, G., and Zignago, S., 2010. BACI: International trade database at the product level. The
1994-2007 version. CEPII Working Paper, No. 2010-23. Paris: Centre d'Etudes Prospectives et
d'Informations Internationales.
Geffen, D.A., and Kenyon, T., 2006. Heinz Capitalism: How Many Varieties Are There? An
Empirical Reexamination of Coordination Mechanisms in Advanced Market Economies. Available
at SSRN: http://ssrn.com/abstract=1005407.
Hall, P.A., and Gingerich, D.W., 2009. Varieties of Capitalism and Institutional Complementarities
in the Political Economy: An Empirical Analysis. British Journal of Political Science, 39:449-482.
Hall, P.A., and Soskice, D., 2001. Varieties of Capitalism: The Institutional Foundations of
Comparative Advantage. Oxford: Oxford University Press.
Hanushek, E.A., and Woessman, L., 2010. Education and Economic Growth. In: Peterson, P.,
Baker, E., and McGaw, B. (Eds), International Encyclopedia of Education, Volume 2, 245-252.
Oxford: Elsevier.
Hanushek, R., and Woessmann, L., 2012. Do better schools lead to more growth? Cognitive skills,
economic outcomes, and causation. Journal of Economic Growth, 17: 267-321.
Hausmann, R., and Hidalgo, C.A., 2010. Country diversification, product ubiquity, and economic
divergence. CID Working Paper, No. 201. Cambridge, MA: Center for International Development,
Harvard University.
25
Hausmann, R., and Hidalgo, C.A., 2011. The Network Structure of Economic Output. Journal of
Economic Growth, 16: 309-342.
Hausmann, R., Hwang, J., and Rodrik, D., 2007. What You Export Matters. Journal of Economic
Growth, 12: 1-25.
Hausmann, R., and Klinger, B., 2007. The structure of the product space and the evolution of
comparative advantage. CID Working Paper, No. 146. Cambridge, MA: Center for International
Development, Harvard University.
Hidalgo, C.A., and Hausmann, R., 2009. The building blocks of economic complexity. Proceedings
of the National Academy of Sciences, 106: 10570-10575.
Hidalgo, C.A., Klinger, B., Barabàsi, A.L., and Hausmann, R., 2007. The product space conditions
the development of nations. Science, 317: 482-487.
Hodgson, G.M., 2006. What Are Institutions? Journal of Economic Issues, 40: 1-25.
Hofstede, G., 1980. Culture's Consequences: International Differences in Work-Related Values.
Beverly Hills, CA: Sage Publications.
Hofstede, G., Hofstede, G.J., and Minkov, M., 2010. Cultures and Organizations: Software of the
Mind. 3rd Edition. McGraw-Hill USA.
Klepper, S., 2002. The capabilities of new firms and the evolution of the US automobile industry.
Industrial and Corporate Change, 11: 645-666.
Klepper, S., and Simons, K.L., 2000. Dominance by birthright: Entry of prior radio producers and
competitive ramifications in the U.S. television receiver industry. Strategic Management Journal,
21: 997-1016.
Klimek, P., Hausmann, R., and Thurner, S., 2012. Empirical Confirmation of Creative Destruction
from World Trade Data. PLoS ONE, 7: e38924.
Knack, S., and Keefer, P., 1997. Does social capital have an economic impact? A cross-country
investigation. Quarterly Journal of Economics, 112: 1252-1288.
Krueger, A.B., and Lindahl, M., 2001. Education for growth: Why and for whom? Journal of
Economic Literature, 39: 1101-1136.
Lipsey, R.G., 2009. Economic growth related to mutually interdependent institutions and
technology. Journal of Institutional Economics, 5: 259-288.
Lucas, R.E., 1988. On the mechanics of economic development. Journal of Monetary Economics,
22:342.
Lundvall, B.A., 1992. National Systems of Innovation: Towards a theory of Innovation and
Interactive Learning. London: Pinter.
Malerba, F. (Ed), 2004. Sectoral Systems of Innovation: Concepts, Issues and Analyses of Six Major
Sectors in Europe. Cambridge, UK: Cambridge University Press.
26
North, D.C., 1990. Institutions, Institutional Change, and Economic Performance. New York:
Cambridge University Press.
North, D.C., 1991. Institutions. The Journal of Economic Perspectives, 5: 97-112.
Persson, T., and Tabellini, G., 2007. The Growth Effect of Democracy: Is It Heterogeneous and
How Can It Be Estimated? NBER Working Papers, 13150.
Persson, T., and Tabellini, G., 2009. Democratic Capital: The Nexus of Political and Economic
Change. American Economic Journal: Macroeconomics, 1: 88-126.
Rodrigueza-Pose, A., and Crescenzi, R., 2008. R&D, Spillovers, Innovation Systems, and the
Genesis of Regional Growth in Europe. Regional Studies, 42: 51-67.
Rodrik, D., Subramanian, A., and Trebbi, F., 2004. Institutions Rule: The Primacy of Institutions
over Geography and Integration in Economic Development. Journal of Economic Growth, 9: 131-
165.
Rodrik, D., 2008. Second-best Institutions. American Economic Review: Papers & Proceedings, 98:
100-104.
Romer, P.M., 1990. Endogenous technical change". Journal of Political Economy, 98: 71-102.
Sachs, J.D., 2001. Tropical underdevelopment. NBER Working Papers, 8119.
Schneider, M.R., and Paunescu, M., 2012. Changing Varieties of Capitalism and Revealed
Comparative Advantages from 1990 to 2005: A Test of the Hall and Soskice Claims. Socio-
Economic Review, 10: 731-753.
Smith, A., 1776. An Inquiry into the Nature and Causes of the Wealth of Nations. London: Strahan
and Cadell.
Solow, R.M., 1956. A Contribution to the Theory of Economic Growth. Quarterly Journal of
Economics, 70: 65-94.
Storper M. 1995. The resurgence of regional economies, ten years later: The region as a nexus of
untraded interdependencies, European Urban and Regional Studies 2: 191-221.
Tabellini, G., 2008. Institutions and Culture. Journal of the European Economic Association, 6:
255-294.
Taylor, M.Z., 2004. Empirical evidence against varieties of capitalism’s theory of technological
innovation. International Organization, 58: 601-631.
Weber, M., 1930 [1905]. The Protestant Ethic and the Spirit of Capitalism. London: Allen and
Unwin.
Winter, S.G., 2003. Understanding dynamic capabilities. Strategic Management Journal, 24: 991-
995.
27
Table 1
Determinants of Having a Comparative Advantage in the Future: Economic Institutions
Institutions Indicator
Average Protection against
Expropriation Risk
(Acemoglu et al., 2001)
Government Anti Diversion
Policies (GADP)
(Persson and Tabellini, 2009)
GADP + Bureaucratic Quality
(Tabellini, 2008)
Trade Openness Indicator
(Castellacci and Natera, 2011)
Indicator Measurement Cts Med 3Qt Cts Med 3Qt Cts Med 3Qt Cts Med 3Qt
(1) (2) (3) (4) (5) (6) (7) (8) (9) (10) (11) (12)
Model LPM LPM LPM LPM LPM LPM LPM LPM LPM LPM LPM LPM
D.V. CAt+5 CAt+5 CAt+5 CAt+5 CAt+5 CAt+5 CAt+5 CAt+5 CAt+5 CAt+5 CAt+5 CAt+5
CAt 0.529**
0.53**
0.529**
0.527**
0.527**
0.528**
0.534**
0.537**
0.535**
0.51**
0.511**
0.511**
(0.0106) (0.0107) (0.0107) (0.0109) (0.0109) 0.0108) (0.0103) (0.0104) (0.0103) (0.0107) (0.0107) (0.0106)
Density on Current 0.308**
0.319**
0.303**
0.282**
0.304**
0.299**
0.302**
0.322**
0.299**
0.333**
0.329**
0.323**
(0.0284) (0.0169) (0.0144) (0.0331) (0.0162) 0.0134) (0.0135) (0.0185) (0.0142) (0.0146) (0.0135) (0.0129)
Density on New 0.228**
0.213**
0.205**
0.203**
0.218**
0.212**
0.206**
0.206**
0.205**
0.227**
0.225**
0.219**
(0.033) (0.0106) (0.0102) (0.031) (0.0107) 0.0102) (0.01) (0.011) (0.0109) (0.0133) (0.0109) (0.0099)
Squared Density on Current -0.038**
-0.034**
-0.039**
-0.037**
-0.036**
-0.037**
-0.039**
-0.034**
-0.039**
-0.04**
-0.04**
-0.04**
(0.0052) (0.0052) (0.0049) (0.0042) (0.0041) 0.0041) (0.0044) (0.0043) (0.0043) (0.004) (0.0041) (0.0039)
Squared Density on New -0.021**
-0.02**
-0.024**
-0.025**
-0.023**
-0.025**
-0.021**
-0.023**
-0.022**
-0.027**
-0.027**
-0.027**
(0.0054) (0.005) (0.0049) (0.0053) (0.0048) 0.0054) (0.0054) (0.0055) (0.005) (0.0043) (0.0042) (0.0042)
Indicator *Density on Curr. -0.0005 -0.031+ 0.008 0.0003 -0.002 0.012 0.002 -0.033
+ 0.014 -0.027
* -0.023
** -0.025
*
(0.0033) (0.0162) (0.0113) (0.0004) (0.0157) 0.0122) (0.0035) (0.0193) (0.012) (0.0121) (0.0076) (0.0097)
Indicator *Density on New -0.003 -0.019 0.008 0.0001 -0.008 0.008 -0.003 -0.003 0.004 -0.016 -0.016+ -0.009
(0.0046) (0.014) (0.016) (0.0004) (0.012) 0.0165) (0.0053) (0.0152) (0.0167) (0.0148) (0.0094) (0.0114)
Observations 413253 413253 413253 424422 424422 424422 394638 394638 394638 469098 469098 469098
Number of Clusters 111 111 111 114 114 114 106 106 106 126 126 126
Adjusted R-squared 0.528 0.528 0.528 0.5269 0.5269 0.5269 0.5359 0.536 0.5359 0.5094 0.5095 0.5095
Country-clustered standard errors in parentheses.
All models include country-year and product-year dummy variables. **.*,+
statistically significant at .01, .05 and .10 percent respectively.
28
Table 2
Determinants of Having a Comparative Advantage in the Future: Political Institutions
Institutions Indicator Constraints on Executive
(Tabellini, 2008)
Democracy and Autocracy Index
(Marshall and Jagger, 2003)
Democratic Capital
(Persson and Tabellini, 2009)
Political Transitions
(Persson and Tabellini, 2009)
Indicator Measurement Cts Med 3Qt Cts Med 3Qt Cts Med 3Qt All To Dem To Aut
(1) (2) (3) (4) (5) (6) (7) (8) (9) (10) (11) (12)
Model LPM LPM LPM LPM LPM LPM LPM LPM LPM LPM LPM LPM
D.V. CAt+5 CAt+5 CAt+5 CAt+5 CAt+5 CAt+5 CAt+5 CAt+5 CAt+5 CAt+5 CAt+5 CAt+5
CAt 0.492**
0.492**
0.493**
0.502**
0.502**
0.504**
0.492**
0.491**
0.494**
0.493**
0.493**
0.493**
(0.011) (0.0111) (0.0109) (0.0106) (0.0106) (0.0105) (0.0107) (0.0108) (0.0107) (0.0109) (0.0109) (0.0109)
Density on Current 0.328**
0.333**
0.322**
0.322**
0.321**
0.317**
0.318**
0.317**
0.318**
0.326**
0.325**
0.323**
(0.0176) (0.0142) (0.0127) (0.0132) (0.0146) (0.0128) (0.0138) (0.014) (0.0126) (0.0126) (0.0126) (0.0123)
Density on New 0.25**
0.236**
0.226**
0.223**
0.233**
0.218**
0.235**
0.235**
0.224**
0.224**
0.222**
0.224**
(0.0152) (0.0103) (0.0095) (0.0094) (0.0108) (0.0095) (0.0094) (0.01) (0.0091) (0.0094) (0.0094) (0.0095)
Squared Density on Current -0.039**
-0.038**
-0.039**
-0.039**
-0.039**
-0.04**
-0.041**
-0.04**
-0.042**
-0.039**
-0.039**
-0.038**
(0.004) (0.0038) (0.0039) (0.0039) (0.004) (0.0039) (0.0044) (0.004) (0.0042) (0.004) (0.0039) (0.0038)
Squared Density on New -0.023**
-0.025**
-0.025**
-0.022**
-0.023**
-0.024**
-0.022**
-0.024**
-0.024**
-0.028**
-0.027**
-0.028**
(0.0046) (0.0043) (0.0044) (0.0044) (0.0042) (0.0044) (0.0042) (0.0041) (0.0042) (0.0042) (0.0042) (0.0042)
Indicator *Density on Curr. -0.001 -0.016 0.002 -0.0004 -0.001 0.007 0.013 0.012 0.017+ -0.027
+ -0.023 -0.015
(0.0027) (0.0098) (0.0091) (0.0009) (0.0115) (0.0101) (0.0145) (0.0115) (0.0098) (0.0153) (0.0166) (0.0215)
Indicator *Density on New -0.007* -0.025
* -0.016 -0.002
* -0.027
* -0.008 -0.035
** -0.024
** -0.016 -0.01 -0.004 -0.042
**
(0.0031) (0.0105) (0.0114) (0.0009) (0.0107) (0.0144) (0.0123) (0.009) (0.0102) (0.0134) (0.0146) (0.0154)
Observations 532389 532389 532389 500123 500123 500123 532389 532389 532389 532389 532389 532389
Number of Clusters 143 143 143 142 142 142 143 143 143 143 143 143
Adjusted R-squared 0.4995 0.4994 0.4994 0.5116 0.5116 0.5116 0.4997 0.4996 0.4996 0.4994 0.4994 0.4994
Country-clustered standard errors in parentheses.
All models include country-year and product-year dummy variables. **.*,+
statistically significant at .01, .05 and .10 percent respectively.

29
Table 3
Determinants of Having a Comparative Advantage in the Future: Educational Institutions
Institutions Indicator
Gross Enrolment Ratio
Primary Level
(Castellacci and Natera, 2011)
Gross Enrolment Ratio
Secondary Level
(Castellacci and Natera, 2011)
Gross Enrolment Ratio
Tertiary Level
(Castellacci and Natera, 2011)
Public Expenditure on Education
(Castellacci and Natera, 2011)
Indicator Measurement Cts Med 3Qt Cts Med 3Qt Cts Med 3Qt Cts Med 3Qt
(1) (2) (3) (4) (5) (6) (7) (8) (9) (10) (11) (12)
Model LPM LPM LPM LPM LPM LPM LPM LPM LPM LPM LPM LPM
D.V. CAt+5 CAt+5 CAt+5 CAt+5 CAt+5 CAt+5 CAt+5 CAt+5 CAt+5 CAt+5 CAt+5 CAt+5
CAt 0.509**
0.51**
0.509**
0.51**
0.511**
0.51**
0.51**
0.511**
0.51**
0.51**
0.51**
0.509**
(0.0113) (0.0107) (0.0108) (0.0107) (0.0106) (0.0108) (0.0107) (0.0106) (0.0108) (0.0108) (0.0108) (0.0108)
Density on Current 0.343**
0.319**
0.315**
0.334**
0.325**
0.312**
0.322**
0.328**
0.315**
0.311**
0.315**
0.312**
(0.0437) (0.0128) (0.0126) (0.0181) (0.0138) (0.0129) (0.0141) (0.0135) (0.0127) (0.0186) (0.0134) (0.0129)
Density on New 0.278**
0.225**
0.221**
0.232**
0.22**
0.216**
0.225**
0.219**
0.218**
0.22**
0.217**
0.218**
(0.038) (0.01) (0.01) (0.0165) (0.0103) (0.01) (0.0124) (0.0104) (0.0102) (0.0168) (0.0109) (0.01)
Squared Density on Current -0.038**
-0.039**
-0.039**
-0.037**
-0.038**
-0.04**
-0.038**
-0.037**
-0.039**
-0.039**
-0.039**
-0.038**
(0.004) (0.004) (0.0041) (0.0041) (0.0042) (0.0042) (0.004) (0.0042) (0.0041) (0.004) (0.004) (0.0042)
Squared Density on New -0.026**
-0.026**
-0.028**
-0.025**
-0.027**
-0.027**
-0.025**
-0.028**
-0.026**
-0.026**
-0.027**
-0.026**
(0.0043) (0.0042) (0.0044) (0.0048) (0.0049) (0.0049) (0.0046) (0.0046) (0.0045) (0.0044) (0.0044) (0.0042)
Indicator *Density on Curr. -0.0003 -0.004 0.007 -0.0003 -0.018* 0.013 -0.0002 -0.022
** 0.001 0.001 0.0002 0.008
(0.0004) (0.0071) (0.009) (0.0002) (0.0089) (0.0105) (0.0002) (0.0084) (0.0089) (0.0028) (0.0081) (0.0078)
Indicator *Density on New -0.0006 -0.011 -0.009 -0.0002 -0.005 0.005 -0.0003 -0.003 -0.002 -0.001 0.001 -0.0001
(0.0004) (0.0084) (0.0107) (0.0002) (0.011) (0.0149) (0.0002) (0.0104) (0.0119) (0.0033) (0.0095) (0.0103)
Observations 469098 469098 469098 469098 469098 469098 469098 469098 469098 469098 469098 469098
Number of Clusters 126 126 126 126 126 126 126 126 126 126 126 126
Adjusted R-squared 0.5094 0.5094 0.5094 0.5094 0.5094 0.5094 0.5094 0.5094 0.5094 0.5094 0.5094 0.5094
Country-clustered standard errors in parentheses.
All models include country-year and product-year dummy variables. **.*,+
statistically significant at .01, .05 and .10 percent respectively.
30
Table 4
Determinants of Having a Comparative Advantage in the Future: Quality of Education
Institutions Indicator Average School Attainment
(Persson and Tabellini, 2009)
Pupil-Teacher Ratio
Primary Level
(Castellacci and Natera, 2011)
Cognitive Skills
(Hanushek and Woessman, 2012)
Social Filter
(Rodriguez-Pose
and Crescenzi, 2008)
Indicator Measurement Cts Med 3Qt Cts Med 3Qt Cts Med 3Qt Cts Med 3Qt
(1) (2) (3) (4) (5) (6) (7) (8) (9) (10) (11) (12)
Model LPM LPM LPM LPM LPM LPM LPM LPM LPM LPM LPM LPM
D.V. CAt+5 CAt+5 CAt+5 CAt+5 CAt+5 CAt+5 CAt+5 CAt+5 CAt+5 CAt+5 CAt+5 CAt+5
CAt 0.534**
0.534**
0.533**
0.512**
0.511**
0.51**
0.575**
0.576**
0.574**
0.525**
0.526**
0.527**
(0.0104) (0.0105) (0.0106) (0.0106) (0.0106) (0.0107) (0.0131) (0.0131) (0.0131) (0.0106) (0.0107) (0.0106)
Density on Current 0.36**
0.323**
0.315**
0.281**
0.333**
0.315**
0.307**
0.241**
0.237**
0.304**
0.294**
0.293**
(0.0238) (0.0148) (0.0146) (0.0179) (0.0139) (0.0129) (0.0694) (0.0155) (0.0152) (0.0127) (0.0134) (0.0126)
Density on New 0.236**
0.214**
0.216**
0.209**
0.221**
0.217**
0.251**
0.175**
0.185**
0.215**
0.211**
0.211**
(0.023) (0.011) (0.0099) (0.0161) (0.0099) (0.0099) (0.0521) (0.0122) (0.0098) (0.0096) (0.0121) (0.0104)
Squared Density on Current -0.037**
-0.038**
-0.039**
-0.035**
-0.035**
-0.039**
-0.022**
-0.021**
-0.024**
-0.035**
-0.036**
-0.035**
(0.005) (0.0049) (0.0051) (0.0039) (0.0041) (0.004) (0.0052) (0.0046) (0.0046) (0.0042) (0.0043) (0.004)
Squared Density on New -0.024**
-0.026**
-0.023**
-0.027**
-0.026**
-0.027**
-0.017**
-0.02**
-0.019**
-0.026**
-0.027**
-0.026**
(0.0053) (0.0049) (0.0049) (0.0049) (0.0048) (0.0048) (0.0054) (0.0053) (0.0048) (0.0052) (0.0051) (0.0045)
Indicator *Density on Curr. -0.024**
-0.026**
-0.02+ -0.001
* -0.032
** 0.001 -0.017 -0.02
+ -0.013 0.005
+ 0.02
* 0.042
*
(0.0087) (0.0092) (0.0102) (0.0006) (0.011) (0.0087) (0.0148) (0.0114) (0.0115) (0.0027) (0.0092) (0.0199)
Indicator *Density on New -0.012 -0.006 -0.015 -0.0003 -0.01 0.003 -0.016 0.002 -0.026+ 0.004 0.006 0.013
(0.0105) (0.0117) (0.0134) (0.0005) (0.011) (0.0127) (0.0113) (0.0137) (0.0139) (0.0038) (0.0117) (0.0131)
Observations 382228 382228 382228 469098 469098 469098 245718 245718 245718 416976 416976 416976
Number of Clusters 108 108 108 126 126 126 66 66 66 112 112 112
Adjusted R-squared 0.5278 0.5279 0.5278 0.5095 0.5095 0.5094 0.5395 0.5396 0.5395 0.5166 0.5166 0.5167
Country-clustered standard errors in parentheses.
All models include country-year and product-year dummy variables. **.*,+
statistically significant at .01, .05 and .10 percent respectively.

31
Table 5
Determinants of Having a Comparative Advantage in the Future: Coordination Institutions
Institutions Indicator Original Dummy
(Hall and Soskice, 2001)
Coordination in Labor Relations
(Hall and Gingerich, 2009)
Coordination in Corporate
Governance
(Hall and Gingerich, 2009)
Coordination in Labor Relations
and Corporate Governance
(Hall and Gingerich, 2009)
Indicator Measurement LME CME MME Cts Med 3Qt Cts Med 3Qt Cts Med 3Qt
(1) (2) (3) (4) (5) (6) (7) (8) (9) (10) (11) (12)
Model LPM LPM LPM LPM LPM LPM LPM LPM LPM LPM LPM LPM
D.V. CAt+5 CAt+5 CAt+5 CAt+5 CAt+5 CAt+5 CAt+5 CAt+5 CAt+5 CAt+5 CAt+5 CAt+5
CAt 0.661**
0.661**
0.66**
0.669**
0.67**
0.671**
0.669**
0.669**
0.669**
0.668**
0.67**
0.67**
(0.0123) (0.0122) (0.0123) (0.012) (0.0119) (0.0123) (0.0118) (0.0123) (0.0114) (0.0119) (0.0124) (0.0122)
Density on Current 0.164**
0.159**
0.163**
0.141**
0.144**
0.15**
0.138**
0.15**
0.156**
0.138**
0.144**
0.153**
(0.0106) (0.0124) (0.0118) (0.015) (0.0131) (0.0132) (0.0157) (0.015) (0.0118) (0.0152) (0.0145) (0.0126)
Density on New 0.147**
0.138**
0.15**
0.129**
0.13**
0.138**
0.132**
0.137**
0.154**
0.142**
0.129**
0.147**
(0.0086) (0.0084) (0.0072) (0.0114) (0.0109) (0.0092) (0.0126) (0.01) (0.0104) (0.0135) (0.0103) (0.0113)
Squared Density on Current -0.011* -0.011
* -0.011
* -0.014
* -0.013
* -0.016
* -0.015
* -0.014
* -0.017
* -0.013
* -0.014
* -0.018
**
(0.0053) (0.0052) (0.0053) (0.0062) (0.0057) (0.0063) (0.0064) (0.0057) (0.0065) (0.0059) (0.0054) (0.0065)
Squared Density on New 0.003 0.004 0.005 0.006 0.006 0.006 0.006 0.005 0.011* 0.008 0.006 0.011
+
(0.0042) (0.0044) (0.0041) (0.0042) (0.0047) (0.0047) (0.0038) (0.0035) (0.0055) (0.005) (0.0043) (0.0065)
Dummy*Density on Curr. -0.012 0.006 0.001
(0.0158) (0.0119) (0.0147)
Dummy*Density on New -0.01 0.016 -0.012
(0.0142) (0.0128) (0.0171)
Labor*Density on Curr. 0.031+ 0.024
* 0.027
* -0.014 0.023
* 0.018
(0.0168) (0.0113) (0.0131) (0.05) (0.0104) (0.0153)
Labor*Density on New 0.03+ 0.027
* 0.023
+ 0.062 0.026 0.026
*
(0.0161) (0.0121) (0.0127) (0.0404) (0.0163) (0.0109)
Corp.Gov.*Density on Curr. 0.034+ 0.014 0.014 0.043 0.001 0.006
(0.0195) (0.0138) (0.0126) (0.055) (0.0129) (0.0156)
Corp.Gov.*Density on New 0.023 0.016 -0.017 -0.044 0.002 -0.026
(0.0188) (0.0122) (0.016) (0.0484) (0.0154) (0.0178)
Observations 85629 85629 85629 74460 74460 74460 74460 74460 74460 74460 74460 74460
Number of Clusters 23 23 23 20 20 20 20 20 20 20 20 20
Adjusted R-squared 0.6243 0.6243 0.6243 0.6334 0.6335 0.6335 0.6335 0.6334 0.6335 0.6335 0.6335 0.6335
Country-clustered standard errors in parentheses.
All models include country-year and product-year dummy variables. **.*,+
statistically significant at .01, .05 and .10 percent respectively.
32
Table 6
Determinants of Having a Comparative Advantage in the Future: Markets for Technology
Institutions Indicator Royalty and License Fees Payments
(Castellacci and Natera, 2011)
Indicator Measurement Cts Med 3Qt
(1) (2) (3)
Model LPM LPM LPM
D.V. CAt+5 CAt+5 CAt+5
CAt 0.509**
0.509**
0.508**
(0.0109) (0.0109) (0.0107)
Density on Current 0.312**
0.332**
0.318**
(0.0128) (0.0135) (0.0128)
Density on New 0.216**
0.236**
0.226**
(0.01) (0.0105) (0.0097)
Squared Density on Current -0.038**
-0.038**
-0.039**
(0.004) (0.0041) (0.0039)
Squared Density on New -0.027**
-0.024**
-0.026**
(0.0042) (0.0043) (0.0042)
Indicator*Density on Curr. 1.034 -0.023* -0.003
(1.0719) (0.0102) (0.0085)
Indicator*Density on New 0.506 -0.031**
-0.026**
(1.0981) (0.0097) (0.0099)
Observations 469098 469098 469098
Number of Clusters 126 126 126
Adjusted R-squared 0.5094 0.5094 0.5095
Country-clustered standard errors in parentheses.
All models include country-year and product-year dummy variables. **.*,+
statistically significant at .01, .05 and .10 percent respectively.
33
Table 7
Determinants of Having a Comparative Advantage in the Future: Cultural Indicators
Cultural Indicator
Uncertainty Avoidance Index
(UAI)
(Hofstede et al., 2010)
Individualism
(IDV)
(Hofstede et al., 2010)
Masculinity
(MAS)
(Hofstede et al., 2010)
Long Term Orientation
(LTO)
(Hofstede et al., 2010)
Indicator Measurement Cts Med 3Qt Cts Med 3Qt Cts Med 3Qt Cts Med 3Qt
(1) (2) (3) (4) (5) (6) (7) (8) (9) (10) (11) (12)
Model LPM LPM LPM LPM LPM LPM LPM LPM LPM LPM LPM LPM
D.V. CAt+5 CAt+5 CAt+5 CAt+5 CAt+5 CAt+5 CAt+5 CAt+5 CAt+5 CAt+5 CAt+5 CAt+5
CAt 0.59**
0.59**
0.59**
0.59**
0.59**
0.59**
0.59**
0.59**
0.59**
0.535**
0.535**
0.536**
(0.0116) (0.0117) (0.0118) (0.0117) (0.0117) (0.0116) (0.0119) (0.0119) (0.0117) (0.013) (0.0131) (0.013)
Density on Current 0.217**
0.209**
0.206**
0.215**
0.212**
0.207**
0.226**
0.209**
0.212**
0.307**
0.301**
0.291**
(0.0184) (0.0129) (0.0121) (0.0153) (0.0129) (0.0117) (0.0174) (0.0118) (0.0107) (0.0183) (0.0178) (0.0153)
Density on New 0.164**
0.163**
0.165**
0.175**
0.166**
0.169**
0.173**
0.164**
0.172**
0.238**
0.219**
0.209**
(0.0135) (0.0092) (0.0088) (0.0148) (0.0102) (0.0089) (0.017) (0.0096) (0.0089) (0.0177) (0.0147) (0.0102)
Squared Density on Current -0.019**
-0.019**
-0.018**
-0.018**
-0.018**
-0.019**
-0.018**
-0.019**
-0.017**
-0.036**
-0.035**
-0.035**
(0.004) (0.0042) (0.0041) (0.0041) (0.0041) (0.0038) (0.0042) (0.0042) (0.0042) (0.0053) (0.0049) (0.0054)
Squared Density on New -0.015**
-0.015**
-0.015**
-0.013**
-0.015**
-0.013**
-0.014**
-0.015**
-0.012**
-0.021**
-0.022**
-0.023**
(0.004) (0.004) (0.0039) (0.0044) (0.0041) (0.004) (0.0042) (0.0041) (0.0042) (0.0053) (0.0051) (0.0053)
Indicator*Density on Curr. -0.0001 -0.002 0.008 -0.0002 -0.007 0.002 -0.0004 -0.001 -0.02+ -0.0004
+ -0.022
+ -0.017
+
(0.0002) (0.0094) (0.0102) (0.0002) (0.0111) (0.012) (0.0003) (0.0099) (0.0103) (0.0002) (0.0118) (0.0095)
Indicator*Density on New < 0.0001 0.004 0.001 -0.0003 -0.002 -0.017 -0.0002 0.002 -0.029**
-0.001**
-0.034* -0.026
*
(0.0002) (0.0102) (0.0118) (0.0003) (0.0114) (0.0149) (0.0003) (0.0106) (0.011) (0.0003) (0.0133) (0.0116)
Observations 235790 235790 235790 235790 235790 235790 235790 235790 235790 317696 317696 317696
Number of Clusters 64 64 64 64 64 64 64 64 64 86 86 86
Adjusted R-squared 0.5497 0.5497 0.5497 0.5497 0.5497 0.5497 0.5497 0.5497 0.5497 0.5214 0.5214 0.5213
Country-clustered standard errors in parentheses.
All models include country-year and product-year dummy variables. **.*,+
statistically significant at .01, .05 and .10 percent respectively.
34
Table 8
Determinants of Having a Comparative Advantage in the Future: Culture Full Model
Cultural Indicator Hofstede Cultural Indicators
(Hofstede et al., 2010)
Indicator Measurement Cts Med 3Qt
(1) (2) (3)
Model LPM LPM LPM
D.V. CAt+5 CAt+5 CAt+5
CAt 0.593**
0.593**
0.594**
(0.0123) (0.0125) (0.0123)
Density on Current 0.261**
0.219**
0.207**
(0.0382) (0.0231) (0.0133)
Density on New 0.235**
0.181**
0.185**
(0.0404) (0.0248) (0.012)
Squared Density on Current -0.019**
-0.02**
-0.017**
(0.0058) (0.0049) (0.0051)
Squared Density on New -0.008 -0.012* -0.007
(0.0055) (0.0055) (0.0047)
UAI*Density on Curr. -0.0002 -0.005 0.006
(0.0002) (0.0113) (0.0117)
UAI*Density on New -0.0001 0.006 -0.003
(0.0002) (0.0128) (0.0125)
IDV*Density on Curr. -0.0002 -0.007 0.003
(0.0003) (0.0114) (0.0122)
IDV*Density on New -0.0004 -0.004 -0.019
(0.0003) (0.0148) (0.0141)
MAS*Density on Curr. -0.0004 -0.002 -0.012
(0.0003) (0.0116) (0.0127)
MAS*Density on New -0.0003 -0.003 -0.029**
(0.0003) (0.013) (0.0107)
LTO*Density on Curr. -0.0002 -0.007 -0.015
(0.0002) (0.0123) (0.0101)
LTO*Density on New -0.001**
-0.029+ -0.034
**
(0.0003) (0.0155) (0.0099)
Observations 217175 217175 217175
Number of Clusters 59 59 59
Adjusted R-squared 0.5529 0.5529 0.553
Country-clustered standard errors in parentheses.
All models include country-year and product-year dummy variables. **.*,+
statistically significant at .01, .05 and .10 percent respectively.

35
Appendix: Simulation Model
We can provide a more precise account of our theoretical argument by building a simulation model
of product dynamics, that simplifies and extends the work by Hausmann and Hidalgo (2011) and by
Klimek, Hausmann, and Thurner (2012). The basic elements of our model are products and
capabilities: products are the elements that can be observed in the empirical studies; capabilities are
unobservable characteristics that determine the evolution of the observable products. The state of
the economy of a country is represented at each point in time by two binary vectors: an element of
the vector of products (of length Np) takes value 1 if a country has a comparative advantage in the
production of that product, and 0 otherwise; analogously, an element of the vector of capabilities (of
length Na) takes value 1 if a country has that specific capability, and 0 otherwise.
The transition from a state to next one is governed by two separate processes for the evolution of
capabilities and products. Capabilities are subject to both production and destruction rules. In a
Schumpeterian fashion, new capabilities are created through the recombination of existing
capabilities. For each capability, there are on average 𝑅+̅̅ ̅̅ combinations of existing capabilities that
can generate it. For the sake of simplicity, we assume that each combination requires only two
capabilities. All these relations are summarized in a binary matrix of dimensions Na x R+ for each
capability: in each column two elements take value 1 (corresponding to the production
combination) and all other elements take value 0. Capabilities can also be lost, because they are not
used anymore due to the obsolescence of corresponding products. For each capability, there are on
average 𝑅−̅̅ ̅̅ different capabilities leading to obsolescence.
The dynamics of products is determined by the presence or lack of the required capabilities. Each
product requires a set of specific capabilities (on average Nap) that a country has to be endowed with
in order to produce it. While previous models assumed this relation between capabilities and
products to be deterministic (a country needed all required capabilities for a product in order to
produce it), here we relax this assumption by allowing countries to produce a product even if they
do not have all required capabilities. However, the more the required capabilities a country is

36
endowed with, the higher the probability to start producing a product. This probability is modeled
through a beta cumulative distribution function, where the parameter β always takes the value 1. We
use variations in the parameter α to distinguish between countries with strong and weak general-
purpose capabilities: countries with strong general-purpose capabilities will have a lower value of α
(αs), while countries with weak general-purpose capabilities will have a higher value of α (αw).
In each period, we first update the vector of capability for each country, and then we update the
corresponding vector of products. Initial conditions in terms of products and capabilities are
estimated from the empirical dataset.
Our model represents, in a simple and parsimonious way, the mechanisms that we tried to highlight
in the theoretical section. Therefore, the analysis of the data generated by our simulation model
follows the same methodology employed for the empirical analysis. Since initial conditions are
estimated from the empirical data, we also use fixed effects and clustered standard errors. We
present the preliminary results in Table A1: the results presented are the outcome of a single
simulation run, although a similar pattern emerges from multiple simulation runs.
As can be seen in columns 1 and 2, the model successfully replicates the findings on density.
However, columns 3 and 4 show that the effect of density is valid only in the case of countries with
weak general-purpose capabilities, whereas countries with strong general-purpose capabilities are
not constrained at all by density in the evolution of their productive structure. Although rather
extreme, these results support our main theoretical argument. However, further calibration of the
parameters of the model and several robustness checks will be needed in order to validate our
results.
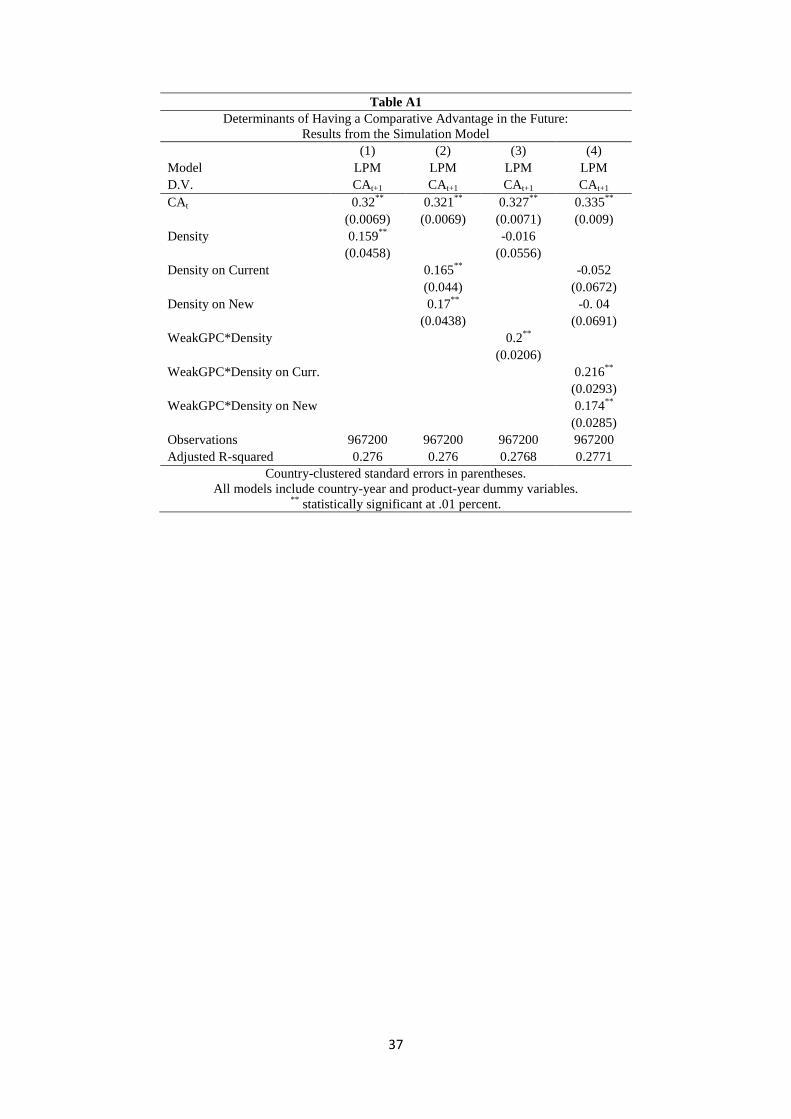
37
Table A1
Determinants of Having a Comparative Advantage in the Future:
Results from the Simulation Model
(1) (2) (3) (4)
Model LPM LPM LPM LPM
D.V. CAt+1 CAt+1 CAt+1 CAt+1
CAt 0.32**
0.321**
0.327**
0.335**
(0.0069) (0.0069) (0.0071) (0.009)
Density 0.159**
-0.016
(0.0458) (0.0556)
Density on Current 0.165**
-0.052
(0.044) (0.0672)
Density on New 0.17**
-0. 04
(0.0438) (0.0691)
WeakGPC*Density 0.2**
(0.0206)
WeakGPC*Density on Curr. 0.216**
(0.0293)
WeakGPC*Density on New 0.174**
(0.0285)
Observations 967200 967200 967200 967200
Adjusted R-squared 0.276 0.276 0.2768 0.2771
Country-clustered standard errors in parentheses.
All models include country-year and product-year dummy variables. **
statistically significant at .01 percent.