relationship of subjective and objective social status … preliminar y study compared the...
TRANSCRIPT

Health Psychology2000, Vol. 19, No. 6, 586-592
Copyright 2000 by the American Psychological Association, Inc.0278-6133/00/$5.00 DO1: 10.1037//0278-6133.19.6.586
Relationship of Subjective and Objective Social Status With Psychologicaland Physiological Functioning: Preliminary Data in Healthy White Women
Nancy E. Adler and Elissa S. EpelUniversity of California, San Francisco
Grace Castellazzo and Jeannette R. IckovicsYale University
This preliminary study compared the associations between objective and subjective socioeconomic status(SES) with psychological and physical variables among 157 healthy White women, 59 of whomsubsequently participated in a laboratory stress study. Compared with objective indicators, subjectivesocial status was more consistently and strongly related to psychological functioning and health-relatedfactors (self-rated health, heart rate, sleep latency, body fat distribution, and cortisol habituation torepeated stress). Most associations remained significant even after controlling for objective social statusand negative affectivity. Results suggest that, in this sample with a moderately restricted range on SESand health, psychological perceptions of social status may be contributing to the SES-health gradient.
Key words: social class, social hierarchy, waist-to-hip ratio, cortisol, health
Socioeconomic status (SES) is linked to risk of disease andpremature death (Adler, Marmot, McEwen, & Stewart, 1999).Although some of the association may be due to health effects onSES, evidence is stronger for SES effects on health (Fox, Gold-blatt, & Jones, 1985; Haan, Kaplan, & Syme, 1989). The pathwaysby which SES influences health are not well established, however.Based on research showing health effects of income inequality,independent of median income, Wilkinson (1999) argued that it isnot absolute levels of SES that are important for health but ratherinequality resulting from relative standing'. If so, a person's sub-jective social status should be more strongly linked to health thantraditional measures of SES. The current study presents a newmeasure of subjective social standing and provides suggestiveevidence that higher subjective social status may foster betterhealth.
Despite substantial research on SES and health, there is limitedwork on the correlates of subjective social standing. Most researchon subjective status was conducted from the 1940s through the1970s and examined determinants of class identification and as-sociations of class identification with political attitudes and behav-iors (Cantril, 1943; Centers, 1949; Jackman & Jackman, 1973;Kluegel, Singleton, & Starnes, 1977). Subjective status typically
Nancy E. Adler and Elissa S. Epel, Health Psychology Program, Uni-versity of California, San Francisco; Grace Castellazzo and Jeannette R.Ickovics, Department of Psychology and Department of Epidemiology andPublic Health, Yale University.
This research was supported by the John D. and Catherine T. MacArthurFoundation Network on Socioeconomic Status and by a research awardfrom the American Psychological Association Division of Health Psychol-ogy (Division 38) to Elissa S. Epel. We thank Joan Ostrove and JudithStewart for their helpful comments.
Correspondence concerning this article should be addressed to Nancy E.Adler, Health Psychology Program, University of California, San Fran-cisco, Box 0844, 3333 California Street, Suite 465, San Francisco, Cali-fornia 94143-0844. Electronic mail may be sent to [email protected].
has been assessed by asking respondents to indicate the social classto which they belong (e.g., upper, middle, working). Two morerecent studies examined the relationship of subjective class iden-tification with objective class location and socioeconomic factors(Baxter, 1994; Ekehammar, Sidanius, & Nilsson, 1987). We nowreport on associations of subjective social status with psycholog-ical and physiological factors associated in prior research withobjective SES and health.
A risk factor for a number of diseases is body fat, both overallbody fat as reflected by body mass index (BMI) and abdominal fatdistribution as reflected by the waist-to-hip ratio (WHR). HighWHR may be a stronger predictor of mortality than BMI amongwomen (Folsom et al., 1993). Although both are associated withSES (Sobal & Stunkard, 1989; Rosmond, Lapidus, & Bjoratorp,1996), some research has found associations for WHR but not BMI(Larsson et al., 1989). Higher WHR has been found among thosewith less education (Kaye, Folsom, Prineas, Potter, & Gapstur,1990; Kay, Folsom, Jacobs, Hughes, & Flack, 1993; Seidell, 1991;Georges, Mueller, & Wear, 1993) and among those of loweroccupational status (Brunner et al., 1997; Rosmond et al., 1996).
SES may affect fat distribution partly through behaviors thatcovary with SES such as high-fat diet, alcohol consumption, andphysical inactivity. However, studies that controlled for smokingand alcohol use found an independent relationship of SES withWHR (Georges et al., 1993; Rosmond et al., 1996). SES effects onfat distribution may also occur through differential exposure tostress. Abdominal fat has relatively greater sensitivity to cortisolthan peripheral fat, so individuals with greater exposure to eventsthat evoke a stress response may accumulate greater abdominal fat(McEwen, 1998; Rebuffe-Scrive, Walsh, McEwen, & Rodin,1992). Animal research shows that subordinate animals havehigher levels of cortisol and more central fat than dominant ani-mals (Sapolsky, 1982; Shively & Clarkson, 1988). The currentstudy examines the association of objective and subjective SESwith WHR and with cortisol habituation to stress, which may
586
This
doc
umen
t is c
opyr
ight
ed b
y th
e A
mer
ican
Psy
chol
ogic
al A
ssoc
iatio
n or
one
of i
ts a
llied
pub
lishe
rs.
This
arti
cle
is in
tend
ed so
lely
for t
he p
erso
nal u
se o
f the
indi
vidu
al u
ser a
nd is
not
to b
e di
ssem
inat
ed b
road
ly.

SUBJECTIVE SOCIAL STATUS AND HEALTH 587
reflect longer term levels of cortisol exposure (McEwen, 1998;
Kirschbaum et al., 1995). Cortisol habituation to repeated stress
may be a more valid indicator of cumulative exposure to elevatedcortisol than baseline levels or responses to a single sttessor.
Sympathetic activity at rest is another potential risk factor fordisease that may be affected by SES. High resting heart rate is a
risk factor for all-cause mortality (Greenland et al., 1999; Reun-
anen et al., 2000). High resting blood pressure is also a consistent
predictor of heart disease and is related, although not consistently,
to lower SES (Pickering, 1999).
Sleep may be another pathway by which SES influences health(Van Cauter & Spiegel, 1999). Insufficient sleep, poor sleep qual-
ity, and higher prevalence of sleep disorders are linked to poorer
health and impaired immune function (Dement, 1993; Hall et al.,1998; Segovia, Harriett, & Edwards, 1989). In a community sam-
ple, better sleep quality was associated with better psychological
and self-reported physical health, and better sleep quality partiallymediated the association of higher income with health (Moore,
Adler, Williams, & Jackson, 2000).
Psychological variables related to perceptions of stress and
adversity may also mediate the impact of SES on health (Taylor &
Seeman, 1999). Stress, pessimism, and sense of control have beenlinked to both SES and worse health outcomes (Adler et al., 1999;
Cohen, Kaplan, & Salonen, 1999; Taylor & Seeman, 1999). Pas-
sive coping has been linked to worse health (e.g., Billings, Folk-
man, Acree, & Moskowitz, 2000; Essex & Klein, 1989; Lehrer,
1998) but has not yet been linked to SES. In research reportedhere, we assess exposure to and evaluation of stress, active versus
passive coping, pessimism, and sense of control.The current study presents data on a new measure of subjective
SES. The measure is a self-anchoring scale (Kilpatrick & Cantril,1960) that uses a simple drawing of a ladder on which individuals
place themselves. It is anchored at the top by those in U.S. society
who are best off in terms of income, education, and occupation andat the bottom by those who are worst off. We present data on the
association of ladder rankings with self-rated health and with
psychological and physiological functioning in a sample of healthy
adult White women.
Method
Study Participants
Participants were 157 regularly menstruating White women aged 30to 46 years who were participating in a larger study of stress, body fatdistribution, and physiological reactivity to stress; of these, 59 participatedin a laboratory study examining habituation to stress (see Epel et al., 2000).One woman failed to provide SES data and was dropped from all analyses.
Exclusion criteria included factors that could influence fat distribution orcortisol reactivity: ciurent smoking or having smoked 10 or more cigarettesa day within the last 2 years, more than 7 drinks of alcohol a week, historyof endocrine or metabolic disorders, hypertension, use of medicationsincluding oral contraceptives, more than three pregnancies lasting morethan 12 weeks, weight changes of greater than 5% of body weight in thelast 3 months, exercising more than 2 hours a day, current depression,hospitalizations for psychiatric problems, and alcohol or drug dependen-cies. Women with less than a high school education were excluded,because one task in the larger study was a memory task, which could beaffected by very low education. Exclusion criteria were assessed by self-report in a telephone interview and were rechecked at the initial visit.
Participants were recruited by advertisements requesting healthy non-smoking women between the ages of 30 and 45 years. Women meetingscreening requirements came to the laboratory, completed psychosocialand health surveys, and had anthropomorphic measurements taken by atrained research assistant (height, weight, waist and hip circumference, andpercentage of body fat). Fifty-nine women who bad either a low or a highWHR were included in a three-session laboratory stress study (for details,see Epel et al., 2000). Sessions took place over 3 consecutive days in thelate afternoon. Those occurred about 1 month after the first visit, during thefollicular stage of women's menstrual cycle. Participants performed diffi-cult tasks and delivered a speech during each session while repeated salivasamples were taken.
Measures
Social Status
Subjective SES scale. Participants were given a drawing of a ladderwith 10 rungs that was described as follows: "Think of this ladder asrepresenting where people stand in our society. At the top of the ladder arethe people who are the best off, those who have the most money, mosteducation, and best jobs. At the bottom are the people who are the worstoff, those who have me least money, least education, and woist jobs or nojob." They were then asked to place an X on the rung that best representswhere they think they stand on the ladder.
Objective SES. Education was measured by highest degree earned andwas coded into four categories: (a) high school degree, (b) college degree,(c) master's degree, and (d) higher degree (including doctorate and lawdegree). Household income was coded into four categories: (a) $10,000 orless, (b) $10,001-430,000, (c) $30,001-$50,000, and (d) $50,001 or more.Occupation was coded into three categories: (a) blue collar or service, (b)clerical/self-employed, and (c) professional or managerial. Distributions ofthese variables are shown in Table 1. A composite measure of education,income, and occupation was created by standardizing each variable andtaking their mean. This composite parallels the ladder measure in that itassesses the three traditional components of SES (education, income,occupation). Women who were not engaged in paid employment, includingthose who identified themselves as students (n — 21, 13%), homemakers(n = 14, 9%), or unemployed (n = 6, 4%), were not given a value for
Table 1
Sociodemographic Data of Sample
Variable M(SD)
Age (years) (n = 156) 37.4 (4.8)30-3536-4041-46
Education level (degree earned; n ~ 149) 15.7' (1.7)High schoolCollegeMaster's levelHigher
Income (household; n = 150) $44,345 ($28,236)£$10,000$ll.000-$30.000$31,000-$50,000$51,000-$120,000
Occupational status (n = 148) 2.2 (0.9)Blue collar/serviceClericalManagerial/professionalOther (e.g., student, bontemaker)
41(64)29(44)30(48)
32.2 (48)31.5(47)28.9 (43)7.4(11)
8.0(12)26.7 (40)33.3 (50)32.0(48)
18.9 (28)16.9(25)36.5 (54)27.7(41)
* Number refers to years of education.
This
doc
umen
t is c
opyr
ight
ed b
y th
e A
mer
ican
Psy
chol
ogic
al A
ssoc
iatio
n or
one
of i
ts a
llied
pub
lishe
rs.
This
arti
cle
is in
tend
ed so
lely
for t
he p
erso
nal u
se o
f the
indi
vidu
al u
ser a
nd is
not
to b
e di
ssem
inat
ed b
road
ly.
588 ADLER, EPEL, CASTELLAZZO, AND ICKOVICS
occupation. Therefore, their objective SES score was based solely onhousehold income and education.
Health-Related Variables
Self-rated health. This was assessed by the general health subscale ofthe SF-36 (Ware & Sherbourne, 1992). This five-item subscale assessesglobal perceptions of one's current health and how one's health compareswith that of others. High scores reflect better health. Raw scale scores werestandardized to a 100-point scale (Medical Outcomes Trust, 1994). Self-assessments of health have been shown to predict subsequent mortality,even when controlling for health as assessed by physical exam (Idler &Angel, 1990; Idler & Benyamini 1997; Mossey & Shapiro, 1982).
BMI. Body weight was assessed on a balance beam scale, with partic-ipants wearing T-shirts and briefs. Body height was measured to thenearest 0.25 inch. BMI was calculated as weight (kilograms) divided byheight (meters squared).
Body fat distribution. Waist circumference was measured twice at themidpoint between the upper iliac crest and lower costal margin in themidaxillary line. Hip circumferences were measured twice at the maximumwidth of the buttocks or gluteofemoral fold (Galloway, Chumba, & Bou-chard, 1988). WHR was calculated as the mean waist circumferencedivided by the mean hip circumference. Percentage of body fat wasassessed with the Futrex-5000 body fat computer (Futrex, Gaithersburg,MD). Analyses of WHR controlled for percentage of body fat as well as forBMI. Controlling for both BMI and percentage of body fat creates a morestringent measure of fat distribution, independent of overall body size andfatness.
Sleep. This was assessed using the sleep quality and sleep-onset la-tency subscales from the Pittsburgh Sleep Quality Index (Buys&e, Rey-nolds, Monk, Berman, & Kupfer, 1989). High scores on both sleep sub-scales indicate poor sleep. This questionnaire compares favorably withclinical and laboratory diagnoses of "good" and "poor" sleepers, the latterbased on studies of depressed or sleep-disordered patients (Buysse el al.,1989).
Resting physiological response. The subsample of 59 women in thelaboratory study initially rested seated for 30 min, beginning at either 4:30or 5:00 p.m. Blood pressure and heart rate were assessed at the end of theresting period, after 30 min. We used an SD-700A (IBS, Waltham, MA)electronic blood pressure and pulse monitor, applying the cuff to theparticipant's dominant arm.
Cortisol adaptation to challenge. This was also measured in the par-ticipants from the laboratory study. Salivary cortisol is a noninvasive,reliable method of measuring levels of cortisol, which strongly reflectslevels of serum cortisol (Kirschbaum & Hellhammer, 1989). Eight salivasamples were collected each session, frozen after collection, and laterassayed with a radioimmunoassay, using a commercial kit (DiagnosticProducts Corporation, Los Angeles, CA). Intra-assay coefficients of vari-ation were 4.8% for low concentrations and 5.1% for high concentrationsof salivary cortisol. The interassay coefficient of variation was 4%. Cor-tisol responses to the stress task on the first day of the challenge werecompared with those on the 2 subsequent days of challenge. Each individ-ual's cortisol responses during the three sessions were plotted onto onegraph. Participants showed one of three patterns:
1. Those showing "habituation" had higher cortisol on Stress Day 1 thanStress Day 2 or 3. This is taken to indicate healthy adaptation to novelstress.
2. Those showing "nonhabituation" had levels of cortisol on Day 2 or 3equal to or higher than that on Day 1. This high reactivity withouthabituation is taken to be unhealthy, indicating overexposure of cortisol.
3. "Low reactors" showed little response on any day with cortisolstaying at about 0.10 jxg/dl throughout the sessions. Low cortisol couldreflect low levels of stress, dysregulation, or lack of engagement with thetask.
Reliability of ratings categorizing participants into these three groups wasgood (90% agreement). Another analysis on this sample found that non-habituators showed the least psychological growth after experiencing astressful event (Epel, McEwen, & Ickovics, 1998).
Psychological Variables
All of the psychological measures have established reliability and va-lidity and were internally consistent in this sample (Cronbach's a =.70-.93).
Negative affectivity was measured using the Negative Affect subscale ofthe Positive and Negative Affectivity Scale (Watson, Clark, & Tellegen,1988). Participants rated how much they generally tend to feel negativeemotions.
Pessimism was assessed by the Life Orientation Test (Scheier & Carver,1985), which measures relatively stable appraisals of expectancies forpositive and negative outcomes. Four items that assessed negative expec-tations were used to obtain a measure of pessimism; negative expectationshave shown consistently stronger associations with SES than have positiveexpectations (Taylor & Seeman, 1999).
A one-item question assessing perceived control over life was takenfrom MacArthur Midlife Survey (Lachman & Weaver, 1998). Participantswere asked, "Using a 0 to 10 scale, where 0 means no control at all and 10means very much control, how would you rate the amount of control youhave over your life overall diese days?"
Coping style was measured by combining two instruments. In additionto the COPE (Carver, Weintraub, & Scheier, 1989), which assesses rela-tively stable ways of responding to stress, 10 items assessing active copingthrough "emotional approach" (processing and expressing one's feelings)were used (Stanton, Danoff-Burg, Cameron, & Ellis, 1994).These yieldedmeasures of active coping, which included both problem-focused andemotion-focused strategies, and passive coping, which included disengage-ment strategies such as denial, giving up, and distraction.
Subjective stress was measured using the Perceived Stress Scale (Cohen,Kamarck, & Mermelstein, 1983), which assesses the frequency of bothstressful situations and feelings of stress over the last month. Chronic stresswas measured using the Social Stress Index (Wheaton, 1994). Participantsindicated how much they experienced each of 51 ongoing difficult situa-tions or events.
Statistical Analyses
To examine relations among SES, physiological, and psychologicalfactors, we performed bivariate correlations between subjective and objec-tive SES and these measures. WHR was analyzed using partial correla-tions, controlling for BMI and percentage of body fat. Given previousfindings that high WHR is most clearly related to income at the lowestlevels of BMI (Larsson et al., 1989), we also examined relations betweenWHR and SES at varying levels of BMI by stratifying the sample intotertiles: low BMI (=S22.6), medium BMI (22.7-26.2), and high BMI(£26.2).
Hierarchical regressions examined the effect of subjective SES, inde-pendent of both objective SES and, for self-report measures, possiblereporting bias as a result of greater negative affectivity. Individuals who arehigher on negative affectivity may place themselves lower on the ladder.Because it is just as likely that feelings of relative standing influencenegative affect (e.g., Sennett & Cobb, 1972), this may, in fact, overcontrolfor negative affect. In cross-sectional data, we cannot tease apart these twopossibilities. Step 1 of the regressions included the objective SES com-posite, Step 2 included negative affectivity, and Step 3 included subjectiveSES. For physiological data, in which negative affect is not an issue, onlyobjective SES was controlled for. Initial beta weights from when eachvariable is first entered into the model are reported as is the change in R2
after the last step when we entered subjective SES.
This
doc
umen
t is c
opyr
ight
ed b
y th
e A
mer
ican
Psy
chol
ogic
al A
ssoc
iatio
n or
one
of i
ts a
llied
pub
lishe
rs.
This
arti
cle
is in
tend
ed so
lely
for t
he p
erso
nal u
se o
f the
indi
vidu
al u
ser a
nd is
not
to b
e di
ssem
inat
ed b
road
ly.

SUBJECTIVE SOCIAL STATUS AND HEALTH 589
Participants with missing data on a variable were excluded from Cheanalysis of that specific variable. The SES composite took an average ofthe available SES indices, so that those with missing data had a standard-ized SES score reflecting the available SES markers. Three participants hadmissing data on the ladder and were excluded from analyses of the ladder.
Results
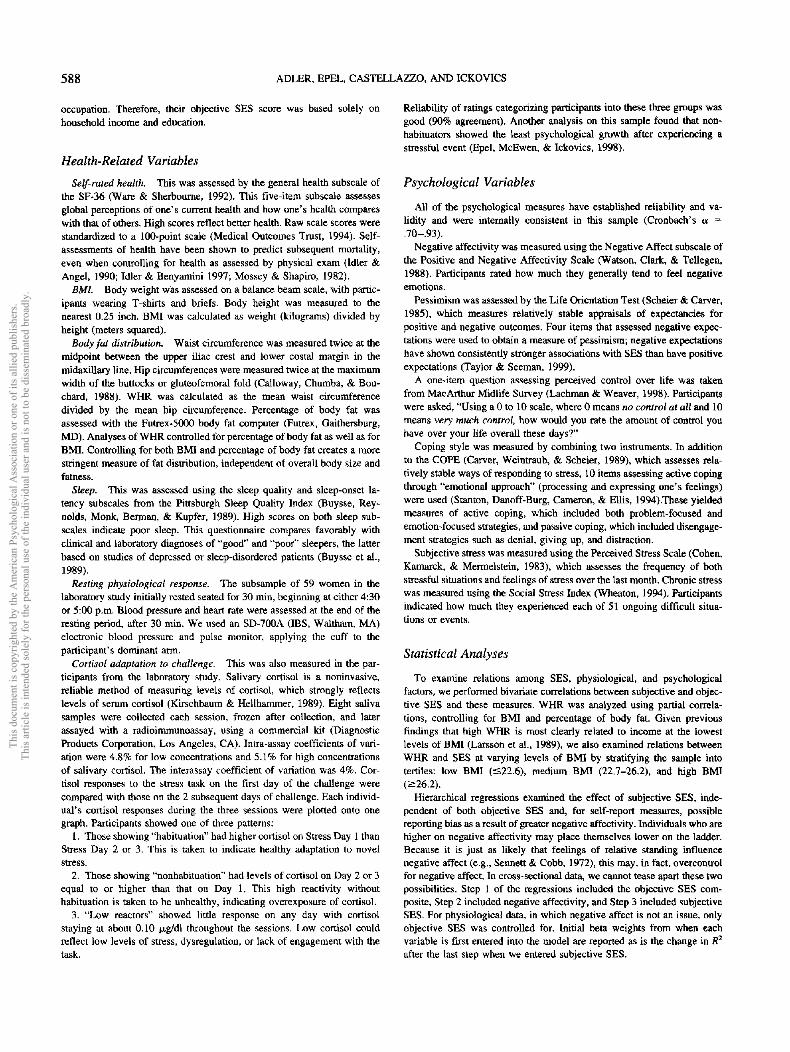
The sample demographics are shown in Table 1. The averagesubjective SES score was 6.8 (SE = 0.12), on the 10-point ladderscale; these scores are slightly skewed, which may reflect thesomewhat higher objective SES of the sample (Figure 1). Theaverage woman was slightly overweight (average BMI = 25.47),with BMIs ranging from low (17.8) to obese (42,5). Average WHRwas moderately high, at .78, ranging from low (.67), representingpredominantly peripheral fat distribution, to high (.97), represent-ing greater abdominal fat distribution.
Bivariate AssociationsOccupational status was related to education (r = .31, p < .001)
and income (r = .20, p < .05). Household income and educationwere unrelated (r = ,04), even when students were excluded (r =.06). This may reflect the fact that household incomes are notsimply a function of the woman's own income but also that of herpartner. Subjective SES was significantly related to both income(r ~ .22, p < .01) and educational degree (r = .32, p < .01) butnot to occupational status (r = .11). Subjective SES was morestrongly related to the composite measure of objective SES (r =.40, p < .01) than to any one objective SES indicator, suggestingthat participants take into account their relative standing on thevarious components of SES when indicating their rank on theladder.
Bivariate associations of the composite objective and subjectiveSES indicators with physiological and psychological variables areshown in Table 2. Objective SES was significantly related to bettersleep quality, which was not associated with subjective SES. Incontrast, subjective status showed significant associations withother health-related indicators: The higher individuals were on the
Table 2Correlations Among SES, Health, and Psychological Variables
Index
PhysiologicalPhysical healthBMIWHR"Sleep quality1'Sleep latency"Resting heart rateb
Resting systolic blood pressure*1
PsychologicalNegative affectivityChronic stressSubjective stressPessimismControl over lifeActive copingPassive coping
Objective SES(n = 156)
.05-.07-.10-.27*-.17-.10
.06
-.13-.13-.08-.20*-.05
.10-.20*
Subjective SES(n = 153)
.18*-.12-.18*-.10-.44**-.29*-.16
-.31*-.36*-.25*-.37*
.26*
.24*-.33**
Ladder Ranking
Figure 1, Frequency distribution of ladder rankings (1-10) by percentile.
Note. SES = socioeconomic status; BMI - body mass index; WHR =waist-to-hip ratio." Partial correlations, adjusted for BMI and percentage of bodyfat. b n = 59.*p < .05. **p < .01.
subjective ladder, the better was their self-rated health, die smallertheir WHR, the shorter their sleep latency, and the Lower their heartrate. Subjective SES was also associated with cortisol habituationusing an analysis of variance: Nonhabituators placed themselvessignificantly lower on the ladder (M - 5.5, SE - 0.47) than didlow reactors (M = 6.8, SE = 0.27) or habituators (M = 6.8,SE = 0.41), F(2, 56) = 3.4, p < .04. There were no significantdifferences in cortisol adaptation groups by objective SES, F(2,56) = 1.8, p = .17.
Because WHR may be a more sensitive indicator of stress anddisease among lean people (Larrson et al., 1984), we also exam-ined whether the correlation between subjective SES and WHRvaries across tertiles of BMI. As predicted, the partial correlationbetween subjective SES and WHR controlling for BMI and per-centage of body fat was significant only among the leanest women(r = —.30, p < .05), whereas there was no significant relationshipamong average weight and heavier women (rs = -.11).
More of the psychological variables were related to subjectivethan to objective SES as well. As shown in Table 2, higherobjective SES was related only to less pessimism and passivecoping, whereas subjective SES was significantly related to all ofthe psychological variables. The higher the women placed them-selves on the ladder, the lower was their chronic stress, subjectivestress, negative affect, pessimism, and passive coping and thegreater was their perceived control over life and active coping.
Associations With Subjective SES Controlling forObjective SES and Negative Affect
Hierarchical multiple regression analyses were performed on allvariables significantly related to the ladder to test whether subjec-tive SES showed independent associations with physical and psy-chological variables while controlling for objective SES and fornegative affectivity for self-reported outcomes. Although objective
This
doc
umen
t is c
opyr
ight
ed b
y th
e A
mer
ican
Psy
chol
ogic
al A
ssoc
iatio
n or
one
of i
ts a
llied
pub
lishe
rs.
This
arti
cle
is in
tend
ed so
lely
for t
he p
erso
nal u
se o
f the
indi
vidu
al u
ser a
nd is
not
to b
e di
ssem
inat
ed b
road
ly.

590 ADLER, EPEL, CASTELLAZZO, AND ICKOV1CS
SES was not related to most health outcomes, we entered it first toremove any association of subjective social standing that over-lapped with objective SES. Negative affectivity was entered forself-reported outcomes in Step 2, and the subjective SES rankingswere entered as the last step. Initial beta weights, changes in R2
after entering subjective SES, and total variance accounted for areshown in Table 3. Sleep latency was still significantly related toself-related health once objective SES and negative affect wereentered, but self-reported health was not. Heart rate was signifi-cantly predicted by subjective SES after controlling for objectiveSES, but WHR and cortisol habitation showed only marginalindependent associations (ps = .07 and .09, respectively).
Negative affect was strongly related to all of the psychologicalmeasures. Despite this, and its correlation of -.31 with subjectiveSES, the associations between subjective SES with chronic stress,pessimism, control over life, active coping, and passive coping allremained significant after controlling for objective SES and neg-ative affect. The association of subjective SES with subjectivestress no longer reached significance once objective SES andnegative affect were entered, most likely because of the strongrelationship between negative affect and subjective stress (r = .64,p < .0001).
Discussion
In the present sample, subjective SES, a simple one-item mea-sure of where individuals place themselves on the social hierarchy,was related to indicators of both physiological and psychologicalfunctioning. These results show that high subjective status isstrongly linked to psychological factors that may predispose indi-viduals to better health trajectories and shows some associations,although weaker, to current physiological functioning and self-reported health.
The results are consistent with the hypothesis that low subjec-tive standing is linked to greater stress. Low subjective SES could
either increase stress directly or increase vulnerability to the ef-fects of stress. Consistently high cortisol reactivity and abdominalfat distribution, particularly in lean women, reflect hyperactivity ofthe hypothalamic-pituitary-adrenal (HPA) axis, a system that re-sponds to perceptions of threat. Sleep latency, too, may be asso-ciated with HPA axis activity. Individuals with higher levels ofcortisol at night have more sleep problems (Van Cauter, Leproult,& Plat, 2000). Sleep difficulties or lack of sleep, in turn, mayincrease nocturnal cortisol and are associated with poorer healthstatus (Van Cauter & Spiegel, 1999). The findings of longer sleeplatency as well as greater activity of both the sympathetic and HPAaxis response systems being associated with lower ladder rankingsare consistent with there being greater chronic stress among thosewith lower subjective social standing.
Negative affect is associated with ladder ranking, and it is notpossible to determine the causal direction because of the cross-sectional nature of the data. The same is true for the other psy-chological factors (e.g., pessimism or low control over life couldeither reflect or influence subjective status). Although some recip-rocal causation is likely, there is reason to believe that subjectivesocial status is affecting both the mental and physical outcomes.Even when controlling for negative affect (which provides a veryconservative test), ladder rankings continued to show significantrelationships with indices of stress, including heart rate, sleeplatency, chronic stress, pessimism, perceived control, and coping.Self-perception of lower social status, although related to negativeaffect, has independent associations with physical and psycholog-ical outcomes, suggesting that the associations are neither spuriousrelationships resulting from reporting bias of those with negativeaffect nor wholly mediated by negative affect.
There are several limitations to the present research. The womenin this sample had at least a high school degree. This restrictionmay underestimate the impact of education on health, limiting ourability to draw conclusions about the relative associations of
Table 3Summaries of Hierarchical Regression Models for Subjective Social Status Predicting PhysicalHealth and Psychological Indices
Index
Initial beta weights
Step 1:objective
SES
Step 2:negative
affectivityStep 3:ladder
A^forladder
Overall R2
(adjusted)
PhysiologicalPhysical healthSleep latency'Heart rate"WHR
PsychologicalSubjective stressChronic stressPessimismControl over lifeActive copingPassive coping
.05-.17-.09-.10"
-.08-.13-.20**-.05
.10-.20*
-.31*.08
——
.64*
.47*
.44*-.35*-.21*
.48*
.10-.44**-.32*-.16
* -.06* -.24*** -.23*** .23**
.18** -.17*
.01
.15**
.09*
.02
.00
.05**
.04**
.04**
.03*
.02*
.09
.14
.06
.10
.39
.26
.26
.15
.06
.28
Note. Dash indicates that for physiological measures, negative affect was not controlled for. SES :
economic status; WHR = waist-to-hip ratio.* n — 59. b Body mass index and percentage of body fat were included in Step 1.*p<.05. **p < .01. ***/>< .001.
This
doc
umen
t is c
opyr
ight
ed b
y th
e A
mer
ican
Psy
chol
ogic
al A
ssoc
iatio
n or
one
of i
ts a
llied
pub
lishe
rs.
This
arti
cle
is in
tend
ed so
lely
for t
he p
erso
nal u
se o
f the
indi
vidu
al u
ser a
nd is
not
to b
e di
ssem
inat
ed b
road
ly.

SUBJECTIVE SOCIAL STATUS AND HEALTH 591
subjective and objective SES with health. Despite this, there wasstill substantial variation in education as well as in income withinthe sample, and significant associations were found. In addition,scores on the subjective ladder were similarly skewed toward theupper end. One study (Ostrove, Adler, Kuppermann, & Washing-ton, 2000) that had a wide range of income and education yieldedsimilar findings about the association of subjective versus objec-tive social status and self-reported health among White women. A
second limitation of this study is that the participants were allWhite women. Associations between SES and health may not bethe same for all ethnic groups, particularly Latinas and AfricanAmericans (see Ostrove et al., 2000). We also do not knowwhether similar findings would emerge for men and for eitherolder or younger people. Finally, the women in this sample wererecruited to be healthy. As a result, the range of health outcomeswas constricted. Despite the stringent exclusion criteria (e.g., hy-pertension, medication or alcohol use, smoking), we found signif-icant associations of both physical and psychological factors withladder rankings. These effects might well be magnified with a lesshealthy sample. Further research is needed to explore the impor-tance of subjective SES to healthy psychological and physiologicalfunctioning. The preliminary data reported here suggest that it is apromising concept that may broaden the definition, measurement,and understanding of social status.
References
Adler, N. E., Marmot, M., McEwen, B., & Stewart, J. (Eds.). (1999).Annals of the New York Academy of Sciences: Vol. 896. Socioeconomicstatus and health in industrial nations: Social, psychological, and bio-logical pathways. New York: New York Academy of Sciences.
Baxter, J. (1994). Is husband's class enough? Class location and classidentity in the United States, Sweden, Norway, and Australia. AmericanSociological Review, 59, 220-235.
Billings, D., Folkman, S., Acree, M., & Moskowitz, J. (2000). Coping andphysical health during caregiving: The roles of positive and negativeaffect. Journal of Personality and Social Psychology, 79. 131-142.
Brunner, E. J., Marmot, M. G., Nanchahal, K., Shipley, M. J., Stansfeld,S. A., Juneja, M.. & Albert, K. G. (1997). Social inequality in coronaryrisk: Central obesity and the metabolic syndrome. Evidence from theWhitehall H study. Diabetologia, 40, 1341-1349.
Buysse, D. J., Reynolds, C. F., ffl, Monk, T. H., Berman, S. R., & Kupfer,D. J. (1989). The Pittsburgh sleep quality index: A new instrument forpsychiatric practice and research. Psychiatry Research, 28, 193-213.
Calloway, C. W., Chumba, W. C., & Bouchard, C. (1988). Circumferences.In A. R. T. Lohman & R. Martorel (Eds.), Anthropometric standardiza-tion reference manual (pp. 39-55). Champaign, IL: Human Kinetics.
Cantril, H. (1943). Identification with social and economic class. Journalof Abnormal and Social Psychiatry, 38, 74-81.
Carver, C. S., Weintraub, J. K., & Scheier, M. F. (1989). Assessing copingstrategies: A theoretically based approach. Journal of Personality andSocial Psychology, 56, 267-283.
Centers, R. (1949). The psychology of social classes. New York: Russell &Russell.
Cohen, S., Kamarck, T., & Mermelstein, R. (1983). A global measure ofperceived stress. Journal of Health and Social Behavior, 24, 385—396.
Cohen, S.. Kaplan, G. A., & Salonen, J. (1999). The role of psychologicalcharacteristics in the relation between socioeconomic status and per-ceived health. Journal of Applied Social Psychology, 29, 445-468.
Dement, W. C. (1993). It's time to wake up to the importance of sleepdisorders. JAMA, 269(12), 1548-1549.
Ekehammar, B., Sidanius, J., & Nilsson, I. (1987). Social status: Constructand external validity. Journal of Social Psychology, 127, 473-481.
Epel, E., McEwen, B., & Ickovics, J. (1998). Embodying psychologicalthriving: Physical thriving in response to stress. Journal of SocialIssues, 54, 301-322.
Epel, E., McEwen, B., Seeman, T., Matthews, K., Castellazzo, G.,Brownell, K., Bell, J., & Ickovics, J. (2000). Stress and body shape:Consistently greater stress-induced cortisol reactivity among womenwith abdominal fat. Psychosomatic Medicine, 62, 623-632.
Essex, M., & Klein, M. (1989). The importance of the self-concept andcoping responses in explaining physical health status and depressionamong older women. Journal of Aging and Health, J, 327-348.
Folsom, A., Kaye, S., Sellers, T., Hong, C, Cerhan, J., Potter, J., & Prineas,R. (1993). Body fat distribution and 5-year risk of death in older women.JAMA, 269, 483-487.
Fox, A. J., Goldblatt, P. O., & Jones, D. R. (1985). Social class mortalitydifferentials: Artifact, selection, or life circumstances? Journal of Epi-demiology and Community Health, 39, 1-8.
Georges, E., Mueller, W. H., & Wear, M. L. (1993). Body fat distributionin men and women of the Hispanic health and nutrition examinationsurvey of the United States: Associations with behavioral variables.Annals of Human Biology, 20, 275-291.
Greenland, P., Daviglus, M., Dyer, A., Liu, K., Huang, C., Goldberger, J.,& Stamler, J. (1999). Resting heart rate is a risk factor for cardiovascularand noncardiovascular mortality: The Chicago Heart Association Detec-tion Project in Industry. American Journal of Epidemiology, 149, 853-862.
Haan, M., Kaplan, G., & Syme, S. L. (1989). Socioeconomic status andhealth: Old observations and new thoughts. In J. Bunker, D. Gomby, &B. Kehrer (Eds.), Pathways to health: The role of social factors (pp.76-135). Menlo Park, CA: Henry J. Kaiser Family Foundation.
Hall, M., Baum, A., Buysse, D. J., Prigerson, H. G., Kupfer, D. J., &Reynolds, C. F., HI. (1998). Sleep as a mediator of the stress-immunerelationship. Psychosomatic Medicine, 60, 48-51.
Idler. E. L., & Angel, R. J. (1990). Self-rated health and mortality in theNHANES-I cpidemiologic follow-up study. American Journal of PublicHealth, 80, 446-452.
Idler, E. L., & Benyamini, Y. (1997). Self-rated health and mortality: Areview of twenty-seven community studies. Journal of Health andSocial Behavior. 38, 21-37.
Jackman, M. R., & Jackman, R. W. (1973). An interpretation of the relationbetween objective and subjective social status. American SociologicalReview, 38, 569-582.
Kaye, S., Folsom, A., Jacobs, D., Hughes, G., & Flack, J. (1993). Psycho-logical correlates of body fat distribution in Black and White youngadults. International Journal of Obesity, 17, 271-277.
Kaye, S., Folsom, A., Prineas, R., Potter, J., & Gapstur, S. (1990). Theassociation of body fat distribution with lifestyle and reproductive fac-tors in a population study of post-menopausal women. InternationalJournal of Obesity, 14, 583-591.
Kilpatrick, F., & Cantril, H. (1960). Self-anchoring scaling: A measure ofindividuals' unique reality worlds. Journal of Individual Psychology, 16,158-173.
Kirschbaum, C., & Hellhammer, D. (1989). Salivary cortisol in psychobi-ological research: An overview. Neuropsychobiology, 22, 150-169.
Kirschbaum, C., Prubner, J., Stone, A., Federenko, I., Gaab, J., Lintz, D.,Schommer, N., & Hellhammer, D. (1995). Persistent high cortisol re-sponses to repeated psychological stress in a subpopulation of healthymen. Psychosomatic Medicine, 57, 468-474.
Kluegel, J. R., Singleton, R., Jr., & Starnes, C. E. (1977). Subjective classidentification: A multiple indicator approach. American SociologicalReview, 42, 599-611.
Lachman, M. E., & Weaver, S. L. (1998). Sociodemographic variations inthe sense of control by domain: Findings from the MacArthur studies ofmidlife. Psychology and Aging, 13, 553-562.
Larsson, B., Seidell, J., Svardsudd, K., Welin, L., Tiblin, G., & Bjorntorp,
This
doc
umen
t is c
opyr
ight
ed b
y th
e A
mer
ican
Psy
chol
ogic
al A
ssoc
iatio
n or
one
of i
ts a
llied
pub
lishe
rs.
This
arti
cle
is in
tend
ed so
lely
for t
he p
erso
nal u
se o
f the
indi
vidu
al u
ser a
nd is
not
to b
e di
ssem
inat
ed b
road
ly.

592 ADLER, EPEL, CASTELLAZZO, AND ICKOVICS
P. (1989). Obesity, adipose tissue distribution and health in men. Appe-tite, 13, 37-44.
Larsson, B., Svardsudd, L., Welin, L., Wilhelmsen, L., Bjorntorp, P., &Tibblin, G. (1984). Abdominal adipose tissue distribution, obesity, andrisk of cardiovascular disease and death: A 13-year follow-up of partic-ipants in the study of men bom in 1913. British Medical Journal, 2S8,1401-1404.
Lehrer, P. (1998). Emotionally triggered asthma: A review of researchliterature and some hypotheses for self-regulation. Applied Psychophys-iology and Biofeedback, I, 13-41.
McEwen, B. S. (1998). Protective and damaging effects of stress media-tors. New England Journal of Medicine, 338, 171-179.
Medical Outcomes Trust. (1994). How to score the SF-36 health survey.Boston: Author.
Moore, P. J., Adler, N. E., Williams, D. R., & Jackson, J. S. (2000).Socioeconomic status and health: The role of sleep. Manuscript submit-ted for publication.
Mossey, J. M., & Shapiro, E. (1982). Self-rated health: A predictor ofmortality among the elderly. American Journal of Public Health, 72,800-808.
Ostrove, J. M., Adler, N. E., Kupperrnann, M., & Washington, A. E.(2000). Objective and subjective assessments of socioeconomic statusand their relationship to self-rated health in an ethnically diverse sampleof pregnant women. Health Psychology, 19, 613-618.
Pickering, T. (1999). Cardiovascular pathways: Socioeconomic status andstress effects on hypertension and cardiovascular function. In N. E.Adler, M. Marmot, B., McEwen, & J. Stewart (Eds.), Annals of the NewYork Academy of Sciences: Vol. 896. Socioeconomic status and health inindustrial nations: Social, psychological, and biological pathways (pp.262-277). New York: New York Academy of Sciences.
Rebuffe-Scrive, M., Walsh, U. A., McEwen, B., & Rodin, J. (1992). Effectof chronic stress and exogenous glucocorticoids on regional fat distri-bution and metabolism. Physiology and Behavior, 52, 583-590.
Reunanen, A., Karjalainen, J., Ristola, P., Heliovaara, M., Knekt, P., &Aromaa, A. (2000). Heart rate and mortality. Journal of Internal Med-icine, 247, 231-239.
Rosmond, R. D., Lapidus, L., & Bjorntorp, P. (1996). The influence ofoccupational and social factors on obesity and body fat distribution inmiddle-aged men. International Journal of Obesity, 20, 599-607.
Sapolsky, R. (1982). The endocrine stress-response and social status in thewild baboon. Hormones and Behavior, IS, 279-292.
Scheier, M. F., & Carver, C. S. (1985). Optimism, coping, and health:Assessment and implications of generalized outcome expectations.Health Psychology, 4, 219-247.
Segovia, J., Bartlett, R. P., & Edwards, A. C. (1989). The associationbetween self-assessed health status and individual health practices. Ca-nadian Journal of Public Health. Kevut Canadienne de Same Puk-lique, SO, 32-37.
Seidell, J. (1991). Environmental influences on regional fat distribution.International Journal of Obesity, 15, 31-35.
Sennett, R., & Cobb, J. (1972). The hidden injuries of class. New York:Random House.
Shively, C. A., & Clarkson, T. B. (1988). Regional obesity and coronaryartery atherosclerosis in females: A nonhuman primate model. ActaMedica Scandinavica Supplementary 723, 71-78.
Sobal, J., & Stunkard, A. (1989). Socioeconomic status and obesity: Areview of the literature. Psychological Bulletin, 105, 260-275.
Stanton, A., Danoff-Burg, S., Cameron, C., & Ellis, A. (1994). Copingthrough emotional approach: Problems of conceptualization and con-founding. Journal of Personality and Social Psychology, 66, 350-362.
Taylor, S., & Seeman, T. E. (1999). Psychosocial resources and theSES-health relationship. In N. E. Adler, M. Marmot, B. McEwen, & J.Stewart (Eds.), Annals of the New York Academy of Sciences: Vol. 896.Socioeconomic status and health in industrial nations: Social, psycho-logical, and biological pathways (pp. 210-225). New York: New YorkAcademy of Sciences.
Van Cauter, E., Leproult, R., & Plat, L. (2000). Age-related changes inslow wave sleep and REM sleep and relationship with growth hormoneand cortisol levels in healthy men. JAMA, 284, 861-868.
Van Cauter, E., & Spiegel, K. (1999). Sleep as a mediator of the relation-ship between socioeconomic status and health: A hypothesis. In N. E.Adler, M. Marmot, B. McEwen, & J. Stewart (Eds.), Annals of the NewYork Academy of 'Sciences: Vol. 896. Socioeconomic status and health inindustrial nations: Social, psychological, and biological pathways (pp.254-261). New York: New York Academy of Sciences.
Ware, J., & Sherboume, C. D. (1992). The MOS 36-item short-form healthsurvey (SF-36). Medical Care, 30, 473-483.
Watson, D., Clark, L., & Tellegen, A. (1988). Development and validationof brief measures of positive and negative affect: The PANAS scales.Journal of Personality and Social Psychology, 54, 1063-1070.
Wheaton, B. (1994). Sampling the stress universe. In W. R. Avison & I. H.Gotlib (Eds.), Stress and mental health: Contemporary issues and pros-pects for the future (pp. 77-114). New York: Plenum.
Wilkinson, R. G. (1999). Health, hierarchy, and social anxiety. In N. E.Adler, M. Marmot, B. McEwen, & J. Stewart (Eds.), Annals of the NewYork Academy of Sciences: Vol. 896. Socioeconomic status and health inindustrial nations: Social, psychological, and biological pathways (pp.48-63). New York: New York Academy of Sciences.
This
doc
umen
t is c
opyr
ight
ed b
y th
e A
mer
ican
Psy
chol
ogic
al A
ssoc
iatio
n or
one
of i
ts a
llied
pub
lishe
rs.
This
arti
cle
is in
tend
ed so
lely
for t
he p
erso
nal u
se o
f the
indi
vidu
al u
ser a
nd is
not
to b
e di
ssem
inat
ed b
road
ly.