relative earthquake hazard maps - oregon department of geology
TRANSCRIPT
DallasDallas
Hood RiverHood River
McMinnville-McMinnville-Dayton-Dayton-LafayetteLafayette
Monmouth-Monmouth-IndependenceIndependence
Newberg-DundeeNewberg-Dundee
SandySandy
Sheridan-Sheridan-WillaminaWillamina
St. Helens-St. Helens-Columbia City-Columbia City-ScappooseScappoose
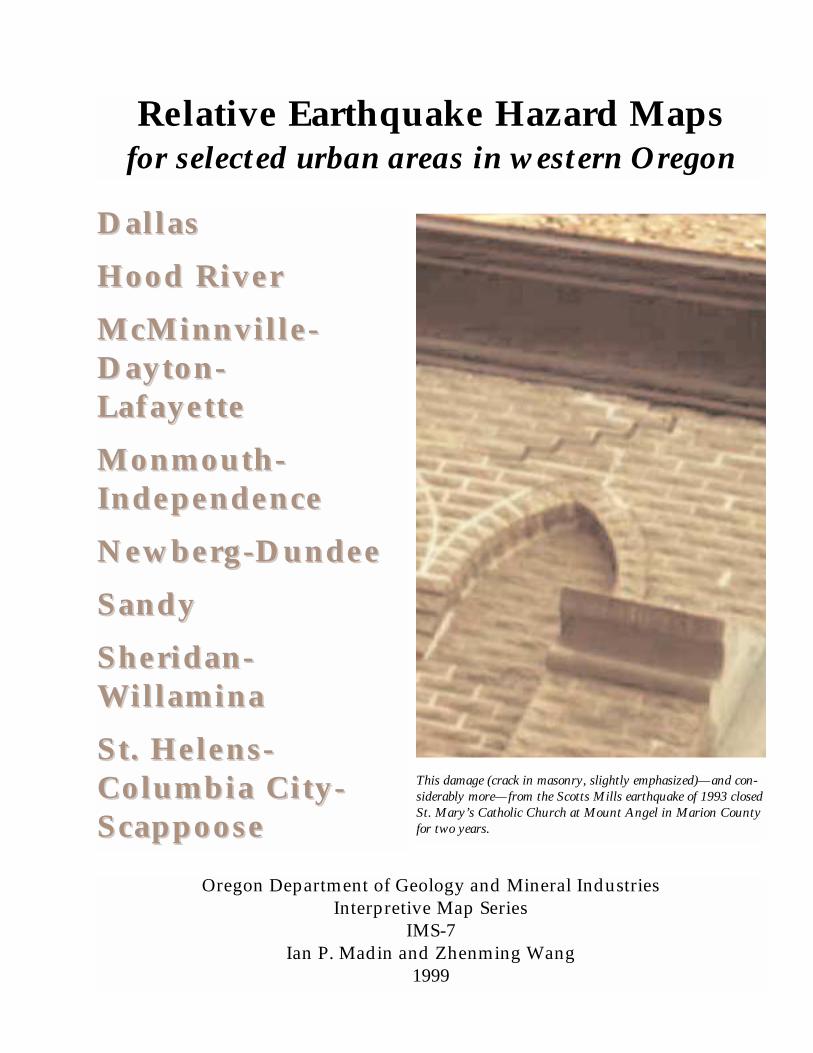
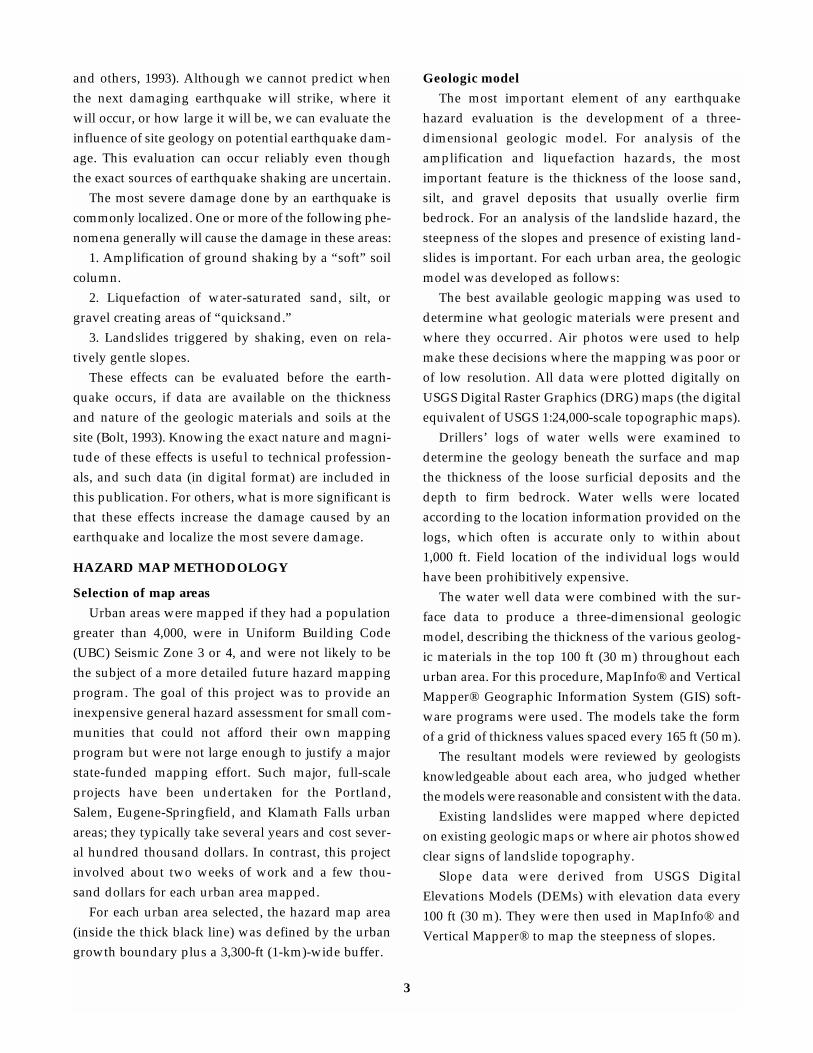
Relative Earthquake Hazard Mapsfor selected urban areas in western Oregon
Oregon Department of Geology and Mineral IndustriesInterpretive Map Series
IMS-7Ian P. Madin and Zhenming Wang
1999
This damage (crack in masonry, slightly emphasized)—and con-siderably more—from the Scotts Mills earthquake of 1993 closedSt. Mary’s Catholic Church at Mount Angel in Marion Countyfor two years.

STATE OF OREGON
DEPARTMENT OF GEOLOGY AND MINERAL INDUSTRIES
Suite 965, 800 NE Oregon St., #28
Portland, Oregon 97232
Interpretive Map Series
IMS–7
Relative Earthquake Hazard Mapsfor Selected Urban Areas in Western Oregon
Dallas, Hood River, McMinnville-Dayton-Lafayette, Monmouth-
Independence, Newberg-Dundee, Sandy, Sheridan-Willamina,
St. Helens-Columbia City-Scappoose
By
Ian P. Madin and Zhenming Wang
Oregon Department of Geology and Mineral Industries
1999
Funded by the State of Oregon
and the U.S. Geological Survey (USGS), Department of the Interior,
under USGS award number 1434–97–GR–03118
CONTENTSPage
Introduction . . . . . . . . . . . . . . . . . . . . . . . . . . . . . . . . . . . . . . . . . . . . . . . . . . . . . . . . . . . . . . . . . . . . . . . . . . . . . . . . . . . . . . . . . . .1Earthquake Hazard . . . . . . . . . . . . . . . . . . . . . . . . . . . . . . . . . . . . . . . . . . . . . . . . . . . . . . . . . . . . . . . . . . . . . . . . . . . . . . . . . . . . .2Earthquake Effects . . . . . . . . . . . . . . . . . . . . . . . . . . . . . . . . . . . . . . . . . . . . . . . . . . . . . . . . . . . . . . . . . . . . . . . . . . . . . . . . . . . . . .2Hazard Map Methodology . . . . . . . . . . . . . . . . . . . . . . . . . . . . . . . . . . . . . . . . . . . . . . . . . . . . . . . . . . . . . . . . . . . . . . . . . . . . . . .3
Selection of Map Areas . . . . . . . . . . . . . . . . . . . . . . . . . . . . . . . . . . . . . . . . . . . . . . . . . . . . . . . . . . . . . . . . . . . . . . . . . . . . . . . .3Geologic Model . . . . . . . . . . . . . . . . . . . . . . . . . . . . . . . . . . . . . . . . . . . . . . . . . . . . . . . . . . . . . . . . . . . . . . . . . . . . . . . . . . . . . .3Hazard Analysis . . . . . . . . . . . . . . . . . . . . . . . . . . . . . . . . . . . . . . . . . . . . . . . . . . . . . . . . . . . . . . . . . . . . . . . . . . . . . . . . . . . . .4
Ground Shaking Amplification . . . . . . . . . . . . . . . . . . . . . . . . . . . . . . . . . . . . . . . . . . . . . . . . . . . . . . . . . . . . . . . . . . . . . . .4Liquefaction . . . . . . . . . . . . . . . . . . . . . . . . . . . . . . . . . . . . . . . . . . . . . . . . . . . . . . . . . . . . . . . . . . . . . . . . . . . . . . . . . . . . . .4Earthquake-Induced Landslides . . . . . . . . . . . . . . . . . . . . . . . . . . . . . . . . . . . . . . . . . . . . . . . . . . . . . . . . . . . . . . . . . . . . . .5
Relative Earthquake Hazard Maps . . . . . . . . . . . . . . . . . . . . . . . . . . . . . . . . . . . . . . . . . . . . . . . . . . . . . . . . . . . . . . . . . . . . . . . .5Use of the Relative Earthquake Hazard Maps . . . . . . . . . . . . . . . . . . . . . . . . . . . . . . . . . . . . . . . . . . . . . . . . . . . . . . . . . . . . . . .6
Emergency Response and Hazard Mitigation . . . . . . . . . . . . . . . . . . . . . . . . . . . . . . . . . . . . . . . . . . . . . . . . . . . . . . . . . . . . . .6Land Use Planning and Seismic Retrofit . . . . . . . . . . . . . . . . . . . . . . . . . . . . . . . . . . . . . . . . . . . . . . . . . . . . . . . . . . . . . . . . . .6Lifelines . . . . . . . . . . . . . . . . . . . . . . . . . . . . . . . . . . . . . . . . . . . . . . . . . . . . . . . . . . . . . . . . . . . . . . . . . . . . . . . . . . . . . . . . . . . .6Engineering . . . . . . . . . . . . . . . . . . . . . . . . . . . . . . . . . . . . . . . . . . . . . . . . . . . . . . . . . . . . . . . . . . . . . . . . . . . . . . . . . . . . . . . . .6Relative Hazard . . . . . . . . . . . . . . . . . . . . . . . . . . . . . . . . . . . . . . . . . . . . . . . . . . . . . . . . . . . . . . . . . . . . . . . . . . . . . . . . . . . . . .6
Urban Area Summaries . . . . . . . . . . . . . . . . . . . . . . . . . . . . . . . . . . . . . . . . . . . . . . . . . . . . . . . . . . . . . . . . . . . . . . . . . . . . . . . . . .8Dallas . . . . . . . . . . . . . . . . . . . . . . . . . . . . . . . . . . . . . . . . . . . . . . . . . . . . . . . . . . . . . . . . . . . . . . . . . . . . . . . . . . . . . . . . . . . . . .9Hood River . . . . . . . . . . . . . . . . . . . . . . . . . . . . . . . . . . . . . . . . . . . . . . . . . . . . . . . . . . . . . . . . . . . . . . . . . . . . . . . . . . . . . . . . .10McMinnville-Dayton-Lafayette . . . . . . . . . . . . . . . . . . . . . . . . . . . . . . . . . . . . . . . . . . . . . . . . . . . . . . . . . . . . . . . . . . . . . . . .11Monmouth-Independence . . . . . . . . . . . . . . . . . . . . . . . . . . . . . . . . . . . . . . . . . . . . . . . . . . . . . . . . . . . . . . . . . . . . . . . . . . . . .12Newberg-Dundee . . . . . . . . . . . . . . . . . . . . . . . . . . . . . . . . . . . . . . . . . . . . . . . . . . . . . . . . . . . . . . . . . . . . . . . . . . . . . . . . . . .13Sandy . . . . . . . . . . . . . . . . . . . . . . . . . . . . . . . . . . . . . . . . . . . . . . . . . . . . . . . . . . . . . . . . . . . . . . . . . . . . . . . . . . . . . . . . . . . . .14Sheridan-Willamina . . . . . . . . . . . . . . . . . . . . . . . . . . . . . . . . . . . . . . . . . . . . . . . . . . . . . . . . . . . . . . . . . . . . . . . . . . . . . . . . . .15St. Helens-Columbia City-Scappoose . . . . . . . . . . . . . . . . . . . . . . . . . . . . . . . . . . . . . . . . . . . . . . . . . . . . . . . . . . . . . . . . . . . .16
Acknowledgments . . . . . . . . . . . . . . . . . . . . . . . . . . . . . . . . . . . . . . . . . . . . . . . . . . . . . . . . . . . . . . . . . . . . . . . . . . . . . . . . . . . . .17Bibliography . . . . . . . . . . . . . . . . . . . . . . . . . . . . . . . . . . . . . . . . . . . . . . . . . . . . . . . . . . . . . . . . . . . . . . . . . . . . . . . . . . . . . . . . . .17Appendix . . . . . . . . . . . . . . . . . . . . . . . . . . . . . . . . . . . . . . . . . . . . . . . . . . . . . . . . . . . . . . . . . . . . . . . . . . . . . . . . . . . . . . . . . . . . .19
1. Generalized Descriptions of Geologic Units Used in This Report . . . . . . . . . . . . . . . . . . . . . . . . . . . . . . . . . . . . . . . . . . .202. Data Table Showing Shear-Wave Velocities Measured for Geologic Units in Each Community . . . . . . . . . . . . . . . . . .213. Collection and Use of Shear-Wave Velocity Data . . . . . . . . . . . . . . . . . . . . . . . . . . . . . . . . . . . . . . . . . . . . . . . . . . . . . . . .23
Figures1. Plate-Tectonic Map of the Pacific Northwest . . . . . . . . . . . . . . . . . . . . . . . . . . . . . . . . . . . . . . . . . . . . . . . . . . . . . . . . . . . .2A-1. Composited SH-Wave Refraction Profile at Site McMin03 . . . . . . . . . . . . . . . . . . . . . . . . . . . . . . . . . . . . . . . . . . . . . .23A-2. Arrival Time Curves of the Refractions at Site McMin03 . . . . . . . . . . . . . . . . . . . . . . . . . . . . . . . . . . . . . . . . . . . . . . .23A-3. Shear-Wave Velocity Model Interpreted from Refraction Data at Site McMin03 . . . . . . . . . . . . . . . . . . . . . . . . . . . .24
Tables1. UBC-97 Soil Profile Types . . . . . . . . . . . . . . . . . . . . . . . . . . . . . . . . . . . . . . . . . . . . . . . . . . . . . . . . . . . . . . . . . . . . . . . . . . . .42. Liquefaction Hazard Categories . . . . . . . . . . . . . . . . . . . . . . . . . . . . . . . . . . . . . . . . . . . . . . . . . . . . . . . . . . . . . . . . . . . . . . .53. Earthquake-Induced Landslide Hazard Zones . . . . . . . . . . . . . . . . . . . . . . . . . . . . . . . . . . . . . . . . . . . . . . . . . . . . . . . . . . .54. Hazard Zone Values in the Relative Hazard Maps . . . . . . . . . . . . . . . . . . . . . . . . . . . . . . . . . . . . . . . . . . . . . . . . . . . . . . .5A-1. Measured Shear-Wave Velocities . . . . . . . . . . . . . . . . . . . . . . . . . . . . . . . . . . . . . . . . . . . . . . . . . . . . . . . . . . . . . . . . . . .21
CD-ROM Disk with Digital Data . . . . . . . . . . . . . . . . . . . . . . . . . . . . . . . . . . . . . . . . . . . . . . . . . . . . . . . .Separately in Package
NOTICE
The results and conclusions of this report are necessarily based on limited geologic and geo-
physical data. The hazards and data are described in this report. At any given site in any map
area, site-specific data could give results that differ from those shown on this map. This report
cannot replace site-specific investigations. Some appropriate uses are discussed in the report.
The hazards of an individual site should be assessed through geotechnical or engineering geol-
ogy investigation by qualified practitioners.
ii
INTRODUCTION
Since the late 1980s, the understanding of earth-quake hazards in the Pacific Northwest has signifi-cantly increased. It is now known that Oregon mayexperience damaging earthquakes much larger thanany that have been recorded in the past (Atwater,1987; Heaton and Hartzell, 1987; Weaver andShedlock, 1989; Yelin and others, 1994). Planning theresponse to earthquake disasters and strengtheninghomes, buildings, and lifelines for power, water, com-munication, and transportation can greatly reduce theimpact of an earthquake. These measures should bebased on the best possible forecast of the amount anddistribution of future earthquake damage. Earthquakehazard maps such as those in this publication providea basis for such a forecast.
The amount of damage sustained by a buildingduring a strong earthquake is difficult to predict anddepends on the size, type, and location of the earth-quake, the characteristics of the soils at the buildingsite, and the characteristics of the building itself. Atpresent, it is not possible to accurately forecast thelocation or size of future earthquakes. It is possible,however, to predict the behavior of the soil1 at anyparticular site. In fact, in many major earthquakesaround the world, a large amount of the damage hasbeen due to the behavior of the soil.
The maps in this report identify those areas inselected Oregon communities that will be at higher
risk, relative to other areas, during a damaging earth-quake. The analysis is based on the behavior of thesoils and does not depict the absolute earthquake haz-ard at any particular site. It is quite possible that, forany given earthquake, damage in even the highesthazard areas will be light. On the other hand, duringan earthquake that is stronger or much closer thanour design parameters, even the lowest hazard cate-gories could experience severe damage.
This report includes a nontechnical description ofhow the maps were made and how they might beused. More technical information on the mapmakingmethods is contained in the Appendix.
The printed report includes paper-copy RelativeEarthquake Hazard Maps for each urban area, overlaid onU.S. Geological Survey topographic base maps at thescale of 1:24,000. In addition, for each area, three individ-ual hazard component maps are included as digital datafiles on CD-ROM. The digital data are in two formats:(1) high-resolution -.JPG files (bitmap images) that canbe viewed with many image viewers or word proces-sors and (2) MapInfo® and ArcView® GIS vector files.
These maps were produced by the OregonDepartment of Geology and Mineral Industries and werefunded by the State of Oregon and the U.S. GeologicalSurvey (USGS), Department of the Interior, under USGSaward #1434-97-GR-03118. The views and conclusionscontained in this document are those of the authors andshould not be interpreted as necessarily representingthe official policies, either expressed or implied, of theU.S. Government.
1
IMS–7Relative Earthquake Hazard Maps
for Selected Urban Areas in Western Oregon
Dallas, Hood River, McMinnville-Dayton-Lafayette, Monmouth-
Independence, Newberg-Dundee, Sandy, Sheridan-Willamina,
St. Helens-Columbia City-Scappoose
By Ian P. Madin and Zhenming Wang, Oregon Department of Geology and Mineral Industries
This is one of four companion publications presenting earthquake hazard maps for small to intermediate-sized communities in western Oregon. Each publication includes a geographic grouping of urban areas.
1 In this report, “soil” means the relatively loose and soft geologicmaterial that typically overlies solid bedrock in western Oregon.
EARTHQUAKE HAZARD
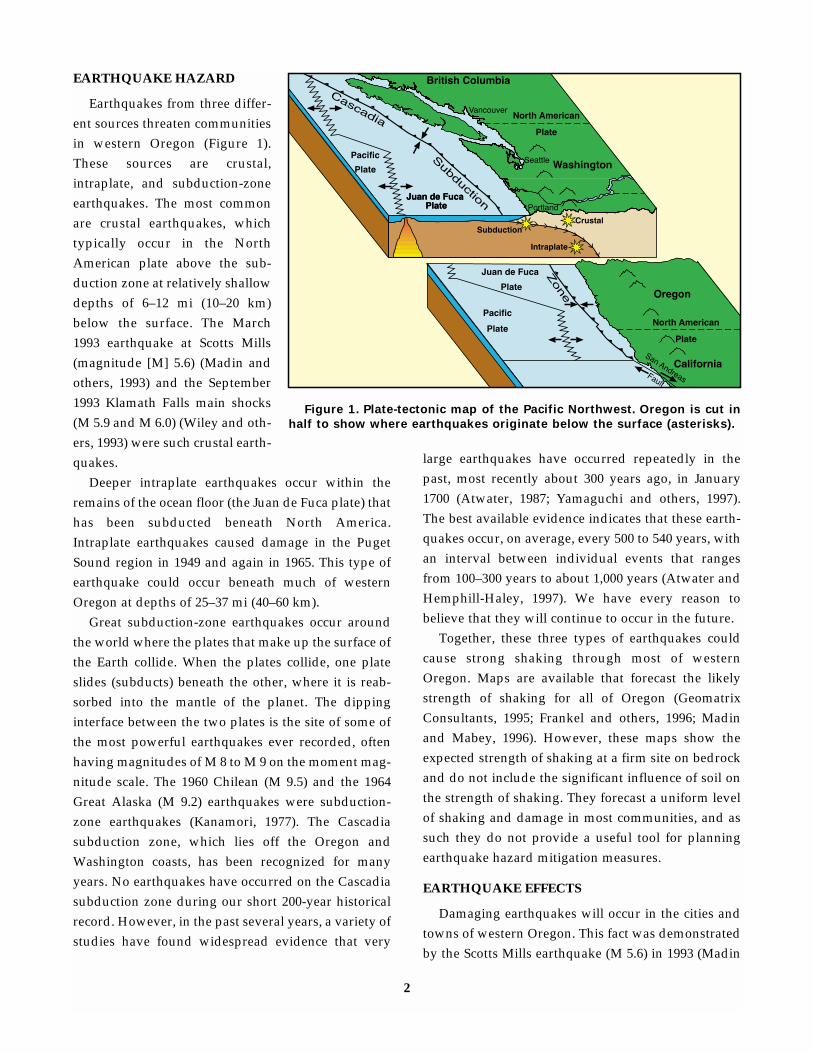
Earthquakes from three differ-ent sources threaten communitiesin western Oregon (Figure 1).These sources are crustal,intraplate, and subduction-zoneearthquakes. The most commonare crustal earthquakes, whichtypically occur in the NorthAmerican plate above the sub-duction zone at relatively shallowdepths of 6–12 mi (10–20 km)below the surface. The March1993 earthquake at Scotts Mills(magnitude [M] 5.6) (Madin andothers, 1993) and the September1993 Klamath Falls main shocks(M 5.9 and M 6.0) (Wiley and oth-ers, 1993) were such crustal earth-quakes.
Deeper intraplate earthquakes occur within theremains of the ocean floor (the Juan de Fuca plate) thathas been subducted beneath North America.Intraplate earthquakes caused damage in the PugetSound region in 1949 and again in 1965. This type ofearthquake could occur beneath much of westernOregon at depths of 25–37 mi (40–60 km).
Great subduction-zone earthquakes occur aroundthe world where the plates that make up the surface ofthe Earth collide. When the plates collide, one plateslides (subducts) beneath the other, where it is reab-sorbed into the mantle of the planet. The dippinginterface between the two plates is the site of some ofthe most powerful earthquakes ever recorded, oftenhaving magnitudes of M 8 to M 9 on the moment mag-nitude scale. The 1960 Chilean (M 9.5) and the 1964Great Alaska (M 9.2) earthquakes were subduction-zone earthquakes (Kanamori, 1977). The Cascadiasubduction zone, which lies off the Oregon andWashington coasts, has been recognized for manyyears. No earthquakes have occurred on the Cascadiasubduction zone during our short 200-year historicalrecord. However, in the past several years, a variety ofstudies have found widespread evidence that very
large earthquakes have occurred repeatedly in thepast, most recently about 300 years ago, in January1700 (Atwater, 1987; Yamaguchi and others, 1997).The best available evidence indicates that these earth-quakes occur, on average, every 500 to 540 years, withan interval between individual events that rangesfrom 100–300 years to about 1,000 years (Atwater andHemphill-Haley, 1997). We have every reason tobelieve that they will continue to occur in the future.
Together, these three types of earthquakes couldcause strong shaking through most of westernOregon. Maps are available that forecast the likelystrength of shaking for all of Oregon (GeomatrixConsultants, 1995; Frankel and others, 1996; Madinand Mabey, 1996). However, these maps show theexpected strength of shaking at a firm site on bedrockand do not include the significant influence of soil onthe strength of shaking. They forecast a uniform levelof shaking and damage in most communities, and assuch they do not provide a useful tool for planningearthquake hazard mitigation measures.
EARTHQUAKE EFFECTS
Damaging earthquakes will occur in the cities andtowns of western Oregon. This fact was demonstratedby the Scotts Mills earthquake (M 5.6) in 1993 (Madin
2
Figure 1. Plate-tectonic map of the Pacific Northwest. Oregon is cut inhalf to show where earthquakes originate below the surface (asterisks).
and others, 1993). Although we cannot predict whenthe next damaging earthquake will strike, where itwill occur, or how large it will be, we can evaluate theinfluence of site geology on potential earthquake dam-age. This evaluation can occur reliably even thoughthe exact sources of earthquake shaking are uncertain.
The most severe damage done by an earthquake iscommonly localized. One or more of the following phe-nomena generally will cause the damage in these areas:
1. Amplification of ground shaking by a “soft” soilcolumn.
2. Liquefaction of water-saturated sand, silt, orgravel creating areas of “quicksand.”
3. Landslides triggered by shaking, even on rela-tively gentle slopes.
These effects can be evaluated before the earth-quake occurs, if data are available on the thicknessand nature of the geologic materials and soils at thesite (Bolt, 1993). Knowing the exact nature and magni-tude of these effects is useful to technical profession-als, and such data (in digital format) are included inthis publication. For others, what is more significant isthat these effects increase the damage caused by anearthquake and localize the most severe damage.
HAZARD MAP METHODOLOGY
Selection of map areasUrban areas were mapped if they had a population
greater than 4,000, were in Uniform Building Code(UBC) Seismic Zone 3 or 4, and were not likely to bethe subject of a more detailed future hazard mappingprogram. The goal of this project was to provide aninexpensive general hazard assessment for small com-munities that could not afford their own mappingprogram but were not large enough to justify a majorstate-funded mapping effort. Such major, full-scaleprojects have been undertaken for the Portland,Salem, Eugene-Springfield, and Klamath Falls urbanareas; they typically take several years and cost sever-al hundred thousand dollars. In contrast, this projectinvolved about two weeks of work and a few thou-sand dollars for each urban area mapped.
For each urban area selected, the hazard map area(inside the thick black line) was defined by the urbangrowth boundary plus a 3,300-ft (1-km)-wide buffer.
Geologic modelThe most important element of any earthquake
hazard evaluation is the development of a three-dimensional geologic model. For analysis of theamplification and liquefaction hazards, the mostimportant feature is the thickness of the loose sand,silt, and gravel deposits that usually overlie firmbedrock. For an analysis of the landslide hazard, thesteepness of the slopes and presence of existing land-slides is important. For each urban area, the geologicmodel was developed as follows:
The best available geologic mapping was used todetermine what geologic materials were present andwhere they occurred. Air photos were used to helpmake these decisions where the mapping was poor orof low resolution. All data were plotted digitally onUSGS Digital Raster Graphics (DRG) maps (the digitalequivalent of USGS 1:24,000-scale topographic maps).
Drillers’ logs of water wells were examined todetermine the geology beneath the surface and mapthe thickness of the loose surficial deposits and thedepth to firm bedrock. Water wells were locatedaccording to the location information provided on thelogs, which often is accurate only to within about1,000 ft. Field location of the individual logs wouldhave been prohibitively expensive.
The water well data were combined with the sur-face data to produce a three-dimensional geologicmodel, describing the thickness of the various geolog-ic materials in the top 100 ft (30 m) throughout eachurban area. For this procedure, MapInfo® and VerticalMapper® Geographic Information System (GIS) soft-ware programs were used. The models take the formof a grid of thickness values spaced every 165 ft (50 m).
The resultant models were reviewed by geologistsknowledgeable about each area, who judged whetherthe models were reasonable and consistent with the data.
Existing landslides were mapped where depictedon existing geologic maps or where air photos showedclear signs of landslide topography.
Slope data were derived from USGS DigitalElevations Models (DEMs) with elevation data every100 ft (30 m). They were then used in MapInfo® andVertical Mapper® to map the steepness of slopes.
3

The details of the local geology and datasources for each urban area are described in the“Urban Area Summaries” section of this report.
Hazard analysisGround shaking amplification
The soils and soft sedimentary rocksnear the surface can modify bedrockground shaking caused by an earthquake.This modification can increase (ordecrease) the strength of shaking or change the fre-quency of the shaking. The nature of the modificationsis determined by the thickness of the geologic materi-als and their physical properties, such as stiffness.
This amplification study used a method first devel-oped for the National Earthquake Hazard ReductionProgram (NEHRP) and published by the FederalEmergency Management Agency (FEMA, 1995). Thismethod was adopted in the 1997 version of theUniform Building Code (ICBO [International Confer-ence of Building Officials], 1997) and will henceforthbe referred to as the UBC-97 methodology. The UBC-97 methodology defines six soil categories that arebased on average shear-wave velocity in the upper 100ft (30 m) of the soil column. The shear-wave velocity isthe speed with which a particular type of groundvibration travels through a material, and can be mea-sured directly by several techniques. The six soil cate-gories are Hard Rock (A), Rock (B), Very Dense Soiland Soft Rock (C), Stiff Soil (D), Soft Soil (E), andSpecial Soils (F). Category F soils are very soft soilsrequiring site-specific evaluation and are not mappedin this study, because limited funding precluded anysite visits.
For the amplification hazard component maps, wecollected shear-wave velocity data (see Appendix fordata and methods) at one or more sites in each urbanarea and used our geologic model to calculate theaverage shear-wave velocity of each 165-ft (50-m) gridcell in the model. We then assigned a soil category,using the relationships in Table 1.
According to the UBC-97 methodology, none of theurban areas in this study had Type A soils. UBC-97soil category maps for each urban area are presentedin the accompanying digital map set.
LiquefactionLiquefaction is a phenomenon in which shaking of
a saturated soil causes its material properties tochange so that it behaves as a liquid. In qualitativeterms, the cause of liquefaction was described verywell by Seed and Idriss (1982): “If a saturated sand issubjected to ground vibrations, it tends to compactand decrease in volume; if drainage is unable to occur,the tendency to decrease in volume results in anincrease in pore water pressure, and if the pore waterpressure builds up to the point at which it is equal tothe overburden pressure, the effective stress becomeszero, the sand loses its strength completely, and itdevelops a liquefied state.”
Soils that liquefy tend to be young, loose, granularsoils that are saturated with water (National ResearchCouncil, 1985). Unsaturated soils will not liquefy, butthey may settle. If an earthquake induces liquefaction,several things can happen: The liquefied layer andeverything lying on top of it may move downslope.Alternatively, it may oscillate with displacementslarge enough to rupture pipelines, move bridge abut-ments, or rupture building foundations. Light objects,such as underground storage tanks, can float towardthe surface, and heavy objects, such as buildings, cansink. Typical displacements can range from centime-ters to meters. Thus, if the soil at a site liquefies, thedamage resulting from an earthquake can be dramati-cally increased over what shaking alone might havecaused.
The liquefaction hazard analysis is based on the ageand grain size of the geologic unit, the thickness of theunit, and the shear-wave velocity. Use of the shear-wave velocity to characterize the liquefaction poten-tial follows Andrus and Stokoe (1997). Liquefaction
4
Table 1. UBC-97 soil profile types. From ICBO, 1997Soil Average shear-wave Amplification
category Description velocity meters/second factor (Cv)
SA Hard rock Vs > 1,500 0.8
SB Rock 760 < Vs < 1,500 1
SC Very dense soil and soft rock 360 < Vs < 760 1.5
SD Stiff soil 180 < Vs < 360 1.8
SE Soil Vs < 180 2.8
SF Soil requiring site-specific evaluation
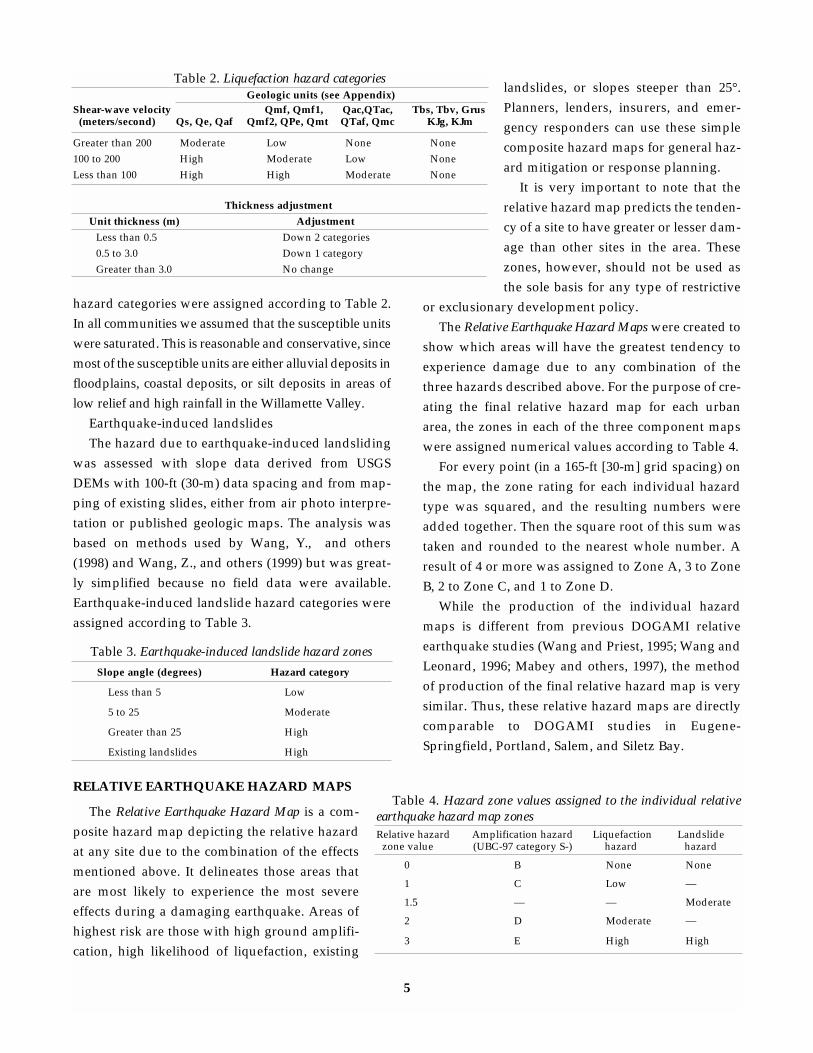
hazard categories were assigned according to Table 2.In all communities we assumed that the susceptible unitswere saturated. This is reasonable and conservative, sincemost of the susceptible units are either alluvial deposits infloodplains, coastal deposits, or silt deposits in areas oflow relief and high rainfall in the Willamette Valley.
Earthquake-induced landslidesThe hazard due to earthquake-induced landsliding
was assessed with slope data derived from USGSDEMs with 100-ft (30-m) data spacing and from map-ping of existing slides, either from air photo interpre-tation or published geologic maps. The analysis wasbased on methods used by Wang, Y., and others(1998) and Wang, Z., and others (1999) but was great-ly simplified because no field data were available.Earthquake-induced landslide hazard categories wereassigned according to Table 3.
RELATIVE EARTHQUAKE HAZARD MAPS
The Relative Earthquake Hazard Map is a com-posite hazard map depicting the relative hazardat any site due to the combination of the effectsmentioned above. It delineates those areas thatare most likely to experience the most severeeffects during a damaging earthquake. Areas ofhighest risk are those with high ground amplifi-cation, high likelihood of liquefaction, existing
landslides, or slopes steeper than 25°.Planners, lenders, insurers, and emer-gency responders can use these simplecomposite hazard maps for general haz-ard mitigation or response planning.
It is very important to note that therelative hazard map predicts the tenden-cy of a site to have greater or lesser dam-age than other sites in the area. Thesezones, however, should not be used asthe sole basis for any type of restrictive
or exclusionary development policy.The Relative Earthquake Hazard Maps were created to
show which areas will have the greatest tendency toexperience damage due to any combination of thethree hazards described above. For the purpose of cre-ating the final relative hazard map for each urbanarea, the zones in each of the three component mapswere assigned numerical values according to Table 4.
For every point (in a 165-ft [30-m] grid spacing) onthe map, the zone rating for each individual hazardtype was squared, and the resulting numbers wereadded together. Then the square root of this sum wastaken and rounded to the nearest whole number. Aresult of 4 or more was assigned to Zone A, 3 to ZoneB, 2 to Zone C, and 1 to Zone D.
While the production of the individual hazardmaps is different from previous DOGAMI relativeearthquake studies (Wang and Priest, 1995; Wang andLeonard, 1996; Mabey and others, 1997), the methodof production of the final relative hazard map is verysimilar. Thus, these relative hazard maps are directlycomparable to DOGAMI studies in Eugene-Springfield, Portland, Salem, and Siletz Bay.
5
Table 2. Liquefaction hazard categoriesGeologic units (see Appendix)
Shear-wave velocity Qmf, Qmf1, Qac,QTac, Tbs, Tbv, Grus(meters/second) Qs, Qe, Qaf Qmf2, QPe, Qmt QTaf, Qmc KJg, KJm
Greater than 200 Moderate Low None None100 to 200 High Moderate Low NoneLess than 100 High High Moderate None
Thickness adjustmentUnit thickness (m) Adjustment
Less than 0.5 Down 2 categories0.5 to 3.0 Down 1 categoryGreater than 3.0 No change
Table 3. Earthquake-induced landslide hazard zonesSlope angle (degrees) Hazard category
Less than 5 Low
5 to 25 Moderate
Greater than 25 High
Existing landslides High
Table 4. Hazard zone values assigned to the individual relativeearthquake hazard map zonesRelative hazard Amplification hazard Liquefaction Landslide
zone value (UBC-97 category S-) hazard hazard
0 B None None
1 C Low —
1.5 — — Moderate
2 D Moderate —
3 E High High
The GIS techniques used to develop these mapsinvolved several changes between vector data andraster data, with a data grid cell size of 165 ft (50 m) forthe raster data. As a result, the relative hazard mapsoften had numerous zones that were very small, andprobably not significant. The final maps were hand-edited to remove all hazard zones that covered lessthan 1 acre.
USE OF RELATIVE EARTHQUAKE HAZARD MAPS
The Relative Earthquake Hazard Maps delineate thoseareas most likely to experience damage in a givenearthquake. This information can be used to develop avariety of hazard mitigation strategies. The informa-tion should, however, be carefully considered andunderstood, so that inappropriate use can be avoided.
Emergency response and hazard mitigationOne of the key uses of these maps is to develop
emergency response plans. The areas indicated ashaving a higher hazard would be the areas where thegreatest and most abundant damage will tend tooccur. Planning for disaster response will be enhancedby the use of these maps to identify which resourcesand transportation routes are likely to be damaged.
Land use planning and seismic retrofitEfforts and funds for both urban renewal and
strengthening or replacing older and weaker build-ings can be focused on the areas where the effects ofearthquakes will be the greatest. The location of futureurban expansion or intensified development shouldalso consider earthquake hazards.
Requirements placed on development could bebased on the hazard zone in which the development islocated. For example, the type of site-specific earth-quake hazard investigation that is required could bebased on the hazard.
LifelinesLifelines include road and access systems including
railroads, airports, and runways, bridges, and over-and underpasses, as well as utilities and distributionsystems. The Relative Earthquake Hazard Map and itscomponent single-hazard maps are especially usefulfor expected-damage estimation and mitigation forlifelines. Lifelines are usually distributed widely and
often require regional as opposed to site-specific haz-ard assessments. The hazard maps presented hereallow quantitative estimates of the hazard throughouta lifeline system. This information can be used forassessing vulnerability as well as deciding on priori-ties and approaches for mitigation.
EngineeringThe hazard zones shown on the Relative Earthquake
Hazard Maps cannot serve as a substitute for site-spe-cific evaluations based on subsurface informationgathered at a site. The calculated values of the indi-vidual component maps used to make the RelativeHazard Maps may, however, be used to good purposein the absence of such site-specific information, forinstance, at the feasibility-study or preliminary-designstage. In most cases, the quantitative values calculatedfor these maps would be superior to a qualitative esti-mate based solely on lithology or non-site-specificinformation. Any significant deviation of observedsite geology from the geologic model used in the anal-yses indicates the need for additional analyses at thesite.
Relative hazardIt is important to recognize the limitations of a
Relative Earthquake Hazard Map, which in no wayincludes information with regard to the probability ofdamage to occur. Rather, it shows that when shakingoccurs, the damage is more likely to occur, or be moresevere, in the higher hazard areas. The exact probabil-ity of such shaking to occur is yet to be determined.
Neither should the higher hazard areas be viewedas unsafe. Except for landslides, the earthquake effectsthat are factored into the Relative Earthquake HazardMap are not life threatening in and of themselves.What is life threatening is the way that structures suchas buildings and bridges respond to these effects.
The map depicts trends and tendencies. In all cases,the actual threat at a given location can be assessedonly by some degree of site-specific assessment. Thisis similar to being able to say demographically that azip code zone contains an economic middle class, butwithin that zone there easily could be individuals orneighborhoods significantly richer or poorer.
6
Because the maps exist as “layers” of digital GISdata, they can easily be combined with earthquakesource information to produce earthquake damagescenarios. They can also be combined with probabilis-tic or scenario bedrock ground shaking maps to pro-vide an assessment of the absolute level of hazard andan estimate of how often that level will occur. Finally,the maps can also be easily used in conjunction with
GIS data for land use or emergency management plan-ning.
This study does not address the hazard of tsunamisthat exists in areas close to the Oregon coast and is alsoearthquake induced. The Oregon Department ofGeology and Mineral Industries has published sepa-rate tsunami hazard maps on this subject (Priest, 1995;Priest and Baptista, 1995).
7

URBAN AREA SUMMARIES
8
DALLAS URBAN AREA
9
The Dallas geologic model was developed usingsurface geologic data from Baldwin (1964), Gannetand Caldwell (1998) and O'Connor and others (inpress) and subsurface data from logs of 51 approxi-mately located water wells.
The geology consists of Quaternary silt, sand, andgravel overlying Miocene sedimentary and volcanicbedrock (Tbs). The Quaternary deposits can be gross-ly divided into an older sand and gravel alluvial unit(QTac) and a younger unit of flood silt (Qmf) deposit-ed by catastrophic Missoula floods (Bretz and others,1956; Waitt, 1985). The model consists of a body ofQTac and a body of Qmf. (Units are described inAppendix 1.)
Shear-wave velocities were assigned as follows:Qmf Two direct measurements, 165 and 174 m/sec,
average 170 m/sec.QTac No direct measurement, nearby values for
similar sediments range from 275 to 438
m/sec, average 346 m/sec.Tbs Two direct measurements, 755 and 780 m/sec,
average 768 m/sec.Amplification hazard is generally low, with a small
area of moderate hazard at the east end of the urbanarea where there is a significant combined thickness ofQmf and QTac.
Liquefaction hazard is nil throughout most of theurban area and low to moderate to the east in areasunderlain by Qmf.
Earthquake-induced landslide hazard is generallylow on the valley floors, with some areas of moderatehazard on steeper slopes in the hills.
Relative hazard is generally Zone D or C for mostof the area, reflecting geology that is largely bedrockor thin QTac gravel. There is a small area of Zone B atthe east end of the urban area, where moderately thickQmf and QTac deposits cause elevated amplificationand liquefaction hazards.
HOOD RIVER URBAN AREA
10
The Hood River geologic model was derived fromsurface mapping at 1:62,500 by Beaulieu (1977) and airphoto interpretation and subsurface data from 26approximately located water wells.
The geology consists of several deposits of Quater-nary sediments on top of bedrock (Tbv) that includesMiocene Columbia River basalt and Pliocene-Pleistocene lava flows and debris flows derived fromthe Mount Hood volcano. There are two units ofQuaternary deposits: Sand, silt, and clay depositsalong the shores of the Columbia River, and a body ofclay on the broad flat in the middle of the area aremapped as unit Qaf. Gravel deposits at the south endof the area are mapped as QTac. (Units are describedin Appendix 1.)
Shear-wave velocities are assigned as follows:QTac Two direct measurements, 271 and 377 m/sec,
average 324 m/sec.Qaf One direct measurement, 145 m/sec.Tbv Two direct measurements, 995 and 1,352
m/sec, average 1,174 m/sec.
Amplification hazard ranges from nil to moderate,with the higher values associated with the deposits ofQaf along the Columbia River shore and in the centerof the area.
Liquefaction hazard is nil throughout most of thearea, where bedrock or unit QTac are at the surface.Moderate liquefaction is associated with unit Qaf inthe middle of the area, and high liquefaction hazardassociated with Qaf along the Columbia River shore.
Earthquake-induced landslide hazard is generallylow, with some areas of moderate hazard associatedwith bluffs along the Columbia and Hood Rivers, andminor tributaries. Small areas of high hazard are asso-ciated with the steepest bluffs and some existing land-slides.
Much of the area is in relative hazard Zone D,because there is bedrock at the surface in many areas.There are also large patches of Zone A associated withthe Qaf deposits in the center of the area and along theColumbia shore. Small areas of Zones B and A are alsoassociated with existing landslides and steep slopes.
MCMINNVILLE-DAYTON-LAFAYETTE URBAN AREA
11
This model was developed using surface geologicfrom Gannett and Caldwell (1998), Yeats and others(1991), and Brownfield and Schlicker (1981). Subsur-face data were obtained from 165 approximately locat-ed water well logs.
The geology consists of three units of Quaternarymaterial deposited on top of bedrock. The bedrock(Tbs) consists of basalt flows of the Columbia RiverBasalt Group, tuffaceous marine sedimentary rocks ofthe Oligocene and Eocene Keasey and Pittsburgh BluffFormations, tuffaceous sedimentary rocks and pillowbasalts of the Eocene Nestucca Formation, and Eocenebasalt and gabbro sills and dikes. The oldestQuaternary unit (QTaf) consists of Pleistocene fluvialsand, silt, clay, and gravel and is overlain by two lay-ers of Quaternary silt deposited by catastrophic out-burst floods from glacial Lake Missoula (Bretz andothers, 1956; Waitt, 1985). The two units of Missoulaflood silts can be distinguished by a consistent colorchange in driller’s logs (upper brown-tan=Qmf1,lower blue-gray=Qmf2) and have different shear-wave velocity values, based on field measurements.The geologic model consists of a body of Qmf1, a bodyof Qmf2, and a body of QTaf. (Units are described inAppendix 1.)
Shear-wave velocity values are assigned as follows:Qmf1 Three direct measurements, 180–213 m/sec,
average 198 m/sec.Qmf2 Two direct measurements, 241 and 277 m/sec
average 259 m/sec.QTaf One direct measurement, 460 m/sec.Tbs One direct measurement, 914 m/sec.
Amplification hazard is moderate over most of thearea, due to widespread thick deposits of Qmf1 andQmf2. There are some areas of low to nil hazard in thehills along the north edge of the urban area bedrock isat the surface.
Liquefaction hazard is moderate over most of thearea, associated with widespread Qmf1 and Qmf2deposits. Liquefaction hazard is low in the hills alongthe north edge of the urban area where bedrock is atthe surface.
Earthquake-induced landslide hazard is low through-out the area. Moderate hazard occurs in the hills at thewest end of the urban area and on steep bluffs alongthe Yamhill River and its major tributaries.
Most of the area is in relative hazard Zone B, withsome areas of Zones D and C in the hills along thenorth edge of the urban area. The large area of Zone Bis due to the combination of moderate amplificationand liquefaction hazards in the areas underlain byQmf1 and Qmf2.

MONMOUTH-INDEPENDENCE URBAN AREA
12
The Monmouth-Independence geologic model wasdeveloped using geologic data from Bela (1981),Gannet and Caldwell (1998) and O’Connor and others(in press). Subsurface geology was inferred using datafrom 49 approximately located water wells.
The surface geology was divided into three units:Holocene sand and gravel (Qac) deposited on thefloodplain of the Willamette River, Late Pleistocenesilt (Qmf) deposited by catastrophic floods from lakeMissoula (Bretz and others, 1956; Waitt, 1985), andEocene sandstone and claystone bedrock (Tbv). A unitof Pliocene-Pleistocene sand and gravel (QTaf) wasrecognized only in the subsurface. The model includesa body of Qac, a body of Qmf, and a body of QTaf. Qacand Qmf completely cover QTac, which pinches out tothe west. (Units are described in Appendix 1.)
Shear-wave velocities are assigned as follows:Qmf Two direct measurements, 159 and 169 m/sec,
average 164 m/sec.QTac Two direct measurements, 275 and 325 m/sec,
average 300 m/sec.Qac No direct measurements, similar gravel at
Lebanon is 144 m/sec.QTaf Two direct measurements, 403 and 550 m/sec,
average 477 m/sec.Tbv One direct measurement, 1,138 m/sec.
Amplification hazard is moderate throughout thearea because of widespread Qmf deposits. There is asmall area of low hazard in the hills at the west end ofthe urban area.
Liquefaction hazard is moderate throughout thearea because of widespread Qmf deposits. There is asmall area of low and nil hazard in the hills at the westend of the urban area and an area of low hazard alongthe bluff above the Willamette River in the center ofthe urban area.
Earthquake-induced landslide hazard is generallylow throughout the area, with a small area of moder-ate hazard in the hills at the west end of the urban areaand more moderate hazard areas along the bluff abovethe Willamette River. A small area of high hazard at thewest end of the urban area is due to very steep slopes.
Most of the area is in relative hazard Zone B,reflecting the combination of moderate amplificationand liquefaction hazard associated with widespreadQmf deposits. The hills at the west end of the urbanarea are in Zones C and D, since these areas havebedrock at the surface. There is also an area of Zone Cbeneath the urban centers of Monmouth and Indepen-dence, due to lower liquefaction hazard.
13
NEWBERG-DUNDEE URBAN AREA
The Newberg-Dundee geologic model was devel-oped using surface geologic data from Gannet andCaldwell (1998) and airphoto interpretation. Subsur-face geology was inferred from 151 approximatelylocated water wells and 2 shear-wave velocity profiles.
The geology is complex, particularly in the subsur-face. Surficial deposits consist of two layers of Quater-nary silt deposited by catastrophic Missoula floods(Bretz and others, 1956; Waitt, 1985), and sand and siltalluvium deposited on the floodplain of the Willam-ette River. The flood silt can be divided into an upperoxidized low-velocity layer (Qmf1) and a lower unox-idized higher-velocity layer (Qmf2). The Quaternaryalluvium was combined with the Qmf1 unit becauseof the difficulty of distinguishing the two units in welllogs and because their shear-wave velocities are likelyto be similarly low.
The Quaternary units overlie a complex geologyconsisting of Pliocene-Pleistocene alluvial sand, silt,and clay (QTaf), laterite developed on Columbia Riverbasalt, Columbia River basalt, and Miocene marinesediments (Tbs). There are almost certainly significantfaults in the area, because the thicknesses of the aboveunits change abruptly at several locations, but map-ping these faults was not possible in this study. Nu-merous well logs reported red and brown clay, silt,siltstone, sandstone, and mudstone. These descrip-tions could conceivably be assigned to the laterite,Pliocene-Pleistocene sediments, or Miocene sedi-ments. The complexity of these units could not be re-solved in this study. Instead, we assumed that thevelocities of the alluvial and the laterite units weresimilar and combined them under unit name QTaf.We also assumed that the velocities of unit Tbs and theColumbia River basalt were similar and combined
them under unit name Tbs. The final model consists ofa body of Qmf1, a body of Qmf2, a body of QTaf, andone of Tbs. (Units are described in Appendix 1.)
Shear-wave velocity is assigned as follows:Qmf1 Two direct measurements, 162m/sec and 220
m/sec, average 191m/secQmf2 No direct measurement, values from adjacent
McMinnville area (10–20 km away) average259 m/sec.
QTaf One direct measurement, 330 m/sec, compa-rable to McMinnville (416 m/sec) and Wood-burn (20 km away, 303–366 m/sec, average offour values 344 m/sec).
Tbs One direct measurement, 513 m/sec.Amplification hazard is generally moderate in the
flat lowland parts of the urban area, which are gener-ally covered with Qmf deposits. In the surroundinghills amplification is generally low.
Liquefaction hazard is generally low in the flat low-land parts of the urban area, which are generally cov-ered with Qmf deposits, but increase to moderate asthe Qmf thickens toward the Willamette River. In thesurrounding hills liquefaction hazard is nil.
Earthquake-induced landslide hazard is generallylow on the flat lowlands, and moderate in the hills andalong the valleys cut by minor streams. There areareas of high landslide hazard on the steepest slopeson Chehalem Mountain, and along the bluffs abovethe Willamette River.
Most of the area is in relative hazard Zone C, withareas of Zone B toward the Willamette River, reflect-ing higher liquefaction hazard associated with thickerQmf. There are also pockets of Zones B and A in theChehalem Mountains where slopes are very steep,and areas of Zone A along the Willamette River bluffs.
The Sandy geologic model was developed usinggeologic mapping (Trimble, 1963) and air photo anal-ysis. No late Quaternary unconsolidated deposits arein the target area, and the geology consists almostentirely of Pleistocene to Miocene volcaniclastic sand-stone and conglomerate and fluvial mudstone (Tbs).(Units are described in Appendix 1.) Several moder-ate-sized landslides occur along the steep walls of theSandy River canyon.
Shear-wave velocity values are assigned as follows:Tbs Two direct measurements, 286 and 610 m/sec,
average 448 m/sec.
Amplification hazard is low throughout the area,reflecting the absence of loose, young surface deposits.
Liquefaction hazard is nil, because the entire area isunderlain by bedrock.
Earthquake-induced landslide hazard is low on theflat uplands covering most of the area and moderateto high along the steep walls of the Sandy Rivercanyon and its tributary valleys. The highest slopehazard is associated with some very steep slopes andexisting landslides along the Sandy River canyon.
Most of the area is in relative hazard Zone D, withsome areas of higher hazard associated with steepslopes or existing landslides.
14
SANDY URBAN AREA

The geologic model was developed using surfacegeologic data from Brownfield (1982), Gannet and Cald-well (1998) and air photo interpretation. Subsurfacegeology was interpreted from 39 approximately locat-ed water wells and two shear-wave velocity profiles.
The geology consists of up to 7 m of Quaternary siltand sand (Qmf), including modern stream depositsand material deposited by catastrophic Missoulafloods (Bretz and others, 1956; Waitt, 1985). The Qmffills a shallow valley cut into shale and siltstone of theEocene Nestucca and Yamhill Formations (Tbs).(Units are described in Appendix 1.) Although onevelocity profile (site Willa01, QTaf) showed evidenceof an intermediate-age and -velocity layer between theQmf and Tbs layers, it was not possible to map thisunit in other boreholes, and so it was ignored. A fewancient landslides are found in the hills along thenorthern edge of the area.
Shear-wave velocity is assigned as follows:Qmf Two direct measurements, 124 and 125 m/sec.Tbs Two direct measurements, 749 and 773 m/sec,
average 761 m/secAmplification hazard is nil throughout most of the
area, with a small strip of low hazard where the Qmfsediments are thickest along the South Fork of theYamhill River.
Liquefaction hazard is low along the valley floor,due to thin Qmf, and nil in the surrounding hillswhere bedrock is at the surface.
Earthquake-induced landslide hazard is low on thevalley floor, and moderate in the surrounding hills. Afew areas of high hazard in the hills are associatedwith existing landslides.
Most of the area is in relative hazard Zone D, witha few patches of hazard up to Zone B associated withexisting landslides.
15
SHERIDAN-WILLAMINA URBAN AREA
The St. Helens-Columbia City-Scappoose geologicmodel was developed using airphoto interpretationand existing geologic mapping from Wilkinson andothers (1946). Subsurface geology was inferred from88 approximately located water wells.
The geology of the area is somewhat complex anddifficult to model. Quaternary surficial deposits con-sist of a fine-grained unit and a coarse grained unit.The fine-grained unit (Qaf) consists of silts and sandsdeposited by the modern Columbia River and by thelatest Pleistocene Missoula floods (Bretz and others,1956; Waitt, 1985). Thick deposits of clay northwest ofScappoose were included in this unit, but could beolder. Also, deposits of red clay and silt overColumbia River basalt bedrock that are probably lat-erite were included in the fine unit. The coarse unit(Qac) consists of pebble to boulder gravel with vari-able amounts of silt, sand, and clay; it is probablylargely gravel deposited by the late QuaternaryMissoula floods but may include some older Pliocene-Pleistocene gravels. Bedrock includes Columbia Riverbasalt, Miocene marine sedimentary rocks, andPliocene-Pleistocene conglomerate and sandstone, allof which are combined in a single bedrock unit (Tbv).(Units are described in Appendix 1.) Several land-slides were inferred from airphotos along the bluffsnorth and west of St. Helens.
Shear-wave velocity is assigned to the various unitsas follows:Qaf Two direct measurements, 88 and 132 m/sec,
average 110 m/sec.Qac Two direct measurements, 710 and 830 m/sec,
average 770 m/sec.Tbv One direct measurement, 1,204 m/sec.
Amplification hazard is quite varied across thearea, ranging from high where unit Qaf is thick (par-ticularly along the Columbia River) to nil in the hillsadjacent to the Columbia River plain, with somepatches of nil amplification on the plain where Qaf isabsent or thin.
Liquefaction hazard is also varied, ranging fromhigh along the Columbia to nil in the hills adjacent tothe Columbia River plain.
Earthquake-induced landslide hazard is low on theColumbia River plain, and generally moderate in theadjacent hills, with a few areas of high hazard associ-ated with existing landslides.
Most of the Columbia River plain is in relative haz-ard Zones B and A, reflecting amplification and lique-faction hazards associated with Qaf. Some areas of theplain are in Zones D and C, where Qaf is thin orabsent. The hills are generally in Zone D, with someareas of higher hazard associated with steep slopes.
16
ST. HELENS-COLUMBIA CITY-SCAPPOOSE URBAN AREA
BIBLIOGRAPHY
17
ACKNOWLEDGMENTS
Geological models were reviewed by MarshallGannett and Jim O’Connor of the U.S. Geological Sur-vey (USGS) Water Resources Division, Ken Lite of theOregon Water Resources Department, Dr. Ray Wellsof the USGS, Dr. Curt Peterson of Portland State Uni-versity, Dr. Jad D’Allura of Southern Oregon Univer-sity, and Dr. John Beaulieu, Gerald Black, and Dr.George Priest of the Oregon Department of Geology
and Mineral Industries. The reports were reviewed byGerald Black and Mei Mei Wang. Marshall Gannettand Jim O’Connor provided unpublished digital geo-logic data that were helpful in building the geologicmodels. Dr. Marvin Beeson provided unpublishedgeologic mapping. We are very grateful to all of theseindividuals for their generous assistance.
Andrus, R.D., and Stokoe, K.H., 1997, Liquefaction resis-tance based on shear-wave velocity (9/18/97 version), inYoud, T.L., and Idriss, I.M., eds., Proceedings of theNCEER Workshop on Evaluation of LiquefactionResistance of Soils, Jan. 4–5, Salt Lake City, Utah: Buffalo,N.Y., National Center for Earthquake EngineeringResearch Technical Report NCEER-97-0022, p. 89–128.
Atwater, B.F., 1987, Evidence for great Holocene earth-quakes along the outer coast of Washington State:Science, v. 236, p. 942–944.
Atwater, B.F., and Hemphill-Haley, 1997, Recurrence inter-vals for great earthquakes of the past 3,500 years at north-eastern Willapa Bay, Washington: U.S. Geological SurveyProfessional Paper 1576, 108 p.
Baldwin, E.M., 1964, Geology of the Dallas and Valsetzquadrangles, rev. ed.: Oregon Department of Geologyand Mineral Industries Bulletin 35, 56 p., 1 map 1:62,500.
Beaulieu, J.D., 1977, Geologic hazards of parts of northernHood River, Wasco, and Sherman Counties, Oregon:Oregon Department of Geology and Mineral IndustriesBulletin 91, 95 p., 10 maps.
Beaulieu, J.D., and Hughes, P.W., 1975, Environmental geol-ogy of western Coos and Douglas Counties, Oregon:Oregon Department of Geology and Mineral IndustriesBulletin 87, 148 p., 16 maps.
———1976, Land use geology of western Curry County,Oregon: Oregon Department of Geology and MineralIndustries Bulletin 90, 148 p., 12 maps.
Bela, J.L, 1981, Geology of the Rickreall, Salem West,Monmouth, and Sidney 7½' quadrangles, Marion, Polk,and Linn Counties, Oregon: Oregon Department ofGeology and Mineral Industries Geological Map SeriesGMS–18, 2 pls., 1:24,000.
Bolt, B.A., 1993, Earthquakes: New York, W.H. Freeman andCo., 331 p.
Bretz, J.H., Smith, H.T.U., and Neff, G.E., 1956, ChanneledScabland of Washington: New data and interpretations:Geological Society of America Bulletin, v. 67, no. 8, p.957–1049.
Brownfield, M.E., 1982, Geologic map of the Sheridan quad-rangle, Polk and Yamhill Counties, Oregon: OregonDepartment of Geology and Mineral IndustriesGeological Map Series GMS–23, 1:24,000.
Brownfield, M.E., and Schlicker, H.G., 1981, Preliminarygeologic map of the McMinnville and Dayton quadran-gles, Oregon: Oregon Department of Geology andMineral Industries Open-File Report O–81–6, 1:24,000.
FEMA (Federal Emergency Management Agency), 1995,NEHRP recommended provisions for seismic regulationsfor new buildings, 1994 edition, Part 1: Provisions:Washington, D.C., Building Seismic Safety Council,FEMA Publication 222A / May 1995, 290 p.
Frankel, A., Mueller, C., Barnhard, T., Perkins, D.,Leyendecker, E.V., Dickman, N., Hanson, S., andHopper, M., 1996, National seismic hazard maps, June1996 documentation: U.S. Geological Survey Open-FileReport 96–532, 110 p.
Gannett, M.W., and Caldwell, R.R., 1998, Geologic frame-work of the Willamette Lowland aquifer system: U.S.Geological Survey Professional Paper 1424–A, 32 p., 8pls.
Geomatrix Consultants, Inc., 1995, Seismic design mapping,State of Oregon: Final Report to Oregon Department ofTransportation, Project no. 2442, var. pag.
Heaton, T.H., and Hartzell, S.H., 1987, Earthquake hazardson the Cascadia subduction zone: Science, v. 236, no.4798, p. 162–168.
Hunter, J.A., Pullan, S.E., Burns, R.A., and Good, R.L., 1984,Shallow seismic reflection mapping of the overburden-bedrock interface with an engineering seismograph——Some simple techniques: Geophysics, v. 49, p. 1381–1385.
ICBO (International Conference of Building Officials), 1997,1997 Uniform building code, v. 2, Structural engineeringdesign provisions: Whittier, Calif., InternationalConference of Building Officials, 492 p.
Kanamori, H., 1977, The energy release in great earthquakes:Journal of Geophysical Research, v. 82, p. 2981–2987.
Mabey, M.A., Black, G.L., Madin, I.P., Meier, D.B., Youd,T.L., Jones, C.F., and Rice, J.B., 1997, Relative earthquakehazard map of the Portland metro region, Clackamas,Multnomah, and Washington Counties, Oregon: OregonDepartment of Geology and Mineral IndustriesInterpretive Map Series IMS–1, 1:62,500.
Madin, I.P., and Mabey, M.A., 1996, Earthquake hazardmaps for Oregon: Oregon Department of Geology andMineral Industries Geological Map Series GMS–100.
Madin, I.P., Priest, G.R., Mabey, M.A., Malone, S., Yelin,T.S., and Meier, D., 1993, March 25, 1993, Scotts Millsearthquake—western Oregon’s wake-up call: OregonGeology, v. 55, no. 3, p. 51–57.
National Research Council, Commission on Engineeringand Technical Systems, Committee on EarthquakeEngineering, 1985, Liquefaction of soils during earth-quakes: Washington, D.C., National Academy Press, 240 p.
O’Connor, J.E., Sarna-Wojcicki, A., Wozniak, K.C., Polette,D.J., and Fleck, R.J., in press, Origin, extent, and thicknessof Quaternary geologic units in the Willamette Valley,Oregon: U.S. Geological Survey Professional Paper 1620.
Priest, G.R., 1995, Explanation of mapping methods and useof the tsunami hazard maps of the Oregon coast: OregonDepartment of Geology and Mineral Industries Open-File Report O–95–67, 95 p.
Priest, G.R., and Baptista, A.M., 1995, Tsunami hazard mapsof coastal quadrangles, Oregon: Oregon Department ofGeology and Mineral Industries Open-File ReportO–95–09 through O–95–66 (amended 1997 by O–97–31and O–97–32), 56 quadrangle maps (as amended).
Ramp, L., and Peterson, N.V., 1979, Geology and mineralresources of Josephine County, Oregon: OregonDepartment of Geology and Mineral Industries Bulletin100, 45 p., 3 geologic maps.
Schlicker, H.G., Deacon, R.J., Beaulieu, J.D., and Olcott,G.W., 1972, Environmental geology of the coastal regionof Tillamook and Clatsop Counties; Oregon Departmentof Geology and Mineral Industries Bulletin 74, 164 p., 18 pls.
Schlicker, H.G., Deacon, R.J., Newcomb, R.C., and Jackson,R.L., 1974, Environmental geology of coastal LaneCounty, Oregon: Oregon Department of Geology andMineral Industries Bulletin 85, 116 p., 3 maps.
Seed, H.B., and Idriss, I.M., 1982, Ground motions and soilliquefaction during earthquakes: Earthquake Engineer-ing Institute Monograph, 134 p.
Snavely, P.D., Jr., MacLeod, N.S., Wagner, H.C., and Rau,W.W., 1976, Geologic map of the Cape Foulweather andEuchre Mountain quadrangles, Lincoln County, Oregon:U.S. Geological Survey Miscellaneous InvestigationsSeries Map I–868, 1:62,500.
Ticknor, R., 1993, Late Quaternary crustal deformation onthe central Oregon coast as deduced from uplifted wave-cut platforms: Bellingham, Wash., Western WashingtonUniversity master’s thesis, 70 p.
Trimble, D.E., 1963, Geology of Portland, Oregon, and ad-jacent areas: U.S. Geological Survey Bulletin 1119, 119 p.
Waitt, R.B., 1985, Case for periodic, colossal jökulhlaupsfrom Pleistocene glacial Lake Missoula: GeologicalSociety of America Bulletin, v. 96, no. 10, p. 1271–1286.
Walker, G.W., and McLeod, N.S., 1991, Geologic map ofOregon: U.S. Geological Survey Special Geologic Map,1:500,000.
Wang, Y., Keefer, D.K., and Wang, Z., 1998, Seismic hazardmapping in Eugene-Springfield, Oregon: OregonGeology, v. 60, no. 2, p. 31–41.
Wang, Y., and Leonard, W.J., 1996, Relative earthquake haz-ard maps of the Salem East and Salem West quadrangles,Marion and Polk Counties, Oregon: Oregon Departmentof Geology and Mineral Industries Geological Map SeriesGMS–105, 1:24,000.
Wang, Y., and Priest, G.R., 1995, Relative earthquake hazardmaps of the Siletz Bay area, coastal Lincoln County,Oregon: Oregon Department of Geology and MineralIndustries Geological Map Series GMS–93, 1:12,000 and1:24,000.
Wang, Z., Wang, Y., and Keefer, D.K., 1999, Earthquake-induced rockfall and slide hazard along U.S. Highway 97and Oregon Highway 140 near Klamath Falls, Oregon, inElliott, W.M., and McDonough, P., eds., Optimizing post-earthquake lifeline system reliability. Proceedings of the5th U.S. Conference on Lifeline Earthquake Engineering,Seattle, Wash., August 12–14, 1999: Reston, Va., Ameri-can Society of Civil Engineers, Technical Council onLifeline Earthquake Engineering Monograph 16, p. 61–70.
Weaver, C.S., and Shedlock, K.M., 1989, Potential sub-duction, probable intraplate, and known crustal earth-quake source areas in the Cascadia subduction zone, inHayes, W.W., ed., Third annual workshop on earthquakehazards in the Puget Sound/Portland area, proceedingsof Conference XLVIII: U.S. Geological Survey Open-FileReport 89–465, p. 11–26.
Wiley, T.J., Sherrod, D.R., Keefer, D.K., Qamar, A., Schuster,R.L., Dewey, J.W., Mabey, M.A., Black, G.L., and Wells,R.E., 1993, Klamath Falls earthquakes, September 20,1993—including the strongest quake ever measured inOregon: Oregon Geology, v. 55, no. 6, p. 127–134.
Wilkinson, W.D., Lowry, W.D., and Baldwin, E.M., 1946,Geology of the St. Helens quadrangle, Oregon: OregonDepartment of Geology and Mineral Industries Bulletin31, 39 p., 1 map, 1:62,500.
Yamaguchi, D.K., Atwater, B.F., Bunker, D.E., Benson, B.E.,and Reid, M.S., 1997, Tree-ring dating the 1700 Cascadiaearthquake: Nature, v. 389, p. 922.
Yeats, R.S., Graven, E.P., Werner, K.S., Goldfinger, C., andPopowski, T., 1991, Tectonics of the Willamette Valley,Oregon: U.S. Geological Survey Open-File Report91–441–P, 47 p.
Yelin, T.S., Tarr, A.C., Michael, J.A., and Weaver, C.S., 1994,Washington and Oregon earthquake history and haz-ards: U.S. Geological Survey Open-File Report 94–226–B,11 p.
18

19
APPENDIX

Qaf Fine-grained Quaternary alluvium; river and stream deposits of sand, silt, and clay
Qac Coarse-grained Quaternary alluvium; river and stream deposits of sand and gravel
Qmf Fine-grained Quaternary Missoula flood deposits; sand and silt left by catastrophic glacial floods
Qmc Coarse-grained Quaternary Missoula flood deposits; sand and gravel left by catastrophic glacial floods
Qmf1 Fine-grained Quaternary Missoula flood deposits; upper, oxidized low-velocity layer
Qmf2 Fine-grained Quaternary Missoula flood deposits; lower, reduced high-velocity layer
Qe Quaternary estuarine sediments; silt, sand, and mud deposited in bays and tidewater reaches of major rivers
Qs Quaternary sands; beach and dune deposits along the coast
Qmt Quaternary marine terrace deposits; sand and silt deposited during previous interglacial periods
QPe Pleistocene estuarine sediments; older sand and mud deposited in bays and tidewater reaches of rivers
QTac Older coarse-grained alluvium; sand and gravel deposited by ancient rivers and streams
QTaf Older fine-grained alluvium; sand and silt deposited by ancient rivers and streams
Grus Decomposed granite
Tbs Sedimentary bedrock
Tbv Volcanic bedrock
KJg Granite bedrock
KJm Metamorphic bedrock
20
1. GEOLOGIC UNITS USED IN TABLE A–1
21
URBAN AREA SITE # LAT LONG T-1 V-1 U-1 T-2 V-2 U-2 T-3 V-3 U-3 T-4 V-4 U-4
IMS–7
Dallas Dalla01 44.9287 -123.3222 3.4 165 Qmf 0.0 755 Tbs — — — — — —
Dallas Dalla02 44.9218 -123.3001 2.7 174 Qmf 0.0 780 Tbs — — — — — —
Hood River Hoodr01 45.7057 -121.5268 4.5 145 Qaf 0.0 1,352 Tbv — — — — — —
Hood River Hoodr02 45.6893 -121.5190 1.0 139 ? 6.0 271 QTac 38.0 377 QTac 0.0 995 Tbv
McMinnville-Dayton McMin01 45.2052 -123.2321 5.8 180 Qmf1 0.0 1,371 Tbv — — — — — —
McMinnville-Dayton McMin02 45.2112 -123.1383 7.0 201 Qmf1 0.0 277 Qmf2 — — — — — —
McMinnville-Dayton McMin03 45.2290 -123.0655 5.6 213 Qmf1 31.7 241 Qmf2 25.3 460 QTaf 0.0 914 Tbs
Monmouth-Independence Monm01 44.8649 -123.2181 2.3 169 Qmf 15.0 325 QTac 29.1 550 QTaf 0.0 1,138 Tbv
Monmouth-Independence Monm02 44.8425 -123.2027 7.0 159 Qmf 21.1 275 QTac 0.0 403 QTaf — — —
Newberg-Dundee Newb01 45.3123 -122.9494 4.9 220 Qmf1 0.0 513 Tbs — — — — — —
Newberg-Dundee Newb02 45.2945 -122.9735 7.9 162 Qmf1 0.0 330 QTaf — — — — — —
St. Helens-Scappoose STH01 45.8516 -122.8104 1.0 88 Qaf 0.0 1,204 Tbv — — — — — —
St. Helens-Scappoose STH02 45.8562 -122.8364 1.0 40 ? 0.0 830 Qac — — — — — —
St. Helens-Scappoose STH03 45.8619 -122.7992 1.5 132 Qaf 0.0 710 Qac — — — — — —
Sandy Sandy01 45.4029 -122.2745 4.5 286 Tbs 0.0 610 Tbs — — — — — —
Sheridan Sher01 45.0948 -123.3898 3.4 125 Qmf 0.0 749 Tbs — — — — — —
Willamina Willa01 45.0769 -123.4811 1.0 124 Qmf 3.0 386 QTaf? 0.0 773 Tbs — — —
IMS–8
Canby-Aurora Canb01 45.2682 -122.6859 2.5 266 Qmf 0.0 680 Qmc — — — — — —
Canby-Aurora Canb02 45.2550 -122.6979 3.5 160 Qmf 0.0 657 Qmc — — — — — —
Lebanon Lebanon01 44.5293 -122.9104 3.0 144 Qac 0.0 598 Tbv — — — — — —
Lebanon Lebanon02 44.5517 -122.8945 4.9 244 QTac 0.0 665 Tbv — — — — — —
Silverton Silvert01 45.0166 -122.7881 1.0 196 Qmf 3.0 818 QTaf 0.0 1,402 Tbv — — —
Mt. Angel Mtag01 45.0731 -122.7897 3.7 184 Qmf 10.0 438 QTac 0.0 1,087 Tbv — — —
Stayton Stayt01 44.8311 -122.7879 3.0 216 ? 0.0 551 Tbv — — — — — —
Stayton Stayt02 44.8047 -122.8014 1.8 142 Qac 0.0 958 Tbv — — — — — —
Sweet Home Sweet01 44.3955 -122.7234 6.1 203 Qac 0.0 855 Tbv — — — — — —
Woodburn-Hubbard Hub01 45.1871 -122.8026 1.0 101 ? 11.2 244 Qmf1 0.0 364 Qmf2 — — —
Woodburn-Hubbard Wood01 45.1451 -122.8228 6.1 247 Qmf1 33.5 341 Qmf2 0.0 396 QTaf — — —
Woodburn-Hubbard Wood02 45.1350 -122.8695 6.7 230 Qmf1 0.0 366 Qmf2 0.0 415 QTaf — — —
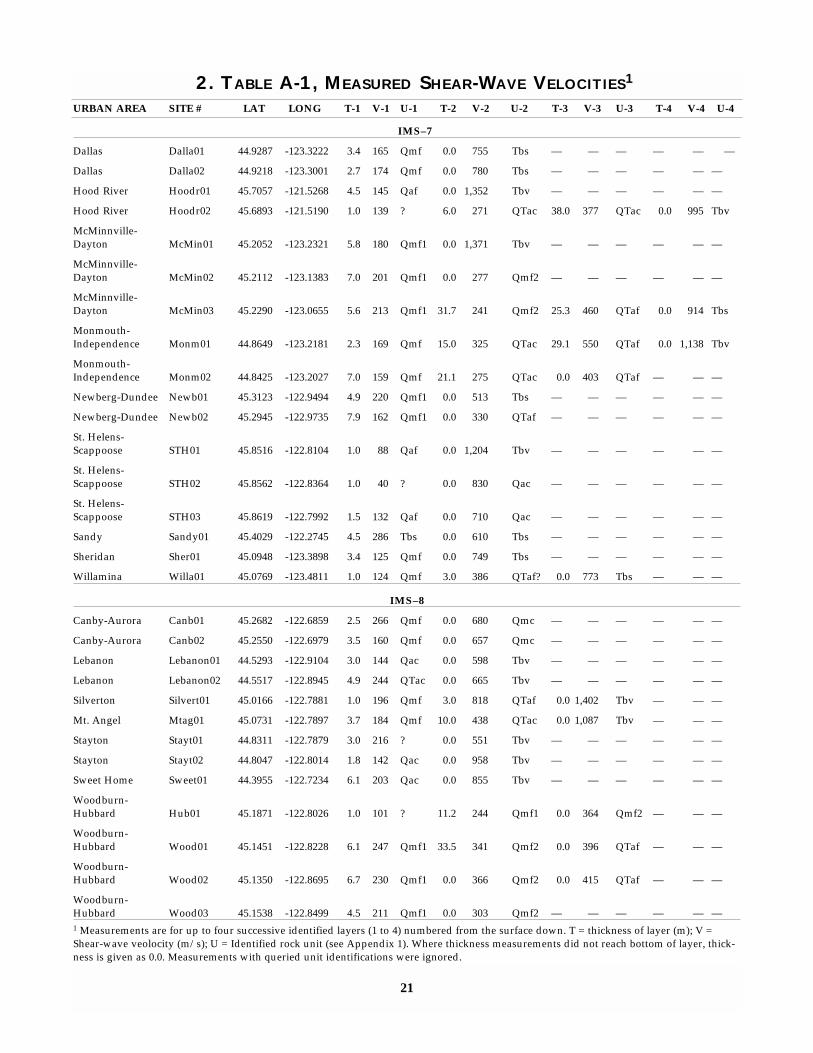
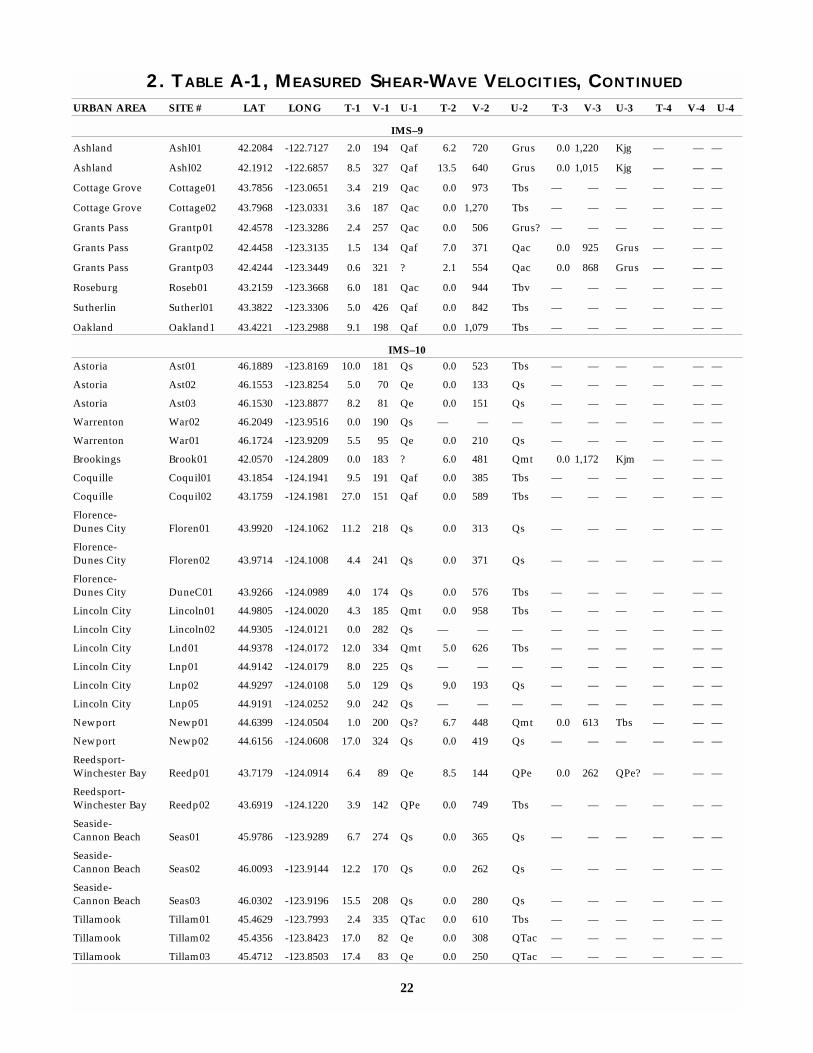
Woodburn-Hubbard Wood03 45.1538 -122.8499 4.5 211 Qmf1 0.0 303 Qmf2 — — — — — —1 Measurements are for up to four successive identified layers (1 to 4) numbered from the surface down. T = thickness of layer (m); V =Shear-wave veolocity (m/s); U = Identified rock unit (see Appendix 1). Where thickness measurements did not reach bottom of layer, thick-ness is given as 0.0. Measurements with queried unit identifications were ignored.
2. TABLE A-1, MEASURED SHEAR-WAVE VELOCITIES1
URBAN AREA SITE # LAT LONG T-1 V-1 U-1 T-2 V-2 U-2 T-3 V-3 U-3 T-4 V-4 U-4
IMS–9Ashland Ashl01 42.2084 -122.7127 2.0 194 Qaf 6.2 720 Grus 0.0 1,220 Kjg — — —
Ashland Ashl02 42.1912 -122.6857 8.5 327 Qaf 13.5 640 Grus 0.0 1,015 Kjg — — —
Cottage Grove Cottage01 43.7856 -123.0651 3.4 219 Qac 0.0 973 Tbs — — — — — —
Cottage Grove Cottage02 43.7968 -123.0331 3.6 187 Qac 0.0 1,270 Tbs — — — — — —
Grants Pass Grantp01 42.4578 -123.3286 2.4 257 Qac 0.0 506 Grus? — — — — — —
Grants Pass Grantp02 42.4458 -123.3135 1.5 134 Qaf 7.0 371 Qac 0.0 925 Grus — — —
Grants Pass Grantp03 42.4244 -123.3449 0.6 321 ? 2.1 554 Qac 0.0 868 Grus — — —
Roseburg Roseb01 43.2159 -123.3668 6.0 181 Qac 0.0 944 Tbv — — — — — —
Sutherlin Sutherl01 43.3822 -123.3306 5.0 426 Qaf 0.0 842 Tbs — — — — — —
Oakland Oakland1 43.4221 -123.2988 9.1 198 Qaf 0.0 1,079 Tbs — — — — — —
IMS–10Astoria Ast01 46.1889 -123.8169 10.0 181 Qs 0.0 523 Tbs — — — — — —
Astoria Ast02 46.1553 -123.8254 5.0 70 Qe 0.0 133 Qs — — — — — —
Astoria Ast03 46.1530 -123.8877 8.2 81 Qe 0.0 151 Qs — — — — — —
Warrenton War02 46.2049 -123.9516 0.0 190 Qs — — — — — — — — —
Warrenton War01 46.1724 -123.9209 5.5 95 Qe 0.0 210 Qs — — — — — —
Brookings Brook01 42.0570 -124.2809 0.0 183 ? 6.0 481 Qmt 0.0 1,172 Kjm — — —
Coquille Coquil01 43.1854 -124.1941 9.5 191 Qaf 0.0 385 Tbs — — — — — —
Coquille Coquil02 43.1759 -124.1981 27.0 151 Qaf 0.0 589 Tbs — — — — — —
Florence-Dunes City Floren01 43.9920 -124.1062 11.2 218 Qs 0.0 313 Qs — — — — — —
Florence-Dunes City Floren02 43.9714 -124.1008 4.4 241 Qs 0.0 371 Qs — — — — — —
Florence-Dunes City DuneC01 43.9266 -124.0989 4.0 174 Qs 0.0 576 Tbs — — — — — —
Lincoln City Lincoln01 44.9805 -124.0020 4.3 185 Qmt 0.0 958 Tbs — — — — — —
Lincoln City Lincoln02 44.9305 -124.0121 0.0 282 Qs — — — — — — — — —
Lincoln City Lnd01 44.9378 -124.0172 12.0 334 Qmt 5.0 626 Tbs — — — — — —
Lincoln City Lnp01 44.9142 -124.0179 8.0 225 Qs — — — — — — — — —
Lincoln City Lnp02 44.9297 -124.0108 5.0 129 Qs 9.0 193 Qs — — — — — —
Lincoln City Lnp05 44.9191 -124.0252 9.0 242 Qs — — — — — — — — —
Newport Newp01 44.6399 -124.0504 1.0 200 Qs? 6.7 448 Qmt 0.0 613 Tbs — — —
Newport Newp02 44.6156 -124.0608 17.0 324 Qs 0.0 419 Qs — — — — — —
Reedsport-Winchester Bay Reedp01 43.7179 -124.0914 6.4 89 Qe 8.5 144 QPe 0.0 262 QPe? — — —
Reedsport-Winchester Bay Reedp02 43.6919 -124.1220 3.9 142 QPe 0.0 749 Tbs — — — — — —
Seaside-Cannon Beach Seas01 45.9786 -123.9289 6.7 274 Qs 0.0 365 Qs — — — — — —
Seaside-Cannon Beach Seas02 46.0093 -123.9144 12.2 170 Qs 0.0 262 Qs — — — — — —
Seaside-Cannon Beach Seas03 46.0302 -123.9196 15.5 208 Qs 0.0 280 Qs — — — — — —
Tillamook Tillam01 45.4629 -123.7993 2.4 335 QTac 0.0 610 Tbs — — — — — —
Tillamook Tillam02 45.4356 -123.8423 17.0 82 Qe 0.0 308 QTac — — — — — —
Tillamook Tillam03 45.4712 -123.8503 17.4 83 Qe 0.0 250 QTac — — — — — —
22
2. TABLE A-1, MEASURED SHEAR-WAVE VELOCITIES, CONTINUED
This section describes our technique forcollecting and applying the shear-wavevelocity data shown in the preceding table(Table A-1). The table is also available on theaccompanying CD-ROM disk as a MicrosoftExcelTM spreadsheet.
SH-wave data were collected by means ofa 12-channel Bison 5000 seismograph with8-bit instantaneous floating point and 2048samples per channel. The data were record-ed at a sampling rate between 0.025 and 0.5ms, depending upon site conditions. Theenergy source for SH-wave generation is a1.5 m section of steel I-beam struck horizon-tally by a 4.5-kg sledgehammer. The geo-phones used for recording SH-wave datawere 30-Hz horizontal component MarkProduct geophones. Spacing between thegeophones is 3.05 m (10 ft). We used thewalkaway method (Hunter and others,1984), in which a group of 12 in-line geo-phones remained fixed and the energysource was “stepped out” through a set ofpredefined offsets. Depending upon site-geological conditions, the offsets of 3.05 m(10 ft), 30.5 m (100 ft), 61.0 m (200 ft), 91.5 m(300 ft), 122 m (400 ft), and 152.4 m (500 ft)were used. In order to enhance the SH-waveand reduce other phases, 5-20 hammerstrikes on each site of the steel I-beam werestacked and recorded for each offset.
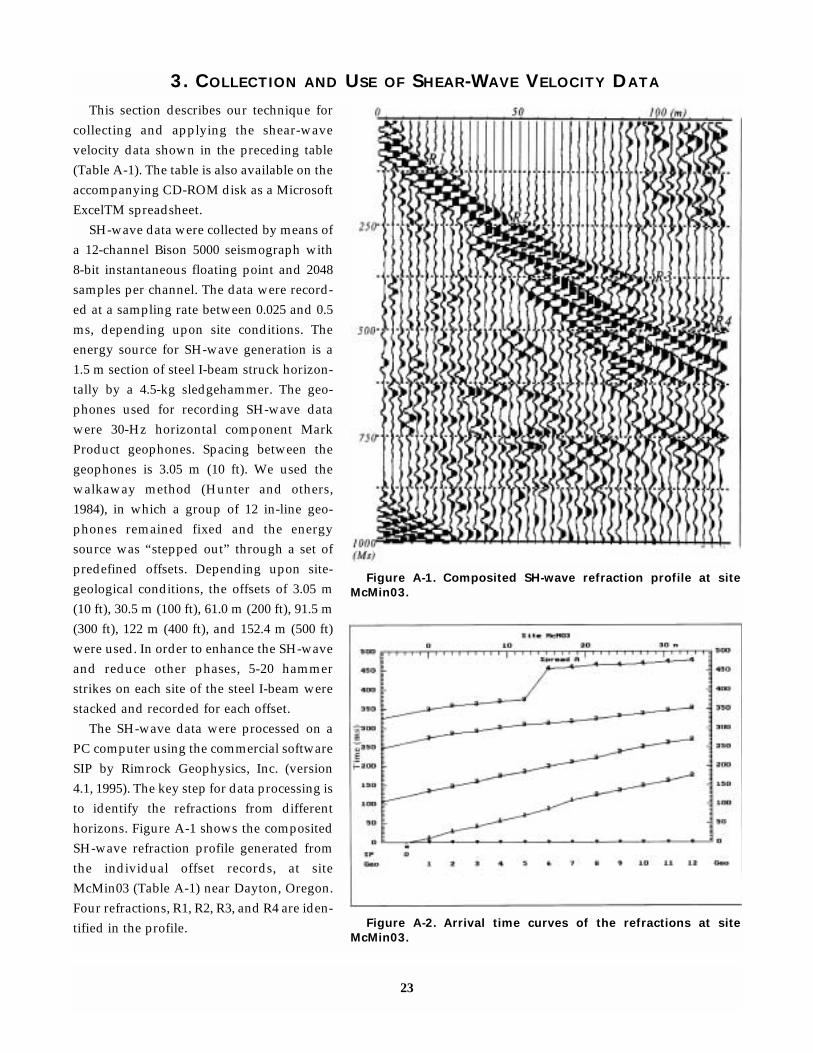
The SH-wave data were processed on aPC computer using the commercial softwareSIP by Rimrock Geophysics, Inc. (version4.1, 1995). The key step for data processing isto identify the refractions from differenthorizons. Figure A-1 shows the compositedSH-wave refraction profile generated fromthe individual offset records, at siteMcMin03 (Table A-1) near Dayton, Oregon.Four refractions, R1, R2, R3, and R4 are iden-tified in the profile.
23
3. COLLECTION AND USE OF SHEAR-WAVE VELOCITY DATA
Figure A-1. Composited SH-wave refraction profile at siteMcMin03.
Figure A-2. Arrival time curves of the refractions at siteMcMin03.

Arrival times of the refractions were picked inter-actively on the PC using the BSIPIK module in SIP.The arrival time data picked from each offset recordwere edited and combined in the SIPIN module togenerate a data file for velocity-model deduction.
Figure A-2 shows the arrival times for the refrac-tions identified in the profile (Figure A-1). The shear-wave velocity model is generated automatically usingthe SIPT2 module. Figure A-3 shows the shear-wavevelocity model derived from the refraction data at siteMcMin03 (Figure A-1). The model is used to calculatean average shear-wave velocity.
The average shear-wave velocity (ns) over theupper 30 m of the soil profile is calculated with the for-
mula of the Uniform Building Code (InternationalConference of Building Officials, 1997):
Vs = 30m/Σ{di/Vsi}
Where: di = thickness of layer i in meters andVsi = shear-wave velocity of layer i in m/s. Based on the average shear-wave velocity and the
UBC-97 soil profile categories as shown in Table 1above (page 4), the UBC-97 soil classification map isgenerated with MapInfo® and Vertical Mapper®. Soiltypes SE and SF can not be differentiated from theaverage shear-wave velocity. SE and SF are differenti-ated based on geologic and geotechnical data, andengineering judgement.
24
Figure A-3. Shear-wave velocity model interpreted from refraction data at site McMin03.