release 1 t11 (eng)
TRANSCRIPT

Earnings Release1Q11
Earnings Release1Q11
1Q11 Conference Call:
EnglishMay 2, 2011
9:00 a.m. (US ET)Tel: +55 11 3301-3000
Replay
Tel: +55 (11) 3127-4999Código: 41708803
Investor Relations:
Leandro BousquetCFO and IR Director
Derek TangCoordinator
Leonardo VazquezAnalyst
Bruno Cani
Tel: +55 21 3138-9900Fax: +55 21 3138-9901
1

Earnings Release1Q11
BRMALLS ANNOUNCES ADJUSTED EBITDA OF R$140.6 MILLIO N IN 1Q11, UP 58.6% OVER 1Q10.
Rio de Janeiro, April 29, 2011 – BRMALLS Participações S.A. (Bovespa: BRML3), the largest integrated shopping mallcompany in Brazil, announces today its results for the f irst quarter (1Q11). BRMALLS has a portfolio of 40malls, comprising 1,219,218 m² of gross leasable area (GLA) and 634,316 m² of owned GLA. The Company currentlyhas 3 greenf ield projects under development and 8 expansion projects, which together will increase its total GLA to1.407,200 m² and its owned GLA to 748,100 m² by 2013. BRMALLS is the only shopping mall company in Brazil with anationwide presence that caters to all income segments. The Company provides management and leasing services for32 malls, in 31 of which it retains an ownership interest.
1Q11 Highlights and Subsequent Events :1Q11 Highlights and Subsequent Events :
•Net revenues grew 68.4% in 1Q11 reaching R$179.1 million ;
• Net operating income (NOI) totaled R$158.6 million in 1Q11, an increase of 70.5% over the NOI in 1Q10 of R$93.0million, for NOI margin of 89.5% in the quarter. Same-property NOI climbed by 26.0% over 1Q10.
• Adjusted EBITDA reached R$140.6 million in the quarter, expanding 58.6% over the same period last year.
• In 1Q11, Net Income totaled R$57.2 million, an increase of 36.1% over 1Q10. Our FFO reached R$60.1 million, up33.3% year over year. Adjusted FFO totaled R$56.4 million in the quarter, against R$60.2 million in 1Q10.
• In 1Q11, we increased our interest in Shopping Center Crystal Plaza , Shopping Piracicaba and ShoppingCuritiba , totaling R$108.7 million in investments, with real and unleveraged average IRR of 13.1%. We sold our814.9 m2 stake in the GLA of Esplanada Shopping for R$11.8 million , with real IRR of 16.7%.
• We inaugurated , with great success, Via Brasil Shopping and the expansion of Shopping Tamboré , adding a totalowned GLA of 30,100 m2, with occupancy rates of 95% and 100%, respectively.
• Our malls continue to present high occupancy rates , averaging 98.1% of total GLA occupied in 1Q11. Of the 39malls in which we hold an interest, 18 achieved occupancy rates of over 99.0% of GLA .
• Renewal leasing spreads reached 28.1% and new contract leasing spreads reached 21.0% in the quarter, showingthe high demand for space combined with our high occupancy rates.the high demand for space combined with our high occupancy rates.
• Same-store rent continued its near double-digit growth, reaching 9.7% in the quarter. Same-store sales (SSS) grew8.7% in the period, inf luenced by the effects of the high comparison base in 1Q10 and the Easter holiday. Excluding thestores that were affected the most, SSS in 1Q11 would be 9.3%.
• In the f irst quarter of 2011, our owned GLA and total GLA expanded by 6.9% and 1.8%, respectively, over 4Q10. Weadded 11,200 m2 of owned GLA through acquisitions , 14,300 m2 through greenfield projects and 15,100 m2 throughexpansions .
• We fully prepaid the loan we took for the acquisition of Shopping Tijuca, amounting to R$520.5 million, which wouldbe repaid in 10 quarterly installments after the 21st month, at a cost of CDI+2% p.a. , replacing it with a CRI for the sameamount, with monthly installments over 14 years and grace period of two years, at a cost of TR+10.7% p.a.
2

Earnings Release1Q11
• We raised US$230 million through the issue of perpetual bonds at 8.50% p.a. The coupon payments were swappedto 99.15% of CDI until the January 2016 call date. In 1Q11, we raised a total of R$670.7 million in TR linked debt forShopping Tijuca, Shopping Tamboré and Mooca Plaza Shopping.
Net Revenues 179,083 106,325 68.4%S, G & A 24,549 15,904 54.4%S, G & A (% of Gross Revenues) 12.7% 13.7% -1.1%NOI 158,635 93,021 70.5%adjusted margin for Uberlândia results% 91.5% 88.8% 2.7%Gross Profit 160,068 94,412 69.5%
Financial Highlights (R$ 000)
1Q11 1Q10 %
Gross Profit 160,068 94,412 69.5%margin % 89.4% 88.8% 0.6%EBITDA 139,314 87,560 59.1%Adjusted EBITDA 140,602 88,638 58.6%adjusted margin for Uberlândia results% 79.3% 83.4% -4.1%Net Income 57,224 42,052 36.1%margin % 32.0% 39.6% -7.6%FFO 60,077 45,055 33.3%Adjusted FFO 56,433 60,177 -6.2%margin % 31.5% 56.6% -25.1%
Total GLA (m²) 1,173,179 1,034,911 13.4%Owned GLA (m²) 603,633 467,752 29.0%Same Store Sales per m² 1,038 956 8.7%Total Sales (R$ million) 3,251 2,702 20.3%Sales per m² 955 897 6.4%Sales per m² (stores up to 1,000 m²) 1,347 1,293 4.1%Same Store Sales per ft² (US$) (stores up to 1,000 m²) 920 828 11.2%Same Store Rents per m² 62 57 9.7%Rent per m² (monthly average) 83 68 21.2%NOI per m² (monthly average) 94 73 29.9%Occupancy Cost (% of sales) 10.5% 10.2% 0.3%(+) Occupancy Cost (% of rent) 6.5% 6.4% 0.1%(+) Occupancy Cost (% of condominium and marketing 4.0% 3.8% 0.2%Occupancy (monthly average) 98.1% 97.9% 0.2%Net Late Payments 1.3% 1.6% -0.3%
Operating Highlights
1Q11 1Q10 %
Number of Shares 406,884,274 404,825,782 0.5%Number of Outstanding Shares 383,135,379 378,022,816 1.4%Average Share Price 16.04 10.86 47.7%Closing Share Price 17.00 10.39 63.6%Market Value 6,917 4,206 64.5%Average Daily Traded Volume 27.9 27.2 2.6%Closing Exchange Rate (US$) 1.63 1.78 -8.4%Net Debt 1,898.8 413.4 359.3%NOI per share 0.39 0.23 69.7%Adjusted Net Income per share 0.14 0.10 35.4%Adjusted FFO per share 0.14 0.15 -6.7%EV/EBITDA (annualized) 15.7 13.0 20.3%P/FFO (annualized) 30.6 17.5 75.4%*Check glossary for definitions.
Market Indicators
1Q11 1Q10 %
Net Late Payments 1.3% 1.6% -0.3%Late Payments - 30 days (monthly average) 3.6% 3.7% -0.1%Tenant Turnover 5.0% 4.5% 0.5%Leasing Spread (renewals) 28.1% 18.3% 9.8%Leasing Spread (new contracts) 21.0% 12.6% 8.4%
3

Earnings Release1Q11
Management Comments:
We began 2011 with a strong outlook in the company’s three growth drivers: current malls, acquisitions anddevelopments. As in 2010, we continue to benef it f rom the continued favorable economic scenario for the country and forthe retail sector.
In 1Q11 we increased our ownership stake in Shopping Center Crystal Plaza, Shopping Piracicaba and ShoppingCuritiba, totaling R$108.7 million in investments. With the aforementioned acquisitions, we consolidate our position inCuritiba reaching an owned GLA of 74.7 thousand m². The actual NOI for our acquisitions since 2006 have delivered areal increase of 27,2% above what we had projected for 1Q11.
This week we added 30.7 thousand m² of owned GLA to our portfolio with the openings of Via Brasil Shopping and theexpansion of Shopping Tamboré, increasing our total number of malls to 40, of which 10 are located in the state of Rio deJaneiro.Janeiro.
We currently have three other greenf ield projects under development, which are according to schedule and together willadd 72.4 thousand m² of owned GLA. Mooca Plaza Shopping is expected to open on 4Q11 and has already leasedapproximately 80% of its GLA, six months prior to opening. Additionally, we have eight expansions planned to open by2013, representing an addition of 42.2 thousand m² of owned GLA.
In our current portfolio, same store sales (SSS) registered an increase of 8.7% over 1Q10, when compared to the sameperiod in the previous year, primarily impacted by the higher base of comparison in 1Q10 and the Easterseasonality, which this year occurred in the second half of April, compared to last year when it occurred in the first weekof April. Same store rent (SSR) increased around two digits, reaching 9.7% for the same period, contributed to the realincrements of rents above IGP-M.
Our NOI grew by 70.5%, compared to 1Q10, reaching R$158.6 million, with a margin of 89.5%. The same mall NOIincreased 26.0% compared to the same period in 2010, benef ited by the high rate of leasing spread and occupancy rate.Adjusted EBITDA totaled R$140.6 million, an increase of 58.6% over 1Q10, with a margin of 79.3%.
One of the highlights for this quarter was the occupancy rate which reached 98.1%, completing a full year of occupancylevels above 98% and an increase of 0.2 p.p. over 1Q10. Our net delinquency rate totaled 1.3% this quarter, a decreaseof 0.3 p.p. compared to 1Q10, which indicates the favorable conditions experienced by our tenants. The occupancy costcontinued to post low levels, ending the quarter at 10.5% and providing the opportunity for us to continue to record highleasing spreads in our renewals and new leases.
In 1Q11 we leased 218 stores, representing 21.7 thousand m² of total GLA. We highlight the leasing activity in ourIn 1Q11 we leased 218 stores, representing 21.7 thousand m² of total GLA. We highlight the leasing activity in ourgreenf ield projects and expansions that totaled 71 contracts, or 10.3 thousand m² of total GLA. The high occupancy in ourmalls, the focus in controlling occupancy cost and the good sales performance of our tenants, contributed for us to reachhigh leasing spread for renewals and new leases, reaching 28.1% and 21.0%, respectively.
The good market conditions gives us conf idence to continue to explore the growth opportunities and seek to improve oureff iciency even further. We are scheduled to open an additional greenf ield project and an expansion this year and weexpect to announce new development projects throughout the year. Furthermore, in line with our strategy, continue togrow through acquisitions.
4

Earnings Release1Q11
All the f inancial and operational information below is in reais (R$), and comparisons refer to the f irst quarter of 2011(1Q11), except where otherwise indicated. The complete f inancial statements in accordance with the accountingpractices and norms required by the CVM (Brazilian Securities & Exchange Commission) are available at the end of thisreport.
The consolidated f inancial statements have been prepared and are presented in accordance with the standards of IFRS(International Financial Reporting Standards) issued by the International Accounting Standards Board.
In compliance with CVM Instruction 603/09 and CVM 626/10, the Company is re-stating the present ITRs so that theyare also in accordance with International Accounting Standard IAS 34 - Interim Financial Statements, issued by the IASB- International Accounting Standards Board . In this context the only difference between the accounting practices earlieradopted by BR Malls and IAS 34 refers to the balance of deferred assets, which was reversed as shown in Note 2. Dueto the immateriality of this adjustment, the Company's management decided not to change the comment of performancesince the write-of f of these deferred assets does not generate signif icant impacts on the analysis, rates and results.since the write-of f of these deferred assets does not generate signif icant impacts on the analysis, rates and results.
MANAGEMENT COMMENTS ON 1Q11 RESULTS
Gross Revenues:
Base RentBase rent revenue grew R$44.2 million, or68.1%, over 1Q10, due to the increase in the leasingspread rates in new contracts and renewals, theincrease in inf lation that was ref lected in contractualadjustments and acquisitions/greenf ields concludedduring 2010, along with three stake increases in thequarter. The straight-line recognition of rent addedR$10.0 million in 1Q11;
Mall & Merchandising
Overage RentOverage rent increased R$4.3 million, or 53.0%, over1Q10, mainly driven by the 20.3% growth in total salesregistered by tenants, and acquisitions/greenf ields
During the quarter, gross revenues totaled R$193.9million, an increase of 67.2% over the same periodlast year, mainly due to the following factors:
1Q10 1Q11
115,960
193,895
Gross Revenues Growth (R$ thousand)
67.2%
Mall & MerchandisingMall and merchandising revenues amounted toR$17.0 million, up 69.7% year over year, mainly dueto acquisitions/greenf ields concluded during2010, which represented 23.5% of total mall &merchandising revenue. This revenue correspondedto 7.2% of total rent revenue in the quarter;
Services RevenuesService revenues increased R$5.3 million, or47.4%, over 1Q10, due to the higher number of mallsmanaged by the Company (29 in 1Q11 compared to22 in 1Q10) and the entry of Shopping Uberlândiainto the Shared Services Center (CSC), bringing thetotal to 23.
concluded during 2010, which represented 25.7% of totaloverage rent. This line was negatively impacted in thequarter by the Easter holiday, which distorted thecomparison base between 1Q11 and 1Q10. 30.0% of thepercentage rent came from stores that were auditedduring the quarter. Percentage rent accounted for 9.0% oftotal rent revenue in the quarter;
Key MoneyKey money increased R$7.5 million, or 152.8% over1Q10, excluding the effects of straight-line recognition.This growth was aided by the increased pace in sales ofthe Company’s greenf ield projects and the expansionscompared to the previous year. Key money, including theeffects of straight-line recognition, increased R$4.3million, or 135.1%, over 1Q10. Stock of key money in1Q11 came to R$84.4 million, an increase of 98.9% over1Q10;
5

Earnings Release1Q11
ParkingParking revenues increased R$12.7 million, or 89.9%, overthe same period last year, largely due to the change in theownership structure of the parking operations at our malls.Moreover, the entry of new malls acquired since 1Q10contributed 41.3% to the growth in this line. In 1Q11, parkingNOI grew 77.4% to reach R$22.5 million.
1Q10 1Q11
12,673
22,481
Parking NOI Evolution (R$ thousand)
77.4%
1Q10 1Q11
13.9%
8.5%
3.9%
1.3%0.9%
56.3%
6.4%8.8%
71.5%
Gross Revenues Breakdown 1Q11
Parking
Services
Key Money
Others
Transfer Fee
Base Rent
Overage Rent
Mall & Merchandising
Overage Rent
Mall & Merchandising
Base Rent
Gross Revenue Breakdown (R$ mil)
1Q10 1Q11 %
Base Rent 109,102 64,891 68.1%
Overage Rent 12,452 8,137 53.0%
Mall & Merchandising 17,020 10,032 69.7%
Parking 26,898 14,163 89.9%
Services 16,552 11,226 47.4%
Key Money 7,520 3,199 135.1%
Transfer Fee 1,779 483 268.3%
Others 2,572 3,829 -32.8%
Gross Revenue 193,895 115,960 67.2%
1Q10 1Q11 %
6

Earnings Release1Q11
Net revenues totaled R$179.1 million in 1Q11, up R$72.8million, or 68.4%, on 1Q10.
Excluding the effects of straight-line recognition, net revenueswould be R$174.1 million in the quarter, up R$67.5 million, or63.3% on 1Q10.
Net Revenues:
106,325
179,083
Net Revenues Growth (R$ thousand)
68.4%
1Q10 1Q11
Costs:
In 1Q11, costs associated with rents andservices increased R$7.1 million, or 59.6%, over1Q10. Excluding the non-recurring commoncosts of Center Shopping Uberlândia, total costswould be R$17.0 million in 1Q11, up 42.4%. Thecost components were:
11,913
19,015
Costs Growth (R$ thousand)
59.6%
Personnel CostsPersonnel costs increased R$2.5 million, mainlyimpacted by the common costs of CenterShopping Uberlândia, as explained before, whichrepresented 11.0% of total personnel costs, andthe increase in our GLA due to the addition of newmalls in our portfolio during 2010. Moreover, thechange in the ownership structure of a few parkingoperations and increased audit efforts also droveup personnel costs, but the latter resulted in a53.0% increase in percentage rent revenue duringthe quarter.
Other ServicesThe R$3.6 million increase in costs associatedwith other services was mainly due to the non-recurring common costs of Center ShoppingUberlândia, which totaled R$2.0 million in thequarter, and the increase in GLA due to newmalls being included in our portfolio during 2010.The corporate restructuring of the mall wascompleted in February 2011 and hence thesecosts started to be transferred to thecondominium, no longer impacting the Company'sresults of subsequent quarters.
1Q10 1Q11
7

Earnings Release1Q11
93,021
158,635
NOI Growth (R$ thousand) and NOI Margin (%)
70.5%
In 1Q11, NOI totaled R$158.6 million, up R$65.4million, or 70.5%, over the same period last year.NOI margin in the quarter was 89.5%, a growth of0.7 p.p. over 1Q10, once again impacted by theabove-mentioned non-recurring effects of CenterShopping Uberlândia and the change inownership at a few parking operations, which nowrecognize revenues and costs separately as ofthe end of 1Q10. NOI margin adjusted for thenon-recurring effects of Uberlândia would be91.5% in 1Q11, an increase of 2.7 p.p.
NOI:
88.8% 89.5%
1Q10 1Q11
In the quarter, same-property NOI rose by 26.0% over1Q10. Malls managed by BRMALLS registered same-property NOI growth of 27.5%. Bulk of our NOI in thequarter (89.2%) was concentrated in the 29 mallsmanaged by the Company with an average ownershipof 63.1%.
1Q10 1Q11
88,539
111,552
Same Mall NOI Growth (R$ thousand)
26.0%
Gross Revenue 193,895 115,960
(-) Services (16,552) (11,226)
(-) Costs (19,015) (11,913)
(+) Aruaguaia Debenture 1,288 1,078
NOI Reconciliation (R$ thousand)
1Q11 1Q10Shopping Tijuca 17,667 140,664
Plaza Shopping 17,512 163,688
NorteShopping 15,247 262,884
Shopping Uberlândia 8,153 104,070
Shopping Recife 7,943 263,372
Shopping Metrô Santa Cruz 7,147 74,937
Shopping Tamboré 7,091 81,980
NOI and Total Tenants´Sales by Mall (R$ million)
NOI 1Q11 Sales 1Q11
* Adjusted by Uberlândia s condominiums costs and revenues
* NOI considers the straight linning effect
(+) Presumed Credit PIS/COFINS (981) (878)
NOI 158,635 93,021
Margin % 89.5% 88.8%
Adjusted Margin % * 91.5% 88.8%
Shopping Tamboré 7,091 81,980
Shopping Del Rey 6,136 107,597
Campinas Shopping 6,102 66,405
Granja Vianna 5,664 51,419
Shopping Estação 5,335 69,178
Shopping Campo Grande 5,126 72,848
Shopping Villa-Lobos 4,754 119,772
Fashion Mall 4,709 53,605
Ilha Plaza Shopping 4,185 57,447
Independência Shopping 4,104 45,222
Goiânia Shopping 3,786 64,264 82,4% of NOI 1Q11
Others 27,972 1,451,925
Total 158,635 3,251,278
8
Earnings Release1Q11
Selling, General and Administrative Expenses:
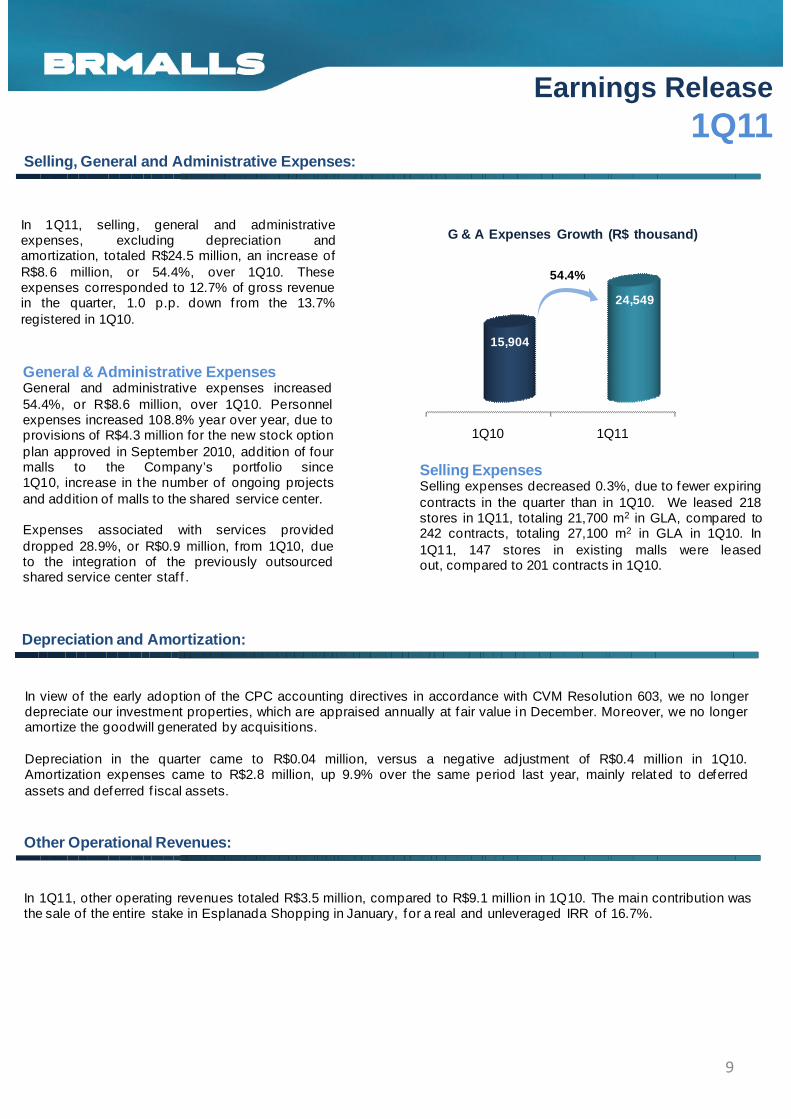
In 1Q11, selling, general and administrativeexpenses, excluding depreciation andamortization, totaled R$24.5 million, an increase ofR$8.6 million, or 54.4%, over 1Q10. Theseexpenses corresponded to 12.7% of gross revenuein the quarter, 1.0 p.p. down from the 13.7%registered in 1Q10.
General & Administrative Expenses
15,904
24,549
G & A Expenses Growth (R$ thousand)
54.4%
Selling ExpensesSelling expenses decreased 0.3%, due to fewer expiringcontracts in the quarter than in 1Q10. We leased 218stores in 1Q11, totaling 21,700 m2 in GLA, compared to242 contracts, totaling 27,100 m2 in GLA in 1Q10. In1Q11, 147 stores in existing malls were leasedout, compared to 201 contracts in 1Q10.
General & Administrative ExpensesGeneral and administrative expenses increased54.4%, or R$8.6 million, over 1Q10. Personnelexpenses increased 108.8% year over year, due toprovisions of R$4.3 million for the new stock optionplan approved in September 2010, addition of fourmalls to the Company’s portfolio since1Q10, increase in the number of ongoing projectsand addition of malls to the shared service center.
Expenses associated with services provideddropped 28.9%, or R$0.9 million, f rom 1Q10, dueto the integration of the previously outsourcedshared service center staf f .
1Q10 1Q11
Depreciation and Amortization:
In view of the early adoption of the CPC accounting directives in accordance with CVM Resolution 603, we no longerdepreciate our investment properties, which are appraised annually at fair value in December. Moreover, we no longeramortize the goodwill generated by acquisitions.
Depreciation in the quarter came to R$0.04 million, versus a negative adjustment of R$0.4 million in 1Q10.Amortization expenses came to R$2.8 million, up 9.9% over the same period last year, mainly related to deferredassets and deferred f iscal assets.
Other Operational Revenues:
In 1Q11, other operating revenues totaled R$3.5 million, compared to R$9.1 million in 1Q10. The main contribution wasthe sale of the entire stake in Esplanada Shopping in January, for a real and unleveraged IRR of 16.7%.
9
Earnings Release1Q11
EBITDA:
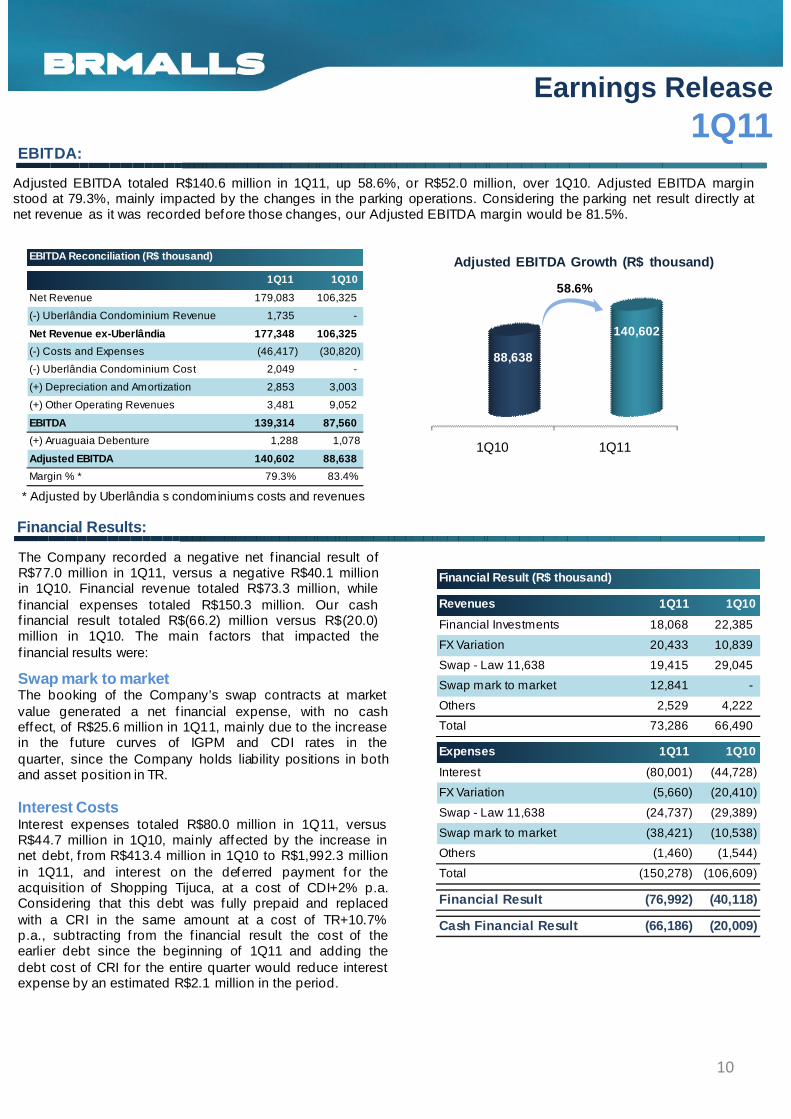
Adjusted EBITDA totaled R$140.6 million in 1Q11, up 58.6%, or R$52.0 million, over 1Q10. Adjusted EBITDA marginstood at 79.3%, mainly impacted by the changes in the parking operations. Considering the parking net result directly atnet revenue as it was recorded before those changes, our Adjusted EBITDA margin would be 81.5%.
88,638
140,602
Adjusted EBITDA Growth (R$ thousand)
58.6%Net Revenue 179,083 106,325
(-) Uberlândia Condominium Revenue 1,735 -
Net Revenue ex-Uberlândia 177,348 106,325
(-) Costs and Expenses (46,417) (30,820)
(-) Uberlândia Condominium Cost 2,049 -
EBITDA Reconciliation (R$ thousand)
1Q11 1Q10
1Q10 1Q11
Financial Results:
* Adjusted by Uberlândia s condominiums costs and revenues
The Company recorded a negative net f inancial result ofR$77.0 million in 1Q11, versus a negative R$40.1 millionin 1Q10. Financial revenue totaled R$73.3 million, whilef inancial expenses totaled R$150.3 million. Our cashf inancial result totaled R$(66.2) million versus R$(20.0)million in 1Q10. The main factors that impacted thef inancial results were:
Swap mark to marketThe booking of the Company’s swap contracts at marketvalue generated a net f inancial expense, with no casheffect, of R$25.6 million in 1Q11, mainly due to the increasein the future curves of IGPM and CDI rates in the
Financial Investments 18,068 22,385
FX Variation 20,433 10,839
Swap - Law 11,638 19,415 29,045
Swap mark to market 12,841 -
Others 2,529 4,222
Total 73,286 66,490
Financial Result (R$ thousand)
Revenues 1Q11 1Q10
Expenses 1Q11 1Q10
(-) Uberlândia Condominium Cost 2,049 -
(+) Depreciation and Amortization 2,853 3,003
(+) Other Operating Revenues 3,481 9,052
EBITDA 139,314 87,560
(+) Aruaguaia Debenture 1,288 1,078
Adjusted EBITDA 140,602 88,638
Margin % * 79.3% 83.4%
in the future curves of IGPM and CDI rates in thequarter, since the Company holds liability positions in bothand asset position in TR.
Interest CostsInterest expenses totaled R$80.0 million in 1Q11, versusR$44.7 million in 1Q10, mainly affected by the increase innet debt, f rom R$413.4 million in 1Q10 to R$1,992.3 millionin 1Q11, and interest on the deferred payment for theacquisition of Shopping Tijuca, at a cost of CDI+2% p.a.Considering that this debt was fully prepaid and replacedwith a CRI in the same amount at a cost of TR+10.7%p.a., subtracting f rom the f inancial result the cost of theearlier debt since the beginning of 1Q11 and adding thedebt cost of CRI for the entire quarter would reduce interestexpense by an estimated R$2.1 million in the period.
Interest (80,001) (44,728)
FX Variation (5,660) (20,410)
Swap - Law 11,638 (24,737) (29,389)
Swap mark to market (38,421) (10,538)
Others (1,460) (1,544)
Total (150,278) (106,609)
Financial Result (76,992) (40,118)
Cash Financial Result (66,186) (20,009)
Expenses 1Q11 1Q10
10

Earnings Release1Q11
Net Income:
Net income in 1Q11 was R$57.2 million, 36.1% more than in 1Q10. Earnings per share was R$0.14.
42,052
57,224
Adjusted Net Income Growth (R$ thousand)
36.1%
1Q10 1Q11
AFFO:
Adjusted FFO amounted to R$56.4 million in 1Q11, down R$3.7 million from the R$60.2 million in 1Q10. Adjusted FFOmargin was 31.5%, impacted by a reduction in the cash position and an increase in the f inancial expenses as a result ofthe increase in gross debt and the variations in the debt indicators. Adjusting R$4.3 million due to provisions for thestock option plan, our Adjusted FFO would be R$60.7 million, with a margin of 33.9%. In 1Q11, the Company prepaidthe deferred payments for the acquisition of Shopping Tijuca, which had a cost of CDI+2% p.a. by replacing it with aR$500 million debt at TR+10.7% p.a., which should reduce interest expenses in the coming quarters.
FFO Reconciliation (R$ thousand)
1Q11 1Q10
1Q10 1Q11
60,17756,433
Adjusted FFO Growth (R$ thousand)
-6.2%
Net Income 57,224 42,052
(+) Depreciation and Amortization 2,853 3,003
FFO 60,077 45,055
(-) FX Variation 14,774 (9,571)
(-) Swap - Law 11.638 (25,580) (10,538)
(-) Non-cash Taxes Adjustment (14,450) (4,987)
Adjusted FFO 56,433 60,177
Margin % 31.5% 56.6%
1Q11 1Q10
11

Earnings Release1Q11
CAPEX:
AcquisitionsTotal of R$37.3 million relating to the acquisitionsof Shopping Crystal Plaza, Shopping Piracicabaand Shopping Curitiba;
Expansions and RenovationsTotal of R$39.5 million, bulk of it for the expansion
During the quarter, the Company invested R$147.3 million, as follows:
25.3%
1.0%
CAPEX Breakdown
AcquisitionsTotal of R$39.5 million, bulk of it for the expansionof Shopping Tamboré, inaugurated on April28, 2011, and for ongoing renovation works;
Greenfield ProjectsTotal of R$69.0 million, mainly relating to works atShopping Mooca, expected to be completed in4Q11, in addition to other greenf ield projectsalready announced;
OthersTotal of R$1.4 million invested in internal systemsand processes, among others.
26.9%
46.8%
Expansions and Renovations
Greenf ield Projects
Others
12

Earnings Release1Q11
We ended the quarter with gross debt of R$2,623.7million, up R$1,057.8 million over the year ended 2010. Theincrease was mainly due to the issue of the CRI for ShoppingTijuca in the quarter. Using the CRI funds, the Companyprepaid the deferred payment for the acquisition of ShoppingTijuca. The replacement of this deferred payment with theCRI will represent for the upcoming quarters a debt costreduction of around 100 bps. The increase in gross debt wasalso impacted by the perpetual bonds issued in January inthe amount of US$ 230 million at a cost of US$ + 8.5%. Thecoupon was swapped to 99.15% of CDI for a term of 5 years.The balance at the end of the quarter was R$380.7 million.Additionally, we releveraged the CRI for the expansion of
IPCA12.7%
Dólares (USD)19,7%
TR43.4%
Debt Indices (as a % of the total)
Cash and Total Debt:
We ended the quarter with cash of R$725.0million, up R$407.3 million over 4Q10, mainlycaused by the above-mentioned new fundingoperations and the disbursement of R$520.5 millionfor prepaying the deferred payment for theacquisition of Shopping Tijuca, as well as thedisbursements for acquiring additional stakes inShopping Crystal Plaza, Shopping Piracicaba andShopping Curitiba.
Considering the net result of the above-mentioneddisbursements, net debt totaled R$1,898.8
Additionally, we releveraged the CRI for the expansion ofShopping Tamboré in the quarter, raising R$150 million. Thethree borrowings accounted for R$1.0 billion of the R$1.1billion increase in gross debt. We also signed the loan of SãoBernardo totaling R$107.0 million, with 12 yearinstallments, 2 years of grace period, and a cost ofTR+10.65% p.a.
2011 2012 2013 2014 2015 2016 2017 2018 2019 2020 2021 2022 2023 onwards
114 127
237 239 231 231
150 151 14294 76 69
861Debt Amortization Schedule (R$ million)
IGP-M13.1%
TJLP0.5%
CDI1.9%
1Q11 4Q10
Main Indicators (R$ thousand)
disbursements, net debt totaled R$1,898.8million, R$650.6 million more than in 4Q10. Debtcontinues to be long-term (94.3% of gross debt) withthe amortization schedule averaging 11.0years, compared to 10.8 years in 4Q10. Average costdecreased since the last quarter f rom IGP-M + 7.55%to IGP-M + 6.70%, representing a nominal cost of debtof 12.92% p.a.
Cash Position 724,993 317,716
Average Remuneration 101.1% 101.8%
Gross Debt (R$ thousand) 2,623,751 1,565,896
Duration (years) 11.0 10.8
Average Cost IGP-M + 6,70% IGP-M + 7,55%
Net Debt 1,898,758 1,248,180
Net Debt / annualized EBITDA 3.38 0.45
Net Debt (ex-perpetuals) / an. EBITDA 2.18 0.35
EBITDA / Net Financial Expenses 7.30 10.40
Gross Debt / EBITDA 4.67 0.57
FFO / Gross Debt 0.09 0.18
13
Earnings Release1Q11
Operational Indicators:
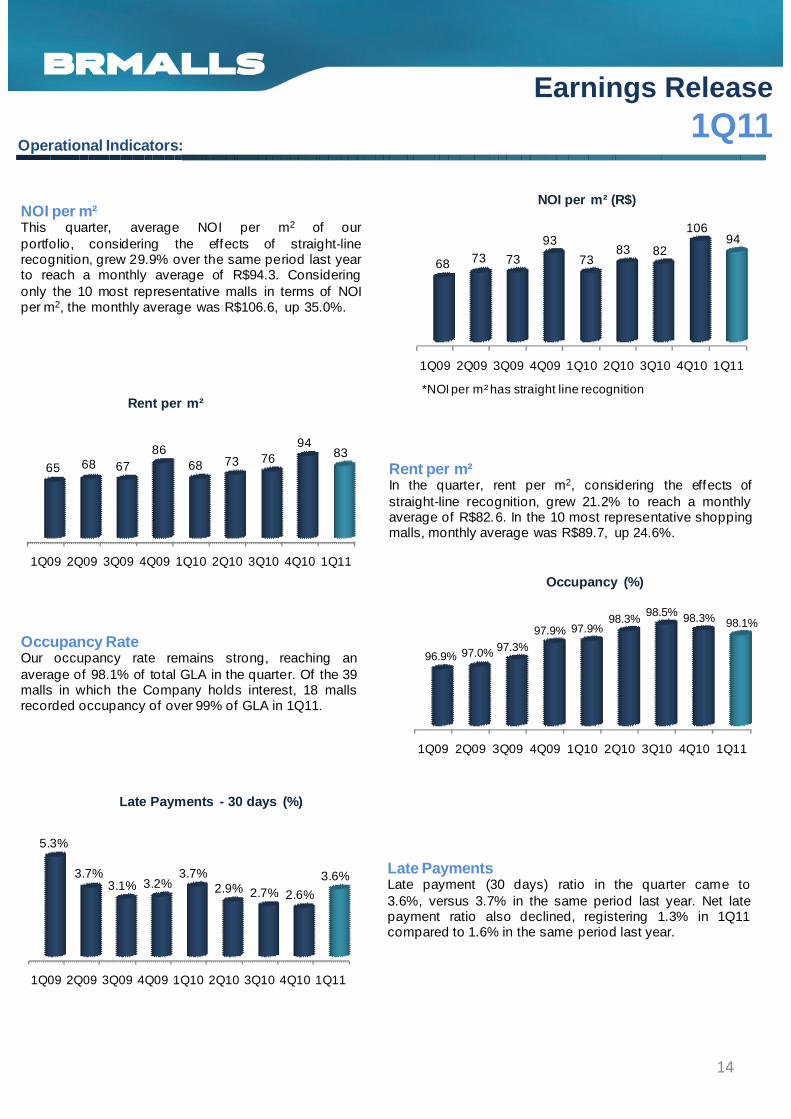
NOI per m²This quarter, average NOI per m2 of ourportfolio, considering the effects of straight-linerecognition, grew 29.9% over the same period last yearto reach a monthly average of R$94.3. Consideringonly the 10 most representative malls in terms of NOIper m2, the monthly average was R$106.6, up 35.0%.
1Q09 2Q09 3Q09 4Q09 1Q10 2Q10 3Q10 4Q10 1Q11
68 73 73
93
7383 82
10694
NOI per m² (R$)
Rent per m²In the quarter, rent per m2, considering the effects ofstraight-line recognition, grew 21.2% to reach a monthlyaverage of R$82.6. In the 10 most representative shoppingmalls, monthly average was R$89.7, up 24.6%.
Occupancy RateOur occupancy rate remains strong, reaching anaverage of 98.1% of total GLA in the quarter. Of the 39malls in which the Company holds interest, 18 mallsrecorded occupancy of over 99% of GLA in 1Q11.
1Q09 2Q09 3Q09 4Q09 1Q10 2Q10 3Q10 4Q10 1Q11
*NOI per m² has straight line recognition
1Q09 2Q09 3Q09 4Q09 1Q10 2Q10 3Q10 4Q10 1Q11
65 68 6786
68 73 7694
83
Rent per m²
1Q09 2Q09 3Q09 4Q09 1Q10 2Q10 3Q10 4Q10 1Q11
96.9% 97.0% 97.3%97.9% 97.9%
98.3%98.5% 98.3% 98.1%
Occupancy (%)
Late PaymentsLate payment (30 days) ratio in the quarter came to3.6%, versus 3.7% in the same period last year. Net latepayment ratio also declined, registering 1.3% in 1Q11compared to 1.6% in the same period last year.
1Q09 2Q09 3Q09 4Q09 1Q10 2Q10 3Q10 4Q10 1Q11
1Q09 2Q09 3Q09 4Q09 1Q10 2Q10 3Q10 4Q10 1Q11
5.3%
3.7%3.1% 3.2%
3.7%2.9% 2.7% 2.6%
3.6%
Late Payments - 30 days (%)
14
Earnings Release1Q11
1Q09 2Q09 3Q09 4Q09 1Q10 2Q10 3Q10 4Q10 1Q11
4.2% 3.7% 3.6% 2.9% 3.8% 3.4% 3.4% 2.9% 4.0%
6.6%6.1% 6.1% 6.1%
6.4%5.8% 5.8% 6.0%
6.5%
Occupancy Cost Breakdown (% of Sales)
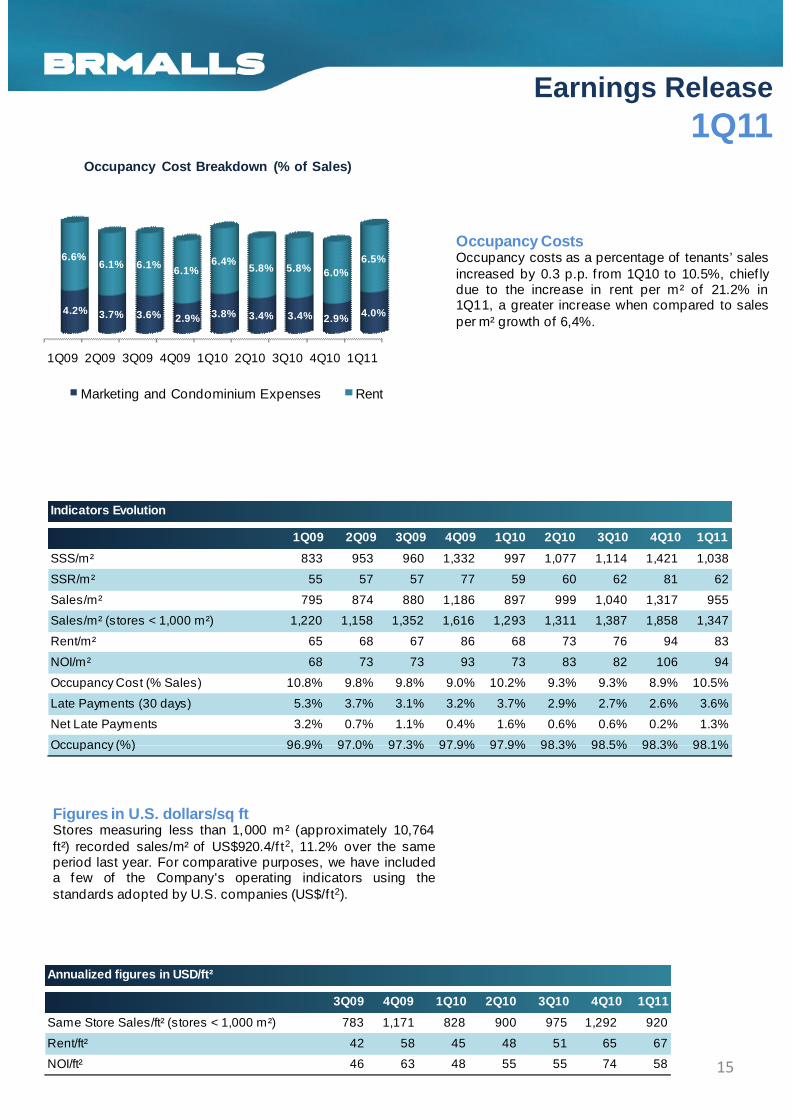
Occupancy CostsOccupancy costs as a percentage of tenants’ salesincreased by 0.3 p.p. f rom 1Q10 to 10.5%, chief lydue to the increase in rent per m² of 21.2% in1Q11, a greater increase when compared to salesper m² growth of 6,4%.
Marketing and Condominium Expenses Rent
SSS/m² 833 953 960 1,332 997 1,077 1,114 1,421 1,038
SSR/m² 55 57 57 77 59 60 62 81 62
Sales/m² 795 874 880 1,186 897 999 1,040 1,317 955
Sales/m² (stores < 1,000 m²) 1,220 1,158 1,352 1,616 1,293 1,311 1,387 1,858 1,347
Rent/m² 65 68 67 86 68 73 76 94 83
NOI/m² 68 73 73 93 73 83 82 106 94
Occupancy Cost (% Sales) 10.8% 9.8% 9.8% 9.0% 10.2% 9.3% 9.3% 8.9% 10.5%
Late Payments (30 days) 5.3% 3.7% 3.1% 3.2% 3.7% 2.9% 2.7% 2.6% 3.6%
Net Late Payments 3.2% 0.7% 1.1% 0.4% 1.6% 0.6% 0.6% 0.2% 1.3%
Occupancy (%) 96.9% 97.0% 97.3% 97.9% 97.9% 98.3% 98.5% 98.3% 98.1%
1Q09 2Q09 3Q09 4Q09 1Q10 2Q10 3Q10 4Q10 1Q11
Indicators Evolution
Figures in U.S. dollars/sq ftStores measuring less than 1,000 m² (approximately 10,764ft²) recorded sales/m² of US$920.4/f t2, 11.2% over the sameperiod last year. For comparative purposes, we have includeda few of the Company's operating indicators using thestandards adopted by U.S. companies (US$/f t2).
Occupancy (%) 96.9% 97.0% 97.3% 97.9% 97.9% 98.3% 98.5% 98.3% 98.1%
Same Store Sales/ft² (stores < 1,000 m²) 783 1,171 828 900 975 1,292 920
Rent/ft² 42 58 45 48 51 65 67
NOI/ft² 46 63 48 55 55 74 58
Annualized figures in USD/ft²
3Q09 4Q09 1Q10 2Q10 3Q10 4Q10 1Q11
15

Earnings Release1Q11
Sales Performance:
In 1Q11, 39 malls in the Company’s portfoliorecorded total sales of R$3.3 billion, 20.3% morethan in 1Q10. Same-store sales grew 8.7%, againstthe 16.2% growth recorded in 1Q10. This slowdownwas mainly caused by the high comparison baseand, to a lesser degree, the Easter holiday whichoccurred in the third week of April this year, whilelast year it fell in the f irst week of April. Leisure andsatellite stores were the top performers with same-store sales growth of 18.5% and11.6%, respectively. On the other hand, anchor 0.9%
6.7%
11.6%
18.5%
Same Store Sales per Segment (1Q11 versus 1Q10)
SSS (%) % of NOI
11.6%, respectively. On the other hand, anchorstores, due to the above-mentionedeffects, contributed to the slowdown in same-storesales, registering 0.9% in the quarter.
In regional terms, the Midwest led the SSSgrowth rankings, with a 10.7% upturn over1Q10, driven by Araguaia Shopping. TheSoutheast region, which accounts for 76.6% ofthe company's NOI, grew 8.6%, led by ShoppingMetrô Santa Cruz, which recorded SSS of 20.4%.
Anchors Megastore Satellites Leisure
0.9%
3.4%
8.5% 8.6 %
6.8%
10.7%
6,4% 7,5%
Low-middle Middle Upper-middle Upper
In terms of income segment, the shopping mallstargeted at the upper-middle class posted thehighest growth of 10.9% over 1Q10, driven byshopping malls Goiânia Shopping and ShoppingUberlândia, which registered SSS of 20.9% and14.2%, respectively. Malls targeting the lower-middle class also registered above-average SSSgrowth of 9.7%.
10,9%
7,1%
36,7%
40,3%
15,6%9,7%
16
Earnings Release1Q11Leasing Activity:
17.7%13.9%
8.1%
14.7%18.3%
22.3% 22.5%
27.7% 28.1%
Renewals Leasing Spread (%)
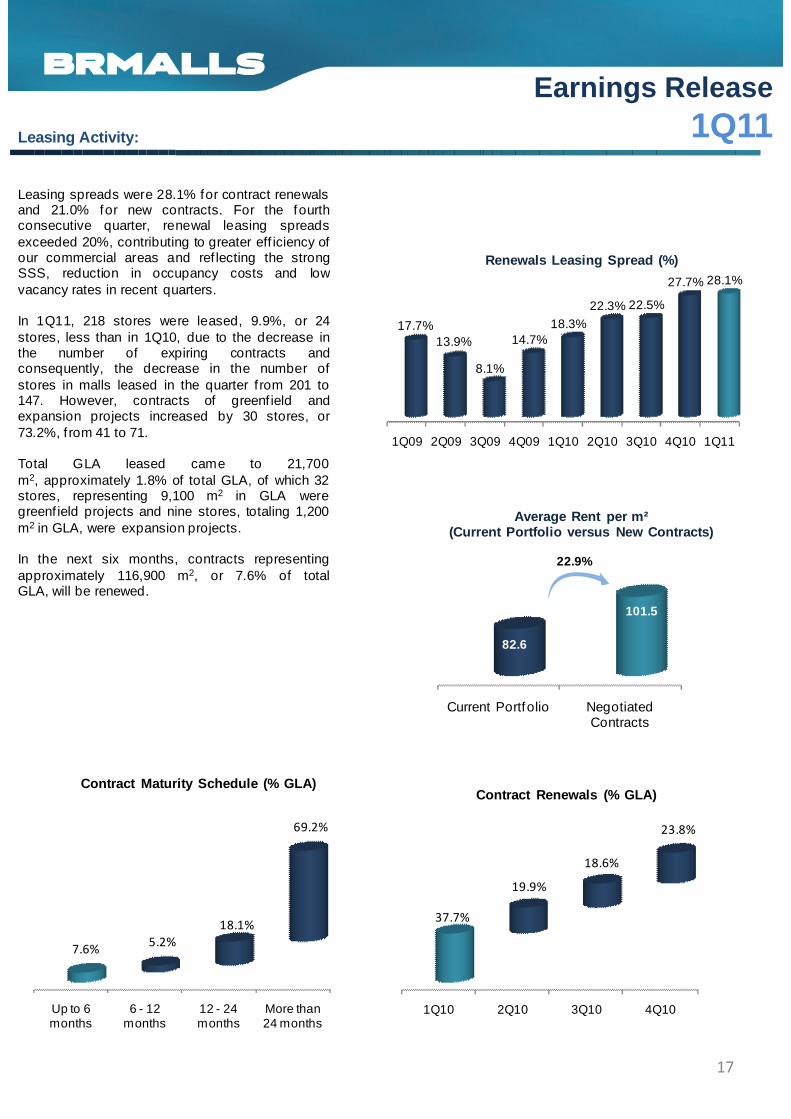
Leasing spreads were 28.1% for contract renewalsand 21.0% for new contracts. For the fourthconsecutive quarter, renewal leasing spreadsexceeded 20%, contributing to greater eff iciency ofour commercial areas and ref lecting the strongSSS, reduction in occupancy costs and lowvacancy rates in recent quarters.
In 1Q11, 218 stores were leased, 9.9%, or 24stores, less than in 1Q10, due to the decrease inthe number of expiring contracts andconsequently, the decrease in the number of
Current Portfolio Negotiated Contracts
82.6
101.5
Average Rent per m² (Current Portfolio versus New Contracts)
22.9%
1Q09 2Q09 3Q09 4Q09 1Q10 2Q10 3Q10 4Q10 1Q11
8.1%consequently, the decrease in the number ofstores in malls leased in the quarter f rom 201 to147. However, contracts of greenf ield andexpansion projects increased by 30 stores, or73.2%, from 41 to 71.
Total GLA leased came to 21,700m2, approximately 1.8% of total GLA, of which 32stores, representing 9,100 m2 in GLA weregreenf ield projects and nine stores, totaling 1,200m2 in GLA, were expansion projects.
In the next six months, contracts representingapproximately 116,900 m2, or 7.6% of totalGLA, will be renewed.
Up to 6 months
6 - 12 months
12 - 24 months
More than 24 months
7.6%5.2%
18.1%
69.2%
Contract Maturity Schedule (% GLA)
1Q10 2Q10 3Q10 4Q10
37.7%
19.9%
18.6%
23.8%
Contract Renewals (% GLA)
17

Earnings Release1Q11
Acquisitions:
62,378 79,356
NOI of Realized Acquisitions (R$ thousand)
27.2%
In 1Q11, the Company increased its stake inShopping Center Crystal Plaza, ShoppingPiracicaba and Shopping Curitiba. These threeacquisitions added 11,200 m2 of owned GLA tothe BRMALLS portfolio, for a total investment ofR$108.7 million.
NOI in this quarter f rom the malls that wereacquired since 2006 continue to outperform theNOI projected in the feasibility studies at the timeof the acquisitions, representing a real growth of27.2% for 1Q11.
Projected NOI 1Q11
Realized NOI 1Q11
27.2% for 1Q11.
Increase in Ownership Interest - Shopping CenterCystal Plaza
In January 2011, the Company acquired additionalstake in Shopping Crystal Plaza in Curitiba, raisingits interest f rom 40% to 70% in the mall and adding3,700 m2 of owned GLA to its portfolio. Theinvestment was R$43.1 million, with an estimatedcap rate of 11.5% for 2011, and real andunleveraged IRR of 13.4%.
This acquisition consolidates our position inShopping Crystal Plaza, a mall we believe hasimportant upsides, and where the estimated 100% ofimportant upsides, and where the estimated 100% ofNOI from the mall for 2011 was recently revised f romR$14.1 million to R$14.8 million.
18
Earnings Release1Q11
Increase in Ownership Interest - Shopping Piracicaba
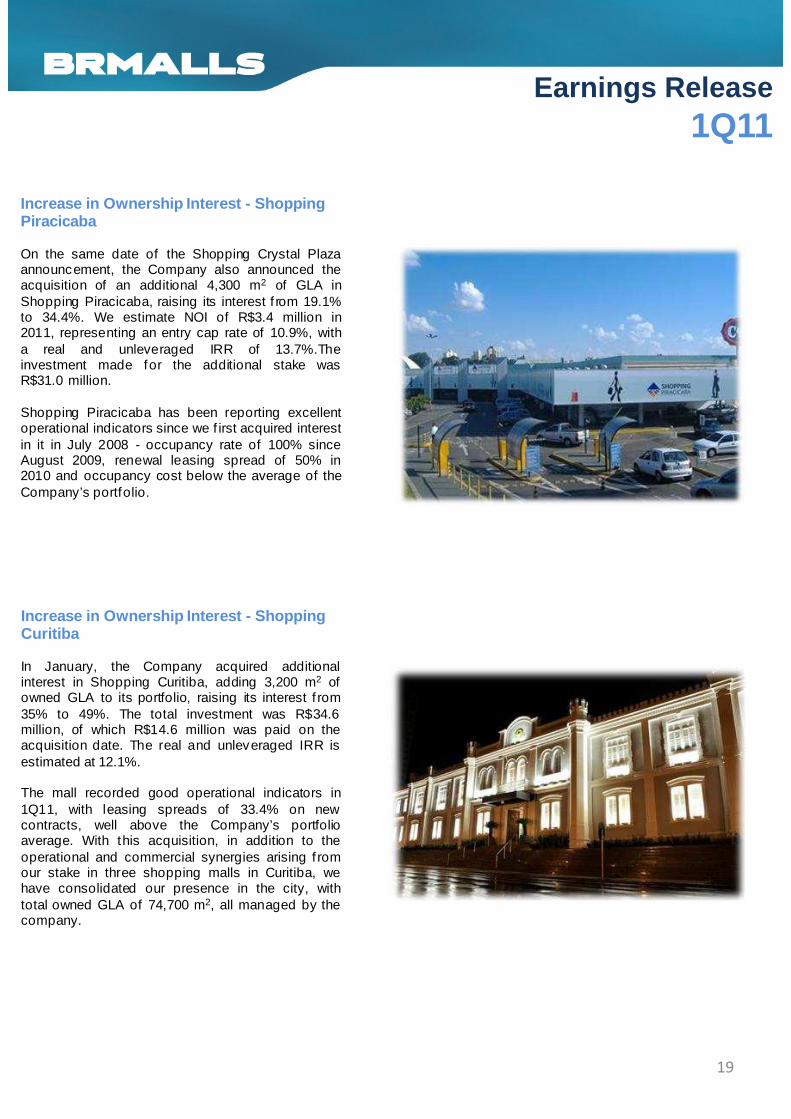
On the same date of the Shopping Crystal Plazaannouncement, the Company also announced theacquisition of an additional 4,300 m2 of GLA inShopping Piracicaba, raising its interest f rom 19.1%to 34.4%. We estimate NOI of R$3.4 million in2011, representing an entry cap rate of 10.9%, witha real and unleveraged IRR of 13.7%.Theinvestment made for the additional stake wasinvestment made for the additional stake wasR$31.0 million.
Shopping Piracicaba has been reporting excellentoperational indicators since we f irst acquired interestin it in July 2008 - occupancy rate of 100% sinceAugust 2009, renewal leasing spread of 50% in2010 and occupancy cost below the average of theCompany’s portfolio.
Increase in Ownership Interest - Shopping Curitiba
In January, the Company acquired additionalinterest in Shopping Curitiba, adding 3,200 m2 ofowned GLA to its portfolio, raising its interest f rom35% to 49%. The total investment was R$34.6million, of which R$14.6 million was paid on theacquisition date. The real and unleveraged IRR isacquisition date. The real and unleveraged IRR isestimated at 12.1%.
The mall recorded good operational indicators in1Q11, with leasing spreads of 33.4% on newcontracts, well above the Company’s portfolioaverage. With this acquisition, in addition to theoperational and commercial synergies arising f romour stake in three shopping malls in Curitiba, wehave consolidated our presence in the city, withtotal owned GLA of 74,700 m2, all managed by thecompany.
19
Earnings Release1Q11
Expansions:
Owned GLA with ExpansionsExpansions CAPEX Schedule (R$ thousand)
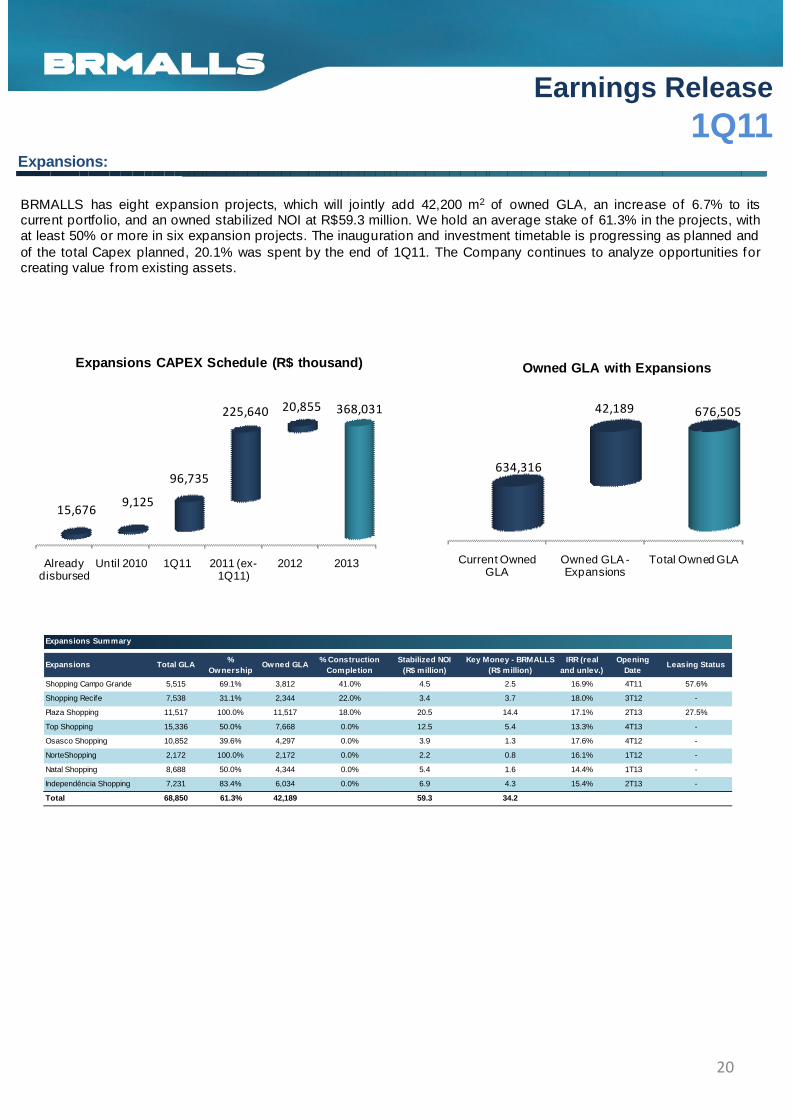
BRMALLS has eight expansion projects, which will jointly add 42,200 m2 of owned GLA, an increase of 6.7% to itscurrent portfolio, and an owned stabilized NOI at R$59.3 million. We hold an average stake of 61.3% in the projects, withat least 50% or more in six expansion projects. The inauguration and investment timetable is progressing as planned andof the total Capex planned, 20.1% was spent by the end of 1Q11. The Company continues to analyze opportunities forcreating value from existing assets.
Current Owned GLA
Owned GLA -Expansions
Total Owned GLA
634,316
676,50542,189
Owned GLA with Expansions
Already disbursed
Until 2010 1Q11 2011 (ex-1Q11)
2012 2013
15,676
20,855 368,031
9,125
96,735
225,640
Expansions Total GLA%
OwnershipOwned GLA
% Construction Completion
Stabilized NOI (R$ million)
Key Money - BRMALLS (R$ million)
IRR (real and unlev.)
Opening Date
Leasing Status
Shopping Campo Grande 5,515 69.1% 3,812 41.0% 4.5 2.5 16.9% 4T11 57.6%
Shopping Recife 7,538 31.1% 2,344 22.0% 3.4 3.7 18.0% 3T12 -
Plaza Shopping 11,517 100.0% 11,517 18.0% 20.5 14.4 17.1% 2T13 27.5%
Top Shopping 15,336 50.0% 7,668 0.0% 12.5 5.4 13.3% 4T13 -
Osasco Shopping 10,852 39.6% 4,297 0.0% 3.9 1.3 17.6% 4T12 -
Expansions Summary
NorteShopping 2,172 100.0% 2,172 0.0% 2.2 0.8 16.1% 1T12 -
Natal Shopping 8,688 50.0% 4,344 0.0% 5.4 1.6 14.4% 1T13 -
Independência Shopping 7,231 83.4% 6,034 0.0% 6.9 4.3 15.4% 2T13 -
Total 68,850 61.3% 42,189 59.3 34.2
20

Earnings Release1Q11
Shopping Tamboré Expansion
The expansion of Shopping Tamboré, BRMALLS’sseventh expansion, was launched yesterday. ShoppingTamboré was inaugurated in 1992 and this will be our7th expansion, which will increase the mall’s GLA byalmost 50% and add 15,100 m2 to total GLA.
The mall had been registering an occupancy rate of100% since November 2008, which contributed to thesuccessful leasing out of the expansion, which openedwith 100% of its GLA occupied.with 100% of its GLA occupied.
We expect the expansion to add R$20.4 million instabilized NOI for BRMALLS, an increase of 60.0% to theNOI delivered by the mall in 2010. Af ter thisexpansion, the consolidated NOI will reach R$46.5million, representing an increase of 200.0% over the NOIin 2007, when the mall was acquired by BRMALLS, anda CAGR of 31.6%.
Shopping Campo Grande Expansion
This expansion to be launched in 4Q11 by the Companywill add 5,500 m2 to total GLA, an increase of 16.5% tothe mall’s total GLA. Our stake will be 69.1% in thisexpansion.
Shopping Campo Grande will add a stabilized NOI ofR$4.5 million to the Company. It has been registering astrong pace of leasing, with 50.0% of its GLA alreadyleased out, 8 months before inauguration.
21

Earnings Release1Q11
Developments:
Owned GLA with DevelopmentsGreenfield Capex Schedule (R$ thousand)
We have three greenf ield projects under way, one of which (Mooca Plaza Shopping) is scheduled to open in 4Q11.These projects will add 72,400 m2 of owned GLA, a growth of 11.4% to the present owned GLA.Own investment in 2011 is around R$226.6 million, 16.3% was spent during the 1Q11. Our average interest is 60.0%and stabilized NOI for the Company is estimated at R$87.7 million.
Current Owned GLA
Owned GLA -Developments
Total Owned GLA
634,316
706,68772,370
Until 2010 1Q112011 (ex-1Q11) 2012 2013 2014 Total
103,656
994 433,610
31,709
194,859
99,680 2,712
Projects Total GLA%
OwnershipOwned GLA
% Construction Evolution
Stabilized NOI (R$ million)
Key Money - BRMALLS (R$ million)
IRR (real and unlev.)
Opening Date
Leasing Status
Mooca Plaza Shopping 41,963 60.0% 25,178 39.5% 33.3 18.1 18.3% 4T11 79.7%
Shopping Estação BH 36,317 60.0% 21,790 37.0% 23.6 11.0 19.2% 1T12 66.4%
São Bernardo 42,338 60.0% 25,403 16.6% 30.7 14.3 16.8% 4T12 17.3%
Total 120,617 60.0% 72,370 87.7 43.5
Greenfield Projects
22

Earnings Release1Q11
Inauguration - Via Brasil Shopping
This week, we opened Via Brasil Shopping, BRMALLS’s40th shopping mall, its 10th in the state of Rio de Janeiroand the 3rd shopping mall opened in about six months.The project was acquired by BRMALLS in May 2010 whenit was still in progress.
This mall is strategically located at the junction of AvenidaBrasil with the Presidente Dutra Highway, two high-traff icroads, which will contribute to a higher number of visitorsto the mall.
The mall, which was initially leased by an independentcompany, opens with 95% of its GLA leased. In February2011, BRMALLS became responsible forleasing, therefore implementing its expertise on theleasing activity. The occupancy rate grew from 82% to95% in only 2 months.
The inauguration added 30,700 m2 of total GLA and15,000 m2 of owned GLA, contributing to increases of2.4% and 4.9%, respectively. We estimate the mall to addR$13.9 million in stabilized NOI.
Mooca Plaza Shopping
Works in the mall are already in an advanced stage andare in line with the expected inauguration in 4Q11. Onceinaugurated, Mooca Plaza Shopping will add 42,000 m2 oftotal GLA and 25,200 m2 of owned GLA, representingincreases of 3.5% and 4.2%, respectively.
Of the mall’s total GLA, 79.7% has already been leased 8months before inauguration. We estimate the mall to addmonths before inauguration. We estimate the mall to addR$33.3 million to our stabilized NOI.
23
Earnings Release1Q11Capital Markets:
Regional Shareholder Distribution (31/03/2011)
A BRMALLS tem sua ação ordinária negociada no NovoMercado da BM&F Bovespa sob o código BRML3. Aempresa também possui um programa de ADR nível1, permitindo a negociação das ações no mercadosecundário ou de balcão nos Estados Unidos, sob ocódigo BRMLL, disponibilizando as ações a um númeromaior de investidores nos Estados Unidos e no mundo.
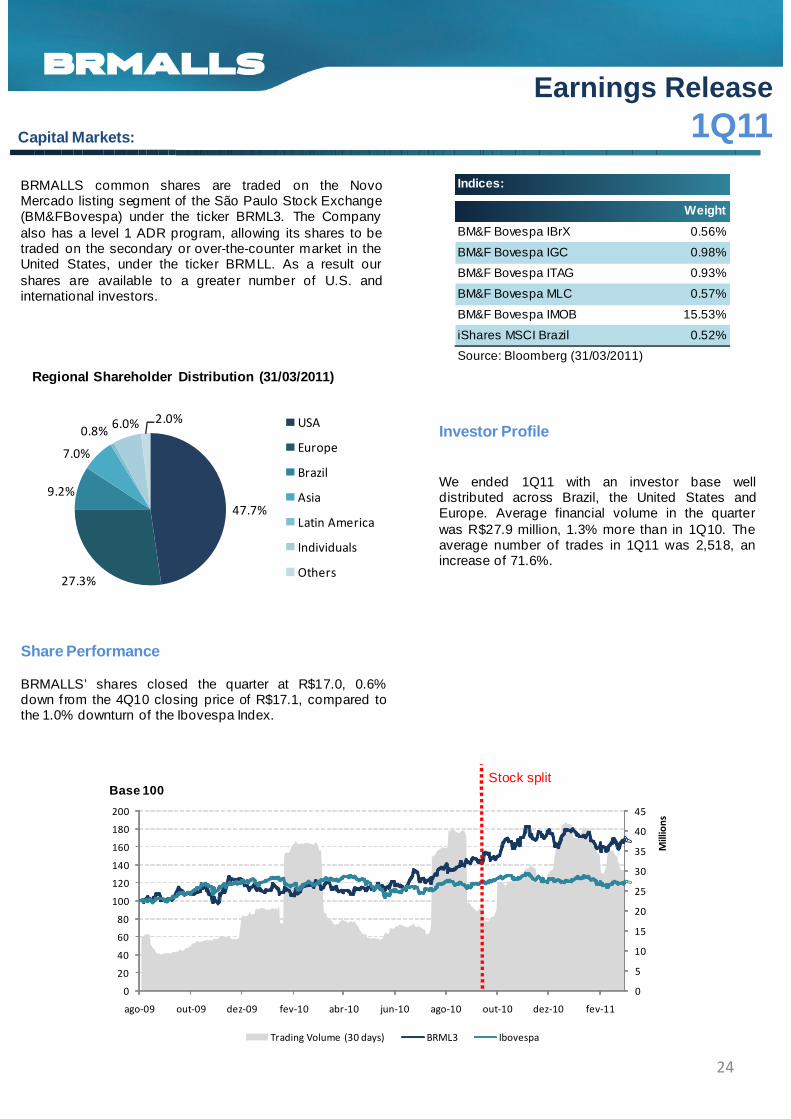
BRMALLS common shares are traded on the NovoMercado listing segment of the São Paulo Stock Exchange(BM&FBovespa) under the ticker BRML3. The Companyalso has a level 1 ADR program, allowing its shares to betraded on the secondary or over-the-counter market in theUnited States, under the ticker BRMLL. As a result ourshares are available to a greater number of U.S. andinternational investors.
BM&F Bovespa IBrX 0.56%
BM&F Bovespa IGC 0.98%
BM&F Bovespa ITAG 0.93%
BM&F Bovespa MLC 0.57%
BM&F Bovespa IMOB 15.53%
iShares MSCI Brazil 0.52%
Source: Bloomberg (31/03/2011)
Indices:
Weight
47.7%
27.3%
9.2%
7.0%
0.8%6.0% 2.0%
Regional Shareholder Distribution (31/03/2011)
USA
Europe
Brazil
Asia
Latin America
Individuals
Others
Share Performance
BRMALLS’ shares closed the quarter at R$17.0, 0.6%down from the 4Q10 closing price of R$17.1, compared tothe 1.0% downturn of the Ibovespa Index.
Investor Profile
We ended 1Q11 with an investor base welldistributed across Brazil, the United States andEurope. Average financial volume in the quarterwas R$27.9 million, 1.3% more than in 1Q10. Theaverage number of trades in 1Q11 was 2,518, anincrease of 71.6%.
0
5
10
15
20
25
30
35
40
45
0
20
40
60
80
100
120
140
160
180
200
ago-09 out-09 dez-09 fev-10 abr-10 jun-10 ago-10 out-10 dez-10 fev-11
Millions
Trading Volume (30 days) BRML3 Ibovespa
Stock splitBase 100
24

Earnings Release1Q11
Our Portfolio:
BRMALLS currently holds an ownership interest in 40 malls, with a total GLA of 1,219,218 m² and owned GLA of634,316 m². Our average ownership interest is 52.0%. The malls in which we retain a 50% or higher interest account for83.6% of our NOI and our interest in these 19 malls averages 82.3%. Of our portfolio, nine malls are 100% owned. Weprovide services for 32 of our 40 malls. We provide leasing services to 32 malls in our portfolio and managementservices to 29, while 24 are serviced by the CSC (shared service center).
Our malls have 6,900 stores and attract millions of visitors per year. BRMALLS is the only shopping mall company inBrazil with a nationwide presence and targeting all income segments.
Maceió Shopping AL 34,742 34.2% 11,892Amazonas Shopping AM 34,214 17.9% 6,124 Manag./Leasing/CSCAraguaia Shopping GO 22,078 50.0% 11,039 Manag. / Leasing
Mall State Total GLA % Owned GLA Services
Araguaia Shopping GO 22,078 50.0% 11,039 Manag. / LeasingGoiânia Shopping GO 22,692 48.4% 10,983 Manag./Leasing/CSCSão Luís Shopping MA 34,123 15.0% 5,118Center Shopping Uberlândia MG 52,415 51.0% 26,732 Manag./Leasing/CSCShopping Del Rey MG 37,171 65.0% 24,161 Manag./Leasing/CSCShopping Sete Lagoas MG 16,451 70.0% 11,515 Manag./Leasing/CSCIndependência Shopping MG 23,214 83.4% 19,360 Manag./Leasing/CSCMinas Shopping MG 35,120 2.1% 747Big Shopping MG 17,555 13.0% 2,282Shopping Campo Grande MS 33,415 71.2% 23,792 Manag./Leasing/CSCPantanal Shopping MT 43,187 10.0% 4,319Shopping Pátio Belém PA 20,631 13.3% 2,744Shopping Recife PE 61,079 31.1% 18,968 Shared Management / LeasingShopping Crystal Plaza PR 12,686 70.0% 8,880 Manag. / LeasingShopping Curitiba PR 23,379 49.0% 11,456 Manag./Leasing/CSCShopping Estação PR 54,716 100.0% 54,716 Manag./Leasing/CSCWest Shopping RJ 38,481 30.0% 11,544 Manag. / LeasingCenter Shopping RJ 14,294 30.0% 4,288 Manag. / LeasingNorteshopping RJ 77,908 74.5% 58,041 Manag./Leasing/CSCPlaza Shopping RJ 33,196 100.0% 33,196 Manag./Leasing/CSCFashion Mall RJ 14,886 100.0% 14,886 Manag./Leasing/CSCIlha Plaza Shopping RJ 21,614 100.0% 21,614 Manag./Leasing/CSCRio Plaza Shopping RJ 6,955 100.0% 6,955 Manag./Leasing/CSCShopping Tijuca RJ 35,055 100.0% 35,055 Manag./Leasing/CSCTop Shopping RJ 18,168 35.0% 6,359 LeasingTop Shopping RJ 18,168 35.0% 6,359 LeasingVia Brasil Shopping RJ 30,680 49.0% 15,033 Manag. / Leasing/CSCNatal Shopping RN 17,690 50.0% 8,845 LeasingShopping Iguatemi Caxias do Sul RS 29,101 45.5% 13,241 Manag./Leasing/CSCShopping Mueller Joinville SC 27,453 10.4% 2,855Shopping ABC SP 46,285 1.3% 602 Manag./Leasing/CSCShopping Piracicaba SP 27,870 34.4% 9,587 Manag./Leasing/CSCShopping Villa-Lobos SP 27,023 39.7% 10,733 Manag./Leasing/CSCGranja Vianna SP 29,813 77.8% 23,188 Manag./Leasing/CSCShopping Tamboré SP 46,776 100.0% 46,776 Manag./Leasing/CSCShopping Metrô Santa Cruz SP 19,248 100.0% 19,248 Manag./Leasing/CSCCampinas Shopping SP 30,769 100.0% 30,769 Manag./Leasing/CSCOsasco Plaza Shopping SP 14,367 39.6% 5,689 LeasingShopping Metrô Tatuapé SP 32,718 3.0% 982Total 1,219,218 52.0% 634,316
25

Earnings Release1Q11
Glossary:
Gross Leasable Area or GLA: Sum of all areas in a shopping mall that are available for lease, except for kiosks.
Owned GLA : GLA multiplied by our ownership stake.
Net Operating Income or NOI: Gross revenue (less service revenue) - costs + depreciation + amortization.
Law 11,638: Law 11,638 was enacted with the purpose of including publicly-held Brazilian companies in the internationalaccounting convergence process. The 4Q08 f inancial and operating f igures will be impacted by certain accountingeffects due to the changes arising from Law 11,638/07.
Same-Property NOI: NOI from the exact same properties in which we currently own a stake, proportional to ourownership stake in the property for both periods.
EBITDA (Earnings Before Interest, Taxes, Depreciation and Amortization): refers to gross income - SG&A +depreciation + amortization.
Adjusted EBITDA: EBITDA + Shopping Araguaia prof it-sharing debenture revenues + straight-line effects – otheroperating revenues from investment property
Adjusted FFO (Funds From Operations): Adjusted net income (excluding exchange rate variations and Law 11,638effects) + depreciation + amortization + straight-lining effects – other operating revenues and deferred taxes f rominvestment property
Same store sale (SSS): Sales f igures for the same stores that were operating in the same space in both periods.
Same store rent (SSR): Rent f igures for the same stores that were operating at the same space in both periods.
Occupancy Rate: Total leased and occupied GLA as a percentage of total leasable GLA.
Tenant Turnover: sum of new contract GLA negotiated in the last 12 months – the GLA variation for unoccupied storesin the last 12 months / average GLA in the last 12 months
Late Payment: Measured on the last day of each month, includes total revenues in that month over total revenueseffectively collected in the same month. It does not include inactive stores.
Occupancy Cost as a Percentage of Sales : Rent revenues (minimum rent + % overage) + common chargesOccupancy Cost as a Percentage of Sales : Rent revenues (minimum rent + % overage) + common charges(excluding specif ic tenant costs) + merchandising fund contributions. (This item should be analyzed from the tenant’spoint of view.)
Leasing Spread: Comparison between the average rent for the new contract and the rent charged in the previouscontract for the same space.
Average GLA (Rent/m² and NOI/m²): Does not include 27,921 m² of GLA from the Convention Center located inShopping Estação. In the average GLA used for rent/m², we do not consider owned GLA for Araguaia Shopping, since itsrevenues are recognized via debenture payments.
Shopping Malls by Income Group (Brazil Criterion): The Brazil Criterion is related to the purchasing power ofindividuals and families and is def ined by IBOPE. According to this criterion, our malls are divided into four categories:• Upper: Villa Lobos and Fashion Mall;• Upper-middle: Goiânia, Iguatemi Caxias, Plaza Niterói and Rio Plaza;• Middle: Amazonas, Independência; Campo Grande, Curitiba, Norte Shopping, Campinas Shopping, ABC, Metrô SantaCruz, Piracicaba, Tamboré, Belém, Esplanada, Mueller, São Luís, Recife, Natal, Iguatemi Maceió and Pantanal;• Lower-middle: Metrô Tatuapé, BIG, Minas, TopShopping, Osasco, Araguaia, Del Rey, Estação, Center, Ilha Plaza andWest.
26
Earnings Release1Q11
Original Portfolio: Original malls acquired f rom ECISA (Norte Shopping, Shopping Recife, Villa-Lobos, Del Rey, Campo Grande andIguatemi Caxias).
Acquired Portfolio: Other malls acquired in 2007 and on.
Cash on cash: Stabilized NOI (fourth year af ter inauguration) over net capex (total Investment – key money revenues)
EV/EBITDA: Market Capitalization + Net debt / Annualized Adjusted EBITDA
P/FFO: Market Capitalization / Annualized Adjusted FFO
ROE: Annualized Adjusted Net Income / Shareholders’ Equity
ROIC: Annualized EBIT * (1 - ef fective tax rate) / invested capital
27

Earnings Release1Q11
Income Statement:
Gross Revenue 193,895 115,960 67.2% Rents 128,559 81,587 57.6% Rent straight-lining 10,015 1,473 579.9% Key Money 12,572 4,973 152.8% Key Money straight-lining (5,052) (1,774) 184.8% Parking 26,898 14,163 89.9% Transfer Fee 1,779 483 268.3%
1Q11 1Q10 %
Income Statement (R$ thousand)
Transfer Fee 1,779 483 268.3% Services Provided 16,552 11,226 47.4% Others 2,572 3,829 -32.8%(-)Taxes and Contributions (14,812) (9,635) 53.7%Net Revenue 179,083 106,325 68.4%Costs (19,015) (11,913) 59.6% Payroll (4,013) (1,556) 157.9% Services Provided (9,925) (6,343) 56.5% Common Costs (3,942) (3,005) 31.2% Merchandising Costs (1,135) (1,009) 12.5%Gross Profit 160,068 94,412 69.5%Sales, General and Administrative Expenses (24,549) (15,904) 54.4% Sales Expenses (2,328) (2,336) -0.3% Personnel Expenses (18,237) (8,734) 108.8% Services Hired (2,323) (3,267) -28.9% Other Expenses (1,661) (1,567) 6.0%Depreciation (37) (440) -91.6%Amortization (2,816) (2,563) 9.9%Financial Income (76,992) (40,118) 91.9% Financial Revenues 73,286 66,490 10.2% Financial Expenses (150,278) (106,609) 41.0% Financial Expenses (150,278) (106,609) 41.0% Financial Income Adjustment - Law 11,638 - - 0.0%Revenue based on Equity Revenue 3,481 9,052 -61.5%Other Operational Revenues 59,155 44,439 33.1%
Operating Income 59,155 44,439 33.1%Income before Income Taxes and Minority Interest (10,716) (6,007) 78.4%Income Tax and Social Contribution Provision 14,450 4,987 189.8%Minority Interest (5,665) (1,367) 314.4%
Net Income (Loss) 57,224 42,052 36.1%
28

Earnings Release1Q11
Balance Sheet:
Assets LiabilitiesCurrent Assets Current LiabilitiesCash and cash equivalents 9,328 19,843 -53.0% Loans and Financings 148,053 126,873 16.7%Accounts receivable 150,524 154,933 -2.8% Suppliers 29,996 21,796 37.6%Securities 715,665 231,961 208.5% Taxes and Contributions 46,951 58,198 -19.3%Swap Variation Receivable 1,745 618 182.4% Payroll and related charges 38,268 37,852 1.1%Recoverable taxes 50,774 59,922 -15.3% Minimum Required Payable Dividend 27,742 27,742 Advances 11,371 10,033 13.3% Taxes and Contributions - Installments 4,366 4,803 -9.1%Other Receivable Accounts 39,279 30,001 30.9% Client Advances 17,329 20,729 -16.4%Advanced Expenses 17,742 7,683 130.9% Liability on shopping center's acquisition 166,385 203,139 -18.1%Total 996,428 514,994 93.5% Swap variation payable 2,713 2,078 30.6%
Other Account Payables 87 2,150 0.0%
1Q11 4Q10 % 1Q11 4Q10 %
Balance Sheet (R$ thousand)
Other Account Payables 87 2,150 0.0%Total 481,890 505,360 -4.6%
Non current LiabilitiesNon current Assets Loans and Financings 2,475,699 1,439,023 72.0%Clients 86,229 80,935 6.5% Suppliers 6,399 6,226 2.8%Deferred Tax Assets 46,255 48,386 -4.4% Provision for Fiscal Risks and other 110,238 110,530 -0.3%Deposits and Bonds 22,707 21,867 3.8% Taxes and Contributions - Installments 75,009 75,751 -1.0%Securities - 65,912 -100.0% Liability on shopping center's acquisition 20,870 519,930 Deferred Income Tax and Social Contribution 62,207 54,756 13.6% Swap variation payable 73,038 89,828 -18.7%Swap Variation Receivable 18,160 64,469 -71.8% Deferred Taxes 1,886,695 1,901,146 -0.8%Other Investments 467 11,673 -96.0% Deferred Revenues 84,423 128,427 -34.3%Others 8,615 7,914 8.9% Other Account Payables 9,709 4,148 134.1%Total 244,640 355,912 -31.3% Total 4,742,080 4,275,009 10.9%
Shareholder's Equity
Fixed Assets Minority Interest 298,478 307,227 -2.8%Investment Property 9,823,450 9,676,115 1.5% Capital Stock 2,567,617 2,561,195 0.3%Property, Plant and Equipment 11,432 11,574 -1.2% Capital Reserves 24,562 20,284 21.1%Leasing - - Income Reserve 2,955,363 2,955,363 0.0%Deferred - - 0.0% Shares in Treasury (8) (14,792) -99.9%Intangible 11,377 11,172 1.8% Retained Earnings(Loss) 57,224 - 0.0%Construction Financing - - Equity Offering Expenses (39,879) (39,879) 0.0%Total 9,846,259 9,698,861 1.5% Total Shareholder's Equity 5,863,357 5,789,398 1.3%
Total Assets 11,087,327 10,569,767 4.9% Total Liabilities 11,087,327 10,569,767 4.9%
29

Earnings Release1Q11
Cash Flow:
Operations
Retained Earnings/Accumulated Deficit 57,224
Adjustments to reconciliate net income and cash fro m operating activities
116,034
Depreciation and Amortization 4,984
Interest and Monetary Variations on Loans 65,227
Adjustment of swap to market value 18,068
Adjustment to present value and of straigh-lining (4,961)
Leasing Adjustment - Law 11.638 (302)
Deferred Income Tax and Social Contribution (3,734)
Adjustment Granted Option Plans 4,277
Cash Flow (R$ thousand)
1Q11
Adjustment Granted Option Plans 4,277
Others 3,361
Defered Taxes - CVM 349 (2,131)
Adjustment to Market Value Swap 25,580
Result Minority 5,665
Reduction (increase) 16,994
Accounts Receivable 9,128
Taxes Recoverable 9,148
Prepaid Condominium Charges (1,338)
Prepaid Expenses (10,059)
Deposits and Guarantees (840)
Others 10,955
Increase (reduction) in Assets (622,591)
Suppliers 8,373
Taxes and Contributions (6,067)
Income taxes (24,526)
Salaries and Social Charges 416
Liabilities Payable – Acquisition (535,814)
Advances from Clients (3,400)
Provision for Contingencies -
Others (61,573)
Net Cash generated (used) in operating activities -
Investing -
Disposal (Acquisition) of Marketable Securities (2,961,970) Disposal (Acquisition) of Marketable Securities (2,961,970)
Marketable Securities Sale 2,526,109
Dividends -
Acquisition of Intangible Assets (369)
Investment Property (147,335)
Others -
Assets -
Funding -
Net Cash from Investing Activities (583,565)
Financing Activities -
Adition in Deferred Assets -
Capital Increase 6,422
New Loans 1,054,440
Amortizations of Loans (61,508)
Treasury Shares 14,784
Result Minority (8,749)
Net Cash from Financing Activities 1,005,389
Increase (Decrease) in Cash and Cash Equivalents (10,515)
30
Earnings Release1Q11
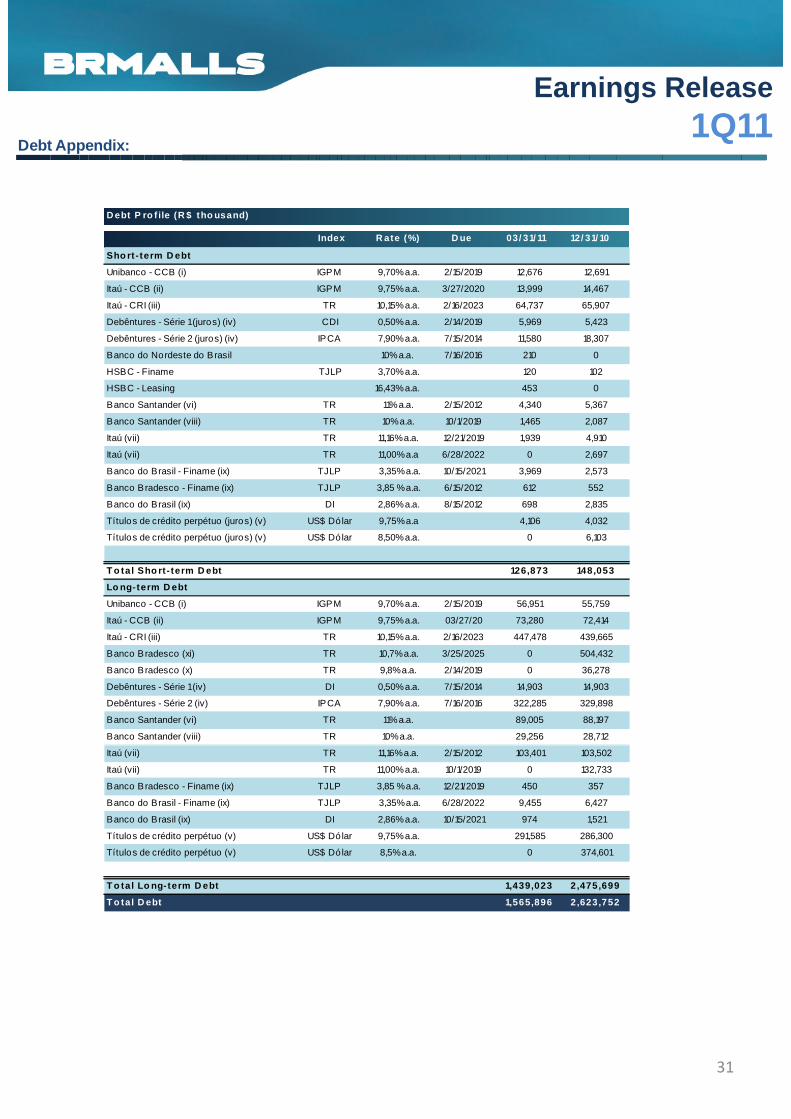
Debt Appendix:
Sho rt - term D ebt
Unibanco - CCB (i) IGPM 9,70% a.a. 2/15/2019 12,676 12,691
Itaú - CCB (ii) IGPM 9,75% a.a. 3/27/2020 13,999 14,467
Itaú - CRI (iii) TR 10,15% a.a. 2/16/2023 64,737 65,907
Debêntures - Série 1 (juros) (iv) CDI 0,50% a.a. 2/14/2019 5,969 5,423
Debêntures - Série 2 (juros) (iv) IPCA 7,90% a.a. 7/15/2014 11,580 18,307
Banco do Nordeste do Brasil 10% a.a. 7/16/2016 210 0
HSBC - Finame TJLP 3,70% a.a. 120 102
D ebt P ro f ile (R $ tho usand)
Index R ate (%) D ue 03/ 31/ 11 12/ 31/ 10
HSBC - Finame TJLP 3,70% a.a. 120 102
HSBC - Leasing 16,43% a.a. 453 0
Banco Santander (vi) TR 11% a.a. 2/15/2012 4,340 5,367
Banco Santander (viii) TR 10% a.a. 10/1/2019 1,465 2,087
Itaú (vii) TR 11,16% a.a. 12/21/2019 1,939 4,910
Itaú (vii) TR 11,00% a.a 6/28/2022 0 2,697
Banco do Brasil - Finame (ix) TJLP 3,35% a.a. 10/15/2021 3,969 2,573
Banco Bradesco - Finame (ix) TJLP 3,85 % a.a. 6/15/2012 612 552
Banco do Brasil (ix) DI 2,86% a.a. 8/15/2012 698 2,835
Títulos de crédito perpétuo (juros) (v) US$ Dólar 9,75% a.a 4,106 4,032
Títulos de crédito perpétuo (juros) (v) US$ Dólar 8,50% a.a. 0 6,103
T o ta l Sho rt - term D ebt 126,873 148,053
Lo ng- term D ebt
Unibanco - CCB (i) IGPM 9,70% a.a. 2/15/2019 56,951 55,759
Itaú - CCB (ii) IGPM 9,75% a.a. 03/27/20 73,280 72,414
Itaú - CRI (iii) TR 10,15% a.a. 2/16/2023 447,478 439,665
Banco Bradesco (xi) TR 10,7% a.a. 3/25/2025 0 504,432
Banco Bradesco (x) TR 9,8% a.a. 2/14/2019 0 36,278
Debêntures - Série 1 (iv) DI 0,50% a.a. 7/15/2014 14,903 14,903
Debêntures - Série 2 (iv) IPCA 7,90% a.a. 7/16/2016 322,285 329,898
Banco Santander (vi) TR 11% a.a. 89,005 88,197
Banco Santander (viii) TR 10% a.a. 29,256 28,712
Itaú (vii) TR 11,16% a.a. 2/15/2012 103,401 103,502
Itaú (vii) TR 11,00% a.a. 10/1/2019 0 132,733
Banco Bradesco - Finame (ix) TJLP 3,85 % a.a. 12/21/2019 450 357
Banco do Brasil - Finame (ix) TJLP 3,35% a.a. 6/28/2022 9,455 6,427
Banco do Brasil (ix) DI 2,86% a.a. 10/15/2021 974 1,521
Títulos de crédito perpétuo (v) US$ Dólar 9,75% a.a. 291,585 286,300
Títulos de crédito perpétuo (v) US$ Dólar 8,5% a.a. 0 374,601
T o ta l Lo ng- term D ebt 1,439,023 2,475,699
T o ta l D ebt 1,565,896 2,623,752
31