reliability-based life-cycle economic analysis
DESCRIPTION
Reliability-Based Life-Cycle Economic Analysis. Dr Bill Wessels, PE CRE Principal R esearch Scientist UAH Research Institute Reliability & Failure Analysis Lab. Part Alternatives. Five Vendors offer part that meets or exceeds reliability requirements Acquisition Costs A - $6,064 - PowerPoint PPT PresentationTRANSCRIPT

Reliability-Based Life-Cycle Economic Analysis
Dr Bill Wessels, PE CREPrincipal Research Scientist
UAH Research InstituteReliability & Failure Analysis Lab
Dr Bill Wessels PE CRE 2
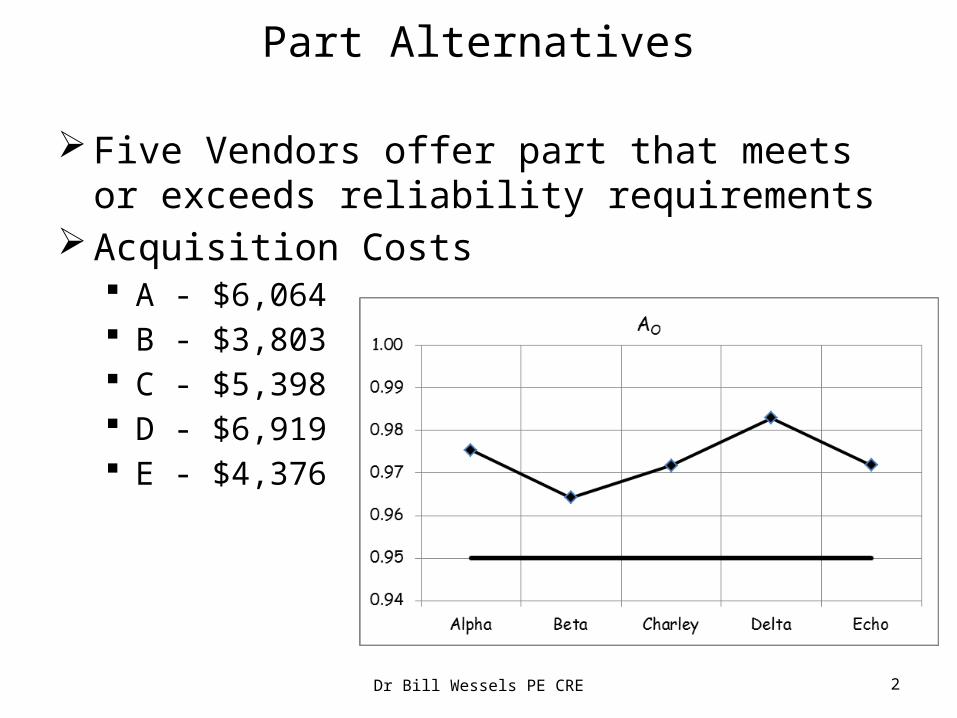
Part Alternatives
Five Vendors offer part that meets or exceeds reliability requirements
Acquisition Costs A - $6,064 B - $3,803 C - $5,398 D - $6,919 E - $4,376

Dr Bill Wessels PE CRE 3
Part Failure –
MaintenanceCycle
g
f 3P(t)
g
g
f 3P(t)
f 3P(t)
f preRepLog(t)
f postRepLog(t)
Part FailsSystem Down
Total Down Time
Part Completes pre-RepairLogistics Downtime
Part Completes Repair
Part Completes post-RepairLogistics Downtime
System Returns to Service
Dr Bill Wessels PE CRE 4
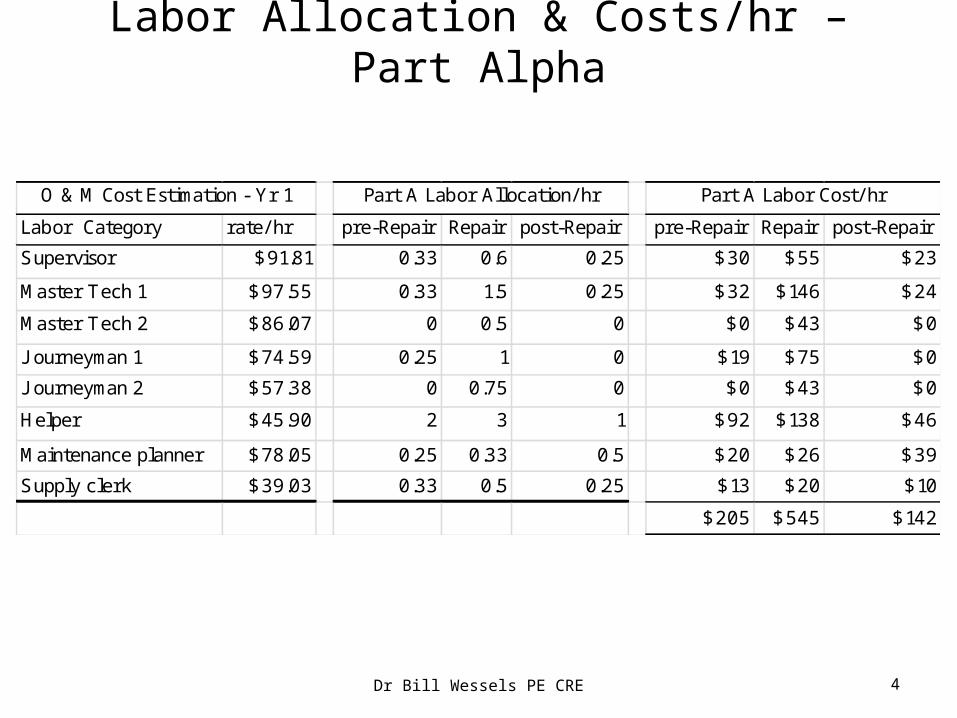
Labor Allocation & Costs/hr – Part Alpha
Labor Category rate/ hr pre-Repair Repair post-Repair pre-Repair Repair post-Repair
Supervisor $91.81 0.33 0.6 0.25 $30 $55 $23
Master Tech 1 $97.55 0.33 1.5 0.25 $32 $146 $24
Master Tech 2 $86.07 0 0.5 0 $0 $43 $0
J ourneyman 1 $74.59 0.25 1 0 $19 $75 $0
J ourneyman 2 $57.38 0 0.75 0 $0 $43 $0
Helper $45.90 2 3 1 $92 $138 $46
Maintenance planner $78.05 0.25 0.33 0.5 $20 $26 $39
Supply clerk $39.03 0.33 0.5 0.25 $13 $20 $10
$205 $545 $142
Part A Labor Allocation/ hrO & M Cost Estimation - Yr 1 Part A Labor Cost/ hr
Dr Bill Wessels PE CRE 5
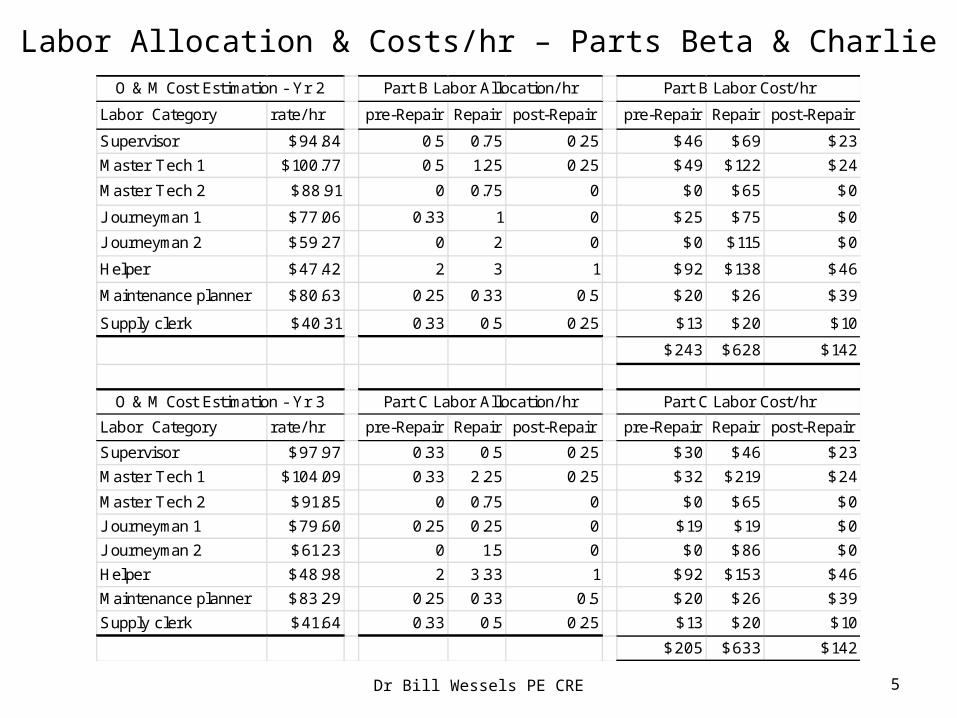
Labor Allocation & Costs/hr – Parts Beta & Charlie
Labor Category rate/ hr pre-Repair Repair post-Repair pre-Repair Repair post-Repair
Supervisor $94.84 0.5 0.75 0.25 $46 $69 $23
Master Tech 1 $100.77 0.5 1.25 0.25 $49 $122 $24
Master Tech 2 $88.91 0 0.75 0 $0 $65 $0
J ourneyman 1 $77.06 0.33 1 0 $25 $75 $0
J ourneyman 2 $59.27 0 2 0 $0 $115 $0
Helper $47.42 2 3 1 $92 $138 $46
Maintenance planner $80.63 0.25 0.33 0.5 $20 $26 $39
Supply clerk $40.31 0.33 0.5 0.25 $13 $20 $10
$243 $628 $142
Labor Category rate/ hr pre-Repair Repair post-Repair pre-Repair Repair post-Repair
Supervisor $97.97 0.33 0.5 0.25 $30 $46 $23
Master Tech 1 $104.09 0.33 2.25 0.25 $32 $219 $24
Master Tech 2 $91.85 0 0.75 0 $0 $65 $0
J ourneyman 1 $79.60 0.25 0.25 0 $19 $19 $0
J ourneyman 2 $61.23 0 1.5 0 $0 $86 $0
Helper $48.98 2 3.33 1 $92 $153 $46
Maintenance planner $83.29 0.25 0.33 0.5 $20 $26 $39
Supply clerk $41.64 0.33 0.5 0.25 $13 $20 $10
$205 $633 $142
Part B Labor Allocation/ hr
Part C Labor Allocation/ hr
O & M Cost Estimation - Yr 2
O & M Cost Estimation - Yr 3
Part B Labor Cost/ hr
Part C Labor Cost/ hr

Dr Bill Wessels PE CRE 6
Labor Allocation & Costs/hr – Parts Delta & Echo
Labor Category rate/ hr pre-Repair Repair post-Repair pre-Repair Repair post-Repair
Supervisor $101.20 0.25 0.33 0.25 $23 $30 $23
Master Tech 1 $107.53 0 0 0 $0 $0 $0
Master Tech 2 $94.88 0.25 0.75 0.25 $22 $65 $22
J ourneyman 1 $82.23 0 0 0 $0 $0 $0
J ourneyman 2 $63.25 0.33 0.75 0 $19 $43 $0
Helper $50.60 2 1 1 $92 $46 $46
Maintenance planner $86.04 0.25 0.33 0.5 $20 $26 $39
Supply clerk $43.02 0.33 0.5 0.25 $13 $20 $10
$188 $229 $139
Labor Category rate/ hr pre-Repair Repair post-Repair pre-Repair Repair post-Repair
Supervisor $104.54 0.33 0.5 0.25 $30 $46 $23
Master Tech 1 $111.07 0.33 1 0.25 $32 $98 $24
Master Tech 2 $98.01 0 0.5 0 $0 $43 $0
J ourneyman 1 $84.94 0.25 1 0 $19 $75 $0
J ourneyman 2 $65.34 0 0.67 0 $0 $38 $0
Helper $52.27 2 3 1 $92 $138 $46
Maintenance planner $88.88 0.25 0.33 0.5 $20 $26 $39
Supply clerk $44.44 0.33 0.5 0.25 $13 $20 $10
$205 $483 $142
Part E Labor Cost/ hr
Part D Labor Allocation/ hr
Part E Labor Allocation/ hr
O & M Cost Estimation - Yr 4
O & M Cost Estimation - Yr 5
Part D Labor Cost/ hr

Dr Bill Wessels PE CRE 7
Overhead Costs
Retrieval Vehicle -$51.40
Overhead Crane -$13.32
Facility -$268.19 -/ bay-hr
Lost Opportunity Cost/ hr Estimation
-$6,355
Capital Cost/ hr Estimation

Dr Bill Wessels PE CRE 8
Deterministic Part Alternatives
Deterministic Part Summary I nf ormation
Part h b g q h b g m preRep postRep L
Alpha 35.2 6.67 390 423 0.56 2.25 3.15 3.65 5.53 1.51 7.04
Beta 16.8 2.97 295 310 0.91 2.46 3.65 4.46 5.53 1.51 7.04
Charley 25.3 6.67 450 474 0.55 2.25 6.25 6.74 5.53 1.51 7.04
Delta 48.9 7.93 642 688 0.67 3.05 4.33 4.93 5.53 1.51 7.04
Echo 18.5 2.15 401 417 1.55 2.57 3.67 5.05 5.53 1.51 7.04
Failure Math Model Repair Math Model System LDT
Dr Bill Wessels PE CRE 9
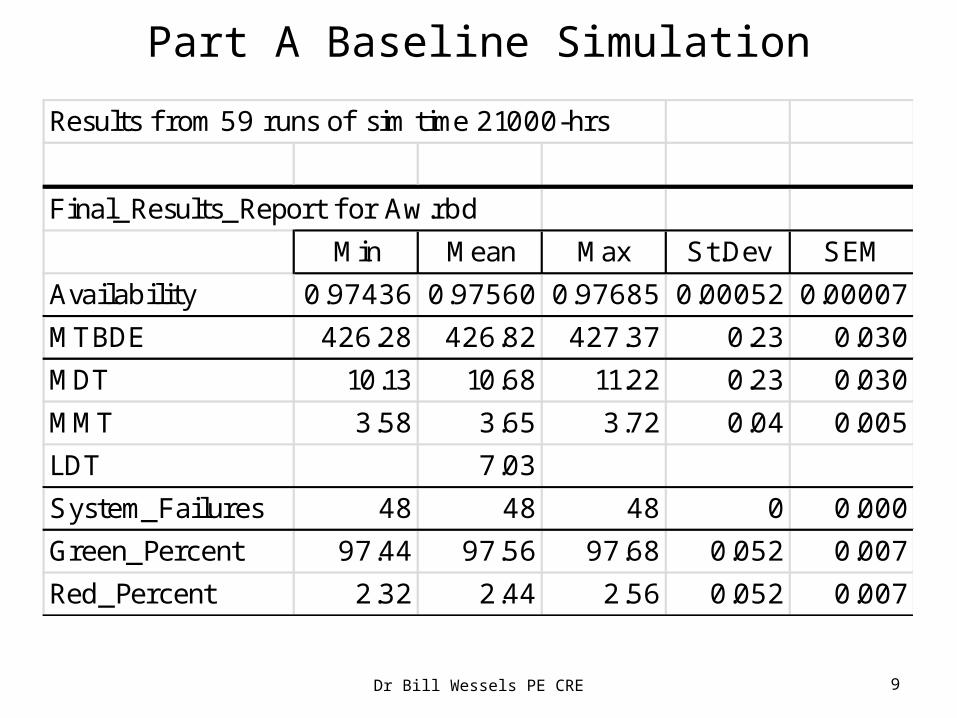
Part A Baseline Simulation
Results f rom 59 runs of sim time 21000-hrs
Final_Results_Report f or Aw.rbd
Min Mean Max St.Dev SEM
Availability 0.97436 0.97560 0.97685 0.00052 0.00007
MTBDE 426.28 426.82 427.37 0.23 0.030
MDT 10.13 10.68 11.22 0.23 0.030
MMT 3.58 3.65 3.72 0.04 0.005
LDT 7.03
System_Failures 48 48 48 0 0.000
Green_Percent 97.44 97.56 97.68 0.052 0.007
Red_Percent 2.32 2.44 2.56 0.052 0.007

Dr Bill Wessels PE CRE 10
Part B Baseline Simulation
Results f rom 59 runs of sim time 21000-hrs
Final_Results_Report f or Bw.rbd
Min Mean Max St.Dev SEM
Availability 0.96304 0.96452 0.96591 0.00067 0.00009
MTBDE 311.14 311.61 312.06 0.22 0.028
MDT 11.01 11.46 11.94 0.22 0.028
MMT 4.37 4.46 4.55 0.040 0.005
LDT 7.01
System_Failures 65 65 65 0 0.000
Green_Percent 96.30 96.45 96.59 0.067 0.009
Red_Percent 3.41 3.55 3.70 0.067 0.009

Dr Bill Wessels PE CRE 11
Part C Baseline Simulation
Results f rom 59 runs of sim time 21000-hrs
Final_Results_Report f or Cw.rbd
Min Mean Max St.Dev SEM
Availability 0.97074 0.97190 0.97327 0.00048 0.00006
MTBDE 474.08 475.03 486.08 2.09 0.27
MDT 13.05 13.74 14.29 0.24 0.031
MMT 6.67 6.74 6.82 0.034 0.004
LDT 6.99
System_Failures 42 42.97 43 0.18 0.024
Green_Percent 97.07 97.19 97.33 0.048 0.006
Red_Percent 2.67 2.81 2.93 0.05 0.006

Dr Bill Wessels PE CRE 12
Part D Baseline Simulation
Results f rom 59 runs of sim time 21000-hrs
Final_Results_Report f or Dw.rbd
Min Mean Max St.Dev SEM
Availability 0.98226 0.98321 0.98417 0.00040 0.00005
MTBDE 687.58 699.11 712.64 12.00 1.56
MDT 11.08 11.94 12.71 0.30 0.039
MMT 4.85 4.93 5.02 0.041 0.005
LDT 7.01
System_Failures 29 29.54 30 0.502478 0.065
Green_Percent 98.23 98.32 98.42 0.040 0.005
Red_Percent 1.58 1.68 1.77 0.040 0.005

Dr Bill Wessels PE CRE 13
Part E Baseline Simulation
Results f rom 59 runs of sim time 21000-hrs
Final_Results_Report f or Ew.rbd
Min Mean Max St.Dev SEM
Availability 0.97103 0.97223 0.97367 0.00061 0.00008
MTBDE 416.28 422.85 425.98 4.06 0.53
MDT 11.46 12.08 12.68 0.25 0.032
MMT 4.85 5.06 5.21 0.080 0.010
LDT 7.02
System_Failures 48 48.29 49 0.456782 0.059
Green_Percent 97.10 97.22 97.37 0.061 0.008
Red_Percent 2.63 2.78 2.90 0.061 0.008
Dr Bill Wessels PE CRE 14
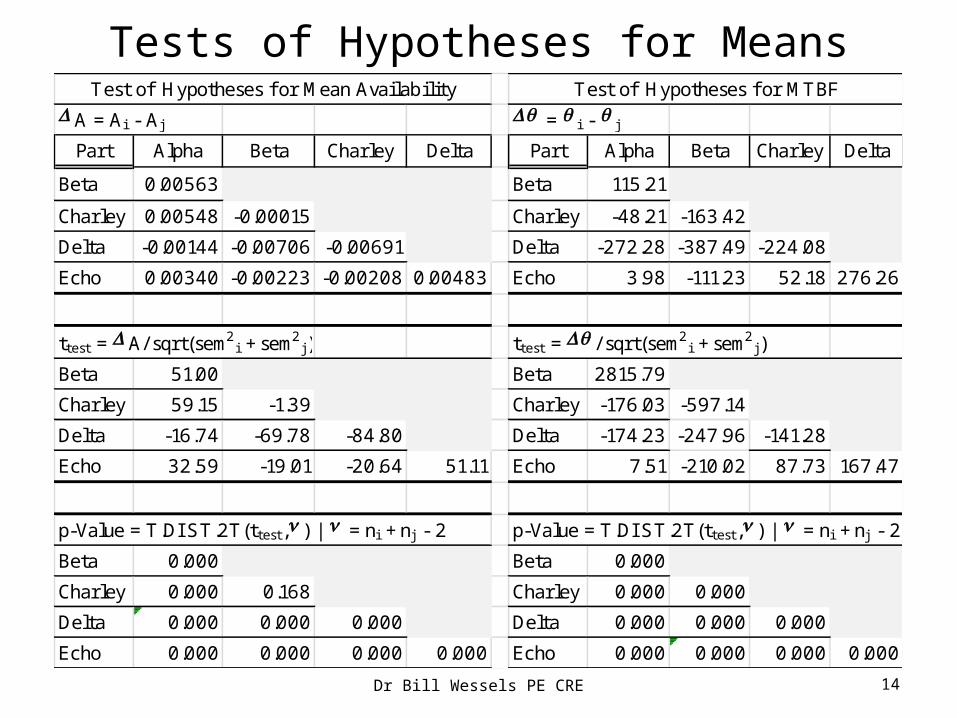
Tests of Hypotheses for Means
D A = Ai - Aj Dq = q i - q j
Part Alpha Beta Charley Delta Part Alpha Beta Charley Delta
Beta 0.00563 Beta 115.21
Charley 0.00548 -0.00015 Charley -48.21 -163.42
Delta -0.00144 -0.00706 -0.00691 Delta -272.28 -387.49 -224.08
Echo 0.00340 -0.00223 -0.00208 0.00483 Echo 3.98 -111.23 52.18 276.26
ttest = D A/ sqrt(sem2i + sem2
j) ttest = Dq / sqrt(sem2i + sem2
j)
Beta 51.00 Beta 2815.79
Charley 59.15 -1.39 Charley -176.03 -597.14
Delta -16.74 -69.78 -84.80 Delta -174.23 -247.96 -141.28
Echo 32.59 -19.01 -20.64 51.11 Echo 7.51 -210.02 87.73 167.47
p-Value = T.DI ST.2T(ttest,n ) | n = ni + nj - 2 p-Value = T.DI ST.2T(ttest,n ) | n = ni + nj - 2
Beta 0.000 Beta 0.000
Charley 0.000 0.168 Charley 0.000 0.000
Delta 0.000 0.000 0.000 Delta 0.000 0.000 0.000
Echo 0.000 0.000 0.000 0.000 Echo 0.000 0.000 0.000 0.000
Test of Hypotheses f or Mean Availability Test of Hypotheses f or MTBF
Dr Bill Wessels PE CRE 15
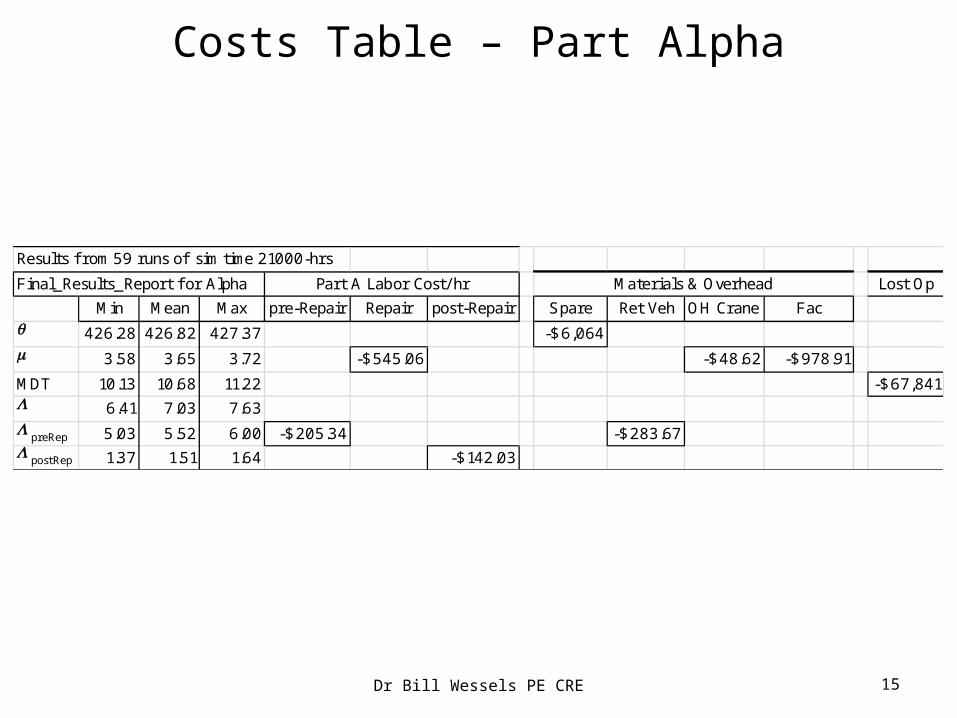
Costs Table – Part Alpha
Results f rom 59 runs of sim time 21000-hrs
Final_Results_Report f or Alpha Lost Op
Min Mean Max pre-Repair Repair post-Repair Spare Ret Veh OH Crane Fac
q 426.28 426.82 427.37 -$6,064
m 3.58 3.65 3.72 -$545.06 -$48.62 -$978.91
MDT 10.13 10.68 11.22 -$67,841L 6.41 7.03 7.63
L preRep 5.03 5.52 6.00 -$205.34 -$283.67L postRep 1.37 1.51 1.64 -$142.03
Part A Labor Cost/ hr Materials & Overhead

Dr Bill Wessels PE CRE 16
Costs Table – Part Beta
Final_Results_Report f or Baker Lost Op
Min Mean Max pre-Repair Repair post-Repair Spare Ret Veh OH Crane Facq 311.14 311.61 312.06 -$3,803m 4.37 4.46 4.55 -$627.68 -$59.38 -$1,195.51
MDT 11.01 11.46 11.94 -$72,844L 6.47 7.01 7.57L preRep 5.08 5.50 5.95 -$243.50 -$282.85L postRep 1.39 1.50 1.62 -$142.03
Part B Labor Cost/ hr Materials & Overhead
Costs Table – Part CharlieFinal_Results_Report f or Charlie Lost Op
Min Mean Max pre-Repair Repair post-Repair Spare Ret Veh OH Crane Facq 474.08 475.03 486.08 -$5,398m 6.67 6.74 6.82 -$632.79 -$89.84 -$1,808.67
MDT 13.05 13.74 14.29 -$87,287L 6.24 6.99 7.62L preRep 4.90 5.49 5.98 -$205.34 -$282.30L postRep 1.34 1.50 1.63 -$142.03
Part C Labor Cost/ hr Materials & Overhead
Dr Bill Wessels PE CRE 17
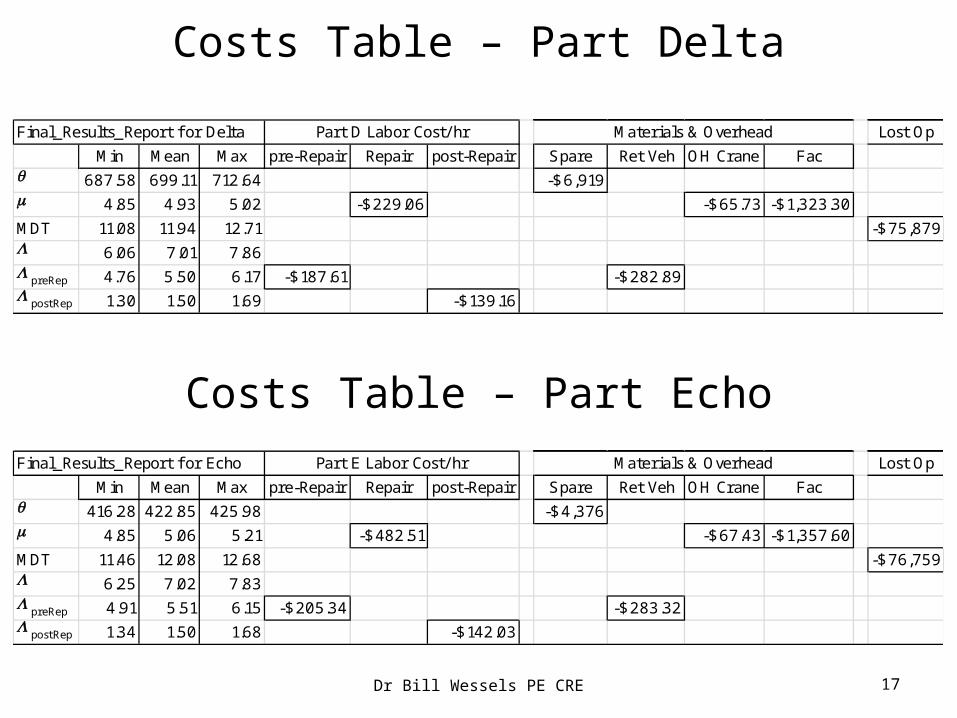
Costs Table – Part Delta
Final_Results_Report f or Delta Lost Op
Min Mean Max pre-Repair Repair post-Repair Spare Ret Veh OH Crane Facq 687.58 699.11 712.64 -$6,919m 4.85 4.93 5.02 -$229.06 -$65.73 -$1,323.30
MDT 11.08 11.94 12.71 -$75,879L 6.06 7.01 7.86L preRep 4.76 5.50 6.17 -$187.61 -$282.89L postRep 1.30 1.50 1.69 -$139.16
Part D Labor Cost/ hr Materials & Overhead
Costs Table – Part EchoFinal_Results_Report f or Echo Lost Op
Min Mean Max pre-Repair Repair post-Repair Spare Ret Veh OH Crane Facq 416.28 422.85 425.98 -$4,376m 4.85 5.06 5.21 -$482.51 -$67.43 -$1,357.60
MDT 11.46 12.08 12.68 -$76,759L 6.25 7.02 7.83L preRep 4.91 5.51 6.15 -$205.34 -$283.32L postRep 1.34 1.50 1.68 -$142.03
Part E Labor Cost/ hr Materials & Overhead

Dr Bill Wessels PE CRE 18
Engineering Economic Analysis
rd = APRn = qm = CP/yr i = rd/mA = uniform cost per hrPV[A] = PV(i, n, A)F = S [Costs at n]PV[F]= PV(i, n,_, F)NPV = PV[A] + PV[F]AEquiv = PMT(i, n, NPV)
Dr Bill Wessels PE CRE 19
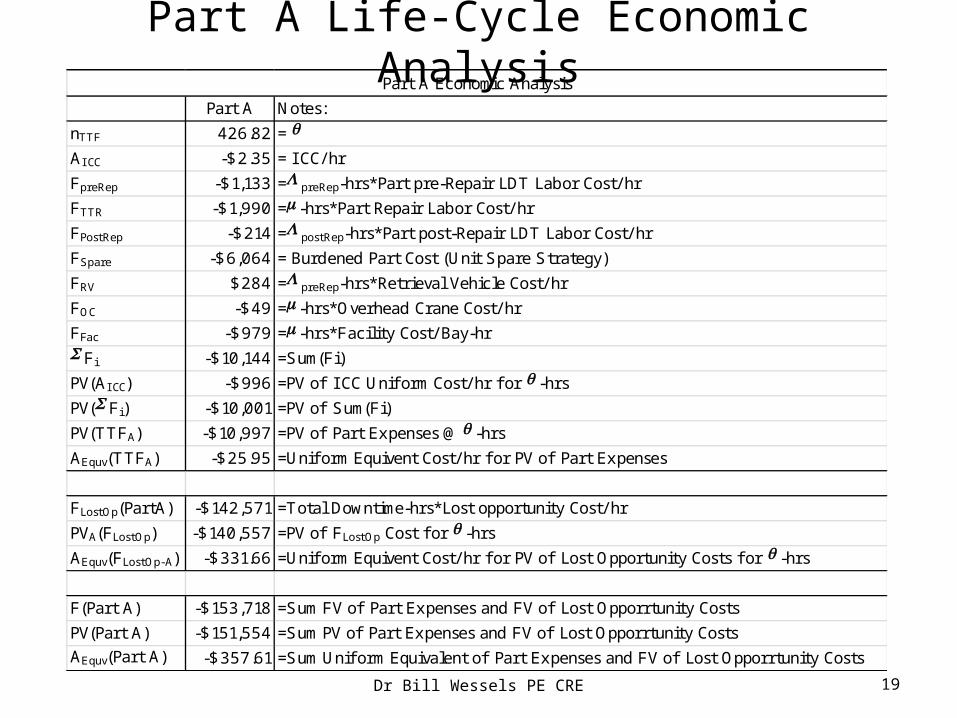
Part A Life-Cycle Economic AnalysisPart A Notes:
nTTF 426.82 = q
AI CC -$2.35 = I CC/ hr
FpreRep -$1,133 =L preRep-hrs*Part pre-Repair LDT Labor Cost/ hr
FTTR -$1,990 =m -hrs*Part Repair Labor Cost/ hr
FPostRep -$214 =L postRep-hrs*Part post-Repair LDT Labor Cost/ hr
FSpare -$6,064 = Burdened Part Cost (Unit Spare Strategy)
FRV $284 =L preRep-hrs*Retrieval Vehicle Cost/ hr
FOC -$49 =m -hrs*Overhead Crane Cost/ hr
FFac -$979 =m -hrs*Facility Cost/ Bay-hrS Fi -$10,144 =Sum(Fi)
PV(AI CC) -$996 =PV of I CC Unif orm Cost/ hr f or q -hrs
PV(S Fi) -$10,001 =PV of Sum(Fi)
PV(TTFA) -$10,997 =PV of Part Expenses @ q -hrs
AEquv(TTFA) -$25.95 =Unif orm Equivent Cost/ hr f or PV of Part Expenses
FLostOp(PartA) -$142,571 =Total Downtime-hrs*Lost opportunity Cost/ hr
PVA(FLostOp) -$140,557 =PV of FLostOp Cost f or q -hrs
AEquv(FLostOp-A) -$331.66 =Unif orm Equivent Cost/ hr f or PV of Lost Opportunity Costs f or q -hrs
F(Part A) -$153,718 =Sum FV of Part Expenses and FV of Lost Opporrtunity Costs
PV(Part A) -$151,554 =Sum PV of Part Expenses and FV of Lost Opporrtunity Costs
AEquv(Part A) -$357.61 =Sum Unif orm Equivalent of Part Expenses and FV of Lost Opporrtunity Costs
Part A Economic Analysis

Dr Bill Wessels PE CRE 20
Part Alternatives Life-Cycle Economic AnalysesPart A Part B Part C Part D Part E
nTTF 426.82 311.61 475.03 699.11 422.85
AI CC -$2.35 -$2.35 -$2.35 -$2.35 -$2.35
FpreRep -$1,133 -$1,340 -$1,128 -$1,033 -$1,132
FTTR -$1,990 -$2,798 -$4,268 -$1,130 -$2,443
FPostRep -$214 -$213 -$213 -$209 -$214
FSpare -$6,064 -$3,803 -$5,398 -$6,919 -$4,376
FRV $284 $283 $282 $283 $283
FOC -$49 -$59 -$90 -$66 -$67
FFac -$979 -$1,196 -$1,809 -$1,323 -$1,358
S Fi -$10,144 -$9,126 -$12,622 -$10,397 -$9,306
PV(AI CC) -$996 -$728 -$1,108 -$1,624 -$987
PV(S Fi) -$10,001 -$9,032 -$12,424 -$10,157 -$9,175
PV(TTFA) -$10,997 -$9,760 -$13,531 -$11,781 -$10,162
AEquv(TTFA) -$25.95 -$31.49 -$28.71 -$17.05 -$24.20
FLostOp(PartA) -$142,571 -$153,085 -$183,437 -$183,437 -$161,313
PVA(FLostOp) -$140,557 -$151,504 -$180,555 -$179,212 -$159,055
AEquv(FLostOp-A) -$331.66 -$488.73 -$383.12 -$259.35 -$378.81
F(Part A) -$153,718 -$162,944 -$197,175 -$195,476 -$171,612
PV(Part A) -$151,554 -$161,264 -$194,087 -$190,993 -$169,217
AEquv(Part A) -$357.61 -$520.21 -$411.83 -$276.40 -$403.02
Lif e-Cycle Economic Analysis

Dr Bill Wessels PE CRE 21

Dr Bill Wessels PE CRE 22
Part Alternatives Economic Ranking
1 - Lowest
5 - highest
Legend