relim the challenge of climate change questions of our ... · to evaluate them with the aim of...
TRANSCRIPT

REKLIMHelmholtz Climate Initiative
Regional Climate Change
THE
CHA
LLEN
GE
OF
CLIM
ATE
CHA
NG
E
Q
uest
ions
of o
ur ti
me.
Ans
wer
s w
e ne
ed.
NEWSLETTER No. 2September 2012
Regional climate change - causes and effects

Collaborative climate researchThe climate change challenge
During its 3 years of operation thus far the Helmholtz Climate Initiative Regional Climate Change (REKLIM) has worked closely together and developed major findings in the field of regional climate development. Given the continued unchecked worldwide trend in emissions of greenhouse gases harmful to the climate into the atmosphere and the simultaneous rise in the mean global temperature, it is all the more important to gain a better understanding of the causes, feedback processes and consequences, especially on a regional scale, and be able to evaluate them with the aim of communicating improved projections and determining appropriate adaptation measures on that basis.
Such topics as the increase in weather extremes (heavy pre-cipitation, floods or droughts) and the change in precipitation statistics are a matter of concern to every single one of us and are perceived as such. Something that is merely a disturbing development for some may represent an existential threat for others (e.g. agriculture). That is why a better understanding of the prevailing processes and interactions and the further deve-lopment of high-resolution regional models through improved parameterisation play a major role in the climate initiative.
This also involves precise knowledge of atmospheric processes as well as physical and chemical processes in the atmosphere and interactions on a microscale, in particular for the land surface. Only by deriving better parameterisation of these processes for modelling on a global to regional scale is it pos-
sible to comprehend the observations better and in the next step project anthropogenic changes. Examples in this context include the impacts of trace gases as well as aerosols and particulates on cloud formation and the radiation budget and the hydrometeorological interactions in soil moisture dynamics as a prerequisite for an improved understanding of vegetation feedbacks in the climate system.
On the global scale processes in polar latitudes, especially in the Arctic, provide a major contribution to detection of climate change. Observations substantiate that the polar regions in particular react intensively to changes, which manifests itself in an increasing decline in sea ice and pronounced melting on Greenland, with consequences for the ocean, permafrost areas (also submarine) and the ecosystem.
To conduct this diverse research, the REKLIM initiative com-bines a large number of observations, starting with satellite measurements and ranging from aircraft all the way to In-situ observations, with further development of models on a global to regional scale. In the 2012 newsletter we present specific aspects of the results obtained last year on an exemplary basis.
Prof. Dr. Peter Lemke (AWI) Scientific Coordinator of the Helmholtz Climate Initiative REKLIM

1
AW I | D L R | F Z J | G F Z | H M G U | H Z G | K I T | U F Z
Alfred-Wegener-Institut für Polar- und Meeresforschung in der Helmholtz-Gemeinschaft
Deutsches Zentrum für Luft- und Raumfahrt
Forschungszentrum Jülich
Helmholtz-Zentrum Potsdam - Deutsches GeoForschungsZentrum
Helmholtz-Zentrum München - Deutsches Forschungszentrum für Gesundheit und Umwelt
Helmholtz-Zentrum Geesthacht - Zentrum für Material- und Küstenforschung
Karlsruher Institut für Technologie
Helmholtz-Zentrum für Umweltforschung
PA R T N E R U N I V E R S I T I E S
Universität Bremen (UHB)
Universität Hamburg (UHH)
Universität Heidelberg (UHD)
KIT - Universitätsbereich (UKA)
Universität zu Köln (UK)
Universität Leipzig (UL)
Technische Universität München (TUM)
Universität Potsdam (UP)

2
Impressum
Coordination officeHelmholtz-Verbund REKLIMScientific coordinator: Prof. Dr. Peter Lemke (AWI)Managing director: Dr. Klaus Grosfeld (AWI)Coordination assistant: Marietta Weigelt (AWI)
Contact:Alfred-Wegener-Institut für Polar- und Meeresforschungin der Helmholtz-GemeinschaftBussestraße 24, 27570 Bremerhaven
Dr. Klaus GrosfeldTel.: 0471-4831-1765E-mail: [email protected]
Dipl.-Geogr. Marietta WeigeltTel.: 0471-4831-1750E-Mail: [email protected]
www.reklim.deE-mail: [email protected]
Publisher:Helmholtz-Verbund REKLIM, 2012
Text and figures:Members of the Helmholtz-Verbund REKLIM
Editing and design:Prof. Dr. Peter Lemke (AWI)Dr. Klaus Grosfeld (AWI)Dipl.-Geogr. Marietta Weigelt (AWI)
Copyright:Alfred-Wegener-Institut für Polar- und Meeresforschung in der Helmholtz-Gemeinschaft
Spokespersons for the topics:Topic 1: Prof. Dr. Klaus Dethloff (AWI), Prof. Dr. Hans von Storch (HZG)Topic 2: Prof. Dr. Peter Lemke (AWI), Prof. Dr. Heinrich Miller (AWI)Topic 3: Prof. Dr. Rolando di Primio (GFZ), Prof. Dr. Ursula Schauer (AWI)Topic 4: Prof. Dr. Sabine Attinger (UFZ), Prof. Dr. Hans Peter Schmid (KIT)Topic 5: Prof. Dr. Johannes Orphal (KIT), Prof. Dr. Andreas Wahner (FZJ)Topic 6: Prof. Dr. Christoph Kottmeier (KIT), Dr. Frauke Feser (HZG)Topic 7: Prof. Dr. Bernd Hansjürgens (UFZ), Prof. Dr. Hans von Storch (HZG)Topic 8: Prof. Dr. Ralf Tiedemann (AWI), Prof. Dr. Achim Brauer (GFZ)Topic 9: Prof. Dr. Johannes Orphal (KIT), Prof. Dr. Andreas Wahner (FZJ)Topic 10: Prof. Dr. Reimund Schwarze (HZG/UFZ) Prof. Dr. Beate Ratter (HZG)
Layout: Coordination office REKLIM
Printing: BerlinDruck, Achim

3
Content
5
6
Coupled modelling of regional Earth systems 4
Sea-level changes and coastal protection 6
Regional climate changes in the Artic: Forcing and 8long-term effects at the land-ocean interface
The land surface in the climate system 10
Chemistry-climate interactions on global to regional scales 12
Extreme weather events – storms, heavy precipitation, 14floods and droughts
Socio-economics and management for regional climate change adaptation 16and mitigation strategies
Abrupt climate change derived from proxy data 18
Climate change and air quality 20
Risk assessment and risk management for climate adaptation strategies 22
Climate Office for Polar Regions and Sea Level Rise 24
North German Climate Office 25
Climate Office for Central Germany 26
South German Climate Office 27
7
8
9
10
4
3
2
1
3

4
How does the development of the climate depend on the interaction between atmosphere-ocean-ice and land surfaces? What effect do natural and anthropogenic processes have?
Abb. 1.1: Temporal change in the Arctic sea ice extent for the month of September in the ensemble simulations, the NCEP reanalysis and SSMI satellite data. The blue line shows the ensemble mean, the dashed blue lines represent the range of the double standard deviation. The orange line represents the NCEP data and the grey line the SSMI data. (Graphics: AWI/Dorn et al., 2012)
MotivationREKLIM provides a framework for developing regional climate system models having a high spatial resolution. These are based on coupled models for the various climate components, such as atmosphere, ocean, sea ice, land and aerosol che-mistry. The objective is to rework the currently available global climate projections, which in some cases only have a coarse spatial resolution of several hundred km, for the regional scale. This is not easy since increasing spatial resolution means processes and interactions in the climate system have to be depicted and represented in greater detail, but this is the only way to capture the local influences on the climate and make reliable projections.
Within REKLIM the Alfred Wegener Institute (AWI) primarily focuses on the Arctic region using regional Earth system models (RESMs). The Helmholtz-Zentrum Geesthacht (HZG) develops these RESMs for Germany and northern Europe while the Karlsruher Institut für Technologie (KIT) and the Helmholtz-Zentrum für Umweltforschung (UFZ) concentrate their develop-ment efforts on Germany and Central Europe.
Atmosphere, ocean, sea ice and permafrost feedbacksThe sea ice cover in the Arctic is a major indicator of climate change and additionally triggers feedback processes that boost the progress of this change. Knowledge of these proces-ses is therefore important to be able project future changes more precisely. Seven ensemble simulations were carried for the 1948-2008 period using the coupled regional climate mo-del HIRHAM-NAOSIM, which provides a good representation of
the spatial distribution of thin and thick sea ice. These simula-tions showed that the atmospheric circulation in summer plays a decisive role for changes in the extent of the sea ice cover. In summers with low-pressure systems over the Arctic Ocean the decline in sea ice is significantly less than in summers with high-pressure systems. High-reaching, warm anticyclones and minimal cyclone activity thus lead to a reduction in sea ice in the Arctic. The simulated sea ice variability displays considera-ble decadal variations whose amplitude fluctuates between the ensemble members (Fig. 1.1). The variability in winter, by cont-rast, is predominantly driven by external processes whereas in summer it is determined by internal feedback processes.
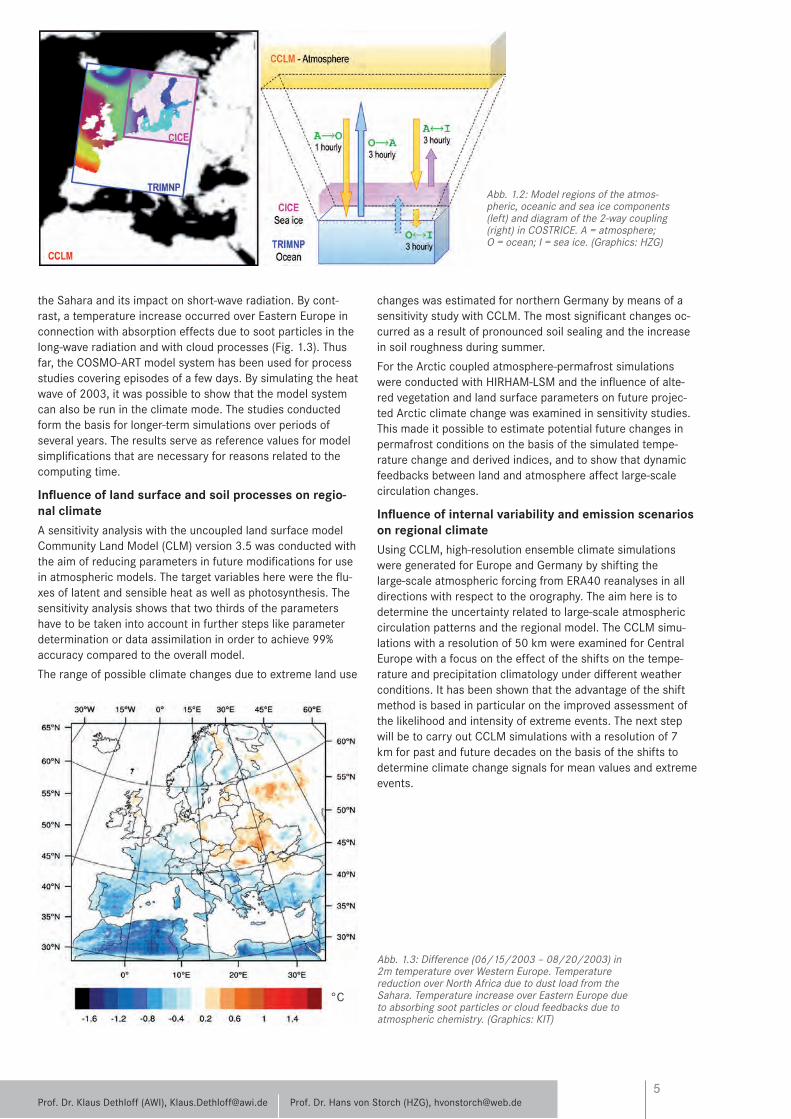
The COSTRICE model system was developed for investigations of the interactions between atmosphere, ocean and sea ice over the North and Baltic Seas region. The components of this system are the regional climate model for the atmosphere CCLM (COSMO-CLM), the regional ocean model TRIMNP and the sea ice model CICE. The OASIS coupler (Fig. 1.2) provides for the exchange between the components. In a test study COSTRICE was used for simulations over the North and Baltic Seas for winter and summer months of the year 1997. Because of the higher spatial resolution (13km x 13km) in comparison to the global data (200km x 200km) and the interaction with the atmosphere, the ocean model TRIMNP generated better monthly mean values of the sea surface temperature (SST) over ice-free regions in the coupled version than in the uncou-pled version. Without a sea ice scheme, TRIMNP tends to un-derestimate the SST and overestimate the surface temperature over the sea ice regions of the Gulf of Bothnia. The aim of this model development is an improved simulation of the regional climate over the North and Baltic Seas region by taking into account interactions between atmosphere, ocean and sea ice.
Influence of aerosols, clouds and trace gases on the climate in EuropeThe COSMO-ART model system was further developed regar-ding treatment of the interaction between aerosol particles and clouds and currently includes 60 chemical constituents and 111 aerosol tracers as well as their coupling via radiation. The heat wave in summer 2003 with extremely warm high-pressure systems over Europe was simulated with this model system. According to the latter, the extreme temperatures over Western Europe were reduced by approx. 1°C due to the ae-rosol influence resulting from deposition of mineral dust from
1Coupled modelling of regionalEarth systems
AW I | K I T | H Z G | U F Zex
tent
of i
ce c
over
[106 k
m2 ]
5
changes was estimated for northern Germany by means of a sensitivity study with CCLM. The most significant changes oc-curred as a result of pronounced soil sealing and the increase in soil roughness during summer.
For the Arctic coupled atmosphere-permafrost simulations were conducted with HIRHAM-LSM and the influence of alte-red vegetation and land surface parameters on future projec-ted Arctic climate change was examined in sensitivity studies. This made it possible to estimate potential future changes in permafrost conditions on the basis of the simulated tempe-rature change and derived indices, and to show that dynamic feedbacks between land and atmosphere affect large-scale circulation changes.
Influence of internal variability and emission scenarios on regional climateUsing CCLM, high-resolution ensemble climate simulations were generated for Europe and Germany by shifting the large-scale atmospheric forcing from ERA40 reanalyses in all directions with respect to the orography. The aim here is to determine the uncertainty related to large-scale atmospheric circulation patterns and the regional model. The CCLM simu-lations with a resolution of 50 km were examined for Central Europe with a focus on the effect of the shifts on the tempe-rature and precipitation climatology under different weather conditions. It has been shown that the advantage of the shift method is based in particular on the improved assessment of the likelihood and intensity of extreme events. The next step will be to carry out CCLM simulations with a resolution of 7 km for past and future decades on the basis of the shifts to determine climate change signals for mean values and extreme events.
Prof. Dr. Klaus Dethloff (AWI), [email protected] Prof. Dr. Hans von Storch (HZG), [email protected]
the Sahara and its impact on short-wave radiation. By cont-rast, a temperature increase occurred over Eastern Europe in connection with absorption effects due to soot particles in the long-wave radiation and with cloud processes (Fig. 1.3). Thus far, the COSMO-ART model system has been used for process studies covering episodes of a few days. By simulating the heat wave of 2003, it was possible to show that the model system can also be run in the climate mode. The studies conducted form the basis for longer-term simulations over periods of several years. The results serve as reference values for model simplifications that are necessary for reasons related to the computing time.
Influence of land surface and soil processes on regio-nal climateA sensitivity analysis with the uncoupled land surface model Community Land Model (CLM) version 3.5 was conducted with the aim of reducing parameters in future modifications for use in atmospheric models. The target variables here were the flu-xes of latent and sensible heat as well as photosynthesis. The sensitivity analysis shows that two thirds of the parameters have to be taken into account in further steps like parameter determination or data assimilation in order to achieve 99% accuracy compared to the overall model.
The range of possible climate changes due to extreme land use
Abb. 1.2: Model regions of the atmos-pheric, oceanic and sea ice components (left) and diagram of the 2-way coupling (right) in COSTRICE. A = atmosphere; O = ocean; I = sea ice. (Graphics: HZG)
Abb. 1.3: Difference (06/15/2003 – 08/20/2003) in 2m temperature over Western Europe. Temperature reduction over North Africa due to dust load from the Sahara. Temperature increase over Eastern Europe due to absorbing soot particles or cloud feedbacks due to atmospheric chemistry. (Graphics: KIT)
°C

6
The climate warming observed on the Earth in recent decades not only leads to a rise in the global mean temperature, but also has impacts on the mean sea level. Two mechanisms play a key role here. On the one hand, the warming of the oceans causes a thermal expansion of the water, which consequently occupies more volume (steric contribution). On the other hand, higher air and ocean temperatures lead to increased melting of mountain glaciers and parts of the huge Greenland and An-tarctic ice sheets, which thus drain additional freshwater into the oceans (eustatic contribution). The two processes together currently contribute to a more or less equal extent to the rise in the global mean sea level. Observations in recent years, however, indicate that particularly the contribution due to melting processes on Greenland is growing and we can expect an accelerated rate of the sea level rise.
Ice mass balance and global impactsThanks to satellite observations and especially the GRACE satellite gravimetry mission, it has been possible since 2002 to quantify the mass balance of the two ice sheets on a regional scale. In this mission two satellites in tandem flight measure the tiniest changes in the gravitational attraction, which may result, for example, from varying melting or iceberg calving of
the continental ice sheets and associated changes in mass. Within REKLIM the GRACE data have now been compared to other observations in order to identify what share of the cur-rent ice mass loss on Greenland is accounted for by melting, iceberg calving and fluctuations in precipitation. An increase in the loss of mass in the northwest after 2005, for instance, is partially attributable to heavy precipitation in the period before that and is also perceptible in the mass balance for the entire ice sheet (Fig. 2.1). This previous growth in mass declined in the following years, leading to acceleration in the net mass loss. The melting and calving rates between 2002 and 2011 for all regions examined are extraordinarily high in comparison to estimates over the past five decades.
The melting of the large ice sheets and in particular the observed ice mass loss on Greenland not only influence the sea level, but also the entire climate system. A study with a coupled global Earth system model (Fig. 2.2) investigates the interaction processes of future climate developments with respect to the Earth system on a global scale. For this purpose a dynamic ice sheet model was integrated into an Earth system model that describes the feedback processes, such as changes in height and albedo, as well as the melt water runoff with respect to the atmosphere and the ocean. In the last IPCC assessment report in 2007 the projections for climate development up to the year 2100 were calculated with an Earth system model and a fixed ice sheet, without taking into account the major interaction processes for the melting of the ice sheet. For this reason scenario simulations for various CO2 developments up to the year 2300 are currently carried out with the fully coupled Earth system model. This enables better assessment of the global impacts. These calculations are to be included in the next assessment report, which will be published in 2013.
Global and regional sea level changesTo quantify the steric sea level contribution more precisely, the changes in the local sea level height, the density of the seawater as well as the distribution of the ocean mass during the last eight years were investigated in the North Atlantic.
Abb. 2.1: Temporal variation in ice mass on Greenland between 2002 and 2011. GRACE data (black); anomalies in precipitation (red) and melting (yellow) from a regional climate model (RCM) and anomalies in outflow (calving) of glaciers and ice streams from radar interferometry data (blue), and their total (green); anomalies w.r.t. the mean values from 1961 to 1990. (Graphics: Ingo Sasgen, GFZ)
AW I | G F Z | H Z G
How large are the losses of the continental ice masses (particularly on Greenland) and how does the sea level react to melt water and ocean warming?
Sea-level changes andcoastal protection2

7
For the period from mid-2002 to the end of 2010 altimeter satellites recorded in the North Atlantic no change in the sea level height between the Equator and 55°N. Using Argo floats (autonomous drifting floats for measurement of ocean tem-perature, salt concentration and ocean current), an increase in the density in the upper 2000 m was observed at the same time for this region. This corresponds to a drop in the sea level of approx. 1 mm/year. The GRACE satellites recorded an increase in ocean mass in the same period, equivalent to a rise of approx. 0.5 mm/year. Further investigations are necessary to determine the extent to which the lacking 0.5 mm/year are due to measurement inaccuracy or represent a real indication of density changes from the deep ocean (e.g. warming of deep water).
Although the mean sea level in the North Atlantic has changed little since 2002, regionally a differentiated picture results. In the tropical and subpolar North Atlantic the sea level rose by up to 5 mm/year while it dropped by approx. 5 mm/year in the subtropics, indicating a weaker mean circulation in the upper 1000 m. An analysis of the main components of the sea level signal shows that it involves the dominant pattern of sea levels after deduction of the seasonal cycle (see Fig. 2.3). In
Prof. Dr. Peter Lemke (AWI), [email protected] Prof. Dr. Heinrich Miller (AWI), [email protected]
addition to a reinforcement of this pattern over the observati-on period, additional multi-year fluctuations occur. This pattern is also found in the steric levels, i.e. it is caused by changes in density along with other influences.
Influence on ocean circulationThe accelerated melting of the Greenland ice sheet and the increasing input of freshwater contributes, on the one hand, to an additional mass flux to the global sea level rise while, on the other hand, the local sea level is additionally influenced by cir-culation changes, the altered gravity effects on the ocean and the change in loading in the lithosphere. Though the mean sea level can be derived accurately enough from the mass losses, the influence on the local sea level is the subject of intensive research.
In a model study using the finite element sea ice ocean model (FESOM), which is based on an unstructured model grid with local grid refinement and is thus especially suited for such studies, a freshwater perturbation experiment was conducted to study the change in the local sea level in the Arctic Ocean (Fig. 2.4). Under specified atmospheric forcing conditions freshwater discharges of 100,000 m³/s were initiated along the Greenland coast. After 120 years a spatially differentiated picture results, by virtue of the melt water input alone, with changes of up to 20 cm sea level rise in the Canadian archipe-lago and several centimetres along the European coast and in the central Arctic.
Abb. 2.2: The coupled Earth system model for studying long-term climate change consists of an atmosphere model (ECHAM5), an ocean model (MPI-OM) with sea ice component as well as an ice sheet model (RIMBAY). The respective forcing data of the different models are exchanged in order to take the interaction processes in the climate system into account. (Graphics: AWI)
Abb. 2.4: Dynamic change in sea level (cm) due to melt water input from Greenland after a simulation period of 120 years. (Graphics: AWI)
Abb. 2.3: Dominant patterns of the change in sea level and of the steric component (top) as well as their temporal development (EOF ana-lysis)(right). The annual cycle was subtracted beforehand. (Graphics: Saskia Esselborn, GFZ)
Sea level - 41% variance Steric level - 30% variance
Height (cm)
Amplitudes of the main components
Sea level Steric level
4000
3500
3000
2500
2000
1500
1000
500
0
4000
3000
2000
1000
5000
1000 2000 3000 4000 5000
Eis
dick
e
3500
3000
2500
2000
1500
1000
500
0
1500
500
2500
2000
1000
500 1000 1500
-40 -20 0 10 20 30B
reite
Länge
Temperatur (°C)La
Latit
ude
Ice
thic
knes
s
LaLongitude
Temperature (°C)

8
AW I | G F Z | H Z G
Regional climate changes in the Arctic: Forcing and long-term effectsat the land-ocean interface
What specific changes result for land, ocean, and atmosphere in the shelf sea and permafrost regions of the Arctic due to climate change and what interactions take place?
The objective of the work on Topic 3 is to decipher the me-chanisms and effects of regional climate change in marginal areas of the Arctic Ocean. In-situ observations, aircraft and satellite measurements and a regional model are used for this purpose so as to gain an understanding of the current and past changes in energy and material fluxes in the atmosphere, ocean, on the seafloor and on land. (Fig. 3.1)
Ocean circulation in Fram Strait and Laptev SeaWarm and highly saline water of Atlantic origin enters the Arctic Ocean through the Fram Strait between Greenland and Svalbard (Spitzbergen). Our long-term measurements show a temperature increase of approx. 1°C in the inflow area over the last decade. Simultaneous sea ice observations indicate that ocean warming in the immediate environment has led to a decline in the ice cover.
Via the boundary current parts of the warm Atlantic water reaches far eastward along the shelf edge to the northern edge of the Laptev Sea, one of the broad and shallow Siberian shelf seas. There oceanographic data from year-round measuring moorings and hydrographic surveys in winter 2009/2010 show
3that, triggered by offshore winds and the related drift of sea ice, warm bottom water has spread far southward onto the shallow shelf. This warm water very likely comes from the con-tinuation of the warmed-up inflow through the Fram Strait and reaches the shelf through upwelling processes. Such warm water intrusions may have far-reaching impacts on the sea ice cover, the submarine permafrost and biological processes.
Methane in the atmosphereEnergy, water and carbon fluxes are measured regularly at the Russian-German Samoylov research station in the northeast Siberian Lena Delta. Such continuous measurements provide for good recording of the temporal variability of the measure-ment variables, but not of the substantial spatial variability. For this reason airborne measurements will be carried out in the near future to complement local measurements. The airborne eddy covariance measurements, both on land and over the ocean, will supply regionally integrated methane emission rates on 100 km scales.
The current and the next AIRMETH (Airborne Measurements of Methane) campaign utilise the turbulence sensor on the nose boom and a fast methane sensor on board the Polar 5 aircraft to record methane fluxes. Initial test measurements took place in Germany and subarctic Finland in June 2011. They provided important experience for planning the first expeditions over permafrost areas in northwest Canada and northern Alaska, which are planned for July 2012.
Abb. 3.1: Map of the Arctic with all research areas. In the ocean: studies on gas emission (yellow circ-le), oceanographic measurements (thick lines). On land: aircraft campaigns (stars), permafrost studies and applications of remote sensing (dashed lines), simulation region of the atmosphere model (dotted line). (Graphics: Florian Greil, AWI)
−6000
−4000
−2000
0m
Hammerfest Basin
Fram Strait
Laptev Sea area
Yamal region
YakutskMackenzie
CCLM

9Prof. Dr. Rolando di Primio (GFZ), [email protected] Prof. Dr. Ursula Schauer (AWI), [email protected]
Methan on the seafloorTo study the temperature-controlled emission of methane from the Arctic Basin, more precise investigation of the geologi-cal development of the Hammerfest Basin in the southwest Barents Sea have been performed. Our basin reconstructions by means of 3D simulation software for oil and natural gas deposits show episodic outgassing in the last 2.5 million years. Access to high-resolution seismic data on a natural gas reservoir additionally permits us to study gas migration through faults and fissures in detail (Fig. 3.3). Escaping gas is presumably stored during ice ages in the form of gas hydrates and released during the transition to the following interglacial. Up to 3 gigatons of methane – a gigaton is the weight of an ice block having an edge length of 1 km – have left the seafloor within the last 1.1 million years. Biogeochemical investigations of pockmarks (crater-like structures formed when gas escapes from the seafloor) support these findings. Biomarkers indicate that biotic communities which metabolise methane occurred in the past, but no longer exist today.
Abb. 3.2: Collection of soil data for calibration of remote sensing parameters in Yamal (Siberia) in August 2011. The photo shows spectrogonio-meter measurements for the so-called leaf area index of the tundra in the measurement areas of the international programme Greening of the Arctic. (Photo: Roman Ivanov, Yamal expedition 2011)
Abb. 3.3: Diagram of leakage system above a gas field. Possible gas flow path-ways are indicated by red arrows. The base of the gas hydrate stability zone (GHSZ) is highlighted in blue. When the glaciers retreat, the GHSZ becomes shallower, gas escapes from the seafloor and generates pockmarks. (Gra-phics: Ilya Ostanin, GFZ).
Field measurements, operational remote sensing and regional climate modelling of permafrostA circum-arctic service for satellite-aided remote sensing has been set up in cooperation with the International Permafrost Association (IPA) within the framework of the Data User Ele-ment (DUE) Permafrost project. The remote sensing products “surface temperature”, “soil moisture”, “frozen/non-frozen soil” and “land cover” are evaluated using soil measurements from international monitoring networks (Fig. 3.1) and demon-strate their suitability for describing permafrost landscapes at high latitudes. The remote sensing products are now freely available to users (http://www.ipf.tuwien.ac.at/permafrost) and applicable for monitoring, parameterisation and evaluation in permafrost and climate models.
Due to the low meteorological station density in the Arctic region of Siberia, in-situ observation data is available only to a limited degree. Hence the COSMO-CLM regional climate model was used to reconstruct the climate in Siberia for the period 1948-2010 and thus obtain a meteorological data record with a good spatial and temporal resolution. The model was previous-ly configured especially for this region.

10
K I T | F Z J | U F Z | H M G U | G F Z
The land surface in the climate system
What are the regional impacts of climate change on the ecosystem, water resources, agriculture and forestry and how do these in turn affect the climate?
using the WRF regional hydrometeorological model and obser-vations of the TERENO Pre-Alpine Observatory (Fig. 4.1). In this process various spatial resolutions of the model (60, 20, 3km) were evaluated at three different TERENO locations (Fendt, Rottenbuch and Graswang) for six months. While the quality of the forecast declines with the forecast period for all locations, as expected, a positive effect of the resolution can initially be identified only for the Rottenbuch and Fendt locations. For Graswang, situated in a narrow mountain valley, the model shows unstructured deviations for all resolutions examined. Overall, the model is able to depict the dynamics of the atmos-pheric processes well. The next step involves validation for the transformation of water and energy in the soil zone.
Sensitivity of a land surface model to its initial para-metersInvestigation of the sensitivity of calculated flux variables, such as the sensible heat flow or photosynthesis, of parameters in land surface models is a key step during model development and evaluation. Parameters here refer to variables in the model equations that were determined through empirical data and are thus not constants, but contain uncertainty. One of the difficulties in sensitivity analyses involves existing correlations between the parameters. The Helmholtz-Zentrum für Umwelt-forschung (UFZ) therefore carried out a complex sensitivity analysis with a commonly applied land surface model that takes into account the correlations between different para-
With its vegetation, soil and groundwater the land surface forms the lower boundary condition in the climate system through which the atmosphere and the climate are essentially shaped and which, in turn, is dependent on climatic influen-ces. Transformation and transport processes in the cycles of energy (radiation, heat) and water, of greenhouse gases and other trace substances with a climatic impact are concentra-ted on the land surface. Together with topography, therefore, the land surface with its pronounced spatial variability is the primary cause of regional distinctions in the climate, which is additionally exposed to anthropogenic land use changes (agriculture, forestry, urban development, slash-and-burn land clearance). One of the objectives of REKLIM is to gain a better understanding of the interactions between soil, biosphere and atmosphere and describe them quantitatively using mechani-stic models. Long-term, integrated measuring and modelling activities in the TERENO (TERrestrial ENvironmental Observato-ries) network play a key role in this context.
Validation of hydrometeorological simulations with TERENO observationsHydrometeorological model systems are used to obtain an understanding of the interactions between water and energy balance. They make it possible, for instance, to analyse the exchange processes between soil, vegetation and atmosphere. For the validation of these models it is thus important for a broad range of observation variables to be available and this is ensured via the TERENO initiative. In the first step KIT/IMK-IFU compared regional 72-hour weather forecasts on a daily basis
4Abb. 4.2: The left side shows a classic parameter importance index that does not take into account any correlations between parame-ters. The right side shows the newly developed index that takes into account parameter interactions. One can see that the group of parameters 6-9, for example, which describe the hydraulic conductivi-ty of the soil, and the group 35-50, which contains many biochemical parameters of photosynthesis, stand out to a greater degree when correlations are taken into account. (Graphics: Matthias Cuntz)
Abb. 4.1: Comparison of a selected 72-h WRF forecast as from 15.05.2012 (solid lines) with measurements (broken line) of the TERE-NO Pre-Alpine Station in Fendt. (Graphics: Benjamin Fersch)
0 10 20 30 40 50 60 70Parameter
0.00
0.02
0.04
0.06
0.08
0.10
0.12
0.14
0.16
0.18
Par
amet
erIm
port
ance
Without Covariation
0 10 20 30 40 50 60 70Parameter
0.00
0.02
0.04
0.06
0.08
0.10
0.12
Par
amet
erIm
port
ance
With Covariation

11
meters. For this purpose the sensitivity of sensible and latent heat as well as of photosynthesis was determined based on the nearly 70 identified parameters of the land surface model by examining the derivations of the flux variables according to these parameters with a singular value decomposition. On the basis of the main component analysis, it is possible in this way to develop an index that indicates the importance of each sin-gle parameter for the model variability. Furthermore, scientists can calculate, according to a user-defined confidence interval, a threshold value that enables them to pick out the most im-portant parameters with the desired model accuracy (Fig. 4.2). The results of the sensitivity analysis were made available to the other groups in REKLIM, e.g. as a guideline for adaptation of the coupled regional climate models.
Assimilation of eddy covariance and soil moisture mea-surements in land surface modelsTo improve the forecasts of the HYDRUS-1D land surface mo-del, the Agrosphere Institute at the Forschungszentrum Jülich analysed how the assimilation of eddy covariance and/or soil moisture measurements influences the model results. Data assimilation was carried out by means of a so-called particle filter in combination with methods of sequential importance sampling (SIS) or sequential importance resampling (SIR) using 6,000 particles. Data assimilation was tested by means of a synthetic experiment in which loamy sand was the reference soil type and a growth cycle of an agricultural plant was simulated. The groundwater level was fixed at a depth of 4 m as the lower boundary condition. The atmospheric input data stem from the Maastricht airport in the Netherlands (2007). In the first time step soil hydraulic parameters (Mualem-van Genuchten parameters a, n and Ks) were drawn randomly via Latin Hypercube Sampling (LHS) and in the case of resampling perturbed with 10% for a and 2.5% for n und Ks.
The model behaviour was evaluated through 1) characterisati-on of the soil moisture at various depths, 2) the current evapo-transpiration of the plants and 3) characterisation of soil hyd-raulic parameters. The results show that forecasts of the soil moisture and characterisation of the soil hydraulic parameters via assimilation of measured soil moisture can be immensely improved (Fig. 4.4). Assimilation of eddy covariance data, on the other hand, hardly improves the forecast of evapotranspira-tion and the corresponding parameters. The best results were achieved when soil moisture and eddy covariance data were assimilated together, thus leading to improved forecasts of soil moisture, evapotranspiration and soil hydraulic parameters.
Prof. Dr. Sabine Attinger (UFZ), [email protected] Prof. Dr. Hans Peter Schmid (KIT), [email protected]
Establishment of the new research area TERENO NortheastThe Deutsche GeoForschungsZentrum Potsdam (GFZ) com-menced with instrumentation of the TERrestrial Environmental Observatories (TERENO) German Lowland (NO) at the begin-ning of 2011. A substantial portion of the instrumentation had already been put into operation in the test areas Müritz National Park (Grosser Fürstenseer See) and DEMMIN (Du-rable Environmental Multidisciplinary Monitoring Information Network).
The most important instrumentation implemented last year in-cluded: i) installation of a crane in the forest near Demmin (see Fig. 4.3), which serves as a universal research platform, e.g. for innovative remote sensing technologies and dendrological investigations; ii) installation of 15 climate stations on the DLR-Neustrelitz DEMMIN test field for calibration and validation purposes in connection with satellite data products (e.g. eva-potranspiration, soil moisture); iii) hydrological instrumentation at Grosser Fürstenseer See (Müritz National Park) for studying the interaction between groundwater and surface water as well as the water availability of trees; iv) field instrumentation for dendrological investigations at Grosser Fürstenseer See for examining transfer of the climate signal in representative tree species.
TERENO-NO receives major support from two other Helmholtz projects: i) the Helmholtz Virtual Institute ICLEA (Virtual Insti-tute of Integrated Climate and Landscape Evolution Analyses) and the Helmholtz junior researcher group TEAM (Trace Gas Exchange in the Earth – Atmosphere System on Multiple Sca-les) with a total of 16 scientists and 5 technicians.
Abb. 4.4: Evolution of estimated soil hydraulic parameters (a, n, and Ks) for 2007 for the case in which soil moisture and eddy covariance measurements are assimilated. The red line is the mean forecast by means of the particle filter and the red star is the reference value. The shaded areas are from white to black the 10%, 68%, 90%, and 95% significance level. (Graphics: Wittaya Kessomkiat, FZJ)
Abb. 4.3: At the TERENO “German Lowland” observatory (coordination: GFZ) crane equipment makes it possible to sample hard-to-reach marshland and treetops. (Photos: Markus Reich, GFZ)

12
F Z J | K I T | G F Z | AW I | D L R
5Chemistry-climate interactionson global to regional scales
How is the regional climate affected by changes to the atmospheric composition?
The scientists involved in this topic examine the possible influence of various physical and chemical processes in the atmosphere on the climate system and contribute to the development of coupled chemistry-climate models, which can then also be used to study regional climate change. One of the focal points of this topic is a more in-depth investigation of the chemical and thermal structure of the tropopause region (boundary between the lower atmospheric region, the tropos-phere, and the stratosphere lying above that). It is one of the subjects reported on in this issue.
Quantification of the ice nucleation capacity of aerosol particlesA very small proportion of the aerosol particles in the atmos-phere has the special ability to cause cloud drops to freeze and thus trigger the formation of precipitation. The number of ice crystals in cirrus clouds in the upper troposphere is also influenced by aerosol particles. The physical and chemical prerequisites for this phenomenon are tested in numerous laboratory experiments. In REKLIM Topic 5 scientists at the Karlsruher Institut für Technologie (KIT) are endeavouring to summarise these measurements and derive from them parameterisations for weather and climate models. A decisive factor is the surface size of the particles. Measurements using different methods converge when the number of ice nuclei is
standardised with the particle surface (Fig. 5.1). This applies in particular to mineral dust, which is often transported up to the upper troposphere.
The tropopause as a climate indicatorThe tropopause is a key region for an understanding of diverse atmospheric processes. It is characterised by the transition of the temperature profile from temperatures that decline with increasing height to temperatures that rise with increasing height. The height of the tropopause varies with geographic latitude; the greatest heights occur in the tropics (17-18 km) and then a nearly continuous decline towards the poles can be observed (7-8 km).
Changes in the height of the tropopause are a sign of climate change. Two fundamental mechanisms that lead to a rise in the tropopause height are a warming of the troposphere and a cooling of the lower stratosphere. Both processes have been detected in recent years by means of an analysis of various data records (satellites, weather analyses, radiosondes) and reproduced with numerical simulations of coupled chemistry-climate models.
Particularly satellite measurements with the GPS radio occulta-tion method, which have a suitable vertical resolution (<1 km) for the temperature measurements and cover the height range of the upper troposphere and lower stratosphere, are suited for global observation of the tropopause height. The Deutsche GeoForschungsZentrum Potsdam (GFZ) has been obtaining and analysing the data from three GPS instruments (CHAMP, GRACE, TerraSAR-X) since 2001.
Fig. 5.2 shows temperature trends in a height range from 5 to 25 km between 85°N and 85°S. The positive temperature trend in the troposphere, i.e. below the tropopause, whose mean height is shown as a white line, is clearly visible. Cooling can be observed in large sections above the tropopause, i.e. in the lower stratosphere. Exceptions are solely found in the tropics just above the tropopause and in the area of the sub-tropics in both hemispheres.
Abb. 5.1: Number of ice nuclei per particle surface as a function of temperature for the freezing of supercooled drops with the aerosol particles contained in them. Without aerosol particles cloud drops freeze at approx. -38°C. The data are based on a large number of laboratory measure-ments. (Graphics: after Hoose and Möhler, 2012)

13
Mixing processes in the lower stratosphereNatural and anthropogenic greenhouse gases have a conside-rable effect on the climate in the region of the upper tropos-phere and lower stratosphere. For this reason it is important to understand the quantitative influence of transport and mixing processes. Using the chemistry-transport model CLaMS (Chemical Lagrangian Model of the Stratosphere), scientists in Jülich have examined the impact of uncertainty regarding the atmosphere mixing intensity on the simulation of greenhouse gases and the corresponding radiation effects.
The mixing process is parameterised in the model essentially on the basis of the horizontal and vertical deformation of the wind field. Especially water vapour and ozone concentrations display pronounced gradients in the lower stratosphere and thus react extremely sensitively to uncertainty regarding the mixing intensity. The model calculations show that correspon-ding uncertainty in the calculation of radiative forcing may amount to as much as 0.72 W/m2 for water vapour and 0.17 W/m2 for ozone. These figures are comparable to the current estimates of the total greenhouse effect due to long-lived greenhouse gases since 1980 and demonstrate the impor-tance of maximum accuracy in the reproduction of atmosphe-ric trace substance transport and of the processes on which it is based in the region of the upper troposphere and lower stratosphere in climate simulations.
Use of satellite data for validation of chemistry-climate modelsA cooperation project between the Forschungszentrum Jülich (FZJ) and the Karlsruher Institut für Technologie (KIT) examines how satellite data compare to model simulations of the chemi-cal composition in the upper troposphere. The algorithms for determining the concentration profiles of different trace gases from the infrared spectra of the MIPAS instrument (Michel-son Interferometer for Passive Atmospheric Sounding) were developed at KIT. The profiles are compared to the results of various global chemistry-climate models stored in the Jülich ar-chive of the TFHTAP (Task Force Hemispheric Transport of Air Pollution). In this context the scientists are primarily interested in the conclusions that can be drawn concerning the sources and sinks of reactive nitrogen oxides in the upper troposphere based on the data and how the ozone concentration in the upper troposphere is influenced by the nitrogen oxide concen-trations. Fig. 5.3 shows a comparison of the monthly mean MIPAS concentrations from 16 different models. The results vary substantially. The MIPAS data generally display a more pronounced vertical gradient in the tropopause than the model data. This is an indication of shortcomings in the parameterisa-tion of transport in the lower stratosphere. The DFG researcher group SHARP (Stratospheric Change and its Role for Climate Prediction), with the participation of Helmholtz Association research institutes, carries out further work on the use of satellite data.
Prof. Dr. Johannes Orphal (KIT), [email protected] Prof. Dr. Andreas Wahner (FZJ), [email protected]
Abb. 5.2: Mean annual temperature trend in °C for height range 5-25 km. The solid white line marks the mean tro-popause height. The results are based on measurements by CHAMP (May 2001 to September 2008), GRACE (April 2006 to December 2011) and TerraSAR-X (March 2009 to December 2011). (Graphics: after Schmidt et al., 2010)
0
5
10
15
20
25
0 2 4 6 8 10
Altit
ude
[km
]
HNO3 [ppb]
HTAP Models January 2001 and MIPAS Data (116E, 34N) CAMCHEM
CHASER
ECHAM-HAMMOZ
ECHAM-MOZ
FRSGCUCI
GEMAQ-EC
GEOS-CHEM
GISS-PUCINI
GMI
LMDZ-INCA
IMPACT
MOZART
OSLO-CTM2
STOCHEM
TM5
UMCAM
MIPAS 2007
MIPAS 2008
MIPAS 2009
Abb. 5.3: Vertical profiles of HNO3 mixing ratio over China from MIPAS satellite measurements in January 2007, 2008 and 2009 compared to calculated mixing ratios from 16 models of the international TFHTAP model comparison.(Graphics: K. Sahu, FZJ)
Temperature trends (2001 to 2011)H
eigh
t [km
][°C/Jahr]

14
K I T | H Z G | G F Z | U F Z
6Damage due to meteorological extreme events has increased significantly worldwide in recent years. Questions that arise in this connection include the extent to which this increase is caused by climate change and what extreme events will be ex-pected in the future. The work focusing on these questions in the framework of Topic 6 encompasses various studies on po-lar lows, heavy precipitation and related floods and hailstorms. Combining results of high-resolution regional climate models with different observation data records makes it possible to quantify and statistically analyse the frequency and intensity of meteorological extreme events better than before.
A climatology of North Pacific polar lowsUsing a regional climate model (CCLM), a climatology for polar lows in the North Pacific in the last approx. 60 years was calculated for the first time at Helmholtz-Zentrum Geesthacht (HZG). Polar lows are intensive small-scale cyclones that may endanger coastal regions, maritime shipping and infrastruc-ture. A similar study has already been conducted for the North Atlantic within the scope of REKLIM. It showed that the re-gional model is able to simulate polar lows even if they are not contained in the forcing reanalysis data. The model has now been examined with an eye to its suitability for simulation of polar lows in the North Pacific on the basis of individual case studies. Subsequently a polar low climatology from 1948 to 2010 was calculated (Fig. 6.1, left). The number of polar lows displays a pronounced variability from year to year. However, a long-term trend cannot be inferred for the last decades, which corresponds to the results for the North Atlantic. The spatial distribution of the polar lows in the North Pacific is quite even (Fig. 6.1, right); there are only isolated clusters, such as on the coast of Japan. Similar to the study for the North Atlantic,
there are plans to estimate the development of polar low fre-quency up to the end of the century for various possible future scenarios using the CCLM.
Understanding flood changes betterThe development of flood events is determined by a number of natural and anthropogenic factors. Scientists at the Deutsches GeoForschungsZentrum (GFZ) are developing a concept for classification of flood changes that will serve as the basis for determining the causes of the changes. By means of trend tests and non-stationary extreme value statistics, it is thus possible to detect the changes in flood behaviour. At the same time simulation models are used to examine whether the presumed causes (e.g. climate, land use changes, river construction) may explain the flood changes.
Researchers examined the extent to which the observed flood trends in selected catchment areas in Germany in the period from 1951 to 2003 were caused by changes in precipitation
Extreme weather events - storms,heavy precipitation, floods and droughts
How will the severity and frequency of extreme weatherevents change in a future climate?
Abb. 6.1 left: Climatology of polar lows for the subpolar North Pacific from 1948 to 2000, derived from a multi-decadal COSMO-CLM simulati-on. The climatology shows a pronounced interannual variability in the number of polar lows, but only a low decadal variability and no long-term changes in the North Pacific. Right: Spatial distribution of polar lows in the North Pacific, the map depicts the number of detected polar lows per 0.4° grid box. (Graphics: Frauke Feser, HZG)
Abb. 6.2: Impacts of climate change on the probability distribution of flood trends at Haltern/Lippe gauge. (Graphics: Yeshewatesfa Hunde-cha, GFZ)
-4 -3 -2 -1 0 1 2 3 4 50
0.1
0.2
0.3
0.4
0.5
0.6
0.7
0.8
Mann-Kendall test statistic / Measure of change in flood flows
Rela
tive fre
quency
Haltern/Lippe, flood flows in winter
-4 -3 -2 -1 0 1 2 3 40
0.1
0.2
0.3
0.4
0.5
0.6
0.7
0.8
Rela
tive fre
quency
Guntershausen/Fulda, flood flows in winter
Stationary precipitation, stationary temperature
Stationary precipitation, non-stationary temperature
Non-stationary precipitation, stationary temperature
Non-stationary precipitation, non-stationary temperature
Observed trend
Mann-Kendall test statistic / Measure of change in flood flows
Number of polar lowsTime (years)
Num
ber o
f det
ecte
d po
lar l
ows

15
and temperature. A hydrological model was forced with many synthetic climate time series. The latter were produced with a multivariate weather generator taking into account the tem-poral variability of precipitation and temperature (Fig. 6.2). In case of the Haltern/Lippe gauge, for example, it is found that the observed flood trend can be almost completely explained by changes in precipitation. For other gauges examined, by contrast, the climate changes can only partially explain the trend. This indicates that there were other influences that aggravated flood behaviour in the catchment area, such as changes in land use or river training. Further research is needed to identify the influential factors.
Prediction of extreme droughts caused by soil moistu-re deficitsThe main causes of the unsatisfactory capacity of forecast models are uncertainty regarding the meteorological forcing factors, conceptualisation of dominant processes and their parameterisation to the desired spatial and temporal scale. To map parameter uncertainty in the prediction of soil moisture and drought events, soil moisture fields were generated for the period 1950-2010 from 100 different parameter sets (ensemb-le) at the Helmholtz-Zentrum für Umweltforschung (UFZ) using the mesoscale hydrological model (mHM). Each of the 100 ensemble members was forced with the same daily meteorolo-gical conditions (precipitation and temperature) and a spatial resolution of 4 x 4 km². Furthermore, the model was initialised on 1 January 1951 with climatological mean values of a 15-day window around the first of January. The simulations display a high variability in the soil moisture index (SMI), perceptible in the large range of fluctuation (Fig. 6.3, left). In addition, the influence of parameter uncertainty on drought statistics, as shown by the significant variance of its probability of occur-rence (Fig. 6.3, right), cannot be neglected. This demonstrates that individual model simulations are not suitable for deriving conclusive results regarding extreme droughts on the basis of these data.
Summer thunderstorms and hailOn the basis of three-dimensional radar data in combinati-on with lightning data and insurance data, scientists at the Karlsruher Institut für Technologie (KIT) developed a “clima-tology” of severe hail events for Germany. According to this climatology, the probability of hail increases considerably from
north to south mainly due to changes in static stability of the atmosphere. In many regions, the maximum is located on the lee side of the low mountain ranges. According to COSMO simulation studies, this distribution is caused by the formation of convergence zones in connection with a partial flow circula-tion around the mountains.
To analyse long-term changes in the convection conditions in the past, researchers statistically analysed radiosonde data and various reanalyses downscaled with the CCLM regional climate model. Overall, all data records examined show an increase in convection potential across Europe in the past (Fig. 6.4). By means of a Bayesian model (statistical method of analysis), it was shown that the frequency of hail-related large-scale weather patterns will increase only slightly in the future. Currently efforts are under way to determine the best possible combination of different proxy data that are relevant for hail with the help of multivariate regression analyses. This method will then be applied to an ensemble of regional climate models in order to determine changes in hail probability in the future.
Prof. Dr. Christoph Kottmeier (KIT), [email protected] Dr. Frauke Feser (HZG), [email protected]
Abb. 6.3 left: Uncertainty of soil moisture index SMI (indicator of available water in the rhizosphere) for major river catchment areas in Ger-many. The dark blue line represents the mean value of the ensemble, the uncertainty range of the SMI is shown in light blue. Right: Drought intensity as an integral of the SMI for the duration of a drought event; the higher the value, the longer and more intense is the drought event (unit: months x percentage share of area based on Germany). Every dot stands for an ensemble simulation. The probability density of the drought size and area affected by the drought (SMI<0.2) for these simulations is depicted in colour for two of the ten biggest events in Germany since 1951. (Graphics: Luis Samaniego, UFZ)
Abb. 6.4: Linear trends of 90% percentile of the annual distribution function (1978-2009) for the convective available potential energy CAPE across Western Europe (red: increase, blue: decline; dark colours: > 90% significance, light colours > 80%, no shading: no significance). (Graphics: Susanna Mohr, KIT)

16
U F Z | H Z G
7Socio-economics and managementfor regional climate change adaptation and mitigation strategies
Integrated climate policies comprise the mitigation of greenhouse gas emissions and adaptation to climate change. Is there an optimal route to be taken?
The negotiations on continuation of the Kyoto Protocol in Durban at the end of 2011 made it clear that we cannot expect a binding and ambitious global convention on reduction of greenhouse gases in the short to medium term. Against this background, the climate policy strategy of adaptation is gaining increasing significance and was consequently incorpo-rated into the climate policy “post-Kyoto architecture” as an essential complement to the mitigation strategy (Fig. 7.2). This means targeted scientific analyses are necessary to ensure effective and consistent climate protection and adaptation measures. In addition, we need improved databases as well as innovative methods and instruments to implement this new in-tegrated climate policy in national, regional and local contexts. Topic 7 encompasses socio-economic research work on adap-tation and integrated climate policy by the Helmholtz-Zentrum für Umweltforschung (UFZ) and Helmholtz-Zentrum Geesthacht (HZG). The main focus here was on scientific support and an analysis of the latest developments and negotiation processes in the post-Kyoto regime. Another focal point was to determine the existing challenges regarding the interaction between climate research and policy. Finally, methods for supporting regional adaptation decisions were developed and applied.
New developments in the post-Kyoto architectureThe UN Climate Conferences in Cancun (COP16) and Durban (COP 17) in 2010 and 2011 sealed the end of Kyoto’s policy architecture. The new post-Kyoto architecture differs in many ways from the previous Kyoto regime. Worldwide adaptation is a key element of international climate policy since the climate changes that have already take place are irreversible in the short to medium term, even in the event of successful future climate protection agreements. Furthermore, this integrated adaptation and mitigation strategy is supported by the estab-lishment of a comprehensive, uniform worldwide system for monitoring, reporting and verifying greenhouse gas emissions – also in the new industrial countries, such as China and India. Another crucial component of the post-Kyoto architecture is a newly forming international system of “climate finance”. The latter provides for transfer payments from industrial to developing countries in order to promote their adaptation and mitigation efforts, which are indispensable for global climate policy success. There are basically four types of payments that differ according to the targeted costs (Fig. 7.1). They are used to reduce either the potential costs of loss and damage, or vulnerability, the actual costs of damage as well as the costs of adaptation and mitigation of the developing countries. In contrast to the debate in the scientific and political arena up to now, greater weight should be placed on the strategic effects, incentives and welfare implications associated with the diffe-rent types of transfer and thus on the question of the form of financing, in addition to the amount of the transfer payments.
Abb. 7.1: The system of “climate finance” within the new post-Kyoto architecture essentially envisages four starting points for the instruments aimed at providing fi-nancial support for climate policy measures in developing countries after their implementation under the umbrella of the United Nations Framework Convention on Climate Change (UNFCCC). The central element is the Green Climate Fund, which provides for financing of 1) adapta-tion and 2) mitigation investments and thus expands the purely adaptation fund. Another financing programme is designed to alleviate the 3) residual loss and damage due to climate change. The UNFCCC-related financing inst-ruments include the Global Environmental Facility (GEF) of the World Bank, whose transfer payments are geared to 4) vulnerability, i.e. the potential costs of damage, as a form of environmental assistance. (Source: Glemarec, 2011)
UNFCCC
Standing Committeeon Finance
Green Climate Fund
Mitigation Adaptation
Loss anddamages
AdaptationFund
GEF

17
Abb. 7.3: Process of assessment and pri-oritisation of adaptation measures using the software-based decision-making support tool PRIMATE (Graphics: UFZ)
Interaction between climate policy and research and the role of the IPCCAlthough reference is often made in relevant literature to the “hegemonic role” of the Intergovernmental Panel on Climate Change (IPCC), currently there are few studies that examine the interactions of its reports with research at the national level. The Helmholtz-Zentrum für Umweltforschung (UFZ) takes up this issue within the scope of the NESNET research project. The project comes to the conclusion that though the IPCC does not directly attempt to exert influence on national research efforts, it has created major impetus and a new con-ditional framework for research and research policy. Although transnational bodies of experts like the IPCC do not have an official mandate for “research policy”, one of its missions is to determine where political decision-makers have a need for information and on that basis identify corresponding research priorities. As a rule, IPCC reports are used as a standard reference in German research programmes and thus perform a generic function in demonstrating the relevance of climate problems in politics and research. In addition, it becomes evident that the knowledge provided by the IPCC as well as its concepts regarding research and policy advice are not directly adaptable. Rather, there is a need for adapting concepts like climate adaptation to the requirements of the national and regional level as well as of the individual research fields (such as biodiversity and flood protection) and incorporating them into existing approaches and knowledge bases (Hulme et al., 2011; Beck, 2012).
Economic assessment and selection of adaptation measuresDecisions made within the framework of an integrated climate policy lead to complex risk considerations, which in the end can only be weighed up in discussions with the parties concerned. Do we need new assessment bases for munici-pal drainage and sewage infrastructure in view of increasing winter precipitation? How can fresh air corridors be created in cities vulnerable to heat waves on a socially compatible basis, without destroying neighbourhoods that have evolved over time? Socio-economic research can support these debates by means of dynamic decision-making aids that are adaptable to local conditions (Fig. 7.3). The software-based, participative decision-making support tool PRIMATE (Probabilistic Multi-Attribute Evaluation) was developed at UFZ in this connection. It makes it possible to develop suitable adaptation measures in cooperation with players concerned and advocacy groups as well as to identify and weight assessment criteria. Depending on demands and available data, the assessment can be carried out on the basis the cost-benefit criterion or on a multi-criteria basis. The tool has already been successfully applied for prio-ritisation of urban adaptation measures in the framework of a case study (Gebhard et al., 2011).
Prof. Dr. Bernd Hansjürgens (UFZ), [email protected] Prof. Dr. Hans von Storch (HZG), [email protected]
Abb. 7.2: In view of stagnant international climate protection negotiations, the climate policy strategy of adaptation is gaining increasing impor-tance. There is a particularly pressing need for adaptation in developing countries that are already hard hit by the negative impacts of climate change, such as heat stress and drought, but do not have the necessary financial strength to alleviate their vulnerability. The photo shows a no-mad settlement in the West Bank suffering from the arid conditions. A water distribution ditch was built there in the framework of the S.M.A.R.T. (Sustainable Management of Available Water Resources with Innovative Technologies) project. (Photo: André Künzelmann, UFZ)
1st stageIdenti�cation of vulnerabilityDelimiting the speci�c problemsetting or damaging event
2nd stageDe�nition of possible measuresPossibly setting up a packageof measures
5th stagePrioritisation of measuresFor instance with PRIMATE
4th stageData ascertainment for the evaluation of measuresExperienced data, anticipation data
3rd stageDe�nition of evaluation criteria and choice of evaluation methodPossibly weighting of evaluation criteria
Update throughadjustment ofcriteria
Update throughimprovement of databasis or additionalresearch

18
AW I | G F Z | H Z G | U H B | U H D | U H H | U P
8Abrupt climate change derived from proxy data
Which mechanisms, processes and regional climate patterns intensify abrupt climate changes during interglacials and at glacial-interglacial transitions? How different are these patterns compared to the last interglacial, the Eemian, when the average temperature was about 1-2°C higher than it is now?
Climate archives of the past provide evidence that abrupt changes in the climate with global consequences have taken place within a few years or decades. Potentially such abrupt transitions cannot be ruled out for the future either. A deeper understanding of the climate archives thus furnishes the basis for a better understanding of the processes and mechanisms on which such rapid climate changes are based.
Modelling abrupt changes in deep water circulation in the Atlantic
The climate in the Atlantic Ocean displays a strong correlati-on between the alternation of warm and cold phases at high latitudes and changes in the meridional deep water circulation. Geological archives from marine sediment and ice cores show that these changes may have occurred relatively suddenly within only a few decades.
To be able to understand the causes of such abrupt changes in the past climate better, these processes were examined using a complex numerical Earth system model. During the last age in the period from approx. 70,000 to 11,500 years ago large amounts of continental ice in North America and Scandinavia were stored and episodically ended up in the North Atlantic as fresh water. Our numerical experiments thus simulate the temporal development of the climate as a response to fresh water intrusions in the North Atlantic for three time periods: the preindustrial climate and the glacial climate 21,000 and 32,000 years ago. The respective basic states for our experi-ments are based on equilibrium simulations having a duration of 2,000 years each, followed by simulation of an increased fresh water inflow of 0.2 Sv (1 Sv = 106 m3/s) in the North Atlantic over a period of 150 years. At the end of this period all three simulations display a similar reaction in the form of a greatly reduced meridional deep water circulation (Fig. 1a, b, c). However, the subsequent recovery of circulation depends considerably on the basic state of the climate. In this regard we find a faster and more pronounced kick-start behaviour for the circulation under the climate conditions 32,000 years ago (Fig. 1b) in comparison to 21,000 years ago (Fig. 1c). For the preindustrial climate we observe a relatively slow and gradual rise to the initial state.
Abb. 8.1 : Changes in the formation of deep water in the Labrador Sea and the Greenland-Iceland-Norwegian Sea (GIN) as well as in the North Atlantic (AMOC) for the a) preindustrial climate and for the climate b) 32,000 years ago and c) 21,000 years ago. The dashed grey lines for model year 100 and 250 indicate the time frame for fresh water per-turbation. The curves in d) and e) show the simulation development of temperature and salt concentration in the tropical Atlantic (20°S-30°N) at a depth of 500 m. (Graphics: AWI)

19Prof. Dr. Ralf Tiedemann (AWI), [email protected] Prof. Dr. Achim Brauer (GFZ), [email protected]
Abb. 8.2: Lake Meerfelder Maar during winter ice cover. (Photo: Martin Koziol, Maar Museum Manderscheid)
Abb. 8.3: Laminated sediments from Lake Meerfelder Maar from the first millennium BC. The conspicuous bright layer at approx. 33 cm shows a sequence after a severe discharge event caused by heavy rain. (Graphics: GFZ)
The key to these different climate responses lies in the altered vertical temperature stratification in the North Atlantic that is characterised by an exceptionally rapidly increasing tempera-ture inversion (rise in temperature with increasing depth) in the experiment for the climate 32,000 years ago. The sudden collapse of the vertical stratification is triggered by the end of the fresh water perturbation and leads to intensification of the deep water circulation by the rise of relatively warm and salty intermediate water masses to the surface. The tropical Atlantic has a similar influence, by contributing to the subsequent fuel-ling of the deep water circulation as a positive feedback (Fig. 1d-e) by virtue of the accumulation of warm and salty water during the fresh water perturbation. These processes tempora-rily result in greater volumetric transport surpassing that of the initial state (Fig. 1b, c). These results are in line with the data and furnish an explanation for the varying behaviour of chan-ges in deep water circulation during abrupt climate transitions during the last ice age.
Climate information from lake sedimentsLaminated lake sediments (Fig. 8.3) provide information on ab-rupt and short-term climate fluctuations in times before instru-ment recordings, their possible causes as well as their regional impacts in human habitats. New findings on a cooling phase at the beginning of the pre-Roman Iron Age in Central Europe were obtained in a study on sediments from Lake Meerfelder Maar in the West Eifel region (Fig. 8.2). 2,760 years ago the thickness of the annual layers suddenly doubled for a period of 200 years. Microscopic analyses of the annual layers show that particularly the considerably increased occurrence of frag-mented diatoms brought about this rise in layer thickness. The reason for this was pronounced algal bloom in spring after the break-up of the lake’s winter ice cover. This algal bloom was triggered by the release of nutrients from the sediment due to a wind-induced increase in water circulation. Thus the rise in the layer thickness is a clear indication of frequently stormy conditions in spring. Precisely for this sediment section with thicker layers parallel geochemical analyses revealed a higher element flow of beryllium-10, which is regarded as an indica-tor (proxy) of solar activity. Increased beryllium-10 values are
indicators of lower solar activity and indicate here the grand solar minimum known as Homeric Minimum. At the same time this makes it possible for the first time to show on the basis of a sediment profile that the atmospheric circulation in Central Europe changed at the same time as a substantial decline in solar activity lasting around 200 years. This is an indication of a causal connection between solar activity and atmospheric circulation. Moreover, the results support observations from satellite data that the (compared to the overall radiation) much more extensively varying ultra violet (UV) share of the solar radiation, which is responsible for ozone production and warming in the stratosphere, is a key to understanding the reinforcement mechanisms, via which changes in solar activity impact the climate. Even though the complex process chain of the transmission of stratospheric changes to tropospheric wind systems is not yet known in detail, the results from Lake Meerfelder Maar demonstrate that new proxy data can make a major contribution to an understanding of regional climate change. In addition, a precise chronology enables us, by coun-ting the annual layers, to ascertain that the change from calm to windy conditions in spring took place within a very short pe-riod of only 8 years. The reasons for such short-term changes and possible threshold values are not known. The data from this study are available to REKLIM partners, who can compare them to proxy data from other geoarchives and regions and test them in climate models.

20
K I T | F Z J | H M G U | D L R | U K | U K A | T U M
9Climate change and air quality
How does climate change affect the air quality? What are the potential impacts of climate change and air quality changes on human health? How can these various interconnections and reactions be integrated into numerical climate and air quality models? What kind of measured data is required to characterise these effects in quantitative terms?
OverviewThe topic of “Climate change and air quality” has been the subject of research at the centres involved (Karlsruher Institut für Technologie, Forschungszentrum Jülich, Helmholtz Zentrum München) and the associated partners (Zentrum Allergie und Umwelt an der TU München, Institut für Physik der Atmosphä-re am DLR, Rheinisches Institut für Umweltforschung an der Universität Köln, Engineering Mathematics and Computing Lab am KIT) since mid-2011.
The main objective of this topic is networking and coordinated further development of the existing work and competencies related to research in the field of climate change and air quali-ty, particularly with regard to health and allergology, as well as better integration of the climate-relevant aspects of air quality into the development of regional climate forecasts. This prima-rily takes place through thematic orientation and coordination of new work at the various centres.
The focus of work up to now has been on investigating the influence of aerosols and particulate matter on climate and air
quality as well as the impact of local air pollution control meas-ures in plumes of clean coal-fired power stations on clouds and precipitation frequency and developing new satellite mis-sions for monitoring air quality over Europe.
Influence of aerosols and fine dust on climate and air qualityBased on measurements and model simulations, the focus of the work was on the direct and indirect impact of aerosols and particulate matter on climate and air quality. On the one hand, researchers examined the impacts of the eruption of the Eyjafjallajökull volcano on Iceland on air quality and health (Schäfer et al. 2011). On the other hand, they conducted model simulations with the WRF/chem coupled climate-chemistry model system regarding direct and indirect feedback mecha-nisms of aerosols and particulate matter in connection with meteorology (radiation, temperature, precipitation, boundary layer height, clouds) and air quality (ozone, PM10) in Europe (Fig. 9.1). As a result, they determined that the so-called semi-direct effect, which describes the influence of temperature, mixed layer height and clouds on the radiation budget, domi-nates the direct effect of absorption by aerosols on radiation. The impacts on ozone concentration and PM10 distribution (particulate matter with a size smaller than 10 μm) results in changes of ±10% and up to -50% respectively, depending on cloud cover, precipitation and the intensity of the particulate matter emissions.
Impacts of local air pollution control measures in plu-mes of clean coal-fired power stations on clouds and precipitation frequencyJunkermann et al. (2011) studied the impacts of local air pollution control measures in plumes of clean coal-fired power stations in Germany, China and Australia on the regional cli-mate by means of an ultra-light aircraft (the smallest manned environmental research aircraft in the world) that enables scientists to trace the emissions and the increase in aerosols
Abb. 9.1: Overview of the regions examined over Europe (abo-ve) and North America (below) using ten different up-to-date regional air quality model systems (Solazzo et al. 2012). The colours show the anthropogenic summer emissions of NOx (in kg m-3) from standard inventories. The dots and other symbols are the positions of urban ozone measuring stations used for the analysis. (Graphics: Salazzo et al., 2012)
(kg/m3)

21
directly at the height of the plumes.
The currently common method of flue gas cleaning by means of so-called flue gas scrubbing and selective catalytic reduc-tion (SCR) leads to a massive increase in the emission of ultra-fine sulphur aerosols and makes coal-fired power stations a major source of ultra-fine aerosol (Fig. 9.2). These particles accumulate in the atmosphere to form cloud condensation nu-clei within a few hours and thus influence cloud microphysics as well as precipitation intensity and frequency on a regional scale.
A further measurement campaign is planned in Australia for summer 2012 in order to investigate the regional impacts of these technologies more closely there.
Development of new satellite missions to monitor air purity over EuropeMonitoring of air purity over Europe by means of satellites is an important topic that has received a great deal of attention for several years now. Measurements of tropospheric NO2 using GOME (on ERS-2) and SCIAMACHY (on ENVISAT) instruments have given major impetus to the determination of regional emissions and the distribution of air pollutants. These measu-rements are now continued by means of operational sensors (GOME-2) on MetOp satellites. In the past years measure-ments of tropospheric ozone have been derived for the first
Prof. Dr. Johannes Orphal (KIT), [email protected] Prof. Dr. Andreas Wahner (FZJ), [email protected]
time from data of the IASI instrument (also on MetOp), which are of great interest for validation of chemistry-climate models and improvement of emission inventories. Satellite data from tropospheric CO are also possible by means of IASI.
Current work primarily concerns measurements of NO2, O3, CO and aerosols from the geostationary orbit, which enables bet-ter spatial and temporal coverage compared to the currently available polar satellites (MetOp) and reduces the influence of clouds (Fig. 9.3). In Europe this will be the GMES Sentinel 4, which is to be launched together with the Meteosat Third Ge-neration (MTG) operational satellites at the end of this decade. This and any subsequent missions will be optimised by means of so-called Observation System Simulation Experiments (OSSE), in which the influence of instrument parameters on improvement of forecasts is studied by coupling the simulated observation data with operational air quality models.
The preparatory work in this field (Lahoz et al. 2012) takes place in close cooperation with scientists, space and environ-mental agencies worldwide, coordinated in particular by the CEOS (Committee on Earth Observation Satellites) – Atmos-pheric Composition Constellation (ACC) group – as well as with the European network MACC (Monitoring of Atmospheric Com-position and Climate), which bundles the operational services in this sector planned in GMES.
Abb. 9.2: Schematic diagram of the influence of flue gas cleaning technologies on precipitation statistics (Junkermann et al., 2011). Left (old power station): the SO2 emissions influ-ence the size and distribution of aerosols, but not the number of emitted particles. Right (new power station): directly emitted H2SO4 increases the density of cloud condensation nuclei and thus has a massive influence on cloud micro-physics (brighter clouds, reduced precipitation). (Graphics: Junkermann et al., 2011)
Abb. 9.3: Improvement of spatial resolution and coverage over Europe by means of a satellite in geostatio-nary orbit (GEO) in comparison to a low Earth orbit (LEO) constellation of polar satellites (Lahoz et al. 2012). Left: Required number of LEO satellites for a resolution of 1.0 degree (approx. 100 km). Right: Required number of LEO satellites for a resolution of 0.4 degrees (approx. 40 km). Grey areas show zones that cannot be recorded from GEO. (Graphics: Lahoz et al., 2012)

22
G F Z | H Z G | K I T | U F Z | U P | U H H | U K A | U L
Risk assessment and risk management for climate adaptation strategies 10 What risks are related to climate change and how can they be assessed from
an economic point of view? How can scientific support be provided to policy-makers and other decision-makers in addressing these risks?
The basis for successful adaptation to climate change is assessment of future risks. However, an integrated analysis of the dynamics of climate and socio-economic change repre-sents a tremendous challenge compared to the previous static risk analyses. Coupling natural and social science approaches within the Helmholtz centres involved (GFZ, HZG, KIT, UFZ) makes precisely such dynamic risk analyses possible. The focus here is on an examination of meteorological extreme events whose risks have been assessable up to now only with a relatively high degree of uncertainty in contrast to more fre-quent events. Such events include storm tides, floods, heavy winds, hail, lightning and droughts. Integrated assessment of municipal or regional planning concepts and adaptation strate-gies poses another challenge. Science develops methods and processes for supporting political decision-makers in mana-ging risks that involve substantial uncertainty. Some research activities are presented in the following.
Perception of climate change and natural disastersCultural values and perceptions of risks in the population play a major role in the development of future planning and ma-nagement strategies. But how does the population of a region perceive climate change and the potential danger of natural disasters? At Helmholtz-Zentrum Geesthacht (HZG) this is the
subject of investigation in the Hamburg metropolitan region. In an annual telephone survey since 2008 Hamburg households have been asked to submit their assessment of the influence of climate change and the probability of occurrence of a natu-ral disaster. The most recent survey of May 2012 shows that, as the years before, less than half (47%) of the respondents feel that climate change represents a great or very great threat for Hamburg (Fig. 10.1). 83% view storm tides or floods as the natural disaster that potentially has the severest consequen-ces for Hamburg while 8% indicate storms, 7% heavy rain and 2% heat waves (see also: Ratter et al., 2012).
Moving towards integrated flood management in Germany
Integrated concepts for flood management are increasingly implemented in Germany and Europe. Private household should also make a contribution. That includes using mobile water barriers or highly resistant building materials as well as taking precautions with respect to substances hazardous for water. The GeoForschungsZentrum Potsdam (GFZ) has succeeded in quantifying the damage-mitigating effect of these measures and pointing out their cost efficiency (Kreibich et al. 2011). Moreover, it examined the status of the implementation of private precautionary measures (Bubeck et al., submitted) by means of a survey of flood-prone households along the
Abb. 10.1: “Does climate change represent a very great, great, not so great or no threat at all for Hamburg in your opinion?” Surveys 2008-2012, number of surveyed households n~500 (Graphics: Ratter et al., 2012; www.hzg.de).

23
Rhine conducted by the GFZ in cooperation with the Institute for Environmental Studies (IVM), Amsterdam. The results show that, in particular, direct experience with floods leads to the implementation of precautionary measures (Fig. 10.2). This is substantiated very clearly, for instance, in the wake of the two severe floods in 1993 and 1995. However, if climate change increasingly influences areas with little direct experience with floods as well, the question arises as to how adequate propa-gation of precautionary measures can be achieved in these regions.
Integrated risk assessment and communication of uncer-tainty for municipal risk management and adaptation strategies
The impacts of elementary weather events are extremely complex in densely settled and dynamic areas and the damage potential is at the same time quite considerable because of the high concentration of assets in urban regions. For the development of municipal adaptation and risk management strategies it is therefore important to assess local hazards and risks and analyse what uncertainties are associated with these assessments. High-resolution climate projections, such as those developed at the Centre for Disaster Management and Risk Reduction Technology CEDIM run jointly by the GeoFor-schungsZentrum Potsdam and the Karlsruher Institut für Technologie (KIT) (Schädler et al., 2012), are coupled with mo-dels for assessing vulnerability to enable a combined systemic analysis of interdependencies, indirect effects or cascades (Fig. 10.3).
Methods for assessing costs of natural risks
A profound understanding of the costs caused by natural hazards is necessary for efficient management of the risks of climate impacts. The objective of the EU project CONHAZ, in which the Helmholtz-Zentrum für Umweltforschung (UFZ) and the GFZ were involved, was to compile existing methods for assessing the costs of natural risks. It took into account different natural risks (droughts, floods, storm tides and alpine natural risks) and different types of costs (direct damage, los-ses due to operational downtime, indirect damage, intangible effects like health and environmental effects as well as costs of risk reduction through management measures). For the first time it was possible to obtain a comprehensive overview of the current status of assessment methods in this field (www.conhaz.org; Markantonis et al. 2012).
Prof. Dr. Reimund Schwarze (HZG/UFZ), [email protected] Prof. Dr. Beate M. W. Ratter (HZG), [email protected]
Abb. 10.2: Flood experience and implementation of precautionary measures on the part of flood-pro-ne households (number of surveyed households n=752) along the Rhine (1970-2011). (Graphics: GFZ)
Abb. 10.3: The figure (below) shows the relative change in flood discharge (ensemble average) between 2021-2050 and 1971-2000, here using the Ruhr as an example. The use of coupled ensembles enables quantification of the uncertainty (in grey, standard deviation from ensemble average). The work at KIT also looks at the question of how such uncertainty can be communicated and taken into account in planning processes (Graphics: Schädler et al. 2012, Photo: KIT).

24
What does climate change mean for young people all over the world? Who is responsible for climate change and who bears the consequences? To be able to understand these aspects relating to the topic of “climate justness” better, the Climate Office for Polar Regions and Sea Level Rise at the Alfred-Wege-ner-Institut carried out the “climateXperience” project funded by Deutsche Bundesstiftung Umwelt (German Foundation for the Environment) in 2011. An exhibition was set up at Bremen’s Cultural Church St. Stephani jointly with Bremen sculptor and artist Gunther Gerlach and Europaschule Schulzentrum Sekundarbereich II Utbremen in Bremen. Implementation of the project was integrated into everyday classroom instruction at school through the subject “Applied Project Management”. Topics from the fields of climate change, climate adaptation and climate protection were prepared for the exhibition. The topics were to be presented illustratively with the help of information, pictures and objects selected and put together by the pupils and others involved themselves. The cooperation with Mr. Gerlach enabled the secondary school pupils to find new forms of expression for sharing their views and experi-ences with others. The positive reporting, such as in the local Bremen daily “Weser-Kurier”, led to participation of the pupils with their project in Sustainability Day for Bremen schools in March 2012. Among other things, three teams of the project received the opportunity there of showing their self-made films concerning climate change on a big screen at the CineStar Kristall-Palast cinema.
Climate Office for Polar Regions and Sea Level Rise
Climate consulting at Alfred-Wegener-Institut für Polar- und Meeres-forschung (AWI)
AW I |
The current projects of the Climate Office additionally include developing lecture notes for the correspondence course Envi-ronmental Science in the Climate Department at the Fernuni-versität (distance teaching university) in Hagen. The advanced course of study combines current and practice-oriented know-ledge in the various fields of environmental science as well as many years of experience in further education and training and correspondence courses. This work involves transferring the research results of the Alfred-Wegener-Institut to teaching practice and thus promotes and intensifies a mutual exchange of scientific findings.
To further intensify communication between scientific research and society, the Climate Office held a workshop on “Observed climate changes in the polar regions” at Pauluskirche in Bre-merhaven on the occasion of the General Convent in July 2012.
Furthermore, in October 2012 the Climate Office is organising the German-French workshop “Gateway to the Arctic“ at AWI in Bremerhaven that brings together young researchers from different disciplines of the natural and social sciences focusing on the Arctic so they have the opportunity of getting an insight into and discussing developments outside their own discipline.
Abb. K.1: Result of the pupils’ campaign “Scrap monster” at Recyclinghof (recycling cen-tre). The campaign was carried out within the scope of the pu-pils’ project “climateXerience” funded by Deutsche Bun-desstiftung Umwelt. (Photo: Gunther Gerlach)
Abb. K.2: Exhibits of the “climateXperience” pupils’ exhibition during Sustainability Day for Bremen schools in March 2012. (Photo: Renate Treffeisen)
www.klimabuero-polarmeer.de Dr. Renate Treffeisen (AWI), [email protected]

25
Since 2006 the North German Climate Office at the Helmholtz-Zentrum Geesthacht (HZG) maintains an intensive science - stakeholder dialogue in Northern Germany. From this dialogue process public information needs regarding regional climate change are derived to develop tailored information products. Last year, for instance, the North German Climate Office came up with two new information offerings.
Web tool on coastal protection need: www.kuesten-schutzbedarf.deOn the occasion of fiftieth anniversary of the storm surge of 16/17 February 1962 the North German Climate Office developed a new interactive web tool that provides information on the current and possible future coastal protection needs. When people are asked about the risks associated with climate change in Northern Germany, the first response are often the storm surges. Apart from this general awareness of the risks, however, practically applicable know-how is indispen-sable since many people are still unaware of the fact that at present the home for around 4.8 million residents of Northern Germany would be flooded twice a day if there were no dikes. At www.kuestenschutzbedarf.de users can find out on an interactive map (Fig. K.3) whether their residential area is now protected against storm surges thanks to coastal protection measures or whether this may be necessary in the future due to climate change. Residential areas and specific regions can be selected via postcodes or a zoom function. By the end of the 21st century high storm surges in the North Sea may rise up to 1.10 metres compared to present storm surge heights because of a rising sea level and possible changes in the wind climate. In the event of such water levels, the area requiring protection against North Sea storm surges would expand by about 10 percent from the current approx. 10,800 square kilo-meters. Of decisive importance for the effectiveness of coastal protection are flexible protection strategies that have to be planned and implemented with the involvement of an informed population. The new interactive web tool is contributing to this aim.
Handbook for Baltic Sea coast in climate changeResults of a survey among players in the political and adminis-trative arena on the German Baltic Sea coast in summer 2011 illustrated the substantial need for scientifically sound infor-mation in a comprehensibly prepared form. The North German Climate Office together with the International BALTEX Secre-
North German Climate Office
Regional climate service for Northern Germany
H Z G |
tariat at the Helmholtz Zentrum Geesthacht have responded to this need with a new handbook on “Baltic Sea Coast in Climate Change” that is free of charge and presents scientifically con-solidated results in comprehensible form (Fig. K.4). In terms of content, the handbook is based on the regional assessment report on climate change in the Baltic Sea region (BACC - Assessment of Climate Change for the Baltic Sea Basin) and information offered by the North German Climate Office. The handbook contains the most important research results of the past decades from the Baltic Sea region and is oriented as far as possible to the German Baltic Sea coast.
www.norddeutsches-klimabuero.de Dr. Insa Meinke (HZG), [email protected]
Abb. K.3: Excerpt from the interactive map for simulation of current coastal protection using Cuxhaven as an example, www.kuesten-schutzbedarf.de. (Graphics: Insa Meinke, HZG)
Abb. K.4: Cover “Baltic Sea Coast in Climate Change – A handbook on the state of research”

26
The dialogue with regional players and decision-makers is the focal point of the work performed by the Climate Office for Central Germany at the Helmholtz-Zentrum für Umwelt-forschung (UFZ). Its competence encompasses the fields of climate impacts and adaptation. As far as climate impacts are concerned, the Climate Office focuses on the topics of water quality and quantity, biodiversity and the impacts on society and the economy. In addition, it places special weight on the interaction and processes between the land surface and the atmosphere on a regional scale, which is also a focal point of REKLIM Topic 4.
Translation of predominantly natural science knowledge to society is supported by socio-economic adaptation research (REKLIM Topic 7) at the UFZ and implemented at the Climate Office via numerous public events. The dialogue with society takes place with quite a varying target audience. One of the
Climate Office for Central Germany
Dialogue with regional players on climate impacts and adaptation
U F Z |
focal points last year, “Heat in the City”, was the subject of discussion at two big events. A panel discussion on “Urban Cli-mate Leipzig – Countering the Change” took place in January as part of the series of events entitled “City Talks”. The discus-sion centred on the topics of urban climate, possible measures (Fig. K.5) for urban development adaptation and energy effici-ency. The Climate Office for Central Germany opened the sci-entific part. This was followed by a lively exchange on climate impacts and adaptation strategies as well as with regional planning experts, architects and political decision-makers. At the invitation of the Friedrich Ebert Foundation a discussion took place on the topic of regional climate with particular focus on opportunities and risks for the regional economy.
Another focal point of the inquiries directed at the Climate Office was the area of hydrological regime. Among other things, the interplay between climate change and groundwater in central Germany was discussed with the Leipzig State Direc-torate. The rising groundwater level resulting from the end of brown coal open-cast mining combined with the counteracting decline in the groundwater level due to increased groundwater removal for irrigation and greater evaporation of surface water represents an exceptional challenge for planners.
In March 2012 the members of the interdepartmental and interdisciplinary “Climate Change” working group of the federal state of Sachsen-Anhalt, in which the Climate Office for Central Germany is represented for the Helmholtz-Zentrum für Umweltforschung, were guests at a joint meeting in Leipzig. State ministries and their subordinate authorities and institu-tions as well as research institutes are represented in the working group. Scientific support for the state’s adaptation strategy is the focus of the work under the management of the Ministry of Agriculture and the Environment.
www.mitteldeutsches-klimabuero.de Dr. Andreas Marx (UFZ), [email protected]
Abb. K.5: Façade greening can contribute to cooling in the city. (Photo: Andreas Marx, UFZ)

27
South German Climate Office
Regional climate modelling and extreme events with the focus on Southern Germany
K I T |
Climate change represents one of the greatest challenges for society in the 21st century and decision-makers at the international, national and regional level require sound and at the same time specific and comprehensible information on possible climate changes. This leads to increased communi-cation needs between climate researchers and the various groups in society.
The South German Climate Office at the Karlsruher Institut für Technologie (KIT) focuses on communication between climate research and society and provides scientific information on the climate and the impacts of regional climate change to media, public organisations as well as decision-makers from indus-try and politics (Fig. K.6). In doing so, it has recourse to the research results and expertise of the KIT centre “Climate and Environment”, to which the South German Climate Office also belongs, as well as of other KIT institutes and various other institutions in Southern Germany.
The dialogue with society can help to determine information needs, particularly with respect to regional climate change, and communicate them to the research institutes. Moreover, the South German Climate Office initiates cooperative underta-kings with other scientific disciplines as well as interdisciplina-ry projects.
Current work at the South German Climate Office examines the interrelationship between climate research and the con-struction sector as well as the direct influence of climate on agriculture. In connection with the former topic it organised in October last year the international conference “Climate and Constructions“, which was attended by around 80 experts from over 20 nations worldwide (Fig. K.7). In the construction sector climate change affects such areas as construction chemicals, materials science, building physics and building materials technology as well as urban climate. The long versi-ons of the over 30 papers have been compiled in conference
proceedings that contain 370 pages. This conference resulted in a more intensified exchange between climate research and the construction sector boosted by several applications and research projects.
As far as the topic of agriculture is concerned, the project en-titled “Water-related soil erosion as a consequence of climate change” is in the second, three-year phase. The focus here is on the coupling between the COSMO-CLM climate model and the LISEM soil erosion model with the aim of assessing the di-rect influence of precipitation events on the soil erosion rates for past and future.
High-quality measurements at as many stations as possible over the longest possible period of time are indispensable in order to describe the climate of the past, present and future. The project on “Assessment of climatological measurement data for Baden-Württemberg and creation of a metadatabase” was completed in this framework at the beginning of 2012.
Another major element of the work at the South German Climate Office involves setting up a network within and outside the climate sciences. Aside from the network of regional Helm-holtz climate offices, there are contacts to such organisations as the German Climate Consortium (DKK), the Climate Service Centre (CSC) and the German Weather Service (DWD), which underline the national integration of the South German Climate Office. The topics relevant to climate are diverse. They range from basic climate research all the way to research regarding adaptation to climate change.
Abb. K.7: Participants at the international conference “Climate and Constructions” in Karlsruhe, October 2011. (Photo: Sandra Göttisheim)
www.sueddeutsches-klimabuero.de Dr. Hans Schipper (KIT), [email protected]
Abb. K.6: Appearance of South German Climate Office at Extreme Weather Congress in Hamburg, March 2012. (Photo: Hans Schipper)

OutlookAW I | D L R | F Z J | G F Z | H M G U | H Z G | K I T | U F Z
At the turn of the year 2011/2012 the world’s population reached the 7 billion mark and humanity now faces a changing planet and altered climate conditions. The increasing energy requirements and supply needs of the global population lead to a more pronounced intervention in the resources and environ-ment of the Earth, thus accelerating this change. CO2 emis-sions, primarily caused by land use and combustion of fossil fuels (by virtue of traffic, heating, power generation, industry, etc.), continue to rise unchecked and are developing in line with the worst case scenario of the IPPC’s last status report published in 2007, which projects a temperature rise of 4-6°C for this scenario for the year 2100.
For this reason knowledge about the causes of climate change and its interactions in the climate system (e.g. reinforcement mechanisms) as well as its regional impacts is of exceeding
importance. After all, sustainable use of the changing planet can only succeed if, on the one hand, the vulnerabilities of the climate system and ecosystem are known and, on the other hand, the requirements of a further increasing global popula-tion (projection of around 10 billion people by 2100) are taken into account.
The work carried out by the Helmholtz REKLIM Initiative makes a major contribution to acquiring this knowledge and can thus provide assistance and point out specific action for mitigation and adaptation to climate change. A dialogue with society, the stakeholders concerned and decision-makers takes place via annual publications, such as this newsletter, and via public re-gional conferences, which have been held in Karlsruhe (2010) and Leipzig (2011) thus far and will take place in Potsdam this year, and in this way enables knowledge transfer.
28

Photo credits and references
29
Photo credits: Photo cover inside: Alfred-Wegener-Institut, photos page 2 horizontally from top left to bottom right: Photo 1: Peter Lemke, photo 2: André Künzelmann, photo 3: Heidi Kassens, photo 4: Johannes Käßbohrer, photo 5: Matthias Mauder, photo 6: AeroArt, photo 7: Hannes Grobe, photo 8: © dpa, photo 9: André Künzelmann, photo 10: AWI Rechenzentrum, photo 11: Helmholtz-Zentrum Pots-dam - Deutsches GeoForschungs-Zentrum, photo 12: Torsten Sachs, photo 13: Hand Oerter, photo 14: © VGMeril/PIXELIO, photo 15: realnature.tv, photo 16: © Georg Müller, photo 17: ESA, photo 18: Forschungszentrum Jülich, photo 19: IMK-IFU, photo 20: © picture-alliance/dpa, photo Seite 28: Benjamin Creutzfeld.
References: Beck, S. 2012: The challenges of building cosmopolitan climate expertise - with reference to Germany. Wiley Interdisciplinary
Reviews, Climate Change, Vol. 3/1, 1-17.Bubeck, P., W.J.W.J. Botzen, H. Kreibich, and J.C.J.H. Aerts, 2012: Long-term development and effectiveness of private flood
mitigation measures: An analysis for the German part of the Rhine. Natural Hazards and Earth System Sciences, (submitted).Dorn, W., K. Dethloff, and A. Rinke, 2012: Limitations of a coupled regional climate model in the reproduction of the observed
Arctic sea-ice retreat. The Cryosphere Discuss., 6, 1269-1306, doi:10.5194/tcd-6-1269-2012.Gebhardt, O., M. Brenck und V. Meyer, 2011: Investitionsbedarf und gesellschaftliche Rentabilität von
Klimaanpassungsmaßnahmen in Städten, Zwischenbericht zur Expertise 4 des Forschungsprogramms „Experimenteller Wohnungs- und Städtebau“ (ExWoSt). Forschungsschwerpunkt I: Kommunale Strategien und Potenziale; Helmholtz-Zentrum für Umweltforschung – UFZ, Leipzig.
Glemarec, Y., 2011: Catalysing Climate Finance, A Guidebook on policy and financing options to support green, low-emission and climate-resilient development. New York: United Nations Development Programme, 148pp.
Hulme and 26 co-authors, 2011: Science-Policy Interface: Beyond Assessments. Science , 333 (6043), 697-698, doi:10.1126/science.333.6043.697
Hoose, C. and O. Möhler, 2012: Heterogeneous ice nucleation on atmospheric aerosols: a review of results from laboratory experiments. Atmospheric Chemistry and Physics Discuss., 12, 12531-12621, doi:10.5194/acpd-12-12531-2012.
Junkermann, W., B. Vogel, and M. A. Sutton, 2011: The climate penalty for clean fossil fuel combustion. Atmospheric Chemistry and Physics, 11, 12917-12924.
Kreibich, H., S. Christenberger, and R. Schwarze, 2011: Economic motivation of households to undertake private precautionary measures against floods. Natural Hazards and Earth System Sciences, 11, 2, 309-321.
Lahoz, W. A. and 10 co-authors, 2012: Monitoring Air Quality from Space: The Case for the Geostationary Platform. Bulletin of the American Meteorological Society, 93, 221-233.
Markantonis, V., V. Meyer, and R. Schwarze, 2012: Valuating the intangible effects of natural hazards – review and analysis of the costing methods. Natural Hazards and Earth System Sciences, 12, 1633–1640, doi:10.5194/nhess-12-1633-2012.
Ratter, B.M.W., K.H.I. Philipp, and H. von Storch, 2012: Between hype and decline: recent trends in public perception of climate change. Environmental Science and Policy, 15, 1, 3-8, doi:10.1016/j.envsci.2011.12.007.
Schädler, G. and 9 co-authors, 2012: Flood Hazards in a Changing Climate. CEDIM Project Report, January 2012. (http://www.cedim.de/download/Flood_Hazards_in_a_Changing_Climate.pdf)
Schäfer, K. and 23 co-authors, 2011: Influences of the 2010 Eyjafjallajökull volcanic plume on air quality in the northern Alpine region. Atmospheric Chemistry and Physics 11, 8555-8575.
Schmidt, T., J. Wickert, and A. Haser, 2010: Variability of the upper troposphere and lower stratosphere observed with GPS radio occultation bending angles and temperatures. Advances in Space Research, doi:10.1016/j.asr.2010.01.021.
Solazzo, E. and 35 co-authors, 2012: Model evaluation and ensemble modelling of surface-level ozone in Europe and North Ameri-ca in the context of AQMEII. Atmospheric Environment, 53, 60-74.

AW I | D L R | F Z J | G F Z | H M G U | H Z G | K I T | U F Z
Alfred-Wegener-Institut für Polar- und Meeresforschung in der Helmholtz-Gemeinschaft
Deutsches Zentrum für Luft- und Raumfahrt
Forschungszentrum Jülich
Helmholtz-Zentrum Potsdam - Deutsches GeoForschungsZentrum
Helmholtz Zentrum München – Deutsches Forschungszentrum für Gesundheit und Umwelt
Helmholtz -Zentrum Geesthacht - Zentrum für Material- und Küstenforschung
Karlsruher Institut für Technologie
Helmholtz-Zentrum für Umweltforschung
www.reklim.de