remedial investigation report for the asarco llc hayden ... · ray mine and is transported by rail...
TRANSCRIPT
D r a f t R e p o r t
Remedial Investigation Report for the ASARCO LLC
Hayden Plant Site Hayden, Gila County, Arizona
Prepared for
U.S. Environmental Protection Agency Region IX 75 Hawthorne Street
San Francisco, CA 94105
August 2008
2625 South. Plaza Drive
Suite 300 Tempe, AZ 85282
CH2MHILL
SEMS-RM DOCID # 100005516

ES022008005PHX iii
Executive Summary
ES.1 Purpose This report presents the results of the investigation of industrial discharges from ore processing- and smelting-related activities in the area around Hayden and Winkelman, Arizona. The ASARCO Hayden Plant Site (Site) in Hayden, Arizona, is an active copper ore processing, concentrating, and smelter facility located in Gila County, near the confluence of the Gila River and San Pedro River. This report describes a remedial investigation (RI) of potential environmental impacts from Site operations, which date back to 1911, on air, soil, groundwater, surface water, and sediments in the vicinity of the Site. The field activities described in this report were conducted from November 2005 through March 2008. All RI field activities are complete with the exception of the ongoing air investigation.
The overall purpose of the RI is to identify the nature and extent of contaminants, migration pathways of the contaminants, and potential threats to human and ecological receptors in the study area.
ES.2 Site Location and Description Hayden is located approximately 100 miles southeast of Phoenix and 50 miles northeast of Tucson. Winkelman is located approximately one mile southeast of Hayden (Figure 1-1). The study area encompasses the towns of Hayden and Winkelman, the Site (defined as the area encompassing the ASARCO-owned and operated ore processing operation), and the area surrounding the confluence of the Gila River and San Pedro River (Figure 1-2). The active portion of the Site consists of ASARCO’s crusher, concentrator, smelter, and tailings impoundment areas. The crusher is located on the north side of State Route 177 and provides crushing of ore after arriving via the Copper Basin Railway from the Ray Mine (and historically from other sources). An overland conveyor (Conveyor 9), approximately 2,000 feet long, has a portion (about 400 feet in length) that passes over some of Hayden’s residential streets and directs ore from the crusher to the mill building at the concentrator facility (see Figures 1-1, 1-2 and 1-3).
The tailings slurry pipelines extend from the concentrator area next to the town of Hayden swimming pool, south to Tailings Impoundment AB/BC and Tailings Impoundment D located adjacent to the Gila River.
Hayden’s drinking water is supplied by a wellfield, which is operated by ASARCO and is located south of Hayden and east of Tailings Impoundment AB/BC. Winkelman’s drinking water is supplied by three wells, which are operated by the Arizona Water Company, located east of town within the community park adjacent to the Gila River.
EXECUTIVE SUMMARY
iv ES022008005PHX
ES.4 Current Operations In the current Ray Complex operations, sulfide ore undergoes primary crushing at the Ray Mine and is transported by rail to the Hayden operations. ASARCO manages the concentrator and smelter operations separately with each operation having a separate entrance. At the concentrator facility, the ore is offloaded at the track hopper, and passed through a secondary crushing process where it is further reduced in size. The ore is transported by Conveyor 9 (a portion of which is overhead) to the mill building, where the ore is pulverized to sand size or smaller, and then converted to a slurry. The ore slurry is directed to froth flotation tanks where the copper minerals are separated from the bulk of the copper ore. The copper-rich concentrate, which contains about 25 to 30 percent copper, is sent to the smelting operation for further processing. The tailings waste from the froth flotation process is sent to the thickeners, and then transported as slurry in the tailings pipeline and deposited on Tailings Impoundments AB/BC and D.
The copper-rich concentrates are then transported to the smelter facility, which includes an oxygen flash furnace, converters, anode casting, oxygen plant, and acid plant. The concentrates are unloaded and blended with fluxes, then transferred to fluid bed dryers where they are dried and stored prior to being introduced into the oxygen flash furnace. The copper concentrates ignite, melt, and partition to produce matte (approximately 55 percent copper) and slag. The matte from the flash furnace is subsequently processed in converter furnaces to remove additional impurities and produce blister copper (approximately 98.5 percent copper). Finally, the blister copper is further processed in anode furnaces to produce copper anodes that are 99 percent pure. The anodes are shipped offsite for final processing. During the smelting process, sulfur from the ore is oxidized to form SO2 gas, which is converted to sulfuric acid in the sulfuric acid plant. Slag from the smelter operations is transferred to open waste stockpiles located immediately southeast of the smelter operations area.
The tailings impoundments are managed as part of the concentrator operations. Tailings Impoundment AB/BC is located south of State Route 177 and north of the Gila River, extends for a length of approximately 2.5 miles, and has a maximum width of one mile and a maximum height of 200 feet. The newer Tailings Impoundment D is located south of the Gila River, extends for a length of approximately two miles, has a maximum width of 1,500 feet, and a maximum height of 150 feet.
ES.5 Field Data Collection Overview ES.5.1 Soil Sampling The purpose of the surface soil sampling was to develop a better understanding of contaminant levels, potential contaminant source(s), and contaminant migration patterns in soils over a broader area.
Non-Residential Soil Sampling Activities A total of 270 non-residential soil sample locations were selected within and outside the town limits of Hayden and Winkelman based on the potential human risk of exposure to
EXECUTIVE SUMMARY
ES022008005PHX v
metals by a variety of routes. The following sample locations were included as part of the RI:
1. Washes (Figures 4-2 through 4-5) – A total of 32 samples were collected in San Pedro and Power House washes, above (north of) Highway 177 to determine concentrations of metals and evaluate data gathering methods.
2. ASARCO Property (Figures 4-2 through 4-5) - A total of 77 locations on and near ASARCO property were sampled, including the crusher facility (7), Kennecott Avenue Wash (10), former Kennecott smelter (15), perimeter of the concentrator (27), perimeter of the smelter (1), the slag dump (1), south of the slag dump (4), and at the two tailings impoundments (12).
3. Winkelman School Complex (Figures 4-6 through 4-8) (including staff housing on school property) - A total of 38 locations were sampled around the school buildings, athletic fields, and playgrounds. An additional 26 sample locations were collected around the three residential school-owned properties on Lobo Lane, adjacent to and west of the school complex.
4. Hayden Public Areas and Golf Club (Figures 4-7 through 4-9) - A total of 10 locations were sampled in the public areas around the Hayden Library and adjacent park. Also, a total of 33 sample locations were sampled at and near the Hayden Public Golf Club and from the adjacent access road east of Tailings Impoundment AB/BC.
5. Upland and Surrounding Areas (Figures 4-10 and 4-11) - Samples were collected from 13 locations (total of 26 samples, which included a surface and subsurface sample at each location) in upland areas, to help evaluate soil quality in surrounding and background areas. Samples were also collected from two locations (total of four samples, which included a surface and subsurface sample at each location) along State Route 77 northeast of Winkelman.
Most non-residential samples were collected as surface soil samples, from 0-2 inches below ground surface (bgs).
Residential Soil Sampling Activities The residential soil sampling activities included the collection of soil samples from 130 habitable homes within Hayden and Winkelman. This total consisted of 99 homes in Hayden and 31 homes in Winkelman (see Figures 4-12 to 4-23).
Sample locations were selected within the town limits of Hayden and Winkelman based on the potential human risk of exposure to metals. During the planning process, Hayden and Winkelman were divided into 26 separate zones. At least 30 percent of all residential lots in zones located closer to active operations were samples, while a lower sample frequency of at least 15 percent was employed for zones further from active operations.
Prior to sampling, a signed access agreement was obtained from the property owner or tenant at each residence. Ten surface samples were collected on each residential lot, which consisted of nine surface soil samples (0-2 inches bgs) and one subsurface sample (10-12 inches bgs).
EXECUTIVE SUMMARY
vi ES022008005PHX
All soil samples were analyzed for metals using a field portable x-ray fluorescence (FPXRF) instrument, and approximately 10 percent of samples were submitted for CLP analysis of TAL metals. Later, it was decided to submit all samples that were initially analyzed by FPXRF only (and retained in secure storage) for laboratory analysis of arsenic, copper, and lead. The results and conclusions for soils presented in this report are based on laboratory data only.
ES.5.2 Surface Water and Sediment Sampling The purpose of the sediment sampling was to develop a better understanding of contaminant levels, potential contaminant source(s), and contaminant migration patterns over a broader area.
The combined surface water and in-stream sediment sampling activities were conducted in March 2006 (Winter event) and August 2006 (Summer event). Soil sampling from riparian communities was conducted adjacent to the Gila and San Pedro Rivers in April 2006.
The combined surface water and in-stream sediment sample locations were selected along the Gila and San Pedro Rivers based on the potential ecological and human risk due to exposure to Site-related contaminants by a variety of routes. During both the Winter and Summer sampling events, surface water and in-stream sediment samples were collected from a total of 11 locations along the Gila River and two locations along the San Pedro River.
The stable and unstable riparian sediment samples were collected in the nearest suitable habitat adjacent to the 11 Gila River locations and the two San Pedro River locations. In addition, five additional biased sample locations in the Gila River flood plain (between the confluence of the Gila and San Pedro Rivers and Last Chance Basin), were selected.
ES.5.3 Groundwater Investigation and Sampling The purpose of the installation of new monitoring wells was to compliment the existing monitor well network, evaluate shallow groundwater quality impacts, and evaluate groundwater flow conditions within and around the Site. The purpose for the two groundwater sampling events was to evaluate the nature and extent of possible contamination within and around the Site during winter and summer periods.
Five monitoring wells were installed in the study area. Groundwater level measurements from all new and selected existing monitor wells were collected. Finally, selected existing monitoring wells and the newly installed monitoring wells, as well as selected drinking water supply wells, manifolds and taps in Hayden and Winkelman, were sampled in March 2006 (Winter event) and August 2006 (Summer event).
ES.5.4 Air Sampling The purpose of this task was to further characterize the concentrations of contaminants from the Site at discrete points within Hayden and Winkelman. This was conducted by installing PM10 and meteorological stations in Hayden and Winkelman. The Hayden monitoring station was placed on the roof of the Town of Hayden maintenance building. The
EXECUTIVE SUMMARY
ES022008005PHX vii
Winkelman monitoring station was placed on the roof of the Winkelman High School gymnasium.
The air investigation involved collection of meteorological, PM10, and metals data from two new air monitoring stations. The new stations were programmed to collect samples for a 24-hour period from midnight to midnight every sixth day. The Hayden monitoring operations have been ongoing since October 2006, while the Winkelman monitoring operations have been ongoing since November 2006. An assessment of background air concentrations was also conducted based on data from the Organ Pipe National Monument air monitoring station (Organ Pipe station).
ES.5.5 Interior Dust Sampling The purpose of the residential interior dust sampling task was to evaluate metals concentrations in dust samples from selected homes. This task involved laboratory analyses of samples collected from 18 locations in Hayden and four locations in Winkelman. The homes were selected based on concentrations of arsenic in soil detected during residential surficial soil sampling activities in January and February 2006. The sample locations were selected to generally include those homes where relatively low, medium, and high arsenic concentrations were found in soils. At each selected location, indoor dust samples (from occupied areas of the home) were collected, and attic dust samples were collected at those homes with accessible attics.
ES.5.6 Ecological Investigation The purpose of this task was to characterize the terrestrial and aquatic habitats in the project area, as well as in a reference area (i.e., an area with similar vegetation, geology, slope, etc., but that is not impacted by the Site). These characterizations included general habitat mapping and wildlife observations, in general accordance with EPA guidance for ecological assessments. These activities were conducted in support of the SLERA.
Prior to beginning the field study, a preliminary habitat map was created using existing remote sensing data (i.e., recent, high-resolution aerial photographs of the area, topographic maps, National Wetlands Inventory maps, and Natural Resources Conservation Service soil maps). A limited field survey was then conducted to verify/ground-truth assigned terrestrial and aquatic habitat types as determined by the initial maps, to identify habitats in the vicinity of soil, sediment, and water sampling areas, and to record characteristic vegetation and general wildlife utilization patterns within the project and reference areas.
ES.6 Findings and Conclusions The following sections describe the findings for each type of media that was sampled during the RI.
ES.6.1 Non-Residential Soils The results for non-residential surficial soils indicate that arsenic, copper, and lead are the primary contaminants of concern (COCs). This is indicated by the elevated arsenic, copper, and lead impacts above the Arizona Residential Soil Remediation Levels (R-SRLs) and
EXECUTIVE SUMMARY
viii ES022008005PHX
above background upper tolerance limit (UTL) concentrations. A small number of non-residential properties showed exceedances of R-SRLs for other metals, but none of these metals are widespread at elevated concentrations. These results indicate that nonresidential soils are markedly influenced by ASARCO operations. As shown on Figures 4-2 through 4-11, soils at ASARCO facilities (particularly the perimeter of the concentrator and former Kennecott smelter areas and the smelter perimeter and slag dump areas) generally contain the highest concentrations of metals, while nonresidential soils on non-ASARCO properties, including the Winkelman and upland areas, contain the lowest concentrations. The washes located near the ASARCO operations (especially Power House Wash) also appear to be directly affected by ASARCO operations.
ES.6.2 Residential Soils Data collected from the surficial soil sampling at Hayden and Winkelman residential properties indicates that the primary COCs are arsenic, copper, and lead.
Hayden Residential Soils Based on the laboratory results of the 99 homes sampled in Hayden, only one parcel in Hayden has an arsenic 95% upper confidence level (UCL) concentration below the R-SRL of 10 mg/kg (Figure 4-12). Also, four other parcels display arsenic UCL concentrations just over the R-SRL but below the Hayden area background UTL value of 12.5 mg/kg. Together, these five parcels are all located in the most distant zones from active operations. The remaining 94 parcels in Hayden display UCL values above both the R-SRL and background values. The UCL concentrations in these 94 parcels range from 13.4 mg/kg in parcel 101-07-259, (Zone 4), to 540 mg/kg in parcel 101-07-089T (Zone 9, just south of the former Kennecott smelter area).
As shown on Figure 4-12, the highest arsenic concentrations are in Zones 7, 8, 9, 10, 16, and 17 located south of the former Kennecott smelter area and west of the active concentrator operations. The next most impacted area is represented by Zones 12, 13, 14, and 15 located in northeast Hayden and in relative close proximity to ASARCO’s concentrator facility.
Figure 4-13 shows that the subsurface arsenic soil concentrations are considerably lower than surface soil concentrations. Nearly half of the subsurface soil samples (46 samples) display arsenic concentrations below the R-SRL.
Only nine of the 99 parcels in Hayden have copper UCL concentrations below the R-SRL of 3,100 mg/kg (Figure 4-14). Eight of these nine parcels are located in the most distant zones in Hayden from the concentrator operations. However, all nine of these parcels have copper UCL concentrations above the Hayden area background value of 1,270 mg/kg. The remaining 90 parcels in Hayden display UCL values above the R-SRL, and therefore, well above background value. The UCL concentrations in these 90 parcels range from 3,350 mg/kg in parcel 101-07-259 (Zone 4), to 39,700 mg/kg in parcel 101-09-140 (Zone 16, near the active concentrator operations).
As shown on Figure 4-14, the pattern of elevated copper concentrations is similar to that displayed for arsenic. The highest copper concentrations are in Zones 7-9, located south of the former Kennecott smelter area and west of the active concentrator operations, and in
EXECUTIVE SUMMARY
ES022008005PHX ix
Zones 10 and 16, located in northeast Hayden and adjacent to ASARCO’s concentrator facility.
Figure 4-15 shows that the subsurface copper soil concentrations are considerably lower than surface soil concentrations. All but 24 of the 99 subsurface soil samples display copper concentrations below the R-SRL. Most of the subsurface soil samples with concentrations below the R-SRL are also below the background value, although several parcels, primarily those located closer to active concentrator operations, are above the background value.
The lowest lead UCL concentration is in parcel 101-07-185C (51.8 mg/kg), located in the most distant zone in Hayden from the concentrator operations (Figure 4-16). The highest lead UCL concentrations are in parcels 101-09-088 (92,600 mg/kg, Zone 15), parcel 101-09-004 (8,170 mg/kg, Zone 12), and parcel 101-09-077 (7,250 mg/kg, Zone 14), located in central Hayden. The lead concentration in the Zone 15 parcel is anomalously high (an order of magnitude above the next highest values) and exceeds levels in non-residential soil samples on ASARCO property, suggesting that other possible sources of lead may be present on this parcel. Overall, the largest percentage of parcels with lead UCL concentrations above the R-SRL are in Zones 10, 12, 13, 14, and 16, located in relatively close proximity to concentrator operations. As indicated on Figure 4-16, the lead values in non-residential soil samples collected on the concentrator property are above the Hayden area background level of 47.9 mg/kg, but below the R-SRL and in most cases below the UCL values in nearby residential parcels. These data indicate that ASARCO operations may be a source of lead, along with other sources such as lead-based paint.
As indicated on Figure 4-17, the subsurface lead soil concentrations are considerably lower than surface soil concentrations. Approximately 30 percent (30 parcels) have lead concentrations below the background value. Regarding exceedances, 12 parcels have lead values above the screening value of 212 mg/kg, and seven parcels have lead values above the R-SRL of 400 mg/kg. Lead concentrations in these seven lots range from 433 mg/kg to 1,340 mg/kg and are located in Zones 2, 8, 10, 12, 13, 14, and 16.
Winkelman Residential Soils Only five of the 31 parcels in Winkelman have arsenic UCL concentrations above the R-SRL (and therefore also above the Winkelman area background value of 9.1 mg/kg). The arsenic UCL concentrations in these five parcels range from 16.6 mg/kg (parcel 101-12-142) to 112 mg/kg (parcel 101-12-071). Figure 4-18 shows these parcels are all located in Zones 18, 19, and 21, in the central and southern areas of Winkelman.
The subsurface arsenic soil concentrations are generally lower than surface soil concentrations (Figure 4-19). Only one subsurface soil sample (101-12-008J, 12.3 mg/kg) exceeds the R-SRL; the concentration in this subsurface soil sample along with one other subsurface soil sample (101-10-019, 9.4 mg/kg) exceeds the background value of 9.1 mg/kg.
Only two of the 31 parcels in Winkelman have copper UCL concentrations above the R-SRL. The copper exceedances are found in two neighboring parcels in Zone 21: parcel 101-12-149 (5,130 mg/kg) and 101-12-150 (4,410 mg/kg). Arsenic UCL exceedances were also found for these two parcels. In addition, parcels 101-12-142 (1,390 mg/kg) in zone 21 and parcel 101-12-093 (1,040 mg/kg) in zone 20 exceeded the Winkelman area background value of 882
EXECUTIVE SUMMARY
x ES022008005PHX
mg/kg. All other copper UCL concentrations in Winkelman parcels are below the background level (Figure 4-20).
As indicated on Figure 4-21, all subsurface copper concentrations are below both the background and R-SRL values in all samples.
Only five of the 31 parcels in Winkelman have lead UCL concentrations above the R-SRL (Figure 4-22). The highest lead exceedance is found in Zone 21 parcel 101-12-149 (2,330 mg/kg). Of the remaining 21 Winkelman parcels, 18 display lead UCL concentrations above the Winkelman area background concentration of 45.8 mg/kg. Because nonresidential soil samples collected in the northern part of Winkelman are generally below background lead levels, the residential soils data suggest that some limited lead-based paint impacts may exist as wells as other industrial sources in the southern part of town.
As indicated on Figure 4-23, the subsurface lead concentrations are below the R-SRL values in all samples. Nine additional samples exceed the background value of 45.8 mg/kg. Overall, the subsurface lead impacts are relatively limited.
ES.6.3 Surface Water and Sediments Surface Water Samples Surface water samples were collected at 13 locations, including 11 locations along the Gila River and two locations along the San Pedro River. The 13 surface water samples collected during two sampling events (Winter - Figure 4-24, and Summer – Figure 4-25). Elevated concentrations of several analytes were clearly evident at the two Gila River sampling locations (GR-SW-06 and GR-SW-07) located between the tailings impoundments, compared to other upstream and downstream locations, as indicated on the histograms (Figures 4-26 through Figure 4-34). The total and dissolved concentrations of aluminum, arsenic, barium, beryllium, calcium, cadmium, chromium, cobalt, copper, iron, lead, magnesium, manganese, nickel, potassium, sodium, thallium, vanadium, and zinc as well as total mercury, molybdenum, selenium, and silver, were generally higher in these two samples than in other Gila River samples. These elevated concentrations were most pronounced in samples collected in the Summer event when flows were about 4 times higher than during the Winter event. Although no winter sampling event samples exceeded Arizona Aquatic and Wildlife Water Quality Criteria (AAWWQC) or Preliminary Remediation Goals (PRG) levels (with the exception of arsenic), several exceedances were noted in the Summer event samples at GR-SW-06 and/or GR-SW-07 only, and these levels were also considerably above background levels measured in upgradient samples GR-SW-01 and GR-SW-02.
Surface water samples from the San Pedro River location SPR-SW-02 displayed higher concentrations for some analytes as compared to Gila River sampling locations. Total and dissolved arsenic, barium, boron, calcium, chromium, cobalt, iron, magnesium, molybdenum, nickel, potassium, selenium, and sodium, total copper, lead, and silver, and dissolved manganese, vanadium, and zinc were generally greater in San Pedro River samples relative to Gila River samples. Dramatic seasonal differences in concentrations in the San Pedro River samples were evident through analytes such as aluminum, barium, iron, and manganese, which were higher during the Summer sampling event, although analytes like magnesium and sodium were higher during the Winter sampling event. These
EXECUTIVE SUMMARY
ES022008005PHX xi
elevated levels in the San Pedro River samples may result from different geology, mining activity or lower flow conditions, resulting in less dilution, and therefore, higher concentrations of these metals.
Despite the increased concentrations observed in the San Pedro River samples and in Gila River samples GR-SW-06 and GR-SW-07, the downgradient samples did not show AAWWQC or PRG exceedances (with the exception of arsenic).
Sediment Samples In-stream sediment samples showed metals (arsenic, lead, manganese, and vanadium) concentrations in upstream, between tailings impoundments, and downstream of the tailings impoundments, which indicate that additional data are needed to differentiate upstream contributions and the full extent of impacts. With few exceptions, analyte concentrations within in-stream sediment samples from the San Pedro River exhibited generally lower concentrations (but higher surface water metals concentrations) than those obtained from the Gila River sampling locations. Large seasonal variations were also evident among the San Pedro River samples.
For the riparian sediment samples, elevated concentrations above the R-SRL or EPA PRG of arsenic, lead, and vanadium are present at upstream locations. However, only arsenic had concentrations exceeding these standards between the tailings impoundments and downstream of the tailings impoundments. Unstable riparian sediments generally had higher and more variable concentrations than were observed in associated stable riparian sediments.
ES.6.4 Groundwater The groundwater investigation confirmed that groundwater from the concentrator and smelter facilities generally flow towards the Gila River. In general, the groundwater quality data from the two sampling events (Winter and Summer) show concentrations exceeding comparison criteria for aluminum, arsenic, iron, copper, manganese, molybdenum, selenium, and vanadium. Most exceedences are in groundwater samples collected from monitoring wells located near active ASARCO concentrator and smelter operations, with a limited number of exceedences from production wells.
Cadmium, chromium, lead, and mercury had either singular exceedances or none at all, and therefore, are not considered COCs in groundwater. Arsenic concentrations at every sample location exceeded the PRG, however, only six monitoring well locations had concentrations exceeding the MCL of 10 mg/L. Monitoring wells with generally high sulfate concentrations (above the secondary MCL of 250 mg/L) are H-2A, H-3, H-8, H-9, LC-1, and SM-2. All monitoring wells on Site have sulfate and TDS concentrations greater than the secondary MCL standards (250 mg/L and 500 mg/L, respectively).
The Hayden production wells do not display elevated levels of metals concentrations. The only exceedances occurred at the Winkelman wellfield. The sample from WM-4 had exceedances for total and dissolved manganese and dissolved copper. Samples collected from the Winkelman Wellfield Manifold had exceedances for total manganese and dissolved selenium. Moreover, samples from the Hayden wellfield wells generally have sulfate and TDS concentrations greater than the secondary MCLs. Samples from the
EXECUTIVE SUMMARY
xii ES022008005PHX
Winkelman wellfield wells generally show only TDS concentrations above the secondary MCL. Samples collected at the Winkelman Elementary School drinking fountain had an exceedance of total and dissolved copper, which may be related to the piping distribution network. Similarly, the sample from the Hayden Library drinking fountain had an exceedance of dissolved copper in the Summer sampling event (which may be related to the piping), but not in the Winter event.
ES.6.5 Air For this report, data from the period October 22, 2006, to November 7, 2007, were evaluated, along with data from two annual three-week smelter shutdown periods in 2007 and 2008. Data from this study show that the concentrations of PM10 and metals in the Hayden and Winkelman stations far exceed the measured concentrations at the background Organ Pipe station. The average PM10 concentrations at Hayden and Winkelman stations were approximately 2.36 and 1.26 times higher, respectively, than average PM10 concentrations at the Organ Pipe station. Arsenic and cadmium were not found above the method detection limit (MDL) at the Organ Pipe station. However arsenic and cadmium concentrations at the Hayden station exceeded the Organ Pipe sample MDL values by a factor ranging from 40-80 and 7.55, respectively, and exceeded the PRG levels by a factor of 53 and 4, respectively. The average ambient air concentrations of copper, lead, and chromium at the Hayden station were 510, 64, and 3.6 times higher, respectively, than average levels at the Organ Pipe station. The average ambient air concentration of copper, lead, and chromium at the Winkelman station were 203, 17, and 1.9 times higher, respectively, than average levels at the Organ Pipe station.
The PM10 concentrations in the Hayden station samples are about twice the levels in the Winkelman station samples. The concentrations of arsenic, copper and chromium are about 2.5 times higher in Hayden station samples compared to Winkelman station samples. Lead concentrations in Hayden station samples are about 3.5 times higher than levels in Winkelman station samples. The higher concentrations in the Hayden area are likely attributed to the closer proximity to active concentrator and smelter operations.
Data collected during the smelter shutdown periods show that average PM10 and metals concentrations are considerably lower compared to average concentrations during the overall monitoring period.
ES.6.6 Interior Dust Of the 22 indoor residential dust sample parcel locations, 18 parcels were in Hayden and four parcels were in Winkelman. The increased concentration of sample locations in Hayden was in direct response to the elevated metals concentrations found in Hayden residential soil samples relative to Winkelman residential soil samples. Indoor dust samples were collected from occupied living areas at all residences, and from attics where they were present and accessible (11 of the locations). Of these 22 sample locations, 17 locations had dust sample results that exceeded the arsenic R-SRL, 15 locations exceeded the copper R-SRL, and eight locations exceeded the lead R-SRL. Of the 11 attic samples, nine were collected in Hayden with all nine samples exceeding the R-SRLs for arsenic, copper, and lead. Two attic dust samples were collected in Winkelman and both had exceedences of the arsenic R-SRL only.
EXECUTIVE SUMMARY
ES022008005PHX xiii
ES.6.7 Data Gaps The following primary data gaps are provided per media, based on data collected during the RI. These data gaps should be addressed during subsequent phases of remedial investigation at the Site and study area.
Non-Residential Soils • Additional soil samples encompassing the entire former Kennecott smelter area are
needed to further characterize the vertical and horizontal extent of contamination within the area, with an extensive analysis of metals suite (including molybdenum and vanadium) to determine other possible contaminants of concern.
• Additional soil samples collected from the active concentrator area, beyond the perimeter of public areas, are needed to determine the vertical and horizontal extent of contamination, with an extensive analysis of metals suite to determine other possible contaminants of concern.
• Additional soil sampling of the entire area at the active smelter area is needed to determine the vertical and horizontal extent of contamination, with an extensive analysis of metals suite to determine other possible contaminants of concern.
• Additional soil sampling of other public and commercial areas within the towns of Hayden and Winkelman is needed, to determine the vertical and horizontal extent of contamination, with an extensive analysis of metals suite to determine other possible contaminants of concern.
Residential Soils • Only a limited number of residences in Hayden and Winkelman were sampled during
the RI, and additional sampling is needed, especially at residences located in relatively close proximity to the active concentrator facility.
• Only one subsurface soil sample was collected on each property, and additional sampling is needed to better delineate the vertical extent of impacts.
• A recontamination assessment is needed to determine the possibility and rate of recontamination of the area residential soils from the on-going air contamination.
Surface Water and Sediment • To delineate the extent of surface water impacts from smelter emissions and assess
possible upstream contributions, additional samples are needed upstream on the Gila and San Pedro Rivers.
• To delineate the extent of in-stream and riparian sediment impacts and assess possible upstream contributions, an increased density of samples is needed upstream and downstream on the Gila and San Pedro Rivers.
• Further characterization by an increased density of samples collected of riparian sediment is needed to evaluate the impact of the tailings impoundments.
EXECUTIVE SUMMARY
xiv ES022008005PHX
• Additional rounds of surface water and sediment sampling are needed to evaluate impacts seasonally and to evaluate longer term trends.
Groundwater • More upgradient monitoring wells are needed to assess and define background
groundwater quality conditions. • There are very few monitoring wells located on former and currently active ASARCO
operations, especially the smelters, concentrator, and slag dump areas. Additional wells are needed to identify possible source areas and the extent of impact.
• To better assess the influence of the alluvial aquifer on the chemistry and flow rate of the Gila River, installation of additional monitoring wells in the vicinity of the Gila River are needed; this includes in proximity to the tailings impoundments.
• Additional information on the individual production well operations is needed to better assess regional groundwater flow and pumping effects.
• Installations of additional stream gauges, and a monitoring well near the SW-04 sample location, are needed to evaluate the possible connection of groundwater and surface water.
• The groundwater elevation data suggests that ARU-1 is disconnected from water levels within the Gila River alluvium; confirmation or resurveying of the top-of-casing elevation is needed (and based on additional groundwater elevation measurements, a more reliable downgradient monitoring well may be needed to assess impacts of tailings impoundments on the Gila River alluvial aquifer).
• An independent confirmation of vertical and horizontal coordinates for the existing monitoring and production well locations was not conducted as part of the RI. An updated and accurate survey of all monitoring well locations is needed to provide greater confidence in the groundwater elevation contouring.
• Continual quarterly or monthly water level monitoring and groundwater sampling are needed to evaluate impacts seasonally and to evaluate longer term trends.
Air • A source apportionment study is needed to identify the relationship between emission
sources and measured concentrations of metals.
• Only the PM10 fraction of lead in ambient air was measured. A TSP monitor is needed to analyze for lead and compare with the NAAQS value.
• No background air monitor was installed for this investigation. A limited set of data were used (approximately 15 samples) from the background Organ Pipe station. More background air stations with more samples are needed to allow for more precise averages.
• A co-located air monitor is needed next to the Hayden and/or Winkelman air monitoring stations to allow for a QA/QC of data from that air monitoring station.
• Monitoring and differentiation of acid gases in the air are needed at the Site and study area.
EXECUTIVE SUMMARY
ES022008005PHX xv
• Analysis of the collected air monitoring filters for particulate morphology and speciation is needed to assist in source attribution.
• Detailed ambient air monitoring stations closer to suspected source areas are needed to better evaluate possible unknown sources.
• Sampling of fine grained soils is needed in industrial areas for determination of these as possible air impact sources from entrainment during high wind events.
• Point source air monitoring for stack and near-ground emission sources is needed.
• Day and night short term sampling events for emissions comparison are needed.
• High wind short term sampling events for emissions comparison are needed.
Interior Dust • The dust sampling was of a very limited extent and included a very few number of
residences. Additional sampling from other residences in potentially impacted areas is needed to confirm metals concentrations in these other areas.
• Lead-specific sampling is needed to differentiate between Site-related lead and the impact of lead-based paint on lead concentrations detected in dust samples.
• Additional dust samples are needed from public areas (such as schools, library, post office, commercial, and retail businesses) to determine the extent of dust contamination in these areas.
ES.7 Soils Removal Action Based on residential soil sampling data collected during the RI, an agreement between EPA and ASARCO was signed in March 2008, under which ASARCO performed and paid for removal of contaminated soil at 15 privately-owned residential parcels in Hayden and Winkelman. This cleanup work was conducted with oversight from EPA, and took place between late March and early June 2008. EPA reviewed the residential soil sample data from the RI and decided to promptly address those residential yards with the highest concentrations of arsenic, copper, and lead. Yards where soil contamination levels exceeded 200 mg/kg of arsenic, 2,000 mg/kg of lead, or 20,000 mg/kg of copper were selected for cleanup. Based on these soil concentration levels, the following 14 properties in Hayden were selected by EPA and then cleaned up by ASARCO:
1. 101-07-035AS 2. 101-07-040 3. 101-07-066 4. 101-07-089Q 5. 101-07-089S 6. 101-07-089T 7. 101-07-091 8. 101-09-004 9. 101-09-036
EXECUTIVE SUMMARY
xvi ES022008005PHX
10. 101-09-039 11. 101-09-070 12. 101-09-077 13. 101-09-088 14. 101-09-140
In Winkelman, one residential yard (101-12-149) was selected by EPA and then cleaned up by ASARCO.
The soil cleanup activities consisted of removing the top 1-2 feet of soil, replacing it with clean fill, re-grading the area, and adding a stabilizing sod cover. The interiors of some of the homes were also addressed.
ES.8 Administrative Order on Consent for Future Study and Cleanup
On April 15, 2008, EPA, U.S. Department of Justice (DOJ), ADEQ, and ASARCO signed a second agreement to perform additional investigation and cleanup work in the towns of Hayden and Winkelman. The agreement, referred to as an Administrative Settlement Agreement and Order on Consent (AOC), describes the investigation and cleanup responsibilities of ASARCO. The AOC was approved and became effective on May 27, 2008. Key features of the AOC include:
• Additional Sampling of Residential Yards. All remaining yards of occupied residences in Hayden and portions of Winkelman that were not sampled during this RI will be sampled by ASARCO.
• Additional Cleanup of Residential Yards. Yards will be cleaned up at all residences where soil concentration levels exceed 24.3 mg/kg for arsenic, 400 mg/kg for lead, and 9,300 mg/kg for copper.
• Study and Cleanup of ASARCO Property. A further study will be completed to identify releases of any hazardous materials, evaluate cleanup methods, and conduct cleanup on and in the vicinity of ASARCO-owned property. The remedial investigation/feasibility study (RI/FS) will include additional sampling of soils, air, groundwater, and surface water. Additional human health/ecological risk assessment and reporting will also be required as part of this process.
• Funding of Technical Assistance Plan for the Community. A Technical Assistance Plan (TAP) will be funded by ASARCO and will provide independent technical expertise to help the community understand the cleanup documents and proposed cleanup actions. The environmental expert will review Site documents, explain them to the community, and help residents frame their issues and concerns back to EPA and ASARCO.
• Establish Financial Assurance. In order to ensure the completion of work called for in the AOC, ASARCO is required to establish and maintain a Performance Guarantee, such as a trust fund, in the amount of $15,000,000.
Activities called for in the AOC will be initiated within 30 days of the AOC’s effective date.
EXECUTIVE SUMMARY
ES022008005PHX xvii
ES.9 Overall Summary In summary, the RI results indicate that the current and former ASARCO operations have resulted in measurable impacts to soils, ambient air, and indoor dust, and to a lesser extent on groundwater, surface water and sediment.
Data from the RI were used to prepare the Human Health Risk Assessment (HHRA) and Screening-Level Ecological Risk Assessment Report (SLERA) reports, presented as Volumes 2 and 3, respectively, of this RI Report.
Based on residential soils data collected during the RI, soil from the 14 most impacted residential properties in Hayden, and from one property in Winkelman, were cleaned up as part of an agreement between EPA and ASARCO. Under the AOC signed in April 2008, ASARCO will undertake additional studies to fill the data gaps identified during the RI, and complete further cleanup activities.

ES022008005PHX xix
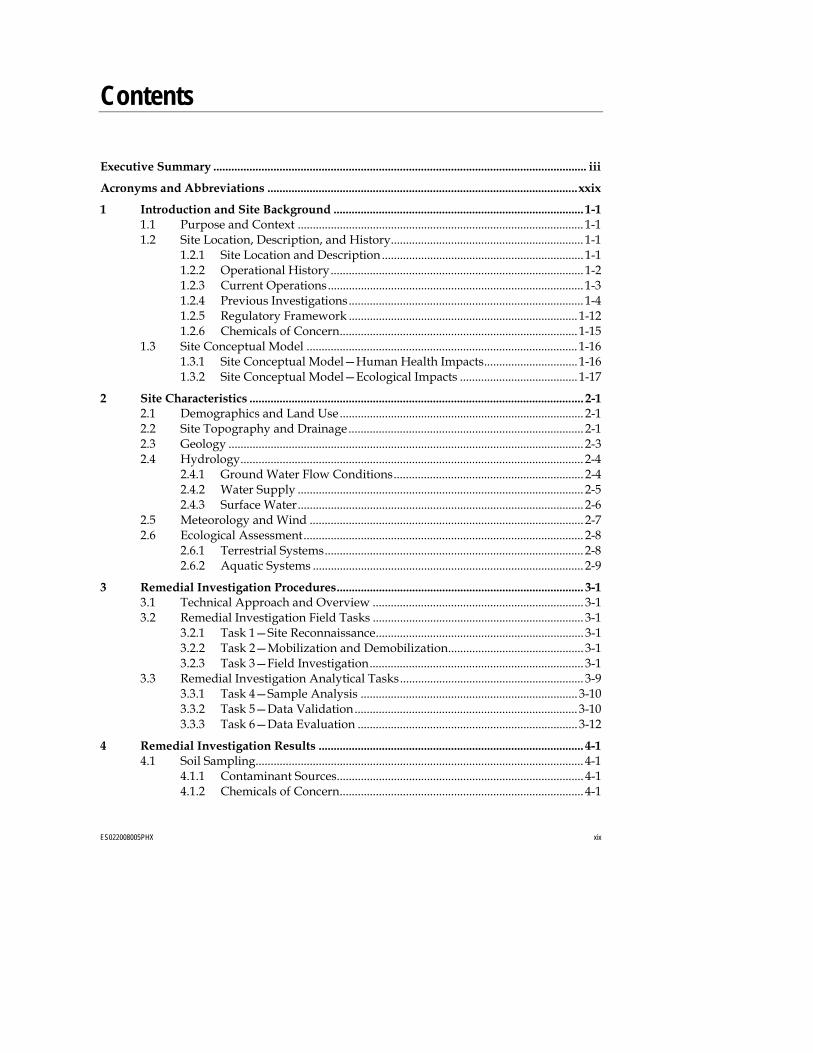
Contents
Executive Summary ............................................................................................................................ iii Acronyms and Abbreviations .......................................................................................................xxix 1 Introduction and Site Background ................................................................................... 1-1
1.1 Purpose and Context ............................................................................................... 1-1 1.2 Site Location, Description, and History................................................................ 1-1
1.2.1 Site Location and Description................................................................... 1-1 1.2.2 Operational History.................................................................................... 1-2 1.2.3 Current Operations..................................................................................... 1-3 1.2.4 Previous Investigations.............................................................................. 1-4 1.2.5 Regulatory Framework ............................................................................ 1-12 1.2.6 Chemicals of Concern............................................................................... 1-15
1.3 Site Conceptual Model .......................................................................................... 1-16 1.3.1 Site Conceptual Model—Human Health Impacts............................... 1-16 1.3.2 Site Conceptual Model—Ecological Impacts ....................................... 1-17
2 Site Characteristics ............................................................................................................... 2-1 2.1 Demographics and Land Use................................................................................. 2-1 2.2 Site Topography and Drainage .............................................................................. 2-1 2.3 Geology ...................................................................................................................... 2-3 2.4 Hydrology.................................................................................................................. 2-4
2.4.1 Ground Water Flow Conditions............................................................... 2-4 2.4.2 Water Supply ............................................................................................... 2-5 2.4.3 Surface Water............................................................................................... 2-6
2.5 Meteorology and Wind ........................................................................................... 2-7 2.6 Ecological Assessment............................................................................................. 2-8
2.6.1 Terrestrial Systems...................................................................................... 2-8 2.6.2 Aquatic Systems .......................................................................................... 2-9
3 Remedial Investigation Procedures.................................................................................. 3-1 3.1 Technical Approach and Overview ...................................................................... 3-1 3.2 Remedial Investigation Field Tasks ...................................................................... 3-1
3.2.1 Task 1—Site Reconnaissance..................................................................... 3-1 3.2.2 Task 2—Mobilization and Demobilization............................................. 3-1 3.2.3 Task 3—Field Investigation....................................................................... 3-1
3.3 Remedial Investigation Analytical Tasks............................................................. 3-9 3.3.1 Task 4—Sample Analysis ........................................................................ 3-10 3.3.2 Task 5—Data Validation.......................................................................... 3-10 3.3.3 Task 6—Data Evaluation ......................................................................... 3-12
4 Remedial Investigation Results ........................................................................................ 4-1 4.1 Soil Sampling............................................................................................................. 4-1
4.1.1 Contaminant Sources.................................................................................. 4-1 4.1.2 Chemicals of Concern................................................................................. 4-1
CONTENTS
xx ES022008005PHX
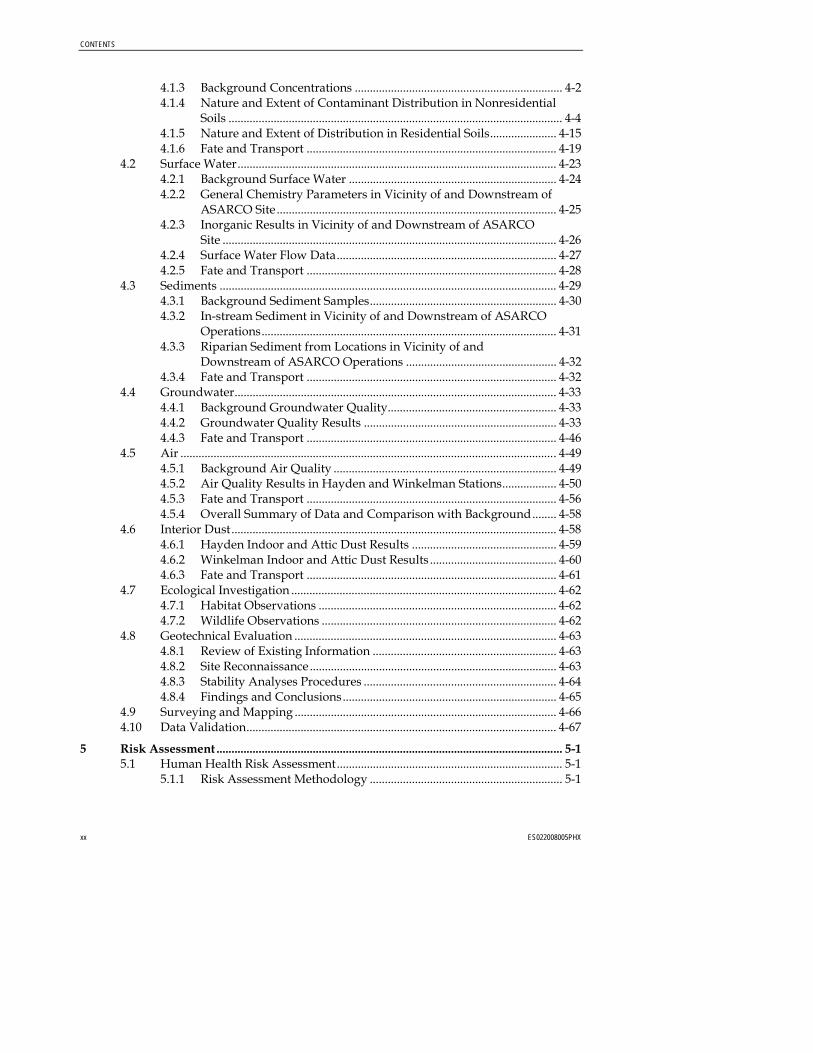
4.1.3 Background Concentrations ..................................................................... 4-2 4.1.4 Nature and Extent of Contaminant Distribution in Nonresidential
Soils ............................................................................................................... 4-4 4.1.5 Nature and Extent of Distribution in Residential Soils...................... 4-15 4.1.6 Fate and Transport ................................................................................... 4-19
4.2 Surface Water.......................................................................................................... 4-23 4.2.1 Background Surface Water ..................................................................... 4-24 4.2.2 General Chemistry Parameters in Vicinity of and Downstream of
ASARCO Site ............................................................................................. 4-25 4.2.3 Inorganic Results in Vicinity of and Downstream of ASARCO
Site ............................................................................................................... 4-26 4.2.4 Surface Water Flow Data......................................................................... 4-27 4.2.5 Fate and Transport ................................................................................... 4-28
4.3 Sediments ................................................................................................................ 4-29 4.3.1 Background Sediment Samples.............................................................. 4-30 4.3.2 In-stream Sediment in Vicinity of and Downstream of ASARCO
Operations.................................................................................................. 4-31 4.3.3 Riparian Sediment from Locations in Vicinity of and
Downstream of ASARCO Operations .................................................. 4-32 4.3.4 Fate and Transport ................................................................................... 4-32
4.4 Groundwater........................................................................................................... 4-33 4.4.1 Background Groundwater Quality........................................................ 4-33 4.4.2 Groundwater Quality Results ................................................................ 4-33 4.4.3 Fate and Transport ................................................................................... 4-46
4.5 Air ............................................................................................................................. 4-49 4.5.1 Background Air Quality .......................................................................... 4-49 4.5.2 Air Quality Results in Hayden and Winkelman Stations.................. 4-50 4.5.3 Fate and Transport ................................................................................... 4-56 4.5.4 Overall Summary of Data and Comparison with Background........ 4-58
4.6 Interior Dust............................................................................................................ 4-58 4.6.1 Hayden Indoor and Attic Dust Results ................................................ 4-59 4.6.2 Winkelman Indoor and Attic Dust Results .......................................... 4-60 4.6.3 Fate and Transport ................................................................................... 4-61
4.7 Ecological Investigation ........................................................................................ 4-62 4.7.1 Habitat Observations ............................................................................... 4-62 4.7.2 Wildlife Observations .............................................................................. 4-62
4.8 Geotechnical Evaluation ....................................................................................... 4-63 4.8.1 Review of Existing Information ............................................................. 4-63 4.8.2 Site Reconnaissance.................................................................................. 4-63 4.8.3 Stability Analyses Procedures ................................................................ 4-64 4.8.4 Findings and Conclusions....................................................................... 4-65
4.9 Surveying and Mapping ....................................................................................... 4-66 4.10 Data Validation....................................................................................................... 4-67
5 Risk Assessment ................................................................................................................... 5-1 5.1 Human Health Risk Assessment........................................................................... 5-1
5.1.1 Risk Assessment Methodology ................................................................ 5-1
CONTENTS
ES022008005PHX xxi
5.1.2 Data Collection and Data Evaluation ...................................................... 5-1 5.1.3 Exposure Assessment................................................................................. 5-2 5.1.4 Toxicity Assessment ................................................................................... 5-3 5.1.5 Risk Characterization ................................................................................. 5-4 5.1.6 Uncertainty Evaluation ............................................................................ 5-11 5.1.7 Summary of Results.................................................................................. 5-11 5.1.8 Conclusions ................................................................................................ 5-14
5.2 Ecological Risk Assessment.................................................................................. 5-14 5.2.1 ERA Objectives and Approach ............................................................... 5-14 5.2.2 Conclusions ................................................................................................ 5-15 5.2.3 Recommendations..................................................................................... 5-16
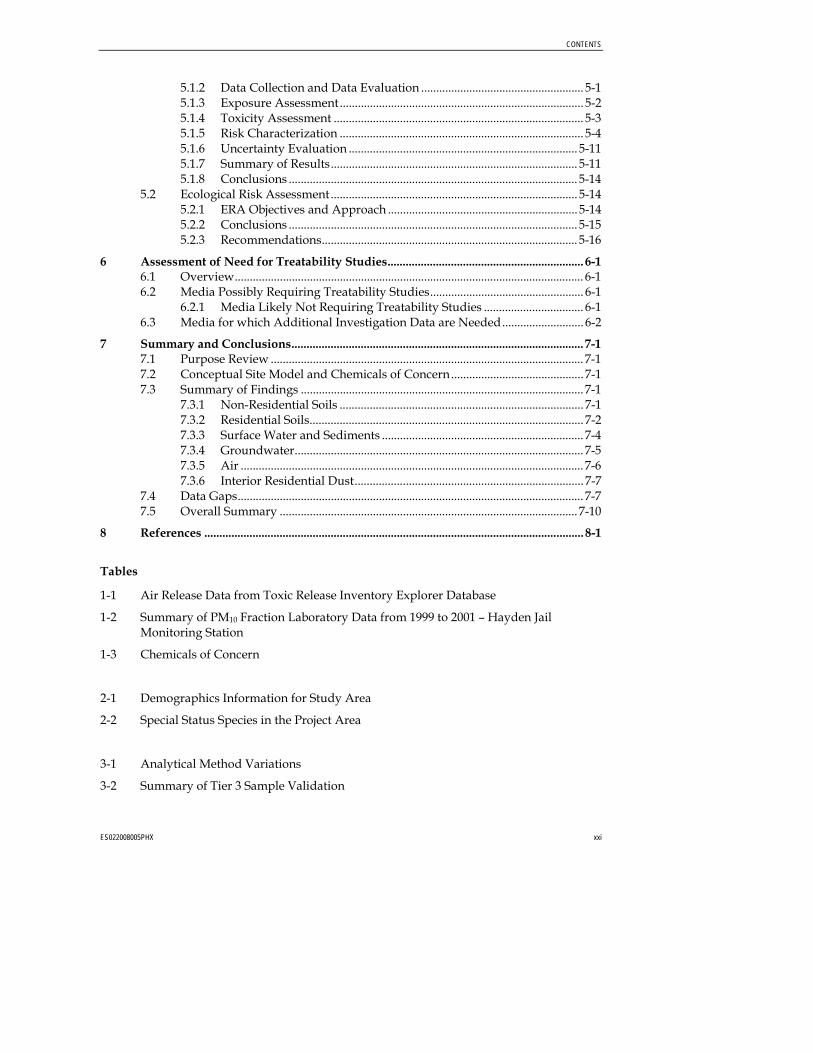
6 Assessment of Need for Treatability Studies................................................................. 6-1 6.1 Overview.................................................................................................................... 6-1 6.2 Media Possibly Requiring Treatability Studies................................................... 6-1
6.2.1 Media Likely Not Requiring Treatability Studies ................................. 6-1 6.3 Media for which Additional Investigation Data are Needed........................... 6-2
7 Summary and Conclusions................................................................................................. 7-1 7.1 Purpose Review ........................................................................................................ 7-1 7.2 Conceptual Site Model and Chemicals of Concern............................................ 7-1 7.3 Summary of Findings .............................................................................................. 7-1
7.3.1 Non-Residential Soils ................................................................................. 7-1 7.3.2 Residential Soils........................................................................................... 7-2 7.3.3 Surface Water and Sediments ................................................................... 7-4 7.3.4 Groundwater................................................................................................ 7-5 7.3.5 Air .................................................................................................................. 7-6 7.3.6 Interior Residential Dust............................................................................ 7-7
7.4 Data Gaps................................................................................................................... 7-7 7.5 Overall Summary ................................................................................................... 7-10
8 References .............................................................................................................................. 8-1
Tables
1-1 Air Release Data from Toxic Release Inventory Explorer Database
1-2 Summary of PM10 Fraction Laboratory Data from 1999 to 2001 – Hayden Jail Monitoring Station
1-3 Chemicals of Concern
2-1 Demographics Information for Study Area
2-2 Special Status Species in the Project Area
3-1 Analytical Method Variations
3-2 Summary of Tier 3 Sample Validation
CONTENTS
xxii ES022008005PHX
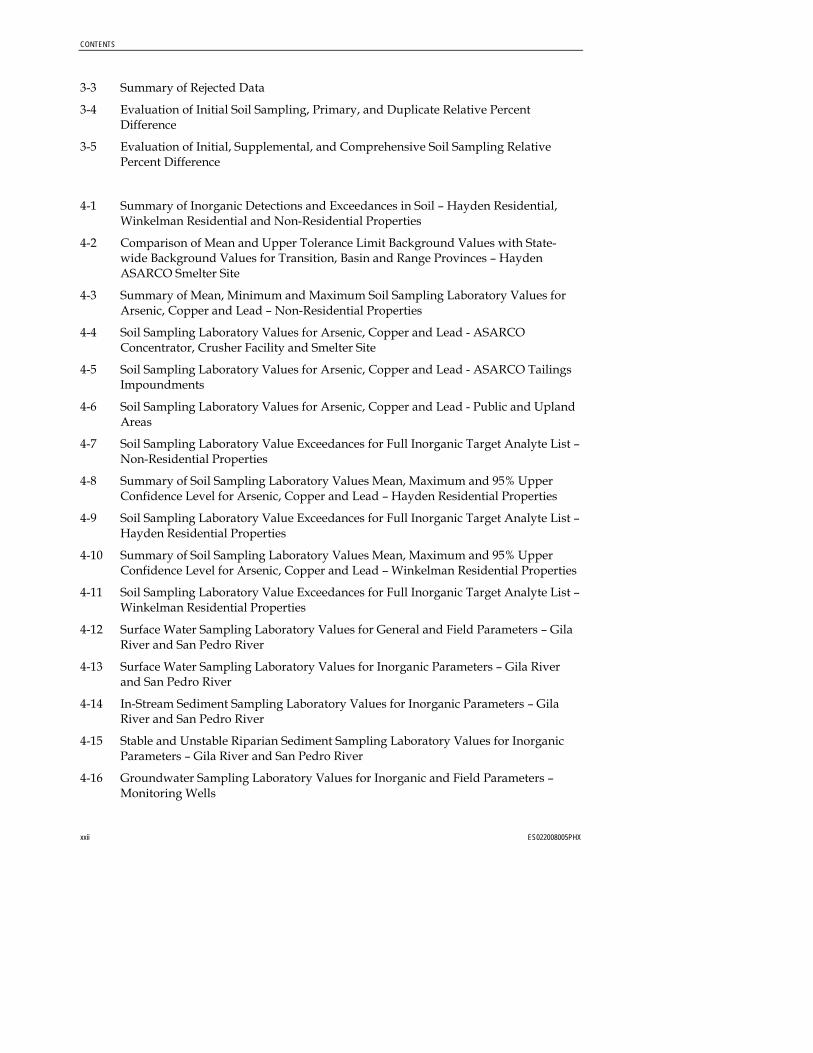
3-3 Summary of Rejected Data
3-4 Evaluation of Initial Soil Sampling, Primary, and Duplicate Relative Percent Difference
3-5 Evaluation of Initial, Supplemental, and Comprehensive Soil Sampling Relative Percent Difference
4-1 Summary of Inorganic Detections and Exceedances in Soil – Hayden Residential, Winkelman Residential and Non-Residential Properties
4-2 Comparison of Mean and Upper Tolerance Limit Background Values with State-wide Background Values for Transition, Basin and Range Provinces – Hayden ASARCO Smelter Site
4-3 Summary of Mean, Minimum and Maximum Soil Sampling Laboratory Values for Arsenic, Copper and Lead – Non-Residential Properties
4-4 Soil Sampling Laboratory Values for Arsenic, Copper and Lead - ASARCO Concentrator, Crusher Facility and Smelter Site
4-5 Soil Sampling Laboratory Values for Arsenic, Copper and Lead - ASARCO Tailings Impoundments
4-6 Soil Sampling Laboratory Values for Arsenic, Copper and Lead - Public and Upland Areas
4-7 Soil Sampling Laboratory Value Exceedances for Full Inorganic Target Analyte List – Non-Residential Properties
4-8 Summary of Soil Sampling Laboratory Values Mean, Maximum and 95% Upper Confidence Level for Arsenic, Copper and Lead – Hayden Residential Properties
4-9 Soil Sampling Laboratory Value Exceedances for Full Inorganic Target Analyte List – Hayden Residential Properties
4-10 Summary of Soil Sampling Laboratory Values Mean, Maximum and 95% Upper Confidence Level for Arsenic, Copper and Lead – Winkelman Residential Properties
4-11 Soil Sampling Laboratory Value Exceedances for Full Inorganic Target Analyte List – Winkelman Residential Properties
4-12 Surface Water Sampling Laboratory Values for General and Field Parameters – Gila River and San Pedro River
4-13 Surface Water Sampling Laboratory Values for Inorganic Parameters – Gila River and San Pedro River
4-14 In-Stream Sediment Sampling Laboratory Values for Inorganic Parameters – Gila River and San Pedro River
4-15 Stable and Unstable Riparian Sediment Sampling Laboratory Values for Inorganic Parameters – Gila River and San Pedro River
4-16 Groundwater Sampling Laboratory Values for Inorganic and Field Parameters – Monitoring Wells
CONTENTS
ES022008005PHX xxiii
4-17 Groundwater Sampling Laboratory Values for Volatile Organic Compound Parameters – Monitoring Wells
4-18 Groundwater Sampling Laboratory Values for Semi-Volatile Organic Compound Parameters – Monitoring Wells
4-19 Groundwater Sampling Laboratory Values for Total Petroleum Hydrocarbon Parameters – Monitoring Wells
4-20 Groundwater Sampling Laboratory Values for General Water Quality Parameters – Monitoring Wells
4-21 Groundwater Sampling Laboratory Values for Radionuclide Parameters – Monitoring Wells
4-22 Groundwater Sampling Laboratory Values for Inorganic and Field Parameters – Water Supply Wells and Drinking Fountains
4-23 Groundwater Sampling Laboratory Values for Volatile Organic Compound Parameters – Water Supply Wells and Drinking Fountains
4-24 Groundwater Sampling Laboratory Values for Semi-Volatile Organic Compound Parameters – Water Supply Wells and Drinking Fountains
4-25 Groundwater Sampling Laboratory Values for General Water Quality Parameters – Water Supply Wells and Drinking Fountains
4-26 Groundwater Sampling Laboratory Values for Radionuclide Parameters – Water Supply Wells and Drinking Fountains
4-27 Groundwater Sampling Laboratory Value Exceedances – Monitoring Wells, Water Supply Wells and Drinking Fountains
4-28 Groundwater Elevation Data
4-29 Background Concentrations of Metals in Ambient Air – PM10 samples - Organ Pipe National Monument
4-30 Summary of Meteorological Data – Hayden and Winkelman Monitoring Stations
4-31 PM10 Air Filter Sampling Laboratory Values for Inorganic Parameters – Hayden Monitoring Station
4-32 PM10 Air Filter Sampling Laboratory Values for Inorganic Parameters – Winkelman Monitoring Station
4-33 Summary of PM10 Air Filter Sampling Laboratory Data – Hayden and Winkelman Monitoring Stations
4-34 Wind Speed, Wind Direction and Upwind Sources for Elevated Arsenic Concentrations – Hayden and Winkelman Monitoring Stations
4-35 Comparison of Ambient Air Concentrations at Grand Canyon, Hayden and Winkelman Monitoring Stations
4-36 Dust Sampling Laboratory Values for Inorganic and General Parameters
CONTENTS
xxiv ES022008005PHX
4-37 Comparison of Indoor Dust, Attic Dust, Surface Soil Statistics and Entry Way Soil Sample Arsenic Results
4-38 Comparison of Indoor Dust, Attic Dust, Surface Soil Statistics and Entry Way Soil Sample Copper Results
4-39 Comparison of Indoor Dust, Attic Dust, Surface Soil Statistics and Entry Way Soil Sample Lead Results
4-40 Summary of Habitat and Wildlife Observations
5-1 Summary of Initial Screening Evaluation for Aquatic Ecological Receptors
5-2 Summary of Refined Risk Evaluation for Terrestrial Ecological Receptors
Figures
1-1 ASARCO Vicinity Map 1-2 Study Area Map
1-3 Key Features of Study Area
1-4 Historical Surface Soil Sample Results Concentrations Exceeding Residential SRLs in Hayden
1-5 Historical Surface Soil Sample Results Concentrations Exceeding Residential SRLs in Winkelman
1-6 Conceptual Site Model Diagram for Human Exposures
1-7 Conceptual Site Model Diagram for Ecological Exposures
2-1 Key Features of Study Area with Topographic Contours
2-2 Geologic Map
2-3 Monitoring Well and Production Well Locations
2-4 Groundwater Elevation Contour Map, February 2006
2-5 Groundwater Elevation Contour Map, October 2006
2-6 Wind Roses for Selected Air Monitoring Stations in Hayden Area
3-1 Residential Soil Sampling Zones, Categories, and Parcel Boundaries, Hayden, Arizona
3-2 Residential Soil Sampling Zones, Categories, and Parcel Boundaries, Winkelman, Arizona
3-3 Location of Air Monitoring Stations
3-4 Ecological Observation Locations
4-1 Study Area Map with Background Soil Sample Locations
CONTENTS
ES022008005PHX xxv
4-2 Non-Residential Soil Laboratory Results for Arsenic, ASARCO Concentrator and Vicinity
4-3 Non-Residential Soil Laboratory Results for Copper, ASARCO Concentrator and Vicinity
4-4 Non-Residential Soil Laboratory Results for Lead, ASARCO Concentrator and Vicinity
4-5 Residential and Non-Residential Soil Exceedances for Molybdenum, Vanadium, and Iron, Hayden, Arizona
4-6 Non-Residential Soil Laboratory Results for Arsenic, Smelter and Vicinity
4-7 Non-Residential Soil Laboratory Results for Copper, Smelter and Vicinity
4-8 Non-Residential Soil Laboratory Results for Lead, Smelter and Vicinity
4-9 Non-Residential Soil Laboratory Results for Arsenic, Tailings Impoundment, Upgradient, and State Route 77 Areas
4-10 Non-Residential Soil Laboratory Results for Copper, Tailings Impoundment, Upgradient, and State Route 77 Areas
4-11 Non-Residential Soil Laboratory Results for Lead, Tailings Impoundment, Upgradient, and State Route 77 Areas
4-12 Residential and Non-Residential Surface Soil Laboratory Results for Arsenic, Hayden, Arizona
4-13 Residential Subsurface Soil Laboratory Results for Arsenic, Hayden, Arizona
4-14 Residential and Non-Residential Surface Soil Laboratory Results for Copper, Hayden, Arizona
4-15 Residential Subsurface Soil Laboratory Results for Copper, Hayden, Arizona
4-16 Residential and Non-Residential Surface Soil Laboratory Results for Lead, Hayden, Arizona
4-17 Residential Subsurface Soil Laboratory Results for Lead, Hayden, Arizona
4-18 Residential and Non-Residential Surface Soil Laboratory Results for Arsenic, Winkelman, Arizona
4-19 Residential Subsurface Soil Laboratory Results for Arsenic, Winkelman, Arizona
4-20 Residential and Non-Residential Surface Soil Laboratory Results for Copper, Winkelman, Arizona
4-21 Residential Subsurface Soil Laboratory Results for Copper, Winkelman, Arizona
4-22 Residential and Non-Residential Surface Soil Laboratory Results for Lead, Winkelman, Arizona
4-23 Residential Subsurface Soil Laboratory Results for Lead, Winkelman, Arizona
4-24 Selected Surface Water Sampling Results, Winter 2006
4-25 Selected Surface Water Sampling Results, Summer 2006
CONTENTS
xxvi ES022008005PHX
4-26 Histograms of Concentrations of General Chemistry Parameters in Surface Water Samples, Hayden, Arizona
4-27 Histograms of Total Concentrations of Aluminum, Calcium, Iron, Magnesium, Potassium, and Sodium in Surface Water Samples, Hayden, Arizona
4-28 Histograms of Dissolved Concentrations of Aluminum, Calcium, Iron, Magnesium, Potassium, and Sodium in Surface Water Samples, Hayden, Arizona
4-29 Histograms of Total Concentrations of Barium, Copper, Manganese, Vanadium, and Zinc in Surface Water Samples, Hayden, Arizona
4-30 Histograms of Dissolved Concentrations of Barium, Copper, Manganese, Vanadium, and Zinc in Surface Water Samples, Hayden, Arizona
4-31 Histograms of Total Concentrations of Arsenic, Boron, Chromium, Cobalt, Lead, and Nickel in Surface Water Samples, Hayden, Arizona
4-32 Histograms of Dissolved Concentrations of Arsenic, Boron, Chromium, Cobalt, Lead, and Nickel in Surface Water Samples, Hayden, Arizona
4-33 Histograms of Total Concentrations of Antimony, Beryllium, Cadmium, Thallium, Mercury, Molybdenum, Selenium, and Silver in Surface Water Samples, Hayden, Arizona
4-34 Histograms of Dissolved Concentrations of Antimony, Beryllium, Cadmium, Thallium, Mercury, Molybdenum, Selenium, and Silver in Surface Water Samples, Hayden, Arizona
4-35 Monthly Mean Daily Flow, 1911 to 2006
4-36 Mean Daily Flows at the Coolidge and Kelvin Gauging Stations, January through October 2006
4-37 Mean Daily Flow and Precipitation, 1996 to 2006
4-38 Selected In-Stream Sediment Sampling Results, Winter and Summer 2006
4-39 Selected Stable and Unstable Riparian Sediment Sampling Results, April 2006
4-40 Histograms of Concentrations of Aluminum, Calcium, Iron, Magnesium, Potassium, and Sodium in In-Stream Sediment Samples, Hayden, Arizona
4-41 Histograms of Concentrations of Barium, Copper, Manganese, Vanadium, and Zinc in In-Stream Sediment Samples, Hayden, Arizona
4-42 Histograms of Concentrations of Arsenic, Boron, Chromium, Cobalt, Lead, and Nickel in In-Stream Sediment Samples, Hayden, Arizona
4-43 Histograms of Concentrations of Antimony, Beryllium, Cadmium, Thallium, Mercury, Molybdenum, Selenium, and Silver in In-Stream Sediment Samples, Hayden, Arizona
4-44 Histograms of Concentrations of Aluminum, Calcium, Iron, Magnesium, Potassium, and Sodium in Stable and Unstable Riparian Sediment Samples, Hayden, Arizona
4-45 Histograms of Concentrations of Barium, Copper, Manganese, Vanadium, and Zinc in Stable and Unstable Riparian Sediment Samples, Hayden, Arizona
CONTENTS
ES022008005PHX xxvii
4-46 Histograms of Concentrations of Arsenic, Boron, Chromium, Cobalt, Lead, and Nickel in Stable and Unstable Riparian Sediment Samples, Hayden, Arizona
4-47 Histograms of Concentrations of Antimony, Beryllium, Cadmium, Cyanide, Mercury, Molybdenum, Selenium, and Silver in Stable and Unstable Riparian Sediment Samples, Hayden, Arizona
4-48 Summary of Groundwater Sample Exceedances, February-March 2006
4-49 Summary of Groundwater Sample Exceedances, August-September 2006
4-50 Monitoring Well Data Piper Diagram, March 2006
4-51 Monitoring Well Data Piper Diagram, August-September 2006
4-52 Production Well Data Piper Diagram, March 2006
4-53 Production Well Data Piper Diagram, August-September 2006
4-54 Drinking Fountain Data Piper Diagram, March 2006
4-55 PM10 Concentrations and Wind Speed for Hayden and Winkelman Monitors
4-56 Arsenic Concentrations in Air at Hayden and Winkelman Stations
4-57 Lead Concentrations in Air at Hayden and Winkelman Stations
4-58 Copper Concentrations in Air at Hayden and Winkelman Stations
4-59 Chromium Concentrations in Air at Hayden and Winkelman Stations
4-60 Arsenic to PM10 Ratios in Air at Hayden and Winkelman Stations
4-61 Residential Indoor and Attic Dust Sampling Results, Hayden, Arizona
4-62 Residential Indoor and Attic Dust Sampling Results, Winkelman, Arizona
4-63 Arsenic Concentrations in Dust and Soil, Hayden, Arizona
4-64 Copper Concentrations in Dust and Soil, Hayden, Arizona
4-65 Lead Concentrations in Dust and Soil, Hayden, Arizona
4-66 Lead Concentrations in Dust and Soil, Properties with Elevated Concentrations, Hayden, Arizona
4-67 Arsenic Concentrations in Dust and Soil, Winkelman, Arizona
4-68 Copper Concentrations in Dust and Soil, Winkelman, Arizona
4-69 Lead Concentrations in Dust and Soil, Winkelman, Arizona
4-70 Ecological Observation Locations
Appendices
A Remedial Investigation Field Procedures B XRF Results
CONTENTS
xxviii ES022008005PHX
Table B-1 Soil Sampling XRF Values for Arsenic, Copper and Lead – Non-Residential Properties
Table B-2 Soil Sampling XRF Values for Arsenic, Copper and Lead – Hayden Residential Properties
Table B-3 Soil Sampling XRF Values for Arsenic, Copper and Lead – Winkelman Residential Properties
C Background Evaluation Technical Memorandum D Non-Residential Soil Laboratory Data Table D-1 Soil Sampling Laboratory Values for Full Inorganics Target Analyte
List – Non-Residential Properties E Residential Soil Laboratory Data Table E-1 Soil Sampling Laboratory Values for Full Inorganics Target Analyte
List – Hayden Residential Properties Table E-2 Soil Sampling Laboratory Values for Full Inorganics Target Analyte
List – Winkelman Residential Properties F Boring Logs and Well Drawings Table F-1 Geologic Borehole Log and Monitoring Well Installation Details
Summary G Geotechnical Evaluation Technical Memorandum
H Investigated Derived Waste (IDW Analysis)
I Summary of Terrestrial and Wildlife Observations
J Data Validation Reports
ES022008005PHX xxix
Acronyms and Abbreviations
AAWWQC Arizona Aquatic and Wildlife Water Quality Criteria
ADEQ Arizona Department of Environmental Quality
ADHS Arizona Department of Health Services
ADWR Arizona Department of Water Resources
AGFD Arizona Game and Fish Department
AOC Agreement and Order on Consent
APP Aquifer Protection Permit
ARIS Alternative RCRA Information for States
ATSDR Agency for Toxic Substances and Disease Registry
AWC Arizona Water Company
AZPDES Arizona Pollution Discharge Elimination System
BADCT Best Available Demonstrated Control Technology
BAF bioavailability factor
bgs below ground surface
CERCLA Comprehensive Environmental Response, Compensation, and Liability Act
CERCLIS Comprehensive Environmental Response, Compensation, and Liability Information System
CFR Code of Federal Regulations
cfs cubic feet per second
CLP Contract Laboratory Program
cm/sec centimeter per second
CoC chain of custody
COC chemicals of concern
COPC chemicals of potential concern
COPEC chemicals of potential ecological concern
CPM counts per minute
CSM Conceptual Site Model
ACRONYMS AND ABBREVIATIONS
xxx ES022008005PHX
CV comparison values
DI distilled water
DO dissolved oxygen
DOJ U.S. Department of Justice
DQO Data Quality Objectives
DTSC Department of Toxic Substances Control (California)
ELCR excess lifetime cancer risk
EPA U.S. Environmental Protection Agency
EPC exposure point concentration
ERA Ecological Risk Assessment
ERS Emergency Response Section
ESI Expanded Site Inspection
FPXRF Field Portable X-Ray Fluorescence
fsp feet per second
FSP Field Sampling Plan
gpm gallons per minute
HASP Health and Safety Plan
HEAST Health Effects Assessment Summary Table
HHRA Human Health Risk Assessment
HI Hazard Index
HL Hayden Library
HQ Hazard Quotient
IDW investigation-derived waste
IMPROVE Interagency Monitoring of Protected Visual Environments
IRIS Integrated Risk Information System
LLC Limited Liability Corporation
MCL maximum contamination level
MDL method detection limit
mg/kg milligrams per kilogram
mg/L milligrams per liter
ACRONYMS AND ABBREVIATIONS
ES022008005PHX xxxi
mS/cm milliSiemens per centimeter
MS/MSD matrix spike/matrix spike duplicate
MSHA Mine Safety and Health Administration
msl mean sea level
NAAQS National Ambient Air Quality Standards
Na-HCO3 sodium bicarbonate
Na-SO4 sodium sulfate
NAWQA National Water Quality Assessment
NCEA National Center for Environmental Assessment (NCEA)
NOD Notice of Disposal
NOV Notice of Violation
NPL National Priorities List
PA Preliminary Assessment
PARCC precision, accuracy, representativeness, comparability, and completeness
PBET physically based extraction test
PPRTVs Provisional Peer Reviewed Toxicity Values
pCi/L picocuries per liter
PHA preliminary hazard analysis
PM particulate matter
PM10 particulate matter smaller than 10 microns
PM2.5 particulate matter smaller than 2.5 microns
PRG Preliminary Remediation Goals
QC Quality Control
QAPP Quality Assurance Project Plan
Qo Quaternary Deposits
RA Removal Assessment
RCRA Resource Conversation and Recovery Act
RI Remedial Investigation
RI Workplan “Final Workplan Remedial Investigation”
RPD relative percent deviation
ACRONYMS AND ABBREVIATIONS
xxxii ES022008005PHX
R&R reverberatory furnace and roaster
RME reasonable maximum exposure
R-SRL Residential Soil Remediation Level
SDG Sample Delivery Group
SI Site Inspection
SLERA Screening-Level Ecological Risk Assessment
SO2 sulfur dioxide
SOW Statement of Work
SVE soil vapor extraction
SVOC semi volatile organic compound
TAL Target Analyte List
TAP Technical Assistance Plan
TDS total dissolved solids
tpd tons per day
tpy tons per year
TPH Total Petroleum Hydrocarbon
TRI Toxics Release Inventory
Ts Tertiary Sediment
TSP total suspended particulate
TSS total suspended solids
UCL upper confidence level
µg/L micrograms per liter
µg/m3 micrograms per cubic meter
USGS U.S. Geological Survey
UST underground storage tank
UTL upper tolerance limit
VOC volatile organic compound
WWTP Winkelman Wastewater Treatment Plant
ES022008005PHX 1-1
SECTION 1
Introduction and Site Background
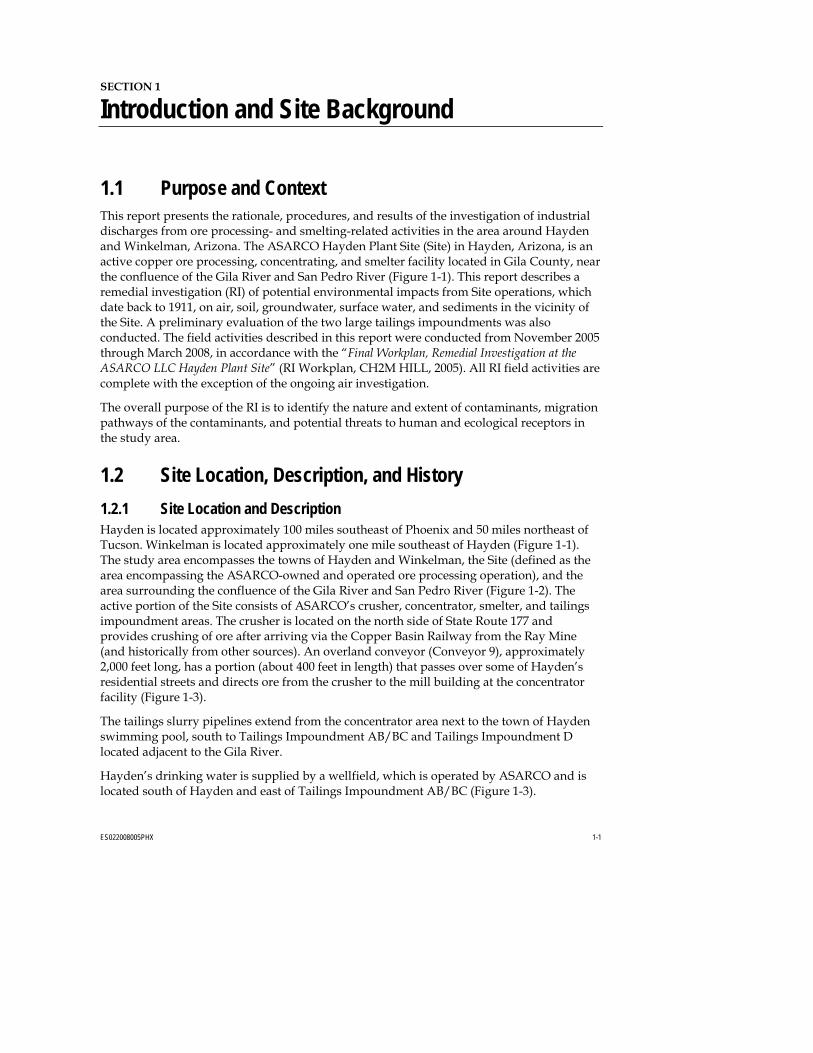
1.1 Purpose and Context This report presents the rationale, procedures, and results of the investigation of industrial discharges from ore processing- and smelting-related activities in the area around Hayden and Winkelman, Arizona. The ASARCO Hayden Plant Site (Site) in Hayden, Arizona, is an active copper ore processing, concentrating, and smelter facility located in Gila County, near the confluence of the Gila River and San Pedro River (Figure 1-1). This report describes a remedial investigation (RI) of potential environmental impacts from Site operations, which date back to 1911, on air, soil, groundwater, surface water, and sediments in the vicinity of the Site. A preliminary evaluation of the two large tailings impoundments was also conducted. The field activities described in this report were conducted from November 2005 through March 2008, in accordance with the “Final Workplan, Remedial Investigation at the ASARCO LLC Hayden Plant Site” (RI Workplan, CH2M HILL, 2005). All RI field activities are complete with the exception of the ongoing air investigation.
The overall purpose of the RI is to identify the nature and extent of contaminants, migration pathways of the contaminants, and potential threats to human and ecological receptors in the study area.
1.2 Site Location, Description, and History 1.2.1 Site Location and Description Hayden is located approximately 100 miles southeast of Phoenix and 50 miles northeast of Tucson. Winkelman is located approximately one mile southeast of Hayden (Figure 1-1). The study area encompasses the towns of Hayden and Winkelman, the Site (defined as the area encompassing the ASARCO-owned and operated ore processing operation), and the area surrounding the confluence of the Gila River and San Pedro River (Figure 1-2). The active portion of the Site consists of ASARCO’s crusher, concentrator, smelter, and tailings impoundment areas. The crusher is located on the north side of State Route 177 and provides crushing of ore after arriving via the Copper Basin Railway from the Ray Mine (and historically from other sources). An overland conveyor (Conveyor 9), approximately 2,000 feet long, has a portion (about 400 feet in length) that passes over some of Hayden’s residential streets and directs ore from the crusher to the mill building at the concentrator facility (Figure 1-3).
The tailings slurry pipelines extend from the concentrator area next to the town of Hayden swimming pool, south to Tailings Impoundment AB/BC and Tailings Impoundment D located adjacent to the Gila River.
Hayden’s drinking water is supplied by a wellfield, which is operated by ASARCO and is located south of Hayden and east of Tailings Impoundment AB/BC (Figure 1-3).
1.0 INTRODUCTION AND SITE BACKGROUND
1-2 ES022008005PHX
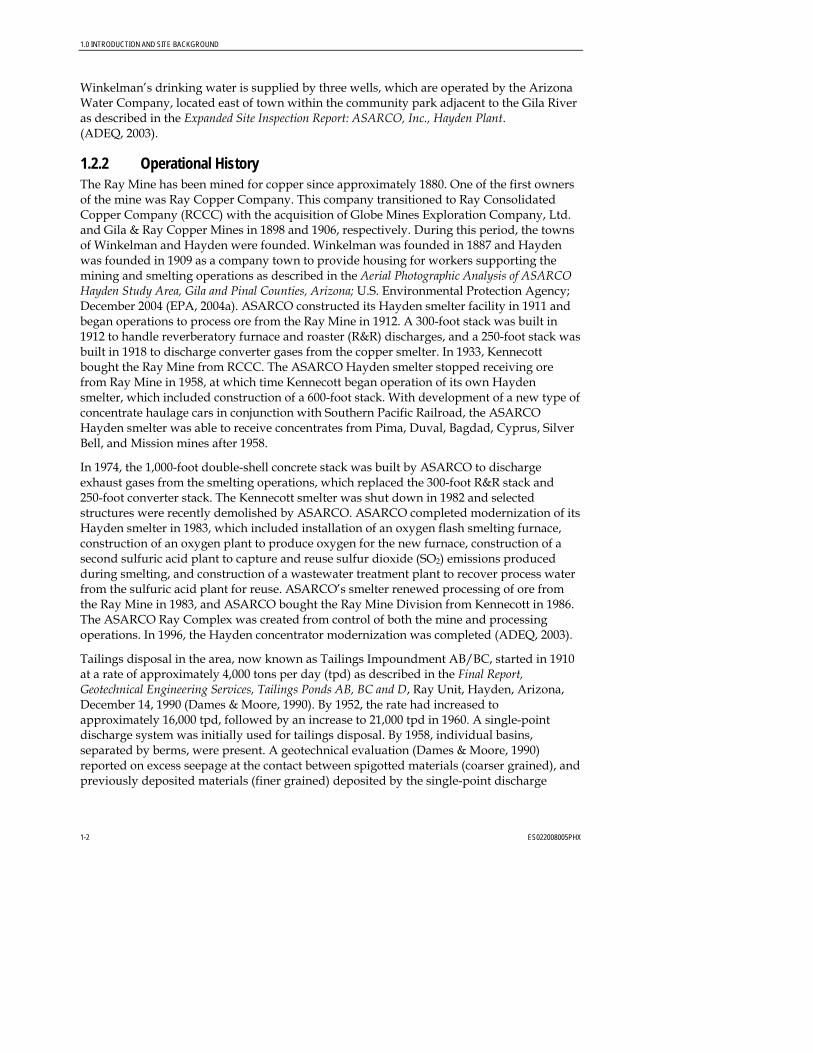
Winkelman’s drinking water is supplied by three wells, which are operated by the Arizona Water Company, located east of town within the community park adjacent to the Gila River as described in the Expanded Site Inspection Report: ASARCO, Inc., Hayden Plant. (ADEQ, 2003).
1.2.2 Operational History The Ray Mine has been mined for copper since approximately 1880. One of the first owners of the mine was Ray Copper Company. This company transitioned to Ray Consolidated Copper Company (RCCC) with the acquisition of Globe Mines Exploration Company, Ltd. and Gila & Ray Copper Mines in 1898 and 1906, respectively. During this period, the towns of Winkelman and Hayden were founded. Winkelman was founded in 1887 and Hayden was founded in 1909 as a company town to provide housing for workers supporting the mining and smelting operations as described in the Aerial Photographic Analysis of ASARCO Hayden Study Area, Gila and Pinal Counties, Arizona; U.S. Environmental Protection Agency; December 2004 (EPA, 2004a). ASARCO constructed its Hayden smelter facility in 1911 and began operations to process ore from the Ray Mine in 1912. A 300-foot stack was built in 1912 to handle reverberatory furnace and roaster (R&R) discharges, and a 250-foot stack was built in 1918 to discharge converter gases from the copper smelter. In 1933, Kennecott bought the Ray Mine from RCCC. The ASARCO Hayden smelter stopped receiving ore from Ray Mine in 1958, at which time Kennecott began operation of its own Hayden smelter, which included construction of a 600-foot stack. With development of a new type of concentrate haulage cars in conjunction with Southern Pacific Railroad, the ASARCO Hayden smelter was able to receive concentrates from Pima, Duval, Bagdad, Cyprus, Silver Bell, and Mission mines after 1958.
In 1974, the 1,000-foot double-shell concrete stack was built by ASARCO to discharge exhaust gases from the smelting operations, which replaced the 300-foot R&R stack and 250-foot converter stack. The Kennecott smelter was shut down in 1982 and selected structures were recently demolished by ASARCO. ASARCO completed modernization of its Hayden smelter in 1983, which included installation of an oxygen flash smelting furnace, construction of an oxygen plant to produce oxygen for the new furnace, construction of a second sulfuric acid plant to capture and reuse sulfur dioxide (SO2) emissions produced during smelting, and construction of a wastewater treatment plant to recover process water from the sulfuric acid plant for reuse. ASARCO’s smelter renewed processing of ore from the Ray Mine in 1983, and ASARCO bought the Ray Mine Division from Kennecott in 1986. The ASARCO Ray Complex was created from control of both the mine and processing operations. In 1996, the Hayden concentrator modernization was completed (ADEQ, 2003).
Tailings disposal in the area, now known as Tailings Impoundment AB/BC, started in 1910 at a rate of approximately 4,000 tons per day (tpd) as described in the Final Report, Geotechnical Engineering Services, Tailings Ponds AB, BC and D, Ray Unit, Hayden, Arizona, December 14, 1990 (Dames & Moore, 1990). By 1952, the rate had increased to approximately 16,000 tpd, followed by an increase to 21,000 tpd in 1960. A single-point discharge system was initially used for tailings disposal. By 1958, individual basins, separated by berms, were present. A geotechnical evaluation (Dames & Moore, 1990) reported on excess seepage at the contact between spigotted materials (coarser grained), and previously deposited materials (finer grained) deposited by the single-point discharge
1.0 INTRODUCTION AND SITE BACKGROUND
ES022008005PHX 1-3
system. The tailings seepage concern was evident mainly along the western half of the tailings impoundments. The discontinuity eventually caused a slope failure in 1972 that resulted in a slope failure of 500 feet across and 30 to 50 feet deep. Another failure occurred in 1973. At the time of failure, water was seeping out of failed portions of the impoundment, and active piping was observed (Dames & Moore, 1990).
• In 1982, construction of Tailings Impoundment D began with an 8,700 feet long, 48 feet high starter dike. After 29 weeks of tailings disposal behind the dike, settlement cracks and tailing seepage were observed by mine employees. The cracks and seepage were apparently caused by differential settlement between coarse- and fine-grained materials, and were reportedly addressed by ASARCO.
The former Kennecott Copper Company (Kennecott) smelter area, located on the north edge of Hayden and north of the concentrator facility, underwent demolition work beginning in 2004. Currently, the area consists of miscellaneous building debris, storage tanks, foundations, and an abandoned slag dump northwest of the former smelter. The former Kennecott smelter stack was not subject to the demolition activity as discussed during the CH2M HILL December 15, 2004 site visit with ASARCO personnel (ASARCO, 2004). The lime and filter plant facilities are still actively operated.
An historical photographic analysis conducted to provide support to field investigations in the area is provided in the Aerial Photographic Analysis of ASARCO Hayden Study Area (EPA 2004). The analysis documents environmental conditions and industrial activities on nine different dates over a period extending from 1958 through 2004.
1.2.3 Current Operations In the current Ray Complex operations, sulfide ore undergoes primary crushing at the Ray Mine and is transported by rail to the Hayden operations. At the 27,400 tpd Hayden concentrator, the ore is offloaded at the track hopper and passed through secondary crushing processes where it is further reduced in size. The ore is transported by Conveyor 9 (a portion of which is overhead) to rod mills and ball mills where the ore is pulverized to a sand size or smaller, and then converted to a slurry. The ore slurry is directed to froth flotation tanks where the copper minerals are separated from the bulk of the copper ore. The copper-rich concentrate, which contains about 25 to 30 percent (%) copper, is sent to the smelting operation for further processing (the smelter also receives concentrates directly from the Ray Mine operations). The tailings waste from the froth flotation process is sent to the thickeners, and then transported as slurry in the tailings pipeline and deposited on Tailings Impoundments AB/BC and D.
The copper-rich concentrates are then transported to the 720,000 tons per year (tpy) Hayden smelter, located about 2,000 feet east-northeast of Hayden. The smelter facility includes an oxygen flash furnace, converters, anode casting, oxygen plant, and acid plant (ASARCO, 2008). Although closely related, ASARCO manages the concentrator and smelter operations separately with each operation having a separate entrance. The concentrates are unloaded and blended with fluxes, then transferred to fluid bed dryers where they are dried and stored prior to being introduced into the oxygen flash furnace. The copper concentrates ignite, melt, and partition to produce matte (approximately 55% copper) and slag. During this process, sulfur from the ore is oxidized to form SO2 gas. The matte from the flash
1.0 INTRODUCTION AND SITE BACKGROUND
1-4 ES022008005PHX
furnace is subsequently processed in converter furnaces to remove additional impurities and produce blister copper (approximately 98.5% copper). Finally, the blister copper is further processed in anode furnaces to produce copper anodes that are 99% pure. The anodes are shipped offsite for final processing (ADEQ, 2003).
The smelter facility includes several waste management activities. The active smelter building is approximately 11 stories tall, and a portion of the air emissions are released to the atmosphere through a 1,000-foot-tall stack. During the smelting process, sulfur from the ore is oxidized to form SO2 gas, which is converted to sulfuric acid in the sulfuric acid plant. Slag from the smelter operations is transferred to open waste stockpiles located immediately southeast of the smelter operations area (Figure 1-3). Treated wastewater and other process waters are discharged to containment pond CP-1, located east of the smelter. Decant water from the tailings impoundment is discharged to retention ponds located east of Tailings Impoundment AB/BC, where it is reclaimed into the process operations (ADEQ, 2003).
Process/storm water management facilities (Figures 1-2 and 1-3) consist of several drainages and surface water impoundments located throughout the concentrator and smelter areas. These facilities include Power House Wash (separating the active smelter area from the concentrator/Hayden residential areas), emergency overflow and pump back ponds located south-southeast of Tailings Impoundment AB/BC, a large retention pond (Last Chance Basin) at the northwest edge of Tailings Impoundment AB/BC, and containment berms in selected areas of the tailings impoundments areas.
The tailings impoundments are managed as part of the concentrator operations. Tailings Impoundment AB/BC is located south of State Route 177 and north of the Gila River, extends for a length of approximately 2.5 miles, and has a maximum width of one mile and a maximum height of 200 feet. The newer Tailings Impoundment D is located south of the Gila River, extends for a length of approximately two miles, has a maximum width of 1,500 feet, and a maximum height of 150 feet.
1.2.4 Previous Investigations Previous investigations at the Site have been conducted by U.S. Environmental Protection Agency (EPA) and Arizona Department of Environmental Quality (ADEQ), (including primarily the Air Quality Division and the Water Quality Division). In addition, the Arizona Department of Health Services (ADHS) joined with the Agency for Toxic Substances and Disease Registry (ATSDR) to prepare a Public Health Assessment (PHA); Public Health Assessment, ASARCO Hayden Smelter Site, Hayden, Gila County, Arizona (ATSDR, 2002). ASARCO has led investigations relating to underground storage tanks (USTs) and other compliance-related matters at the Site. The following summarizes the major investigations and other information at the Site:
Preliminary Assessment – 1988. EPA conducted a Preliminary Assessment (PA) to determine if there were releases of hazardous substances determining eligibility for placement on the National Priorities List (NPL). Following the PA, a Site Inspection (SI) was recommended for the Site (ADEQ, 2003).
Site Inspection – 1991. ADEQ conducted a non-sampling SI and concluded that based on documented releases to the air and soil, the Site qualified for further consideration under the Comprehensive Environmental Response, Compensation, and Liability Act (CERCLA);
1.0 INTRODUCTION AND SITE BACKGROUND
ES022008005PHX 1-5
Preliminary Assessment/Site Inspection Report (ADEQ, 1991). EPA later decided that an Expanded Site Inspection (ESI) was needed (ADEQ, 2003).
Underground Storage Tank Removal – 1989. In January 1989, ASARCO removed a 1,000-gallon gasoline UST and a 1,000-gallon diesel UST located southwest of its smelting operations. During the removal, holes in the tanks were observed and evidence of a release was noted. ASARCO installed and operated a soil vapor extraction (SVE) system at the site of the gasoline release and initiated a quarterly groundwater monitoring and product removal program at the diesel release site as described in the UST Closure and Characterization Report, ASARCO Ray Complex; October 16, 1998 (Hydrometrics, 1998). Based on an inquiry to the ADEQ Tanks Program Division, the case numbers for the gasoline and diesel USTs are 635.01 and 635.01, respectively. The gasoline UST case was closed on June 14, 1996. For the diesel UST case, ADEQ received a “cased closed request” from ASARCO on January 24, 2008, (ADEQ, 2008).
Underground Storage Tank Removal – 1998. In September 1998, during the removal of two 5,000-gallon gasoline USTs located near the concentrator operations, holes in the USTs were noted and a gasoline release was reported. Contaminated soil was excavated and removed from the UST location. According to ADEQ’s UST Corrective Action Section, groundwater contamination is not known to be related to the UST releases at this Site (Hydrometrics, 1998). Based on a review of the ADEQ US Track Database (updated on a semiannual basis), these two cases were closed on November 29, 2005 (ADEQ, 2007).
Preliminary Hazard Analysis – 1999. In conjunction with ATSDR, ADHS conducted a PHA for the study area, which consisted of obtaining 10 environmental soil samples within Hayden and Winkelman to evaluate levels of contamination. From June to October 1999, public health surveys were conducted of the residents of Hayden and Winkelman. Blood lead levels were evaluated for some children aged 6 to 72 months, and urinary arsenic levels were checked in some adults and children. The study also summarized air quality data obtained from 1991-1998 from the dichot particulate monitoring station maintained by ADEQ at the Hayden Jail location, and compared data against ATSDR Comparison Values (CV) for arsenic (0.0002 micrograms per cubic meter [μg/m3]), lead (National Ambient Air Quality Standard [NAAQS] of 1.5 μg/m3 - for a quarterly period), and SO2 (25 μg/m3 for a 3-hour period). The CVs are concentrations of a chemical below which adverse health effects are unlikely to occur. The CVs are not used to define specific adverse health effects from exposure, but instead to help determine if additional contaminant-specific investigation is needed.
The PHA reported that the average concentrations of metals in soils were not above ATSDR CVs except for lead; however, the sample locations were not specified, only 10 samples were collected, and the sampling depth (0-6 inches below ground surface [bgs]) may not be fully indicative of surface soil impacts (0-2 inches bgs). Elevated urinary arsenic levels were found in a limited number of residents. The arsenic CV was exceeded in outdoor air, based on ADEQ data from the Hayden Jail, for each year from 1991-1998, while the lead CV was not exceeded based on ADEQ data from 1993-1997. The PHA did not include an evaluation of other metals such as chromium, cadmium, or copper. Finally, the SO2 CV was exceeded on occasion. The PHA concluded that air quality in the Hayden and Winkelman area generally meets all federal and state air quality standards for criteria air pollutants, although
1.0 INTRODUCTION AND SITE BACKGROUND
1-6 ES022008005PHX
some exceedances of arsenic and SO2 CVs were reported. Brief episodes of elevated SO2 in air may cause short-term respiratory symptoms for sensitive asthmatics a few times per month. Levels of SO2 in air are unlikely to cause respiratory symptoms in persons without pre-existing respiratory conditions. The report noted that conclusions drawn were based on data available at the time the document was released, and that conclusions could change if data indicate that exposure has increased or decreased based on further environmental investigation (ATSDR, 2002).
RCRA Inspection – 2000. On September 20, 2000, EPA performed a Resource Conservation and Recovery Act (RCRA) inspection at the Site, which included the collection of 12 solid material samples from the concentrator and smelter areas for analysis of the 23 Target Analyte List (TAL) metals by the EPA Region IX laboratory. The sample locations and results for selected metals are presented on Figure 1-4. The laboratory data indicate the following (EPA, 2000):
• Arsenic levels were well above the Residential Soil Remediation Levels (R-SRL) (10 milligrams per kilogram [mg/kg]) at all locations, and the highest concentrations were in the filter cake sample from the filter plant area (sample AS07, at 32,000 mg/kg), CP-1 solids sample (sample AS06, 3,700 mg/kg), and the berm sample collected adjacent to storage bins along the road near the filter plant (sample AS10, 2,400 mg/kg).
• Copper levels were well above the former and current R-SRL (2,800 and 3,100 mg/kg) at all locations except the tailings impoundment (sample AS04), and the highest concentrations were in the filter cake sample from the filter plant area (sample AS07, 350,000 mg/kg), and samples of concentrate (sample AS12, 320,000 mg/kg), Mission concentrate (sample AS05, 230,000 mg/kg) and Hayden concentrate (sample AS11, 230,000 mg/kg).
• Lead levels were above the R-SRL (400 mg/kg) in several samples, and the highest concentrations were in the same samples with the elevated arsenic levels. The highest lead levels were found in the filter cake sample from the filter plant area (sample AS07, 32,000 mg/kg), the CP-1 solids sample (sample AS06, 7,200 mg/kg), and the berm sample collected adjacent to storage bins near the filter plant (sample AS10, 6,600 mg/kg).
• Cadmium levels were above the R-SRL (39 mg/kg) in several samples, and the highest concentrations were identical to the samples with the elevated arsenic and lead levels. The highest cadmium levels were found in the filer cake sample from the filter plant area (sample AS07, 5,200 mg/kg), the CP-1 solids sample (sample AS06, 340 mg/kg), and the berm sample collected adjacent to storage bins near the filter plant (sample AS10, 240 mg/kg).
• Chromium levels were above the R-SRL (30 mg/kg) in three samples, which included the berm sample collected adjacent to storage bins near the filter plant (sample AS09, 380 mg/kg), the CP-1 solids sample (sample AS06, 46 mg/kg), and the tailings impoundment sample (sample AS04, 34 mg/kg).
• Some samples also had elevated concentrations of other metals above the R-SRL, including zinc, mercury, and vanadium.
1.0 INTRODUCTION AND SITE BACKGROUND
ES022008005PHX 1-7
Expanded Site Inspection – 2002. ADEQ, on behalf of EPA, performed an ESI, which primarily included soil sampling around Conveyor 9 and other nearby areas in Hayden (groundwater and surface water/sediment sampling were also conducted). Soils from residential areas were sampled due to the potential for the finer material on the conveyor belt that runs through town to be dispersed by wind into the residents’ yards. ADEQ collected surface soil samples from 23 private residences, and areas assessed included the private residences to the east of Conveyor 9; located on Smelter Road, Hillcrest Avenue, Sunnyslope Road, Ray Avenue, Velasco Avenue, and Garfield Avenue (ADEQ, 2003). The sample locations are shown on Figure 1-4.
Of the 27 distinct locations sampled in Hayden, results of analyses revealed the following exceedances of the Arizona soil screening level R-SRLs in surficial soils:
• Arsenic levels exceeded the R-SRL of 10 mg/kg at 26 locations (maximum of 67.4 mg/kg).
• Copper levels exceeded the former R-SRL of 2,800 mg/kg (note that the R-SRL was increased to 3,100 mg/kg in 2007) at 24 locations (maximum of 55,100 mg/kg).
• Lead levels exceeded the R-SRL of 400 mg/kg at three locations (maximum of 851 mg/kg).
In addition, cadmium, mercury, and zinc levels in several samples were reported as elevated compared to the average background concentrations, but were not detected above their R-SRLs.
The ESI concluded that the elevated concentrations of metals were the result of ASARCO operations. Arsenic, cadmium, copper, and mercury in surficial soil samples met the criteria of “observed contamination” (were detected in concentrations exceeding three times the average background soil concentration). Lead did not meet the criteria of “observed contamination” although three of 36 surface soil samples exceeded the R-SRL of 400 mg/kg. Contamination is potentially attributable to sources including dispersal of crushed ore from the conveyor belt, deposition of aerosols from smelting operations, sediment transported by surface water runoff from the concentrator operation, and deposition of tailings from wind events. Elevated concentrations at ASARCO operations were shown, in sediment analysis from containment pond CP-1, which collects stormwater, wastewater, and process waters from the smelter area, to contain elevated concentrations of arsenic, cadmium, chromium, copper, lead, mercury, and zinc.
Removal Assessment – 2004. The EPA Emergency Response Section (ER) sampled soils in the Hayden, Kearney, and Winkelman areas to further evaluate impacts from Site operations as described in the ASARCO Hayden Removal Assessment; Final Report, December 2004 (Ecology & Environment, Inc., 2004). The EPA Removal Assessment (RA) was focused on defining levels of metals contamination within residential, public, and commercial areas of the three towns. Kearney did not contain elevated levels of contamination. Hence, the following paragraphs focus on results of sampling in Hayden and Winkelman.
Soil samples were collected at a total of 51 locations in Hayden (Figure 1-4) and 69 locations in Winkelman (Figure 1-5) from randomly selected locations within an established grid.
1.0 INTRODUCTION AND SITE BACKGROUND
1-8 ES022008005PHX
Background samples were collected at six locations along State Route 77 south of Winkelman. Surficial samples were collected to a depth of approximately two inches bgs.
Of the 51 samples in the Hayden area, the total metals analyses revealed metals contamination above R-SRLs at 40 locations including the following:
• Arsenic levels exceeded the R-SRL of 10 mg/kg at 40 locations (maximum of 91 mg/kg).
• Copper levels exceeded the former R-SRL of 2,800 mg/kg at 29 locations (maximum of 11,400 mg/kg).
• Lead levels exceeded the R-SRL of 400 mg/kg at one location (463 mg/kg).
In Hayden, sample locations revealing elevated copper and lead concentrations generally coincided with locations showing high arsenic concentrations, with the highest concentrations typically concentrated close to ASARCO facilities, including particularly the Conveyor 9 area, east of the Conveyor 9 area near Power House Wash, and to the north of Hayden adjacent to concentrator operations and the former Kennecott smelter area.
Of the 69 samples from the Winkelman area, the total metals analyses revealed the following exceedances of R-SRLs:
• Arsenic levels exceeded the R-SRL of 10 mg/kg at 16 locations (maximum of 320 mg/kg).
• Copper levels exceeded the former R-SRL of 2,800 mg/kg at seven locations (maximum of 19,000 mg/kg).
• Lead levels exceeded the R-SRL of 400 mg/kg at three locations (maximum of 485 mg/kg).
In Winkelman, elevated arsenic levels were generally located along and south of State Route 177. In addition, antimony, beryllium, and thallium were also detected at concentrations above their R-SRLs in several samples, although antimony exceeded the R-SRL at only one location. Through data validation, the beryllium and thallium concentrations were determined to likely be biased high.
An analyses of RA background samples revealed that concentrations of metals above their respective R-SRLs are not naturally occurring.
The RA concluded that surficial soil contamination is present in Hayden and Winkelman. The study further concluded that the elevated concentrations of metals found throughout Hayden are likely the result of contamination dispersed from ASARCO operations. Elevated concentrations of metals in Winkelman are presumed to be the result of close proximity to ASARCO operations (exceedances in the northern portion of town), proximity to tailings disposal areas, and aerial dispersion from vehicles traveling along State Route 177, as well as rail transport facilities for copper ore.
EPA Focused Sampling Event – 2004. In October 2004, in combination with the RA, soil samples were collected by EPA at five locations in Hayden and six locations in Winkelman, with the locations focused at the Hayden public pool and play area and the Winkelman school yards (Figures 1-4 and 1-5). A formal report of this investigation was not prepared;
1.0 INTRODUCTION AND SITE BACKGROUND
ES022008005PHX 1-9
however, the data were subject to all necessary quality assurance procedures. Therefore, the data are useful as a reference in planning future work.
The total metals analyses revealed the following exceedances of R-SRLs in surficial soils for these 11 samples:
• Arsenic levels exceeded the R-SRL of 10 mg/kg at five locations, including four locations in Hayden and one in Winkelman (maximum concentration of 66.8 mg/kg).
• Copper levels exceeded the former R-SRL of 2,800 mg/kg at five locations in Hayden (maximum concentration of 16,900 mg/kg).
• Lead levels exceeded the R-SRL of 400 mg/kg at one location in Hayden and one in Winkelman (maximum concentration of 485 mg/kg).
• Samples from Hayden containing exceedances of R-SRLs were at locations in the vicinity of the public pool and play structures west of and adjacent to the concentrator facility. The sample from Winkelman that contained arsenic above the R-SRL was collected at a culvert near the high school indoor swimming pool. All other samples collected at the Winkelman school area contained arsenic levels below the R-SRL.
The 2004 EPA school and playground sample results reveal that surficial soil contamination is present in areas where public activities are concentrated, particularly in Hayden.
Air Quality Monitoring Data. Historically, both the ASARCO smelter and adjacent Kennecott smelter operations produced significant air emissions. At the ASARCO smelter, there were two primary stacks, including a 300-foot R&R stack (built in 1912) and a 250-foot converter stack (built in 1918). In 1920, the first air controls were installed to electrostatically remove dust from the discharge of the R&R stack. In the mid-1950s, measuring indicated that over 13,000 pounds of copper was discharged out of the two stacks on a daily basis. In 1961, production had increased and additional roaster improvements were made and copper removal was improved to 99.7% efficiency, which translated to a reduction to approximately 3,000 pounds per day of copper discharged through the R&R stack. The Kennecott smelter discharged from a 600-foot stack since the time of construction in 1958, until cessation of operations there in 1982. Since the early 1970s, EPA, State of Arizona (State), and ASARCO have collected ambient air monitoring data for SO2 and particulate matter less than 10 microns in diameter (PM10) at various locations in the Hayden area. Selected PM10 samples have also been analyzed for chemical makeup of the particles. This section provides a brief summary of available air quality monitoring data.
Toxic Release Inventory Data
ASARCO submits annual reports on discharges of toxic chemicals to EPA under the federal Emergency Planning and Community Right-to-Know Act (EPCRA) program, to inform communities and citizens of chemical hazards in their areas. Through EPCRA, Congress mandated that information on toxic chemical releases to the environment be collected into a database called the Toxic Release Inventory (TRI). The ASARCO Hayden operation has been one of the top sources of TRI chemicals in the entire nation. ASARCO also submits annual emissions inventories of regulated air pollutants to ADEQ as a requirement of regulations adopted by the State and EPA under the Clean Air Act. Table 1-1 presents a summary of TRI
1.0 INTRODUCTION AND SITE BACKGROUND
1-10 ES022008005PHX
air emissions, from fugitive and point sources, for the past four years of available data (2003-2006). The following observations are made based on Table 1-1:
1. The total air emissions were about 268 tons in 2003, 102 tons in 2004, 169 tons in 2005, and 192 tons in 2006. The decrease in 2004 is likely attributed to reduced production, which was then increased in 2005 with a further increase in 2006.
2. Sulfuric acid emissions (related to SO2 emissions) represented between 60-70% of total emissions over the four-year period.
3. For the period 2003 through 2006, the maximum emission amounts for metals were in order for copper, zinc, lead, and arsenic (however, barium emissions were greater than arsenic emissions in 2005 and 2006).
4. A majority of sulfuric acid is emitted through point sources, while a majority of metals are emitted through fugitive sources (with some consistent exceptions for some metals, including mercury, barium, chromium, and zinc).
Sulfur Dioxide Data
In 1974, an extensive SO2 monitoring network was established with spatial and temporal coverage intended to comprehensively evaluate the ambient impact of smelter emissions. More than 20 stationary and mobile monitoring sites were established throughout the area, with as many as 12 monitors operating concurrently (see Appendix A of the RI Workplan). This ambient SO2 network was developed to identify maximum ambient impact areas using diffusion modeling, monitored wind direction, citizen observations, and ambient SO2 monitoring.
Installation of additional meteorological instrumentation at the network sites to measure wind speed and direction, air temperature, and humidity parameters, helped to further define airflow and pollutant transport in the region. Use of mobile monitors allowed evaluation and verification of ambient SO2 concentrations over a greater area. Numerous sites were monitored and subsequently relocated under the direction of State meteorologists when no significant impacts were observed. All monitoring for SO2 was reportedly performed with guidance and dispersion modeling analysis from ADEQ.
Following ASARCO’s compliance with SO2 emissions limits and based on continuous control technology, the number of permanent monitors was gradually reduced to the current network of six. The monitors were removed or relocated only if no ambient SO2 violations were recorded, no SO2 curtailment was needed due to data recorded at that monitor, or if the new site was shown to be more representative of the ambient air quality of the area. This iterative process of location of monitors has resulted in the current remaining six sites, which are all high impact monitoring sites found to be representative of air quality of the area. These monitoring sites decisions were made jointly by ADEQ and ASARCO in accordance with EPA guidance. Table A-8 of the RI Workplan summarizes SO2 monitoring data for a five-year period (1999-2003) for each of the six currently operating monitoring stations (Air Quality Annual Report, ADEQ, 2000, 2001, 2002, 2003, and 2004). The NAAQS for SO2 are 80 μg/m3, 365 μg/m3, and 1,300 μg/m3 on an annual, 24-hour, and 3-hour

1.0 INTRODUCTION AND SITE BACKGROUND
ES022008005PHX 1-11
average basis, respectively. There have been no violations of the NAAQS for SO2 in the Hayden area since 1995.
Particulate Matter Data
Particulate matter (PM) is regulated by two separate Title V Permits for the Hayden concentrator and Hayden smelter facilities. The primary PM emission points/sources at the Hayden concentrator consist of the track hopper (Wet Scrubber Stack # 3 and #7) , secondary crushing circuit (Wet Scrubber #4 Stack), tertiary crushing circuit (Wet Scrubber Stack #1, #2, #5, #6, and Fine Ore Scrubber Stacks), and miscellaneous areas (lime silo baghouse, Tailings Impoundments AB/BC and D, unpaved roads, and open areas). The primary PM emission points/sources at the Hayden smelter consist of the main stack center (flash furnace and converter primary hoods) main stack annulus (fluid bed dryers, flash furnace ventilation hoods, converter secondary vent gas hood emissions), revert crushing system, anode furnaces, acid plant, material storage, and fugitive emissions from the flash furnaces and converters. A portion of the PM emissions at the smelter facility occur through the center and annulus of the 1,000-foot stack. ADEQ has operated a PM10 sampler at the Hayden Jail monitoring site since February 1985, and has operated a Total Suspended Particulate (TSP) monitor at the same location for preceding years. The NAAQS for PM10 are 50 μg/m3 and 150 μg/m3 on an annual arithmetic mean and 24-hour average basis, respectively, and some exceedances were noted.
Metals Data
ADEQ has collected PM samples at the Hayden Jail site using an Anderson Dichot sampler. The samples were analyzed by x-ray fluorescence (XRF) method at Desert Research Institute (DRI) laboratory in Reno, NV. The Dichot sampler was equipped with two filters to measure the fine and coarse fractions of particulate matter—particulate matter less than 2.5 microns in diameter (PM2.5) and PM10. The data were converted using 24-hour duration of sample and a standard 16.7 liter/minute flow rate to calculate concentrations of metals in ambient air.
Table 1-2 shows a comparison of ambient air metals concentrations in the ADEQ PM10 fraction samples with the EPA Region IX Preliminary Remediation Goals (PRGs) for ambient air. The table compares the annual average concentration over the period 1999-2001. This time period was selected to follow completion of several ASARCO air emission control projects (including anode furnace steam injection in 1994, converter secondary hoods baghouse in 1996, and furnace wet gas handling with a venturi scrubber in 1998), and to coincide with the last years for which ADEQ data were collected. The metals results from the ADEQ Hayden Jail site are compared with the PRG for each metal. The comparison shows that annual average concentrations during this three-year period exceeded the PRGs for arsenic, cadmium, and chromium. There is no PRG for copper or lead, although the quarterly NAAQS for lead of 1.5 μg/m3 was used for comparison and was not exceeded. The EPA has proposed to lower the lead NAAQS to within the range of 0.10 to 0.30 μg/m3 (EPA, 2008b - Federal Register, May 20, 2008), and several Hayden Jail values over this period were within this range.
Currently, ADEQ continues to monitor for SO2 and once every six days for PM10 at the Hayden Jail monitor. The PM10 filter samples are no longer submitted for analysis of metals.
1.0 INTRODUCTION AND SITE BACKGROUND
1-12 ES022008005PHX
1.2.5.1
1.2.5 Regulatory Framework The ASARCO facilities have air, water, and solid waste permits, which regulate potential environmental contamination. Both EPA and ADEQ have been involved with this Site from a regulatory standpoint. The Site was identified as a potential hazardous waste site and entered into the Comprehensive Environmental Response, Compensation, and Liability Information System (CERCLIS) on December 1, 1979, and was given EPA ID No. AZD008397127.
Facility Permits Air - ASARCO maintains two ADEQ Title V Air Quality Class I (Major Source) operating permits for its Hayden operations: one for the concentrator (Permit Number M070399P1-99) and one for the smelter (Permit Number 1000042). In 2007, ADEQ initiated review of the two permits for the purpose of renewal, and subsequently determined that the permits should be combined into a single Title V permit. The combined Title V permit will reportedly be available for EPA review and public comment in early 2008 (ADEQ, 2007). The existing permit regulates PM10 and SO2 and does not directly control levels of arsenic, lead, copper, and chromium released into the air.
Water - ASARCO has filed two Aquifer Protection Permit (APP) Applications with ADEQ’s Water Permits Section. The first application for an APP was submitted to ADEQ in 1992. A second application was filed in 1995 due to deficiencies noted in the 1992 application. To date, the 1995 application is still under ADEQ review. According to the ADEQ Mining Unit Manager, the application is currently in the technical review process. Until the APP Application is approved, it is ADEQ’s understanding that ASARCO will continue to operate under the guidelines of the Notice of Disposal (NOD) (ADEQ, 2004).
Waste - The Site is listed as a “Large Quantity Generator” in the Alternative RCRA Information for States (ARIS) database under EPA ID No. AZD008397127. ASARCO is required to report its waste volumes under the TRI program.
1.2.5.2 Violations Air - ADEQ has performed numerous air inspections at the Site. As a result of these inspections, numerous Notice of Violations (NOV) have been issued. Many of the NOVs were issued to ASARCO for observed emissions from the smelter stack with opacities greater than 20%. An NOV was also issued in March 1991 for an observed release of dust from Tailings Impoundment AB/BC with opacity of 78% (ADEQ, 2003). In September 2005, ADEQ air quality inspectors discovered that loose tailing dust had collected throughout the mine’s tailing pond area and witnessed dust emissions from the ASARCO facility, a violation of ASARCO’s air quality permit. ADEQ issued an NOV to ASARCO in October 2005, which required the company to keep the tailing pond area damp or encrusted to minimize dust emissions. Under the NOV, ASARCO has applied a dust suppressant designed to control future dust problems at the Site. In 2007, ASARCO paid a penalty of $77,500 to resolve the dust violations at the facility.
Water - In 1985, a NOD for discharging wastewater was filed with ADHS, the predecessor of ADEQ. The NOD outlined all wastewater discharges from ASARCO’s Hayden operations. The NOD includes untreated domestic sewage, along with the tailings slurry
1.0 INTRODUCTION AND SITE BACKGROUND
ES022008005PHX 1-13
from the concentrator operations, which is discharged on top of the tailings impoundments. ASARCO was also discharging wastewater sludge from the treatment of the smelter scrubber blow-down to a lined impoundment (CP-1) south of the smelter.
Twenty-seven (27) spill incidents have been documented at the Site from October 1990 to September 2002, according to the National Response Center database. The spilled materials included sulfuric acid, arsenic acid, arsenic compounds, cadmium compounds, and lead compounds. According to ADEQ’s Hazardous Materials Incident Logbook, no emergency response actions occurred (ADEQ, 2004).
On April 30, 1991, ADEQ’s inspection of ASARCO’s Slag Tunnel Wastewater System identified treated domestic wastewater being discharged to an unlined impoundment. This impoundment was formerly known as Louie’s Lagoon, and is now lined and known as containment pond CP-1. Analytical data were not available during the inspection since the treatment plant was not required to perform any discharge monitoring. Because of excess rainfall that filled a lined surface impoundment, which received process wastewater and sludge, ASARCO transferred over 1,000,000 gallons of water from the lined surface impoundment to the unlined surface impoundment (Louie’s Lagoon) in December 1990 and January 1991. Analysis of the wastewater sludge from the lined containment pond CP-1, submitted with the NOD, indicated concentrations of arsenic, barium, cadmium, mercury, selenium, and fluorine above their respective standards. Analysis of the transferred water, provided by ASARCO, indicated concentrations of arsenic, cadmium, fluorine, copper, and zinc above their respective standards (ADEQ, 2003).
On January 5, 2004, a NOV was issued to ASARCO for failure to submit an Arizona Pollution Discharge Elimination System (AZPDES) permit application for storm water discharges from tailings facilities along the Gila River.
In February 2007, a pipeline that pumps mine tailings to one of the tailings impoundments ruptured and discharged approximately 16,000 pounds of mine tailings into the Gila River flood plain near the facility and approximately 2,000 pounds of tailings directly into the Gila River. ASARCO manually removed the tailings discharged into the Gila River flood plain; however, the tailings discharged into the river were carried downstream and could not be removed. In May 2007, ADEQ issued a NOV that requires ASARCO to take action to avoid another pipeline rupture, and to advise ADEQ within 90 days of the action taken.
Waste - On November 1, 1994, an inspection was conducted at the Site by the Hazardous Waste Inspections and Compliance Unit of ADEQ. Based on the inspection, a violation for “Generator Waste Determination” was issued to ASARCO. On August 14, 2000, an inspection was conducted at the Site by EPA. Based on the inspection, a violation for “Pre-transport Requirements” was issued to ASARCO (ADEQ, 2003).
1.2.5.3 Soil Removal Agreement Under an agreement between EPA and ASARCO signed in March 2008, ASARCO performed and paid for removal of contaminated soil at 15 privately-owned residential parcels in Hayden and Winkelman. As described in the EPA-issued Pollution Report, this cleanup work was conducted with oversight from EPA, and took place between late March and early June 2008 (EPA, 2008a). EPA reviewed the residential soil sample data from the RI (as presented in Section 4.1 of this report) and decided to promptly address those residential
1.0 INTRODUCTION AND SITE BACKGROUND
1-14 ES022008005PHX
1.2.5.4
yards where the highest concentrations of arsenic, copper, and lead were found. Yards where soil contamination levels exceeded 200 mg/kg of arsenic, 2,000 mg/kg of lead, or 20,000 mg/kg of copper were selected for cleanup. Based on these soil concentration levels, the following 14 properties in Hayden were selected by EPA and then cleaned up by ASARCO:
15. 101-07-035AS 16. 101-07-040 17. 101-07-066 18. 101-07-089Q 19. 101-07-089S 20. 101-07-089T 21. 101-07-091 22. 101-09-004 23. 101-09-036 24. 101-09-039 25. 101-09-070 26. 101-09-077 27. 101-09-088 28. 101-09-140
In Winkelman, one residential yard (101-12-149) was selected by EPA and then cleaned up by ASARCO.
The soil cleanup activities consisted of removing the top 1-2 feet of soil, replacing it with clean fill, re-grading the area, and adding a stabilizing sod cover. The interiors of some of the homes were also addressed.
Administrative Settlement Agreement and Order on Consent On April 15, 2008, EPA, U.S. Department of Justice (DOJ), ADEQ and ASARCO signed a second agreement to perform additional investigation and cleanup work in the towns of Hayden and Winkelman. The agreement, referred to as an Administrative Settlement Agreement and Order on Consent (AOC), is a legal document that describes the investigation and cleanup responsibilities of ASARCO. Following a public comment period, the AOC was approved and became effective on May 27, 2008. Key features of the AOC include:
• Additional Sampling of Residential Yards. All remaining yards of occupied residences in Hayden and portions of Winkelman that were not sampled during this Phase I RI will be sampled by ASARCO.
• Additional Cleanup of Residential Yards. Yards will be cleaned up at all residences where soil concentration levels exceed 24.3 mg/kg for arsenic, 400 mg/kg for lead, and 9,300 mg/kg for copper.
• RI/FS and Cleanup of ASARCO Property. An RI/FS will be completed to identify releases of any hazardous materials, evaluate cleanup methods, and conduct cleanup on and in the vicinity of ASARCO-owned property. The RI/FS will include additional sampling of soils, air, groundwater, and surface water. Additional human
1.0 INTRODUCTION AND SITE BACKGROUND
ES022008005PHX 1-15
health/ecological risk assessment and reporting will also be required as part of this process.
• Funding of Technical Assistance Plan for the Community. A Technical Assistance Plan (TAP) will be funded by ASARCO and will provide independent technical expertise to help the community understand the cleanup documents and proposed cleanup actions. The environmental expert will review Site documents, explain them to the community, and help residents frame their issues and concerns back to EPA and ASARCO.
• Establish Financial Assurance. In order to ensure the completion of work called for in the AOC, ASARCO is required to establish and maintain a Performance Guarantee, such as a trust fund, in the amount of $15,000,000.
Activities called for in the AOC will be initiated within 30 days of the AOC’s effective date.
1.2.6 Chemicals of Concern This section outlines the chemicals that may be of concern to human health and the environment based on existing chemical data collected at the Site, and based on expected chemicals from ongoing copper ore processing activities.
Section 1.2.4 presents a summary of existing chemical data collected at the Site. In addition to copper, soil at the Site contains elevated levels of metals including arsenic, lead, cadmium, chromium, and mercury. Air emissions from the facility include stack (point source), fugitive (nonpoint source), and contain elevated levels of particulate emissions, arsenic, lead, copper, cadmium, and chromium. Onsite stormwater management and containment ponds and offsite tailings impoundments are also part of the operations. Sulfate impacts to groundwater have been documented at other mining properties. In summary, six metals (arsenic, copper, lead, cadmium, chromium, and mercury), as well as sulfate, SO2 and PM, were considered chemicals of concern (COCs) prior to the start of the RI.
1.2.6.1 Chemicals of Potential Concern for Human Health Impacts For human health risk assessments, chemicals of potential concern (COPC) are chemicals that are potentially Site related and for which data are of sufficient quality for use in the quantitative risk assessment (Risk Assessment Guidance for Superfund, Human Health Evaluation Manual, U.S. EPA (EPA, 1989). From the extensive list of COPCs, a smaller list of COCs are then identified and retained for quantitative risk analysis after the COPCs have undergone preliminary screening. These two lists are found on Table 1-3.
As described above, the currently known COPC for the Site includes metals that have been detected in soils, groundwater, and air samples, as well as SO2 and PM10. The full list of metal COPCs includes all the 14 metals in the TRI report, for reporting year 2003, submitted by ASARCO to EPA (EPA, 2005). Additionally, radionuclides have been added to the COPC list since they are often associated with mining and ore processing activities and may be of concern in the direct vicinity of the smelter facility. Uranium, thorium, and radium are radionuclides associated with soils, while gross alpha and beta radioactivity, as well as uranium, thorium, and radium can be found in groundwater. Because of industrial process operations at the concentrator and smelter facilities, volatile organic compounds (VOCs)
1.0 INTRODUCTION AND SITE BACKGROUND
1-16 ES022008005PHX
1.2.6.2
and semivolatile organic compounds (SVOCs) are also considered COPC. A preliminary list of the COPC described in this section is included in Table 1-3.
The Mine Safety and Health Administration (MSHA) normally provides oversight of potential occupational exposures and potential health risks to the ASARCO work force by Site releases, and therefore, these exposure scenarios are not considered as part of the RI or risk assessment process.
Human health impacts by exposure to these COPC can occur through inhalation, incidental ingestion, and dermal contact with those chemicals.
Chemicals of Potential Ecological Concern Chemicals of potential ecological concern (COPEC) are those chemicals present at the Site in concentrations that may exceed toxicity thresholds for plants and animals (ecological receptors). These chemicals are identified by the evaluation of known Site practices or analytical results. The ore processing operations at the Site have resulted in large accumulations of tailings, which have been deposited adjacent to the Gila River near the confluence with the San Pedro River. In 1993, flood waters washed approximately 292,000 tons of the tailings into the Gila River, potentially impacting surface waters and sediment in the downstream areas (ADEQ, 2003). Air emissions from the smelting process have been deposited in surface soils and water in the terrestrial and aquatic areas around the plant.
Existing data indicates that arsenic and copper, and to a lesser extent, cadmium, lead, mercury, and zinc are at levels of potential concern. Therefore, all of these analytes are considered COPEC in soil, sediment, and surface water.
At low levels, most organisms are able to accumulate and regulate intake of metals that serve as nutrients (i.e., chromium, copper, selenium, and zinc). However, these metals generally become toxic at certain levels. The mechanisms of ecotoxicity and environmental fate and transport information for each of the COPEC are presented in Appendix A of the RI Work Plan. Physical and chemical characteristics of, as well as interactions between, the medium and the COPEC are also important in understanding the potential environmental impacts. For example, organic carbon in soil and sediment often binds to metals, especially under alkaline conditions, and reduces their bioavailability to potential ecological receptors, thus reducing exposure.
1.3 Site Conceptual Model The Conceptual Site Model (CSM) is a visual method of showing sources of contamination, release mechanisms, exposure pathways, and potential receptors associated with a site. Typically, separate CSMs are developed for human and ecological impacts. These CSMs are presented in Figures 1-6 and 1-7 for human and ecological exposures, respectively.
1.3.1 Site Conceptual Model—Human Health Impacts For potential human impacts (as depicted in Figure 1-6), releases from current and historic Hayden smelters and concentrator operations are the primary sources of impacts from the Site. Together, the smelters and concentrator are the source of solid waste releases to soil,
1.0 INTRODUCTION AND SITE BACKGROUND
ES022008005PHX 1-17
fugitive and stack emissions to air, and process wastewater releases. The primary release mechanisms are spills and releases from onsite operations, and fugitive and stack air emissions releases. The dispersion transport media would include soil, groundwater, surface water, and wind. Potential human exposure routes would include soil (sediment) and dust ingestion, dermal contact, inhalation of particulates and vapors (if any) both indoors and outdoors, tap water ingestion, and ingestion of garden vegetables and sport fish caught in the Gila River. Currently, potential applicable human receptors would be those of Hayden and Winkelman including, adult and child residents, school children in schoolyards, pools, and parks, trespassers on tailings piles and other industrial facilities, and anglers in the nearby Gila River and San Pedro River, as appropriate.
For human receptors, the major environmental media associated with offsite exposures to Site-related releases are expected to be soil and air, which were the major focus in RI sampling for the Site. Groundwater, drinking water, and sediments were expected to be relatively minor sources of risks and hazards, and received a comparatively lower level of RI sampling.
1.3.2 Site Conceptual Model—Ecological Impacts For potential ecological impacts (as depicted on Figure 1-7), the primary sources are similar to those described above; namely, current or historic activities of the smelter and concentrator. Primary release mechanisms include air emissions from the smelter stacks and other process locations, as well as solid wastes (tailings) and wastewater associated with the processing of the copper ore. Release mechanisms include aerial deposition of stack emissions, discharge/runoff from the tailings impoundments to the Gila River or to adjacent soils, wind erosion, leaching to groundwater, and surface discharge from groundwater. Complete exposure pathways from contaminated surface soil, sediment, surface water (including ponded water located on top of the tailings impoundments), biota, and possibly groundwater, to ecological receptors exist at the Site.
Soil, sediment, and surface water are the primary environmental media for ecological exposures; therefore, the sampling strategy included samples of these media within areas of ecological habitat. Since shallow groundwater discharges directly to surface water, groundwater sampling was also a focus of the RI.

ES022008005PHX 2-1
SECTION 2
Site Characteristics
This section presents the overall Site characteristics, including demographics, topography, hydrology, meteorology, and ecological habitat.
2.1 Demographics and Land Use Hayden has a population of approximately 840 residents (Arizona Department of Commerce (ADOC, 2006). ASARCO operations including the crusher, concentrator, smelter, and tailings impoundments surround the Hayden community on the northern, southern, and eastern edges of town. Residential areas are bounded on the west edge of town by the San Pedro Wash and are bisected by the Kennecott Wash. Public areas including a library, playground, and swimming pool area are located adjacent to and west of ASARCO’s concentrator facilities. Currently, based on a 2007 reconnaissance estimate conducted as part of this RI, there are a total of 383 structures in the town of Hayden. Of this total, 301 of the structures are occupied habitable homes, 52 are uninhabitable homes, and 30 are government or commercial structures.
Winkelman has a population of approximately 435 people (ADOC, 2006). It is primarily a residential area, with a school complex for the towns of Hayden and Winkelman on the northern edge of town, commercial development along State Route 177, and a community park along the Gila River on the east edge of town. Winkelman has a total of 215 structures in the town of Winkelman, including 156 homes, of which 146 homes are habitable and 10 are uninhabitable. There are also 59 government and commercial structures in Winkelman.
Table 2-1 provides a summary of selected demographics information for Hayden and Winkelman.
2.2 Site Topography and Drainage The study area is located near the western edge of the Mexican Highland portion of the Basin and Range physiographic province. This province is characterized by north-northwest trending mountain ranges separated by sediment-filled valleys derived from erosion of the adjacent ranges. Major fault systems typically parallel the length of the uplifted mountain blocks.
Hayden is located on the southwestern flank of the Dripping Spring Mountains, near the confluence of the Gila and San Pedro Rivers. The Tortilla Mountains, which form the western border of the Gila River Valley, are located several miles to the west of Hayden. Relief is moderately gentle on the west side of the study area, transitioning to moderately steep slopes further west in the Tortilla Mountains. Elevation ranges from 3,947 feet above mean sea level (msl) at Horse Hills in the Tortilla Mountains to approximately 1,900 feet msl along the Gila River in the northwestern corner of the Site. The highest point in the area is Tornado Peak (located approximately three miles north of Hayden) at 4,484 feet msl. A
2.0 SITE CHARACTERISTICS
2-2 ES022008005PHX
gently sloping alluvial surface slopes northeastward from the Tortilla Mountains to the Gila and San Pedro Rivers. The area east of the Gila and San Pedro Rivers is characterized by a dissected upland area that drains to the west.
The Hayden concentrator and smelter are located in Hayden near the base of the Dripping Spring Mountains, adjacent to and elevated above the flood plain of the Gila River. Elevations at the Site range from approximately 2,000 feet near State Route 177, to approximately 2,300 feet near the process water tank located north of the former Kennecott smelter area (Figure 2-1). Both the ASARCO main concentrator area (concentrator, mill building, fine ore bins, and thickener tanks) and the smelter operations have elevations of approximately 2,160 feet, while the former Kennecott smelter area has an elevation of approximately 2,180 feet. The San Pedro neighborhood located on the western edge of Hayden ranges from 2,040 feet at the southern end to 2,140 feet at the northern end. The Kennecott Wash (and former tailings impoundment areas) located east of the San Pedro neighborhood range in elevation from 2,010 feet at the southern end to 2,120 feet at the northern edge. The central neighborhood in Hayden (bounded between the Kennecott Wash to the west, and Power House Wash to the east) ranges in elevation from 2,040 feet to 2,100 feet.
The drainage conditions in the Hayden operations area on the north side of the Gila River are complex (Figure 2-1). Review of topographic maps and historical aerial photographs of the Site (EPA, 2004a) indicate several drainages located north of the Site. Prior to industrial development in the area, these drainages would continue past the location of current ASARCO operations and link with prominent drainages in Hayden. These prominent drainages (San Pedro Wash, Kennecott Wash, and Power House Wash), and large portions of the town of Hayden are positioned down-gradient and at lower elevations relative to most Site operations. Hence, under historical flow conditions, residential areas and drainages south of the former Kennecott smelter and west to southwest of the concentrator (particularly in the central portion of Hayden) would have been subject to runoff in direct contact with the Site.
Currently at the Site, there are buildings, storage areas, roads, and a complex system of man-made channels, pipes, surface impoundments, and dikes to control surface water flows in the area. ASARCO personnel indicate that all storm water runoff from the Hayden concentrator and part of the smelter operations area is currently captured by this system before it can enter the Gila River, with the exception of runoff from the downgradient/ downstream edge of the berm/dike around Tailings Impoundment AB/BC (ASARCO, January 2005). These areas are captured in the emergency overflow ponds (Figure 1-3). Runoff from portions of the smelter operations area is contained in impoundments below the operating slag piles, where it is infiltrated into the subsurface. Past discharges of flow in this area would have flowed directly into the Gila River.
The town of Winkelman is located southeast of Hayden and is bounded to the north by the ASARCO active smelter operations and to the south and east by the Gila River. The Winkelman School Complex is located approximately 1,300 feet directly south from the slag dump and oxygen plant areas of the active ASARCO smelter. The topography of Winkelman is relatively flat, with a gradual decrease in elevation toward the Gila River flood plain. The southernmost part of Winkelman is located within the flood plain of the
2.0 SITE CHARACTERISTICS
ES022008005PHX 2-3
Gila River. In 1926, one of the worst floods in local history was recorded; it destroyed most of the farm land and flooded lower Winkelman (also known as Winkelman Flats). There were other large flood events in 1983 and again in 1993.
The prominent Tailings Impoundment AB/BC is bounded on the north by the Copper Basin Railway tracks and on the south by the Gila River flood plain. Tailings Impoundment AB/BC extends west to the confluence of Keystone Canyon Wash with the Gila River as outlined in the 1992 APP Application Phase I, ASARCO, Inc. – Ray Complex, Gila and Pinal Counties, AZ; SHB Earth & Environment, Inc. (SHB, 1992), and the eastern boundary is adjoined by the Hayden Golf Club (Figure 1-3). The town of Hayden is located near the northeastern edge of Tailings Impoundment AB/BC (residential neighborhoods are approximately 750 feet to the northeast), and Winkelman is located approximately 0.6 miles east of Tailings Impoundment AB/BC.
The area south of the Gila River includes Tailings Impoundment D and the surrounding Tortilla Mountains. Hayden and Winkelman are located roughly 1.5 miles to the northeast of Tailings Impoundment D.
2.3 Geology The geologic units exposed in the study area consist of a basement complex of older Precambrian through Paleozoic sedimentary rocks and minor igneous intrusives. Older Quaternary deposits such as alluvial fans and younger Quaternary alluvium are present along stream and river channels as outlined in the 1994 APP Application Phase III, ASARCO, Inc. – Ray Complex, Gila and Pinal Counties, AZ; SHB-AGRA Earth & Environment, Inc. (SHB, 1994). At the Site and study area, the dominant feature is the alluvial basin formed by the Gila River and San Pedro River confluence, which generally trends in a southeast to northwest direction. On the Hayden side of this basin, adjacent to the Dripping Spring Mountains, are found Tertiary bedrock formations with locally variably amounts of Holocene alluvium/colluvium.
The following geologic units were identified for the study area based on a map prepared by SHB (1992). Figure 2-2 depicts the geologic units in the study area. Detailed descriptions of these units are described below, listed from youngest to oldest. The geochemistry of these units is described in Section 4.1.1.
1. Fill Material (Fd). The fill material consists primarily of mine tailings, and includes Tailings Impoundments AB/BC and D, and older tailings deposits in lower Kennecott Wash and west of Power House Wash.
2. Quaternary Alluvium (Qal). The Quaternary alluvium consists of unconsolidated silt, sand and gravel along washes and river channels (Gila River, San Pedro River, San Pedro Wash, and Power House Wash).
3. Older Quaternary Deposits (Qo). The older Quaternary deposits are present along stream terraces and alluvial fans, including nearly all of the Winkelman residential area and other terrace areas (especially adjacent to the west side of Tailings Impoundment D). Small areas of Hayden are located on this unit.
2.0 SITE CHARACTERISTICS
2-4 ES022008005PHX
4. Tertiary Sediments (Ts). The Tertiary sediments consist primarily of tuffs and conglomerates; these are present in all of the Hayden residential areas located above the washes, and extending into the far northwestern portion of Winkelman. The active concentrator, smelter, and most of the former Kennecott smelter area are also located on this unit.
5. Cretaceous/Tertiary Intrusives and Volcanics (KTi). These intrusive and volcanic rock formations are located in the higher elevations north and east of Hayden, and adjacent to the reaches of the Gila River upstream of Winkelman.
6. Paleozoic Sediments (Ps). The Paleozoic sediments consist of limestone located primarily in a northeast to southwest trending band in the upland area north of Hayden, and adjacent to the Gila River upstream of Winkelman.
2.4 Hydrology 2.4.1 Ground Water Flow Conditions The Site is located within the Upper San Pedro groundwater basin. The major components of this system are the water bearing sands and gravels of the Gila River and San Pedro River flood plains that are recharged from groundwater flows within smaller tributary stream alluvium. Bedrock seepage may also contribute a small amount of inflow in certain areas. Water level measurements in wells located along the San Pedro and Gila Rivers indicate that the depth to groundwater is generally within tens of feet below the channel elevation (SHB, 1994).
The locations of Site monitoring wells and production wells are shown on Figure 2-3. Based on groundwater elevation measurements in February and October 2006, groundwater elevation contour maps were prepared (Figures 2-4 and 2-5, respectively). These figures indicate that the regional groundwater flow direction within Hayden and Winkelman is in a southerly direction towards the Hayden wellfield and Gila River/San Pedro River confluence. The groundwater flow gradient is relatively high in the Hayden area (as indicated by more closely spaced contours), and the gradient is considerably lower in the Gila River flood plain (more widely spaced contours). The groundwater flow direction between the two tailings impoundments is generally in a northwesterly direction, consistent with the surface water flow direction of the Gila River. The tailings impoundments do not appear to be causing large mounding of the water table, but the relatively low gradient in the vicinity is likely the result of recharge from Gila River surface water losses and tailings impoundments drain down.
Local groundwater systems at the Site can be largely divided into three systems:
• Gila River/San Pedro River Alluvial Aquifer: This uppermost aquifer is composed of approximately the top 100 feet of alluvial sands and gravels (Qal geologic unit) within the Gila River flood plain. Existing monitoring wells H-1, H-2A, H-3, H-4, H-5, H-6, H-10, and H-11, most of the ARU series monitoring wells, S-4A, new monitoring well GW-03, and all Hayden and Winkelman production wells, are screened within this aquifer. As would be expected, fluctuations in water levels within this aquifer are largely controlled by fluctuations in the river stage. Yields from production wells
2.0 SITE CHARACTERISTICS
ES022008005PHX 2-5
completed in this aquifer are generally large (200 to 1,200 gallons per minute [gpm]), and the aquifer comprises the area’s major water supply source. Both the Hayden and Winkelman wellfields are completed in this aquifer. The hydraulic conductivity for this aquifer, as obtained from APP field tests (SHB, 1994), is approximately 10-1 centimeters per second (cm/sec).
• Bedrock Aquifer: Wells completed in bedrock are located in the Ts formation (also referred to as the Big Dome Formation, [SHB, 1992]). These bedrock aquifer wells include existing monitoring wells H-7, H-8, H-9, LC-1, and SM-2 (bottom portion of screened interval, or 70-91.5 feet bgs), and new monitoring wells GW-01(R), GW-02 (bottom portion of screened interval, or 28-31 feet bgs), and GW-06. The hydraulic conductivity for this aquifer, as obtained from APP field tests (SHB, 1994), is considerably lower than the alluvial aquifer, at approximately 10-5 cm/sec.
• Wash Alluvial Aquifers: These disconnected aquifers are associated with the older alluvium/colluvium (Qo unit) found within upper reaches of the local Site drainages. While several wells are located within the boundaries of the washes, only the upper screened intervals of existing monitoring well SM-2 (61.5-70 feet bgs) and new monitoring well GW-02 (11-28 feet bgs) are screened within the wash alluvial aquifer. Borings completed during prior Site studies indicate that these aquifers may be dry for most of the time, and flow only when there is significant precipitation or other recharge (i.e., ponds or storage basins). The limited field tests of hydraulic conductivity (SHB, 1994) performed on wash alluvial aquifer wells yield an approximate value of 10-4cm/sec.
2.4.2 Water Supply 2.4.2.1 Winkelman Water supply The Winkelman wellfield is located in the Winkelman Flats Public Park on the east side of State Route 77, and is operated by the Arizona Water Company (AWC), a private utility. The AWC provided the following details on the wellfield, which is contained within a fenced enclosure at the north-end of the park and as shown on Figure 1-3:
• Well #3 is the northernmost well and is also known as GWF-618;
• Well #4 is the southernmost well and has a discharge water quality characterized by high turbidity (dirt and rust), and AWC at the time was evaluating treatment alternatives such as a flush-out system;
• Well #2 (westernmost well) is no longer in service; and
• AWC services 192 connections in Winkelman, with several connections in Hayden. The wells are run daily and alternate in pumping operation. Water pumped from the wellfield is directed to a 100,000-gallon reservoir on the hillside located west of the wellfield. AWC also conducts quarterly sampling of the wells for metals, VOCs, and SVOCs, and conducts complimentary residential tap sampling for lead and copper.
2.0 SITE CHARACTERISTICS
2-6 ES022008005PHX
2.4.2.2 Hayden Water Supply The Hayden wellfield is located in the Gila River flood plain, east of Tailings Impoundment AB/BC, and is operated by ASARCO. The following details are available on the Hayden wellfield (ASARCO, January 2005a) and shown on Figure 1-3:
• Nineteen (19) production wells are located in the main wellfield, although not all wells are operational at all times;
• Most of the production wells have taps for collection of water quality samples;
• Two additional production wells are located at PZ Ranch about eight miles south of Hayden;
• The smelter also uses two production wells at Robinson Ranch, located about two miles south of Hayden;
• The main freshwater pump house is located south of State Route 177, collects water from the various production wells via manifolding, and pumps water to three end users;
• Water for Hayden residential use is pumped to a large, rectangular, concrete-lined reservoir on the hillside near the active smelter (the exact number of connections is uncertain), while another tank provides storage for ASARCO plant use; and
• Water for the Ray Mine operations is pumped using two large pumps from a station located near State Route 177.
ASARCO provides water free of charge to the residents of Hayden. Wastewater from Hayden residents is mixed with the Site tailings water (100:1 dilution), and is directed to the tailings impoundments. However, the process of mixing wastewater with process water is under review by ADEQ, and Hayden plans to begin delivering wastewater to the Winkelman Wastewater Treatment Plant (WWTP). The WWTP will receive improvements, but the improvement plans and schedule have not been confirmed.
2.4.3 Surface Water The Site is located in the vicinity of two main rivers, the Gila River and the San Pedro River. The Gila River flows southwestward from the San Carlos Reservoir (created by the Coolidge Dam, about 30 miles upstream, which was completed in 1928) through the Mescal Mountains and southern portion of the Dripping Spring Mountains, turns northwestward at Hayden, and flows through the valley between the Dripping Spring Mountains and the Tortilla Mountains. The San Pedro River flows northwestward from southeast Arizona and Mexico, and empties into the Gila River approximately one-half mile southeast of Hayden. This area is referred to as the Middle Gila Watershed as provided by the Arizona Department of Water Resources (ADWR, 2005).
The area north and west of the Gila River is drained by a series of intermittent streams that are unnamed on U.S. Geological Survey (USGS) topographic quadrangle maps. The boundaries of the watershed, in which the north Hayden area is situated, were delineated using USGS 7-½ minute topographic quadrangle maps for Hayden and Winkelman (SHB, 1992). The watershed area of the Site was determined to be two and one-half square miles.
2.0 SITE CHARACTERISTICS
ES022008005PHX 2-7
USGS stream flow records are available for gauges on the Gila River above and below Coolidge Dam and at Kelvin (about 10 miles downstream from the confluence of the Gila and San Pedro Rivers). Flows in this reach of the Gila River are largely controlled by dam releases. Due to the relative contribution of the Gila River flows between Tailings Impoundments AB/BC and D, the flow region of primary interest with respect to possible environmental impacts is downstream of the confluence with the San Pedro River. The three highest historical high flood crests for the area occurred in 1993, 1932, and 1997.
Storm water in the smelter vicinity drains primarily to CP-1 (formerly known as Louie’s Lagoon and also known as “run-on and containment pond,” Figure 1-3). CP-1 is a detention pond, which collects runoff from storm drains, and blow-down (process water discharge) from the anode cooling tower, treated process effluent from various treatment plants, process machinery cooling water, and air conditioner and swamp cooler water. CP-1 was originally unlined. Excess water from Louie’s Lagoon was pumped to the three Terrace Ponds, the seven North Ponds, and Wimpy’s New Pond located further to the north. However, this practice was discontinued when CP-1 was constructed and the sediments from the upper ponds were removed (ASARCO, 2005b). All of these ponds receive storm runoff. A concrete lined sump is located at the southwest corner of CP-1.
There are reclaim ponds east of Tailings Impoundment AB/BC, south of Hayden. These reclaim ponds receive decant water from tailings ponds located on top of the tailings impoundments (ADEQ, 2003), and this water is recycled in concentrator process operations.
Unlined depressions that collect storm water are located downstream of the active ASARCO and former Kennecott smelter area slag piles. At the ASARCO slag pile, these include East Storm Water Collection Area No. 1 (which collected mainly storm water runoff), and East Storm Water Collection Area No. 2 (which collects overflow from No. 1 and is normally dry.) The unlined depression downstream (south) of the former Kennecott smelter area slag pile collects runoff from the slag pile, lime plant, and most of the former smelter area.
In 1993, a breach in the southern portion of Tailings Impoundment AB/BC caused by a flood event released 292,000 tons of tailings into the Gila River. This event was observed directly, and samples were collected as far as 11 miles downstream of the tailings impoundments. Sediment samples collected following this discharge along the Gila River indicated that copper and zinc concentrations in the discharged sediment were elevated (ADEQ, 2003).
2.5 Meteorology and Wind Based on general climatological information (ADOC, 2007), Hayden has an annual average precipitation of 13.9 inches and temperatures ranging from a low of 30ºF in winter to a high of 103ºF in summer. The annual average low temperature is 46ºF, and the annual average high temperature is 84ºF. Precipitation occurs primarily during two periods including winter (December to March) and summer/fall (July to October), with the most precipitation occurring in July and August.
Wind patterns can be important in the evaluation of overall air quality. To evaluate wind patterns in the study area, wind roses were generated based on data provided by ASARCO for three air monitoring stations (Montgomery Ranch, Hayden Junction, and Globe
2.0 SITE CHARACTERISTICS
2-8 ES022008005PHX
Highway) over the period January 1, 2000 through December 31, 2004. In addition, wind roses were generated based on data collected from the Hayden and Winkelman air monitoring stations during this RI over the period January 1 through December 31, 2007 (Figure 2-6). Although the monitoring periods for the ASARCO and RI stations do not coincide, the wind roses should provide a general assessment of dominant wind patterns at these locations. The wind roses for the Montgomery Ranch and Hayden Junction stations, located west of Hayden, show a dominant east-west wind pattern which is likely controlled by the orientation of the Gila River valley in this area. The wind rose for the Globe Highway station, located north of Winkelman, shows dominant wind direction from the northeast and southwest, which is also likely controlled by the Gila River valley orientation in the area. The wind roses for the Hayden and Winkelman stations are more variable. The dominant wind directions observed at the Hayden station are from the west and southeast, while the dominant wind directions at the Winkelman station are from the northwest, northeast, and south.
2.6 Ecological Assessment Descriptions of the terrestrial and aquatic systems in the study area are derived from the literature. For example, general information on the terrestrial habitat in the area was obtained from Biotic Communities: Southwestern United States and Northwestern Mexico (Brown, 1994). More Site-specific descriptions of both terrestrial and aquatic (primarily the associated riparian areas) habitats were obtained from ecological studies conducted along the Gila and San Pedro Rivers, ranging from southeast of Winkelman along the San Pedro River to northwest of Hayden past Kelvin along the Gila River. Prior information and data collected during the RI is summarized in the Screening-Level Ecological Risk Assessment for the ASARCO LLC Hayden Plant Site (SLERA), (CH2M HILL, 2008b), which is a companion document to this RI Report. A more detailed summary of the SLERA procedures and findings is presented in Section 5.2.
2.6.1 Terrestrial Systems The Site is located in the northeastern corner of the Sonoran desert scrub biome. This biome represents a large arid region that encompasses most of the Baja California Peninsula, the western half of the State of Sonora, Mexico, and large areas in southeastern California and southwestern Arizona (Brown, 1994). The Sonoran Desert has a bimodal rainfall pattern (rains in winter and summer), which allows it to have a greater structural diversity (i.e., large cacti and succulent plants in most regions and trees, tall shrubs, and succulents along drainages) than any of the other North American deserts. Brown (1994) presents six subdivisions of this biome, and the Site is located in habitat characterized as Arizona Upland. About 90% of this subdivision is on slopes, broken ground, and multi-dissected sloping plains. It is the best watered and least desert-like desert scrub habitat in North America.
Some large mammals include desert mule deer and javelina, whereas smaller mammals in the area consist of species such as the black-tailed jackrabbit, desert cottontail, Arizona pocket mouse, gray fox, and the endemic Harris antelope squirrel (Brown, 1994). Avian species include the Harris’ hawk, white-winged dove, Inca dove, elf owl, cactus wren, curve-billed thrasher, cactus woodpecker, and the Wied’s crested flycatcher (Brown, 1994).
2.0 SITE CHARACTERISTICS
ES022008005PHX 2-9
Reptiles, especially lizards and snakes, are a common component of desert ecosystems. Within the Arizona Upland subdivision, there are many Sonoran and other desert reptiles, including the regal horned lizard, western whiptail, Gila monster, Arizona glossy snake, Arizona coral snake, tiger rattlesnake, and diamondback rattlesnake.
2.6.2 Aquatic Systems The Site is located near the confluence of the Gila and San Pedro Rivers. The Gila River and its tributaries are major lotic waters (i.e., actively moving) in the area and provide vital riparian habitat for wildlife in southeastern Arizona (Environmental Contaminants in Sediment and Fish of Mineral Creek and the Middle Gila River, Arizona [Andrews and King, 1997]). The Banding and Population Genetics of Southwestern Willow Flycatchers in Arizona - 1997 Summary Report (Paxton, et al, 1997) describe both rivers as perennial (i.e., contain water year-round), though it has been known to be dry during low rain periods (ADEQ, 2003). The Gila River is considered a fishery with flow characteristics from 100 cubic feet per second (cfs) to 1,000 cfs (ADEQ, 2003). It should be noted that flow in the Gila River between Coolidge Dam and Ashurst-Hayden Diversion Dam is attributed to releases from the San Carlos Reservoir and to natural flow in the river (ADWR, 2005).
The San Pedro River is of the calcium-biocarbonate type with an annual average concentration of total dissolved solids (TDS) of 676 milligrams per liter (mg/L) near Winkelman. Exceedances of water quality standards for turbidity, metals, bacteria, TDS, and nutrients have been reported along the Gila River (ADWR, 2005).
The riparian area near the confluence of the San Pedro and Gila Rivers consists of mixed exotic and native vegetation. Riparian areas along the confluence of these rivers have been described as varying from monotypic tamarisk (also known as saltcedar) to stands of native Gooding’s willow and Fremont cottonwood,” with average canopy heights between 4 to 15 meters, as described in Southwestern Willow Flycatcher 2003 Survey and Nest Monitoring Reports (Smith, et al, 2004). These riparian areas are surrounded by the Arizona Upland subdivision vegetation as described above, though agricultural fields border the riparian habitat along some portions of the San Pedro River (Andrews and King, 1997).
There are several special status fish species in the Middle Gila River, including the Gila topminnow. Avian species supported by the riparian habitat along the Gila River include the federally endangered southwestern willow flycatcher (Empidonax traillii extimus), as well as other riparian species such as the yellow-billed cuckoo, common snipe, belted kingfisher, and various warblers. The southwestern willow flycatcher and bald eagles (Haliaeetus leucocephalus) have been documented in the Site vicinity (ADEQ, 2003). A list of special status species (including plants, invertebrates, fish, amphibians, reptiles, birds, and mammals), which have been documented in the project area, was provided by the Arizona Game and Fish Department (AGFD, 2006) and is presented in Table 2-2.
A more detailed description of terrestrial and aquatic communities within the Middle Gila watershed is provided in the SLERA.

ES022008005PHX 3-1
SECTION 3
Remedial Investigation Procedures
3.1 Technical Approach and Overview This section presents an overview of the RI approach and field procedures. The field investigations for data needs and uses described in this report were conducted from November 2005 through November 2007. Media sampled in this investigation included non-residential surface soil, residential surface soil, ambient air, indoor dust (attic and living space), groundwater, surface water, in-stream sediment, and stable and unstable riparian sediment. Detailed field procedures are presented in Appendix A, and the RI results are presented in Section 4.
3.2 Remedial Investigation Field Tasks This section presents a brief overview of the field task procedures. Detailed field procedures are included in Appendix A.
3.2.1 Task 1—Site Reconnaissance On September 8 and 29, 2005, CH2M HILL representatives visited the Site to confirm access and sample locations, and generally prepare for RI activities. Minor sample location changes were made prior to completion of the RI Workplan in September 2005.
3.2.2 Task 2—Mobilization and Demobilization Mobilization consisted of coordination and consultation with the CH2M HILL field team to execute the RI sampling activities at the Site. The field activities were conducted concurrently to the extent possible, but separate mobilizations were required for some activities. Field personnel either traveled between Phoenix and Hayden, Arizona (for short duration field activity), or were based in Kearny, Arizona (for extended field activities). Field personnel confirmed final sample locations, and requested utility clearance through ASARCO personnel as needed for onsite work within restricted areas.
3.2.3 Task 3—Field Investigation The field investigation consisted of the following tasks:
• Task 3a – Prepare Site-Specific Plans • Task 3b – Surface Soil Sampling • Task 3c – Surface Water and Sediment Sampling • Task 3d – Groundwater Investigation and Sampling • Task 3e – Air Investigation and Dust Sampling • Task 3f – Ecological Investigation • Task 3g – Geotechnical Evaluation of Tailings Impoundments
Task 3h – Surveying and Mapping •
3.0 REMEDIAL INVESTIGATION PROCEDURES
3-2 ES022008005PHX
vities
nd brief overview of procedures for each
3.2.3.1 Task 3a—Prepare Site-Specific Plans Purpose. T plans was to provide guidelines for
A.
Plan for the ASARCO LLC Hayden Plant Site, November 2005 (HASP).
PP).
lementation of the RI, the following RI Workplan addenda were prepared to
1 - Task 3b Surficial Soil Sampling and Task 3d scope
• ust Sampling, March 24, 2006.
• n Addendum #3, Task 3b - Surficial Soil Sampling, November 21, 2006. This
• rficial Soil
3.2.Purpose. T two main purposes:
better understanding of
• ssment and remedial actions, if necessary.
• Task 3i – Investigation Support Acti
• The following sections present the purpose atask. The detailed field procedures are presented in Appendix A, and results are in Section 4.
he purpose of preparing Site-specific implementation of the RI. All Site-specific plans were reviewed and approved by EPActivities Performed. The following list presents the document title and date of completion. Final Workplan - Remedial Investigation at the ASARCO LLC Hayden Plant Site, September 2005(RI Workplan).
Health and Safety
Final Quality Assurance Project Plan, ASARCO LLC Hayden Plant Site, November 2005 (QA
Human Health Risk Assessment Plan for the ASARCO LLC Hayden Plant Site, May 2006 (HHRAP).
During impcapture changes in field procedures:
• RI Technical Workplan Addendum #Groundwater Investigation, February 2, 2006. This document provides a change infor the soil sampling and groundwater investigation tasks.
RI Workplan Addendum # 2 - Task 3e - Air Investigations and DThis document provides a change in scope for the air investigations and dust sampling activities.
RI Workpladocument describes the submittal of additional soil samples under the Contract Laboratory Program (CLP) as part of the supplemental analytical event.
RI Workplan Addendum #4, Comprehensive Soil Sample Analysis, Task 3b - SuSampling, August 7, 2007. This document describes the submittal of additional soil samples under the CLP as part of the comprehensive analytical event
3.2 Task 3b—Surface Soil Sampling he surface soil sampling task had
• Complement results of previous investigations and develop a contaminant levels, potential contaminant source(s), and contaminant migration patterns in soils over a broader area; and
Collect sufficient data to support risk asse
Activities Performed. This task consisted of a non-residential soil sampling event, a residential soil sampling event, and a gamma ray survey.
3.0 REMEDIAL INVESTIGATION PROCEDURES
ES022008005PHX 3-3
Non-Residential Soil Sampling Activities. The non-residential soil sampling activities consisted of two events (Phase I and Phase II).
The Phase I event was conducted from November 15, 2005 through November 18, 2005, and included collection of 17 samples within San Pedro Wash, and 15 samples within Power House Wash. All samples were analyzed using a field portable x-ray fluorescence (FPXRF) instrument, and were also submitted for laboratory (CLP) analysis of TAL metals (which includes 23 metals as further described in Section 4.1).
The Phase II event was conducted from February 20, 2006, through March 10, 2006, and included collection of samples at 238 locations within Hayden, Winkelman, and ASARCO property. All samples were analyzed for metals using an FPXRF instrument, and selected samples were submitted for laboratory analysis of TAL metals. Later, as described in the next subsection, all non-residential soil samples not initially analyzed by the laboratory (and retained in secure storage) were submitted for laboratory analysis of arsenic, copper, and lead.
The Phase I and II non-residential soil sample locations were selected within and outside the town limits of Hayden and Winkelman based on the potential human risk of exposure to metals by a variety of routes. The following sample locations were included as part of the larger Phase II investigation:
1. ASARCO Property - A total of 77 locations on and near ASARCO property were sampled, including the crusher facility (7), Kennecott Avenue Wash (10), former Kennecott smelter (15), perimeter of the concentrator (27), perimeter of the smelter (1), the slag dump (1), south of the slag dump (4), and at the two tailings impoundments (12).
2. Winkelman School Complex (including staff housing on school property) - A total of 38 locations were sampled around the school buildings, athletic fields, and playgrounds. An additional 26 sample locations were collected around the three residential school-owned properties on Lobo Lane, adjacent to and west of the school complex.
3. Hayden Public Areas and Golf Club - A total of 10 locations were sampled in the public areas around the Hayden Library and adjacent park. Also, a total of 33 sample locations were sampled at and near the Hayden Public Golf Club and from the adjacent access road east of Tailings Impoundment AB/BC.
4. Upland and Surrounding Areas - Samples were collected from 13 locations (total of 26 samples, which included a surface and subsurface sample at each location) in upland areas, to help evaluate soil quality in surrounding and background areas. Samples were also collected from two locations (total of four samples, which included a surface and subsurface sample at each location) along State Route 77 northeast of Winkelman.
Residential Soil Sampling Activities. The residential soil sampling activities were conducted in one event (Phase II) and included the collection of soil samples from 130 habitable homes within Hayden and Winkelman. This total consisted of 99 homes in Hayden and 31 homes in Winkelman. In total, 1,447 individual residential soil samples (including QC samples)

3.0 REMEDIAL INVESTIGATION PROCEDURES
3-4 ES022008005PHX
were collected during the RI. The residential soil sampling activities were conducted between January 30, 2006, and February 17, 2006.
Sample locations were selected within the town limits of Hayden and Winkelman based on the potential human risk of exposure to metals. During the planning process, Hayden and Winkelman were divided into 26 separate zones. These zones were then separated into two categories, termed Category 1 and Category 2. Category 1 includes areas in closer proximity to facility operations, which have a greater potential to be affected by aerial deposition, surface water runoff, or waste disposal activities, while Category 2 includes areas more distant from facility operations, which are likely to be affected primarily by aerial deposition. At least 30% of all residential lots in zones from Category 1 were sampled, while a lower sample frequency of at least 15% was employed for zones from Category 2 (see Figures 3-1 and 3-2 for zone locations and category designations).
Prior to sampling, a signed access agreement was obtained from the property owner or tenant at each residence. Ten surface samples were collected on each residential lot, which consisted of nine surface soil samples (0-2 inches bgs) and one subsurface sample (10-12 inches bgs).
All soil samples were analyzed for metals using a FPXRF instrument, and approximately 10% of samples were submitted for laboratory analysis of TAL metals. Following receipt of the laboratory data, a comparison of FPXRF and laboratory results was conducted. The evaluation indicated there was relatively good correlation for some metals, but poor correlation for others. The reasons for the poor correlation can be attributed primarily to heterogeneity in the soil matrix itself, and heterogeneity related to different portions of the samples being analyzed by the FPXRF instrument and the laboratory. Also, the FPXRF arsenic results were likely adversely affected by lead interferences resulting from unexpectedly high lead concentrations. As a result, it was decided to submit all samples that were initially analyzed by FPXRF only (and retained in secure storage) for laboratory analysis of arsenic, copper, and lead.
The stored soil samples were submitted for laboratory analysis in two groups. The first group (identified as the “supplemental” analytical event) included those residential soil samples with the highest arsenic concentrations, based on FPXRF results, and consisted of 499 samples (490 samples from Hayden and nine samples from Winkelman). Following evaluation of the supplemental data, it was decided to submit the second group (identified as the “comprehensive” analytical event), which consisted of all remaining residential soil samples, as well as all non-residential soil samples not analyzed initially.
The comprehensive analytical event consisted of 793 residential soil samples and 186 non-residential soil samples. In addition, 37 samples were submitted for re-analysis to evaluate holding times.
The laboratory results for the non-residential and residential soil samples were used to evaluate background soil concentrations and Site-related impacts, and are summarized in Section 4.1. The FPXRF data are considered screening-level data only and are presented in Appendix B.
3.0 REMEDIAL INVESTIGATION PROCEDURES
ES022008005PHX 3-5
3.2.3.3
Gamma Ray Survey. The gamma ray survey was completed to characterize gamma emissions from soils in and around the ASARCO property and the towns of Hayden and Winkelman. Copper deposits similar to the ones that have fed the Hayden smelters have been known to have elevated radioactivity. Gamma rays are a type of radioactivity. The results of the survey were used for locating areas where gamma radiation may exist at levels higher than background.
A gamma ray survey was conducted at the Site on January 23, 2006. The selected areas surveyed were Power House Wash, Kennecott Avenue Wash, State Route 77 in the vicinity of Hayden and Winkelman, portions of the Copper Basin Railway, the storm water impoundments, and the Gila River flood plain downgradient of the slag pile. These areas were selected because of their proximity to areas assigned for sediment and soil sampling.
The survey was completed by walking in serpentine patterns across or along the target areas, while holding the scintillator (detector) approximately 0.5 to 3 inches above the ground, and while carrying the portable ratemeter in the other hand so the meter could be easily read. For survey locations along State Route 77, within Winkelman, and along the Copper Basin Railway, the field personnel remained in the field vehicle, while holding the scintillator out of the passenger side window approximately one to three inches above the ground. The driver kept the truck speed as low as possible along the shoulder of the road and railway access roads.
Background gamma emission rates were determined at the beginning of the day by surveying areas outside of process operations. Background emission rates were determined to be up to 1,000 counts per minute (cpm). The average emission rates for all surveyed areas ranged between 500-800 cpm, and the maximum gamma ray count was approximately 2,000 cpm. However, field personnel were unable to find a source that could duplicate or continuously produce the maximum value.
The gamma survey results showed that there were no locations considered to have gamma emissions greater than background levels within the areas traversed. Therefore, this survey is not described further in this report.
Task 3c—Surface Water and Sediment Sampling Purpose. This task had two key purposes:
• Complement results of previous investigations and develop a better understanding of contaminant levels, potential contaminant source(s), and contaminant migration patterns over a broader area; and
• Collect sufficient data to support remedial actions, if necessary, and to support a SLERA.
Activities Performed. The combined surface water and in-stream sediment sampling activities were conducted on March 7 and 8, 2006 (Winter event) and on August 22 and 23, 2006 (Summer event). Soil sampling from riparian communities was conducted adjacent to the Gila and San Pedro Rivers on April 27 and 28, 2006.
The combined surface water and in-stream sediment sample locations were selected along the Gila and San Pedro Rivers based on the potential ecological and human risk due to exposure to Site-related contaminants by a variety of routes. During both the Winter and
3.0 REMEDIAL INVESTIGATION PROCEDURES
3-6 ES022008005PHX
3.2.3.4
3.2.3.5
Summer sampling events, surface water and in-stream sediment samples were collected from a total of 11 locations along the Gila River and two locations along the San Pedro River.
The stable and unstable riparian sediment samples were collected in the nearest suitable habitat adjacent to the 11 Gila River locations and the two San Pedro River locations. In addition, five additional biased sample locations in the Gila River flood plain (between the confluence of the Gila and San Pedro Rivers and Last Chance Basin), were selected.
The laboratory results for the surface water and sediment samples are summarized in Sections 4.2 and 4.3.
Task 3d—Groundwater Investigation and Sampling Purpose. The purpose of the installation of new monitoring wells was to compliment the existing monitor well network, evaluate shallow groundwater quality impacts, and evaluate groundwater flow conditions within and around the Site. The purpose for the two groundwater sampling events was to evaluate the nature and extent of possible contamination within and around the Site during winter and summer periods.
Activities Performed. Four monitoring wells (identified as GW-01, GW-02, GW-03, and GW-06) were installed between January 4, 2006, and January 12, 2006. A fifth monitoring well, GW-01(R), was installed during the week of August 7, 2006, to replace GW-01 (for which field parameter data collected following well installation suggested potentially faulty well construction).
Two rounds of groundwater level measurements were taken on February 7, 2006, and October 19, 2006. Each measurement event included all new and existing monitor wells that could be accessed at the time. Two surface water elevations were also measured at locations on the Gila River during the October 19, 2006, event. Finally, 23 existing monitoring wells and the four newly installed monitoring wells, as well as selected drinking water supply wells, manifolds and taps in Hayden and Winkelman, were sampled in March 2006 (Winter sampling event) and August 2006 (Summer sampling event).
The laboratory results for the groundwater samples, and an evaluation of groundwater flow conditions, are presented in Section 4.4.
Task 3e—Air Investigation Purpose. The purpose of this task was to further characterize the concentrations of contaminants from the Site at discrete areas within Hayden and Winkelman. This was conducted by installing PM10 and meteorological stations in Hayden and Winkelman. A secondary purpose of this task was to evaluate metal concentrations in dust samples in selected residential homes.
The air investigation involves collection of meteorological, PM10, and metals data from two air monitors installed as part of this study. The Hayden monitoring station was placed on the roof of the town of Hayden maintenance building. The Winkelman monitoring station was placed on the roof of the Winkelman High School gymnasium. Figure 3-3 displays the location of these two stations, and other existing air monitoring stations described in Section 1.2.4.
3.0 REMEDIAL INVESTIGATION PROCEDURES
ES022008005PHX 3-7
3.2.3.6
The new air monitoring stations were programmed to collect samples for a 24-hour period from midnight to midnight. One 24-hour sample is collected every sixth day in accordance with the RI Workplan. The Hayden monitoring operations have been ongoing since October 2006, while the Winkelman monitoring operations have been ongoing since November 2006. An assessment of background air concentrations was also conducted.
Two air monitoring performance audits were conducted at the Winkelman and Hayden locations. These audits were performed on May 17, 2007 and June 24, 2008. Performance audits were conducted on the following instruments:
• Wind Speed (mph) - 3 meters • Wind Direction (degrees) - 3 meters • Ambient Temperature (degrees C) • Barometric Pressure (mm Hg) • Flow Rate (SLPM)
It was determined during both audits that the data collected by both monitoring stations meet the EPA guidelines as outlined in the Meteorological and PM10 Monitoring Performance Audits at Winkelman, AZ and Hayden, AZ Air Quality Monitoring Stations on May 17, 2007 and June 24, 2008; (CH2M HILL 2007c and 2008a). There were three primary recommendations from the 2008 audit that should be implemented to ensure long-term data reliability. First, there is no current procedure for calibration/certification of the flow meter used to perform the bi-weekly checks. The auditor recommended that the flow meter used to perform these checks be calibrated and certified by the manufacturer on an annual basis.
Second, the stability of the Winkelman High School station meteorological tower could be improved. The meteorological box is not securely attached to the tower, and should be stabilized. The stabilization of the tower and meteorological box should be addressed, if possible, in order to avoid any storm-related damage. Third, the wind speed sensor at this location passed all audit criteria, but the bearings should be replaced to avoid possible failure in the future.
Task 3f—Indoor and Attic Dust Sampling The residential dust sampling task involved laboratory analyses of samples collected from 18 sample locations in Hayden and four sample locations in Winkelman. The homes were selected based on concentrations of arsenic in soil detected during residential surficial soil sampling activities in January and February 2006. The sample locations were selected to generally include those homes where relatively low, medium, and high arsenic concentrations were found in soils. At each selected location, indoor dust samples (from occupied areas of the home) were collected, and attic dust samples were collected at those homes with accessible attics.
The indoor dust sampling activities were conducted on February 23, 2006, and May 17 and 18, 2006.
The laboratory results for air and dust samples are presented in Section 4.5.
3.0 REMEDIAL INVESTIGATION PROCEDURES
3-8 ES022008005PHX
3.2.3.7
3.2.3.8
3.2.3.9
Task 3g—Conduct Ecological Investigation Purpose. The purpose of this task was to characterize the terrestrial and aquatic habitats in the project area, as well as in a reference area (i.e., an area with similar vegetation, geology, slope, etc., but that is not impacted by the Site). These characterizations included general habitat mapping and wildlife observations, in general accordance with EPA guidance for ecological assessments. These activities were conducted in support of the SLERA.
Activities Performed. Prior to beginning the field study, a preliminary habitat map was created using existing remote sensing data (i.e., recent, high-resolution aerial photographs of the area, topographic maps, National Wetlands Inventory maps, and Natural Resources Conservation Service soil maps). A limited field survey was then conducted to verify/ground-truth assigned terrestrial and aquatic habitat types as determined by the initial maps, to identify habitats in the vicinity of soil, sediment, and water sampling areas, and to record characteristic vegetation and general wildlife utilization patterns within the project and reference areas (Figure 3-4). This field survey was conducted in April 2006. This time of year was selected as this is when vegetation and wildlife, especially flowering plants and resident birds, would be especially abundant in the habitat types present in the project area.
The findings from the ecological investigation are presented in Section 4.6, and a brief summary of the SLERA findings is presented in Section 5.2.
Task 3h—Geotechnical Evaluation Purpose. The purpose of this task was to perform a reconnaissance-level general assessment of the overall stability of Tailings Impoundment AB/BC and Tailings Impoundment D.
Activities Performed. The assessment was based on existing information and Site observations. The assessment included a review of available existing information and published reports relative to the construction and operation of Tailings Impoundments AB/BC and D, Site reconnaissance of the impoundments by a geotechnical engineer, and the performance of general slope stability analyses of the impoundments.
The geotechnical field reconnaissance of Tailings Impoundments AB/BC and D was conducted on May 1, 2007. No invasive soil sampling, testing, or field measurements were performed during this reconnaissance.
The findings from the geotechnical evaluation are presented in Section 4.7.
Task 3i—Surveying and Mapping To improve accuracy and efficiency and reduce RI surveying and mapping costs, hand-held GPS units were utilized to establish the locations of sampling points.
A Trimble GeoXT hand-held GPS unit was utilized during the field effort. This high-end resource grade GPS mapping system was capable of collecting post processed differential GPS data with specified accuracy of 0.5-meter or sub-meter root means square. This unit also employed Everest Multipath Rejection Technology, which reduces the chances of positional errors due to multipath. For each sampling location, a minimum of six satellites were locked on the GeoXT to ensure accuracy.
3.0 REMEDIAL INVESTIGATION PROCEDURES
ES022008005PHX 3-9
3.2.3.10
Further details and outcomes from this task are presented in Section 4.8.
Task 3j—Investigation Support Activities Purpose. The purpose of this task was to ensure the collection of high quality data during the RI, and maintain consistency in field procedures.
Activities Performed. This task included all support-related activities, including sample handling, documentation, labeling and shipping, personnel and equipment decontamination, and management of investigation derived waste (IDW).
3.3 Remedial Investigation Analytical Tasks The objective of the RI analytical tasks was to generate data of known quality appropriate to project needs in terms of end decisions. This objective was accomplished through the following cycle:
• The Data Quality Objectives (DQOs) identified project data needs and decision rules. The DQOs were included as an appendix to the QAPP.
• The QAPP defined the organization, functional activities, procedures, and policies that were implemented to obtain project-specific data of known and appropriate quality.
• The FSP described the sample collection and handling procedures required to obtain samples that would meet the DQOs.
• The laboratory analytical, QA/QC, and documentation procedures were included in the QAPP as an appendix.
• Field and laboratory QA/QC were conducted through internal and external oversight/audits/reviews.
• Data quality and usability review were conducted outside the laboratory as documented in the data validation reports presented in Appendix D. Table 3-1 lists the data that were validated by a third-party reviewer retained by EPA.
• Qualification of the individual data points was completed by applying data validation report flags to the data in the project database.
• Overall data quality assessment was conducted within the context of project objectives as described below.
To guide the overall analytical program, the following three tasks were part of the RI Workplan:
Task 4 – Sample Analysis Task 5 – Data Validation Task 6 – Data Evaluation
The following sections present the analytical methodology, the data validation methodology, and the overall data evaluation and usability. The associated sample/analyte-specific validation reports are presented in Appendix J.
3.0 REMEDIAL INVESTIGATION PROCEDURES
3-10 ES022008005PHX
3.3.2.1
3.3.1 Task 4—Sample Analysis The project analytes, associated methods, and laboratories were presented in the FSP and QAPP. For each analytical parameter and method, the standard EPA analytical method and/or the associated CLP laboratory Statements of Work (SOW) were followed. Summary tables for the CLP SOW requirements are located in the QAPP, and the standard EPA analytical methods were included in the QAPP as an appendix. These documents also identify the following method-specific QC requirements:
• Method-specific QC procedure;
• Level of effort (frequency of QC checks) for each QC procedure;
• Quantitative acceptance limits for QC data;
• Corrective action requirements for the laboratories for QC data outside the acceptance limits; and
• Documentation.
• These requirements as detailed for each analytical method in the QAPP and the CLP SOW were followed as the project analytical requirements by the assigned laboratory.
The detection limit requirements in accordance with project needs and regulatory criteria also are listed in tables in the QAPP (Table A2.1 and Table A2.7). The analytical laboratories established method detection limits (MDLs) in accordance with Title 40, Part 136, Appendix B, of the Code of Federal Regulations (CFR) before start of the work to ensure that laboratory-specific limits complied with the specifications listed in the QAPP.
For a small percentage of the samples, the analytical method differed from the method specified in the QAPP. In these cases, a standard EPA method equivalent to the standard EPA method specified in the QAPP was used. These variations were based on the laboratory available to perform the analyses. These variations are listed in Table 3-1. The methods used to replace the methods specified in the QAPP were standard EPA methods that met the project data quality objectives including detection limit requirements.
3.3.2 Task 5—Data Validation Data Validation Methodology
All data (100%) have been evaluated independent of the laboratory by project chemists. The samples analyzed by CLP laboratories are run through the EPA’s electronic data review and flagging program. The samples analyzed by the EPA Region IX laboratory are reviewed and flagged according to the EPA Region IX laboratory policy. Reports are generated for both of these reviews. Those sample delivery groups (SDGs) that received Tier 3 data validation from a third-party evaluator, retained by EPA, are listed in Table 3-2.
Sample data have been reviewed for the QC specifications identified in the project QAPP and CLP SOW for each specific parameter and are flagged in accordance with the project QAPP and EPA functional validation guidelines, as referenced in the validation reports in Appendix D.
3.0 REMEDIAL INVESTIGATION PROCEDURES
ES022008005PHX 3-11
3.3.2.2
3.3.2.3
3.3.2.4
• Chain of Custody (CoC) forms and tracking records.
Reporting Sample and parameter-specific data validation reports, presented in Appendix J, are based on review of the individual laboratory SDGs. The SDG-based reports are ordered by analytical groups. The cover of each report identifies individual samples included in the SDG.
Each report has subsections that correspond to the internal QC check requirements for that specific method as identified in the project QAPP. If laboratory data are found to deviate from the specifications, the subsection provides quantitative details for the QC data deviation, and the associated affected samples and provides flags according to defined conventions.
Field blank, trip blank, and matrix spike/matrix spike duplicate (MS/MSD) sample results have been listed in laboratory result data sheets, as well as the project database.
The individual SDG reports provide a summary table at the end of each section where flags are applied, and the report is followed by flagged data sheets. The reports list all flags and their appropriate classifications, as well as the reason for the flags.
Flagging Conventions, Data Validation Findings, and Overall Summaries EPA data validation functional guidelines and QAPP criteria were used to determine flagging conventions.
Sample- and analyte-specific data validation findings and associated qualifying flags, per laboratory internal quality control data, are presented within each validation report. Data validation flags have been entered in the project database and on data tables contained in this report. Additionally the field QC data (field blanks, field duplicates, and MS/MSD) are provided to end-users for site-wide application, as the distribution of the field QC data correlates to Site information at-large rather than the individual samples in the associated SDG.
Several air filter samples were rejected because of torn filters received at the laboratory. Also, the quantitation limits for some analytes were rejected due to QC outliers that did not meet the minimum requirements for acceptability. The analytes in the affected samples with a brief explanation of the basis for rejections are presented on Table 3-3. These results are considered unusable. A number of data were qualified, both quantitation limits and positive results, due to sporadic QC outliers. Where data are qualified, there is an increase in uncertainty in the numerical results, although the data remain usable to meet the project objectives. The overall project completeness objective of 90% usable results was met.
Data Storage Backup information for the data evaluation and validation findings includes the following:
• Laboratory hard copy packages, assembled by SDG, which includes all QC data. These packages are stored at the EPA Region IX offices, as well as at the laboratories.
• A project-specific electronic database, maintained by CH2M HILL, which includes all sample concentration data with validation flags and a subset of laboratory QC data.
3.0 REMEDIAL INVESTIGATION PROCEDURES
3-12 ES022008005PHX
aintained by the laboratories.
Quality Control Data Data quali terms of precision, accuracy,
racy Accuracy m nt data include laboratory control sample and matrix spike recovery
a
Overall Sum cision measurement data include laboratory and field duplicate data
ential and non-residential soil samples were s
d
comprehensive events were analyzed outside the
l
een the initial results and the subsequent supplemental and comprehensive results, an RPD comparison was implemented. The investigative and corresponding duplicate results from the initial set
• Laboratory bench records and sample custody logs m
3.3.3 Task 6—Data Evaluation 3.3.3.1 Data Quality Assessment and
ty objectives have been prescribed in the QAPP in tiveness, comparability, and completeness (PARCCrepresenta ) parameters. The following is
a description of the assessment for each parameter. The PARCC objectives for the project arelisted in the QAPP. Associated data for the PARCC parameters are shown in the laboratory data packages.
3.3.3.2 Accueasureme
th organic data for bo and inorganic analytical parameters, as well as surrogate recovery data for organic parameters. The accuracy data have been provided to the project team (datusers) for consideration during decision-making since these data need to be applied to the whole Site. Over 90% of data are within criteria, thus meeting project goals.
3.3.3.3 Precision mary. Pre
expressed as relative percent difference (RPD). Validation reports were also used to detail any duplicates outside control limits, if there were any such samples. The duplicate data have been provided to the project team (data users) for consideration during decision-making since these data need to be applied to the whole Site. Over 90% of data are withinthese criteria, thus meeting project goals.
Soil Sample Holding Time Evaluation. Residsubmitted for laboratory analysis of arsenic, copper, and lead in three events identified ainitial, supplemental, and comprehensive. The supplemental and comprehensive events were composed of split samples selected from the initial soil sampling event, which were pulled from storage and submitted for analysis. The initial sampling event occurred in February 2006. Subsequently, the split samples composed of the supplemental and comprehensive sampling events were submitted to the laboratory in November 2006 anAugust/September 2007, respectively.
The samples from the supplemental and method holding time of 180 days from the date of initial sample collection. Samples analyzed outside the method holding times may be estimated based on the specific chemicaunder consideration and potential routes of analyte losses such as chemical, physical, or biological degradation or volatilization. However, in the case of the heavy metals arsenic, copper, and lead, there appears to be no process that would lead to analyte losses during the storage implemented of the split samples. Hence, there is no expected adverse impact on measured concentrations based on long period storage on these metals (Schumacher, 2005), and no apparent need to consider the results estimated.
To investigate any possible bias that may be present betw
3.0 REMEDIAL INVESTIGATION PROCEDURES
ES022008005PHX 3-13
d in the r all -
ple e
ta rent
s
olding times differed by nearly 300 days.
eness is a measure of how closely the measured results reflect the actual concentration or d the chemical compounds in the sampled media. Representa oth qualitative and quantitative terms. The project report
y tory and
c basis in
were compared to establish representative, achievable precision for these data using the field duplicate RPD as a benchmark. There were 18 field duplicate pairs includeinitial data set. The RPD between these 18 sets of field duplicates ranged from 0 – 22% fothree metals, with the exception of HSS-H-0-101-09-010, which had a RPD of 71% (Table 34). Overall, 17 out of 18 (94%) field duplicate samples fell below the 50% RPD criterion.
To evaluate any holding time impacts, selected samples that were analyzed in the initial sample event were also submitted for laboratory analysis during the supplemental and comprehensive events. The RPDs between the initial results and the corresponding samresults in the supplemental and comprehensive sets were calculated. Table 3-5 presents thanalytical results and the corresponding RPDs. Similar to the comparison of duplicate sample results for the initial data set, 142 out of 150 (95%) supplemental sample results (combined arsenic, copper and lead results) and 69 out of 78 (88%) comprehensive sample results (combined arsenic, copper and lead results) fell below the 50% RPD criterion.
The RPD values based on the results from the supplemental and comprehensive data sets are greater than the results between the 17 investigative/duplicate pairs from the initial daset. The greater RPD values are likely attributed to the following factors: 1) use of diffelaboratories for the initial event (Liberty Analytical) compared to the supplemental and comprehensive events (Bonner Analytical Testing Company), which may introduce minor variability; 2) a more rigorous laboratory homogenization procedure was requested for the supplemental and comprehensive samples to address settlement of finer grained particleduring shipment, and therefore higher levels were expected because finer grained materials generally contain higher metals concentrations.
It is also noteworthy that range and average RPDs for both the supplemental event (total maximum holding time 320 days) and comprehensive event (total maximum holding time 601 days) are nearly identical, although the total hThis indicates that there appears to be no notable bias attributed to changes in metals concentrations during storage.
Based on the evaluation of these samples results, these soil sample data are considered representative of the site conditions at the time of the sample collection and may be used for all purposes.
3.3.3.4 Representativeness Representativ
istribution of tiveness is assessed in b
discusses the qualitative aspects of representativeness in terms of design of the FSP, sampling techniques, sample handling protocols, and associated documentation.Quantitative measures of representativeness include field and laboratory blank measurements to identify if contamination was introduced through field or laboratoroperations. Field duplicate measurements are used to establish variability. Laboratrip blank measurements have been detailed on a sample- and parameter-specifithe validation reports. All qualifications as a result of laboratory and trip blank effects havebeen incorporated into the project sample/analyte-specific data. Field blank results are summarized in the database and provided to data users on a Site-wide basis.
3.0 REMEDIAL INVESTIGATION PROCEDURES
3-14 ES022008005PHX
dence with which one data set can be compared to another. C data has been established through use of following:
nd
• cordance with 40 CFR Part 136, oject requirements.
3.3.m tical
measurements ity completeness is assessed within the context of the overall sampling d pleteness was found to be above 90% at large, and meets project
data assessment through the evaluation of the PARCC parameters, the data generated has me project data quality objectives. Some data points were rejected, as .2.3 and presented on Table 3-3.
d Winkelman stations
ility.
of e at
Field duplicate results and associated RPD data are also presented in the database and takeninto account in project decisions.
3.3.3.5 Comparability Comparability expresses the confi
omparability of
• Standard analytical methods and QC procedures established in the project QAPP aEPA CLP and EPA Region IX laboratory protocols;
• Consistent reporting units for a specified procedure; and
MDLs for all analytical parameters established in acAppendix B, before the start of the analyses to meet the pr
• Based on these comparability standards, the data meet the project objectives.
3.6 Completeness Co pleteness is the measure of the amount of valid data obtained from the analy
. Field activesign. Data com
objectives.
3.3.3.7 Overall Data Usability As shown in
t and exceeded described in Section 3.3
Air Monitoring Station Audits. Two air monitoring audits were conducted on May 17, 2007, and June 24, 2008, at the Hayden and Winkelman air monitoring stations (see section 3.2.3.5). It was concluded that the data collected from the Hayden anare usable since they meet U.S. EPA guidelines. The 2008 audit suggested some improvements to operations that should be considered to ensure long-term data reliab
Reporting Limits. A comparison of reporting limits to the screening levels for analytes not detected in RI samples was conducted. The sample matrices evaluated included residential and nonresidential soil, surface water, sediment, groundwater, and air particulates. When an analyte is not detected and the reporting limit exceeds the applicable screening levels, some uncertainty regarding the presence of an exceedance exists. Since the analyte reporting limit is generally 2 to 5 times the MDL and positive results are reported to the MDL, the uncertainty is less in cases where the screening level falls within this margin. When the screening level is below the estimated MDL (range between 1/2 and 1/5 the reporting limit), a larger uncertainty regarding the presence of an exceedance exists.
For all methods, the reporting limits are consistent with the project plan. Notably, many the ambient air and water screening levels, including EPA Region 9 Tap Water PRGs, arconcentrations below what can be achieved using the best available analytical methodologies.
3.0 REMEDIAL INVESTIGATION PROCEDURES
ES022008005PHX 3-15
yte reporting limits that exceed screening levels are discussed below.
cyanide and 27 mercury (dissolved fraction) reporting limits
d xachlorobenzene in 19
llutants Ambient Air Criteria in the following number of samples:
es
e etals ranged from 0.009 to 0.0705 µg/m3 compared to the llutants Ambient Air Criteria which ranged from 0.00016 to
No sediment reporting limits exceeded the applicable screening levels. For the remaining matrices, the anal
Residential Soil. Six arsenic reporting limits exceeded the EPA PRG but were below the 10 mg/kg Arizona R-SRL.
Nonresidential Soil. One thallium and two arsenic reporting limits exceeded the EPA PRGs.
Surface Water. Twenty-oneexceeded the Arizona Aquatic and Wildlife Water Quality Criteria.
Groundwater. The reporting limits for aluminum exceeded the federal MCL in 21 unfilterewater samples and in 29 filtered samples. The reporting limits for hesamples exceeded both the EPA PRGs and the federal MCLs. The minimum detectable Radium 226 activity in 61 samples and the Radium 228 activity in 65 samples exceeded the tap water PRGs.
Air. Arsenic, cadmium, chromium, and cobalt reporting limits exceeded the Arizona Hazardous Air Po
• Arsenic in 30 samples • Cadmium in 122 samples • Chromium in 87 sampl• Cobalt in 133 samples
Th reporting limits for these mArizona Hazardous Air Po0.00045 µg/m3.

ES022008005PHX 4-1
SECTION 4
Remedial Investigation Results
This section presents the RI results for each media that was studied. For each media, the background concentrations, nature and extent of impacts, and fate and transport of chemicals of concern (COC) are presented.
4.1 Soil Sampling This section presents the results of the RI conducted for both nonresidential and residential soils at the Site. The primary sources of soil impacts and the COCs specific to soil impacts are identified. In addition, the background concentrations for soils that support the evaluation of the nature and extent of soil impacts at the Site are presented. Finally, individual COC characteristics, transport processes, and migration trends observed at the Site are discussed.
4.1.1 Contaminant Sources The CSM presented in Figure 1-6 (and described in Section 1.3) identified the concentrator operations and the current and historic smelter operations as the primary sources of contamination. The fugitive and stack emissions, tailings impoundments, rail transport, and process wastewater were identified as the primary release mechanisms that may have affected soils on and near the Site.
Other process operations and features, including smelter furnace and converter areas, machine shops, maintenance yards, and underground storage tanks, may be potential sources of various contaminants. Although a limited amount of onsite soil sampling was conducted, it was beyond the scope of the RI to extensively evaluate onsite operations. The focus of the RI was on collection of soil samples from nonresidential and residential areas to determine impacts to residential areas from current and historical copper processing activities.
4.1.2 Chemicals of Concern Table 1-3 presents the COCs identified before the start of the RI, based on previous studies. For metals, six COCs (arsenic, copper, lead, cadmium, chromium, and mercury) were identified because their concentrations exceeded their respective R-SRLs or were elevated relative to mean background concentrations.
To further confirm COCs based on the RI soils data, Table 4-1 was prepared to display the number of detections and exceedances of the Arizona R-SRL and/or the EPA PRG for each metal in residential and nonresidential soils. This table indicates that nearly 100% (1,817 samples) of all soil samples with detected results exceeded the R-SRL (10 mg/kg) and/or PRG (0.39 mg/kg) for arsenic. Approximately 51% (929 samples) of all soil samples exceeded the R-SRL and PRG of 3,100 mg/kg for copper, and about 12% (219 samples) exceeded the R-SRL and PRG of 400 mg/kg for lead. Because of the large number of
4.0 REMEDIAL INVESTIGATION RESULTS
4-2 ES022008005PHX
exceedances in residential and nonresidential soil samples, arsenic, copper, and lead represent the primary COCs for the Site.
As Table 4-1 indicates, very few exceedances of R-SRLs and PRGs were found for other metals. The TAL metals with exceedances found at the Site, in descending order by the number of exceedances, are as follows:
• Iron (122 of 281 samples, or about 43%, exceeded the PRG of 23,000 mg/kg)
• Molybdenum (9 of 127 samples, or about 7%, exceeded the R-SRL/PRG of 390 mg/kg)
• Vanadium (9 of 281 samples, or about 3%, exceeded the R-SRL/PRG of 78 mg/kg)
• Antimony (3 of 281 samples, or about 1%, exceeded the R-SRL/PRG of 31 mg/kg)
• Cadmium (3 of 281 samples, or about 1%, exceeded the R-SRL or PRG of 39 and 37 mg/kg, respectively)
• Silver (1 of 281 samples, or about 0.4%, exceeded the R-SRL/PRG of 390 mg/kg)
• Thallium (1 of 281 samples, or about 0.4%, exceeded the R-SRL/PRG of 5.2 mg/kg)
The highest iron concentrations were found in samples collected on ASARCO property. There are also numerous iron exceedances in residential soil samples in Hayden, and in some nonresidential soil samples in the Hayden area (particularly San Pedro Wash and Power House Wash). However, there is only one iron exceedance in a residential soil sample from Winkelman, and nonresidential soil samples collected more distant from Hayden show lower concentrations.
All samples with molybdenum exceedances are found in nonresidential soil samples collected on ASARCO property. Similarly, eight of the nine samples with vanadium exceedances were also from nonresidential soil samples collected on ASARCO property. All soil samples with molybdenum and vanadium exceedances also have iron exceedances.
For cadmium, two soil samples with exceedances were on ASARCO property near the active slag dump area, while the third exceedance was an isolated occurrence at a Hayden residential property (101-09-070), from which the sample with the single silver exceedance was also collected. The single soil sample with a thallium exceedance was on ASARCO property at the former Kennecott smelter area.
In summary, arsenic, copper, and lead represent the three primary COCs in soils for the Site, and are the focus of discussion in subsequent sections focusing on background concentrations, nature and extent, and fate and transport in soils. The presence of iron, molybdenum, and vanadium is also further described in subsequent sections. No further discussion of other metals is warranted.
4.1.3 Background Concentrations This section presents the procedures and outcome of an assessment of soil background concentrations for arsenic, copper, and lead (the primary COCs for soil) within the study area. The purpose of this evaluation is to establish soil background concentrations for better assessment of potential environmental impacts from ASARCO operations on soils in the Hayden and Winkelman area. These background concentrations were developed based on
4.0 REMEDIAL INVESTIGATION RESULTS
ES022008005PHX 4-3
of Background
ere
ic setting evaluation of background concentrations, geologic mapping
of
d Qo .
and
% of
und evaluation, and the primary
background concentrations for arsenic, copper, and lead, based on
991)
•
all appropriate background data available for the study area, including those from previousinvestigations. In accordance with methods provided by EPA in Guidance for Comparing Background and Chemical Concentrations in Soil for CERCLA Sites (EPA, 2002), a detailed statistical comparison was performed on a combined Site-wide data set.
Details of this background data evaluation are presented in the EvaluationMetal Concentrations in Soil for the ASARCO LLC Hayden Plant Site technical memorandumprepared by CH2M HILL on November 30, 2007 (CH2M HILL, 2007a), and is provided in Appendix C. As described in the technical memorandum, the background evaluation was conducted on a macro-scale using statewide data and a compilation of all Site background soils data, and on a more detailed level that considered the geologic setting of the towns of Hayden and Winkelman. The statewide data included 47 soil samples collected by the USGSfrom the Colorado Plateau, Transition Zone, and Basin and Range physiographic provinces in Arizona as provided in the Evaluation of Background Metals Concentrations in Arizona Soils; Earth Technology Corporation; June 1991; (Earth Tech, 1991). For purposes of this study, only the 28 samples collected from the Transition Zone and Basin and Range provinces wconsidered most appropriate for comparison with soil sample data from the Site (Figure 4-1).
For the geolog(Figure 2-2) indicates that the town of Hayden (including most portions of ASARCO operations) is situated in the Tertiary Sediment (Ts) geologic map unit, while the townWinkelman is situated in the Older Quaternary Deposits (Qo) geologic map unit (see Section 2.3 for a detailed description of the Site geologic setting). Therefore, select background soil samples were identified and statistically evaluated from the Ts anareas to develop background soil concentrations for Hayden and Winkelman, respectivelyThe background datasets for the Ts and Qo areas were comprised of 35 Ts samples and 6 Qosamples. Figure 4-1 shows the location of these selected background samples, along with the extent of geologic mapping for the study area. Individual data sets were constructed for samples from the Ts and Qo geological units. Then, ProUCL v.4.0 software was used to identify any outliers and generate the summary statistics, including mean, standard deviation, minimum, maximum, and upper tolerance limit (UTL), for arsenic, copperlead. The UTL parameter provides an accepted statistical method for determining a background value from a set of data (EPA, 2002). The UTL represents a value that 95the population will fall below with 95% confidence.
Table 4-2 presents a summary of the detailed backgrofindings are as follows:
• The statewide meanUSGS soil samples from the Transition Zone and Basin and Range physiographic provinces, are 12.7 mg/kg, 34.4 mg/kg, and 30 mg/kg, respectively (Earth Tech, 1
For all study area data, when geologic units are not considered, the overall mean background concentrations for arsenic, copper, and lead (not taking into account geologic map units) are 7.2 mg/kg, 746 mg/kg, and 209 mg/kg, respectively
4.0 REMEDIAL INVESTIGATION RESULTS
4-4 ES022008005PHX
4.1.4.1
• For Ts data (Hayden soils evaluation), the background mean and UTL values are 6.3 mg/kg and 12.5 mg/kg for arsenic, 460.5 mg/kg and 1,270 mg/kg for copper, and 28.3 mg/kg and 47.9 mg/kg for lead.
• For Qo data (Winkelman soils evaluation), the background mean and UTL values are 6.3 mg/kg and 9.1 mg/kg for arsenic, 501 mg/kg and 882 mg/kg for copper, and 31.7 mg/kg and 45.8 mg/kg for lead.
It is important to note that the arsenic, copper, and lead UTL values for the Ts and Qo datasets are in relatively close alignment, indicating a relatively small difference associated with the Ts and Qo geologic settings. Based on Earth Technology Corporation data (1991), the statewide averages for arsenic (12.7 mg/kg) and lead (30 mg/kg) are in relatively close alignment with these values; the statewide average concentration for copper (34.4 mg/kg) is considerably less than the Site-specific background values, but this is expected because of the Site’s setting in a copper mineralization region.
In summary, the UTL values for the Hayden and Winkelman data sets, as presented in Table 4-2, are used as background soil concentrations for this study.
4.1.4 Nature and Extent of Contaminant Distribution in Nonresidential Soils This section presents the RI results for the nonresidential soils at the Site, and evaluates the nature and the extent of arsenic and metals concentrations in these areas. The results discussion has been organized according to the different nonresidential areas investigated: ASARCO property, adjacent washes, and non-ASARCO public areas. Although the RI included results for all TAL metals, this section focuses on the primary COCs identified at the Site for soil (arsenic, copper, and lead), and secondarily on iron, molybdenum, and vanadium.
Approach to Data Evaluation and Presentation Table 4-3 presents a summary of arsenic, lead, and copper concentrations for the various nonresidential sample areas. The table presents data for soil samples collected on ASARCO and non-ASARCO properties. In addition, Tables 4-4, 4-5, and 4-6 present all sampling results for arsenic, lead, and copper in nonresidential soils for the ASARCO concentrator and smelter area, tailings impoundments, and non-ASARCO public and upland areas, respectively. The results for all TAL metals that displayed any R-SRL exceedances in nonresidential soils are in Table 4-7. Finally, the complete nonresidential surface soil sample results (for all metals) are in Appendix D. These results indicate that arsenic, copper, and lead concentrations in nonresidential soils are markedly influenced by ASARCO operations. This is evidenced by the fact that soils at ASARCO facilities (particularly the perimeter of the concentrator and former Kennecott smelter areas) generally contain the highest concentrations, while nonresidential soils on non-ASARCO properties, including the Winkelman and upland areas, contain the lowest concentrations. The washes located near the ASARCO operations (especially Power House Wash [PHW]) also appear to be directly affected by ASARCO operations. The following sections present the nature and extent of impacts, presented per area where samples were collected, as follows:
• ASARCO Concentrator and Historic Smelter Property – Perimeter of Concentrator (PCON), former Kennecott Smelter (KS), and Crusher (CF)
4.0 REMEDIAL INVESTIGATION RESULTS
ES022008005PHX 4-5
• ASARCO Smelter Property – Perimeter of Smelter (PSMT), slag dump (SD), and downgradient of slag dump (SDD)
• ASARCO Tailings Impoundments Property – Tailings Impoundment AB/BC (TPA) and Tailings Impoundment D (TPD)
• Hayden Washes – Power House Wash (PHW), Kennecott Avenue Wash (KAW), and San Pedro Wash (SPW)
• Non-ASARCO Properties – Hayden Public Areas (HPUB), Hayden Golf Club (HGC), Winkelman School Complex (WSC), State Route 77 (SR77), and upland areas (UP and UPA).
Figures depicting the concentrations of arsenic, copper, and lead in nonresidential soils were prepared to help assess the spatial variability of the data. The figures are color-coded to show the relative concentration of arsenic, copper and lead in the mapped area of interest. The color coding designations were selected to represent relative concentration ranges, as follows:
Arsenic (Figures 4-2, 4-6 and 4-9)
• Low range concentrations (blue): 1 - 10 mg/kg (concentrations in the range from detectable levels up to the Arizona R-SRL)
• Low-mid-level concentration (green): 10.1 – 25.9 mg/kg (concentrations in the range between the R-SRL and the estimated child non-cancer HI of 1 value for arsenic, based on the parallel human health risk assessment [HHRA] efforts)
• Mid-high level concentration (yellow): 26.0 – 47.9 mg/kg (concentrations in the range between the non-cancer HI of 1 and the adult plus child cancer risk of 1x10⁻⁴, based on the parallel HHRA efforts and a bioavailability factor [BAF] of 80%)
• High-level concentration (red): greater than 48 mg/kg (concentrations above the adult plus child cancer risk of 1x10⁻⁴)
Copper (Figures 4-3, 4-7 and 4-10)
• Low range concentrations (blue): 1 – 3,100 mg/kg (concentrations in the range from detectable levels up to the R-SRL)
• Low-mid-level concentration (green): 3,101 – 8,699 mg/kg (concentrations in the range between the R-SRL and a value about three times the R-SRL)
• Mid-high level concentration (yellow): 8,700 – 17,100 mg/kg (concentrations in the range between about three and six times the R-SRL)
• High-level concentration (red): >17,100 mg/kg (concentrations above about six times the R-SRL)
Lead (Figures 4-4, 4-8 and 4-11)
• Low range concentrations (purple): 1 - 212 mg/kg (concentrations in the range from detectable levels up to the screening value, excluding homegrown produce, using the
4.0 REMEDIAL INVESTIGATION RESULTS
4-6 ES022008005PHX
4.1.4.2
California Department of Toxic Substances Control’s [DTSC] Lead Risk Assessment Spreadsheet Version 7, LeadSpread 7 [CalEPA, 1999], based on the parallel HHRA efforts). This model calculates a screening level that represents a concentration of lead in soil for children that is protective for a combined exposure to lead in air, drinking water, food, and soil. The LeadSpread model uses a default bioavailability factor [BAF] of 44%).
• Low-mid-level concentration (blue): 213 – 400 mg/kg (concentrations in the range between the LeadSpread screening level and the R-SRL of 400 mg/kg).
• Mid-high level concentration (green): 401 – 1,199 mg/kg (concentrations in the range between the R-SRL and about three times the R-SRL).
• High-level concentration (yellow): 1,200 – 2,400 mg/kg (concentrations in the range between about three times and six times the R-SRL).
• Very high level concentration (red): >2,400 mg/kg (concentrations above about 6 times the R-SRL).
ASARCO Concentrator and Historic Smelter Property The RI sampling efforts near the concentrator and historic Kennecott smelter properties included the collection and analysis of 27 surface soil samples from the PCON area, 15 surface soil samples from the KS area, and 7 surface soil samples from the CF area.
Arsenic Impacts. Figure 4-2 presents the soil sample locations with posted arsenic concentrations near the concentrator (PCON, KS, and CF areas).
The highest arsenic concentrations among all the nonresidential sample locations were in samples PCON-20-SED-0 (1,720 mg/kg) and PCON-23-SED-0 (769 mg/kg), collected near the southeast perimeter of the concentrator facility. Elevated levels of arsenic were also found along the southern perimeter of the concentrator’s mill building, as indicated by sample PCON-11-SED-0 (81.6 mg/kg). In the former KS area, arsenic concentrations range from non-detectable levels (less than 2 mg/kg) in sample KS-06-SED-0, to 345 mg/kg in KS-02-SED-0 located near the containment pond located in the southwest portion of this area. Elevated arsenic concentrations were also found in nearby samples KS-01-SED-0 (224 mg/kg) and KS-03-SED-0 (140 mg/kg). Elevated arsenic concentrations (114 mg/kg in KS-8-SED-0) were also found in samples collected to the north and east of the former KS area (see Figure 4-2).
Soils in the area immediately south of the former KS and north of ASARCO’s administration building show elevated arsenic concentrations, with the highest concentration in sample KS-14-SED-0 (90.7 mg/kg). The high arsenic concentrations in this area are likely the result of historical windblown and surface water runoff impacts from the former KS area, and because this area was formerly used as a yard area supporting smelter activities. Soils around the CF contain the lowest arsenic concentrations in the concentrator facility area; however, arsenic levels in the area immediately north of the CF, adjacent to Conveyor 9 and the conveyor drainage tailings deposits, are as high as 52.7 mg/kg (CF-07-SED-0).
Samples PCON-16-SED-0 and PCON-17-SED-0 were samples of fine ore dust collected below where Conveyor 9 delivers ore to the mill building; the arsenic concentrations in
4.0 REMEDIAL INVESTIGATION RESULTS
ES022008005PHX 4-7
these samples (13.4 mg/kg and 12.9 mg/kg, respectively) are above the R-SRL and slightly above the background level of 12.5 mg/kg for the Ts geologic map unit area.
Taken collectively, these data indicate that the concentrating and historic smelter operations area, including the CF, have resulted in elevated arsenic impacts above the background level of 12.5 mg/kg and the R-SRL of 10 mg/kg.
Copper Impacts. Figure 4-3 presents the soil sample locations with posted copper concentrations near the concentrator and historic smelter (PCON, KS, and CF areas).
The highest copper concentrations in the PCON area were in samples PCON-12-SED-0 (69,300 mg/kg, or nearly 7% of the total mineral composition in the soil) and PCON-25-SED-0 (59,700 mg/kg, or nearly 6%), collected near the southwest and northeast perimeter of the concentrator facility, respectively. Sample PCON-11-SED-0, also located southwest of the concentrator facility, contained the next highest copper level (57,800 mg/kg).
In the former KS area, copper concentrations were higher, with samples KS-06-SED-0 (192,000 mg/kg, or 19.2%) near the railroad line south of the former smelter area, and KS-09-SED-0 (132,999 mg/kg) north of the former smelter, showing the highest concentrations. Soils in the area south of the former KS and north of ASARCO’s administration building also show elevated copper concentrations, with the highest concentration in sample KS-14-SED-0 (48,600 mg/kg).
Soils north of the CF and within the conveyor drainage tailings deposits also show elevated copper levels, based on samples CF-06-SED-0 (131,000 mg/kg, or 13.1%) and CF-04-SED-0 (57,600 mg/kg).
The fine ore dust samples PCON-16-SED-0 and PCON-17-SED-0 have copper concentrations of 9,510 mg/kg and 7,530 mg/kg, respectively, which are both above the R-SRL.
Taken collectively, these data indicate that the concentrating operations area, including the former KS area and CF area, have resulted in elevated copper impacts well above the background level of 1,270 mg/kg (for Ts geologic map unit area) and the R-SRL of 3,100 mg/kg.
Lead Impacts. Figure 4-4 presents the soil sample locations with posted lead concentrations near the concentrator (PCON, KS, and CF areas).
The highest lead concentrations in the PCON area were in samples PCON-25-SED-0 (348 mg/kg) and PCON-21-SED-0 (329 mg/kg), collected near the northeast and southeast perimeter of the concentrator facility, respectively. Although these concentrations are below the R-SRL of 400 mg/kg, they are above the lead background level of 47.9 mg/kg for the Ts geologic map unit.
In the former KS area, lead concentrations were higher, with samples KS-09-SED-0 (552 mg/kg) and KS-08-SED-0 (539 mg/kg) north of the former smelter, and sample KS-02-SED-0 (547 mg/kg) near the containment pond southeast of the former smelter, showing the highest levels. Soils in the area south of the former KS and north of ASARCO’s administration building also show elevated lead concentrations, with the highest concentration in sample KS-14-SED-0 (450 mg/kg).
4.0 REMEDIAL INVESTIGATION RESULTS
4-8 ES022008005PHX
4.1.4.3
Soils north of the CF and within the conveyor drainage tailings deposits show lower lead levels relative to the concentrator and former KS areas, but still above background levels. Samples CF-07-SED-0 (156 mg/kg) and CF-04-SED-0 (102 mg/kg) have the highest lead levels in this area.
The fine ore dust samples PCON-16-SED-0 and PCON-17-SED-0 have lead concentrations of 47.4 mg/kg and 21.3 mg/kg, respectively, which are well below the R-SRL and background levels.
Taken collectively, these data indicate that the former KS area has soils with lead concentrations above the R-SRL of 400 mg/kg, and the PCON and CF areas have soils with lead above the background level of 47.9 mg/kg (for the Ts geologic map unit).
Other Metals—Molybdenum, Vanadium, and Iron. Most of the exceedances for molybdenum, vanadium, and iron are near the concentrator operations. Therefore, Figure 4-5 presents those soil sample locations within the concentrator and surrounding area with exceedances of the R-SRL and/or PRG for molybdenum, vanadium, and iron (Table 4-7).
For molybdenum, the R-SRL of 390 mg/kg is exceeded in nine surface soil samples, which are all located on ASARCO property. Six of these samples are in the KS area, where the maximum concentration (2,280 mg/kg in KS-06-SED-0) is also present. Two of the nine samples are in the PCON area, and include PCON-11-SED-0 (1,240 mg/kg) and PCON-25-SED-0 (1,020 mg/kg).
For vanadium, the R-SRL of 78 mg/kg is exceeded in nine surface soil samples, which are more broadly distributed, although eight of the nine are on ASARCO property. Two of these samples are in the KS area: KS-01-SED-0 (84.2 mg/kg) and KS-02-SED-0 (105 mg/kg). Two of the nine samples are in the PCON area: PCON-11-SED-0 (93.3 mg/kg) and PCON-21-SED-0 (105 mg/kg). One sample is located in PHW (PHW-SED-11AS, 79.8 mg/kg), and the remaining samples are located outside the mapped area of Figure 4-5.
For iron, concentrations in some samples in the KS and PCON areas are an order of magnitude higher than in other surrounding areas, with the highest levels in KS-04-SED-0 (227,000 mg/kg), KS-02-SED-0 (197,000 mg/kg), and PCON-25-SED-0 (162,999).
ASARCO Smelter Property The RI efforts near the active smelter areas included the collection and analysis of one surface soil sample each from the PSMT and SD areas, and four surface soil samples from the SDD area.
Arsenic Impacts. Figure 4-6 presents the soil sample locations with posted arsenic concentrations near the current smelter (PSMT, SD, and SDD areas).
The single sample collected from the PSMT area (PSMT-01-SED-0) showed an elevated arsenic level of 121 mg/kg, while the single sample from the SD area (SD-01-SED-01) showed a concentration of 24.7 mg/kg. For the SDD area, samples SDD-01-SED-0 and SDD-02-SED-0 showed the highest arsenic levels, at 361 mg/kg and 232 mg/kg, respectively.
4.0 REMEDIAL INVESTIGATION RESULTS
ES022008005PHX 4-9
4.1.4.4
Taken collectively, these data indicate that the current smelter operations area have resulted in elevated arsenic impacts above the background level of 12.7 mg/kg (for the Qo geologic map unit) and the R-SRL of 10 mg/kg.
Copper Impacts. Figure 4-7 presents the soil sample locations with posted copper concentrations near the current smelter (PSMT, SD, and SDD areas).
The single sample collected from the PSMT area (PSMT-01-SED-0) showed a significantly elevated copper level of 380,000 mg/kg (38%), while the single sample from the SD area (SD-01-SED-01) showed an elevated concentration of 47,200 mg/kg. For the SDD area, samples SDD-03-SED-0 and SDD-01-SED-0 showed the highest copper levels, at 27,000 mg/kg and 12,100 mg/kg, respectively.
Taken collectively, these data indicate that the current smelter operations area have resulted in elevated copper impacts above the background level of 1,193 mg/kg (for the Qo geologic map unit) and the R-SRL of 3,100 mg/kg.
Lead Impacts. Figure 4-8 presents the soil sample locations with posted lead concentrations near the current smelter (PSMT, SD, and SDD areas).
The single sample collected from the PSMT area (PSMT-01-SED-0) showed the highest lead concentration (1,230 mg/kg) of any nonresidential soil samples, while the single sample from the SD area (SD-01-SED-01) showed a lead concentration of 468 mg/kg; both exceeding the R-SRL of 400 mg/kg. For the SDD area, samples SDD-01-SED-0 and SDD-02-SED-0 showed the highest lead levels, at 308 mg/kg and 220 mg/kg, respectively.
Taken collectively, these data indicate that the current smelter operations area have resulted in elevated lead impacts above the background level of 60.4 mg/kg (for the Qo geologic map unit), with two exceedances of the R-SRL of 400 mg/kg.
Other Metals—Molybdenum, Vanadium, and Iron. For molybdenum, the R-SRL of 390 mg/kg is exceeded in one sample from the smelter area: SD-01-SED-0 (1,060 mg/kg). No soil samples from the smelter area showed vanadium exceedances. Finally, nearly all samples showed iron exceedances.
ASARCO Tailings Impoundment Property The RI efforts near the active tailings impoundments included the collection and analysis of eight surface soil samples from the TPA area, and four surface soil samples from the TPD area. Samples were collected at the most recent deposition areas as shown in Figures 4-9 through 4-11.
Arsenic Impacts. Figure 4-9 presents the soil sample locations with posted arsenic concentrations near the active tailings impoundments (TPA and TPD areas).
For the TPA area, four of eight samples showed arsenic above background levels, including TPA-08-SED-0 (27.3 mg/kg), TPA-04-SED-0 (24.5 mg/kg), TPA-03-SED-0 (21.8 mg/kg), and TPA-07-SED-0 (13.7 mg/kg). For the TPD area, only one of the four samples showed arsenic levels above background: TPD-04-SED-0 (18.1 mg/kg).

4.0 REMEDIAL INVESTIGATION RESULTS
4-10 ES022008005PHX
4.1.4.5
Taken collectively, these data indicate that soils in TPA show slightly elevated arsenic levels, whereas soils in TPD do not show widespread occurrence of arsenic levels above background.
Copper Impacts. Figure 4-10 presents the soil sample locations with posted copper concentrations near the active tailings impoundments (TPA and TPD areas).
For the TPA area, all eight samples showed copper levels above background levels, but only one sample (TPA-06-SED-0, 3,730 mg/kg) had a copper concentration above the R-SRL of 3,100 mg/kg. For the TPD area, all four samples showed levels above background, and two samples (TPD-04-SED-0 at 6,000 mg/kg, and TPD-02-SED-0 at 3,920 mg/kg) showed copper levels above the R-SRL.
Taken collectively, these data indicate that soils in TPA and TPD show slightly elevated copper levels above background, with limited exceedances of the R-SRL.
Lead Impacts. Figure 4-11 presents the soil sample locations with posted lead concentrations near the active tailings impoundments (TPA and TPD areas).
For the TPA area, three of the eight samples showed lead levels above background, but no samples exceeded the R-SRL of 400 mg/kg. For the TPD area, all four samples showed lead levels near or below background levels, and well below the R-SRL.
Taken collectively, these data indicate that soils in TPA and TPD do not show widespread elevated lead impacts.
Other Metals—Molybdenum, Vanadium, and Iron. For molybdenum, there are no R-SRL exceedances in the TPA and TPD samples. One soil sample (TPA-07-SED-0) showed an exceedance for vanadium (79.4 mg/kg). Finally, one sample showed an iron exceedance (TPA-07-SED-0 at 36,100 mg/kg).
Hayden Wash Areas The RI efforts near the adjacent washes included the collection and analysis of 15 surface soil samples and five subsurface soil samples from PHW, 10 surface soil samples from KAW, and 17 surface soil samples from SPW. All soil sample results for these locations can be found in Table 4-4 and 4-7.
Arsenic Impacts. Figure 4-2 presents the surface soil sample locations with posted arsenic concentrations in the adjacent washes (PHW, KAW, and SPW areas). For the PHW area, 10 of the 15 surface soil sample results exceed background, with the highest arsenic concentration in PHW-SED-05AS (77.4 mg/kg). The arsenic levels in all five PHW subsurface soil samples exceed background, with the highest concentration in PHW-SED-02BS (37.9 mg/kg).
For the KAW area, seven samples collected along the lower reaches of the wash, where the former tailings deposition is visible, showed arsenic levels below background. The following three samples collected along the upper reach of the wash, closer to the concentrator operations and slightly outside the former tailings deposition area, showed arsenic levels above background: KAW-10-SED-0 (22 mg/kg), KAW-09-SED-0 (21.6 mg/kg) and KAW-06-SED-0 (15.5 mg/kg).
4.0 REMEDIAL INVESTIGATION RESULTS
ES022008005PHX 4-11
For the SPW area, 13 of the 17 samples showed arsenic levels above background, with the highest concentrations along the upper reaches of the wash, closer to the former KS area, in samples SPW-SED-02AS (29.7 mg/kg) and SPW-SED-06AS (28.9 mg/kg).
These data indicate that the PHW area has been impacted by nearby crusher and concentrator operations. The former tailings in the KAW area do not show elevated arsenic impacts, whereas soils in the upper reaches of the KAW and SPW areas do show arsenic impacts.
Copper Impacts. Figure 4-3 presents the surface soil sample locations with posted copper concentrations in the adjacent washes (PHW, KAW, and SPW areas). For the PHW area, all 11 of 15 surface soil sample results exceeded background and the R-SRL for copper, with the highest copper concentration in PHW-SED-05AS (12,200 mg/kg). The copper levels in all five PHW subsurface soil samples exceed background and the R-SRL, with the highest concentration in PHW-SED-02BS (11,100 mg/kg).
For the KAW area, most samples collected along the lower reaches of the wash, where the former tailings deposition area is located, showed copper levels near or below background levels and generally below the R-SRL of 3,100 mg/kg with the exception of KAW-03-SED-0 (3,920 mg/kg). The following three samples collected along the upper reach of the wash, closer to the concentrator operations and slightly outside the former tailings deposition area, showed copper levels above the R-SRL: KAW-09-SED-0 (13,500 mg/kg), KAW-10-SED-0 (9,620 mg/kg) and KAW-06-SED-0 (4,720 mg/kg).
For the SPW area, 16 of the 17 samples showed copper levels above background, with the highest concentrations along the upper reaches of the wash, closer to the former KS area, in samples SPW-SED-02AS (12,500 mg/kg) and SPW-SED-01AS (10,500 mg/kg).
These data indicate that the PHW area has been impacted by nearby crusher and concentrator operations. The former tailings in the KAW area do not show elevated copper impacts, whereas soils in the upper reaches of the KAW and SPW areas do show copper impacts.
Lead Impacts. Figure 4-4 presents the surface soil sample locations with posted lead concentrations in the adjacent washes (PHW, KAW, and SPW areas).
For the PHW area, nearly all 15 surface soil sample results exceeded background lead levels, but no samples exceeded the R-SRL of 400 mg/kg. The highest lead concentration is in PHW-SED-05AS (242 mg/kg). The lead levels in four of the five PHW subsurface soil samples exceed background but not the R-SRL, with the highest concentration in PHW-SED-02BS (140 mg/kg).
For the KAW area, all samples collected along the lower reaches of the wash, where the former tailings deposition area is visible, showed lead levels below background and below the R-SRL. The following three samples collected along the upper reach of the wash, closer to the concentrator operations and slightly outside the former tailings deposition area, showed lead levels above background but still below the R-SRL: KAW-10-SED-0 (97.7 mg/kg), KAW-06-SED-0 (81.5 mg/kg), and KAW-09-SED-0 (64.9 mg/kg).
For the SPW area, most of the 17 samples showed lead levels near or below background, and all results are below the R-SRL. The highest concentration was in a sample along the
4.0 REMEDIAL INVESTIGATION RESULTS
4-12 ES022008005PHX
4.1.4.6
middle reach of the wash, closer to the former KS area, in sample SPW-SED-06AS (129 mg/kg).
These data indicate that the adjacent wash areas contain some soils with levels above background, but these areas have not been impacted above the R-SRL. The former tailings in the KAW area do not show elevated lead impacts.
Other Metals—Molybdenum, Vanadium, and Iron. For molybdenum, there are no R-SRL exceedances in the wash area samples. One soil sample (PHW-SED-11AS at 79.8 mg/kg) showed an exceedance for vanadium. Finally, nearly all PHW and SPW samples show iron exceedances (Table 4-7).
Surface to Subsurface Comparison of Results. All five subsurface samples collected in PHW exceeded the R-SRL for arsenic and copper, but not for lead. When compared to the surface samples associated with each subsurface sample location, the concentrations in the subsurface samples tend to be lower than the surface samples. However, three samples (PHW-SED-02BS, PHW-SED-06BS, and PHW-SED-08BS) had copper concentrations greater than the associated surface samples (Table 4-7).
Non-ASARCO Properties The RI efforts on non-ASARCO properties included the collection and analysis of the following:
• Hayden Public Areas (HPUB - 9 surface and 10 subsurface soil samples • Hayden Golf Club (HGC - 33 surface and one subsurface soil samples • Winkelman School Complex (WSC - 38 surface soil samples • Winkelman School Housing Lot A (WSCLA) - 7 surface and one subsurface soil sample • Winkelman School Housing Lot B (WSCLB) - 9 surface and one subsurface soil sample • Winkelman School Housing Lot C (WSCLC) - 9 surface and one subsurface soil sample • State Route 77 (SR77 – 3 surface and 3 subsurface soil samples • Upland Areas (UP and UPA – 12 surface and 12 subsurface soil samples
Arsenic Impacts. Figures 4-2, 4-6, and 4-9 present the surface soil sample locations with posted arsenic concentrations in the non-ASARCO properties. The surface and subsurface soil sample results for arsenic for these areas are presented in Tables 4-6 and 4-7.
For the HPUB area, five of the nine surface soil sample results exceeded background and the R-SRL, with the highest arsenic concentration in HPUB-01-SED-0 (60.9 mg/kg) located near the pool within the Hayden public park area. The arsenic levels in three of the 10 HPUB subsurface soil samples exceed background, with the highest concentration also in HPUB-01-SED-1 (26.4 mg/kg).
For the HGC area, the data results fall into two groups. All 23 samples collected on the central and eastern portion of the golf course (HGC-01 through HGC-23) were below background levels for arsenic. However, 9 of the 10 surface soil samples collected on the far western edge of the golf course, adjacent to TPA, showed arsenic levels above background and above the R-SRL of 10 mg/kg. The highest concentration was in HGC-30-SED-0 (87.8 mg/kg). The single subsurface soil sample (HGC-30-SED-1) was collected at this same location, and the result (6.5 mg/kg) is below background and the R-SRL.
4.0 REMEDIAL INVESTIGATION RESULTS
ES022008005PHX 4-13
For the WSC, WSCLA, WSCLB, and WSCLC areas, all surface and subsurface soil samples were below background except for a single surface sample (WSC-01-SED-0, 14.9 mg/kg) located near the northern end of the school complex.
For the SR77 area, two of the three surface soil samples exceeded background, with the highest concentration in SR77-01-SED-0 (39.1 mg/kg). All three subsurface soil samples exceeded background, with the highest concentration in SR77-02-SED-0.3 (31.4 mg/kg).
Finally, for the UP and UPA areas, arsenic results are below background for all samples except those collected in relatively close proximity to ASARCO operations, including UP-02-SED-0 (70 mg/kg) south of the smelter area, and UPA-08-SED-0 (27.2 mg/kg) just west of SPW. The arsenic results from two subsurface soil samples south of the smelter (UP-02-SED-1 at 31.3 mg/kg and UP-01-SED-1 at 13.2 mg/kg) also exceeded background.
These data indicate that several soil samples collected within the HPUB area, the western portion of HGC, SR77 area, and from two UP and UPA sample locations near ASARCO operations, exceeded the background and R-SRL for arsenic.
Copper Impacts. Figures 4-3, 4-7, and 4-10 present the surface soil sample locations with posted copper concentrations in the non-ASARCO properties. The surface and subsurface soil sample results for copper for these areas are presented in Tables 4-6 and 4-7.
For the HPUB area, six of the nine surface soil sample results exceeded the copper R-SRL of 3,100 mg/kg, with the highest concentration in HPUB-01-SED-0 (24,400 mg/kg), located near the pool within the Hayden public park area. The copper levels in three of the 10 HPUB subsurface soil samples exceed background, with the highest concentration in HPUB-10-SED-1 (8,210 mg/kg).
For the HGC area, the data results fall into two groups. Nearly all samples collected on the central and eastern portion of the golf course were below background and the R-SRL for copper. However, several surface soil samples collected on the far western edge of the golf course, adjacent to TPA, showed copper levels above the R-SRL of 3,100 mg/kg. The highest concentration was in HGC-22-SED-0 (14,700 mg/kg). The single subsurface soil sample (HGC-30-SED-1) showed copper well below background.
For the WSC, WSCLA, WSCLB, and WSCLC areas, all surface and subsurface soil samples were below the R-SRL of 3,100 mg/kg, and nearly all samples are below background.
For the SR77 area, two of the three surface soil samples exceeded the copper R-SRL, with the highest concentration in SR77-01-SED-0 (8,130 mg/kg). One of the three subsurface soil samples also slightly exceeded the R-SRL (SR77-02-SED-0.3 at 3,110 mg/kg).
Finally, for the UP and UPA areas, copper results are below background and the R-SRL for all samples except those collected in relatively close proximity to ASARCO operations, including UP-02-SED-0 (10,200 mg/kg) south of the smelter area, UPA-08-SED-0 (6,310 mg/kg) just west of SPW, and UPA-09-SED-0 (3,250 mg/kg) located north of TPA. The copper results from the subsurface soil sample south of the smelter (UP-02-SED-1 at 3,620 mg/kg) also exceeded the R-SRL.
4.0 REMEDIAL INVESTIGATION RESULTS
4-14 ES022008005PHX
These data indicate that several soil samples collected within the HPUB area, the western portion of HGC, the SR77 area, and from three upland area sample locations near ASARCO operations, exceeded the background and R-SRL for copper.
Lead Impacts. Figures 4-4, 4-8, and 4-11 present the surface soil sample locations with posted lead concentrations in these non-ASARCO properties. The surface and subsurface soil sample results for lead for these areas are presented in Table 4-6.
For the HPUB area, there were no exceedances of the lead R-SRL of 400 mg/kg, although five of the nine surface soil sample results exceeded the lead background, with the highest concentration in HPUB-01-SED-0 (209 mg/kg), located near the pool within the Hayden public park area. The lead levels in three of the 10 HPUB subsurface soil samples exceed background, with the highest concentration in HPUB-01-SED-0 (89.5 mg/kg).
For the HGC area, the data results fall into two groups, although all samples in the HGC area are below the R-SRL for lead. All samples collected on the central and eastern (HGC-01 through HGC-23) portion of the golf course were below background for lead. However, several surface soil samples collected on the far western edge of the golf course, adjacent to the tailings impoundment, showed lead levels above background. The highest lead concentration was in HGC-29-SED-0 (227 mg/kg). The single subsurface soil sample (HGC-30-SED-1 at 15.7 mg/kg) showed lead well below background.
For the WSC, WSCLA, WSCLB, and WSCLC areas, all surface and subsurface soil samples were below the R-SRL of 400 mg/kg, and nearly all samples are below background.
For the SR77 area, all surface and subsurface samples were below the lead R-SRL of 400 mg/kg. Two of the three surface samples were above background, with the highest concentration in SR77-01-SED-0 (231 mg/kg). Two of the three subsurface soil samples also slightly exceeded background (SR77-02-SED-0.3 at 114 mg/kg and SR77-03-SED-0.33 at 73.8 mg/kg).
Finally, for the upland areas, UP and UPA samples, all results are below the lead R-SRL of 400mg/kg. Also, lead results are below background for all samples except those collected near ASARCO operations, including UP-02-SED-0 (247 mg/kg) south of the smelter area, UPA-08-SED-0 (143 mg/kg) just west of SPW, and UPA-09-SED-0 (84.4 mg/kg) located north of TPA. The lead results from one subsurface soil sample (UP-02-SED-1 at 94.8 mg/kg) also exceeded background.
These data indicate that no exceedance of the lead R-SRL was found in soil samples collected on non-ASARCO property. However, several soil samples collected within the HPUB area, the western portion of HGC, the SR77 area, and from three UP And UPA sample location, exceeded the background level for lead.
Other Metals—Molybdenum, Vanadium, and Iron. For molybdenum, there are no R-SRL exceedances in the non-ASARCO area samples. One HGC soil sample (HGC-33-SED-0 at 105 mg/kg) and one upland sample (UPA-01-SED-0 at 86.3 mg/kg) showed an exceedance for vanadium (Table 4-7). Finally, one HPUB sample (HPUB-01-SED-0 at 30,800 mg/kg), two HGC samples (HGC-30-SED-0 at 25,900 mg/kg and HGC-33-SED-0 at 46,600 mg/kg), and one SR77 sample (SR77-01-SED-0 at 27,200) showed an exceedance for iron.
4.0 REMEDIAL INVESTIGATION RESULTS
ES022008005PHX 4-15
4.1.5.1
4.1.5.2
Surface to Subsurface Comparison of Results. The subsurface concentrations are considerably lower than the surface samples. There were 10 subsurface samples that had a greater concentration of arsenic, copper, or lead than the associated surface sample. The concentrations exhibited in the 10 subsurface samples were similar to the concentrations of the associated surface sample with the exception; SR77-01-SED-1 had twice the concentrations of arsenic, copper, and lead than the associated surface sample (Table 4-7).
4.1.5 Nature and Extent of Distribution in Residential Soils This section presents the RI results for the residential soils and evaluates the nature and the extent of elevated metals concentrations. The discussion is organized based on the zones established during the sampling program. These designated zones are related to the location of the individual residential lots relative to ASARCO facilities. Although the RI included analysis of residential soil samples for the full TAL metals list, only arsenic, copper, and lead are considered COCs in residential soils (as described in Section 4.1.2), and are the focus of this section.
Approach to Data Evaluation As detailed in Section 3.2.3, the residential soil investigation included the collection of nine surface soil samples and one subsurface soil sample from 99 home parcels in Hayden and 31 home parcels in Winkelman. The samples were analyzed for arsenic, copper, and lead (a subset of these samples were also analyzed for the full TAL metals list). The surface soil sample results from each parcel were then compiled and summary statistics were generated, including the mean, maximum, and 95% upper confidence level (UCL) for arsenic, copper, and lead. The UCL is the concentration that 95% of the samples from a given yard will not exceed, and is considered a useful value to represent the overall level of surface soils impact in a given parcel. The UCL was then compared with the appropriate regulatory criteria (R-SRLs and PRGs) to assess whether an exceedance existed on that parcel, and with background metals concentrations. The single subsurface sample result was used to assess the relative depth of any impacts.
As described in Section 4.1.4.1, figures depicting the concentrations of arsenic, copper, and lead in residential soils were prepared to help assess the spatial variability of the data. The figures are color coded to show the relative concentration of arsenic, copper, and lead in the mapped area of interest. As discussed in Section 4.1.4.1, the same color-coding designations used to evaluate nonresidential soils impacts were also used for residential soils.
The RI residential soil sample results are presented separately for Hayden and Winkelman in the following sections. The extent of impacts from arsenic, copper, and lead was markedly different in Hayden compared to Winkelman. Elevated concentrations are relatively widespread in Hayden, but limited to a relatively few parcels in Winkelman.
Hayden Residential Soils This section presents the results of soil sampling conducted at the 99 residential parcels in Hayden. Table 4-8 presents the mean, maximum, and UCL values of arsenic, copper, and lead for each Hayden residential parcel, while Table 4-9 presents the TAL metals for which any exceedances occurred for all individual residential soil samples in Hayden. Figures 4-12 through 4-17 present the surface and subsurface soil sampling results individually for
4.0 REMEDIAL INVESTIGATION RESULTS
4-16 ES022008005PHX
arsenic, copper and lead. The results are presented for each metal in the following sections based on proximity to ASARCO operations.
Arsenic. Figure 4-12 presents the mean, maximum, and UCL values for residential surface soil samples on an aerial base map of Hayden, along with the nearby nonresidential surface soil results. Figure 4-13 presents the results of the single subsurface soil sample collected on each residential parcel. For this section, the main comparison criteria are the Arizona R-SRL of 10 mg/kg, the background value (per Table 4-2, the UTL value for Ts soils) of 12.5 mg/kg, and the non-cancer risk HI of 1 value of 26 mg/kg.
Only one parcel in Hayden has an arsenic UCL concentration below the R-SRL of 10 mg/kg. This parcel (101-07-185C at 9.02 mg/kg) is located in Zone 1, the most distant zone in Hayden from the concentrator operations. Also, four other parcels display arsenic UCL concentrations just over the R-SRL but below the background value of 12.5 mg/kg; these parcels (101-07-202, 101-07-234, 101-07-244, and 101-07-247) are all located in nearby Zones 2 and 3, which are the next most distant zones from active operations. The remaining 94 parcels in Hayden display UCL values above both the R-SRL and background values. The UCL concentrations in these 94 parcels range from 13.4 mg/kg in parcel 101-07-259, (Zone 4), to 540 mg/kg in parcel 101-07-089T (Zone 9, just south of the former KS area).
As shown on Figure 4-12, the highest arsenic concentrations are in Zones 7, 8, 9, 10, 16, and 17 located south of the former KS area and west and south of the active concentrator operations. Of the parcels sampled in these three zones, nearly all display arsenic UCL concentrations above the arsenic non-cancer HI of 1 value of 26 mg/kg. The second highest arsenic UCL concentration among all Hayden parcels (221 mg/kg in parcel 101-09-140) is located in Zone 16. The next most impacted area is represented by Zones 12, 13, 14, and 15, located in eastern Hayden and adjacent to ASARCO’s concentrator facility. In these zones, many parcels also contain arsenic UCL concentrations above the arsenic non-cancer HI of 1 value of 26 mg/kg.
As indicated on Figure 4-13, the subsurface arsenic soil concentrations are considerably lower than surface soil concentrations. Nearly half of the subsurface soil samples (46 samples) display arsenic concentrations below the R-SRL. Seven subsurface samples are above the non-cancer HI value of 1 value of 26 mg/kg, and these samples are generally located in zones adjacent to concentrator operations. The highest concentrations in subsurface soil samples occur in parcel 101-07-010 in Zone 10 (74 mg/kg) and in parcel 101-09-108 in Zone 16 (58.1 mg/kg); in these two parcels, the subsurface arsenic concentration exceeds the arsenic UCL for the surface soil samples.
Copper. Figure 4-14 presents the mean, maximum, and UCL values for residential surface soil samples in Hayden. Figure 4-15 presents the results of the single subsurface soil sample collected on each residential parcel. For this section, the main comparison criteria are the Arizona R-SRL of 3,100 mg/kg and the background value (per Table 4-2, the UTL value for Ts soils) of 1,270 mg/kg.
Only nine of the 99 parcels in Hayden have copper UCL concentrations below the R-SRL of 3,100 mg/kg. Eight of these nine parcels are located in Zones 1-4, the most distant zones in Hayden from the concentrator operations. However, all nine of these parcels have copper UCL concentrations above the background value of 1,270 mg/kg. The remaining 90 parcels
4.0 REMEDIAL INVESTIGATION RESULTS
ES022008005PHX 4-17
in Hayden display UCL values above the R-SRL and, therefore, well above background value. The UCL concentrations in these 90 parcels range from 3,350 mg/kg in parcel 101-07-259, (Zone 4), to 39,700 mg/kg in parcel 101-09-140 (Zone 16, near the active concentrator operations).
As shown on Figure 4-14, the pattern of elevated copper concentrations is similar to that displayed for arsenic. The highest copper concentrations are in Zones 7-9, located south of the former KS area and west of the active concentrator operations, and in Zones 10 and 16, located in northeast Hayden and immediately adjacent to ASARCO’s concentrator facility.
As indicated on Figure 4-15, the subsurface copper soil concentrations are considerably lower than surface soil concentrations. All but 24 of the 99 subsurface soil samples display copper concentrations below the R-SRL. Most of the subsurface soil samples with concentrations below the R-SRL are also below the background value, although several parcels, primarily those located closer to active concentrator operations, are above background values. The highest concentrations in subsurface soil samples occur in parcel 101-07-110 in Zone 8 (17,100 mg/kg) in the KAW area, and in parcel 101-09-108 in Zone 16 (11,300 mg/kg); in these two parcels, the subsurface copper concentration exceeds the copper UCL for the surface soil samples.
Lead. Figure 4-16 presents the mean, maximum, and UCL values for residential surface soil samples in Hayden. Figure 4-17 presents the results of the single subsurface soil sample collected on each residential parcel. For this section, the main comparison criteria are the background value (per Table 4-2, the UTL value for Ts soils) of 47.9 mg/kg, the screening level of 212 mg/kg (as described in Section 4.1.4.1), and the Arizona R-SRL of 400 mg/kg.
All 99 parcels in Hayden have lead UCL concentrations above the background value of 47.9 mg/kg. Approximately 70% (70 parcels) have lead UCL concentrations above the screening level of 212 mg/kg, and about 45% (45 parcels) are above the R-SRL of 400 mg/kg.
The lowest lead UCL concentration is in parcel 101-07-185C (51.8 mg/kg), located in Zone 1, the most distant zone in Hayden from the concentrator operations. The highest lead UCL concentrations are in parcel 101-09-088 (92,600 mg/kg, Zone 15), parcel 101-09-004 (8,170 mg/kg, Zone 12), and parcel 101-09-077 (7,250 mg/kg, Zone 14), located in central Hayden. The lead concentration in the Zone 15 parcel is anomalously high (an order of magnitude above the next highest values) and exceeds levels in nonresidential soil samples on ASARCO property, suggesting that other possible sources of lead may be present on this parcel. Overall, the largest percentage of parcels with lead UCL concentrations above the R-SRL are in Zones 10, 12, 13, 14, and 16, located in relatively close proximity to concentrator operations. As indicated on Figure 4-16, the lead values in nonresidential soil samples collected on the concentrator property are above background, but below the R-SRL and in most cases below the UCL values in nearby residential parcels. These data indicate that ASARCO operations may be a source of lead, along with other sources such as lead-based paint.
As indicated on Figure 4-17, the subsurface lead soil concentrations are considerably lower than surface soil concentrations. Approximately 30% (30 parcels) have lead concentrations below the background value. Regarding exceedances, 12 parcels have lead values above the
4.0 REMEDIAL INVESTIGATION RESULTS
4-18 ES022008005PHX
4.1.5.3
screening value of 212 mg/kg, and seven parcels have lead values above the R-SRL of 400 mg/kg. Lead concentrations in these seven lots range from 433 mg/kg to 1,340 mg/kg and are located in Zones 2, 8, 10, 12, 13, 14, and 16.
Other Metals—Molybdenum, Vanadium, and Iron. As described in Section 4.1.4.2, most of the exceedances for molybdenum, vanadium, and iron are in nonresidential soils near the former KS and concentrator operations. Figure 4-8 and Table 4-9 present individual (not UTL) residential and nonresidential soil sample locations in Hayden with exceedances of the R-SRL and/or PRG for vanadium and iron (there were no molybdenum exceedances). Only one residential parcel in the northern end of Zone 8, just south of the former KS area, displayed an exceedance for vanadium (101-07-091 , 80.7 mg/kg) above the R-SRL of 78 mg/kg.
Iron exceedances occur at 59 of the 99 investigated lots in Hayden. The highest iron concentrations are in Zone 9 parcels 101-07-035AS (84,400 mg/kg) and 101-07-062 (78,300 mg/kg), located south of the former KS area, which are about three times the PRG of 23,000 mg/kg. The iron exceedances follow a similar pattern as the arsenic and lead exceedances, with higher concentrations in zones closer to concentrator operations.
Winkelman This section presents the results of soil sampling conducted at the 31 residential parcels in Winkelman. Table 4-10 presents the mean, maximum, and UCL values of arsenic, copper, and lead for each Winkelman residential parcel, while Table 4-11 presents the TAL metals for which any exceedances occurred for all individual residential soil samples in Winkelman. Figures 4-18 through 4-23 present the surface and subsurface soil sampling results individually for arsenic, copper, and lead. The results are presented for each metal in the following sections.
Soil impacts in Winkelman are not widespread and appear to be limited to a few areas in the southern part of town. The school areas have low COC concentrations.
Arsenic. Figure 4-18 presents the mean, maximum and UCL values for residential surface soil samples on an aerial base map of Winkelman, along with the nearby nonresidential surface soil results. Figure 4-19 presents the results of the single subsurface soil sample collected on each residential parcel. For this section, the main comparison criteria are the Arizona R-SRL of 10 mg/kg and the background value (per Table 4-2, the UTL value for Qo soils) of 9.1 mg/kg.
Only five of the 31 parcels in Winkelman have arsenic UCL concentrations above the R-SRL (and therefore also above the background value). The arsenic UCL concentrations in these five parcels range from 16.6 mg/kg (parcel 101-12-142) to 112 mg/kg (parcel 101-12-071). These parcels are all located in Zones 18, 19, and 21, in the central and southern areas of Winkelman.
As indicated on Figure 4-19, the subsurface arsenic soil concentrations are generally lower than surface soil concentrations. Only one subsurface soil sample (101-12-008J, 12.3 mg/kg) exceeds the R-SRL; this subsurface soil sample along with subsurface soil sample (101-10-019, 9.4 mg/kg) exceeds the background UTL of 9.1 mg/kg.
4.0 REMEDIAL INVESTIGATION RESULTS
ES022008005PHX 4-19
4.1.6.1
Copper. Figure 4-20 presents the mean, maximum, and UCL values for residential surface soil samples. Figure 4-21 presents the results of the single subsurface soil sample collected on each residential parcel. For this section, the main comparison criteria are the Arizona R-SRL of 3,100 mg/kg and the background value (per Table 4-2, the UTL value for Qo soils) of 882 mg/kg.
Only two of the 31 parcels in Winkelman have copper UCL concentrations above the R-SRL. The copper exceedances are found in two neighboring parcels in Zone 21: parcel 101-12-149 (5,130 mg/kg) and 101-12-150 (4,410 mg/kg). Arsenic UCL exceedances were also found for these two parcels. In addition, parcels 101-12-142 (1,390 mg/kg) in zone 21 and parcel 101-12-093 (1,040 mg/kg) in zone 20 exceeded the background value. All other copper UCL concentrations in Winkelman parcels are below the background level.
As indicated on Figure 4-21, all subsurface copper concentrations are below both the background and R-SRL values in all samples.
Lead. Figure 4-22 presents the mean, maximum, and UCL values for residential surface soil samples. Figure 4-23 presents the results of the single subsurface soil sample collected on each residential parcel. For this section, the main comparison criteria are the background value (per Table 4-2, the UTL value for Qo soils) of 45.8 mg/kg, the screening level of 212 mg/kg (as described in Section 4.1.4.1), and the Arizona R-SRL of 400 mg/kg.
Only five of the 31 parcels in Winkelman have lead UCL concentrations above the R-SRL. The highest lead exceedance is found in Zone 21 parcel 101-12-149 (2,330 mg/kg). Five additional parcels have lead UCL concentrations above the screening level of 212 mg/kg. Of the remaining 21 Winkelman parcels, 18 display lead UCL concentrations above the background concentration of 45.8 mg/kg. Because nonresidential soil samples collected in the northern part of Winkelman are generally below background lead levels, the residential soils data suggest that some limited lead-based paint impacts may exist as wells as other industrial sources in the southern part of town.
As indicated on Figure 4-23, the subsurface lead concentrations are below the R-SRL values in all samples. Only two samples (101-12-102 at 283 mg/kg and 101-12-008J at 229 mg/kg) exceed the screening level of 212 mg/kg. Nine additional samples exceed the background value of 45.8 mg/kg. Overall, the subsurface lead impacts are relatively limited.
Other Metals—Molybdenum, Vanadium, and Iron. Iron is the only metal besides arsenic, copper, and lead that exceeds comparison criteria in Winkelman soils. Only one exceedance of the iron PRG of 23,000 mg/kg was found in a single Winkelman residential sample from parcel 101-12-023A (25,500 mg/kg). The iron concentrations in Winkelman are considerably lower than levels in Hayden.
4.1.6 Fate and Transport This section discusses the chemistry of COCs, transport properties, and potential pathways that may help explain the results observed at the Site.
COC Characteristics—Overview The following sections summarize the chemical characteristics of the COCs identified in the previous sections. The discussion is limited to those COCs found within all soils at increased
4.0 REMEDIAL INVESTIGATION RESULTS
4-20 ES022008005PHX
frequencies and concentrations (arsenic, copper, lead, iron). While there were several exceedances of molybdenum and vanadium, these are largely limited to areas around the concentrator and former KS operations and do not indicate widespread impacts. This information has been extracted from Remediation Technologies Screening Matrix, Version 4.0, Federal Remediation Technologies Roundtable, www.frtr.gov/matrix2/).
4.1.6.2
4.1.6.3
4.1.6.4
Arsenic Characteristics Arsenic occurs as part of the primary sulfide mineralization found in the ore processed by the ASARCO smelter. These primary mineral sulfides containing the arsenic oxidize when exposed to atmospheric conditions and the released arsenic becomes a negatively charged oxygenated ion. It is initially released from the smelter in its reduced more mobile and toxic form, arsenite (AsIII, or arsenic trioxide). This form of arsenic becomes further oxidized in the near surface environment to arsenate (AsV). In this respect, arsenic portrays the general chemical characteristics as molybdenum, vanadium, and antimony that also form negatively charged oxygenated ions. Arsenic in surface soils is usually in the oxidized arsenate form mostly adsorbed to iron-oxyhydroxide/ oxide that gives soils the yellow, brown, and red coloration. However, it can also become adsorbed to aluminum oxyhydroxide/oxide (major clay component) and to a significantly lesser extent can precipitate as a calcium arsenate or arsenite. The reduced arsenite form is much less likely to be adsorbed to iron oxyhydroxide than the oxidized arsenate and is therefore more mobile. Arsenic adsorption increases with decreasing pH and can become desorbed at pH values above about 7.5. Only hydroxide and orthophosphate are adsorbed more effectively on iron oxyhydroxide/oxide than arsenate. Therefore, unless the soil becomes anaerobic (exclusion of oxygen), the pH becomes fairly alkaline or orthophosphate is present in the water, arsenic remains adsorbed to surface soils.
Copper Characteristics Copper also occurs as part of the primary sulfide mineralization found in the ore processed by the ASARCO smelter. When released to the atmosphere, copper forms a positively charged ion. Soil can retain copper through ion exchange (e.g., calcium), adsorption to iron oxyhydroxide/oxide and/or precipitated as blue or green copper carbonate minerals. As with other positively charged ions and unlike negatively charged ions like arsenic, copper is increasingly adsorbed with increasing pH and more mobile under acidic conditions. Copper is adsorbed to iron oxyhydroxide/oxide more strongly than any other positively charged metal, except lead. Copper, however, has a high affinity to soluble organic ligands. The formation of organic complexes may greatly increase its mobility in soil. Copper has a high toxicity to aquatic organisms.
Lead Characteristics Lead can also occur as part of the primary sulfide mineralization found in the ore processed by the ASARCO smelter. When released to the atmosphere, lead, as a positively charged ion, has similar characteristics as copper. It is readily adsorbed by iron oxyhydroxide/oxide as pH increases and more mobile under acidic conditions. Lead forms a relatively insoluble carbonate mineral (cerrusite). However, in addition, it also forms an insoluble orthophosphate mineral (pyromorphite). Therefore, it is not as mobile as either copper or arsenic under near surface soil conditions.
4.0 REMEDIAL INVESTIGATION RESULTS
ES022008005PHX 4-21
4.1.6.5
4.1.6.6
4.1.6.7
Lead tends to accumulate in the soil surface, usually within 3 to 5 centimeters of the surface. Lead concentrations from anthropogenic sources generally decrease with depth. Insoluble lead sulfide is typically immobile in soil as long as reducing conditions are maintained.
The capacity of soil to adsorb lead increases with pH, cation exchange capacity, organic carbon content, soil/water Eh (redox potential), and orthophosphate levels. Lead exhibits a high degree of adsorption on clay-rich soil. Only a small percent of the total lead is typically leachable; the major portion is usually solid or adsorbed onto soil particles. Surface runoff, which can transport soil particles containing adsorbed lead, facilitates migration and subsequent desorption from contaminated soils. On the other hand, groundwater (typically low in suspended solids and leachable lead salts) does not normally create a major pathway for lead migration.
It is also important to recognize that other sources of lead in soil, including lead-based paint, can exist, especially in older communities such as Hayden and Winkelman. The use of lead based paint used in residential structures was banned in 1978.
Iron Characteristics Iron is the fourth most abundant element in the earth’s crust, of which it constitutes about five percent by weight. Iron is everywhere in soils and sediment. Its mobility is controlled by both pH and redox potential. It is typically immobile in the surface soil environment. The presence of iron at the Site is not necessarily of concern as a COPC. However, its presence affects the mobility and speciation of other constituents, including arsenic as described above.
Transport Processes The primary sources of copper, arsenic, and to a lesser extent lead are sulfide minerals processed at the former Kennecott and current ASARCO operations. The main release mechanisms consist of historic stack and fugitive emissions from abandoned impoundments at historic operations facilities, as well as emissions from current ore transfer, concentrator, smelter, and tailings impoundments. Spills, discharges, and runoff from facilities the various facilities are also considered sources at the Site.
Secondary sources and release mechanisms, which redistribute these elements from the primary sources, involve wind, onsite and offsite soils, tailings impoundments, and surface runoff. For the off-facility soils and tailings impoundments, the secondary possible release mechanisms are resuspension to outdoor air (wind and mechanical), adherence attributing to indoor dust (shoes, vehicles, clothing), direct contact of soils and tailings impoundments, uptake, surface water runoff with entrained sediments, and leaching to groundwater. The on-facility soils could possibly undergo resuspension (wind and mechanical) and entrainment in surface water runoff and leaching to groundwater. Historic movement of soil and waste material from industrial areas to residential areas has also taken place.
Contaminant Migration Trends Arsenic and Copper. The highest concentrations of arsenic and copper in soils are observed in nonresidential soils on and adjacent to ASARCO property. Specifically, the highest concentrations are in soils collected around the concentrating operations area, the former KS area, and the CF, where arsenic and copper levels are well above background and
4.0 REMEDIAL INVESTIGATION RESULTS
4-22 ES022008005PHX
R-SRLs (Figures 4-2 and 4-3). Two ore dust samples collected below Conveyor 9 showed copper concentrations at two to three times the R-SRL and arsenic concentrations slightly above background. Elevated arsenic and copper impacts were also observed in the smelter vicinity (including the slag dump area), although the extent of sampling was considerably less. These data indicate that the current concentrator and smelter facilities, and the former KS area, are the most heavily impacted areas of arsenic and copper in soils. The extent of impacts on these ASARCO properties was not defined as part of this study, as there are several areas where elevated concentrations were detected and perimeter “delineation” samples with lower concentrations do not exist.
The arsenic and lead concentrations in adjacent nonresidential areas and washes are lower than concentrations on ASARCO property, but are above background and R-SRLs (Figures 4-12 and 4-13). In particular, elevated arsenic and copper levels were found in soils in Hayden public areas, the Hayden golf club area adjacent to TPA, and in the upper reaches of the washes (PHW, KAW, and SPW). Sampling in lower reaches of these washes, south of SR77 and closer to the Gila River, was not conducted as part of this study and, therefore, the extent of impacts was not delineated. Sampling in lower elevation areas below the slag dump, toward the Gila River, was also not conducted as part of this study and, therefore, the extent of slag dump area impacts was not delineated.
The public areas surrounding the Winkelman School complex do not show elevated arsenic and copper concentrations.
Finally, elevated arsenic and copper concentrations are found in residential areas in Hayden, and to a far lesser extent in Winkelman:
• For arsenic, 95% (94 of 99 samples) of sampled parcels in Hayden, and only 16% (5 of 31) of sampled parcels in Winkelman, showed surface soil arsenic UCL concentrations above background and R-SRL levels.
• For copper, 90% (89 of 99 samples) of sampled parcels in Hayden, and only 10% (3 of 31) of sampled parcels in Winkelman, showed surface soil copper UCL concentrations above background and R-SRL levels.
The extent of impacts in Hayden residential soils is higher in areas adjacent to active concentrator operations and the former KS area. The arsenic and copper concentrations in these soils are likely the result of aerial deposition from industrial operations, with some discharges and runoff contributions from the concentrator facility and KS areas. Contaminated soil fill from industrial areas or operations also contributes to residential impacts. Impacts from the smelter facility on residential soils would result primarily from aerial deposition, due to the increased distance.
The subsurface concentrations of arsenic (Figure 4-13) and copper (Figure 4-15), although related to surface contamination, are much lower and are further controlled by the leachability characteristics of each element discussed above. In Hayden, several subsurface soil samples have arsenic and copper concentrations that are above R-SRLs, indicating more extensive, deeper impacts. However, in Winkelman, all subsurface soil samples have arsenic and copper concentrations below R-SRLs. Contaminated soil fill may account from some of the elevated subsurface concentrations
4.0 REMEDIAL INVESTIGATION RESULTS
ES022008005PHX 4-23
Lead. The highest concentrations of lead, with values above the R-SRL, were found in samples from the smelter area (including slag dump vicinity) and the former KS area (Figure 4-4). Elevated levels were also found in the PCON area, where concentrations were below the R-SRL, but considerably above background levels. These data indicate that the current concentrator and smelter facilities, and the former KS area, represent a source of lead impacts to soils. The extent of impacts on these ASARCO properties was not defined as part of this study, as there are several areas where elevated lead concentrations were detected and perimeter “delineation” samples with lower concentrations do not exist.
The lead concentrations in adjacent nonresidential areas and washes are lower than concentrations on ASARCO property (Figure 4-4). Concentrations in all samples from these areas were below the R-SRL, but many samples showed levels above background. In particular, lead levels above background were found in soils in Hayden public areas, the Hayden golf club area adjacent to TPA, and in the washes (PHW, KAW, and SPW). Sampling in lower reaches of the washes, south of SR77 and closer to the Gila River, was not conducted as part of this study and, therefore, the extent of impacts was not delineated.
The public areas surrounding the Winkelman School complex do not show elevated lead concentrations.
Unlike the arsenic and copper distribution pattern, the highest lead UCL concentrations are found in residential areas in Hayden, and to a far lesser extent in Winkelman. About 45% (45 of 99 samples) of sampled parcels in Hayden, and 16% (5 of 31) of sampled parcels in Winkelman, showed surface soil lead UCL concentrations above the R-SRL.
Overall, the largest percentage of parcels with lead UCL concentrations above the R-SRL is in parcels located near concentrator operations. However, some lead concentrations are anomalously high and indicate likely parcel-specific sources such as lead-based paint. Taken together, these data indicate that ASARCO operations may be a source of lead, along with other sources such as lead-based paint. Lead in these soils that resulted from ASARCO sources is likely the result of aerial deposition, with some discharges and runoff contributions from the concentrator facility and KS areas. Impacts from the smelter facility on residential soils would result primarily from aerial deposition, due to the increased distance.
The subsurface soil concentrations of lead are much lower than surface soil concentrations, with seven parcels showing R-SRL exceedances in Hayden, and no exceedances in Winkelman.
4.2 Surface Water Surface water samples were collected at 13 locations, including 11 locations along the Gila River and two locations along the San Pedro River. The 13 surface water samples were collected during two sampling events (Winter and Summer). The samples were analyzed for metals, general water quality parameters, and field parameters, and the results are presented in Tables 4-12 and 4-13. Figures 4-24 and 4-25 depict the sample locations, and also present concentrations for selected parameters.
4.0 REMEDIAL INVESTIGATION RESULTS
4-24 ES022008005PHX
This section presents the sampling results for surface water, including the general chemical characteristics and solute concentrations observed along the Gila and San Pedro Rivers, and also provides an evaluation of contaminant fate and transport. For purposes of the RI, the surface water sample results are compared with the Arizona Aquatic and Wildlife Quality Criteria (AAWWQC), which are based on ecological risks, and EPA tap water PRGs, which are based on human health risks.
As part of the evaluation of surface water results, histograms were prepared to present the water quality results. A histogram graphically presents results for various groups of data for a given sample, using stacked rectangles to depict the concentrations. For this study, the histograms are displayed together on figures, organized from upstream to downstream sample location. Each figure allows for a visual comparison of concentrations for each analyte group at locations that are upstream, adjacent to, and downstream of ASARCO operations. Figures 4-26 through 4-34 present the surface water histograms for the selected analyte groups.
A detailed evaluation of ecological impacts resulting from surface water concentrations is presented in the companion SLERA report, as summarized in Section 5.2.
4.2.1 Background Surface Water A thorough evaluation of background surface water quality was beyond the scope of the RI. However, locations GR-SW-01 and GR-SW-02 are located along the Gila River upstream of ASARCO operations, while SPR-SW-01 is located at the San Pedro River, south of Winkelman, and also upstream of ASARCO operations (see Figures 4-24 and 4-25). Hence, these sample locations are not considered to be affected by ASARCO operations and are deemed background locations for the purpose of this investigation. The background surface water sampling results for the two Gila River sample locations (GR-SW-01 and GR-SW-02) indicate the following:
• The water’s pH is circum-neutral to slightly alkaline, ranging from 7.26 to 7.99 and does not vary seasonally.
• The water is fully oxygenated, with dissolved oxygen (DO) concentrations fluctuating seasonally between 8.58 mg/L in the Summer event and 11.57 mg/L in the Winter event.
• The electrical conductivity values are approximately 1.0 milliSiemens per centimeter (mS/cm), with very little variance during sampling events.
All metal concentrations but arsenic are below AAWWQC and EPA PRG criteria. Total and dissolved arsenic concentrations are well below AAWWQC, but exceed the PRG criteria of 0.045 micrograms per liter (µg/L), with concentrations ranging from 2.5 µg/L to 7 µg/L. The arsenic concentrations in the Summer event samples were about twice the levels found in the Winter event samples. Total copper concentrations in GR-SW-01 and GR-SW-02 ranged from 4.9 µg/L to 15.4 µg/L, with concentrations 3 to 4 times higher in the Summer event relative to the Winter event. Total lead concentrations in GR-SW-01 and GR-SW-02 ranged from 0.68 µg/L to 4.6 µg/L, with concentrations several times higher in the Summer event relative to the Winter event. Concentrations for most other metals were also higher in the Summer event relative to the Winter event.
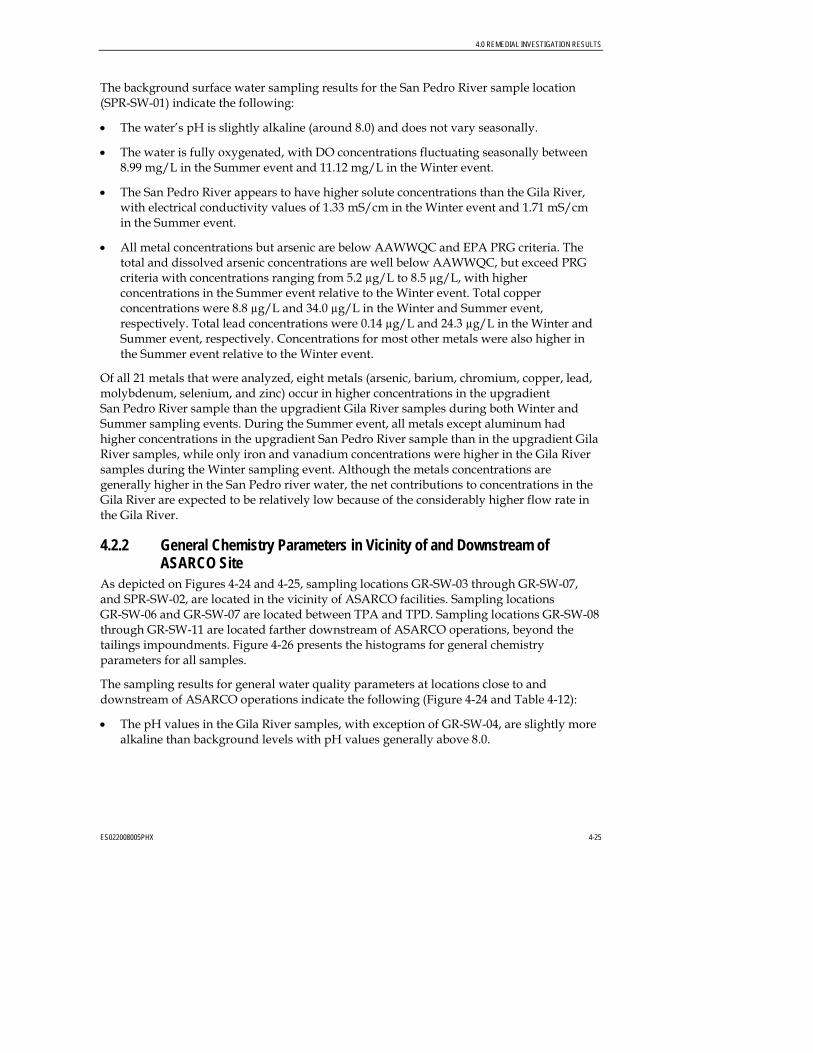
4.0 REMEDIAL INVESTIGATION RESULTS
ES022008005PHX 4-25
The background surface water sampling results for the San Pedro River sample location (SPR-SW-01) indicate the following:
• The water’s pH is slightly alkaline (around 8.0) and does not vary seasonally.
• The water is fully oxygenated, with DO concentrations fluctuating seasonally between 8.99 mg/L in the Summer event and 11.12 mg/L in the Winter event.
• The San Pedro River appears to have higher solute concentrations than the Gila River, with electrical conductivity values of 1.33 mS/cm in the Winter event and 1.71 mS/cm in the Summer event.
• All metal concentrations but arsenic are below AAWWQC and EPA PRG criteria. The total and dissolved arsenic concentrations are well below AAWWQC, but exceed PRG criteria with concentrations ranging from 5.2 µg/L to 8.5 µg/L, with higher concentrations in the Summer event relative to the Winter event. Total copper concentrations were 8.8 µg/L and 34.0 µg/L in the Winter and Summer event, respectively. Total lead concentrations were 0.14 µg/L and 24.3 µg/L in the Winter and Summer event, respectively. Concentrations for most other metals were also higher in the Summer event relative to the Winter event.
Of all 21 metals that were analyzed, eight metals (arsenic, barium, chromium, copper, lead, molybdenum, selenium, and zinc) occur in higher concentrations in the upgradient San Pedro River sample than the upgradient Gila River samples during both Winter and Summer sampling events. During the Summer event, all metals except aluminum had higher concentrations in the upgradient San Pedro River sample than in the upgradient Gila River samples, while only iron and vanadium concentrations were higher in the Gila River samples during the Winter sampling event. Although the metals concentrations are generally higher in the San Pedro river water, the net contributions to concentrations in the Gila River are expected to be relatively low because of the considerably higher flow rate in the Gila River.
4.2.2 General Chemistry Parameters in Vicinity of and Downstream of ASARCO Site
As depicted on Figures 4-24 and 4-25, sampling locations GR-SW-03 through GR-SW-07, and SPR-SW-02, are located in the vicinity of ASARCO facilities. Sampling locations GR-SW-06 and GR-SW-07 are located between TPA and TPD. Sampling locations GR-SW-08 through GR-SW-11 are located farther downstream of ASARCO operations, beyond the tailings impoundments. Figure 4-26 presents the histograms for general chemistry parameters for all samples.
The sampling results for general water quality parameters at locations close to and downstream of ASARCO operations indicate the following (Figure 4-24 and Table 4-12):
• The pH values in the Gila River samples, with exception of GR-SW-04, are slightly more alkaline than background levels with pH values generally above 8.0.
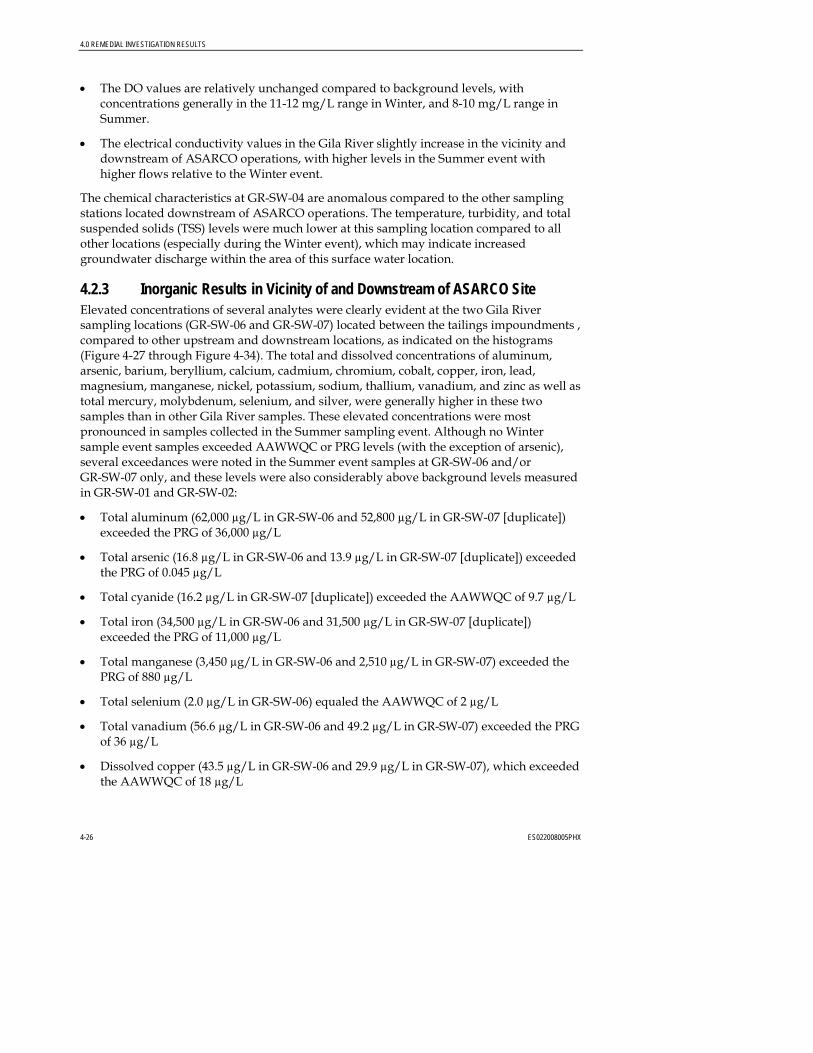
4.0 REMEDIAL INVESTIGATION RESULTS
4-26 ES022008005PHX
• The DO values are relatively unchanged compared to background levels, with concentrations generally in the 11-12 mg/L range in Winter, and 8-10 mg/L range in Summer.
• The electrical conductivity values in the Gila River slightly increase in the vicinity and downstream of ASARCO operations, with higher levels in the Summer event with higher flows relative to the Winter event.
The chemical characteristics at GR-SW-04 are anomalous compared to the other sampling stations located downstream of ASARCO operations. The temperature, turbidity, and total suspended solids (TSS) levels were much lower at this sampling location compared to all other locations (especially during the Winter event), which may indicate increased groundwater discharge within the area of this surface water location.
4.2.3 Inorganic Results in Vicinity of and Downstream of ASARCO Site Elevated concentrations of several analytes were clearly evident at the two Gila River sampling locations (GR-SW-06 and GR-SW-07) located between the tailings impoundments , compared to other upstream and downstream locations, as indicated on the histograms (Figure 4-27 through Figure 4-34). The total and dissolved concentrations of aluminum, arsenic, barium, beryllium, calcium, cadmium, chromium, cobalt, copper, iron, lead, magnesium, manganese, nickel, potassium, sodium, thallium, vanadium, and zinc as well as total mercury, molybdenum, selenium, and silver, were generally higher in these two samples than in other Gila River samples. These elevated concentrations were most pronounced in samples collected in the Summer sampling event. Although no Winter sample event samples exceeded AAWWQC or PRG levels (with the exception of arsenic), several exceedances were noted in the Summer event samples at GR-SW-06 and/or GR-SW-07 only, and these levels were also considerably above background levels measured in GR-SW-01 and GR-SW-02:
• Total aluminum (62,000 µg/L in GR-SW-06 and 52,800 µg/L in GR-SW-07 [duplicate]) exceeded the PRG of 36,000 µg/L
• Total arsenic (16.8 µg/L in GR-SW-06 and 13.9 µg/L in GR-SW-07 [duplicate]) exceeded the PRG of 0.045 µg/L
• Total cyanide (16.2 µg/L in GR-SW-07 [duplicate]) exceeded the AAWWQC of 9.7 µg/L
• Total iron (34,500 µg/L in GR-SW-06 and 31,500 µg/L in GR-SW-07 [duplicate]) exceeded the PRG of 11,000 µg/L
• Total manganese (3,450 µg/L in GR-SW-06 and 2,510 µg/L in GR-SW-07) exceeded the PRG of 880 µg/L
• Total selenium (2.0 µg/L in GR-SW-06) equaled the AAWWQC of 2 µg/L
• Total vanadium (56.6 µg/L in GR-SW-06 and 49.2 µg/L in GR-SW-07) exceeded the PRG of 36 µg/L
• Dissolved copper (43.5 µg/L in GR-SW-06 and 29.9 µg/L in GR-SW-07), which exceeded the AAWWQC of 18 µg/L
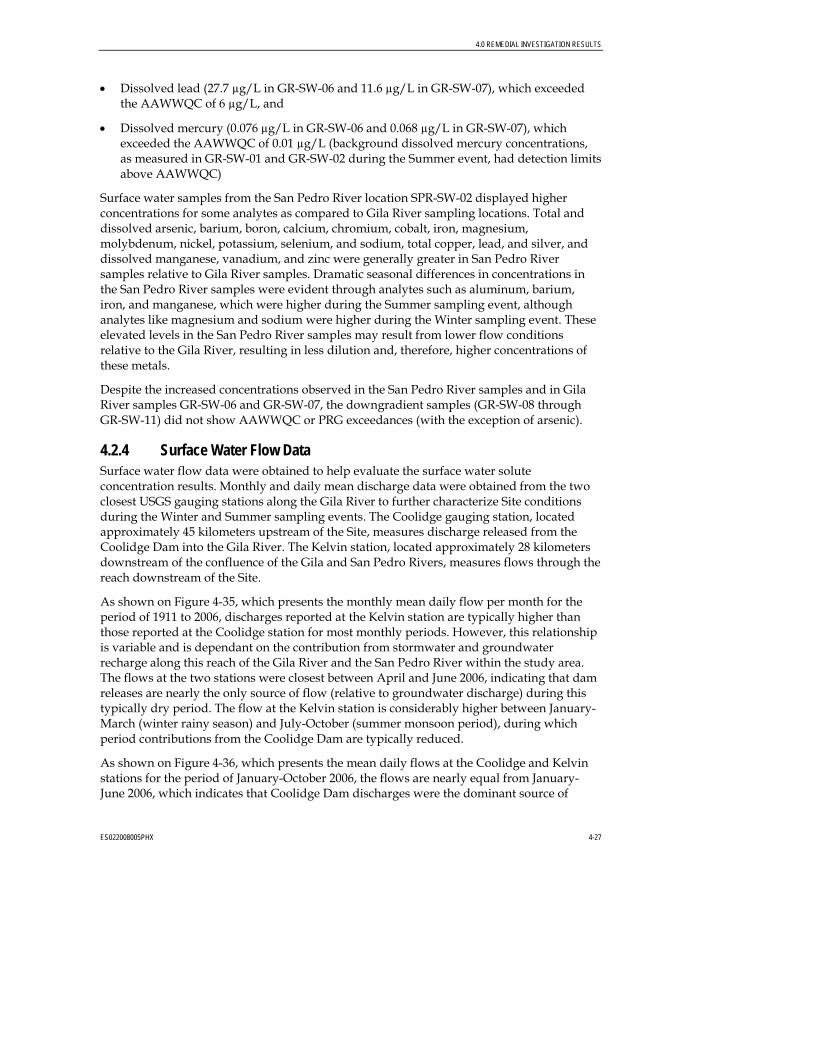
4.0 REMEDIAL INVESTIGATION RESULTS
ES022008005PHX 4-27
• Dissolved lead (27.7 µg/L in GR-SW-06 and 11.6 µg/L in GR-SW-07), which exceeded the AAWWQC of 6 µg/L, and
• Dissolved mercury (0.076 µg/L in GR-SW-06 and 0.068 µg/L in GR-SW-07), which exceeded the AAWWQC of 0.01 µg/L (background dissolved mercury concentrations, as measured in GR-SW-01 and GR-SW-02 during the Summer event, had detection limits above AAWWQC)
Surface water samples from the San Pedro River location SPR-SW-02 displayed higher concentrations for some analytes as compared to Gila River sampling locations. Total and dissolved arsenic, barium, boron, calcium, chromium, cobalt, iron, magnesium, molybdenum, nickel, potassium, selenium, and sodium, total copper, lead, and silver, and dissolved manganese, vanadium, and zinc were generally greater in San Pedro River samples relative to Gila River samples. Dramatic seasonal differences in concentrations in the San Pedro River samples were evident through analytes such as aluminum, barium, iron, and manganese, which were higher during the Summer sampling event, although analytes like magnesium and sodium were higher during the Winter sampling event. These elevated levels in the San Pedro River samples may result from lower flow conditions relative to the Gila River, resulting in less dilution and, therefore, higher concentrations of these metals.
Despite the increased concentrations observed in the San Pedro River samples and in Gila River samples GR-SW-06 and GR-SW-07, the downgradient samples (GR-SW-08 through GR-SW-11) did not show AAWWQC or PRG exceedances (with the exception of arsenic).
4.2.4 Surface Water Flow Data Surface water flow data were obtained to help evaluate the surface water solute concentration results. Monthly and daily mean discharge data were obtained from the two closest USGS gauging stations along the Gila River to further characterize Site conditions during the Winter and Summer sampling events. The Coolidge gauging station, located approximately 45 kilometers upstream of the Site, measures discharge released from the Coolidge Dam into the Gila River. The Kelvin station, located approximately 28 kilometers downstream of the confluence of the Gila and San Pedro Rivers, measures flows through the reach downstream of the Site.
As shown on Figure 4-35, which presents the monthly mean daily flow per month for the period of 1911 to 2006, discharges reported at the Kelvin station are typically higher than those reported at the Coolidge station for most monthly periods. However, this relationship is variable and is dependant on the contribution from stormwater and groundwater recharge along this reach of the Gila River and the San Pedro River within the study area. The flows at the two stations were closest between April and June 2006, indicating that dam releases are nearly the only source of flow (relative to groundwater discharge) during this typically dry period. The flow at the Kelvin station is considerably higher between January-March (winter rainy season) and July-October (summer monsoon period), during which period contributions from the Coolidge Dam are typically reduced.
As shown on Figure 4-36, which presents the mean daily flows at the Coolidge and Kelvin stations for the period of January-October 2006, the flows are nearly equal from January-June 2006, which indicates that Coolidge Dam discharges were the dominant source of
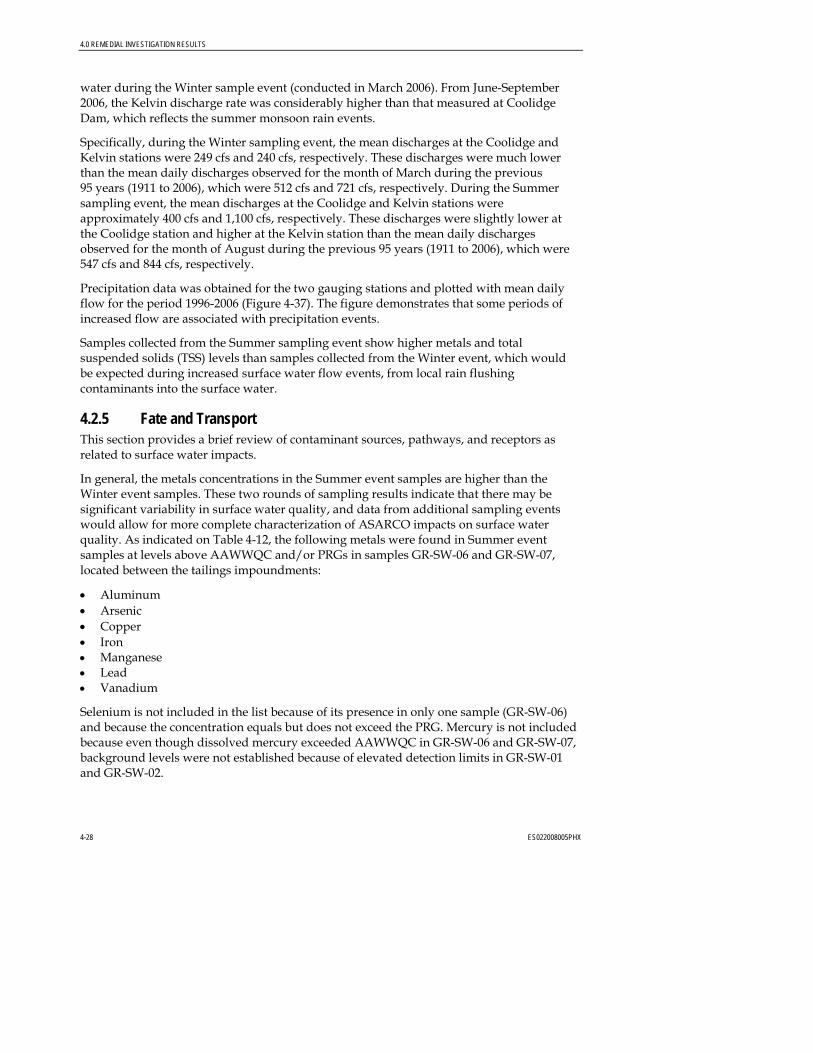
4.0 REMEDIAL INVESTIGATION RESULTS
4-28 ES022008005PHX
water during the Winter sample event (conducted in March 2006). From June-September 2006, the Kelvin discharge rate was considerably higher than that measured at Coolidge Dam, which reflects the summer monsoon rain events.
Specifically, during the Winter sampling event, the mean discharges at the Coolidge and Kelvin stations were 249 cfs and 240 cfs, respectively. These discharges were much lower than the mean daily discharges observed for the month of March during the previous 95 years (1911 to 2006), which were 512 cfs and 721 cfs, respectively. During the Summer sampling event, the mean discharges at the Coolidge and Kelvin stations were approximately 400 cfs and 1,100 cfs, respectively. These discharges were slightly lower at the Coolidge station and higher at the Kelvin station than the mean daily discharges observed for the month of August during the previous 95 years (1911 to 2006), which were 547 cfs and 844 cfs, respectively.
Precipitation data was obtained for the two gauging stations and plotted with mean daily flow for the period 1996-2006 (Figure 4-37). The figure demonstrates that some periods of increased flow are associated with precipitation events.
Samples collected from the Summer sampling event show higher metals and total suspended solids (TSS) levels than samples collected from the Winter event, which would be expected during increased surface water flow events, from local rain flushing contaminants into the surface water.
4.2.5 Fate and Transport This section provides a brief review of contaminant sources, pathways, and receptors as related to surface water impacts.
In general, the metals concentrations in the Summer event samples are higher than the Winter event samples. These two rounds of sampling results indicate that there may be significant variability in surface water quality, and data from additional sampling events would allow for more complete characterization of ASARCO impacts on surface water quality. As indicated on Table 4-12, the following metals were found in Summer event samples at levels above AAWWQC and/or PRGs in samples GR-SW-06 and GR-SW-07, located between the tailings impoundments:
• Aluminum • Arsenic • Copper • Iron • Manganese • Lead • Vanadium
Selenium is not included in the list because of its presence in only one sample (GR-SW-06) and because the concentration equals but does not exceed the PRG. Mercury is not included because even though dissolved mercury exceeded AAWWQC in GR-SW-06 and GR-SW-07, background levels were not established because of elevated detection limits in GR-SW-01 and GR-SW-02.
4.0 REMEDIAL INVESTIGATION RESULTS
ES022008005PHX 4-29
Most of the constituents listed above are commonly associated with copper mining and processing activities, but can also occur naturally in aquifers and hydraulically connected surface waters of semiarid desert regions. Most of these constituents were also found in elevated levels in monitoring wells completed in the bedrock and Gila River alluvial aquifers. The identification of specific sources of these impacts was beyond the scope of this RI. The tailings impoundments, however, are a likely source of iron and manganese impacts to surface water as well as groundwater, as indicated by elevated concentrations in H-1 and H-2A, downgradient of TPA (see Section 4.4).
Behavior of inorganics in a river environment is complex. Inorganics can be in the particulate-sorbed or dissolved phases in surface waters. Interchange between sorbed trace metal ions and dissolved metal ions, occurs via sorption/desorption mechanisms. Within the dissolved phase, metals can be complicated with a number of different ligands in natural waters. Likewise, metal ions can be sorbed onto both mineral and organic suspended sediment. Bed sediments can be scoured and thereby enter the surface water column. Suspended solids can undergo sedimentation and be deposited on the bed sediments. Metal ions in pore water of sediments can diffuse to the overlying water column and vice versa.
Discharges from the tailings impoundments into the Gila River is evident from the Winter and Summer sampling results at sampling locations GR-SW-06 and GR-SW-07, due to the exceedance of water quality standards. The total inorganic concentrations are higher than the dissolved inorganic concentrations for most analytes, which indicates that the suspended solids loading accounts for the higher levels. Most inorganic concentrations, furthermore, undergo rapid dilution downstream of the tailings impoundments, as indicated by reduced concentrations at GR-SW-08, GR-SW-09, GR-SW-10, and GR-SW-11.
The companion SLERA (Volume 3 of the RI Report) includes a detailed evaluation of ecological exposures to these inorganic constituents. Regarding human health exposures, surface water recharge to the groundwater may occur during the year, especially during dry periods when the water table is reduced and base flow contributions to surface water are minimal. Therefore, elevated concentrations in surface water, particularly of dissolved inorganic constituents, may have an adverse impact on aquifer water quality. However, because dissolved inorganic constituent concentrations are relatively low, the impact of surface water on groundwater and local drinking water supplies is expected to be relatively low.
4.3 Sediments Three types of sediment samples were collected for the purpose of this RI. At each sample location, an in-stream, stable riparian, and unstable riparian sediment sample were collected (Figures 4-38 and 4-39). The in-stream sediment samples were collected within the currently flowing river bed. The unstable riparian samples were collected on the adjacent flood plain of the current river channel, while the stable riparian samples were collected at the adjacent, more stable area above the stable riparian sample location.
In-stream sediment samples were collected at 11 locations along the Gila River and two locations along the San Pedro River. The in-stream sediment samples were collected concurrently with the surface water samples during two sampling events: Winter (March 7
4.0 REMEDIAL INVESTIGATION RESULTS
4-30 ES022008005PHX
and 8, 2006) and Summer (August 22 and 23, 2006). Sediment samples were also collected in both stable and unstable riparian habitat in the nearest suitable location adjacent to the in-stream sediment locations. Five additional biased locations in the Gila River floodplain (between the confluence of the San Pedro River and Last Chance Basin) were selected for collection of stable and unstable riparian sediment samples. Finally, one additional upstream Gila River location was selected for collection of background stable and unstable riparian sediment samples. The in-stream riparian sediment samples were analyzed for metals, and results are presented in Tables 4-15 and 4-16, respectively. Figures 4-38 and 4-39 depict the in-stream sediment and riparian sample locations, respectively, and also present concentrations for selected parameters.
As part of the evaluation of the sediment results, histograms were prepared for various groups of data for a given sample, using stacked rectangles to depict the concentrations. For this study, the histograms are displayed together on figures, organized from upstream to downstream sampling location. Each figure allows for a visual comparison of concentrations for each analyte group at locations that are upstream, adjacent to, and downstream of ASARCO operations. Figures 4-40 through 4-43 present the in-stream sediment histograms, and Figures 4-44 through 4-47 present the riparian sediment sample histograms, for the selected analyte groups.
A detailed evaluation of ecological impacts resulting from sediment concentrations is presented in the companion SLERA report, as summarized in Section 5.2.
4.3.1 Background Sediment Samples A thorough evaluation of background sediment quality was beyond the scope of the RI. However, sampling locations GR-SED-01, GR-SED-02, GR-REF, and SPR-SED-01 are located upstream of ASARCO operations. In-stream and riparian sediment samples were collected from GR-SED-01, GR-SED-02, and GR-REF (riparian sediment samples only) along the Gila River, and SPR-SED-01 along the San Pedro River, south of Winkelman (Figures 4-38 and 4-39). Sediments from these locations are not considered to be affected by ASARCO operations and, therefore, are considered background sediment concentrations for the purposes of this investigation. However, GR-SED-01 and GR-SED-02 samples may be affected by ASARCO stack emissions from Hayden that blew into drainages to the northeast from the facilities.
From the two in-stream sediment sample locations GR-SED-01 and GR-SED-02, the maximum concentrations of arsenic (4.4 mg/kg), iron (28,800 mg/kg), manganese (2,270 mg/kg), and vanadium (91.2 mg/kg) exceeded the Arizona R-SRL and/or EPA PRG criteria, while only arsenic (maximum 2.6 mg/kg) exceeded these criteria from the upstream San Pedro River location SPR-SED-01. For upstream Gila River in-stream sediment samples GR-SED-01 and GR-SED-02, the maximum concentrations for other metals of concern, including copper (191 mg/kg), lead (11.7 mg/kg), and chromium (14 mg/kg) are well below R-SRL and/or PRG criteria, and slightly lower concentrations for these metals are observed in the upstream San Pedro River sediment sample SPR-SED-01 (Figure 4-38 and Table 4-14).
Similar results were found in the upstream riparian sediment sample locations GR-REF-01, GR1-01, and GR2-01. From these samples, the maximum concentrations of arsenic
4.0 REMEDIAL INVESTIGATION RESULTS
ES022008005PHX 4-31
(4 mg/kg), iron (27,200 mg/kg), and vanadium (83.1 mg/kg) exceeded the Arizona R-SRL and/or EPA PRG criteria, while only arsenic (maximum 2.4 mg/kg) exceeded these criteria from upstream San Pedro River location SPR-SED-01. The maximum concentrations for other metals of concern were higher than those found in in-stream sediment samples, including copper (1,150 mg/kg), lead (32.8 mg/kg), and chromium (16.8 mg/kg), although these levels are still below R-SRL and/or PRG criteria (Figure 4-39 and Table 4-15).
The presence of elevated concentrations of some metals in upstream sediment samples likely results from contributions from other side drainages to the Gila River.
4.3.2 In-stream Sediment in Vicinity of and Downstream of ASARCO Operations
As depicted on Figure 4-38, in-stream sediment sample locations GR-SED-03 through GR-SED-07, and SPR-SED-02, are located in the vicinity of ASARCO facilities. Sampling locations GR-SED-06 and GR-SED-07 are located between TPA and TPD. Sampling locations GR-SED-08 through GR-SED-11 are located farther downstream of ASARCO operations, beyond the tailings impoundments. Figures 4-40 through 4-43 presents the histograms for selected analyte groups.
The sampling results for in-stream sediment samples in the vicinity of and downstream of ASARCO operations indicate the following (results presented below are the highest from among the Winter and Summer sample events):
• Arsenic concentrations are in the range of 1.1 mg/kg to 5 mg/kg, consistent with levels found in the upstream samples, and do not show a marked increase adjacent to ASARCO operations.
• Iron concentrations are above the PRG in GR-SED-07 (24,700 mg/kg), GR-SED-08 (26,300 mg/kg), and GR-SED-11 (23,800 mg/kg), but these levels are consistent with those found in upstream samples.
• Manganese concentrations are above the PRG in GR-SED-03 (2,410 mg/kg), but this level is consistent with upstream samples.
• Vanadium concentrations are lower than the maximum concentration in the upstream sediment samples.
• Copper concentrations show small relative increases in samples collected near and downgradient of the tailings impoundments (GR-SED-07 and GR-SED-08), but concentrations are generally consistent with those found in upstream samples.
• Lead and chromium concentrations show small relative increases in samples collected adjacent to and downgradient of ASARCO operations (GR-SED-06 through GR-SED-11), but concentrations are not significantly above those found in upstream samples.
• The variability in concentrations between the Winter and Summer sample events are mixed for Gila River sediment samples, whereas samples from the San Pedro River show a general increasing trend in the Summer sample event.
4.0 REMEDIAL INVESTIGATION RESULTS
4-32 ES022008005PHX
• Vanadium
With few exceptions, analyte concentrations within in-stream sediment samples from the San Pedro River exhibited generally lower concentrations than those obtained from Gila River sampling locations. Large seasonal variations were also evident among the San Pedro River samples.
4.3.3 Riparian Sediment from Locations in Vicinity of and Downstream of ASARCO Operations
As depicted on Figure 4-39, the stable and unstable riparian sediment sample locations GR-03 through GR-07, and SPR-02, are located near ASARCO facilities. Sampling locations GR-06, GR-07, and GR-12 through GR-16 are located between TPA and TPD. Sampling locations GR-08 through GR-11 are located farther downstream of ASARCO operations, beyond the tailings impoundments. Figures 4-44 through 4-47 presents the histograms for selected analyte groups.
The sampling results for the stable and unstable riparian sediment samples in the vicinity of and downstream of ASARCO operations indicate the following:
• Arsenic concentrations are in the range of 1.2 mg/kg to 7.5 mg/kg, which are slightly above levels found in the upstream sediment samples.
• Iron and manganese concentrations are below the PRG in all samples, which are, therefore, below levels found in upstream sediment samples.
• Vanadium concentrations are lower than the maximum concentration in the upstream sediment samples.
• The highest copper, lead and chromium concentrations are in GR3-01S, but concentrations in other downstream sediment samples are generally below levels found in upstream sediment samples.
• Stable riparian sediments in the San Pedro River (SPR2-01S) metal concentrations did not exceed background (SPR1-01S) concentrations, except for aluminum, barium, and sodium. For unstable riparian sediments, San Pedro River sample location SPR-2-01U, shows slightly higher trace element concentrations than the reference upstream location (SPR1-01U) for several metals.
Arsenic is the only analyte that exceeds the Arizona R-SRL and EPA PRG criteria for soils in stable and unstable riparian sediments at all downstream locations.
4.3.4 Fate and Transport This section provides a brief review of contaminant sources, pathways, and receptors as related to sediment impacts.
The following metals were found at levels above R-SRLs and PRGs in in-stream and/or riparian sediment samples:
• Arsenic • Iron • Manganese
Comment [a1]: Does this change any of the following sentences? l ______________________________________________________________ ~
4.0 REMEDIAL INVESTIGATION RESULTS
ES022008005PHX 4-33
stituents listed above are commonly associated with copper mining and
his
is complex. the
nt
.
on e
4.4 Groundwater of the February/March 2006 (Winter) and
easurement
A
gro in the scope of work for this RI. An
ns
The following sections present the results from monitoring well, production well, and drinking water tap locations. The focus of the discussion in the following sections is on
Most of the conprocessing activities, but can also occur naturally in aquifers and hydraulically connectedsurface waters of semiarid desert regions. Most of these constituents were also found in elevated levels in monitoring wells completed in the bedrock and Gila River alluvial aquifers. The identification of specific sources of these impacts was beyond the scope of tRI. The tailings impoundments, however, are a likely source of iron and manganese impacts to surface water and sediment, as well as groundwater, as indicated by elevated concentrations in H-1 and H-2A, downgradient of TPA (see Section 4.4).
As described in Section 4.2, behavior of inorganics in a river environment Because of metal’s ability to be transported in and out of river sediments, dissolve intowater column, and undergo sedimentation processes, inference of the initial and final deposition is difficult. In general, however, increased concentrations of inorganic constituents were found in downstream sediment samples relative to upstream sedimesamples. The presence of elevated concentrations of some metals in upstream sediment samples likely results from contributions from other side drainages to the Gila River and could be from smelter air emissions settling to the ground and washing into surface water
The companion HHRA document (Volume 2) describes the expected impact of surface water and sediment on human health, under possible exposure scenarios. The companiSLERA document (Volume 3) includes a detailed evaluation of ecological exposures to thesinorganic constituents.
This section discusses the results August/September 2006 (Summer) groundwater sampling and water level mevents. The results of all laboratory analyses completed are shown in Tables 4-16 through Table 4-27. The water level measurements used to prepare groundwater elevation contourmaps are in Table 4-28. This section details the results and concentrations exceeding the EPprimary or secondary maximum contaminant level (MCL) and tap water PRGs for groundwater in the monitoring wells, production wells, and drinking water taps, and also provides an evaluation of contaminant fate and transport.
4.4.1 Background Groundwater Quality A back und groundwater quality study was not identified upgradient well from ASARCO operations (H-7) was sampled in August 2006 (Figure 2-3). The concentrations in H-7 exhibit the highest concentrations of arsenic (231 µg/L) and vanadium (598 µg/L) compared to all other wells sampled during the RI, and also showed elevated gross alpha (16.4 picocuries per liter [pCi/L]). The concentratioof these parameters are all above the MCL. Therefore, H--7 cannot be considered a representative well for background concentrations. A detailed background study would be needed to further assess background concentrations.
4.4.2 Groundwater Quality Results
4.0 REMEDIAL INVESTIGATION RESULTS
4-34 ES022008005PHX
ance CLs and tap water PRGs. Table 4-27 presents . for
, LC-1, and newly installed,
EPA-owne 6. Due to the deviations discussed in Appendix
troleum hydrocarbon (TPH);
monitoring well samples were analyzed for both to evaluate impacts from ASARCO operations. The metals with
n e MCLs and/or PRGs for total and/or dissolved metals are (in ,
n GW-06 (1,800 µg/L),
wed by LC-1 (1,300 µg/L), H-3 (720 µg/L), ARU-1 (320 µg/L), H-8 (100 µg/L), and
• l -4
of the dissolved arsenic concentrations exceeded the
• otal
µg/L), H-1 (920 µg/L), LC-1
exceed s of EPA primary and secondary Ma summary of the parameters with exceedances of these EPA drinking water standardsFigures 4-48 and 4-49 depict the sample location maps with drinking water exceedancesboth the Winter and Summer sampling events, respectively.
4.4.2.1 Monitoring Well Sample Results. The 22 monitoring wells selected for sampling included the ASARCO-owned H- series wells(H-1 through H-11), ARU-1 and -8, MW-2 and -4, S-4A, SM-2
d wells GW-01(R), -02, -03, and -0A, wells H-7, SM-2, GW-01, and GW-02 were not sampled during the Winter sampling event. Furthermore, not all monitoring wells were sampled for all the analyte suites. However, when a monitoring well was sampled during both sampling events, the samples were analyzed for the same suites during each event. The results are divided into five categories:
• Inorganics: Total and Dissolved Metals; • VOCs and SVOCs; • Total pe• Radiochemistry; and
ry. • General geochemist
Inorganics: Total and Dissolved Metals. Alltotal and dissolved metalsco centrations exceeding thalphabetical order) aluminum, antimony, arsenic, cadmium, iron, manganese, molybdenumselenium, uranium, and vanadium. For each analyte, the monitoring wells with exceedances of either target criteria are listed below for Winter and Summer individually (see Table 4-16for the full analyte list results and Table 4-27 for exceedances).
Winter
• Total and dissolved aluminum (secondary MCL is 50 µg/L and PRG is 36,000 µg/L). Fortotal aluminum, the maximum concentration was observed ifolloGW-03: Dup (52 µg/L). For dissolved aluminum, the maximum concentration was observed in GW-06 (260 µg/L), followed by LC-1 (66 µg/L). No aluminum concentrations exceeded the PRG.
Total and dissolved arsenic (PRG is 0.045 µg/L and MCL is 10 µg/L): All of the totaarsenic concentrations exceeded the PRG, but only two exceeded the MCL : H(16 µg/L) and ARU-8 (13 µg/L). All PRG, but only ARU-8 (12 µg/L) exceeded the MCL.
Total and dissolved iron (secondary MCL is 300 µg/L and PRG is 11,000 µg/L): For tiron, the maximum concentration was observed in MW-4 (1,800 µg/L), followed by GW--06 (1,600 µg/L), ARU-1 (1,400 µg/L), H-4 (1,300(910 µg/L), H-2A (820 µg/L), and H-3 (780 µg/L). For dissolved iron, the maximum concentration was observed in H-1 (950 µg/L), followed by H-2A (840 µg/L). No iron concentrations exceeded the PRG.
4.0 REMEDIAL INVESTIGATION RESULTS
ES022008005PHX 4-35
• r
(850 µg/L), H-9 (460 µg/L), H-10 (320 µg/L), H--3
• denum
L), and MW-4 (55 µg/L). For dissolved selenium, the ),
•
µg/L), and ARU-1 (7.3 µg/L). For dissolved uranium, the maximum concentration was observed in H-3 (21 µg/L), followed by H-9 (9.7 µg/L ), and H-4
•
e maximum concentration was observed in H-8 (85 µg/L), followed by LC-1 (51 µg/L) and H-9 (42 µg/L).
Sum
• µg/L),
ed by LC-1 (3,070 µg/L), SM-2 (909 µg/L), H-7 (815 µg/L), and H-8 (383 µg/L). No concentrations of total aluminum exceeded the PRG. None of the monitoring wells
•
imony concentrations exceeded the PRG.
• ing
W-02 (34.4 µg/L), LC-1 (21.9 µg/L), and ARU-8 (10 µg/L). All of the dissolved arsenic concentrations exceeded the PRG, but only three
-2
Total and dissolved manganese (secondary MCL is 50 µg/L and PRG is 880 µg/L): Fototal manganese, the maximum concentration was observed in H-2A (7,200 µg/L), followed by H-1 (6,500 µg/L), H-5 (300 µg/L), H-4 (270 µg/L), GW-06 (91 µg/L), LC-1 (80 µg/L), and ARU-1 (77 µg/L). For dissolved manganese, the maximum concentration was observed in many of the same wells, specifically in H-2A (7,300 µg/L), followed by H-1 (6,700 µg/L), H-5 (820 µg/L), H-9 (450 µg/L), and H-10 (68 µg/L). Concentrations of both total and dissolved manganese exceeded the PRG in H-2A and H-1.
Molybdenum (PRG is 180 µg/L): The only monitoring well with an exceedance was LC-1, with a total molybdenum concentration of 510 µg/L and a dissolved molybconcentration of 540 µg/L.
• Total and dissolved selenium (MCL is 50 µg/L and PRG is 180 µg/L): For total selenium, the maximum concentration was observed in LC-1 (480 µg/L), followed by H--8 (100 µg/L), H-9 (56 µg/maximum concentration was observed in LC-1 (500 µg/L), followed by H-8 (100 µg/Land H-9 (57 µg/L). Concentrations of both total and dissolved selenium exceeded the PRG in LC-1 only.
Total and dissolved uranium (PRG is 7.3 µg/L and MCL is 30 µg/L): For total uranium, the maximum concentration was observed in H-3 (21 µg/L), followed by H-9: Dup (9.8 µg/L), H-4 (8.5
(8.5 µg/L). No uranium concentrations exceeded the MCL.
Total and dissolved vanadium (PRG is 36 µg/L): For total vanadium, the maximum concentration was observed in H-8 (70 µg/L), followed by MW-4 (49 µg/L), LC-1 (48 µg/L), and GW-06 (39 µg/L). For dissolved vanadium, th
mer
Total and dissolved aluminum (secondary MCL is 50 µg/L and PRG is 36,000 µg/L): For total aluminum, the maximum concentration was observed in GW-01(R) (29,900 follow
had dissolved aluminum concentrations exceeding the MCL or PRG.
Total and Dissolved Antimony (MCL is 6 µg/L and PRG is 15 µg/L): The only monitoring well with an exceedance was GW-02, with a total antimony concentration of9.2 µg/L and a dissolved antimony concentration of 10.4 µg/L. No ant
Total and dissolved arsenic (PRG is 0.045 µg/L and MCL is 10 µg/L): All of the total arsenic concentrations exceeded the PRG, but only five exceeded the MCL, includH-7 (231 µg/L), SM-2 (43.7 µg/L), G
exceeded the MCL, including H-7 (199 µg/L), followed by GW-02 (31.7 µg/L), and SM(12.9 µg/L).
4.0 REMEDIAL INVESTIGATION RESULTS
4-36 ES022008005PHX
• otal
-7 (623 µg/L), H-1 (513 µg/L), H-2A (411 µg/L), and H-5 (404 µg/L). For
•
• dary MCL is 50 µg/L and PRG is 880 µg/L): For
-4
)
•
030 µg/L), followed by LC-1
•
um, (677 µg/L), followed by GW-02
tal and
• -4
ed vanadium, the maximum
VOfor g wethe
Total and dissolved iron (secondary MCL is 300 µg/L and PRG is 11,000 µg/L): For tiron, the maximum concentration was observed in GW-01(R) (22,400 µg/L), followed byLC-1 (4,130 µg/L), MW-2 (3,130 µg/L), MW-4 (2,810 µg/L), SM-2 (1,780 µg/L), ARU-1 (780 µg/L), Hdissolved iron, the maximum concentration was observed in H-1(487 µg/L), followed by H-2A (374 µg/L) and H-5 (373 µg/L).
Cadmium (MCL is 5 µg/L and PRG is 18 µg/L): The only monitoring well with an exceedance was GW-02, with a total cadmium concentration of 9.2 µg/L and a dissolved cadmium concentration of 8.1 µg/L. No cadmium concentrations exceeded the PRG.
Total and dissolved manganese (secontotal manganese, the maximum concentration was observed in H-1 (7,330 µg/L), followed by H-2A (5,250 µg/L), H-5 (2,190 µg/L), GW-01(R) (1,030 µg/L), H-10 (767 µg/L), H-9: Dup (492 µg/L ), H-9 (485 µg/L), SM-2 (55.6 µg/L), ARU-1 (51.1 µg/L), H(75.1 µg/L), LC-1 (74.9 µg/L), SM-2 (55.6 µg/L), and ARU-1 (51.1 µg/L). For dissolved manganese, the maximum concentration was observed in H-1 (7,250 µg/L), followed byH-2A (5,150 µg/L), H-5 (2,190 µg/L), H-9: Dup (353 µg/L), H-9 (344 µg/L), GW-01(R(298 µg/L), and H-10 (154 µg/L). Concentrations of both total and dissolved manganese exceeded the PRG in H-1, H-2A, and H-5.
Total and dissolved molybdenum (PRG is 180 µg/L): For total molybdenum, the maximum concentration was observed in GW-02 (2,050 µg/L), followed by LC-1 (517 µg/L), SM-2 (426 µg/L), and H-8 (300 µg/L). For dissolved molybdenum, the maximum concentration was observed in GW-02 (2,(533 µg/L), SM-2 (394 µg/L), and H-8 (259 µg/L).
Total and dissolved selenium (MCL is 50 µg/L and PRG is 180 µg/L): For total selenium, the maximum concentration was observed in LC-1 (781 µg/L), followed by GW-02 (92.2 µg/L), MW-4 (58.4 µg/L), and SM-2 (56.1 µg/L). For dissolved selenithe maximum concentration was observed in LC-1(97.2 µg/L), MW-4 (58.2 µg/L), and SM-2 (52.8 µg/L). Concentrations of both todissolved selenium exceeded the PRG in LC-1 only.
Total and dissolved vanadium (PRG is 36 µg/L): For total vanadium, the maximum concentration was observed in H-7 (598 µg/L), followed by GW-01(R) (90 µg/L), MW(63.4 µg/L), H-8 (60.7 µg/L), MW-2 (56 µg/L), LC-1 (53.4 µg/L), H-9 (48.1 µg/L), H-9: Dup (47.8 µg/L), and GW-06 (47.6 µg/L). For dissolvconcentration was observed in H-7 (505 µg/L), followed by GW-01(R) (46.2 µg/L), H-8 (45 µg/L), MW-4 (41.2 µg/L), LC-1 (40.5 µg/L), and GW-06 (36.5 µg/L).
Cs, and SVOCs. Samples from a total of seven monitor monitoring wells were analyzed VOCs and SVOCs to evaluate impacts from ASARCO operations. Of the monitorinlls sampled for VOCs and SVOCs, only four wells had analyte concentrations exceeding MCLs and/or PRGs. The VOCs with concentrations exceeding PRGs are
1,2-dibromoethane, bromodichloromethane, chloroform, tetrachloroethene (PCE), and trichloroethene (TCE). The only SVOC with a concentration exceeding its PRG was bis(2-ethylhexyl) phthalate. The concentrations exceeding the standards are presented for
4.0 REMEDIAL INVESTIGATION RESULTS
ES022008005PHX 4-37
ll was not sampled in Winter sampling event).
) and MCL
e
•
W s det 3 µg/L.
or these analytes; therefore, this
er at 470 mg/L and 370 mg/L,
• uring
s 210 mg/L at GW-06, and the maximum concentration during Summer
•
d exceedances of the secondary MCL. The maximum
each monitoring well for both the Winter and Summer sampling events in Tables 4-17, Table 4-18, and Table 4-27.
• GW-01(R) had a concentration of the VOC bromodichloromethane of 0.25 µg/L (abovePRG of 0.18 µg/L) and chloroform of 2.9 µg/L (above the PRG of 0.17 µg/L) during theSummer sampling event (we
• GW-06 had concentrations for the VOC bromodichloromethane of 0.46 µg/L and 0.51 µg/L (above PRG of 0.18 µg/L) during the Winter and Summer sampling events, respectively. GW-06 had chloroform concentrations of 2.4 (above PRG of 0.17 µg/LPCE concentrations of 0.39 µg/L and 0.36 µg/L (above PRG of 0.1 µg/L, but belowof 5 µg/L) during the Winter 2006 and Summer 2006 sampling events, respectively. Thmonitoring well also had a TCE concentration of 0.13 µg/L (above the PRG of 0.028 µg/L, but below the MCL of 5 µg/L).
H-11 had a concentration of the VOC 1,2-dibromoethane of 0.052 µg/L (above the MCL of 0.05 µg/L and PRG of .0056 µg/L) during the Summer sampling event.
• MW-4 was the only well with an SVOC exceedance, which was a concentration of bis-2-ethylhexylphthalate of 28 µg/L and 8.7 µg/L (above the MCL of 6 µg/L) during the Winter and Summer sampling events, respectively.
• Note that the reporting limit for some VOCs and SVOCs is above the drinking water standards, and these reporting limits are noted in Tables 4-17, 4-18, and 4-27.
TPH. The analysis for TPH was limited to three monitoring wells, GW-01(R), GW-02, and G -06 as presented in Table 4-19. During the Summer sampling event, TPH as diesel wa
ected in GW-01R at 330 µg/L, and TPH as gasoline was detected in GW-06 at 3There is no MCL or PRG for these TPH analyte groups.
General Geochemistry. All monitor monitoring well samples were analyzed for general water quality parameters to evaluate differences in overall water quality in various portions of the study area. PRGs and primary MCLs do not exist fsection does not detail exceedances, but summarizes relevant information pertaining to these analytes. Secondary MCLs do exist for some analytes (chloride, fluoride, TDS, and sulfate) as identified herein (see Tables 4-20 and 4-27).
• Bicarbonate alkalinity concentrations ranged from 77 mg/L to 470 mg/L during the Winter and Summer sampling events. The maximum concentration for both the Wintand Summer sampling events was observed at H-3 respectively.
Carbonate alkalinity concentrations ranged from <10 mg/L (non-detect) to 210 mg/L during the Winter and Summer sampling events. The maximum concentration dthe Winter wawas 72 mg/L at H-7.
Chloride concentrations ranged from 15 mg/L to 590 mg/L during the Winter and Summer sampling events (secondary MCL is 250 mg/L). A majority of the monitoring well samples displaye
4.0 REMEDIAL INVESTIGATION RESULTS
4-38 ES022008005PHX
•
nd 6.1 mg/L,
•
nter was 1,700 mg/L at H-9, and the maximum concentration during the
•
ter was 3,700 mg/L at H-9 (Duplicate), and the
Radforexce chemistry analytes
-2 (21.3 pCi/L) also during the Summer.
L),
U-8 (2.8 pCi/L), H-11 0
e
• m
, H-9 (Duplicate) (2.6 pCi/L), ARU-8 (2.4 pCi/L), GW-03
concentration during the Winter was 510 mg/L at H-9 (Duplicate), and the maximumconcentration during the Summer was 590 mg/L at SM-2.
Fluoride concentrations ranged from 0.13 mg/L to 6.1 mg/L during the Winter and Summer sampling events (PRG is 2.2 mg/L). The maximum concentration for both the Winter and Summer sampling events was observed at H-3 at 5.6 mg/L arespectively.
Sulfate concentrations ranged from 13 mg/L to 2,000 mg/L during the Winter and Summer sampling events (Secondary MCL is 250 mg/L). The maximum concentration during the WiSummer was 2,000 mg/L at H-1.
Total dissolved solids (TDS) ranged from 210 mg/L to 4,100 mg/L during the Winter 2006 and Summer 2006 sampling events (Secondary MCL is 500 mg/L). The maximum TDS concentration during the Winmaximum concentration during the Summer was 4,100 mg/L at H-1.
iochemistry. All monitoring well samples were analyzed for radiochemistry parameters evaluation of these impacts. Several monitoring well samples had analyte concentrations
eding either the PRGs or MCLs for radiochemistry parameters. Radiowith concentrations exceeding MCLs and/or PRGs are gross alpha activity, radium- 226 activity, uranium- 234, and uranium- 238. The concentrations exceeding the standards are presented for each monitoring well for both Winter and Summer sampling events (Table 4-21 and Table 4-27).
• Gross alpha activity (MCL is 15 pCi/L): Exceedances were found in H-3 during the Summer (21.7 pCi/L) and Winter (16.3 pCi/L) samples, in H-7 (16.4 pCi/L) during theSummer, and in SM
• Radium 226 activity (PRG is 0.000823 pCi/L): Exceedances were found in H-6 (0.8 pCi/L) during the Winter, in GW-01(R) (0.4 pCi/L) during the Summer, and in GW--03 (Duplicate) (0.3 pCi/L) during the Summer.
• Uranium- 234 (PRG is 0.674 pCi/L): During the Winter sampling event, the maximumexceedance was observed in H-3 (13.9 pCi/L ), followed by H-9 (duplicate) (6.3 pCi/H-9 (5.5 pCi/L ), H-4 (4.8 pCi/L), ARU-1 (3.3 pCi/L), AR(2.7 pCi/L), S-4A (2.7 pCi/L), H-8 (2.6 pCi/L), GW-03 (2.4 pCi/L), H-6 (2.1 pCi/L), H-1(1.8 pCi/L), H-2A (1.4 pCi/L), H-1 (1.1 pCi/L), GW-06 (0.9 pCi/L), and MW-4 (0.8 pCi/L). Monitoring well samples were not analyzed for uranium- 234 during thSummer sampling event.
Uranium- 238 (PRG is 0.744 pCi/L): During the Winter sampling event, the maximuexceedance was observed in H-3 (5.3 pCi/L), followed by H-9 (3.6 pCi/L), ARU-1 (3 pCi/L), H-4 (2.9 pCi/L)(1.8 pCi/L), H-11 (1.5 pCi/L), S-4A (1.4 pCi/L), H-8 (1.3 pCi/L), H-6 (1 pCi/L), H-2A (0.9 pCi/L), H-1 (0.8 pCi/L), and GW-03 (Duplicate) (0.8 pCi/L). Monitoring well samples were not analyzed for uranium- 238 during the Summer sampling event.

4.0 REMEDIAL INVESTIGATION RESULTS
ES022008005PHX 4-39
4.4.The -3 and WM-4 an Wellfield Manifold (WWFM), three Hayd F-26, operated by ASARCO), and
Radiochemistry; and
The production well and manifold samples were dissolved metals. The metals with concentrations exceeding the
nese, selenium, and uranium. The concentrations
tration is not listed herein, but is shown on Figures 4-48 and 4-49.
but
ents, respectively. All
t
Cs, the PRGs, but not the MCLs,
hich
2.5 µg/L and
2.2 Production Well and Manifold Sample Results production wells and manifolds sampled included Winkelman wells 3 and 4 (WM
, respectively, operated by AWC), the Winkelmen Wellfield wells (HWF-15, HWF-21, and HW
the Hayden Wellfield Manifold (HWFM). Each production well was sampled for the sameanalytical suite during each event. The results have been divided into four categories and are presented in Tables 4-22 through 4-27:
• Inorganics: Total and Dissolved Metals; • VOCs, SVOCs, and TPH; •• General geochemistry.
Inorganics: Total and Dissolved Metals.analyzed for both total and MCLs and/or PRGs were arsenic, mangaexceeding the standards are presented for each production well for Winter and Summer (Tables 4-22 and 4-27).
Every production well sample for Winter and Summer had an arsenic concentration exceeding the PRG (0.045 µg/L), but all concentrations were below the MCL (10 µg/L). Therefore, each concen
HWF-21 had total and dissolved uranium concentrations exceeding the PRG (7.3 µg/L), not the MCL (30 µg/L) in the Winter sampling event. Total uranium concentrations for HWF-21 and its duplicate were 8.1 and 8.2 µg/L, respectively, while dissolved uranium concentrations were 9 and 8.6 µg/L, respectively. Samples from this well were not tested for total and dissolved uranium during the Summer sampling event.
WM-4 had total manganese concentrations of 100 µg/L and 278 µg/L during the Winter and Summer sampling events, respectively. WM-4 had dissolved manganese concentrations of 140 µg/L and 75.1 µg/L during the Winter and Summer sampling evof these concentrations exceed the secondary MCL (50 µg/L), but not the PRG (880 µg/L).
The WWFM had total manganese concentrations of 51 µg/L and 177 µg/L during the Winter and Summer sampling events, respectively, which exceeded the secondary MCL, bunot the PRG. The WWFM also contained dissolved selenium concentrations of 54 µg/L during the Winter sampling event, which exceeded the MCL.
VOCs, SVOCs, and TPH. None of the samples from the production wells or manifold exceeded MCLs or PRGs for SVOCs or TPH. Of the samples submitted for analysis of VOonly the WWFM sample had analyte concentrations exceedingincluding 1,2-dibromoethane, bromodichloromethane, and chlorodibromomethane, ware common disinfection byproducts (see Tables 4-23, 4-24, and 4-27).
The concentration of 1,2-dibromoethane (PRG is 0.0056 µg/L) in WWFM did not exceed the PRG during the Winter sampling event, but was 0.036 µg/L during the Summer sampling event. Bromodichloromethane concentrations (PRG is 0.18 µg/L) were1.7 µg/L during the Winter and Summer sampling events, respectively. Chlorodibromo-
4.0 REMEDIAL INVESTIGATION RESULTS
4-40 ES022008005PHX
inter
s 4-25 and Table 4-27).
during the Winter
• r and Summer sampling events. The maximum
and the
• s for both the
• mg/L and Summer sampling events. The maximum concentration during
• ummer sampling events. The maximum
t
Radexce ers. Radiochemistry analytes
ity,
or nitoring well HWF-21 at 0.5 pCi/L during the Winter sampling event.
F-26 ,
and
• nce was observed in HWF-21 (2.2 pCi/L), followed by HWF-26 (2.1 pCi/L),
HWF-21 (Duplicate) (1.5 pCi/L), HWFM (1.5 pCi/L), HWF-15 (1 pCi/L), WM-4
methane concentrations (PRG is 0.13 µg/L) were 2.4 µg/L and 1.2 µg/L during the Wand Summer sampling events, respectively.
General Geochemistry. The sample results with exceedances of available secondary MCLs are described herein, and presented in Table
• Bicarbonate alkalinity concentrations ranged from 190 mg/L to 280 mg/L during the Winter and Summer sampling events. The maximum concentration was 280 mg/L at HWF-26, and the maximum concentration during the Summer was 250 mg/L at HWF-21.
Chloride (secondary MCL is 250 mg/L) concentrations ranged from 85 mg/L to 280 mg/L during the Winteconcentration during the Winter was 240 mg/L at HWF-26, WM-4, and WWFM, maximum concentration during the Summer was 280 mg/L at WM-4.
Fluoride (PRG is 2.2 mg/L) concentrations ranged from 1.1 mg/L to 2.0 mg/L during the Winter and Summer sampling events. The maximum concentrationWinter and Summer sampling events were at HWF-26 at 2.0 mg/L and 2.0 mg/L, respectively.
Sulfate (secondary MCL is 250 mg/L) concentrations ranged from 93 mg/L to 490 during the Winter the Winter was 490 mg/L at HWF-26, and the maximum concentration during the Summer was 330 mg/L at HWF-21.
The TDS (secondary MCL is 500 mg/L) concentrations ranged from 640 mg/L to 1,400 mg/L during the Winter and Sconcentrations for both the Winter and Summer sampling events were observed aHWF-26 with 1,400 mg/L and 1,100 mg/L, respectively.
iochemistry. Several production and wellfield wells had analyte concentrations eding either the PRGs or MCLs for radiochemistry paramet
with concentrations exceeding MCLs and/or PRGs are radium 226radium-226 activuranium- 234, and uranium- 238. The concentrations exceeding the standards are presented for each monitoring well for both Winter and Summer sampling events (Tables 4-26 and4-27).
• Radium- 226 activity (PRG is 0.000823 pCi/L): Exceedances were found only in monitmo
• Uranium- 234 activity (PRG is 0.674 pCi/L): During the Winter sampling event, the maximum exceedance was observed in HWF-21 (4.5 pCi/L), followed by HW(3.3 pCi/L), HWF-21 (Duplicate) (2.9 pCi/L), HWFM (2.7 pCi/L), WWFM (2.7 pCi/L)HWF-15 (2.4 pCi/L), WM-4 (2.3 pCi/L), and WM-3 (2 pCi/L). The production wellmanifold samples were not analyzed for uranium- 238 during the Summer sampling event.
Uranium- 238 (PRG is 0.744 pCi/L): During the Winter sampling event, the maximumexceeda
4.0 REMEDIAL INVESTIGATION RESULTS
ES022008005PHX 4-41
4.4.The water taps include the Hayden Library (HL) and a tap at the Winkelman Elementary les were analyzed for total and dissolved metals, general wa dionuclides. The results are presented in
PRGs nd Summer had
re
.
MCL is 250 mg/L) is
mg/L
r se tap samples were not analyzed for
and
An rces and the full nature and extent of groundwater impacts fro e scope of the RI. Therefore, this section focuses pri potential impacts to the local drinking water
(0.9 pCi/L), WM-3 (0.8 pCi/L), and WWFM (0.8 pCi/L). The production well and manifold samples were not analyzed for uranium- 238 during the Summer samplingevent.
2.3 Drinking Water Tap Samples drinking
School (WSCH). These sampter quality parameters, and ra
Tables 4-22 through 4-27, and are described below for each analyte group.
Inorganics: Total and Dissolved Metals. The drinking water taps were analyzed for both total and dissolved metals. The metals with concentrations exceeding the MCLs and/orwere arsenic and manganese. Both drinking water tap samples for Winter atotal and dissolved arsenic concentrations exceeding the PRG (0.045 µg/L), but below the MCL (10 µg/L). Therefore, the concentrations are not listed herein, but are shown on Figu4-48 and Figure 4-49.
The WSCH sample had a total manganese (secondary MCL is 50 µg/L) concentration of 110 µg/L during the winter sampling event only, whereas the HL sample did not have a manganese exceedance
General Geochemistry. The sample results with exceedances of available secondary MCLs are described herein, and presented in Tables 4-25 and Table 4-27).
For the HL and WSCH samples, bicarbonate alkalinity concentrations during the Winter sampling event were 240 mg/L and 210 mg/L, respectively. Chloride and fluoride concentrations were below the secondary MCLs. Sulfate (secondaryconcentrations were 260 mg/L and 130 mg/L, respectively. Lastly, TDS (secondary MCL 500 mg/L) levels for HL during the Winter and Summer sampling events were 930 and 900 mg/L respectively, and TDS for WSCH were 760 and 750 for the Winter and Summer sampling events, respectively.
Radiochemistry. The HL and WSCH drinking water tap samples had radiochemistry concentrations exceeding the PRG for uranium- 234 and -238 activity during the Wintesampling event (see Tables 4-26 and 4-27). Theradionuclide parameters during the Summer.
• For the HL tap, the uranium- 234 (PRG is 0.674 pCi/L) concentration was 1.6 pCi/L, the uranium- 238 (PRG is 0.744 pCi/L) concentration was 0.9 pCi/L.
• For the WSCH tap, the uranium- 234 concentration was 2.2 pCi/L, and the uranium- 238 concentration was 0.8 pCi/L.
4.4.2.4 Nature and Extent of Impacts evaluation of contaminant sou
m ASARCO operations was beyond thmarily on the level of actual or
aquifer and water supply. As described in Section 2.4.1, all monitor monitoring wells and production wells are screened in the following aquifers:
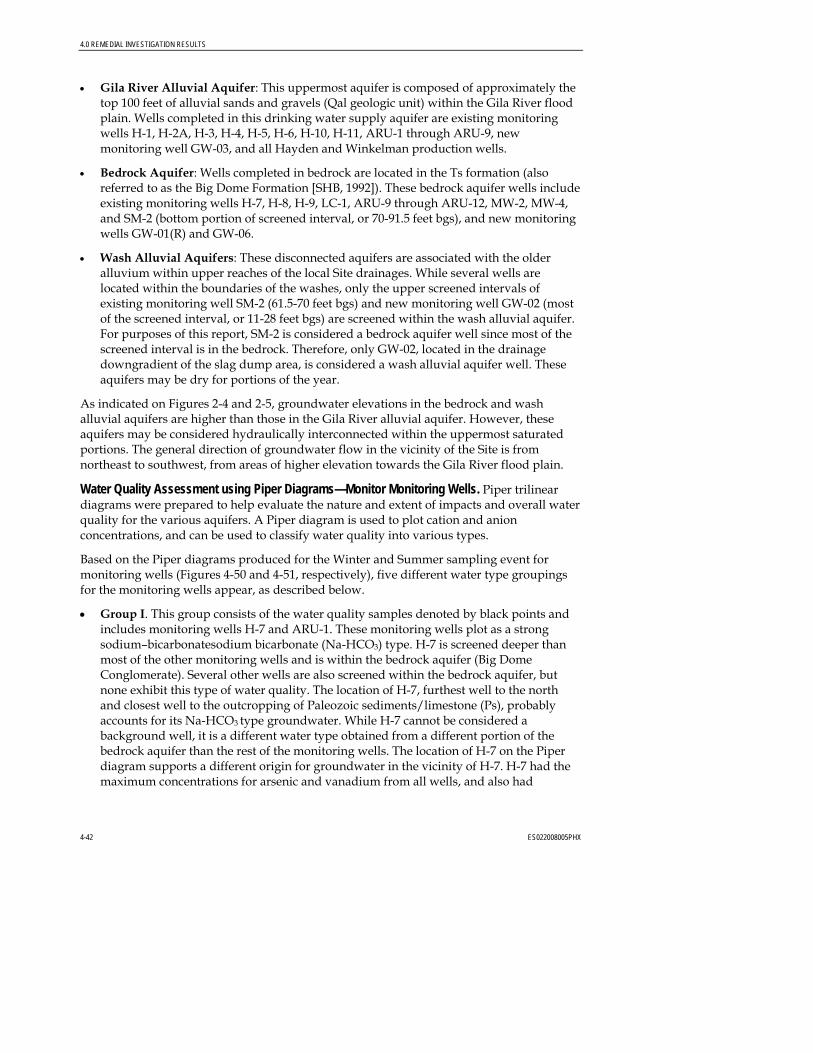
4.0 REMEDIAL INVESTIGATION RESULTS
4-42 ES022008005PHX
the
aquifer are existing monitoring
• lude
2, MW-4, ing
•
of the washes, only the upper screened intervals of ost fer.
f the
As alluaqu nected within the uppermost saturated
water
oupings
nd
3) type. H-7 is screened deeper than most of the other monitoring wells and is within the bedrock aquifer (Big Dome
e
• Gila River Alluvial Aquifer: This uppermost aquifer is composed of approximatelytop 100 feet of alluvial sands and gravels (Qal geologic unit) within the Gila River flood plain. Wells completed in this drinking water supply wells H-1, H-2A, H-3, H-4, H-5, H-6, H-10, H-11, ARU-1 through ARU-9, new monitoring well GW-03, and all Hayden and Winkelman production wells.
Bedrock Aquifer: Wells completed in bedrock are located in the Ts formation (also referred to as the Big Dome Formation [SHB, 1992]). These bedrock aquifer wells incexisting monitoring wells H-7, H-8, H-9, LC-1, ARU-9 through ARU-12, MW-and SM-2 (bottom portion of screened interval, or 70-91.5 feet bgs), and new monitorwells GW-01(R) and GW-06.
Wash Alluvial Aquifers: These disconnected aquifers are associated with the older alluvium within upper reaches of the local Site drainages. While several wells are located within the boundariesexisting monitoring well SM-2 (61.5-70 feet bgs) and new monitoring well GW-02 (mof the screened interval, or 11-28 feet bgs) are screened within the wash alluvial aquiFor purposes of this report, SM-2 is considered a bedrock aquifer well since most oscreened interval is in the bedrock. Therefore, only GW-02, located in the drainage downgradient of the slag dump area, is considered a wash alluvial aquifer well. These aquifers may be dry for portions of the year.
indicated on Figures 2-4 and 2-5, groundwater elevations in the bedrock and wash vial aquifers are higher than those in the Gila River alluvial aquifer. However, these ifers may be considered hydraulically intercon
portions. The general direction of groundwater flow in the vicinity of the Site is from northeast to southwest, from areas of higher elevation towards the Gila River flood plain.
Water Quality Assessment using Piper Diagrams—Monitor Monitoring Wells. Piper trilinear diagrams were prepared to help evaluate the nature and extent of impacts and overallquality for the various aquifers. A Piper diagram is used to plot cation and anion concentrations, and can be used to classify water quality into various types.
Based on the Piper diagrams produced for the Winter and Summer sampling event for monitoring wells (Figures 4-50 and 4-51, respectively), five different water type grfor the monitoring wells appear, as described below.
• Group I. This group consists of the water quality samples denoted by black points aincludes monitoring wells H-7 and ARU-1. These monitoring wells plot as a strong sodium–bicarbonatesodium bicarbonate (Na-HCO
Conglomerate). Several other wells are also screened within the bedrock aquifer, but none exhibit this type of water quality. The location of H-7, furthest well to the north and closest well to the outcropping of Paleozoic sediments/limestone (Ps), probably accounts for its Na-HCO3 type groundwater. While H-7 cannot be considered a background well, it is a different water type obtained from a different portion of the bedrock aquifer than the rest of the monitoring wells. The location of H-7 on the Piper diagram supports a different origin for groundwater in the vicinity of H-7. H-7 had thmaximum concentrations for arsenic and vanadium from all wells, and also had
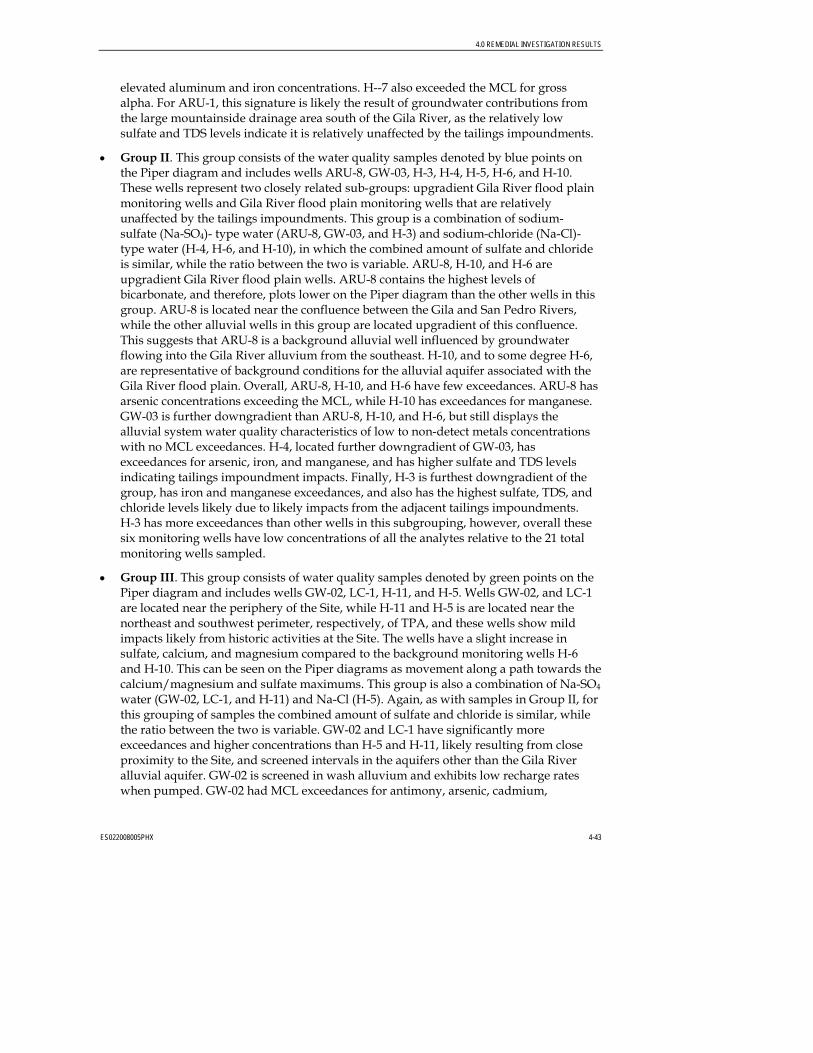
4.0 REMEDIAL INVESTIGATION RESULTS
ES022008005PHX 4-43
ts.
•
loride
ers, uence.
6, e
has
ls
S, and
•
ry of the Site, while H-11 and H-5 is are located near the
the -SO4
rates
elevated aluminum and iron concentrations. H--7 also exceeded the MCL for gross alpha. For ARU-1, this signature is likely the result of groundwater contributions from the large mountainside drainage area south of the Gila River, as the relatively lowsulfate and TDS levels indicate it is relatively unaffected by the tailings impoundmen
Group II. This group consists of the water quality samples denoted by blue points on the Piper diagram and includes wells ARU-8, GW-03, H-3, H-4, H-5, H-6, and H-10. These wells represent two closely related sub-groups: upgradient Gila River flood plain monitoring wells and Gila River flood plain monitoring wells that are relatively unaffected by the tailings impoundments. This group is a combination of sodium- sulfate (Na-SO4)- type water (ARU-8, GW-03, and H-3) and sodium-chloride (Na-Cl)- type water (H-4, H-6, and H-10), in which the combined amount of sulfate and chis similar, while the ratio between the two is variable. ARU-8, H-10, and H-6 are upgradient Gila River flood plain wells. ARU-8 contains the highest levels of bicarbonate, and therefore, plots lower on the Piper diagram than the other wells in this group. ARU-8 is located near the confluence between the Gila and San Pedro Rivwhile the other alluvial wells in this group are located upgradient of this conflThis suggests that ARU-8 is a background alluvial well influenced by groundwater flowing into the Gila River alluvium from the southeast. H-10, and to some degree H-are representative of background conditions for the alluvial aquifer associated with thGila River flood plain. Overall, ARU-8, H-10, and H-6 have few exceedances. ARU-8arsenic concentrations exceeding the MCL, while H-10 has exceedances for manganese. GW-03 is further downgradient than ARU-8, H-10, and H-6, but still displays the alluvial system water quality characteristics of low to non-detect metals concentrations with no MCL exceedances. H-4, located further downgradient of GW-03, has exceedances for arsenic, iron, and manganese, and has higher sulfate and TDS leveindicating tailings impoundment impacts. Finally, H-3 is furthest downgradient of the group, has iron and manganese exceedances, and also has the highest sulfate, TDchloride levels likely due to likely impacts from the adjacent tailings impoundments. H-3 has more exceedances than other wells in this subgrouping, however, overall thesesix monitoring wells have low concentrations of all the analytes relative to the 21 total monitoring wells sampled.
Group III. This group consists of water quality samples denoted by green points on the Piper diagram and includes wells GW-02, LC-1, H-11, and H-5. Wells GW-02, and LC-1are located near the periphenortheast and southwest perimeter, respectively, of TPA, and these wells show mild impacts likely from historic activities at the Site. The wells have a slight increase in sulfate, calcium, and magnesium compared to the background monitoring wells H-6 and H-10. This can be seen on the Piper diagrams as movement along a path towardscalcium/magnesium and sulfate maximums. This group is also a combination of Nawater (GW-02, LC-1, and H-11) and Na-Cl (H-5). Again, as with samples in Group II, forthis grouping of samples the combined amount of sulfate and chloride is similar, while the ratio between the two is variable. GW-02 and LC-1 have significantly more exceedances and higher concentrations than H-5 and H-11, likely resulting from close proximity to the Site, and screened intervals in the aquifers other than the Gila River alluvial aquifer. GW-02 is screened in wash alluvium and exhibits low rechargewhen pumped. GW-02 had MCL exceedances for antimony, arsenic, cadmium,
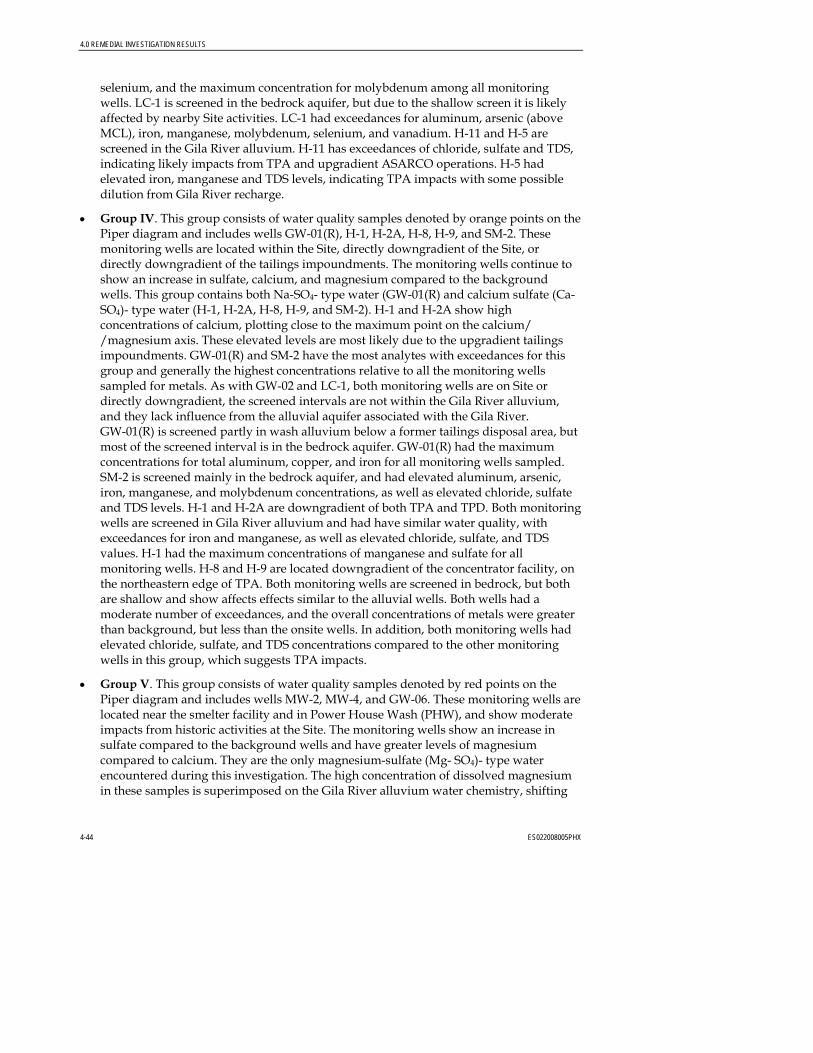
4.0 REMEDIAL INVESTIGATION RESULTS
4-44 ES022008005PHX
bove
le
• e
the Site, directly downgradient of the Site, or
(Ca-
s for this
, but
pled.
, on th
a
g
•
se Wash (PHW), and show moderate
m fting
selenium, and the maximum concentration for molybdenum among all monitoring wells. LC-1 is screened in the bedrock aquifer, but due to the shallow screen it is likelyaffected by nearby Site activities. LC-1 had exceedances for aluminum, arsenic (aMCL), iron, manganese, molybdenum, selenium, and vanadium. H-11 and H-5 are screened in the Gila River alluvium. H-11 has exceedances of chloride, sulfate and TDS,indicating likely impacts from TPA and upgradient ASARCO operations. H-5 had elevated iron, manganese and TDS levels, indicating TPA impacts with some possibdilution from Gila River recharge.
Group IV. This group consists of water quality samples denoted by orange points on thPiper diagram and includes wells GW-01(R), H-1, H-2A, H-8, H-9, and SM-2. These monitoring wells are located withindirectly downgradient of the tailings impoundments. The monitoring wells continue to show an increase in sulfate, calcium, and magnesium compared to the background wells. This group contains both Na-SO4- type water (GW-01(R) and calcium sulfateSO4)- type water (H-1, H-2A, H-8, H-9, and SM-2). H-1 and H-2A show high concentrations of calcium, plotting close to the maximum point on the calcium/ /magnesium axis. These elevated levels are most likely due to the upgradient tailings impoundments. GW-01(R) and SM-2 have the most analytes with exceedancegroup and generally the highest concentrations relative to all the monitoring wells sampled for metals. As with GW-02 and LC-1, both monitoring wells are on Site or directly downgradient, the screened intervals are not within the Gila River alluvium, and they lack influence from the alluvial aquifer associated with the Gila River. GW-01(R) is screened partly in wash alluvium below a former tailings disposal areamost of the screened interval is in the bedrock aquifer. GW-01(R) had the maximum concentrations for total aluminum, copper, and iron for all monitoring wells samSM-2 is screened mainly in the bedrock aquifer, and had elevated aluminum, arsenic, iron, manganese, and molybdenum concentrations, as well as elevated chloride, sulfateand TDS levels. H-1 and H-2A are downgradient of both TPA and TPD. Both monitoringwells are screened in Gila River alluvium and had have similar water quality, with exceedances for iron and manganese, as well as elevated chloride, sulfate, and TDS values. H-1 had the maximum concentrations of manganese and sulfate for all monitoring wells. H-8 and H-9 are located downgradient of the concentrator facilitythe northeastern edge of TPA. Both monitoring wells are screened in bedrock, but boare shallow and show affects effects similar to the alluvial wells. Both wells hadmoderate number of exceedances, and the overall concentrations of metals were greater than background, but less than the onsite wells. In addition, both monitoring wells had elevated chloride, sulfate, and TDS concentrations compared to the other monitorinwells in this group, which suggests TPA impacts.
Group V. This group consists of water quality samples denoted by red points on the Piper diagram and includes wells MW-2, MW-4, and GW-06. These monitoring wells arelocated near the smelter facility and in Power Houimpacts from historic activities at the Site. The monitoring wells show an increase in sulfate compared to the background wells and have greater levels of magnesium compared to calcium. They are the only magnesium-sulfate (Mg- SO4)- type water encountered during this investigation. The high concentration of dissolved magnesiuin these samples is superimposed on the Gila River alluvium water chemistry, shi
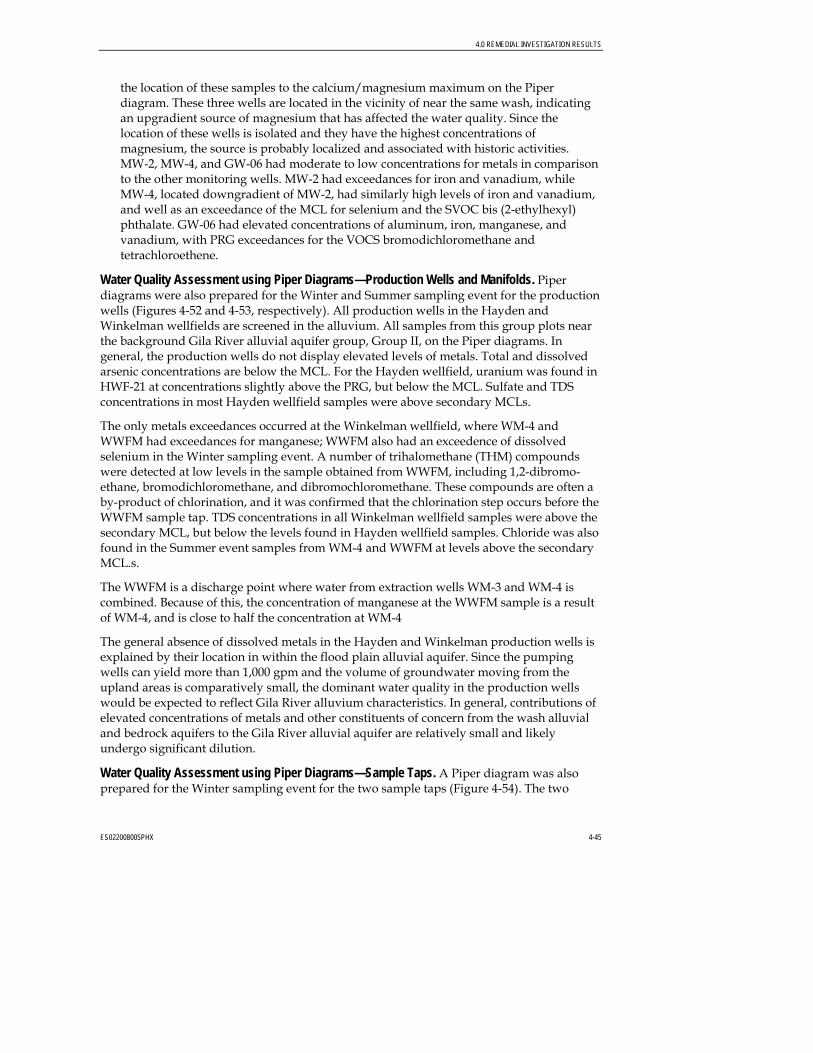
4.0 REMEDIAL INVESTIGATION RESULTS
ES022008005PHX 4-45
arison while
m,
Wadia oduction wel 4-53, respectively). All production wells in the Hayden and
ear
olved
pounds o-
n a he he
d is close to half the concentration at WM-4
ndwater moving from the
of ial
the location of these samples to the calcium/magnesium maximum on the Piper diagram. These three wells are located in the vicinity of near the same wash, indicating an upgradient source of magnesium that has affected the water quality. Since the location of these wells is isolated and they have the highest concentrations of magnesium, the source is probably localized and associated with historic activities. MW-2, MW-4, and GW-06 had moderate to low concentrations for metals in compto the other monitoring wells. MW-2 had exceedances for iron and vanadium,MW-4, located downgradient of MW-2, had similarly high levels of iron and vanadiuand well as an exceedance of the MCL for selenium and the SVOC bis (2-ethylhexyl) phthalate. GW-06 had elevated concentrations of aluminum, iron, manganese, and vanadium, with PRG exceedances for the VOCS bromodichloromethane and tetrachloroethene.
ter Quality Assessment using Piper Diagrams—Production Wells and Manifolds. Piper grams were also prepared for the Winter and Summer sampling event for the prls (Figures 4-52 and
Winkelman wellfields are screened in the alluvium. All samples from this group plots nthe background Gila River alluvial aquifer group, Group II, on the Piper diagrams. In general, the production wells do not display elevated levels of metals. Total and dissarsenic concentrations are below the MCL. For the Hayden wellfield, uranium was found inHWF-21 at concentrations slightly above the PRG, but below the MCL. Sulfate and TDS concentrations in most Hayden wellfield samples were above secondary MCLs.
The only metals exceedances occurred at the Winkelman wellfield, where WM-4 and WWFM had exceedances for manganese; WWFM also had an exceedence of dissolved selenium in the Winter sampling event. A number of trihalomethane (THM) comwere detected at low levels in the sample obtained from WWFM, including 1,2-dibromethane, bromodichloromethane, and dibromochloromethane. These compounds are ofteby-product of chlorination, and it was confirmed that the chlorination step occurs before tWWFM sample tap. TDS concentrations in all Winkelman wellfield samples were above tsecondary MCL, but below the levels found in Hayden wellfield samples. Chloride was alsofound in the Summer event samples from WM-4 and WWFM at levels above the secondary MCL.s.
The WWFM is a discharge point where water from extraction wells WM-3 and WM-4 is combined. Because of this, the concentration of manganese at the WWFM sample is a result of WM-4, an
The general absence of dissolved metals in the Hayden and Winkelman production wells is explained by their location in within the flood plain alluvial aquifer. Since the pumping wells can yield more than 1,000 gpm and the volume of grouupland areas is comparatively small, the dominant water quality in the production wells would be expected to reflect Gila River alluvium characteristics. In general, contributionselevated concentrations of metals and other constituents of concern from the wash alluvand bedrock aquifers to the Gila River alluvial aquifer are relatively small and likely undergo significant dilution.
Water Quality Assessment using Piper Diagrams—Sample Taps. A Piper diagram was also prepared for the Winter sampling event for the two sample taps (Figure 4-54). The two
4.0 REMEDIAL INVESTIGATION RESULTS
4-46 ES022008005PHX
w
at the
w of contaminant sources, pathways, and receptors as to g
In general, th dwater quality data from the Winter and Summer groundwater sampling e flect that metals with several occurrences of total or dissolved
se bdenum
dmium had only a single MCL exceedence in one well (GW-02), and read impacts from these metals are not likely.
semi-arid desert regions. An
nitoring wells near or downgradient of
concentrator facility,
drinking water tap samples plot on the Piper diagram with the production wells and nearthe background alluvial aquifer group (Group II). The drinking water taps generally shono elevated levels of metals contamination. Total and dissolved arsenic concentrations are below the MCL. The concentrations of copper at both the HL and WSCH samples are significantly higher than concentrations found in the monitoring wells and source production well samples, but are still below the secondary MCL. The source of copperdrinking water taps, therefore, is likely from the distribution system.
4.4.3 Fate and Transport This section provides a brief revierelated roundwater impacts.
4.4.3.1 Metals e groun
vents reconcentrations exceeding standards, as indicated on Table 4-27, were:
• Aluminum • Arsenic • Iron • Mangane• Moly• Selenium • Vanadium
Antimony and catherefore widesp
Most of the constituents listed above are commonly associated with copper mining andprocessing activities, but can also occur naturally in aquifers of assessment of background concentrations in groundwater was not conducted due to the lack of suitable background monitoring wells.
Arsenic concentrations at six monitoring well locations had concentrations exceeding the MCL. The highest arsenic concentrations are in moASARCO operations, including H-7, LC-1, SM-2, and GW-02. The extent of arsenic distribution was not defined, and would require additional background water quality dataand delineation in other areas surrounding ASARCO operations.
Monitoring wells GW-01(R), GW-02, LC-1, and SM-2 generally had the highest total metal concentrations, and Wells LC-1 and GW-01(R) are all located near thewhile SM-2 and GW-02 are located near the former or active smelter facility. Wells LC-1, SM-2, and GW-02 had high selenium and molybdenum concentrations, which are associatedwith slag dumps or slag processing areas. The concentrations in these wells are influenced by historic mineral processing activities at the Site. Because of the relatively few number of wells, actual source areas and the extent of impacts are not delineated. As groundwater flows to the south/southwest towards the Gila River, concentrations are significantly diluted by the volume of flow in the Gila River alluvial aquifer. Figures 4-8 and 4-9 indicate
4.0 REMEDIAL INVESTIGATION RESULTS
ES022008005PHX 4-47
ng
adient
e sampling event. This is likely a seasonal effect due to the unusually dry winter
al ht
y
tion of exposure to drinking water receptors in these
the
Regarding H-1 had the highest chloride, sulfate, and TDS concentrat h generally high sulfate levels include H-2A,
m
ese
Analysis fo H was conducted for a limited number of wells. Monitoring W-06 showed some trace levels of VOCs that exceeded
at y
tion
a higher incidence of PRG or MCL exceedances in wells associated with tailings (includiKennecott Wash), slag dumps, and industrial areas related to the smelters.
The tailings impoundments are a likely source of iron and manganese impacts to groundwater, as indicated by elevated concentrations in H-1 and H-2A, downgrof TPA.
Data from the Winter sampling event typically had greater metal concentrations than thSummer conditions and the wet summer months. During the Winter sampling event, much of centrArizona experienced a record-breaking period without rain. However, the summer brougheavy rainfall just prior to the sampling round conducted at the end of August 2006. The water levels in all wells with the exception of ARU-5, ARU-8, and GW-06, increased due to the recharge from rainfall to the alluvial aquifers (Table 4-28). As a result, the water qualitresults show a general lowered (dilution) of total and dissolved metal concentrations duringthe Summer sampling event.
Finally, the HWFM and HL samples for Hayden, and the WWFM and WSCH samples for Winkelman, provide an indicacommunities. The Hayden samples do not show MCL exceedances, whereas the WWFM samples (both events) and WSCH sample (Winter only) show only manganese above secondary MCL of 50 µg/L. The secondary MCL was developed to avoid staining of clothing and fixtures, and is believed to be more than adequate to protect human health asdescribed in the “Drinking Water Health Advisory for Manganese” (EPA, 2004b).
4.4.3.2 General Groundwater Chemistry general groundwater chemistry,
ions. Other monitoring wells witH-3, H-8, H-9, LC-1, and SM-2. All wells on the Site have sulfate and TDS concentrations greater than the secondary MCL standards (250 mg/L and 500 mg/L, respectively). This indicates that historic mineral processing activities at the Site, including the tailings impoundments, are contributing sulfate and other TDS to the Gila River alluvial aquifer.
Regarding Hayden exposures, the HWFM and HL samples showed sulfate and TDS concentrations well below levels found in Gila River alluvial aquifer monitor monitoring wells, but still above the secondary MCL. For Winkelman exposures, the WWFM andWSCH samples showed TDS levels above the secondary MCL, and the WWFM sample frothe Summer event had chloride above the secondary MCL. The secondary MCLs for thconstituents were established as non-enforceable guidelines for water systems. For chloride, sulfate, and TDS, these levels are based on odor and taste, and the levels are believed more than adequate to protect human health.
4.4.3.3 VOCs, SVOCs and TPH r VOCs, SVOCs, and TP wells GW-01(R) and G
the PRGs, and MW-4 had a concentration of the SVOC bis(2-ethylhexyl) phthalate thexceeded the MCL, which indicates that upgradient ASARCO-related sources of VOCs maexist. However, VOCs and SVOCs were not found in the HWFM sample. Some disinfec
4.0 REMEDIAL INVESTIGATION RESULTS
4-48 ES022008005PHX
onuclides Nearly all oduction well, manifold, and tap water samples showed levels of U -234 and -238 activity above the PRGs. No MCLs are established
al
which are not considered to be a public health concern. In most cases, the
s) ost
ed
rces, especially
Overall, the al concentrations demonstrates that some Site-related impacts ar r, the delineation of these impacts from metals has not been
ances
is
d production wells at levels above the secondary MCLs. The occurrence of
d -238
byproducts were found in the WWFM sample. VOCs, SVOCs, and TPH were not analyzed for in the tap water samples, but overall exposure to these organic compounds is expected to be minimal.
4.4.3.4 Radimonitoring well, prranium uranium
for these uranium activity levels, however total Uranium was also analyzed for in seversamples and there were no MCL exceedances. There were also limited PRG exceedances for gross alpha and Radium radium-226 activity in some wells, although the Hayden and Winkelman manifold and tap water samples did not show PRG exceedances for these constituents.
On a national and local level, most drinking water sources will have very low levels of radioactivity,radioactivity is naturally occurring. Certain rock types have naturally occurring trace amounts of “mildly radioactive” elements (radioactive elements with very long half-livethat serve as the “parent” of other radioactive contaminants (“daughter products”). Mparts of the United States have very low “average radionuclide occurrence” in drinking water sources. However, some parts of the country have, on average, elevated levels of particular radionuclides compared to the national average. For example, some Western states have elevated average uranium levels compared to the national average as describin the EPA website relating to safewater/radionuclides (EPA, 2008c)).
Although copper processing has been known to concentrate radioactive materials, there appears to be minimal impacts to this Site. There is evidence of natural soufrom the southwest side of the Gila and San Pedro Rivers.
4.4.3.5 Overall Summary distribution of met
e present. Howeveachieved because of the relatively few number of monitoring wells. The metals exceedare likely due to localized sources and/or historic plant mineral processing activities. Groundwater in the alluvium of the washes is likely affected by Site activities and drains to the Gila River alluvial aquifer; however, due to because of dilution effects, this limitedcontribution of a metals load has little impact on the water quality found in production wells completed in the alluvial aquifer. If groundwater on the southeastern side of TPApumped only for municipal supply in the future, impacts to the Hayden water supply are possible.
In addition to metals, concentrations of sulfate, chloride, and TDS were found in many monitoring anthese constituents can be demonstrated and their impact on the regional alluvial aquifersystem is likely a result of current and historic mineral processing practices.
No significant impacts from VOCs, SVOCs, or TPH were identified, although the extent ofsampling was quite limited. Finally, radionuclides, especially uranium-234 an
4.0 REMEDIAL INVESTIGATION RESULTS
ES022008005PHX 4-49
ir ectio ibes the air monitoring results for the Hayden and Winkelman stations
d a f the RI.
d concentrations of PM10 and selected metals (including arsenic,
10 s aintenance yard and the Hayden High School
ity, s.
ples
y
gro as not installed as part of the RI. Therefore, an quality data was conducted for comparison with
s l
f re
e
activities are elevated compared to PRGs are and appear to be naturally occurring in the region.
4.5 AThis s n descrinstalle s part o
First, an evaluation of available background air quality data is provided. Then, a summary and evaluation of monitorelead, copper, cadmium, and chromium) are presented for the Hayden and Winkelman air monitoring stations. Although data collection will continue for several more months, the approximately one year of data and conclusions presented in this section are considered relatively complete and representative. .
The two air monitoring stations consist of PM and meteorological data collection systemand are installed at the town of Hayden m(located in Winkelman and referred to as the Winkelman station). Each station was established to collect PM10 samples during a 24-hour period (midnight to midnight) on a 6-day cycle, while meteorological data (average ambient temperature, relative humidwind speed, and wind direction) are collected every 30 minutes on a continuous daily basiThis data evaluation includes Hayden station monitoring data from October 22, 2006, through November 7, 2007, and Winkelman station monitoring data from November 21, 2006, through November 1, 2007. In addition, this report includes the results of air samcollected during the March 10-31, 2008, period, when ASARCO’s smelter facility was shutdown for annual maintenance (note that the 2007 annual shutdown occurred between January 15 and February 5, 2007). Samples collected during these periods were submitted for analysis of PM10 by gravimetric method and for metals analysis of the PM10 filters bEPA Compendium Method IO-3.3 using X-ray Fluorescence Spectroscopy. All laboratory analyses were conducted by Chester LabNet of Tigard, Oregon.
4.5.1 Background Air Quality A back und air monitoring station wassessment of available background airRI data from the Hayden and Winkelman stations. Data collected from remote locationwith minimal anthropogenic (caused or influenced by human activities) contributions canbe used to estimate background concentrations of metals in ambient air. Data from severaremote monitoring locations in Arizona were reviewed to identify appropriate datasets to provide background concentrations for an area similar to Hayden, Arizona. Appendix C contains a technical memorandum that provides details of the methodology used to select representative data for estimation of background concentration of PM10 and metals. In summary, PM10 filter samples from the Organ Pipe National Monument (Organ Pipe, part othe Interagency Monitoring of Protected Visual Environments [IMPROVE] network) weused to estimate background concentrations. A selected number of samples from the Organ Pipe station were submitted to Chester LabNet for analysis of PM10 and metals, per the samEPA methodology used for analysis of the RI station samples. The annual mean, minimum, and maximum values for PM10 and selected metals (arsenic, cadmium, copper, lead, and
4.0 REMEDIAL INVESTIGATION RESULTS
4-50 ES022008005PHX
ct in the es from the Organ Pipe station. However, the MDLs for arsenic (which
w the
ta c ns included olog sure, relative
rain
igh
4-31 and 4-32 provide a summary of the air sampling
nty value, in accordance rtainty measurement
while a es
ove
chromium) from the Organ Pipe station for calendar year 2006 are summarized in Table 4-29.
As shown on Table 4-29, the concentrations of arsenic and cadmium were non-deteambient air samplranged from 0.0003 to 0.0006 µg/m3) and cadmium (0.0006 to 0.0009 µg/m3) were below the arsenic and cadmium ambient air PRGs of 0.00045 and 0.0011 µg/m3, respectively, except for five sample that had an arsenic MDL of 0.0006 µg/m3, only slightly above the MDL. The arithmetic mean concentration of chromium (0.00049 µg/m3) was above the PRG for ambient air of 0.00016 µg/m3. There are no ambient air PRGs for copper and lead; however the average lead concentration (0.00133 µg/m3) at this background station is well belocurrent NAAQS of 1.5 µg/m3 and below the EPA-proposed revision to the NAAQS standard to within the range of 0.10 – 0.30 µg/m3. Overall, these metals concentrations can be used for direct comparison with data from the Hayden and Winkelman stations.
4.5.2 Air Quality Results in Hayden and Winkelman Stations The da ollected from the Hayden and Winkelman air monitoring statiometeor ical data (electronically recorded temperature, barometric preshumidity, wind speed and wind direction data at both stations, and manually recordedgauge data at the Winkelman station only), PM10, and metals (including arsenic, copper, cadmium, lead, and chromium) during the period October 2006 through November 2007.
A summary of the meteorological data (temperature, pressure, relative humidity, and Winkelman station rain gauge data) is provided in Table 4-30. The rain gauge data for the Winkelman station was recorded manually by an on-site representative at the Hayden HSchool. The data are included for information purposes, but its accuracy and completeness could not be independently verified.
Following validation of the laboratory data, summary tables were created containing the results and any data qualifiers. Tablesresults for PM10 and metals for the Hayden and Winkelman stations, respectively. These tables also show the regulatory comparison criteria, along with a 24-hour windrose for each day PM10 samples were collected. Finally, Table 4-33 presents a statistical summary of all PM10 and metals data from the Hayden and Winkelman stations.
The metals results reported by Chester LabNet include an uncertaiwith the XRF analytical procedure in EPA Method IO-3.3. The uncerepresents the statistical range in which a measurement may fall. For a Gaussian distribution, a one-sigma uncertainty would describe the range of possible values (by adding and subtracting the uncertainty to the reported value) with 68% confidence, three-sigma uncertainty would describe the range at 99.7% confidence. The uncertaintireported by the laboratory are one sigma uncertainties. Based on discussions with the laboratory and a review of practices used to evaluate air quality data at other sites, a threesigma uncertainty was used for review of data for this Site. When a measured value is abthe three-sigma MDL uncertainty, it is considered a detected result, and is reported as is. If it is found below the three-sigma uncertainty, it is considered a nondetected result, and the three-sigma uncertainty value is provided in the summary tables. For some samples, the
4.0 REMEDIAL INVESTIGATION RESULTS
ES022008005PHX 4-51
, the concentrations of PM10 and metals at the two stations were likely affected by
4.5.2.1 PM Concentration Summary As indicate alidation there are 58 available results for PM10
10 the two RI stations and the
ges at
t
007, at the e
t the 007
e
rack
4.5.2.2 Metal Concentrations Summary The concen ters, including arsenic, lead, copper, and
eriod are
L;
three-sigma MDL uncertainty is above the regulatory criteria, as indicated in Tables 4-31 and 4-32.
In generala combination of factors, including the relative locations of the emission sources and the monitoring stations, the variation of the emission rates of the sources, and meteorologicalconditions such as wind direction and speed.
10
d in Table 4-33, following data vat the Hayden station and 55 results available for the Winkelman station. The average PM10 value for the Hayden station (37.7 µg/m3) over this period is about 1.9 times the average PM10 value at the Winkelman station (20.2 µg/m3). These concentrations both exceed the Organ Pipe station background average value (16 µg/m3).
Figure 4-55 shows the comparison of PM concentrations at average wind speed monitored at the Hayden station (since wind speeds were generallysimilar at both stations). In general, PM10 concentrations were observed to be higher at the Hayden station than the Winkelman station except on one day (March 27, 2007). The fluctuation of the PM10 concentrations seems to follow the pattern of wind speed chanthe Hayden station. However at The Winkelman station higher concentrations of PM10 were not measured if the wind was not blowing from the direction of smelter, concentrator or tailing piles. The highest or lowest PM10 concentrations at both monitoring stations did nonecessarily occur on days with the highest or lowest wind speed, respectively.
The highest concentrations of PM10 were found on June 1, 2007, and March 27, 2Hayden (91.5 µg/m3) station and Winkelman (82.4 µg/m3) station, respectively. None of thsamples collected at the two stations exceeded the NAAQS 24-hour PM10 value of 150 µg/m3. The wind rose diagrams, provided in Tables 4-31 and 4-32, indicate thaaverage wind speed on June 1, 2007 was moderate, while the wind speed on March 27, 2was the third highest wind speed during the entire monitoring period. For both days, the hourly wind directions were measured predominantly from the west, southwest, and southeast, with the average wind direction for the day from the west-southwest. For thHayden station, upwind sources of PM10 emissions on that day included the tailings impoundments (to the southwest), open areas west of Hayden (to the west), and the thopper, CF and Conveyer 9 area (to the southeast). For the Winkelman station, upwind sources of PM10 emissions included the open spaces and tailings impoundments (to the west).
trations of metals in the PM10 filchromium, were evaluated for both the Hayden and Winkelman stations. The concentrations of arsenic, lead, copper, and chromium during the monitoring pshown in Figures 4-56 through 4-59, respectively. The cadmium concentrations were not plotted due to the relatively low number of detections above the laboratory-reported MDthere were only five detections at the Hayden station and six detections at the Winkelman station. The metals results are further described below.
4.0 REMEDIAL INVESTIGATION RESULTS
4-52 ES022008005PHX
Arsenic Concentrations at Hayden Station. Of the57 samples collected in Hayden during the reporting period and analyzed for metals, 49 (86%) exceeded the arsenic ambient air PRG of 0.00045 µg/m3. Table 4-34 presents the highest concentration sample dates for arsenic, along with the prevailing wind direction and potential upwind sources on those dates. The eight most elevated arsenic concentrations were found on November 21, 2006; December 3, 2006; January 8, 2007; March 3, 2007; August 30, 2007; September 11, 2007 (highest level); October 22, 2007, and; November 7, 2007.
During most of these sample periods, the prevailing wind direction was from the northeast and east, and the ASARCO smelter facility was generally upwind. The maximum arsenic concentration (0.189 µg/m3 on September 11, 2007) is about 420 times the ambient air PRG and just below the California Acute Reference Exposure Level (REL) of 0.19 µg/m3 (4-hour average value). Although the Hayden station sample from June 1, 2007 (91.5 µg/m3) had the highest PM10 reading, an elevated concentration of arsenic was not found on this day.
Table 4-35 presents the average ambient air concentrations for arsenic (and other metals) measured at the Organ Pipe background station, compared with average ambient air concentrations from the Hayden and Winkelman stations. The average arsenic concentration at the Hayden station (0.0239 µg/m3) is about 40-80 times higher than the range of arsenic MDL values (0.0003 – 0.0006 µg/m3) at the Organ Pipe station.
Arsenic Concentrations at Winkelman Station. Of the 55 samples collected in Winkelman during the reporting period and analyzed for metals, 39 (71%) exceeded the arsenic ambient air PRG of 0.00045 µg/m3. As shown on Table 4-34, the seven most elevated arsenic concentrations were found on February 19, 2007; April 26, 2007; May 8, 2007 (tied for highest value); May 14, 2007 (tied for highest value); June 1, 2007; June 25, 2007; and August 18, 2007.
During most of these sample periods, the prevailing wind direction was from the northwest, and the ASARCO smelter and concentrator facilities were generally upwind. The maximum arsenic concentration (0.0282 µg/m3, measured on both May 8, 2007 and May 14, 2007) is about 62 times the PRG, and about 6.7 times lower than the maximum value recorded in Hayden. Also, the elevated arsenic concentration days in Hayden and Winkelman did not coincide; however, arsenic data in Winkelman were not available for some of the days when elevated arsenic concentrations were found in Hayden, such as October 22 and November 7, 2007.
As indicated on Table 4-35, the average arsenic concentration at the Winkelman station (0.008 µg/m3) is about 13-26 times higher than the range of MDL values (0.0003 – 0.0006 µg/m3) at the Organ Pipe station.
Lead Concentrations in Hayden and Winkelman. As shown in Figure 4-57, the concentration pattern for lead in the Hayden and Winkelman samples was very similar to arsenic and cadmium, with the elevated concentrations occurring on the same dates. The maximum lead concentration (0.836 µg/m3 on September 11, 2007) in Hayden (Tables 4-31 and 4-33) corresponded to the same sample for which the maximum arsenic concentration was found; this lead concentration in the PM10 sample is about 55% of the NAAQS of 1.5 µg/m3 (quarterly average value), but considerably above the EPA-proposed NAAQS revision (range of 0.1 to 0.3 µg/m3). The average lead concentration in Hayden (0.0853 µg/m3) is
4.0 REMEDIAL INVESTIGATION RESULTS
ES022008005PHX 4-53
about 64 times the Organ Pipe station average background value of 0.00133 µg/m3 (Tables 4-29, 4-31, and 4-35).
The maximum lead concentration (0.083 µg/m3 on June 25, 2007) in Winkelman (Tables 4-32 and 4-33) corresponded to the fourth highest arsenic concentration sample, is about 5% of the NAAQS, is below the EPA-proposed NAAQS revision (range of 0.1 to 0.3 µg/m3, and is about 100 times lower than the maximum lead value recorded in Hayden. However, the average lead concentration in Winkelman (0.0224 µg/m3 is about 16.8 time higher than the Organ Pipe station average background value of 0.00133 µg/m3 (Table 4-35).
It is important to note that lead data for use in determination of compliance with the federal lead NAAQS must be collected and analyzed using a Federal Reference Method (FRM) or Federal Equivalent Method (FEM) for lead using a Total Suspended Particulate (Pb-TSP) monitor. The current FRM for lead sampling is based on the use of a high-volume Total Suspended Particulate (TSP) sampler, and use of atomic absorption for the analysis of lead (40 CFR 50, Appendix G). In addition, all other approved FEMs are based on the use of high-volume TSP samplers.
Copper Concentrations in Hayden and Winkelman. As shown in Figure 4-58, the concentration pattern for copper in the Hayden and Winkelman samples was very similar to arsenic and cadmium, with the elevated concentrations occurring on the same dates. There is no PRG or NAAQS for copper, and the California Acute REL is 100 µg/m3 (1 hour average). The maximum copper concentration (3.997 µg/m3 on November 21, 2006) in Hayden was well below the Acute REL. The average copper concentration in Hayden (0.724 µg/m3) is about 510 times higher than the Organ Pipe station average background value of 0.00142 µg/m3 (Tables 4-29, 4-31, and 4-35).
The maximum copper concentration (1.3030 µg/m3 on May 8, 2007) in Winkelman corresponded to one of the two highest arsenic concentration dates, while the second highest copper concentration (0.95674 µg/m3 on June 25, 2007) corresponded to the highest lead concentration sample. The maximum copper concentration in Winkelman is about three times lower than the maximum value recorded in Hayden. As indicated on Table 4-35, however, the average copper concentration at the Winkelman station (0.288 µg/m3) is about 203 times higher than the background average copper concentration (0.00142 µg/m3) at the Organ Pipe station.
Chromium Concentrations in Hayden and Winkelman. As shown in Figure 4-59, the concentration pattern for chromium in the Hayden and Winkelman samples differs from arsenic, copper, lead, and cadmium, with the elevated concentrations occurring on the same dates as the elevated PM10 concentrations. In Hayden, the two dates with the highest chromium concentrations (0.0072 µg/m3 on June 1, 2007 and 0.0070 on October 22, 2007) were also the two dates with the highest PM10 concentrations in Hayden.
The maximum chromium concentration in Hayden (0.0072 µg/m3) is about 45 times the PRG of 0.00016 µg/m3. As indicated on Table 4-35, the average chromium concentration (0.00049 µg/m3) at the Organ Pipe background station is about three times the PRG. However, the average chromium concentration at the Hayden station (0.00175 µg/m3) is still about 3.5 times the Organ Pipe station average concentration of 0.00049 µg/m3. The highest chromium concentration in Winkelman (0.0056 µg/m3 on March 27, 2007) is about 35 times
4.0 REMEDIAL INVESTIGATION RESULTS
4-54 ES022008005PHX
the PRG. Based on Table 4-25, the average chromium concentration at the Winkelman station (0.000945 µg/m3) is still about 1.9 times the Organ Pipe station average concentration of 0.00049 µg/m3.
The dates of the highest concentrations of chromium at Hayden and Winkelman stations corresponded with the highest PM10 concentration at these two stations, respectively.
Arsenic to PM Concentration Ratio. F10 igure 4-60 shows the arsenic to PM10 concentration ratios at the two stations. The arsenic to PM10 ratios for the 8 days with elevated arsenic concentrations at the Hayden station (November 21, 2006; December 3, 2006, January 8, 2007; March 3, 2007; August 30, 2007; September 11, 2007, October 22, 2007, and November 7, 2007) are generally much higher than for the other days. During the days of when high arsenic to PM10 ratio was measured predominant wind direction was from smelter facilities to the Hayden station.
The higher arsenic to PM10 ratios at the Winkelman station occurred on the same days when elevated arsenic concentrations were found at the Winkelman station (February 13, 2007; February 19, 2007; February 25, 2007; April 26, 2007; May 8, 2007; May 14, 2007; June 1, 2007; June 25, 2007; and August 18, 2007). During most of the days when high arsenic to PM10 ratio was measured at the Winkelman station, the predominant wind direction was from smelter facilities toward the Winkelman station.
Cadmium Concentrations in Hayden and Winkelman. For Hayden samples, five cadmium results from November 21, 2006 (0.0166 µg/m3), January 8, 2007 (0.0141 µg/m3), August 30, 2007 (0.0351 µg/m3), September 11, 2007 (0.0324 µg/m3), and October 22, 2007 (0.0108 µg/m3) exceeded the PRG of 0.0011 µg/m3. The highest concentration for Hayden (the August 30, 2007 sample) is about 32 times the PRG. These dates with elevated cadmium concentrations all correspond with high arsenic and lead concentrations in Hayden. Cadmium was not found in the Organ Pipe station samples, with an MDL of 0.0006 µg/m3; however, the average cadmium concentration at the Hayden station (0.00453 µg/m3) is about 7.5 times the Organ Pipe station MDL value.
For Winkelman samples, six cadmium results from 2007 (February 19, May 8, June 1, June 19, June 25, and August 24) exceeded the PRG of 0.0011 µg/m3, and were within a narrow concentration range of 0.0022-0.0029 µg/m3, or about 2-3 times the PRG. Three of the six samples (February 19, June 1, and June 25) correspond with high arsenic concentrations in Winkelman. The average cadmium concentration at the Winkelman station (0.00121 µg/m3) is about 4 times the Organ Pipe station MDL value of 0.0003 µg/m3.
The high cadmium concentrations also correspond with high copper concentrations in samples from Hayden monitoring station. The average concentration of copper in all samples from Hayden was 0.756 µg/m3. However, during the 5 days when cadmium levels exceeded the PRG (November 21, 2006, January 8, 2007, August 30, 2007, September 11, 2007, and October 2007), copper concentrations ranged from 2.73 µg/m3 to 4.0 µg/m3.
Other Metals in Hayden and Winkelman. As indicated in Tables 4-31 and 4-32, an exceedance of PRGs was identified for manganese.
4.0 REMEDIAL INVESTIGATION RESULTS
ES022008005PHX 4-55
4.5.2.3
The manganese concentration in one Winkelman sample (March 27, 2007, 0.0544 µg/m3) exceeded the PRG of 0.051 µg/m3. The manganese exceedance corresponds with the sample date showing the highest PM10 concentration in Winkelman.
No other metals results display exceedances of regulatory criteria. However, as indicated on Tables 4-31 and 4-32, many metals do not have corresponding regulatory criteria that could be referenced in this report. Also, as described above in Section 4.5.2, the three-sigma uncertainty value exceeded the regulatory criteria for some metals. In particular, the three-sigma uncertainty value for cobalt was above the PRG in all Hayden and Winkelman samples.
Ambient Air Quality in Hayden and Winkelman During Smelter Shutdowns The ASARCO smelter was shutdown for annual maintenance during the monitoring periods from January 15-February 5, 2007, and again from March 10-31, 2008. However, the ASARCO concentrator facilities continued to operate during both of these periods of smelter shutdown. Table 4-31 and Table 4-32 include ambient air monitoring data for these dates for PM10 and metals for the Hayden and Winkelman stations. Seven samples at the Hayden station and five samples at the Winkelman station were collected during these shutdown periods. This section briefly evaluates the changes in concentrations when the smelter was not operating, with a focus on PM10 and metals.
Table 4-35 presents the average concentrations measured during the two shutdown periods. The measured concentrations of PM10 at the Hayden station during the smelter shutdown periods ranged from 1.16 µg/m3 to 29.53 µg/m3, and the arithmetic mean value was 19.5 µg/m3, which is 52% of the arithmetic mean for PM10 of 37.7 µg/m3 for the entire monitoring period (October 22, 2006, through November 7, 2007). During the shutdown periods, arsenic concentrations ranged from non-detect to 0.0079 µg/m3 with an arithmetic mean value of 0.004 µg/m3, which is just 17% of the arithmetic mean arsenic concentration of 0.0239 µg/m3 for the entire monitoring period. The average Arsenic to PM10 ratio during shut down period was 0.0003, well below the ratio of 0.003 during the entire monitoring period.
Similarly, the measured concentrations of PM10 at the Winkelman station during the smelter shutdown periods ranged from 2.19 µg/m3 to 12.47 µg/m3. The arithmetic mean value was 6.88 µg/m3, which is 34% of the arithmetic mean of 20.2 µg/m3 for the entire monitoring period. During the smelter shutdowns, arsenic concentrations ranged from non-detect to 0.0044 µg/m3 with an arithmetic mean value of 0.0024 µg/m3, which is 30% of the arithmetic mean arsenic concentration 0.008 µg/m3 for the entire monitoring period. The average Arsenic to PM10 ratio during the shut down period was 0.0004, below the ratio of 0.003 during the entire monitoring period. On March 31, 2008, when smelter was shut down and wind direction was from northwest (from smelter facilities) no elevated Arsenic to PM10 ratio was measured. The measured concentrations of arsenic, copper, lead and cadmium were also below the average measured values for each metal at the Winkelman station on this day.
4.0 REMEDIAL INVESTIGATION RESULTS
4-56 ES022008005PHX
The arithmetic mean concentration of cadmium, copper and lead also were significantly less at both the Hayden and Winkelman monitoring stations during the smelter shutdown period, compared to the arithmetic mean values over the entire monitoring period.
During the days of the smelter shutdown when the samples were collected at Hayden station, the wind speed was measured as moderate. None of the days during this shutdown period displayed a wind direction from the smelter facilities to the Hayden monitoring station. No precipitation was measured on any of the shutdown days.
During the days of the smelter shutdown when samples were collected at the Winkelman Station, the wind speed was measured as moderate. For four out of five days of monitoring, wind blew partially from the northwest (smelter facility direction). No precipitation was measured on any of the shutdown days.
4.5.2.4 Precipitation Daily precipitation data were manually recorded during the monitoring period, using a rain gauge at the Winkelman station. From October 2006 through September 2007, there were a total of 10 days with daily precipitation of 0.1 to 1.8 inches. Among the total of 10 precipitation days, 4 occurred 1 or 2 days before the sampling, and 2 occurred on the day of the sampling. The time and duration of each precipitation event was not recorded. At the Hayden station, none of the samples collected on or immediately after the days with precipitation had elevated PM or metal concentrations. At the Winkelman station, elevated arsenic to PM10 concentration ratio were observed on February 13, 2007, and April 26, 2007, with total daily precipitation of 0.1 inch and 1.8 inches recorded on these two days, respectively.
Precipitation would reduce or deplete the particulate matter from the ambient air, and the damp soil would limit the ground-level fugitive dust emissions. However, there are many other factors that would affect the PM and metal concentrations at the monitoring stations and it is difficult to relate the 24-hour average PM and metal concentration changes to the relatively short time precipitation event. More detailed data, such as hourly PM and metal concentrations as well as hourly precipitation data will be required to identify any possible effects of precipitation on the PM and metal concentration changes at the two stations.
Precipitation is not being monitored at the ADEQ Hayden Jail Monitoring Station.
4.5.3 Fate and Transport Three primary source categories can contribute to the PM10 and metal concentrations at Hayden and Winkelman stations. One category is mechanically generated emissions from the raw material handling equipment at the concentrator operations, such as the hoppers, crushers, and the conveyors. The second category includes wind reentrained dusts emission from the surrounding areas (including tailings impoundments). The third category is emissions from the smelting processes at the smelter facility. The emissions at the smelter occur from the stacks as well as the uncaptured low level fugitive emissions from the smelter buildings. The PM10 and metal concentrations may be attributed to all three source categories. The contribution from each source may vary depending on the meteorological conditions, the equipment operating conditions, and emission rates.
4.0 REMEDIAL INVESTIGATION RESULTS
ES022008005PHX 4-57
For this evaluation, only the top-elevated concentrations were evaluated to identify the possible sources that may have significantly contributed to the PM10 and metal emissions. Emissions impacts from the smelter main stack were not included in this evaluation. Although the 1,000-foot-high main stack at the smelter facility has large amounts of PM10 and metal emissions, the contributions of the main stack emissions to the locally monitored concentrations are expected to be relatively low (possibly insignificant) because of the very high stack height, which greatly helps the dispersion. In addition, the monitored wind profiles near ground level at the two stations would likely be significantly different than those at the 1,000-foot height, and thus cannot be used to predict the impacts from the main stack emissions.
In general, the elevated PM10 values were found on the days with relative higher wind speeds; however, the highest values were not found on the days with highest wind speed. The highest PM10 concentration at Hayden and Winkelman monitors occurred on June 1 and March 27, 2007, respectively, when the wind directions were from the tailings impoundments and the track hopper, CF and Conveyor 9 area toward the monitoring stations. Because the wind was not blowing from the smelter facility (as it was on other days with elevated PM10 and metals concentrations), it is reasonable to assume that the major sources of the highest PM10 concentrations at the two stations were the fugitive dust emissions from the material handling activities and/or from the tailings impoundments and surrounding open spaces with exposed soils. However, lower PM10 concentrations were also found on other days when wind was blowing from the material handling facility and the tailing impoundments, but this may be attributed to lower wind speeds.
The PM10 concentrations observed at Hayden station were generally higher than at the Winkelman station, indicating that the top contributing sources are located closer to the Hayden station. However, an accurate determination of the major contributors to the PM10 concentrations is difficult without using additional analytical tools or specific source-area sampling instruments.
The elevated PM10 emissions on June 1 and March 27, 2007 did not coincide with elevated arsenic, lead, or cadmium concentrations monitored at the Hayden and Winkelman stations, indicating that the fugitive dust emissions from areas to the west of the monitoring stations were unlikely to be the top contributor for arsenic and lead.
The arsenic and lead data generally show the same trend of concentration changes, and their concentrations were elevated on the same days when the smelter facilities were upwind of the monitors. In addition, arsenic to PM10 ratios were much higher on the days with elevated arsenic concentrations. The PM10 emissions from the smelter facility would likely contain higher arsenic content compared to the fugitive dust emissions from the material handling or tailings impoundment (wind erosion) areas. The higher arsenic to PM10 ratio indicates that the major sources for elevated arsenic and lead concentrations are likely the process generated emissions from the smelter facilities.
The elevated copper concentrations generally occurred both on the days with elevated arsenic and lead concentrations, as well as on the days with the highest PM10 (and lower arsenic and lead) concentrations. These results indicate that copper detected at the Hayden and Winkelman stations may be mostly attributed to the process generated emissions from the smelter facility. However, emissions from copper ore crushing and transporting and
4.0 REMEDIAL INVESTIGATION RESULTS
4-58 ES022008005PHX
reentrainment from surrounding areas can also contribute to high ambient air concentrations of copper.
Most of the elevated chromium concentrations occurred on the days with elevated PM10 concentrations. Overall, the chromium concentrations were not elevated on the days with elevated arsenic and lead concentrations. Therefore, it seems the major contributor to the elevated chromium concentrations were similar to PM10.
According to a RCRA inspection report in 2000, non-concentrate feed stock (Cottrell dust, cyclone dust, converter hood dust, and baghouse dust bags) to the smelter contained high (displayed RCRA Toxicity Characteristics) levels of lead and cadmium. Soil and materials sampling by EPA for total metals (Figure 1-4) around the smelter also indicates high concentrations (well above the PRG) of arsenic, copper, lead, cadmium, and chromium. These materials may be a source of elevated concentrations of metals in air.
4.5.4 Overall Summary of Data and Comparison with Background Table 4-35 provides a comparison of measured metals concentration and PM10 concentration at the Hayden and Winkelman stations with the measured concentrations at the background Organ Pipe station. The average PM10 concentrations at Hayden and Winkelman stations were approximately 2.36 and 1.26 times higher, respectively, than average PM10
concentrations at the Organ Pipe station. Arsenic and cadmium were not found above MDLs at the Organ Pipe station . However, the average concentrations of arsenic and cadmium in Hayden were about 40-80 and 7.55 times the Organ Pipe station MDLs, and exceeded the PRG levels by a factor of 53 and 4, respectively The average ambient air concentrations of copper, lead, and chromium at the Hayden station were 510, 64, and 4 times higher, respectively, than average levels at the Organ Pipe station. Finally, the average ambient air concentration of copper, lead, and chromium at the Winkelman station were 203, 17, and 2 times higher, respectively, than average levels at the Organ Pipe station.
In summary, the concentrations of PM10 and metals in the Hayden and Winkelman stations exceed background levels. The PM10 concentrations in the Hayden station samples are about twice the levels in the Winkelman station samples. The concentrations of arsenic, copper and chromium are about 2.5 times higher in Hayden station samples compared to Winkelman station samples. Finally, lead and cadmium concentrations in Hayden station samples are about 3.5 times higher than levels in Winkelman station samples.
4.6 Interior Dust This section presents the results of a limited residential indoor dust investigation. The indoor dust samples were collected from Hayden and Winkelman properties during field activities conducted on February 23, May 17, and May 18, 2006. A total of 22 residential locations were selected, which consisted of 18 homes in Hayden and four homes in Winkelman. Dust samples were collected from the indoor living space at each location, and where possible, the attic. The sampling method conducted was judgmental in that if dust could be seen at specific locations within the homes it was vacuumed to create a sample (as opposed to random or gridded sampling methods). Some locations did not include attic dust sampling because the home either did not contain an attic or the attic was not easily
4.0 REMEDIAL INVESTIGATION RESULTS
ES022008005PHX 4-59
accessible. From the 22 locations, 33 investigative samples were collected, which consisted of 22 indoor dust samples (one from each home) and 11 attic dust samples.
4.6.1 Hayden Indoor and Attic Dust Results The Hayden dust sampling effort included the collection of dust samples from indoor occupied areas at 18 homes, and collection of attic dust samples from nine of the 18 homes. Table 4-36 presents the data for the Hayden dust samples, with comparison against Arizona R-SRLs. Figure 4-61 presents the dust results for arsenic, copper, and lead at the residences sampled in Hayden.
In Hayden, 16 of 18 indoor dust samples exceeded the arsenic R-SRL of 10 mg/kg, 14 of 18 indoor dust samples exceeded the copper R-SRL of 3,100 mg/kg, and 8 of 18 samples exceeded the lead R-SRL of 400 mg/kg. All nine attic dust samples collected in Hayden exceeded the R-SRLs for arsenic, copper, and lead.
As shown in Figure 4-61, the highest detected arsenic and copper concentrations of 259 mg/kg and 34,600 mg/kg, respectively, were detected in the same attic dust sample (parcel 101-07-061 in Zone 9). The highest lead concentration of 88,600 mg/kg was detected in an indoor dust sample (parcel 101-07-046 in Zone 10). Generally, higher concentrations of metals were found in the attic dust sample relative to indoor dust samples, and higher indoor and attic dust sample concentrations were found in residences located closer to active concentrator operations.
There were very limited exceedances of the R-SRL for other metals in dust samples. As shown in Table 4-36:
• Cadmium concentrations in three dust samples (parcel 101-07-029 in Zone 10 at 85.7 mg/kg [indoor], parcel 101-07-061 in Zone 9 at 51.4 mg/kg [attic only], and parcel 101-07-111 in Zone 6 at 465 mg/kg [indoor]) exceeded the R-SRL of 38 mg/kg. The Zone 6 concentrations are notably elevated compared to other cadmium detections.
• The aluminum concentration in one Hayden indoor dust sample (parcel 101-07-111 in Zone 6) exceeded the R-SRL.
• The antimony concentration in one indoor dust sample (parcel 101-07-111 in Zone 6) exceeded the R-SRL.
• The vanadium concentration in one indoor dust sample (parcel 101-07-111 in Zone 6) exceeded the R-SRL.
• Finally, the zinc concentration in one indoor dust sample (parcel 101-09-111B in Zone 16) exceeded the R-SRL.
• Tables 4-37 through 4-39 provide a comparison of attic and indoor dust sample results with surface soil sample results collected in the yards of the homes for arsenic, copper, and lead, respectively. In addition to presenting the 95% UCL (which was determined using all nine surface soil sample results collected in the yard), the metals concentrations from the surface soil sample collected closest to the entrance or near the side or back entrance results are provided. Figures 4-63 through 4-65 provide a comparison of the attic and indoor dust sample results with the outdoor surface soil results (one figure
4.0 REMEDIAL INVESTIGATION RESULTS
4-60 ES022008005PHX
representing arsenic concentrations, one for copper, and two for lead). For lead, dust sample results for three of the parcels are presented in a separate figure (Figure 4-66) because the lead concentrations detected were elevated. Figure 4-63 excludes parcel 101-07-089T because the elevated arsenic concentration in surface soil made the scale on the figure too large making it difficult to see the differences in concentrations at the other parcels. The following observations can be made from the dust results comparison tables and figures:
• The attic dust results for arsenic and copper are generally higher for most homes than the indoor dust and soil results and as stated above, all nine attic dust samples collected in Hayden exceed screening levels.
• For copper, four of the attic dust samples were greater than (generally by a factor of 2) the indoor dust samples collected from the same home. Five of the attic dust samples have indoor dust results that are significantly higher than their corresponding attic dust sample results.
• Indoor dust and outdoor soil concentrations for arsenic are similar for many of the parcels. However, for a few parcels, the arsenic concentrations between the two media are very different. Two of these parcels with widely divergent results include parcel 101-07-089T where the indoor dust arsenic is 49.7 mg/kg and surface soil arsenic is 540 mg/kg (see Table 4-40 and parcel 101-07-111 where the indoor dust arsenic is 209 mg/kg and surface soil arsenic is 15.3 mg/kg.
• For copper, 10 homes have higher surface soil results than indoor dust results and seven homes have higher indoor dust results than surface soil results.
• For lead, concentrations are high for both indoor dust and outdoor soil at parcels 101-07-070, 101-09-077 and 101-09-106. The indoor dust sample collected from 101-07-046 is extremely high (88,600 mg/kg) and the outdoor surface soil sample results was a more moderate level of 734 mg/kg.
4.6.2 Winkelman Indoor and Attic Dust Results The Winkelman dust sampling effort included the collection of dust samples from indoor occupied areas at four homes, and collection of attic dust samples from two of the four homes. Table 4-36 presents the data for the Winkelman dust samples, with comparison against Arizona R-SRLs. Figure 4-62 presents the dust results for the residences sampled in Winkelman.
In Winkelman, only one of the four indoor dust samples (parcel 101-12-093 in Zone 20 at 10.2 mg/kg) slightly exceeded the arsenic R-SRL, and no indoor dust samples exceeded the copper or lead R-SRLs. Both attic dust samples collected in Winkelman exceeded the R-SRLs for arsenic (with a maximum concentration of 54 mg/kg at parcel 101-12-241 in Zone 24), but neither exceeded the copper and lead R-SRLs. Additionally, as shown in Table 4-36, the indoor dust sample at parcel 101-12-093 in Zone 20 had aluminum and antimony concentrations above the R-SRL. Antimony was also above the R-SRL in an attic dust sample at parcel 101-12-241 in Zone 24.
4.0 REMEDIAL INVESTIGATION RESULTS
ES022008005PHX 4-61
• Tables 4-37 through 4-39 provide a comparison of attic and indoor dust sample results with surface soil sample results collected in the yards of the homes where the dust samples were collected for arsenic, copper, and lead, respectively. In addition to presenting the 95% UCL (which was determined by using all nine surface soil sample results collected in each yard), the metals concentrations from the surface soil sample collected closest to the entrance or near the side or back entrance results are provided. Figures 4-67 through 4-70 provide a comparison of the attic and indoor dust sample results with the outdoor surface soil results. The following observations can be made from the dust results comparison tables and figures:
• All of the Winkelman indoor dust samples (collected from four homes) have arsenic results that are below the Winkelman Site-specific background level (Qo) for arsenic of 12.5 mg/kg.
• The attic dust sample results show higher concentrations of arsenic than the indoor dust sample results. One attic dust sample result exceeds the risk-based soil screening level of 48 mg/kg. The second attic dust sample is closer to background levels.
• The arsenic results for surface soil and indoor dust are similarly low (below Site-specific background levels).
• All attic and indoor dust sample results for copper and lead are below the Arizona R-SRLs.
4.6.3 Fate and Transport The sources of dust found in residences are many and varied. There are ASARCO-related sources including mechanically generated emissions from the raw material handling equipment such as the hoppers, crusher, and the conveyors, wind or vehicle reentrained dusts emission from the surrounding areas (including tailings impoundments), and emissions from the smelting processes at the smelter facility (miscellaneous sources). Metals in house dust may be derived from metals in outdoor dust and soil as well as from ambient air lead (including previously deposited lead resuspended into ambient air). The indoor dust samples would be expected to represent shorter term depositional activity, whereas the attic dust samples would be expected to represent longer-term, historical accumulations. This is reflected in the generally higher concentrations in the attic dust samples compared with the indoor dust samples.
The concentrations of arsenic, copper, and lead in the dust samples are markedly higher in the Hayden residences compared with the Winkelman residences. Nearly all indoor and attic dust samples collected in Hayden had concentrations of arsenic, copper, and lead above the R-SRL. Concentrations generally decline in homes located further from the concentrator operations, and results from parcel 101-07-049 in Zone 4 showed the lowest concentrations of any indoor samples in Hayden. The homes adjacent to Conveyor 9 and near the concentrator are more exposed to fugitive dust emissions from the material handling activities and process generated emissions from the smelter facility.
4.0 REMEDIAL INVESTIGATION RESULTS
4-62 ES022008005PHX
•
•
•
4.7 Ecological Investigation As part of the RI, a reconnaissance-level ecological evaluation was conducted. The ecological evaluation was used to support the Screening Level Ecological Risk Assessment (SLERA). The SLERA findings are summarized in Section 5.2, and the complete SLERA Report is included in Volume 3 of the RI Report. The following activities were conducted during the ecological evaluation:
Characterize terrestrial habitats in the study area
Characterize aquatic habitats in the study area
Characterize terrestrial and aquatic habitats in a reference area, for comparison to the study area
These characterizations in the study and reference areas include general habitat mapping and wildlife observations, and were generally conducted according to guidance for ecological assessments provided by EPA (1997).
The ecological investigation was conducted on April 27 and 28, 2006. Representatives from EPA, AFGD, USFWS, and ASARCO were present on one or both days of the investigation. The locations of the sites surveyed are shown in Figure 4-70 and the results of habitat and wildlife observations for each area are summarized in Table 4-40 (see Appendix I for checklists recording the complete terrestrial and aquatic habitat observations).
4.7.1 Habitat Observations Stressed upland vegetation was observed at two locations, GR04 and GR10. Dead cottonwoods were observed at GR-04 (see photo GR04-3 in Appendix I). These trees were upland and quite a distance from the river and were not included in the evaluation of the river. Other vegetation around the cottonwoods did not appear to be stressed. The cause of the dead cottonwoods is unknown, but may have been due to changes in access to water. At GR10, multiple instances of shrubs with brown, chlorotic, or otherwise stressed foliage were observed (see photo GR10-Stress1, GR10-Stress2, and GR10-Stress3 in Appendix I). Potential causes were not readily apparent.
4.7.2 Wildlife Observations Because of how close the project area is to the Gila and San Pedro Rivers, a variety of reptilian, mammalian, and avian species is supported. The mammal community observed at the Site includes small herbivorous species (desert cottontail, pocket mouse, and antelope squirrel); a number of larger omnivores and predators (fox, bobcat, and coyote); and large herbivores (feral horse and mule deer). The bird community is diverse with particular bird communities associated with specific plant communities and seasons. Common herbivorous and insectivorous birds observed included a variety of sparrows and finches, phainopepla, red-winged blackbird, and cliff swallows. Birds of prey include Swainson’s hawk and turkey vulture. It should be noted that the Gila-San Pedro River confluence (a central portion of the project area), is a key portion of the breeding range for the federally endangered southwestern willow flycatcher. (No southwestern willow flycatchers were observed during the field surveys.)
4.0 REMEDIAL INVESTIGATION RESULTS
ES022008005PHX 4-63
•
•
•
•
Although no reptiles were observed during the Site visit, the species diversity of reptiles at ASARCO is likely high, typical of the southwestern desert environment. Amphibians may also be abundant; however, amphibians are seasonal in their occurrence outside of the permanent rivers and streams.
4.8 Geotechnical Evaluation A limited, reconnaissance-level geotechnical evaluation of Tailings Impoundments AB/BC and D was conducted on May 1, 2007. The evaluation consisted of the following tasks:
Step 1 - Review available existing information on the construction and operation of Tailings Impoundments AB/BC and D.
Step 2 - Site reconnaissance of impoundments by a CH2M HILL geotechnical engineer.
Step 3 - Perform general slope stability analyses of the impoundments.
Step 4 – Prepare technical memorandum with findings and conclusions.
The outcome from Step 4 was preparation of a technical memorandum entitled, “Limited Geotechnical Evaluation of Tailings Impoundments AB/BC and D” (CH2M HILL, 2007b), which is included in Appendix G. This section presents a brief summary of the procedures and results of the geotechnical evaluation.
4.8.1 Review of Existing Information CH2M HILL reviewed several previous reports documenting the results of subsurface investigations, laboratory testing, and engineering analyses for the tailings impoundments. Copies of key reports were obtained from ASARCO during a scheduled records review at the ASARCO Hayden office on March 16, 2007. The technical memorandum in Appendix G presents detailed information from these reports.
4.8.2 Site Reconnaissance CH2M HILL personnel were escorted by ASARCO personnel to the tailings impoundments during the reconnaissance. Tailings Impoundment AB/BC was initially observed, followed by Tailings Impoundment D. No invasive soil sampling, testing, or field measurements were conducted during the reconnaissance.
The reconnaissance was conducted by driving around the impoundments along the crest and base of Tailings Impoundment AB/BC and stopping at various locations, including where decant lines intersect berms, to conduct closer observations, and to take photographs. Observations at Tailings Impoundment D were completed along the base (northwest side) and along the backside (southwest) of the impoundment where current tailings merge into the existing topography.
ASARCO personnel reported that impounded water is removed via siphon flow when accumulated to a minimum depth of approximately three feet. CH2M HILL did not observe downstream seepage or significant cracking along the top of and parallel to the crest of the tailings impoundments. Such features are indicative of major slope movements. No evidence of slumps on the sides of the impoundments was observed. ASARCO indicated
4.0 REMEDIAL INVESTIGATION RESULTS
4-64 ES022008005PHX
that French drains installed to control historical seepage along the toe of the southwest side of Tailings Impoundment AB/BC (AB portion) are no longer producing measurable amounts of seepage.
Major erosional features were observed along the slope face at both impoundments. These features seemed especially prevalent along the southwestern sides of Tailings Impoundment AB/BC, though erosion in this area may appear more severe because of ongoing erosion repairs being conducted by ASARCO. At several locations, erosional gullies are sufficiently deep to have created small caves below the tailings surface. Erosional gullies and dropouts were being backfilled with furnace slag in select areas along this side of the impoundments. The slag is underlain by a drainage geotextile, according to ASARCO.
Close observations of the outer toe of Tailings Impoundment AB/BC (AB portion) were also conducted, along the Gila River bank near the North Emergency Tailings Pond. No active erosional undercutting of the pond berms or the impoundment berm was noted. Riprap from three to four feet in diameter has been placed along the southeast side of the emergency pond. Riprap placed north of this area along the riverbank was noticeably smaller, consisting of stone and concrete rubble. Moderate to heavy vegetation covers this area in many places, making the size and placement of rip rap difficult to verify. It appears that all riprap observed has been randomly placed. ASARCO reported that maintenance of riprap occurs during the brief period each year (typically in November) when releases to the Gila River from the upstream reservoir cease, which allows equipment access along the riverbank.
The most significant observation made at both impoundments during the reconnaissance is the extensive surface erosion of the tailings, and probable impacts to localized surficial slope stability as a consequence of this erosion.
4.8.3 Stability Analyses Procedures Eight cross sections were prepared and analyzed for slope stability analysis, four at Tailings Impoundment AB/BC and four at Tailings Impoundment D. The locations were selected based on a review of previous studies, findings from the site reconnaissance, and the potential for overall impacts to the Gila River flood plain associated with potential slope failure. The cross sections used in the stability analyses were generated electronically from the most recent topographic map of the impoundment areas, and were modified based on estimated elevation changes to the present time.
The slope stability analyses performed considered the overall (global) stability of slopes using circular and wedge shaped failure planes. Localized circular failure planes were also considered and analyzed separately. The calculations were performed using the limit equilibrium computer program SLIDE v.5.0 (Rocscience Inc. Users Guide 1989-2003). The critical slip surface for each major slope is shown on the results of analyses. Results of slope stability analyses are presented in Appendix G.
The Arizona Mining Guidance Manual, BADCT (ADEQ, 2004), which presents the State’s Best Available Demonstrated Control Technology (BADCT) guidance, was reviewed to determine the minimum slope stability factor of safety for the tailings impoundment slopes. Where Site-specific test results are not available, factors of safety of 1.5 and 1.1, respectively,
4.0 REMEDIAL INVESTIGATION RESULTS
ES022008005PHX 4-65
4.8.4.1
4.8.4.2
4.8.4.3
are required. BADCT also requires a slope deformation analysis if environmental impacts are potentially imminent under failure conditions, which was considered in the evaluations.
4.8.4 Findings and Conclusions Stability
From the results of the global stability analyses performed for the impoundment slopes, the overall stability of the slopes of Tailings Impoundments AB/BC and D appears to be adequate under static and pseudostatic conditions. Based on conservative assumptions, the anticipated displacement of Tailings Impoundment AB/BC slopes during a seismic event is in the order of two to three feet. Such a displacement is not expected to impact the Gila River flood plain, however, because these major slopes are located about 100 to 200 feet from this flood plain area.
The mine tailings are highly erodible, consisting of cohesionless fine sands and silts. This is evident by observations of the impoundments, and should require a constant maintenance effort for ASARCO to address. ASARCO has implemented controls such as placement of coarse furnace slag and geotextiles in repaired areas, which appears to help within the areas of application. However, until sloped areas are regraded as needed and completely covered with some form of erosion protection, significant erosion is expected to continue.
The stability analyses conducted during the RI was limited, because it was based on recommendations and findings from previous studies, and included no additional field sampling to support more detailed evaluations. Nevertheless, ASARCO has not reported major slope failures, with exception for surficial erosion, since modifications were made to the impoundments as a result of global slope failures in late 1972 and early 1973.
Riverbank Erosion Riverbank erosion near Tailings Impoundment AB/BC is a potential threat impacting the stability of the mine tailings and ecosystem along the Gila River flood plain. Based on the Site reconnaissance, ASARCO has taken steps to control riverbank erosion. This includes placement of riprap combined with annual inspection of the riverbank to assess and plan needed repairs. As noted in the site reconnaissance, the riprap appears to be randomly placed. The size of the riprap located near cross section A-A’ is estimated to be nominally three to four feet in diameter. Stones of this size placed on a 2H: 1V slope can resist flow velocities of approximately 18 to 20 feet per second (fps), according to hydraulic design criteria charts published by the United States Army Corps of Engineers (USACE). Smaller rocks and rubble noted further downstream along the riverbank would resist river flow in the range of 8 to 10 fps.
Overall Conclusions Based on the reconnaissance, review of pertinent engineering reports, and stability analyses, the following conclusions are made:
• Global stability analyses of the impoundment slopes indicate that the minimum slope stability factors of safety are achieved.
4.0 REMEDIAL INVESTIGATION RESULTS
4-66 ES022008005PHX
• Localized slope instability related to erosion and surface saturation of the tailings is possible. If left unchecked, larger stability issues could develop from localized slope failures.
• Deformation analyses indicate that global slope deformations along Tailings Impoundment AB/BC could be in the range of two to three feet during a maximum credible earthquake event. Though unlikely to occur, these deformations are not expected to directly impact the Gila River flood plain.
• Riverbank erosion poses the greatest potential threat to the overall stability of Tailings Impoundment AB/BC, and corresponding impacts to the Gila River flood plain.
• Additional field investigation is recommended for a more detailed evaluation. This should include continuous borings or cone penetration soundings to determine the presence, depth, and thickness of any relatively thin weak bedding layers. Additional groundwater level measurements should be collected to determine the current level of the phreatic surface within the impoundments.
• Current berm elevations along the Gila River near Tailings Impoundment AB/BC should be compared to the maximum water surface elevation for the 100-year flood event within the Gila River flood plain. The berms should be sized to provide at least three feet of freeboard to protect against overtopping as a result of the 100-year flood event.
• Riprap placed along the river channel should be engineered and constructed to resist the expected flood flow velocities. If current riprap is adequate, ASARCO should provide evidence such as engineering calculations prepared by an Arizona-registered professional engineer
4.9 Surveying and Mapping To improve accuracy and efficiency and reduce RI costs, handheld GPS units were used to establish the locations of sampling points. This was intended to reduce data gaps, reduce land surveying costs, eliminate post collection data entry, and standardize data collection.
A Trimble GeoXT handheld GPS unit was used during the field effort. This high-end resource-grade GPS mapping system is capable of collecting post processed differential GPS data with specified accuracy of 0.5-meter or submeter root means square. This unit also employed Everest Multipath Rejection Technology, which reduces the chances of positional errors due to multipath. For each sampling location, a minimum of six satellites were locked on the GeoXT to ensure accuracy.
Also, an Arizona licensed land surveyor (Engineering and Environmental Consultants, Inc. [EEC]) was retained to obtain location and elevation coordinates for the newly installed monitor wells. In accordance with contract requirements, the coordinate system was Arizona State Plane Coordinate System, NAD 83, and the vertical datum was NAVD88. Surveying coordinates were measured to the nearest 0.01 foot.
4.0 REMEDIAL INVESTIGATION RESULTS
ES022008005PHX 4-67
4.10 Data Validation The results of data validation and data evaluation are presented in Sections 3.3.2 and 3.3.3 of this RI Report.

ES022008005PHX 5-1
SECTION 5
Risk Assessment
5.1 Human Health Risk Assessment A baseline human health risk assessment (HHRA) was prepared for EPA in support of the RI, to address potential exposure to contamination associated with the ASARCO Site in Hayden, Arizona. The HHRA presents the potential for current and future cancer risks and non-cancer health hazards to people who may be exposed to contaminants from the Site. Results from the HHRA will be one of the factors that EPA uses to determine if cleanup actions are warranted at the Site. The complete HHRA is presented in Volume 2 of this RI Report, and this section presents a summary of the procedures and conclusions.
5.1.1 Risk Assessment Methodology The HHRA was prepared in a manner consistent with EPA’s Risk Assessment Guidance for Superfund, Parts A, B and E (see HHRA for complete references). The exposure assumptions provided for the general public by EPA and incorporated into the HHRA are conservative (i.e., representative of the highest exposure that is reasonably expected to occur at a site) and thus, health-protective.
The HHRA is a baseline evaluation which assumes exposure to contaminated media under current conditions without consideration of future remediation or natural attenuation of chemicals.
5.1.2 Data Collection and Data Evaluation Samples of environmental media such as soil, air, and water were collected in order to characterize the nature and extent of contamination from the Site. The data evaluation step consists of reviewing and evaluating available data. Data evaluation allows for the identification of COCs. Based on data collected historically and during the RI, COCs selected for each media include:
• Soil and dust (indoor and attic dust) – arsenic, copper, and lead.
• Air – arsenic, cadmium, chromium, copper, and lead.
• Groundwater – metals (aluminum, antimony, arsenic, cadmium, iron, manganese, molybdenum, selenium, uranium, vanadium), radionuclides, VOCs, and SVOCs.
• Surface water – arsenic, aluminum, iron, lead, manganese, and vanadium.
• Sediment – arsenic, copper, iron, lead, manganese, and vanadium.
Data were collected and evaluated separately for each of the various media that were evaluated in the HHRA. A detailed discussion of the data collected for the RI and used in the baseline HHRA is presented in Section 4.0. The analytical data were reviewed according to the data evaluation procedures specified in EPA guidance documents. These procedures
5.0 RISK ASSESSMENT
5-2 ES022008005PHX
5.1.3.1
include evaluation of the analytical methods, quantitation limits, qualified data, blank contamination, and comparison with background concentrations.
5.1.3 Exposure Assessment Exposure assessment is the determination or estimation of the magnitude, frequency, duration, and route of exposure. Exposure assessments may consider past, present, and future exposures, using varying assessment techniques for each phase. The objective of the exposure assessment is to estimate the type and magnitude of exposures to COCs that are present at or migrating from a site.
The three primary steps in exposure assessment are identification of exposed populations, identification of exposure pathways, and quantification of exposure. A conceptual site model (CSM) is a tool used to assist with the identification of potential exposure media, human receptors, and exposure pathways. The CSM developed for human exposures (Figure 1-6) indicates complete and potentially complete exposure pathways under current and reasonably likely future conditions. An exposure pathway is defined as complete when each of the five elements of a complete pathway is present:
• A source of contaminants (e.g., smelter) • A release mechanism (e.g., stack emissions)
− A secondary source (e.g., off-facility soil) − A secondary release mechanism (e.g., soil adhering to shoes)
• An exposure medium (e.g., soil, indoor dust) • A route of exposure (e.g., incidental ingestion, direct contact) • A receptor (e.g., residents of Hayden and Winkelman)
Exposed Populations Residential receptors include residents of the towns of Hayden and Winkelman exposed to contaminated soil, air, groundwater, and indoor and attic dust. Adult and child residents were both evaluated; however, risk management decisions are usually made using risk/hazard results for the most sensitive receptor. For potential cancer risks, the most sensitive receptor is a resident who is exposed to contaminated media for six years as a child and 24 years as an adult. This health-protective approach is chosen to take into account the higher daily rates of soil ingestion in children, differences in body weight between adults and children, as well as the longer duration of exposure that is anticipated for a long-term resident. For potential non-cancer hazards, the most sensitive receptor is a child (0 to 6 years of age); therefore, although adult and child non-cancer hazards were estimated, non-cancer results for a child are discussed in this report.
Other potential receptors exposed to soil include school children in schoolyards and parks, adult golfers at the local golf course, trespassers on ASARCO properties and other locations, and recreational visitors and anglers at the nearby Gila River and San Pedro River. Site-specific exposure assumptions were developed for these receptors based on professional judgment made by EPA and CH2M HILL project personnel and an interview with a Winkelman resident about exposure-related activities of potential receptors in these areas.
5.0 RISK ASSESSMENT
ES022008005PHX 5-3
5.1.3.2
5.1.3.3
Exposure Pathways Potentially complete pathways for the exposed populations may be associated with contaminated soil, air, groundwater, indoor and attic dust, and surface water and sediment from the San Pedro and Gila Rivers. Quantitative risks and hazards were evaluated for residents, trespassers, school children, and recreational visitors (including park users, golfers, swimmers, and anglers). Screening level or qualitative evaluations were completed for residential exposure to groundwater and indoor and attic dust.
Exposure pathways evaluated for soil include incidental ingestion, direct contact, and outdoor dust inhalation (resuspended particulates) by residents, trespassers, school children, park users, and golfers. The exposure pathway evaluated for air includes inhalation of ambient air by a resident using air monitoring data from the Hayden and Winkelman air monitoring stations. Exposure pathways evaluated for surface water include incidental ingestion and direct contact using a recreational swimmer scenario. Exposure pathways evaluated for sediment include incidental ingestion and direct contact using a recreational angler scenario.
Estimating Contaminant Intakes Exposure point concentrations (EPCs) for the COCs are used within the exposure assessment calculations to estimate potential chemical intake. For example, surface soil EPCs were calculated for each residential parcel or non-residential exposure area that was sampled. For soil, air, groundwater, surface water, and sediment, the EPC was either the 95% upper confidence limit on the mean (UCL) or the maximum detected concentration for chemicals with the UCL exceeding the maximum concentration. For indoor and attic dust, individual sample results were compared with screening levels and associated soil results.
Quantification of exposure includes evaluation of exposure parameters that describe the exposed population (e.g., contact rate, exposure frequency and duration, and body weight). Each exposure parameter in the equation has a range of values. The reasonable maximum exposure (RME) risk estimate was used in this HHRA. An RME is the “highest exposure that is reasonably expected to occur” and is estimated using a combination of average and upper-bound values of human exposure parameters (EPA, 1989). Chemical intake is calculated by using an appropriate equation that divides exposure variables by an averaging time. For non-carcinogenic compounds, the averaging time equals the exposure duration; whereas for carcinogenic compounds, the averaging time used is a lifetime, assumed to be 70 years (EPA, 1989).
5.1.4 Toxicity Assessment The purpose of the toxicity assessment is to weigh available evidence regarding the potential for particular contaminants to cause adverse health effects in exposed individuals and to provide, where possible, an estimate of the relationship between the extent of exposure to a contaminant and the increased likelihood and/or severity of adverse effects. EPA has performed the toxicity assessment step for numerous chemicals and has made available the resulting toxicity information and toxicity values which have undergone extensive peer review. The derivation of toxicity values is a complex process that includes the evaluation of many factors relating to toxicological data including the type of exposure route, duration of exposure, dose administered, physiology of the species tested, and the
5.0 RISK ASSESSMENT
5-4 ES022008005PHX
type of adverse health effect observed. In the toxicity assessment step, toxicity values are compiled that characterize potential adverse health effects from exposure to COCs. Uncertainty and modifying factors are commonly applied to toxicity values in order to account for uncertainties inherent in the process of relating laboratory toxicity data to relevant human exposure levels.
Cancer and non-cancer effects are evaluated differently within the toxicity assessment process. For many non-carcinogenic effects, protective mechanisms are believed to exist that must be overcome before the adverse effect is manifested. A reference dose, or RfD, is the toxicity value used most often in evaluating non-cancer effects. Because variability exists in the human population, attempts are made to identify a sub-threshold level protective of sensitive individuals in the population. For most chemicals, this level can only be estimated.
Carcinogenesis, unlike many non-carcinogenic health effects, is generally thought to be a phenomenon for which risk evaluation based on presumption of a threshold is inappropriate. For carcinogens, EPA assumes that a small number of molecular events can evoke changes in a single cell that can lead to uncontrolled cellular proliferation and eventually to a clinical state of disease. For carcinogenic effects, EPA uses a two-part evaluation in which the substance first is assigned a weight-of-evidence classification, and then a cancer slope factor is calculated.
EPA has established a hierarchy of toxicity values to be used in the risk assessment process (EPA, 2003):
• Tier 1—EPA’s Integrated Risk Information System (IRIS)
• Tier 2—EPA’s Provisional Peer Reviewed Toxicity Values (PPRTVs)
• Tier 3—Additional EPA sources (e.g., historic Health Effects Assessment Summary Table (HEAST) and National Center for Environmental Assessment (NCEA) provisional values and non-EPA sources of toxicity information (e.g., California Environmental Protection Agency [Cal-EPA] toxicity values)
Exposure to lead in soil was evaluated using a site-specific screening level generated by the California Department of Toxic Substances Control (DTSC) Lead Risk Assessment Spreadsheet Version 7, LeadSpread Version 7 (DTSC, 2002). This model calculates a screening level that represents a concentration of lead in soil for children that is protective for a combined exposure to lead in air, drinking water, food, and soil. For the residential lead evaluation, the most conservative (health-protective) screening level available from the LeadSpread model was selected (99th percentile) based on protection of children’s health.
5.1.5 Risk Characterization The risk characterization step integrates the exposure assessment and toxicity assessment into quantitative expressions of risk. To characterize potential non-carcinogenic effects, comparisons are made between estimated intakes of substances and toxicity values. Potential carcinogenic effects are evaluated by calculating probabilities that an individual will develop cancer over a lifetime exposure based on projected intakes and chemical-specific dose-response information. Potential excess lifetime cancer risk (ELCR) and non-cancer hazard index (HI) were calculated for adult and child receptors for each exposure
5.0 RISK ASSESSMENT
ES022008005PHX 5-5
5.1.5.1
5.1.5.2
area and medium. Human health risks are compared against the EPA risk management range of 10-6 to 10-4 for cancer risks and the HI benchmark of 1 for non-cancer hazards (EPA, 1991b). Exposure areas with ELCRs less than 10-6 or HI less than 1 are characterized as not posing a threat to human health for the evaluated exposed populations and pathways.
For the groundwater samples collected at Hayden and Winkelman, screening-level risks and hazards were estimated by the risk ratio method using EPA’s tap water PRGs.
Risks/Hazards from Background Concentrations Details of the background data evaluation for soil are presented in a technical memorandum located in Appendix C, Volume I of the RI Report. The towns of Hayden and Winkelman are located on two different geologic settings. The soils in the Hayden area are located in the Tertiary Sediments (Ts) geological map unit, and the soils in the Winkelman area are in the older Quaternary deposit unit (Qo). Therefore, risk and hazard estimates for each geologic setting were prepared for comparison to the residential risks and hazards estimated for the residential parcels in each town and non-residential exposure areas. Ninety-five (95) percent upper tolerance limit (UTL) soil concentrations were derived from the Ts data set and were used in the background risk and hazard estimates for comparison to risk and hazard estimates from Hayden parcels; maximum concentrations of metals in Qo soil were used for the background risk and hazard estimates for the Qo data set for comparison to risk and hazard estimates from Winkelman parcels. The background risk and HI estimates for Hayden are 3 x 10⁻⁵ and 0.9, respectively. For Winkelman, background risk and HI estimates are 2 x 10⁻⁵ and 0.6, respectively.
Air samples were not specifically collected for background purposes during the RI. However, air data from several of EPA’s IMPROVE network monitoring sites were evaluated to identify appropriate data sets to provide background levels for an area similar to Hayden, Arizona. Data from the IMPROVE Organ Pipe station over the period from January through December 2006 were selected to best represent background conditions for comparison to the Hayden and Winkelman air monitoring data. Arsenic and cadmium were not detected in any of the 15 Organ Pipe air samples used for the background data set. Therefore, the EPCs used in the background risk calculation for those metals were based on an average of the MDLs. The background risk estimate for air is 6 x 10⁻⁶.
Risk and hazards from background levels were not calculated for groundwater, surface water or sediment. Site-specific background levels were not established for groundwater since upgradient monitoring wells do not exist at the Site. Therefore, the Site groundwater concentrations were compared with arsenic levels found in groundwater from an unaffected area of Maricopa County, Arizona (USGS, 2008). For radionuclides in groundwater, national background levels (USGS, 1998) were compared with Site radionuclide levels. For surface water and sediment, three samples for each medium were collected to represent background levels. The results from the samples collected downgradient of these background locations were compared and discussed.
Risk and Hazard Estimates The following sections present the risk and hazard estimates from exposure to contaminated residential soil, nonresidential soil, air, groundwater, surface water, and sediment.
5.0 RISK ASSESSMENT
5-6 ES022008005PHX
Residential Soil. The ELCRs and HIs for soil exposure for each residential parcel evaluated are calculated based on the arsenic and copper concentrations detected in soil. Out of the 130 residential parcels evaluated, potential risks to residents due to direct contact with soil exceeded the EPA risk management range of 10-6 to 10-4 for six parcels in Hayden and one parcel in Winkelman. Eighty-three (83) of the parcels in Hayden and Winkelman have lead concentrations that exceed the site-specific screening level of 212 milligrams per kilogram (mg/kg). Risk and hazard estimates are based on the arsenic and copper concentrations detected in surface soil
Residential Soil—Hayden. A total of 93 parcels in Hayden have estimated ELCRs that are within the risk management range, although all are at the upper end of the risk range (between 10-5 to 10-4). For non-cancer effects, 91 parcels show an HI that exceeds the threshold of 1, and only eight parcels have an HI that do not exceed that threshold. Seventy-two (72) of the parcels evaluated in Hayden have lead levels higher than the site-specific screening level of 212 mg/kg.
Elevated levels of lead are widespread in Hayden. No residential parcels in Hayden have lead EPCs lower than the background level of 47.9 mg/kg (for Ts). The majority of parcels (72) evaluated had EPCs higher than the site-specific lead screening level of 212 mg/kg. This site-specific screening level excludes the homegrown produce pathway. Nine of the 99 parcels evaluated do not exceed the site-specific lead screening level of 122 mg/kg, which includes the homegrown produce pathway. Comparison to the Arizona R-SRL of 400 mg/kg indicates that 45 of the parcels exceed this screening level.
Residential Soil—Winkelman. In Winkelman, only one parcel (101-12-071) has an ELCR (2 x 10⁻⁴) that exceeds the EPA risk management range. The other 30 parcels sampled in Winkelman have an ELCR that is within the risk management range. For non-cancer effects, 28 parcels have an HI below the non-cancer threshold of 1 and three parcels exceed this threshold. The HIs for these three parcels range from 3 to 4. Eleven (11) parcels evaluated in Winkelman have lead concentrations that exceed the site-specific screening level of 212 mg/kg.
Non-Residential Soil. The non-residential exposure areas include six areas in the Hayden grouping, four areas in the Winkelman grouping, 14 areas associated with the ASARCO Properties grouping, and 11 areas in the Outlying Areas grouping.
Non-Residential Soil—Hayden. All of the ELCRs for non-residential soils in the Hayden grouping are within or below the EPA risk management range (5 exposure areas are within and 1 is below). However, the non-cancer HIs exceed 1 for Power House Wash (HI = 2) and the Hayden Community Park/Library area (HI = 4). For both of these areas, the main contributor to the HI is copper. Each of the exposure areas has a lead EPCs less than the site-specific risk-based screening level of 212 mg/kg (which excludes the homegrown produce pathway).
Non-Residential Soil—Winkelman. The four exposure areas in the Winkelman grouping have estimated cancer risks that are within the EPA risk management range and non-cancer HIs that do not exceed the non-cancer threshold of 1. In addition, each of the four areas has a lead EPC that is less than the site-specific risk-based screening level of 212 mg/kg.
5.0 RISK ASSESSMENT
ES022008005PHX 5-7
5.1.5.3
Non-Residential Soil—ASARCO Properties. The ELCRs at all of the exposure areas in the ASARCO Properties grouping are within the EPA risk management range with the exception of the East of Hillcrest Avenue area, which exceeds 1 x 10⁻⁴. However, the non-cancer HIs at all 14 of these exposure areas, except 5th Street Right-of-Way and Crusher Facility, exceed the non-cancer threshold of 1. HIs range from 2 (at the South of Mill Building exposure area) to 28 (at the East of Hillcrest Avenue exposure area). Each of the 14 exposure areas has a lead EPC that exceeds the site-specific risk-based screening level of 212 mg/kg for lead. These areas include the Kennecott Smelter – North End, Kennecott Smelter Basin, Kennecott Smelter - Lime Plant, and Kennecott Smelter - South of Lime Plant; West of Administration Building; East of Hillcrest Avenue; and North of Mill Building exposure areas.
Non-Residential Soil—Outlying Areas. All of the exposure areas in the Outlying Areas grouping have ELCRs that are within the EPA risk management range, although one of the areas (Slag Dump) is at the top of the range with an estimated cancer risk of 9 x 10⁻⁵. The non-cancer HIs do not exceed the non-cancer threshold of 1 except at the Slag Dump area where the HI is 31. Three of the 11 exposure areas have lead EPCs that exceed the site-specific risk-based screening level of 212 mg/kg for lead. These areas include the Tertiary Sediments – South of Smelter, Slag Dump, and State Route 77 exposure areas.
Air Estimated cancer risks are presented for arsenic, cadmium, and chromium detected in ambient air at the two air monitoring stations established as part of the RI. One air monitoring station is located in Hayden and the other station is located in Winkelman.
Non-cancer inhalation reference doses were not available for the air COCs evaluated. Therefore, non-cancer hazards were not considered in this ambient air assessment. The concentrations of metals in air are significantly higher in Hayden when compared to Winkelman. Both Hayden and Winkelman have levels of metals in air that are significantly higher than background levels found at the Organ Pipe station.
Air—Hayden. The ELCR from exposure to air in Hayden for arsenic, cadmium, and chromium is 1 x 10⁻⁴ which is at the upper end of the EPA risk management range. Of the total cancer risk, 80% of the risk contribution is from arsenic, 9% from cadmium, and 11% from chromium.
The Hayden EPC for lead of 0.183 micrograms per cubic meter (μg/m3) is below the EPA NAAQS of 1.5 μg/m3 (quarterly average). This concentration is also within the range of EPA’s proposed revision to the lead NAAQS , which is 0.1 to 0.3 μg/m3. The Hayden EPC for copper of 1.3 μg/m3 exceeds the background air level for copper of 0.0028 μg/m3.
Air—Winkelman. The ELCR calculated from arsenic, cadmium, and chromium data from the Winkelman air monitoring station is 4 x 10⁻⁵, which is within the EPA risk management range. Of the total risk, 64% is from arsenic, 6% from cadmium, and 30% from chromium.
The Winkelman EPC for lead of 0.0281 μg/m3 is much less than the EPA NAAQS of 1.5 μg/m3 (quarterly average) and also below the range of EPA’s proposed revision to the lead NAAQS, which is 0.1 to 0.3 μg/m3. The Winkelman EPC for copper of 0.36 μg/m3 exceeds the background air level for copper of 0.0028 μg/m3.
5.0 RISK ASSESSMENT
5-8 ES022008005PHX
5.1.5.4 Groundwater Chemicals and radionuclides were evaluated for risks and hazards using a quantitative screening level approach. Each evaluation is summarized in the sections below.
Screening-Level Chemical Evaluation. The following are the screening-level results using the risk-ratio method for the individual groundwater data groupings:
Drinking Water Aquifer: For residential exposure to drinking water from the aquifer, the ELCR is 2 x 10⁻⁴. Arsenic contributes 100% of the cumulative cancer risk. The non-cancer HI is 7 and manganese contributes more than 60% of the HI and is the only chemical that has a hazard quotient (HQ) that exceeds 1.
Non-Drinking Water Aquifer: For exposure to groundwater from the non-drinking water aquifer which is located beneath industrial areas, the ELCR is 4 x 10⁻³. The primary risk driver is arsenic (99% of the cumulative cancer risk). The non-cancer HI is 35 and arsenic contributes almost 50% of the HI. Molybdenum contributes almost 10% of the HI. Arsenic, molybdenum, selenium, and vanadium have HQs that exceed 1.
Hayden Municipal Supply Well and Manifold Samples: For exposure to groundwater from the Hayden municipal supply well and manifolds, the ELCR is estimated at 9 x 10⁻⁵, with arsenic contributing 100% of the total risk. The non-cancer HI is 2 with uranium contributing more than 50% of the HI, followed by arsenic (18%) and vanadium (11%). No individual chemical has an HQ that exceeds 1.
Winkelman Municipal Supply Well and Manifold Samples: For exposure to groundwater from Winkelman municipal supply well and manifolds, the ELCR is 1 x 10⁻⁴ with arsenic contributing over 70% of the total risk in addition to chlorodibromomethane (13%) and bromodichloromethane (10%). The non-cancer HI is 2 with uranium contributing over 30% of the total HI, followed by arsenic (26%) and manganese (13%). No individual chemical has an HQ that exceeds 1.
Tap Water: For exposure to tap water from the Hayden Library, the ELCR is 1 x 10⁻⁴ with arsenic as the only risk driver (100%). The non-cancer HI is 2 with uranium contributing 41% of the total HI in addition to arsenic (28%), vanadium (16%), and molybdenum (13%). No individual chemical has an HQ that exceeds 1.
For exposure to tap water from Winkelman Elementary School, the ELCR is 1 x 10⁻⁴ with arsenic as the only risk driver (100%). The HI does not exceed the non-cancer threshold of 1 with uranium contributing 36% of the cumulative HI as well as arsenic (32%) and vanadium (17%). No individual chemical has an HQ that exceeds 1.
Lead EPCs for all the data groupings were below the action level of 15 μg/L.
Screening Level Radionuclides Evaluation. For completeness to the analytical suite, radionuclide analysis was included to evaluate groundwater quality. The following are the screening-level results using the risk-ratio method for the individual data groupings:
Drinking Water Aquifer: For residential exposure to drinking water from the aquifer, the ELCR is 5 x 10⁻⁴. Radium 226 contributes 97% of the cumulative cancer risk.
5.0 RISK ASSESSMENT
ES022008005PHX 5-9
5.1.5.5
5.1.5.6
5.1.5.7
Non-Drinking Water Aquifer: For residential exposure to non-drinking water from the aquifer monitoring wells, the ELCR is 4 x 10⁻⁴. The primary risk driver is radium 226 (97% of the cumulative cancer risk).
Hayden Municipal Supply Well and Manifold Samples: For residential exposure to groundwater from Hayden municipal supply well and manifolds, the ELCR is 6 x 10⁻⁴, with radium 226 contributing 98% of the total risk.
Winkelman Municipal Supply Well and Manifold Samples: For residential exposure to groundwater from Winkelman municipal supply well and manifolds, the ELCR is 5 x 10⁻⁶ with uranium 234 contributing 76% of the total risk.
Tap Water: For residential exposure to tap water from the Hayden Library, the ELCR is 4 x 10⁻⁶ with uranium 234 contributing to 65% of the total risk.
For residential exposure to tap water from Winkelman Elementary School, the ELCR is 4 x 10⁻⁶ with uranium 234 contributing to 74% of the total risk. The cumulative risk results for the Winkelman municipal supply well and manifold samples and tap water data groupings are within EPA’s risk management range of 10-6 to 10-4.
Surface Water The ELCR for exposure to surface water by the recreational swimmer is 2 x 10⁻⁶, which is at the lower end of the EPA risk management range. The child non-cancer hazard calculated from the EPCs for aluminum, arsenic, iron, manganese, and vanadium is less than the non-cancer threshold of 1.
Sediment The ELCR for exposure to sediments by the recreational angler is 2 x 10⁻⁶, which is at the lower end of the EPA risk management range. The exposure route which contributes the most to total risk is the oral route, which contributed 89% to the total risk. The child non-cancer hazard index calculated from the EPCs for arsenic, copper, iron, manganese, and vanadium is less than the non-cancer threshold of 1.
The lead concentrations in sediment are below the site-specific soil screening level of 212 mg/kg.
Indoor and Attic Dust A qualitative approach was selected for the indoor and attic dust evaluation because dust samples were collected from only 22 homes, which included 18 homes in Hayden and four homes in Winkelman. Dust concentrations were compared to Arizona R-SRLs. The dust samples were collected by judgmental, directed sampling where dust would tend to accumulate (along floorboards and window sills in the occupied areas, and in attics near the access doors where present) rather than by random sampling. From the 22 homes sampled, 33 investigative samples were collected, which consisted of 22 indoor dust samples (one from each home) and 11 attic dust samples.
Hayden Indoor and Attic Dust. In Hayden, 16 of 18 indoor dust samples exceeded the arsenic Arizona R-SRL of 10 mg/kg, 14 of 18 indoor dust samples exceeded the copper Arizona R-SRL of 3,100 mg/kg, and 8 of 18 samples exceeded the lead Arizona R-SRL of 400 mg/kg.
5.0 RISK ASSESSMENT
5-10 ES022008005PHX
5.1.5.8
All nine attic dust samples collected in Hayden exceeded the Arizona R-SRLs for arsenic, copper, and lead.
Winkelman Indoor and Attic Dust Results. In Winkelman, only one of the four indoor dust samples (Parcel 101-12-093 at 10.2 mg/kg) slightly exceeded the arsenic Arizona R-SRL, and no indoor dust samples exceeded the copper or lead Arizona R-SRLs. Both attic dust samples collected in Winkelman exceeded the R-SRLs for arsenic (with a maximum concentration of 54 mg/kg at Parcel 101-12-241), but neither exceeded the copper and lead Arizona R-SRLs. The indoor dust sample at Parcel 101-12-093 had antimony concentrations of 110 mg/kg, which is above the Arizona R-SRL of 31 mg/kg. In the attic dust sample at Parcel 101-12-241, the antimony concentration of 112 mg/kg was also above the Arizona R-SRL.
Multi-Pathway Cumulative Risks As a means of evaluating multi-pathway cumulative risks and comparing the relative contribution to risk from multi-pathway exposures, the sum of the residential soil and ambient air cancer risks was calculated for three soil and ambient air exposure combinations for both Hayden and Winkelman.
• Example 1 (Background). The sum of soil background risks plus air monitoring background risks. Arsenic and cadmium were not detected in any of the 15 Organ Pipe air samples used for the background data set. Therefore, the EPCs used in the background risk calculation for those metals were based on an average of the MDLs. The background risk estimate for air is 6 x 10⁻⁶.
• Example 2 (Mid-Level Soils Concentrations). In Hayden, the sum of soil risks associated with soil arsenic at 26 mg/kg (5 x 10⁻⁵ cancer risk) plus the corresponding risks associated with air monitoring data from Hayden. For Winkelman, the sum of soil risks associated with soil arsenic at 20 mg/kg arsenic (4 x 10⁻⁵) plus the corresponding risks associated with air monitoring data from Winkelman.
• Example 3 (High-Level Soils Concentrations). The sum of soil risks for the highest concentration property (assumed highest level of soil arsenic after soil removal action of selected properties): 132 mg/kg arsenic in Hayden, 112 mg/kg arsenic in Winkelman, plus the corresponding air monitoring risks.
Risks from Soil plus Air—Hayden. For Hayden, the sum of residential soil plus ambient air cancer risk was 3 x 10⁻⁵ (Example 1), 2 x 10⁻⁴ (Example 2) and 4 x 10⁻⁴ (Example 3).
The soil plus air cancer risks in Hayden were greater than the background cancer risk. Ambient air cancer risks in Hayden were 1x 10⁻⁴; all additional incremental risks are assumed to be due to residential soil exposure.
Risks from Soil plus Air—Winkelman. For Winkelman, the sum of residential soil plus ambient air cancer risk was 3 x 10⁻⁵ (Example 1), 8 x 10⁻⁵ (Example 2), and 2 x 10⁻⁴ (Example 3).
The soil plus air cancer risks in Winkelman were greater than the background cancer risk. Ambient air cancer risks in Winkelman were 4 x 10⁻⁵; all additional incremental risks are assumed to be due to residential soil exposure.
5.0 RISK ASSESSMENT
ES022008005PHX 5-11
5.1.6 Uncertainty Evaluation An uncertainty evaluation describes uncertainties associated with a risk assessment, including data gaps in toxicological and exposure assessment, and conservative assumptions or scientific judgments used to bridge these data gaps. Uncertainties, which arise at every step in the risk assessment process, are evaluated to provide an indication of the relative degree of conservatism associated with a risk estimate (EPA, 1992). The key uncertainties associated with this HHRA include the following:
• For some non-residential soil exposure areas, only one sample was collected to represent the area, which is a very limited data set. A larger sample size would allow for the calculation of a more representative exposure point concentration, and thus decrease uncertainty regarding chemical concentrations used for risk assessment at these locations.
• Site-specific exposure assumptions for the non-residential soil risk/hazard estimates are based on limited interview information and professional judgment and may not represent actual Site exposures.
• Site-specific background data sets are limited for soil and ambient air, and therefore there is uncertainty associated with the comparisons of Site data to background levels.
• A Site-specific background data set is not available for groundwater for metals, radionuclides, VOCs, and SVOCs, and therefore regional and national background information was used for comparison. These regional and national background data sets may not accurately represent the range of metals and radionuclides found in the vicinity of the Site.
• The amount of a given COC (i.e., arsenic) absorbed into the body may be quite different from the amount of chemical that is actually contacted. The bioavailability factor used for ingestion of arsenic in soil was 80% based on limited mineralogy information. This factor may over or under estimate the actual bioavailability of the arsenic in soil at the Site.
In general, where uncertainties are associated with the steps of the HHRA process, conservative assumptions are made so that the results will be health-protective. Because of the conservative assumptions used for the risk assessment, these estimates are calculated in a way that tends to over estimate risks, and thus any actual risks are likely to be lower than these estimates.
5.1.7 Summary of Results Consistent with the CSM, the predominant exposure pathways for residents to contaminants from the Site are incidental ingestion of soil, inhalation of particulates from soil and air, and dermal contact with soil. Exposure to groundwater, indoor dust, and attic dust are considered to be minor exposure pathways and were addressed through screening-level or qualitative risk evaluations in the HHRA. Exposure to surface water and sediment are also considered to be minor exposure pathways and were evaluated using recreational exposure assumptions.
The following discussion summarizes the key findings of this HHRA:
5.0 RISK ASSESSMENT
5-12 ES022008005PHX
5.1.7.1
5.1.7.2
Residential Soil Based on the baseline HHRA assumptions (i.e., assuming no remedial actions have occurred) and arsenic, copper, and lead concentrations in soil, the risk and hazard results for residential soils are as follows:
• ELCRs exceeded the EPA risk management range of 10-6 to 10-4 for six parcels in Hayden and one parcel in Winkelman. The six parcels in Hayden that exceed include 101-07-176, 101-07-089K, 101-07-089T, 101-07-034, 101-09-038, and 101-07-140 and the parcel in Winkelman that exceeds is 101-12-071.
• For non-cancer effects, the HIs exceeded the threshold of 1 for 91 parcels in Hayden and three parcels in Winkelman. The HIs that exceed the threshold range from 2 to 27.
• Lead levels exceeded site-specific lead screening level of 212 mg/kg for 72 parcels in Hayden and 11 parcels in Winkelman.
Non-Residential Soil Based on arsenic, copper, and lead concentrations in soil, the risk and hazard results for non-residential soil are as follows:
• All of the ELCRs for non-residential soil exposure areas in the Hayden and Winkelman groupings are within or below the EPA risk management range.
• ELCRs at all of the exposure areas in the ASARCO Properties grouping are within the EPA risk management range with the exception of the East of Hillcrest Avenue area (2 x 10⁻³), which exceeds 1 x 10⁻⁴.
• All of the exposure areas in the Outlying Areas grouping have ELCRs that are within the EPA risk management range, although one of the areas (Slag Dump) is at the upper end of the range with an estimated cancer risk of 9 x 10⁻⁵.
• For non-cancer effects, the HIs exceeded the threshold of 1 for two exposure areas in the Hayden grouping (maximum HI = 4 at Hayden Community Library), 12 exposure areas in the ASARCO Properties grouping (maximum HI = 28 at East of Hillcrest Avenue), and one exposure area in the Outlying Areas grouping (maximum HI = 31 at Slag Dump).
• Lead levels exceeded the site-specific risk-based screening level of 212 mg/kg for all 14 exposure areas in ASARCO Properties, and three exposure areas in the Outlying Areas grouping (Tertiary Sediments – South of Smelter, Slag Dump, and State Route 77).
5.0 RISK ASSESSMENT
ES022008005PHX 5-13
5.1.7.3
5.1.7.4
5.1.7.5
5.1.7.6
5.1.7.7
Air The concentrations of metals in air are significantly higher in Hayden when compared to Winkelman. The ELCR from exposure to air in Hayden for arsenic, cadmium, and chromium is 1 x 10⁻⁴ which is at the upper end of the EPA risk management range. The major contributor to risk from exposure to air is arsenic.
Groundwater Quantitative screening level ELCRs exceeded the EPA risk management range of 10-6 to 10-4 from exposure to the drinking water aquifer and non-drinking water aquifer and are at the upper end of the risk management range for Winkelman Municipal Supply Well and Manifold Samples, tap water from the Hayden Library and Winkelman Elementary School. The primary contributor to cancer risk for residential groundwater exposure is arsenic.
For non-cancer effects, the HIs exceeded the threshold of 1 from exposure to drinking water aquifer, non-drinking water aquifer, Hayden Municipal Supply Well and Manifold Samples, Winkelman Municipal Supply Well and Manifold Samples, and tap water from Hayden Library.
Screening level ELCRs from exposure to radionuclides in groundwater exceeded the EPA risk management range of 10-6 to 10-4 from exposure to the drinking water aquifer, non-drinking water aquifer, and Hayden Municipal Supply Well and Manifold Samples.
Surface Water and Sediment The ELCR for exposure to surface water by the recreational swimmer and exposure to sediments by the recreational angler are both 2 x 10⁻⁶, which is at the lower end of the EPA risk management range. Non-cancer hazards for the child for exposure to surface water and sediment are both below the non-cancer threshold of 1.
Indoor and Attic Dust In Hayden, 16 of 18 indoor dust samples exceeded the arsenic Arizona R-SRL of 10 mg/kg, 14 of 18 indoor dust samples exceeded the copper Arizona R-SRL of 3,100 mg/kg, and 8 of 18 samples exceeded the lead Arizona R-SRL of 400 mg/kg. All nine attic dust samples collected in Hayden exceeded the Arizona R-SRLs for arsenic, copper, and lead.
In Winkelman, only one of the four indoor dust samples (Parcel 101-12-093 at 10.2 mg/kg) slightly exceeded the arsenic Arizona R-SRL. Both attic dust samples collected in Winkelman exceeded the Arizona R-SRLs for arsenic. The indoor dust sample at one parcel has an antimony concentration above the Arizona R-SRL of 31 mg/kg. In the attic dust sample one parcel has an antimony concentration above the Arizona R-SRL.
Multi-Pathway Cumulative Risks Multi-pathway cumulative risks indicate that the soil plus air cancer risks in Hayden and Winkelman were greater than the cumulative background cancer risks. The cumulative soil plus air risk associated with background conditions at 3 x 10⁻⁵were within the EPA risk management range. The cumulative soil plus air risk for Hayden and Winkelman exceeded the EPA risk management range assuming high level metal concentrations in soil (i.e., assuming the EPCs are maximum remaining levels of soil arsenic after soil removal actions
5.0 RISK ASSESSMENT
5-14 ES022008005PHX
at selected properties): 132 mg/kg arsenic in Hayden, 112 mg/kg arsenic in Winkelman, plus the corresponding air monitoring risks. Assuming mid-level concentrations of arsenic in soils, the cancer risk is within the risk management range for Winkelman and exceeds the risk management range for Hayden.
5.1.8 Conclusions The HHRA results indicate that the current and former ASARCO operations have resulted in measurable impacts to soils, ambient air, and indoor dust, and to a lesser extent on groundwater, surface water and sediment. In addition, excess lifetime cancer risks exceed EPA's risk management range for some residential and nonresidential properties. Data gaps have been identified related to environmental media sampling (see Section 7.4 of Volume I of the RI Report) and therefore, additional studies will be needed to fill those data gaps.
5.2 Ecological Risk Assessment The Screening-Level Ecological Risk Assessment (SLERA) Report is presented as Volume 3 of this RI Report. This section presents a summary of the SLERA objectives and results.
5.2.1 ERA Objectives and Approach As depicted on the CSM for ecological exposures (Figure 1-7), historic and current activities at the Site resulted in release of contaminants (primarily metals and other inorganics) from smelter emissions, crushing and concentrator operations, the tailings impoundments, process water discharges to unlined ponds, and other process operations to the air, surface soil, sediments, and groundwater in the Hayden area. Discharge/runoff from the tailings impoundments and drainages into the Gila River and aerial deposition of contaminants were the primary release mechanisms of concern to ecological receptors. The SLERA was conducted in support of the RI for the Site. Potential risks to ecological receptors in the vicinity of the Site were evaluated. A brief summary of the SLERA approach, risk conclusions, and recommendations based on those conclusions are provided.
The primary guidance utilized in completing the SLERA was the Ecological Risk Assessment Guidance for Superfund (EPA 1997) and the Final Guidelines for Ecological Risk Assessment (EPA 1998). In accordance with these guidance documents, this assessment serves as a SLERA. An initial screening and a refined screening assessment were conducted.
The primary sources are current or historic activities of the smelter and concentrator. Primary release mechanisms include air emissions from the 1,000-foot stack and other process locations, as well as solid wastes (the tailings impoundments) and wastewater associated with the processing of the copper ore. Release mechanisms include aerial deposition of stack or fugitive emissions, discharge/runoff from the tailings impoundments (as occurred during flooding in 1993) to the Gila River or to adjacent soils, wind erosion, leaching to groundwater, and surface discharge from groundwater. Secondary sources of potential contaminants are surface soils (including areas affected by aerial deposition, riparian soils), surface water and sediment of the rivers, groundwater, and air.
Complete exposure pathways from contaminated surface soil, surface water, sediment, biota, and groundwater to ecological receptors exist at the Site. Surface soils in the ERA refer
5.0 RISK ASSESSMENT
ES022008005PHX 5-15
to riparian, upland, and wash soils that support ecological habitat. Soils collected from the residential/non-residential areas in the town of Hayden were not evaluated because they lack habitats for ecological receptors. Soils and water collected from the tailings impoundments also were not evaluated due to a lack of suitable ecological habitat.
The areas of greatest potential concern to ecological receptors include:
• Gila River and San Pedro River flood plains and environs, extending along the Gila River from about two miles upstream of Winkelman to five miles downstream of Last Chance Basin, and along the San Pedro River about two miles upstream of the confluence with the Gila River.
• Surface water drainages within Hayden that are near ASARCO process facilities, including Power House, Kennecott, and San Pedro washes.
• Upland areas.
Based on historic and current Site use and historic media data, aluminum, antimony, arsenic, barium, beryllium, boron, cadmium, chromium, cobalt, copper, cyanide, iron, lead, magnesium, manganese, mercury, molybdenum, nickel, selenium, silver, thallium, and zinc were considered as contaminants of potential ecological concern (COPECs). The measured concentrations in surface water, sediment, soils, and groundwater collected during the RI sampling were the primary data used in the SLERA.
Assessment endpoints for the Site include aquatic plants, water-column invertebrates, benthic invertebrates, fish, amphibians, and aquatic birds and mammals (swallows, belted kingfishers, little brown bats, and mink) in the aquatic habitats and terrestrial plants, soil invertebrates, soil microbial processes, and terrestrial birds and mammals (mourning doves, curve-billed thrashers, red-tailed hawks, southwestern willow flycatchers, desert cottontails, desert shrews, and coyotes) in the terrestrial habitats. The southwestern willow flycatcher is a federally listed endangered species.
In the initial screening evaluation for the Site, maximum contaminant concentrations (or dietary exposure estimates based on maximum concentrations) were compared to conservative literature-derived toxicity values. These toxicity values were published screening-level benchmarks or were based on no observed effects concentrations (NOECs) or no observed adverse effects levels (NOAELs) and may be referred to as toxicity reference values (TRVs).
Analytes that passed the initial screening were not evaluated further. Those analytes that failed the initial screening were retained for evaluation in a refined screening step. The refined screen did not include the collection of additional data, but rather, highly conservative assumptions used in the initial screening evaluation were refined, or risk was evaluated qualitatively.
5.2.2 Conclusions The results of this refined SLERA are intended to determine potential risks to ecological receptors in support of the RI for the Site. The findings indicate that multiple analytes pose a possible risk to at least one receptor in each medium and sampling area at the Site.

5.0 RISK ASSESSMENT
5-16 ES022008005PHX
Possible risks within the aquatic portions of the Site are primarily related to exposures of aquatic plants, water-column invertebrates, fish, and amphibians to surface water (Table 5-1). Benthic invertebrates do not appear to be at risk from sediment exposures in either river, though this is uncertain for cyanide due to an insufficient detection limit. Additionally, aquatic birds and mammals (swallows, belted kingfisher, little brown bats, and mink) may be at risk from cadmium, copper, iron, or mercury in the Gila River and cadmium, iron, or selenium in the San Pedro River.
Conclusions for the riparian areas in the onsite portions of the Gila River and San Pedro River, as with sediment, indicate a low risk to terrestrial receptors (Table 5-2). Possible risks to terrestrial plants from exposure to arsenic and manganese in Gila River soils, and risks to southwestern willow flycatchers from exposure to mercury in soils of either river and zinc in San Pedro River soils were identified. Although risks to several receptors from exposure to selenium and thallium could not be excluded, these risks are uncertain due to insufficient detection limits.
Within the upland and wash areas, possible risks to terrestrial receptors from multiple analytes were observed. Cadmium, copper, lead, molybdenum, selenium, and zinc in upland soils posed a risk to at least six terrestrial receptors, with copper posing a risk to nine of the ten receptors evaluated (Table ES-2). Arsenic, cobalt, mercury, and silver were a risk to at least one receptor, but no more than three receptors. Risks from copper are also widespread in the wash areas, with a possible risk conclusion for six of the ten receptors. Arsenic, cadmium, molybdenum, silver, and zinc were a risk to at least one receptor, but no more than four.
5.2.3 Recommendations Based on conclusions summarized above, the following recommendations would serve to reduce uncertainties associated with the SLERA risk estimates:
1. Multiple chemicals exceeded surface water screening values for aquatic organisms and soil screening values for plants and soil invertebrates. Because some chemicals may interact (in additive, antagonistic, or synergistic ways), the actual Site-specific risks are somewhat uncertain. Ambient media bioassays, in which receptors are exposed to Site media, would serve to reduce this uncertainty. Sediment bioassays are not recommended at the Site because no risks to benthic invertebrates were identified. However, surface water bioassays using fish and Ceriodaphnia (a water-column invertebrate) would serve to reduce uncertainties associated with the risks from surface water. Similarly, soil bioassays using appropriate terrestrial plant and invertebrate species would reduce the uncertainties related to risks from soils. However, soil bioassays are recommended only for the upland, and possibly wash, areas of the Site because little or no risks were observed for the riparian soils.
2. Exposure estimates for birds and mammals included the use of literature-based bioaccumulation models. Because the applicability of these models to the Site is unknown, development of Site-specific bioaccumulation models would serve to reduce uncertainties in the risk estimates for birds and mammals. This can be accomplished through collection of co-located abiotic media and biota samples. Development of soil-to-plant and soil-to-invertebrate bioaccumulation models for the upland and wash areas is recommended.
5.0 RISK ASSESSMENT
ES022008005PHX 5-17
3. The detection limits for some analyte/medium combinations exceeded screening benchmarks for one or more receptors (e.g., selenium and thallium in riparian soils). This indicates that the detection limit was too high and risks are uncertain. Therefore, additional sampling and laboratory analysis using methods to obtain lower detection limits, particularly for selenium and thallium in the riparian areas, may be appropriate. However, it is recommended only if additional sampling is planned in these areas (e.g., collection of soil samples to obtain Site-specific bioaccumulation data or to obtain more background data).
4. Background data for sediment were very limited; therefore, adequate background comparisons could not be conducted (though a comparison to upstream and downstream sediment was possible). Collection of additional sediment data from background areas would reduce this uncertainty. However, these additional data may not add value to the risk assessment. Surface water levels and flows in both the Gila River and San Pedro River are highly variable. At some times during the year, the streambeds are dry, whereas at other times, flash floods or releases from Coolidge Dam on the Gila River result in high flows. Therefore, sediments in these riverbeds are often very mobile and may not store contaminants at high levels. Additionally, current data suggest that cleaner sediments from the San Pedro River may dilute onsite sediment in the Gila River downstream of the confluence of the two rivers. In the upland areas, however, additional background data could be used to determine how much of the observed toxicity is related to the local geology of the area versus the result of contaminant discharges from the Site
5. The results of the SLERA indicate widespread risks among the upland, and to a lesser extent, wash areas. It is possible that additional study of these areas is needed to determine the spatial extent of these risks.

ES022008005PHX 6-1
SECTION 6
Assessment of Need for Treatability Studies
6.1 Overview Based upon the data presented in this report concerning the nature and distribution of contamination at the Site, development and execution of treatability studies may be needed as a step in remedial planning. It is important to recognize that treatability studies will only be required if EPA deems: 1) that remedial action is needed; and 2) that testing of one or more remedial technologies is needed to confirm the most applicable technology to implement at the Site. Therefore, treatability studies may not be needed at all, or may only be needed for selected media impacted above acceptable levels.
Based on existing data, treatability studies to address contamination may be needed for selected media, including non-residential soils and riparian sediments. The existing data do not support a need for development of treatability studies for residential soils, dust, and surface water, as explained more fully below. Finally, the need for treatability studies for groundwater and air cannot be assessed until additional investigation work is completed.
6.2 Media Possibly Requiring Treatability Studies Non-residential soils such as those within the former Kennecott smelter area and within surface water drainages in Hayden require further characterization to better define the nature and extent of contamination and support decisions regarding the need for remedial action. If remedial action is deemed necessary, this may provide a basis for the identification and screening of potential remediation technologies and associated treatability studies. Depending upon the results of further characterization, treatability studies for impacted non-residential soils may be warranted to support evaluation of technologies such as onsite stabilization and active treatment of contamination (as possible alternatives to excavation and offsite disposal of these materials).
Data from characterization of riparian sediments, particularly in the vicinity of the tailings impoundments, indicates that further characterization and possible treatability studies may be beneficial in supporting remedial planning. Treatability studies would focus on measures for embankment stabilization and erosion control, to limit the potential for discharge of sediments from Site operations to the Gila River flood plain. This would improve the quality of sediments in the flood plain and would also have a beneficial impact on surface water quality.
6.2.1 Media Likely Not Requiring Treatability Studies Residential soils within Hayden and Winkelman have been characterized at many discrete locations and treatability studies to support planning for remediation of these soils will not likely be needed. It is anticipated that remediation of residential soils will be consistent with residential soil remediation practices at comparable sites. Common remediation practices
6.0 ASSESSMENT OF NEED FOR TREATABILITY STUDIES
6-2 ES022008005PHX
involve removal of impacted soils to a specified depth and replacement of excavated soil with clean fill.
Remediation of contaminated attic dust is anticipated to include commonly-employed measures such as vacuum-removal of dust and offsite disposal. Therefore, no treatability studies are expected for this medium.
The overall low levels of contaminants detected in the Gila River surface water, combined with the likelihood of contribution of contaminants to surface water from sources upstream of the Site, yield the conclusion that treatability studies for surface water are not appropriate. Control of Site-related discharges to the Gila River will also improve surface water conditions.
6.3 Media for which Additional Investigation Data are Needed
A detailed list of data gaps for the sampled media is presented in Section 7.4. This section provides an abbreviated description focused on groundwater and air.
For groundwater, some elevated levels of contaminants were found in monitor wells near Site operations, but generally acceptable levels were found to be present in production wells from which the potable supply is provided. Additional groundwater quality monitoring is needed to confirm that production wells are not threatened by Site-related contaminants. If this evaluation indicates that production wells are potentially threatened and that remedial action is warranted, treatability studies for groundwater (to confirm an appropriate remedial technology) may be needed.
Regarding air emissions, insufficient data have been collected to allow a determination as to whether treatability studies are needed. If deemed necessary, treatability studies would focus on reduction of air emissions from active processes and control of airborne emissions from waste storage/disposal areas. Studies would include evaluation of improvements to emission controls at the concentrator and smelter facilities, consolidation/stabilization of waste piles in the vicinity of facilities such as the concentrator and Conveyor No. 9, and stabilization or other erosion control methods applied to the tailings impoundment surfaces. Evaluation of potential emissions controls on process facilities would require collection of additional air quality monitoring data and possible dispersion modeling.
ES022008005PHX 7-1
SECTION 7
Summary and Conclusions
7.1 Purpose Review This report was prepared to describe the investigation of potential environmental impacts from ASARCO Site operations, which date back to 1911, on air, soil, groundwater, surface water, and sediments in the vicinity of the Site. Field activities described in this report were conducted from November 2005 through March 2008, although the air monitoring portions of the investigation will continue through 2008. EPA is the lead responsible agency for the RI and guided the overall implementation.
7.2 Conceptual Site Model and Chemicals of Concern The CSM presented in Figure 1-6 identified the concentrator operations and the current and historic smelter operations as the primary sources of contamination. The fugitive and stack emissions, tailings impoundments, rail transport, and process wastewater were identified as the primary release mechanisms that may have affected soils on and near the Site.
Other process operations and features, including smelter furnace and converter areas, machine shops, maintenance yards, and underground storage tanks, may be potential sources of various contaminants. Although a limited amount of onsite soil sampling was conducted, it was beyond the scope of the RI to extensively evaluate onsite operations. The focus of the RI was on adjoining and nearby nonresidential and residential areas to evaluate impacts from current and historical copper processing activities.
The primary COCs prior to the start of the RI are six metals, which include arsenic, copper, lead, cadmium, chromium, and mercury.
7.3 Summary of Findings The following sections describe the findings for each type of media that was sampled during the remedial investigation.
7.3.1 Non-Residential Soils The non-residential soil sampling activities consisted of the collection of samples at 270 locations within Hayden, Winkelman, and ASARCO property.
The results for non-residential surficial soils indicate that arsenic, copper, and lead are the primary COCs. This is indicated by the elevated arsenic, copper, and lead impacts above the Arizona Residential Soil Remediation Levels (R-SRLs) and above background concentrations. A small number of non-residential properties showed exceedances of R-SRLs for other metals, but none of these metals are widespread at elevated concentrations. These results indicate that nonresidential soils are markedly influenced by ASARCO
7.0 SUMMARY AND CONCLUSIONS
7-2 ES022008005PHX
operations. Soils at ASARCO facilities (particularly the perimeter of the concentrator and former Kennecott smelter areas and the smelter perimeter and slag dump areas) generally contain the highest concentrations of metals, while nonresidential soils on non-ASARCO properties, including the Winkelman and upland areas, contain the lowest concentrations. The washes located near the ASARCO operations (especially Power House Wash) also appear to be directly affected by ASARCO operations.
7.3.2 Residential Soils Hayden Data collected from the surficial soil sampling in Hayden (and Winkelman) residential properties indicates that the primary COCs are arsenic, copper, and lead. Based on the laboratory results of the 99 homes sampled in Hayden, only one parcel in Hayden has an arsenic UCL concentration below the R-SRL of 10 mg/kg. This parcel (101-07-185C) is located in Zone 1, the most distant zone in Hayden from the former Kennecott smelter, ASARCO smelter, and concentrator operations. Also, four other parcels display arsenic UCL concentrations just over the R-SRL but below the background value of 12.5 mg/kg; these parcels (101-07-202, 101-07-234, 101-07-244, and 101-07-247) are all located in nearby Zones 2 and 3, which are the next most distant zones from active operations. The remaining 94 parcels in Hayden display UCL values above both the R-SRL and background values. The UCL concentrations in these 94 parcels range from 13.4 mg/kg in parcel 101-07-259, (Zone 4), to 540 mg/kg in parcel 101-07-089T (Zone 9, just south of the former Kennecott smelter area).
As shown on Figure 4-12, the highest arsenic concentrations are in Zones 7, 8, 9, 10, 16, and 17 located south of the former Kennecott smelter area and west of the active concentrator operations. Of the parcels sampled in these three zones, nearly all display arsenic UCL concentrations above the arsenic non-cancer HI of 1 value of 26 mg/kg. The next most impacted area is represented by Zones 12, 13, 14, and 15 located in northeast Hayden and in relative close proximity to ASARCO’s concentrator facility. In these zones, nearly all parcels also contain arsenic UCL concentrations above the arsenic non-cancer HI of 1 value of 26 mg/kg.
As indicated on Figure 4-13, the subsurface arsenic soil concentrations are considerably lower than surface soil concentrations. Nearly half of the subsurface soil samples (46 samples) display arsenic concentrations below the R-SRL. Seven subsurface samples are above the non-cancer HI value of 1 value of 26 mg/kg, and these samples are generally located in zones adjacent to concentrator operations. The highest concentrations in subsurface soil samples occur in parcel 101-07-010 in Zone 10 (74 mg/kg) and in parcel 101-09-108 in Zone 16 (58.1 mg/kg); in these two parcels, the subsurface arsenic concentration exceeds the arsenic UCL for the surface soil samples.
Only nine of the 99 parcels in Hayden have copper UCL concentrations below the R-SRL of 3,100 mg/kg. Eight of these nine parcels are located in Zones 1-4, the most distant zones in Hayden from the concentrator operations. However, all nine of these parcels have copper UCL concentrations above the Hayden background value of 1,270 mg/kg. The remaining 90 parcels in Hayden display UCL values above the R-SRL, and therefore, well above background value. The UCL concentrations in these 90 parcels range from 3,350 mg/kg in
7.0 SUMMARY AND CONCLUSIONS
ES022008005PHX 7-3
parcel 101-07-259 (Zone 4), to 39,700 mg/kg in parcel 101-09-140 (Zone 16, near the active concentrator operations).
As shown on Figure 4-14, the pattern of elevated copper concentrations is similar to that displayed for arsenic. The highest copper concentrations are in Zones 7-9, located south of the former Kennecott smelter area and west of the active concentrator operations, and in Zones 10 and 16, located in northeast Hayden and adjacent to ASARCO’s concentrator facility.
Figure 4-15 shows that the subsurface copper soil concentrations are considerably lower than surface soil concentrations. All but 24 of the 99 subsurface soil samples display copper concentrations below the R-SRL. Most of the subsurface soil samples with concentrations below the R-SRL are also below the background value, although several parcels, primarily those located closer to active concentrator operations, are above background values. The highest concentrations in subsurface soil samples occur in parcel 101-07-110 in Zone 8 (17,100 mg/kg) near the Kennecott Avenue Wash area, and in parcel 101-09-108 in Zone 16 (11,300 mg/kg); in these two parcels, the subsurface copper concentration exceeds the copper UCL for the surface soil samples.
The lowest lead UCL concentration is in parcel 101-07-185C (51.8 mg/kg), located in Zone 1, the most distant zone in Hayden from the concentrator operations. The highest lead UCL concentrations are in parcels 101-09-088 (92,600 mg/kg, Zone 15), parcel 101-09-004 (8,170 mg/kg, Zone 12), and parcel 101-09-077 (7,250 mg/kg, Zone 14), located in central Hayden. The lead concentration in the Zone 15 parcel is anomalously high (an order of magnitude above the next highest values) and exceeds levels in non-residential soil samples on ASARCO property, suggesting that other possible sources of lead may be present on this parcel. Overall, the largest percentage of parcels with lead UCL concentrations above the R-SRL are in Zones 10, 12, 13, 14, and 16, located in relatively close proximity to concentrator operations. As indicated on Figure 4-16, the lead values in non-residential soil samples collected on the concentrator property are above background, but below the R-SRL and in most cases below the UCL values in nearby residential parcels. These data indicate that ASARCO operations may be a source of lead, along with other sources such as lead-based paint.
As indicated on Figure 4-17, the subsurface lead soil concentrations are considerably lower than surface soil concentrations. Approximately 30% (30 parcels) have lead concentrations below the background value. Regarding exceedances, 12 parcels have lead values above the screening value of 212 mg/kg, and seven parcels have lead values above the R-SRL of 400 mg/kg. Lead concentrations in these seven lots range from 433 mg/kg to 1,340 mg/kg and are located in Zones 2, 8, 10, 12, 13, 14, and 16.
Winkelman Only five of the 31 parcels in Winkelman have arsenic UCL concentrations above the R-SRL (and therefore also above the background value). The arsenic UCL concentrations in these five parcels range from 16.6 mg/kg (parcel 101-12-142) to 112 mg/kg (parcel 101-12-071). Figure 4-18 shows these parcels are all located in Zones 18, 19, and 21, in the central and southern areas of Winkelman.
7.0 SUMMARY AND CONCLUSIONS
7-4 ES022008005PHX
As indicated on Figure 4-19, the subsurface arsenic soil concentrations are generally lower than surface soil concentrations. Only one subsurface soil sample (101-12-008J, 12.3 mg/kg) exceeds the R-SRL; this subsurface soil sample along with subsurface soil sample (101-10-019, 9.4 mg/kg) exceeds the background UTL of 9.1 mg/kg.
Only two of the 31 parcels in Winkelman have copper UCL concentrations above the R-SRL. The copper exceedances are found in two neighboring parcels in Zone 21: parcel 101-12-149 (5,130 mg/kg) and 101-12-150 (4,410 mg/kg). Arsenic UCL exceedances were also found for these two parcels. In addition, parcels 101-12-142 (1,390 mg/kg) in zone 21 and parcel 101-12-093 (1,040 mg/kg) in zone 20 exceeded the Winkelman area background value. All other copper UCL concentrations in Winkelman parcels are below the background level.
As indicated on Figure 4-21, all subsurface copper concentrations are below both the background and R-SRL values in all samples.
Only five of the 31 parcels in Winkelman have lead UCL concentrations above the R-SRL. The highest lead exceedance is found in Zone 21 parcel 101-12-149 (2,330 mg/kg). Five additional parcels have lead UCL concentrations above the screening level of 212 mg/kg. Of the remaining 21 Winkelman parcels, 18 display lead UCL concentrations above the background concentration of 45.8 mg/kg. Because nonresidential soil samples collected in the northern part of Winkelman are generally below background lead levels, the residential soils data suggest that some limited lead-based paint impacts may exist as wells as other industrial sources in the southern part of town.
As indicated on Figure 4-23, the subsurface lead concentrations are below the R-SRL values in all samples. Nine additional samples exceed the background value of 45.8 mg/kg. Overall, the subsurface lead impacts are relatively limited.
7.3.3 Surface Water and Sediments Surface Water Surface water samples were collected at 13 locations, including 11 locations along the Gila River and two locations along the San Pedro River. The 13 surface water samples were collected during two sampling events (Winter [Figure 4-24] and Summer [Figure 4-25]). Elevated concentrations of several analytes were clearly evident at the two Gila River sampling locations (GR-SW-06 and GR-SW-07) located between the tailings impoundments, compared to other upstream and downstream locations, as indicated on the histograms (Figure 4-27 through Figure 4-34). The total and dissolved concentrations of aluminum, arsenic, barium, beryllium, calcium, cadmium, chromium, cobalt, copper, iron, lead, magnesium, manganese, nickel, potassium, sodium, thallium, vanadium, and zinc as well as total mercury, molybdenum, selenium, and silver, were generally higher in these two samples than in other Gila River samples. These elevated concentrations were most pronounced in samples collected in the Summer sampling event when surface water flows were approximately 4 times higher than Winter. Although no Winter sampling event samples exceeded AAWWQC or PRG levels (with the exception of arsenic), several exceedances were noted in the Summer event samples at GR-SW-06 and/or GR-SW-07 only, and these levels were also considerably above background levels measured in upgradient samples GR-SW-01 and GR-SW-02.
7.0 SUMMARY AND CONCLUSIONS
ES022008005PHX 7-5
Surface water samples from the San Pedro River location SPR-SW-02 displayed higher concentrations for some analytes as compared to Gila River sampling locations. Total and dissolved arsenic, barium, boron, calcium, chromium, cobalt, iron, magnesium, molybdenum, nickel, potassium, selenium, and sodium, total copper, lead, and silver, and dissolved manganese, vanadium, and zinc were generally greater in San Pedro River samples relative to Gila River samples. Dramatic seasonal differences in concentrations in the San Pedro River samples were evident through analytes such as aluminum, barium, iron, and manganese, which were higher during the Summer sampling event, although analytes like magnesium and sodium were higher during the Winter sampling event. These elevated levels in the San Pedro River samples may result from different geology, mining activity or lower flow conditions, resulting in less dilution, and therefore, higher concentrations of these metals.
Despite the increased concentrations observed in the San Pedro River samples and in Gila River samples GR-SW-06 and GR-SW-07, the downgradient samples did not show AAWWQC or PRG exceedances (with the exception of arsenic).
Sediment In-stream sediment samples showed elevated metals (arsenic, lead, manganese, and vanadium) concentrations in upstream, between tailings impoundments, and downstream of the tailings impoundments, which indicate that additional data are needed to characterize upstream contributions and the full extent of impacts. With few exceptions, analyte concentrations within in-stream sediment samples from the San Pedro River exhibited generally lower concentrations (but higher surface water concentrations for metals) than those obtained from the Gila River sampling locations. Large seasonal variations were also evident among the San Pedro River samples.
For the riparian sediment samples, elevated concentrations above the R-SRL or EPA PRG of arsenic, lead, and vanadium are present at upstream locations. However, only arsenic had concentrations exceeding these standards between the tailings impoundments and downstream of the tailings impoundments. Unstable riparian sediments generally had higher and more variable concentrations than were observed in associated stable riparian sediments.
7.3.4 Groundwater The groundwater investigation confirmed that groundwater from the concentrator and smelter facilities generally flow towards the Gila River. In general, the groundwater quality data from the two sampling events (Winter and Summer 2006) show concentrations exceeding comparison criteria for aluminum, arsenic, iron, copper, manganese, molybdenum, selenium, and vanadium. Most exceedences are in groundwater samples collected from monitoring wells located near active ASARCO concentrator and smelter operations, with a limited number of exceedences from production wells.
Cadmium, chromium, lead, and mercury had either singular exceedances or none at all, and therefore, are not considered COCs in groundwater. Arsenic concentrations at every location exceeded the PRG, however, only six monitoring well locations had concentrations exceeding the MCL of 10 mg/L. Monitoring wells with generally high sulfate concentrations (above the secondary MCL of 250 mg/L) are H-2A, H-3, H-8, H-9, LC-1, and SM-2. All
7.0 SUMMARY AND CONCLUSIONS
7-6 ES022008005PHX
monitoring wells on Site have sulfate and TDS concentrations greater than the secondary MCL standards (250 mg/L and 500 mg/L, respectively).
The Hayden production wells do not display elevated levels of metals concentrations. The only exceedances occurred at the Winkelman wellfield. The sample from WM-4 had exceedances for total and dissolved manganese and dissolved copper. Samples collected from the Winkelman Wellfield Manifold had exceedances for total manganese and dissolved selenium. Moreover, samples from the Hayden wellfield wells generally have sulfate and TDS concentrations greater than the secondary MCLs. Samples from the Winkelman wellfield wells generally show only TDS concentrations above the secondary MCL. Samples collected at the Winkelman Elementary School drinking fountain had an exceedance of total and dissolved copper, which may be related to the piping distribution network. Similarly, the sample from the Hayden Library drinking fountain had an exceedance of dissolved copper in Summer 2006 (which may be related to the piping), but not in the Winter 2006 sampling event.
7.3.5 Air The air investigation began at the Hayden and Winkelman air monitoring stations in October 2006, and will continue through most or all of 2008. For this report, data from the period October 22, 2006, to November 7, 2007, were evaluated, along with data collected during the three-week annual smelter shutdown periods in 2007 and 2008. Data from this study show that the concentrations of PM10 and metals in the Hayden and Winkelman stations far exceed the measured concentrations at the background Organ Pipe station. The average PM10 concentrations at Hayden and Winkelman stations were approximately 2.36 and 1.26 times higher, respectively, than average PM10 concentrations at the Organ Pipe station. No arsenic and cadmium were detected at the Organ Pipe station at levels above the MDL. However, the average arsenic concentrations were about 40 to 80 times greater at the Hayden station than the MDLs at the Organ Pipe station. The average cadmium levels were about 7.5 times greater in the Hayden station compared to the Organ Pipe station MDLs (Table 4-35). The average arsenic and cadmium levels in Hayden exceeded the PRG levels by a factor of 53 and 4, respectively. The average ambient air concentrations of copper, lead, and chromium at the Hayden station were 510, 64, and 4 times higher, respectively, than average levels at the Organ Pipe station. The average ambient air concentration of copper, lead, and chromium at the Winkelman station were 203, 17, and 2 times higher, respectively, than average levels at the Organ Pipe station.
The average PM10 concentrations in the Hayden station samples are about twice the levels in the Winkelman station samples. The average concentrations of arsenic, copper and chromium are about 2.5 times higher in Hayden station samples compared to Winkelman station samples. The average lead concentrations in Hayden station samples are about 3.5 times higher than levels in Winkelman station samples. The higher concentrations in the Hayden area are likely attributed to the closer proximity to active concentrator and smelter operations.
Data collected during the smelter shutdown periods show that average PM10 and metals concentrations are considerably lower compared to average concentrations during the entire monitoring period. During the smelter shutdowns, the average PM10 levels were 52 and 34% of the average concentrations measured during the entire monitoring period in Hayden and
7.0 SUMMARY AND CONCLUSIONS
ES022008005PHX 7-7
Winkelman, respectively. Similarly, average arsenic concentrations were 17 and 30% of average concentrations measured during the entire monitoring period in Hayden and Winkelman, respectively.
7.3.6 Interior Dust Of the 22 indoor residential dust sample locations, 18 parcels were in Hayden and four parcels were in Winkelman. The increased concentration of sample locations in Hayden was in direct response to the elevated metals concentrations in Hayden residential soil samples relative to Winkelman residential soil samples. Indoor dust samples were collected from occupied living areas at all residences, and from attics where they were present and accessible (11 of the locations). Of these 22 sample locations, 17 locations had dust sample results that exceeded the arsenic R-SRL, 15 locations exceeded the copper R-SRL, and eight locations exceeded the lead R-SRL. Of the 11 attic samples, nine were collected in Hayden with all nine samples exceeding the R-SRLs for arsenic, copper, and lead. Two attic dust samples were collected in Winkelman and both had exceedences of the arsenic R-SRL only.
7.4 Data Gaps The following data gaps are provided per media, based on data collected during the RI. The Screening-Level Ecological Risk Assessment (SLERA) also cites some recommendations in Section 5.2.3. The SLERA recommendations and the following data gaps should be addressed during subsequent phases of remedial investigation at the Site and study area.
Non-Residential Soils
• Additional soil samples encompassing the entire former Kennecott smelter area are needed to further characterize the vertical and horizontal extent of contamination within the area, with an extensive analysis of metals suite (including molybdenum and vanadium) to determine other possible contaminants of concern.
• Additional soil samples collected from the active concentrator area, beyond the perimeter of public areas, are needed to determine the vertical and horizontal extent of contamination, with an extensive analysis of metals suite to determine other possible contaminants of concern.
• Additional soil sampling of the entire area at the active smelter area is needed to determine the vertical and horizontal extent of contamination, with an extensive analysis of metals suite to determine other possible contaminants of concern.
• Additional soil sampling of other public and commercial areas within the towns of Hayden and Winkelman is needed, to determine the vertical and horizontal extent of contamination, with an extensive analysis of metals suite to determine other possible contaminants of concern.
Residential Soils
• Only a limited number of residences in Hayden and Winkelman were sampled during the RI, and additional sampling is needed, especially at residences located in relatively close proximity to the active concentrator facility.
7.0 SUMMARY AND CONCLUSIONS
7-8 ES022008005PHX
• Only one subsurface soil sample was collected on each property, and additional sampling is needed to better delineate the vertical extent of impacts.
• A recontamination assessment is needed to determine the possibility and rate of recontamination of the area residential soils from the on-going air contamination.
Surface Water and Sediment
• To delineate the extent of surface water impacts from smelter emissions and assess possible upstream contributions, additional samples are needed upstream on the Gila and San Pedro Rivers.
• To delineate the extent of in-stream and riparian sediment impacts and assess possible upstream contributions, an increased density of samples is needed upstream and downstream on the Gila and San Pedro Rivers.
• Further characterization by an increased density of samples collected of riparian sediment is needed to evaluate the impact of the tailings impoundments.
• Additional rounds of surface water and sediment sampling are needed to evaluate impacts seasonally and to evaluate longer term trends.
Groundwater
• More upgradient monitoring wells are needed to assess and define background groundwater quality conditions.
• There are very few monitoring wells located on former and currently active ASARCO operations, especially the smelters, concentrator, and slag dump areas. Additional wells are needed to identify possible source areas and the extent of impact.
• To better assess the influence of the alluvial aquifer on the chemistry and flow rate of the Gila River, installation of additional monitoring wells in the vicinity of the Gila River are needed; this includes in proximity to the tailings impoundments.
• Additional information on the individual production well operations is needed to better assess regional groundwater flow and pumping effects.
• Installation of additional stream gauges, and a monitoring well near the SW-04 sample location, are needed to evaluate the possible connection of groundwater and surface water.
• The groundwater elevation data suggests that ARU-1 is disconnected from water levels within the Gila River alluvium; confirmation or resurveying of the top-of-casing elevation is needed (and based on additional groundwater elevation measurements, a more reliable downgradient monitoring well may be needed to assess impacts of tailings impoundments on the Gila River alluvial aquifer).
• An independent confirmation of vertical and horizontal coordinates for the existing monitoring and production well locations was not conducted as part of the RI. An updated and accurate survey of all monitoring well locations is needed to provide greater confidence in the groundwater elevation contouring.
• Continual quarterly or monthly water level monitoring and groundwater sampling are needed to evaluate impacts seasonally and to evaluate longer term trends.
7.0 SUMMARY AND CONCLUSIONS
ES022008005PHX 7-9
Air • A source apportionment study is needed to identify the relationship between emission
sources and measured concentrations of metals.
• Only the PM10 fraction of lead in ambient air was measured. A TSP monitor is needed to analyze for lead and compare with the NAAQS value.
• No background air monitor was installed for this investigation. A limited set of data were used (approximately 15 samples) from the background Organ Pipe station. More background air stations with more samples are needed to allow for more precise averages.
• A co-located air monitor is needed next to the Hayden and/or Winkelman air monitoring stations to allow for a QA/QC of data from that air monitoring station.
• Monitoring and differentiation of acid gases in the air are needed at the Site and study area.
• Analysis of the collected air monitoring filters for particulate morphology and speciation is needed to assist in source attribution.
• Detailed ambient air monitoring stations closer to suspected source areas are needed to better evaluate possible unknown sources.
• Sampling of fine grained soils is needed in industrial areas for determination of these as possible air impact sources from entrainment during high wind events.
• Point source air monitoring for stack and near-ground emission sources is needed.
• Day and night short term sampling events for emissions comparison are needed.
• High wind short term sampling events for emissions comparison are needed.
Interior Dust
• The dust sampling was of a very limited extent and included a very few number of residences. Additional sampling from other residences in potentially impacted areas is needed to confirm metals concentrations in these other areas.
• Lead-specific sampling is needed to differentiate between Site-related lead and the impact of lead-based paint on lead concentrations detected in dust samples.
• Additional dust samples are needed from public areas (such as schools, library, post office, commercial, and retail businesses) to determine the extent of dust contamination in these areas.
7.0 SUMMARY AND CONCLUSIONS
7-10 ES022008005PHX
7.5 Overall Summary The RI results indicate that the current and former ASARCO operations have resulted in measurable impacts to soils, ambient air, and indoor dust, and to a lesser extent on groundwater, surface water and sediment. Additional studies will be needed to fill the data gaps presented in Section 7.4.
ES022008005PHX 8-1
SECTION 8
References
Agency for Toxic Substances and Disease Registry (ATSDR). 2002. Public Health Assessment, ASARCO Hayden Smelter Site, Hayden, Gila County, Arizona. Prepared by Arizona Department of Health Services (ADHS) and ATSDR. ATSDR Website: http://www.atsdr.cdc.gov/. September 30.
Andrews, B.J., and K.A. King. 1997. Environmental Contaminants in Sediment and Fish of Mineral Creek and the Middle Gila River, Arizona. U.S. Fish and Wildlife Service, Region 2, Contaminants Program. July. 18 pp.
Arizona Department of Commerce (ADOC). 2006. Community Profile Statistics. Arizona Department of Economic Security.
Arizona Department of Environmental Quality (ADEQ). 2008. Online UST status search, http://www.azdeq.gov/cgi-bin/webdata_ust.pl
Arizona Department of Environmental Quality (ADEQ). 2007. Online UST status search, http://www.azdeq.gov/cgi-bin/webdata_ust.pl
Arizona Department of Environmental Quality (ADEQ). 2005. Online Hazardous Material Incident Logbook search, http://www.azdeq.gov/database/hwssearch.html
Arizona Department of Environmental Quality (ADEQ). 2004a. Arizona Mining Guidance Manual, BADCT (Best Available Demonstrated Control Technology.
Arizona Department of Environmental Quality (ADEQ). 2004b. Telephone conversation between CH2M HILL and Jeff Emdi, ADEQ APP Case Manager. December 7.
Arizona Department of Environmental Quality (ADEQ). 2003. Expanded Site Inspection Report: ASARCO, Inc., Hayden Plant. EPA ID No. AZD008397127. Prepared for the U.S. Environmental Protection Agency Region IX by ADEQ, Capacity Development Section, Site Assessment Unit. April 25.
Arizona Department of Environmental Quality (ADEQ). 1991. Preliminary Assessment/Site Inspection Report. July 19.
Arizona Department of Water Resources (ADWR). 2005. http://www.water.az.gov/adwr/content/waterinfo/outsideAMAs/southeasternArizona/watersheds/middlegilariver.html.
Arizona Game and Fish Department (AGFD). 2006. Special Status Species Information for EPA Study Area for Hayden Plant Site; Proposed Remedial Investigation. AGFD #M06-04210824. Letter from G. L. Ritter of AGFD to C.A. Arenal of CH2M HILL. April 24.
ASARCO LLC. 2008. http://www.asarco.com/hayden_T.html
8.0 REFERENCES
8-2 ES022008005PHX
ASARCO LLC. (ASARCO, 2005a). Comments to Draft Remedial Investigation Workplan, provided at close of 30-day public comment period. September 6.
ASARCO LLC. (ASARCO, 2005b). Personal discussion between CH2M HILL and Jack Garrity, Technical Services Manager, during January 20, 2005 site visit.
ASARCO LLC. Personal discussion between CH2M HILL/EPA and Jack Garrity, Technical Services Manager, during December 15, 2004 site visit.
Brown, D.E. 1994. Biotic Communities: Southwestern United States and Northwestern Mexico. University of Utah Press, Salt Lake City, UT, 342 pp.
California Environmental Protection Agency, Department of Toxic Substance (DTSC). 2002. DTSC Lead Risk Assessment Spreadsheet, Version 7.0, link at: http://dtsc.ca.gov/AssessingRisk/leadspread.cfm
CH2M HILL. 2008a. Meteorological and PM10 Monitoring Performance Audits at Winkelman, AZ and Hayden, AZ Air Quality Monitoring Stations (ASARCO LLC Hayden Plant Site). June 24.
CH2M HILL. 2008b. Screening-Level Ecological Risk Assessment for the ASARCO LLC Hayden Plant Site (SLERA). February.
CH2M HILL. 2007a. Evaluation of Background Metal Concentrations in Soil for the ASARCO LLC Hayden Plant Site technical memorandum. November.
CH2M HILL. 2007b. Limited Geotechnical Evaluation of Tailings Impoundments AB/BC and D. May.
CH2M HILL. 2007c. Meteorological and PM10 Monitoring Performance Audits at Winkelman, AZ and Hayden, AZ Air Quality Monitoring Stations (ASARCO LLC Hayden Plant Site), May 17.
CH2M HILL. 2005. Final Workplan, Remedial Investigation at the ASARCO LLC Hayden Plant Site, Hayden, Gila County, Arizona. September.
Dames & Moore. 1990. Final Report, Geotechnical Engineering Services, Tailings Ponds AB, BC and D, Ray Unit, Hayden, Arizona, December 14.
Earth Technology Corporation. 1991. Evaluation of Background Metals Concentrations in Arizona Soils. Prepared for the Arizona Department of Environmental Quality Groundwater Hydrology Section. June.
Ecology and Environment, Inc. (E&E). 2004. ASARCO Hayden Removal Assessment: Final Report. Superfund Technical Assessment and Response Team, Contract No: 68-W-01-012. Prepared for the U.S. Environmental Protection Agency Region IX Emergency Response Section. December.
Hydrometrics, Inc. 1998. UST Closure and Characterization Report, ASARCO Ray Complex. October 16
Paxton, E., S. Langridge, and M.K. Sogge. 1997. Banding and Population Genetics of Southwestern Willow Flycatchers in Arizona – 1997 Summary Report. U.S. Geological Survey, Biological Resources Division, Colorado Plateau Field Station, Southwestern Willow Flycatcher Research Program, Flagstaff, Arizona.
8.0 REFERENCES
ES022008005PHX 8-3
Schumacher, Brian A., Calvin C. Ainsworth, Eric A. Crecelius, and Valerie I. Cullinan, Battelle-Marine Sciences Laboratory. 2005. Re-evaluation of the Applicability of Agency Sample Holding Times. http://epa.gov/nerl/news/forum2005/schumacher.pdf
SHB – AGRA Earth & Environmental, Inc. (SHB) 1994. App Application Phase III, ASARCO, Inc. – Ray Complex, Gila and Pinal Counties, Arizona. March.
SHB Earth & Environmental, Inc. (SHB) 1992. APP Application Phase I, ASARCO, Inc. – Ray Complex, Gila and Pinal Counties, Arizona. June.
Smith, A.B., P.E.T. Dockens, A.A. Tudor, H.C. English, and B.L. Allen. 2004. Southwestern Willow Flycatcher 2003 Survey and Nest Monitoring Reports. Technical Report 233, Arizona Game and Fish Department, Nongame and Endangered Wildlife Program, Phoenix, AZ. March. 65 pp.
U.S. Environmental Protection Agency (EPA). 2008a. Pollution Report. June 12.
U.S. Environmental Protection Agency (EPA). 2008b. Federal Register, Part II, 40 CFR Parts 50, 51, 53 et al. National Ambient Air Quality Standards for Lead; Proposed Rule. May 20.
U.S. Environmental Protection Agency (EPA). 2008c. EPA Website: http://www.epa.gov/safewater/radionuclides/basicinformation.html
U.S. Environmental Protection Agency (EPA). 2005. Toxics Release Inventory (TRI), Form R Reports, ASARCO, Inc. Ray Complex, Hayden Smelter and Concentrator, 640 ASARCO Avenue, Hayden, Arizona, Reporting Year 2003, John Shaw, General Manager, Hayden Operations, Date Signed: June 30, 2004. EPA Website: http://www.epa.gov/safewater/mcl.html/. January 20.
U.S. Environmental Protection Agency (EPA). 2004a. Aerial Photographic Analysis of ASARCO Hayden Study Area, Gila and Pinal Counties, Arizona. December.
U.S. Environmental Protection Agency (EPA). 2004b. Drinking Water Health Advisory for Manganese. Report No. EPA-822-R-04-033. January.
U.S. Environmental Protection Agency (EPA). 2002. Guidance for Comparing Background and Chemical Concentrations in Soil for CERCLA Sites.
United States Environmental Protection Agency (EPA). 2003. Human Health Toxicity Values in Superfund Risk Assessments. OSWER, Directive 9285.7-53. December 5.
U.S. Environmental Protection Agency (EPA). 2000. Resource Conservation and Recovery Act (RCRA) Inspection Report. September 20.
U..S. Environmental Protection Agency (EPA). 1998. Final Guidelines for Ecological Risk Assessment, Risk Assessment Forum. U.S. EPA, Washington, D.C., EPA/630/R-95/002F. April.
U.S. Environmental Protection Agency (EPA). 1992. Guidelines for Exposure Assessment. Federal Register. Vol. 57(104), pp. 22888-22938. May 29.
United States Environmental Protection Agency (EPA). 1989. Risk Assessment Guidance for Superfund, Volume I: Human Health Evaluation Manual, Part A. EPA/540/1-89/002. December.
8.0 REFERENCES
8-4 ES022008005PHX
U.S. Geological Survey (USGS). 2008. National Water Quality Assessment (NAWQA) Data Warehouse.
U.S. Geological Survey (USGS). 2005. Online Surface Water Data. http://nwis.waterdata.usgs.gov/az/nwis
U. S. Geological Survey (USGS). 1998. Occurrence of Selected Radionuclides in Ground Water Used for Drinking Water in the United States: A Reconnaissance Survey, 1998. Water-Resources Investigations Report No. 00-4273.
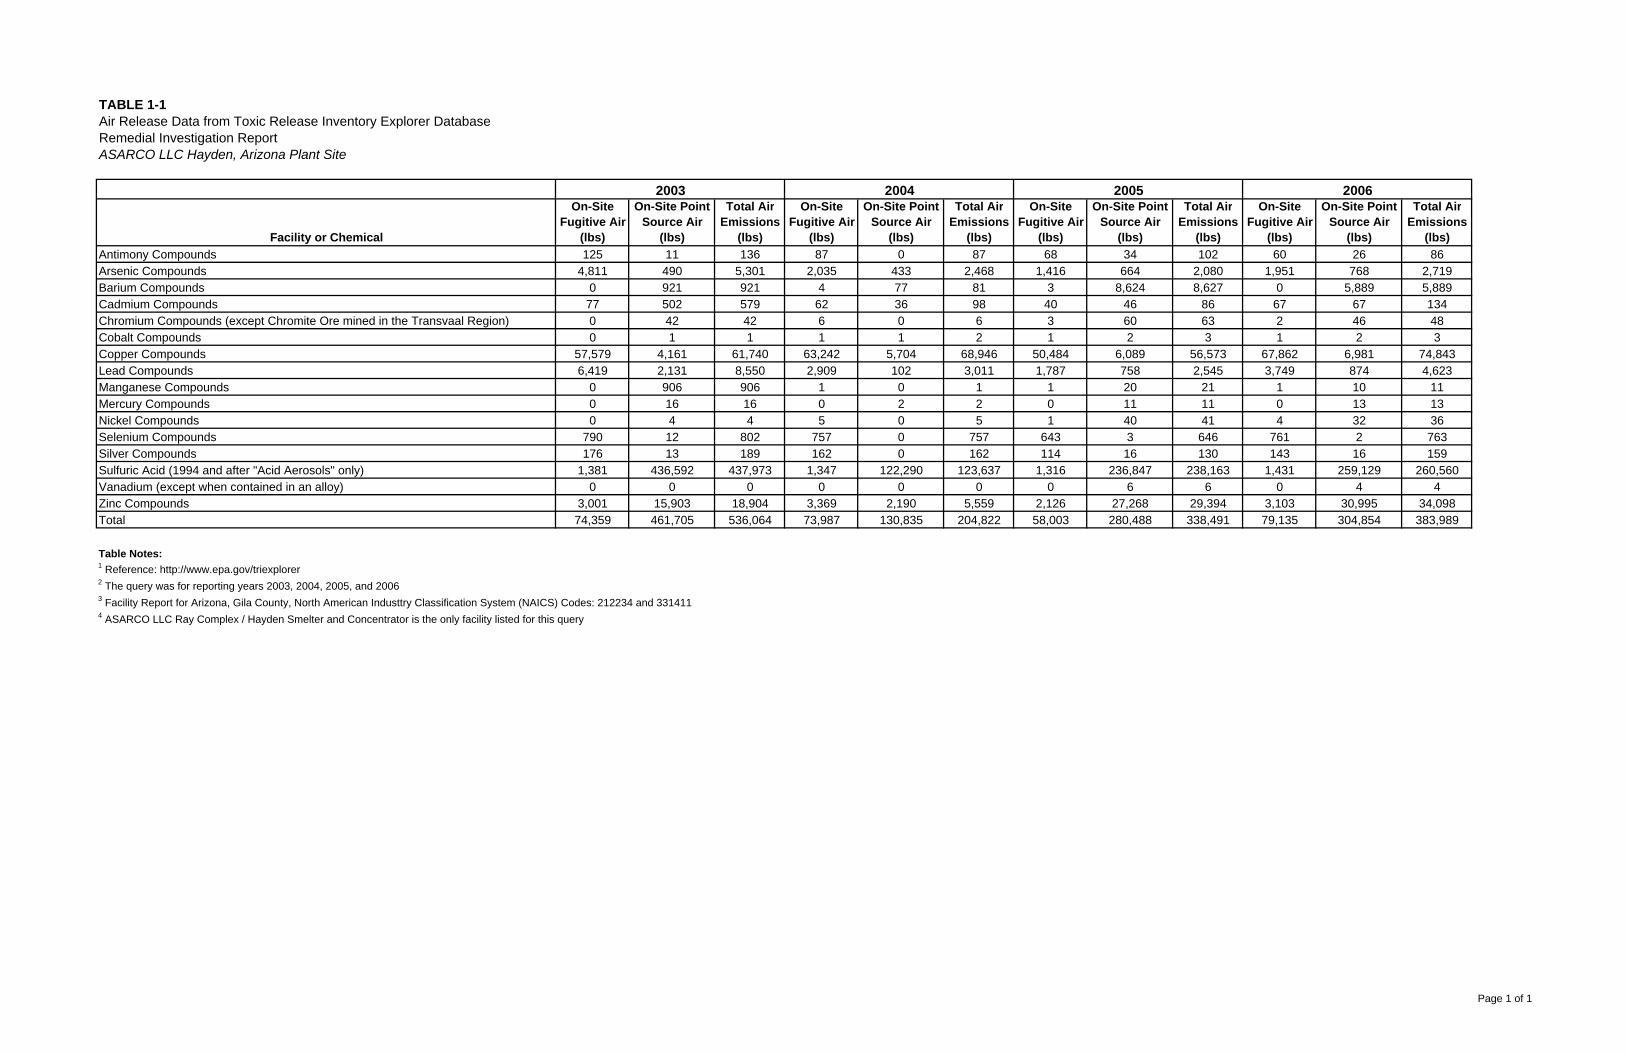
TABLE 1-1Air Release Data from Toxic Release Inventory Explorer DatabaseRemedial Investigation ReportASARCO LLC Hayden, Arizona Plant Site
Facility or Chemical
On-SiteFugitive Air
(lbs)
On-Site Point Source Air
(lbs)
Total AirEmissions
(lbs)
On-SiteFugitive Air
(lbs)
On-Site Point Source Air
(lbs)
Total AirEmissions
(lbs)
On-SiteFugitive Air
(lbs)
On-Site Point Source Air
(lbs)
Total AirEmissions
(lbs)
On-SiteFugitive Air
(lbs)
On-Site Point Source Air
(lbs)
Total AirEmissions
(lbs)Antimony Compounds 125 11 136 87 0 87 68 34 102 60 26 86Arsenic Compounds 4,811 490 5,301 2,035 433 2,468 1,416 664 2,080 1,951 768 2,719Barium Compounds 0 921 921 4 77 81 3 8,624 8,627 0 5,889 5,889Cadmium Compounds 77 502 579 62 36 98 40 46 86 67 67 134Chromium Compounds (except Chromite Ore mined in the Transvaal Region) 0 42 42 6 0 6 3 60 63 2 46 48Cobalt Compounds 0 1 1 1 1 2 1 2 3 1 2 3Copper Compounds 57,579 4,161 61,740 63,242 5,704 68,946 50,484 6,089 56,573 67,862 6,981 74,843Lead Compounds 6,419 2,131 8,550 2,909 102 3,011 1,787 758 2,545 3,749 874 4,623Manganese Compounds 0 906 906 1 0 1 1 20 21 1 10 11Mercury Compounds 0 16 16 0 2 2 0 11 11 0 13 13Nickel Compounds 0 4 4 5 0 5 1 40 41 4 32 36Selenium Compounds 790 12 802 757 0 757 643 3 646 761 2 763Silver Compounds 176 13 189 162 0 162 114 16 130 143 16 159Sulfuric Acid (1994 and after "Acid Aerosols" only) 1,381 436,592 437,973 1,347 122,290 123,637 1,316 236,847 238,163 1,431 259,129 260,560Vanadium (except when contained in an alloy) 0 0 0 0 0 0 0 6 6 0 4 4Zinc Compounds 3,001 15,903 18,904 3,369 2,190 5,559 2,126 27,268 29,394 3,103 30,995 34,098Total 74,359 461,705 536,064 73,987 130,835 204,822 58,003 280,488 338,491 79,135 304,854 383,989
Table Notes:1 Reference: http://www.epa.gov/triexplorer2 The query was for reporting years 2003, 2004, 2005, and 20063 Facility Report for Arizona, Gila County, North American Industtry Classification System (NAICS) Codes: 212234 and 3314114 ASARCO LLC Ray Complex / Hayden Smelter and Concentrator is the only facility listed for this query
2004 20052003 2006
Page 1 of 1
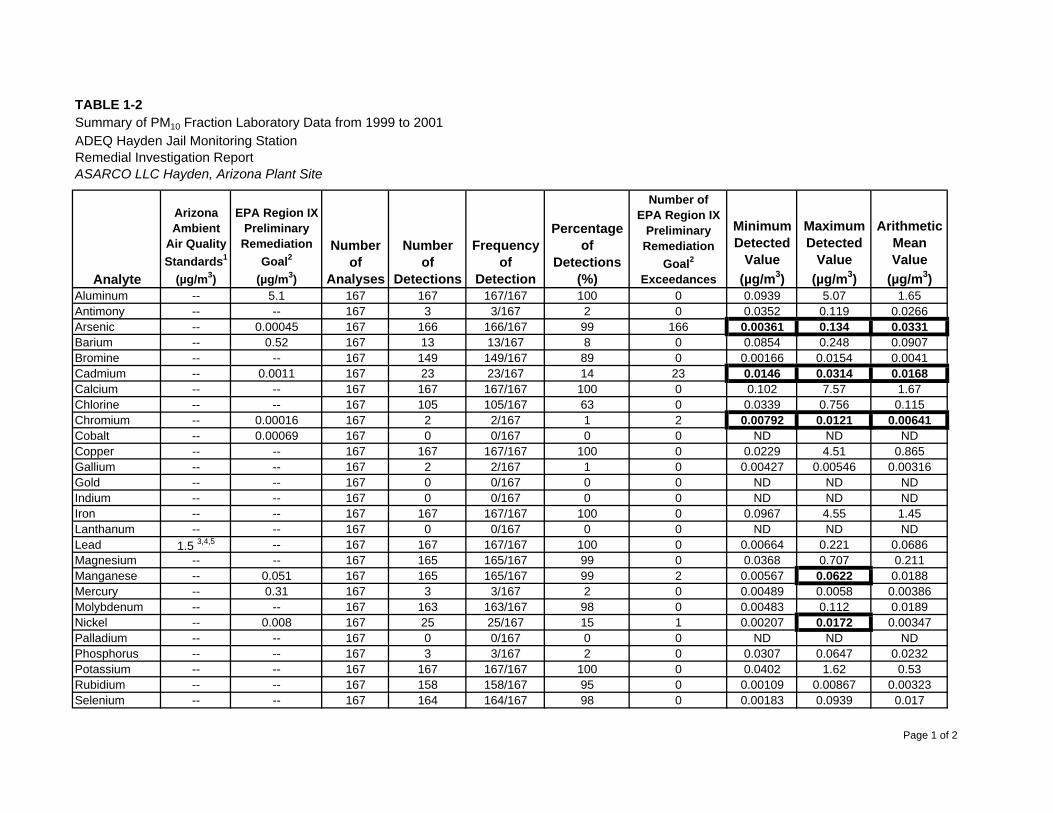
TABLE 1-2Summary of PM10 Fraction Laboratory Data from 1999 to 2001ADEQ Hayden Jail Monitoring StationRemedial Investigation ReportASARCO LLC Hayden, Arizona Plant Site
Analyte
ArizonaAmbient
Air QualityStandards1
(µg/m3)
EPA Region IXPreliminary
RemediationGoal2
(µg/m3)
Numberof
Analyses
Numberof
Detections
Frequencyof
Detection
Percentageof
Detections(%)
Number ofEPA Region IX
PreliminaryRemediation
Goal2
Exceedances
MinimumDetected
Value(µg/m3)
MaximumDetected
Value(µg/m3)
ArithmeticMeanValue
(µg/m3)Aluminum -- 5.1 167 167 167/167 100 0 0.0939 5.07 1.65Antimony -- -- 167 3 3/167 2 0 0.0352 0.119 0.0266Arsenic -- 0.00045 167 166 166/167 99 166 0.00361 0.134 0.0331Barium -- 0.52 167 13 13/167 8 0 0.0854 0.248 0.0907Bromine -- -- 167 149 149/167 89 0 0.00166 0.0154 0.0041Cadmium -- 0.0011 167 23 23/167 14 23 0.0146 0.0314 0.0168Calcium -- -- 167 167 167/167 100 0 0.102 7.57 1.67Chlorine -- -- 167 105 105/167 63 0 0.0339 0.756 0.115Chromium -- 0.00016 167 2 2/167 1 2 0.00792 0.0121 0.00641Cobalt -- 0.00069 167 0 0/167 0 0 ND ND NDCopper -- -- 167 167 167/167 100 0 0.0229 4.51 0.865Gallium -- -- 167 2 2/167 1 0 0.00427 0.00546 0.00316Gold -- -- 167 0 0/167 0 0 ND ND NDIndium -- -- 167 0 0/167 0 0 ND ND NDIron -- -- 167 167 167/167 100 0 0.0967 4.55 1.45Lanthanum -- -- 167 0 0/167 0 0 ND ND NDLead 1.5 3,4,5 -- 167 167 167/167 100 0 0.00664 0.221 0.0686Magnesium -- -- 167 165 165/167 99 0 0.0368 0.707 0.211Manganese -- 0.051 167 165 165/167 99 2 0.00567 0.0622 0.0188Mercury -- 0.31 167 3 3/167 2 0 0.00489 0.0058 0.00386Molybdenum -- -- 167 163 163/167 98 0 0.00483 0.112 0.0189Nickel -- 0.008 167 25 25/167 15 1 0.00207 0.0172 0.00347Palladium -- -- 167 0 0/167 0 0 ND ND NDPhosphorus -- -- 167 3 3/167 2 0 0.0307 0.0647 0.0232Potassium -- -- 167 167 167/167 100 0 0.0402 1.62 0.53Rubidium -- -- 167 158 158/167 95 0 0.00109 0.00867 0.00323Selenium -- -- 167 164 164/167 98 0 0.00183 0.0939 0.017
Page 1 of 2
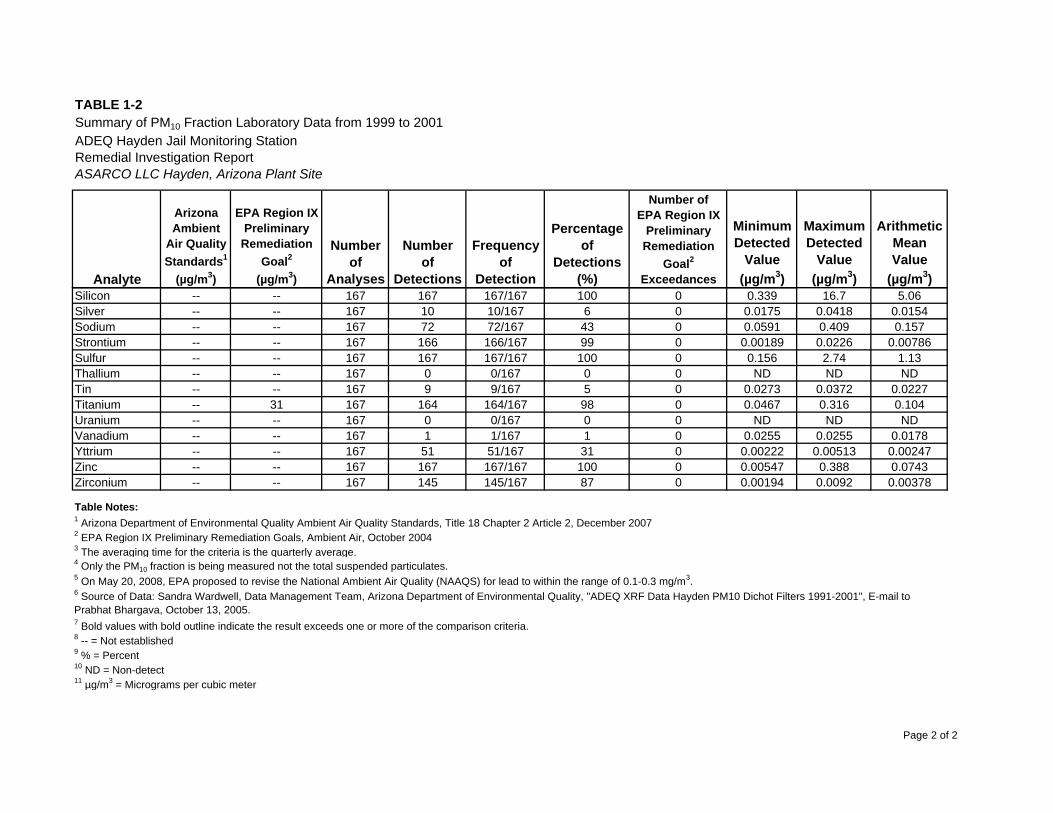
TABLE 1-2Summary of PM10 Fraction Laboratory Data from 1999 to 2001ADEQ Hayden Jail Monitoring StationRemedial Investigation ReportASARCO LLC Hayden, Arizona Plant Site
Analyte
ArizonaAmbient
Air QualityStandards1
(µg/m3)
EPA Region IXPreliminary
RemediationGoal2
(µg/m3)
Numberof
Analyses
Numberof
Detections
Frequencyof
Detection
Percentageof
Detections(%)
Number ofEPA Region IX
PreliminaryRemediation
Goal2
Exceedances
MinimumDetected
Value(µg/m3)
MaximumDetected
Value(µg/m3)
ArithmeticMeanValue
(µg/m3)Silicon -- -- 167 167 167/167 100 0 0.339 16.7 5.06Silver -- -- 167 10 10/167 6 0 0.0175 0.0418 0.0154Sodium -- -- 167 72 72/167 43 0 0.0591 0.409 0.157Strontium -- -- 167 166 166/167 99 0 0.00189 0.0226 0.00786Sulfur -- -- 167 167 167/167 100 0 0.156 2.74 1.13Thallium -- -- 167 0 0/167 0 0 ND ND NDTin -- -- 167 9 9/167 5 0 0.0273 0.0372 0.0227Titanium -- 31 167 164 164/167 98 0 0.0467 0.316 0.104Uranium -- -- 167 0 0/167 0 0 ND ND NDVanadium -- -- 167 1 1/167 1 0 0.0255 0.0255 0.0178Yttrium -- -- 167 51 51/167 31 0 0.00222 0.00513 0.00247Zinc -- -- 167 167 167/167 100 0 0.00547 0.388 0.0743Zirconium -- -- 167 145 145/167 87 0 0.00194 0.0092 0.00378
1 Arizona Department of Environmental Quality Ambient Air Quality Standards, Title 18 Chapter 2 Article 2, December 20072 EPA Region IX Preliminary Remediation Goals, Ambient Air, October 20043 The averaging time for the criteria is the quarterly average.4 Only the PM10 fraction is being measured not the total suspended particulates.5 On May 20, 2008, EPA proposed to revise the National Ambient Air Quality (NAAQS) for lead to within the range of 0.1-0.3 mg/m3.
7 Bold values with bold outline indicate the result exceeds one or more of the comparison criteria.8 -- = Not established9 % = Percent10 ND = Non-detect11 µg/m3 = Micrograms per cubic meter
Table Notes:
6 Source of Data: Sandra Wardwell, Data Management Team, Arizona Department of Environmental Quality, "ADEQ XRF Data Hayden PM10 Dichot Filters 1991-2001", E-mail to Prabhat Bhargava, October 13, 2005.
Page 2 of 2
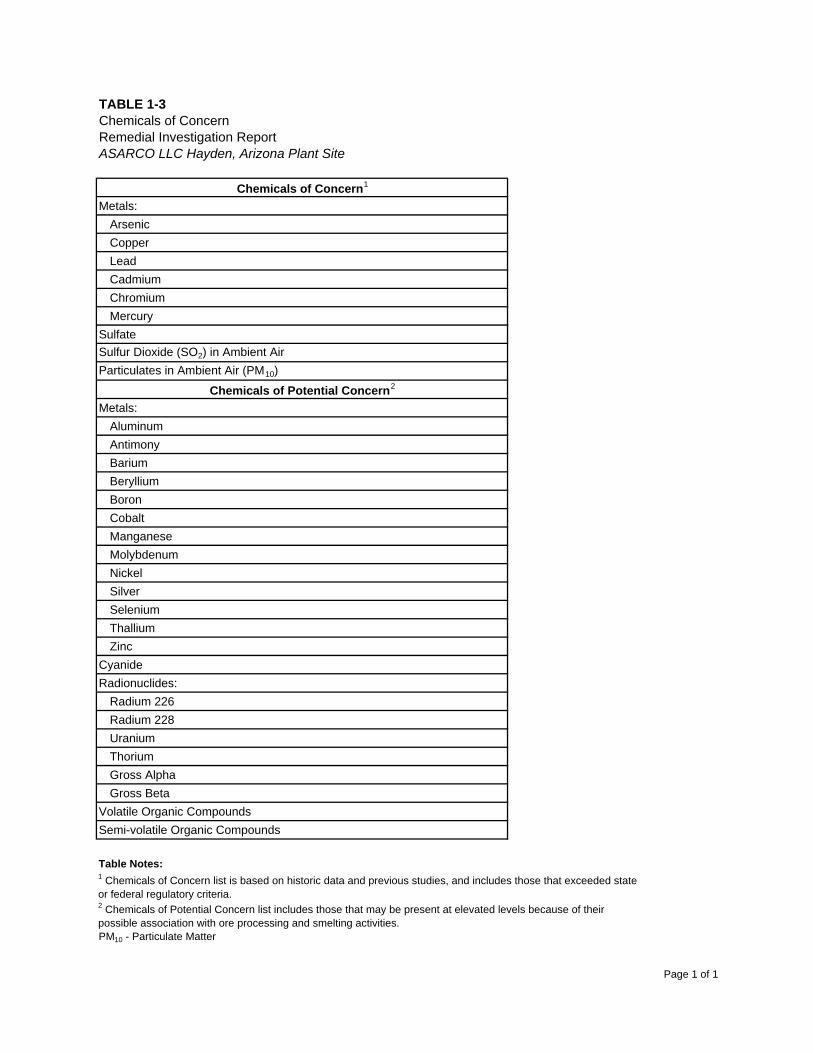
TABLE 1-3Chemicals of ConcernRemedial Investigation ReportASARCO LLC Hayden, Arizona Plant Site
Chemicals of Concern1
Metals:ArsenicCopperLeadCadmiumChromiumMercury
SulfateSulfur Dioxide (SO2) in Ambient AirParticulates in Ambient Air (PM10)
Chemicals of Potential Concern2
Metals:AluminumAntimonyBariumBerylliumBoronCobaltManganeseMolybdenumNickelSilverSeleniumThalliumZinc
CyanideRadionuclides:
Radium 226Radium 228UraniumThoriumGross AlphaGross Beta
Volatile Organic CompoundsSemi-volatile Organic Compounds
Table Notes:
PM10 - Particulate Matter
1 Chemicals of Concern list is based on historic data and previous studies, and includes those that exceeded state or federal regulatory criteria.2 Chemicals of Potential Concern list includes those that may be present at elevated levels because of their possible association with ore processing and smelting activities.
Page 1 of 1
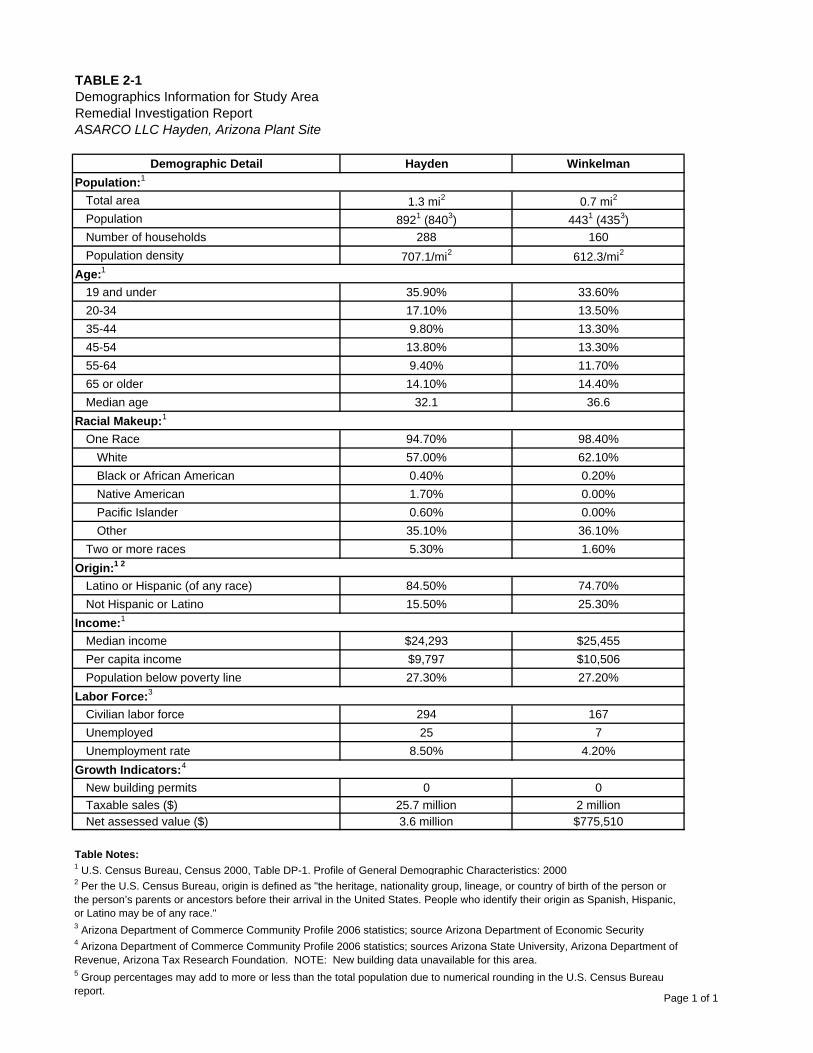
TABLE 2-1Demographics Information for Study AreaRemedial Investigation ReportASARCO LLC Hayden, Arizona Plant Site
Demographic Detail Hayden Winkelman
Total area 1.3 mi2 0.7 mi2
Population 8921 (8403) 4431 (4353)Number of households 288 160Population density 707.1/mi2 612.3/mi2
19 and under 35.90% 33.60%20-34 17.10% 13.50%35-44 9.80% 13.30%45-54 13.80% 13.30%55-64 9.40% 11.70%65 or older 14.10% 14.40%Median age 32.1 36.6
One Race 94.70% 98.40%White 57.00% 62.10%Black or African American 0.40% 0.20%Native American 1.70% 0.00%Pacific Islander 0.60% 0.00%Other 35.10% 36.10%
Two or more races 5.30% 1.60%
Latino or Hispanic (of any race) 84.50% 74.70%Not Hispanic or Latino 15.50% 25.30%
Median income $24,293 $25,455Per capita income $9,797 $10,506Population below poverty line 27.30% 27.20%
Civilian labor force 294 167Unemployed 25 7Unemployment rate 8.50% 4.20%
New building permits 0 0Taxable sales ($) 25.7 million 2 millionNet assessed value ($) 3.6 million $775,510
Table Notes:1 U.S. Census Bureau, Census 2000, Table DP-1. Profile of General Demographic Characteristics: 20002 Per the U.S. Census Bureau, origin is defined as "the heritage, nationality group, lineage, or country of birth of the person or the person’s parents or ancestors before their arrival in the United States. People who identify their origin as Spanish, Hispanic, or Latino may be of any race."3 Arizona Department of Commerce Community Profile 2006 statistics; source Arizona Department of Economic Security4 Arizona Department of Commerce Community Profile 2006 statistics; sources Arizona State University, Arizona Department of Revenue, Arizona Tax Research Foundation. NOTE: New building data unavailable for this area.5 Group percentages may add to more or less than the total population due to numerical rounding in the U.S. Census Bureau report.
Population:1
Age:1
Racial Makeup:1
Income:1
Labor Force:3
Growth Indicators:4
Origin:1 2
Page 1 of 1
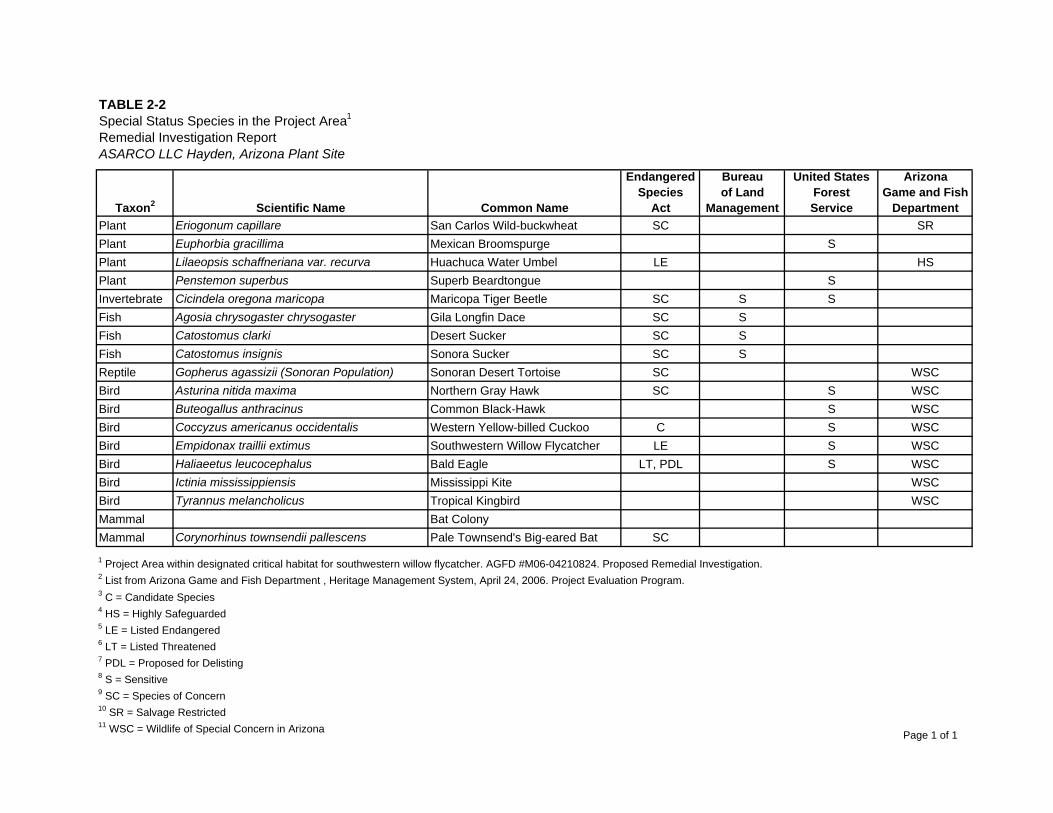
TABLE 2-2
Taxon2 Scientific Name Common Name
EndangeredSpecies
Act
Bureauof Land
Management
United StatesForestService
ArizonaGame and Fish
DepartmentPlant Eriogonum capillare San Carlos Wild-buckwheat SC SRPlant Euphorbia gracillima Mexican Broomspurge SPlant Lilaeopsis schaffneriana var. recurva Huachuca Water Umbel LE HSPlant Penstemon superbus Superb Beardtongue SInvertebrate Cicindela oregona maricopa Maricopa Tiger Beetle SC S SFish Agosia chrysogaster chrysogaster Gila Longfin Dace SC SFish Catostomus clarki Desert Sucker SC SFish Catostomus insignis Sonora Sucker SC SReptile Gopherus agassizii (Sonoran Population) Sonoran Desert Tortoise SC WSCBird Asturina nitida maxima Northern Gray Hawk SC S WSCBird Buteogallus anthracinus Common Black-Hawk S WSCBird Coccyzus americanus occidentalis Western Yellow-billed Cuckoo C S WSCBird Empidonax traillii extimus Southwestern Willow Flycatcher LE S WSCBird Haliaeetus leucocephalus Bald Eagle LT, PDL S WSCBird Ictinia mississippiensis Mississippi Kite WSCBird Tyrannus melancholicus Tropical Kingbird WSCMammal Bat ColonyMammal Corynorhinus townsendii pallescens Pale Townsend's Big-eared Bat SC
3 C = Candidate Species4 HS = Highly Safeguarded5 LE = Listed Endangered6 LT = Listed Threatened7 PDL = Proposed for Delisting8 S = Sensitive9 SC = Species of Concern10 SR = Salvage Restricted11 WSC = Wildlife of Special Concern in Arizona
Special Status Species in the Project Area1
ASARCO LLC Hayden, Arizona Plant SiteRemedial Investigation Report
2 List from Arizona Game and Fish Department , Heritage Management System, April 24, 2006. Project Evaluation Program.
1 Project Area within designated critical habitat for southwestern willow flycatcher. AGFD #M06-04210824. Proposed Remedial Investigation.
Page 1 of 1
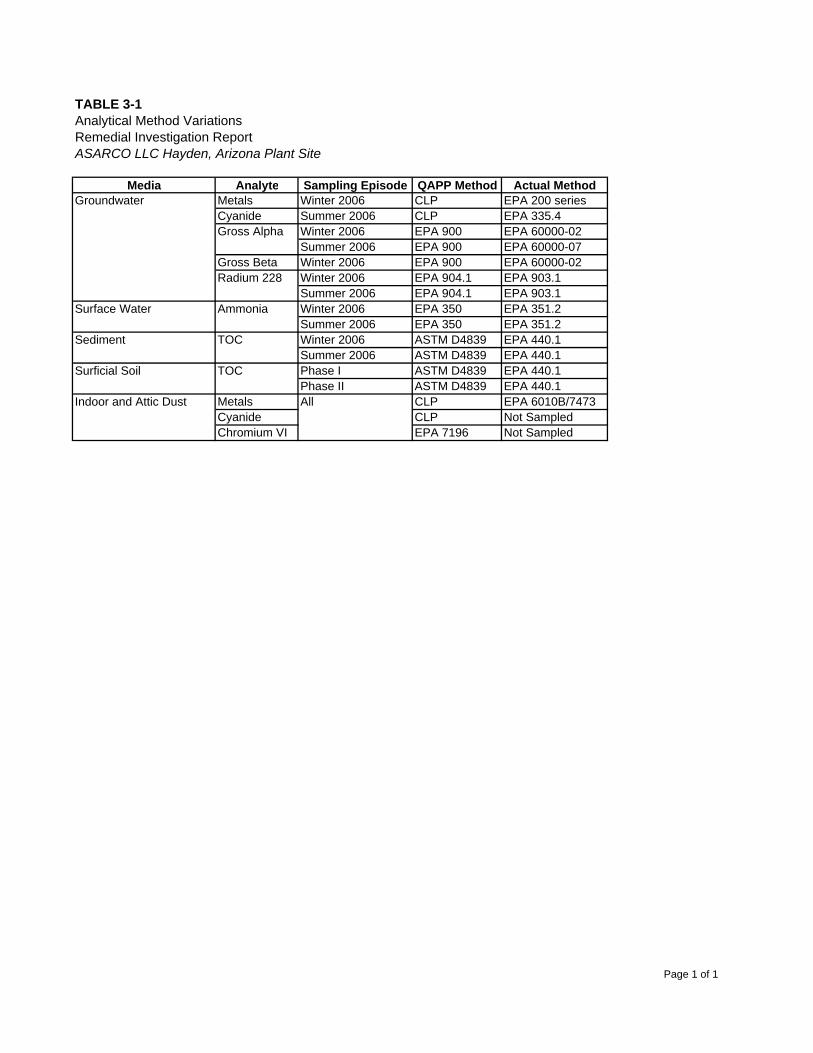
TABLE 3-1Analytical Method VariationsRemedial Investigation Report
Media Analyte Sampling Episode QAPP Method Actual MethodMetals Winter 2006 CLP EPA 200 seriesCyanide Summer 2006 CLP EPA 335.4
Winter 2006 EPA 900 EPA 60000-02Summer 2006 EPA 900 EPA 60000-07
Gross Beta Winter 2006 EPA 900 EPA 60000-02Winter 2006 EPA 904.1 EPA 903.1Summer 2006 EPA 904.1 EPA 903.1Winter 2006 EPA 350 EPA 351.2Summer 2006 EPA 350 EPA 351.2Winter 2006 ASTM D4839 EPA 440.1Summer 2006 ASTM D4839 EPA 440.1Phase I ASTM D4839 EPA 440.1Phase II ASTM D4839 EPA 440.1
Metals CLP EPA 6010B/7473Cyanide CLP Not SampledChromium VI EPA 7196 Not Sampled
TOC
Gross Alpha
Radium 228
All
ASARCO LLC Hayden, Arizona Plant Site
Surficial Soil TOC
Indoor and Attic Dust
Groundwater
Surface Water Ammonia
Sediment
Page 1 of 1
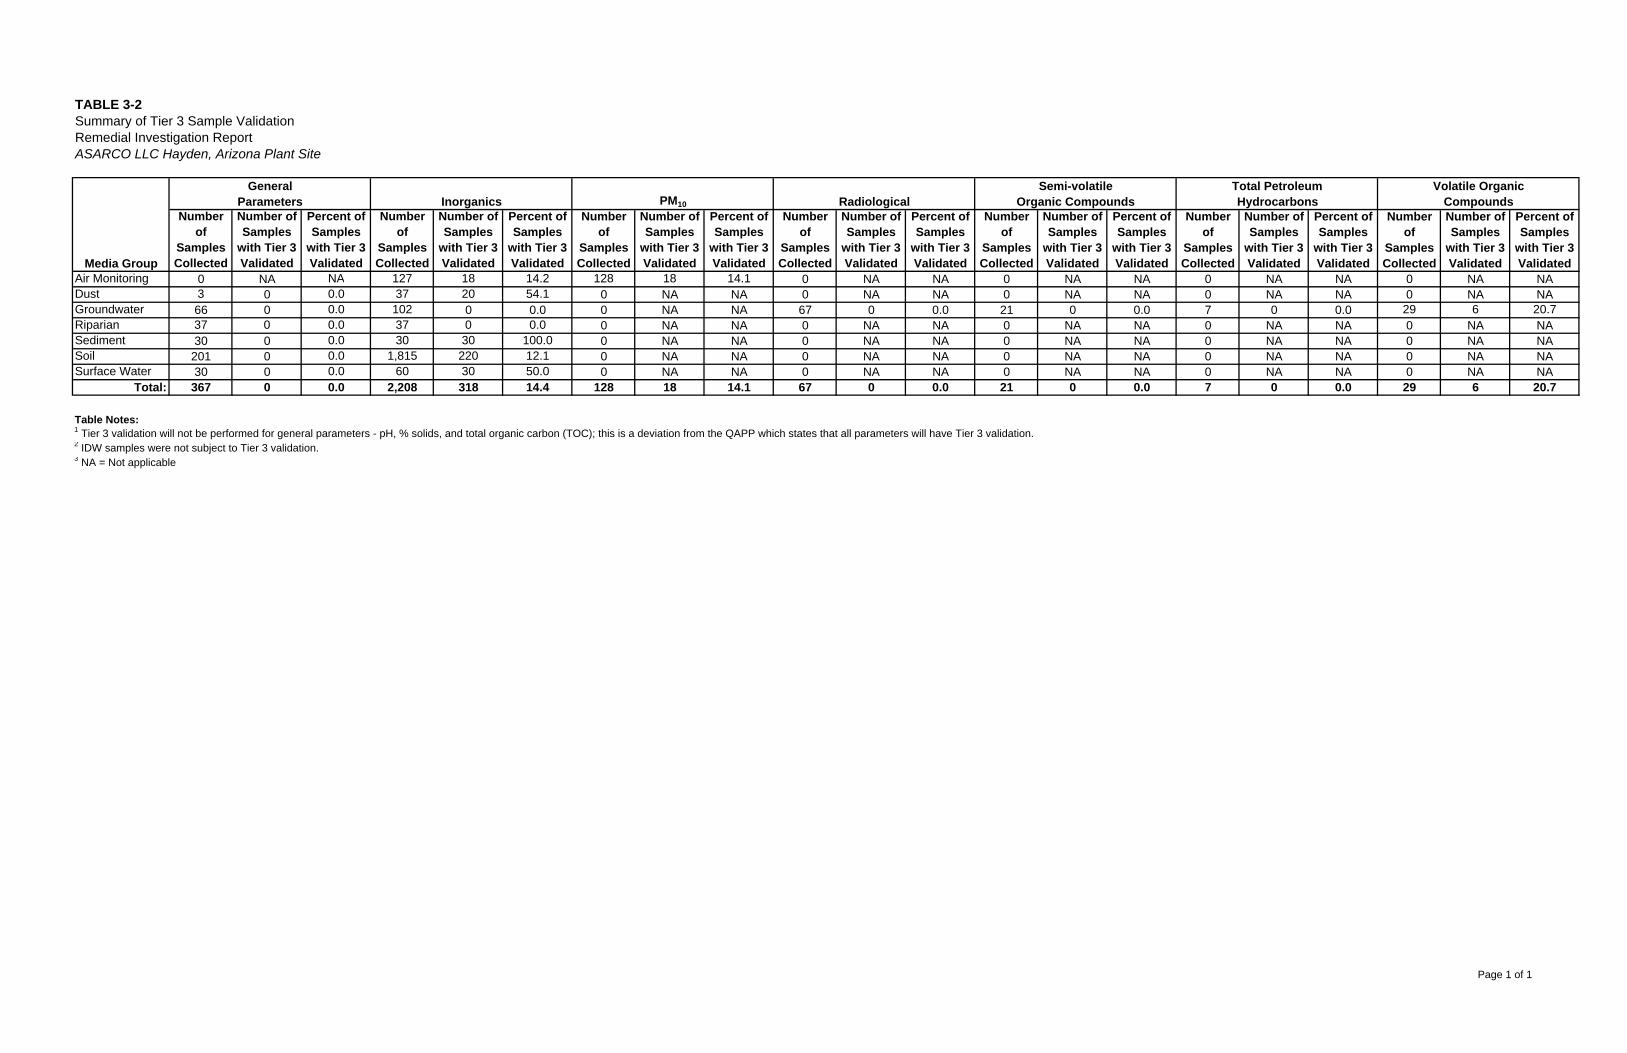
TABLE 3-2Summary of Tier 3 Sample ValidationRemedial Investigation Report
Numberof
SamplesCollected
Number ofSamples
with Tier 3Validated
Percent ofSamples
with Tier 3Validated
Numberof
SamplesCollected
Number ofSamples
with Tier 3Validated
Percent ofSamples
with Tier 3Validated
Numberof
SamplesCollected
Number ofSamples
with Tier 3Validated
Percent ofSamples
with Tier 3Validated
Numberof
SamplesCollected
Number ofSamples
with Tier 3Validated
Percent ofSamples
with Tier 3Validated
Numberof
SamplesCollected
Number ofSamples
with Tier 3Validated
Percent ofSamples
with Tier 3Validated
Numberof
SamplesCollected
Number ofSamples
with Tier 3Validated
Percent ofSamples
with Tier 3Validated
Numberof
SamplesCollected
Number ofSamples
with Tier 3Validated
Percent ofSamples
with Tier 3Validated
Air Monitoring 0 NA NA 127 18 14.2 128 18 14.1 0 NA NA 0 NA NA 0 NA NA 0 NA NADust 3 0 0.0 37 20 54.1 0 NA NA 0 NA NA 0 NA NA 0 NA NA 0 NA NAGroundwater 66 0 0.0 102 0 0.0 0 NA NA 67 0 0.0 21 0 0.0 7 0 0.0 29 6 20.7Riparian 37 0 0.0 37 0 0.0 0 NA NA 0 NA NA 0 NA NA 0 NA NA 0 NA NASediment 30 0 0.0 30 30 100.0 0 NA NA 0 NA NA 0 NA NA 0 NA NA 0 NA NASoil 201 0 0.0 1,815 220 12.1 0 NA NA 0 NA NA 0 NA NA 0 NA NA 0 NA NASurface Water 30 0 0.0 60 30 50.0 0 NA NA 0 NA NA 0 NA NA 0 NA NA 0 NA NA
Total: 367 0 0.0 2,208 318 14.4 128 18 14.1 67 0 0.0 21 0 0.0 7 0 0.0 29 6 20.7
Table Notes:1 Tier 3 validation will not be performed for general parameters - pH, % solids, and total organic carbon (TOC); this is a deviation from the QAPP which states that all parameters will have Tier 3 validation.2 IDW samples were not subject to Tier 3 validation.3 NA = Not applicable
ASARCO LLC Hayden, Arizona Plant Site
Volatile Organic Compounds
Total Petroleum Hydrocarbons
Semi-volatile Organic CompoundsRadiologicalPM10Inorganics
GeneralParameters
Media Group
Page 1 of 1
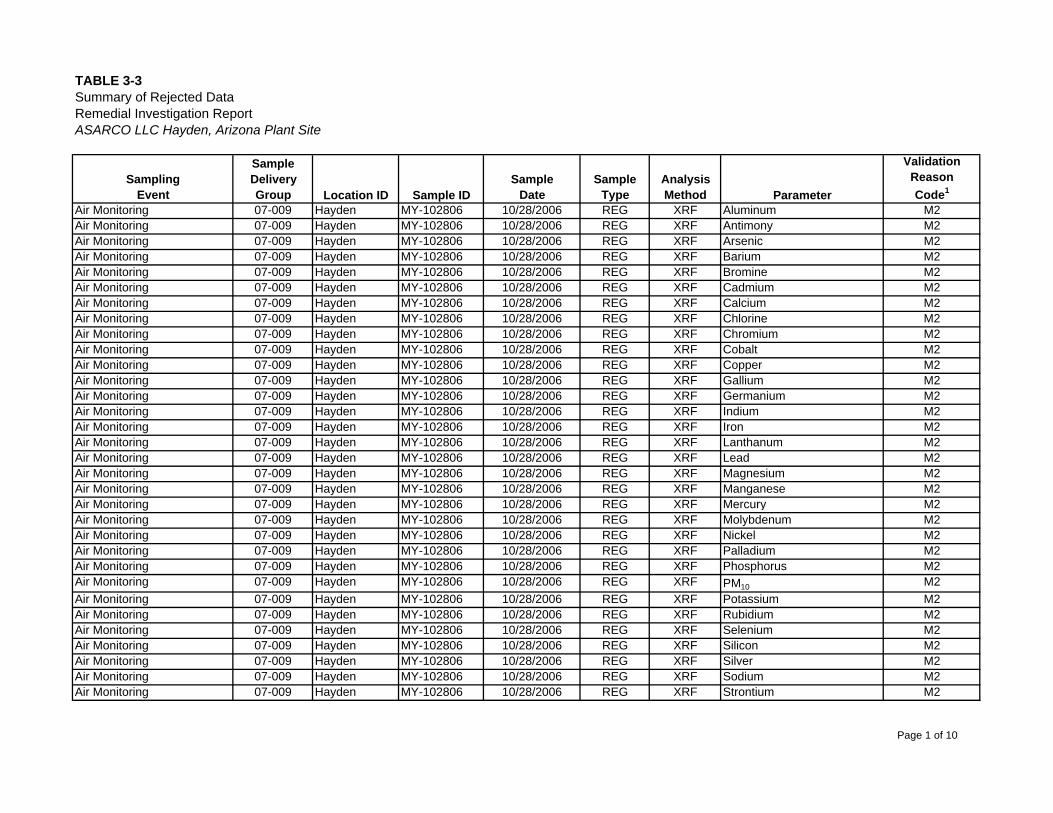
TABLE 3-3Summary of Rejected DataRemedial Investigation ReportASARCO LLC Hayden, Arizona Plant Site
SamplingEvent
SampleDeliveryGroup Location ID Sample ID
SampleDate
SampleType
AnalysisMethod Parameter
ValidationReasonCode1
Air Monitoring 07-009 Hayden MY-102806 10/28/2006 REG XRF Aluminum M2Air Monitoring 07-009 Hayden MY-102806 10/28/2006 REG XRF Antimony M2Air Monitoring 07-009 Hayden MY-102806 10/28/2006 REG XRF Arsenic M2Air Monitoring 07-009 Hayden MY-102806 10/28/2006 REG XRF Barium M2Air Monitoring 07-009 Hayden MY-102806 10/28/2006 REG XRF Bromine M2Air Monitoring 07-009 Hayden MY-102806 10/28/2006 REG XRF Cadmium M2Air Monitoring 07-009 Hayden MY-102806 10/28/2006 REG XRF Calcium M2Air Monitoring 07-009 Hayden MY-102806 10/28/2006 REG XRF Chlorine M2Air Monitoring 07-009 Hayden MY-102806 10/28/2006 REG XRF Chromium M2Air Monitoring 07-009 Hayden MY-102806 10/28/2006 REG XRF Cobalt M2Air Monitoring 07-009 Hayden MY-102806 10/28/2006 REG XRF Copper M2Air Monitoring 07-009 Hayden MY-102806 10/28/2006 REG XRF Gallium M2Air Monitoring 07-009 Hayden MY-102806 10/28/2006 REG XRF Germanium M2Air Monitoring 07-009 Hayden MY-102806 10/28/2006 REG XRF Indium M2Air Monitoring 07-009 Hayden MY-102806 10/28/2006 REG XRF Iron M2Air Monitoring 07-009 Hayden MY-102806 10/28/2006 REG XRF Lanthanum M2Air Monitoring 07-009 Hayden MY-102806 10/28/2006 REG XRF Lead M2Air Monitoring 07-009 Hayden MY-102806 10/28/2006 REG XRF Magnesium M2Air Monitoring 07-009 Hayden MY-102806 10/28/2006 REG XRF Manganese M2Air Monitoring 07-009 Hayden MY-102806 10/28/2006 REG XRF Mercury M2Air Monitoring 07-009 Hayden MY-102806 10/28/2006 REG XRF Molybdenum M2Air Monitoring 07-009 Hayden MY-102806 10/28/2006 REG XRF Nickel M2Air Monitoring 07-009 Hayden MY-102806 10/28/2006 REG XRF Palladium M2Air Monitoring 07-009 Hayden MY-102806 10/28/2006 REG XRF Phosphorus M2Air Monitoring 07-009 Hayden MY-102806 10/28/2006 REG XRF PM10 M2Air Monitoring 07-009 Hayden MY-102806 10/28/2006 REG XRF Potassium M2Air Monitoring 07-009 Hayden MY-102806 10/28/2006 REG XRF Rubidium M2Air Monitoring 07-009 Hayden MY-102806 10/28/2006 REG XRF Selenium M2Air Monitoring 07-009 Hayden MY-102806 10/28/2006 REG XRF Silicon M2Air Monitoring 07-009 Hayden MY-102806 10/28/2006 REG XRF Silver M2Air Monitoring 07-009 Hayden MY-102806 10/28/2006 REG XRF Sodium M2Air Monitoring 07-009 Hayden MY-102806 10/28/2006 REG XRF Strontium M2
Page 1 of 10
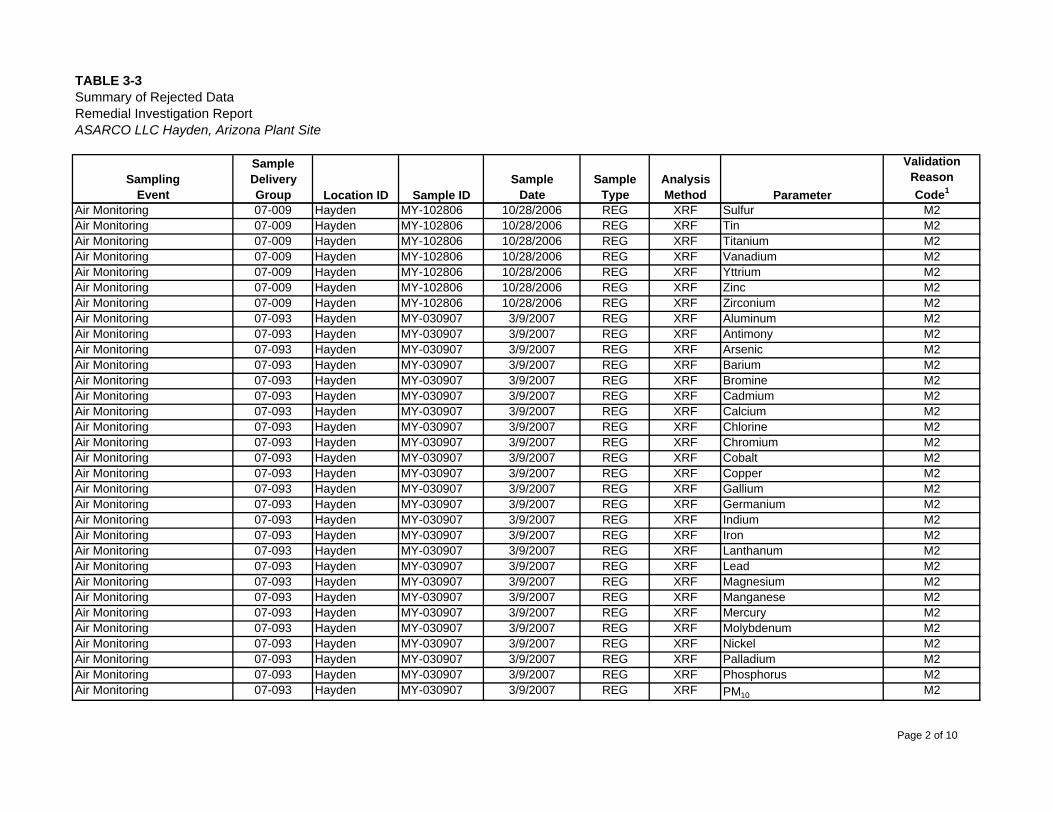
TABLE 3-3Summary of Rejected DataRemedial Investigation ReportASARCO LLC Hayden, Arizona Plant Site
SamplingEvent
SampleDeliveryGroup Location ID Sample ID
SampleDate
SampleType
AnalysisMethod Parameter
ValidationReasonCode1
Air Monitoring 07-009 Hayden MY-102806 10/28/2006 REG XRF Sulfur M2Air Monitoring 07-009 Hayden MY-102806 10/28/2006 REG XRF Tin M2Air Monitoring 07-009 Hayden MY-102806 10/28/2006 REG XRF Titanium M2Air Monitoring 07-009 Hayden MY-102806 10/28/2006 REG XRF Vanadium M2Air Monitoring 07-009 Hayden MY-102806 10/28/2006 REG XRF Yttrium M2Air Monitoring 07-009 Hayden MY-102806 10/28/2006 REG XRF Zinc M2Air Monitoring 07-009 Hayden MY-102806 10/28/2006 REG XRF Zirconium M2Air Monitoring 07-093 Hayden MY-030907 3/9/2007 REG XRF Aluminum M2Air Monitoring 07-093 Hayden MY-030907 3/9/2007 REG XRF Antimony M2Air Monitoring 07-093 Hayden MY-030907 3/9/2007 REG XRF Arsenic M2Air Monitoring 07-093 Hayden MY-030907 3/9/2007 REG XRF Barium M2Air Monitoring 07-093 Hayden MY-030907 3/9/2007 REG XRF Bromine M2Air Monitoring 07-093 Hayden MY-030907 3/9/2007 REG XRF Cadmium M2Air Monitoring 07-093 Hayden MY-030907 3/9/2007 REG XRF Calcium M2Air Monitoring 07-093 Hayden MY-030907 3/9/2007 REG XRF Chlorine M2Air Monitoring 07-093 Hayden MY-030907 3/9/2007 REG XRF Chromium M2Air Monitoring 07-093 Hayden MY-030907 3/9/2007 REG XRF Cobalt M2Air Monitoring 07-093 Hayden MY-030907 3/9/2007 REG XRF Copper M2Air Monitoring 07-093 Hayden MY-030907 3/9/2007 REG XRF Gallium M2Air Monitoring 07-093 Hayden MY-030907 3/9/2007 REG XRF Germanium M2Air Monitoring 07-093 Hayden MY-030907 3/9/2007 REG XRF Indium M2Air Monitoring 07-093 Hayden MY-030907 3/9/2007 REG XRF Iron M2Air Monitoring 07-093 Hayden MY-030907 3/9/2007 REG XRF Lanthanum M2Air Monitoring 07-093 Hayden MY-030907 3/9/2007 REG XRF Lead M2Air Monitoring 07-093 Hayden MY-030907 3/9/2007 REG XRF Magnesium M2Air Monitoring 07-093 Hayden MY-030907 3/9/2007 REG XRF Manganese M2Air Monitoring 07-093 Hayden MY-030907 3/9/2007 REG XRF Mercury M2Air Monitoring 07-093 Hayden MY-030907 3/9/2007 REG XRF Molybdenum M2Air Monitoring 07-093 Hayden MY-030907 3/9/2007 REG XRF Nickel M2Air Monitoring 07-093 Hayden MY-030907 3/9/2007 REG XRF Palladium M2Air Monitoring 07-093 Hayden MY-030907 3/9/2007 REG XRF Phosphorus M2Air Monitoring 07-093 Hayden MY-030907 3/9/2007 REG XRF PM10 M2
Page 2 of 10
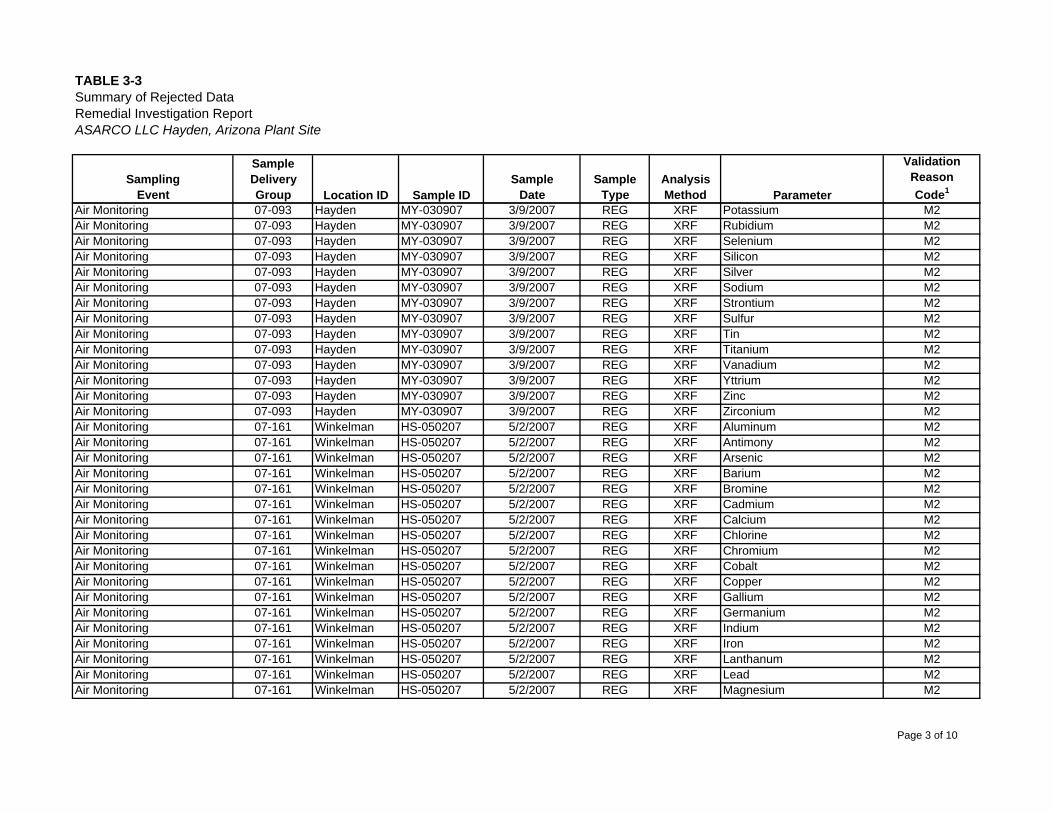
TABLE 3-3Summary of Rejected DataRemedial Investigation ReportASARCO LLC Hayden, Arizona Plant Site
SamplingEvent
SampleDeliveryGroup Location ID Sample ID
SampleDate
SampleType
AnalysisMethod Parameter
ValidationReasonCode1
Air Monitoring 07-093 Hayden MY-030907 3/9/2007 REG XRF Potassium M2Air Monitoring 07-093 Hayden MY-030907 3/9/2007 REG XRF Rubidium M2Air Monitoring 07-093 Hayden MY-030907 3/9/2007 REG XRF Selenium M2Air Monitoring 07-093 Hayden MY-030907 3/9/2007 REG XRF Silicon M2Air Monitoring 07-093 Hayden MY-030907 3/9/2007 REG XRF Silver M2Air Monitoring 07-093 Hayden MY-030907 3/9/2007 REG XRF Sodium M2Air Monitoring 07-093 Hayden MY-030907 3/9/2007 REG XRF Strontium M2Air Monitoring 07-093 Hayden MY-030907 3/9/2007 REG XRF Sulfur M2Air Monitoring 07-093 Hayden MY-030907 3/9/2007 REG XRF Tin M2Air Monitoring 07-093 Hayden MY-030907 3/9/2007 REG XRF Titanium M2Air Monitoring 07-093 Hayden MY-030907 3/9/2007 REG XRF Vanadium M2Air Monitoring 07-093 Hayden MY-030907 3/9/2007 REG XRF Yttrium M2Air Monitoring 07-093 Hayden MY-030907 3/9/2007 REG XRF Zinc M2Air Monitoring 07-093 Hayden MY-030907 3/9/2007 REG XRF Zirconium M2Air Monitoring 07-161 Winkelman HS-050207 5/2/2007 REG XRF Aluminum M2Air Monitoring 07-161 Winkelman HS-050207 5/2/2007 REG XRF Antimony M2Air Monitoring 07-161 Winkelman HS-050207 5/2/2007 REG XRF Arsenic M2Air Monitoring 07-161 Winkelman HS-050207 5/2/2007 REG XRF Barium M2Air Monitoring 07-161 Winkelman HS-050207 5/2/2007 REG XRF Bromine M2Air Monitoring 07-161 Winkelman HS-050207 5/2/2007 REG XRF Cadmium M2Air Monitoring 07-161 Winkelman HS-050207 5/2/2007 REG XRF Calcium M2Air Monitoring 07-161 Winkelman HS-050207 5/2/2007 REG XRF Chlorine M2Air Monitoring 07-161 Winkelman HS-050207 5/2/2007 REG XRF Chromium M2Air Monitoring 07-161 Winkelman HS-050207 5/2/2007 REG XRF Cobalt M2Air Monitoring 07-161 Winkelman HS-050207 5/2/2007 REG XRF Copper M2Air Monitoring 07-161 Winkelman HS-050207 5/2/2007 REG XRF Gallium M2Air Monitoring 07-161 Winkelman HS-050207 5/2/2007 REG XRF Germanium M2Air Monitoring 07-161 Winkelman HS-050207 5/2/2007 REG XRF Indium M2Air Monitoring 07-161 Winkelman HS-050207 5/2/2007 REG XRF Iron M2Air Monitoring 07-161 Winkelman HS-050207 5/2/2007 REG XRF Lanthanum M2Air Monitoring 07-161 Winkelman HS-050207 5/2/2007 REG XRF Lead M2Air Monitoring 07-161 Winkelman HS-050207 5/2/2007 REG XRF Magnesium M2
Page 3 of 10
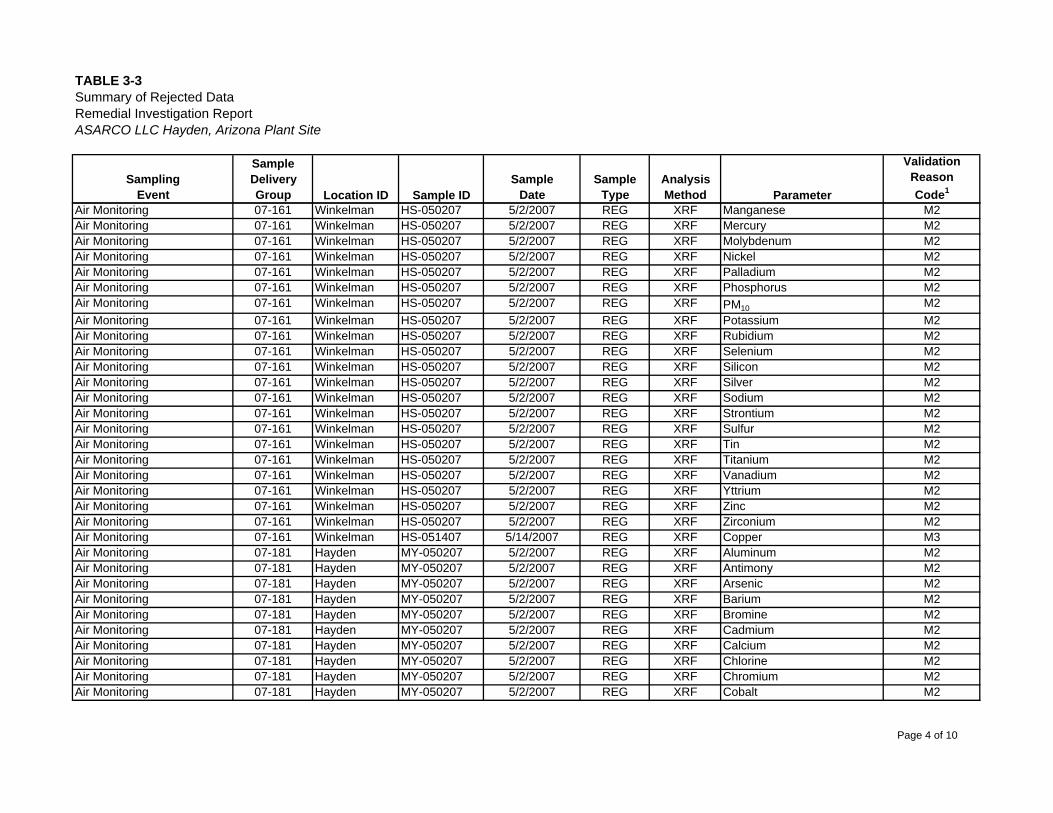
TABLE 3-3Summary of Rejected DataRemedial Investigation ReportASARCO LLC Hayden, Arizona Plant Site
SamplingEvent
SampleDeliveryGroup Location ID Sample ID
SampleDate
SampleType
AnalysisMethod Parameter
ValidationReasonCode1
Air Monitoring 07-161 Winkelman HS-050207 5/2/2007 REG XRF Manganese M2Air Monitoring 07-161 Winkelman HS-050207 5/2/2007 REG XRF Mercury M2Air Monitoring 07-161 Winkelman HS-050207 5/2/2007 REG XRF Molybdenum M2Air Monitoring 07-161 Winkelman HS-050207 5/2/2007 REG XRF Nickel M2Air Monitoring 07-161 Winkelman HS-050207 5/2/2007 REG XRF Palladium M2Air Monitoring 07-161 Winkelman HS-050207 5/2/2007 REG XRF Phosphorus M2Air Monitoring 07-161 Winkelman HS-050207 5/2/2007 REG XRF PM10 M2Air Monitoring 07-161 Winkelman HS-050207 5/2/2007 REG XRF Potassium M2Air Monitoring 07-161 Winkelman HS-050207 5/2/2007 REG XRF Rubidium M2Air Monitoring 07-161 Winkelman HS-050207 5/2/2007 REG XRF Selenium M2Air Monitoring 07-161 Winkelman HS-050207 5/2/2007 REG XRF Silicon M2Air Monitoring 07-161 Winkelman HS-050207 5/2/2007 REG XRF Silver M2Air Monitoring 07-161 Winkelman HS-050207 5/2/2007 REG XRF Sodium M2Air Monitoring 07-161 Winkelman HS-050207 5/2/2007 REG XRF Strontium M2Air Monitoring 07-161 Winkelman HS-050207 5/2/2007 REG XRF Sulfur M2Air Monitoring 07-161 Winkelman HS-050207 5/2/2007 REG XRF Tin M2Air Monitoring 07-161 Winkelman HS-050207 5/2/2007 REG XRF Titanium M2Air Monitoring 07-161 Winkelman HS-050207 5/2/2007 REG XRF Vanadium M2Air Monitoring 07-161 Winkelman HS-050207 5/2/2007 REG XRF Yttrium M2Air Monitoring 07-161 Winkelman HS-050207 5/2/2007 REG XRF Zinc M2Air Monitoring 07-161 Winkelman HS-050207 5/2/2007 REG XRF Zirconium M2Air Monitoring 07-161 Winkelman HS-051407 5/14/2007 REG XRF Copper M3Air Monitoring 07-181 Hayden MY-050207 5/2/2007 REG XRF Aluminum M2Air Monitoring 07-181 Hayden MY-050207 5/2/2007 REG XRF Antimony M2Air Monitoring 07-181 Hayden MY-050207 5/2/2007 REG XRF Arsenic M2Air Monitoring 07-181 Hayden MY-050207 5/2/2007 REG XRF Barium M2Air Monitoring 07-181 Hayden MY-050207 5/2/2007 REG XRF Bromine M2Air Monitoring 07-181 Hayden MY-050207 5/2/2007 REG XRF Cadmium M2Air Monitoring 07-181 Hayden MY-050207 5/2/2007 REG XRF Calcium M2Air Monitoring 07-181 Hayden MY-050207 5/2/2007 REG XRF Chlorine M2Air Monitoring 07-181 Hayden MY-050207 5/2/2007 REG XRF Chromium M2Air Monitoring 07-181 Hayden MY-050207 5/2/2007 REG XRF Cobalt M2
Page 4 of 10
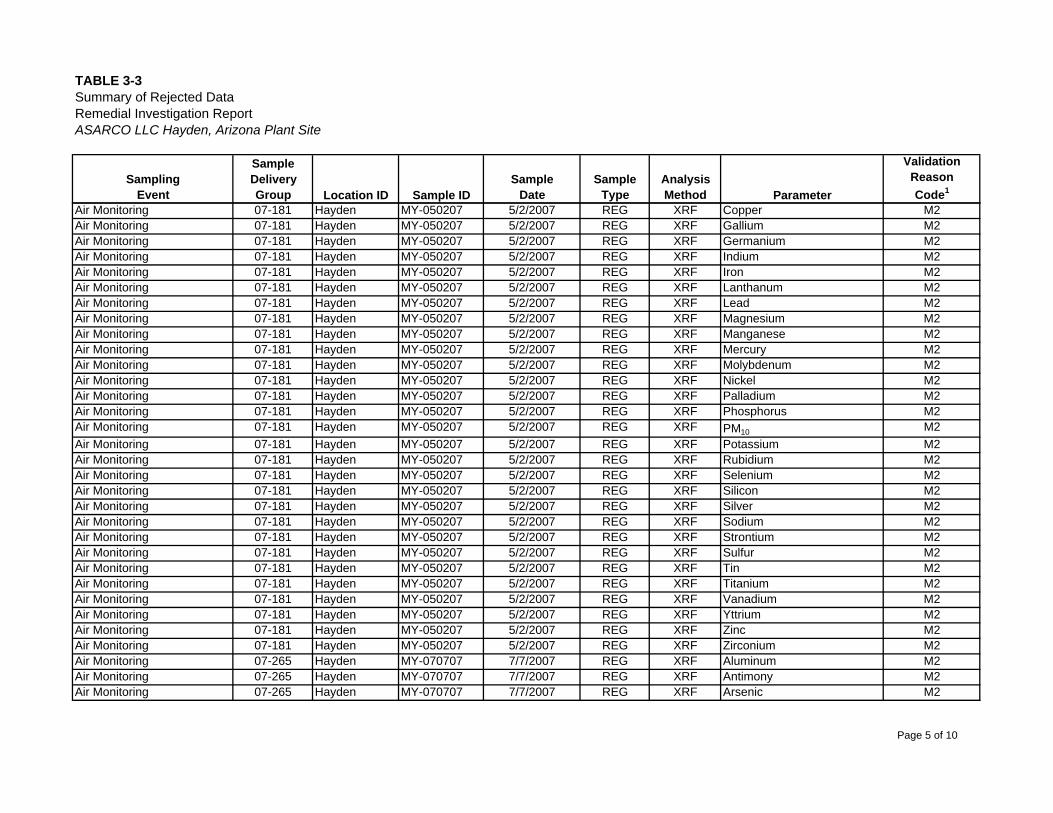
TABLE 3-3Summary of Rejected DataRemedial Investigation ReportASARCO LLC Hayden, Arizona Plant Site
SamplingEvent
SampleDeliveryGroup Location ID Sample ID
SampleDate
SampleType
AnalysisMethod Parameter
ValidationReasonCode1
Air Monitoring 07-181 Hayden MY-050207 5/2/2007 REG XRF Copper M2Air Monitoring 07-181 Hayden MY-050207 5/2/2007 REG XRF Gallium M2Air Monitoring 07-181 Hayden MY-050207 5/2/2007 REG XRF Germanium M2Air Monitoring 07-181 Hayden MY-050207 5/2/2007 REG XRF Indium M2Air Monitoring 07-181 Hayden MY-050207 5/2/2007 REG XRF Iron M2Air Monitoring 07-181 Hayden MY-050207 5/2/2007 REG XRF Lanthanum M2Air Monitoring 07-181 Hayden MY-050207 5/2/2007 REG XRF Lead M2Air Monitoring 07-181 Hayden MY-050207 5/2/2007 REG XRF Magnesium M2Air Monitoring 07-181 Hayden MY-050207 5/2/2007 REG XRF Manganese M2Air Monitoring 07-181 Hayden MY-050207 5/2/2007 REG XRF Mercury M2Air Monitoring 07-181 Hayden MY-050207 5/2/2007 REG XRF Molybdenum M2Air Monitoring 07-181 Hayden MY-050207 5/2/2007 REG XRF Nickel M2Air Monitoring 07-181 Hayden MY-050207 5/2/2007 REG XRF Palladium M2Air Monitoring 07-181 Hayden MY-050207 5/2/2007 REG XRF Phosphorus M2Air Monitoring 07-181 Hayden MY-050207 5/2/2007 REG XRF PM10 M2Air Monitoring 07-181 Hayden MY-050207 5/2/2007 REG XRF Potassium M2Air Monitoring 07-181 Hayden MY-050207 5/2/2007 REG XRF Rubidium M2Air Monitoring 07-181 Hayden MY-050207 5/2/2007 REG XRF Selenium M2Air Monitoring 07-181 Hayden MY-050207 5/2/2007 REG XRF Silicon M2Air Monitoring 07-181 Hayden MY-050207 5/2/2007 REG XRF Silver M2Air Monitoring 07-181 Hayden MY-050207 5/2/2007 REG XRF Sodium M2Air Monitoring 07-181 Hayden MY-050207 5/2/2007 REG XRF Strontium M2Air Monitoring 07-181 Hayden MY-050207 5/2/2007 REG XRF Sulfur M2Air Monitoring 07-181 Hayden MY-050207 5/2/2007 REG XRF Tin M2Air Monitoring 07-181 Hayden MY-050207 5/2/2007 REG XRF Titanium M2Air Monitoring 07-181 Hayden MY-050207 5/2/2007 REG XRF Vanadium M2Air Monitoring 07-181 Hayden MY-050207 5/2/2007 REG XRF Yttrium M2Air Monitoring 07-181 Hayden MY-050207 5/2/2007 REG XRF Zinc M2Air Monitoring 07-181 Hayden MY-050207 5/2/2007 REG XRF Zirconium M2Air Monitoring 07-265 Hayden MY-070707 7/7/2007 REG XRF Aluminum M2Air Monitoring 07-265 Hayden MY-070707 7/7/2007 REG XRF Antimony M2Air Monitoring 07-265 Hayden MY-070707 7/7/2007 REG XRF Arsenic M2
Page 5 of 10
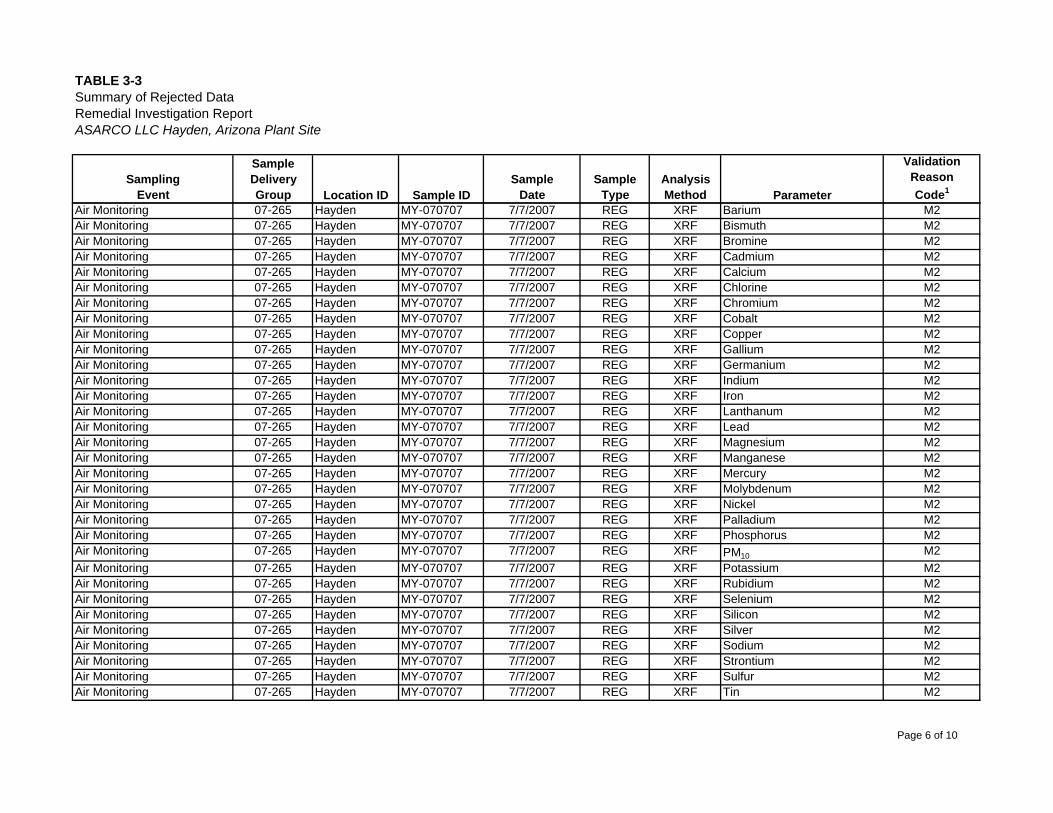
TABLE 3-3Summary of Rejected DataRemedial Investigation ReportASARCO LLC Hayden, Arizona Plant Site
SamplingEvent
SampleDeliveryGroup Location ID Sample ID
SampleDate
SampleType
AnalysisMethod Parameter
ValidationReasonCode1
Air Monitoring 07-265 Hayden MY-070707 7/7/2007 REG XRF Barium M2Air Monitoring 07-265 Hayden MY-070707 7/7/2007 REG XRF Bismuth M2Air Monitoring 07-265 Hayden MY-070707 7/7/2007 REG XRF Bromine M2Air Monitoring 07-265 Hayden MY-070707 7/7/2007 REG XRF Cadmium M2Air Monitoring 07-265 Hayden MY-070707 7/7/2007 REG XRF Calcium M2Air Monitoring 07-265 Hayden MY-070707 7/7/2007 REG XRF Chlorine M2Air Monitoring 07-265 Hayden MY-070707 7/7/2007 REG XRF Chromium M2Air Monitoring 07-265 Hayden MY-070707 7/7/2007 REG XRF Cobalt M2Air Monitoring 07-265 Hayden MY-070707 7/7/2007 REG XRF Copper M2Air Monitoring 07-265 Hayden MY-070707 7/7/2007 REG XRF Gallium M2Air Monitoring 07-265 Hayden MY-070707 7/7/2007 REG XRF Germanium M2Air Monitoring 07-265 Hayden MY-070707 7/7/2007 REG XRF Indium M2Air Monitoring 07-265 Hayden MY-070707 7/7/2007 REG XRF Iron M2Air Monitoring 07-265 Hayden MY-070707 7/7/2007 REG XRF Lanthanum M2Air Monitoring 07-265 Hayden MY-070707 7/7/2007 REG XRF Lead M2Air Monitoring 07-265 Hayden MY-070707 7/7/2007 REG XRF Magnesium M2Air Monitoring 07-265 Hayden MY-070707 7/7/2007 REG XRF Manganese M2Air Monitoring 07-265 Hayden MY-070707 7/7/2007 REG XRF Mercury M2Air Monitoring 07-265 Hayden MY-070707 7/7/2007 REG XRF Molybdenum M2Air Monitoring 07-265 Hayden MY-070707 7/7/2007 REG XRF Nickel M2Air Monitoring 07-265 Hayden MY-070707 7/7/2007 REG XRF Palladium M2Air Monitoring 07-265 Hayden MY-070707 7/7/2007 REG XRF Phosphorus M2Air Monitoring 07-265 Hayden MY-070707 7/7/2007 REG XRF PM10 M2Air Monitoring 07-265 Hayden MY-070707 7/7/2007 REG XRF Potassium M2Air Monitoring 07-265 Hayden MY-070707 7/7/2007 REG XRF Rubidium M2Air Monitoring 07-265 Hayden MY-070707 7/7/2007 REG XRF Selenium M2Air Monitoring 07-265 Hayden MY-070707 7/7/2007 REG XRF Silicon M2Air Monitoring 07-265 Hayden MY-070707 7/7/2007 REG XRF Silver M2Air Monitoring 07-265 Hayden MY-070707 7/7/2007 REG XRF Sodium M2Air Monitoring 07-265 Hayden MY-070707 7/7/2007 REG XRF Strontium M2Air Monitoring 07-265 Hayden MY-070707 7/7/2007 REG XRF Sulfur M2Air Monitoring 07-265 Hayden MY-070707 7/7/2007 REG XRF Tin M2
Page 6 of 10
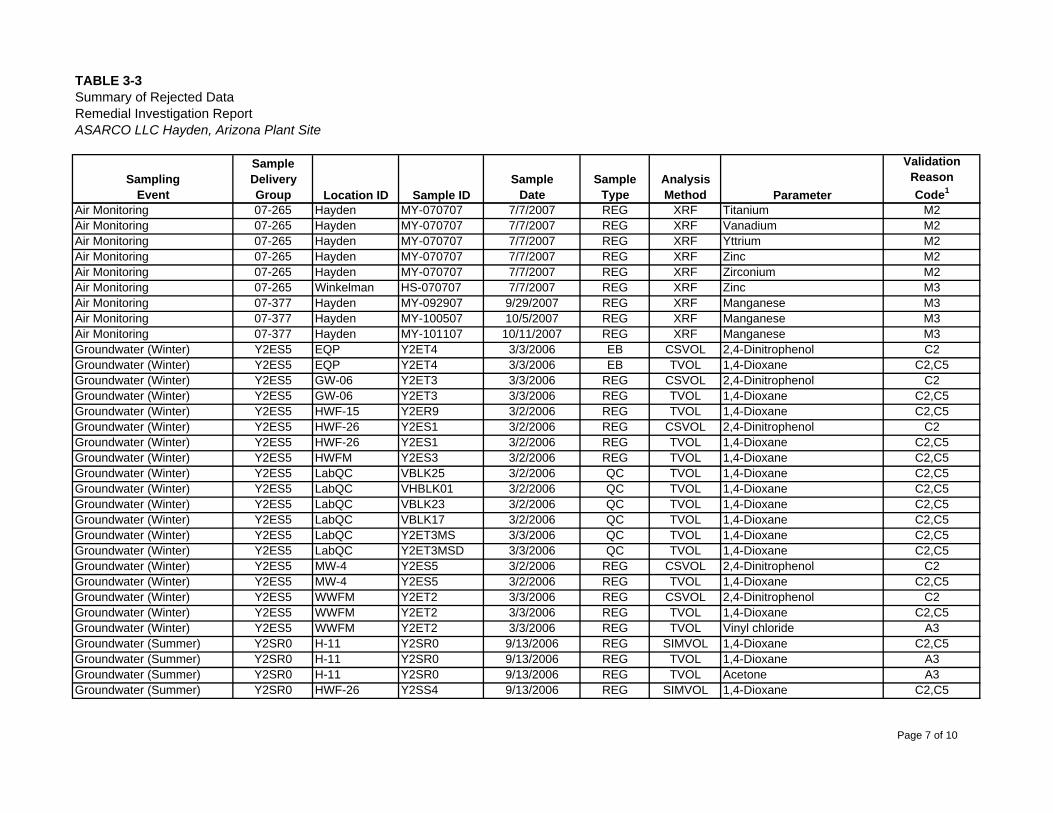
TABLE 3-3Summary of Rejected DataRemedial Investigation ReportASARCO LLC Hayden, Arizona Plant Site
SamplingEvent
SampleDeliveryGroup Location ID Sample ID
SampleDate
SampleType
AnalysisMethod Parameter
ValidationReasonCode1
Air Monitoring 07-265 Hayden MY-070707 7/7/2007 REG XRF Titanium M2Air Monitoring 07-265 Hayden MY-070707 7/7/2007 REG XRF Vanadium M2Air Monitoring 07-265 Hayden MY-070707 7/7/2007 REG XRF Yttrium M2Air Monitoring 07-265 Hayden MY-070707 7/7/2007 REG XRF Zinc M2Air Monitoring 07-265 Hayden MY-070707 7/7/2007 REG XRF Zirconium M2Air Monitoring 07-265 Winkelman HS-070707 7/7/2007 REG XRF Zinc M3Air Monitoring 07-377 Hayden MY-092907 9/29/2007 REG XRF Manganese M3Air Monitoring 07-377 Hayden MY-100507 10/5/2007 REG XRF Manganese M3Air Monitoring 07-377 Hayden MY-101107 10/11/2007 REG XRF Manganese M3Groundwater (Winter) Y2ES5 EQP Y2ET4 3/3/2006 EB CSVOL 2,4-Dinitrophenol C2Groundwater (Winter) Y2ES5 EQP Y2ET4 3/3/2006 EB TVOL 1,4-Dioxane C2,C5Groundwater (Winter) Y2ES5 GW-06 Y2ET3 3/3/2006 REG CSVOL 2,4-Dinitrophenol C2Groundwater (Winter) Y2ES5 GW-06 Y2ET3 3/3/2006 REG TVOL 1,4-Dioxane C2,C5Groundwater (Winter) Y2ES5 HWF-15 Y2ER9 3/2/2006 REG TVOL 1,4-Dioxane C2,C5Groundwater (Winter) Y2ES5 HWF-26 Y2ES1 3/2/2006 REG CSVOL 2,4-Dinitrophenol C2Groundwater (Winter) Y2ES5 HWF-26 Y2ES1 3/2/2006 REG TVOL 1,4-Dioxane C2,C5Groundwater (Winter) Y2ES5 HWFM Y2ES3 3/2/2006 REG TVOL 1,4-Dioxane C2,C5Groundwater (Winter) Y2ES5 LabQC VBLK25 3/2/2006 QC TVOL 1,4-Dioxane C2,C5Groundwater (Winter) Y2ES5 LabQC VHBLK01 3/2/2006 QC TVOL 1,4-Dioxane C2,C5Groundwater (Winter) Y2ES5 LabQC VBLK23 3/2/2006 QC TVOL 1,4-Dioxane C2,C5Groundwater (Winter) Y2ES5 LabQC VBLK17 3/2/2006 QC TVOL 1,4-Dioxane C2,C5Groundwater (Winter) Y2ES5 LabQC Y2ET3MS 3/3/2006 QC TVOL 1,4-Dioxane C2,C5Groundwater (Winter) Y2ES5 LabQC Y2ET3MSD 3/3/2006 QC TVOL 1,4-Dioxane C2,C5Groundwater (Winter) Y2ES5 MW-4 Y2ES5 3/2/2006 REG CSVOL 2,4-Dinitrophenol C2Groundwater (Winter) Y2ES5 MW-4 Y2ES5 3/2/2006 REG TVOL 1,4-Dioxane C2,C5Groundwater (Winter) Y2ES5 WWFM Y2ET2 3/3/2006 REG CSVOL 2,4-Dinitrophenol C2Groundwater (Winter) Y2ES5 WWFM Y2ET2 3/3/2006 REG TVOL 1,4-Dioxane C2,C5Groundwater (Winter) Y2ES5 WWFM Y2ET2 3/3/2006 REG TVOL Vinyl chloride A3Groundwater (Summer) Y2SR0 H-11 Y2SR0 9/13/2006 REG SIMVOL 1,4-Dioxane C2,C5Groundwater (Summer) Y2SR0 H-11 Y2SR0 9/13/2006 REG TVOL 1,4-Dioxane A3Groundwater (Summer) Y2SR0 H-11 Y2SR0 9/13/2006 REG TVOL Acetone A3Groundwater (Summer) Y2SR0 HWF-26 Y2SS4 9/13/2006 REG SIMVOL 1,4-Dioxane C2,C5
Page 7 of 10
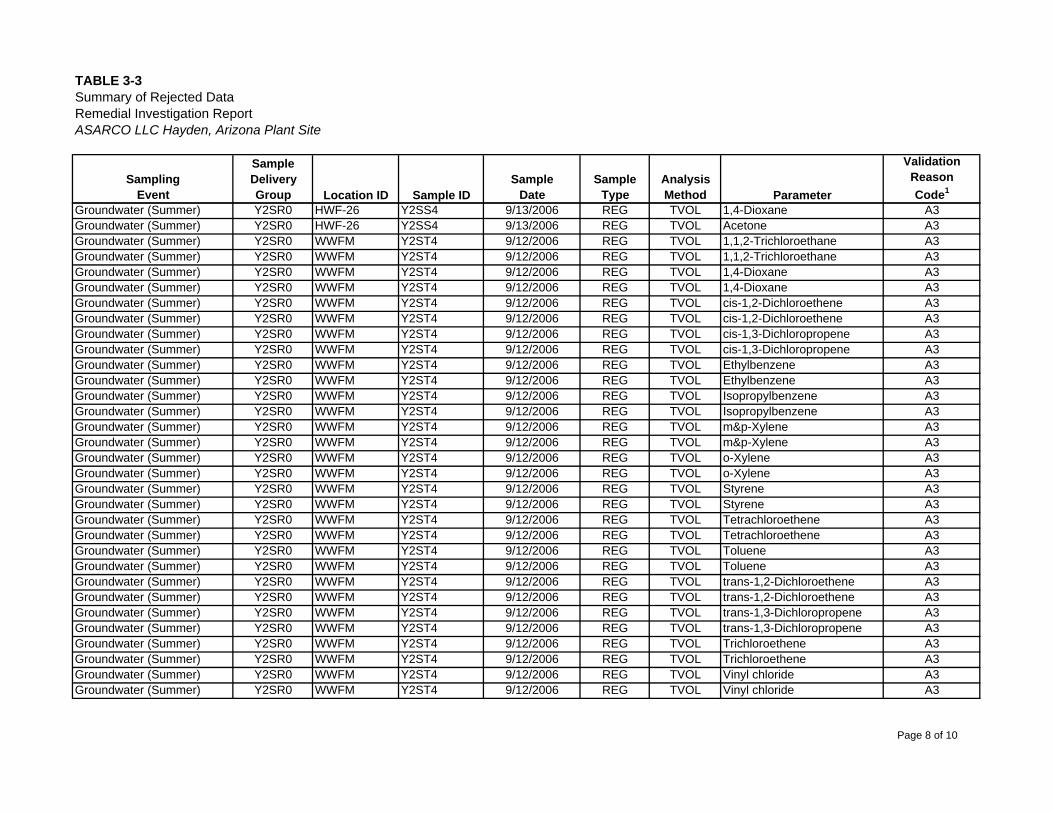
TABLE 3-3Summary of Rejected DataRemedial Investigation ReportASARCO LLC Hayden, Arizona Plant Site
SamplingEvent
SampleDeliveryGroup Location ID Sample ID
SampleDate
SampleType
AnalysisMethod Parameter
ValidationReasonCode1
Groundwater (Summer) Y2SR0 HWF-26 Y2SS4 9/13/2006 REG TVOL 1,4-Dioxane A3Groundwater (Summer) Y2SR0 HWF-26 Y2SS4 9/13/2006 REG TVOL Acetone A3Groundwater (Summer) Y2SR0 WWFM Y2ST4 9/12/2006 REG TVOL 1,1,2-Trichloroethane A3Groundwater (Summer) Y2SR0 WWFM Y2ST4 9/12/2006 REG TVOL 1,1,2-Trichloroethane A3Groundwater (Summer) Y2SR0 WWFM Y2ST4 9/12/2006 REG TVOL 1,4-Dioxane A3Groundwater (Summer) Y2SR0 WWFM Y2ST4 9/12/2006 REG TVOL 1,4-Dioxane A3Groundwater (Summer) Y2SR0 WWFM Y2ST4 9/12/2006 REG TVOL cis-1,2-Dichloroethene A3Groundwater (Summer) Y2SR0 WWFM Y2ST4 9/12/2006 REG TVOL cis-1,2-Dichloroethene A3Groundwater (Summer) Y2SR0 WWFM Y2ST4 9/12/2006 REG TVOL cis-1,3-Dichloropropene A3Groundwater (Summer) Y2SR0 WWFM Y2ST4 9/12/2006 REG TVOL cis-1,3-Dichloropropene A3Groundwater (Summer) Y2SR0 WWFM Y2ST4 9/12/2006 REG TVOL Ethylbenzene A3Groundwater (Summer) Y2SR0 WWFM Y2ST4 9/12/2006 REG TVOL Ethylbenzene A3Groundwater (Summer) Y2SR0 WWFM Y2ST4 9/12/2006 REG TVOL Isopropylbenzene A3Groundwater (Summer) Y2SR0 WWFM Y2ST4 9/12/2006 REG TVOL Isopropylbenzene A3Groundwater (Summer) Y2SR0 WWFM Y2ST4 9/12/2006 REG TVOL m&p-Xylene A3Groundwater (Summer) Y2SR0 WWFM Y2ST4 9/12/2006 REG TVOL m&p-Xylene A3Groundwater (Summer) Y2SR0 WWFM Y2ST4 9/12/2006 REG TVOL o-Xylene A3Groundwater (Summer) Y2SR0 WWFM Y2ST4 9/12/2006 REG TVOL o-Xylene A3Groundwater (Summer) Y2SR0 WWFM Y2ST4 9/12/2006 REG TVOL Styrene A3Groundwater (Summer) Y2SR0 WWFM Y2ST4 9/12/2006 REG TVOL Styrene A3Groundwater (Summer) Y2SR0 WWFM Y2ST4 9/12/2006 REG TVOL Tetrachloroethene A3Groundwater (Summer) Y2SR0 WWFM Y2ST4 9/12/2006 REG TVOL Tetrachloroethene A3Groundwater (Summer) Y2SR0 WWFM Y2ST4 9/12/2006 REG TVOL Toluene A3Groundwater (Summer) Y2SR0 WWFM Y2ST4 9/12/2006 REG TVOL Toluene A3Groundwater (Summer) Y2SR0 WWFM Y2ST4 9/12/2006 REG TVOL trans-1,2-Dichloroethene A3Groundwater (Summer) Y2SR0 WWFM Y2ST4 9/12/2006 REG TVOL trans-1,2-Dichloroethene A3Groundwater (Summer) Y2SR0 WWFM Y2ST4 9/12/2006 REG TVOL trans-1,3-Dichloropropene A3Groundwater (Summer) Y2SR0 WWFM Y2ST4 9/12/2006 REG TVOL trans-1,3-Dichloropropene A3Groundwater (Summer) Y2SR0 WWFM Y2ST4 9/12/2006 REG TVOL Trichloroethene A3Groundwater (Summer) Y2SR0 WWFM Y2ST4 9/12/2006 REG TVOL Trichloroethene A3Groundwater (Summer) Y2SR0 WWFM Y2ST4 9/12/2006 REG TVOL Vinyl chloride A3Groundwater (Summer) Y2SR0 WWFM Y2ST4 9/12/2006 REG TVOL Vinyl chloride A3
Page 8 of 10
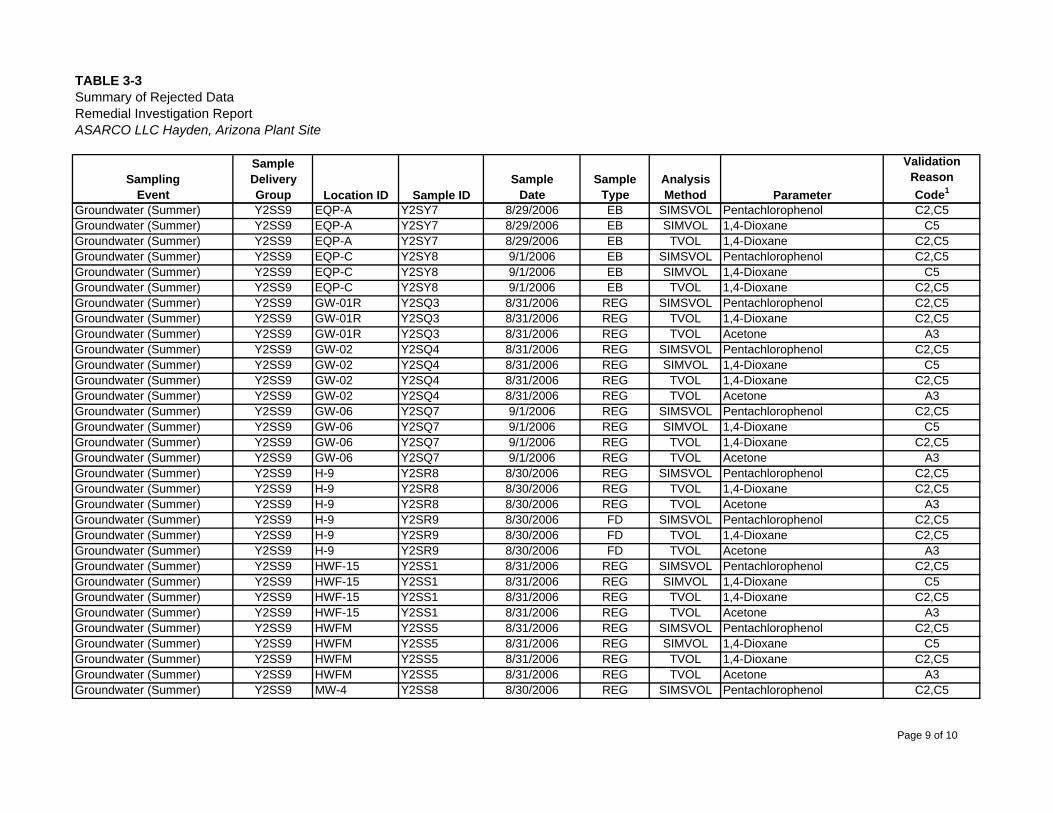
TABLE 3-3Summary of Rejected DataRemedial Investigation ReportASARCO LLC Hayden, Arizona Plant Site
SamplingEvent
SampleDeliveryGroup Location ID Sample ID
SampleDate
SampleType
AnalysisMethod Parameter
ValidationReasonCode1
Groundwater (Summer) Y2SS9 EQP-A Y2SY7 8/29/2006 EB SIMSVOL Pentachlorophenol C2,C5Groundwater (Summer) Y2SS9 EQP-A Y2SY7 8/29/2006 EB SIMVOL 1,4-Dioxane C5Groundwater (Summer) Y2SS9 EQP-A Y2SY7 8/29/2006 EB TVOL 1,4-Dioxane C2,C5Groundwater (Summer) Y2SS9 EQP-C Y2SY8 9/1/2006 EB SIMSVOL Pentachlorophenol C2,C5Groundwater (Summer) Y2SS9 EQP-C Y2SY8 9/1/2006 EB SIMVOL 1,4-Dioxane C5Groundwater (Summer) Y2SS9 EQP-C Y2SY8 9/1/2006 EB TVOL 1,4-Dioxane C2,C5Groundwater (Summer) Y2SS9 GW-01R Y2SQ3 8/31/2006 REG SIMSVOL Pentachlorophenol C2,C5Groundwater (Summer) Y2SS9 GW-01R Y2SQ3 8/31/2006 REG TVOL 1,4-Dioxane C2,C5Groundwater (Summer) Y2SS9 GW-01R Y2SQ3 8/31/2006 REG TVOL Acetone A3Groundwater (Summer) Y2SS9 GW-02 Y2SQ4 8/31/2006 REG SIMSVOL Pentachlorophenol C2,C5Groundwater (Summer) Y2SS9 GW-02 Y2SQ4 8/31/2006 REG SIMVOL 1,4-Dioxane C5Groundwater (Summer) Y2SS9 GW-02 Y2SQ4 8/31/2006 REG TVOL 1,4-Dioxane C2,C5Groundwater (Summer) Y2SS9 GW-02 Y2SQ4 8/31/2006 REG TVOL Acetone A3Groundwater (Summer) Y2SS9 GW-06 Y2SQ7 9/1/2006 REG SIMSVOL Pentachlorophenol C2,C5Groundwater (Summer) Y2SS9 GW-06 Y2SQ7 9/1/2006 REG SIMVOL 1,4-Dioxane C5Groundwater (Summer) Y2SS9 GW-06 Y2SQ7 9/1/2006 REG TVOL 1,4-Dioxane C2,C5Groundwater (Summer) Y2SS9 GW-06 Y2SQ7 9/1/2006 REG TVOL Acetone A3Groundwater (Summer) Y2SS9 H-9 Y2SR8 8/30/2006 REG SIMSVOL Pentachlorophenol C2,C5Groundwater (Summer) Y2SS9 H-9 Y2SR8 8/30/2006 REG TVOL 1,4-Dioxane C2,C5Groundwater (Summer) Y2SS9 H-9 Y2SR8 8/30/2006 REG TVOL Acetone A3Groundwater (Summer) Y2SS9 H-9 Y2SR9 8/30/2006 FD SIMSVOL Pentachlorophenol C2,C5Groundwater (Summer) Y2SS9 H-9 Y2SR9 8/30/2006 FD TVOL 1,4-Dioxane C2,C5Groundwater (Summer) Y2SS9 H-9 Y2SR9 8/30/2006 FD TVOL Acetone A3Groundwater (Summer) Y2SS9 HWF-15 Y2SS1 8/31/2006 REG SIMSVOL Pentachlorophenol C2,C5Groundwater (Summer) Y2SS9 HWF-15 Y2SS1 8/31/2006 REG SIMVOL 1,4-Dioxane C5Groundwater (Summer) Y2SS9 HWF-15 Y2SS1 8/31/2006 REG TVOL 1,4-Dioxane C2,C5Groundwater (Summer) Y2SS9 HWF-15 Y2SS1 8/31/2006 REG TVOL Acetone A3Groundwater (Summer) Y2SS9 HWFM Y2SS5 8/31/2006 REG SIMSVOL Pentachlorophenol C2,C5Groundwater (Summer) Y2SS9 HWFM Y2SS5 8/31/2006 REG SIMVOL 1,4-Dioxane C5Groundwater (Summer) Y2SS9 HWFM Y2SS5 8/31/2006 REG TVOL 1,4-Dioxane C2,C5Groundwater (Summer) Y2SS9 HWFM Y2SS5 8/31/2006 REG TVOL Acetone A3Groundwater (Summer) Y2SS9 MW-4 Y2SS8 8/30/2006 REG SIMSVOL Pentachlorophenol C2,C5
Page 9 of 10
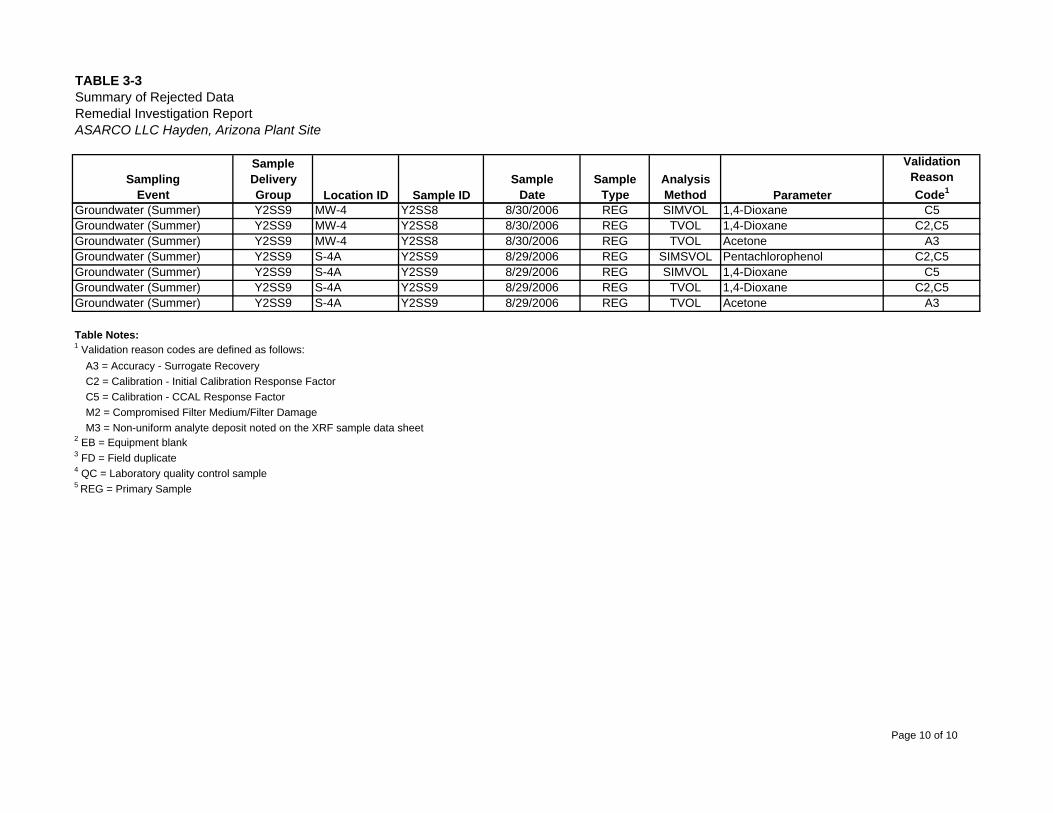
TABLE 3-3Summary of Rejected DataRemedial Investigation ReportASARCO LLC Hayden, Arizona Plant Site
SamplingEvent
SampleDeliveryGroup Location ID Sample ID
SampleDate
SampleType
AnalysisMethod Parameter
ValidationReasonCode1
Groundwater (Summer) Y2SS9 MW-4 Y2SS8 8/30/2006 REG SIMVOL 1,4-Dioxane C5Groundwater (Summer) Y2SS9 MW-4 Y2SS8 8/30/2006 REG TVOL 1,4-Dioxane C2,C5Groundwater (Summer) Y2SS9 MW-4 Y2SS8 8/30/2006 REG TVOL Acetone A3Groundwater (Summer) Y2SS9 S-4A Y2SS9 8/29/2006 REG SIMSVOL Pentachlorophenol C2,C5Groundwater (Summer) Y2SS9 S-4A Y2SS9 8/29/2006 REG SIMVOL 1,4-Dioxane C5Groundwater (Summer) Y2SS9 S-4A Y2SS9 8/29/2006 REG TVOL 1,4-Dioxane C2,C5Groundwater (Summer) Y2SS9 S-4A Y2SS9 8/29/2006 REG TVOL Acetone A3
Table Notes:1 Validation reason codes are defined as follows:
A3 = Accuracy - Surrogate RecoveryC2 = Calibration - Initial Calibration Response FactorC5 = Calibration - CCAL Response FactorM2 = Compromised Filter Medium/Filter DamageM3 = Non-uniform analyte deposit noted on the XRF sample data sheet
2 EB = Equipment blank3 FD = Field duplicate4 QC = Laboratory quality control sample5 REG = Primary Sample
Page 10 of 10
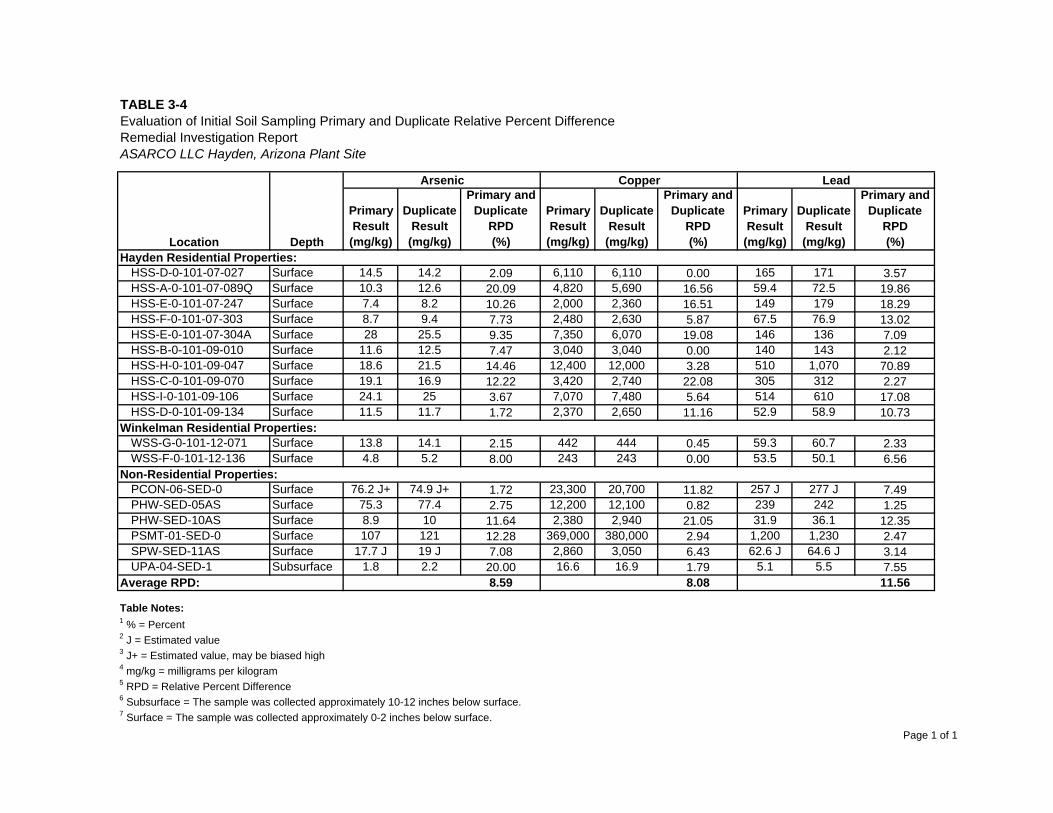
TABLE 3-4Evaluation of Initial Soil Sampling Primary and Duplicate Relative Percent DifferenceRemedial Investigation Report
PrimaryResult
(mg/kg)
DuplicateResult
(mg/kg)
Primary and Duplicate
RPD(%)
PrimaryResult
(mg/kg)
DuplicateResult
(mg/kg)
Primary and Duplicate
RPD(%)
PrimaryResult
(mg/kg)
DuplicateResult
(mg/kg)
Primary and Duplicate
RPD(%)
HSS-D-0-101-07-027 Surface 14.5 14.2 2.09 6,110 6,110 0.00 165 171 3.57HSS-A-0-101-07-089Q Surface 10.3 12.6 20.09 4,820 5,690 16.56 59.4 72.5 19.86HSS-E-0-101-07-247 Surface 7.4 8.2 10.26 2,000 2,360 16.51 149 179 18.29HSS-F-0-101-07-303 Surface 8.7 9.4 7.73 2,480 2,630 5.87 67.5 76.9 13.02HSS-E-0-101-07-304A Surface 28 25.5 9.35 7,350 6,070 19.08 146 136 7.09HSS-B-0-101-09-010 Surface 11.6 12.5 7.47 3,040 3,040 0.00 140 143 2.12HSS-H-0-101-09-047 Surface 18.6 21.5 14.46 12,400 12,000 3.28 510 1,070 70.89HSS-C-0-101-09-070 Surface 19.1 16.9 12.22 3,420 2,740 22.08 305 312 2.27HSS-I-0-101-09-106 Surface 24.1 25 3.67 7,070 7,480 5.64 514 610 17.08HSS-D-0-101-09-134 Surface 11.5 11.7 1.72 2,370 2,650 11.16 52.9 58.9 10.73
WSS-G-0-101-12-071 Surface 13.8 14.1 2.15 442 444 0.45 59.3 60.7 2.33WSS-F-0-101-12-136 Surface 4.8 5.2 8.00 243 243 0.00 53.5 50.1 6.56
PCON-06-SED-0 Surface 76.2 J+ 74.9 J+ 1.72 23,300 20,700 11.82 257 J 277 J 7.49PHW-SED-05AS Surface 75.3 77.4 2.75 12,200 12,100 0.82 239 242 1.25PHW-SED-10AS Surface 8.9 10 11.64 2,380 2,940 21.05 31.9 36.1 12.35PSMT-01-SED-0 Surface 107 121 12.28 369,000 380,000 2.94 1,200 1,230 2.47SPW-SED-11AS Surface 17.7 J 19 J 7.08 2,860 3,050 6.43 62.6 J 64.6 J 3.14UPA-04-SED-1 Subsurface 1.8 2.2 20.00 16.6 16.9 1.79 5.1 5.5 7.55
8.59 8.08 11.56
Table Notes:1 % = Percent2 J = Estimated value3 J+ = Estimated value, may be biased high4 mg/kg = milligrams per kilogram5 RPD = Relative Percent Difference6 Subsurface = The sample was collected approximately 10-12 inches below surface.7 Surface = The sample was collected approximately 0-2 inches below surface.
Average RPD:
ASARCO LLC Hayden, Arizona Plant Site
Winkelman Residential Properties:
Non-Residential Properties:
Location Depth
LeadArsenic Copper
Hayden Residential Properties:
Page 1 of 1
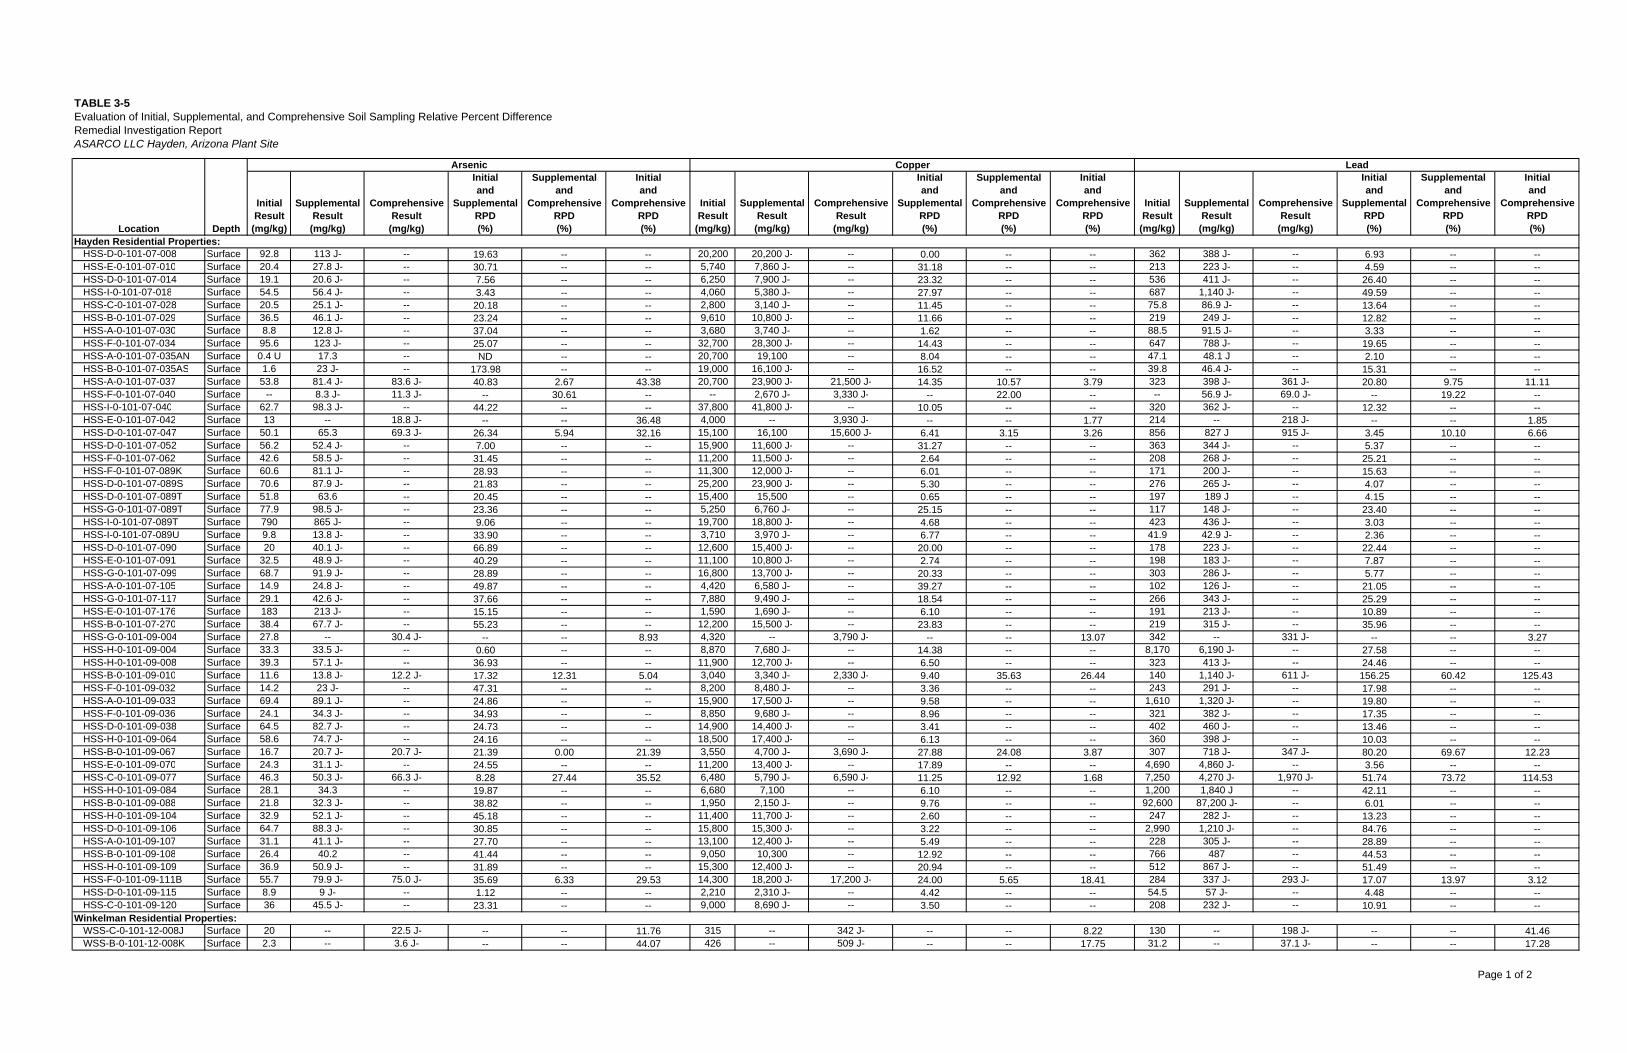
TABLE 3-5Evaluation of Initial, Supplemental, and Comprehensive Soil Sampling Relative Percent DifferenceRemedial Investigation Report
InitialResult
(mg/kg)
SupplementalResult(mg/kg)
ComprehensiveResult
(mg/kg)
Initialand
SupplementalRPD(%)
Supplementaland
ComprehensiveRPD(%)
Initialand
ComprehensiveRPD(%)
InitialResult
(mg/kg)
SupplementalResult(mg/kg)
ComprehensiveResult
(mg/kg)
Initialand
SupplementalRPD(%)
Supplementaland
ComprehensiveRPD(%)
Initialand
ComprehensiveRPD(%)
InitialResult
(mg/kg)
SupplementalResult(mg/kg)
ComprehensiveResult
(mg/kg)
Initialand
SupplementalRPD(%)
Supplementaland
ComprehensiveRPD(%)
Initialand
ComprehensiveRPD(%)
HSS-D-0-101-07-008 Surface 92.8 113 J- -- 19.63 -- -- 20,200 20,200 J- -- 0.00 -- -- 362 388 J- -- 6.93 -- --HSS-E-0-101-07-010 Surface 20.4 27.8 J- -- 30.71 -- -- 5,740 7,860 J- -- 31.18 -- -- 213 223 J- -- 4.59 -- --HSS-D-0-101-07-014 Surface 19.1 20.6 J- -- 7.56 -- -- 6,250 7,900 J- -- 23.32 -- -- 536 411 J- -- 26.40 -- --HSS-I-0-101-07-018 Surface 54.5 56.4 J- -- 3.43 -- -- 4,060 5,380 J- -- 27.97 -- -- 687 1,140 J- -- 49.59 -- --HSS-C-0-101-07-028 Surface 20.5 25.1 J- -- 20.18 -- -- 2,800 3,140 J- -- 11.45 -- -- 75.8 86.9 J- -- 13.64 -- --HSS-B-0-101-07-029 Surface 36.5 46.1 J- -- 23.24 -- -- 9,610 10,800 J- -- 11.66 -- -- 219 249 J- -- 12.82 -- --HSS-A-0-101-07-030 Surface 8.8 12.8 J- -- 37.04 -- -- 3,680 3,740 J- -- 1.62 -- -- 88.5 91.5 J- -- 3.33 -- --HSS-F-0-101-07-034 Surface 95.6 123 J- -- 25.07 -- -- 32,700 28,300 J- -- 14.43 -- -- 647 788 J- -- 19.65 -- --HSS-A-0-101-07-035AN Surface 0.4 U 17.3 -- ND -- -- 20,700 19,100 -- 8.04 -- -- 47.1 48.1 J -- 2.10 -- --HSS-B-0-101-07-035AS Surface 1.6 23 J- -- 173.98 -- -- 19,000 16,100 J- -- 16.52 -- -- 39.8 46.4 J- -- 15.31 -- --HSS-A-0-101-07-037 Surface 53.8 81.4 J- 83.6 J- 40.83 2.67 43.38 20,700 23,900 J- 21,500 J- 14.35 10.57 3.79 323 398 J- 361 J- 20.80 9.75 11.11HSS-F-0-101-07-040 Surface -- 8.3 J- 11.3 J- -- 30.61 -- -- 2,670 J- 3,330 J- -- 22.00 -- -- 56.9 J- 69.0 J- -- 19.22 --HSS-I-0-101-07-040 Surface 62.7 98.3 J- -- 44.22 -- -- 37,800 41,800 J- -- 10.05 -- -- 320 362 J- -- 12.32 -- --HSS-E-0-101-07-042 Surface 13 -- 18.8 J- -- -- 36.48 4,000 -- 3,930 J- -- -- 1.77 214 -- 218 J- -- -- 1.85HSS-D-0-101-07-047 Surface 50.1 65.3 69.3 J- 26.34 5.94 32.16 15,100 16,100 15,600 J- 6.41 3.15 3.26 856 827 J 915 J- 3.45 10.10 6.66HSS-D-0-101-07-052 Surface 56.2 52.4 J- -- 7.00 -- -- 15,900 11,600 J- -- 31.27 -- -- 363 344 J- -- 5.37 -- --HSS-F-0-101-07-062 Surface 42.6 58.5 J- -- 31.45 -- -- 11,200 11,500 J- -- 2.64 -- -- 208 268 J- -- 25.21 -- --HSS-F-0-101-07-089K Surface 60.6 81.1 J- -- 28.93 -- -- 11,300 12,000 J- -- 6.01 -- -- 171 200 J- -- 15.63 -- --HSS-D-0-101-07-089S Surface 70.6 87.9 J- -- 21.83 -- -- 25,200 23,900 J- -- 5.30 -- -- 276 265 J- -- 4.07 -- --HSS-D-0-101-07-089T Surface 51.8 63.6 -- 20.45 -- -- 15,400 15,500 -- 0.65 -- -- 197 189 J -- 4.15 -- --HSS-G-0-101-07-089T Surface 77.9 98.5 J- -- 23.36 -- -- 5,250 6,760 J- -- 25.15 -- -- 117 148 J- -- 23.40 -- --HSS-I-0-101-07-089T Surface 790 865 J- -- 9.06 -- -- 19,700 18,800 J- -- 4.68 -- -- 423 436 J- -- 3.03 -- --HSS-I-0-101-07-089U Surface 9.8 13.8 J- -- 33.90 -- -- 3,710 3,970 J- -- 6.77 -- -- 41.9 42.9 J- -- 2.36 -- --HSS-D-0-101-07-090 Surface 20 40.1 J- -- 66.89 -- -- 12,600 15,400 J- -- 20.00 -- -- 178 223 J- -- 22.44 -- --HSS-E-0-101-07-091 Surface 32.5 48.9 J- -- 40.29 -- -- 11,100 10,800 J- -- 2.74 -- -- 198 183 J- -- 7.87 -- --HSS-G-0-101-07-099 Surface 68.7 91.9 J- -- 28.89 -- -- 16,800 13,700 J- -- 20.33 -- -- 303 286 J- -- 5.77 -- --HSS-A-0-101-07-105 Surface 14.9 24.8 J- -- 49.87 -- -- 4,420 6,580 J- -- 39.27 -- -- 102 126 J- -- 21.05 -- --HSS-G-0-101-07-117 Surface 29.1 42.6 J- -- 37.66 -- -- 7,880 9,490 J- -- 18.54 -- -- 266 343 J- -- 25.29 -- --HSS-E-0-101-07-176 Surface 183 213 J- -- 15.15 -- -- 1,590 1,690 J- -- 6.10 -- -- 191 213 J- -- 10.89 -- --HSS-B-0-101-07-270 Surface 38.4 67.7 J- -- 55.23 -- -- 12,200 15,500 J- -- 23.83 -- -- 219 315 J- -- 35.96 -- --HSS-G-0-101-09-004 Surface 27.8 -- 30.4 J- -- -- 8.93 4,320 -- 3,790 J- -- -- 13.07 342 -- 331 J- -- -- 3.27HSS-H-0-101-09-004 Surface 33.3 33.5 J- -- 0.60 -- -- 8,870 7,680 J- -- 14.38 -- -- 8,170 6,190 J- -- 27.58 -- --HSS-H-0-101-09-008 Surface 39.3 57.1 J- -- 36.93 -- -- 11,900 12,700 J- -- 6.50 -- -- 323 413 J- -- 24.46 -- --HSS-B-0-101-09-010 Surface 11.6 13.8 J- 12.2 J- 17.32 12.31 5.04 3,040 3,340 J- 2,330 J- 9.40 35.63 26.44 140 1,140 J- 611 J- 156.25 60.42 125.43HSS-F-0-101-09-032 Surface 14.2 23 J- -- 47.31 -- -- 8,200 8,480 J- -- 3.36 -- -- 243 291 J- -- 17.98 -- --HSS-A-0-101-09-033 Surface 69.4 89.1 J- -- 24.86 -- -- 15,900 17,500 J- -- 9.58 -- -- 1,610 1,320 J- -- 19.80 -- --HSS-F-0-101-09-036 Surface 24.1 34.3 J- -- 34.93 -- -- 8,850 9,680 J- -- 8.96 -- -- 321 382 J- -- 17.35 -- --HSS-D-0-101-09-038 Surface 64.5 82.7 J- -- 24.73 -- -- 14,900 14,400 J- -- 3.41 -- -- 402 460 J- -- 13.46 -- --HSS-H-0-101-09-064 Surface 58.6 74.7 J- -- 24.16 -- -- 18,500 17,400 J- -- 6.13 -- -- 360 398 J- -- 10.03 -- --HSS-B-0-101-09-067 Surface 16.7 20.7 J- 20.7 J- 21.39 0.00 21.39 3,550 4,700 J- 3,690 J- 27.88 24.08 3.87 307 718 J- 347 J- 80.20 69.67 12.23HSS-E-0-101-09-070 Surface 24.3 31.1 J- -- 24.55 -- -- 11,200 13,400 J- -- 17.89 -- -- 4,690 4,860 J- -- 3.56 -- --HSS-C-0-101-09-077 Surface 46.3 50.3 J- 66.3 J- 8.28 27.44 35.52 6,480 5,790 J- 6,590 J- 11.25 12.92 1.68 7,250 4,270 J- 1,970 J- 51.74 73.72 114.53HSS-H-0-101-09-084 Surface 28.1 34.3 -- 19.87 -- -- 6,680 7,100 -- 6.10 -- -- 1,200 1,840 J -- 42.11 -- --HSS-B-0-101-09-088 Surface 21.8 32.3 J- -- 38.82 -- -- 1,950 2,150 J- -- 9.76 -- -- 92,600 87,200 J- -- 6.01 -- --HSS-H-0-101-09-104 Surface 32.9 52.1 J- -- 45.18 -- -- 11,400 11,700 J- -- 2.60 -- -- 247 282 J- -- 13.23 -- --HSS-D-0-101-09-106 Surface 64.7 88.3 J- -- 30.85 -- -- 15,800 15,300 J- -- 3.22 -- -- 2,990 1,210 J- -- 84.76 -- --HSS-A-0-101-09-107 Surface 31.1 41.1 J- -- 27.70 -- -- 13,100 12,400 J- -- 5.49 -- -- 228 305 J- -- 28.89 -- --HSS-B-0-101-09-108 Surface 26.4 40.2 -- 41.44 -- -- 9,050 10,300 -- 12.92 -- -- 766 487 -- 44.53 -- --HSS-H-0-101-09-109 Surface 36.9 50.9 J- -- 31.89 -- -- 15,300 12,400 J- -- 20.94 -- -- 512 867 J- -- 51.49 -- --HSS-F-0-101-09-111B Surface 55.7 79.9 J- 75.0 J- 35.69 6.33 29.53 14,300 18,200 J- 17,200 J- 24.00 5.65 18.41 284 337 J- 293 J- 17.07 13.97 3.12HSS-D-0-101-09-115 Surface 8.9 9 J- -- 1.12 -- -- 2,210 2,310 J- -- 4.42 -- -- 54.5 57 J- -- 4.48 -- --HSS-C-0-101-09-120 Surface 36 45.5 J- -- 23.31 -- -- 9,000 8,690 J- -- 3.50 -- -- 208 232 J- -- 10.91 -- --
WSS-C-0-101-12-008J Surface 20 -- 22.5 J- -- -- 11.76 315 -- 342 J- -- -- 8.22 130 -- 198 J- -- -- 41.46WSS-B-0-101-12-008K Surface 2.3 -- 3.6 J- -- -- 44.07 426 -- 509 J- -- -- 17.75 31.2 -- 37.1 J- -- -- 17.28
ASARCO LLC Hayden, Arizona Plant Site
Lead
DepthLocation
Arsenic Copper
Hayden Residential Properties:
Winkelman Residential Properties:
Page 1 of 2
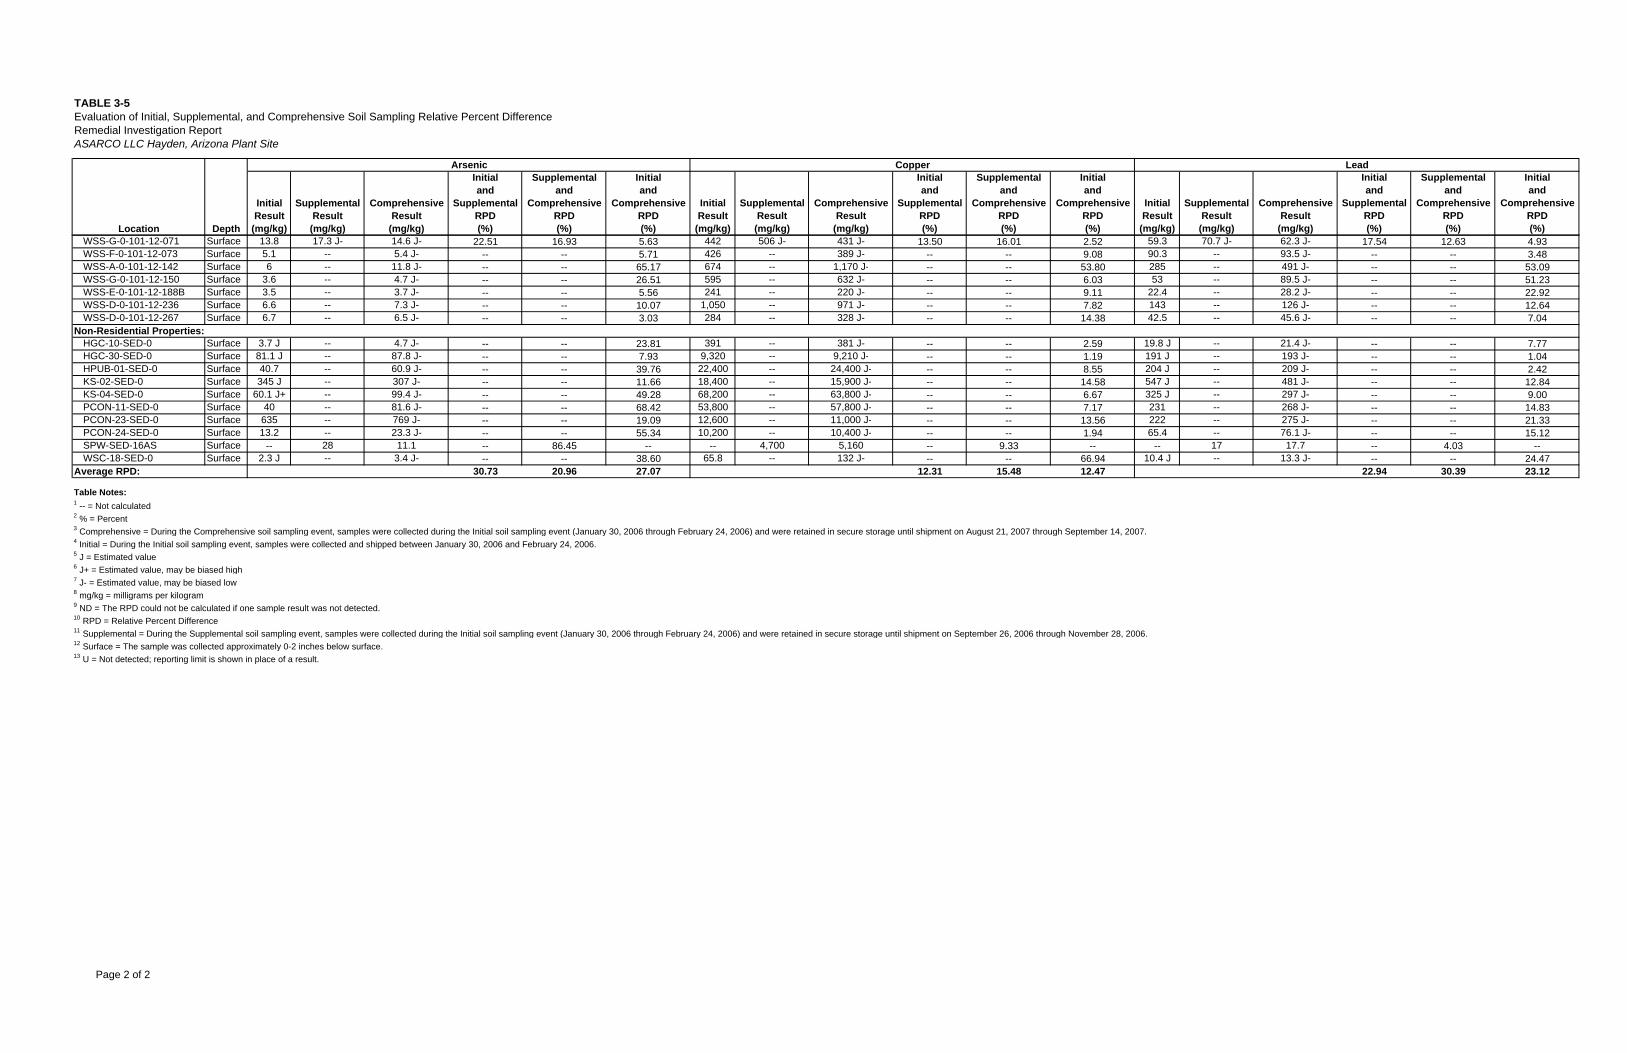
TABLE 3-5Evaluation of Initial, Supplemental, and Comprehensive Soil Sampling Relative Percent DifferenceRemedial Investigation Report
InitialResult
(mg/kg)
SupplementalResult(mg/kg)
ComprehensiveResult
(mg/kg)
Initialand
SupplementalRPD(%)
Supplementaland
ComprehensiveRPD(%)
Initialand
ComprehensiveRPD(%)
InitialResult
(mg/kg)
SupplementalResult(mg/kg)
ComprehensiveResult
(mg/kg)
Initialand
SupplementalRPD(%)
Supplementaland
ComprehensiveRPD(%)
Initialand
ComprehensiveRPD(%)
InitialResult
(mg/kg)
SupplementalResult(mg/kg)
ComprehensiveResult
(mg/kg)
Initialand
SupplementalRPD(%)
Supplementaland
ComprehensiveRPD(%)
Initialand
ComprehensiveRPD(%)
ASARCO LLC Hayden, Arizona Plant Site
Lead
DepthLocation
Arsenic Copper
WSS-G-0-101-12-071 Surface 13.8 17.3 J- 14.6 J- 22.51 16.93 5.63 442 506 J- 431 J- 13.50 16.01 2.52 59.3 70.7 J- 62.3 J- 17.54 12.63 4.93WSS-F-0-101-12-073 Surface 5.1 -- 5.4 J- -- -- 5.71 426 -- 389 J- -- -- 9.08 90.3 -- 93.5 J- -- -- 3.48WSS-A-0-101-12-142 Surface 6 -- 11.8 J- -- -- 65.17 674 -- 1,170 J- -- -- 53.80 285 -- 491 J- -- -- 53.09WSS-G-0-101-12-150 Surface 3.6 -- 4.7 J- -- -- 26.51 595 -- 632 J- -- -- 6.03 53 -- 89.5 J- -- -- 51.23WSS-E-0-101-12-188B Surface 3.5 -- 3.7 J- -- -- 5.56 241 -- 220 J- -- -- 9.11 22.4 -- 28.2 J- -- -- 22.92WSS-D-0-101-12-236 Surface 6.6 -- 7.3 J- -- -- 10.07 1,050 -- 971 J- -- -- 7.82 143 -- 126 J- -- -- 12.64WSS-D-0-101-12-267 Surface 6.7 -- 6.5 J- -- -- 3.03 284 -- 328 J- -- -- 14.38 42.5 -- 45.6 J- -- -- 7.04
HGC-10-SED-0 Surface 3.7 J -- 4.7 J- -- -- 23.81 391 -- 381 J- -- -- 2.59 19.8 J -- 21.4 J- -- -- 7.77HGC-30-SED-0 Surface 81.1 J -- 87.8 J- -- -- 7.93 9,320 -- 9,210 J- -- -- 1.19 191 J -- 193 J- -- -- 1.04HPUB-01-SED-0 Surface 40.7 -- 60.9 J- -- -- 39.76 22,400 -- 24,400 J- -- -- 8.55 204 J -- 209 J- -- -- 2.42KS-02-SED-0 Surface 345 J -- 307 J- -- -- 11.66 18,400 -- 15,900 J- -- -- 14.58 547 J -- 481 J- -- -- 12.84KS-04-SED-0 Surface 60.1 J+ -- 99.4 J- -- -- 49.28 68,200 -- 63,800 J- -- -- 6.67 325 J -- 297 J- -- -- 9.00PCON-11-SED-0 Surface 40 -- 81.6 J- -- -- 68.42 53,800 -- 57,800 J- -- -- 7.17 231 -- 268 J- -- -- 14.83PCON-23-SED-0 Surface 635 -- 769 J- -- -- 19.09 12,600 -- 11,000 J- -- -- 13.56 222 -- 275 J- -- -- 21.33PCON-24-SED-0 Surface 13.2 -- 23.3 J- -- -- 55.34 10,200 -- 10,400 J- -- -- 1.94 65.4 -- 76.1 J- -- -- 15.12SPW-SED-16AS Surface -- 28 11.1 -- 86.45 -- -- 4,700 5,160 -- 9.33 -- -- 17 17.7 -- 4.03 --WSC-18-SED-0 Surface 2.3 J -- 3.4 J- -- -- 38.60 65.8 -- 132 J- -- -- 66.94 10.4 J -- 13.3 J- -- -- 24.47
30.73 20.96 27.07 12.31 15.48 12.47 22.94 30.39 23.12
Table Notes:1 -- = Not calculated2 % = Percent3 Comprehensive = During the Comprehensive soil sampling event, samples were collected during the Initial soil sampling event (January 30, 2006 through February 24, 2006) and were retained in secure storage until shipment on August 21, 2007 through September 14, 2007.4 Initial = During the Initial soil sampling event, samples were collected and shipped between January 30, 2006 and February 24, 2006.5 J = Estimated value6 J+ = Estimated value, may be biased high7 J- = Estimated value, may be biased low8 mg/kg = milligrams per kilogram9 ND = The RPD could not be calculated if one sample result was not detected.10 RPD = Relative Percent Difference11 Supplemental = During the Supplemental soil sampling event, samples were collected during the Initial soil sampling event (January 30, 2006 through February 24, 2006) and were retained in secure storage until shipment on September 26, 2006 through November 28, 2006.12 Surface = The sample was collected approximately 0-2 inches below surface.13 U = Not detected; reporting limit is shown in place of a result.
Average RPD:
Non-Residential Properties:
Page 2 of 2
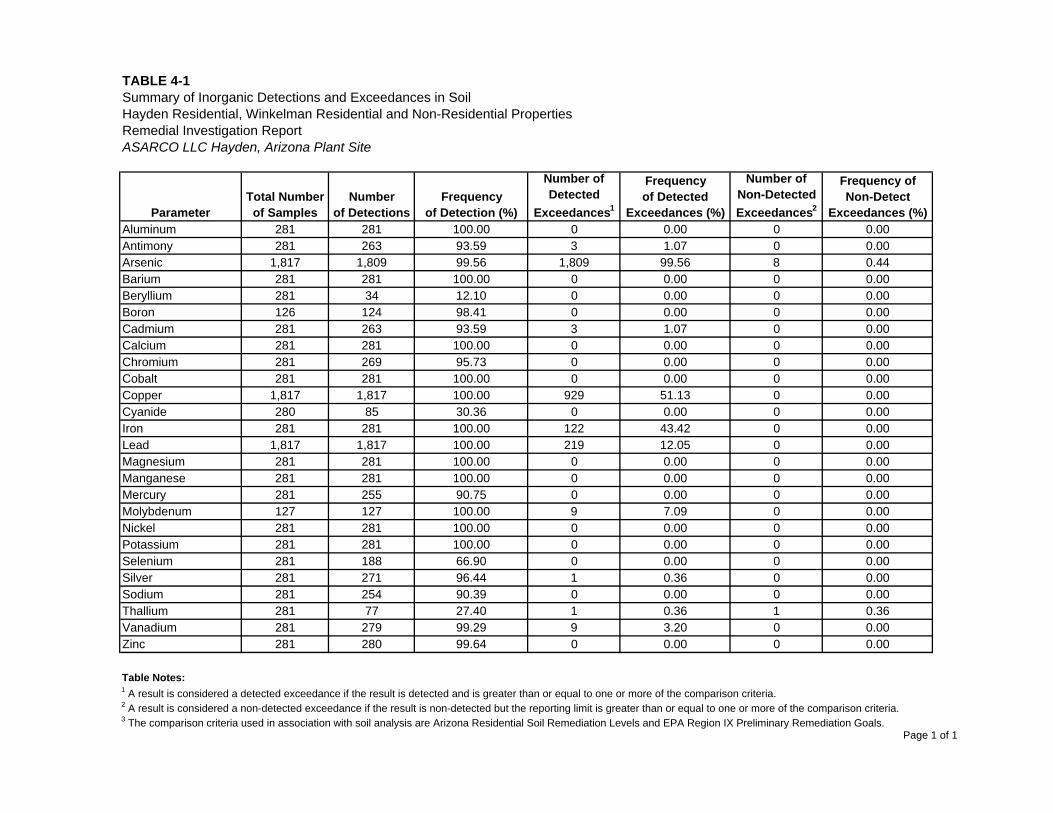
TABLE 4-1Summary of Inorganic Detections and Exceedances in SoilHayden Residential, Winkelman Residential and Non-Residential PropertiesRemedial Investigation ReportASARCO LLC Hayden, Arizona Plant Site
ParameterTotal Numberof Samples
Numberof Detections
Frequencyof Detection (%)
Number ofDetected
Exceedances1
Frequencyof Detected
Exceedances (%)
Number ofNon-DetectedExceedances2
Frequency ofNon-Detect
Exceedances (%)Aluminum 281 281 100.00 0 0.00 0 0.00Antimony 281 263 93.59 3 1.07 0 0.00Arsenic 1,817 1,809 99.56 1,809 99.56 8 0.44Barium 281 281 100.00 0 0.00 0 0.00Beryllium 281 34 12.10 0 0.00 0 0.00Boron 126 124 98.41 0 0.00 0 0.00Cadmium 281 263 93.59 3 1.07 0 0.00Calcium 281 281 100.00 0 0.00 0 0.00Chromium 281 269 95.73 0 0.00 0 0.00Cobalt 281 281 100.00 0 0.00 0 0.00Copper 1,817 1,817 100.00 929 51.13 0 0.00Cyanide 280 85 30.36 0 0.00 0 0.00Iron 281 281 100.00 122 43.42 0 0.00Lead 1,817 1,817 100.00 219 12.05 0 0.00Magnesium 281 281 100.00 0 0.00 0 0.00Manganese 281 281 100.00 0 0.00 0 0.00Mercury 281 255 90.75 0 0.00 0 0.00Molybdenum 127 127 100.00 9 7.09 0 0.00Nickel 281 281 100.00 0 0.00 0 0.00Potassium 281 281 100.00 0 0.00 0 0.00Selenium 281 188 66.90 0 0.00 0 0.00Silver 281 271 96.44 1 0.36 0 0.00Sodium 281 254 90.39 0 0.00 0 0.00Thallium 281 77 27.40 1 0.36 1 0.36Vanadium 281 279 99.29 9 3.20 0 0.00Zinc 281 280 99.64 0 0.00 0 0.00
Table Notes:1 A result is considered a detected exceedance if the result is detected and is greater than or equal to one or more of the comparison criteria.2 A result is considered a non-detected exceedance if the result is non-detected but the reporting limit is greater than or equal to one or more of the comparison criteria.3 The comparison criteria used in association with soil analysis are Arizona Residential Soil Remediation Levels and EPA Region IX Preliminary Remediation Goals.
Page 1 of 1
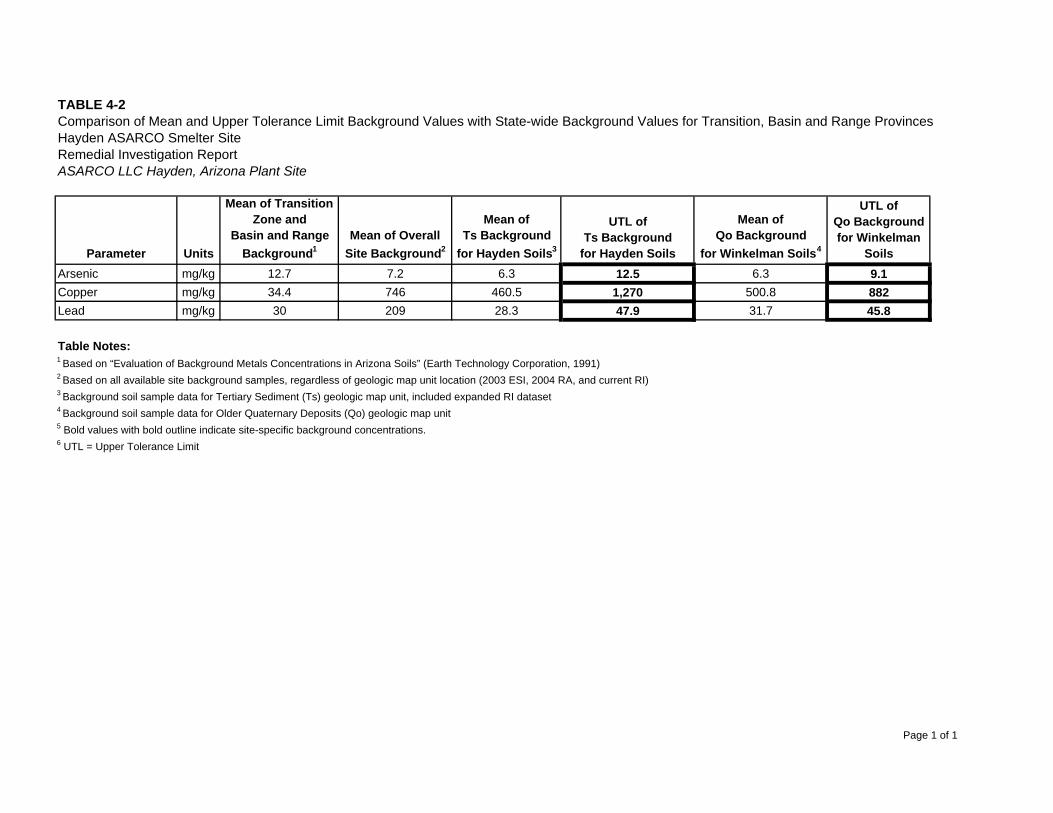
TABLE 4-2Comparison of Mean and Upper Tolerance Limit Background Values with State-wide Background Values for Transition, Basin and Range ProvincesHayden ASARCO Smelter SiteRemedial Investigation ReportASARCO LLC Hayden, Arizona Plant Site
Parameter Units
Mean of Transition Zone and
Basin and Range Background1
Mean of OverallSite Background2
Mean ofTs Background
for Hayden Soils3
UTL ofTs Background
for Hayden Soils
Mean ofQo Background
for Winkelman Soils4
UTL ofQo Backgroundfor Winkelman
SoilsArsenic mg/kg 12.7 7.2 6.3 12.5 6.3 9.1Copper mg/kg 34.4 746 460.5 1,270 500.8 882Lead mg/kg 30 209 28.3 47.9 31.7 45.8
Table Notes:1 Based on “Evaluation of Background Metals Concentrations in Arizona Soils” (Earth Technology Corporation, 1991)2 Based on all available site background samples, regardless of geologic map unit location (2003 ESI, 2004 RA, and current RI)3 Background soil sample data for Tertiary Sediment (Ts) geologic map unit, included expanded RI dataset4 Background soil sample data for Older Quaternary Deposits (Qo) geologic map unit5 Bold values with bold outline indicate site-specific background concentrations.6 UTL = Upper Tolerance Limit
Page 1 of 1
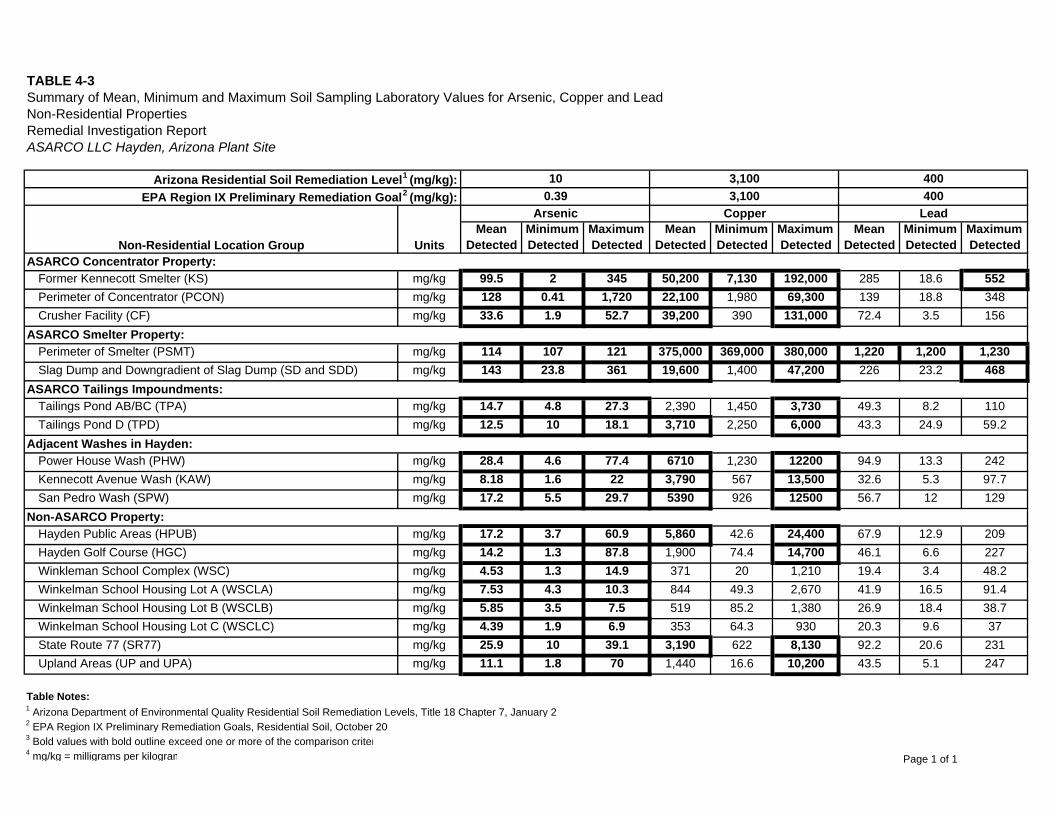
TABLE 4-3Summary of Mean, Minimum and Maximum Soil Sampling Laboratory Values for Arsenic, Copper and LeadNon-Residential PropertiesRemedial Investigation ReportASARCO LLC Hayden, Arizona Plant Site
MeanDetected
MinimumDetected
MaximumDetected
MeanDetected
MinimumDetected
MaximumDetected
MeanDetected
MinimumDetected
MaximumDetected
Former Kennecott Smelter (KS) mg/kg 99.5 2 345 50,200 7,130 192,000 285 18.6 552Perimeter of Concentrator (PCON) mg/kg 128 0.41 1,720 22,100 1,980 69,300 139 18.8 348Crusher Facility (CF) mg/kg 33.6 1.9 52.7 39,200 390 131,000 72.4 3.5 156
Perimeter of Smelter (PSMT) mg/kg 114 107 121 375,000 369,000 380,000 1,220 1,200 1,230Slag Dump and Downgradient of Slag Dump (SD and SDD) mg/kg 143 23.8 361 19,600 1,400 47,200 226 23.2 468
Tailings Pond AB/BC (TPA) mg/kg 14.7 4.8 27.3 2,390 1,450 3,730 49.3 8.2 110Tailings Pond D (TPD) mg/kg 12.5 10 18.1 3,710 2,250 6,000 43.3 24.9 59.2
Power House Wash (PHW) mg/kg 28.4 4.6 77.4 6710 1,230 12200 94.9 13.3 242Kennecott Avenue Wash (KAW) mg/kg 8.18 1.6 22 3,790 567 13,500 32.6 5.3 97.7San Pedro Wash (SPW) mg/kg 17.2 5.5 29.7 5390 926 12500 56.7 12 129
Hayden Public Areas (HPUB) mg/kg 17.2 3.7 60.9 5,860 42.6 24,400 67.9 12.9 209Hayden Golf Course (HGC) mg/kg 14.2 1.3 87.8 1,900 74.4 14,700 46.1 6.6 227Winkleman School Complex (WSC) mg/kg 4.53 1.3 14.9 371 20 1,210 19.4 3.4 48.2Winkelman School Housing Lot A (WSCLA) mg/kg 7.53 4.3 10.3 844 49.3 2,670 41.9 16.5 91.4Winkelman School Housing Lot B (WSCLB) mg/kg 5.85 3.5 7.5 519 85.2 1,380 26.9 18.4 38.7Winkelman School Housing Lot C (WSCLC) mg/kg 4.39 1.9 6.9 353 64.3 930 20.3 9.6 37State Route 77 (SR77) mg/kg 25.9 10 39.1 3,190 622 8,130 92.2 20.6 231Upland Areas (UP and UPA) mg/kg 11.1 1.8 70 1,440 16.6 10,200 43.5 5.1 247
Table Notes:1 Arizona Department of Environmental Quality Residential Soil Remediation Levels, Title 18 Chapter 7, January 22 EPA Region IX Preliminary Remediation Goals, Residential Soil, October 2003 Bold values with bold outline exceed one or more of the comparison criter4 mg/kg = milligrams per kilogram
Adjacent Washes in Hayden:
Non-ASARCO Property:
ASARCO Concentrator Property:
ASARCO Smelter Property:
ASARCO Tailings Impoundments:
400400
Arizona Residential Soil Remediation Level1 (mg/kg):EPA Region IX Preliminary Remediation Goal2 (mg/kg):
3,1003,100
100.39
Arsenic Copper Lead
Non-Residential Location Group Units
Page 1 of 1
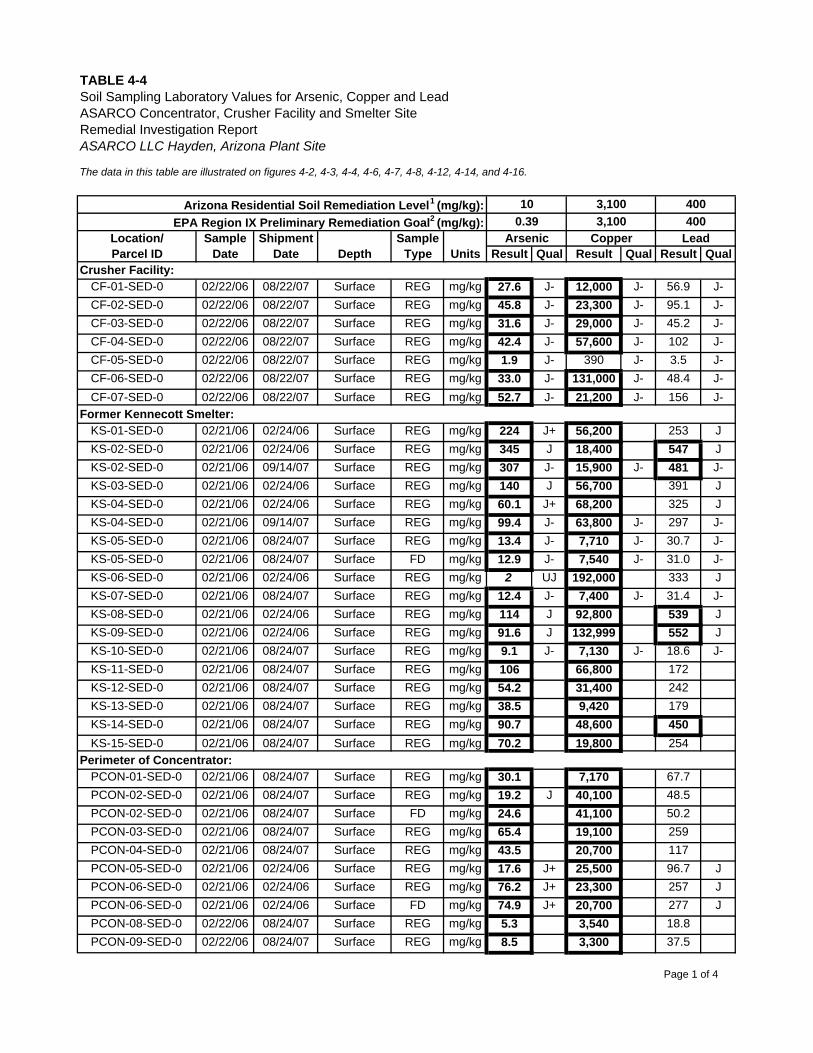
TABLE 4-4Soil Sampling Laboratory Values for Arsenic, Copper and LeadASARCO Concentrator, Crusher Facility and Smelter SiteRemedial Investigation ReportASARCO LLC Hayden, Arizona Plant Site
The data in this table are illustrated on figures 4-2, 4-3, 4-4, 4-6, 4-7, 4-8, 4-12, 4-14, and 4-16.
Result Qual Result Qual Result Qual
CF-01-SED-0 02/22/06 08/22/07 Surface REG mg/kg 27.6 J- 12,000 J- 56.9 J-CF-02-SED-0 02/22/06 08/22/07 Surface REG mg/kg 45.8 J- 23,300 J- 95.1 J-CF-03-SED-0 02/22/06 08/22/07 Surface REG mg/kg 31.6 J- 29,000 J- 45.2 J-CF-04-SED-0 02/22/06 08/22/07 Surface REG mg/kg 42.4 J- 57,600 J- 102 J-CF-05-SED-0 02/22/06 08/22/07 Surface REG mg/kg 1.9 J- 390 J- 3.5 J-CF-06-SED-0 02/22/06 08/22/07 Surface REG mg/kg 33.0 J- 131,000 J- 48.4 J-CF-07-SED-0 02/22/06 08/22/07 Surface REG mg/kg 52.7 J- 21,200 J- 156 J-
KS-01-SED-0 02/21/06 02/24/06 Surface REG mg/kg 224 J+ 56,200 253 JKS-02-SED-0 02/21/06 02/24/06 Surface REG mg/kg 345 J 18,400 547 JKS-02-SED-0 02/21/06 09/14/07 Surface REG mg/kg 307 J- 15,900 J- 481 J-KS-03-SED-0 02/21/06 02/24/06 Surface REG mg/kg 140 J 56,700 391 JKS-04-SED-0 02/21/06 02/24/06 Surface REG mg/kg 60.1 J+ 68,200 325 JKS-04-SED-0 02/21/06 09/14/07 Surface REG mg/kg 99.4 J- 63,800 J- 297 J-KS-05-SED-0 02/21/06 08/24/07 Surface REG mg/kg 13.4 J- 7,710 J- 30.7 J-KS-05-SED-0 02/21/06 08/24/07 Surface FD mg/kg 12.9 J- 7,540 J- 31.0 J-KS-06-SED-0 02/21/06 02/24/06 Surface REG mg/kg 2 UJ 192,000 333 JKS-07-SED-0 02/21/06 08/24/07 Surface REG mg/kg 12.4 J- 7,400 J- 31.4 J-KS-08-SED-0 02/21/06 02/24/06 Surface REG mg/kg 114 J 92,800 539 JKS-09-SED-0 02/21/06 02/24/06 Surface REG mg/kg 91.6 J 132,999 552 JKS-10-SED-0 02/21/06 08/24/07 Surface REG mg/kg 9.1 J- 7,130 J- 18.6 J-KS-11-SED-0 02/21/06 08/24/07 Surface REG mg/kg 106 66,800 172KS-12-SED-0 02/21/06 08/24/07 Surface REG mg/kg 54.2 31,400 242KS-13-SED-0 02/21/06 08/24/07 Surface REG mg/kg 38.5 9,420 179KS-14-SED-0 02/21/06 08/24/07 Surface REG mg/kg 90.7 48,600 450KS-15-SED-0 02/21/06 08/24/07 Surface REG mg/kg 70.2 19,800 254
PCON-01-SED-0 02/21/06 08/24/07 Surface REG mg/kg 30.1 7,170 67.7PCON-02-SED-0 02/21/06 08/24/07 Surface REG mg/kg 19.2 J 40,100 48.5PCON-02-SED-0 02/21/06 08/24/07 Surface FD mg/kg 24.6 41,100 50.2PCON-03-SED-0 02/21/06 08/24/07 Surface REG mg/kg 65.4 19,100 259PCON-04-SED-0 02/21/06 08/24/07 Surface REG mg/kg 43.5 20,700 117PCON-05-SED-0 02/21/06 02/24/06 Surface REG mg/kg 17.6 J+ 25,500 96.7 JPCON-06-SED-0 02/21/06 02/24/06 Surface REG mg/kg 76.2 J+ 23,300 257 JPCON-06-SED-0 02/21/06 02/24/06 Surface FD mg/kg 74.9 J+ 20,700 277 JPCON-08-SED-0 02/22/06 08/24/07 Surface REG mg/kg 5.3 3,540 18.8PCON-09-SED-0 02/22/06 08/24/07 Surface REG mg/kg 8.5 3,300 37.5
Arizona Residential Soil Remediation Level1 (mg/kg):EPA Region IX Preliminary Remediation Goal2 (mg/kg):
SampleType
SampleDate
Location/Parcel ID
LeadArsenicShipmentDate Units
Former Kennecott Smelter:
Perimeter of Concentrator:
DepthCopper
Crusher Facility:
3,100 40010 3,100 400
0.39
Page 1 of 4
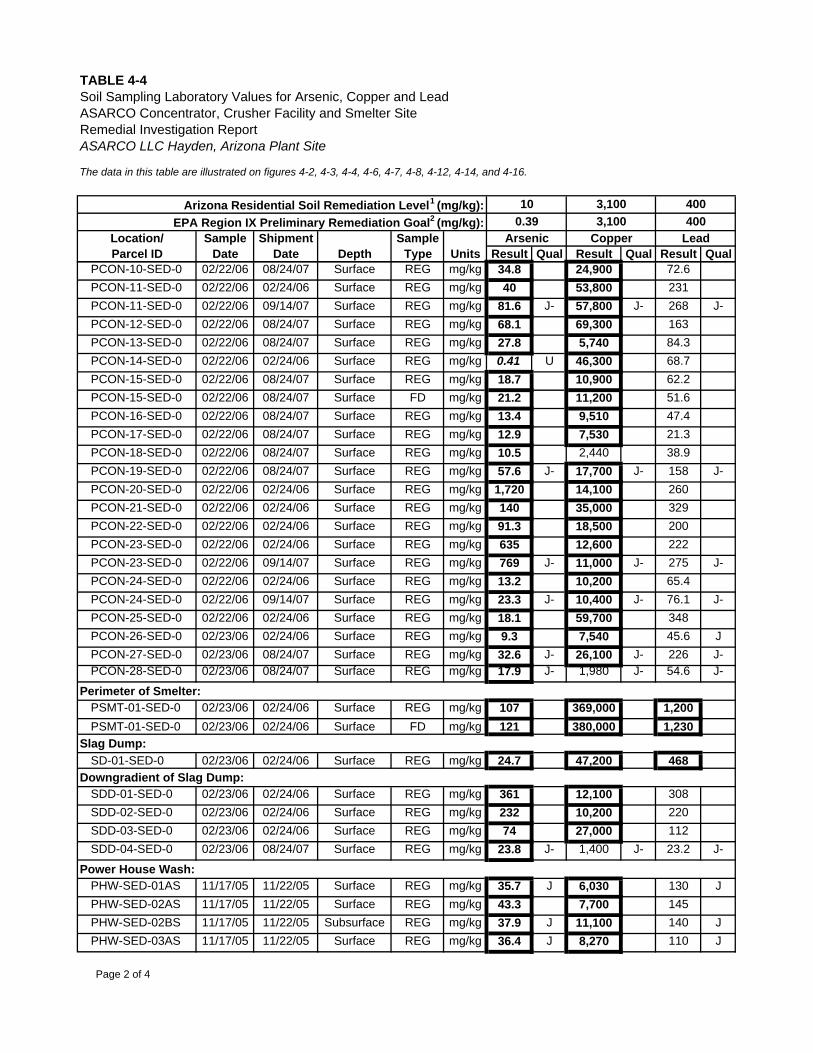
TABLE 4-4Soil Sampling Laboratory Values for Arsenic, Copper and LeadASARCO Concentrator, Crusher Facility and Smelter SiteRemedial Investigation ReportASARCO LLC Hayden, Arizona Plant Site
The data in this table are illustrated on figures 4-2, 4-3, 4-4, 4-6, 4-7, 4-8, 4-12, 4-14, and 4-16.
Result Qual Result Qual Result Qual
Arizona Residential Soil Remediation Level1 (mg/kg):EPA Region IX Preliminary Remediation Goal2 (mg/kg):
SampleType
SampleDate
Location/Parcel ID
LeadArsenicShipmentDate UnitsDepth
Copper3,100 400
10 3,100 4000.39
PCON-10-SED-0 02/22/06 08/24/07 Surface REG mg/kg 34.8 24,900 72.6PCON-11-SED-0 02/22/06 02/24/06 Surface REG mg/kg 40 53,800 231PCON-11-SED-0 02/22/06 09/14/07 Surface REG mg/kg 81.6 J- 57,800 J- 268 J-PCON-12-SED-0 02/22/06 08/24/07 Surface REG mg/kg 68.1 69,300 163PCON-13-SED-0 02/22/06 08/24/07 Surface REG mg/kg 27.8 5,740 84.3PCON-14-SED-0 02/22/06 02/24/06 Surface REG mg/kg 0.41 U 46,300 68.7PCON-15-SED-0 02/22/06 08/24/07 Surface REG mg/kg 18.7 10,900 62.2PCON-15-SED-0 02/22/06 08/24/07 Surface FD mg/kg 21.2 11,200 51.6PCON-16-SED-0 02/22/06 08/24/07 Surface REG mg/kg 13.4 9,510 47.4PCON-17-SED-0 02/22/06 08/24/07 Surface REG mg/kg 12.9 7,530 21.3PCON-18-SED-0 02/22/06 08/24/07 Surface REG mg/kg 10.5 2,440 38.9PCON-19-SED-0 02/22/06 08/24/07 Surface REG mg/kg 57.6 J- 17,700 J- 158 J-PCON-20-SED-0 02/22/06 02/24/06 Surface REG mg/kg 1,720 14,100 260PCON-21-SED-0 02/22/06 02/24/06 Surface REG mg/kg 140 35,000 329PCON-22-SED-0 02/22/06 02/24/06 Surface REG mg/kg 91.3 18,500 200PCON-23-SED-0 02/22/06 02/24/06 Surface REG mg/kg 635 12,600 222PCON-23-SED-0 02/22/06 09/14/07 Surface REG mg/kg 769 J- 11,000 J- 275 J-PCON-24-SED-0 02/22/06 02/24/06 Surface REG mg/kg 13.2 10,200 65.4PCON-24-SED-0 02/22/06 09/14/07 Surface REG mg/kg 23.3 J- 10,400 J- 76.1 J-PCON-25-SED-0 02/22/06 02/24/06 Surface REG mg/kg 18.1 59,700 348PCON-26-SED-0 02/23/06 02/24/06 Surface REG mg/kg 9.3 7,540 45.6 JPCON-27-SED-0 02/23/06 08/24/07 Surface REG mg/kg 32.6 J- 26,100 J- 226 J-PCON-28-SED-0 02/23/06 08/24/07 Surface REG mg/kg 17.9 J- 1,980 J- 54.6 J-
PSMT-01-SED-0 02/23/06 02/24/06 Surface REG mg/kg 107 369,000 1,200PSMT-01-SED-0 02/23/06 02/24/06 Surface FD mg/kg 121 380,000 1,230
SD-01-SED-0 02/23/06 02/24/06 Surface REG mg/kg 24.7 47,200 468
SDD-01-SED-0 02/23/06 02/24/06 Surface REG mg/kg 361 12,100 308SDD-02-SED-0 02/23/06 02/24/06 Surface REG mg/kg 232 10,200 220SDD-03-SED-0 02/23/06 02/24/06 Surface REG mg/kg 74 27,000 112SDD-04-SED-0 02/23/06 08/24/07 Surface REG mg/kg 23.8 J- 1,400 J- 23.2 J-
PHW-SED-01AS 11/17/05 11/22/05 Surface REG mg/kg 35.7 J 6,030 130 JPHW-SED-02AS 11/17/05 11/22/05 Surface REG mg/kg 43.3 7,700 145PHW-SED-02BS 11/17/05 11/22/05 Subsurface REG mg/kg 37.9 J 11,100 140 JPHW-SED-03AS 11/17/05 11/22/05 Surface REG mg/kg 36.4 J 8,270 110 J
Power House Wash:
Perimeter of Smelter:
Slag Dump:
Downgradient of Slag Dump:
Page 2 of 4
I I I I I I I I I I I I
I I I I I I
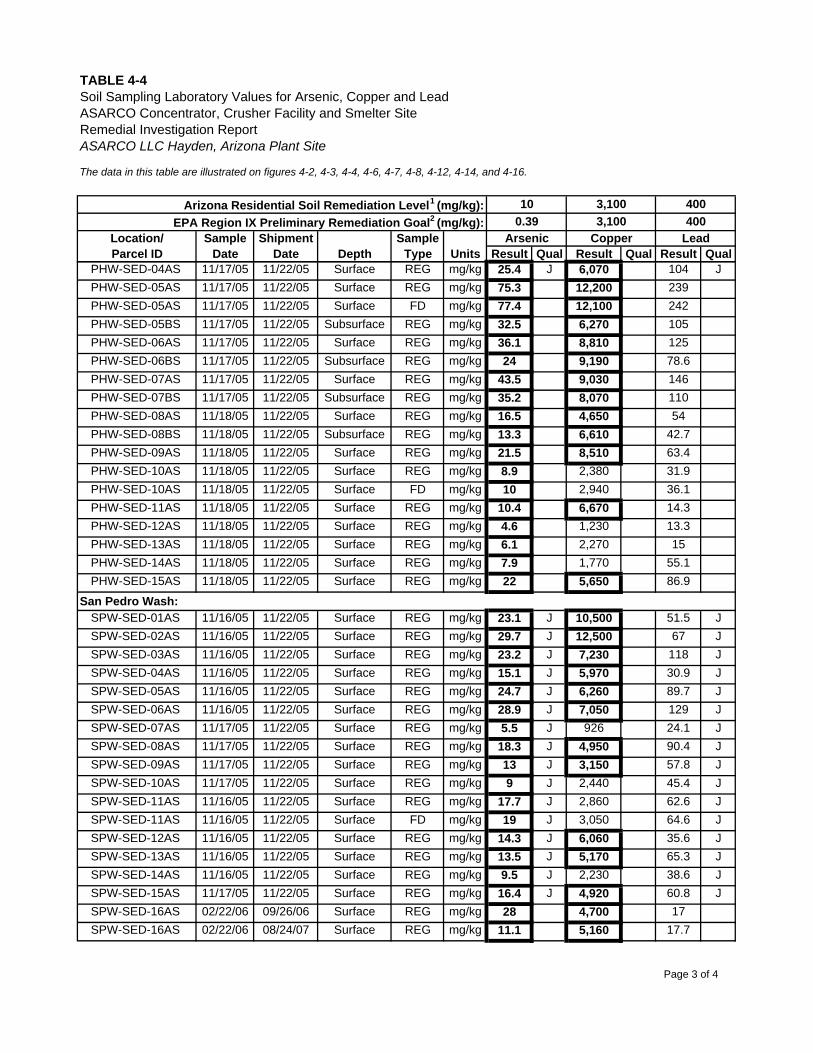
TABLE 4-4Soil Sampling Laboratory Values for Arsenic, Copper and LeadASARCO Concentrator, Crusher Facility and Smelter SiteRemedial Investigation ReportASARCO LLC Hayden, Arizona Plant Site
The data in this table are illustrated on figures 4-2, 4-3, 4-4, 4-6, 4-7, 4-8, 4-12, 4-14, and 4-16.
Result Qual Result Qual Result Qual
Arizona Residential Soil Remediation Level1 (mg/kg):EPA Region IX Preliminary Remediation Goal2 (mg/kg):
SampleType
SampleDate
Location/Parcel ID
LeadArsenicShipmentDate UnitsDepth
Copper3,100 400
10 3,100 4000.39
PHW-SED-04AS 11/17/05 11/22/05 Surface REG mg/kg 25.4 J 6,070 104 JPHW-SED-05AS 11/17/05 11/22/05 Surface REG mg/kg 75.3 12,200 239PHW-SED-05AS 11/17/05 11/22/05 Surface FD mg/kg 77.4 12,100 242PHW-SED-05BS 11/17/05 11/22/05 Subsurface REG mg/kg 32.5 6,270 105PHW-SED-06AS 11/17/05 11/22/05 Surface REG mg/kg 36.1 8,810 125PHW-SED-06BS 11/17/05 11/22/05 Subsurface REG mg/kg 24 9,190 78.6PHW-SED-07AS 11/17/05 11/22/05 Surface REG mg/kg 43.5 9,030 146PHW-SED-07BS 11/17/05 11/22/05 Subsurface REG mg/kg 35.2 8,070 110PHW-SED-08AS 11/18/05 11/22/05 Surface REG mg/kg 16.5 4,650 54PHW-SED-08BS 11/18/05 11/22/05 Subsurface REG mg/kg 13.3 6,610 42.7PHW-SED-09AS 11/18/05 11/22/05 Surface REG mg/kg 21.5 8,510 63.4PHW-SED-10AS 11/18/05 11/22/05 Surface REG mg/kg 8.9 2,380 31.9PHW-SED-10AS 11/18/05 11/22/05 Surface FD mg/kg 10 2,940 36.1PHW-SED-11AS 11/18/05 11/22/05 Surface REG mg/kg 10.4 6,670 14.3PHW-SED-12AS 11/18/05 11/22/05 Surface REG mg/kg 4.6 1,230 13.3PHW-SED-13AS 11/18/05 11/22/05 Surface REG mg/kg 6.1 2,270 15PHW-SED-14AS 11/18/05 11/22/05 Surface REG mg/kg 7.9 1,770 55.1PHW-SED-15AS 11/18/05 11/22/05 Surface REG mg/kg 22 5,650 86.9
SPW-SED-01AS 11/16/05 11/22/05 Surface REG mg/kg 23.1 J 10,500 51.5 JSPW-SED-02AS 11/16/05 11/22/05 Surface REG mg/kg 29.7 J 12,500 67 JSPW-SED-03AS 11/16/05 11/22/05 Surface REG mg/kg 23.2 J 7,230 118 JSPW-SED-04AS 11/16/05 11/22/05 Surface REG mg/kg 15.1 J 5,970 30.9 JSPW-SED-05AS 11/16/05 11/22/05 Surface REG mg/kg 24.7 J 6,260 89.7 JSPW-SED-06AS 11/16/05 11/22/05 Surface REG mg/kg 28.9 J 7,050 129 JSPW-SED-07AS 11/17/05 11/22/05 Surface REG mg/kg 5.5 J 926 24.1 JSPW-SED-08AS 11/17/05 11/22/05 Surface REG mg/kg 18.3 J 4,950 90.4 JSPW-SED-09AS 11/17/05 11/22/05 Surface REG mg/kg 13 J 3,150 57.8 JSPW-SED-10AS 11/17/05 11/22/05 Surface REG mg/kg 9 J 2,440 45.4 JSPW-SED-11AS 11/16/05 11/22/05 Surface REG mg/kg 17.7 J 2,860 62.6 JSPW-SED-11AS 11/16/05 11/22/05 Surface FD mg/kg 19 J 3,050 64.6 JSPW-SED-12AS 11/16/05 11/22/05 Surface REG mg/kg 14.3 J 6,060 35.6 JSPW-SED-13AS 11/16/05 11/22/05 Surface REG mg/kg 13.5 J 5,170 65.3 JSPW-SED-14AS 11/16/05 11/22/05 Surface REG mg/kg 9.5 J 2,230 38.6 JSPW-SED-15AS 11/17/05 11/22/05 Surface REG mg/kg 16.4 J 4,920 60.8 JSPW-SED-16AS 02/22/06 09/26/06 Surface REG mg/kg 28 4,700 17SPW-SED-16AS 02/22/06 08/24/07 Surface REG mg/kg 11.1 5,160 17.7
San Pedro Wash:
Page 3 of 4

TABLE 4-4Soil Sampling Laboratory Values for Arsenic, Copper and LeadASARCO Concentrator, Crusher Facility and Smelter SiteRemedial Investigation ReportASARCO LLC Hayden, Arizona Plant Site
The data in this table are illustrated on figures 4-2, 4-3, 4-4, 4-6, 4-7, 4-8, 4-12, 4-14, and 4-16.
Result Qual Result Qual Result Qual
Arizona Residential Soil Remediation Level1 (mg/kg):EPA Region IX Preliminary Remediation Goal2 (mg/kg):
SampleType
SampleDate
Location/Parcel ID
LeadArsenicShipmentDate UnitsDepth
Copper3,100 400
10 3,100 4000.39
SPW-SED-17AS 02/22/06 08/24/07 Surface REG mg/kg 6.4 7,250 12.0
KAW-01-SED-0 02/22/06 08/24/07 Surface REG mg/kg 3.1 J- 569 J- 9.6 J-KAW-02-SED-0 02/22/06 02/24/06 Surface REG mg/kg 1.6 2,900 9.6KAW-03-SED-0 02/22/06 08/24/07 Surface REG mg/kg 2.7 J- 3,920 J- 7.3 J-KAW-04-SED-0 02/22/06 08/24/07 Surface REG mg/kg 4.4 J- 1,840 J- 11.5 J-KAW-05-SED-0 02/22/06 08/24/07 Surface REG mg/kg 7.5 J- 1,650 J- 31.3 J-KAW-05-SED-0 02/22/06 08/24/07 Surface FD mg/kg 6.8 J- 1,750 J- 31.7 J-KAW-06-SED-0 02/22/06 08/24/07 Surface REG mg/kg 15.5 J- 4,720 J- 81.5 J-KAW-07-SED-0 02/22/06 08/24/07 Surface REG mg/kg 2.6 J- 567 J- 7.9 J-KAW-08-SED-0 02/22/06 08/24/07 Surface REG mg/kg 2.2 J- 628 J- 5.3 J-KAW-09-SED-0 02/23/06 08/24/07 Surface REG mg/kg 21.6 J- 13,500 J- 64.9 J-KAW-10-SED-0 02/23/06 08/24/07 Surface REG mg/kg 22.0 J- 9,620 J- 97.7 J-
Table Notes:1 Arizona Department of Environmental Quality Residential Soil Remediation Levels, Title 18 Chapter 7, January 20082 EPA Region IX Preliminary Remediation Goals, Residential Soil, October 20043 Bold values with bold outline exceed one or more of the comparison criteria.4 Bold italicized values have detection limits above one or more of the comparison criteria.5 FD = Field duplicate6 J = Estimated value7 J+ = Estimated value, may be biased high8 J- = Estimated value, may be biased low9 mg/kg = milligrams per kilogram10 REG = Regular sample11 Subsurface = The sample was collected approximately 10-12 inches below surface.12 Surface = The sample was collected approximately 0-2 inches below surface.13 U = Not detected; reporting limit is shown in place of a result.14 UJ = Not detected; reporting limit is approximate and is shown in place of a result.
Kennecott Avenue Wash:
Page 4 of 4
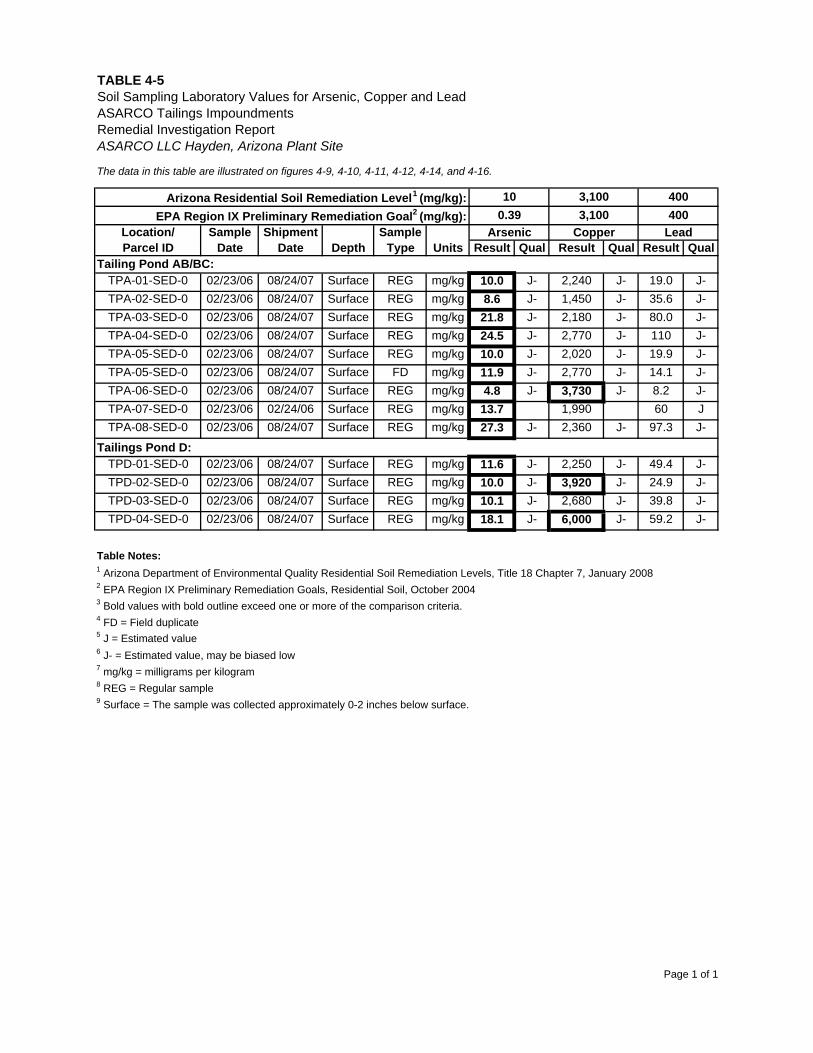
The data in this table are illustrated on figures 4-9, 4-10, 4-11, 4-12, 4-14, and 4-16.
Result Qual Result Qual Result Qual
TPA-01-SED-0 02/23/06 08/24/07 Surface REG mg/kg 10.0 J- 2,240 J- 19.0 J-TPA-02-SED-0 02/23/06 08/24/07 Surface REG mg/kg 8.6 J- 1,450 J- 35.6 J-TPA-03-SED-0 02/23/06 08/24/07 Surface REG mg/kg 21.8 J- 2,180 J- 80.0 J-TPA-04-SED-0 02/23/06 08/24/07 Surface REG mg/kg 24.5 J- 2,770 J- 110 J-TPA-05-SED-0 02/23/06 08/24/07 Surface REG mg/kg 10.0 J- 2,020 J- 19.9 J-TPA-05-SED-0 02/23/06 08/24/07 Surface FD mg/kg 11.9 J- 2,770 J- 14.1 J-TPA-06-SED-0 02/23/06 08/24/07 Surface REG mg/kg 4.8 J- 3,730 J- 8.2 J-TPA-07-SED-0 02/23/06 02/24/06 Surface REG mg/kg 13.7 1,990 60 JTPA-08-SED-0 02/23/06 08/24/07 Surface REG mg/kg 27.3 J- 2,360 J- 97.3 J-
TPD-01-SED-0 02/23/06 08/24/07 Surface REG mg/kg 11.6 J- 2,250 J- 49.4 J-TPD-02-SED-0 02/23/06 08/24/07 Surface REG mg/kg 10.0 J- 3,920 J- 24.9 J-TPD-03-SED-0 02/23/06 08/24/07 Surface REG mg/kg 10.1 J- 2,680 J- 39.8 J-TPD-04-SED-0 02/23/06 08/24/07 Surface REG mg/kg 18.1 J- 6,000 J- 59.2 J-
Table Notes:1 Arizona Department of Environmental Quality Residential Soil Remediation Levels, Title 18 Chapter 7, January 20082 EPA Region IX Preliminary Remediation Goals, Residential Soil, October 20043 Bold values with bold outline exceed one or more of the comparison criteria.4 FD = Field duplicate
6 J- = Estimated value, may be biased low7 mg/kg = milligrams per kilogram8 REG = Regular sample9 Surface = The sample was collected approximately 0-2 inches below surface.
5 J = Estimated value
Arizona Residential Soil Remediation Level1 (mg/kg):EPA Region IX Preliminary Remediation Goal2 (mg/kg):
SampleType
SampleDate
Location/Parcel ID
Tailing Pond AB/BC:
Tailings Pond D:
Copper Lead
TABLE 4-5
ArsenicShipmentDate Units
400
Depth
Soil Sampling Laboratory Values for Arsenic, Copper and LeadASARCO Tailings ImpoundmentsRemedial Investigation ReportASARCO LLC Hayden, Arizona Plant Site
4000.39 3,10010 3,100
Page 1 of 1
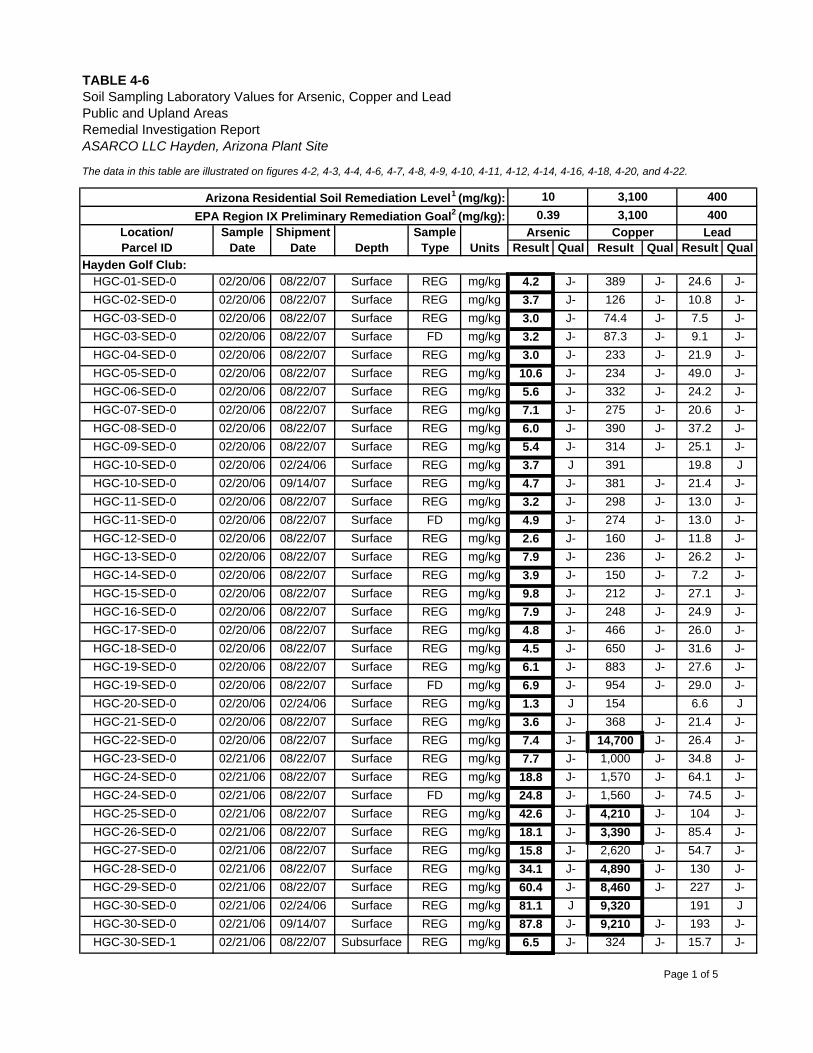
The data in this table are illustrated on figures 4-2, 4-3, 4-4, 4-6, 4-7, 4-8, 4-9, 4-10, 4-11, 4-12, 4-14, 4-16, 4-18, 4-20, and 4-22.
Result Qual Result Qual Result Qual
HGC-01-SED-0 02/20/06 08/22/07 Surface REG mg/kg 4.2 J- 389 J- 24.6 J-HGC-02-SED-0 02/20/06 08/22/07 Surface REG mg/kg 3.7 J- 126 J- 10.8 J-HGC-03-SED-0 02/20/06 08/22/07 Surface REG mg/kg 3.0 J- 74.4 J- 7.5 J-HGC-03-SED-0 02/20/06 08/22/07 Surface FD mg/kg 3.2 J- 87.3 J- 9.1 J-HGC-04-SED-0 02/20/06 08/22/07 Surface REG mg/kg 3.0 J- 233 J- 21.9 J-HGC-05-SED-0 02/20/06 08/22/07 Surface REG mg/kg 10.6 J- 234 J- 49.0 J-HGC-06-SED-0 02/20/06 08/22/07 Surface REG mg/kg 5.6 J- 332 J- 24.2 J-HGC-07-SED-0 02/20/06 08/22/07 Surface REG mg/kg 7.1 J- 275 J- 20.6 J-HGC-08-SED-0 02/20/06 08/22/07 Surface REG mg/kg 6.0 J- 390 J- 37.2 J-HGC-09-SED-0 02/20/06 08/22/07 Surface REG mg/kg 5.4 J- 314 J- 25.1 J-HGC-10-SED-0 02/20/06 02/24/06 Surface REG mg/kg 3.7 J 391 19.8 JHGC-10-SED-0 02/20/06 09/14/07 Surface REG mg/kg 4.7 J- 381 J- 21.4 J-HGC-11-SED-0 02/20/06 08/22/07 Surface REG mg/kg 3.2 J- 298 J- 13.0 J-HGC-11-SED-0 02/20/06 08/22/07 Surface FD mg/kg 4.9 J- 274 J- 13.0 J-HGC-12-SED-0 02/20/06 08/22/07 Surface REG mg/kg 2.6 J- 160 J- 11.8 J-HGC-13-SED-0 02/20/06 08/22/07 Surface REG mg/kg 7.9 J- 236 J- 26.2 J-HGC-14-SED-0 02/20/06 08/22/07 Surface REG mg/kg 3.9 J- 150 J- 7.2 J-HGC-15-SED-0 02/20/06 08/22/07 Surface REG mg/kg 9.8 J- 212 J- 27.1 J-HGC-16-SED-0 02/20/06 08/22/07 Surface REG mg/kg 7.9 J- 248 J- 24.9 J-HGC-17-SED-0 02/20/06 08/22/07 Surface REG mg/kg 4.8 J- 466 J- 26.0 J-HGC-18-SED-0 02/20/06 08/22/07 Surface REG mg/kg 4.5 J- 650 J- 31.6 J-HGC-19-SED-0 02/20/06 08/22/07 Surface REG mg/kg 6.1 J- 883 J- 27.6 J-HGC-19-SED-0 02/20/06 08/22/07 Surface FD mg/kg 6.9 J- 954 J- 29.0 J-HGC-20-SED-0 02/20/06 02/24/06 Surface REG mg/kg 1.3 J 154 6.6 JHGC-21-SED-0 02/20/06 08/22/07 Surface REG mg/kg 3.6 J- 368 J- 21.4 J-HGC-22-SED-0 02/20/06 08/22/07 Surface REG mg/kg 7.4 J- 14,700 J- 26.4 J-HGC-23-SED-0 02/21/06 08/22/07 Surface REG mg/kg 7.7 J- 1,000 J- 34.8 J-HGC-24-SED-0 02/21/06 08/22/07 Surface REG mg/kg 18.8 J- 1,570 J- 64.1 J-HGC-24-SED-0 02/21/06 08/22/07 Surface FD mg/kg 24.8 J- 1,560 J- 74.5 J-HGC-25-SED-0 02/21/06 08/22/07 Surface REG mg/kg 42.6 J- 4,210 J- 104 J-HGC-26-SED-0 02/21/06 08/22/07 Surface REG mg/kg 18.1 J- 3,390 J- 85.4 J-HGC-27-SED-0 02/21/06 08/22/07 Surface REG mg/kg 15.8 J- 2,620 J- 54.7 J-HGC-28-SED-0 02/21/06 08/22/07 Surface REG mg/kg 34.1 J- 4,890 J- 130 J-HGC-29-SED-0 02/21/06 08/22/07 Surface REG mg/kg 60.4 J- 8,460 J- 227 J-HGC-30-SED-0 02/21/06 02/24/06 Surface REG mg/kg 81.1 J 9,320 191 JHGC-30-SED-0 02/21/06 09/14/07 Surface REG mg/kg 87.8 J- 9,210 J- 193 J-HGC-30-SED-1 02/21/06 08/22/07 Subsurface REG mg/kg 6.5 J- 324 J- 15.7 J-
TABLE 4-6
DepthHayden Golf Club:
Soil Sampling Laboratory Values for Arsenic, Copper and LeadPublic and Upland AreasRemedial Investigation ReportASARCO LLC Hayden, Arizona Plant Site
400EPA Region IX Preliminary Remediation Goal2 (mg/kg):Sample
TypeSample
DateLocation/Parcel ID
0.39 3,10010 3,100 400
Copper LeadArsenicShipmentDate Units
Arizona Residential Soil Remediation Level1 (mg/kg):
Page 1 of 5
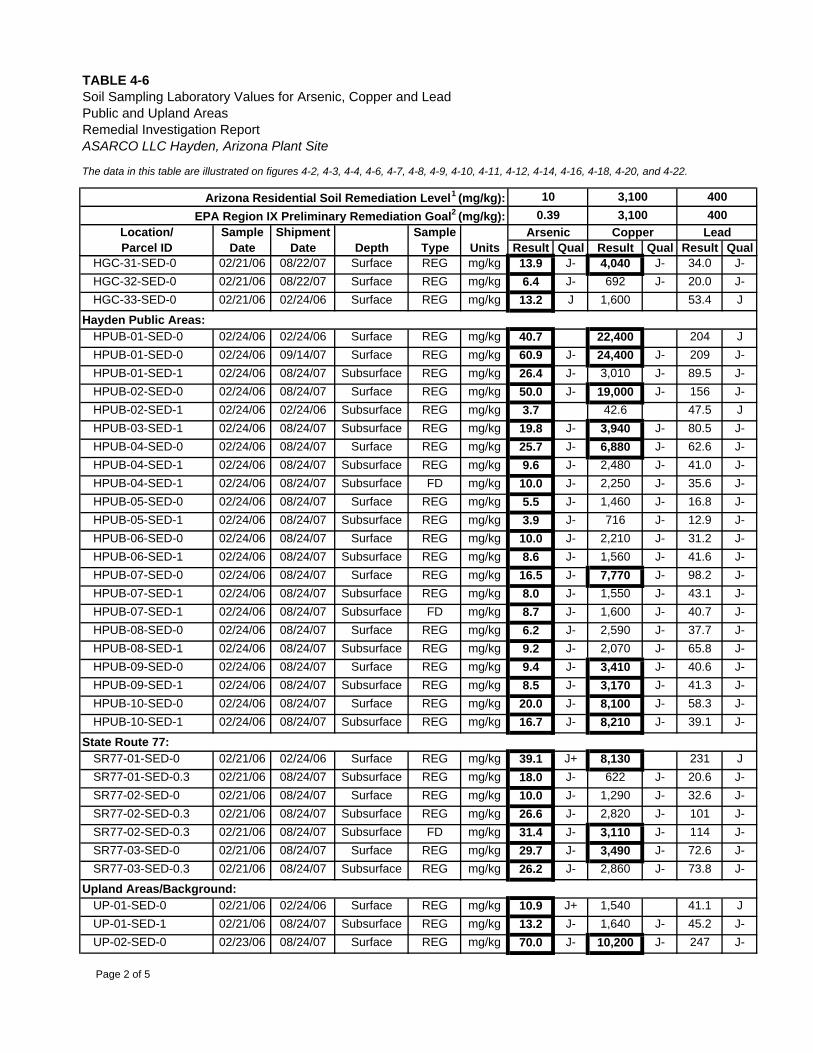
The data in this table are illustrated on figures 4-2, 4-3, 4-4, 4-6, 4-7, 4-8, 4-9, 4-10, 4-11, 4-12, 4-14, 4-16, 4-18, 4-20, and 4-22.
Result Qual Result Qual Result Qual
TABLE 4-6
Depth
Soil Sampling Laboratory Values for Arsenic, Copper and LeadPublic and Upland AreasRemedial Investigation ReportASARCO LLC Hayden, Arizona Plant Site
400EPA Region IX Preliminary Remediation Goal2 (mg/kg):Sample
TypeSample
DateLocation/Parcel ID
0.39 3,10010 3,100 400
Copper LeadArsenicShipmentDate Units
Arizona Residential Soil Remediation Level1 (mg/kg):
HGC-31-SED-0 02/21/06 08/22/07 Surface REG mg/kg 13.9 J- 4,040 J- 34.0 J-HGC-32-SED-0 02/21/06 08/22/07 Surface REG mg/kg 6.4 J- 692 J- 20.0 J-HGC-33-SED-0 02/21/06 02/24/06 Surface REG mg/kg 13.2 J 1,600 53.4 J
HPUB-01-SED-0 02/24/06 02/24/06 Surface REG mg/kg 40.7 22,400 204 JHPUB-01-SED-0 02/24/06 09/14/07 Surface REG mg/kg 60.9 J- 24,400 J- 209 J-HPUB-01-SED-1 02/24/06 08/24/07 Subsurface REG mg/kg 26.4 J- 3,010 J- 89.5 J-HPUB-02-SED-0 02/24/06 08/24/07 Surface REG mg/kg 50.0 J- 19,000 J- 156 J-HPUB-02-SED-1 02/24/06 02/24/06 Subsurface REG mg/kg 3.7 42.6 47.5 JHPUB-03-SED-1 02/24/06 08/24/07 Subsurface REG mg/kg 19.8 J- 3,940 J- 80.5 J-HPUB-04-SED-0 02/24/06 08/24/07 Surface REG mg/kg 25.7 J- 6,880 J- 62.6 J-HPUB-04-SED-1 02/24/06 08/24/07 Subsurface REG mg/kg 9.6 J- 2,480 J- 41.0 J-HPUB-04-SED-1 02/24/06 08/24/07 Subsurface FD mg/kg 10.0 J- 2,250 J- 35.6 J-HPUB-05-SED-0 02/24/06 08/24/07 Surface REG mg/kg 5.5 J- 1,460 J- 16.8 J-HPUB-05-SED-1 02/24/06 08/24/07 Subsurface REG mg/kg 3.9 J- 716 J- 12.9 J-HPUB-06-SED-0 02/24/06 08/24/07 Surface REG mg/kg 10.0 J- 2,210 J- 31.2 J-HPUB-06-SED-1 02/24/06 08/24/07 Subsurface REG mg/kg 8.6 J- 1,560 J- 41.6 J-HPUB-07-SED-0 02/24/06 08/24/07 Surface REG mg/kg 16.5 J- 7,770 J- 98.2 J-HPUB-07-SED-1 02/24/06 08/24/07 Subsurface REG mg/kg 8.0 J- 1,550 J- 43.1 J-HPUB-07-SED-1 02/24/06 08/24/07 Subsurface FD mg/kg 8.7 J- 1,600 J- 40.7 J-HPUB-08-SED-0 02/24/06 08/24/07 Surface REG mg/kg 6.2 J- 2,590 J- 37.7 J-HPUB-08-SED-1 02/24/06 08/24/07 Subsurface REG mg/kg 9.2 J- 2,070 J- 65.8 J-HPUB-09-SED-0 02/24/06 08/24/07 Surface REG mg/kg 9.4 J- 3,410 J- 40.6 J-HPUB-09-SED-1 02/24/06 08/24/07 Subsurface REG mg/kg 8.5 J- 3,170 J- 41.3 J-HPUB-10-SED-0 02/24/06 08/24/07 Surface REG mg/kg 20.0 J- 8,100 J- 58.3 J-HPUB-10-SED-1 02/24/06 08/24/07 Subsurface REG mg/kg 16.7 J- 8,210 J- 39.1 J-
SR77-01-SED-0 02/21/06 02/24/06 Surface REG mg/kg 39.1 J+ 8,130 231 JSR77-01-SED-0.3 02/21/06 08/24/07 Subsurface REG mg/kg 18.0 J- 622 J- 20.6 J-SR77-02-SED-0 02/21/06 08/24/07 Surface REG mg/kg 10.0 J- 1,290 J- 32.6 J-SR77-02-SED-0.3 02/21/06 08/24/07 Subsurface REG mg/kg 26.6 J- 2,820 J- 101 J-SR77-02-SED-0.3 02/21/06 08/24/07 Subsurface FD mg/kg 31.4 J- 3,110 J- 114 J-SR77-03-SED-0 02/21/06 08/24/07 Surface REG mg/kg 29.7 J- 3,490 J- 72.6 J-SR77-03-SED-0.3 02/21/06 08/24/07 Subsurface REG mg/kg 26.2 J- 2,860 J- 73.8 J-
UP-01-SED-0 02/21/06 02/24/06 Surface REG mg/kg 10.9 J+ 1,540 41.1 JUP-01-SED-1 02/21/06 08/24/07 Subsurface REG mg/kg 13.2 J- 1,640 J- 45.2 J-UP-02-SED-0 02/23/06 08/24/07 Surface REG mg/kg 70.0 J- 10,200 J- 247 J-
State Route 77:
Upland Areas/Background:
Hayden Public Areas:
Page 2 of 5
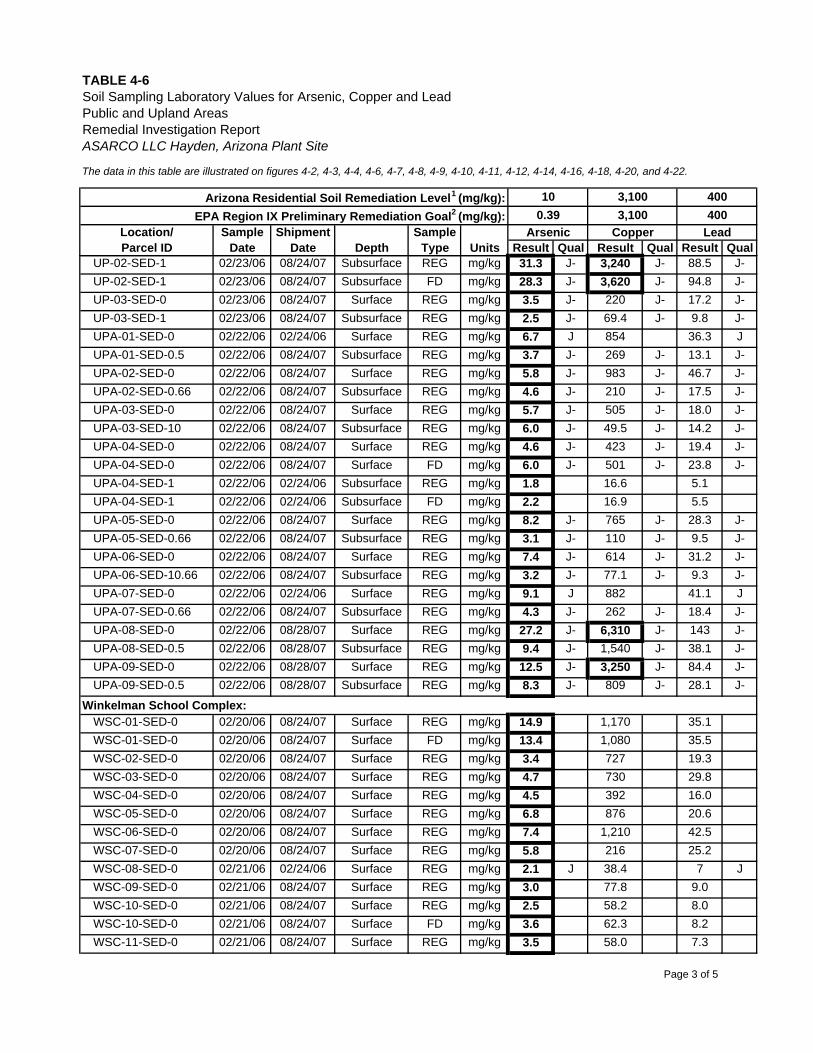
The data in this table are illustrated on figures 4-2, 4-3, 4-4, 4-6, 4-7, 4-8, 4-9, 4-10, 4-11, 4-12, 4-14, 4-16, 4-18, 4-20, and 4-22.
Result Qual Result Qual Result Qual
TABLE 4-6
Depth
Soil Sampling Laboratory Values for Arsenic, Copper and LeadPublic and Upland AreasRemedial Investigation ReportASARCO LLC Hayden, Arizona Plant Site
400EPA Region IX Preliminary Remediation Goal2 (mg/kg):Sample
TypeSample
DateLocation/Parcel ID
0.39 3,10010 3,100 400
Copper LeadArsenicShipmentDate Units
Arizona Residential Soil Remediation Level1 (mg/kg):
UP-02-SED-1 02/23/06 08/24/07 Subsurface REG mg/kg 31.3 J- 3,240 J- 88.5 J-UP-02-SED-1 02/23/06 08/24/07 Subsurface FD mg/kg 28.3 J- 3,620 J- 94.8 J-UP-03-SED-0 02/23/06 08/24/07 Surface REG mg/kg 3.5 J- 220 J- 17.2 J-UP-03-SED-1 02/23/06 08/24/07 Subsurface REG mg/kg 2.5 J- 69.4 J- 9.8 J-UPA-01-SED-0 02/22/06 02/24/06 Surface REG mg/kg 6.7 J 854 36.3 JUPA-01-SED-0.5 02/22/06 08/24/07 Subsurface REG mg/kg 3.7 J- 269 J- 13.1 J-UPA-02-SED-0 02/22/06 08/24/07 Surface REG mg/kg 5.8 J- 983 J- 46.7 J-UPA-02-SED-0.66 02/22/06 08/24/07 Subsurface REG mg/kg 4.6 J- 210 J- 17.5 J-UPA-03-SED-0 02/22/06 08/24/07 Surface REG mg/kg 5.7 J- 505 J- 18.0 J-UPA-03-SED-10 02/22/06 08/24/07 Subsurface REG mg/kg 6.0 J- 49.5 J- 14.2 J-UPA-04-SED-0 02/22/06 08/24/07 Surface REG mg/kg 4.6 J- 423 J- 19.4 J-UPA-04-SED-0 02/22/06 08/24/07 Surface FD mg/kg 6.0 J- 501 J- 23.8 J-UPA-04-SED-1 02/22/06 02/24/06 Subsurface REG mg/kg 1.8 16.6 5.1UPA-04-SED-1 02/22/06 02/24/06 Subsurface FD mg/kg 2.2 16.9 5.5UPA-05-SED-0 02/22/06 08/24/07 Surface REG mg/kg 8.2 J- 765 J- 28.3 J-UPA-05-SED-0.66 02/22/06 08/24/07 Subsurface REG mg/kg 3.1 J- 110 J- 9.5 J-UPA-06-SED-0 02/22/06 08/24/07 Surface REG mg/kg 7.4 J- 614 J- 31.2 J-UPA-06-SED-10.66 02/22/06 08/24/07 Subsurface REG mg/kg 3.2 J- 77.1 J- 9.3 J-UPA-07-SED-0 02/22/06 02/24/06 Surface REG mg/kg 9.1 J 882 41.1 JUPA-07-SED-0.66 02/22/06 08/24/07 Subsurface REG mg/kg 4.3 J- 262 J- 18.4 J-UPA-08-SED-0 02/22/06 08/28/07 Surface REG mg/kg 27.2 J- 6,310 J- 143 J-UPA-08-SED-0.5 02/22/06 08/28/07 Subsurface REG mg/kg 9.4 J- 1,540 J- 38.1 J-UPA-09-SED-0 02/22/06 08/28/07 Surface REG mg/kg 12.5 J- 3,250 J- 84.4 J-UPA-09-SED-0.5 02/22/06 08/28/07 Subsurface REG mg/kg 8.3 J- 809 J- 28.1 J-
WSC-01-SED-0 02/20/06 08/24/07 Surface REG mg/kg 14.9 1,170 35.1WSC-01-SED-0 02/20/06 08/24/07 Surface FD mg/kg 13.4 1,080 35.5WSC-02-SED-0 02/20/06 08/24/07 Surface REG mg/kg 3.4 727 19.3WSC-03-SED-0 02/20/06 08/24/07 Surface REG mg/kg 4.7 730 29.8WSC-04-SED-0 02/20/06 08/24/07 Surface REG mg/kg 4.5 392 16.0WSC-05-SED-0 02/20/06 08/24/07 Surface REG mg/kg 6.8 876 20.6WSC-06-SED-0 02/20/06 08/24/07 Surface REG mg/kg 7.4 1,210 42.5WSC-07-SED-0 02/20/06 08/24/07 Surface REG mg/kg 5.8 216 25.2WSC-08-SED-0 02/21/06 02/24/06 Surface REG mg/kg 2.1 J 38.4 7 JWSC-09-SED-0 02/21/06 08/24/07 Surface REG mg/kg 3.0 77.8 9.0WSC-10-SED-0 02/21/06 08/24/07 Surface REG mg/kg 2.5 58.2 8.0WSC-10-SED-0 02/21/06 08/24/07 Surface FD mg/kg 3.6 62.3 8.2WSC-11-SED-0 02/21/06 08/24/07 Surface REG mg/kg 3.5 58.0 7.3
Winkelman School Complex:
Page 3 of 5
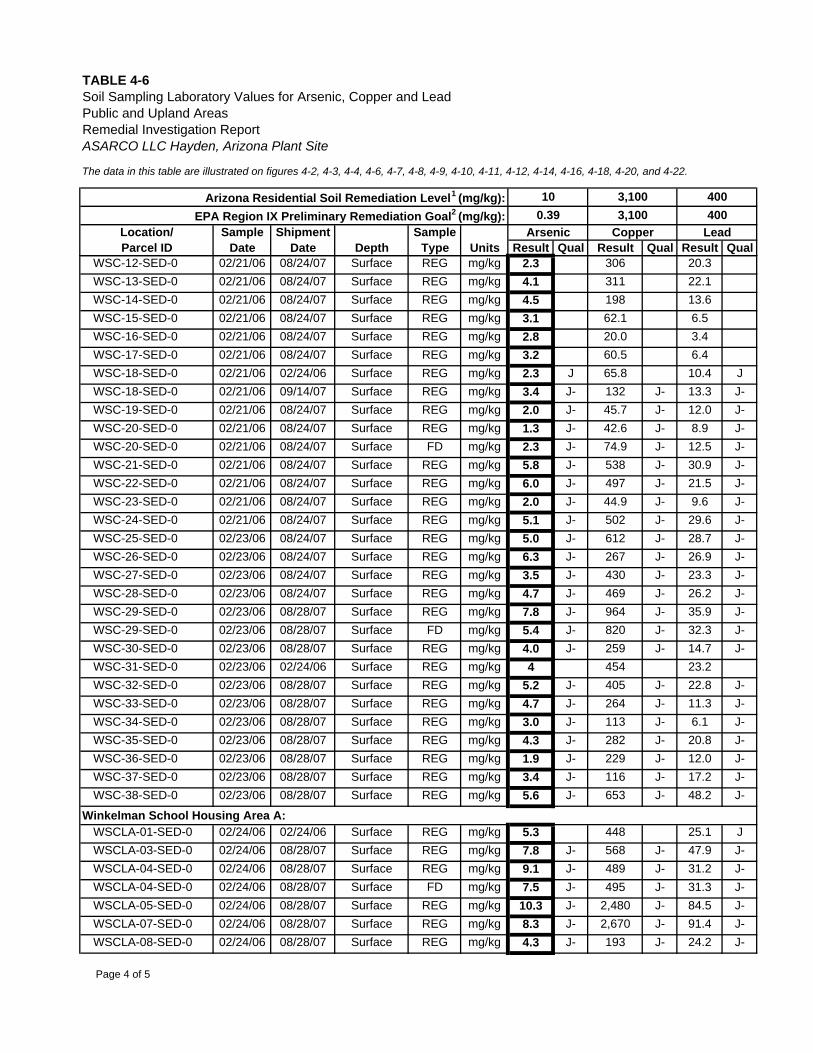
The data in this table are illustrated on figures 4-2, 4-3, 4-4, 4-6, 4-7, 4-8, 4-9, 4-10, 4-11, 4-12, 4-14, 4-16, 4-18, 4-20, and 4-22.
Result Qual Result Qual Result Qual
TABLE 4-6
Depth
Soil Sampling Laboratory Values for Arsenic, Copper and LeadPublic and Upland AreasRemedial Investigation ReportASARCO LLC Hayden, Arizona Plant Site
400EPA Region IX Preliminary Remediation Goal2 (mg/kg):Sample
TypeSample
DateLocation/Parcel ID
0.39 3,10010 3,100 400
Copper LeadArsenicShipmentDate Units
Arizona Residential Soil Remediation Level1 (mg/kg):
WSC-12-SED-0 02/21/06 08/24/07 Surface REG mg/kg 2.3 306 20.3WSC-13-SED-0 02/21/06 08/24/07 Surface REG mg/kg 4.1 311 22.1WSC-14-SED-0 02/21/06 08/24/07 Surface REG mg/kg 4.5 198 13.6WSC-15-SED-0 02/21/06 08/24/07 Surface REG mg/kg 3.1 62.1 6.5WSC-16-SED-0 02/21/06 08/24/07 Surface REG mg/kg 2.8 20.0 3.4WSC-17-SED-0 02/21/06 08/24/07 Surface REG mg/kg 3.2 60.5 6.4WSC-18-SED-0 02/21/06 02/24/06 Surface REG mg/kg 2.3 J 65.8 10.4 JWSC-18-SED-0 02/21/06 09/14/07 Surface REG mg/kg 3.4 J- 132 J- 13.3 J-WSC-19-SED-0 02/21/06 08/24/07 Surface REG mg/kg 2.0 J- 45.7 J- 12.0 J-WSC-20-SED-0 02/21/06 08/24/07 Surface REG mg/kg 1.3 J- 42.6 J- 8.9 J-WSC-20-SED-0 02/21/06 08/24/07 Surface FD mg/kg 2.3 J- 74.9 J- 12.5 J-WSC-21-SED-0 02/21/06 08/24/07 Surface REG mg/kg 5.8 J- 538 J- 30.9 J-WSC-22-SED-0 02/21/06 08/24/07 Surface REG mg/kg 6.0 J- 497 J- 21.5 J-WSC-23-SED-0 02/21/06 08/24/07 Surface REG mg/kg 2.0 J- 44.9 J- 9.6 J-WSC-24-SED-0 02/21/06 08/24/07 Surface REG mg/kg 5.1 J- 502 J- 29.6 J-WSC-25-SED-0 02/23/06 08/24/07 Surface REG mg/kg 5.0 J- 612 J- 28.7 J-WSC-26-SED-0 02/23/06 08/24/07 Surface REG mg/kg 6.3 J- 267 J- 26.9 J-WSC-27-SED-0 02/23/06 08/24/07 Surface REG mg/kg 3.5 J- 430 J- 23.3 J-WSC-28-SED-0 02/23/06 08/24/07 Surface REG mg/kg 4.7 J- 469 J- 26.2 J-WSC-29-SED-0 02/23/06 08/28/07 Surface REG mg/kg 7.8 J- 964 J- 35.9 J-WSC-29-SED-0 02/23/06 08/28/07 Surface FD mg/kg 5.4 J- 820 J- 32.3 J-WSC-30-SED-0 02/23/06 08/28/07 Surface REG mg/kg 4.0 J- 259 J- 14.7 J-WSC-31-SED-0 02/23/06 02/24/06 Surface REG mg/kg 4 454 23.2WSC-32-SED-0 02/23/06 08/28/07 Surface REG mg/kg 5.2 J- 405 J- 22.8 J-WSC-33-SED-0 02/23/06 08/28/07 Surface REG mg/kg 4.7 J- 264 J- 11.3 J-WSC-34-SED-0 02/23/06 08/28/07 Surface REG mg/kg 3.0 J- 113 J- 6.1 J-WSC-35-SED-0 02/23/06 08/28/07 Surface REG mg/kg 4.3 J- 282 J- 20.8 J-WSC-36-SED-0 02/23/06 08/28/07 Surface REG mg/kg 1.9 J- 229 J- 12.0 J-WSC-37-SED-0 02/23/06 08/28/07 Surface REG mg/kg 3.4 J- 116 J- 17.2 J-WSC-38-SED-0 02/23/06 08/28/07 Surface REG mg/kg 5.6 J- 653 J- 48.2 J-
WSCLA-01-SED-0 02/24/06 02/24/06 Surface REG mg/kg 5.3 448 25.1 JWSCLA-03-SED-0 02/24/06 08/28/07 Surface REG mg/kg 7.8 J- 568 J- 47.9 J-WSCLA-04-SED-0 02/24/06 08/28/07 Surface REG mg/kg 9.1 J- 489 J- 31.2 J-WSCLA-04-SED-0 02/24/06 08/28/07 Surface FD mg/kg 7.5 J- 495 J- 31.3 J-WSCLA-05-SED-0 02/24/06 08/28/07 Surface REG mg/kg 10.3 J- 2,480 J- 84.5 J-WSCLA-07-SED-0 02/24/06 08/28/07 Surface REG mg/kg 8.3 J- 2,670 J- 91.4 J-WSCLA-08-SED-0 02/24/06 08/28/07 Surface REG mg/kg 4.3 J- 193 J- 24.2 J-
Winkelman School Housing Area A:
Page 4 of 5
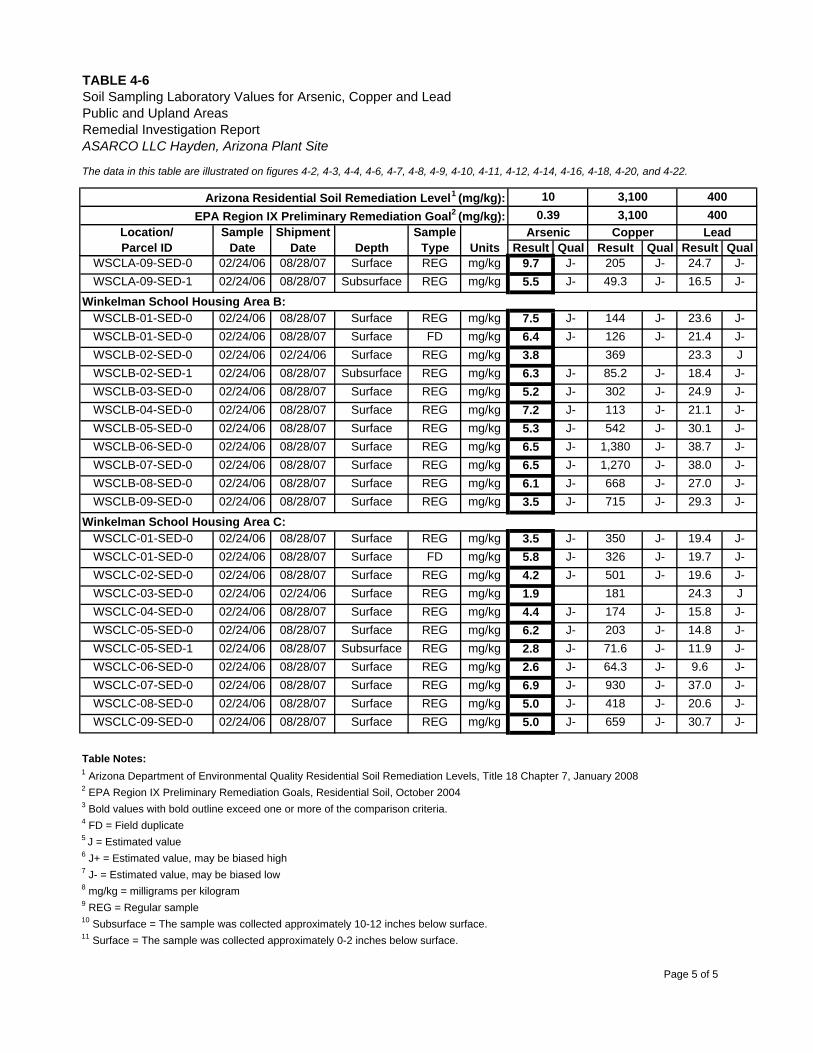
The data in this table are illustrated on figures 4-2, 4-3, 4-4, 4-6, 4-7, 4-8, 4-9, 4-10, 4-11, 4-12, 4-14, 4-16, 4-18, 4-20, and 4-22.
Result Qual Result Qual Result Qual
TABLE 4-6
Depth
Soil Sampling Laboratory Values for Arsenic, Copper and LeadPublic and Upland AreasRemedial Investigation ReportASARCO LLC Hayden, Arizona Plant Site
400EPA Region IX Preliminary Remediation Goal2 (mg/kg):Sample
TypeSample
DateLocation/Parcel ID
0.39 3,10010 3,100 400
Copper LeadArsenicShipmentDate Units
Arizona Residential Soil Remediation Level1 (mg/kg):
WSCLA-09-SED-0 02/24/06 08/28/07 Surface REG mg/kg 9.7 J- 205 J- 24.7 J-WSCLA-09-SED-1 02/24/06 08/28/07 Subsurface REG mg/kg 5.5 J- 49.3 J- 16.5 J-
WSCLB-01-SED-0 02/24/06 08/28/07 Surface REG mg/kg 7.5 J- 144 J- 23.6 J-WSCLB-01-SED-0 02/24/06 08/28/07 Surface FD mg/kg 6.4 J- 126 J- 21.4 J-WSCLB-02-SED-0 02/24/06 02/24/06 Surface REG mg/kg 3.8 369 23.3 JWSCLB-02-SED-1 02/24/06 08/28/07 Subsurface REG mg/kg 6.3 J- 85.2 J- 18.4 J-WSCLB-03-SED-0 02/24/06 08/28/07 Surface REG mg/kg 5.2 J- 302 J- 24.9 J-WSCLB-04-SED-0 02/24/06 08/28/07 Surface REG mg/kg 7.2 J- 113 J- 21.1 J-WSCLB-05-SED-0 02/24/06 08/28/07 Surface REG mg/kg 5.3 J- 542 J- 30.1 J-WSCLB-06-SED-0 02/24/06 08/28/07 Surface REG mg/kg 6.5 J- 1,380 J- 38.7 J-WSCLB-07-SED-0 02/24/06 08/28/07 Surface REG mg/kg 6.5 J- 1,270 J- 38.0 J-WSCLB-08-SED-0 02/24/06 08/28/07 Surface REG mg/kg 6.1 J- 668 J- 27.0 J-WSCLB-09-SED-0 02/24/06 08/28/07 Surface REG mg/kg 3.5 J- 715 J- 29.3 J-
WSCLC-01-SED-0 02/24/06 08/28/07 Surface REG mg/kg 3.5 J- 350 J- 19.4 J-WSCLC-01-SED-0 02/24/06 08/28/07 Surface FD mg/kg 5.8 J- 326 J- 19.7 J-WSCLC-02-SED-0 02/24/06 08/28/07 Surface REG mg/kg 4.2 J- 501 J- 19.6 J-WSCLC-03-SED-0 02/24/06 02/24/06 Surface REG mg/kg 1.9 181 24.3 JWSCLC-04-SED-0 02/24/06 08/28/07 Surface REG mg/kg 4.4 J- 174 J- 15.8 J-WSCLC-05-SED-0 02/24/06 08/28/07 Surface REG mg/kg 6.2 J- 203 J- 14.8 J-WSCLC-05-SED-1 02/24/06 08/28/07 Subsurface REG mg/kg 2.8 J- 71.6 J- 11.9 J-WSCLC-06-SED-0 02/24/06 08/28/07 Surface REG mg/kg 2.6 J- 64.3 J- 9.6 J-WSCLC-07-SED-0 02/24/06 08/28/07 Surface REG mg/kg 6.9 J- 930 J- 37.0 J-WSCLC-08-SED-0 02/24/06 08/28/07 Surface REG mg/kg 5.0 J- 418 J- 20.6 J-WSCLC-09-SED-0 02/24/06 08/28/07 Surface REG mg/kg 5.0 J- 659 J- 30.7 J-
Table Notes:1 Arizona Department of Environmental Quality Residential Soil Remediation Levels, Title 18 Chapter 7, January 20082 EPA Region IX Preliminary Remediation Goals, Residential Soil, October 20043 Bold values with bold outline exceed one or more of the comparison criteria.4 FD = Field duplicate5 J = Estimated value6 J+ = Estimated value, may be biased high7 J- = Estimated value, may be biased low8 mg/kg = milligrams per kilogram9 REG = Regular sample10 Subsurface = The sample was collected approximately 10-12 inches below surface.11 Surface = The sample was collected approximately 0-2 inches below surface.
Winkelman School Housing Area B:
Winkelman School Housing Area C:
Page 5 of 5
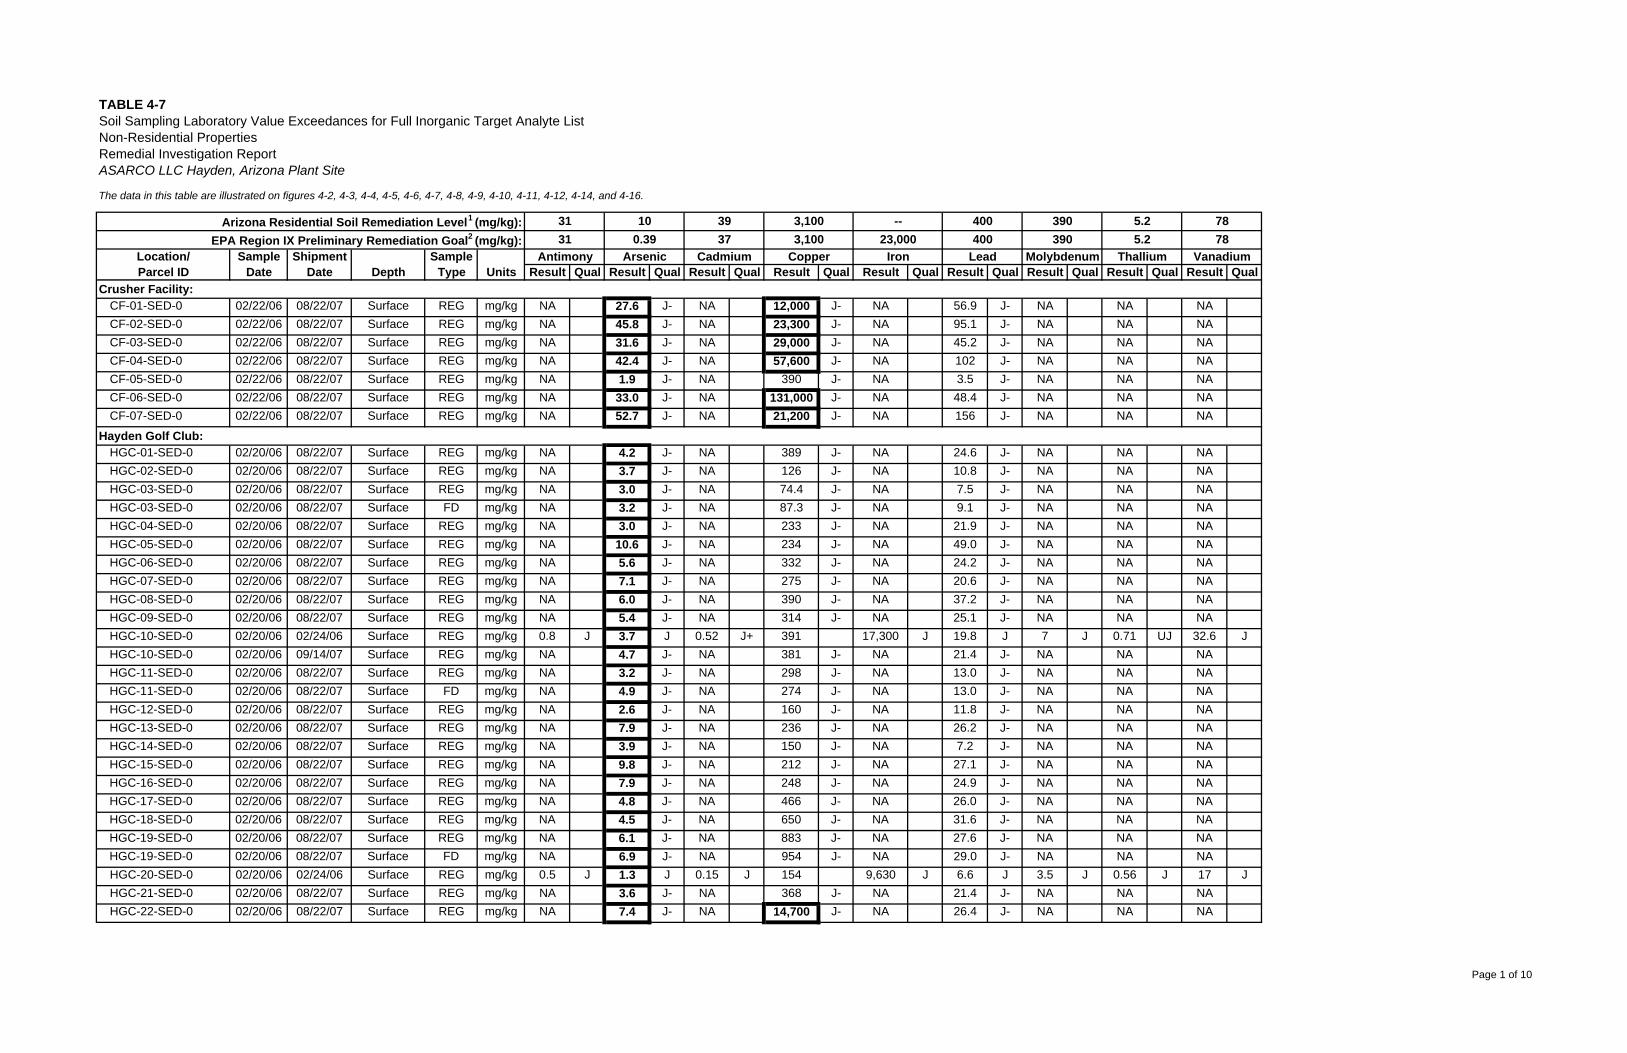
The data in this table are illustrated on figures 4-2, 4-3, 4-4, 4-5, 4-6, 4-7, 4-8, 4-9, 4-10, 4-11, 4-12, 4-14, and 4-16.
Result Qual Result Qual Result Qual Result Qual Result Qual Result Qual Result Qual Result Qual Result Qual
CF-01-SED-0 02/22/06 08/22/07 Surface REG mg/kg NA 27.6 J- NA 12,000 J- NA 56.9 J- NA NA NACF-02-SED-0 02/22/06 08/22/07 Surface REG mg/kg NA 45.8 J- NA 23,300 J- NA 95.1 J- NA NA NACF-03-SED-0 02/22/06 08/22/07 Surface REG mg/kg NA 31.6 J- NA 29,000 J- NA 45.2 J- NA NA NACF-04-SED-0 02/22/06 08/22/07 Surface REG mg/kg NA 42.4 J- NA 57,600 J- NA 102 J- NA NA NACF-05-SED-0 02/22/06 08/22/07 Surface REG mg/kg NA 1.9 J- NA 390 J- NA 3.5 J- NA NA NACF-06-SED-0 02/22/06 08/22/07 Surface REG mg/kg NA 33.0 J- NA 131,000 J- NA 48.4 J- NA NA NACF-07-SED-0 02/22/06 08/22/07 Surface REG mg/kg NA 52.7 J- NA 21,200 J- NA 156 J- NA NA NA
HGC-01-SED-0 02/20/06 08/22/07 Surface REG mg/kg NA 4.2 J- NA 389 J- NA 24.6 J- NA NA NAHGC-02-SED-0 02/20/06 08/22/07 Surface REG mg/kg NA 3.7 J- NA 126 J- NA 10.8 J- NA NA NAHGC-03-SED-0 02/20/06 08/22/07 Surface REG mg/kg NA 3.0 J- NA 74.4 J- NA 7.5 J- NA NA NAHGC-03-SED-0 02/20/06 08/22/07 Surface FD mg/kg NA 3.2 J- NA 87.3 J- NA 9.1 J- NA NA NAHGC-04-SED-0 02/20/06 08/22/07 Surface REG mg/kg NA 3.0 J- NA 233 J- NA 21.9 J- NA NA NAHGC-05-SED-0 02/20/06 08/22/07 Surface REG mg/kg NA 10.6 J- NA 234 J- NA 49.0 J- NA NA NAHGC-06-SED-0 02/20/06 08/22/07 Surface REG mg/kg NA 5.6 J- NA 332 J- NA 24.2 J- NA NA NAHGC-07-SED-0 02/20/06 08/22/07 Surface REG mg/kg NA 7.1 J- NA 275 J- NA 20.6 J- NA NA NAHGC-08-SED-0 02/20/06 08/22/07 Surface REG mg/kg NA 6.0 J- NA 390 J- NA 37.2 J- NA NA NAHGC-09-SED-0 02/20/06 08/22/07 Surface REG mg/kg NA 5.4 J- NA 314 J- NA 25.1 J- NA NA NAHGC-10-SED-0 02/20/06 02/24/06 Surface REG mg/kg 0.8 J 3.7 J 0.52 J+ 391 17,300 J 19.8 J 7 J 0.71 UJ 32.6 JHGC-10-SED-0 02/20/06 09/14/07 Surface REG mg/kg NA 4.7 J- NA 381 J- NA 21.4 J- NA NA NAHGC-11-SED-0 02/20/06 08/22/07 Surface REG mg/kg NA 3.2 J- NA 298 J- NA 13.0 J- NA NA NAHGC-11-SED-0 02/20/06 08/22/07 Surface FD mg/kg NA 4.9 J- NA 274 J- NA 13.0 J- NA NA NAHGC-12-SED-0 02/20/06 08/22/07 Surface REG mg/kg NA 2.6 J- NA 160 J- NA 11.8 J- NA NA NAHGC-13-SED-0 02/20/06 08/22/07 Surface REG mg/kg NA 7.9 J- NA 236 J- NA 26.2 J- NA NA NAHGC-14-SED-0 02/20/06 08/22/07 Surface REG mg/kg NA 3.9 J- NA 150 J- NA 7.2 J- NA NA NAHGC-15-SED-0 02/20/06 08/22/07 Surface REG mg/kg NA 9.8 J- NA 212 J- NA 27.1 J- NA NA NAHGC-16-SED-0 02/20/06 08/22/07 Surface REG mg/kg NA 7.9 J- NA 248 J- NA 24.9 J- NA NA NAHGC-17-SED-0 02/20/06 08/22/07 Surface REG mg/kg NA 4.8 J- NA 466 J- NA 26.0 J- NA NA NAHGC-18-SED-0 02/20/06 08/22/07 Surface REG mg/kg NA 4.5 J- NA 650 J- NA 31.6 J- NA NA NAHGC-19-SED-0 02/20/06 08/22/07 Surface REG mg/kg NA 6.1 J- NA 883 J- NA 27.6 J- NA NA NAHGC-19-SED-0 02/20/06 08/22/07 Surface FD mg/kg NA 6.9 J- NA 954 J- NA 29.0 J- NA NA NAHGC-20-SED-0 02/20/06 02/24/06 Surface REG mg/kg 0.5 J 1.3 J 0.15 J 154 9,630 J 6.6 J 3.5 J 0.56 J 17 JHGC-21-SED-0 02/20/06 08/22/07 Surface REG mg/kg NA 3.6 J- NA 368 J- NA 21.4 J- NA NA NAHGC-22-SED-0 02/20/06 08/22/07 Surface REG mg/kg NA 7.4 J- NA 14,700 J- NA 26.4 J- NA NA NA
TABLE 4-7
Depth
Soil Sampling Laboratory Value Exceedances for Full Inorganic Target Analyte ListNon-Residential PropertiesRemedial Investigation ReportASARCO LLC Hayden, Arizona Plant Site
Location/Parcel ID
31
ShipmentDate Units
Arizona Residential Soil Remediation Level1 (mg/kg):EPA Region IX Preliminary Remediation Goal2 (mg/kg):
SampleType
SampleDate
10
Antimony Arsenic31 0.39
3937
Cadmium
3,1003,100
Copper
--23,000
Iron
400400
Lead
7878
Vanadium
Crusher Facility:
390390
Molybdenum
5.25.2
Thallium
Hayden Golf Club:
Page 1 of 10
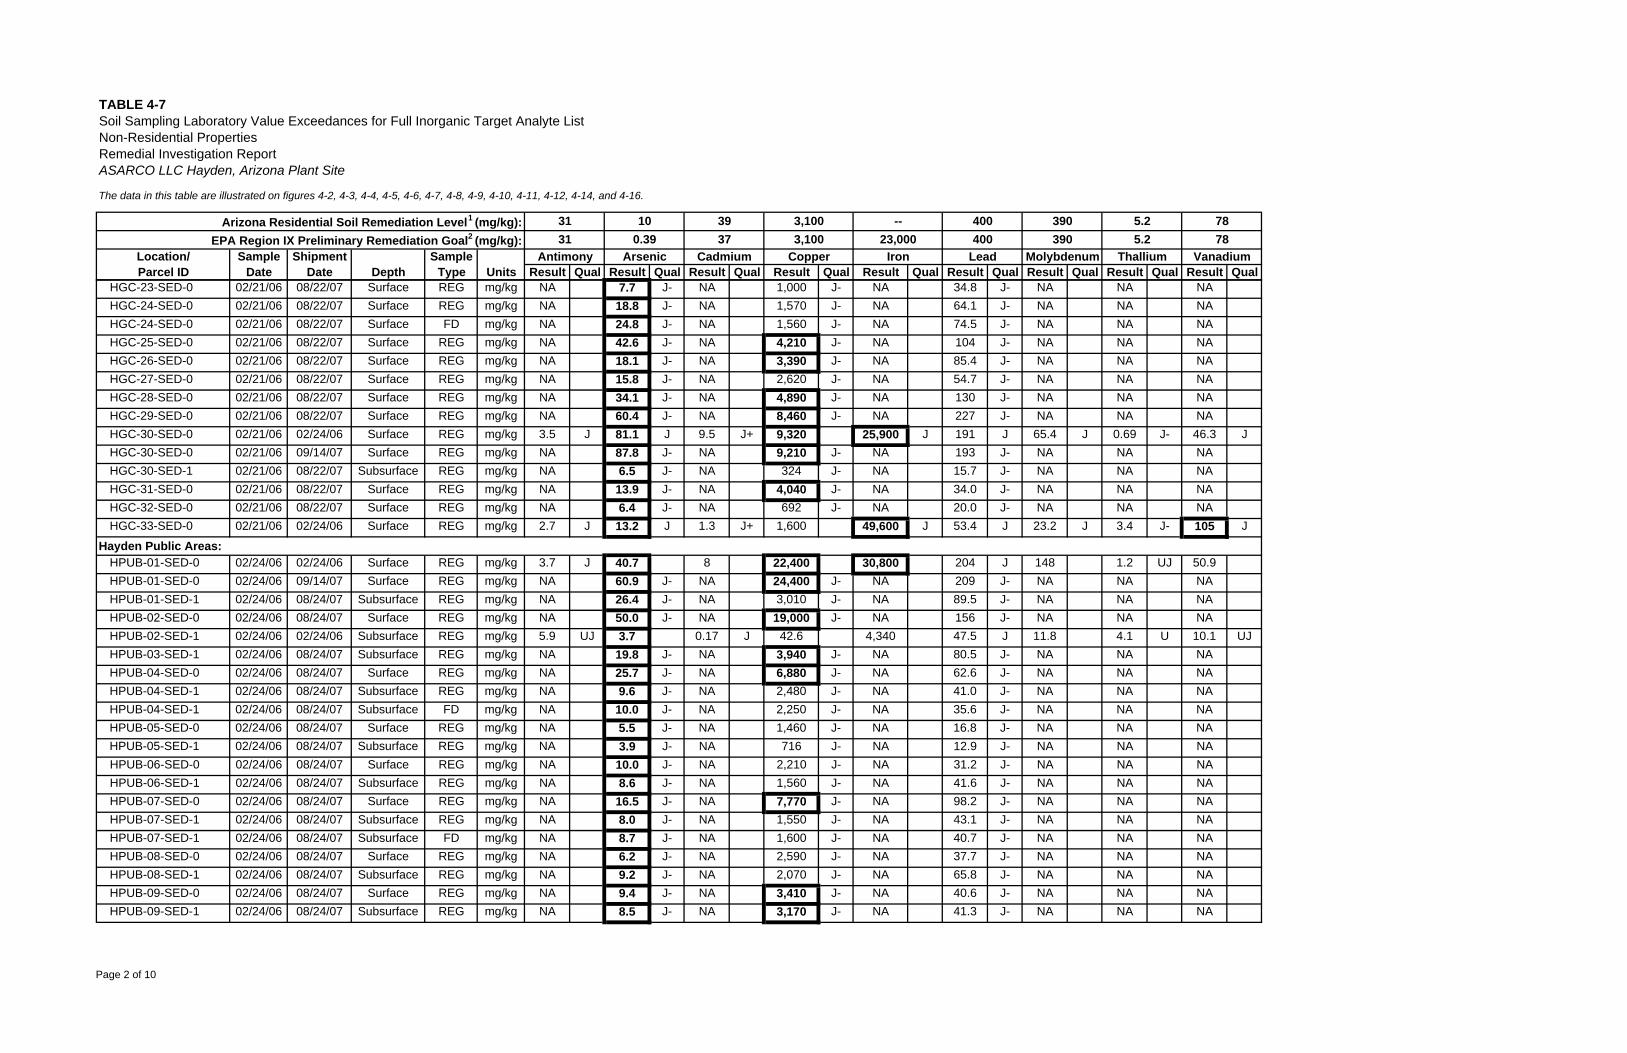
The data in this table are illustrated on figures 4-2, 4-3, 4-4, 4-5, 4-6, 4-7, 4-8, 4-9, 4-10, 4-11, 4-12, 4-14, and 4-16.
Result Qual Result Qual Result Qual Result Qual Result Qual Result Qual Result Qual Result Qual Result Qual
TABLE 4-7
Depth
Soil Sampling Laboratory Value Exceedances for Full Inorganic Target Analyte ListNon-Residential PropertiesRemedial Investigation ReportASARCO LLC Hayden, Arizona Plant Site
Location/Parcel ID
31
ShipmentDate Units
Arizona Residential Soil Remediation Level1 (mg/kg):EPA Region IX Preliminary Remediation Goal2 (mg/kg):
SampleType
SampleDate
10
Antimony Arsenic31 0.39
3937
Cadmium
3,1003,100
Copper
--23,000
Iron
400400
Lead
7878
Vanadium
390390
Molybdenum
5.25.2
Thallium
HGC-23-SED-0 02/21/06 08/22/07 Surface REG mg/kg NA 7.7 J- NA 1,000 J- NA 34.8 J- NA NA NAHGC-24-SED-0 02/21/06 08/22/07 Surface REG mg/kg NA 18.8 J- NA 1,570 J- NA 64.1 J- NA NA NAHGC-24-SED-0 02/21/06 08/22/07 Surface FD mg/kg NA 24.8 J- NA 1,560 J- NA 74.5 J- NA NA NAHGC-25-SED-0 02/21/06 08/22/07 Surface REG mg/kg NA 42.6 J- NA 4,210 J- NA 104 J- NA NA NAHGC-26-SED-0 02/21/06 08/22/07 Surface REG mg/kg NA 18.1 J- NA 3,390 J- NA 85.4 J- NA NA NAHGC-27-SED-0 02/21/06 08/22/07 Surface REG mg/kg NA 15.8 J- NA 2,620 J- NA 54.7 J- NA NA NAHGC-28-SED-0 02/21/06 08/22/07 Surface REG mg/kg NA 34.1 J- NA 4,890 J- NA 130 J- NA NA NAHGC-29-SED-0 02/21/06 08/22/07 Surface REG mg/kg NA 60.4 J- NA 8,460 J- NA 227 J- NA NA NAHGC-30-SED-0 02/21/06 02/24/06 Surface REG mg/kg 3.5 J 81.1 J 9.5 J+ 9,320 25,900 J 191 J 65.4 J 0.69 J- 46.3 JHGC-30-SED-0 02/21/06 09/14/07 Surface REG mg/kg NA 87.8 J- NA 9,210 J- NA 193 J- NA NA NAHGC-30-SED-1 02/21/06 08/22/07 Subsurface REG mg/kg NA 6.5 J- NA 324 J- NA 15.7 J- NA NA NAHGC-31-SED-0 02/21/06 08/22/07 Surface REG mg/kg NA 13.9 J- NA 4,040 J- NA 34.0 J- NA NA NAHGC-32-SED-0 02/21/06 08/22/07 Surface REG mg/kg NA 6.4 J- NA 692 J- NA 20.0 J- NA NA NAHGC-33-SED-0 02/21/06 02/24/06 Surface REG mg/kg 2.7 J 13.2 J 1.3 J+ 1,600 49,600 J 53.4 J 23.2 J 3.4 J- 105 J
HPUB-01-SED-0 02/24/06 02/24/06 Surface REG mg/kg 3.7 J 40.7 8 22,400 30,800 204 J 148 1.2 UJ 50.9HPUB-01-SED-0 02/24/06 09/14/07 Surface REG mg/kg NA 60.9 J- NA 24,400 J- NA 209 J- NA NA NAHPUB-01-SED-1 02/24/06 08/24/07 Subsurface REG mg/kg NA 26.4 J- NA 3,010 J- NA 89.5 J- NA NA NAHPUB-02-SED-0 02/24/06 08/24/07 Surface REG mg/kg NA 50.0 J- NA 19,000 J- NA 156 J- NA NA NAHPUB-02-SED-1 02/24/06 02/24/06 Subsurface REG mg/kg 5.9 UJ 3.7 0.17 J 42.6 4,340 47.5 J 11.8 4.1 U 10.1 UJHPUB-03-SED-1 02/24/06 08/24/07 Subsurface REG mg/kg NA 19.8 J- NA 3,940 J- NA 80.5 J- NA NA NAHPUB-04-SED-0 02/24/06 08/24/07 Surface REG mg/kg NA 25.7 J- NA 6,880 J- NA 62.6 J- NA NA NAHPUB-04-SED-1 02/24/06 08/24/07 Subsurface REG mg/kg NA 9.6 J- NA 2,480 J- NA 41.0 J- NA NA NAHPUB-04-SED-1 02/24/06 08/24/07 Subsurface FD mg/kg NA 10.0 J- NA 2,250 J- NA 35.6 J- NA NA NAHPUB-05-SED-0 02/24/06 08/24/07 Surface REG mg/kg NA 5.5 J- NA 1,460 J- NA 16.8 J- NA NA NAHPUB-05-SED-1 02/24/06 08/24/07 Subsurface REG mg/kg NA 3.9 J- NA 716 J- NA 12.9 J- NA NA NAHPUB-06-SED-0 02/24/06 08/24/07 Surface REG mg/kg NA 10.0 J- NA 2,210 J- NA 31.2 J- NA NA NAHPUB-06-SED-1 02/24/06 08/24/07 Subsurface REG mg/kg NA 8.6 J- NA 1,560 J- NA 41.6 J- NA NA NAHPUB-07-SED-0 02/24/06 08/24/07 Surface REG mg/kg NA 16.5 J- NA 7,770 J- NA 98.2 J- NA NA NAHPUB-07-SED-1 02/24/06 08/24/07 Subsurface REG mg/kg NA 8.0 J- NA 1,550 J- NA 43.1 J- NA NA NAHPUB-07-SED-1 02/24/06 08/24/07 Subsurface FD mg/kg NA 8.7 J- NA 1,600 J- NA 40.7 J- NA NA NAHPUB-08-SED-0 02/24/06 08/24/07 Surface REG mg/kg NA 6.2 J- NA 2,590 J- NA 37.7 J- NA NA NAHPUB-08-SED-1 02/24/06 08/24/07 Subsurface REG mg/kg NA 9.2 J- NA 2,070 J- NA 65.8 J- NA NA NAHPUB-09-SED-0 02/24/06 08/24/07 Surface REG mg/kg NA 9.4 J- NA 3,410 J- NA 40.6 J- NA NA NAHPUB-09-SED-1 02/24/06 08/24/07 Subsurface REG mg/kg NA 8.5 J- NA 3,170 J- NA 41.3 J- NA NA NA
Hayden Public Areas:
Page 2 of 10
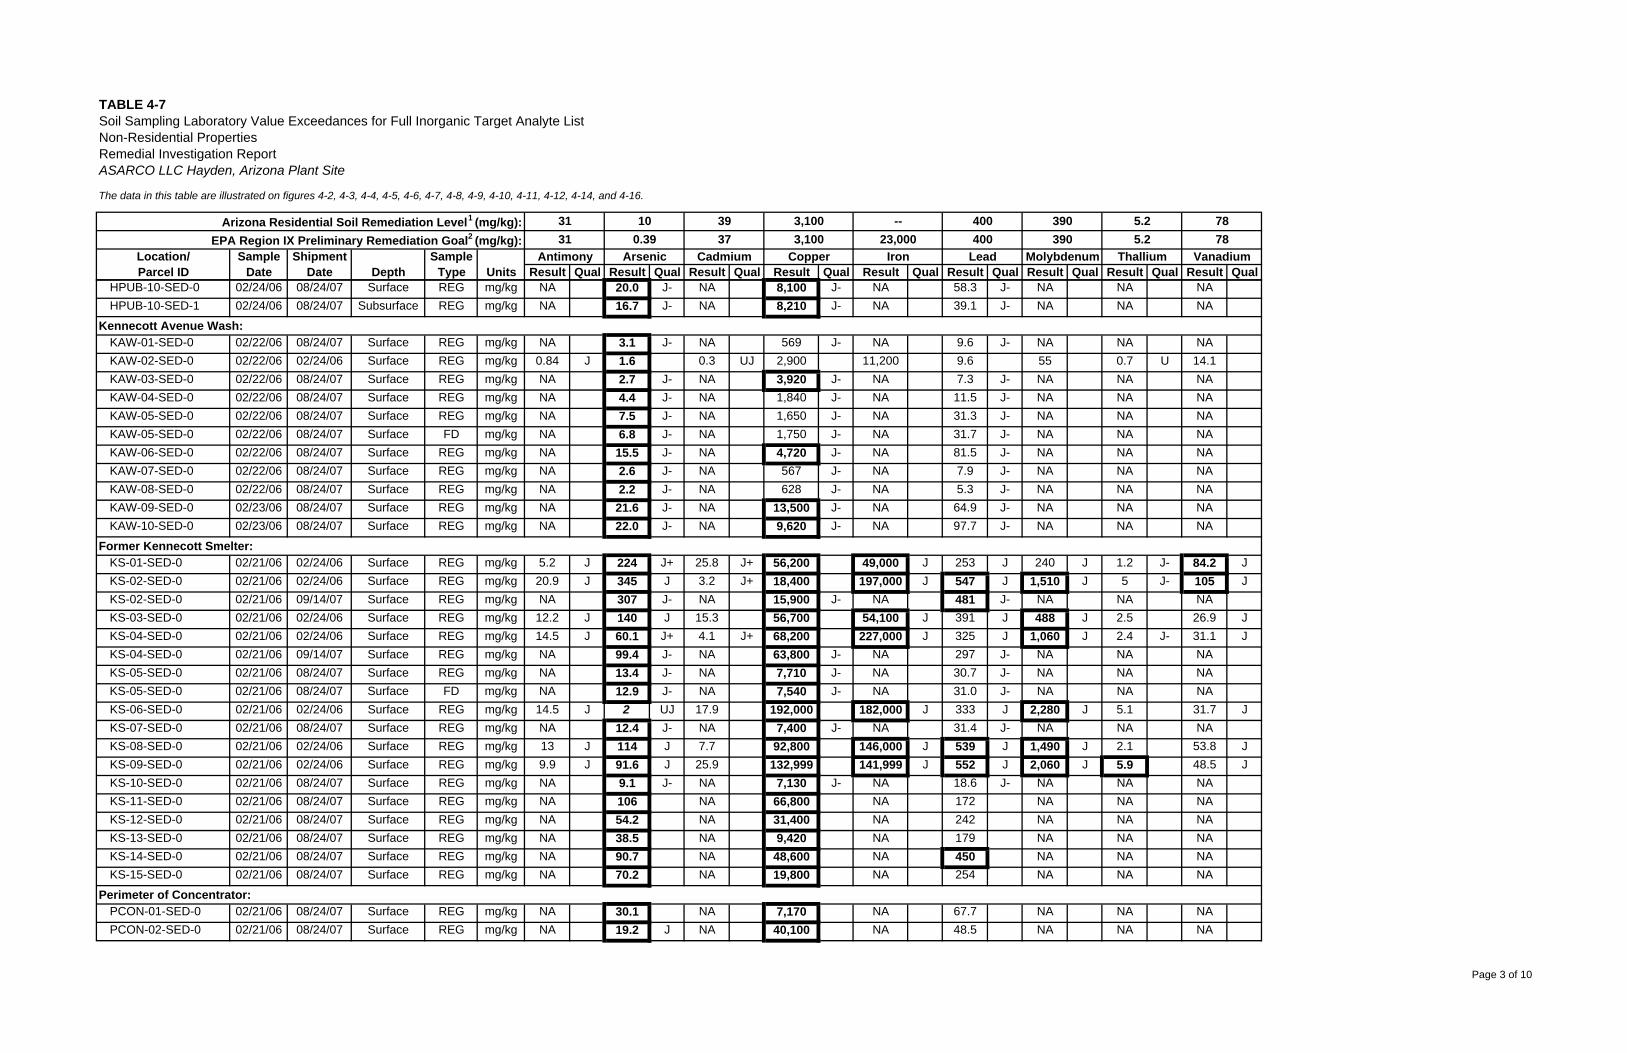
The data in this table are illustrated on figures 4-2, 4-3, 4-4, 4-5, 4-6, 4-7, 4-8, 4-9, 4-10, 4-11, 4-12, 4-14, and 4-16.
Result Qual Result Qual Result Qual Result Qual Result Qual Result Qual Result Qual Result Qual Result Qual
TABLE 4-7
Depth
Soil Sampling Laboratory Value Exceedances for Full Inorganic Target Analyte ListNon-Residential PropertiesRemedial Investigation ReportASARCO LLC Hayden, Arizona Plant Site
Location/Parcel ID
31
ShipmentDate Units
Arizona Residential Soil Remediation Level1 (mg/kg):EPA Region IX Preliminary Remediation Goal2 (mg/kg):
SampleType
SampleDate
10
Antimony Arsenic31 0.39
3937
Cadmium
3,1003,100
Copper
--23,000
Iron
400400
Lead
7878
Vanadium
390390
Molybdenum
5.25.2
Thallium
HPUB-10-SED-0 02/24/06 08/24/07 Surface REG mg/kg NA 20.0 J- NA 8,100 J- NA 58.3 J- NA NA NAHPUB-10-SED-1 02/24/06 08/24/07 Subsurface REG mg/kg NA 16.7 J- NA 8,210 J- NA 39.1 J- NA NA NA
KAW-01-SED-0 02/22/06 08/24/07 Surface REG mg/kg NA 3.1 J- NA 569 J- NA 9.6 J- NA NA NAKAW-02-SED-0 02/22/06 02/24/06 Surface REG mg/kg 0.84 J 1.6 0.3 UJ 2,900 11,200 9.6 55 0.7 U 14.1KAW-03-SED-0 02/22/06 08/24/07 Surface REG mg/kg NA 2.7 J- NA 3,920 J- NA 7.3 J- NA NA NAKAW-04-SED-0 02/22/06 08/24/07 Surface REG mg/kg NA 4.4 J- NA 1,840 J- NA 11.5 J- NA NA NAKAW-05-SED-0 02/22/06 08/24/07 Surface REG mg/kg NA 7.5 J- NA 1,650 J- NA 31.3 J- NA NA NAKAW-05-SED-0 02/22/06 08/24/07 Surface FD mg/kg NA 6.8 J- NA 1,750 J- NA 31.7 J- NA NA NAKAW-06-SED-0 02/22/06 08/24/07 Surface REG mg/kg NA 15.5 J- NA 4,720 J- NA 81.5 J- NA NA NAKAW-07-SED-0 02/22/06 08/24/07 Surface REG mg/kg NA 2.6 J- NA 567 J- NA 7.9 J- NA NA NAKAW-08-SED-0 02/22/06 08/24/07 Surface REG mg/kg NA 2.2 J- NA 628 J- NA 5.3 J- NA NA NAKAW-09-SED-0 02/23/06 08/24/07 Surface REG mg/kg NA 21.6 J- NA 13,500 J- NA 64.9 J- NA NA NAKAW-10-SED-0 02/23/06 08/24/07 Surface REG mg/kg NA 22.0 J- NA 9,620 J- NA 97.7 J- NA NA NA
KS-01-SED-0 02/21/06 02/24/06 Surface REG mg/kg 5.2 J 224 J+ 25.8 J+ 56,200 49,000 J 253 J 240 J 1.2 J- 84.2 JKS-02-SED-0 02/21/06 02/24/06 Surface REG mg/kg 20.9 J 345 J 3.2 J+ 18,400 197,000 J 547 J 1,510 J 5 J- 105 JKS-02-SED-0 02/21/06 09/14/07 Surface REG mg/kg NA 307 J- NA 15,900 J- NA 481 J- NA NA NAKS-03-SED-0 02/21/06 02/24/06 Surface REG mg/kg 12.2 J 140 J 15.3 56,700 54,100 J 391 J 488 J 2.5 26.9 JKS-04-SED-0 02/21/06 02/24/06 Surface REG mg/kg 14.5 J 60.1 J+ 4.1 J+ 68,200 227,000 J 325 J 1,060 J 2.4 J- 31.1 JKS-04-SED-0 02/21/06 09/14/07 Surface REG mg/kg NA 99.4 J- NA 63,800 J- NA 297 J- NA NA NAKS-05-SED-0 02/21/06 08/24/07 Surface REG mg/kg NA 13.4 J- NA 7,710 J- NA 30.7 J- NA NA NAKS-05-SED-0 02/21/06 08/24/07 Surface FD mg/kg NA 12.9 J- NA 7,540 J- NA 31.0 J- NA NA NAKS-06-SED-0 02/21/06 02/24/06 Surface REG mg/kg 14.5 J 2 UJ 17.9 192,000 182,000 J 333 J 2,280 J 5.1 31.7 JKS-07-SED-0 02/21/06 08/24/07 Surface REG mg/kg NA 12.4 J- NA 7,400 J- NA 31.4 J- NA NA NAKS-08-SED-0 02/21/06 02/24/06 Surface REG mg/kg 13 J 114 J 7.7 92,800 146,000 J 539 J 1,490 J 2.1 53.8 JKS-09-SED-0 02/21/06 02/24/06 Surface REG mg/kg 9.9 J 91.6 J 25.9 132,999 141,999 J 552 J 2,060 J 5.9 48.5 JKS-10-SED-0 02/21/06 08/24/07 Surface REG mg/kg NA 9.1 J- NA 7,130 J- NA 18.6 J- NA NA NAKS-11-SED-0 02/21/06 08/24/07 Surface REG mg/kg NA 106 NA 66,800 NA 172 NA NA NAKS-12-SED-0 02/21/06 08/24/07 Surface REG mg/kg NA 54.2 NA 31,400 NA 242 NA NA NAKS-13-SED-0 02/21/06 08/24/07 Surface REG mg/kg NA 38.5 NA 9,420 NA 179 NA NA NAKS-14-SED-0 02/21/06 08/24/07 Surface REG mg/kg NA 90.7 NA 48,600 NA 450 NA NA NAKS-15-SED-0 02/21/06 08/24/07 Surface REG mg/kg NA 70.2 NA 19,800 NA 254 NA NA NA
PCON-01-SED-0 02/21/06 08/24/07 Surface REG mg/kg NA 30.1 NA 7,170 NA 67.7 NA NA NAPCON-02-SED-0 02/21/06 08/24/07 Surface REG mg/kg NA 19.2 J NA 40,100 NA 48.5 NA NA NA
Former Kennecott Smelter:
Perimeter of Concentrator:
Kennecott Avenue Wash:
Page 3 of 10
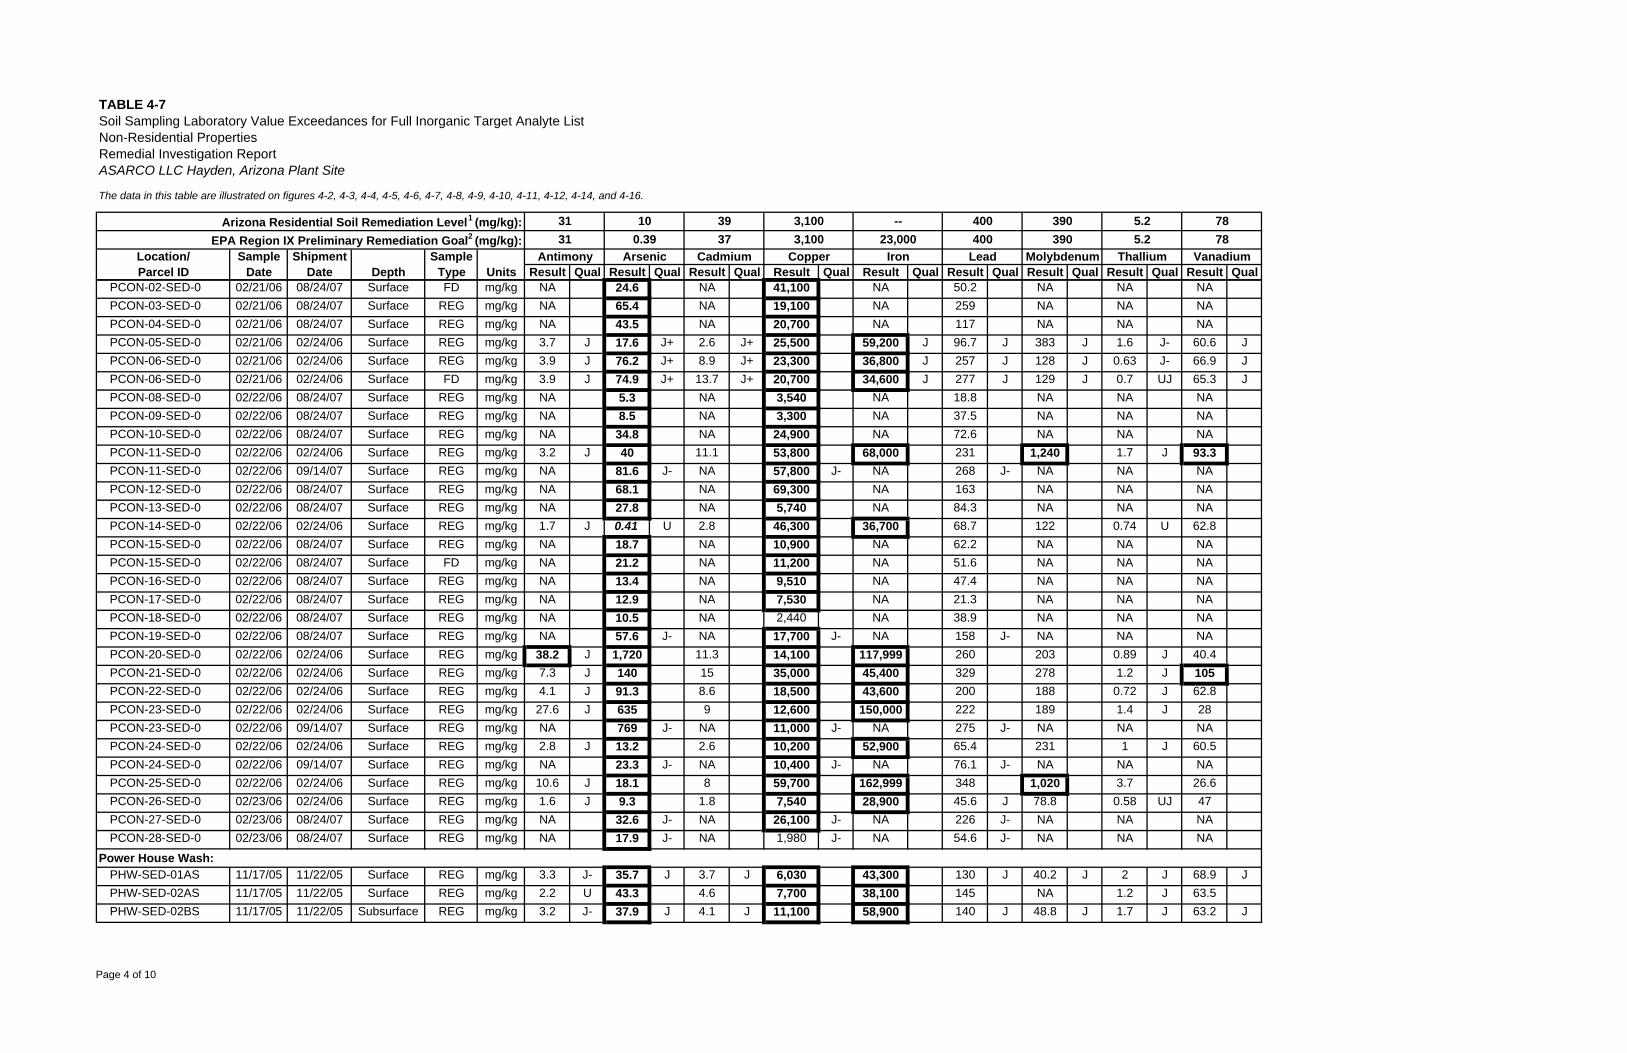
The data in this table are illustrated on figures 4-2, 4-3, 4-4, 4-5, 4-6, 4-7, 4-8, 4-9, 4-10, 4-11, 4-12, 4-14, and 4-16.
Result Qual Result Qual Result Qual Result Qual Result Qual Result Qual Result Qual Result Qual Result Qual
TABLE 4-7
Depth
Soil Sampling Laboratory Value Exceedances for Full Inorganic Target Analyte ListNon-Residential PropertiesRemedial Investigation ReportASARCO LLC Hayden, Arizona Plant Site
Location/Parcel ID
31
ShipmentDate Units
Arizona Residential Soil Remediation Level1 (mg/kg):EPA Region IX Preliminary Remediation Goal2 (mg/kg):
SampleType
SampleDate
10
Antimony Arsenic31 0.39
3937
Cadmium
3,1003,100
Copper
--23,000
Iron
400400
Lead
7878
Vanadium
390390
Molybdenum
5.25.2
Thallium
PCON-02-SED-0 02/21/06 08/24/07 Surface FD mg/kg NA 24.6 NA 41,100 NA 50.2 NA NA NAPCON-03-SED-0 02/21/06 08/24/07 Surface REG mg/kg NA 65.4 NA 19,100 NA 259 NA NA NAPCON-04-SED-0 02/21/06 08/24/07 Surface REG mg/kg NA 43.5 NA 20,700 NA 117 NA NA NAPCON-05-SED-0 02/21/06 02/24/06 Surface REG mg/kg 3.7 J 17.6 J+ 2.6 J+ 25,500 59,200 J 96.7 J 383 J 1.6 J- 60.6 JPCON-06-SED-0 02/21/06 02/24/06 Surface REG mg/kg 3.9 J 76.2 J+ 8.9 J+ 23,300 36,800 J 257 J 128 J 0.63 J- 66.9 JPCON-06-SED-0 02/21/06 02/24/06 Surface FD mg/kg 3.9 J 74.9 J+ 13.7 J+ 20,700 34,600 J 277 J 129 J 0.7 UJ 65.3 JPCON-08-SED-0 02/22/06 08/24/07 Surface REG mg/kg NA 5.3 NA 3,540 NA 18.8 NA NA NAPCON-09-SED-0 02/22/06 08/24/07 Surface REG mg/kg NA 8.5 NA 3,300 NA 37.5 NA NA NAPCON-10-SED-0 02/22/06 08/24/07 Surface REG mg/kg NA 34.8 NA 24,900 NA 72.6 NA NA NAPCON-11-SED-0 02/22/06 02/24/06 Surface REG mg/kg 3.2 J 40 11.1 53,800 68,000 231 1,240 1.7 J 93.3PCON-11-SED-0 02/22/06 09/14/07 Surface REG mg/kg NA 81.6 J- NA 57,800 J- NA 268 J- NA NA NAPCON-12-SED-0 02/22/06 08/24/07 Surface REG mg/kg NA 68.1 NA 69,300 NA 163 NA NA NAPCON-13-SED-0 02/22/06 08/24/07 Surface REG mg/kg NA 27.8 NA 5,740 NA 84.3 NA NA NAPCON-14-SED-0 02/22/06 02/24/06 Surface REG mg/kg 1.7 J 0.41 U 2.8 46,300 36,700 68.7 122 0.74 U 62.8PCON-15-SED-0 02/22/06 08/24/07 Surface REG mg/kg NA 18.7 NA 10,900 NA 62.2 NA NA NAPCON-15-SED-0 02/22/06 08/24/07 Surface FD mg/kg NA 21.2 NA 11,200 NA 51.6 NA NA NAPCON-16-SED-0 02/22/06 08/24/07 Surface REG mg/kg NA 13.4 NA 9,510 NA 47.4 NA NA NAPCON-17-SED-0 02/22/06 08/24/07 Surface REG mg/kg NA 12.9 NA 7,530 NA 21.3 NA NA NAPCON-18-SED-0 02/22/06 08/24/07 Surface REG mg/kg NA 10.5 NA 2,440 NA 38.9 NA NA NAPCON-19-SED-0 02/22/06 08/24/07 Surface REG mg/kg NA 57.6 J- NA 17,700 J- NA 158 J- NA NA NAPCON-20-SED-0 02/22/06 02/24/06 Surface REG mg/kg 38.2 J 1,720 11.3 14,100 117,999 260 203 0.89 J 40.4PCON-21-SED-0 02/22/06 02/24/06 Surface REG mg/kg 7.3 J 140 15 35,000 45,400 329 278 1.2 J 105PCON-22-SED-0 02/22/06 02/24/06 Surface REG mg/kg 4.1 J 91.3 8.6 18,500 43,600 200 188 0.72 J 62.8PCON-23-SED-0 02/22/06 02/24/06 Surface REG mg/kg 27.6 J 635 9 12,600 150,000 222 189 1.4 J 28PCON-23-SED-0 02/22/06 09/14/07 Surface REG mg/kg NA 769 J- NA 11,000 J- NA 275 J- NA NA NAPCON-24-SED-0 02/22/06 02/24/06 Surface REG mg/kg 2.8 J 13.2 2.6 10,200 52,900 65.4 231 1 J 60.5PCON-24-SED-0 02/22/06 09/14/07 Surface REG mg/kg NA 23.3 J- NA 10,400 J- NA 76.1 J- NA NA NAPCON-25-SED-0 02/22/06 02/24/06 Surface REG mg/kg 10.6 J 18.1 8 59,700 162,999 348 1,020 3.7 26.6PCON-26-SED-0 02/23/06 02/24/06 Surface REG mg/kg 1.6 J 9.3 1.8 7,540 28,900 45.6 J 78.8 0.58 UJ 47PCON-27-SED-0 02/23/06 08/24/07 Surface REG mg/kg NA 32.6 J- NA 26,100 J- NA 226 J- NA NA NAPCON-28-SED-0 02/23/06 08/24/07 Surface REG mg/kg NA 17.9 J- NA 1,980 J- NA 54.6 J- NA NA NA
PHW-SED-01AS 11/17/05 11/22/05 Surface REG mg/kg 3.3 J- 35.7 J 3.7 J 6,030 43,300 130 J 40.2 J 2 J 68.9 JPHW-SED-02AS 11/17/05 11/22/05 Surface REG mg/kg 2.2 U 43.3 4.6 7,700 38,100 145 NA 1.2 J 63.5PHW-SED-02BS 11/17/05 11/22/05 Subsurface REG mg/kg 3.2 J- 37.9 J 4.1 J 11,100 58,900 140 J 48.8 J 1.7 J 63.2 J
Power House Wash:
Page 4 of 10
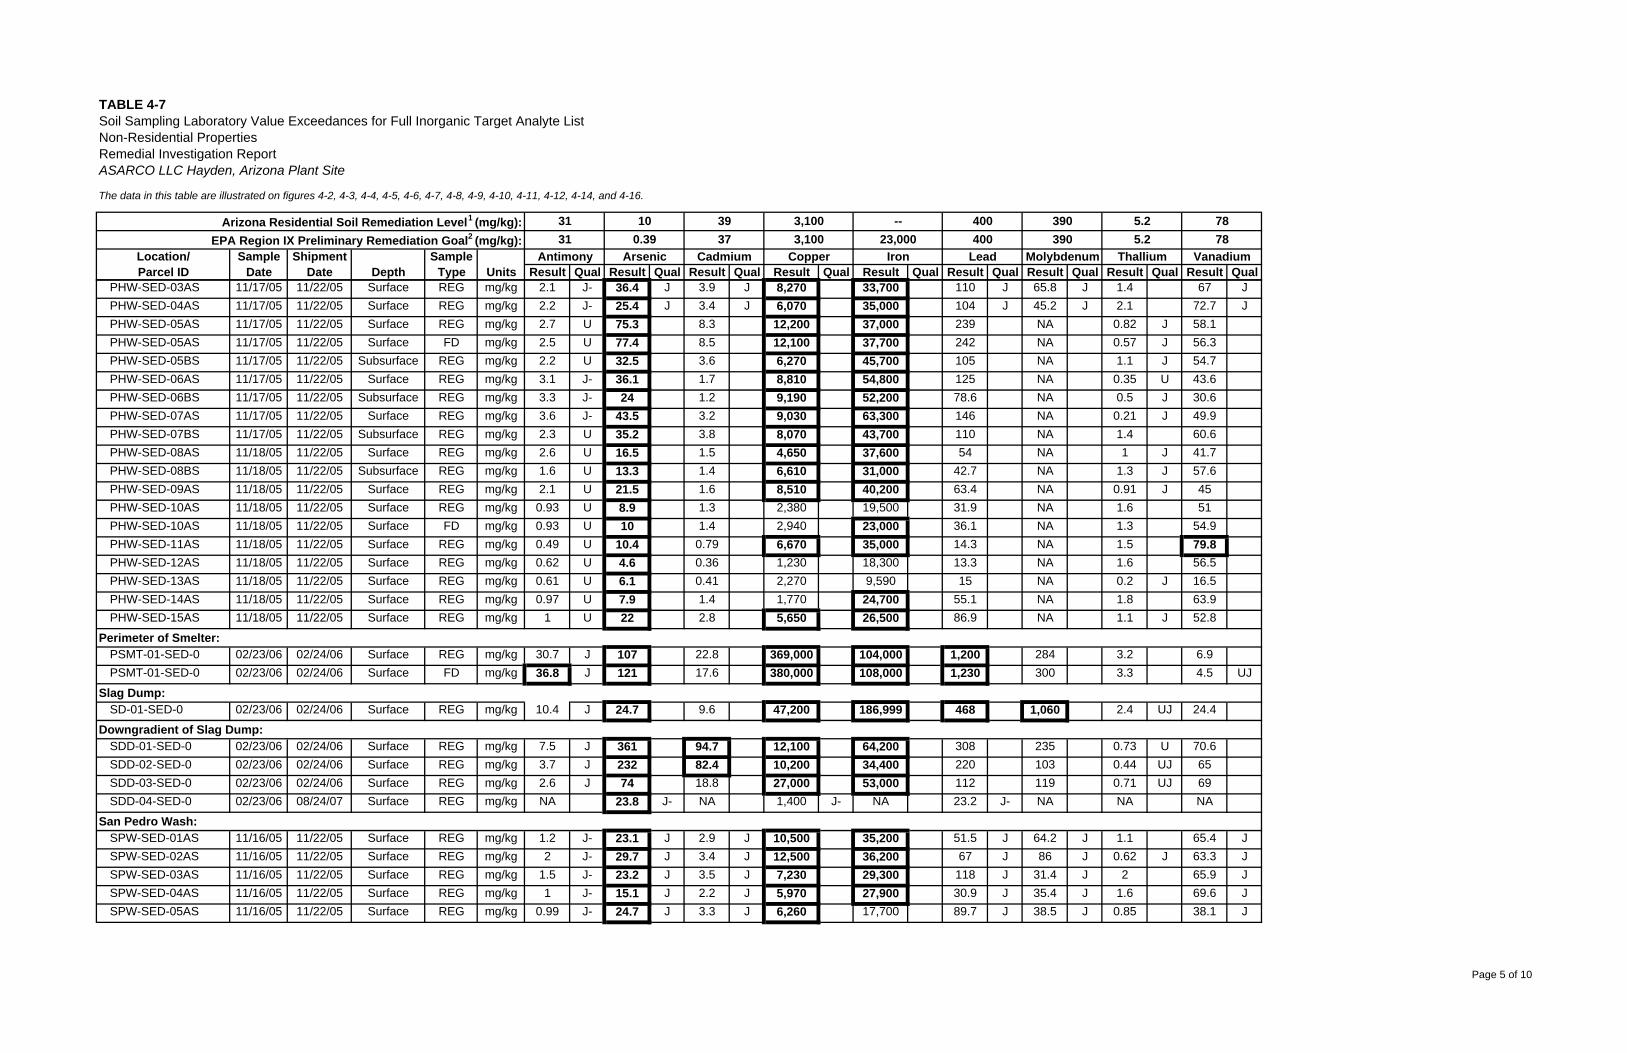
The data in this table are illustrated on figures 4-2, 4-3, 4-4, 4-5, 4-6, 4-7, 4-8, 4-9, 4-10, 4-11, 4-12, 4-14, and 4-16.
Result Qual Result Qual Result Qual Result Qual Result Qual Result Qual Result Qual Result Qual Result Qual
TABLE 4-7
Depth
Soil Sampling Laboratory Value Exceedances for Full Inorganic Target Analyte ListNon-Residential PropertiesRemedial Investigation ReportASARCO LLC Hayden, Arizona Plant Site
Location/Parcel ID
31
ShipmentDate Units
Arizona Residential Soil Remediation Level1 (mg/kg):EPA Region IX Preliminary Remediation Goal2 (mg/kg):
SampleType
SampleDate
10
Antimony Arsenic31 0.39
3937
Cadmium
3,1003,100
Copper
--23,000
Iron
400400
Lead
7878
Vanadium
390390
Molybdenum
5.25.2
Thallium
PHW-SED-03AS 11/17/05 11/22/05 Surface REG mg/kg 2.1 J- 36.4 J 3.9 J 8,270 33,700 110 J 65.8 J 1.4 67 JPHW-SED-04AS 11/17/05 11/22/05 Surface REG mg/kg 2.2 J- 25.4 J 3.4 J 6,070 35,000 104 J 45.2 J 2.1 72.7 JPHW-SED-05AS 11/17/05 11/22/05 Surface REG mg/kg 2.7 U 75.3 8.3 12,200 37,000 239 NA 0.82 J 58.1PHW-SED-05AS 11/17/05 11/22/05 Surface FD mg/kg 2.5 U 77.4 8.5 12,100 37,700 242 NA 0.57 J 56.3PHW-SED-05BS 11/17/05 11/22/05 Subsurface REG mg/kg 2.2 U 32.5 3.6 6,270 45,700 105 NA 1.1 J 54.7PHW-SED-06AS 11/17/05 11/22/05 Surface REG mg/kg 3.1 J- 36.1 1.7 8,810 54,800 125 NA 0.35 U 43.6PHW-SED-06BS 11/17/05 11/22/05 Subsurface REG mg/kg 3.3 J- 24 1.2 9,190 52,200 78.6 NA 0.5 J 30.6PHW-SED-07AS 11/17/05 11/22/05 Surface REG mg/kg 3.6 J- 43.5 3.2 9,030 63,300 146 NA 0.21 J 49.9PHW-SED-07BS 11/17/05 11/22/05 Subsurface REG mg/kg 2.3 U 35.2 3.8 8,070 43,700 110 NA 1.4 60.6PHW-SED-08AS 11/18/05 11/22/05 Surface REG mg/kg 2.6 U 16.5 1.5 4,650 37,600 54 NA 1 J 41.7PHW-SED-08BS 11/18/05 11/22/05 Subsurface REG mg/kg 1.6 U 13.3 1.4 6,610 31,000 42.7 NA 1.3 J 57.6PHW-SED-09AS 11/18/05 11/22/05 Surface REG mg/kg 2.1 U 21.5 1.6 8,510 40,200 63.4 NA 0.91 J 45PHW-SED-10AS 11/18/05 11/22/05 Surface REG mg/kg 0.93 U 8.9 1.3 2,380 19,500 31.9 NA 1.6 51PHW-SED-10AS 11/18/05 11/22/05 Surface FD mg/kg 0.93 U 10 1.4 2,940 23,000 36.1 NA 1.3 54.9PHW-SED-11AS 11/18/05 11/22/05 Surface REG mg/kg 0.49 U 10.4 0.79 6,670 35,000 14.3 NA 1.5 79.8PHW-SED-12AS 11/18/05 11/22/05 Surface REG mg/kg 0.62 U 4.6 0.36 1,230 18,300 13.3 NA 1.6 56.5PHW-SED-13AS 11/18/05 11/22/05 Surface REG mg/kg 0.61 U 6.1 0.41 2,270 9,590 15 NA 0.2 J 16.5PHW-SED-14AS 11/18/05 11/22/05 Surface REG mg/kg 0.97 U 7.9 1.4 1,770 24,700 55.1 NA 1.8 63.9PHW-SED-15AS 11/18/05 11/22/05 Surface REG mg/kg 1 U 22 2.8 5,650 26,500 86.9 NA 1.1 J 52.8
PSMT-01-SED-0 02/23/06 02/24/06 Surface REG mg/kg 30.7 J 107 22.8 369,000 104,000 1,200 284 3.2 6.9PSMT-01-SED-0 02/23/06 02/24/06 Surface FD mg/kg 36.8 J 121 17.6 380,000 108,000 1,230 300 3.3 4.5 UJ
SD-01-SED-0 02/23/06 02/24/06 Surface REG mg/kg 10.4 J 24.7 9.6 47,200 186,999 468 1,060 2.4 UJ 24.4
SDD-01-SED-0 02/23/06 02/24/06 Surface REG mg/kg 7.5 J 361 94.7 12,100 64,200 308 235 0.73 U 70.6SDD-02-SED-0 02/23/06 02/24/06 Surface REG mg/kg 3.7 J 232 82.4 10,200 34,400 220 103 0.44 UJ 65SDD-03-SED-0 02/23/06 02/24/06 Surface REG mg/kg 2.6 J 74 18.8 27,000 53,000 112 119 0.71 UJ 69SDD-04-SED-0 02/23/06 08/24/07 Surface REG mg/kg NA 23.8 J- NA 1,400 J- NA 23.2 J- NA NA NA
SPW-SED-01AS 11/16/05 11/22/05 Surface REG mg/kg 1.2 J- 23.1 J 2.9 J 10,500 35,200 51.5 J 64.2 J 1.1 65.4 JSPW-SED-02AS 11/16/05 11/22/05 Surface REG mg/kg 2 J- 29.7 J 3.4 J 12,500 36,200 67 J 86 J 0.62 J 63.3 JSPW-SED-03AS 11/16/05 11/22/05 Surface REG mg/kg 1.5 J- 23.2 J 3.5 J 7,230 29,300 118 J 31.4 J 2 65.9 JSPW-SED-04AS 11/16/05 11/22/05 Surface REG mg/kg 1 J- 15.1 J 2.2 J 5,970 27,900 30.9 J 35.4 J 1.6 69.6 JSPW-SED-05AS 11/16/05 11/22/05 Surface REG mg/kg 0.99 J- 24.7 J 3.3 J 6,260 17,700 89.7 J 38.5 J 0.85 38.1 J
Perimeter of Smelter:
Slag Dump:
Downgradient of Slag Dump:
San Pedro Wash:
Page 5 of 10
I I I I I I I I I
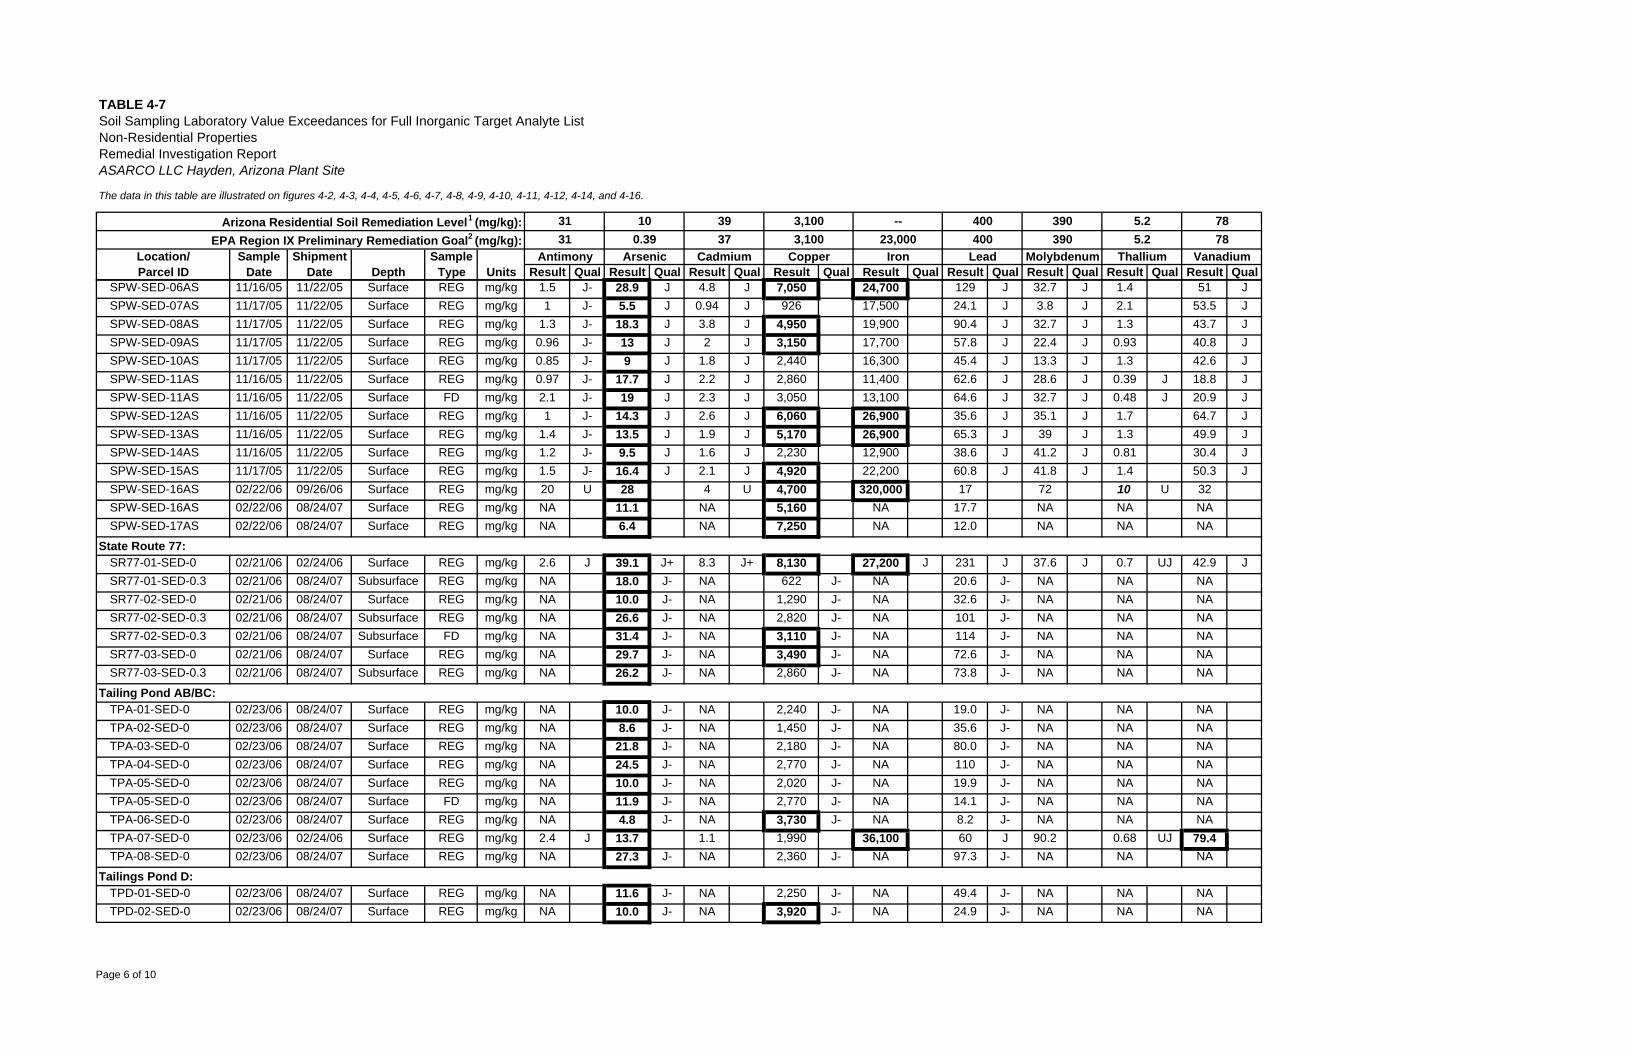
The data in this table are illustrated on figures 4-2, 4-3, 4-4, 4-5, 4-6, 4-7, 4-8, 4-9, 4-10, 4-11, 4-12, 4-14, and 4-16.
Result Qual Result Qual Result Qual Result Qual Result Qual Result Qual Result Qual Result Qual Result Qual
TABLE 4-7
Depth
Soil Sampling Laboratory Value Exceedances for Full Inorganic Target Analyte ListNon-Residential PropertiesRemedial Investigation ReportASARCO LLC Hayden, Arizona Plant Site
Location/Parcel ID
31
ShipmentDate Units
Arizona Residential Soil Remediation Level1 (mg/kg):EPA Region IX Preliminary Remediation Goal2 (mg/kg):
SampleType
SampleDate
10
Antimony Arsenic31 0.39
3937
Cadmium
3,1003,100
Copper
--23,000
Iron
400400
Lead
7878
Vanadium
390390
Molybdenum
5.25.2
Thallium
SPW-SED-06AS 11/16/05 11/22/05 Surface REG mg/kg 1.5 J- 28.9 J 4.8 J 7,050 24,700 129 J 32.7 J 1.4 51 JSPW-SED-07AS 11/17/05 11/22/05 Surface REG mg/kg 1 J- 5.5 J 0.94 J 926 17,500 24.1 J 3.8 J 2.1 53.5 JSPW-SED-08AS 11/17/05 11/22/05 Surface REG mg/kg 1.3 J- 18.3 J 3.8 J 4,950 19,900 90.4 J 32.7 J 1.3 43.7 JSPW-SED-09AS 11/17/05 11/22/05 Surface REG mg/kg 0.96 J- 13 J 2 J 3,150 17,700 57.8 J 22.4 J 0.93 40.8 JSPW-SED-10AS 11/17/05 11/22/05 Surface REG mg/kg 0.85 J- 9 J 1.8 J 2,440 16,300 45.4 J 13.3 J 1.3 42.6 JSPW-SED-11AS 11/16/05 11/22/05 Surface REG mg/kg 0.97 J- 17.7 J 2.2 J 2,860 11,400 62.6 J 28.6 J 0.39 J 18.8 JSPW-SED-11AS 11/16/05 11/22/05 Surface FD mg/kg 2.1 J- 19 J 2.3 J 3,050 13,100 64.6 J 32.7 J 0.48 J 20.9 JSPW-SED-12AS 11/16/05 11/22/05 Surface REG mg/kg 1 J- 14.3 J 2.6 J 6,060 26,900 35.6 J 35.1 J 1.7 64.7 JSPW-SED-13AS 11/16/05 11/22/05 Surface REG mg/kg 1.4 J- 13.5 J 1.9 J 5,170 26,900 65.3 J 39 J 1.3 49.9 JSPW-SED-14AS 11/16/05 11/22/05 Surface REG mg/kg 1.2 J- 9.5 J 1.6 J 2,230 12,900 38.6 J 41.2 J 0.81 30.4 JSPW-SED-15AS 11/17/05 11/22/05 Surface REG mg/kg 1.5 J- 16.4 J 2.1 J 4,920 22,200 60.8 J 41.8 J 1.4 50.3 JSPW-SED-16AS 02/22/06 09/26/06 Surface REG mg/kg 20 U 28 4 U 4,700 320,000 17 72 10 U 32SPW-SED-16AS 02/22/06 08/24/07 Surface REG mg/kg NA 11.1 NA 5,160 NA 17.7 NA NA NASPW-SED-17AS 02/22/06 08/24/07 Surface REG mg/kg NA 6.4 NA 7,250 NA 12.0 NA NA NA
SR77-01-SED-0 02/21/06 02/24/06 Surface REG mg/kg 2.6 J 39.1 J+ 8.3 J+ 8,130 27,200 J 231 J 37.6 J 0.7 UJ 42.9 JSR77-01-SED-0.3 02/21/06 08/24/07 Subsurface REG mg/kg NA 18.0 J- NA 622 J- NA 20.6 J- NA NA NASR77-02-SED-0 02/21/06 08/24/07 Surface REG mg/kg NA 10.0 J- NA 1,290 J- NA 32.6 J- NA NA NASR77-02-SED-0.3 02/21/06 08/24/07 Subsurface REG mg/kg NA 26.6 J- NA 2,820 J- NA 101 J- NA NA NASR77-02-SED-0.3 02/21/06 08/24/07 Subsurface FD mg/kg NA 31.4 J- NA 3,110 J- NA 114 J- NA NA NASR77-03-SED-0 02/21/06 08/24/07 Surface REG mg/kg NA 29.7 J- NA 3,490 J- NA 72.6 J- NA NA NASR77-03-SED-0.3 02/21/06 08/24/07 Subsurface REG mg/kg NA 26.2 J- NA 2,860 J- NA 73.8 J- NA NA NA
TPA-01-SED-0 02/23/06 08/24/07 Surface REG mg/kg NA 10.0 J- NA 2,240 J- NA 19.0 J- NA NA NATPA-02-SED-0 02/23/06 08/24/07 Surface REG mg/kg NA 8.6 J- NA 1,450 J- NA 35.6 J- NA NA NATPA-03-SED-0 02/23/06 08/24/07 Surface REG mg/kg NA 21.8 J- NA 2,180 J- NA 80.0 J- NA NA NATPA-04-SED-0 02/23/06 08/24/07 Surface REG mg/kg NA 24.5 J- NA 2,770 J- NA 110 J- NA NA NATPA-05-SED-0 02/23/06 08/24/07 Surface REG mg/kg NA 10.0 J- NA 2,020 J- NA 19.9 J- NA NA NATPA-05-SED-0 02/23/06 08/24/07 Surface FD mg/kg NA 11.9 J- NA 2,770 J- NA 14.1 J- NA NA NATPA-06-SED-0 02/23/06 08/24/07 Surface REG mg/kg NA 4.8 J- NA 3,730 J- NA 8.2 J- NA NA NATPA-07-SED-0 02/23/06 02/24/06 Surface REG mg/kg 2.4 J 13.7 1.1 1,990 36,100 60 J 90.2 0.68 UJ 79.4TPA-08-SED-0 02/23/06 08/24/07 Surface REG mg/kg NA 27.3 J- NA 2,360 J- NA 97.3 J- NA NA NA
TPD-01-SED-0 02/23/06 08/24/07 Surface REG mg/kg NA 11.6 J- NA 2,250 J- NA 49.4 J- NA NA NATPD-02-SED-0 02/23/06 08/24/07 Surface REG mg/kg NA 10.0 J- NA 3,920 J- NA 24.9 J- NA NA NA
Tailing Pond AB/BC:
Tailings Pond D:
State Route 77:
Page 6 of 10
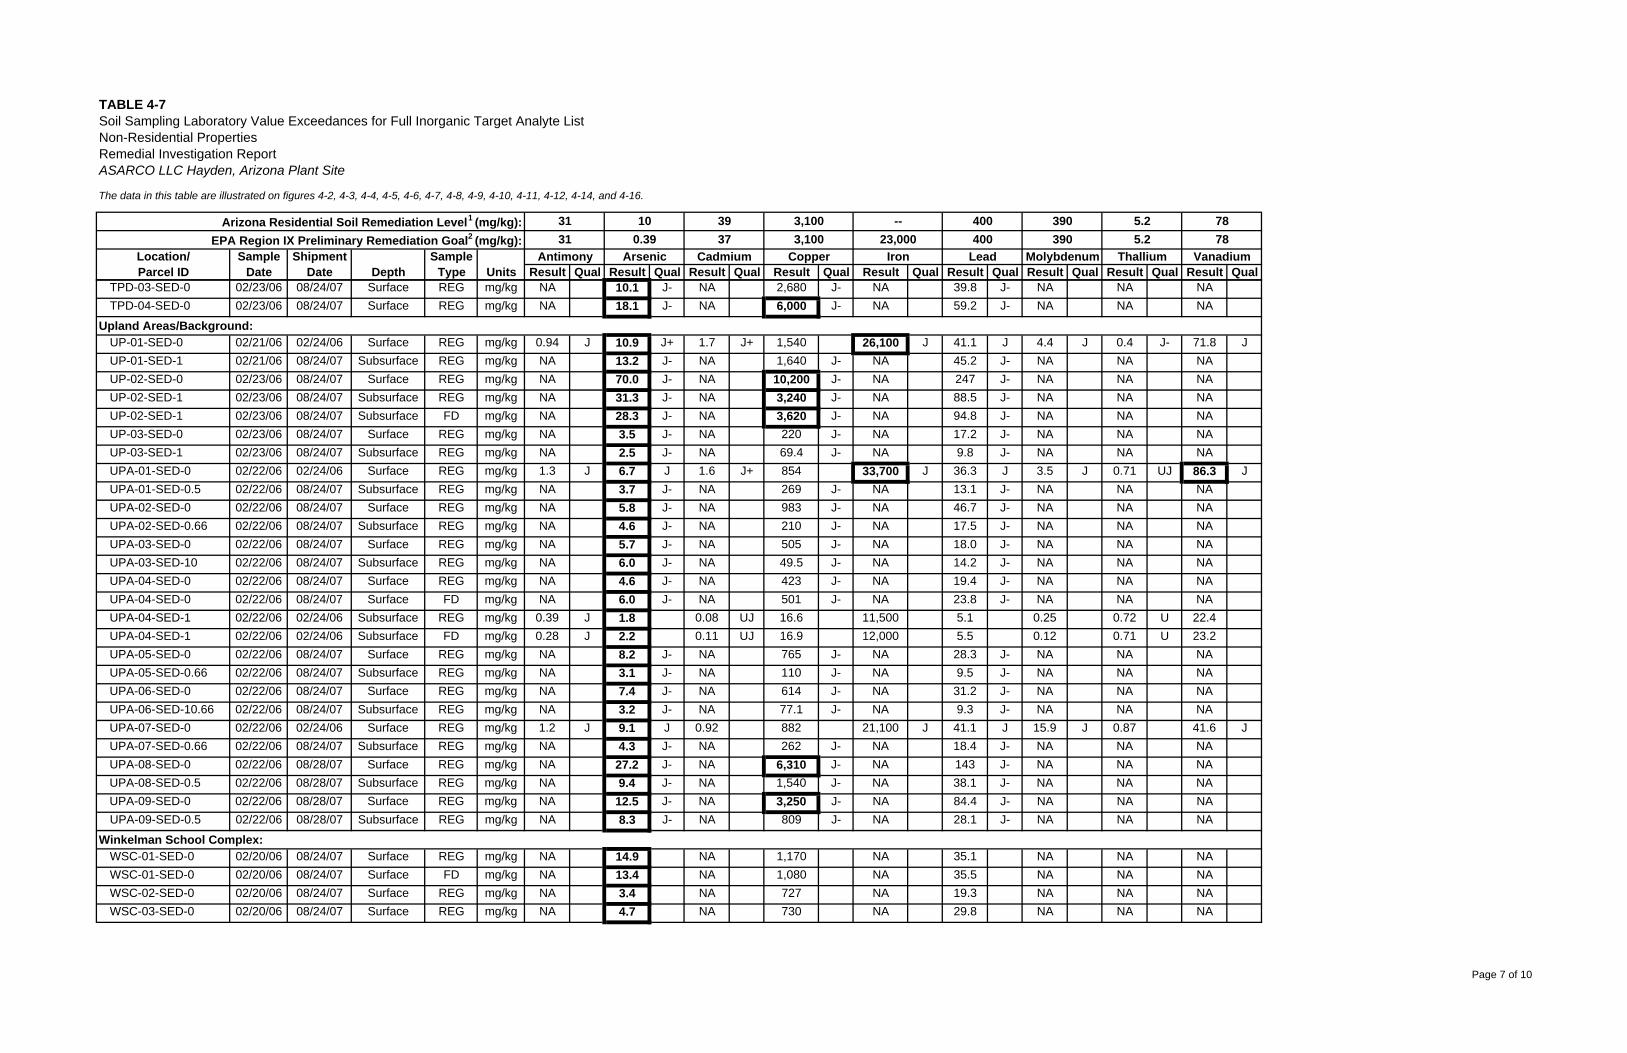
The data in this table are illustrated on figures 4-2, 4-3, 4-4, 4-5, 4-6, 4-7, 4-8, 4-9, 4-10, 4-11, 4-12, 4-14, and 4-16.
Result Qual Result Qual Result Qual Result Qual Result Qual Result Qual Result Qual Result Qual Result Qual
TABLE 4-7
Depth
Soil Sampling Laboratory Value Exceedances for Full Inorganic Target Analyte ListNon-Residential PropertiesRemedial Investigation ReportASARCO LLC Hayden, Arizona Plant Site
Location/Parcel ID
31
ShipmentDate Units
Arizona Residential Soil Remediation Level1 (mg/kg):EPA Region IX Preliminary Remediation Goal2 (mg/kg):
SampleType
SampleDate
10
Antimony Arsenic31 0.39
3937
Cadmium
3,1003,100
Copper
--23,000
Iron
400400
Lead
7878
Vanadium
390390
Molybdenum
5.25.2
Thallium
TPD-03-SED-0 02/23/06 08/24/07 Surface REG mg/kg NA 10.1 J- NA 2,680 J- NA 39.8 J- NA NA NATPD-04-SED-0 02/23/06 08/24/07 Surface REG mg/kg NA 18.1 J- NA 6,000 J- NA 59.2 J- NA NA NA
UP-01-SED-0 02/21/06 02/24/06 Surface REG mg/kg 0.94 J 10.9 J+ 1.7 J+ 1,540 26,100 J 41.1 J 4.4 J 0.4 J- 71.8 JUP-01-SED-1 02/21/06 08/24/07 Subsurface REG mg/kg NA 13.2 J- NA 1,640 J- NA 45.2 J- NA NA NAUP-02-SED-0 02/23/06 08/24/07 Surface REG mg/kg NA 70.0 J- NA 10,200 J- NA 247 J- NA NA NAUP-02-SED-1 02/23/06 08/24/07 Subsurface REG mg/kg NA 31.3 J- NA 3,240 J- NA 88.5 J- NA NA NAUP-02-SED-1 02/23/06 08/24/07 Subsurface FD mg/kg NA 28.3 J- NA 3,620 J- NA 94.8 J- NA NA NAUP-03-SED-0 02/23/06 08/24/07 Surface REG mg/kg NA 3.5 J- NA 220 J- NA 17.2 J- NA NA NAUP-03-SED-1 02/23/06 08/24/07 Subsurface REG mg/kg NA 2.5 J- NA 69.4 J- NA 9.8 J- NA NA NAUPA-01-SED-0 02/22/06 02/24/06 Surface REG mg/kg 1.3 J 6.7 J 1.6 J+ 854 33,700 J 36.3 J 3.5 J 0.71 UJ 86.3 JUPA-01-SED-0.5 02/22/06 08/24/07 Subsurface REG mg/kg NA 3.7 J- NA 269 J- NA 13.1 J- NA NA NAUPA-02-SED-0 02/22/06 08/24/07 Surface REG mg/kg NA 5.8 J- NA 983 J- NA 46.7 J- NA NA NAUPA-02-SED-0.66 02/22/06 08/24/07 Subsurface REG mg/kg NA 4.6 J- NA 210 J- NA 17.5 J- NA NA NAUPA-03-SED-0 02/22/06 08/24/07 Surface REG mg/kg NA 5.7 J- NA 505 J- NA 18.0 J- NA NA NAUPA-03-SED-10 02/22/06 08/24/07 Subsurface REG mg/kg NA 6.0 J- NA 49.5 J- NA 14.2 J- NA NA NAUPA-04-SED-0 02/22/06 08/24/07 Surface REG mg/kg NA 4.6 J- NA 423 J- NA 19.4 J- NA NA NAUPA-04-SED-0 02/22/06 08/24/07 Surface FD mg/kg NA 6.0 J- NA 501 J- NA 23.8 J- NA NA NAUPA-04-SED-1 02/22/06 02/24/06 Subsurface REG mg/kg 0.39 J 1.8 0.08 UJ 16.6 11,500 5.1 0.25 0.72 U 22.4UPA-04-SED-1 02/22/06 02/24/06 Subsurface FD mg/kg 0.28 J 2.2 0.11 UJ 16.9 12,000 5.5 0.12 0.71 U 23.2UPA-05-SED-0 02/22/06 08/24/07 Surface REG mg/kg NA 8.2 J- NA 765 J- NA 28.3 J- NA NA NAUPA-05-SED-0.66 02/22/06 08/24/07 Subsurface REG mg/kg NA 3.1 J- NA 110 J- NA 9.5 J- NA NA NAUPA-06-SED-0 02/22/06 08/24/07 Surface REG mg/kg NA 7.4 J- NA 614 J- NA 31.2 J- NA NA NAUPA-06-SED-10.66 02/22/06 08/24/07 Subsurface REG mg/kg NA 3.2 J- NA 77.1 J- NA 9.3 J- NA NA NAUPA-07-SED-0 02/22/06 02/24/06 Surface REG mg/kg 1.2 J 9.1 J 0.92 882 21,100 J 41.1 J 15.9 J 0.87 41.6 JUPA-07-SED-0.66 02/22/06 08/24/07 Subsurface REG mg/kg NA 4.3 J- NA 262 J- NA 18.4 J- NA NA NAUPA-08-SED-0 02/22/06 08/28/07 Surface REG mg/kg NA 27.2 J- NA 6,310 J- NA 143 J- NA NA NAUPA-08-SED-0.5 02/22/06 08/28/07 Subsurface REG mg/kg NA 9.4 J- NA 1,540 J- NA 38.1 J- NA NA NAUPA-09-SED-0 02/22/06 08/28/07 Surface REG mg/kg NA 12.5 J- NA 3,250 J- NA 84.4 J- NA NA NAUPA-09-SED-0.5 02/22/06 08/28/07 Subsurface REG mg/kg NA 8.3 J- NA 809 J- NA 28.1 J- NA NA NA
WSC-01-SED-0 02/20/06 08/24/07 Surface REG mg/kg NA 14.9 NA 1,170 NA 35.1 NA NA NAWSC-01-SED-0 02/20/06 08/24/07 Surface FD mg/kg NA 13.4 NA 1,080 NA 35.5 NA NA NAWSC-02-SED-0 02/20/06 08/24/07 Surface REG mg/kg NA 3.4 NA 727 NA 19.3 NA NA NAWSC-03-SED-0 02/20/06 08/24/07 Surface REG mg/kg NA 4.7 NA 730 NA 29.8 NA NA NA
Upland Areas/Background:
Winkelman School Complex:
Page 7 of 10
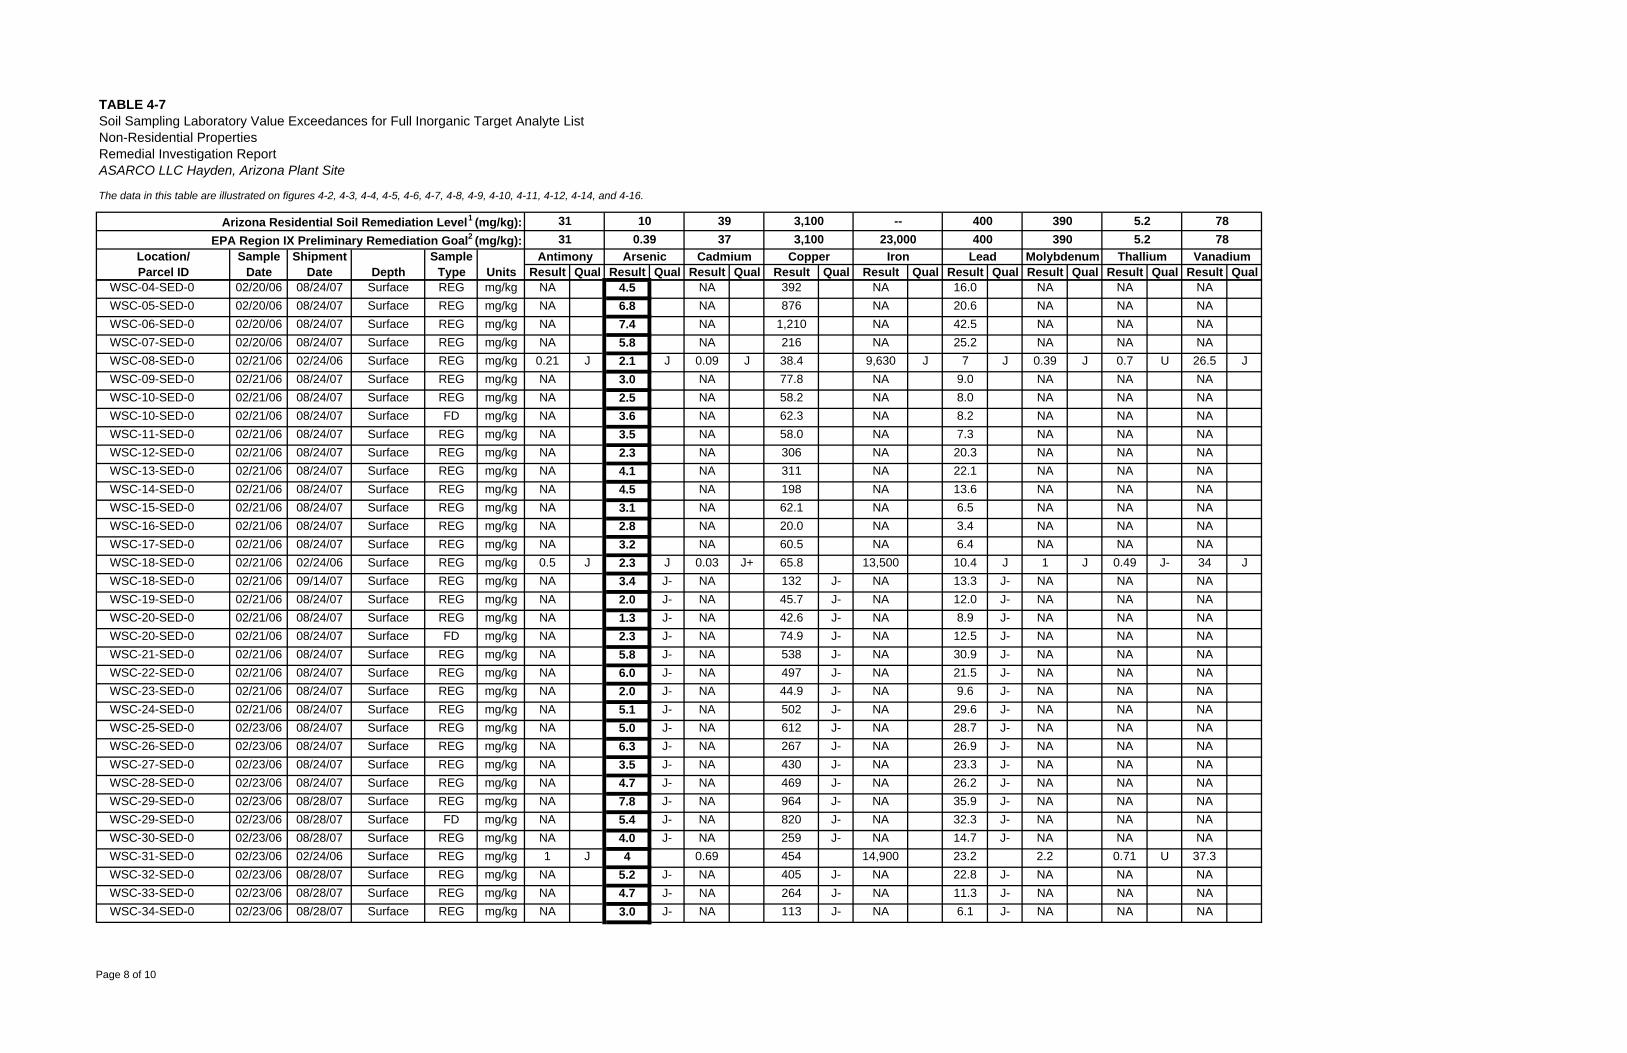
The data in this table are illustrated on figures 4-2, 4-3, 4-4, 4-5, 4-6, 4-7, 4-8, 4-9, 4-10, 4-11, 4-12, 4-14, and 4-16.
Result Qual Result Qual Result Qual Result Qual Result Qual Result Qual Result Qual Result Qual Result Qual
TABLE 4-7
Depth
Soil Sampling Laboratory Value Exceedances for Full Inorganic Target Analyte ListNon-Residential PropertiesRemedial Investigation ReportASARCO LLC Hayden, Arizona Plant Site
Location/Parcel ID
31
ShipmentDate Units
Arizona Residential Soil Remediation Level1 (mg/kg):EPA Region IX Preliminary Remediation Goal2 (mg/kg):
SampleType
SampleDate
10
Antimony Arsenic31 0.39
3937
Cadmium
3,1003,100
Copper
--23,000
Iron
400400
Lead
7878
Vanadium
390390
Molybdenum
5.25.2
Thallium
WSC-04-SED-0 02/20/06 08/24/07 Surface REG mg/kg NA 4.5 NA 392 NA 16.0 NA NA NAWSC-05-SED-0 02/20/06 08/24/07 Surface REG mg/kg NA 6.8 NA 876 NA 20.6 NA NA NAWSC-06-SED-0 02/20/06 08/24/07 Surface REG mg/kg NA 7.4 NA 1,210 NA 42.5 NA NA NAWSC-07-SED-0 02/20/06 08/24/07 Surface REG mg/kg NA 5.8 NA 216 NA 25.2 NA NA NAWSC-08-SED-0 02/21/06 02/24/06 Surface REG mg/kg 0.21 J 2.1 J 0.09 J 38.4 9,630 J 7 J 0.39 J 0.7 U 26.5 JWSC-09-SED-0 02/21/06 08/24/07 Surface REG mg/kg NA 3.0 NA 77.8 NA 9.0 NA NA NAWSC-10-SED-0 02/21/06 08/24/07 Surface REG mg/kg NA 2.5 NA 58.2 NA 8.0 NA NA NAWSC-10-SED-0 02/21/06 08/24/07 Surface FD mg/kg NA 3.6 NA 62.3 NA 8.2 NA NA NAWSC-11-SED-0 02/21/06 08/24/07 Surface REG mg/kg NA 3.5 NA 58.0 NA 7.3 NA NA NAWSC-12-SED-0 02/21/06 08/24/07 Surface REG mg/kg NA 2.3 NA 306 NA 20.3 NA NA NAWSC-13-SED-0 02/21/06 08/24/07 Surface REG mg/kg NA 4.1 NA 311 NA 22.1 NA NA NAWSC-14-SED-0 02/21/06 08/24/07 Surface REG mg/kg NA 4.5 NA 198 NA 13.6 NA NA NAWSC-15-SED-0 02/21/06 08/24/07 Surface REG mg/kg NA 3.1 NA 62.1 NA 6.5 NA NA NAWSC-16-SED-0 02/21/06 08/24/07 Surface REG mg/kg NA 2.8 NA 20.0 NA 3.4 NA NA NAWSC-17-SED-0 02/21/06 08/24/07 Surface REG mg/kg NA 3.2 NA 60.5 NA 6.4 NA NA NAWSC-18-SED-0 02/21/06 02/24/06 Surface REG mg/kg 0.5 J 2.3 J 0.03 J+ 65.8 13,500 10.4 J 1 J 0.49 J- 34 JWSC-18-SED-0 02/21/06 09/14/07 Surface REG mg/kg NA 3.4 J- NA 132 J- NA 13.3 J- NA NA NAWSC-19-SED-0 02/21/06 08/24/07 Surface REG mg/kg NA 2.0 J- NA 45.7 J- NA 12.0 J- NA NA NAWSC-20-SED-0 02/21/06 08/24/07 Surface REG mg/kg NA 1.3 J- NA 42.6 J- NA 8.9 J- NA NA NAWSC-20-SED-0 02/21/06 08/24/07 Surface FD mg/kg NA 2.3 J- NA 74.9 J- NA 12.5 J- NA NA NAWSC-21-SED-0 02/21/06 08/24/07 Surface REG mg/kg NA 5.8 J- NA 538 J- NA 30.9 J- NA NA NAWSC-22-SED-0 02/21/06 08/24/07 Surface REG mg/kg NA 6.0 J- NA 497 J- NA 21.5 J- NA NA NAWSC-23-SED-0 02/21/06 08/24/07 Surface REG mg/kg NA 2.0 J- NA 44.9 J- NA 9.6 J- NA NA NAWSC-24-SED-0 02/21/06 08/24/07 Surface REG mg/kg NA 5.1 J- NA 502 J- NA 29.6 J- NA NA NAWSC-25-SED-0 02/23/06 08/24/07 Surface REG mg/kg NA 5.0 J- NA 612 J- NA 28.7 J- NA NA NAWSC-26-SED-0 02/23/06 08/24/07 Surface REG mg/kg NA 6.3 J- NA 267 J- NA 26.9 J- NA NA NAWSC-27-SED-0 02/23/06 08/24/07 Surface REG mg/kg NA 3.5 J- NA 430 J- NA 23.3 J- NA NA NAWSC-28-SED-0 02/23/06 08/24/07 Surface REG mg/kg NA 4.7 J- NA 469 J- NA 26.2 J- NA NA NAWSC-29-SED-0 02/23/06 08/28/07 Surface REG mg/kg NA 7.8 J- NA 964 J- NA 35.9 J- NA NA NAWSC-29-SED-0 02/23/06 08/28/07 Surface FD mg/kg NA 5.4 J- NA 820 J- NA 32.3 J- NA NA NAWSC-30-SED-0 02/23/06 08/28/07 Surface REG mg/kg NA 4.0 J- NA 259 J- NA 14.7 J- NA NA NAWSC-31-SED-0 02/23/06 02/24/06 Surface REG mg/kg 1 J 4 0.69 454 14,900 23.2 2.2 0.71 U 37.3WSC-32-SED-0 02/23/06 08/28/07 Surface REG mg/kg NA 5.2 J- NA 405 J- NA 22.8 J- NA NA NAWSC-33-SED-0 02/23/06 08/28/07 Surface REG mg/kg NA 4.7 J- NA 264 J- NA 11.3 J- NA NA NAWSC-34-SED-0 02/23/06 08/28/07 Surface REG mg/kg NA 3.0 J- NA 113 J- NA 6.1 J- NA NA NA
Page 8 of 10
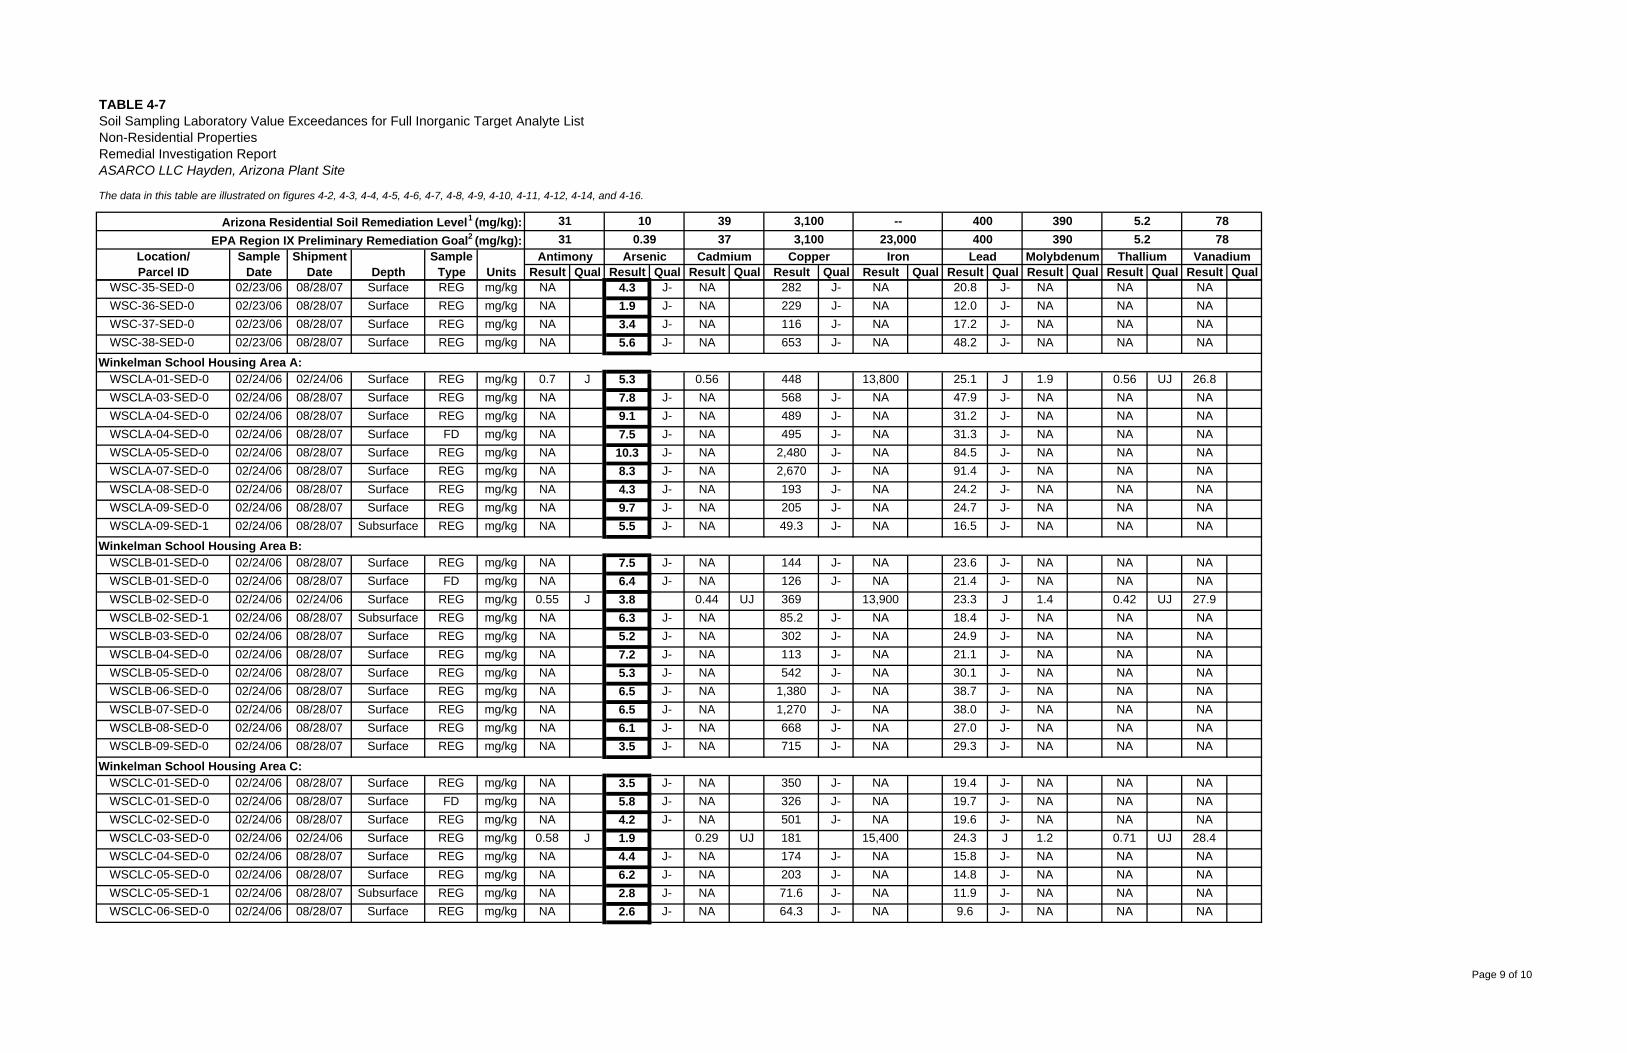
The data in this table are illustrated on figures 4-2, 4-3, 4-4, 4-5, 4-6, 4-7, 4-8, 4-9, 4-10, 4-11, 4-12, 4-14, and 4-16.
Result Qual Result Qual Result Qual Result Qual Result Qual Result Qual Result Qual Result Qual Result Qual
TABLE 4-7
Depth
Soil Sampling Laboratory Value Exceedances for Full Inorganic Target Analyte ListNon-Residential PropertiesRemedial Investigation ReportASARCO LLC Hayden, Arizona Plant Site
Location/Parcel ID
31
ShipmentDate Units
Arizona Residential Soil Remediation Level1 (mg/kg):EPA Region IX Preliminary Remediation Goal2 (mg/kg):
SampleType
SampleDate
10
Antimony Arsenic31 0.39
3937
Cadmium
3,1003,100
Copper
--23,000
Iron
400400
Lead
7878
Vanadium
390390
Molybdenum
5.25.2
Thallium
WSC-35-SED-0 02/23/06 08/28/07 Surface REG mg/kg NA 4.3 J- NA 282 J- NA 20.8 J- NA NA NAWSC-36-SED-0 02/23/06 08/28/07 Surface REG mg/kg NA 1.9 J- NA 229 J- NA 12.0 J- NA NA NAWSC-37-SED-0 02/23/06 08/28/07 Surface REG mg/kg NA 3.4 J- NA 116 J- NA 17.2 J- NA NA NAWSC-38-SED-0 02/23/06 08/28/07 Surface REG mg/kg NA 5.6 J- NA 653 J- NA 48.2 J- NA NA NA
WSCLA-01-SED-0 02/24/06 02/24/06 Surface REG mg/kg 0.7 J 5.3 0.56 448 13,800 25.1 J 1.9 0.56 UJ 26.8WSCLA-03-SED-0 02/24/06 08/28/07 Surface REG mg/kg NA 7.8 J- NA 568 J- NA 47.9 J- NA NA NAWSCLA-04-SED-0 02/24/06 08/28/07 Surface REG mg/kg NA 9.1 J- NA 489 J- NA 31.2 J- NA NA NAWSCLA-04-SED-0 02/24/06 08/28/07 Surface FD mg/kg NA 7.5 J- NA 495 J- NA 31.3 J- NA NA NAWSCLA-05-SED-0 02/24/06 08/28/07 Surface REG mg/kg NA 10.3 J- NA 2,480 J- NA 84.5 J- NA NA NAWSCLA-07-SED-0 02/24/06 08/28/07 Surface REG mg/kg NA 8.3 J- NA 2,670 J- NA 91.4 J- NA NA NAWSCLA-08-SED-0 02/24/06 08/28/07 Surface REG mg/kg NA 4.3 J- NA 193 J- NA 24.2 J- NA NA NAWSCLA-09-SED-0 02/24/06 08/28/07 Surface REG mg/kg NA 9.7 J- NA 205 J- NA 24.7 J- NA NA NAWSCLA-09-SED-1 02/24/06 08/28/07 Subsurface REG mg/kg NA 5.5 J- NA 49.3 J- NA 16.5 J- NA NA NA
WSCLB-01-SED-0 02/24/06 08/28/07 Surface REG mg/kg NA 7.5 J- NA 144 J- NA 23.6 J- NA NA NAWSCLB-01-SED-0 02/24/06 08/28/07 Surface FD mg/kg NA 6.4 J- NA 126 J- NA 21.4 J- NA NA NAWSCLB-02-SED-0 02/24/06 02/24/06 Surface REG mg/kg 0.55 J 3.8 0.44 UJ 369 13,900 23.3 J 1.4 0.42 UJ 27.9WSCLB-02-SED-1 02/24/06 08/28/07 Subsurface REG mg/kg NA 6.3 J- NA 85.2 J- NA 18.4 J- NA NA NAWSCLB-03-SED-0 02/24/06 08/28/07 Surface REG mg/kg NA 5.2 J- NA 302 J- NA 24.9 J- NA NA NAWSCLB-04-SED-0 02/24/06 08/28/07 Surface REG mg/kg NA 7.2 J- NA 113 J- NA 21.1 J- NA NA NAWSCLB-05-SED-0 02/24/06 08/28/07 Surface REG mg/kg NA 5.3 J- NA 542 J- NA 30.1 J- NA NA NAWSCLB-06-SED-0 02/24/06 08/28/07 Surface REG mg/kg NA 6.5 J- NA 1,380 J- NA 38.7 J- NA NA NAWSCLB-07-SED-0 02/24/06 08/28/07 Surface REG mg/kg NA 6.5 J- NA 1,270 J- NA 38.0 J- NA NA NAWSCLB-08-SED-0 02/24/06 08/28/07 Surface REG mg/kg NA 6.1 J- NA 668 J- NA 27.0 J- NA NA NAWSCLB-09-SED-0 02/24/06 08/28/07 Surface REG mg/kg NA 3.5 J- NA 715 J- NA 29.3 J- NA NA NA
WSCLC-01-SED-0 02/24/06 08/28/07 Surface REG mg/kg NA 3.5 J- NA 350 J- NA 19.4 J- NA NA NAWSCLC-01-SED-0 02/24/06 08/28/07 Surface FD mg/kg NA 5.8 J- NA 326 J- NA 19.7 J- NA NA NAWSCLC-02-SED-0 02/24/06 08/28/07 Surface REG mg/kg NA 4.2 J- NA 501 J- NA 19.6 J- NA NA NAWSCLC-03-SED-0 02/24/06 02/24/06 Surface REG mg/kg 0.58 J 1.9 0.29 UJ 181 15,400 24.3 J 1.2 0.71 UJ 28.4WSCLC-04-SED-0 02/24/06 08/28/07 Surface REG mg/kg NA 4.4 J- NA 174 J- NA 15.8 J- NA NA NAWSCLC-05-SED-0 02/24/06 08/28/07 Surface REG mg/kg NA 6.2 J- NA 203 J- NA 14.8 J- NA NA NAWSCLC-05-SED-1 02/24/06 08/28/07 Subsurface REG mg/kg NA 2.8 J- NA 71.6 J- NA 11.9 J- NA NA NAWSCLC-06-SED-0 02/24/06 08/28/07 Surface REG mg/kg NA 2.6 J- NA 64.3 J- NA 9.6 J- NA NA NA
Winkelman School Housing Area A:
Winkelman School Housing Area B:
Winkelman School Housing Area C:
Page 9 of 10
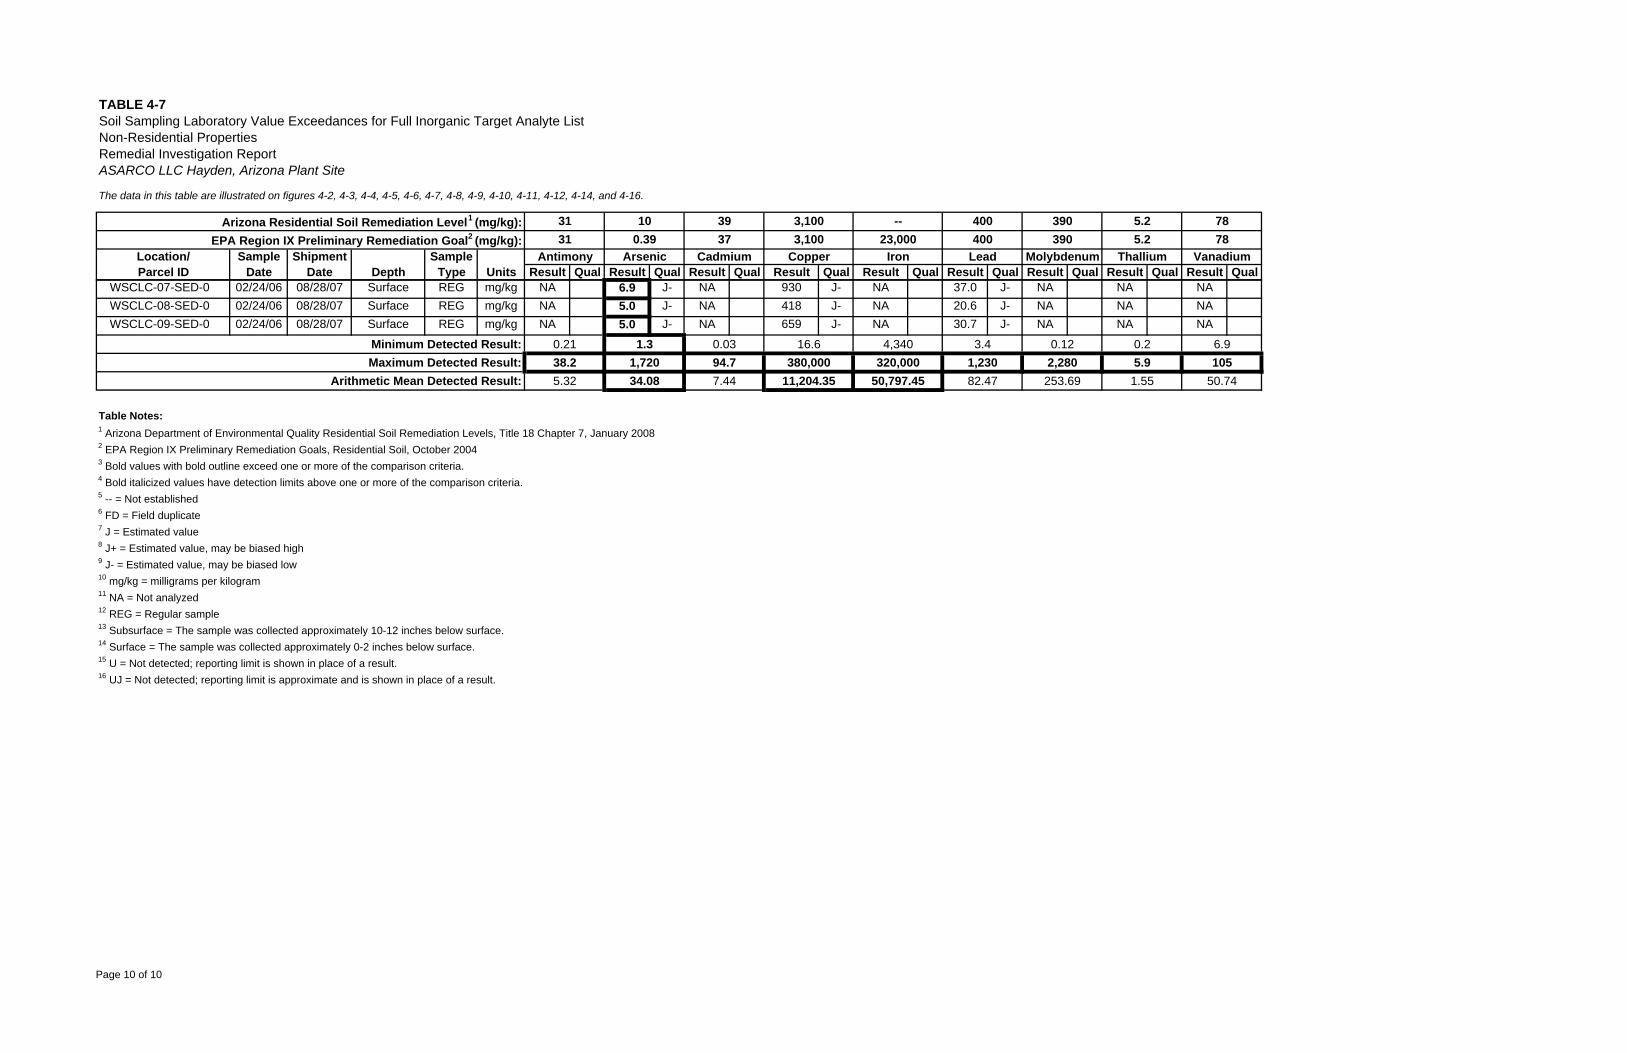
The data in this table are illustrated on figures 4-2, 4-3, 4-4, 4-5, 4-6, 4-7, 4-8, 4-9, 4-10, 4-11, 4-12, 4-14, and 4-16.
Result Qual Result Qual Result Qual Result Qual Result Qual Result Qual Result Qual Result Qual Result Qual
TABLE 4-7
Depth
Soil Sampling Laboratory Value Exceedances for Full Inorganic Target Analyte ListNon-Residential PropertiesRemedial Investigation ReportASARCO LLC Hayden, Arizona Plant Site
Location/Parcel ID
31
ShipmentDate Units
Arizona Residential Soil Remediation Level1 (mg/kg):EPA Region IX Preliminary Remediation Goal2 (mg/kg):
SampleType
SampleDate
10
Antimony Arsenic31 0.39
3937
Cadmium
3,1003,100
Copper
--23,000
Iron
400400
Lead
7878
Vanadium
390390
Molybdenum
5.25.2
Thallium
WSCLC-07-SED-0 02/24/06 08/28/07 Surface REG mg/kg NA 6.9 J- NA 930 J- NA 37.0 J- NA NA NAWSCLC-08-SED-0 02/24/06 08/28/07 Surface REG mg/kg NA 5.0 J- NA 418 J- NA 20.6 J- NA NA NAWSCLC-09-SED-0 02/24/06 08/28/07 Surface REG mg/kg NA 5.0 J- NA 659 J- NA 30.7 J- NA NA NA
Table Notes:1 Arizona Department of Environmental Quality Residential Soil Remediation Levels, Title 18 Chapter 7, January 20082 EPA Region IX Preliminary Remediation Goals, Residential Soil, October 20043 Bold values with bold outline exceed one or more of the comparison criteria.4 Bold italicized values have detection limits above one or more of the comparison criteria.5 -- = Not established6 FD = Field duplicate7 J = Estimated value8 J+ = Estimated value, may be biased high9 J- = Estimated value, may be biased low10 mg/kg = milligrams per kilogram11 NA = Not analyzed12 REG = Regular sample13 Subsurface = The sample was collected approximately 10-12 inches below surface.14 Surface = The sample was collected approximately 0-2 inches below surface.15 U = Not detected; reporting limit is shown in place of a result.16 UJ = Not detected; reporting limit is approximate and is shown in place of a result.
320,000 1,2300.2 6.90.12
Maximum Detected Result: 94.7 380,00038.2 1,720Minimum Detected Result: 0.21 1.3 0.03 16.6 4,340 3.4
Arithmetic Mean Detected Result: 5.32 34.08 7.44 11,204.35 50,797.45 82.47 1.55 50.742,280 5.9 105
253.69
Page 10 of 10
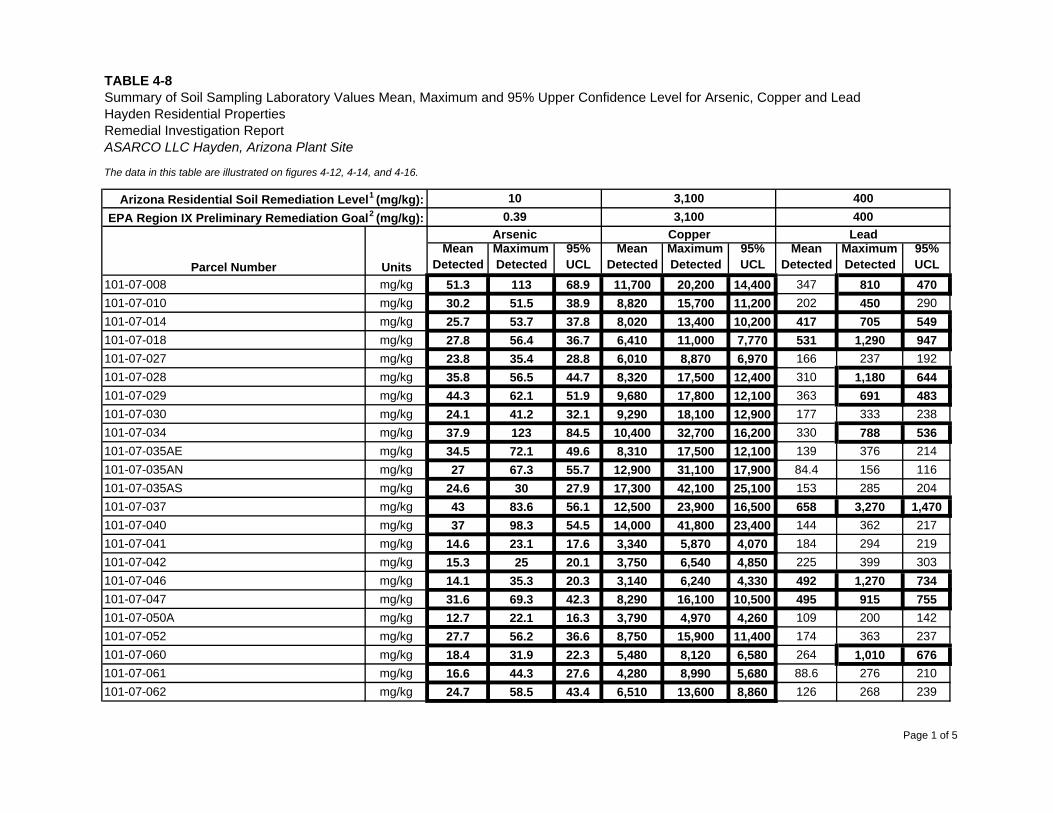
Hayden Residential Properties
The data in this table are illustrated on figures 4-12, 4-14, and 4-16.
MeanDetected
MaximumDetected
95%UCL
MeanDetected
MaximumDetected
95%UCL
MeanDetected
MaximumDetected
95%UCL
101-07-008 mg/kg 51.3 113 68.9 11,700 20,200 14,400 347 810 470101-07-010 mg/kg 30.2 51.5 38.9 8,820 15,700 11,200 202 450 290101-07-014 mg/kg 25.7 53.7 37.8 8,020 13,400 10,200 417 705 549101-07-018 mg/kg 27.8 56.4 36.7 6,410 11,000 7,770 531 1,290 947101-07-027 mg/kg 23.8 35.4 28.8 6,010 8,870 6,970 166 237 192101-07-028 mg/kg 35.8 56.5 44.7 8,320 17,500 12,400 310 1,180 644101-07-029 mg/kg 44.3 62.1 51.9 9,680 17,800 12,100 363 691 483101-07-030 mg/kg 24.1 41.2 32.1 9,290 18,100 12,900 177 333 238101-07-034 mg/kg 37.9 123 84.5 10,400 32,700 16,200 330 788 536101-07-035AE mg/kg 34.5 72.1 49.6 8,310 17,500 12,100 139 376 214101-07-035AN mg/kg 27 67.3 55.7 12,900 31,100 17,900 84.4 156 116101-07-035AS mg/kg 24.6 30 27.9 17,300 42,100 25,100 153 285 204101-07-037 mg/kg 43 83.6 56.1 12,500 23,900 16,500 658 3,270 1,470101-07-040 mg/kg 37 98.3 54.5 14,000 41,800 23,400 144 362 217101-07-041 mg/kg 14.6 23.1 17.6 3,340 5,870 4,070 184 294 219101-07-042 mg/kg 15.3 25 20.1 3,750 6,540 4,850 225 399 303101-07-046 mg/kg 14.1 35.3 20.3 3,140 6,240 4,330 492 1,270 734101-07-047 mg/kg 31.6 69.3 42.3 8,290 16,100 10,500 495 915 755101-07-050A mg/kg 12.7 22.1 16.3 3,790 4,970 4,260 109 200 142101-07-052 mg/kg 27.7 56.2 36.6 8,750 15,900 11,400 174 363 237101-07-060 mg/kg 18.4 31.9 22.3 5,480 8,120 6,580 264 1,010 676101-07-061 mg/kg 16.6 44.3 27.6 4,280 8,990 5,680 88.6 276 210101-07-062 mg/kg 24.7 58.5 43.4 6,510 13,600 8,860 126 268 239
400Arizona Residential Soil Remediation Level1 (mg/kg):
EPA Region IX Preliminary Remediation Goal2 (mg/kg):3,1003,100
100.39
Parcel Number
TABLE 4-8
Remedial Investigation ReportASARCO LLC Hayden, Arizona Plant Site
Summary of Soil Sampling Laboratory Values Mean, Maximum and 95% Upper Confidence Level for Arsenic, Copper and Lead
Arsenic Copper Lead
Units
400
Page 1 of 5
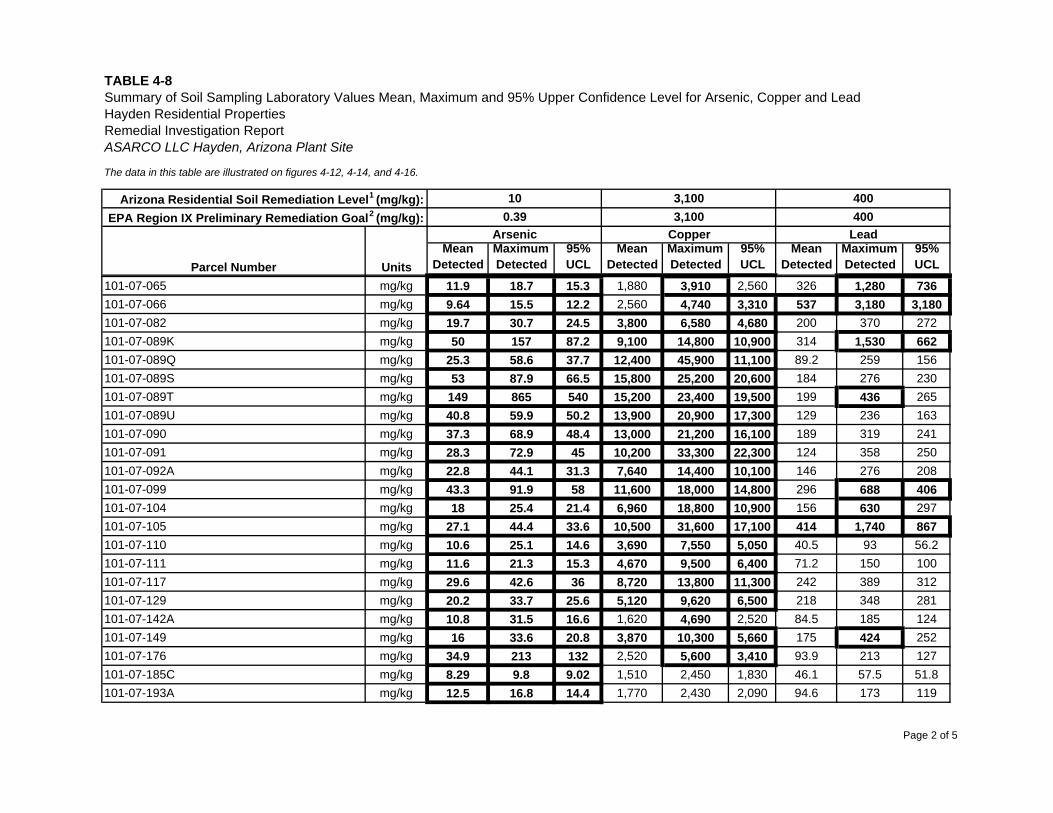
Hayden Residential Properties
The data in this table are illustrated on figures 4-12, 4-14, and 4-16.
MeanDetected
MaximumDetected
95%UCL
MeanDetected
MaximumDetected
95%UCL
MeanDetected
MaximumDetected
95%UCL
400Arizona Residential Soil Remediation Level1 (mg/kg):
EPA Region IX Preliminary Remediation Goal2 (mg/kg):3,1003,100
100.39
Parcel Number
TABLE 4-8
Remedial Investigation ReportASARCO LLC Hayden, Arizona Plant Site
Summary of Soil Sampling Laboratory Values Mean, Maximum and 95% Upper Confidence Level for Arsenic, Copper and Lead
Arsenic Copper Lead
Units
400
101-07-065 mg/kg 11.9 18.7 15.3 1,880 3,910 2,560 326 1,280 736101-07-066 mg/kg 9.64 15.5 12.2 2,560 4,740 3,310 537 3,180 3,180101-07-082 mg/kg 19.7 30.7 24.5 3,800 6,580 4,680 200 370 272101-07-089K mg/kg 50 157 87.2 9,100 14,800 10,900 314 1,530 662101-07-089Q mg/kg 25.3 58.6 37.7 12,400 45,900 11,100 89.2 259 156101-07-089S mg/kg 53 87.9 66.5 15,800 25,200 20,600 184 276 230101-07-089T mg/kg 149 865 540 15,200 23,400 19,500 199 436 265101-07-089U mg/kg 40.8 59.9 50.2 13,900 20,900 17,300 129 236 163101-07-090 mg/kg 37.3 68.9 48.4 13,000 21,200 16,100 189 319 241101-07-091 mg/kg 28.3 72.9 45 10,200 33,300 22,300 124 358 250101-07-092A mg/kg 22.8 44.1 31.3 7,640 14,400 10,100 146 276 208101-07-099 mg/kg 43.3 91.9 58 11,600 18,000 14,800 296 688 406101-07-104 mg/kg 18 25.4 21.4 6,960 18,800 10,900 156 630 297101-07-105 mg/kg 27.1 44.4 33.6 10,500 31,600 17,100 414 1,740 867101-07-110 mg/kg 10.6 25.1 14.6 3,690 7,550 5,050 40.5 93 56.2101-07-111 mg/kg 11.6 21.3 15.3 4,670 9,500 6,400 71.2 150 100101-07-117 mg/kg 29.6 42.6 36 8,720 13,800 11,300 242 389 312101-07-129 mg/kg 20.2 33.7 25.6 5,120 9,620 6,500 218 348 281101-07-142A mg/kg 10.8 31.5 16.6 1,620 4,690 2,520 84.5 185 124101-07-149 mg/kg 16 33.6 20.8 3,870 10,300 5,660 175 424 252101-07-176 mg/kg 34.9 213 132 2,520 5,600 3,410 93.9 213 127101-07-185C mg/kg 8.29 9.8 9.02 1,510 2,450 1,830 46.1 57.5 51.8101-07-193A mg/kg 12.5 16.8 14.4 1,770 2,430 2,090 94.6 173 119
Page 2 of 5
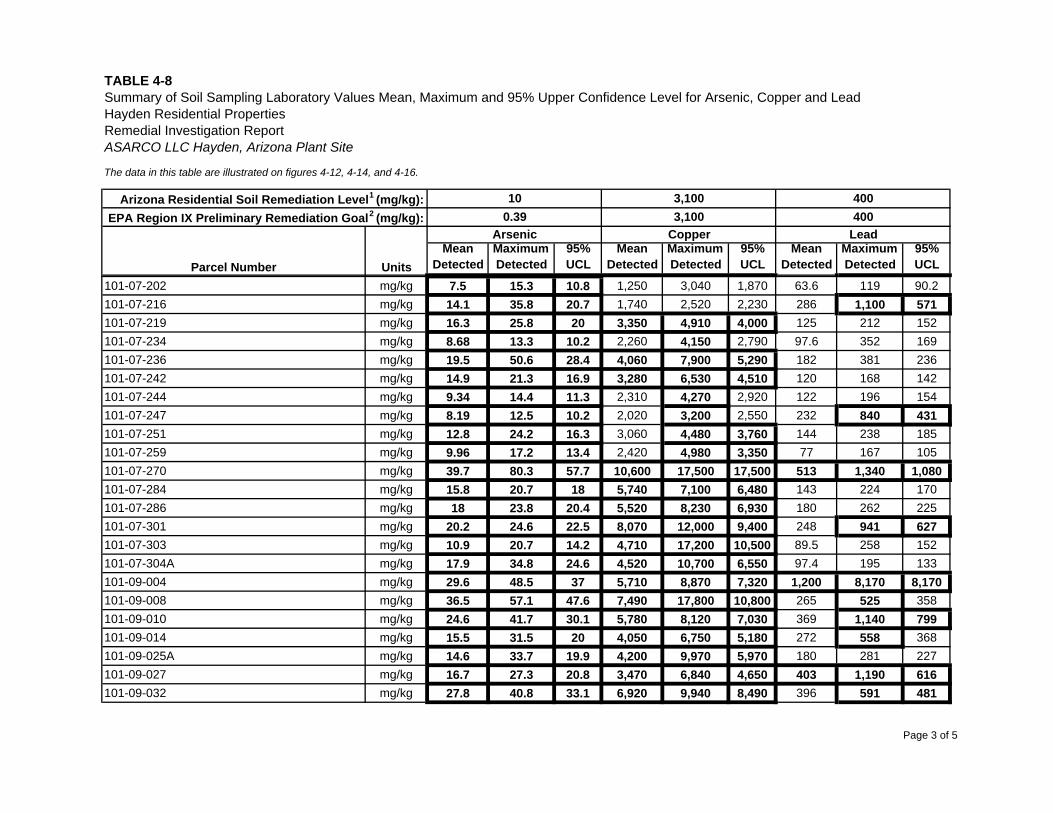
Hayden Residential Properties
The data in this table are illustrated on figures 4-12, 4-14, and 4-16.
MeanDetected
MaximumDetected
95%UCL
MeanDetected
MaximumDetected
95%UCL
MeanDetected
MaximumDetected
95%UCL
400Arizona Residential Soil Remediation Level1 (mg/kg):
EPA Region IX Preliminary Remediation Goal2 (mg/kg):3,1003,100
100.39
Parcel Number
TABLE 4-8
Remedial Investigation ReportASARCO LLC Hayden, Arizona Plant Site
Summary of Soil Sampling Laboratory Values Mean, Maximum and 95% Upper Confidence Level for Arsenic, Copper and Lead
Arsenic Copper Lead
Units
400
101-07-202 mg/kg 7.5 15.3 10.8 1,250 3,040 1,870 63.6 119 90.2101-07-216 mg/kg 14.1 35.8 20.7 1,740 2,520 2,230 286 1,100 571101-07-219 mg/kg 16.3 25.8 20 3,350 4,910 4,000 125 212 152101-07-234 mg/kg 8.68 13.3 10.2 2,260 4,150 2,790 97.6 352 169101-07-236 mg/kg 19.5 50.6 28.4 4,060 7,900 5,290 182 381 236101-07-242 mg/kg 14.9 21.3 16.9 3,280 6,530 4,510 120 168 142101-07-244 mg/kg 9.34 14.4 11.3 2,310 4,270 2,920 122 196 154101-07-247 mg/kg 8.19 12.5 10.2 2,020 3,200 2,550 232 840 431101-07-251 mg/kg 12.8 24.2 16.3 3,060 4,480 3,760 144 238 185101-07-259 mg/kg 9.96 17.2 13.4 2,420 4,980 3,350 77 167 105101-07-270 mg/kg 39.7 80.3 57.7 10,600 17,500 17,500 513 1,340 1,080101-07-284 mg/kg 15.8 20.7 18 5,740 7,100 6,480 143 224 170101-07-286 mg/kg 18 23.8 20.4 5,520 8,230 6,930 180 262 225101-07-301 mg/kg 20.2 24.6 22.5 8,070 12,000 9,400 248 941 627101-07-303 mg/kg 10.9 20.7 14.2 4,710 17,200 10,500 89.5 258 152101-07-304A mg/kg 17.9 34.8 24.6 4,520 10,700 6,550 97.4 195 133101-09-004 mg/kg 29.6 48.5 37 5,710 8,870 7,320 1,200 8,170 8,170101-09-008 mg/kg 36.5 57.1 47.6 7,490 17,800 10,800 265 525 358101-09-010 mg/kg 24.6 41.7 30.1 5,780 8,120 7,030 369 1,140 799101-09-014 mg/kg 15.5 31.5 20 4,050 6,750 5,180 272 558 368101-09-025A mg/kg 14.6 33.7 19.9 4,200 9,970 5,970 180 281 227101-09-027 mg/kg 16.7 27.3 20.8 3,470 6,840 4,650 403 1,190 616101-09-032 mg/kg 27.8 40.8 33.1 6,920 9,940 8,490 396 591 481
Page 3 of 5

Hayden Residential Properties
The data in this table are illustrated on figures 4-12, 4-14, and 4-16.
MeanDetected
MaximumDetected
95%UCL
MeanDetected
MaximumDetected
95%UCL
MeanDetected
MaximumDetected
95%UCL
400Arizona Residential Soil Remediation Level1 (mg/kg):
EPA Region IX Preliminary Remediation Goal2 (mg/kg):3,1003,100
100.39
Parcel Number
TABLE 4-8
Remedial Investigation ReportASARCO LLC Hayden, Arizona Plant Site
Summary of Soil Sampling Laboratory Values Mean, Maximum and 95% Upper Confidence Level for Arsenic, Copper and Lead
Arsenic Copper Lead
Units
400
101-09-033 mg/kg 39.9 89.1 53.4 7,570 17,500 10,300 580 1,610 972101-09-036 mg/kg 23.9 49.3 32.1 5,230 9,680 7,000 1,150 3,710 2,330101-09-038 mg/kg 56.8 116 78.7 10,600 17,200 14,300 318 557 422101-09-039 mg/kg 16.2 32.5 22.3 4,680 12,600 6,890 737 5,210 3,010101-09-042 mg/kg 14.7 26 17.7 4,070 7,110 4,960 347 491 398101-09-045 mg/kg 17.8 31.5 22.6 4,050 6,360 5,010 110 192 137101-09-047 mg/kg 18.7 28.5 22.2 5,260 12,400 7,330 606 1,170 961101-09-054 mg/kg 21.9 29.9 25.7 5,940 8,880 7,480 551 783 676101-09-059 mg/kg 10.5 19.7 13.8 3,930 9,390 5,520 303 1,350 727101-09-062 mg/kg 18.7 31.8 24.4 3,830 5,460 4,590 539 1,070 712101-09-064 mg/kg 30 74.7 42.7 7,770 18,500 11,100 232 434 412101-09-067 mg/kg 32.3 44.8 37 5,410 6,890 5,970 667 1,390 909101-09-068 mg/kg 15.9 33.1 20.7 3,340 5,740 4,130 199 512 296101-09-070 mg/kg 20.6 32.7 25.9 6,280 13,400 8,510 832 4,860 3,030101-09-072 mg/kg 23.5 34.8 29 6,850 11,800 8,430 280 1,030 518101-09-077 mg/kg 35.5 66.3 45.7 5,630 8,110 6,550 1,260 7,250 7,250101-09-083 mg/kg 17.4 69.5 33.6 3,020 11,900 5,910 350 536 459101-09-084 mg/kg 30.3 45.6 36.7 6,660 9,290 7,900 922 1,840 1,220101-09-088 mg/kg 13.2 32.3 19.1 1,890 4,060 2,690 10,500 92,600 92,600101-09-104 mg/kg 36.4 53.4 42.9 10,100 19,700 12,700 354 661 471101-09-106 mg/kg 37.5 88.3 52.4 10,100 15,800 12,000 658 2,990 1,350101-09-107 mg/kg 30.3 41.3 35.5 7,030 13,100 8,700 432 841 574101-09-108 mg/kg 45.7 62.6 52.3 12,100 20,600 15,800 813 2,470 1,600
Page 4 of 5
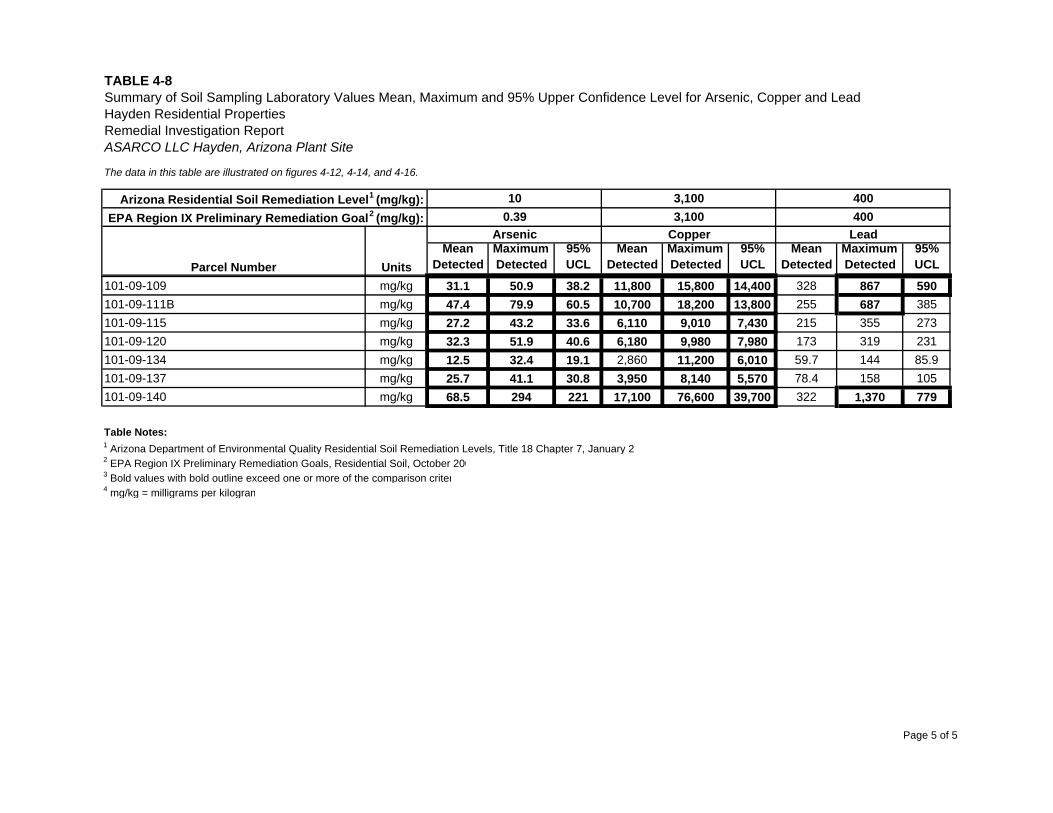
Hayden Residential Properties
The data in this table are illustrated on figures 4-12, 4-14, and 4-16.
MeanDetected
MaximumDetected
95%UCL
MeanDetected
MaximumDetected
95%UCL
MeanDetected
MaximumDetected
95%UCL
400Arizona Residential Soil Remediation Level1 (mg/kg):
EPA Region IX Preliminary Remediation Goal2 (mg/kg):3,1003,100
100.39
Parcel Number
TABLE 4-8
Remedial Investigation ReportASARCO LLC Hayden, Arizona Plant Site
Summary of Soil Sampling Laboratory Values Mean, Maximum and 95% Upper Confidence Level for Arsenic, Copper and Lead
Arsenic Copper Lead
Units
400
101-09-109 mg/kg 31.1 50.9 38.2 11,800 15,800 14,400 328 867 590101-09-111B mg/kg 47.4 79.9 60.5 10,700 18,200 13,800 255 687 385101-09-115 mg/kg 27.2 43.2 33.6 6,110 9,010 7,430 215 355 273101-09-120 mg/kg 32.3 51.9 40.6 6,180 9,980 7,980 173 319 231101-09-134 mg/kg 12.5 32.4 19.1 2,860 11,200 6,010 59.7 144 85.9101-09-137 mg/kg 25.7 41.1 30.8 3,950 8,140 5,570 78.4 158 105101-09-140 mg/kg 68.5 294 221 17,100 76,600 39,700 322 1,370 779
Table Notes:1 Arizona Department of Environmental Quality Residential Soil Remediation Levels, Title 18 Chapter 7, January 22 EPA Region IX Preliminary Remediation Goals, Residential Soil, October 2003 Bold values with bold outline exceed one or more of the comparison criter4 mg/kg = milligrams per kilogram
Page 5 of 5
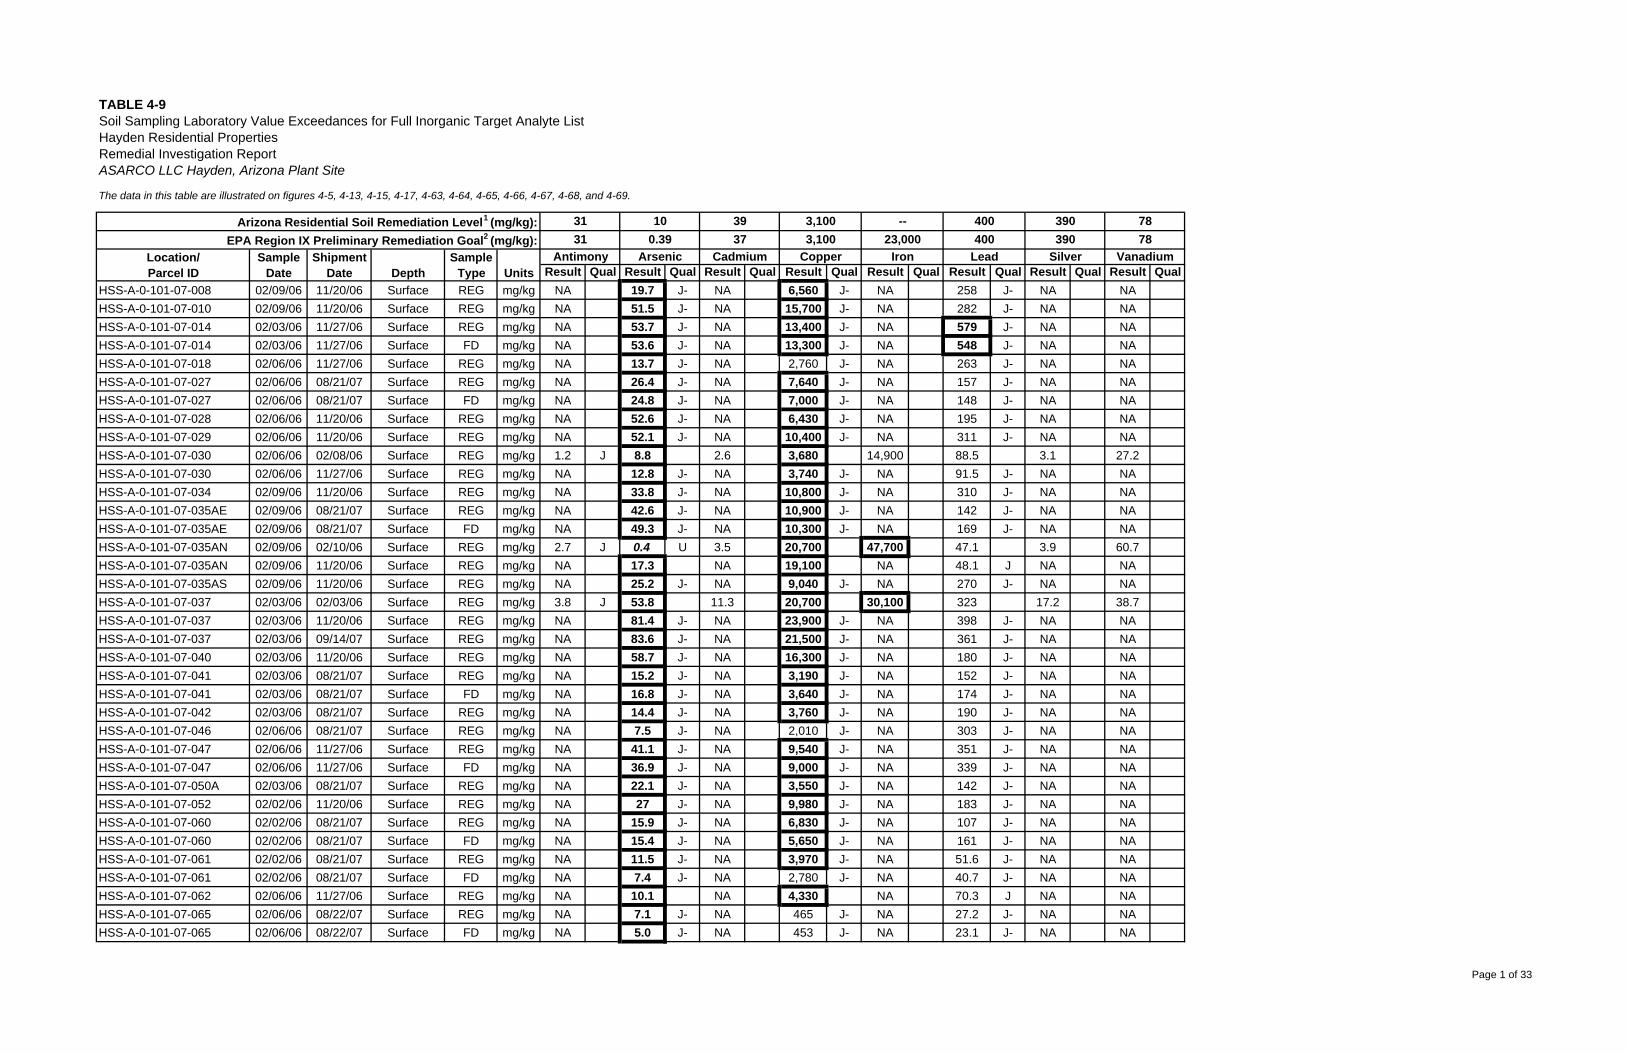
The data in this table are illustrated on figures 4-5, 4-13, 4-15, 4-17, 4-63, 4-64, 4-65, 4-66, 4-67, 4-68, and 4-69.
Result Qual Result Qual Result Qual Result Qual Result Qual Result Qual Result Qual Result QualHSS-A-0-101-07-008 02/09/06 11/20/06 Surface REG mg/kg NA 19.7 J- NA 6,560 J- NA 258 J- NA NAHSS-A-0-101-07-010 02/09/06 11/20/06 Surface REG mg/kg NA 51.5 J- NA 15,700 J- NA 282 J- NA NAHSS-A-0-101-07-014 02/03/06 11/27/06 Surface REG mg/kg NA 53.7 J- NA 13,400 J- NA 579 J- NA NAHSS-A-0-101-07-014 02/03/06 11/27/06 Surface FD mg/kg NA 53.6 J- NA 13,300 J- NA 548 J- NA NAHSS-A-0-101-07-018 02/06/06 11/27/06 Surface REG mg/kg NA 13.7 J- NA 2,760 J- NA 263 J- NA NAHSS-A-0-101-07-027 02/06/06 08/21/07 Surface REG mg/kg NA 26.4 J- NA 7,640 J- NA 157 J- NA NAHSS-A-0-101-07-027 02/06/06 08/21/07 Surface FD mg/kg NA 24.8 J- NA 7,000 J- NA 148 J- NA NAHSS-A-0-101-07-028 02/06/06 11/20/06 Surface REG mg/kg NA 52.6 J- NA 6,430 J- NA 195 J- NA NAHSS-A-0-101-07-029 02/06/06 11/20/06 Surface REG mg/kg NA 52.1 J- NA 10,400 J- NA 311 J- NA NAHSS-A-0-101-07-030 02/06/06 02/08/06 Surface REG mg/kg 1.2 J 8.8 2.6 3,680 14,900 88.5 3.1 27.2HSS-A-0-101-07-030 02/06/06 11/27/06 Surface REG mg/kg NA 12.8 J- NA 3,740 J- NA 91.5 J- NA NAHSS-A-0-101-07-034 02/09/06 11/20/06 Surface REG mg/kg NA 33.8 J- NA 10,800 J- NA 310 J- NA NAHSS-A-0-101-07-035AE 02/09/06 08/21/07 Surface REG mg/kg NA 42.6 J- NA 10,900 J- NA 142 J- NA NAHSS-A-0-101-07-035AE 02/09/06 08/21/07 Surface FD mg/kg NA 49.3 J- NA 10,300 J- NA 169 J- NA NAHSS-A-0-101-07-035AN 02/09/06 02/10/06 Surface REG mg/kg 2.7 J 0.4 U 3.5 20,700 47,700 47.1 3.9 60.7HSS-A-0-101-07-035AN 02/09/06 11/20/06 Surface REG mg/kg NA 17.3 NA 19,100 NA 48.1 J NA NAHSS-A-0-101-07-035AS 02/09/06 11/20/06 Surface REG mg/kg NA 25.2 J- NA 9,040 J- NA 270 J- NA NAHSS-A-0-101-07-037 02/03/06 02/03/06 Surface REG mg/kg 3.8 J 53.8 11.3 20,700 30,100 323 17.2 38.7HSS-A-0-101-07-037 02/03/06 11/20/06 Surface REG mg/kg NA 81.4 J- NA 23,900 J- NA 398 J- NA NAHSS-A-0-101-07-037 02/03/06 09/14/07 Surface REG mg/kg NA 83.6 J- NA 21,500 J- NA 361 J- NA NAHSS-A-0-101-07-040 02/03/06 11/20/06 Surface REG mg/kg NA 58.7 J- NA 16,300 J- NA 180 J- NA NAHSS-A-0-101-07-041 02/03/06 08/21/07 Surface REG mg/kg NA 15.2 J- NA 3,190 J- NA 152 J- NA NAHSS-A-0-101-07-041 02/03/06 08/21/07 Surface FD mg/kg NA 16.8 J- NA 3,640 J- NA 174 J- NA NAHSS-A-0-101-07-042 02/03/06 08/21/07 Surface REG mg/kg NA 14.4 J- NA 3,760 J- NA 190 J- NA NAHSS-A-0-101-07-046 02/06/06 08/21/07 Surface REG mg/kg NA 7.5 J- NA 2,010 J- NA 303 J- NA NAHSS-A-0-101-07-047 02/06/06 11/27/06 Surface REG mg/kg NA 41.1 J- NA 9,540 J- NA 351 J- NA NAHSS-A-0-101-07-047 02/06/06 11/27/06 Surface FD mg/kg NA 36.9 J- NA 9,000 J- NA 339 J- NA NAHSS-A-0-101-07-050A 02/03/06 08/21/07 Surface REG mg/kg NA 22.1 J- NA 3,550 J- NA 142 J- NA NAHSS-A-0-101-07-052 02/02/06 11/20/06 Surface REG mg/kg NA 27 J- NA 9,980 J- NA 183 J- NA NAHSS-A-0-101-07-060 02/02/06 08/21/07 Surface REG mg/kg NA 15.9 J- NA 6,830 J- NA 107 J- NA NAHSS-A-0-101-07-060 02/02/06 08/21/07 Surface FD mg/kg NA 15.4 J- NA 5,650 J- NA 161 J- NA NAHSS-A-0-101-07-061 02/02/06 08/21/07 Surface REG mg/kg NA 11.5 J- NA 3,970 J- NA 51.6 J- NA NAHSS-A-0-101-07-061 02/02/06 08/21/07 Surface FD mg/kg NA 7.4 J- NA 2,780 J- NA 40.7 J- NA NAHSS-A-0-101-07-062 02/06/06 11/27/06 Surface REG mg/kg NA 10.1 NA 4,330 NA 70.3 J NA NAHSS-A-0-101-07-065 02/06/06 08/22/07 Surface REG mg/kg NA 7.1 J- NA 465 J- NA 27.2 J- NA NAHSS-A-0-101-07-065 02/06/06 08/22/07 Surface FD mg/kg NA 5.0 J- NA 453 J- NA 23.1 J- NA NA
TABLE 4-9
Depth
Soil Sampling Laboratory Value Exceedances for Full Inorganic Target Analyte ListHayden Residential PropertiesRemedial Investigation ReportASARCO LLC Hayden, Arizona Plant Site
Location/Parcel ID
31
ShipmentDate Units
Arizona Residential Soil Remediation Level1 (mg/kg):EPA Region IX Preliminary Remediation Goal2 (mg/kg):
SampleType
SampleDate
10
Antimony Arsenic31 0.39
3937
Cadmium
3,1003,100
Copper
--23,000
Iron
400400
Lead
390390
Silver
7878
Vanadium
Page 1 of 33
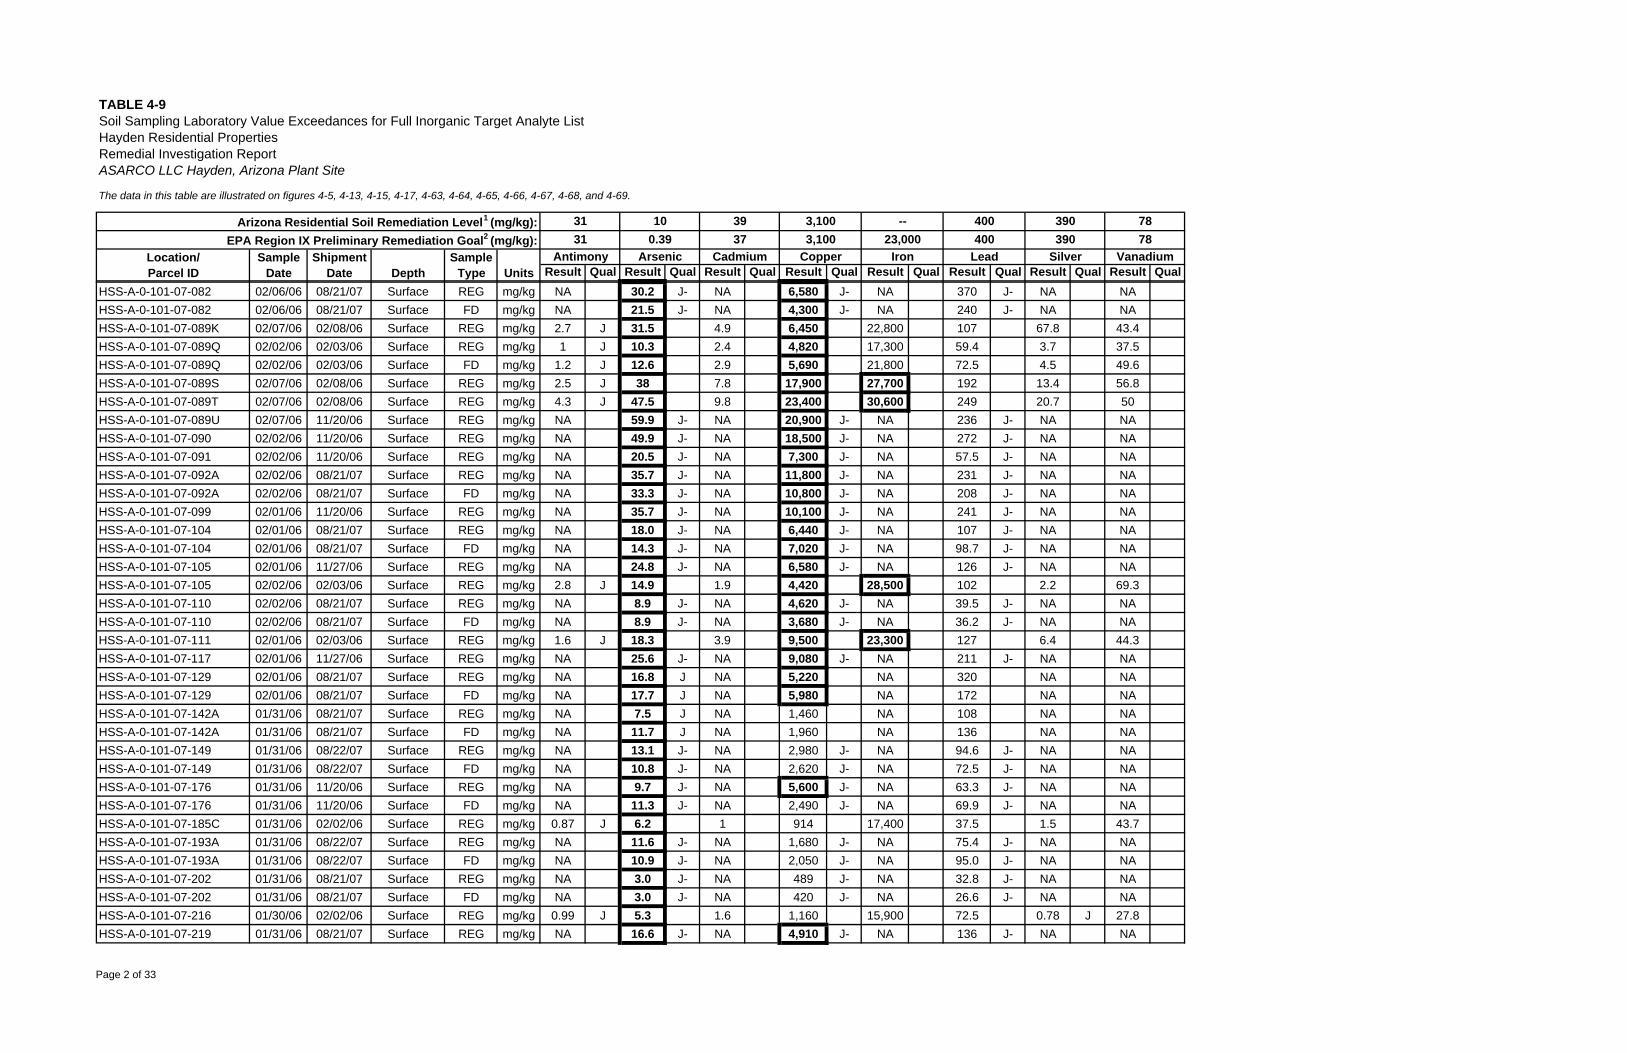
The data in this table are illustrated on figures 4-5, 4-13, 4-15, 4-17, 4-63, 4-64, 4-65, 4-66, 4-67, 4-68, and 4-69.
Result Qual Result Qual Result Qual Result Qual Result Qual Result Qual Result Qual Result Qual
TABLE 4-9
Depth
Soil Sampling Laboratory Value Exceedances for Full Inorganic Target Analyte ListHayden Residential PropertiesRemedial Investigation ReportASARCO LLC Hayden, Arizona Plant Site
Location/Parcel ID
31
ShipmentDate Units
Arizona Residential Soil Remediation Level1 (mg/kg):EPA Region IX Preliminary Remediation Goal2 (mg/kg):
SampleType
SampleDate
10
Antimony Arsenic31 0.39
3937
Cadmium
3,1003,100
Copper
--23,000
Iron
400400
Lead
390390
Silver
7878
Vanadium
HSS-A-0-101-07-082 02/06/06 08/21/07 Surface REG mg/kg NA 30.2 J- NA 6,580 J- NA 370 J- NA NAHSS-A-0-101-07-082 02/06/06 08/21/07 Surface FD mg/kg NA 21.5 J- NA 4,300 J- NA 240 J- NA NAHSS-A-0-101-07-089K 02/07/06 02/08/06 Surface REG mg/kg 2.7 J 31.5 4.9 6,450 22,800 107 67.8 43.4HSS-A-0-101-07-089Q 02/02/06 02/03/06 Surface REG mg/kg 1 J 10.3 2.4 4,820 17,300 59.4 3.7 37.5HSS-A-0-101-07-089Q 02/02/06 02/03/06 Surface FD mg/kg 1.2 J 12.6 2.9 5,690 21,800 72.5 4.5 49.6HSS-A-0-101-07-089S 02/07/06 02/08/06 Surface REG mg/kg 2.5 J 38 7.8 17,900 27,700 192 13.4 56.8HSS-A-0-101-07-089T 02/07/06 02/08/06 Surface REG mg/kg 4.3 J 47.5 9.8 23,400 30,600 249 20.7 50HSS-A-0-101-07-089U 02/07/06 11/20/06 Surface REG mg/kg NA 59.9 J- NA 20,900 J- NA 236 J- NA NAHSS-A-0-101-07-090 02/02/06 11/20/06 Surface REG mg/kg NA 49.9 J- NA 18,500 J- NA 272 J- NA NAHSS-A-0-101-07-091 02/02/06 11/20/06 Surface REG mg/kg NA 20.5 J- NA 7,300 J- NA 57.5 J- NA NAHSS-A-0-101-07-092A 02/02/06 08/21/07 Surface REG mg/kg NA 35.7 J- NA 11,800 J- NA 231 J- NA NAHSS-A-0-101-07-092A 02/02/06 08/21/07 Surface FD mg/kg NA 33.3 J- NA 10,800 J- NA 208 J- NA NAHSS-A-0-101-07-099 02/01/06 11/20/06 Surface REG mg/kg NA 35.7 J- NA 10,100 J- NA 241 J- NA NAHSS-A-0-101-07-104 02/01/06 08/21/07 Surface REG mg/kg NA 18.0 J- NA 6,440 J- NA 107 J- NA NAHSS-A-0-101-07-104 02/01/06 08/21/07 Surface FD mg/kg NA 14.3 J- NA 7,020 J- NA 98.7 J- NA NAHSS-A-0-101-07-105 02/01/06 11/27/06 Surface REG mg/kg NA 24.8 J- NA 6,580 J- NA 126 J- NA NAHSS-A-0-101-07-105 02/02/06 02/03/06 Surface REG mg/kg 2.8 J 14.9 1.9 4,420 28,500 102 2.2 69.3HSS-A-0-101-07-110 02/02/06 08/21/07 Surface REG mg/kg NA 8.9 J- NA 4,620 J- NA 39.5 J- NA NAHSS-A-0-101-07-110 02/02/06 08/21/07 Surface FD mg/kg NA 8.9 J- NA 3,680 J- NA 36.2 J- NA NAHSS-A-0-101-07-111 02/01/06 02/03/06 Surface REG mg/kg 1.6 J 18.3 3.9 9,500 23,300 127 6.4 44.3HSS-A-0-101-07-117 02/01/06 11/27/06 Surface REG mg/kg NA 25.6 J- NA 9,080 J- NA 211 J- NA NAHSS-A-0-101-07-129 02/01/06 08/21/07 Surface REG mg/kg NA 16.8 J NA 5,220 NA 320 NA NAHSS-A-0-101-07-129 02/01/06 08/21/07 Surface FD mg/kg NA 17.7 J NA 5,980 NA 172 NA NAHSS-A-0-101-07-142A 01/31/06 08/21/07 Surface REG mg/kg NA 7.5 J NA 1,460 NA 108 NA NAHSS-A-0-101-07-142A 01/31/06 08/21/07 Surface FD mg/kg NA 11.7 J NA 1,960 NA 136 NA NAHSS-A-0-101-07-149 01/31/06 08/22/07 Surface REG mg/kg NA 13.1 J- NA 2,980 J- NA 94.6 J- NA NAHSS-A-0-101-07-149 01/31/06 08/22/07 Surface FD mg/kg NA 10.8 J- NA 2,620 J- NA 72.5 J- NA NAHSS-A-0-101-07-176 01/31/06 11/20/06 Surface REG mg/kg NA 9.7 J- NA 5,600 J- NA 63.3 J- NA NAHSS-A-0-101-07-176 01/31/06 11/20/06 Surface FD mg/kg NA 11.3 J- NA 2,490 J- NA 69.9 J- NA NAHSS-A-0-101-07-185C 01/31/06 02/02/06 Surface REG mg/kg 0.87 J 6.2 1 914 17,400 37.5 1.5 43.7HSS-A-0-101-07-193A 01/31/06 08/22/07 Surface REG mg/kg NA 11.6 J- NA 1,680 J- NA 75.4 J- NA NAHSS-A-0-101-07-193A 01/31/06 08/22/07 Surface FD mg/kg NA 10.9 J- NA 2,050 J- NA 95.0 J- NA NAHSS-A-0-101-07-202 01/31/06 08/21/07 Surface REG mg/kg NA 3.0 J- NA 489 J- NA 32.8 J- NA NAHSS-A-0-101-07-202 01/31/06 08/21/07 Surface FD mg/kg NA 3.0 J- NA 420 J- NA 26.6 J- NA NAHSS-A-0-101-07-216 01/30/06 02/02/06 Surface REG mg/kg 0.99 J 5.3 1.6 1,160 15,900 72.5 0.78 J 27.8HSS-A-0-101-07-219 01/31/06 08/21/07 Surface REG mg/kg NA 16.6 J- NA 4,910 J- NA 136 J- NA NA
Page 2 of 33
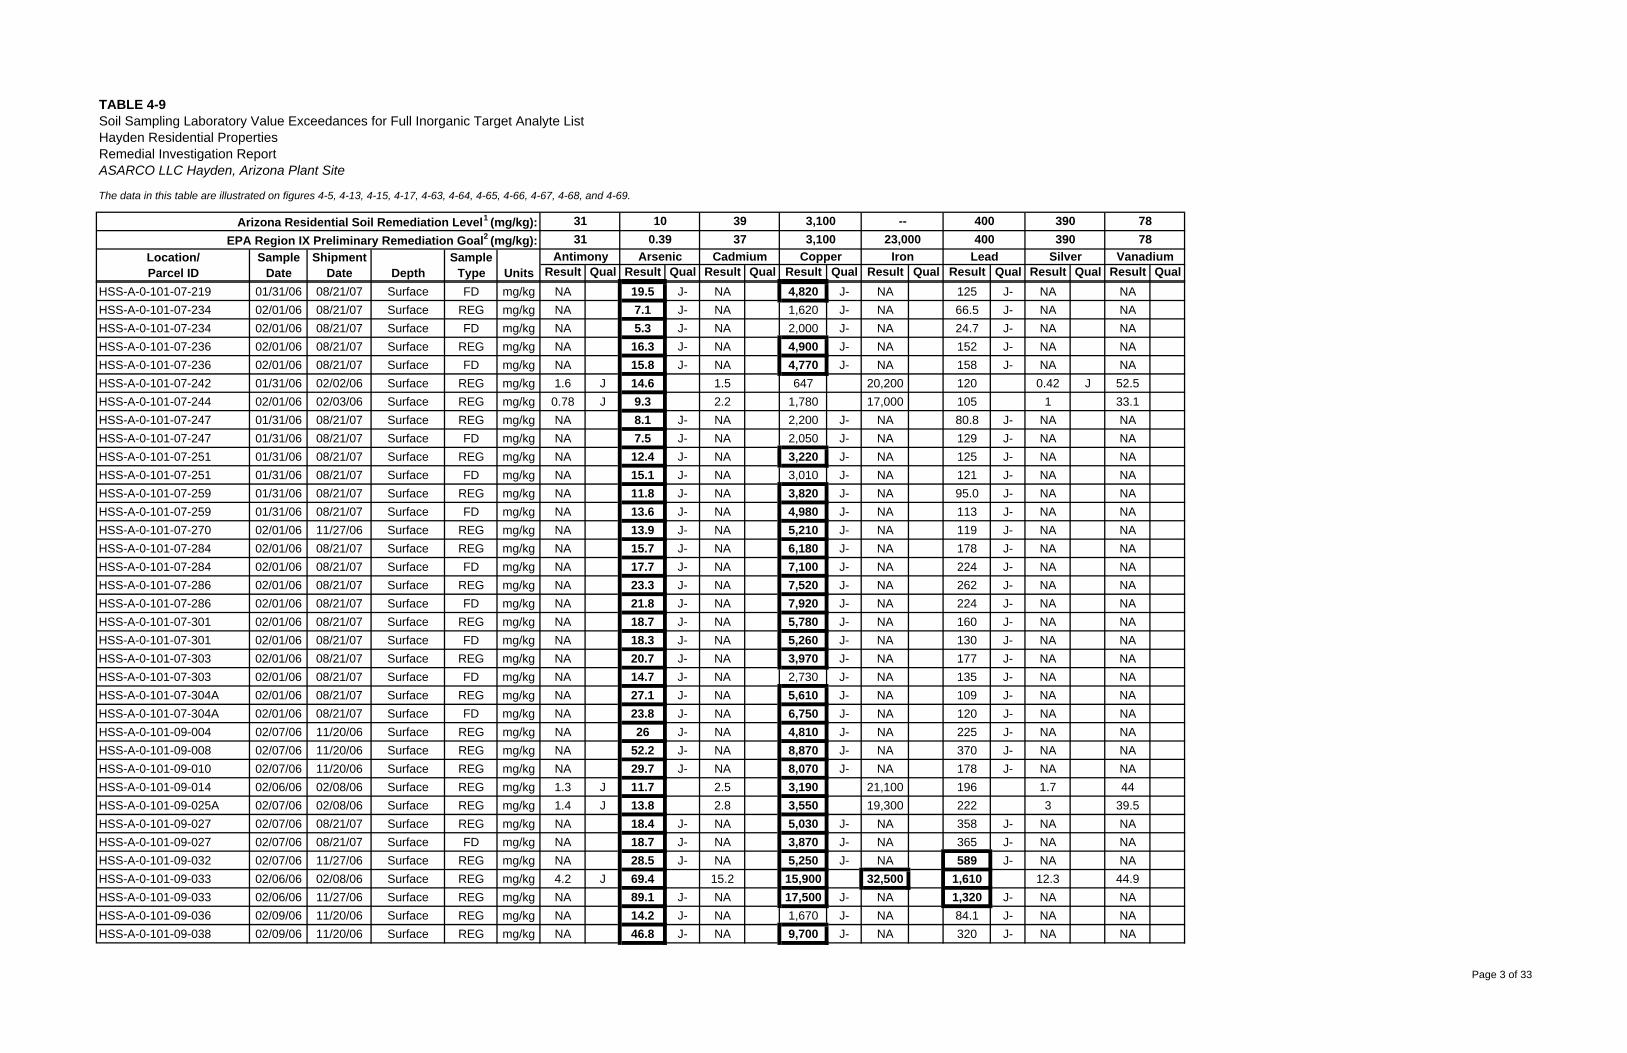
The data in this table are illustrated on figures 4-5, 4-13, 4-15, 4-17, 4-63, 4-64, 4-65, 4-66, 4-67, 4-68, and 4-69.
Result Qual Result Qual Result Qual Result Qual Result Qual Result Qual Result Qual Result Qual
TABLE 4-9
Depth
Soil Sampling Laboratory Value Exceedances for Full Inorganic Target Analyte ListHayden Residential PropertiesRemedial Investigation ReportASARCO LLC Hayden, Arizona Plant Site
Location/Parcel ID
31
ShipmentDate Units
Arizona Residential Soil Remediation Level1 (mg/kg):EPA Region IX Preliminary Remediation Goal2 (mg/kg):
SampleType
SampleDate
10
Antimony Arsenic31 0.39
3937
Cadmium
3,1003,100
Copper
--23,000
Iron
400400
Lead
390390
Silver
7878
Vanadium
HSS-A-0-101-07-219 01/31/06 08/21/07 Surface FD mg/kg NA 19.5 J- NA 4,820 J- NA 125 J- NA NAHSS-A-0-101-07-234 02/01/06 08/21/07 Surface REG mg/kg NA 7.1 J- NA 1,620 J- NA 66.5 J- NA NAHSS-A-0-101-07-234 02/01/06 08/21/07 Surface FD mg/kg NA 5.3 J- NA 2,000 J- NA 24.7 J- NA NAHSS-A-0-101-07-236 02/01/06 08/21/07 Surface REG mg/kg NA 16.3 J- NA 4,900 J- NA 152 J- NA NAHSS-A-0-101-07-236 02/01/06 08/21/07 Surface FD mg/kg NA 15.8 J- NA 4,770 J- NA 158 J- NA NAHSS-A-0-101-07-242 01/31/06 02/02/06 Surface REG mg/kg 1.6 J 14.6 1.5 647 20,200 120 0.42 J 52.5HSS-A-0-101-07-244 02/01/06 02/03/06 Surface REG mg/kg 0.78 J 9.3 2.2 1,780 17,000 105 1 33.1HSS-A-0-101-07-247 01/31/06 08/21/07 Surface REG mg/kg NA 8.1 J- NA 2,200 J- NA 80.8 J- NA NAHSS-A-0-101-07-247 01/31/06 08/21/07 Surface FD mg/kg NA 7.5 J- NA 2,050 J- NA 129 J- NA NAHSS-A-0-101-07-251 01/31/06 08/21/07 Surface REG mg/kg NA 12.4 J- NA 3,220 J- NA 125 J- NA NAHSS-A-0-101-07-251 01/31/06 08/21/07 Surface FD mg/kg NA 15.1 J- NA 3,010 J- NA 121 J- NA NAHSS-A-0-101-07-259 01/31/06 08/21/07 Surface REG mg/kg NA 11.8 J- NA 3,820 J- NA 95.0 J- NA NAHSS-A-0-101-07-259 01/31/06 08/21/07 Surface FD mg/kg NA 13.6 J- NA 4,980 J- NA 113 J- NA NAHSS-A-0-101-07-270 02/01/06 11/27/06 Surface REG mg/kg NA 13.9 J- NA 5,210 J- NA 119 J- NA NAHSS-A-0-101-07-284 02/01/06 08/21/07 Surface REG mg/kg NA 15.7 J- NA 6,180 J- NA 178 J- NA NAHSS-A-0-101-07-284 02/01/06 08/21/07 Surface FD mg/kg NA 17.7 J- NA 7,100 J- NA 224 J- NA NAHSS-A-0-101-07-286 02/01/06 08/21/07 Surface REG mg/kg NA 23.3 J- NA 7,520 J- NA 262 J- NA NAHSS-A-0-101-07-286 02/01/06 08/21/07 Surface FD mg/kg NA 21.8 J- NA 7,920 J- NA 224 J- NA NAHSS-A-0-101-07-301 02/01/06 08/21/07 Surface REG mg/kg NA 18.7 J- NA 5,780 J- NA 160 J- NA NAHSS-A-0-101-07-301 02/01/06 08/21/07 Surface FD mg/kg NA 18.3 J- NA 5,260 J- NA 130 J- NA NAHSS-A-0-101-07-303 02/01/06 08/21/07 Surface REG mg/kg NA 20.7 J- NA 3,970 J- NA 177 J- NA NAHSS-A-0-101-07-303 02/01/06 08/21/07 Surface FD mg/kg NA 14.7 J- NA 2,730 J- NA 135 J- NA NAHSS-A-0-101-07-304A 02/01/06 08/21/07 Surface REG mg/kg NA 27.1 J- NA 5,610 J- NA 109 J- NA NAHSS-A-0-101-07-304A 02/01/06 08/21/07 Surface FD mg/kg NA 23.8 J- NA 6,750 J- NA 120 J- NA NAHSS-A-0-101-09-004 02/07/06 11/20/06 Surface REG mg/kg NA 26 J- NA 4,810 J- NA 225 J- NA NAHSS-A-0-101-09-008 02/07/06 11/20/06 Surface REG mg/kg NA 52.2 J- NA 8,870 J- NA 370 J- NA NAHSS-A-0-101-09-010 02/07/06 11/20/06 Surface REG mg/kg NA 29.7 J- NA 8,070 J- NA 178 J- NA NAHSS-A-0-101-09-014 02/06/06 02/08/06 Surface REG mg/kg 1.3 J 11.7 2.5 3,190 21,100 196 1.7 44HSS-A-0-101-09-025A 02/07/06 02/08/06 Surface REG mg/kg 1.4 J 13.8 2.8 3,550 19,300 222 3 39.5HSS-A-0-101-09-027 02/07/06 08/21/07 Surface REG mg/kg NA 18.4 J- NA 5,030 J- NA 358 J- NA NAHSS-A-0-101-09-027 02/07/06 08/21/07 Surface FD mg/kg NA 18.7 J- NA 3,870 J- NA 365 J- NA NAHSS-A-0-101-09-032 02/07/06 11/27/06 Surface REG mg/kg NA 28.5 J- NA 5,250 J- NA 589 J- NA NAHSS-A-0-101-09-033 02/06/06 02/08/06 Surface REG mg/kg 4.2 J 69.4 15.2 15,900 32,500 1,610 12.3 44.9HSS-A-0-101-09-033 02/06/06 11/27/06 Surface REG mg/kg NA 89.1 J- NA 17,500 J- NA 1,320 J- NA NAHSS-A-0-101-09-036 02/09/06 11/20/06 Surface REG mg/kg NA 14.2 J- NA 1,670 J- NA 84.1 J- NA NAHSS-A-0-101-09-038 02/09/06 11/20/06 Surface REG mg/kg NA 46.8 J- NA 9,700 J- NA 320 J- NA NA
Page 3 of 33
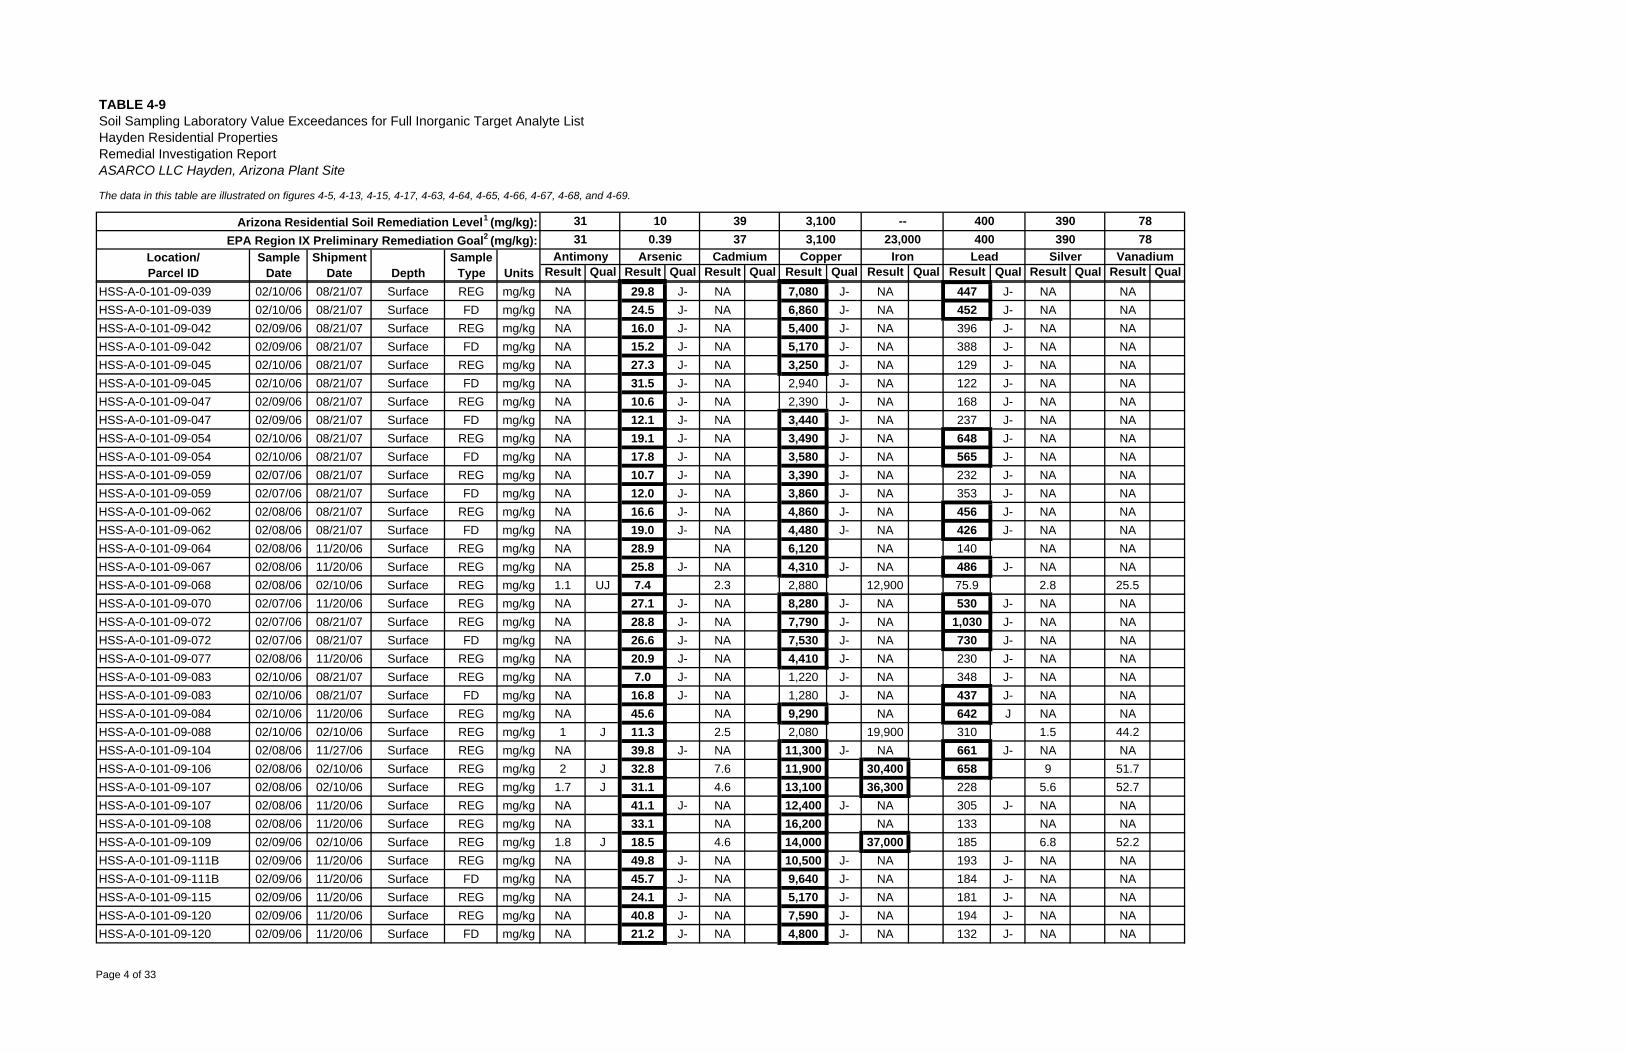
The data in this table are illustrated on figures 4-5, 4-13, 4-15, 4-17, 4-63, 4-64, 4-65, 4-66, 4-67, 4-68, and 4-69.
Result Qual Result Qual Result Qual Result Qual Result Qual Result Qual Result Qual Result Qual
TABLE 4-9
Depth
Soil Sampling Laboratory Value Exceedances for Full Inorganic Target Analyte ListHayden Residential PropertiesRemedial Investigation ReportASARCO LLC Hayden, Arizona Plant Site
Location/Parcel ID
31
ShipmentDate Units
Arizona Residential Soil Remediation Level1 (mg/kg):EPA Region IX Preliminary Remediation Goal2 (mg/kg):
SampleType
SampleDate
10
Antimony Arsenic31 0.39
3937
Cadmium
3,1003,100
Copper
--23,000
Iron
400400
Lead
390390
Silver
7878
Vanadium
HSS-A-0-101-09-039 02/10/06 08/21/07 Surface REG mg/kg NA 29.8 J- NA 7,080 J- NA 447 J- NA NAHSS-A-0-101-09-039 02/10/06 08/21/07 Surface FD mg/kg NA 24.5 J- NA 6,860 J- NA 452 J- NA NAHSS-A-0-101-09-042 02/09/06 08/21/07 Surface REG mg/kg NA 16.0 J- NA 5,400 J- NA 396 J- NA NAHSS-A-0-101-09-042 02/09/06 08/21/07 Surface FD mg/kg NA 15.2 J- NA 5,170 J- NA 388 J- NA NAHSS-A-0-101-09-045 02/10/06 08/21/07 Surface REG mg/kg NA 27.3 J- NA 3,250 J- NA 129 J- NA NAHSS-A-0-101-09-045 02/10/06 08/21/07 Surface FD mg/kg NA 31.5 J- NA 2,940 J- NA 122 J- NA NAHSS-A-0-101-09-047 02/09/06 08/21/07 Surface REG mg/kg NA 10.6 J- NA 2,390 J- NA 168 J- NA NAHSS-A-0-101-09-047 02/09/06 08/21/07 Surface FD mg/kg NA 12.1 J- NA 3,440 J- NA 237 J- NA NAHSS-A-0-101-09-054 02/10/06 08/21/07 Surface REG mg/kg NA 19.1 J- NA 3,490 J- NA 648 J- NA NAHSS-A-0-101-09-054 02/10/06 08/21/07 Surface FD mg/kg NA 17.8 J- NA 3,580 J- NA 565 J- NA NAHSS-A-0-101-09-059 02/07/06 08/21/07 Surface REG mg/kg NA 10.7 J- NA 3,390 J- NA 232 J- NA NAHSS-A-0-101-09-059 02/07/06 08/21/07 Surface FD mg/kg NA 12.0 J- NA 3,860 J- NA 353 J- NA NAHSS-A-0-101-09-062 02/08/06 08/21/07 Surface REG mg/kg NA 16.6 J- NA 4,860 J- NA 456 J- NA NAHSS-A-0-101-09-062 02/08/06 08/21/07 Surface FD mg/kg NA 19.0 J- NA 4,480 J- NA 426 J- NA NAHSS-A-0-101-09-064 02/08/06 11/20/06 Surface REG mg/kg NA 28.9 NA 6,120 NA 140 NA NAHSS-A-0-101-09-067 02/08/06 11/20/06 Surface REG mg/kg NA 25.8 J- NA 4,310 J- NA 486 J- NA NAHSS-A-0-101-09-068 02/08/06 02/10/06 Surface REG mg/kg 1.1 UJ 7.4 2.3 2,880 12,900 75.9 2.8 25.5HSS-A-0-101-09-070 02/07/06 11/20/06 Surface REG mg/kg NA 27.1 J- NA 8,280 J- NA 530 J- NA NAHSS-A-0-101-09-072 02/07/06 08/21/07 Surface REG mg/kg NA 28.8 J- NA 7,790 J- NA 1,030 J- NA NAHSS-A-0-101-09-072 02/07/06 08/21/07 Surface FD mg/kg NA 26.6 J- NA 7,530 J- NA 730 J- NA NAHSS-A-0-101-09-077 02/08/06 11/20/06 Surface REG mg/kg NA 20.9 J- NA 4,410 J- NA 230 J- NA NAHSS-A-0-101-09-083 02/10/06 08/21/07 Surface REG mg/kg NA 7.0 J- NA 1,220 J- NA 348 J- NA NAHSS-A-0-101-09-083 02/10/06 08/21/07 Surface FD mg/kg NA 16.8 J- NA 1,280 J- NA 437 J- NA NAHSS-A-0-101-09-084 02/10/06 11/20/06 Surface REG mg/kg NA 45.6 NA 9,290 NA 642 J NA NAHSS-A-0-101-09-088 02/10/06 02/10/06 Surface REG mg/kg 1 J 11.3 2.5 2,080 19,900 310 1.5 44.2HSS-A-0-101-09-104 02/08/06 11/27/06 Surface REG mg/kg NA 39.8 J- NA 11,300 J- NA 661 J- NA NAHSS-A-0-101-09-106 02/08/06 02/10/06 Surface REG mg/kg 2 J 32.8 7.6 11,900 30,400 658 9 51.7HSS-A-0-101-09-107 02/08/06 02/10/06 Surface REG mg/kg 1.7 J 31.1 4.6 13,100 36,300 228 5.6 52.7HSS-A-0-101-09-107 02/08/06 11/20/06 Surface REG mg/kg NA 41.1 J- NA 12,400 J- NA 305 J- NA NAHSS-A-0-101-09-108 02/08/06 11/20/06 Surface REG mg/kg NA 33.1 NA 16,200 NA 133 NA NAHSS-A-0-101-09-109 02/09/06 02/10/06 Surface REG mg/kg 1.8 J 18.5 4.6 14,000 37,000 185 6.8 52.2HSS-A-0-101-09-111B 02/09/06 11/20/06 Surface REG mg/kg NA 49.8 J- NA 10,500 J- NA 193 J- NA NAHSS-A-0-101-09-111B 02/09/06 11/20/06 Surface FD mg/kg NA 45.7 J- NA 9,640 J- NA 184 J- NA NAHSS-A-0-101-09-115 02/09/06 11/20/06 Surface REG mg/kg NA 24.1 J- NA 5,170 J- NA 181 J- NA NAHSS-A-0-101-09-120 02/09/06 11/20/06 Surface REG mg/kg NA 40.8 J- NA 7,590 J- NA 194 J- NA NAHSS-A-0-101-09-120 02/09/06 11/20/06 Surface FD mg/kg NA 21.2 J- NA 4,800 J- NA 132 J- NA NA
Page 4 of 33
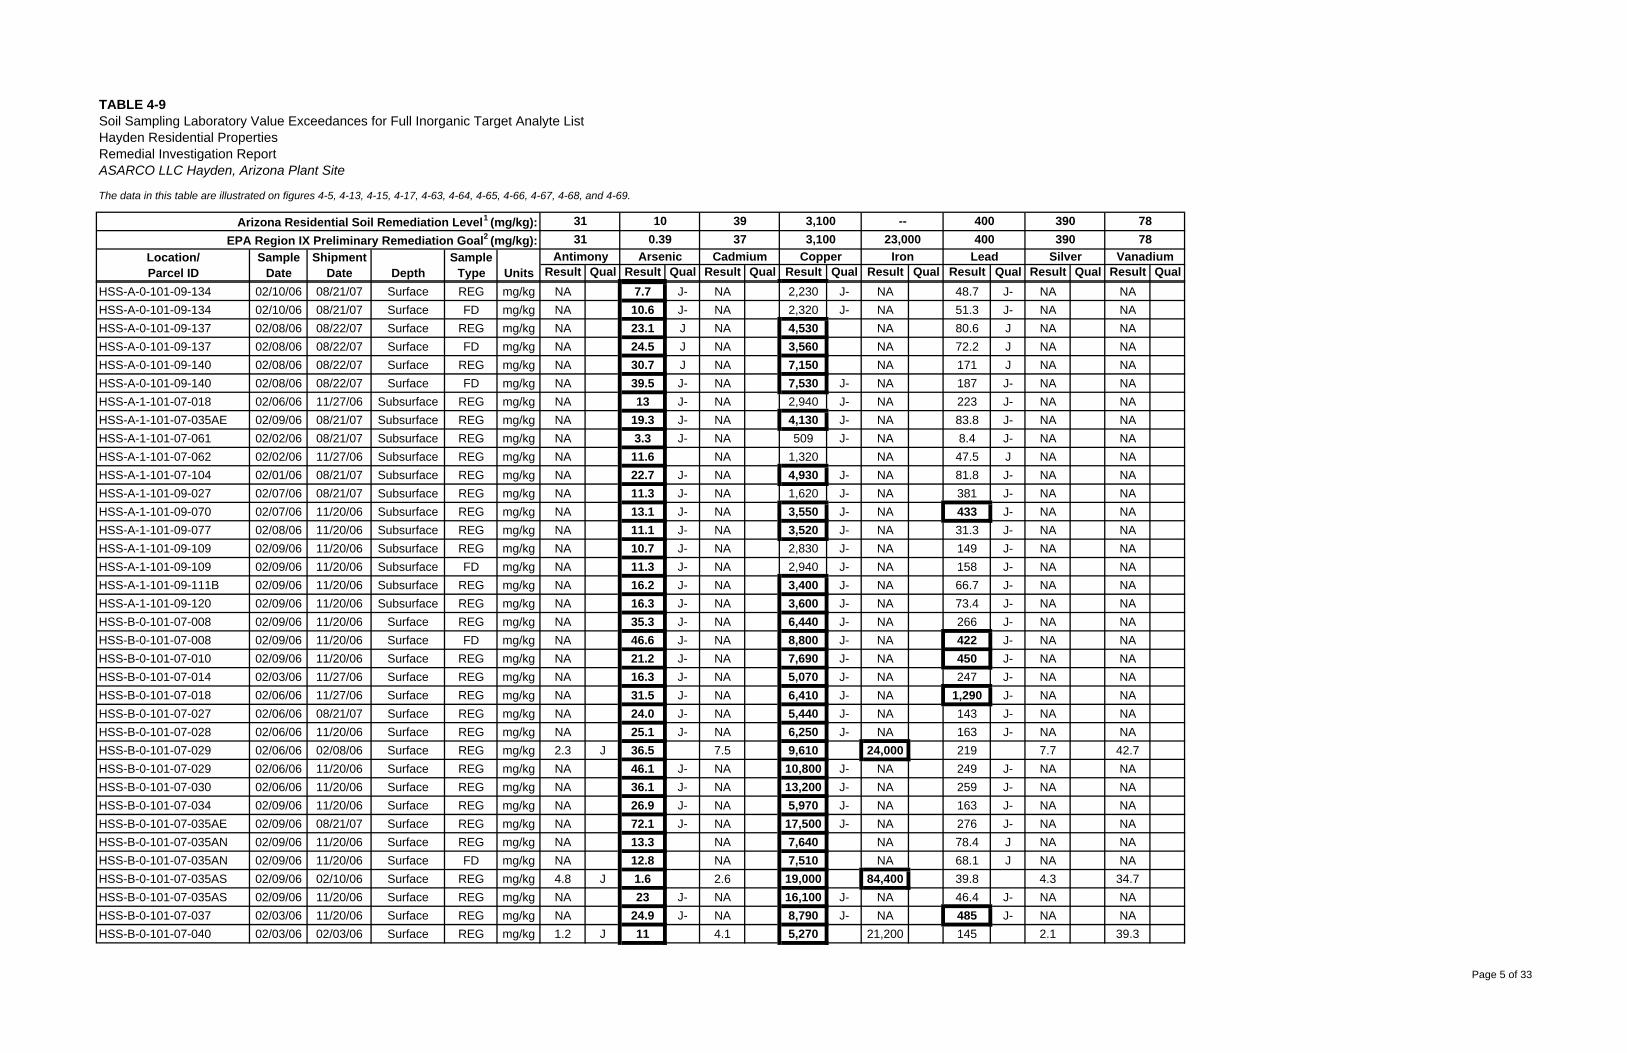
The data in this table are illustrated on figures 4-5, 4-13, 4-15, 4-17, 4-63, 4-64, 4-65, 4-66, 4-67, 4-68, and 4-69.
Result Qual Result Qual Result Qual Result Qual Result Qual Result Qual Result Qual Result Qual
TABLE 4-9
Depth
Soil Sampling Laboratory Value Exceedances for Full Inorganic Target Analyte ListHayden Residential PropertiesRemedial Investigation ReportASARCO LLC Hayden, Arizona Plant Site
Location/Parcel ID
31
ShipmentDate Units
Arizona Residential Soil Remediation Level1 (mg/kg):EPA Region IX Preliminary Remediation Goal2 (mg/kg):
SampleType
SampleDate
10
Antimony Arsenic31 0.39
3937
Cadmium
3,1003,100
Copper
--23,000
Iron
400400
Lead
390390
Silver
7878
Vanadium
HSS-A-0-101-09-134 02/10/06 08/21/07 Surface REG mg/kg NA 7.7 J- NA 2,230 J- NA 48.7 J- NA NAHSS-A-0-101-09-134 02/10/06 08/21/07 Surface FD mg/kg NA 10.6 J- NA 2,320 J- NA 51.3 J- NA NAHSS-A-0-101-09-137 02/08/06 08/22/07 Surface REG mg/kg NA 23.1 J NA 4,530 NA 80.6 J NA NAHSS-A-0-101-09-137 02/08/06 08/22/07 Surface FD mg/kg NA 24.5 J NA 3,560 NA 72.2 J NA NAHSS-A-0-101-09-140 02/08/06 08/22/07 Surface REG mg/kg NA 30.7 J NA 7,150 NA 171 J NA NAHSS-A-0-101-09-140 02/08/06 08/22/07 Surface FD mg/kg NA 39.5 J- NA 7,530 J- NA 187 J- NA NAHSS-A-1-101-07-018 02/06/06 11/27/06 Subsurface REG mg/kg NA 13 J- NA 2,940 J- NA 223 J- NA NAHSS-A-1-101-07-035AE 02/09/06 08/21/07 Subsurface REG mg/kg NA 19.3 J- NA 4,130 J- NA 83.8 J- NA NAHSS-A-1-101-07-061 02/02/06 08/21/07 Subsurface REG mg/kg NA 3.3 J- NA 509 J- NA 8.4 J- NA NAHSS-A-1-101-07-062 02/02/06 11/27/06 Subsurface REG mg/kg NA 11.6 NA 1,320 NA 47.5 J NA NAHSS-A-1-101-07-104 02/01/06 08/21/07 Subsurface REG mg/kg NA 22.7 J- NA 4,930 J- NA 81.8 J- NA NAHSS-A-1-101-09-027 02/07/06 08/21/07 Subsurface REG mg/kg NA 11.3 J- NA 1,620 J- NA 381 J- NA NAHSS-A-1-101-09-070 02/07/06 11/20/06 Subsurface REG mg/kg NA 13.1 J- NA 3,550 J- NA 433 J- NA NAHSS-A-1-101-09-077 02/08/06 11/20/06 Subsurface REG mg/kg NA 11.1 J- NA 3,520 J- NA 31.3 J- NA NAHSS-A-1-101-09-109 02/09/06 11/20/06 Subsurface REG mg/kg NA 10.7 J- NA 2,830 J- NA 149 J- NA NAHSS-A-1-101-09-109 02/09/06 11/20/06 Subsurface FD mg/kg NA 11.3 J- NA 2,940 J- NA 158 J- NA NAHSS-A-1-101-09-111B 02/09/06 11/20/06 Subsurface REG mg/kg NA 16.2 J- NA 3,400 J- NA 66.7 J- NA NAHSS-A-1-101-09-120 02/09/06 11/20/06 Subsurface REG mg/kg NA 16.3 J- NA 3,600 J- NA 73.4 J- NA NAHSS-B-0-101-07-008 02/09/06 11/20/06 Surface REG mg/kg NA 35.3 J- NA 6,440 J- NA 266 J- NA NAHSS-B-0-101-07-008 02/09/06 11/20/06 Surface FD mg/kg NA 46.6 J- NA 8,800 J- NA 422 J- NA NAHSS-B-0-101-07-010 02/09/06 11/20/06 Surface REG mg/kg NA 21.2 J- NA 7,690 J- NA 450 J- NA NAHSS-B-0-101-07-014 02/03/06 11/27/06 Surface REG mg/kg NA 16.3 J- NA 5,070 J- NA 247 J- NA NAHSS-B-0-101-07-018 02/06/06 11/27/06 Surface REG mg/kg NA 31.5 J- NA 6,410 J- NA 1,290 J- NA NAHSS-B-0-101-07-027 02/06/06 08/21/07 Surface REG mg/kg NA 24.0 J- NA 5,440 J- NA 143 J- NA NAHSS-B-0-101-07-028 02/06/06 11/20/06 Surface REG mg/kg NA 25.1 J- NA 6,250 J- NA 163 J- NA NAHSS-B-0-101-07-029 02/06/06 02/08/06 Surface REG mg/kg 2.3 J 36.5 7.5 9,610 24,000 219 7.7 42.7HSS-B-0-101-07-029 02/06/06 11/20/06 Surface REG mg/kg NA 46.1 J- NA 10,800 J- NA 249 J- NA NAHSS-B-0-101-07-030 02/06/06 11/20/06 Surface REG mg/kg NA 36.1 J- NA 13,200 J- NA 259 J- NA NAHSS-B-0-101-07-034 02/09/06 11/20/06 Surface REG mg/kg NA 26.9 J- NA 5,970 J- NA 163 J- NA NAHSS-B-0-101-07-035AE 02/09/06 08/21/07 Surface REG mg/kg NA 72.1 J- NA 17,500 J- NA 276 J- NA NAHSS-B-0-101-07-035AN 02/09/06 11/20/06 Surface REG mg/kg NA 13.3 NA 7,640 NA 78.4 J NA NAHSS-B-0-101-07-035AN 02/09/06 11/20/06 Surface FD mg/kg NA 12.8 NA 7,510 NA 68.1 J NA NAHSS-B-0-101-07-035AS 02/09/06 02/10/06 Surface REG mg/kg 4.8 J 1.6 2.6 19,000 84,400 39.8 4.3 34.7HSS-B-0-101-07-035AS 02/09/06 11/20/06 Surface REG mg/kg NA 23 J- NA 16,100 J- NA 46.4 J- NA NAHSS-B-0-101-07-037 02/03/06 11/20/06 Surface REG mg/kg NA 24.9 J- NA 8,790 J- NA 485 J- NA NAHSS-B-0-101-07-040 02/03/06 02/03/06 Surface REG mg/kg 1.2 J 11 4.1 5,270 21,200 145 2.1 39.3
Page 5 of 33
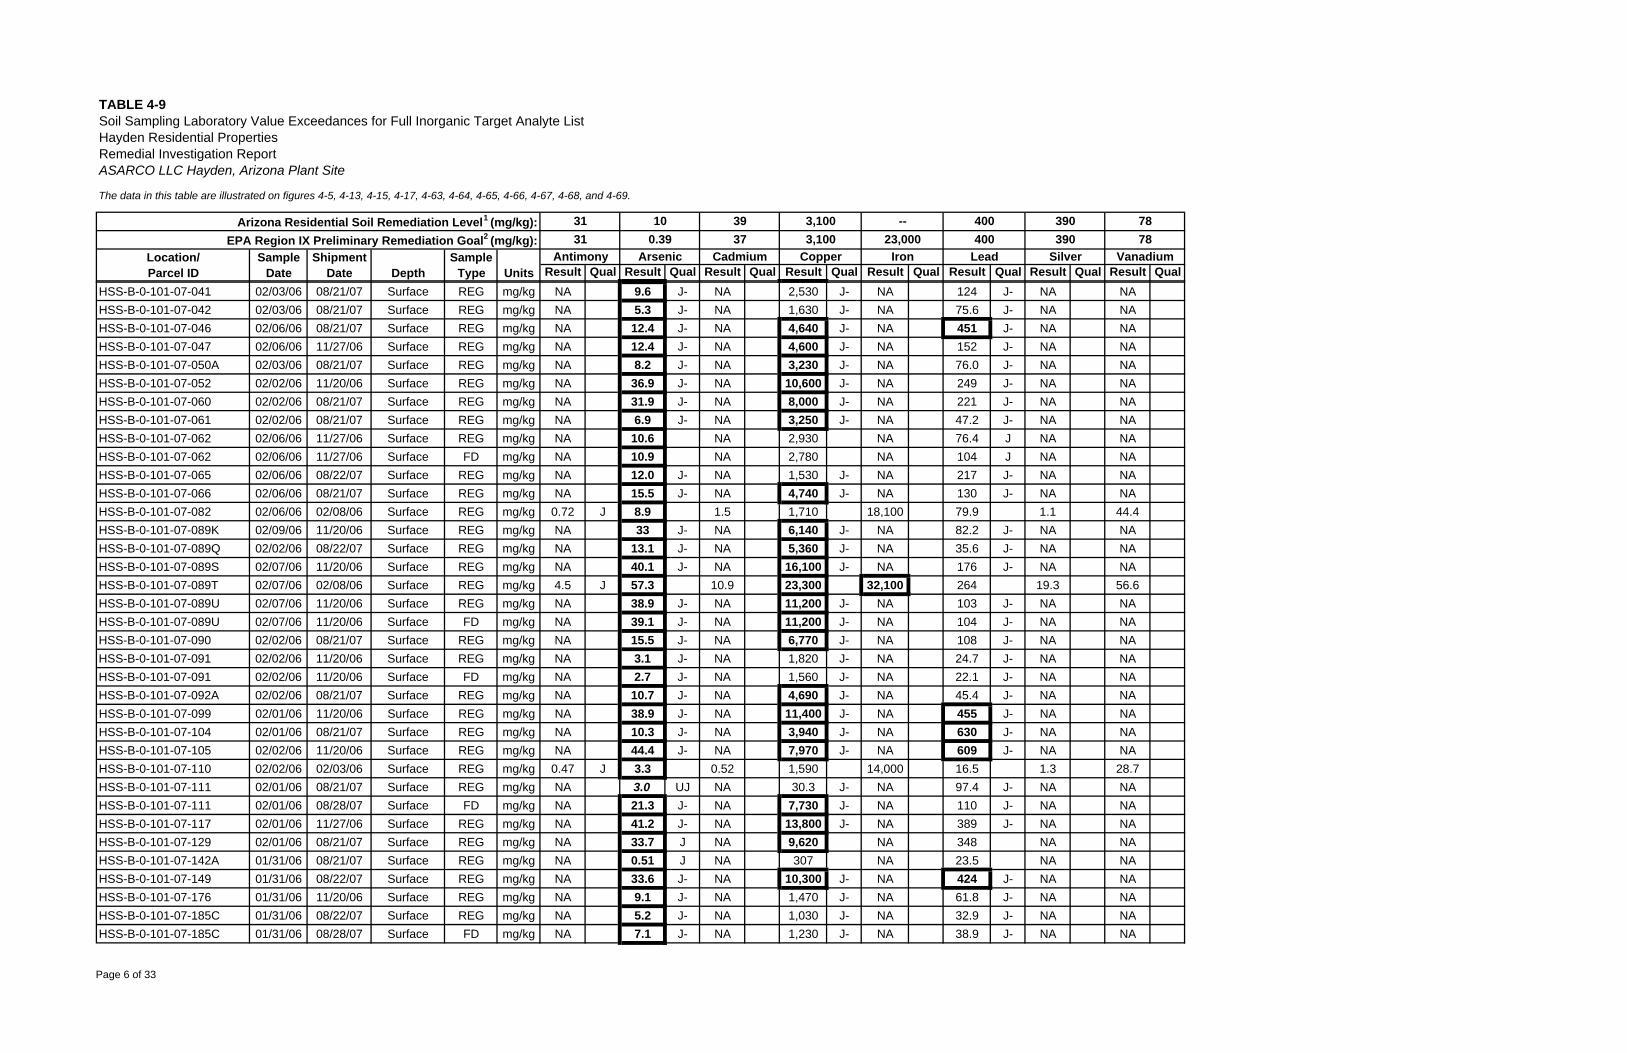
The data in this table are illustrated on figures 4-5, 4-13, 4-15, 4-17, 4-63, 4-64, 4-65, 4-66, 4-67, 4-68, and 4-69.
Result Qual Result Qual Result Qual Result Qual Result Qual Result Qual Result Qual Result Qual
TABLE 4-9
Depth
Soil Sampling Laboratory Value Exceedances for Full Inorganic Target Analyte ListHayden Residential PropertiesRemedial Investigation ReportASARCO LLC Hayden, Arizona Plant Site
Location/Parcel ID
31
ShipmentDate Units
Arizona Residential Soil Remediation Level1 (mg/kg):EPA Region IX Preliminary Remediation Goal2 (mg/kg):
SampleType
SampleDate
10
Antimony Arsenic31 0.39
3937
Cadmium
3,1003,100
Copper
--23,000
Iron
400400
Lead
390390
Silver
7878
Vanadium
HSS-B-0-101-07-041 02/03/06 08/21/07 Surface REG mg/kg NA 9.6 J- NA 2,530 J- NA 124 J- NA NAHSS-B-0-101-07-042 02/03/06 08/21/07 Surface REG mg/kg NA 5.3 J- NA 1,630 J- NA 75.6 J- NA NAHSS-B-0-101-07-046 02/06/06 08/21/07 Surface REG mg/kg NA 12.4 J- NA 4,640 J- NA 451 J- NA NAHSS-B-0-101-07-047 02/06/06 11/27/06 Surface REG mg/kg NA 12.4 J- NA 4,600 J- NA 152 J- NA NAHSS-B-0-101-07-050A 02/03/06 08/21/07 Surface REG mg/kg NA 8.2 J- NA 3,230 J- NA 76.0 J- NA NAHSS-B-0-101-07-052 02/02/06 11/20/06 Surface REG mg/kg NA 36.9 J- NA 10,600 J- NA 249 J- NA NAHSS-B-0-101-07-060 02/02/06 08/21/07 Surface REG mg/kg NA 31.9 J- NA 8,000 J- NA 221 J- NA NAHSS-B-0-101-07-061 02/02/06 08/21/07 Surface REG mg/kg NA 6.9 J- NA 3,250 J- NA 47.2 J- NA NAHSS-B-0-101-07-062 02/06/06 11/27/06 Surface REG mg/kg NA 10.6 NA 2,930 NA 76.4 J NA NAHSS-B-0-101-07-062 02/06/06 11/27/06 Surface FD mg/kg NA 10.9 NA 2,780 NA 104 J NA NAHSS-B-0-101-07-065 02/06/06 08/22/07 Surface REG mg/kg NA 12.0 J- NA 1,530 J- NA 217 J- NA NAHSS-B-0-101-07-066 02/06/06 08/21/07 Surface REG mg/kg NA 15.5 J- NA 4,740 J- NA 130 J- NA NAHSS-B-0-101-07-082 02/06/06 02/08/06 Surface REG mg/kg 0.72 J 8.9 1.5 1,710 18,100 79.9 1.1 44.4HSS-B-0-101-07-089K 02/09/06 11/20/06 Surface REG mg/kg NA 33 J- NA 6,140 J- NA 82.2 J- NA NAHSS-B-0-101-07-089Q 02/02/06 08/22/07 Surface REG mg/kg NA 13.1 J- NA 5,360 J- NA 35.6 J- NA NAHSS-B-0-101-07-089S 02/07/06 11/20/06 Surface REG mg/kg NA 40.1 J- NA 16,100 J- NA 176 J- NA NAHSS-B-0-101-07-089T 02/07/06 02/08/06 Surface REG mg/kg 4.5 J 57.3 10.9 23,300 32,100 264 19.3 56.6HSS-B-0-101-07-089U 02/07/06 11/20/06 Surface REG mg/kg NA 38.9 J- NA 11,200 J- NA 103 J- NA NAHSS-B-0-101-07-089U 02/07/06 11/20/06 Surface FD mg/kg NA 39.1 J- NA 11,200 J- NA 104 J- NA NAHSS-B-0-101-07-090 02/02/06 08/21/07 Surface REG mg/kg NA 15.5 J- NA 6,770 J- NA 108 J- NA NAHSS-B-0-101-07-091 02/02/06 11/20/06 Surface REG mg/kg NA 3.1 J- NA 1,820 J- NA 24.7 J- NA NAHSS-B-0-101-07-091 02/02/06 11/20/06 Surface FD mg/kg NA 2.7 J- NA 1,560 J- NA 22.1 J- NA NAHSS-B-0-101-07-092A 02/02/06 08/21/07 Surface REG mg/kg NA 10.7 J- NA 4,690 J- NA 45.4 J- NA NAHSS-B-0-101-07-099 02/01/06 11/20/06 Surface REG mg/kg NA 38.9 J- NA 11,400 J- NA 455 J- NA NAHSS-B-0-101-07-104 02/01/06 08/21/07 Surface REG mg/kg NA 10.3 J- NA 3,940 J- NA 630 J- NA NAHSS-B-0-101-07-105 02/02/06 11/20/06 Surface REG mg/kg NA 44.4 J- NA 7,970 J- NA 609 J- NA NAHSS-B-0-101-07-110 02/02/06 02/03/06 Surface REG mg/kg 0.47 J 3.3 0.52 1,590 14,000 16.5 1.3 28.7HSS-B-0-101-07-111 02/01/06 08/21/07 Surface REG mg/kg NA 3.0 UJ NA 30.3 J- NA 97.4 J- NA NAHSS-B-0-101-07-111 02/01/06 08/28/07 Surface FD mg/kg NA 21.3 J- NA 7,730 J- NA 110 J- NA NAHSS-B-0-101-07-117 02/01/06 11/27/06 Surface REG mg/kg NA 41.2 J- NA 13,800 J- NA 389 J- NA NAHSS-B-0-101-07-129 02/01/06 08/21/07 Surface REG mg/kg NA 33.7 J NA 9,620 NA 348 NA NAHSS-B-0-101-07-142A 01/31/06 08/21/07 Surface REG mg/kg NA 0.51 J NA 307 NA 23.5 NA NAHSS-B-0-101-07-149 01/31/06 08/22/07 Surface REG mg/kg NA 33.6 J- NA 10,300 J- NA 424 J- NA NAHSS-B-0-101-07-176 01/31/06 11/20/06 Surface REG mg/kg NA 9.1 J- NA 1,470 J- NA 61.8 J- NA NAHSS-B-0-101-07-185C 01/31/06 08/22/07 Surface REG mg/kg NA 5.2 J- NA 1,030 J- NA 32.9 J- NA NAHSS-B-0-101-07-185C 01/31/06 08/28/07 Surface FD mg/kg NA 7.1 J- NA 1,230 J- NA 38.9 J- NA NA
Page 6 of 33
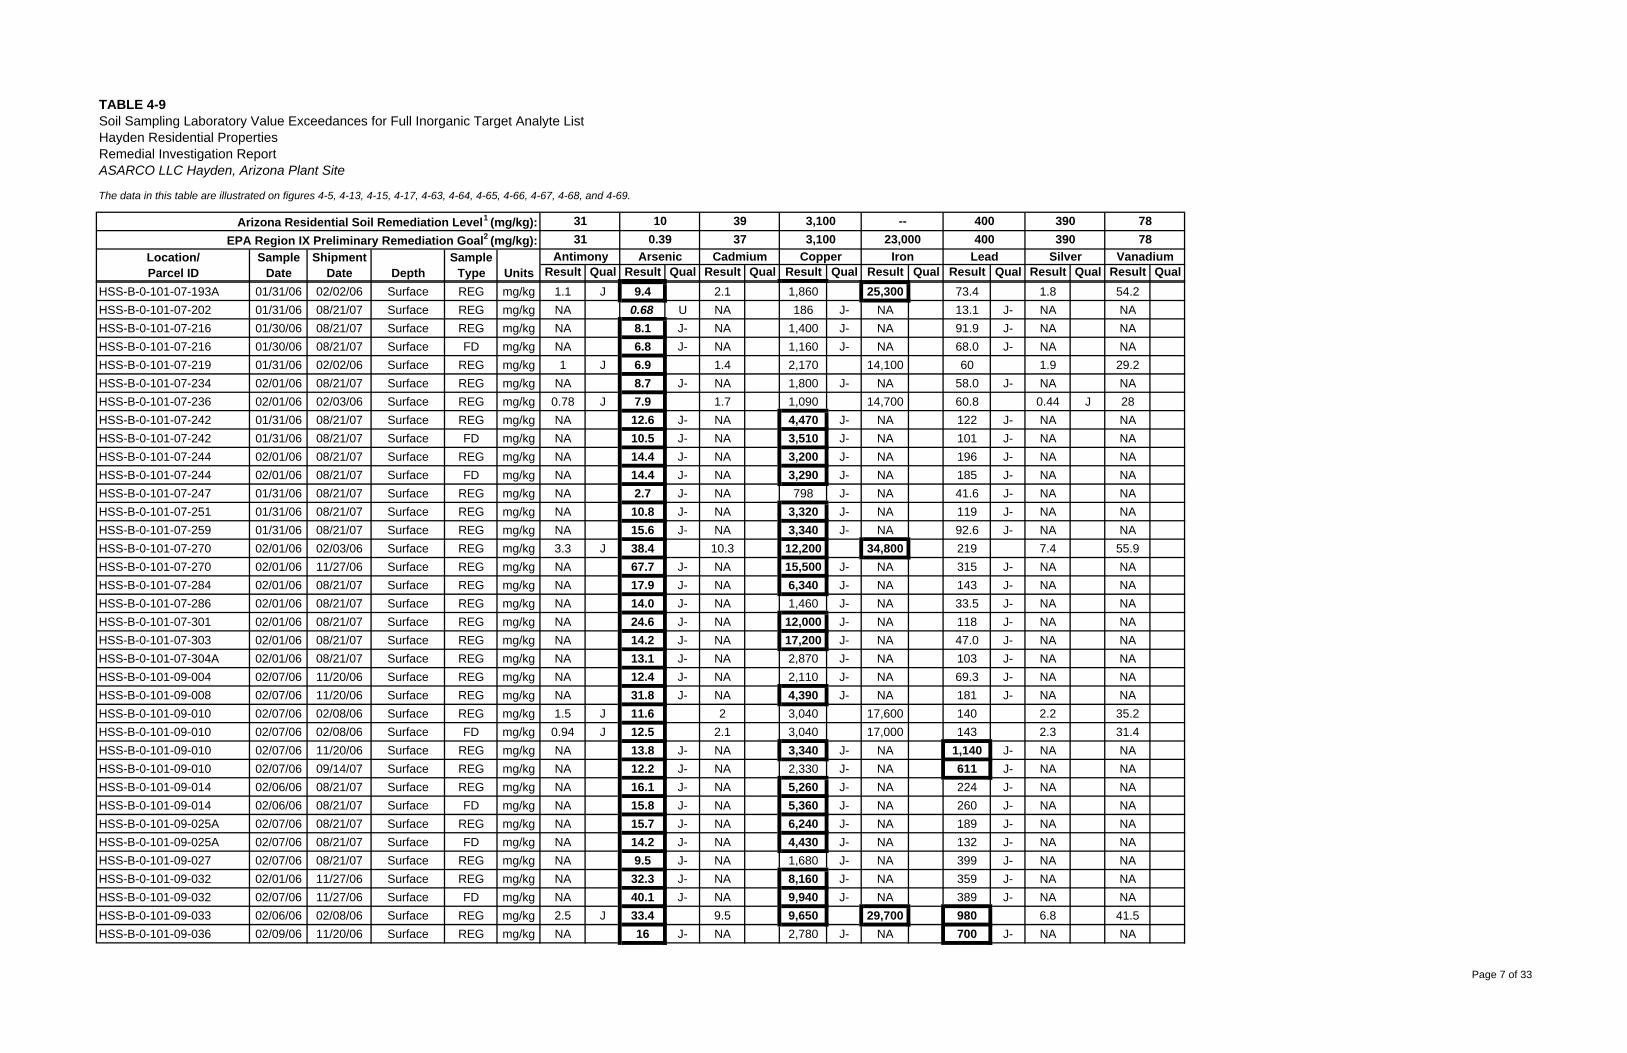
The data in this table are illustrated on figures 4-5, 4-13, 4-15, 4-17, 4-63, 4-64, 4-65, 4-66, 4-67, 4-68, and 4-69.
Result Qual Result Qual Result Qual Result Qual Result Qual Result Qual Result Qual Result Qual
TABLE 4-9
Depth
Soil Sampling Laboratory Value Exceedances for Full Inorganic Target Analyte ListHayden Residential PropertiesRemedial Investigation ReportASARCO LLC Hayden, Arizona Plant Site
Location/Parcel ID
31
ShipmentDate Units
Arizona Residential Soil Remediation Level1 (mg/kg):EPA Region IX Preliminary Remediation Goal2 (mg/kg):
SampleType
SampleDate
10
Antimony Arsenic31 0.39
3937
Cadmium
3,1003,100
Copper
--23,000
Iron
400400
Lead
390390
Silver
7878
Vanadium
HSS-B-0-101-07-193A 01/31/06 02/02/06 Surface REG mg/kg 1.1 J 9.4 2.1 1,860 25,300 73.4 1.8 54.2HSS-B-0-101-07-202 01/31/06 08/21/07 Surface REG mg/kg NA 0.68 U NA 186 J- NA 13.1 J- NA NAHSS-B-0-101-07-216 01/30/06 08/21/07 Surface REG mg/kg NA 8.1 J- NA 1,400 J- NA 91.9 J- NA NAHSS-B-0-101-07-216 01/30/06 08/21/07 Surface FD mg/kg NA 6.8 J- NA 1,160 J- NA 68.0 J- NA NAHSS-B-0-101-07-219 01/31/06 02/02/06 Surface REG mg/kg 1 J 6.9 1.4 2,170 14,100 60 1.9 29.2HSS-B-0-101-07-234 02/01/06 08/21/07 Surface REG mg/kg NA 8.7 J- NA 1,800 J- NA 58.0 J- NA NAHSS-B-0-101-07-236 02/01/06 02/03/06 Surface REG mg/kg 0.78 J 7.9 1.7 1,090 14,700 60.8 0.44 J 28HSS-B-0-101-07-242 01/31/06 08/21/07 Surface REG mg/kg NA 12.6 J- NA 4,470 J- NA 122 J- NA NAHSS-B-0-101-07-242 01/31/06 08/21/07 Surface FD mg/kg NA 10.5 J- NA 3,510 J- NA 101 J- NA NAHSS-B-0-101-07-244 02/01/06 08/21/07 Surface REG mg/kg NA 14.4 J- NA 3,200 J- NA 196 J- NA NAHSS-B-0-101-07-244 02/01/06 08/21/07 Surface FD mg/kg NA 14.4 J- NA 3,290 J- NA 185 J- NA NAHSS-B-0-101-07-247 01/31/06 08/21/07 Surface REG mg/kg NA 2.7 J- NA 798 J- NA 41.6 J- NA NAHSS-B-0-101-07-251 01/31/06 08/21/07 Surface REG mg/kg NA 10.8 J- NA 3,320 J- NA 119 J- NA NAHSS-B-0-101-07-259 01/31/06 08/21/07 Surface REG mg/kg NA 15.6 J- NA 3,340 J- NA 92.6 J- NA NAHSS-B-0-101-07-270 02/01/06 02/03/06 Surface REG mg/kg 3.3 J 38.4 10.3 12,200 34,800 219 7.4 55.9HSS-B-0-101-07-270 02/01/06 11/27/06 Surface REG mg/kg NA 67.7 J- NA 15,500 J- NA 315 J- NA NAHSS-B-0-101-07-284 02/01/06 08/21/07 Surface REG mg/kg NA 17.9 J- NA 6,340 J- NA 143 J- NA NAHSS-B-0-101-07-286 02/01/06 08/21/07 Surface REG mg/kg NA 14.0 J- NA 1,460 J- NA 33.5 J- NA NAHSS-B-0-101-07-301 02/01/06 08/21/07 Surface REG mg/kg NA 24.6 J- NA 12,000 J- NA 118 J- NA NAHSS-B-0-101-07-303 02/01/06 08/21/07 Surface REG mg/kg NA 14.2 J- NA 17,200 J- NA 47.0 J- NA NAHSS-B-0-101-07-304A 02/01/06 08/21/07 Surface REG mg/kg NA 13.1 J- NA 2,870 J- NA 103 J- NA NAHSS-B-0-101-09-004 02/07/06 11/20/06 Surface REG mg/kg NA 12.4 J- NA 2,110 J- NA 69.3 J- NA NAHSS-B-0-101-09-008 02/07/06 11/20/06 Surface REG mg/kg NA 31.8 J- NA 4,390 J- NA 181 J- NA NAHSS-B-0-101-09-010 02/07/06 02/08/06 Surface REG mg/kg 1.5 J 11.6 2 3,040 17,600 140 2.2 35.2HSS-B-0-101-09-010 02/07/06 02/08/06 Surface FD mg/kg 0.94 J 12.5 2.1 3,040 17,000 143 2.3 31.4HSS-B-0-101-09-010 02/07/06 11/20/06 Surface REG mg/kg NA 13.8 J- NA 3,340 J- NA 1,140 J- NA NAHSS-B-0-101-09-010 02/07/06 09/14/07 Surface REG mg/kg NA 12.2 J- NA 2,330 J- NA 611 J- NA NAHSS-B-0-101-09-014 02/06/06 08/21/07 Surface REG mg/kg NA 16.1 J- NA 5,260 J- NA 224 J- NA NAHSS-B-0-101-09-014 02/06/06 08/21/07 Surface FD mg/kg NA 15.8 J- NA 5,360 J- NA 260 J- NA NAHSS-B-0-101-09-025A 02/07/06 08/21/07 Surface REG mg/kg NA 15.7 J- NA 6,240 J- NA 189 J- NA NAHSS-B-0-101-09-025A 02/07/06 08/21/07 Surface FD mg/kg NA 14.2 J- NA 4,430 J- NA 132 J- NA NAHSS-B-0-101-09-027 02/07/06 08/21/07 Surface REG mg/kg NA 9.5 J- NA 1,680 J- NA 399 J- NA NAHSS-B-0-101-09-032 02/01/06 11/27/06 Surface REG mg/kg NA 32.3 J- NA 8,160 J- NA 359 J- NA NAHSS-B-0-101-09-032 02/07/06 11/27/06 Surface FD mg/kg NA 40.1 J- NA 9,940 J- NA 389 J- NA NAHSS-B-0-101-09-033 02/06/06 02/08/06 Surface REG mg/kg 2.5 J 33.4 9.5 9,650 29,700 980 6.8 41.5HSS-B-0-101-09-036 02/09/06 11/20/06 Surface REG mg/kg NA 16 J- NA 2,780 J- NA 700 J- NA NA
Page 7 of 33
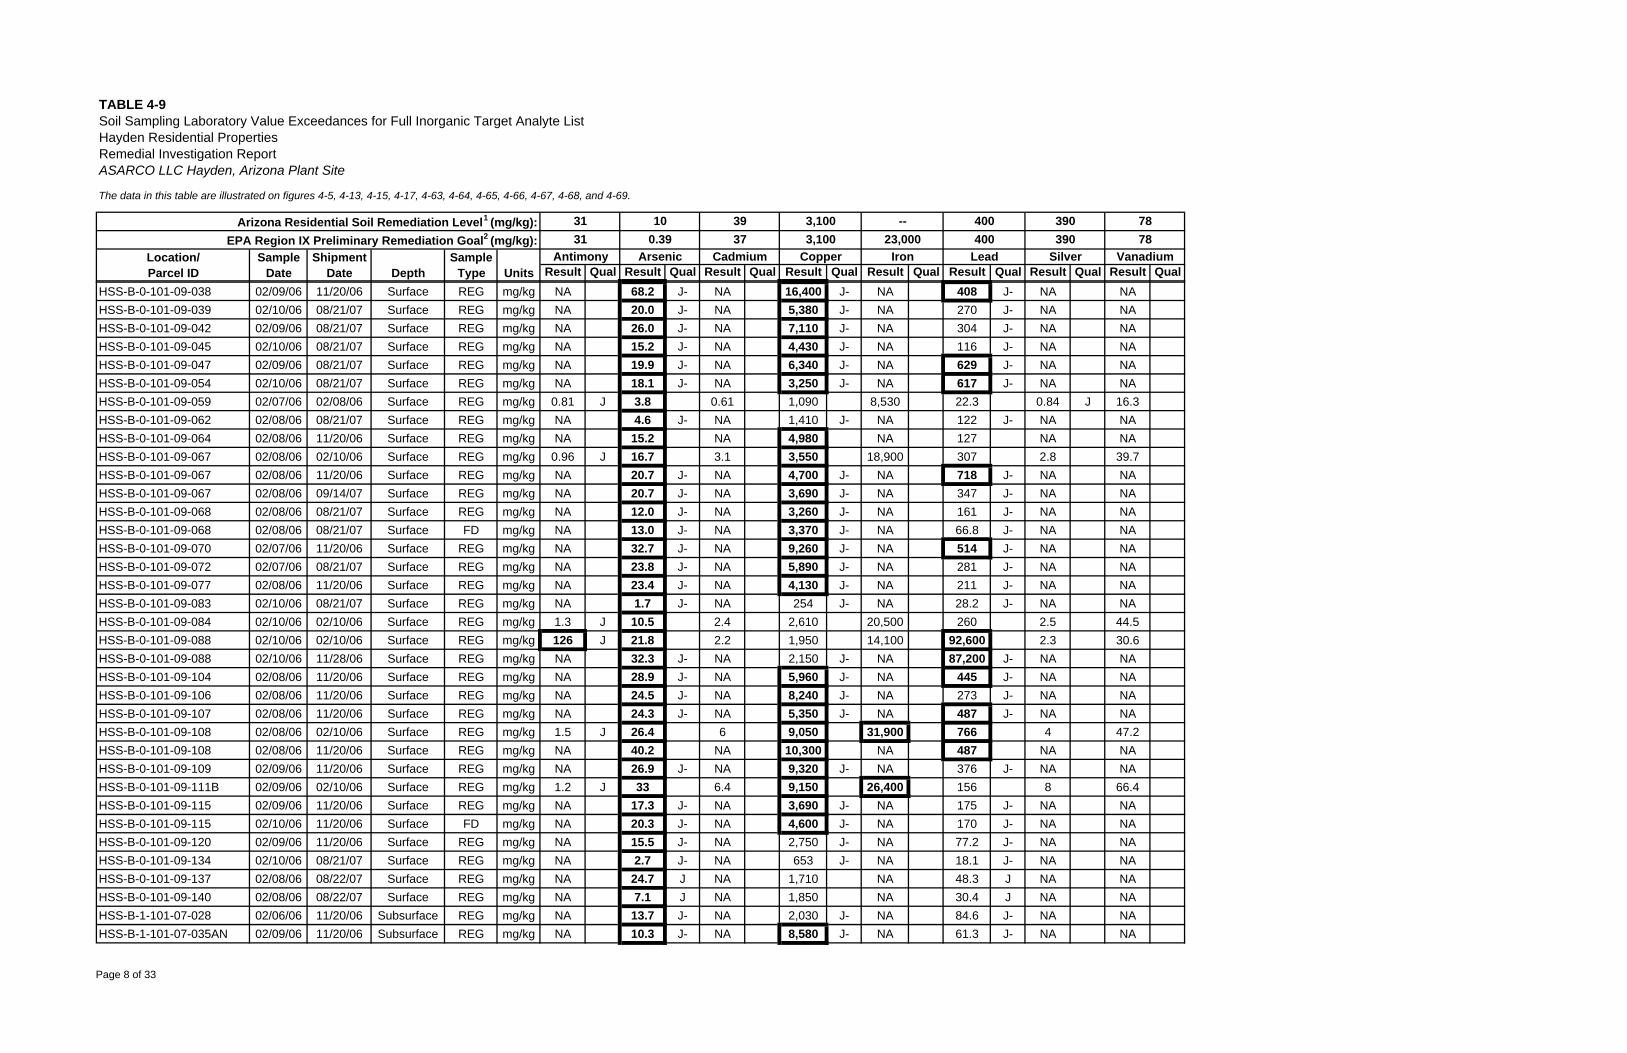
The data in this table are illustrated on figures 4-5, 4-13, 4-15, 4-17, 4-63, 4-64, 4-65, 4-66, 4-67, 4-68, and 4-69.
Result Qual Result Qual Result Qual Result Qual Result Qual Result Qual Result Qual Result Qual
TABLE 4-9
Depth
Soil Sampling Laboratory Value Exceedances for Full Inorganic Target Analyte ListHayden Residential PropertiesRemedial Investigation ReportASARCO LLC Hayden, Arizona Plant Site
Location/Parcel ID
31
ShipmentDate Units
Arizona Residential Soil Remediation Level1 (mg/kg):EPA Region IX Preliminary Remediation Goal2 (mg/kg):
SampleType
SampleDate
10
Antimony Arsenic31 0.39
3937
Cadmium
3,1003,100
Copper
--23,000
Iron
400400
Lead
390390
Silver
7878
Vanadium
HSS-B-0-101-09-038 02/09/06 11/20/06 Surface REG mg/kg NA 68.2 J- NA 16,400 J- NA 408 J- NA NAHSS-B-0-101-09-039 02/10/06 08/21/07 Surface REG mg/kg NA 20.0 J- NA 5,380 J- NA 270 J- NA NAHSS-B-0-101-09-042 02/09/06 08/21/07 Surface REG mg/kg NA 26.0 J- NA 7,110 J- NA 304 J- NA NAHSS-B-0-101-09-045 02/10/06 08/21/07 Surface REG mg/kg NA 15.2 J- NA 4,430 J- NA 116 J- NA NAHSS-B-0-101-09-047 02/09/06 08/21/07 Surface REG mg/kg NA 19.9 J- NA 6,340 J- NA 629 J- NA NAHSS-B-0-101-09-054 02/10/06 08/21/07 Surface REG mg/kg NA 18.1 J- NA 3,250 J- NA 617 J- NA NAHSS-B-0-101-09-059 02/07/06 02/08/06 Surface REG mg/kg 0.81 J 3.8 0.61 1,090 8,530 22.3 0.84 J 16.3HSS-B-0-101-09-062 02/08/06 08/21/07 Surface REG mg/kg NA 4.6 J- NA 1,410 J- NA 122 J- NA NAHSS-B-0-101-09-064 02/08/06 11/20/06 Surface REG mg/kg NA 15.2 NA 4,980 NA 127 NA NAHSS-B-0-101-09-067 02/08/06 02/10/06 Surface REG mg/kg 0.96 J 16.7 3.1 3,550 18,900 307 2.8 39.7HSS-B-0-101-09-067 02/08/06 11/20/06 Surface REG mg/kg NA 20.7 J- NA 4,700 J- NA 718 J- NA NAHSS-B-0-101-09-067 02/08/06 09/14/07 Surface REG mg/kg NA 20.7 J- NA 3,690 J- NA 347 J- NA NAHSS-B-0-101-09-068 02/08/06 08/21/07 Surface REG mg/kg NA 12.0 J- NA 3,260 J- NA 161 J- NA NAHSS-B-0-101-09-068 02/08/06 08/21/07 Surface FD mg/kg NA 13.0 J- NA 3,370 J- NA 66.8 J- NA NAHSS-B-0-101-09-070 02/07/06 11/20/06 Surface REG mg/kg NA 32.7 J- NA 9,260 J- NA 514 J- NA NAHSS-B-0-101-09-072 02/07/06 08/21/07 Surface REG mg/kg NA 23.8 J- NA 5,890 J- NA 281 J- NA NAHSS-B-0-101-09-077 02/08/06 11/20/06 Surface REG mg/kg NA 23.4 J- NA 4,130 J- NA 211 J- NA NAHSS-B-0-101-09-083 02/10/06 08/21/07 Surface REG mg/kg NA 1.7 J- NA 254 J- NA 28.2 J- NA NAHSS-B-0-101-09-084 02/10/06 02/10/06 Surface REG mg/kg 1.3 J 10.5 2.4 2,610 20,500 260 2.5 44.5HSS-B-0-101-09-088 02/10/06 02/10/06 Surface REG mg/kg 126 J 21.8 2.2 1,950 14,100 92,600 2.3 30.6HSS-B-0-101-09-088 02/10/06 11/28/06 Surface REG mg/kg NA 32.3 J- NA 2,150 J- NA 87,200 J- NA NAHSS-B-0-101-09-104 02/08/06 11/20/06 Surface REG mg/kg NA 28.9 J- NA 5,960 J- NA 445 J- NA NAHSS-B-0-101-09-106 02/08/06 11/20/06 Surface REG mg/kg NA 24.5 J- NA 8,240 J- NA 273 J- NA NAHSS-B-0-101-09-107 02/08/06 11/20/06 Surface REG mg/kg NA 24.3 J- NA 5,350 J- NA 487 J- NA NAHSS-B-0-101-09-108 02/08/06 02/10/06 Surface REG mg/kg 1.5 J 26.4 6 9,050 31,900 766 4 47.2HSS-B-0-101-09-108 02/08/06 11/20/06 Surface REG mg/kg NA 40.2 NA 10,300 NA 487 NA NAHSS-B-0-101-09-109 02/09/06 11/20/06 Surface REG mg/kg NA 26.9 J- NA 9,320 J- NA 376 J- NA NAHSS-B-0-101-09-111B 02/09/06 02/10/06 Surface REG mg/kg 1.2 J 33 6.4 9,150 26,400 156 8 66.4HSS-B-0-101-09-115 02/09/06 11/20/06 Surface REG mg/kg NA 17.3 J- NA 3,690 J- NA 175 J- NA NAHSS-B-0-101-09-115 02/10/06 11/20/06 Surface FD mg/kg NA 20.3 J- NA 4,600 J- NA 170 J- NA NAHSS-B-0-101-09-120 02/09/06 11/20/06 Surface REG mg/kg NA 15.5 J- NA 2,750 J- NA 77.2 J- NA NAHSS-B-0-101-09-134 02/10/06 08/21/07 Surface REG mg/kg NA 2.7 J- NA 653 J- NA 18.1 J- NA NAHSS-B-0-101-09-137 02/08/06 08/22/07 Surface REG mg/kg NA 24.7 J NA 1,710 NA 48.3 J NA NAHSS-B-0-101-09-140 02/08/06 08/22/07 Surface REG mg/kg NA 7.1 J NA 1,850 NA 30.4 J NA NAHSS-B-1-101-07-028 02/06/06 11/20/06 Subsurface REG mg/kg NA 13.7 J- NA 2,030 J- NA 84.6 J- NA NAHSS-B-1-101-07-035AN 02/09/06 11/20/06 Subsurface REG mg/kg NA 10.3 J- NA 8,580 J- NA 61.3 J- NA NA
Page 8 of 33
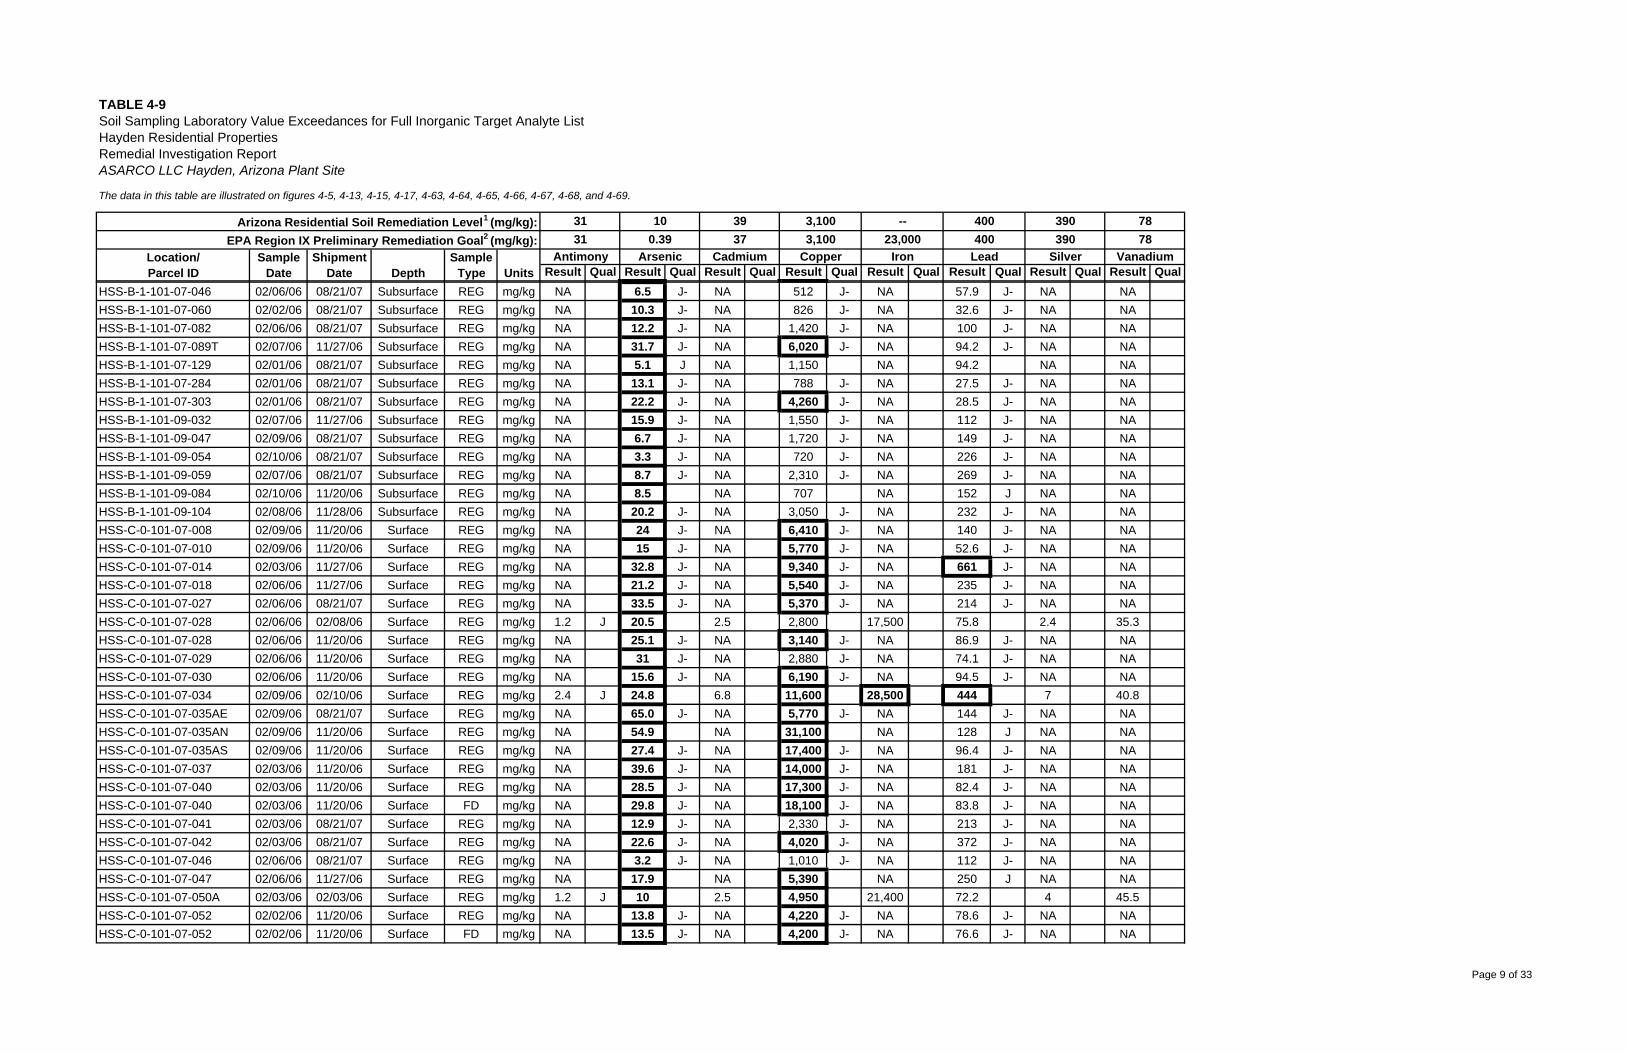
The data in this table are illustrated on figures 4-5, 4-13, 4-15, 4-17, 4-63, 4-64, 4-65, 4-66, 4-67, 4-68, and 4-69.
Result Qual Result Qual Result Qual Result Qual Result Qual Result Qual Result Qual Result Qual
TABLE 4-9
Depth
Soil Sampling Laboratory Value Exceedances for Full Inorganic Target Analyte ListHayden Residential PropertiesRemedial Investigation ReportASARCO LLC Hayden, Arizona Plant Site
Location/Parcel ID
31
ShipmentDate Units
Arizona Residential Soil Remediation Level1 (mg/kg):EPA Region IX Preliminary Remediation Goal2 (mg/kg):
SampleType
SampleDate
10
Antimony Arsenic31 0.39
3937
Cadmium
3,1003,100
Copper
--23,000
Iron
400400
Lead
390390
Silver
7878
Vanadium
HSS-B-1-101-07-046 02/06/06 08/21/07 Subsurface REG mg/kg NA 6.5 J- NA 512 J- NA 57.9 J- NA NAHSS-B-1-101-07-060 02/02/06 08/21/07 Subsurface REG mg/kg NA 10.3 J- NA 826 J- NA 32.6 J- NA NAHSS-B-1-101-07-082 02/06/06 08/21/07 Subsurface REG mg/kg NA 12.2 J- NA 1,420 J- NA 100 J- NA NAHSS-B-1-101-07-089T 02/07/06 11/27/06 Subsurface REG mg/kg NA 31.7 J- NA 6,020 J- NA 94.2 J- NA NAHSS-B-1-101-07-129 02/01/06 08/21/07 Subsurface REG mg/kg NA 5.1 J NA 1,150 NA 94.2 NA NAHSS-B-1-101-07-284 02/01/06 08/21/07 Subsurface REG mg/kg NA 13.1 J- NA 788 J- NA 27.5 J- NA NAHSS-B-1-101-07-303 02/01/06 08/21/07 Subsurface REG mg/kg NA 22.2 J- NA 4,260 J- NA 28.5 J- NA NAHSS-B-1-101-09-032 02/07/06 11/27/06 Subsurface REG mg/kg NA 15.9 J- NA 1,550 J- NA 112 J- NA NAHSS-B-1-101-09-047 02/09/06 08/21/07 Subsurface REG mg/kg NA 6.7 J- NA 1,720 J- NA 149 J- NA NAHSS-B-1-101-09-054 02/10/06 08/21/07 Subsurface REG mg/kg NA 3.3 J- NA 720 J- NA 226 J- NA NAHSS-B-1-101-09-059 02/07/06 08/21/07 Subsurface REG mg/kg NA 8.7 J- NA 2,310 J- NA 269 J- NA NAHSS-B-1-101-09-084 02/10/06 11/20/06 Subsurface REG mg/kg NA 8.5 NA 707 NA 152 J NA NAHSS-B-1-101-09-104 02/08/06 11/28/06 Subsurface REG mg/kg NA 20.2 J- NA 3,050 J- NA 232 J- NA NAHSS-C-0-101-07-008 02/09/06 11/20/06 Surface REG mg/kg NA 24 J- NA 6,410 J- NA 140 J- NA NAHSS-C-0-101-07-010 02/09/06 11/20/06 Surface REG mg/kg NA 15 J- NA 5,770 J- NA 52.6 J- NA NAHSS-C-0-101-07-014 02/03/06 11/27/06 Surface REG mg/kg NA 32.8 J- NA 9,340 J- NA 661 J- NA NAHSS-C-0-101-07-018 02/06/06 11/27/06 Surface REG mg/kg NA 21.2 J- NA 5,540 J- NA 235 J- NA NAHSS-C-0-101-07-027 02/06/06 08/21/07 Surface REG mg/kg NA 33.5 J- NA 5,370 J- NA 214 J- NA NAHSS-C-0-101-07-028 02/06/06 02/08/06 Surface REG mg/kg 1.2 J 20.5 2.5 2,800 17,500 75.8 2.4 35.3HSS-C-0-101-07-028 02/06/06 11/20/06 Surface REG mg/kg NA 25.1 J- NA 3,140 J- NA 86.9 J- NA NAHSS-C-0-101-07-029 02/06/06 11/20/06 Surface REG mg/kg NA 31 J- NA 2,880 J- NA 74.1 J- NA NAHSS-C-0-101-07-030 02/06/06 11/20/06 Surface REG mg/kg NA 15.6 J- NA 6,190 J- NA 94.5 J- NA NAHSS-C-0-101-07-034 02/09/06 02/10/06 Surface REG mg/kg 2.4 J 24.8 6.8 11,600 28,500 444 7 40.8HSS-C-0-101-07-035AE 02/09/06 08/21/07 Surface REG mg/kg NA 65.0 J- NA 5,770 J- NA 144 J- NA NAHSS-C-0-101-07-035AN 02/09/06 11/20/06 Surface REG mg/kg NA 54.9 NA 31,100 NA 128 J NA NAHSS-C-0-101-07-035AS 02/09/06 11/20/06 Surface REG mg/kg NA 27.4 J- NA 17,400 J- NA 96.4 J- NA NAHSS-C-0-101-07-037 02/03/06 11/20/06 Surface REG mg/kg NA 39.6 J- NA 14,000 J- NA 181 J- NA NAHSS-C-0-101-07-040 02/03/06 11/20/06 Surface REG mg/kg NA 28.5 J- NA 17,300 J- NA 82.4 J- NA NAHSS-C-0-101-07-040 02/03/06 11/20/06 Surface FD mg/kg NA 29.8 J- NA 18,100 J- NA 83.8 J- NA NAHSS-C-0-101-07-041 02/03/06 08/21/07 Surface REG mg/kg NA 12.9 J- NA 2,330 J- NA 213 J- NA NAHSS-C-0-101-07-042 02/03/06 08/21/07 Surface REG mg/kg NA 22.6 J- NA 4,020 J- NA 372 J- NA NAHSS-C-0-101-07-046 02/06/06 08/21/07 Surface REG mg/kg NA 3.2 J- NA 1,010 J- NA 112 J- NA NAHSS-C-0-101-07-047 02/06/06 11/27/06 Surface REG mg/kg NA 17.9 NA 5,390 NA 250 J NA NAHSS-C-0-101-07-050A 02/03/06 02/03/06 Surface REG mg/kg 1.2 J 10 2.5 4,950 21,400 72.2 4 45.5HSS-C-0-101-07-052 02/02/06 11/20/06 Surface REG mg/kg NA 13.8 J- NA 4,220 J- NA 78.6 J- NA NAHSS-C-0-101-07-052 02/02/06 11/20/06 Surface FD mg/kg NA 13.5 J- NA 4,200 J- NA 76.6 J- NA NA
Page 9 of 33
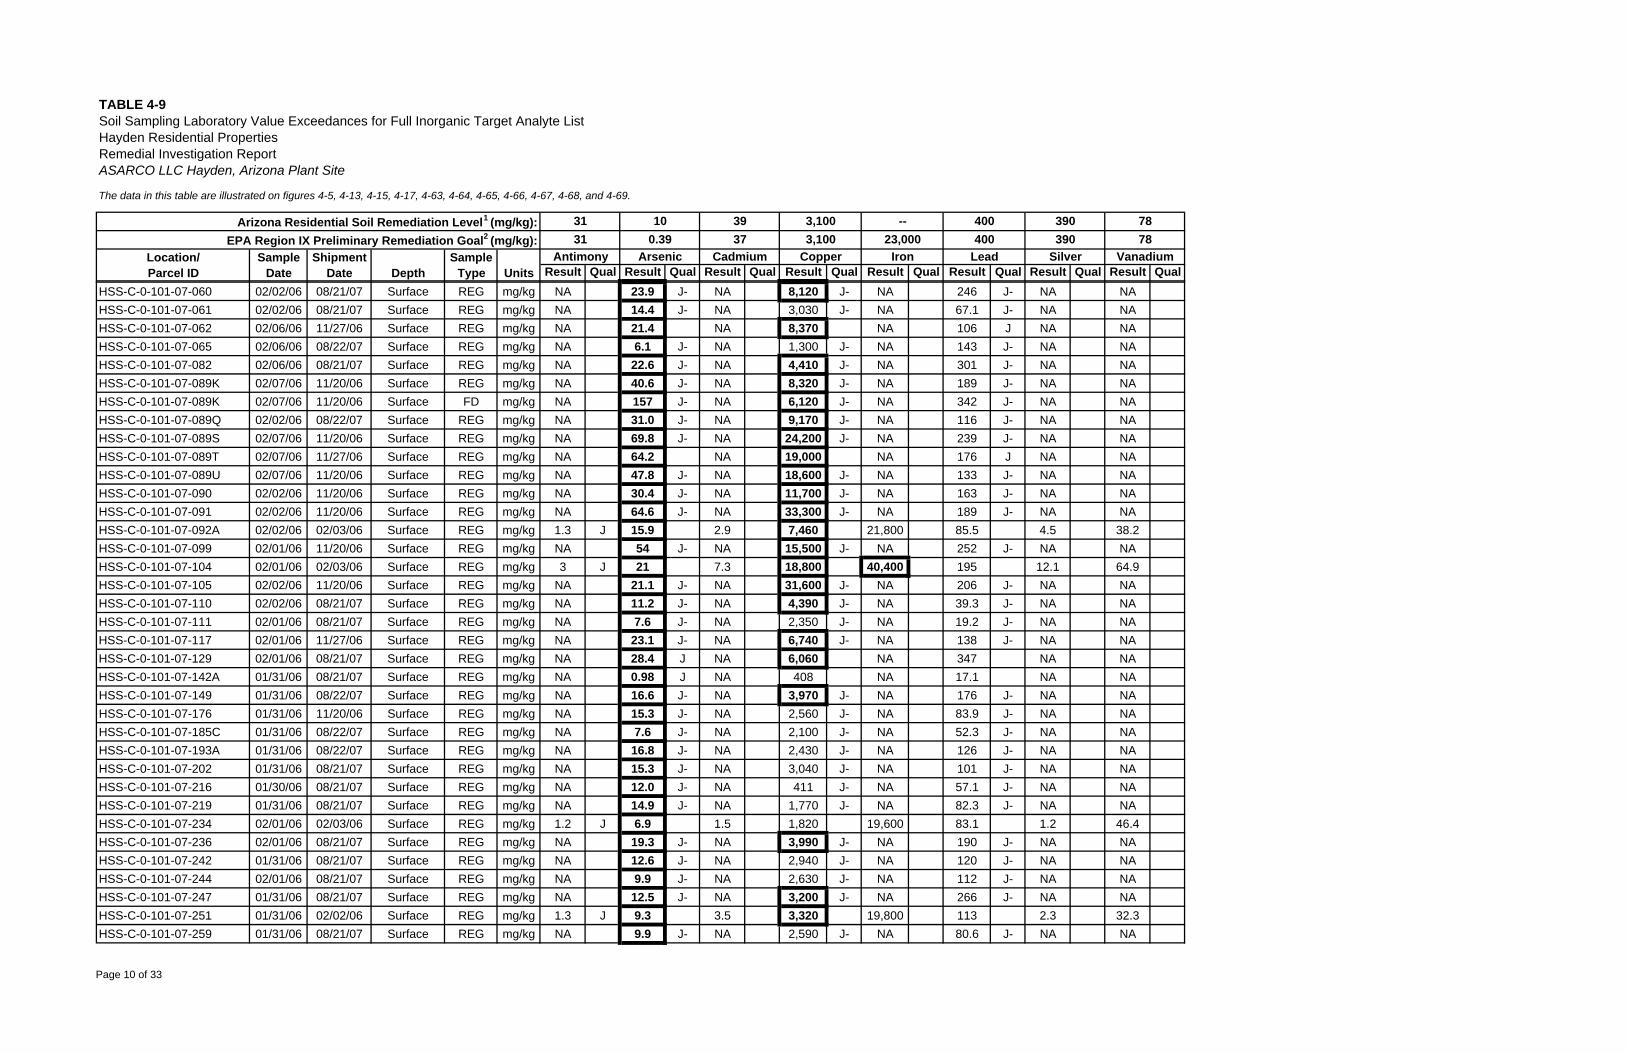
The data in this table are illustrated on figures 4-5, 4-13, 4-15, 4-17, 4-63, 4-64, 4-65, 4-66, 4-67, 4-68, and 4-69.
Result Qual Result Qual Result Qual Result Qual Result Qual Result Qual Result Qual Result Qual
TABLE 4-9
Depth
Soil Sampling Laboratory Value Exceedances for Full Inorganic Target Analyte ListHayden Residential PropertiesRemedial Investigation ReportASARCO LLC Hayden, Arizona Plant Site
Location/Parcel ID
31
ShipmentDate Units
Arizona Residential Soil Remediation Level1 (mg/kg):EPA Region IX Preliminary Remediation Goal2 (mg/kg):
SampleType
SampleDate
10
Antimony Arsenic31 0.39
3937
Cadmium
3,1003,100
Copper
--23,000
Iron
400400
Lead
390390
Silver
7878
Vanadium
HSS-C-0-101-07-060 02/02/06 08/21/07 Surface REG mg/kg NA 23.9 J- NA 8,120 J- NA 246 J- NA NAHSS-C-0-101-07-061 02/02/06 08/21/07 Surface REG mg/kg NA 14.4 J- NA 3,030 J- NA 67.1 J- NA NAHSS-C-0-101-07-062 02/06/06 11/27/06 Surface REG mg/kg NA 21.4 NA 8,370 NA 106 J NA NAHSS-C-0-101-07-065 02/06/06 08/22/07 Surface REG mg/kg NA 6.1 J- NA 1,300 J- NA 143 J- NA NAHSS-C-0-101-07-082 02/06/06 08/21/07 Surface REG mg/kg NA 22.6 J- NA 4,410 J- NA 301 J- NA NAHSS-C-0-101-07-089K 02/07/06 11/20/06 Surface REG mg/kg NA 40.6 J- NA 8,320 J- NA 189 J- NA NAHSS-C-0-101-07-089K 02/07/06 11/20/06 Surface FD mg/kg NA 157 J- NA 6,120 J- NA 342 J- NA NAHSS-C-0-101-07-089Q 02/02/06 08/22/07 Surface REG mg/kg NA 31.0 J- NA 9,170 J- NA 116 J- NA NAHSS-C-0-101-07-089S 02/07/06 11/20/06 Surface REG mg/kg NA 69.8 J- NA 24,200 J- NA 239 J- NA NAHSS-C-0-101-07-089T 02/07/06 11/27/06 Surface REG mg/kg NA 64.2 NA 19,000 NA 176 J NA NAHSS-C-0-101-07-089U 02/07/06 11/20/06 Surface REG mg/kg NA 47.8 J- NA 18,600 J- NA 133 J- NA NAHSS-C-0-101-07-090 02/02/06 11/20/06 Surface REG mg/kg NA 30.4 J- NA 11,700 J- NA 163 J- NA NAHSS-C-0-101-07-091 02/02/06 11/20/06 Surface REG mg/kg NA 64.6 J- NA 33,300 J- NA 189 J- NA NAHSS-C-0-101-07-092A 02/02/06 02/03/06 Surface REG mg/kg 1.3 J 15.9 2.9 7,460 21,800 85.5 4.5 38.2HSS-C-0-101-07-099 02/01/06 11/20/06 Surface REG mg/kg NA 54 J- NA 15,500 J- NA 252 J- NA NAHSS-C-0-101-07-104 02/01/06 02/03/06 Surface REG mg/kg 3 J 21 7.3 18,800 40,400 195 12.1 64.9HSS-C-0-101-07-105 02/02/06 11/20/06 Surface REG mg/kg NA 21.1 J- NA 31,600 J- NA 206 J- NA NAHSS-C-0-101-07-110 02/02/06 08/21/07 Surface REG mg/kg NA 11.2 J- NA 4,390 J- NA 39.3 J- NA NAHSS-C-0-101-07-111 02/01/06 08/21/07 Surface REG mg/kg NA 7.6 J- NA 2,350 J- NA 19.2 J- NA NAHSS-C-0-101-07-117 02/01/06 11/27/06 Surface REG mg/kg NA 23.1 J- NA 6,740 J- NA 138 J- NA NAHSS-C-0-101-07-129 02/01/06 08/21/07 Surface REG mg/kg NA 28.4 J NA 6,060 NA 347 NA NAHSS-C-0-101-07-142A 01/31/06 08/21/07 Surface REG mg/kg NA 0.98 J NA 408 NA 17.1 NA NAHSS-C-0-101-07-149 01/31/06 08/22/07 Surface REG mg/kg NA 16.6 J- NA 3,970 J- NA 176 J- NA NAHSS-C-0-101-07-176 01/31/06 11/20/06 Surface REG mg/kg NA 15.3 J- NA 2,560 J- NA 83.9 J- NA NAHSS-C-0-101-07-185C 01/31/06 08/22/07 Surface REG mg/kg NA 7.6 J- NA 2,100 J- NA 52.3 J- NA NAHSS-C-0-101-07-193A 01/31/06 08/22/07 Surface REG mg/kg NA 16.8 J- NA 2,430 J- NA 126 J- NA NAHSS-C-0-101-07-202 01/31/06 08/21/07 Surface REG mg/kg NA 15.3 J- NA 3,040 J- NA 101 J- NA NAHSS-C-0-101-07-216 01/30/06 08/21/07 Surface REG mg/kg NA 12.0 J- NA 411 J- NA 57.1 J- NA NAHSS-C-0-101-07-219 01/31/06 08/21/07 Surface REG mg/kg NA 14.9 J- NA 1,770 J- NA 82.3 J- NA NAHSS-C-0-101-07-234 02/01/06 02/03/06 Surface REG mg/kg 1.2 J 6.9 1.5 1,820 19,600 83.1 1.2 46.4HSS-C-0-101-07-236 02/01/06 08/21/07 Surface REG mg/kg NA 19.3 J- NA 3,990 J- NA 190 J- NA NAHSS-C-0-101-07-242 01/31/06 08/21/07 Surface REG mg/kg NA 12.6 J- NA 2,940 J- NA 120 J- NA NAHSS-C-0-101-07-244 02/01/06 08/21/07 Surface REG mg/kg NA 9.9 J- NA 2,630 J- NA 112 J- NA NAHSS-C-0-101-07-247 01/31/06 08/21/07 Surface REG mg/kg NA 12.5 J- NA 3,200 J- NA 266 J- NA NAHSS-C-0-101-07-251 01/31/06 02/02/06 Surface REG mg/kg 1.3 J 9.3 3.5 3,320 19,800 113 2.3 32.3HSS-C-0-101-07-259 01/31/06 08/21/07 Surface REG mg/kg NA 9.9 J- NA 2,590 J- NA 80.6 J- NA NA
Page 10 of 33
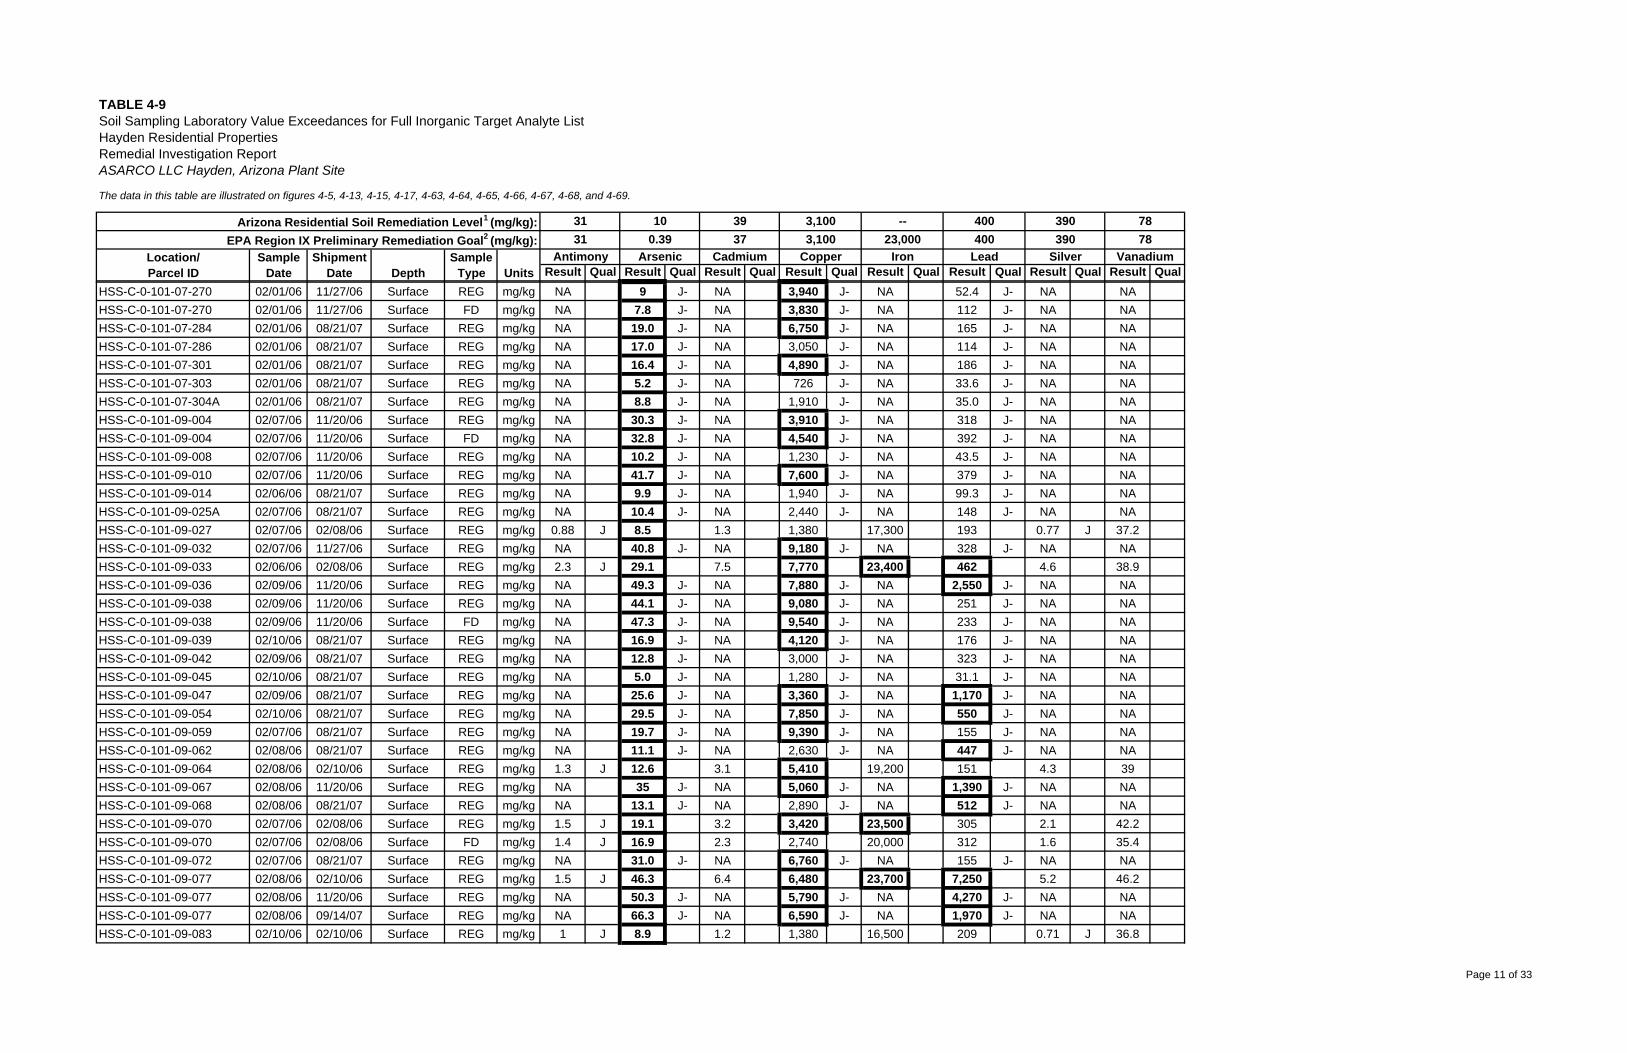
The data in this table are illustrated on figures 4-5, 4-13, 4-15, 4-17, 4-63, 4-64, 4-65, 4-66, 4-67, 4-68, and 4-69.
Result Qual Result Qual Result Qual Result Qual Result Qual Result Qual Result Qual Result Qual
TABLE 4-9
Depth
Soil Sampling Laboratory Value Exceedances for Full Inorganic Target Analyte ListHayden Residential PropertiesRemedial Investigation ReportASARCO LLC Hayden, Arizona Plant Site
Location/Parcel ID
31
ShipmentDate Units
Arizona Residential Soil Remediation Level1 (mg/kg):EPA Region IX Preliminary Remediation Goal2 (mg/kg):
SampleType
SampleDate
10
Antimony Arsenic31 0.39
3937
Cadmium
3,1003,100
Copper
--23,000
Iron
400400
Lead
390390
Silver
7878
Vanadium
HSS-C-0-101-07-270 02/01/06 11/27/06 Surface REG mg/kg NA 9 J- NA 3,940 J- NA 52.4 J- NA NAHSS-C-0-101-07-270 02/01/06 11/27/06 Surface FD mg/kg NA 7.8 J- NA 3,830 J- NA 112 J- NA NAHSS-C-0-101-07-284 02/01/06 08/21/07 Surface REG mg/kg NA 19.0 J- NA 6,750 J- NA 165 J- NA NAHSS-C-0-101-07-286 02/01/06 08/21/07 Surface REG mg/kg NA 17.0 J- NA 3,050 J- NA 114 J- NA NAHSS-C-0-101-07-301 02/01/06 08/21/07 Surface REG mg/kg NA 16.4 J- NA 4,890 J- NA 186 J- NA NAHSS-C-0-101-07-303 02/01/06 08/21/07 Surface REG mg/kg NA 5.2 J- NA 726 J- NA 33.6 J- NA NAHSS-C-0-101-07-304A 02/01/06 08/21/07 Surface REG mg/kg NA 8.8 J- NA 1,910 J- NA 35.0 J- NA NAHSS-C-0-101-09-004 02/07/06 11/20/06 Surface REG mg/kg NA 30.3 J- NA 3,910 J- NA 318 J- NA NAHSS-C-0-101-09-004 02/07/06 11/20/06 Surface FD mg/kg NA 32.8 J- NA 4,540 J- NA 392 J- NA NAHSS-C-0-101-09-008 02/07/06 11/20/06 Surface REG mg/kg NA 10.2 J- NA 1,230 J- NA 43.5 J- NA NAHSS-C-0-101-09-010 02/07/06 11/20/06 Surface REG mg/kg NA 41.7 J- NA 7,600 J- NA 379 J- NA NAHSS-C-0-101-09-014 02/06/06 08/21/07 Surface REG mg/kg NA 9.9 J- NA 1,940 J- NA 99.3 J- NA NAHSS-C-0-101-09-025A 02/07/06 08/21/07 Surface REG mg/kg NA 10.4 J- NA 2,440 J- NA 148 J- NA NAHSS-C-0-101-09-027 02/07/06 02/08/06 Surface REG mg/kg 0.88 J 8.5 1.3 1,380 17,300 193 0.77 J 37.2HSS-C-0-101-09-032 02/07/06 11/27/06 Surface REG mg/kg NA 40.8 J- NA 9,180 J- NA 328 J- NA NAHSS-C-0-101-09-033 02/06/06 02/08/06 Surface REG mg/kg 2.3 J 29.1 7.5 7,770 23,400 462 4.6 38.9HSS-C-0-101-09-036 02/09/06 11/20/06 Surface REG mg/kg NA 49.3 J- NA 7,880 J- NA 2,550 J- NA NAHSS-C-0-101-09-038 02/09/06 11/20/06 Surface REG mg/kg NA 44.1 J- NA 9,080 J- NA 251 J- NA NAHSS-C-0-101-09-038 02/09/06 11/20/06 Surface FD mg/kg NA 47.3 J- NA 9,540 J- NA 233 J- NA NAHSS-C-0-101-09-039 02/10/06 08/21/07 Surface REG mg/kg NA 16.9 J- NA 4,120 J- NA 176 J- NA NAHSS-C-0-101-09-042 02/09/06 08/21/07 Surface REG mg/kg NA 12.8 J- NA 3,000 J- NA 323 J- NA NAHSS-C-0-101-09-045 02/10/06 08/21/07 Surface REG mg/kg NA 5.0 J- NA 1,280 J- NA 31.1 J- NA NAHSS-C-0-101-09-047 02/09/06 08/21/07 Surface REG mg/kg NA 25.6 J- NA 3,360 J- NA 1,170 J- NA NAHSS-C-0-101-09-054 02/10/06 08/21/07 Surface REG mg/kg NA 29.5 J- NA 7,850 J- NA 550 J- NA NAHSS-C-0-101-09-059 02/07/06 08/21/07 Surface REG mg/kg NA 19.7 J- NA 9,390 J- NA 155 J- NA NAHSS-C-0-101-09-062 02/08/06 08/21/07 Surface REG mg/kg NA 11.1 J- NA 2,630 J- NA 447 J- NA NAHSS-C-0-101-09-064 02/08/06 02/10/06 Surface REG mg/kg 1.3 J 12.6 3.1 5,410 19,200 151 4.3 39HSS-C-0-101-09-067 02/08/06 11/20/06 Surface REG mg/kg NA 35 J- NA 5,060 J- NA 1,390 J- NA NAHSS-C-0-101-09-068 02/08/06 08/21/07 Surface REG mg/kg NA 13.1 J- NA 2,890 J- NA 512 J- NA NAHSS-C-0-101-09-070 02/07/06 02/08/06 Surface REG mg/kg 1.5 J 19.1 3.2 3,420 23,500 305 2.1 42.2HSS-C-0-101-09-070 02/07/06 02/08/06 Surface FD mg/kg 1.4 J 16.9 2.3 2,740 20,000 312 1.6 35.4HSS-C-0-101-09-072 02/07/06 08/21/07 Surface REG mg/kg NA 31.0 J- NA 6,760 J- NA 155 J- NA NAHSS-C-0-101-09-077 02/08/06 02/10/06 Surface REG mg/kg 1.5 J 46.3 6.4 6,480 23,700 7,250 5.2 46.2HSS-C-0-101-09-077 02/08/06 11/20/06 Surface REG mg/kg NA 50.3 J- NA 5,790 J- NA 4,270 J- NA NAHSS-C-0-101-09-077 02/08/06 09/14/07 Surface REG mg/kg NA 66.3 J- NA 6,590 J- NA 1,970 J- NA NAHSS-C-0-101-09-083 02/10/06 02/10/06 Surface REG mg/kg 1 J 8.9 1.2 1,380 16,500 209 0.71 J 36.8
Page 11 of 33
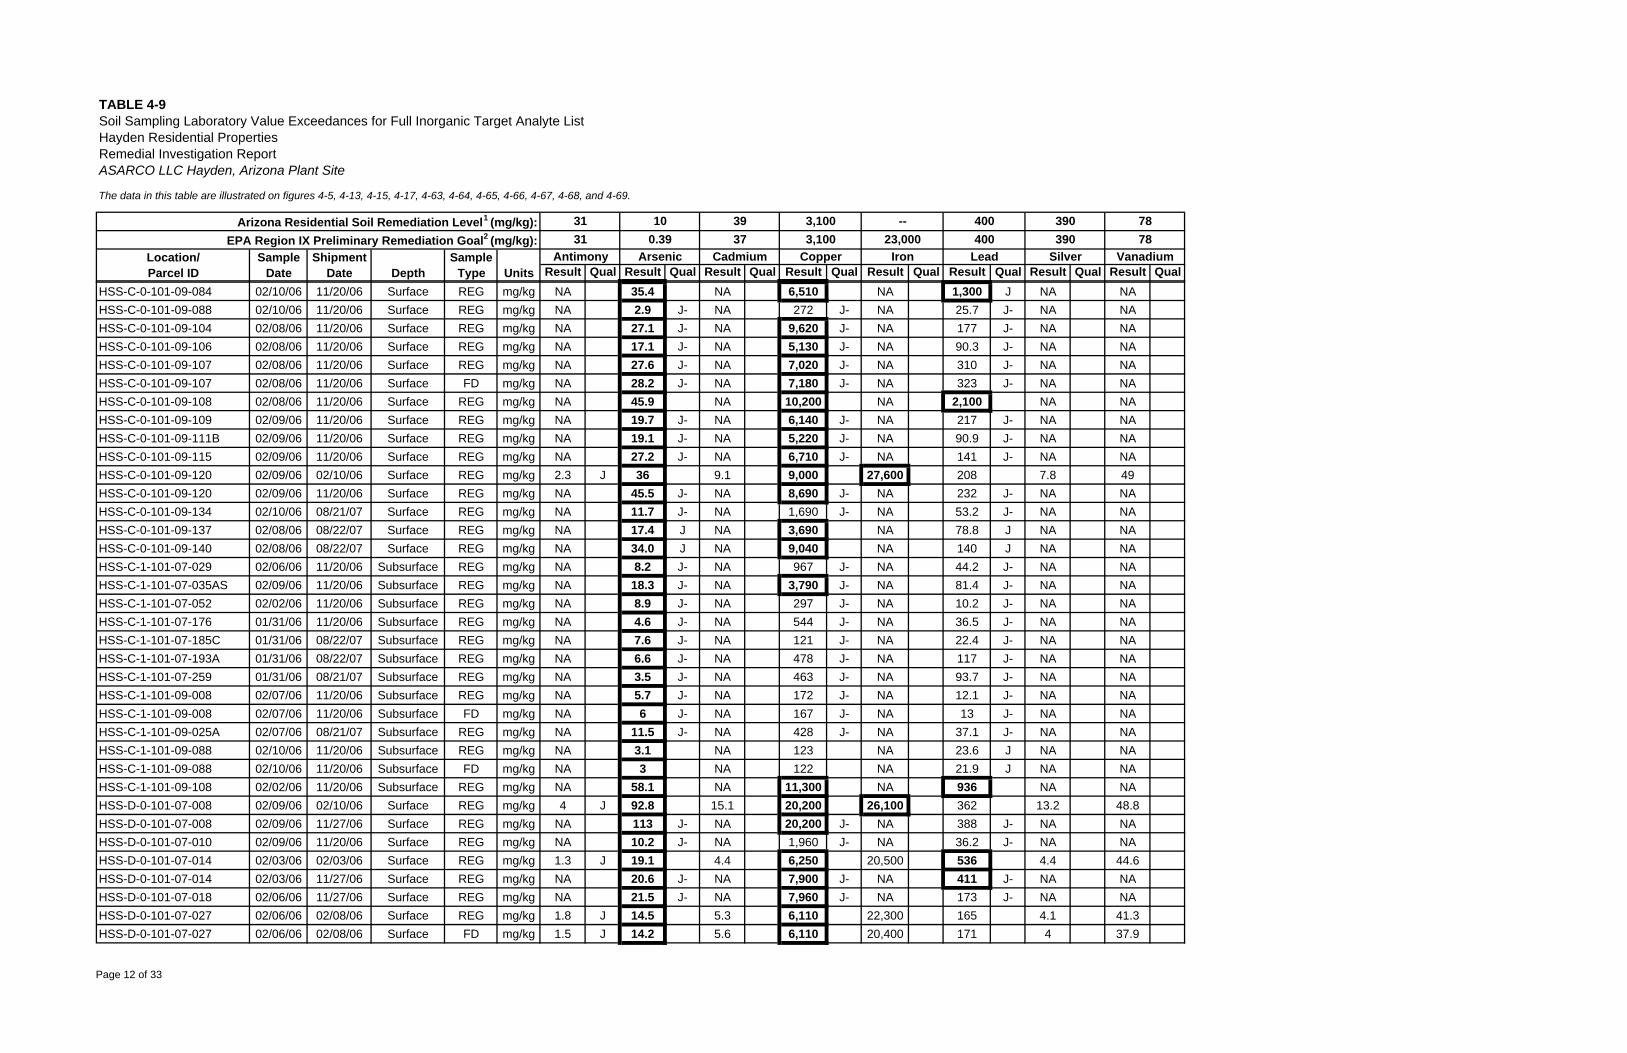
The data in this table are illustrated on figures 4-5, 4-13, 4-15, 4-17, 4-63, 4-64, 4-65, 4-66, 4-67, 4-68, and 4-69.
Result Qual Result Qual Result Qual Result Qual Result Qual Result Qual Result Qual Result Qual
TABLE 4-9
Depth
Soil Sampling Laboratory Value Exceedances for Full Inorganic Target Analyte ListHayden Residential PropertiesRemedial Investigation ReportASARCO LLC Hayden, Arizona Plant Site
Location/Parcel ID
31
ShipmentDate Units
Arizona Residential Soil Remediation Level1 (mg/kg):EPA Region IX Preliminary Remediation Goal2 (mg/kg):
SampleType
SampleDate
10
Antimony Arsenic31 0.39
3937
Cadmium
3,1003,100
Copper
--23,000
Iron
400400
Lead
390390
Silver
7878
Vanadium
HSS-C-0-101-09-084 02/10/06 11/20/06 Surface REG mg/kg NA 35.4 NA 6,510 NA 1,300 J NA NAHSS-C-0-101-09-088 02/10/06 11/20/06 Surface REG mg/kg NA 2.9 J- NA 272 J- NA 25.7 J- NA NAHSS-C-0-101-09-104 02/08/06 11/20/06 Surface REG mg/kg NA 27.1 J- NA 9,620 J- NA 177 J- NA NAHSS-C-0-101-09-106 02/08/06 11/20/06 Surface REG mg/kg NA 17.1 J- NA 5,130 J- NA 90.3 J- NA NAHSS-C-0-101-09-107 02/08/06 11/20/06 Surface REG mg/kg NA 27.6 J- NA 7,020 J- NA 310 J- NA NAHSS-C-0-101-09-107 02/08/06 11/20/06 Surface FD mg/kg NA 28.2 J- NA 7,180 J- NA 323 J- NA NAHSS-C-0-101-09-108 02/08/06 11/20/06 Surface REG mg/kg NA 45.9 NA 10,200 NA 2,100 NA NAHSS-C-0-101-09-109 02/09/06 11/20/06 Surface REG mg/kg NA 19.7 J- NA 6,140 J- NA 217 J- NA NAHSS-C-0-101-09-111B 02/09/06 11/20/06 Surface REG mg/kg NA 19.1 J- NA 5,220 J- NA 90.9 J- NA NAHSS-C-0-101-09-115 02/09/06 11/20/06 Surface REG mg/kg NA 27.2 J- NA 6,710 J- NA 141 J- NA NAHSS-C-0-101-09-120 02/09/06 02/10/06 Surface REG mg/kg 2.3 J 36 9.1 9,000 27,600 208 7.8 49HSS-C-0-101-09-120 02/09/06 11/20/06 Surface REG mg/kg NA 45.5 J- NA 8,690 J- NA 232 J- NA NAHSS-C-0-101-09-134 02/10/06 08/21/07 Surface REG mg/kg NA 11.7 J- NA 1,690 J- NA 53.2 J- NA NAHSS-C-0-101-09-137 02/08/06 08/22/07 Surface REG mg/kg NA 17.4 J NA 3,690 NA 78.8 J NA NAHSS-C-0-101-09-140 02/08/06 08/22/07 Surface REG mg/kg NA 34.0 J NA 9,040 NA 140 J NA NAHSS-C-1-101-07-029 02/06/06 11/20/06 Subsurface REG mg/kg NA 8.2 J- NA 967 J- NA 44.2 J- NA NAHSS-C-1-101-07-035AS 02/09/06 11/20/06 Subsurface REG mg/kg NA 18.3 J- NA 3,790 J- NA 81.4 J- NA NAHSS-C-1-101-07-052 02/02/06 11/20/06 Subsurface REG mg/kg NA 8.9 J- NA 297 J- NA 10.2 J- NA NAHSS-C-1-101-07-176 01/31/06 11/20/06 Subsurface REG mg/kg NA 4.6 J- NA 544 J- NA 36.5 J- NA NAHSS-C-1-101-07-185C 01/31/06 08/22/07 Subsurface REG mg/kg NA 7.6 J- NA 121 J- NA 22.4 J- NA NAHSS-C-1-101-07-193A 01/31/06 08/22/07 Subsurface REG mg/kg NA 6.6 J- NA 478 J- NA 117 J- NA NAHSS-C-1-101-07-259 01/31/06 08/21/07 Subsurface REG mg/kg NA 3.5 J- NA 463 J- NA 93.7 J- NA NAHSS-C-1-101-09-008 02/07/06 11/20/06 Subsurface REG mg/kg NA 5.7 J- NA 172 J- NA 12.1 J- NA NAHSS-C-1-101-09-008 02/07/06 11/20/06 Subsurface FD mg/kg NA 6 J- NA 167 J- NA 13 J- NA NAHSS-C-1-101-09-025A 02/07/06 08/21/07 Subsurface REG mg/kg NA 11.5 J- NA 428 J- NA 37.1 J- NA NAHSS-C-1-101-09-088 02/10/06 11/20/06 Subsurface REG mg/kg NA 3.1 NA 123 NA 23.6 J NA NAHSS-C-1-101-09-088 02/10/06 11/20/06 Subsurface FD mg/kg NA 3 NA 122 NA 21.9 J NA NAHSS-C-1-101-09-108 02/02/06 11/20/06 Subsurface REG mg/kg NA 58.1 NA 11,300 NA 936 NA NAHSS-D-0-101-07-008 02/09/06 02/10/06 Surface REG mg/kg 4 J 92.8 15.1 20,200 26,100 362 13.2 48.8HSS-D-0-101-07-008 02/09/06 11/27/06 Surface REG mg/kg NA 113 J- NA 20,200 J- NA 388 J- NA NAHSS-D-0-101-07-010 02/09/06 11/20/06 Surface REG mg/kg NA 10.2 J- NA 1,960 J- NA 36.2 J- NA NAHSS-D-0-101-07-014 02/03/06 02/03/06 Surface REG mg/kg 1.3 J 19.1 4.4 6,250 20,500 536 4.4 44.6HSS-D-0-101-07-014 02/03/06 11/27/06 Surface REG mg/kg NA 20.6 J- NA 7,900 J- NA 411 J- NA NAHSS-D-0-101-07-018 02/06/06 11/27/06 Surface REG mg/kg NA 21.5 J- NA 7,960 J- NA 173 J- NA NAHSS-D-0-101-07-027 02/06/06 02/08/06 Surface REG mg/kg 1.8 J 14.5 5.3 6,110 22,300 165 4.1 41.3HSS-D-0-101-07-027 02/06/06 02/08/06 Surface FD mg/kg 1.5 J 14.2 5.6 6,110 20,400 171 4 37.9
Page 12 of 33
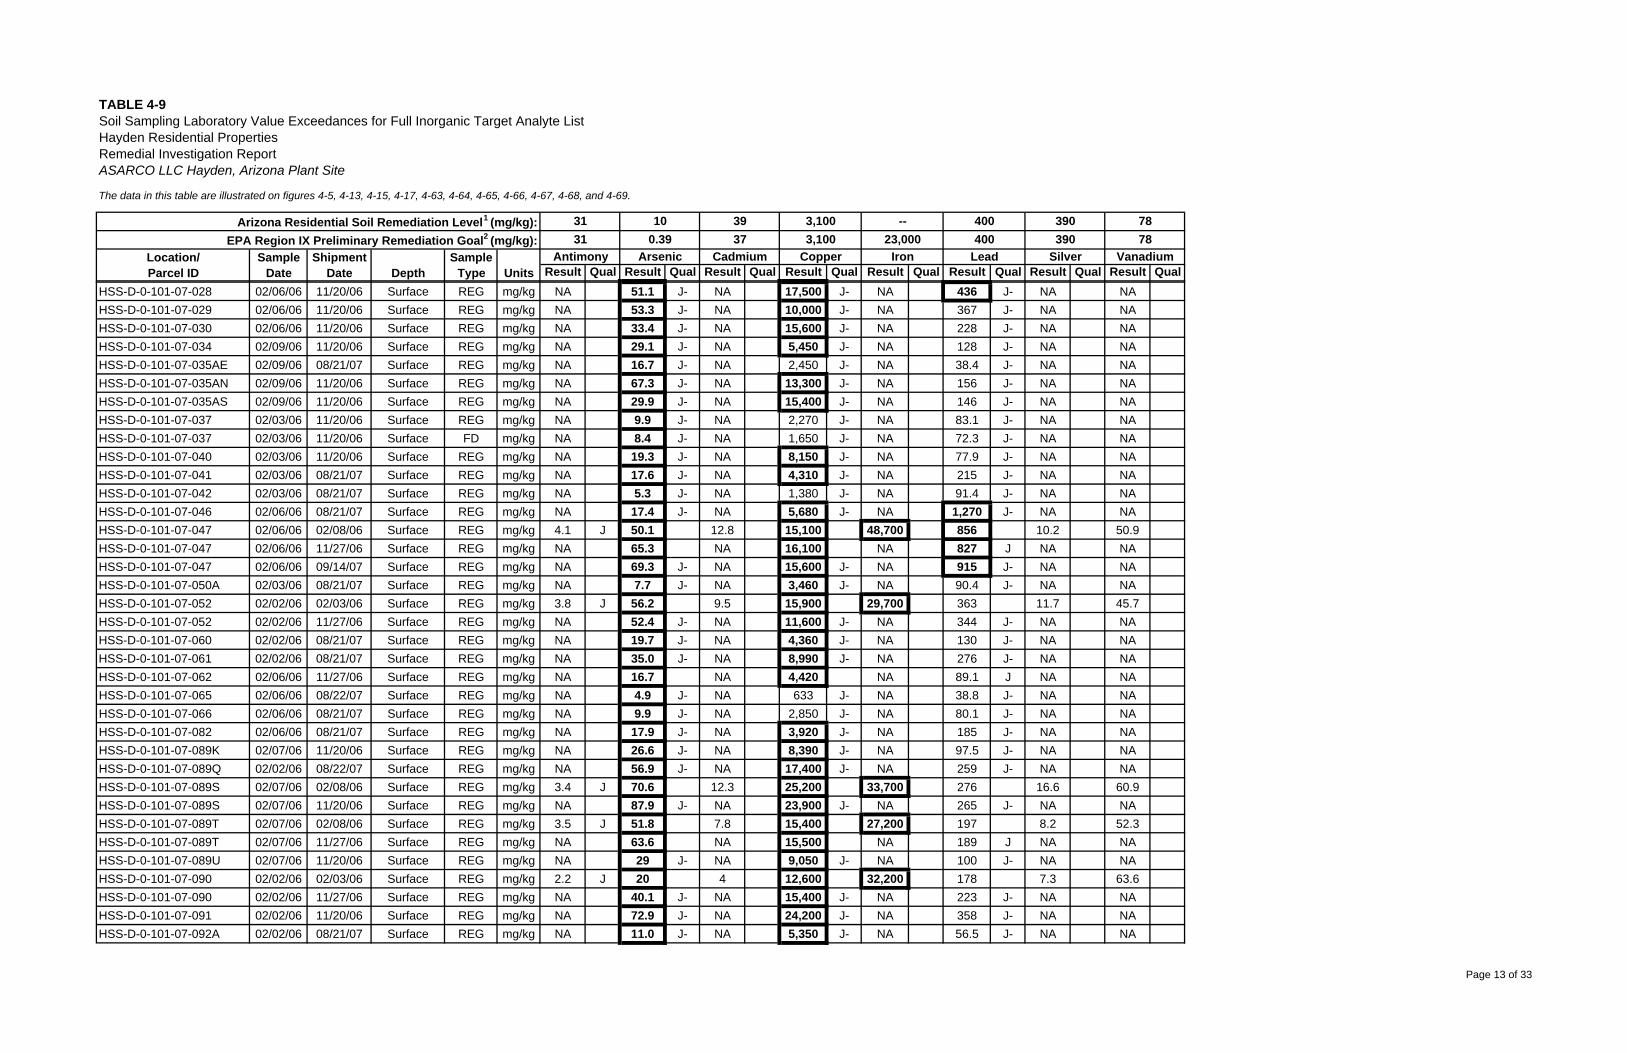
The data in this table are illustrated on figures 4-5, 4-13, 4-15, 4-17, 4-63, 4-64, 4-65, 4-66, 4-67, 4-68, and 4-69.
Result Qual Result Qual Result Qual Result Qual Result Qual Result Qual Result Qual Result Qual
TABLE 4-9
Depth
Soil Sampling Laboratory Value Exceedances for Full Inorganic Target Analyte ListHayden Residential PropertiesRemedial Investigation ReportASARCO LLC Hayden, Arizona Plant Site
Location/Parcel ID
31
ShipmentDate Units
Arizona Residential Soil Remediation Level1 (mg/kg):EPA Region IX Preliminary Remediation Goal2 (mg/kg):
SampleType
SampleDate
10
Antimony Arsenic31 0.39
3937
Cadmium
3,1003,100
Copper
--23,000
Iron
400400
Lead
390390
Silver
7878
Vanadium
HSS-D-0-101-07-028 02/06/06 11/20/06 Surface REG mg/kg NA 51.1 J- NA 17,500 J- NA 436 J- NA NAHSS-D-0-101-07-029 02/06/06 11/20/06 Surface REG mg/kg NA 53.3 J- NA 10,000 J- NA 367 J- NA NAHSS-D-0-101-07-030 02/06/06 11/20/06 Surface REG mg/kg NA 33.4 J- NA 15,600 J- NA 228 J- NA NAHSS-D-0-101-07-034 02/09/06 11/20/06 Surface REG mg/kg NA 29.1 J- NA 5,450 J- NA 128 J- NA NAHSS-D-0-101-07-035AE 02/09/06 08/21/07 Surface REG mg/kg NA 16.7 J- NA 2,450 J- NA 38.4 J- NA NAHSS-D-0-101-07-035AN 02/09/06 11/20/06 Surface REG mg/kg NA 67.3 J- NA 13,300 J- NA 156 J- NA NAHSS-D-0-101-07-035AS 02/09/06 11/20/06 Surface REG mg/kg NA 29.9 J- NA 15,400 J- NA 146 J- NA NAHSS-D-0-101-07-037 02/03/06 11/20/06 Surface REG mg/kg NA 9.9 J- NA 2,270 J- NA 83.1 J- NA NAHSS-D-0-101-07-037 02/03/06 11/20/06 Surface FD mg/kg NA 8.4 J- NA 1,650 J- NA 72.3 J- NA NAHSS-D-0-101-07-040 02/03/06 11/20/06 Surface REG mg/kg NA 19.3 J- NA 8,150 J- NA 77.9 J- NA NAHSS-D-0-101-07-041 02/03/06 08/21/07 Surface REG mg/kg NA 17.6 J- NA 4,310 J- NA 215 J- NA NAHSS-D-0-101-07-042 02/03/06 08/21/07 Surface REG mg/kg NA 5.3 J- NA 1,380 J- NA 91.4 J- NA NAHSS-D-0-101-07-046 02/06/06 08/21/07 Surface REG mg/kg NA 17.4 J- NA 5,680 J- NA 1,270 J- NA NAHSS-D-0-101-07-047 02/06/06 02/08/06 Surface REG mg/kg 4.1 J 50.1 12.8 15,100 48,700 856 10.2 50.9HSS-D-0-101-07-047 02/06/06 11/27/06 Surface REG mg/kg NA 65.3 NA 16,100 NA 827 J NA NAHSS-D-0-101-07-047 02/06/06 09/14/07 Surface REG mg/kg NA 69.3 J- NA 15,600 J- NA 915 J- NA NAHSS-D-0-101-07-050A 02/03/06 08/21/07 Surface REG mg/kg NA 7.7 J- NA 3,460 J- NA 90.4 J- NA NAHSS-D-0-101-07-052 02/02/06 02/03/06 Surface REG mg/kg 3.8 J 56.2 9.5 15,900 29,700 363 11.7 45.7HSS-D-0-101-07-052 02/02/06 11/27/06 Surface REG mg/kg NA 52.4 J- NA 11,600 J- NA 344 J- NA NAHSS-D-0-101-07-060 02/02/06 08/21/07 Surface REG mg/kg NA 19.7 J- NA 4,360 J- NA 130 J- NA NAHSS-D-0-101-07-061 02/02/06 08/21/07 Surface REG mg/kg NA 35.0 J- NA 8,990 J- NA 276 J- NA NAHSS-D-0-101-07-062 02/06/06 11/27/06 Surface REG mg/kg NA 16.7 NA 4,420 NA 89.1 J NA NAHSS-D-0-101-07-065 02/06/06 08/22/07 Surface REG mg/kg NA 4.9 J- NA 633 J- NA 38.8 J- NA NAHSS-D-0-101-07-066 02/06/06 08/21/07 Surface REG mg/kg NA 9.9 J- NA 2,850 J- NA 80.1 J- NA NAHSS-D-0-101-07-082 02/06/06 08/21/07 Surface REG mg/kg NA 17.9 J- NA 3,920 J- NA 185 J- NA NAHSS-D-0-101-07-089K 02/07/06 11/20/06 Surface REG mg/kg NA 26.6 J- NA 8,390 J- NA 97.5 J- NA NAHSS-D-0-101-07-089Q 02/02/06 08/22/07 Surface REG mg/kg NA 56.9 J- NA 17,400 J- NA 259 J- NA NAHSS-D-0-101-07-089S 02/07/06 02/08/06 Surface REG mg/kg 3.4 J 70.6 12.3 25,200 33,700 276 16.6 60.9HSS-D-0-101-07-089S 02/07/06 11/20/06 Surface REG mg/kg NA 87.9 J- NA 23,900 J- NA 265 J- NA NAHSS-D-0-101-07-089T 02/07/06 02/08/06 Surface REG mg/kg 3.5 J 51.8 7.8 15,400 27,200 197 8.2 52.3HSS-D-0-101-07-089T 02/07/06 11/27/06 Surface REG mg/kg NA 63.6 NA 15,500 NA 189 J NA NAHSS-D-0-101-07-089U 02/07/06 11/20/06 Surface REG mg/kg NA 29 J- NA 9,050 J- NA 100 J- NA NAHSS-D-0-101-07-090 02/02/06 02/03/06 Surface REG mg/kg 2.2 J 20 4 12,600 32,200 178 7.3 63.6HSS-D-0-101-07-090 02/02/06 11/27/06 Surface REG mg/kg NA 40.1 J- NA 15,400 J- NA 223 J- NA NAHSS-D-0-101-07-091 02/02/06 11/20/06 Surface REG mg/kg NA 72.9 J- NA 24,200 J- NA 358 J- NA NAHSS-D-0-101-07-092A 02/02/06 08/21/07 Surface REG mg/kg NA 11.0 J- NA 5,350 J- NA 56.5 J- NA NA
Page 13 of 33
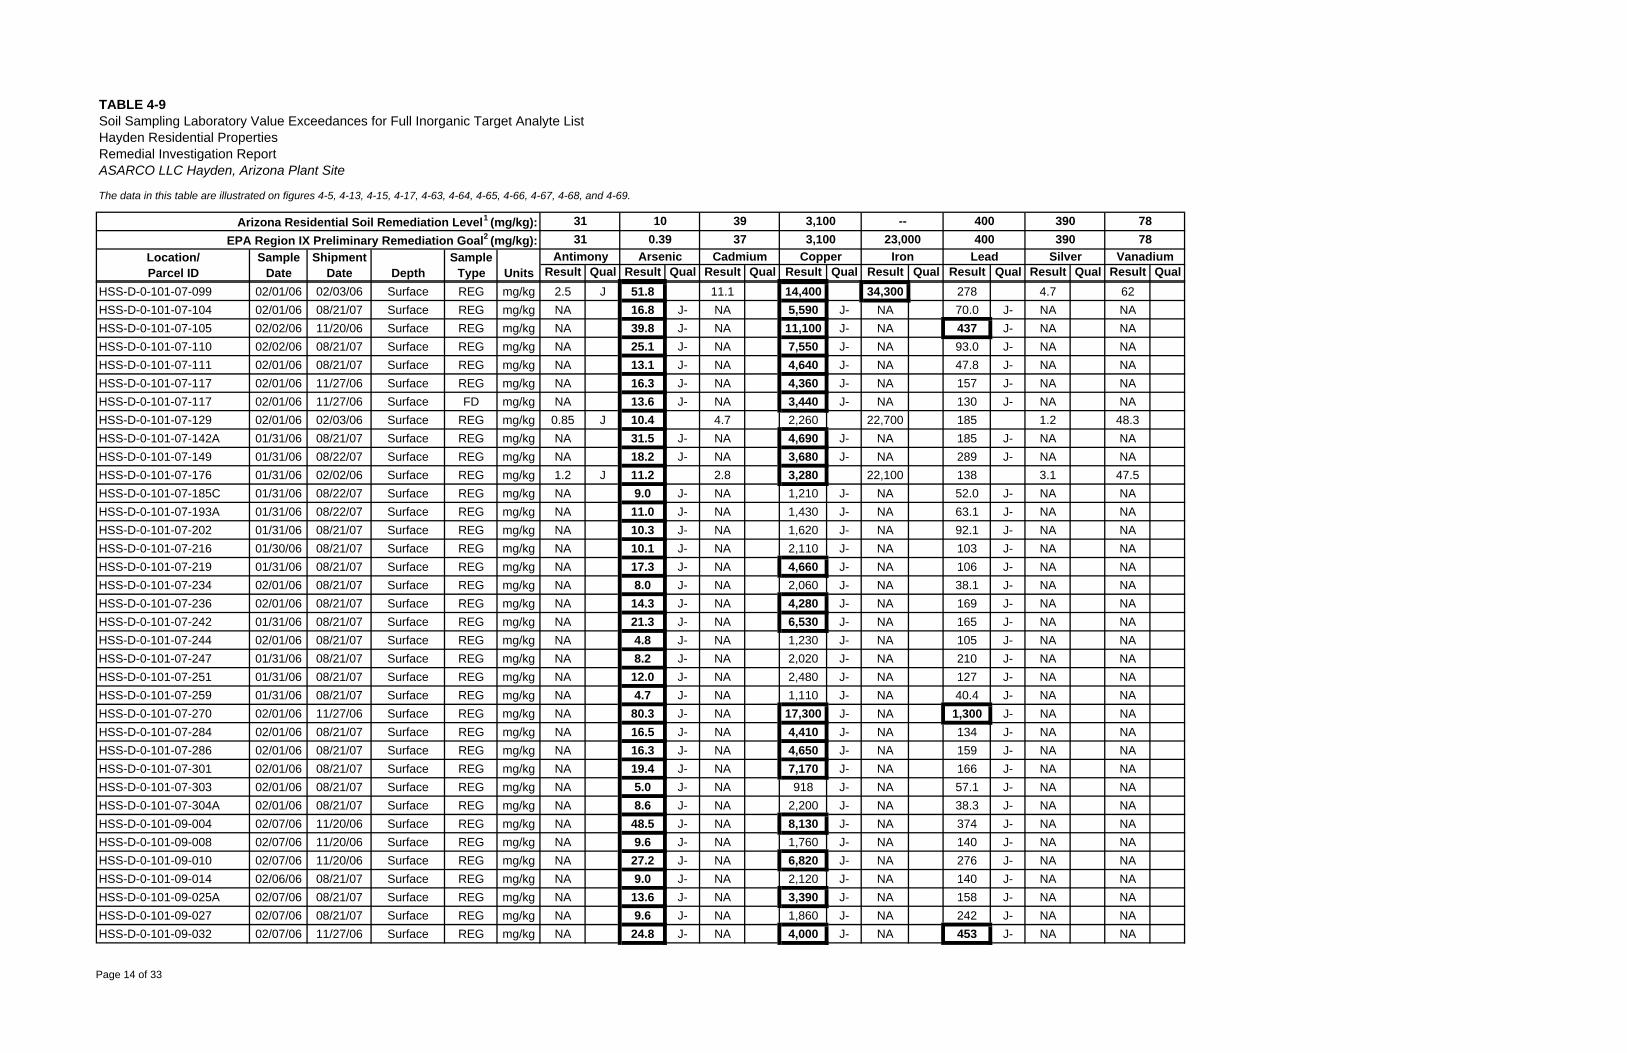
The data in this table are illustrated on figures 4-5, 4-13, 4-15, 4-17, 4-63, 4-64, 4-65, 4-66, 4-67, 4-68, and 4-69.
Result Qual Result Qual Result Qual Result Qual Result Qual Result Qual Result Qual Result Qual
TABLE 4-9
Depth
Soil Sampling Laboratory Value Exceedances for Full Inorganic Target Analyte ListHayden Residential PropertiesRemedial Investigation ReportASARCO LLC Hayden, Arizona Plant Site
Location/Parcel ID
31
ShipmentDate Units
Arizona Residential Soil Remediation Level1 (mg/kg):EPA Region IX Preliminary Remediation Goal2 (mg/kg):
SampleType
SampleDate
10
Antimony Arsenic31 0.39
3937
Cadmium
3,1003,100
Copper
--23,000
Iron
400400
Lead
390390
Silver
7878
Vanadium
HSS-D-0-101-07-099 02/01/06 02/03/06 Surface REG mg/kg 2.5 J 51.8 11.1 14,400 34,300 278 4.7 62HSS-D-0-101-07-104 02/01/06 08/21/07 Surface REG mg/kg NA 16.8 J- NA 5,590 J- NA 70.0 J- NA NAHSS-D-0-101-07-105 02/02/06 11/20/06 Surface REG mg/kg NA 39.8 J- NA 11,100 J- NA 437 J- NA NAHSS-D-0-101-07-110 02/02/06 08/21/07 Surface REG mg/kg NA 25.1 J- NA 7,550 J- NA 93.0 J- NA NAHSS-D-0-101-07-111 02/01/06 08/21/07 Surface REG mg/kg NA 13.1 J- NA 4,640 J- NA 47.8 J- NA NAHSS-D-0-101-07-117 02/01/06 11/27/06 Surface REG mg/kg NA 16.3 J- NA 4,360 J- NA 157 J- NA NAHSS-D-0-101-07-117 02/01/06 11/27/06 Surface FD mg/kg NA 13.6 J- NA 3,440 J- NA 130 J- NA NAHSS-D-0-101-07-129 02/01/06 02/03/06 Surface REG mg/kg 0.85 J 10.4 4.7 2,260 22,700 185 1.2 48.3HSS-D-0-101-07-142A 01/31/06 08/21/07 Surface REG mg/kg NA 31.5 J- NA 4,690 J- NA 185 J- NA NAHSS-D-0-101-07-149 01/31/06 08/22/07 Surface REG mg/kg NA 18.2 J- NA 3,680 J- NA 289 J- NA NAHSS-D-0-101-07-176 01/31/06 02/02/06 Surface REG mg/kg 1.2 J 11.2 2.8 3,280 22,100 138 3.1 47.5HSS-D-0-101-07-185C 01/31/06 08/22/07 Surface REG mg/kg NA 9.0 J- NA 1,210 J- NA 52.0 J- NA NAHSS-D-0-101-07-193A 01/31/06 08/22/07 Surface REG mg/kg NA 11.0 J- NA 1,430 J- NA 63.1 J- NA NAHSS-D-0-101-07-202 01/31/06 08/21/07 Surface REG mg/kg NA 10.3 J- NA 1,620 J- NA 92.1 J- NA NAHSS-D-0-101-07-216 01/30/06 08/21/07 Surface REG mg/kg NA 10.1 J- NA 2,110 J- NA 103 J- NA NAHSS-D-0-101-07-219 01/31/06 08/21/07 Surface REG mg/kg NA 17.3 J- NA 4,660 J- NA 106 J- NA NAHSS-D-0-101-07-234 02/01/06 08/21/07 Surface REG mg/kg NA 8.0 J- NA 2,060 J- NA 38.1 J- NA NAHSS-D-0-101-07-236 02/01/06 08/21/07 Surface REG mg/kg NA 14.3 J- NA 4,280 J- NA 169 J- NA NAHSS-D-0-101-07-242 01/31/06 08/21/07 Surface REG mg/kg NA 21.3 J- NA 6,530 J- NA 165 J- NA NAHSS-D-0-101-07-244 02/01/06 08/21/07 Surface REG mg/kg NA 4.8 J- NA 1,230 J- NA 105 J- NA NAHSS-D-0-101-07-247 01/31/06 08/21/07 Surface REG mg/kg NA 8.2 J- NA 2,020 J- NA 210 J- NA NAHSS-D-0-101-07-251 01/31/06 08/21/07 Surface REG mg/kg NA 12.0 J- NA 2,480 J- NA 127 J- NA NAHSS-D-0-101-07-259 01/31/06 08/21/07 Surface REG mg/kg NA 4.7 J- NA 1,110 J- NA 40.4 J- NA NAHSS-D-0-101-07-270 02/01/06 11/27/06 Surface REG mg/kg NA 80.3 J- NA 17,300 J- NA 1,300 J- NA NAHSS-D-0-101-07-284 02/01/06 08/21/07 Surface REG mg/kg NA 16.5 J- NA 4,410 J- NA 134 J- NA NAHSS-D-0-101-07-286 02/01/06 08/21/07 Surface REG mg/kg NA 16.3 J- NA 4,650 J- NA 159 J- NA NAHSS-D-0-101-07-301 02/01/06 08/21/07 Surface REG mg/kg NA 19.4 J- NA 7,170 J- NA 166 J- NA NAHSS-D-0-101-07-303 02/01/06 08/21/07 Surface REG mg/kg NA 5.0 J- NA 918 J- NA 57.1 J- NA NAHSS-D-0-101-07-304A 02/01/06 08/21/07 Surface REG mg/kg NA 8.6 J- NA 2,200 J- NA 38.3 J- NA NAHSS-D-0-101-09-004 02/07/06 11/20/06 Surface REG mg/kg NA 48.5 J- NA 8,130 J- NA 374 J- NA NAHSS-D-0-101-09-008 02/07/06 11/20/06 Surface REG mg/kg NA 9.6 J- NA 1,760 J- NA 140 J- NA NAHSS-D-0-101-09-010 02/07/06 11/20/06 Surface REG mg/kg NA 27.2 J- NA 6,820 J- NA 276 J- NA NAHSS-D-0-101-09-014 02/06/06 08/21/07 Surface REG mg/kg NA 9.0 J- NA 2,120 J- NA 140 J- NA NAHSS-D-0-101-09-025A 02/07/06 08/21/07 Surface REG mg/kg NA 13.6 J- NA 3,390 J- NA 158 J- NA NAHSS-D-0-101-09-027 02/07/06 08/21/07 Surface REG mg/kg NA 9.6 J- NA 1,860 J- NA 242 J- NA NAHSS-D-0-101-09-032 02/07/06 11/27/06 Surface REG mg/kg NA 24.8 J- NA 4,000 J- NA 453 J- NA NA
Page 14 of 33
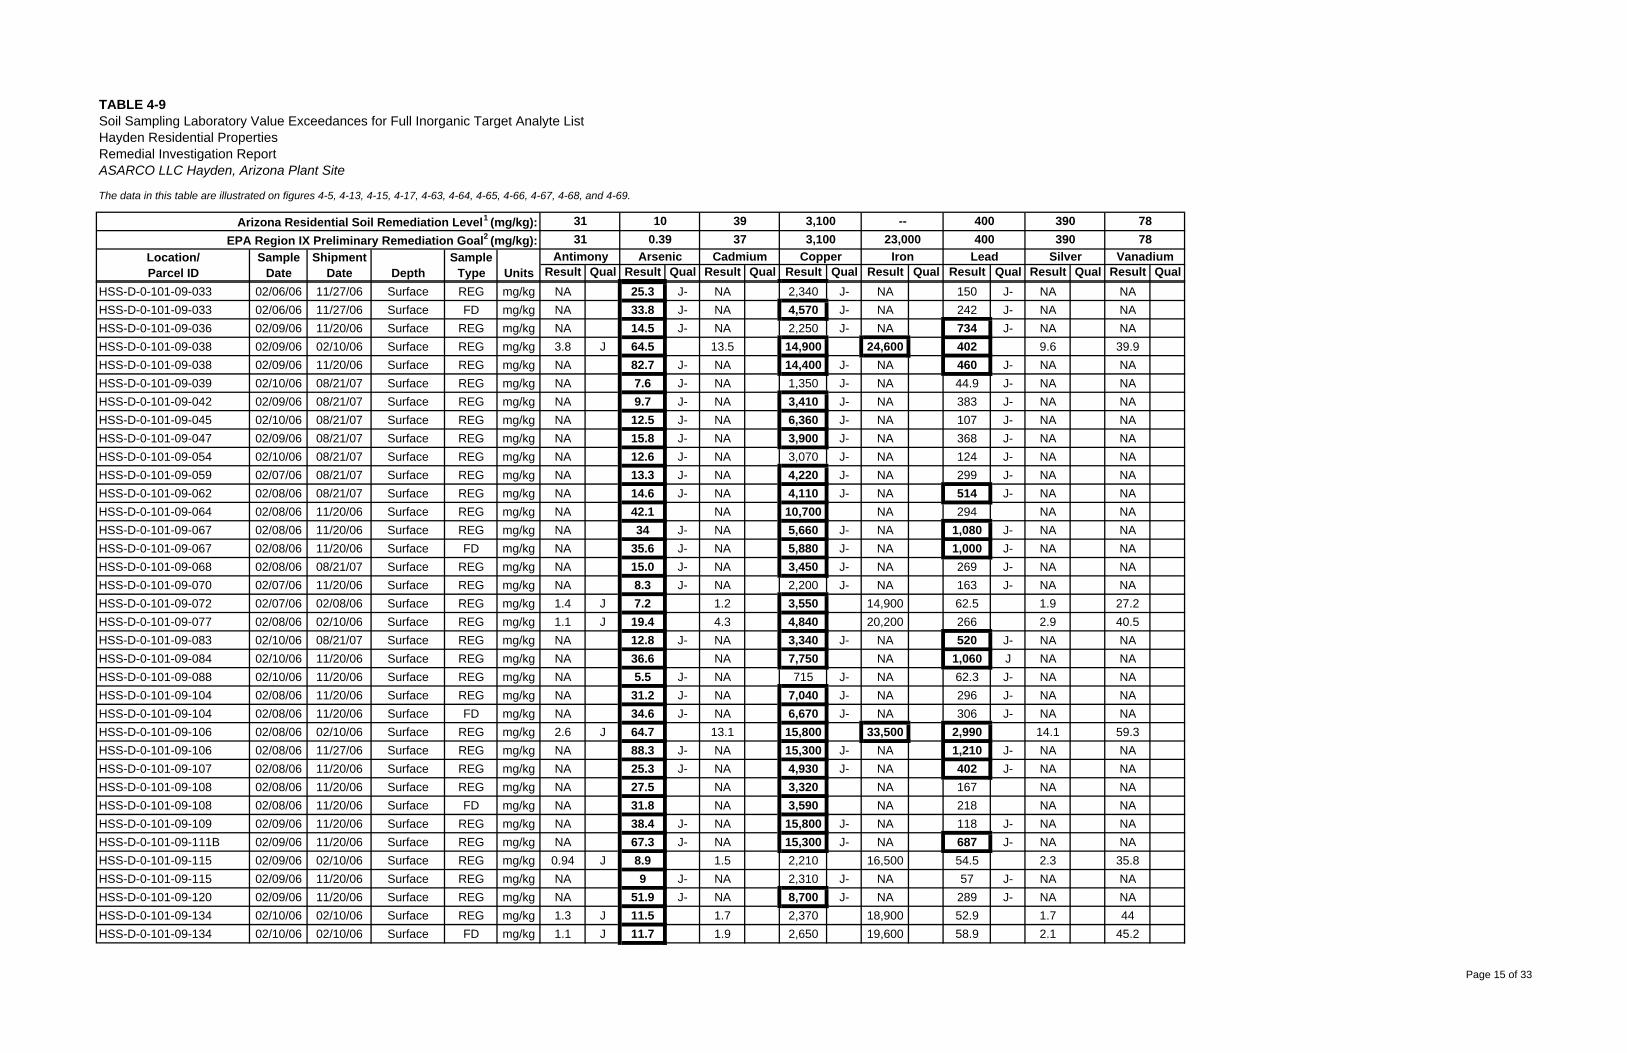
The data in this table are illustrated on figures 4-5, 4-13, 4-15, 4-17, 4-63, 4-64, 4-65, 4-66, 4-67, 4-68, and 4-69.
Result Qual Result Qual Result Qual Result Qual Result Qual Result Qual Result Qual Result Qual
TABLE 4-9
Depth
Soil Sampling Laboratory Value Exceedances for Full Inorganic Target Analyte ListHayden Residential PropertiesRemedial Investigation ReportASARCO LLC Hayden, Arizona Plant Site
Location/Parcel ID
31
ShipmentDate Units
Arizona Residential Soil Remediation Level1 (mg/kg):EPA Region IX Preliminary Remediation Goal2 (mg/kg):
SampleType
SampleDate
10
Antimony Arsenic31 0.39
3937
Cadmium
3,1003,100
Copper
--23,000
Iron
400400
Lead
390390
Silver
7878
Vanadium
HSS-D-0-101-09-033 02/06/06 11/27/06 Surface REG mg/kg NA 25.3 J- NA 2,340 J- NA 150 J- NA NAHSS-D-0-101-09-033 02/06/06 11/27/06 Surface FD mg/kg NA 33.8 J- NA 4,570 J- NA 242 J- NA NAHSS-D-0-101-09-036 02/09/06 11/20/06 Surface REG mg/kg NA 14.5 J- NA 2,250 J- NA 734 J- NA NAHSS-D-0-101-09-038 02/09/06 02/10/06 Surface REG mg/kg 3.8 J 64.5 13.5 14,900 24,600 402 9.6 39.9HSS-D-0-101-09-038 02/09/06 11/20/06 Surface REG mg/kg NA 82.7 J- NA 14,400 J- NA 460 J- NA NAHSS-D-0-101-09-039 02/10/06 08/21/07 Surface REG mg/kg NA 7.6 J- NA 1,350 J- NA 44.9 J- NA NAHSS-D-0-101-09-042 02/09/06 08/21/07 Surface REG mg/kg NA 9.7 J- NA 3,410 J- NA 383 J- NA NAHSS-D-0-101-09-045 02/10/06 08/21/07 Surface REG mg/kg NA 12.5 J- NA 6,360 J- NA 107 J- NA NAHSS-D-0-101-09-047 02/09/06 08/21/07 Surface REG mg/kg NA 15.8 J- NA 3,900 J- NA 368 J- NA NAHSS-D-0-101-09-054 02/10/06 08/21/07 Surface REG mg/kg NA 12.6 J- NA 3,070 J- NA 124 J- NA NAHSS-D-0-101-09-059 02/07/06 08/21/07 Surface REG mg/kg NA 13.3 J- NA 4,220 J- NA 299 J- NA NAHSS-D-0-101-09-062 02/08/06 08/21/07 Surface REG mg/kg NA 14.6 J- NA 4,110 J- NA 514 J- NA NAHSS-D-0-101-09-064 02/08/06 11/20/06 Surface REG mg/kg NA 42.1 NA 10,700 NA 294 NA NAHSS-D-0-101-09-067 02/08/06 11/20/06 Surface REG mg/kg NA 34 J- NA 5,660 J- NA 1,080 J- NA NAHSS-D-0-101-09-067 02/08/06 11/20/06 Surface FD mg/kg NA 35.6 J- NA 5,880 J- NA 1,000 J- NA NAHSS-D-0-101-09-068 02/08/06 08/21/07 Surface REG mg/kg NA 15.0 J- NA 3,450 J- NA 269 J- NA NAHSS-D-0-101-09-070 02/07/06 11/20/06 Surface REG mg/kg NA 8.3 J- NA 2,200 J- NA 163 J- NA NAHSS-D-0-101-09-072 02/07/06 02/08/06 Surface REG mg/kg 1.4 J 7.2 1.2 3,550 14,900 62.5 1.9 27.2HSS-D-0-101-09-077 02/08/06 02/10/06 Surface REG mg/kg 1.1 J 19.4 4.3 4,840 20,200 266 2.9 40.5HSS-D-0-101-09-083 02/10/06 08/21/07 Surface REG mg/kg NA 12.8 J- NA 3,340 J- NA 520 J- NA NAHSS-D-0-101-09-084 02/10/06 11/20/06 Surface REG mg/kg NA 36.6 NA 7,750 NA 1,060 J NA NAHSS-D-0-101-09-088 02/10/06 11/20/06 Surface REG mg/kg NA 5.5 J- NA 715 J- NA 62.3 J- NA NAHSS-D-0-101-09-104 02/08/06 11/20/06 Surface REG mg/kg NA 31.2 J- NA 7,040 J- NA 296 J- NA NAHSS-D-0-101-09-104 02/08/06 11/20/06 Surface FD mg/kg NA 34.6 J- NA 6,670 J- NA 306 J- NA NAHSS-D-0-101-09-106 02/08/06 02/10/06 Surface REG mg/kg 2.6 J 64.7 13.1 15,800 33,500 2,990 14.1 59.3HSS-D-0-101-09-106 02/08/06 11/27/06 Surface REG mg/kg NA 88.3 J- NA 15,300 J- NA 1,210 J- NA NAHSS-D-0-101-09-107 02/08/06 11/20/06 Surface REG mg/kg NA 25.3 J- NA 4,930 J- NA 402 J- NA NAHSS-D-0-101-09-108 02/08/06 11/20/06 Surface REG mg/kg NA 27.5 NA 3,320 NA 167 NA NAHSS-D-0-101-09-108 02/08/06 11/20/06 Surface FD mg/kg NA 31.8 NA 3,590 NA 218 NA NAHSS-D-0-101-09-109 02/09/06 11/20/06 Surface REG mg/kg NA 38.4 J- NA 15,800 J- NA 118 J- NA NAHSS-D-0-101-09-111B 02/09/06 11/20/06 Surface REG mg/kg NA 67.3 J- NA 15,300 J- NA 687 J- NA NAHSS-D-0-101-09-115 02/09/06 02/10/06 Surface REG mg/kg 0.94 J 8.9 1.5 2,210 16,500 54.5 2.3 35.8HSS-D-0-101-09-115 02/09/06 11/20/06 Surface REG mg/kg NA 9 J- NA 2,310 J- NA 57 J- NA NAHSS-D-0-101-09-120 02/09/06 11/20/06 Surface REG mg/kg NA 51.9 J- NA 8,700 J- NA 289 J- NA NAHSS-D-0-101-09-134 02/10/06 02/10/06 Surface REG mg/kg 1.3 J 11.5 1.7 2,370 18,900 52.9 1.7 44HSS-D-0-101-09-134 02/10/06 02/10/06 Surface FD mg/kg 1.1 J 11.7 1.9 2,650 19,600 58.9 2.1 45.2
Page 15 of 33
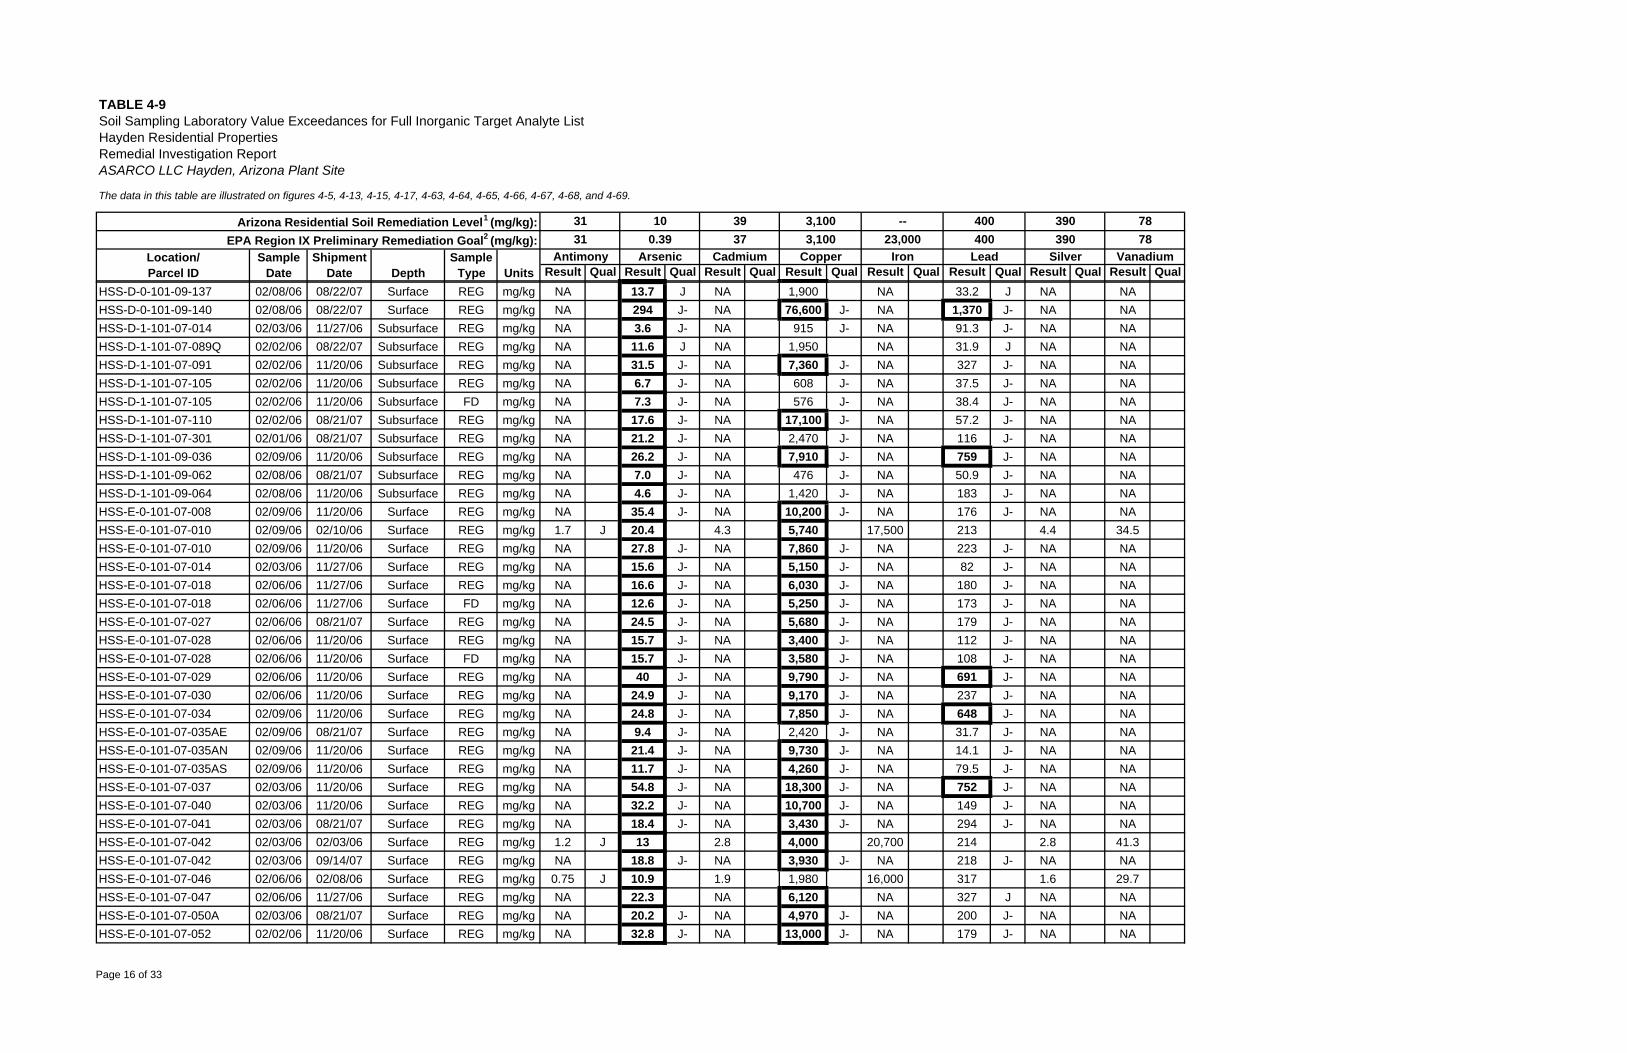
The data in this table are illustrated on figures 4-5, 4-13, 4-15, 4-17, 4-63, 4-64, 4-65, 4-66, 4-67, 4-68, and 4-69.
Result Qual Result Qual Result Qual Result Qual Result Qual Result Qual Result Qual Result Qual
TABLE 4-9
Depth
Soil Sampling Laboratory Value Exceedances for Full Inorganic Target Analyte ListHayden Residential PropertiesRemedial Investigation ReportASARCO LLC Hayden, Arizona Plant Site
Location/Parcel ID
31
ShipmentDate Units
Arizona Residential Soil Remediation Level1 (mg/kg):EPA Region IX Preliminary Remediation Goal2 (mg/kg):
SampleType
SampleDate
10
Antimony Arsenic31 0.39
3937
Cadmium
3,1003,100
Copper
--23,000
Iron
400400
Lead
390390
Silver
7878
Vanadium
HSS-D-0-101-09-137 02/08/06 08/22/07 Surface REG mg/kg NA 13.7 J NA 1,900 NA 33.2 J NA NAHSS-D-0-101-09-140 02/08/06 08/22/07 Surface REG mg/kg NA 294 J- NA 76,600 J- NA 1,370 J- NA NAHSS-D-1-101-07-014 02/03/06 11/27/06 Subsurface REG mg/kg NA 3.6 J- NA 915 J- NA 91.3 J- NA NAHSS-D-1-101-07-089Q 02/02/06 08/22/07 Subsurface REG mg/kg NA 11.6 J NA 1,950 NA 31.9 J NA NAHSS-D-1-101-07-091 02/02/06 11/20/06 Subsurface REG mg/kg NA 31.5 J- NA 7,360 J- NA 327 J- NA NAHSS-D-1-101-07-105 02/02/06 11/20/06 Subsurface REG mg/kg NA 6.7 J- NA 608 J- NA 37.5 J- NA NAHSS-D-1-101-07-105 02/02/06 11/20/06 Subsurface FD mg/kg NA 7.3 J- NA 576 J- NA 38.4 J- NA NAHSS-D-1-101-07-110 02/02/06 08/21/07 Subsurface REG mg/kg NA 17.6 J- NA 17,100 J- NA 57.2 J- NA NAHSS-D-1-101-07-301 02/01/06 08/21/07 Subsurface REG mg/kg NA 21.2 J- NA 2,470 J- NA 116 J- NA NAHSS-D-1-101-09-036 02/09/06 11/20/06 Subsurface REG mg/kg NA 26.2 J- NA 7,910 J- NA 759 J- NA NAHSS-D-1-101-09-062 02/08/06 08/21/07 Subsurface REG mg/kg NA 7.0 J- NA 476 J- NA 50.9 J- NA NAHSS-D-1-101-09-064 02/08/06 11/20/06 Subsurface REG mg/kg NA 4.6 J- NA 1,420 J- NA 183 J- NA NAHSS-E-0-101-07-008 02/09/06 11/20/06 Surface REG mg/kg NA 35.4 J- NA 10,200 J- NA 176 J- NA NAHSS-E-0-101-07-010 02/09/06 02/10/06 Surface REG mg/kg 1.7 J 20.4 4.3 5,740 17,500 213 4.4 34.5HSS-E-0-101-07-010 02/09/06 11/20/06 Surface REG mg/kg NA 27.8 J- NA 7,860 J- NA 223 J- NA NAHSS-E-0-101-07-014 02/03/06 11/27/06 Surface REG mg/kg NA 15.6 J- NA 5,150 J- NA 82 J- NA NAHSS-E-0-101-07-018 02/06/06 11/27/06 Surface REG mg/kg NA 16.6 J- NA 6,030 J- NA 180 J- NA NAHSS-E-0-101-07-018 02/06/06 11/27/06 Surface FD mg/kg NA 12.6 J- NA 5,250 J- NA 173 J- NA NAHSS-E-0-101-07-027 02/06/06 08/21/07 Surface REG mg/kg NA 24.5 J- NA 5,680 J- NA 179 J- NA NAHSS-E-0-101-07-028 02/06/06 11/20/06 Surface REG mg/kg NA 15.7 J- NA 3,400 J- NA 112 J- NA NAHSS-E-0-101-07-028 02/06/06 11/20/06 Surface FD mg/kg NA 15.7 J- NA 3,580 J- NA 108 J- NA NAHSS-E-0-101-07-029 02/06/06 11/20/06 Surface REG mg/kg NA 40 J- NA 9,790 J- NA 691 J- NA NAHSS-E-0-101-07-030 02/06/06 11/20/06 Surface REG mg/kg NA 24.9 J- NA 9,170 J- NA 237 J- NA NAHSS-E-0-101-07-034 02/09/06 11/20/06 Surface REG mg/kg NA 24.8 J- NA 7,850 J- NA 648 J- NA NAHSS-E-0-101-07-035AE 02/09/06 08/21/07 Surface REG mg/kg NA 9.4 J- NA 2,420 J- NA 31.7 J- NA NAHSS-E-0-101-07-035AN 02/09/06 11/20/06 Surface REG mg/kg NA 21.4 J- NA 9,730 J- NA 14.1 J- NA NAHSS-E-0-101-07-035AS 02/09/06 11/20/06 Surface REG mg/kg NA 11.7 J- NA 4,260 J- NA 79.5 J- NA NAHSS-E-0-101-07-037 02/03/06 11/20/06 Surface REG mg/kg NA 54.8 J- NA 18,300 J- NA 752 J- NA NAHSS-E-0-101-07-040 02/03/06 11/20/06 Surface REG mg/kg NA 32.2 J- NA 10,700 J- NA 149 J- NA NAHSS-E-0-101-07-041 02/03/06 08/21/07 Surface REG mg/kg NA 18.4 J- NA 3,430 J- NA 294 J- NA NAHSS-E-0-101-07-042 02/03/06 02/03/06 Surface REG mg/kg 1.2 J 13 2.8 4,000 20,700 214 2.8 41.3HSS-E-0-101-07-042 02/03/06 09/14/07 Surface REG mg/kg NA 18.8 J- NA 3,930 J- NA 218 J- NA NAHSS-E-0-101-07-046 02/06/06 02/08/06 Surface REG mg/kg 0.75 J 10.9 1.9 1,980 16,000 317 1.6 29.7HSS-E-0-101-07-047 02/06/06 11/27/06 Surface REG mg/kg NA 22.3 NA 6,120 NA 327 J NA NAHSS-E-0-101-07-050A 02/03/06 08/21/07 Surface REG mg/kg NA 20.2 J- NA 4,970 J- NA 200 J- NA NAHSS-E-0-101-07-052 02/02/06 11/20/06 Surface REG mg/kg NA 32.8 J- NA 13,000 J- NA 179 J- NA NA
Page 16 of 33
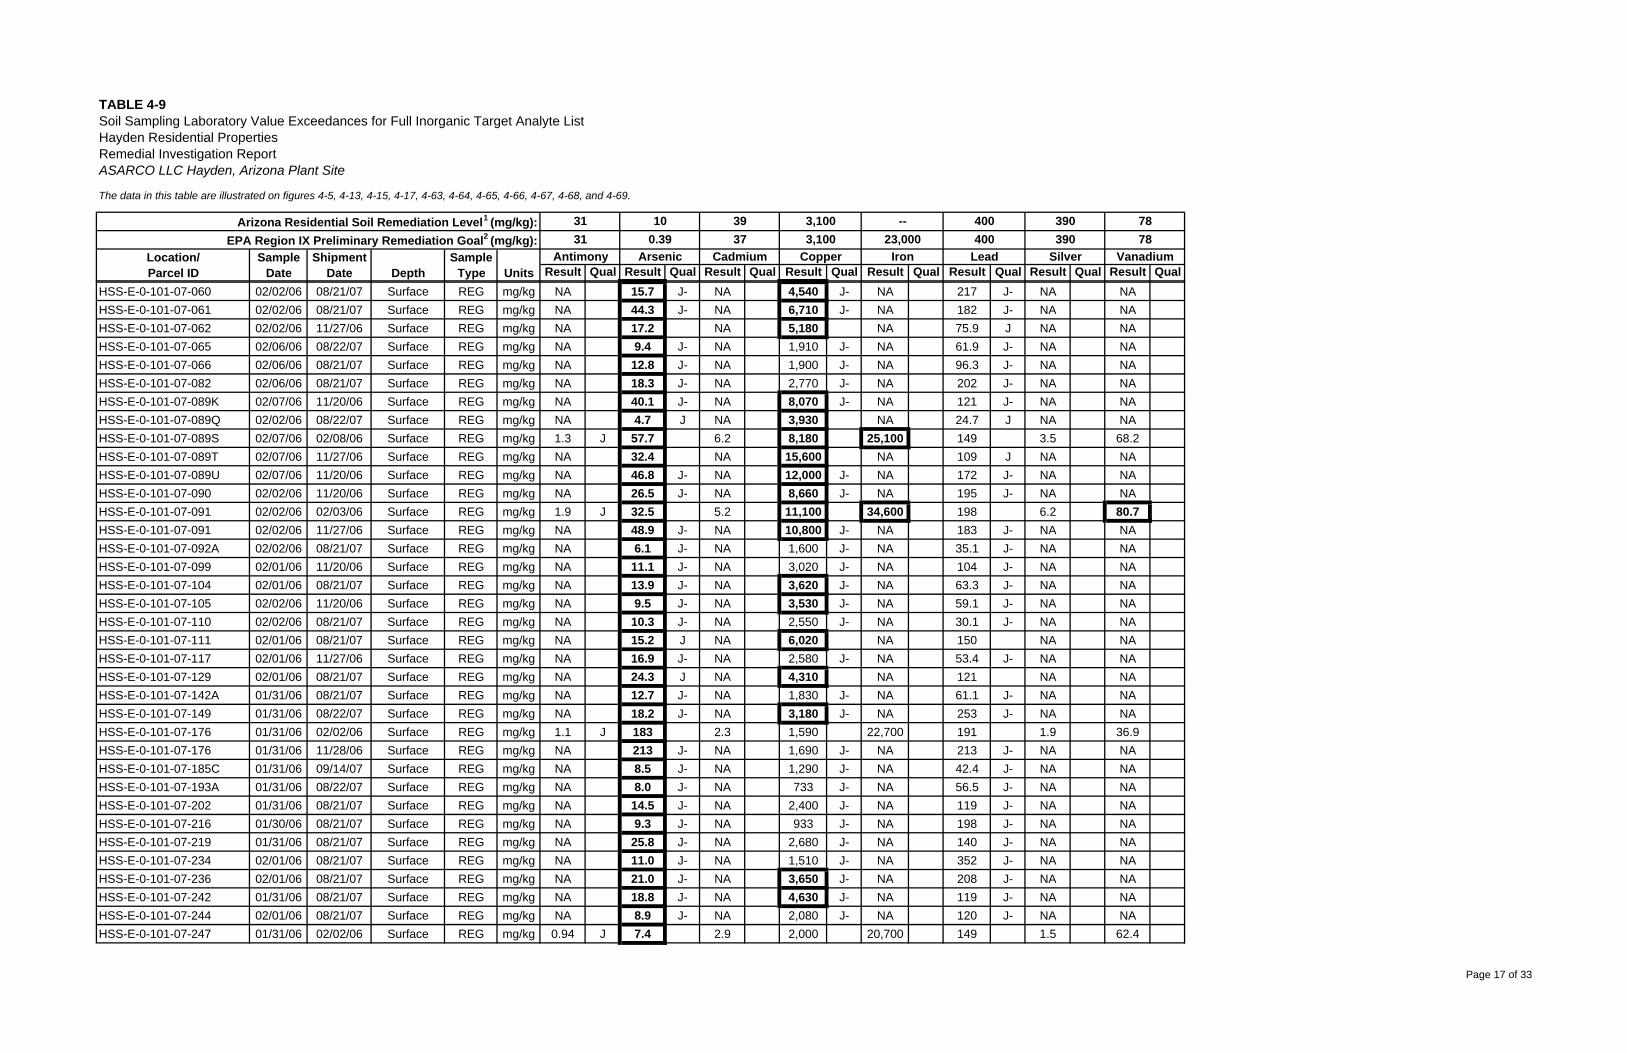
The data in this table are illustrated on figures 4-5, 4-13, 4-15, 4-17, 4-63, 4-64, 4-65, 4-66, 4-67, 4-68, and 4-69.
Result Qual Result Qual Result Qual Result Qual Result Qual Result Qual Result Qual Result Qual
TABLE 4-9
Depth
Soil Sampling Laboratory Value Exceedances for Full Inorganic Target Analyte ListHayden Residential PropertiesRemedial Investigation ReportASARCO LLC Hayden, Arizona Plant Site
Location/Parcel ID
31
ShipmentDate Units
Arizona Residential Soil Remediation Level1 (mg/kg):EPA Region IX Preliminary Remediation Goal2 (mg/kg):
SampleType
SampleDate
10
Antimony Arsenic31 0.39
3937
Cadmium
3,1003,100
Copper
--23,000
Iron
400400
Lead
390390
Silver
7878
Vanadium
HSS-E-0-101-07-060 02/02/06 08/21/07 Surface REG mg/kg NA 15.7 J- NA 4,540 J- NA 217 J- NA NAHSS-E-0-101-07-061 02/02/06 08/21/07 Surface REG mg/kg NA 44.3 J- NA 6,710 J- NA 182 J- NA NAHSS-E-0-101-07-062 02/02/06 11/27/06 Surface REG mg/kg NA 17.2 NA 5,180 NA 75.9 J NA NAHSS-E-0-101-07-065 02/06/06 08/22/07 Surface REG mg/kg NA 9.4 J- NA 1,910 J- NA 61.9 J- NA NAHSS-E-0-101-07-066 02/06/06 08/21/07 Surface REG mg/kg NA 12.8 J- NA 1,900 J- NA 96.3 J- NA NAHSS-E-0-101-07-082 02/06/06 08/21/07 Surface REG mg/kg NA 18.3 J- NA 2,770 J- NA 202 J- NA NAHSS-E-0-101-07-089K 02/07/06 11/20/06 Surface REG mg/kg NA 40.1 J- NA 8,070 J- NA 121 J- NA NAHSS-E-0-101-07-089Q 02/02/06 08/22/07 Surface REG mg/kg NA 4.7 J NA 3,930 NA 24.7 J NA NAHSS-E-0-101-07-089S 02/07/06 02/08/06 Surface REG mg/kg 1.3 J 57.7 6.2 8,180 25,100 149 3.5 68.2HSS-E-0-101-07-089T 02/07/06 11/27/06 Surface REG mg/kg NA 32.4 NA 15,600 NA 109 J NA NAHSS-E-0-101-07-089U 02/07/06 11/20/06 Surface REG mg/kg NA 46.8 J- NA 12,000 J- NA 172 J- NA NAHSS-E-0-101-07-090 02/02/06 11/20/06 Surface REG mg/kg NA 26.5 J- NA 8,660 J- NA 195 J- NA NAHSS-E-0-101-07-091 02/02/06 02/03/06 Surface REG mg/kg 1.9 J 32.5 5.2 11,100 34,600 198 6.2 80.7HSS-E-0-101-07-091 02/02/06 11/27/06 Surface REG mg/kg NA 48.9 J- NA 10,800 J- NA 183 J- NA NAHSS-E-0-101-07-092A 02/02/06 08/21/07 Surface REG mg/kg NA 6.1 J- NA 1,600 J- NA 35.1 J- NA NAHSS-E-0-101-07-099 02/01/06 11/20/06 Surface REG mg/kg NA 11.1 J- NA 3,020 J- NA 104 J- NA NAHSS-E-0-101-07-104 02/01/06 08/21/07 Surface REG mg/kg NA 13.9 J- NA 3,620 J- NA 63.3 J- NA NAHSS-E-0-101-07-105 02/02/06 11/20/06 Surface REG mg/kg NA 9.5 J- NA 3,530 J- NA 59.1 J- NA NAHSS-E-0-101-07-110 02/02/06 08/21/07 Surface REG mg/kg NA 10.3 J- NA 2,550 J- NA 30.1 J- NA NAHSS-E-0-101-07-111 02/01/06 08/21/07 Surface REG mg/kg NA 15.2 J NA 6,020 NA 150 NA NAHSS-E-0-101-07-117 02/01/06 11/27/06 Surface REG mg/kg NA 16.9 J- NA 2,580 J- NA 53.4 J- NA NAHSS-E-0-101-07-129 02/01/06 08/21/07 Surface REG mg/kg NA 24.3 J NA 4,310 NA 121 NA NAHSS-E-0-101-07-142A 01/31/06 08/21/07 Surface REG mg/kg NA 12.7 J- NA 1,830 J- NA 61.1 J- NA NAHSS-E-0-101-07-149 01/31/06 08/22/07 Surface REG mg/kg NA 18.2 J- NA 3,180 J- NA 253 J- NA NAHSS-E-0-101-07-176 01/31/06 02/02/06 Surface REG mg/kg 1.1 J 183 2.3 1,590 22,700 191 1.9 36.9HSS-E-0-101-07-176 01/31/06 11/28/06 Surface REG mg/kg NA 213 J- NA 1,690 J- NA 213 J- NA NAHSS-E-0-101-07-185C 01/31/06 09/14/07 Surface REG mg/kg NA 8.5 J- NA 1,290 J- NA 42.4 J- NA NAHSS-E-0-101-07-193A 01/31/06 08/22/07 Surface REG mg/kg NA 8.0 J- NA 733 J- NA 56.5 J- NA NAHSS-E-0-101-07-202 01/31/06 08/21/07 Surface REG mg/kg NA 14.5 J- NA 2,400 J- NA 119 J- NA NAHSS-E-0-101-07-216 01/30/06 08/21/07 Surface REG mg/kg NA 9.3 J- NA 933 J- NA 198 J- NA NAHSS-E-0-101-07-219 01/31/06 08/21/07 Surface REG mg/kg NA 25.8 J- NA 2,680 J- NA 140 J- NA NAHSS-E-0-101-07-234 02/01/06 08/21/07 Surface REG mg/kg NA 11.0 J- NA 1,510 J- NA 352 J- NA NAHSS-E-0-101-07-236 02/01/06 08/21/07 Surface REG mg/kg NA 21.0 J- NA 3,650 J- NA 208 J- NA NAHSS-E-0-101-07-242 01/31/06 08/21/07 Surface REG mg/kg NA 18.8 J- NA 4,630 J- NA 119 J- NA NAHSS-E-0-101-07-244 02/01/06 08/21/07 Surface REG mg/kg NA 8.9 J- NA 2,080 J- NA 120 J- NA NAHSS-E-0-101-07-247 01/31/06 02/02/06 Surface REG mg/kg 0.94 J 7.4 2.9 2,000 20,700 149 1.5 62.4
Page 17 of 33
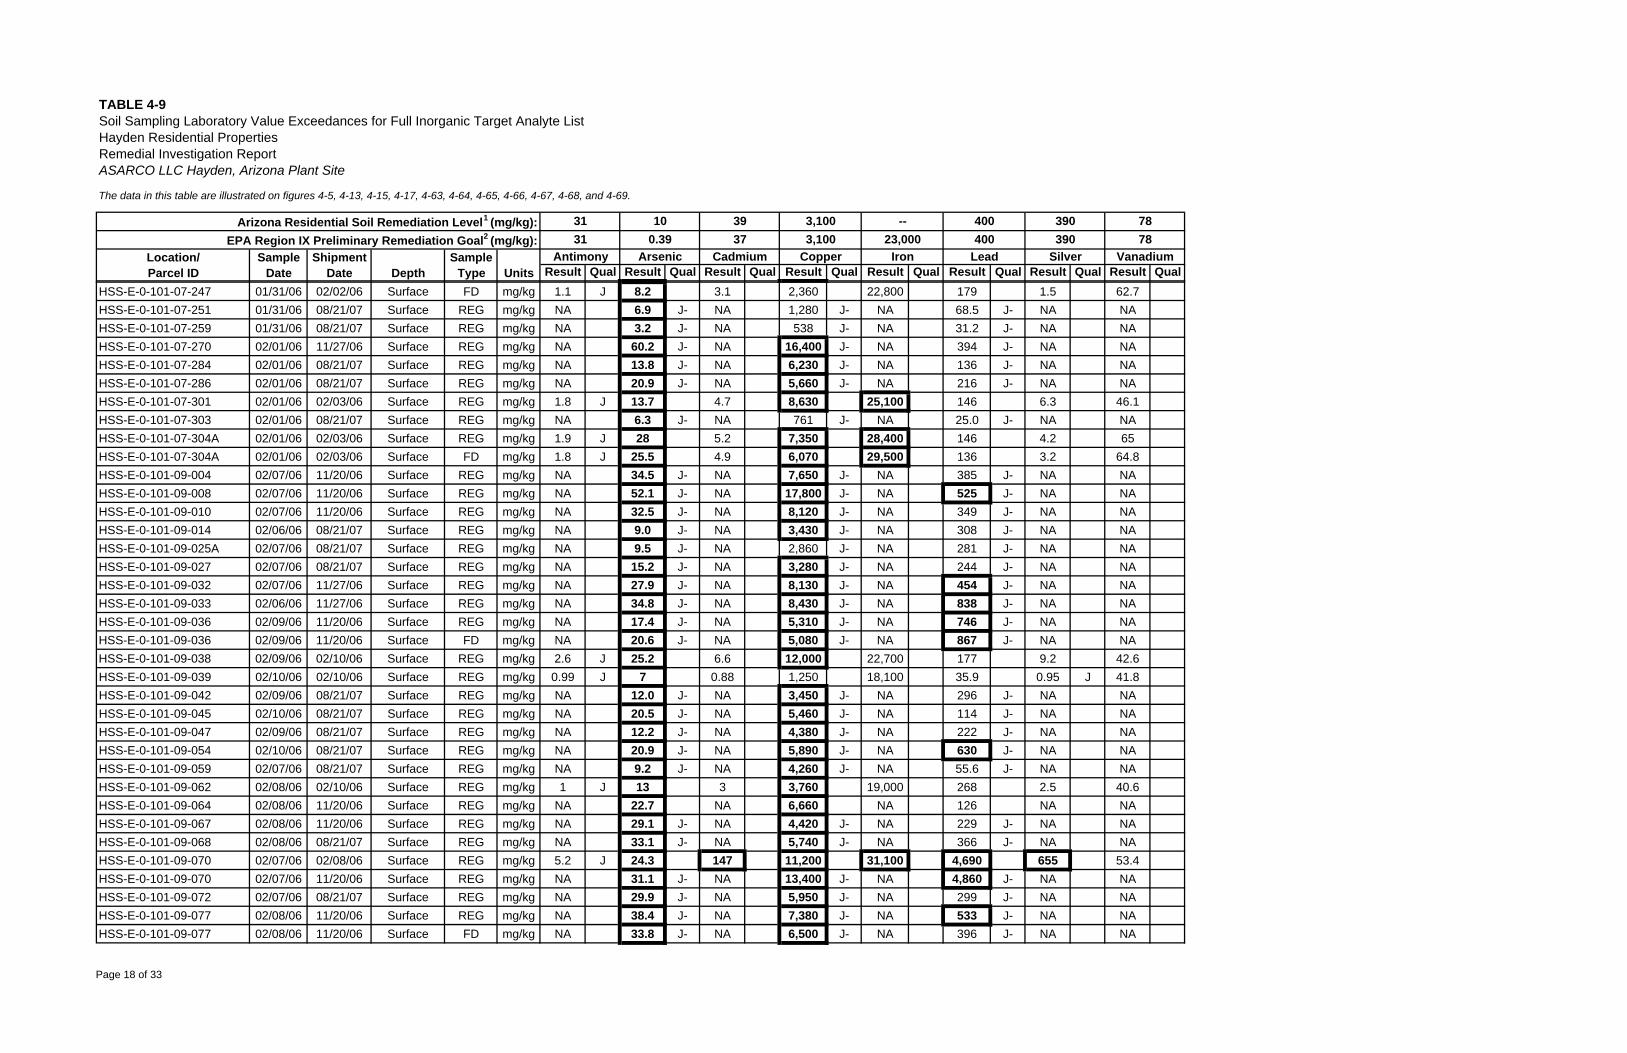
The data in this table are illustrated on figures 4-5, 4-13, 4-15, 4-17, 4-63, 4-64, 4-65, 4-66, 4-67, 4-68, and 4-69.
Result Qual Result Qual Result Qual Result Qual Result Qual Result Qual Result Qual Result Qual
TABLE 4-9
Depth
Soil Sampling Laboratory Value Exceedances for Full Inorganic Target Analyte ListHayden Residential PropertiesRemedial Investigation ReportASARCO LLC Hayden, Arizona Plant Site
Location/Parcel ID
31
ShipmentDate Units
Arizona Residential Soil Remediation Level1 (mg/kg):EPA Region IX Preliminary Remediation Goal2 (mg/kg):
SampleType
SampleDate
10
Antimony Arsenic31 0.39
3937
Cadmium
3,1003,100
Copper
--23,000
Iron
400400
Lead
390390
Silver
7878
Vanadium
HSS-E-0-101-07-247 01/31/06 02/02/06 Surface FD mg/kg 1.1 J 8.2 3.1 2,360 22,800 179 1.5 62.7HSS-E-0-101-07-251 01/31/06 08/21/07 Surface REG mg/kg NA 6.9 J- NA 1,280 J- NA 68.5 J- NA NAHSS-E-0-101-07-259 01/31/06 08/21/07 Surface REG mg/kg NA 3.2 J- NA 538 J- NA 31.2 J- NA NAHSS-E-0-101-07-270 02/01/06 11/27/06 Surface REG mg/kg NA 60.2 J- NA 16,400 J- NA 394 J- NA NAHSS-E-0-101-07-284 02/01/06 08/21/07 Surface REG mg/kg NA 13.8 J- NA 6,230 J- NA 136 J- NA NAHSS-E-0-101-07-286 02/01/06 08/21/07 Surface REG mg/kg NA 20.9 J- NA 5,660 J- NA 216 J- NA NAHSS-E-0-101-07-301 02/01/06 02/03/06 Surface REG mg/kg 1.8 J 13.7 4.7 8,630 25,100 146 6.3 46.1HSS-E-0-101-07-303 02/01/06 08/21/07 Surface REG mg/kg NA 6.3 J- NA 761 J- NA 25.0 J- NA NAHSS-E-0-101-07-304A 02/01/06 02/03/06 Surface REG mg/kg 1.9 J 28 5.2 7,350 28,400 146 4.2 65HSS-E-0-101-07-304A 02/01/06 02/03/06 Surface FD mg/kg 1.8 J 25.5 4.9 6,070 29,500 136 3.2 64.8HSS-E-0-101-09-004 02/07/06 11/20/06 Surface REG mg/kg NA 34.5 J- NA 7,650 J- NA 385 J- NA NAHSS-E-0-101-09-008 02/07/06 11/20/06 Surface REG mg/kg NA 52.1 J- NA 17,800 J- NA 525 J- NA NAHSS-E-0-101-09-010 02/07/06 11/20/06 Surface REG mg/kg NA 32.5 J- NA 8,120 J- NA 349 J- NA NAHSS-E-0-101-09-014 02/06/06 08/21/07 Surface REG mg/kg NA 9.0 J- NA 3,430 J- NA 308 J- NA NAHSS-E-0-101-09-025A 02/07/06 08/21/07 Surface REG mg/kg NA 9.5 J- NA 2,860 J- NA 281 J- NA NAHSS-E-0-101-09-027 02/07/06 08/21/07 Surface REG mg/kg NA 15.2 J- NA 3,280 J- NA 244 J- NA NAHSS-E-0-101-09-032 02/07/06 11/27/06 Surface REG mg/kg NA 27.9 J- NA 8,130 J- NA 454 J- NA NAHSS-E-0-101-09-033 02/06/06 11/27/06 Surface REG mg/kg NA 34.8 J- NA 8,430 J- NA 838 J- NA NAHSS-E-0-101-09-036 02/09/06 11/20/06 Surface REG mg/kg NA 17.4 J- NA 5,310 J- NA 746 J- NA NAHSS-E-0-101-09-036 02/09/06 11/20/06 Surface FD mg/kg NA 20.6 J- NA 5,080 J- NA 867 J- NA NAHSS-E-0-101-09-038 02/09/06 02/10/06 Surface REG mg/kg 2.6 J 25.2 6.6 12,000 22,700 177 9.2 42.6HSS-E-0-101-09-039 02/10/06 02/10/06 Surface REG mg/kg 0.99 J 7 0.88 1,250 18,100 35.9 0.95 J 41.8HSS-E-0-101-09-042 02/09/06 08/21/07 Surface REG mg/kg NA 12.0 J- NA 3,450 J- NA 296 J- NA NAHSS-E-0-101-09-045 02/10/06 08/21/07 Surface REG mg/kg NA 20.5 J- NA 5,460 J- NA 114 J- NA NAHSS-E-0-101-09-047 02/09/06 08/21/07 Surface REG mg/kg NA 12.2 J- NA 4,380 J- NA 222 J- NA NAHSS-E-0-101-09-054 02/10/06 08/21/07 Surface REG mg/kg NA 20.9 J- NA 5,890 J- NA 630 J- NA NAHSS-E-0-101-09-059 02/07/06 08/21/07 Surface REG mg/kg NA 9.2 J- NA 4,260 J- NA 55.6 J- NA NAHSS-E-0-101-09-062 02/08/06 02/10/06 Surface REG mg/kg 1 J 13 3 3,760 19,000 268 2.5 40.6HSS-E-0-101-09-064 02/08/06 11/20/06 Surface REG mg/kg NA 22.7 NA 6,660 NA 126 NA NAHSS-E-0-101-09-067 02/08/06 11/20/06 Surface REG mg/kg NA 29.1 J- NA 4,420 J- NA 229 J- NA NAHSS-E-0-101-09-068 02/08/06 08/21/07 Surface REG mg/kg NA 33.1 J- NA 5,740 J- NA 366 J- NA NAHSS-E-0-101-09-070 02/07/06 02/08/06 Surface REG mg/kg 5.2 J 24.3 147 11,200 31,100 4,690 655 53.4HSS-E-0-101-09-070 02/07/06 11/20/06 Surface REG mg/kg NA 31.1 J- NA 13,400 J- NA 4,860 J- NA NAHSS-E-0-101-09-072 02/07/06 08/21/07 Surface REG mg/kg NA 29.9 J- NA 5,950 J- NA 299 J- NA NAHSS-E-0-101-09-077 02/08/06 11/20/06 Surface REG mg/kg NA 38.4 J- NA 7,380 J- NA 533 J- NA NAHSS-E-0-101-09-077 02/08/06 11/20/06 Surface FD mg/kg NA 33.8 J- NA 6,500 J- NA 396 J- NA NA
Page 18 of 33
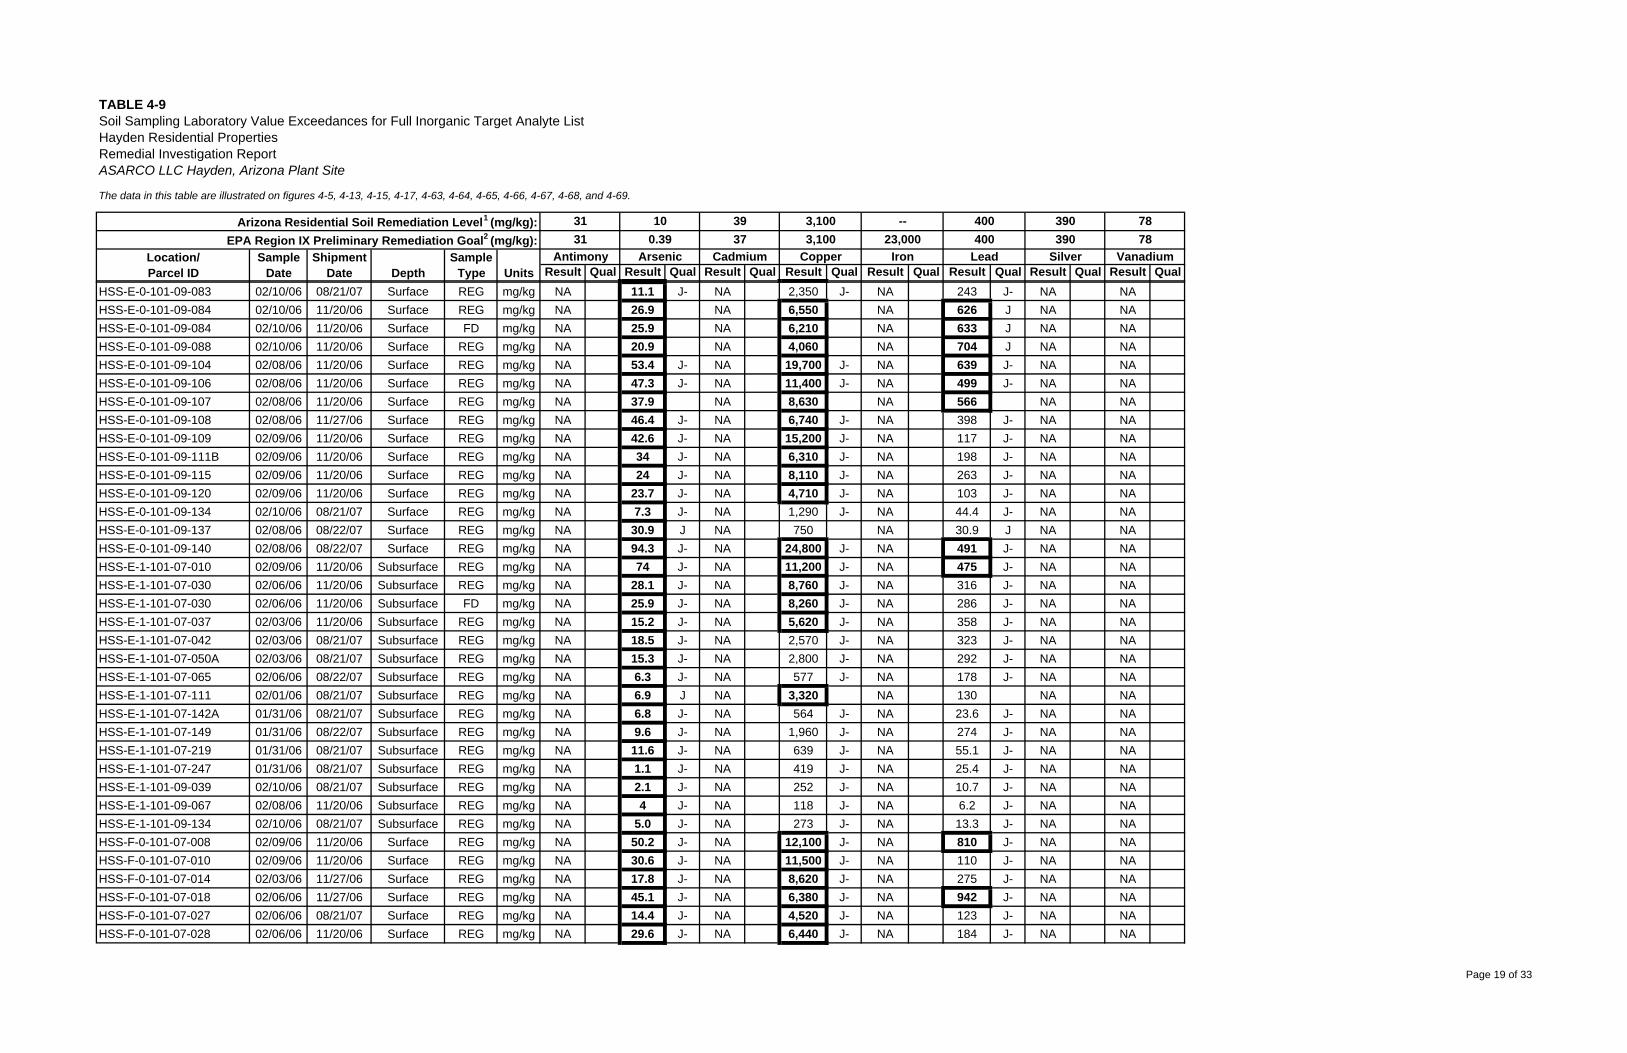
The data in this table are illustrated on figures 4-5, 4-13, 4-15, 4-17, 4-63, 4-64, 4-65, 4-66, 4-67, 4-68, and 4-69.
Result Qual Result Qual Result Qual Result Qual Result Qual Result Qual Result Qual Result Qual
TABLE 4-9
Depth
Soil Sampling Laboratory Value Exceedances for Full Inorganic Target Analyte ListHayden Residential PropertiesRemedial Investigation ReportASARCO LLC Hayden, Arizona Plant Site
Location/Parcel ID
31
ShipmentDate Units
Arizona Residential Soil Remediation Level1 (mg/kg):EPA Region IX Preliminary Remediation Goal2 (mg/kg):
SampleType
SampleDate
10
Antimony Arsenic31 0.39
3937
Cadmium
3,1003,100
Copper
--23,000
Iron
400400
Lead
390390
Silver
7878
Vanadium
HSS-E-0-101-09-083 02/10/06 08/21/07 Surface REG mg/kg NA 11.1 J- NA 2,350 J- NA 243 J- NA NAHSS-E-0-101-09-084 02/10/06 11/20/06 Surface REG mg/kg NA 26.9 NA 6,550 NA 626 J NA NAHSS-E-0-101-09-084 02/10/06 11/20/06 Surface FD mg/kg NA 25.9 NA 6,210 NA 633 J NA NAHSS-E-0-101-09-088 02/10/06 11/20/06 Surface REG mg/kg NA 20.9 NA 4,060 NA 704 J NA NAHSS-E-0-101-09-104 02/08/06 11/20/06 Surface REG mg/kg NA 53.4 J- NA 19,700 J- NA 639 J- NA NAHSS-E-0-101-09-106 02/08/06 11/20/06 Surface REG mg/kg NA 47.3 J- NA 11,400 J- NA 499 J- NA NAHSS-E-0-101-09-107 02/08/06 11/20/06 Surface REG mg/kg NA 37.9 NA 8,630 NA 566 NA NAHSS-E-0-101-09-108 02/08/06 11/27/06 Surface REG mg/kg NA 46.4 J- NA 6,740 J- NA 398 J- NA NAHSS-E-0-101-09-109 02/09/06 11/20/06 Surface REG mg/kg NA 42.6 J- NA 15,200 J- NA 117 J- NA NAHSS-E-0-101-09-111B 02/09/06 11/20/06 Surface REG mg/kg NA 34 J- NA 6,310 J- NA 198 J- NA NAHSS-E-0-101-09-115 02/09/06 11/20/06 Surface REG mg/kg NA 24 J- NA 8,110 J- NA 263 J- NA NAHSS-E-0-101-09-120 02/09/06 11/20/06 Surface REG mg/kg NA 23.7 J- NA 4,710 J- NA 103 J- NA NAHSS-E-0-101-09-134 02/10/06 08/21/07 Surface REG mg/kg NA 7.3 J- NA 1,290 J- NA 44.4 J- NA NAHSS-E-0-101-09-137 02/08/06 08/22/07 Surface REG mg/kg NA 30.9 J NA 750 NA 30.9 J NA NAHSS-E-0-101-09-140 02/08/06 08/22/07 Surface REG mg/kg NA 94.3 J- NA 24,800 J- NA 491 J- NA NAHSS-E-1-101-07-010 02/09/06 11/20/06 Subsurface REG mg/kg NA 74 J- NA 11,200 J- NA 475 J- NA NAHSS-E-1-101-07-030 02/06/06 11/20/06 Subsurface REG mg/kg NA 28.1 J- NA 8,760 J- NA 316 J- NA NAHSS-E-1-101-07-030 02/06/06 11/20/06 Subsurface FD mg/kg NA 25.9 J- NA 8,260 J- NA 286 J- NA NAHSS-E-1-101-07-037 02/03/06 11/20/06 Subsurface REG mg/kg NA 15.2 J- NA 5,620 J- NA 358 J- NA NAHSS-E-1-101-07-042 02/03/06 08/21/07 Subsurface REG mg/kg NA 18.5 J- NA 2,570 J- NA 323 J- NA NAHSS-E-1-101-07-050A 02/03/06 08/21/07 Subsurface REG mg/kg NA 15.3 J- NA 2,800 J- NA 292 J- NA NAHSS-E-1-101-07-065 02/06/06 08/22/07 Subsurface REG mg/kg NA 6.3 J- NA 577 J- NA 178 J- NA NAHSS-E-1-101-07-111 02/01/06 08/21/07 Subsurface REG mg/kg NA 6.9 J NA 3,320 NA 130 NA NAHSS-E-1-101-07-142A 01/31/06 08/21/07 Subsurface REG mg/kg NA 6.8 J- NA 564 J- NA 23.6 J- NA NAHSS-E-1-101-07-149 01/31/06 08/22/07 Subsurface REG mg/kg NA 9.6 J- NA 1,960 J- NA 274 J- NA NAHSS-E-1-101-07-219 01/31/06 08/21/07 Subsurface REG mg/kg NA 11.6 J- NA 639 J- NA 55.1 J- NA NAHSS-E-1-101-07-247 01/31/06 08/21/07 Subsurface REG mg/kg NA 1.1 J- NA 419 J- NA 25.4 J- NA NAHSS-E-1-101-09-039 02/10/06 08/21/07 Subsurface REG mg/kg NA 2.1 J- NA 252 J- NA 10.7 J- NA NAHSS-E-1-101-09-067 02/08/06 11/20/06 Subsurface REG mg/kg NA 4 J- NA 118 J- NA 6.2 J- NA NAHSS-E-1-101-09-134 02/10/06 08/21/07 Subsurface REG mg/kg NA 5.0 J- NA 273 J- NA 13.3 J- NA NAHSS-F-0-101-07-008 02/09/06 11/20/06 Surface REG mg/kg NA 50.2 J- NA 12,100 J- NA 810 J- NA NAHSS-F-0-101-07-010 02/09/06 11/20/06 Surface REG mg/kg NA 30.6 J- NA 11,500 J- NA 110 J- NA NAHSS-F-0-101-07-014 02/03/06 11/27/06 Surface REG mg/kg NA 17.8 J- NA 8,620 J- NA 275 J- NA NAHSS-F-0-101-07-018 02/06/06 11/27/06 Surface REG mg/kg NA 45.1 J- NA 6,380 J- NA 942 J- NA NAHSS-F-0-101-07-027 02/06/06 08/21/07 Surface REG mg/kg NA 14.4 J- NA 4,520 J- NA 123 J- NA NAHSS-F-0-101-07-028 02/06/06 11/20/06 Surface REG mg/kg NA 29.6 J- NA 6,440 J- NA 184 J- NA NA
Page 19 of 33
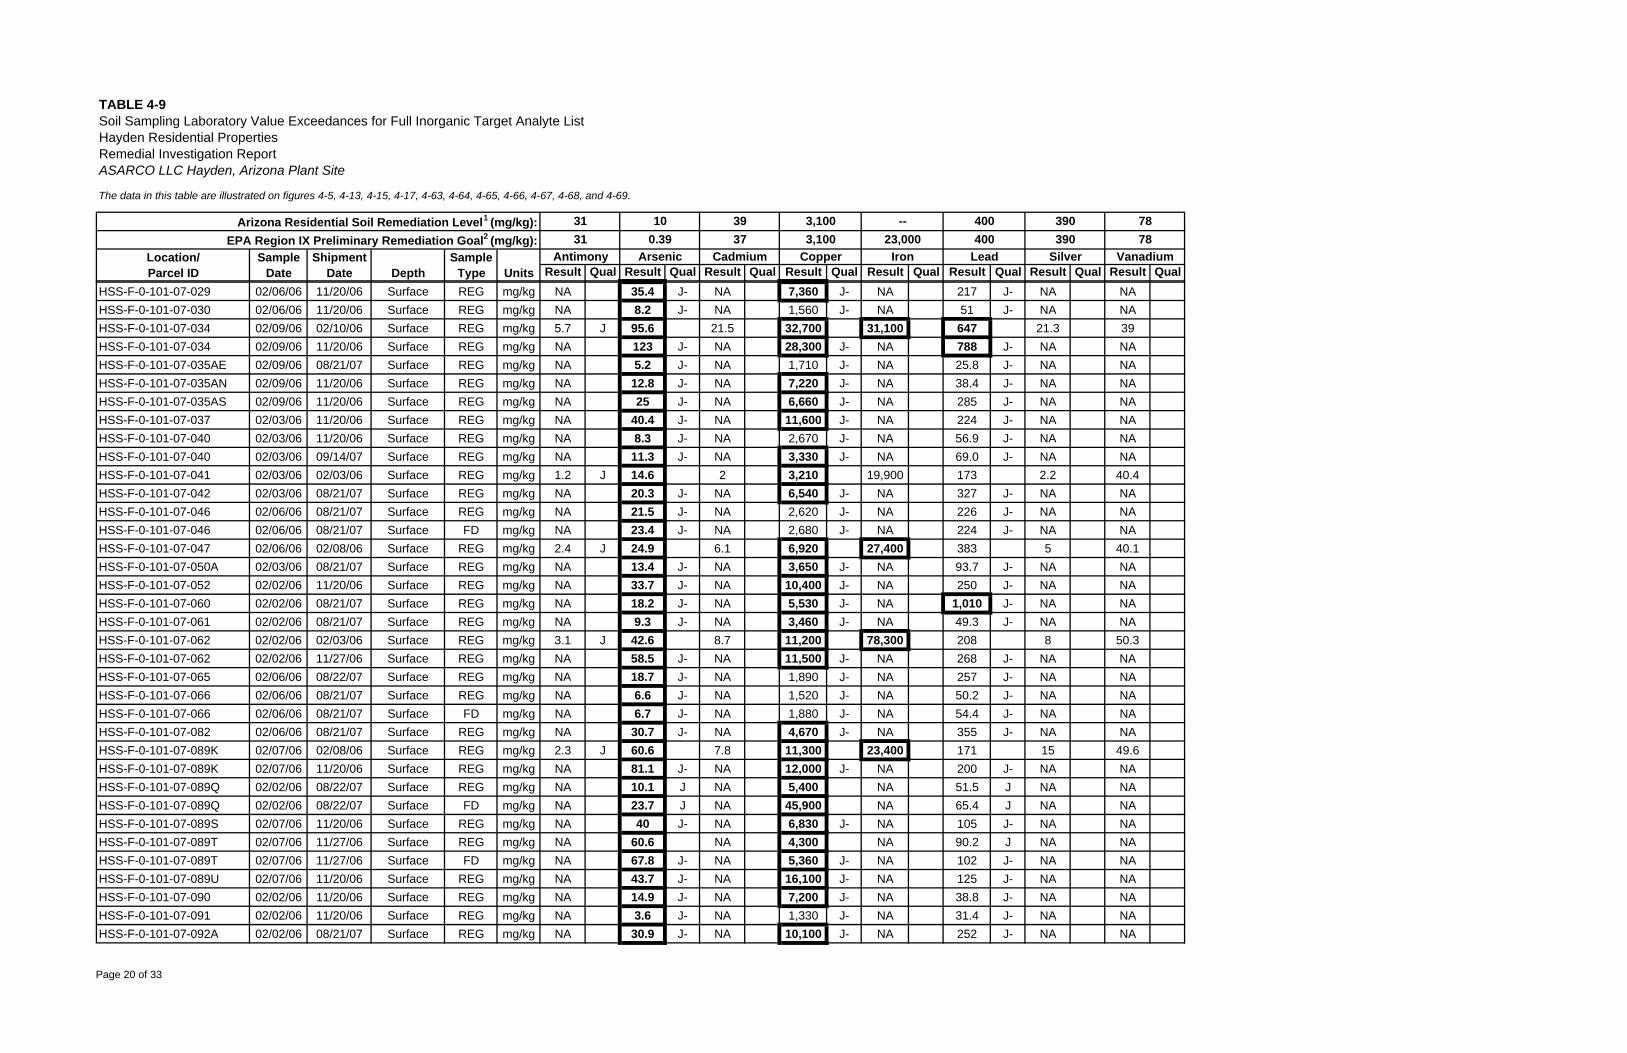
The data in this table are illustrated on figures 4-5, 4-13, 4-15, 4-17, 4-63, 4-64, 4-65, 4-66, 4-67, 4-68, and 4-69.
Result Qual Result Qual Result Qual Result Qual Result Qual Result Qual Result Qual Result Qual
TABLE 4-9
Depth
Soil Sampling Laboratory Value Exceedances for Full Inorganic Target Analyte ListHayden Residential PropertiesRemedial Investigation ReportASARCO LLC Hayden, Arizona Plant Site
Location/Parcel ID
31
ShipmentDate Units
Arizona Residential Soil Remediation Level1 (mg/kg):EPA Region IX Preliminary Remediation Goal2 (mg/kg):
SampleType
SampleDate
10
Antimony Arsenic31 0.39
3937
Cadmium
3,1003,100
Copper
--23,000
Iron
400400
Lead
390390
Silver
7878
Vanadium
HSS-F-0-101-07-029 02/06/06 11/20/06 Surface REG mg/kg NA 35.4 J- NA 7,360 J- NA 217 J- NA NAHSS-F-0-101-07-030 02/06/06 11/20/06 Surface REG mg/kg NA 8.2 J- NA 1,560 J- NA 51 J- NA NAHSS-F-0-101-07-034 02/09/06 02/10/06 Surface REG mg/kg 5.7 J 95.6 21.5 32,700 31,100 647 21.3 39HSS-F-0-101-07-034 02/09/06 11/20/06 Surface REG mg/kg NA 123 J- NA 28,300 J- NA 788 J- NA NAHSS-F-0-101-07-035AE 02/09/06 08/21/07 Surface REG mg/kg NA 5.2 J- NA 1,710 J- NA 25.8 J- NA NAHSS-F-0-101-07-035AN 02/09/06 11/20/06 Surface REG mg/kg NA 12.8 J- NA 7,220 J- NA 38.4 J- NA NAHSS-F-0-101-07-035AS 02/09/06 11/20/06 Surface REG mg/kg NA 25 J- NA 6,660 J- NA 285 J- NA NAHSS-F-0-101-07-037 02/03/06 11/20/06 Surface REG mg/kg NA 40.4 J- NA 11,600 J- NA 224 J- NA NAHSS-F-0-101-07-040 02/03/06 11/20/06 Surface REG mg/kg NA 8.3 J- NA 2,670 J- NA 56.9 J- NA NAHSS-F-0-101-07-040 02/03/06 09/14/07 Surface REG mg/kg NA 11.3 J- NA 3,330 J- NA 69.0 J- NA NAHSS-F-0-101-07-041 02/03/06 02/03/06 Surface REG mg/kg 1.2 J 14.6 2 3,210 19,900 173 2.2 40.4HSS-F-0-101-07-042 02/03/06 08/21/07 Surface REG mg/kg NA 20.3 J- NA 6,540 J- NA 327 J- NA NAHSS-F-0-101-07-046 02/06/06 08/21/07 Surface REG mg/kg NA 21.5 J- NA 2,620 J- NA 226 J- NA NAHSS-F-0-101-07-046 02/06/06 08/21/07 Surface FD mg/kg NA 23.4 J- NA 2,680 J- NA 224 J- NA NAHSS-F-0-101-07-047 02/06/06 02/08/06 Surface REG mg/kg 2.4 J 24.9 6.1 6,920 27,400 383 5 40.1HSS-F-0-101-07-050A 02/03/06 08/21/07 Surface REG mg/kg NA 13.4 J- NA 3,650 J- NA 93.7 J- NA NAHSS-F-0-101-07-052 02/02/06 11/20/06 Surface REG mg/kg NA 33.7 J- NA 10,400 J- NA 250 J- NA NAHSS-F-0-101-07-060 02/02/06 08/21/07 Surface REG mg/kg NA 18.2 J- NA 5,530 J- NA 1,010 J- NA NAHSS-F-0-101-07-061 02/02/06 08/21/07 Surface REG mg/kg NA 9.3 J- NA 3,460 J- NA 49.3 J- NA NAHSS-F-0-101-07-062 02/02/06 02/03/06 Surface REG mg/kg 3.1 J 42.6 8.7 11,200 78,300 208 8 50.3HSS-F-0-101-07-062 02/02/06 11/27/06 Surface REG mg/kg NA 58.5 J- NA 11,500 J- NA 268 J- NA NAHSS-F-0-101-07-065 02/06/06 08/22/07 Surface REG mg/kg NA 18.7 J- NA 1,890 J- NA 257 J- NA NAHSS-F-0-101-07-066 02/06/06 08/21/07 Surface REG mg/kg NA 6.6 J- NA 1,520 J- NA 50.2 J- NA NAHSS-F-0-101-07-066 02/06/06 08/21/07 Surface FD mg/kg NA 6.7 J- NA 1,880 J- NA 54.4 J- NA NAHSS-F-0-101-07-082 02/06/06 08/21/07 Surface REG mg/kg NA 30.7 J- NA 4,670 J- NA 355 J- NA NAHSS-F-0-101-07-089K 02/07/06 02/08/06 Surface REG mg/kg 2.3 J 60.6 7.8 11,300 23,400 171 15 49.6HSS-F-0-101-07-089K 02/07/06 11/20/06 Surface REG mg/kg NA 81.1 J- NA 12,000 J- NA 200 J- NA NAHSS-F-0-101-07-089Q 02/02/06 08/22/07 Surface REG mg/kg NA 10.1 J NA 5,400 NA 51.5 J NA NAHSS-F-0-101-07-089Q 02/02/06 08/22/07 Surface FD mg/kg NA 23.7 J NA 45,900 NA 65.4 J NA NAHSS-F-0-101-07-089S 02/07/06 11/20/06 Surface REG mg/kg NA 40 J- NA 6,830 J- NA 105 J- NA NAHSS-F-0-101-07-089T 02/07/06 11/27/06 Surface REG mg/kg NA 60.6 NA 4,300 NA 90.2 J NA NAHSS-F-0-101-07-089T 02/07/06 11/27/06 Surface FD mg/kg NA 67.8 J- NA 5,360 J- NA 102 J- NA NAHSS-F-0-101-07-089U 02/07/06 11/20/06 Surface REG mg/kg NA 43.7 J- NA 16,100 J- NA 125 J- NA NAHSS-F-0-101-07-090 02/02/06 11/20/06 Surface REG mg/kg NA 14.9 J- NA 7,200 J- NA 38.8 J- NA NAHSS-F-0-101-07-091 02/02/06 11/20/06 Surface REG mg/kg NA 3.6 J- NA 1,330 J- NA 31.4 J- NA NAHSS-F-0-101-07-092A 02/02/06 08/21/07 Surface REG mg/kg NA 30.9 J- NA 10,100 J- NA 252 J- NA NA
Page 20 of 33
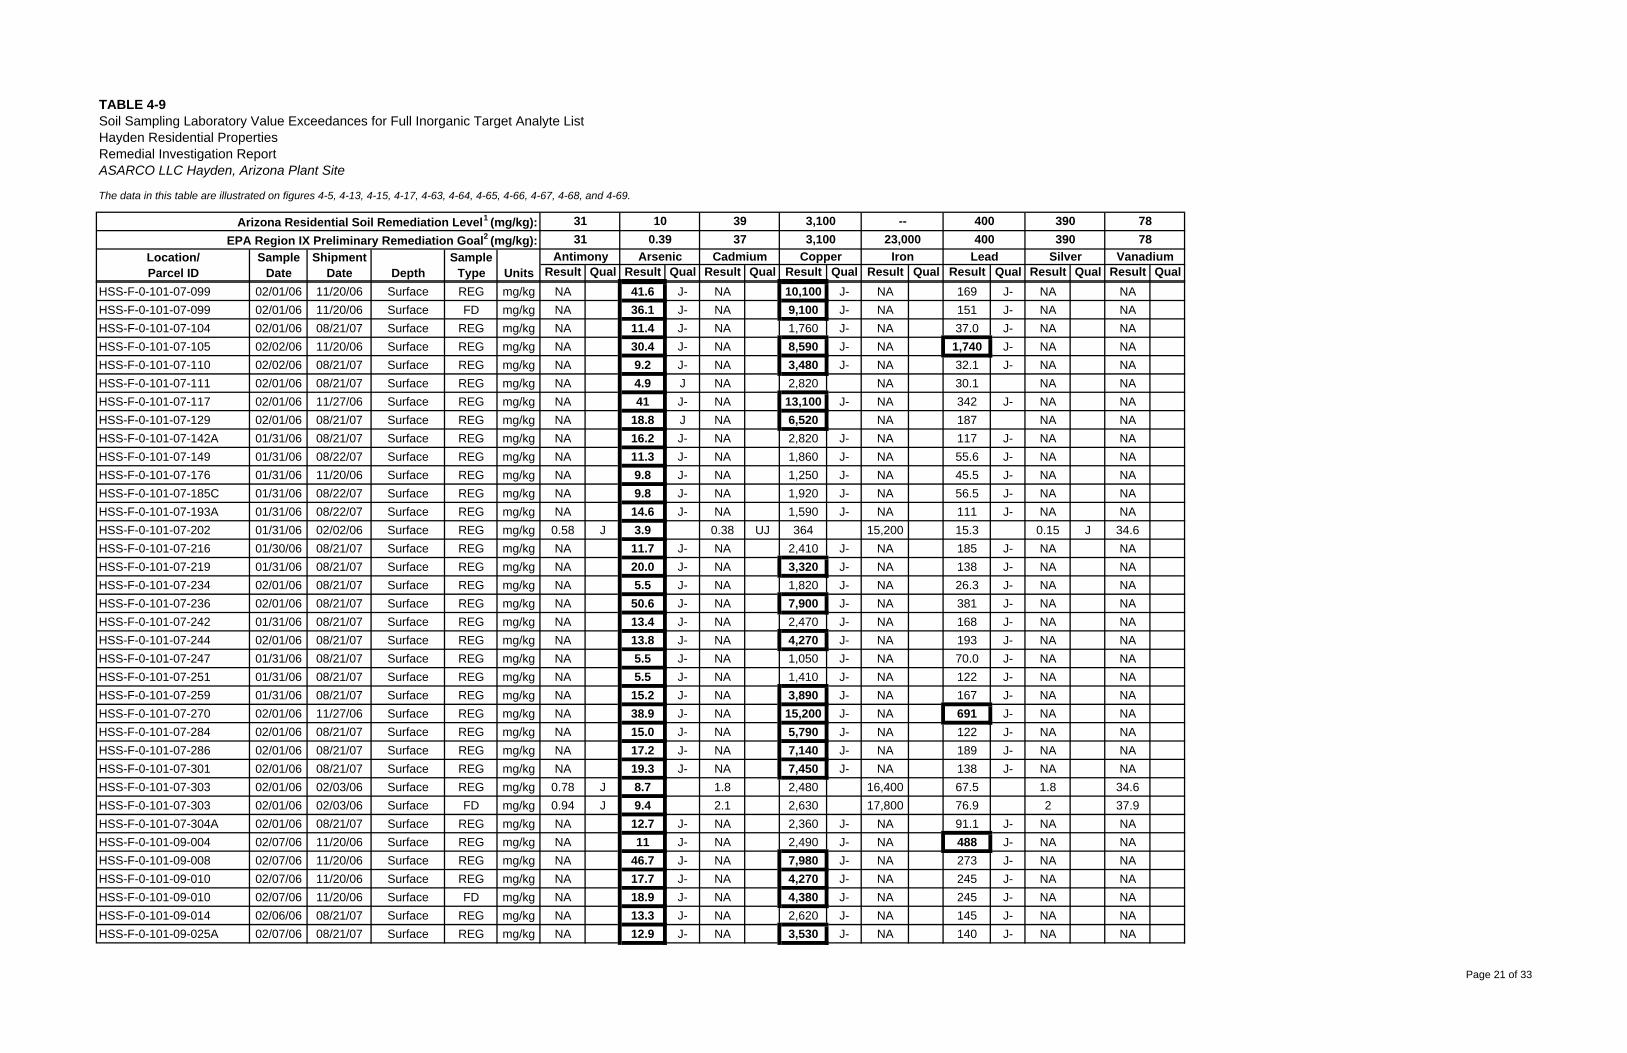
The data in this table are illustrated on figures 4-5, 4-13, 4-15, 4-17, 4-63, 4-64, 4-65, 4-66, 4-67, 4-68, and 4-69.
Result Qual Result Qual Result Qual Result Qual Result Qual Result Qual Result Qual Result Qual
TABLE 4-9
Depth
Soil Sampling Laboratory Value Exceedances for Full Inorganic Target Analyte ListHayden Residential PropertiesRemedial Investigation ReportASARCO LLC Hayden, Arizona Plant Site
Location/Parcel ID
31
ShipmentDate Units
Arizona Residential Soil Remediation Level1 (mg/kg):EPA Region IX Preliminary Remediation Goal2 (mg/kg):
SampleType
SampleDate
10
Antimony Arsenic31 0.39
3937
Cadmium
3,1003,100
Copper
--23,000
Iron
400400
Lead
390390
Silver
7878
Vanadium
HSS-F-0-101-07-099 02/01/06 11/20/06 Surface REG mg/kg NA 41.6 J- NA 10,100 J- NA 169 J- NA NAHSS-F-0-101-07-099 02/01/06 11/20/06 Surface FD mg/kg NA 36.1 J- NA 9,100 J- NA 151 J- NA NAHSS-F-0-101-07-104 02/01/06 08/21/07 Surface REG mg/kg NA 11.4 J- NA 1,760 J- NA 37.0 J- NA NAHSS-F-0-101-07-105 02/02/06 11/20/06 Surface REG mg/kg NA 30.4 J- NA 8,590 J- NA 1,740 J- NA NAHSS-F-0-101-07-110 02/02/06 08/21/07 Surface REG mg/kg NA 9.2 J- NA 3,480 J- NA 32.1 J- NA NAHSS-F-0-101-07-111 02/01/06 08/21/07 Surface REG mg/kg NA 4.9 J NA 2,820 NA 30.1 NA NAHSS-F-0-101-07-117 02/01/06 11/27/06 Surface REG mg/kg NA 41 J- NA 13,100 J- NA 342 J- NA NAHSS-F-0-101-07-129 02/01/06 08/21/07 Surface REG mg/kg NA 18.8 J NA 6,520 NA 187 NA NAHSS-F-0-101-07-142A 01/31/06 08/21/07 Surface REG mg/kg NA 16.2 J- NA 2,820 J- NA 117 J- NA NAHSS-F-0-101-07-149 01/31/06 08/22/07 Surface REG mg/kg NA 11.3 J- NA 1,860 J- NA 55.6 J- NA NAHSS-F-0-101-07-176 01/31/06 11/20/06 Surface REG mg/kg NA 9.8 J- NA 1,250 J- NA 45.5 J- NA NAHSS-F-0-101-07-185C 01/31/06 08/22/07 Surface REG mg/kg NA 9.8 J- NA 1,920 J- NA 56.5 J- NA NAHSS-F-0-101-07-193A 01/31/06 08/22/07 Surface REG mg/kg NA 14.6 J- NA 1,590 J- NA 111 J- NA NAHSS-F-0-101-07-202 01/31/06 02/02/06 Surface REG mg/kg 0.58 J 3.9 0.38 UJ 364 15,200 15.3 0.15 J 34.6HSS-F-0-101-07-216 01/30/06 08/21/07 Surface REG mg/kg NA 11.7 J- NA 2,410 J- NA 185 J- NA NAHSS-F-0-101-07-219 01/31/06 08/21/07 Surface REG mg/kg NA 20.0 J- NA 3,320 J- NA 138 J- NA NAHSS-F-0-101-07-234 02/01/06 08/21/07 Surface REG mg/kg NA 5.5 J- NA 1,820 J- NA 26.3 J- NA NAHSS-F-0-101-07-236 02/01/06 08/21/07 Surface REG mg/kg NA 50.6 J- NA 7,900 J- NA 381 J- NA NAHSS-F-0-101-07-242 01/31/06 08/21/07 Surface REG mg/kg NA 13.4 J- NA 2,470 J- NA 168 J- NA NAHSS-F-0-101-07-244 02/01/06 08/21/07 Surface REG mg/kg NA 13.8 J- NA 4,270 J- NA 193 J- NA NAHSS-F-0-101-07-247 01/31/06 08/21/07 Surface REG mg/kg NA 5.5 J- NA 1,050 J- NA 70.0 J- NA NAHSS-F-0-101-07-251 01/31/06 08/21/07 Surface REG mg/kg NA 5.5 J- NA 1,410 J- NA 122 J- NA NAHSS-F-0-101-07-259 01/31/06 08/21/07 Surface REG mg/kg NA 15.2 J- NA 3,890 J- NA 167 J- NA NAHSS-F-0-101-07-270 02/01/06 11/27/06 Surface REG mg/kg NA 38.9 J- NA 15,200 J- NA 691 J- NA NAHSS-F-0-101-07-284 02/01/06 08/21/07 Surface REG mg/kg NA 15.0 J- NA 5,790 J- NA 122 J- NA NAHSS-F-0-101-07-286 02/01/06 08/21/07 Surface REG mg/kg NA 17.2 J- NA 7,140 J- NA 189 J- NA NAHSS-F-0-101-07-301 02/01/06 08/21/07 Surface REG mg/kg NA 19.3 J- NA 7,450 J- NA 138 J- NA NAHSS-F-0-101-07-303 02/01/06 02/03/06 Surface REG mg/kg 0.78 J 8.7 1.8 2,480 16,400 67.5 1.8 34.6HSS-F-0-101-07-303 02/01/06 02/03/06 Surface FD mg/kg 0.94 J 9.4 2.1 2,630 17,800 76.9 2 37.9HSS-F-0-101-07-304A 02/01/06 08/21/07 Surface REG mg/kg NA 12.7 J- NA 2,360 J- NA 91.1 J- NA NAHSS-F-0-101-09-004 02/07/06 11/20/06 Surface REG mg/kg NA 11 J- NA 2,490 J- NA 488 J- NA NAHSS-F-0-101-09-008 02/07/06 11/20/06 Surface REG mg/kg NA 46.7 J- NA 7,980 J- NA 273 J- NA NAHSS-F-0-101-09-010 02/07/06 11/20/06 Surface REG mg/kg NA 17.7 J- NA 4,270 J- NA 245 J- NA NAHSS-F-0-101-09-010 02/07/06 11/20/06 Surface FD mg/kg NA 18.9 J- NA 4,380 J- NA 245 J- NA NAHSS-F-0-101-09-014 02/06/06 08/21/07 Surface REG mg/kg NA 13.3 J- NA 2,620 J- NA 145 J- NA NAHSS-F-0-101-09-025A 02/07/06 08/21/07 Surface REG mg/kg NA 12.9 J- NA 3,530 J- NA 140 J- NA NA
Page 21 of 33
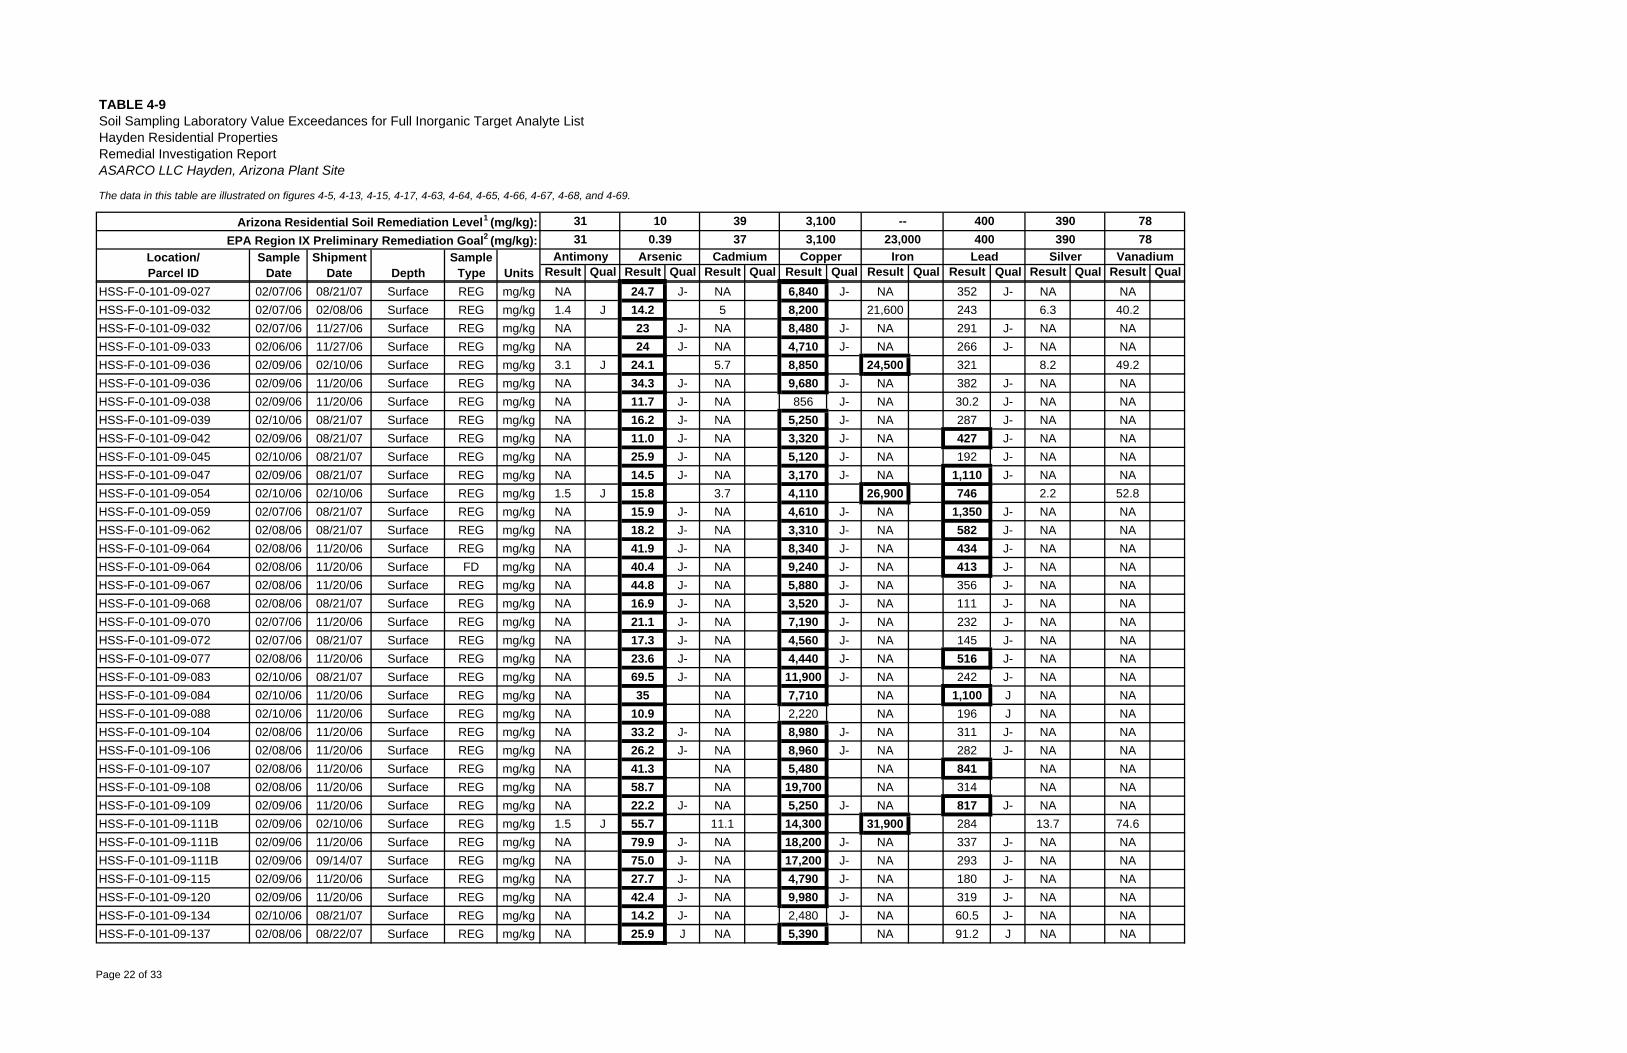
The data in this table are illustrated on figures 4-5, 4-13, 4-15, 4-17, 4-63, 4-64, 4-65, 4-66, 4-67, 4-68, and 4-69.
Result Qual Result Qual Result Qual Result Qual Result Qual Result Qual Result Qual Result Qual
TABLE 4-9
Depth
Soil Sampling Laboratory Value Exceedances for Full Inorganic Target Analyte ListHayden Residential PropertiesRemedial Investigation ReportASARCO LLC Hayden, Arizona Plant Site
Location/Parcel ID
31
ShipmentDate Units
Arizona Residential Soil Remediation Level1 (mg/kg):EPA Region IX Preliminary Remediation Goal2 (mg/kg):
SampleType
SampleDate
10
Antimony Arsenic31 0.39
3937
Cadmium
3,1003,100
Copper
--23,000
Iron
400400
Lead
390390
Silver
7878
Vanadium
HSS-F-0-101-09-027 02/07/06 08/21/07 Surface REG mg/kg NA 24.7 J- NA 6,840 J- NA 352 J- NA NAHSS-F-0-101-09-032 02/07/06 02/08/06 Surface REG mg/kg 1.4 J 14.2 5 8,200 21,600 243 6.3 40.2HSS-F-0-101-09-032 02/07/06 11/27/06 Surface REG mg/kg NA 23 J- NA 8,480 J- NA 291 J- NA NAHSS-F-0-101-09-033 02/06/06 11/27/06 Surface REG mg/kg NA 24 J- NA 4,710 J- NA 266 J- NA NAHSS-F-0-101-09-036 02/09/06 02/10/06 Surface REG mg/kg 3.1 J 24.1 5.7 8,850 24,500 321 8.2 49.2HSS-F-0-101-09-036 02/09/06 11/20/06 Surface REG mg/kg NA 34.3 J- NA 9,680 J- NA 382 J- NA NAHSS-F-0-101-09-038 02/09/06 11/20/06 Surface REG mg/kg NA 11.7 J- NA 856 J- NA 30.2 J- NA NAHSS-F-0-101-09-039 02/10/06 08/21/07 Surface REG mg/kg NA 16.2 J- NA 5,250 J- NA 287 J- NA NAHSS-F-0-101-09-042 02/09/06 08/21/07 Surface REG mg/kg NA 11.0 J- NA 3,320 J- NA 427 J- NA NAHSS-F-0-101-09-045 02/10/06 08/21/07 Surface REG mg/kg NA 25.9 J- NA 5,120 J- NA 192 J- NA NAHSS-F-0-101-09-047 02/09/06 08/21/07 Surface REG mg/kg NA 14.5 J- NA 3,170 J- NA 1,110 J- NA NAHSS-F-0-101-09-054 02/10/06 02/10/06 Surface REG mg/kg 1.5 J 15.8 3.7 4,110 26,900 746 2.2 52.8HSS-F-0-101-09-059 02/07/06 08/21/07 Surface REG mg/kg NA 15.9 J- NA 4,610 J- NA 1,350 J- NA NAHSS-F-0-101-09-062 02/08/06 08/21/07 Surface REG mg/kg NA 18.2 J- NA 3,310 J- NA 582 J- NA NAHSS-F-0-101-09-064 02/08/06 11/20/06 Surface REG mg/kg NA 41.9 J- NA 8,340 J- NA 434 J- NA NAHSS-F-0-101-09-064 02/08/06 11/20/06 Surface FD mg/kg NA 40.4 J- NA 9,240 J- NA 413 J- NA NAHSS-F-0-101-09-067 02/08/06 11/20/06 Surface REG mg/kg NA 44.8 J- NA 5,880 J- NA 356 J- NA NAHSS-F-0-101-09-068 02/08/06 08/21/07 Surface REG mg/kg NA 16.9 J- NA 3,520 J- NA 111 J- NA NAHSS-F-0-101-09-070 02/07/06 11/20/06 Surface REG mg/kg NA 21.1 J- NA 7,190 J- NA 232 J- NA NAHSS-F-0-101-09-072 02/07/06 08/21/07 Surface REG mg/kg NA 17.3 J- NA 4,560 J- NA 145 J- NA NAHSS-F-0-101-09-077 02/08/06 11/20/06 Surface REG mg/kg NA 23.6 J- NA 4,440 J- NA 516 J- NA NAHSS-F-0-101-09-083 02/10/06 08/21/07 Surface REG mg/kg NA 69.5 J- NA 11,900 J- NA 242 J- NA NAHSS-F-0-101-09-084 02/10/06 11/20/06 Surface REG mg/kg NA 35 NA 7,710 NA 1,100 J NA NAHSS-F-0-101-09-088 02/10/06 11/20/06 Surface REG mg/kg NA 10.9 NA 2,220 NA 196 J NA NAHSS-F-0-101-09-104 02/08/06 11/20/06 Surface REG mg/kg NA 33.2 J- NA 8,980 J- NA 311 J- NA NAHSS-F-0-101-09-106 02/08/06 11/20/06 Surface REG mg/kg NA 26.2 J- NA 8,960 J- NA 282 J- NA NAHSS-F-0-101-09-107 02/08/06 11/20/06 Surface REG mg/kg NA 41.3 NA 5,480 NA 841 NA NAHSS-F-0-101-09-108 02/08/06 11/20/06 Surface REG mg/kg NA 58.7 NA 19,700 NA 314 NA NAHSS-F-0-101-09-109 02/09/06 11/20/06 Surface REG mg/kg NA 22.2 J- NA 5,250 J- NA 817 J- NA NAHSS-F-0-101-09-111B 02/09/06 02/10/06 Surface REG mg/kg 1.5 J 55.7 11.1 14,300 31,900 284 13.7 74.6HSS-F-0-101-09-111B 02/09/06 11/20/06 Surface REG mg/kg NA 79.9 J- NA 18,200 J- NA 337 J- NA NAHSS-F-0-101-09-111B 02/09/06 09/14/07 Surface REG mg/kg NA 75.0 J- NA 17,200 J- NA 293 J- NA NAHSS-F-0-101-09-115 02/09/06 11/20/06 Surface REG mg/kg NA 27.7 J- NA 4,790 J- NA 180 J- NA NAHSS-F-0-101-09-120 02/09/06 11/20/06 Surface REG mg/kg NA 42.4 J- NA 9,980 J- NA 319 J- NA NAHSS-F-0-101-09-134 02/10/06 08/21/07 Surface REG mg/kg NA 14.2 J- NA 2,480 J- NA 60.5 J- NA NAHSS-F-0-101-09-137 02/08/06 08/22/07 Surface REG mg/kg NA 25.9 J NA 5,390 NA 91.2 J NA NA
Page 22 of 33
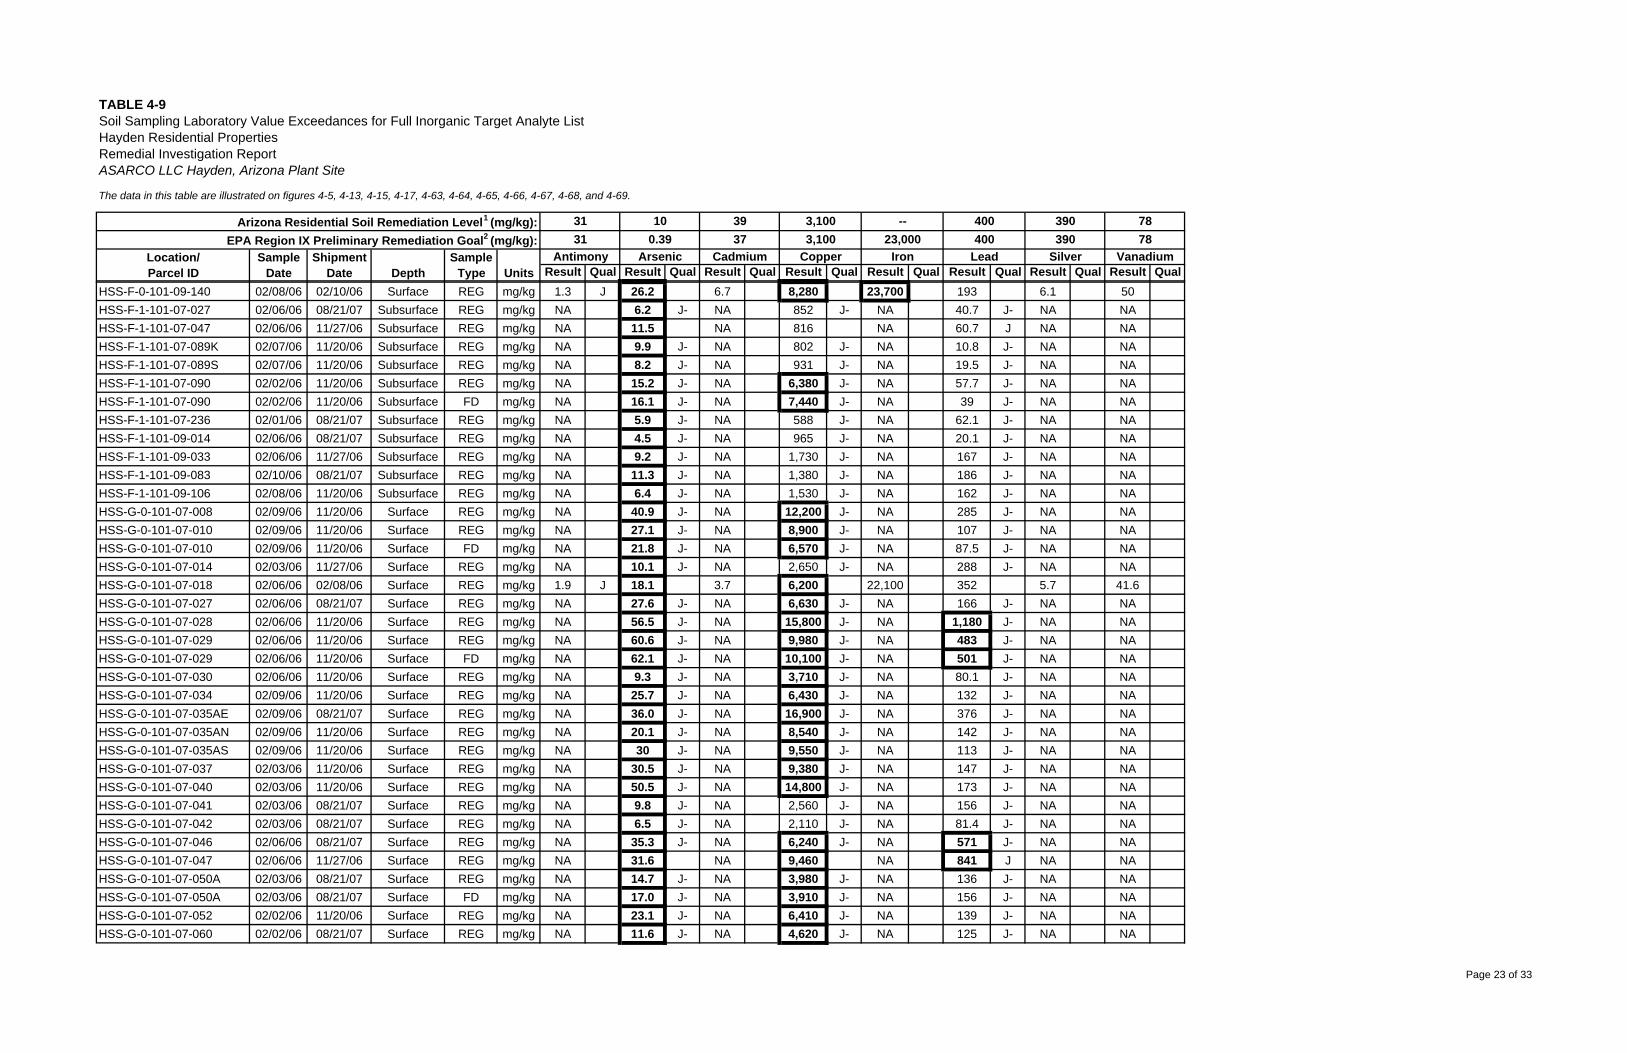
The data in this table are illustrated on figures 4-5, 4-13, 4-15, 4-17, 4-63, 4-64, 4-65, 4-66, 4-67, 4-68, and 4-69.
Result Qual Result Qual Result Qual Result Qual Result Qual Result Qual Result Qual Result Qual
TABLE 4-9
Depth
Soil Sampling Laboratory Value Exceedances for Full Inorganic Target Analyte ListHayden Residential PropertiesRemedial Investigation ReportASARCO LLC Hayden, Arizona Plant Site
Location/Parcel ID
31
ShipmentDate Units
Arizona Residential Soil Remediation Level1 (mg/kg):EPA Region IX Preliminary Remediation Goal2 (mg/kg):
SampleType
SampleDate
10
Antimony Arsenic31 0.39
3937
Cadmium
3,1003,100
Copper
--23,000
Iron
400400
Lead
390390
Silver
7878
Vanadium
HSS-F-0-101-09-140 02/08/06 02/10/06 Surface REG mg/kg 1.3 J 26.2 6.7 8,280 23,700 193 6.1 50HSS-F-1-101-07-027 02/06/06 08/21/07 Subsurface REG mg/kg NA 6.2 J- NA 852 J- NA 40.7 J- NA NAHSS-F-1-101-07-047 02/06/06 11/27/06 Subsurface REG mg/kg NA 11.5 NA 816 NA 60.7 J NA NAHSS-F-1-101-07-089K 02/07/06 11/20/06 Subsurface REG mg/kg NA 9.9 J- NA 802 J- NA 10.8 J- NA NAHSS-F-1-101-07-089S 02/07/06 11/20/06 Subsurface REG mg/kg NA 8.2 J- NA 931 J- NA 19.5 J- NA NAHSS-F-1-101-07-090 02/02/06 11/20/06 Subsurface REG mg/kg NA 15.2 J- NA 6,380 J- NA 57.7 J- NA NAHSS-F-1-101-07-090 02/02/06 11/20/06 Subsurface FD mg/kg NA 16.1 J- NA 7,440 J- NA 39 J- NA NAHSS-F-1-101-07-236 02/01/06 08/21/07 Subsurface REG mg/kg NA 5.9 J- NA 588 J- NA 62.1 J- NA NAHSS-F-1-101-09-014 02/06/06 08/21/07 Subsurface REG mg/kg NA 4.5 J- NA 965 J- NA 20.1 J- NA NAHSS-F-1-101-09-033 02/06/06 11/27/06 Subsurface REG mg/kg NA 9.2 J- NA 1,730 J- NA 167 J- NA NAHSS-F-1-101-09-083 02/10/06 08/21/07 Subsurface REG mg/kg NA 11.3 J- NA 1,380 J- NA 186 J- NA NAHSS-F-1-101-09-106 02/08/06 11/20/06 Subsurface REG mg/kg NA 6.4 J- NA 1,530 J- NA 162 J- NA NAHSS-G-0-101-07-008 02/09/06 11/20/06 Surface REG mg/kg NA 40.9 J- NA 12,200 J- NA 285 J- NA NAHSS-G-0-101-07-010 02/09/06 11/20/06 Surface REG mg/kg NA 27.1 J- NA 8,900 J- NA 107 J- NA NAHSS-G-0-101-07-010 02/09/06 11/20/06 Surface FD mg/kg NA 21.8 J- NA 6,570 J- NA 87.5 J- NA NAHSS-G-0-101-07-014 02/03/06 11/27/06 Surface REG mg/kg NA 10.1 J- NA 2,650 J- NA 288 J- NA NAHSS-G-0-101-07-018 02/06/06 02/08/06 Surface REG mg/kg 1.9 J 18.1 3.7 6,200 22,100 352 5.7 41.6HSS-G-0-101-07-027 02/06/06 08/21/07 Surface REG mg/kg NA 27.6 J- NA 6,630 J- NA 166 J- NA NAHSS-G-0-101-07-028 02/06/06 11/20/06 Surface REG mg/kg NA 56.5 J- NA 15,800 J- NA 1,180 J- NA NAHSS-G-0-101-07-029 02/06/06 11/20/06 Surface REG mg/kg NA 60.6 J- NA 9,980 J- NA 483 J- NA NAHSS-G-0-101-07-029 02/06/06 11/20/06 Surface FD mg/kg NA 62.1 J- NA 10,100 J- NA 501 J- NA NAHSS-G-0-101-07-030 02/06/06 11/20/06 Surface REG mg/kg NA 9.3 J- NA 3,710 J- NA 80.1 J- NA NAHSS-G-0-101-07-034 02/09/06 11/20/06 Surface REG mg/kg NA 25.7 J- NA 6,430 J- NA 132 J- NA NAHSS-G-0-101-07-035AE 02/09/06 08/21/07 Surface REG mg/kg NA 36.0 J- NA 16,900 J- NA 376 J- NA NAHSS-G-0-101-07-035AN 02/09/06 11/20/06 Surface REG mg/kg NA 20.1 J- NA 8,540 J- NA 142 J- NA NAHSS-G-0-101-07-035AS 02/09/06 11/20/06 Surface REG mg/kg NA 30 J- NA 9,550 J- NA 113 J- NA NAHSS-G-0-101-07-037 02/03/06 11/20/06 Surface REG mg/kg NA 30.5 J- NA 9,380 J- NA 147 J- NA NAHSS-G-0-101-07-040 02/03/06 11/20/06 Surface REG mg/kg NA 50.5 J- NA 14,800 J- NA 173 J- NA NAHSS-G-0-101-07-041 02/03/06 08/21/07 Surface REG mg/kg NA 9.8 J- NA 2,560 J- NA 156 J- NA NAHSS-G-0-101-07-042 02/03/06 08/21/07 Surface REG mg/kg NA 6.5 J- NA 2,110 J- NA 81.4 J- NA NAHSS-G-0-101-07-046 02/06/06 08/21/07 Surface REG mg/kg NA 35.3 J- NA 6,240 J- NA 571 J- NA NAHSS-G-0-101-07-047 02/06/06 11/27/06 Surface REG mg/kg NA 31.6 NA 9,460 NA 841 J NA NAHSS-G-0-101-07-050A 02/03/06 08/21/07 Surface REG mg/kg NA 14.7 J- NA 3,980 J- NA 136 J- NA NAHSS-G-0-101-07-050A 02/03/06 08/21/07 Surface FD mg/kg NA 17.0 J- NA 3,910 J- NA 156 J- NA NAHSS-G-0-101-07-052 02/02/06 11/20/06 Surface REG mg/kg NA 23.1 J- NA 6,410 J- NA 139 J- NA NAHSS-G-0-101-07-060 02/02/06 08/21/07 Surface REG mg/kg NA 11.6 J- NA 4,620 J- NA 125 J- NA NA
Page 23 of 33
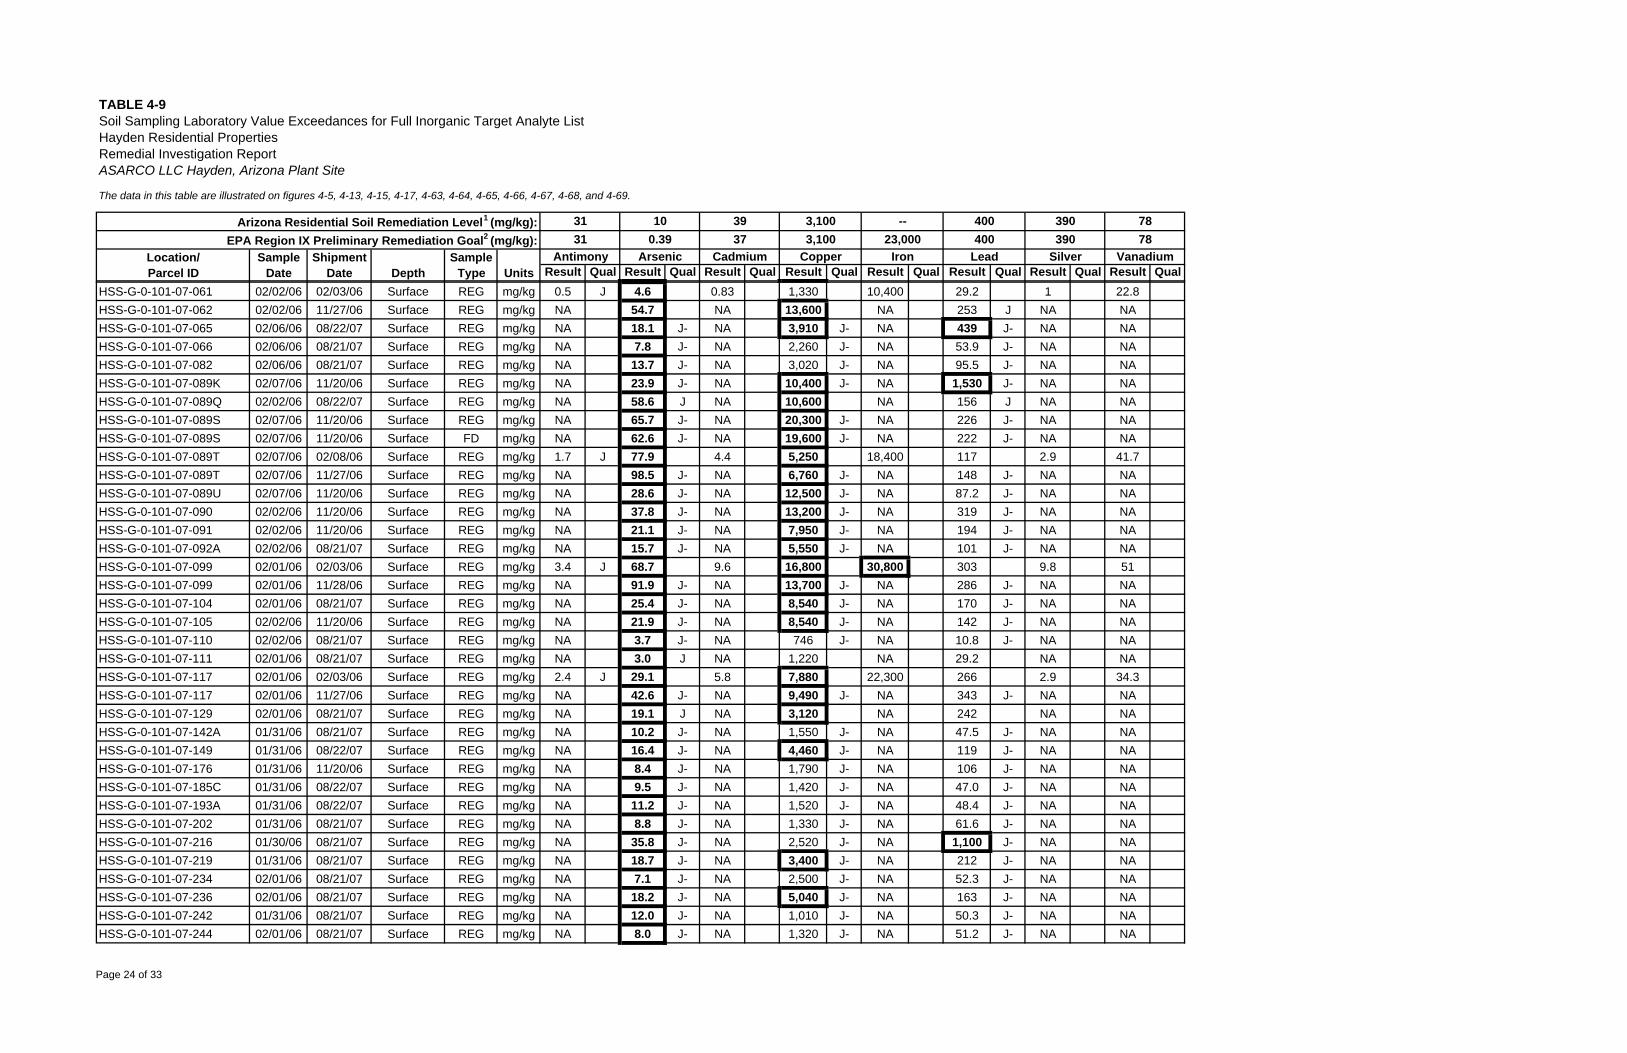
The data in this table are illustrated on figures 4-5, 4-13, 4-15, 4-17, 4-63, 4-64, 4-65, 4-66, 4-67, 4-68, and 4-69.
Result Qual Result Qual Result Qual Result Qual Result Qual Result Qual Result Qual Result Qual
TABLE 4-9
Depth
Soil Sampling Laboratory Value Exceedances for Full Inorganic Target Analyte ListHayden Residential PropertiesRemedial Investigation ReportASARCO LLC Hayden, Arizona Plant Site
Location/Parcel ID
31
ShipmentDate Units
Arizona Residential Soil Remediation Level1 (mg/kg):EPA Region IX Preliminary Remediation Goal2 (mg/kg):
SampleType
SampleDate
10
Antimony Arsenic31 0.39
3937
Cadmium
3,1003,100
Copper
--23,000
Iron
400400
Lead
390390
Silver
7878
Vanadium
HSS-G-0-101-07-061 02/02/06 02/03/06 Surface REG mg/kg 0.5 J 4.6 0.83 1,330 10,400 29.2 1 22.8HSS-G-0-101-07-062 02/02/06 11/27/06 Surface REG mg/kg NA 54.7 NA 13,600 NA 253 J NA NAHSS-G-0-101-07-065 02/06/06 08/22/07 Surface REG mg/kg NA 18.1 J- NA 3,910 J- NA 439 J- NA NAHSS-G-0-101-07-066 02/06/06 08/21/07 Surface REG mg/kg NA 7.8 J- NA 2,260 J- NA 53.9 J- NA NAHSS-G-0-101-07-082 02/06/06 08/21/07 Surface REG mg/kg NA 13.7 J- NA 3,020 J- NA 95.5 J- NA NAHSS-G-0-101-07-089K 02/07/06 11/20/06 Surface REG mg/kg NA 23.9 J- NA 10,400 J- NA 1,530 J- NA NAHSS-G-0-101-07-089Q 02/02/06 08/22/07 Surface REG mg/kg NA 58.6 J NA 10,600 NA 156 J NA NAHSS-G-0-101-07-089S 02/07/06 11/20/06 Surface REG mg/kg NA 65.7 J- NA 20,300 J- NA 226 J- NA NAHSS-G-0-101-07-089S 02/07/06 11/20/06 Surface FD mg/kg NA 62.6 J- NA 19,600 J- NA 222 J- NA NAHSS-G-0-101-07-089T 02/07/06 02/08/06 Surface REG mg/kg 1.7 J 77.9 4.4 5,250 18,400 117 2.9 41.7HSS-G-0-101-07-089T 02/07/06 11/27/06 Surface REG mg/kg NA 98.5 J- NA 6,760 J- NA 148 J- NA NAHSS-G-0-101-07-089U 02/07/06 11/20/06 Surface REG mg/kg NA 28.6 J- NA 12,500 J- NA 87.2 J- NA NAHSS-G-0-101-07-090 02/02/06 11/20/06 Surface REG mg/kg NA 37.8 J- NA 13,200 J- NA 319 J- NA NAHSS-G-0-101-07-091 02/02/06 11/20/06 Surface REG mg/kg NA 21.1 J- NA 7,950 J- NA 194 J- NA NAHSS-G-0-101-07-092A 02/02/06 08/21/07 Surface REG mg/kg NA 15.7 J- NA 5,550 J- NA 101 J- NA NAHSS-G-0-101-07-099 02/01/06 02/03/06 Surface REG mg/kg 3.4 J 68.7 9.6 16,800 30,800 303 9.8 51HSS-G-0-101-07-099 02/01/06 11/28/06 Surface REG mg/kg NA 91.9 J- NA 13,700 J- NA 286 J- NA NAHSS-G-0-101-07-104 02/01/06 08/21/07 Surface REG mg/kg NA 25.4 J- NA 8,540 J- NA 170 J- NA NAHSS-G-0-101-07-105 02/02/06 11/20/06 Surface REG mg/kg NA 21.9 J- NA 8,540 J- NA 142 J- NA NAHSS-G-0-101-07-110 02/02/06 08/21/07 Surface REG mg/kg NA 3.7 J- NA 746 J- NA 10.8 J- NA NAHSS-G-0-101-07-111 02/01/06 08/21/07 Surface REG mg/kg NA 3.0 J NA 1,220 NA 29.2 NA NAHSS-G-0-101-07-117 02/01/06 02/03/06 Surface REG mg/kg 2.4 J 29.1 5.8 7,880 22,300 266 2.9 34.3HSS-G-0-101-07-117 02/01/06 11/27/06 Surface REG mg/kg NA 42.6 J- NA 9,490 J- NA 343 J- NA NAHSS-G-0-101-07-129 02/01/06 08/21/07 Surface REG mg/kg NA 19.1 J NA 3,120 NA 242 NA NAHSS-G-0-101-07-142A 01/31/06 08/21/07 Surface REG mg/kg NA 10.2 J- NA 1,550 J- NA 47.5 J- NA NAHSS-G-0-101-07-149 01/31/06 08/22/07 Surface REG mg/kg NA 16.4 J- NA 4,460 J- NA 119 J- NA NAHSS-G-0-101-07-176 01/31/06 11/20/06 Surface REG mg/kg NA 8.4 J- NA 1,790 J- NA 106 J- NA NAHSS-G-0-101-07-185C 01/31/06 08/22/07 Surface REG mg/kg NA 9.5 J- NA 1,420 J- NA 47.0 J- NA NAHSS-G-0-101-07-193A 01/31/06 08/22/07 Surface REG mg/kg NA 11.2 J- NA 1,520 J- NA 48.4 J- NA NAHSS-G-0-101-07-202 01/31/06 08/21/07 Surface REG mg/kg NA 8.8 J- NA 1,330 J- NA 61.6 J- NA NAHSS-G-0-101-07-216 01/30/06 08/21/07 Surface REG mg/kg NA 35.8 J- NA 2,520 J- NA 1,100 J- NA NAHSS-G-0-101-07-219 01/31/06 08/21/07 Surface REG mg/kg NA 18.7 J- NA 3,400 J- NA 212 J- NA NAHSS-G-0-101-07-234 02/01/06 08/21/07 Surface REG mg/kg NA 7.1 J- NA 2,500 J- NA 52.3 J- NA NAHSS-G-0-101-07-236 02/01/06 08/21/07 Surface REG mg/kg NA 18.2 J- NA 5,040 J- NA 163 J- NA NAHSS-G-0-101-07-242 01/31/06 08/21/07 Surface REG mg/kg NA 12.0 J- NA 1,010 J- NA 50.3 J- NA NAHSS-G-0-101-07-244 02/01/06 08/21/07 Surface REG mg/kg NA 8.0 J- NA 1,320 J- NA 51.2 J- NA NA
Page 24 of 33
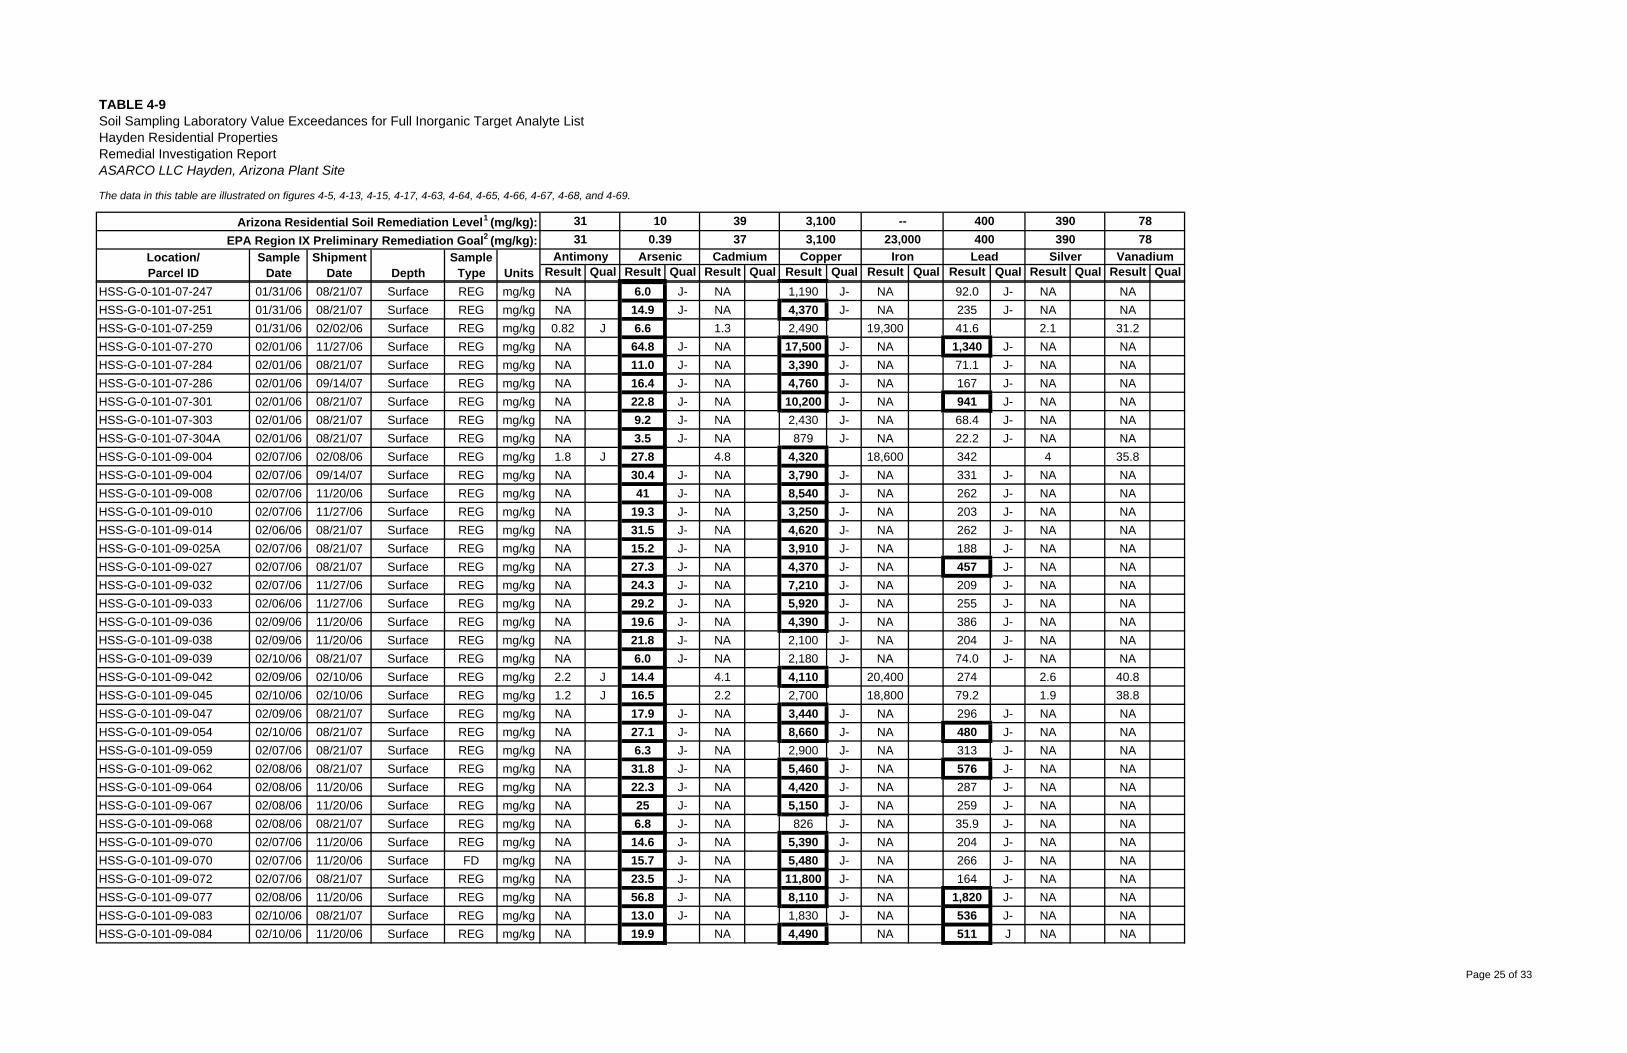
The data in this table are illustrated on figures 4-5, 4-13, 4-15, 4-17, 4-63, 4-64, 4-65, 4-66, 4-67, 4-68, and 4-69.
Result Qual Result Qual Result Qual Result Qual Result Qual Result Qual Result Qual Result Qual
TABLE 4-9
Depth
Soil Sampling Laboratory Value Exceedances for Full Inorganic Target Analyte ListHayden Residential PropertiesRemedial Investigation ReportASARCO LLC Hayden, Arizona Plant Site
Location/Parcel ID
31
ShipmentDate Units
Arizona Residential Soil Remediation Level1 (mg/kg):EPA Region IX Preliminary Remediation Goal2 (mg/kg):
SampleType
SampleDate
10
Antimony Arsenic31 0.39
3937
Cadmium
3,1003,100
Copper
--23,000
Iron
400400
Lead
390390
Silver
7878
Vanadium
HSS-G-0-101-07-247 01/31/06 08/21/07 Surface REG mg/kg NA 6.0 J- NA 1,190 J- NA 92.0 J- NA NAHSS-G-0-101-07-251 01/31/06 08/21/07 Surface REG mg/kg NA 14.9 J- NA 4,370 J- NA 235 J- NA NAHSS-G-0-101-07-259 01/31/06 02/02/06 Surface REG mg/kg 0.82 J 6.6 1.3 2,490 19,300 41.6 2.1 31.2HSS-G-0-101-07-270 02/01/06 11/27/06 Surface REG mg/kg NA 64.8 J- NA 17,500 J- NA 1,340 J- NA NAHSS-G-0-101-07-284 02/01/06 08/21/07 Surface REG mg/kg NA 11.0 J- NA 3,390 J- NA 71.1 J- NA NAHSS-G-0-101-07-286 02/01/06 09/14/07 Surface REG mg/kg NA 16.4 J- NA 4,760 J- NA 167 J- NA NAHSS-G-0-101-07-301 02/01/06 08/21/07 Surface REG mg/kg NA 22.8 J- NA 10,200 J- NA 941 J- NA NAHSS-G-0-101-07-303 02/01/06 08/21/07 Surface REG mg/kg NA 9.2 J- NA 2,430 J- NA 68.4 J- NA NAHSS-G-0-101-07-304A 02/01/06 08/21/07 Surface REG mg/kg NA 3.5 J- NA 879 J- NA 22.2 J- NA NAHSS-G-0-101-09-004 02/07/06 02/08/06 Surface REG mg/kg 1.8 J 27.8 4.8 4,320 18,600 342 4 35.8HSS-G-0-101-09-004 02/07/06 09/14/07 Surface REG mg/kg NA 30.4 J- NA 3,790 J- NA 331 J- NA NAHSS-G-0-101-09-008 02/07/06 11/20/06 Surface REG mg/kg NA 41 J- NA 8,540 J- NA 262 J- NA NAHSS-G-0-101-09-010 02/07/06 11/27/06 Surface REG mg/kg NA 19.3 J- NA 3,250 J- NA 203 J- NA NAHSS-G-0-101-09-014 02/06/06 08/21/07 Surface REG mg/kg NA 31.5 J- NA 4,620 J- NA 262 J- NA NAHSS-G-0-101-09-025A 02/07/06 08/21/07 Surface REG mg/kg NA 15.2 J- NA 3,910 J- NA 188 J- NA NAHSS-G-0-101-09-027 02/07/06 08/21/07 Surface REG mg/kg NA 27.3 J- NA 4,370 J- NA 457 J- NA NAHSS-G-0-101-09-032 02/07/06 11/27/06 Surface REG mg/kg NA 24.3 J- NA 7,210 J- NA 209 J- NA NAHSS-G-0-101-09-033 02/06/06 11/27/06 Surface REG mg/kg NA 29.2 J- NA 5,920 J- NA 255 J- NA NAHSS-G-0-101-09-036 02/09/06 11/20/06 Surface REG mg/kg NA 19.6 J- NA 4,390 J- NA 386 J- NA NAHSS-G-0-101-09-038 02/09/06 11/20/06 Surface REG mg/kg NA 21.8 J- NA 2,100 J- NA 204 J- NA NAHSS-G-0-101-09-039 02/10/06 08/21/07 Surface REG mg/kg NA 6.0 J- NA 2,180 J- NA 74.0 J- NA NAHSS-G-0-101-09-042 02/09/06 02/10/06 Surface REG mg/kg 2.2 J 14.4 4.1 4,110 20,400 274 2.6 40.8HSS-G-0-101-09-045 02/10/06 02/10/06 Surface REG mg/kg 1.2 J 16.5 2.2 2,700 18,800 79.2 1.9 38.8HSS-G-0-101-09-047 02/09/06 08/21/07 Surface REG mg/kg NA 17.9 J- NA 3,440 J- NA 296 J- NA NAHSS-G-0-101-09-054 02/10/06 08/21/07 Surface REG mg/kg NA 27.1 J- NA 8,660 J- NA 480 J- NA NAHSS-G-0-101-09-059 02/07/06 08/21/07 Surface REG mg/kg NA 6.3 J- NA 2,900 J- NA 313 J- NA NAHSS-G-0-101-09-062 02/08/06 08/21/07 Surface REG mg/kg NA 31.8 J- NA 5,460 J- NA 576 J- NA NAHSS-G-0-101-09-064 02/08/06 11/20/06 Surface REG mg/kg NA 22.3 J- NA 4,420 J- NA 287 J- NA NAHSS-G-0-101-09-067 02/08/06 11/20/06 Surface REG mg/kg NA 25 J- NA 5,150 J- NA 259 J- NA NAHSS-G-0-101-09-068 02/08/06 08/21/07 Surface REG mg/kg NA 6.8 J- NA 826 J- NA 35.9 J- NA NAHSS-G-0-101-09-070 02/07/06 11/20/06 Surface REG mg/kg NA 14.6 J- NA 5,390 J- NA 204 J- NA NAHSS-G-0-101-09-070 02/07/06 11/20/06 Surface FD mg/kg NA 15.7 J- NA 5,480 J- NA 266 J- NA NAHSS-G-0-101-09-072 02/07/06 08/21/07 Surface REG mg/kg NA 23.5 J- NA 11,800 J- NA 164 J- NA NAHSS-G-0-101-09-077 02/08/06 11/20/06 Surface REG mg/kg NA 56.8 J- NA 8,110 J- NA 1,820 J- NA NAHSS-G-0-101-09-083 02/10/06 08/21/07 Surface REG mg/kg NA 13.0 J- NA 1,830 J- NA 536 J- NA NAHSS-G-0-101-09-084 02/10/06 11/20/06 Surface REG mg/kg NA 19.9 NA 4,490 NA 511 J NA NA
Page 25 of 33
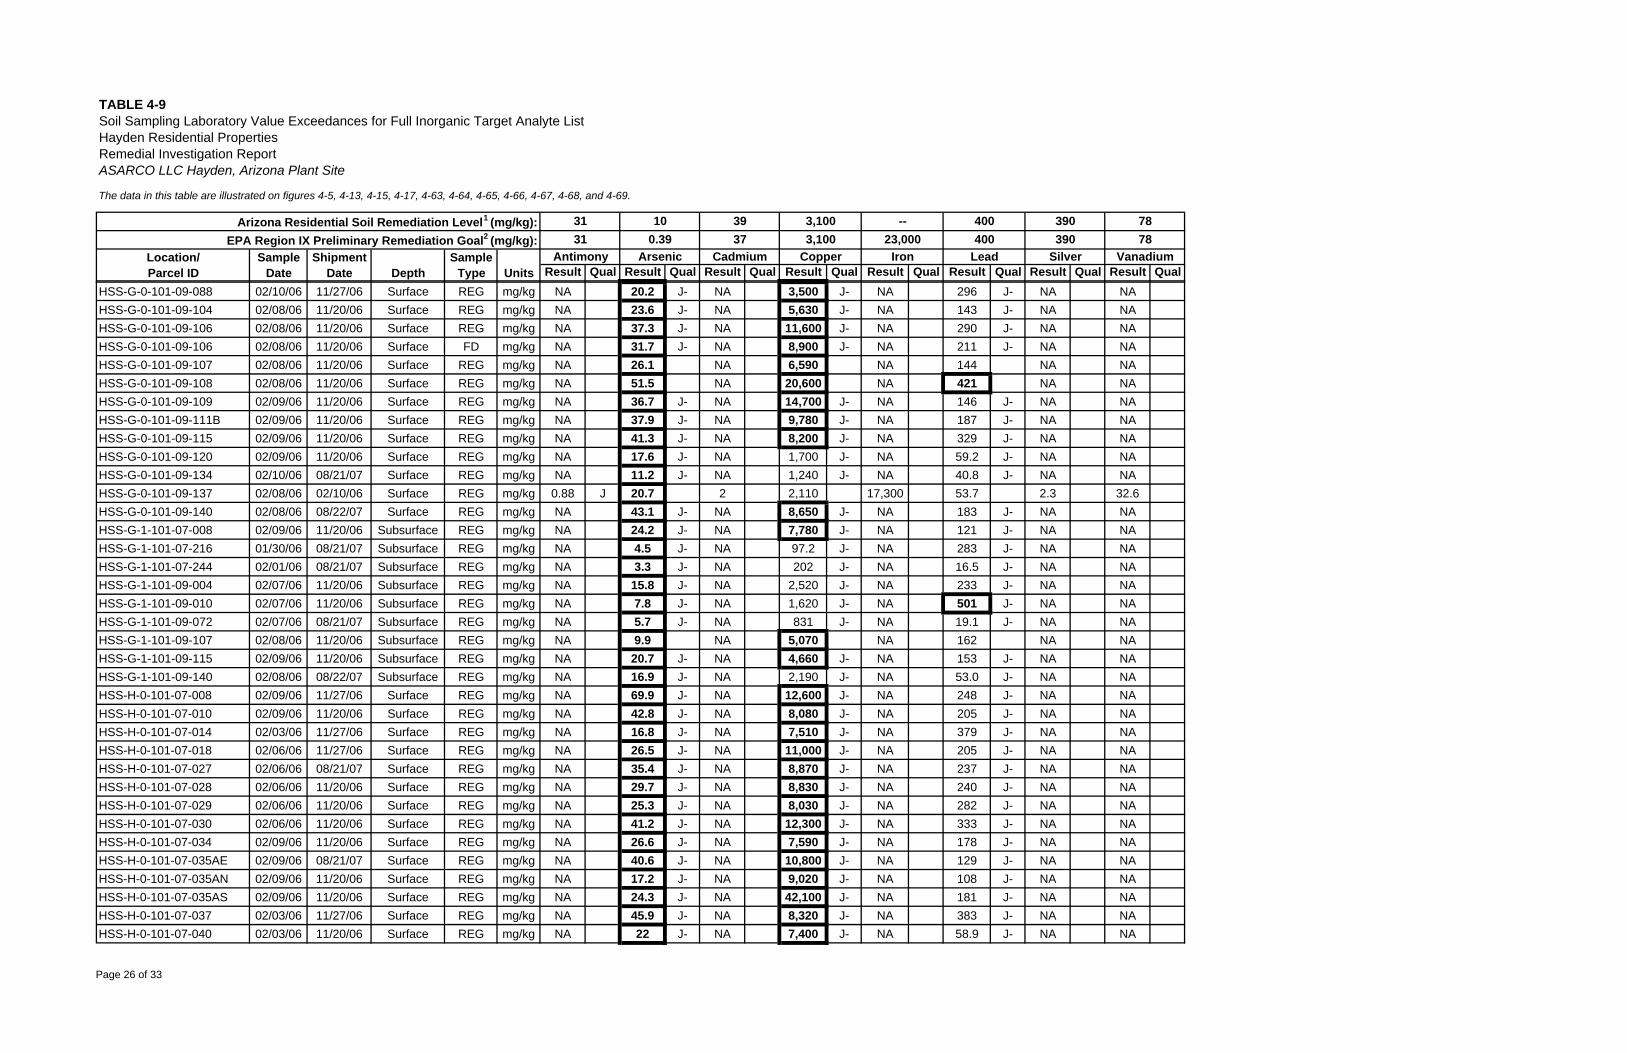
The data in this table are illustrated on figures 4-5, 4-13, 4-15, 4-17, 4-63, 4-64, 4-65, 4-66, 4-67, 4-68, and 4-69.
Result Qual Result Qual Result Qual Result Qual Result Qual Result Qual Result Qual Result Qual
TABLE 4-9
Depth
Soil Sampling Laboratory Value Exceedances for Full Inorganic Target Analyte ListHayden Residential PropertiesRemedial Investigation ReportASARCO LLC Hayden, Arizona Plant Site
Location/Parcel ID
31
ShipmentDate Units
Arizona Residential Soil Remediation Level1 (mg/kg):EPA Region IX Preliminary Remediation Goal2 (mg/kg):
SampleType
SampleDate
10
Antimony Arsenic31 0.39
3937
Cadmium
3,1003,100
Copper
--23,000
Iron
400400
Lead
390390
Silver
7878
Vanadium
HSS-G-0-101-09-088 02/10/06 11/27/06 Surface REG mg/kg NA 20.2 J- NA 3,500 J- NA 296 J- NA NAHSS-G-0-101-09-104 02/08/06 11/20/06 Surface REG mg/kg NA 23.6 J- NA 5,630 J- NA 143 J- NA NAHSS-G-0-101-09-106 02/08/06 11/20/06 Surface REG mg/kg NA 37.3 J- NA 11,600 J- NA 290 J- NA NAHSS-G-0-101-09-106 02/08/06 11/20/06 Surface FD mg/kg NA 31.7 J- NA 8,900 J- NA 211 J- NA NAHSS-G-0-101-09-107 02/08/06 11/20/06 Surface REG mg/kg NA 26.1 NA 6,590 NA 144 NA NAHSS-G-0-101-09-108 02/08/06 11/20/06 Surface REG mg/kg NA 51.5 NA 20,600 NA 421 NA NAHSS-G-0-101-09-109 02/09/06 11/20/06 Surface REG mg/kg NA 36.7 J- NA 14,700 J- NA 146 J- NA NAHSS-G-0-101-09-111B 02/09/06 11/20/06 Surface REG mg/kg NA 37.9 J- NA 9,780 J- NA 187 J- NA NAHSS-G-0-101-09-115 02/09/06 11/20/06 Surface REG mg/kg NA 41.3 J- NA 8,200 J- NA 329 J- NA NAHSS-G-0-101-09-120 02/09/06 11/20/06 Surface REG mg/kg NA 17.6 J- NA 1,700 J- NA 59.2 J- NA NAHSS-G-0-101-09-134 02/10/06 08/21/07 Surface REG mg/kg NA 11.2 J- NA 1,240 J- NA 40.8 J- NA NAHSS-G-0-101-09-137 02/08/06 02/10/06 Surface REG mg/kg 0.88 J 20.7 2 2,110 17,300 53.7 2.3 32.6HSS-G-0-101-09-140 02/08/06 08/22/07 Surface REG mg/kg NA 43.1 J- NA 8,650 J- NA 183 J- NA NAHSS-G-1-101-07-008 02/09/06 11/20/06 Subsurface REG mg/kg NA 24.2 J- NA 7,780 J- NA 121 J- NA NAHSS-G-1-101-07-216 01/30/06 08/21/07 Subsurface REG mg/kg NA 4.5 J- NA 97.2 J- NA 283 J- NA NAHSS-G-1-101-07-244 02/01/06 08/21/07 Subsurface REG mg/kg NA 3.3 J- NA 202 J- NA 16.5 J- NA NAHSS-G-1-101-09-004 02/07/06 11/20/06 Subsurface REG mg/kg NA 15.8 J- NA 2,520 J- NA 233 J- NA NAHSS-G-1-101-09-010 02/07/06 11/20/06 Subsurface REG mg/kg NA 7.8 J- NA 1,620 J- NA 501 J- NA NAHSS-G-1-101-09-072 02/07/06 08/21/07 Subsurface REG mg/kg NA 5.7 J- NA 831 J- NA 19.1 J- NA NAHSS-G-1-101-09-107 02/08/06 11/20/06 Subsurface REG mg/kg NA 9.9 NA 5,070 NA 162 NA NAHSS-G-1-101-09-115 02/09/06 11/20/06 Subsurface REG mg/kg NA 20.7 J- NA 4,660 J- NA 153 J- NA NAHSS-G-1-101-09-140 02/08/06 08/22/07 Subsurface REG mg/kg NA 16.9 J- NA 2,190 J- NA 53.0 J- NA NAHSS-H-0-101-07-008 02/09/06 11/27/06 Surface REG mg/kg NA 69.9 J- NA 12,600 J- NA 248 J- NA NAHSS-H-0-101-07-010 02/09/06 11/20/06 Surface REG mg/kg NA 42.8 J- NA 8,080 J- NA 205 J- NA NAHSS-H-0-101-07-014 02/03/06 11/27/06 Surface REG mg/kg NA 16.8 J- NA 7,510 J- NA 379 J- NA NAHSS-H-0-101-07-018 02/06/06 11/27/06 Surface REG mg/kg NA 26.5 J- NA 11,000 J- NA 205 J- NA NAHSS-H-0-101-07-027 02/06/06 08/21/07 Surface REG mg/kg NA 35.4 J- NA 8,870 J- NA 237 J- NA NAHSS-H-0-101-07-028 02/06/06 11/20/06 Surface REG mg/kg NA 29.7 J- NA 8,830 J- NA 240 J- NA NAHSS-H-0-101-07-029 02/06/06 11/20/06 Surface REG mg/kg NA 25.3 J- NA 8,030 J- NA 282 J- NA NAHSS-H-0-101-07-030 02/06/06 11/20/06 Surface REG mg/kg NA 41.2 J- NA 12,300 J- NA 333 J- NA NAHSS-H-0-101-07-034 02/09/06 11/20/06 Surface REG mg/kg NA 26.6 J- NA 7,590 J- NA 178 J- NA NAHSS-H-0-101-07-035AE 02/09/06 08/21/07 Surface REG mg/kg NA 40.6 J- NA 10,800 J- NA 129 J- NA NAHSS-H-0-101-07-035AN 02/09/06 11/20/06 Surface REG mg/kg NA 17.2 J- NA 9,020 J- NA 108 J- NA NAHSS-H-0-101-07-035AS 02/09/06 11/20/06 Surface REG mg/kg NA 24.3 J- NA 42,100 J- NA 181 J- NA NAHSS-H-0-101-07-037 02/03/06 11/27/06 Surface REG mg/kg NA 45.9 J- NA 8,320 J- NA 383 J- NA NAHSS-H-0-101-07-040 02/03/06 11/20/06 Surface REG mg/kg NA 22 J- NA 7,400 J- NA 58.9 J- NA NA
Page 26 of 33
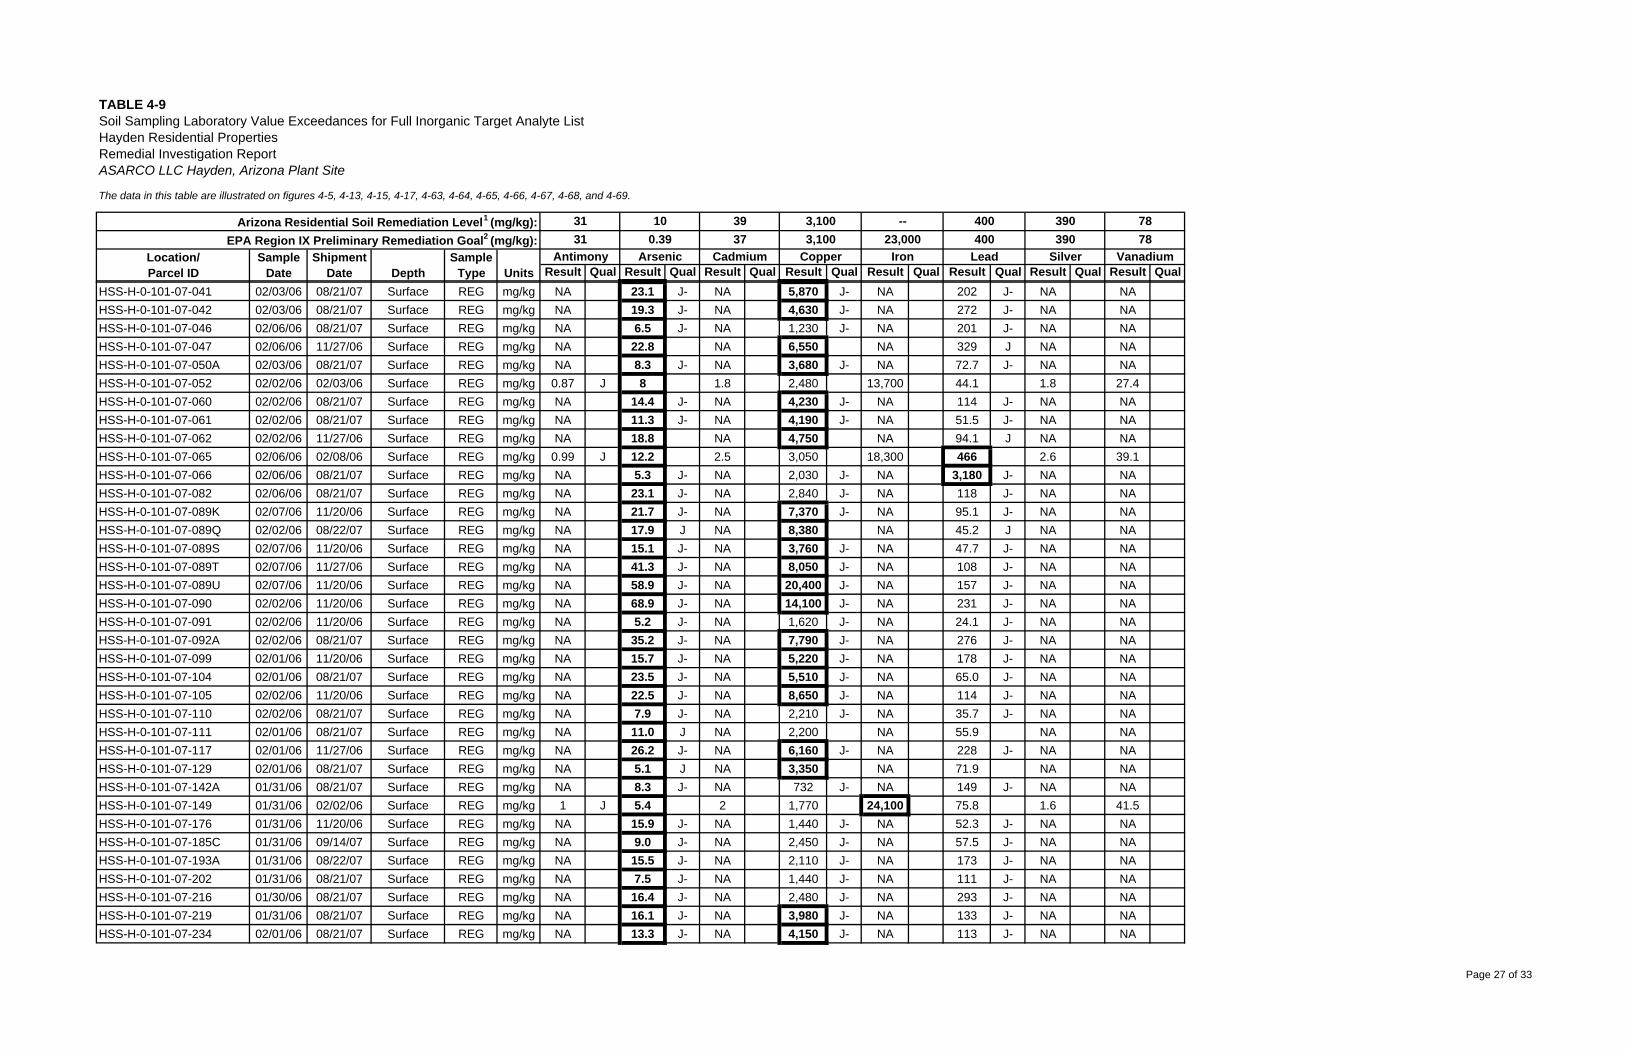
The data in this table are illustrated on figures 4-5, 4-13, 4-15, 4-17, 4-63, 4-64, 4-65, 4-66, 4-67, 4-68, and 4-69.
Result Qual Result Qual Result Qual Result Qual Result Qual Result Qual Result Qual Result Qual
TABLE 4-9
Depth
Soil Sampling Laboratory Value Exceedances for Full Inorganic Target Analyte ListHayden Residential PropertiesRemedial Investigation ReportASARCO LLC Hayden, Arizona Plant Site
Location/Parcel ID
31
ShipmentDate Units
Arizona Residential Soil Remediation Level1 (mg/kg):EPA Region IX Preliminary Remediation Goal2 (mg/kg):
SampleType
SampleDate
10
Antimony Arsenic31 0.39
3937
Cadmium
3,1003,100
Copper
--23,000
Iron
400400
Lead
390390
Silver
7878
Vanadium
HSS-H-0-101-07-041 02/03/06 08/21/07 Surface REG mg/kg NA 23.1 J- NA 5,870 J- NA 202 J- NA NAHSS-H-0-101-07-042 02/03/06 08/21/07 Surface REG mg/kg NA 19.3 J- NA 4,630 J- NA 272 J- NA NAHSS-H-0-101-07-046 02/06/06 08/21/07 Surface REG mg/kg NA 6.5 J- NA 1,230 J- NA 201 J- NA NAHSS-H-0-101-07-047 02/06/06 11/27/06 Surface REG mg/kg NA 22.8 NA 6,550 NA 329 J NA NAHSS-H-0-101-07-050A 02/03/06 08/21/07 Surface REG mg/kg NA 8.3 J- NA 3,680 J- NA 72.7 J- NA NAHSS-H-0-101-07-052 02/02/06 02/03/06 Surface REG mg/kg 0.87 J 8 1.8 2,480 13,700 44.1 1.8 27.4HSS-H-0-101-07-060 02/02/06 08/21/07 Surface REG mg/kg NA 14.4 J- NA 4,230 J- NA 114 J- NA NAHSS-H-0-101-07-061 02/02/06 08/21/07 Surface REG mg/kg NA 11.3 J- NA 4,190 J- NA 51.5 J- NA NAHSS-H-0-101-07-062 02/02/06 11/27/06 Surface REG mg/kg NA 18.8 NA 4,750 NA 94.1 J NA NAHSS-H-0-101-07-065 02/06/06 02/08/06 Surface REG mg/kg 0.99 J 12.2 2.5 3,050 18,300 466 2.6 39.1HSS-H-0-101-07-066 02/06/06 08/21/07 Surface REG mg/kg NA 5.3 J- NA 2,030 J- NA 3,180 J- NA NAHSS-H-0-101-07-082 02/06/06 08/21/07 Surface REG mg/kg NA 23.1 J- NA 2,840 J- NA 118 J- NA NAHSS-H-0-101-07-089K 02/07/06 11/20/06 Surface REG mg/kg NA 21.7 J- NA 7,370 J- NA 95.1 J- NA NAHSS-H-0-101-07-089Q 02/02/06 08/22/07 Surface REG mg/kg NA 17.9 J NA 8,380 NA 45.2 J NA NAHSS-H-0-101-07-089S 02/07/06 11/20/06 Surface REG mg/kg NA 15.1 J- NA 3,760 J- NA 47.7 J- NA NAHSS-H-0-101-07-089T 02/07/06 11/27/06 Surface REG mg/kg NA 41.3 J- NA 8,050 J- NA 108 J- NA NAHSS-H-0-101-07-089U 02/07/06 11/20/06 Surface REG mg/kg NA 58.9 J- NA 20,400 J- NA 157 J- NA NAHSS-H-0-101-07-090 02/02/06 11/20/06 Surface REG mg/kg NA 68.9 J- NA 14,100 J- NA 231 J- NA NAHSS-H-0-101-07-091 02/02/06 11/20/06 Surface REG mg/kg NA 5.2 J- NA 1,620 J- NA 24.1 J- NA NAHSS-H-0-101-07-092A 02/02/06 08/21/07 Surface REG mg/kg NA 35.2 J- NA 7,790 J- NA 276 J- NA NAHSS-H-0-101-07-099 02/01/06 11/20/06 Surface REG mg/kg NA 15.7 J- NA 5,220 J- NA 178 J- NA NAHSS-H-0-101-07-104 02/01/06 08/21/07 Surface REG mg/kg NA 23.5 J- NA 5,510 J- NA 65.0 J- NA NAHSS-H-0-101-07-105 02/02/06 11/20/06 Surface REG mg/kg NA 22.5 J- NA 8,650 J- NA 114 J- NA NAHSS-H-0-101-07-110 02/02/06 08/21/07 Surface REG mg/kg NA 7.9 J- NA 2,210 J- NA 35.7 J- NA NAHSS-H-0-101-07-111 02/01/06 08/21/07 Surface REG mg/kg NA 11.0 J NA 2,200 NA 55.9 NA NAHSS-H-0-101-07-117 02/01/06 11/27/06 Surface REG mg/kg NA 26.2 J- NA 6,160 J- NA 228 J- NA NAHSS-H-0-101-07-129 02/01/06 08/21/07 Surface REG mg/kg NA 5.1 J NA 3,350 NA 71.9 NA NAHSS-H-0-101-07-142A 01/31/06 08/21/07 Surface REG mg/kg NA 8.3 J- NA 732 J- NA 149 J- NA NAHSS-H-0-101-07-149 01/31/06 02/02/06 Surface REG mg/kg 1 J 5.4 2 1,770 24,100 75.8 1.6 41.5HSS-H-0-101-07-176 01/31/06 11/20/06 Surface REG mg/kg NA 15.9 J- NA 1,440 J- NA 52.3 J- NA NAHSS-H-0-101-07-185C 01/31/06 09/14/07 Surface REG mg/kg NA 9.0 J- NA 2,450 J- NA 57.5 J- NA NAHSS-H-0-101-07-193A 01/31/06 08/22/07 Surface REG mg/kg NA 15.5 J- NA 2,110 J- NA 173 J- NA NAHSS-H-0-101-07-202 01/31/06 08/21/07 Surface REG mg/kg NA 7.5 J- NA 1,440 J- NA 111 J- NA NAHSS-H-0-101-07-216 01/30/06 08/21/07 Surface REG mg/kg NA 16.4 J- NA 2,480 J- NA 293 J- NA NAHSS-H-0-101-07-219 01/31/06 08/21/07 Surface REG mg/kg NA 16.1 J- NA 3,980 J- NA 133 J- NA NAHSS-H-0-101-07-234 02/01/06 08/21/07 Surface REG mg/kg NA 13.3 J- NA 4,150 J- NA 113 J- NA NA
Page 27 of 33
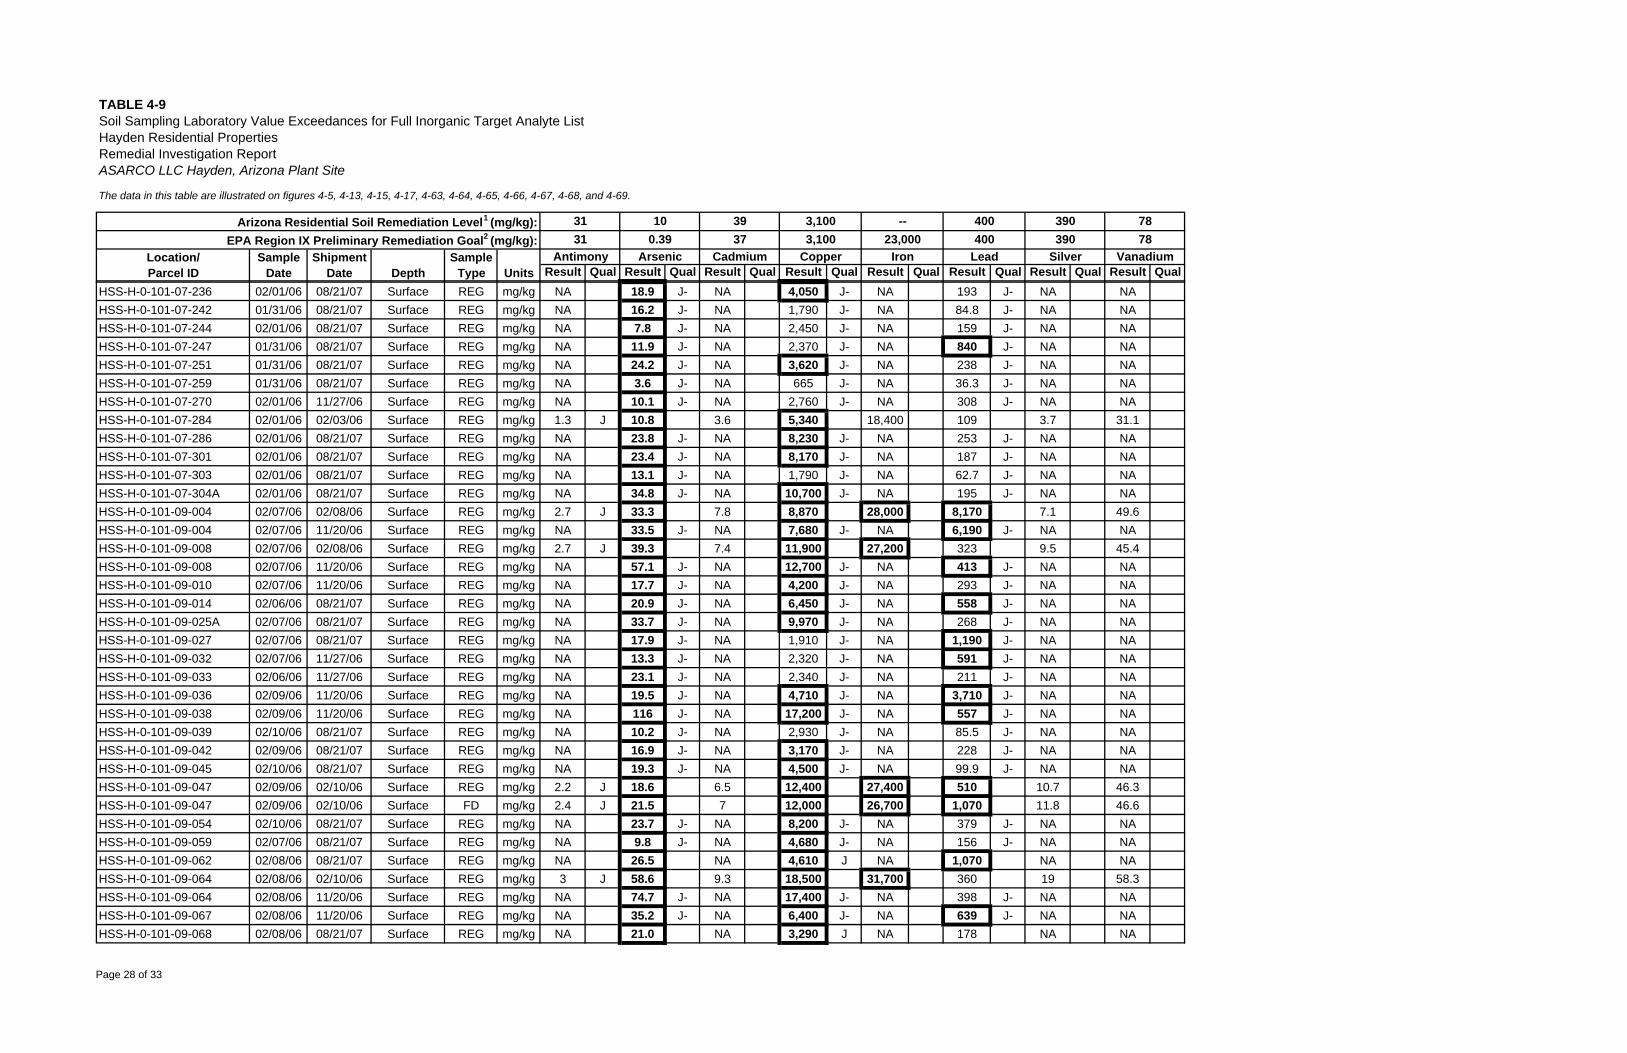
The data in this table are illustrated on figures 4-5, 4-13, 4-15, 4-17, 4-63, 4-64, 4-65, 4-66, 4-67, 4-68, and 4-69.
Result Qual Result Qual Result Qual Result Qual Result Qual Result Qual Result Qual Result Qual
TABLE 4-9
Depth
Soil Sampling Laboratory Value Exceedances for Full Inorganic Target Analyte ListHayden Residential PropertiesRemedial Investigation ReportASARCO LLC Hayden, Arizona Plant Site
Location/Parcel ID
31
ShipmentDate Units
Arizona Residential Soil Remediation Level1 (mg/kg):EPA Region IX Preliminary Remediation Goal2 (mg/kg):
SampleType
SampleDate
10
Antimony Arsenic31 0.39
3937
Cadmium
3,1003,100
Copper
--23,000
Iron
400400
Lead
390390
Silver
7878
Vanadium
HSS-H-0-101-07-236 02/01/06 08/21/07 Surface REG mg/kg NA 18.9 J- NA 4,050 J- NA 193 J- NA NAHSS-H-0-101-07-242 01/31/06 08/21/07 Surface REG mg/kg NA 16.2 J- NA 1,790 J- NA 84.8 J- NA NAHSS-H-0-101-07-244 02/01/06 08/21/07 Surface REG mg/kg NA 7.8 J- NA 2,450 J- NA 159 J- NA NAHSS-H-0-101-07-247 01/31/06 08/21/07 Surface REG mg/kg NA 11.9 J- NA 2,370 J- NA 840 J- NA NAHSS-H-0-101-07-251 01/31/06 08/21/07 Surface REG mg/kg NA 24.2 J- NA 3,620 J- NA 238 J- NA NAHSS-H-0-101-07-259 01/31/06 08/21/07 Surface REG mg/kg NA 3.6 J- NA 665 J- NA 36.3 J- NA NAHSS-H-0-101-07-270 02/01/06 11/27/06 Surface REG mg/kg NA 10.1 J- NA 2,760 J- NA 308 J- NA NAHSS-H-0-101-07-284 02/01/06 02/03/06 Surface REG mg/kg 1.3 J 10.8 3.6 5,340 18,400 109 3.7 31.1HSS-H-0-101-07-286 02/01/06 08/21/07 Surface REG mg/kg NA 23.8 J- NA 8,230 J- NA 253 J- NA NAHSS-H-0-101-07-301 02/01/06 08/21/07 Surface REG mg/kg NA 23.4 J- NA 8,170 J- NA 187 J- NA NAHSS-H-0-101-07-303 02/01/06 08/21/07 Surface REG mg/kg NA 13.1 J- NA 1,790 J- NA 62.7 J- NA NAHSS-H-0-101-07-304A 02/01/06 08/21/07 Surface REG mg/kg NA 34.8 J- NA 10,700 J- NA 195 J- NA NAHSS-H-0-101-09-004 02/07/06 02/08/06 Surface REG mg/kg 2.7 J 33.3 7.8 8,870 28,000 8,170 7.1 49.6HSS-H-0-101-09-004 02/07/06 11/20/06 Surface REG mg/kg NA 33.5 J- NA 7,680 J- NA 6,190 J- NA NAHSS-H-0-101-09-008 02/07/06 02/08/06 Surface REG mg/kg 2.7 J 39.3 7.4 11,900 27,200 323 9.5 45.4HSS-H-0-101-09-008 02/07/06 11/20/06 Surface REG mg/kg NA 57.1 J- NA 12,700 J- NA 413 J- NA NAHSS-H-0-101-09-010 02/07/06 11/20/06 Surface REG mg/kg NA 17.7 J- NA 4,200 J- NA 293 J- NA NAHSS-H-0-101-09-014 02/06/06 08/21/07 Surface REG mg/kg NA 20.9 J- NA 6,450 J- NA 558 J- NA NAHSS-H-0-101-09-025A 02/07/06 08/21/07 Surface REG mg/kg NA 33.7 J- NA 9,970 J- NA 268 J- NA NAHSS-H-0-101-09-027 02/07/06 08/21/07 Surface REG mg/kg NA 17.9 J- NA 1,910 J- NA 1,190 J- NA NAHSS-H-0-101-09-032 02/07/06 11/27/06 Surface REG mg/kg NA 13.3 J- NA 2,320 J- NA 591 J- NA NAHSS-H-0-101-09-033 02/06/06 11/27/06 Surface REG mg/kg NA 23.1 J- NA 2,340 J- NA 211 J- NA NAHSS-H-0-101-09-036 02/09/06 11/20/06 Surface REG mg/kg NA 19.5 J- NA 4,710 J- NA 3,710 J- NA NAHSS-H-0-101-09-038 02/09/06 11/20/06 Surface REG mg/kg NA 116 J- NA 17,200 J- NA 557 J- NA NAHSS-H-0-101-09-039 02/10/06 08/21/07 Surface REG mg/kg NA 10.2 J- NA 2,930 J- NA 85.5 J- NA NAHSS-H-0-101-09-042 02/09/06 08/21/07 Surface REG mg/kg NA 16.9 J- NA 3,170 J- NA 228 J- NA NAHSS-H-0-101-09-045 02/10/06 08/21/07 Surface REG mg/kg NA 19.3 J- NA 4,500 J- NA 99.9 J- NA NAHSS-H-0-101-09-047 02/09/06 02/10/06 Surface REG mg/kg 2.2 J 18.6 6.5 12,400 27,400 510 10.7 46.3HSS-H-0-101-09-047 02/09/06 02/10/06 Surface FD mg/kg 2.4 J 21.5 7 12,000 26,700 1,070 11.8 46.6HSS-H-0-101-09-054 02/10/06 08/21/07 Surface REG mg/kg NA 23.7 J- NA 8,200 J- NA 379 J- NA NAHSS-H-0-101-09-059 02/07/06 08/21/07 Surface REG mg/kg NA 9.8 J- NA 4,680 J- NA 156 J- NA NAHSS-H-0-101-09-062 02/08/06 08/21/07 Surface REG mg/kg NA 26.5 NA 4,610 J NA 1,070 NA NAHSS-H-0-101-09-064 02/08/06 02/10/06 Surface REG mg/kg 3 J 58.6 9.3 18,500 31,700 360 19 58.3HSS-H-0-101-09-064 02/08/06 11/20/06 Surface REG mg/kg NA 74.7 J- NA 17,400 J- NA 398 J- NA NAHSS-H-0-101-09-067 02/08/06 11/20/06 Surface REG mg/kg NA 35.2 J- NA 6,400 J- NA 639 J- NA NAHSS-H-0-101-09-068 02/08/06 08/21/07 Surface REG mg/kg NA 21.0 NA 3,290 J NA 178 NA NA
Page 28 of 33
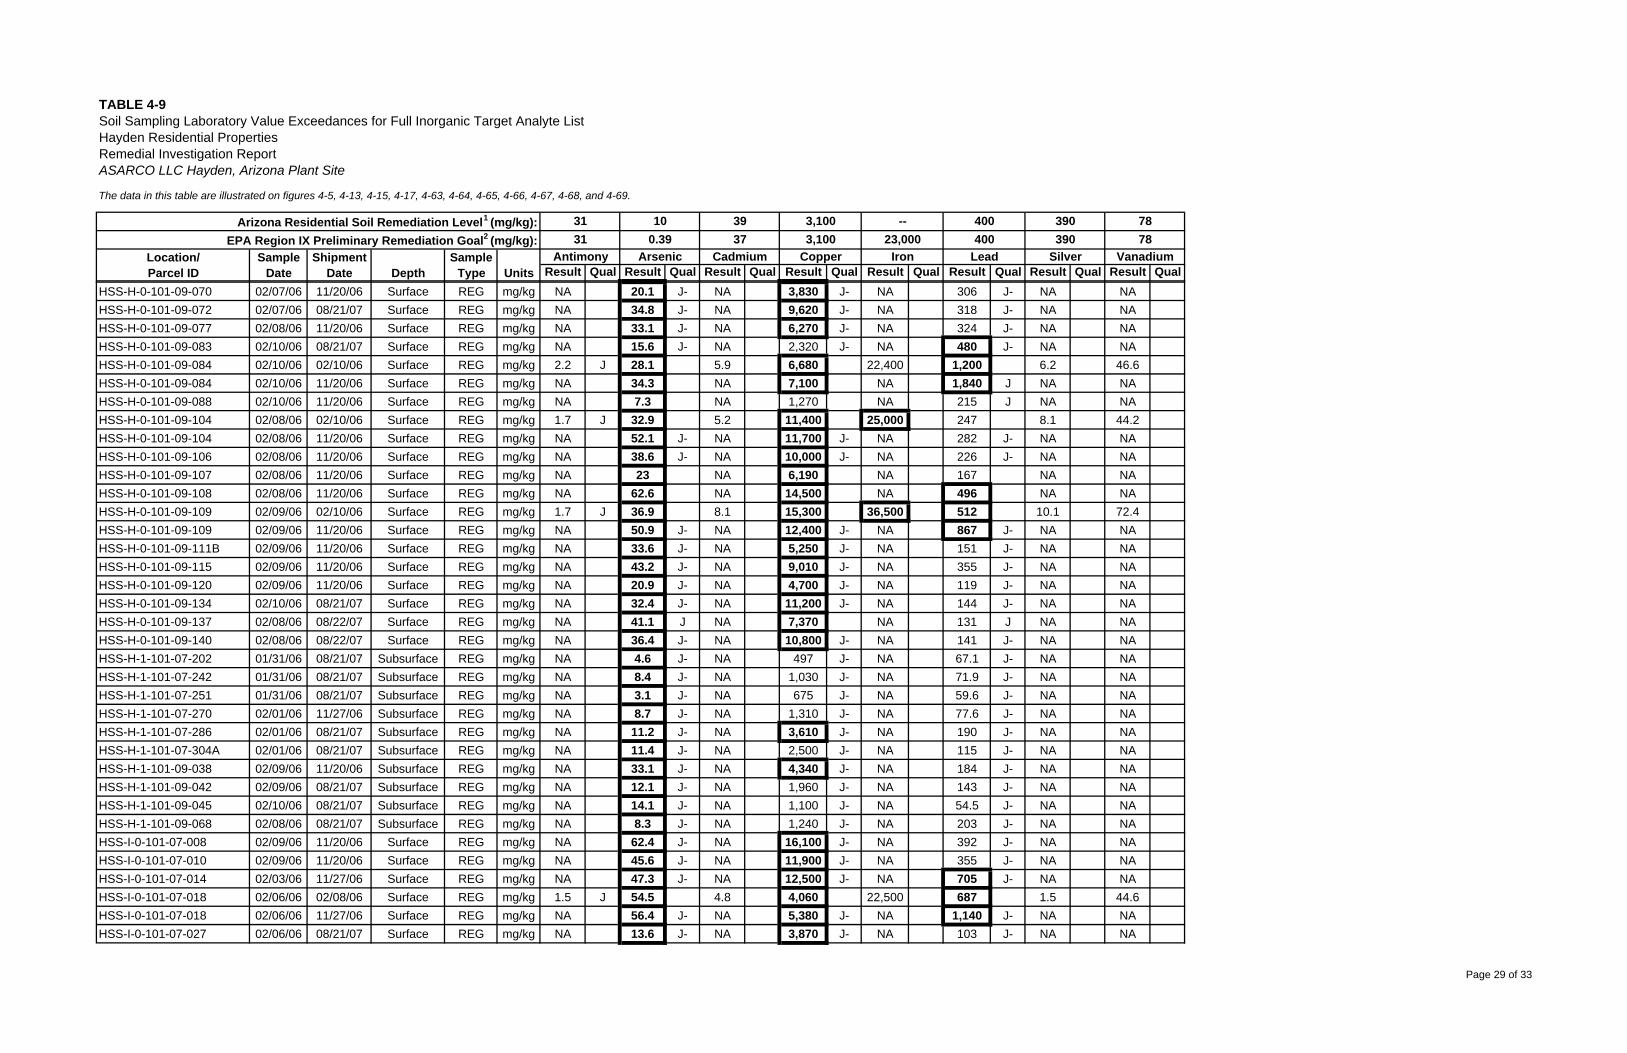
The data in this table are illustrated on figures 4-5, 4-13, 4-15, 4-17, 4-63, 4-64, 4-65, 4-66, 4-67, 4-68, and 4-69.
Result Qual Result Qual Result Qual Result Qual Result Qual Result Qual Result Qual Result Qual
TABLE 4-9
Depth
Soil Sampling Laboratory Value Exceedances for Full Inorganic Target Analyte ListHayden Residential PropertiesRemedial Investigation ReportASARCO LLC Hayden, Arizona Plant Site
Location/Parcel ID
31
ShipmentDate Units
Arizona Residential Soil Remediation Level1 (mg/kg):EPA Region IX Preliminary Remediation Goal2 (mg/kg):
SampleType
SampleDate
10
Antimony Arsenic31 0.39
3937
Cadmium
3,1003,100
Copper
--23,000
Iron
400400
Lead
390390
Silver
7878
Vanadium
HSS-H-0-101-09-070 02/07/06 11/20/06 Surface REG mg/kg NA 20.1 J- NA 3,830 J- NA 306 J- NA NAHSS-H-0-101-09-072 02/07/06 08/21/07 Surface REG mg/kg NA 34.8 J- NA 9,620 J- NA 318 J- NA NAHSS-H-0-101-09-077 02/08/06 11/20/06 Surface REG mg/kg NA 33.1 J- NA 6,270 J- NA 324 J- NA NAHSS-H-0-101-09-083 02/10/06 08/21/07 Surface REG mg/kg NA 15.6 J- NA 2,320 J- NA 480 J- NA NAHSS-H-0-101-09-084 02/10/06 02/10/06 Surface REG mg/kg 2.2 J 28.1 5.9 6,680 22,400 1,200 6.2 46.6HSS-H-0-101-09-084 02/10/06 11/20/06 Surface REG mg/kg NA 34.3 NA 7,100 NA 1,840 J NA NAHSS-H-0-101-09-088 02/10/06 11/20/06 Surface REG mg/kg NA 7.3 NA 1,270 NA 215 J NA NAHSS-H-0-101-09-104 02/08/06 02/10/06 Surface REG mg/kg 1.7 J 32.9 5.2 11,400 25,000 247 8.1 44.2HSS-H-0-101-09-104 02/08/06 11/20/06 Surface REG mg/kg NA 52.1 J- NA 11,700 J- NA 282 J- NA NAHSS-H-0-101-09-106 02/08/06 11/20/06 Surface REG mg/kg NA 38.6 J- NA 10,000 J- NA 226 J- NA NAHSS-H-0-101-09-107 02/08/06 11/20/06 Surface REG mg/kg NA 23 NA 6,190 NA 167 NA NAHSS-H-0-101-09-108 02/08/06 11/20/06 Surface REG mg/kg NA 62.6 NA 14,500 NA 496 NA NAHSS-H-0-101-09-109 02/09/06 02/10/06 Surface REG mg/kg 1.7 J 36.9 8.1 15,300 36,500 512 10.1 72.4HSS-H-0-101-09-109 02/09/06 11/20/06 Surface REG mg/kg NA 50.9 J- NA 12,400 J- NA 867 J- NA NAHSS-H-0-101-09-111B 02/09/06 11/20/06 Surface REG mg/kg NA 33.6 J- NA 5,250 J- NA 151 J- NA NAHSS-H-0-101-09-115 02/09/06 11/20/06 Surface REG mg/kg NA 43.2 J- NA 9,010 J- NA 355 J- NA NAHSS-H-0-101-09-120 02/09/06 11/20/06 Surface REG mg/kg NA 20.9 J- NA 4,700 J- NA 119 J- NA NAHSS-H-0-101-09-134 02/10/06 08/21/07 Surface REG mg/kg NA 32.4 J- NA 11,200 J- NA 144 J- NA NAHSS-H-0-101-09-137 02/08/06 08/22/07 Surface REG mg/kg NA 41.1 J NA 7,370 NA 131 J NA NAHSS-H-0-101-09-140 02/08/06 08/22/07 Surface REG mg/kg NA 36.4 J- NA 10,800 J- NA 141 J- NA NAHSS-H-1-101-07-202 01/31/06 08/21/07 Subsurface REG mg/kg NA 4.6 J- NA 497 J- NA 67.1 J- NA NAHSS-H-1-101-07-242 01/31/06 08/21/07 Subsurface REG mg/kg NA 8.4 J- NA 1,030 J- NA 71.9 J- NA NAHSS-H-1-101-07-251 01/31/06 08/21/07 Subsurface REG mg/kg NA 3.1 J- NA 675 J- NA 59.6 J- NA NAHSS-H-1-101-07-270 02/01/06 11/27/06 Subsurface REG mg/kg NA 8.7 J- NA 1,310 J- NA 77.6 J- NA NAHSS-H-1-101-07-286 02/01/06 08/21/07 Subsurface REG mg/kg NA 11.2 J- NA 3,610 J- NA 190 J- NA NAHSS-H-1-101-07-304A 02/01/06 08/21/07 Subsurface REG mg/kg NA 11.4 J- NA 2,500 J- NA 115 J- NA NAHSS-H-1-101-09-038 02/09/06 11/20/06 Subsurface REG mg/kg NA 33.1 J- NA 4,340 J- NA 184 J- NA NAHSS-H-1-101-09-042 02/09/06 08/21/07 Subsurface REG mg/kg NA 12.1 J- NA 1,960 J- NA 143 J- NA NAHSS-H-1-101-09-045 02/10/06 08/21/07 Subsurface REG mg/kg NA 14.1 J- NA 1,100 J- NA 54.5 J- NA NAHSS-H-1-101-09-068 02/08/06 08/21/07 Subsurface REG mg/kg NA 8.3 J- NA 1,240 J- NA 203 J- NA NAHSS-I-0-101-07-008 02/09/06 11/20/06 Surface REG mg/kg NA 62.4 J- NA 16,100 J- NA 392 J- NA NAHSS-I-0-101-07-010 02/09/06 11/20/06 Surface REG mg/kg NA 45.6 J- NA 11,900 J- NA 355 J- NA NAHSS-I-0-101-07-014 02/03/06 11/27/06 Surface REG mg/kg NA 47.3 J- NA 12,500 J- NA 705 J- NA NAHSS-I-0-101-07-018 02/06/06 02/08/06 Surface REG mg/kg 1.5 J 54.5 4.8 4,060 22,500 687 1.5 44.6HSS-I-0-101-07-018 02/06/06 11/27/06 Surface REG mg/kg NA 56.4 J- NA 5,380 J- NA 1,140 J- NA NAHSS-I-0-101-07-027 02/06/06 08/21/07 Surface REG mg/kg NA 13.6 J- NA 3,870 J- NA 103 J- NA NA
Page 29 of 33
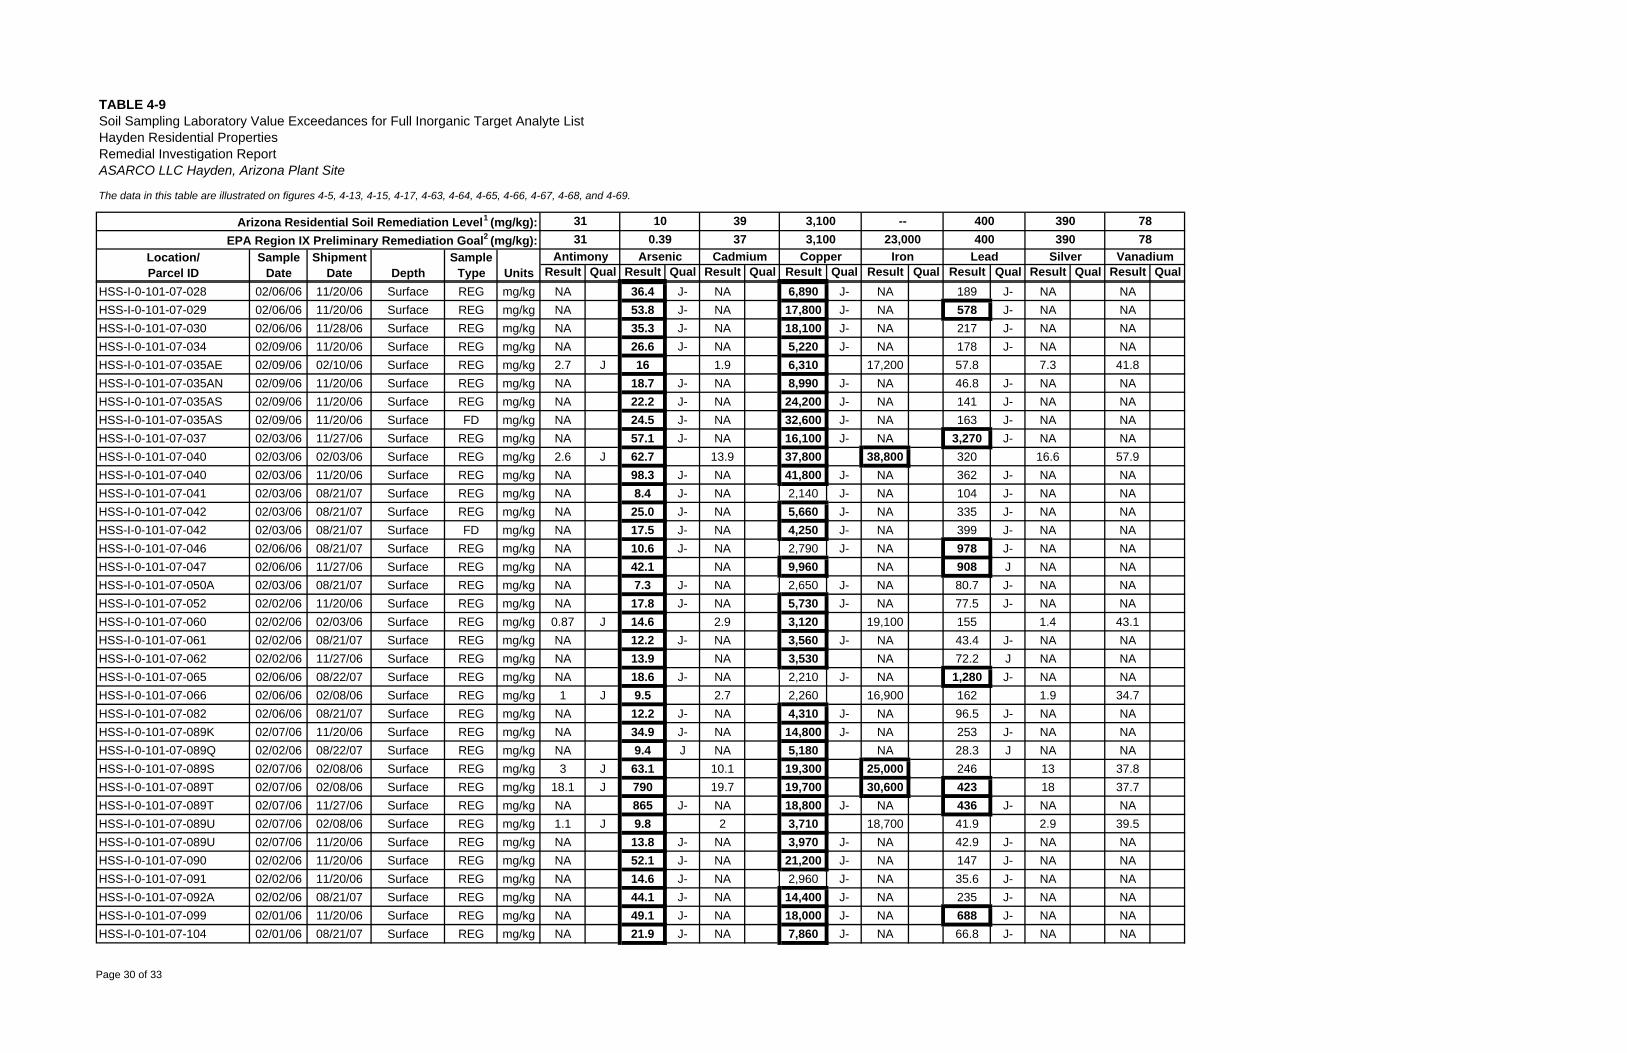
The data in this table are illustrated on figures 4-5, 4-13, 4-15, 4-17, 4-63, 4-64, 4-65, 4-66, 4-67, 4-68, and 4-69.
Result Qual Result Qual Result Qual Result Qual Result Qual Result Qual Result Qual Result Qual
TABLE 4-9
Depth
Soil Sampling Laboratory Value Exceedances for Full Inorganic Target Analyte ListHayden Residential PropertiesRemedial Investigation ReportASARCO LLC Hayden, Arizona Plant Site
Location/Parcel ID
31
ShipmentDate Units
Arizona Residential Soil Remediation Level1 (mg/kg):EPA Region IX Preliminary Remediation Goal2 (mg/kg):
SampleType
SampleDate
10
Antimony Arsenic31 0.39
3937
Cadmium
3,1003,100
Copper
--23,000
Iron
400400
Lead
390390
Silver
7878
Vanadium
HSS-I-0-101-07-028 02/06/06 11/20/06 Surface REG mg/kg NA 36.4 J- NA 6,890 J- NA 189 J- NA NAHSS-I-0-101-07-029 02/06/06 11/20/06 Surface REG mg/kg NA 53.8 J- NA 17,800 J- NA 578 J- NA NAHSS-I-0-101-07-030 02/06/06 11/28/06 Surface REG mg/kg NA 35.3 J- NA 18,100 J- NA 217 J- NA NAHSS-I-0-101-07-034 02/09/06 11/20/06 Surface REG mg/kg NA 26.6 J- NA 5,220 J- NA 178 J- NA NAHSS-I-0-101-07-035AE 02/09/06 02/10/06 Surface REG mg/kg 2.7 J 16 1.9 6,310 17,200 57.8 7.3 41.8HSS-I-0-101-07-035AN 02/09/06 11/20/06 Surface REG mg/kg NA 18.7 J- NA 8,990 J- NA 46.8 J- NA NAHSS-I-0-101-07-035AS 02/09/06 11/20/06 Surface REG mg/kg NA 22.2 J- NA 24,200 J- NA 141 J- NA NAHSS-I-0-101-07-035AS 02/09/06 11/20/06 Surface FD mg/kg NA 24.5 J- NA 32,600 J- NA 163 J- NA NAHSS-I-0-101-07-037 02/03/06 11/27/06 Surface REG mg/kg NA 57.1 J- NA 16,100 J- NA 3,270 J- NA NAHSS-I-0-101-07-040 02/03/06 02/03/06 Surface REG mg/kg 2.6 J 62.7 13.9 37,800 38,800 320 16.6 57.9HSS-I-0-101-07-040 02/03/06 11/20/06 Surface REG mg/kg NA 98.3 J- NA 41,800 J- NA 362 J- NA NAHSS-I-0-101-07-041 02/03/06 08/21/07 Surface REG mg/kg NA 8.4 J- NA 2,140 J- NA 104 J- NA NAHSS-I-0-101-07-042 02/03/06 08/21/07 Surface REG mg/kg NA 25.0 J- NA 5,660 J- NA 335 J- NA NAHSS-I-0-101-07-042 02/03/06 08/21/07 Surface FD mg/kg NA 17.5 J- NA 4,250 J- NA 399 J- NA NAHSS-I-0-101-07-046 02/06/06 08/21/07 Surface REG mg/kg NA 10.6 J- NA 2,790 J- NA 978 J- NA NAHSS-I-0-101-07-047 02/06/06 11/27/06 Surface REG mg/kg NA 42.1 NA 9,960 NA 908 J NA NAHSS-I-0-101-07-050A 02/03/06 08/21/07 Surface REG mg/kg NA 7.3 J- NA 2,650 J- NA 80.7 J- NA NAHSS-I-0-101-07-052 02/02/06 11/20/06 Surface REG mg/kg NA 17.8 J- NA 5,730 J- NA 77.5 J- NA NAHSS-I-0-101-07-060 02/02/06 02/03/06 Surface REG mg/kg 0.87 J 14.6 2.9 3,120 19,100 155 1.4 43.1HSS-I-0-101-07-061 02/02/06 08/21/07 Surface REG mg/kg NA 12.2 J- NA 3,560 J- NA 43.4 J- NA NAHSS-I-0-101-07-062 02/02/06 11/27/06 Surface REG mg/kg NA 13.9 NA 3,530 NA 72.2 J NA NAHSS-I-0-101-07-065 02/06/06 08/22/07 Surface REG mg/kg NA 18.6 J- NA 2,210 J- NA 1,280 J- NA NAHSS-I-0-101-07-066 02/06/06 02/08/06 Surface REG mg/kg 1 J 9.5 2.7 2,260 16,900 162 1.9 34.7HSS-I-0-101-07-082 02/06/06 08/21/07 Surface REG mg/kg NA 12.2 J- NA 4,310 J- NA 96.5 J- NA NAHSS-I-0-101-07-089K 02/07/06 11/20/06 Surface REG mg/kg NA 34.9 J- NA 14,800 J- NA 253 J- NA NAHSS-I-0-101-07-089Q 02/02/06 08/22/07 Surface REG mg/kg NA 9.4 J NA 5,180 NA 28.3 J NA NAHSS-I-0-101-07-089S 02/07/06 02/08/06 Surface REG mg/kg 3 J 63.1 10.1 19,300 25,000 246 13 37.8HSS-I-0-101-07-089T 02/07/06 02/08/06 Surface REG mg/kg 18.1 J 790 19.7 19,700 30,600 423 18 37.7HSS-I-0-101-07-089T 02/07/06 11/27/06 Surface REG mg/kg NA 865 J- NA 18,800 J- NA 436 J- NA NAHSS-I-0-101-07-089U 02/07/06 02/08/06 Surface REG mg/kg 1.1 J 9.8 2 3,710 18,700 41.9 2.9 39.5HSS-I-0-101-07-089U 02/07/06 11/20/06 Surface REG mg/kg NA 13.8 J- NA 3,970 J- NA 42.9 J- NA NAHSS-I-0-101-07-090 02/02/06 11/20/06 Surface REG mg/kg NA 52.1 J- NA 21,200 J- NA 147 J- NA NAHSS-I-0-101-07-091 02/02/06 11/20/06 Surface REG mg/kg NA 14.6 J- NA 2,960 J- NA 35.6 J- NA NAHSS-I-0-101-07-092A 02/02/06 08/21/07 Surface REG mg/kg NA 44.1 J- NA 14,400 J- NA 235 J- NA NAHSS-I-0-101-07-099 02/01/06 11/20/06 Surface REG mg/kg NA 49.1 J- NA 18,000 J- NA 688 J- NA NAHSS-I-0-101-07-104 02/01/06 08/21/07 Surface REG mg/kg NA 21.9 J- NA 7,860 J- NA 66.8 J- NA NA
Page 30 of 33
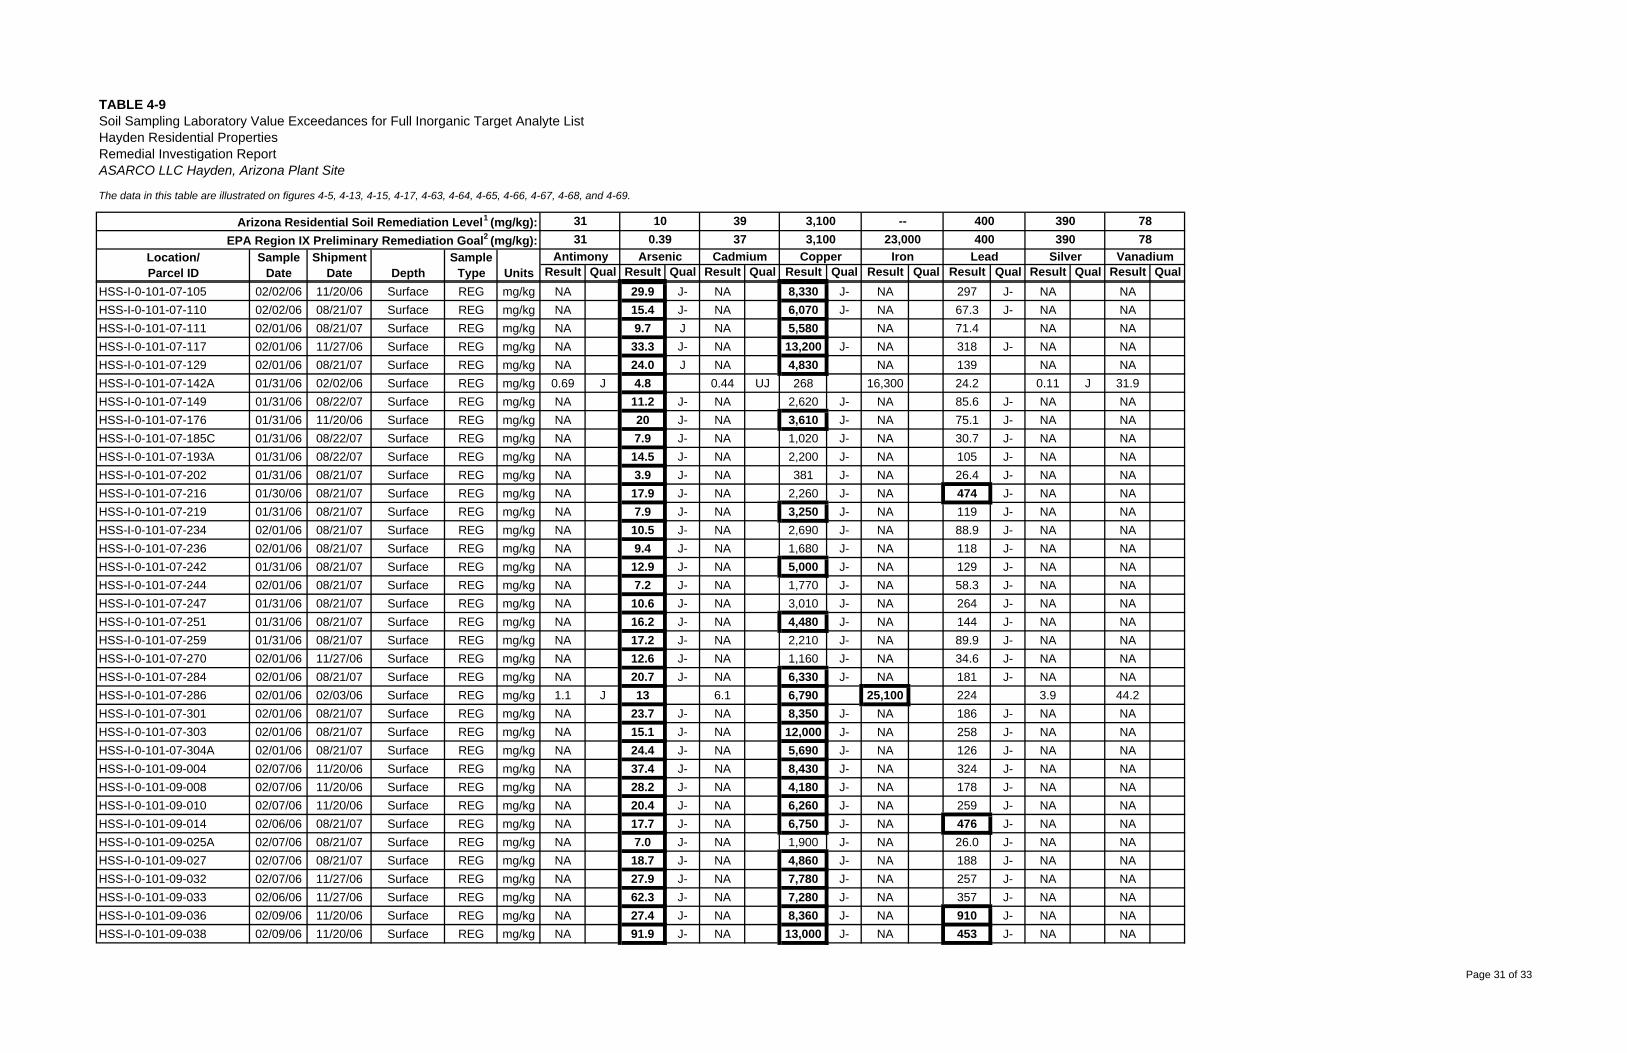
The data in this table are illustrated on figures 4-5, 4-13, 4-15, 4-17, 4-63, 4-64, 4-65, 4-66, 4-67, 4-68, and 4-69.
Result Qual Result Qual Result Qual Result Qual Result Qual Result Qual Result Qual Result Qual
TABLE 4-9
Depth
Soil Sampling Laboratory Value Exceedances for Full Inorganic Target Analyte ListHayden Residential PropertiesRemedial Investigation ReportASARCO LLC Hayden, Arizona Plant Site
Location/Parcel ID
31
ShipmentDate Units
Arizona Residential Soil Remediation Level1 (mg/kg):EPA Region IX Preliminary Remediation Goal2 (mg/kg):
SampleType
SampleDate
10
Antimony Arsenic31 0.39
3937
Cadmium
3,1003,100
Copper
--23,000
Iron
400400
Lead
390390
Silver
7878
Vanadium
HSS-I-0-101-07-105 02/02/06 11/20/06 Surface REG mg/kg NA 29.9 J- NA 8,330 J- NA 297 J- NA NAHSS-I-0-101-07-110 02/02/06 08/21/07 Surface REG mg/kg NA 15.4 J- NA 6,070 J- NA 67.3 J- NA NAHSS-I-0-101-07-111 02/01/06 08/21/07 Surface REG mg/kg NA 9.7 J NA 5,580 NA 71.4 NA NAHSS-I-0-101-07-117 02/01/06 11/27/06 Surface REG mg/kg NA 33.3 J- NA 13,200 J- NA 318 J- NA NAHSS-I-0-101-07-129 02/01/06 08/21/07 Surface REG mg/kg NA 24.0 J NA 4,830 NA 139 NA NAHSS-I-0-101-07-142A 01/31/06 02/02/06 Surface REG mg/kg 0.69 J 4.8 0.44 UJ 268 16,300 24.2 0.11 J 31.9HSS-I-0-101-07-149 01/31/06 08/22/07 Surface REG mg/kg NA 11.2 J- NA 2,620 J- NA 85.6 J- NA NAHSS-I-0-101-07-176 01/31/06 11/20/06 Surface REG mg/kg NA 20 J- NA 3,610 J- NA 75.1 J- NA NAHSS-I-0-101-07-185C 01/31/06 08/22/07 Surface REG mg/kg NA 7.9 J- NA 1,020 J- NA 30.7 J- NA NAHSS-I-0-101-07-193A 01/31/06 08/22/07 Surface REG mg/kg NA 14.5 J- NA 2,200 J- NA 105 J- NA NAHSS-I-0-101-07-202 01/31/06 08/21/07 Surface REG mg/kg NA 3.9 J- NA 381 J- NA 26.4 J- NA NAHSS-I-0-101-07-216 01/30/06 08/21/07 Surface REG mg/kg NA 17.9 J- NA 2,260 J- NA 474 J- NA NAHSS-I-0-101-07-219 01/31/06 08/21/07 Surface REG mg/kg NA 7.9 J- NA 3,250 J- NA 119 J- NA NAHSS-I-0-101-07-234 02/01/06 08/21/07 Surface REG mg/kg NA 10.5 J- NA 2,690 J- NA 88.9 J- NA NAHSS-I-0-101-07-236 02/01/06 08/21/07 Surface REG mg/kg NA 9.4 J- NA 1,680 J- NA 118 J- NA NAHSS-I-0-101-07-242 01/31/06 08/21/07 Surface REG mg/kg NA 12.9 J- NA 5,000 J- NA 129 J- NA NAHSS-I-0-101-07-244 02/01/06 08/21/07 Surface REG mg/kg NA 7.2 J- NA 1,770 J- NA 58.3 J- NA NAHSS-I-0-101-07-247 01/31/06 08/21/07 Surface REG mg/kg NA 10.6 J- NA 3,010 J- NA 264 J- NA NAHSS-I-0-101-07-251 01/31/06 08/21/07 Surface REG mg/kg NA 16.2 J- NA 4,480 J- NA 144 J- NA NAHSS-I-0-101-07-259 01/31/06 08/21/07 Surface REG mg/kg NA 17.2 J- NA 2,210 J- NA 89.9 J- NA NAHSS-I-0-101-07-270 02/01/06 11/27/06 Surface REG mg/kg NA 12.6 J- NA 1,160 J- NA 34.6 J- NA NAHSS-I-0-101-07-284 02/01/06 08/21/07 Surface REG mg/kg NA 20.7 J- NA 6,330 J- NA 181 J- NA NAHSS-I-0-101-07-286 02/01/06 02/03/06 Surface REG mg/kg 1.1 J 13 6.1 6,790 25,100 224 3.9 44.2HSS-I-0-101-07-301 02/01/06 08/21/07 Surface REG mg/kg NA 23.7 J- NA 8,350 J- NA 186 J- NA NAHSS-I-0-101-07-303 02/01/06 08/21/07 Surface REG mg/kg NA 15.1 J- NA 12,000 J- NA 258 J- NA NAHSS-I-0-101-07-304A 02/01/06 08/21/07 Surface REG mg/kg NA 24.4 J- NA 5,690 J- NA 126 J- NA NAHSS-I-0-101-09-004 02/07/06 11/20/06 Surface REG mg/kg NA 37.4 J- NA 8,430 J- NA 324 J- NA NAHSS-I-0-101-09-008 02/07/06 11/20/06 Surface REG mg/kg NA 28.2 J- NA 4,180 J- NA 178 J- NA NAHSS-I-0-101-09-010 02/07/06 11/20/06 Surface REG mg/kg NA 20.4 J- NA 6,260 J- NA 259 J- NA NAHSS-I-0-101-09-014 02/06/06 08/21/07 Surface REG mg/kg NA 17.7 J- NA 6,750 J- NA 476 J- NA NAHSS-I-0-101-09-025A 02/07/06 08/21/07 Surface REG mg/kg NA 7.0 J- NA 1,900 J- NA 26.0 J- NA NAHSS-I-0-101-09-027 02/07/06 08/21/07 Surface REG mg/kg NA 18.7 J- NA 4,860 J- NA 188 J- NA NAHSS-I-0-101-09-032 02/07/06 11/27/06 Surface REG mg/kg NA 27.9 J- NA 7,780 J- NA 257 J- NA NAHSS-I-0-101-09-033 02/06/06 11/27/06 Surface REG mg/kg NA 62.3 J- NA 7,280 J- NA 357 J- NA NAHSS-I-0-101-09-036 02/09/06 11/20/06 Surface REG mg/kg NA 27.4 J- NA 8,360 J- NA 910 J- NA NAHSS-I-0-101-09-038 02/09/06 11/20/06 Surface REG mg/kg NA 91.9 J- NA 13,000 J- NA 453 J- NA NA
Page 31 of 33
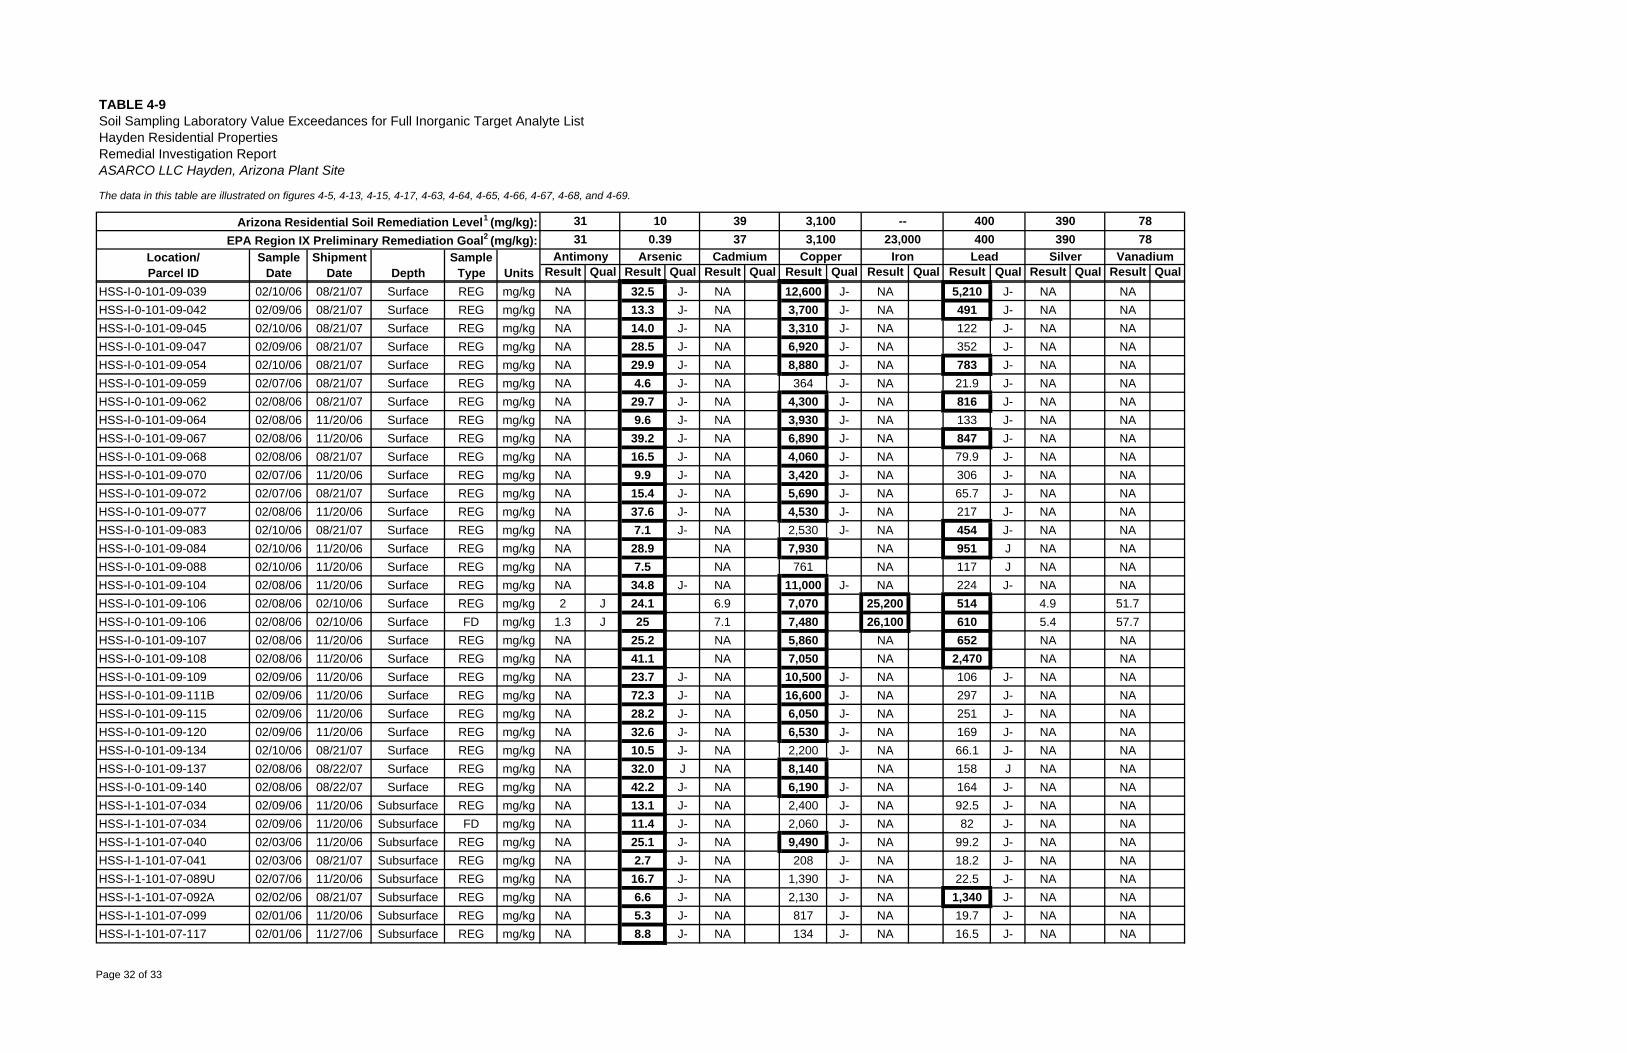
The data in this table are illustrated on figures 4-5, 4-13, 4-15, 4-17, 4-63, 4-64, 4-65, 4-66, 4-67, 4-68, and 4-69.
Result Qual Result Qual Result Qual Result Qual Result Qual Result Qual Result Qual Result Qual
TABLE 4-9
Depth
Soil Sampling Laboratory Value Exceedances for Full Inorganic Target Analyte ListHayden Residential PropertiesRemedial Investigation ReportASARCO LLC Hayden, Arizona Plant Site
Location/Parcel ID
31
ShipmentDate Units
Arizona Residential Soil Remediation Level1 (mg/kg):EPA Region IX Preliminary Remediation Goal2 (mg/kg):
SampleType
SampleDate
10
Antimony Arsenic31 0.39
3937
Cadmium
3,1003,100
Copper
--23,000
Iron
400400
Lead
390390
Silver
7878
Vanadium
HSS-I-0-101-09-039 02/10/06 08/21/07 Surface REG mg/kg NA 32.5 J- NA 12,600 J- NA 5,210 J- NA NAHSS-I-0-101-09-042 02/09/06 08/21/07 Surface REG mg/kg NA 13.3 J- NA 3,700 J- NA 491 J- NA NAHSS-I-0-101-09-045 02/10/06 08/21/07 Surface REG mg/kg NA 14.0 J- NA 3,310 J- NA 122 J- NA NAHSS-I-0-101-09-047 02/09/06 08/21/07 Surface REG mg/kg NA 28.5 J- NA 6,920 J- NA 352 J- NA NAHSS-I-0-101-09-054 02/10/06 08/21/07 Surface REG mg/kg NA 29.9 J- NA 8,880 J- NA 783 J- NA NAHSS-I-0-101-09-059 02/07/06 08/21/07 Surface REG mg/kg NA 4.6 J- NA 364 J- NA 21.9 J- NA NAHSS-I-0-101-09-062 02/08/06 08/21/07 Surface REG mg/kg NA 29.7 J- NA 4,300 J- NA 816 J- NA NAHSS-I-0-101-09-064 02/08/06 11/20/06 Surface REG mg/kg NA 9.6 J- NA 3,930 J- NA 133 J- NA NAHSS-I-0-101-09-067 02/08/06 11/20/06 Surface REG mg/kg NA 39.2 J- NA 6,890 J- NA 847 J- NA NAHSS-I-0-101-09-068 02/08/06 08/21/07 Surface REG mg/kg NA 16.5 J- NA 4,060 J- NA 79.9 J- NA NAHSS-I-0-101-09-070 02/07/06 11/20/06 Surface REG mg/kg NA 9.9 J- NA 3,420 J- NA 306 J- NA NAHSS-I-0-101-09-072 02/07/06 08/21/07 Surface REG mg/kg NA 15.4 J- NA 5,690 J- NA 65.7 J- NA NAHSS-I-0-101-09-077 02/08/06 11/20/06 Surface REG mg/kg NA 37.6 J- NA 4,530 J- NA 217 J- NA NAHSS-I-0-101-09-083 02/10/06 08/21/07 Surface REG mg/kg NA 7.1 J- NA 2,530 J- NA 454 J- NA NAHSS-I-0-101-09-084 02/10/06 11/20/06 Surface REG mg/kg NA 28.9 NA 7,930 NA 951 J NA NAHSS-I-0-101-09-088 02/10/06 11/20/06 Surface REG mg/kg NA 7.5 NA 761 NA 117 J NA NAHSS-I-0-101-09-104 02/08/06 11/20/06 Surface REG mg/kg NA 34.8 J- NA 11,000 J- NA 224 J- NA NAHSS-I-0-101-09-106 02/08/06 02/10/06 Surface REG mg/kg 2 J 24.1 6.9 7,070 25,200 514 4.9 51.7HSS-I-0-101-09-106 02/08/06 02/10/06 Surface FD mg/kg 1.3 J 25 7.1 7,480 26,100 610 5.4 57.7HSS-I-0-101-09-107 02/08/06 11/20/06 Surface REG mg/kg NA 25.2 NA 5,860 NA 652 NA NAHSS-I-0-101-09-108 02/08/06 11/20/06 Surface REG mg/kg NA 41.1 NA 7,050 NA 2,470 NA NAHSS-I-0-101-09-109 02/09/06 11/20/06 Surface REG mg/kg NA 23.7 J- NA 10,500 J- NA 106 J- NA NAHSS-I-0-101-09-111B 02/09/06 11/20/06 Surface REG mg/kg NA 72.3 J- NA 16,600 J- NA 297 J- NA NAHSS-I-0-101-09-115 02/09/06 11/20/06 Surface REG mg/kg NA 28.2 J- NA 6,050 J- NA 251 J- NA NAHSS-I-0-101-09-120 02/09/06 11/20/06 Surface REG mg/kg NA 32.6 J- NA 6,530 J- NA 169 J- NA NAHSS-I-0-101-09-134 02/10/06 08/21/07 Surface REG mg/kg NA 10.5 J- NA 2,200 J- NA 66.1 J- NA NAHSS-I-0-101-09-137 02/08/06 08/22/07 Surface REG mg/kg NA 32.0 J NA 8,140 NA 158 J NA NAHSS-I-0-101-09-140 02/08/06 08/22/07 Surface REG mg/kg NA 42.2 J- NA 6,190 J- NA 164 J- NA NAHSS-I-1-101-07-034 02/09/06 11/20/06 Subsurface REG mg/kg NA 13.1 J- NA 2,400 J- NA 92.5 J- NA NAHSS-I-1-101-07-034 02/09/06 11/20/06 Subsurface FD mg/kg NA 11.4 J- NA 2,060 J- NA 82 J- NA NAHSS-I-1-101-07-040 02/03/06 11/20/06 Subsurface REG mg/kg NA 25.1 J- NA 9,490 J- NA 99.2 J- NA NAHSS-I-1-101-07-041 02/03/06 08/21/07 Subsurface REG mg/kg NA 2.7 J- NA 208 J- NA 18.2 J- NA NAHSS-I-1-101-07-089U 02/07/06 11/20/06 Subsurface REG mg/kg NA 16.7 J- NA 1,390 J- NA 22.5 J- NA NAHSS-I-1-101-07-092A 02/02/06 08/21/07 Subsurface REG mg/kg NA 6.6 J- NA 2,130 J- NA 1,340 J- NA NAHSS-I-1-101-07-099 02/01/06 11/20/06 Subsurface REG mg/kg NA 5.3 J- NA 817 J- NA 19.7 J- NA NAHSS-I-1-101-07-117 02/01/06 11/27/06 Subsurface REG mg/kg NA 8.8 J- NA 134 J- NA 16.5 J- NA NA
Page 32 of 33
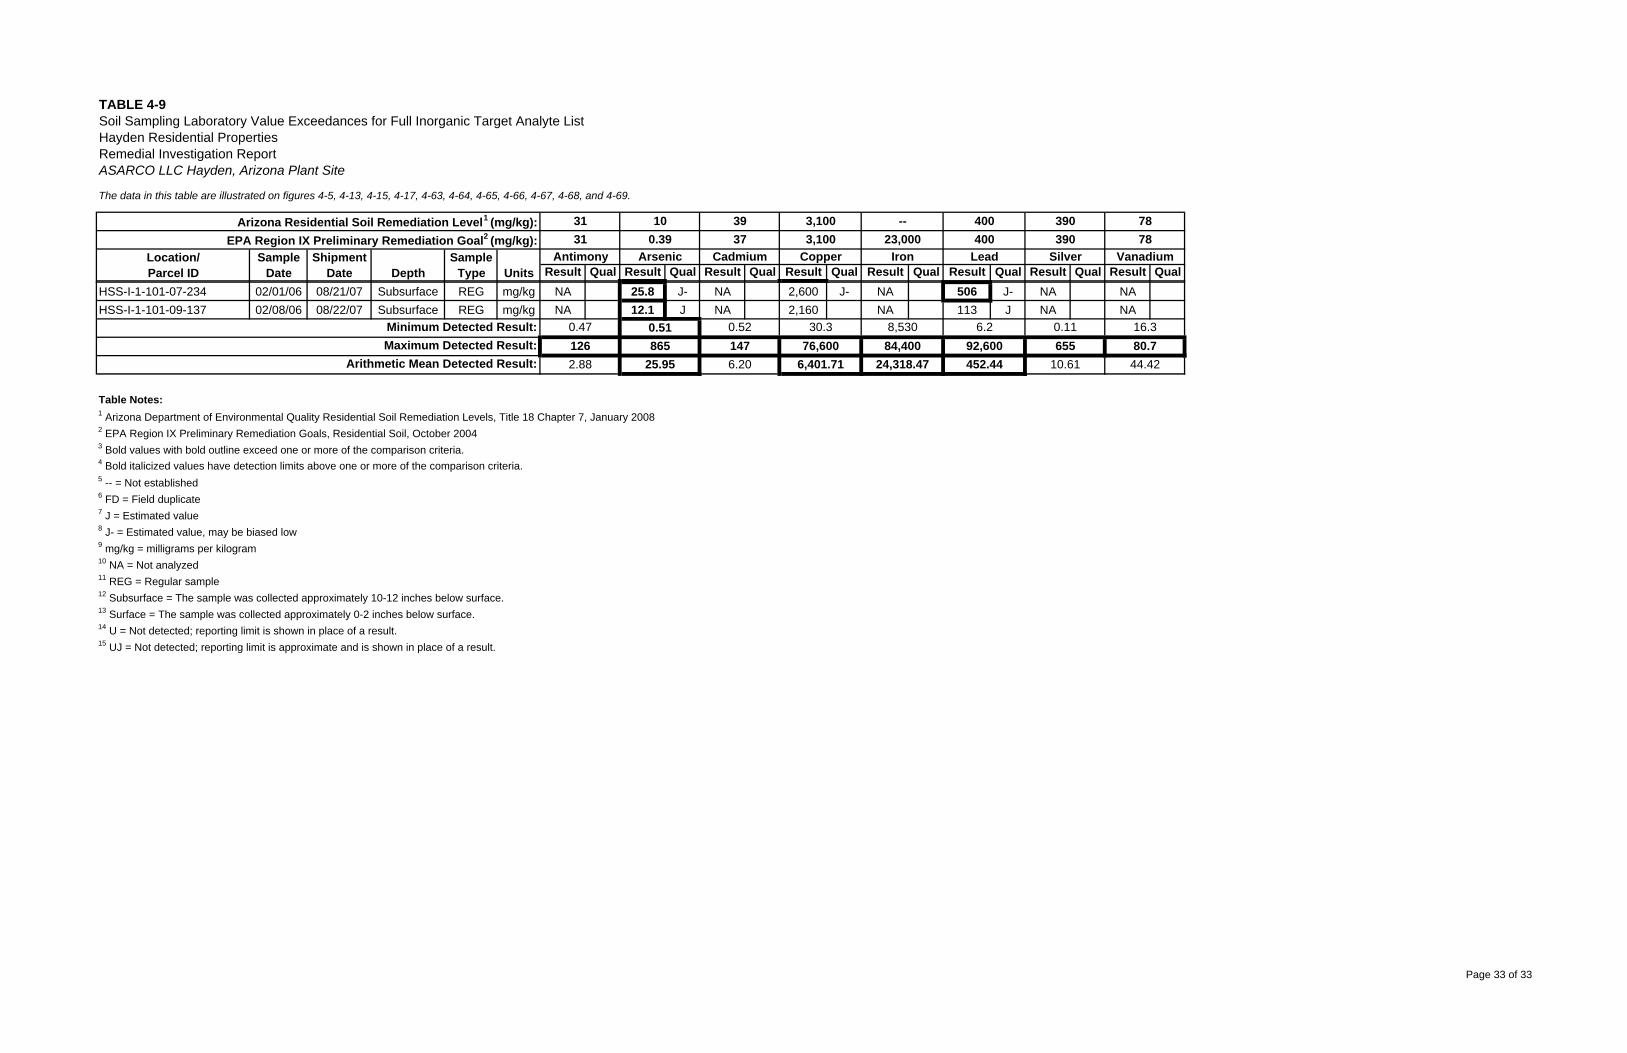
The data in this table are illustrated on figures 4-5, 4-13, 4-15, 4-17, 4-63, 4-64, 4-65, 4-66, 4-67, 4-68, and 4-69.
Result Qual Result Qual Result Qual Result Qual Result Qual Result Qual Result Qual Result Qual
TABLE 4-9
Depth
Soil Sampling Laboratory Value Exceedances for Full Inorganic Target Analyte ListHayden Residential PropertiesRemedial Investigation ReportASARCO LLC Hayden, Arizona Plant Site
Location/Parcel ID
31
ShipmentDate Units
Arizona Residential Soil Remediation Level1 (mg/kg):EPA Region IX Preliminary Remediation Goal2 (mg/kg):
SampleType
SampleDate
10
Antimony Arsenic31 0.39
3937
Cadmium
3,1003,100
Copper
--23,000
Iron
400400
Lead
390390
Silver
7878
Vanadium
HSS-I-1-101-07-234 02/01/06 08/21/07 Subsurface REG mg/kg NA 25.8 J- NA 2,600 J- NA 506 J- NA NAHSS-I-1-101-09-137 02/08/06 08/22/07 Subsurface REG mg/kg NA 12.1 J NA 2,160 NA 113 J NA NA
Table Notes:1 Arizona Department of Environmental Quality Residential Soil Remediation Levels, Title 18 Chapter 7, January 20082 EPA Region IX Preliminary Remediation Goals, Residential Soil, October 20043 Bold values with bold outline exceed one or more of the comparison criteria.
5 -- = Not established6 FD = Field duplicate7 J = Estimated value8 J- = Estimated value, may be biased low9 mg/kg = milligrams per kilogram10 NA = Not analyzed11 REG = Regular sample12 Subsurface = The sample was collected approximately 10-12 inches below surface.13 Surface = The sample was collected approximately 0-2 inches below surface.14 U = Not detected; reporting limit is shown in place of a result.15 UJ = Not detected; reporting limit is approximate and is shown in place of a result.
Minimum Detected Result: 0.47 0.51 0.52 30.3 8,530 6.2 0.11 16.3Maximum Detected Result: 126 865 147 76,600 84,400 92,600 655 80.7
24,318.47 452.44 44.4210.61
4 Bold italicized values have detection limits above one or more of the comparison criteria.
6,401.71Arithmetic Mean Detected Result: 2.88 25.95 6.20
Page 33 of 33
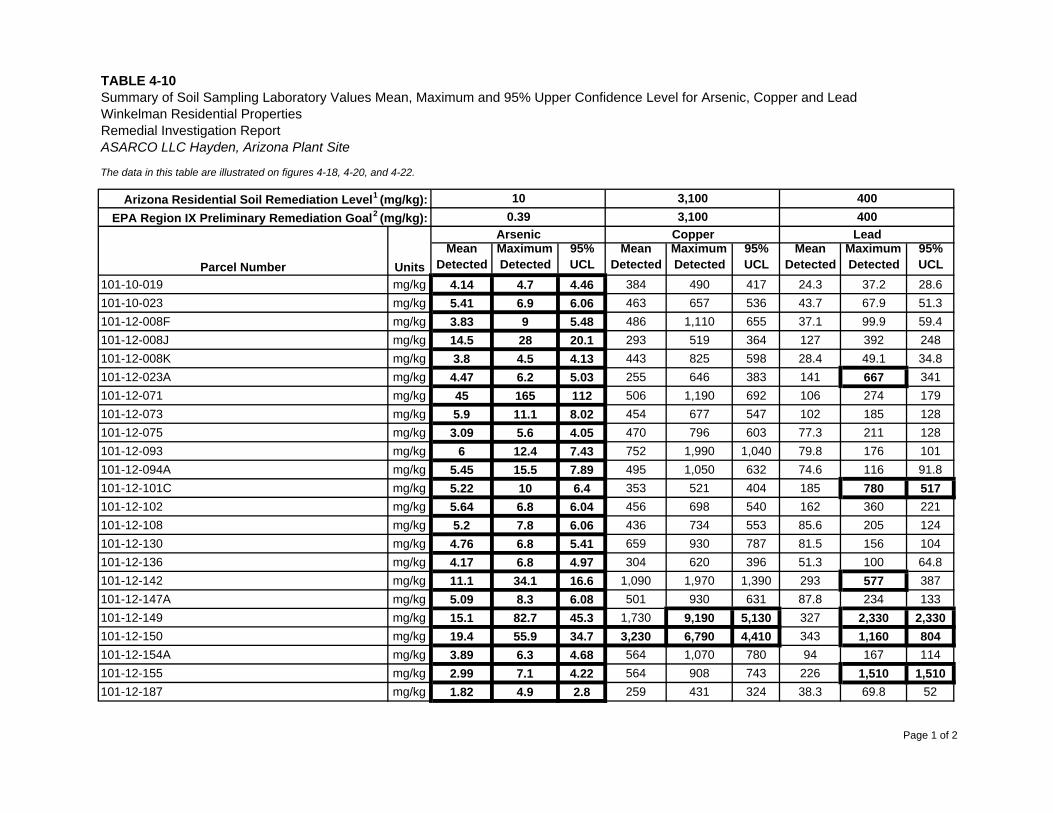
Winkelman Residential Properties
The data in this table are illustrated on figures 4-18, 4-20, and 4-22.
MeanDetected
MaximumDetected
95%UCL
MeanDetected
MaximumDetected
95%UCL
MeanDetected
MaximumDetected
95%UCL
101-10-019 mg/kg 4.14 4.7 4.46 384 490 417 24.3 37.2 28.6101-10-023 mg/kg 5.41 6.9 6.06 463 657 536 43.7 67.9 51.3101-12-008F mg/kg 3.83 9 5.48 486 1,110 655 37.1 99.9 59.4101-12-008J mg/kg 14.5 28 20.1 293 519 364 127 392 248101-12-008K mg/kg 3.8 4.5 4.13 443 825 598 28.4 49.1 34.8101-12-023A mg/kg 4.47 6.2 5.03 255 646 383 141 667 341101-12-071 mg/kg 45 165 112 506 1,190 692 106 274 179101-12-073 mg/kg 5.9 11.1 8.02 454 677 547 102 185 128101-12-075 mg/kg 3.09 5.6 4.05 470 796 603 77.3 211 128101-12-093 mg/kg 6 12.4 7.43 752 1,990 1,040 79.8 176 101101-12-094A mg/kg 5.45 15.5 7.89 495 1,050 632 74.6 116 91.8101-12-101C mg/kg 5.22 10 6.4 353 521 404 185 780 517101-12-102 mg/kg 5.64 6.8 6.04 456 698 540 162 360 221101-12-108 mg/kg 5.2 7.8 6.06 436 734 553 85.6 205 124101-12-130 mg/kg 4.76 6.8 5.41 659 930 787 81.5 156 104101-12-136 mg/kg 4.17 6.8 4.97 304 620 396 51.3 100 64.8101-12-142 mg/kg 11.1 34.1 16.6 1,090 1,970 1,390 293 577 387101-12-147A mg/kg 5.09 8.3 6.08 501 930 631 87.8 234 133101-12-149 mg/kg 15.1 82.7 45.3 1,730 9,190 5,130 327 2,330 2,330101-12-150 mg/kg 19.4 55.9 34.7 3,230 6,790 4,410 343 1,160 804101-12-154A mg/kg 3.89 6.3 4.68 564 1,070 780 94 167 114101-12-155 mg/kg 2.99 7.1 4.22 564 908 743 226 1,510 1,510101-12-187 mg/kg 1.82 4.9 2.8 259 431 324 38.3 69.8 52
Parcel Number
TABLE 4-10
Remedial Investigation ReportASARCO LLC Hayden, Arizona Plant Site
Summary of Soil Sampling Laboratory Values Mean, Maximum and 95% Upper Confidence Level for Arsenic, Copper and Lead
Arsenic Copper Lead
Units
400400
Arizona Residential Soil Remediation Level1 (mg/kg):EPA Region IX Preliminary Remediation Goal2 (mg/kg):
3,1003,100
100.39
Page 1 of 2
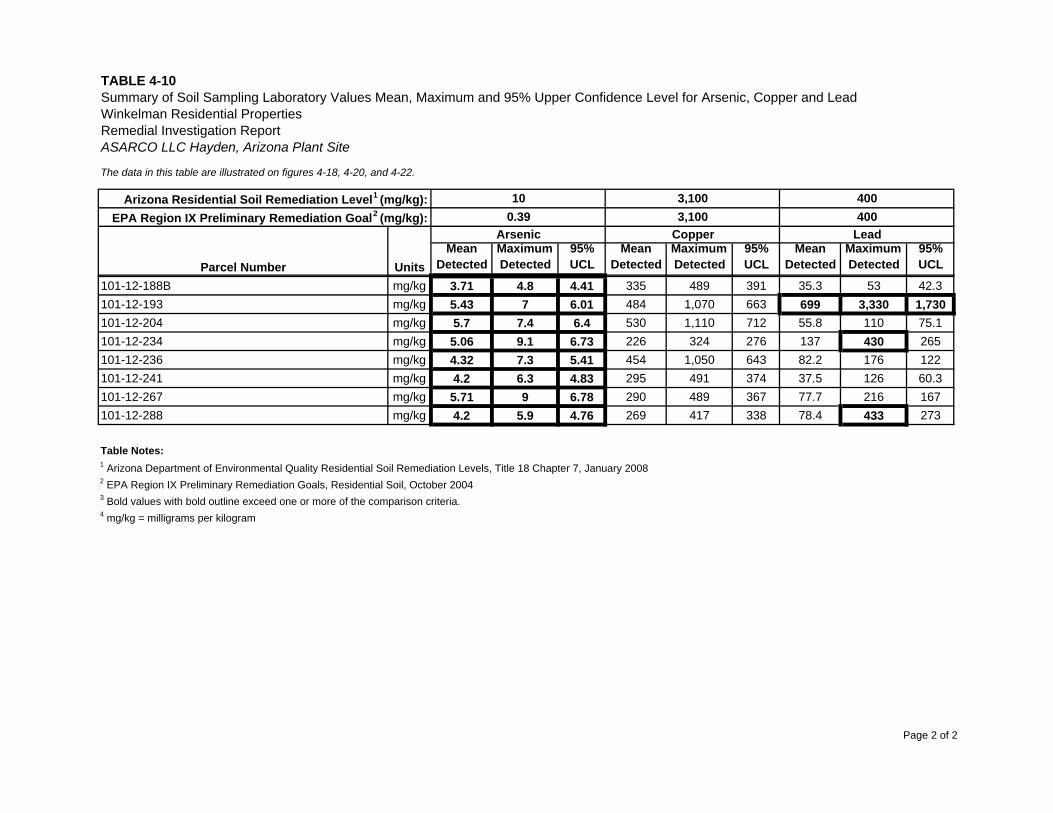
Winkelman Residential Properties
The data in this table are illustrated on figures 4-18, 4-20, and 4-22.
MeanDetected
MaximumDetected
95%UCL
MeanDetected
MaximumDetected
95%UCL
MeanDetected
MaximumDetected
95%UCLParcel Number
TABLE 4-10
Remedial Investigation ReportASARCO LLC Hayden, Arizona Plant Site
Summary of Soil Sampling Laboratory Values Mean, Maximum and 95% Upper Confidence Level for Arsenic, Copper and Lead
Arsenic Copper Lead
Units
400400
Arizona Residential Soil Remediation Level1 (mg/kg):EPA Region IX Preliminary Remediation Goal2 (mg/kg):
3,1003,100
100.39
101-12-188B mg/kg 3.71 4.8 4.41 335 489 391 35.3 53 42.3101-12-193 mg/kg 5.43 7 6.01 484 1,070 663 699 3,330 1,730101-12-204 mg/kg 5.7 7.4 6.4 530 1,110 712 55.8 110 75.1101-12-234 mg/kg 5.06 9.1 6.73 226 324 276 137 430 265101-12-236 mg/kg 4.32 7.3 5.41 454 1,050 643 82.2 176 122101-12-241 mg/kg 4.2 6.3 4.83 295 491 374 37.5 126 60.3101-12-267 mg/kg 5.71 9 6.78 290 489 367 77.7 216 167101-12-288 mg/kg 4.2 5.9 4.76 269 417 338 78.4 433 273
Table Notes:1 Arizona Department of Environmental Quality Residential Soil Remediation Levels, Title 18 Chapter 7, January 20082 EPA Region IX Preliminary Remediation Goals, Residential Soil, October 20043 Bold values with bold outline exceed one or more of the comparison criteria.4 mg/kg = milligrams per kilogram
Page 2 of 2
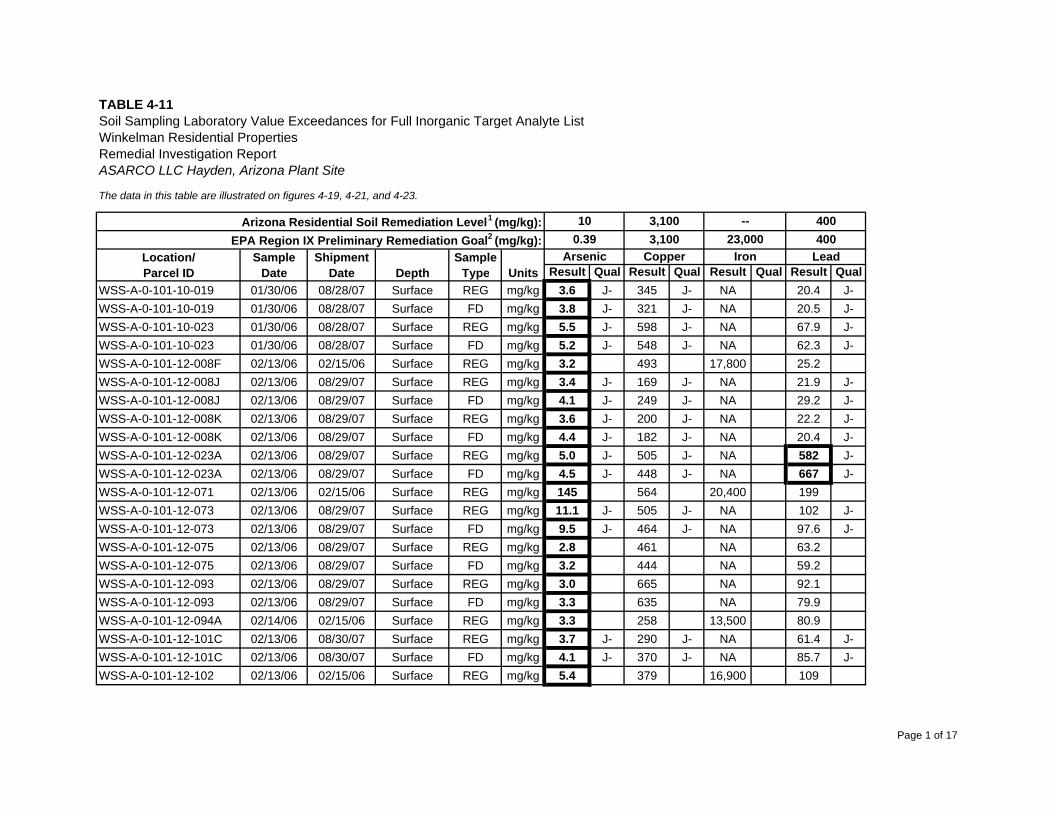
The data in this table are illustrated on figures 4-19, 4-21, and 4-23.
Result Qual Result Qual Result Qual Result QualWSS-A-0-101-10-019 01/30/06 08/28/07 Surface REG mg/kg 3.6 J- 345 J- NA 20.4 J-WSS-A-0-101-10-019 01/30/06 08/28/07 Surface FD mg/kg 3.8 J- 321 J- NA 20.5 J-WSS-A-0-101-10-023 01/30/06 08/28/07 Surface REG mg/kg 5.5 J- 598 J- NA 67.9 J-WSS-A-0-101-10-023 01/30/06 08/28/07 Surface FD mg/kg 5.2 J- 548 J- NA 62.3 J-WSS-A-0-101-12-008F 02/13/06 02/15/06 Surface REG mg/kg 3.2 493 17,800 25.2WSS-A-0-101-12-008J 02/13/06 08/29/07 Surface REG mg/kg 3.4 J- 169 J- NA 21.9 J-WSS-A-0-101-12-008J 02/13/06 08/29/07 Surface FD mg/kg 4.1 J- 249 J- NA 29.2 J-WSS-A-0-101-12-008K 02/13/06 08/29/07 Surface REG mg/kg 3.6 J- 200 J- NA 22.2 J-WSS-A-0-101-12-008K 02/13/06 08/29/07 Surface FD mg/kg 4.4 J- 182 J- NA 20.4 J-WSS-A-0-101-12-023A 02/13/06 08/29/07 Surface REG mg/kg 5.0 J- 505 J- NA 582 J-WSS-A-0-101-12-023A 02/13/06 08/29/07 Surface FD mg/kg 4.5 J- 448 J- NA 667 J-WSS-A-0-101-12-071 02/13/06 02/15/06 Surface REG mg/kg 145 564 20,400 199WSS-A-0-101-12-073 02/13/06 08/29/07 Surface REG mg/kg 11.1 J- 505 J- NA 102 J-WSS-A-0-101-12-073 02/13/06 08/29/07 Surface FD mg/kg 9.5 J- 464 J- NA 97.6 J-WSS-A-0-101-12-075 02/13/06 08/29/07 Surface REG mg/kg 2.8 461 NA 63.2WSS-A-0-101-12-075 02/13/06 08/29/07 Surface FD mg/kg 3.2 444 NA 59.2WSS-A-0-101-12-093 02/13/06 08/29/07 Surface REG mg/kg 3.0 665 NA 92.1WSS-A-0-101-12-093 02/13/06 08/29/07 Surface FD mg/kg 3.3 635 NA 79.9WSS-A-0-101-12-094A 02/14/06 02/15/06 Surface REG mg/kg 3.3 258 13,500 80.9WSS-A-0-101-12-101C 02/13/06 08/30/07 Surface REG mg/kg 3.7 J- 290 J- NA 61.4 J-WSS-A-0-101-12-101C 02/13/06 08/30/07 Surface FD mg/kg 4.1 J- 370 J- NA 85.7 J-WSS-A-0-101-12-102 02/13/06 02/15/06 Surface REG mg/kg 5.4 379 16,900 109
--23,000
IronArsenic0.39
Copper
10
Units
Arizona Residential Soil Remediation Level1 (mg/kg): 400400
LeadEPA Region IX Preliminary Remediation Goal2 (mg/kg):
SampleType
SampleDate
3,1003,100
TABLE 4-11
Depth
Winkelman Residential PropertiesRemedial Investigation ReportASARCO LLC Hayden, Arizona Plant Site
Location/Parcel ID
Soil Sampling Laboratory Value Exceedances for Full Inorganic Target Analyte List
ShipmentDate
Page 1 of 17
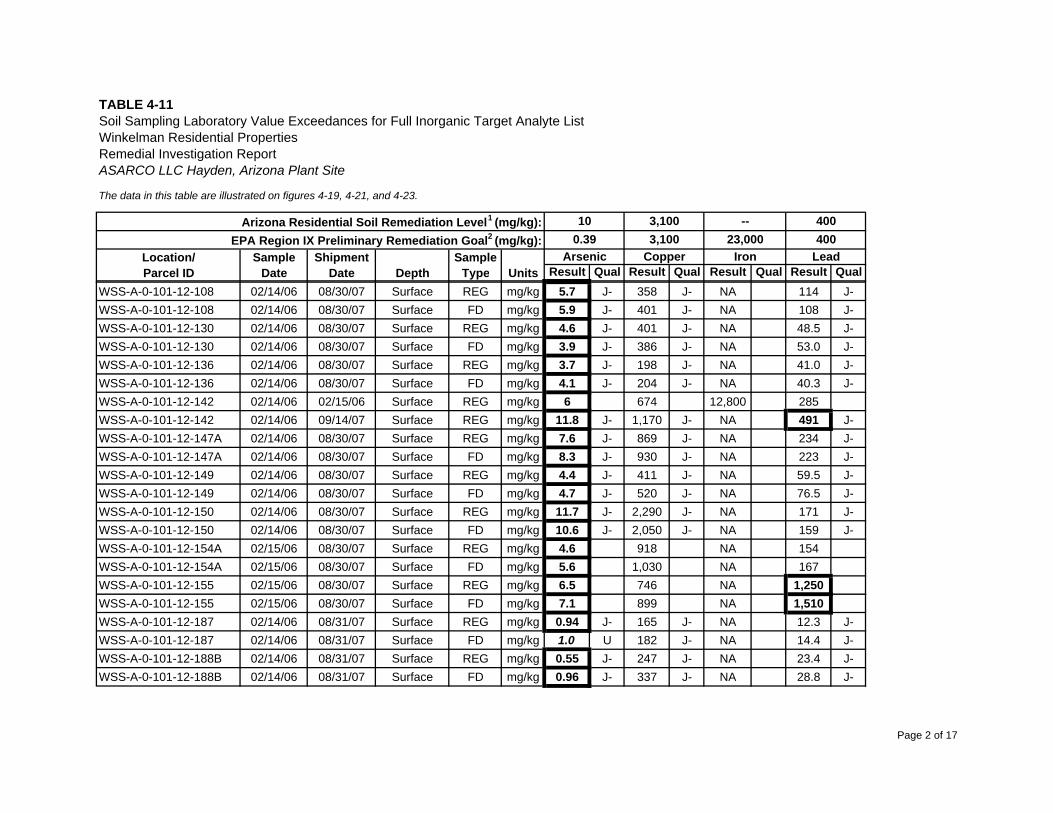
The data in this table are illustrated on figures 4-19, 4-21, and 4-23.
Result Qual Result Qual Result Qual Result Qual
--23,000
IronArsenic0.39
Copper
10
Units
Arizona Residential Soil Remediation Level1 (mg/kg): 400400
LeadEPA Region IX Preliminary Remediation Goal2 (mg/kg):
SampleType
SampleDate
3,1003,100
TABLE 4-11
Depth
Winkelman Residential PropertiesRemedial Investigation ReportASARCO LLC Hayden, Arizona Plant Site
Location/Parcel ID
Soil Sampling Laboratory Value Exceedances for Full Inorganic Target Analyte List
ShipmentDate
WSS-A-0-101-12-108 02/14/06 08/30/07 Surface REG mg/kg 5.7 J- 358 J- NA 114 J-WSS-A-0-101-12-108 02/14/06 08/30/07 Surface FD mg/kg 5.9 J- 401 J- NA 108 J-WSS-A-0-101-12-130 02/14/06 08/30/07 Surface REG mg/kg 4.6 J- 401 J- NA 48.5 J-WSS-A-0-101-12-130 02/14/06 08/30/07 Surface FD mg/kg 3.9 J- 386 J- NA 53.0 J-WSS-A-0-101-12-136 02/14/06 08/30/07 Surface REG mg/kg 3.7 J- 198 J- NA 41.0 J-WSS-A-0-101-12-136 02/14/06 08/30/07 Surface FD mg/kg 4.1 J- 204 J- NA 40.3 J-WSS-A-0-101-12-142 02/14/06 02/15/06 Surface REG mg/kg 6 674 12,800 285WSS-A-0-101-12-142 02/14/06 09/14/07 Surface REG mg/kg 11.8 J- 1,170 J- NA 491 J-WSS-A-0-101-12-147A 02/14/06 08/30/07 Surface REG mg/kg 7.6 J- 869 J- NA 234 J-WSS-A-0-101-12-147A 02/14/06 08/30/07 Surface FD mg/kg 8.3 J- 930 J- NA 223 J-WSS-A-0-101-12-149 02/14/06 08/30/07 Surface REG mg/kg 4.4 J- 411 J- NA 59.5 J-WSS-A-0-101-12-149 02/14/06 08/30/07 Surface FD mg/kg 4.7 J- 520 J- NA 76.5 J-WSS-A-0-101-12-150 02/14/06 08/30/07 Surface REG mg/kg 11.7 J- 2,290 J- NA 171 J-WSS-A-0-101-12-150 02/14/06 08/30/07 Surface FD mg/kg 10.6 J- 2,050 J- NA 159 J-WSS-A-0-101-12-154A 02/15/06 08/30/07 Surface REG mg/kg 4.6 918 NA 154WSS-A-0-101-12-154A 02/15/06 08/30/07 Surface FD mg/kg 5.6 1,030 NA 167WSS-A-0-101-12-155 02/15/06 08/30/07 Surface REG mg/kg 6.5 746 NA 1,250WSS-A-0-101-12-155 02/15/06 08/30/07 Surface FD mg/kg 7.1 899 NA 1,510WSS-A-0-101-12-187 02/14/06 08/31/07 Surface REG mg/kg 0.94 J- 165 J- NA 12.3 J-WSS-A-0-101-12-187 02/14/06 08/31/07 Surface FD mg/kg 1.0 U 182 J- NA 14.4 J-WSS-A-0-101-12-188B 02/14/06 08/31/07 Surface REG mg/kg 0.55 J- 247 J- NA 23.4 J-WSS-A-0-101-12-188B 02/14/06 08/31/07 Surface FD mg/kg 0.96 J- 337 J- NA 28.8 J-
Page 2 of 17
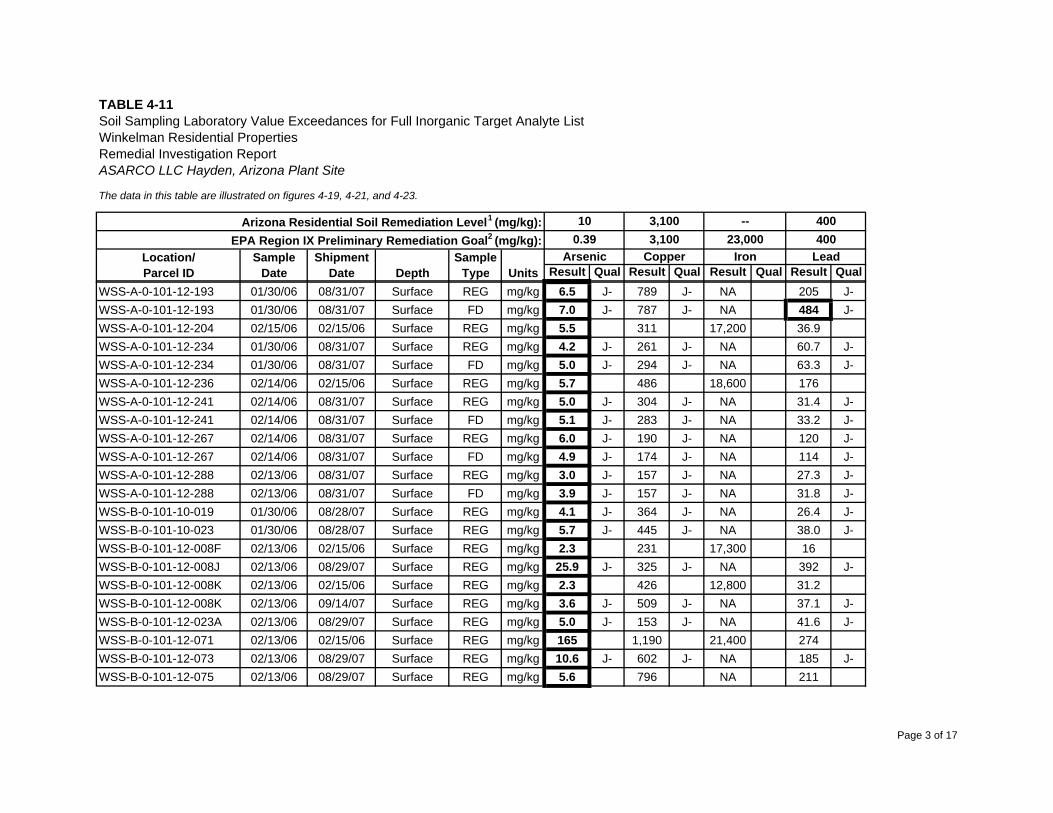
The data in this table are illustrated on figures 4-19, 4-21, and 4-23.
Result Qual Result Qual Result Qual Result Qual
--23,000
IronArsenic0.39
Copper
10
Units
Arizona Residential Soil Remediation Level1 (mg/kg): 400400
LeadEPA Region IX Preliminary Remediation Goal2 (mg/kg):
SampleType
SampleDate
3,1003,100
TABLE 4-11
Depth
Winkelman Residential PropertiesRemedial Investigation ReportASARCO LLC Hayden, Arizona Plant Site
Location/Parcel ID
Soil Sampling Laboratory Value Exceedances for Full Inorganic Target Analyte List
ShipmentDate
WSS-A-0-101-12-193 01/30/06 08/31/07 Surface REG mg/kg 6.5 J- 789 J- NA 205 J-WSS-A-0-101-12-193 01/30/06 08/31/07 Surface FD mg/kg 7.0 J- 787 J- NA 484 J-WSS-A-0-101-12-204 02/15/06 02/15/06 Surface REG mg/kg 5.5 311 17,200 36.9WSS-A-0-101-12-234 01/30/06 08/31/07 Surface REG mg/kg 4.2 J- 261 J- NA 60.7 J-WSS-A-0-101-12-234 01/30/06 08/31/07 Surface FD mg/kg 5.0 J- 294 J- NA 63.3 J-WSS-A-0-101-12-236 02/14/06 02/15/06 Surface REG mg/kg 5.7 486 18,600 176WSS-A-0-101-12-241 02/14/06 08/31/07 Surface REG mg/kg 5.0 J- 304 J- NA 31.4 J-WSS-A-0-101-12-241 02/14/06 08/31/07 Surface FD mg/kg 5.1 J- 283 J- NA 33.2 J-WSS-A-0-101-12-267 02/14/06 08/31/07 Surface REG mg/kg 6.0 J- 190 J- NA 120 J-WSS-A-0-101-12-267 02/14/06 08/31/07 Surface FD mg/kg 4.9 J- 174 J- NA 114 J-WSS-A-0-101-12-288 02/13/06 08/31/07 Surface REG mg/kg 3.0 J- 157 J- NA 27.3 J-WSS-A-0-101-12-288 02/13/06 08/31/07 Surface FD mg/kg 3.9 J- 157 J- NA 31.8 J-WSS-B-0-101-10-019 01/30/06 08/28/07 Surface REG mg/kg 4.1 J- 364 J- NA 26.4 J-WSS-B-0-101-10-023 01/30/06 08/28/07 Surface REG mg/kg 5.7 J- 445 J- NA 38.0 J-WSS-B-0-101-12-008F 02/13/06 02/15/06 Surface REG mg/kg 2.3 231 17,300 16WSS-B-0-101-12-008J 02/13/06 08/29/07 Surface REG mg/kg 25.9 J- 325 J- NA 392 J-WSS-B-0-101-12-008K 02/13/06 02/15/06 Surface REG mg/kg 2.3 426 12,800 31.2WSS-B-0-101-12-008K 02/13/06 09/14/07 Surface REG mg/kg 3.6 J- 509 J- NA 37.1 J-WSS-B-0-101-12-023A 02/13/06 08/29/07 Surface REG mg/kg 5.0 J- 153 J- NA 41.6 J-WSS-B-0-101-12-071 02/13/06 02/15/06 Surface REG mg/kg 165 1,190 21,400 274WSS-B-0-101-12-073 02/13/06 08/29/07 Surface REG mg/kg 10.6 J- 602 J- NA 185 J-WSS-B-0-101-12-075 02/13/06 08/29/07 Surface REG mg/kg 5.6 796 NA 211
Page 3 of 17
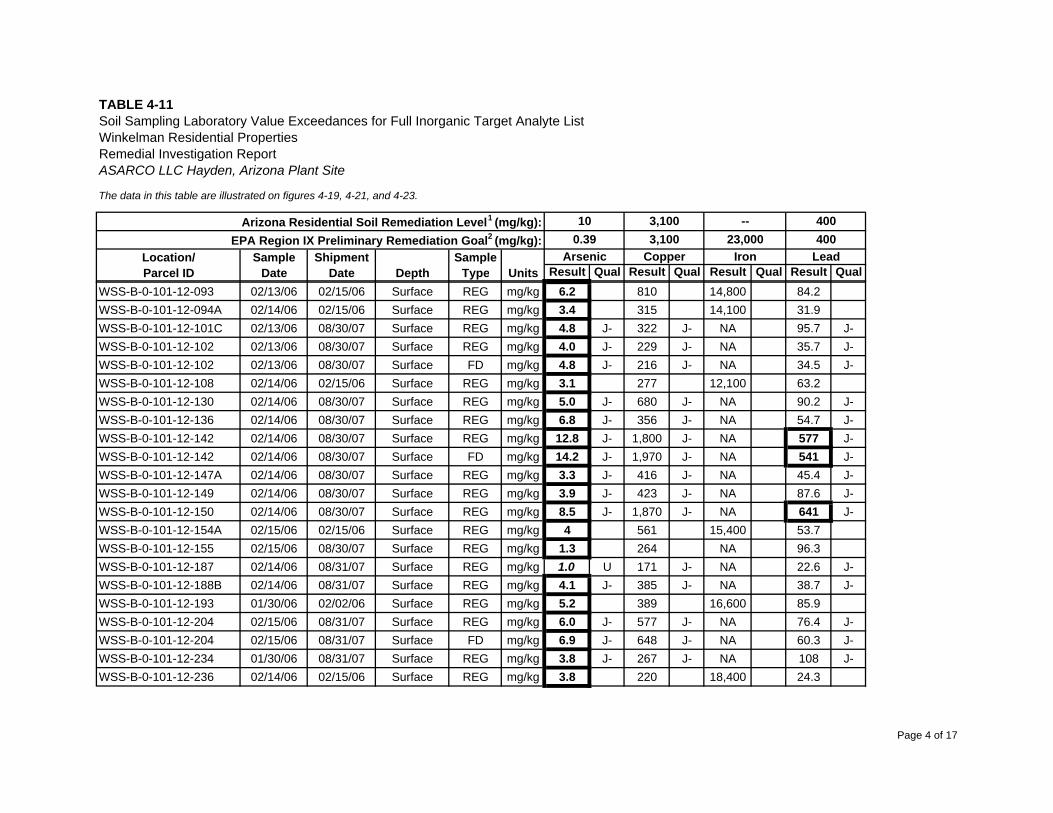
The data in this table are illustrated on figures 4-19, 4-21, and 4-23.
Result Qual Result Qual Result Qual Result Qual
--23,000
IronArsenic0.39
Copper
10
Units
Arizona Residential Soil Remediation Level1 (mg/kg): 400400
LeadEPA Region IX Preliminary Remediation Goal2 (mg/kg):
SampleType
SampleDate
3,1003,100
TABLE 4-11
Depth
Winkelman Residential PropertiesRemedial Investigation ReportASARCO LLC Hayden, Arizona Plant Site
Location/Parcel ID
Soil Sampling Laboratory Value Exceedances for Full Inorganic Target Analyte List
ShipmentDate
WSS-B-0-101-12-093 02/13/06 02/15/06 Surface REG mg/kg 6.2 810 14,800 84.2WSS-B-0-101-12-094A 02/14/06 02/15/06 Surface REG mg/kg 3.4 315 14,100 31.9WSS-B-0-101-12-101C 02/13/06 08/30/07 Surface REG mg/kg 4.8 J- 322 J- NA 95.7 J-WSS-B-0-101-12-102 02/13/06 08/30/07 Surface REG mg/kg 4.0 J- 229 J- NA 35.7 J-WSS-B-0-101-12-102 02/13/06 08/30/07 Surface FD mg/kg 4.8 J- 216 J- NA 34.5 J-WSS-B-0-101-12-108 02/14/06 02/15/06 Surface REG mg/kg 3.1 277 12,100 63.2WSS-B-0-101-12-130 02/14/06 08/30/07 Surface REG mg/kg 5.0 J- 680 J- NA 90.2 J-WSS-B-0-101-12-136 02/14/06 08/30/07 Surface REG mg/kg 6.8 J- 356 J- NA 54.7 J-WSS-B-0-101-12-142 02/14/06 08/30/07 Surface REG mg/kg 12.8 J- 1,800 J- NA 577 J-WSS-B-0-101-12-142 02/14/06 08/30/07 Surface FD mg/kg 14.2 J- 1,970 J- NA 541 J-WSS-B-0-101-12-147A 02/14/06 08/30/07 Surface REG mg/kg 3.3 J- 416 J- NA 45.4 J-WSS-B-0-101-12-149 02/14/06 08/30/07 Surface REG mg/kg 3.9 J- 423 J- NA 87.6 J-WSS-B-0-101-12-150 02/14/06 08/30/07 Surface REG mg/kg 8.5 J- 1,870 J- NA 641 J-WSS-B-0-101-12-154A 02/15/06 02/15/06 Surface REG mg/kg 4 561 15,400 53.7WSS-B-0-101-12-155 02/15/06 08/30/07 Surface REG mg/kg 1.3 264 NA 96.3WSS-B-0-101-12-187 02/14/06 08/31/07 Surface REG mg/kg 1.0 U 171 J- NA 22.6 J-WSS-B-0-101-12-188B 02/14/06 08/31/07 Surface REG mg/kg 4.1 J- 385 J- NA 38.7 J-WSS-B-0-101-12-193 01/30/06 02/02/06 Surface REG mg/kg 5.2 389 16,600 85.9WSS-B-0-101-12-204 02/15/06 08/31/07 Surface REG mg/kg 6.0 J- 577 J- NA 76.4 J-WSS-B-0-101-12-204 02/15/06 08/31/07 Surface FD mg/kg 6.9 J- 648 J- NA 60.3 J-WSS-B-0-101-12-234 01/30/06 08/31/07 Surface REG mg/kg 3.8 J- 267 J- NA 108 J-WSS-B-0-101-12-236 02/14/06 02/15/06 Surface REG mg/kg 3.8 220 18,400 24.3
Page 4 of 17
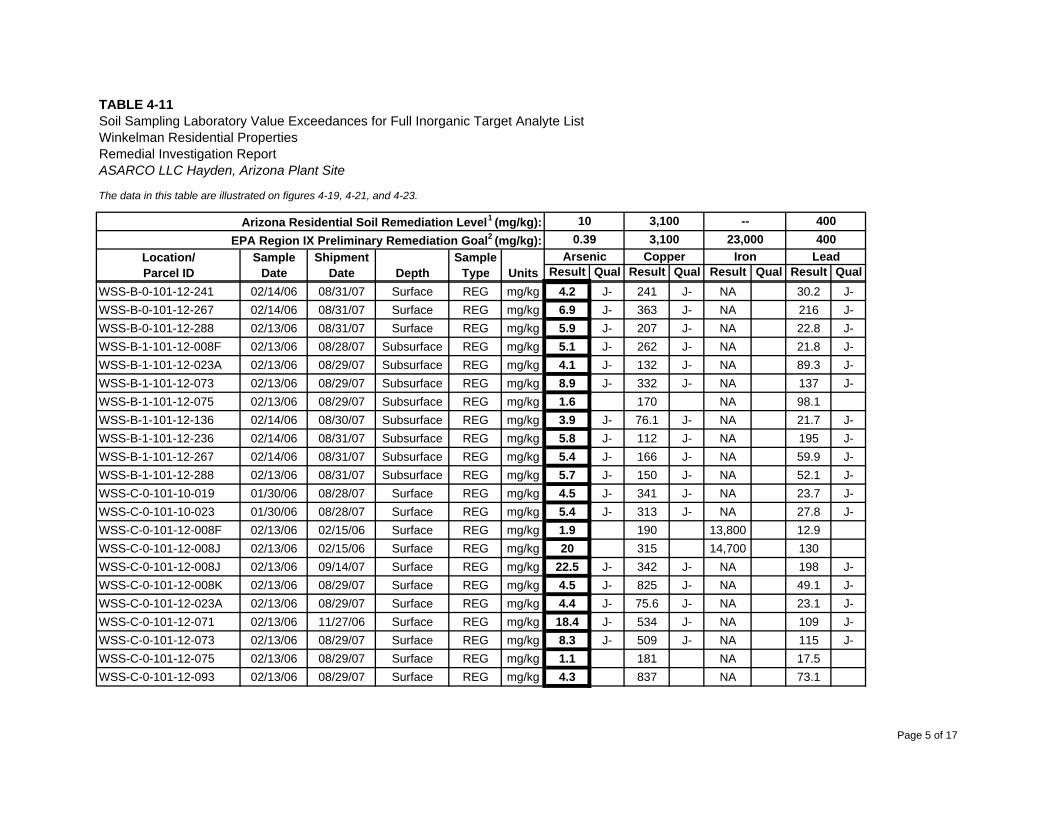
The data in this table are illustrated on figures 4-19, 4-21, and 4-23.
Result Qual Result Qual Result Qual Result Qual
--23,000
IronArsenic0.39
Copper
10
Units
Arizona Residential Soil Remediation Level1 (mg/kg): 400400
LeadEPA Region IX Preliminary Remediation Goal2 (mg/kg):
SampleType
SampleDate
3,1003,100
TABLE 4-11
Depth
Winkelman Residential PropertiesRemedial Investigation ReportASARCO LLC Hayden, Arizona Plant Site
Location/Parcel ID
Soil Sampling Laboratory Value Exceedances for Full Inorganic Target Analyte List
ShipmentDate
WSS-B-0-101-12-241 02/14/06 08/31/07 Surface REG mg/kg 4.2 J- 241 J- NA 30.2 J-WSS-B-0-101-12-267 02/14/06 08/31/07 Surface REG mg/kg 6.9 J- 363 J- NA 216 J-WSS-B-0-101-12-288 02/13/06 08/31/07 Surface REG mg/kg 5.9 J- 207 J- NA 22.8 J-WSS-B-1-101-12-008F 02/13/06 08/28/07 Subsurface REG mg/kg 5.1 J- 262 J- NA 21.8 J-WSS-B-1-101-12-023A 02/13/06 08/29/07 Subsurface REG mg/kg 4.1 J- 132 J- NA 89.3 J-WSS-B-1-101-12-073 02/13/06 08/29/07 Subsurface REG mg/kg 8.9 J- 332 J- NA 137 J-WSS-B-1-101-12-075 02/13/06 08/29/07 Subsurface REG mg/kg 1.6 170 NA 98.1WSS-B-1-101-12-136 02/14/06 08/30/07 Subsurface REG mg/kg 3.9 J- 76.1 J- NA 21.7 J-WSS-B-1-101-12-236 02/14/06 08/31/07 Subsurface REG mg/kg 5.8 J- 112 J- NA 195 J-WSS-B-1-101-12-267 02/14/06 08/31/07 Subsurface REG mg/kg 5.4 J- 166 J- NA 59.9 J-WSS-B-1-101-12-288 02/13/06 08/31/07 Subsurface REG mg/kg 5.7 J- 150 J- NA 52.1 J-WSS-C-0-101-10-019 01/30/06 08/28/07 Surface REG mg/kg 4.5 J- 341 J- NA 23.7 J-WSS-C-0-101-10-023 01/30/06 08/28/07 Surface REG mg/kg 5.4 J- 313 J- NA 27.8 J-WSS-C-0-101-12-008F 02/13/06 02/15/06 Surface REG mg/kg 1.9 190 13,800 12.9WSS-C-0-101-12-008J 02/13/06 02/15/06 Surface REG mg/kg 20 315 14,700 130WSS-C-0-101-12-008J 02/13/06 09/14/07 Surface REG mg/kg 22.5 J- 342 J- NA 198 J-WSS-C-0-101-12-008K 02/13/06 08/29/07 Surface REG mg/kg 4.5 J- 825 J- NA 49.1 J-WSS-C-0-101-12-023A 02/13/06 08/29/07 Surface REG mg/kg 4.4 J- 75.6 J- NA 23.1 J-WSS-C-0-101-12-071 02/13/06 11/27/06 Surface REG mg/kg 18.4 J- 534 J- NA 109 J-WSS-C-0-101-12-073 02/13/06 08/29/07 Surface REG mg/kg 8.3 J- 509 J- NA 115 J-WSS-C-0-101-12-075 02/13/06 08/29/07 Surface REG mg/kg 1.1 181 NA 17.5WSS-C-0-101-12-093 02/13/06 08/29/07 Surface REG mg/kg 4.3 837 NA 73.1
Page 5 of 17
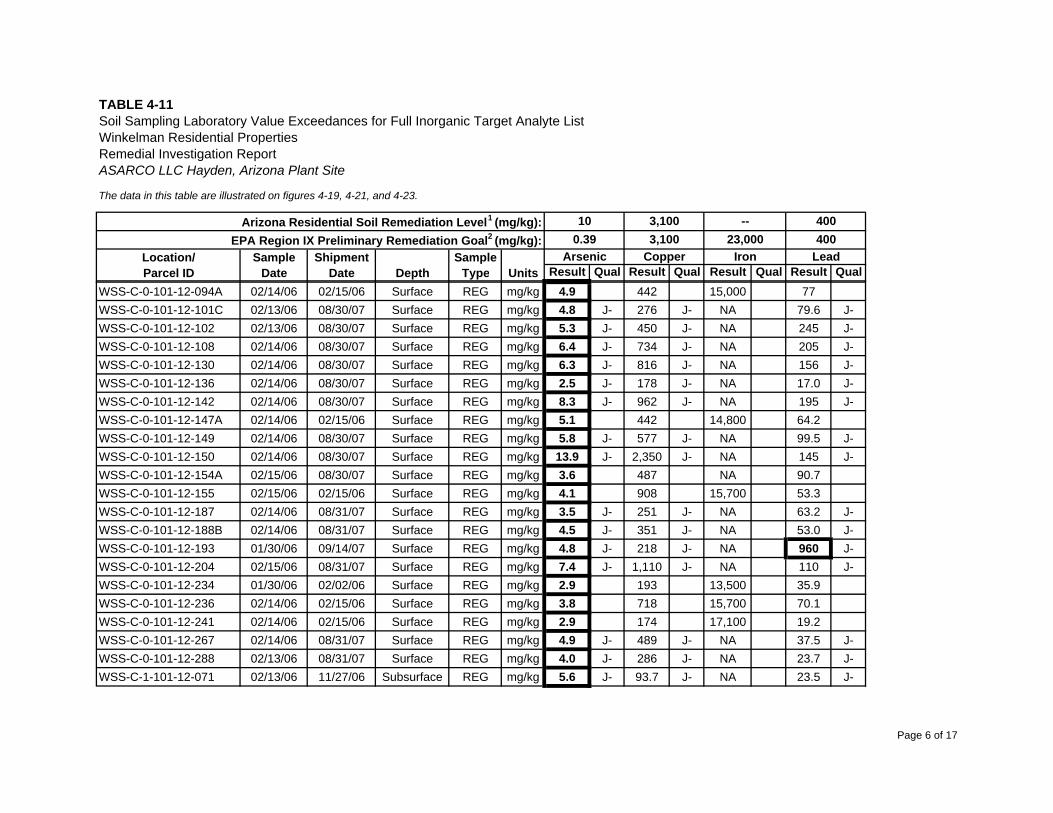
The data in this table are illustrated on figures 4-19, 4-21, and 4-23.
Result Qual Result Qual Result Qual Result Qual
--23,000
IronArsenic0.39
Copper
10
Units
Arizona Residential Soil Remediation Level1 (mg/kg): 400400
LeadEPA Region IX Preliminary Remediation Goal2 (mg/kg):
SampleType
SampleDate
3,1003,100
TABLE 4-11
Depth
Winkelman Residential PropertiesRemedial Investigation ReportASARCO LLC Hayden, Arizona Plant Site
Location/Parcel ID
Soil Sampling Laboratory Value Exceedances for Full Inorganic Target Analyte List
ShipmentDate
WSS-C-0-101-12-094A 02/14/06 02/15/06 Surface REG mg/kg 4.9 442 15,000 77WSS-C-0-101-12-101C 02/13/06 08/30/07 Surface REG mg/kg 4.8 J- 276 J- NA 79.6 J-WSS-C-0-101-12-102 02/13/06 08/30/07 Surface REG mg/kg 5.3 J- 450 J- NA 245 J-WSS-C-0-101-12-108 02/14/06 08/30/07 Surface REG mg/kg 6.4 J- 734 J- NA 205 J-WSS-C-0-101-12-130 02/14/06 08/30/07 Surface REG mg/kg 6.3 J- 816 J- NA 156 J-WSS-C-0-101-12-136 02/14/06 08/30/07 Surface REG mg/kg 2.5 J- 178 J- NA 17.0 J-WSS-C-0-101-12-142 02/14/06 08/30/07 Surface REG mg/kg 8.3 J- 962 J- NA 195 J-WSS-C-0-101-12-147A 02/14/06 02/15/06 Surface REG mg/kg 5.1 442 14,800 64.2WSS-C-0-101-12-149 02/14/06 08/30/07 Surface REG mg/kg 5.8 J- 577 J- NA 99.5 J-WSS-C-0-101-12-150 02/14/06 08/30/07 Surface REG mg/kg 13.9 J- 2,350 J- NA 145 J-WSS-C-0-101-12-154A 02/15/06 08/30/07 Surface REG mg/kg 3.6 487 NA 90.7WSS-C-0-101-12-155 02/15/06 02/15/06 Surface REG mg/kg 4.1 908 15,700 53.3WSS-C-0-101-12-187 02/14/06 08/31/07 Surface REG mg/kg 3.5 J- 251 J- NA 63.2 J-WSS-C-0-101-12-188B 02/14/06 08/31/07 Surface REG mg/kg 4.5 J- 351 J- NA 53.0 J-WSS-C-0-101-12-193 01/30/06 09/14/07 Surface REG mg/kg 4.8 J- 218 J- NA 960 J-WSS-C-0-101-12-204 02/15/06 08/31/07 Surface REG mg/kg 7.4 J- 1,110 J- NA 110 J-WSS-C-0-101-12-234 01/30/06 02/02/06 Surface REG mg/kg 2.9 193 13,500 35.9WSS-C-0-101-12-236 02/14/06 02/15/06 Surface REG mg/kg 3.8 718 15,700 70.1WSS-C-0-101-12-241 02/14/06 02/15/06 Surface REG mg/kg 2.9 174 17,100 19.2WSS-C-0-101-12-267 02/14/06 08/31/07 Surface REG mg/kg 4.9 J- 489 J- NA 37.5 J-WSS-C-0-101-12-288 02/13/06 08/31/07 Surface REG mg/kg 4.0 J- 286 J- NA 23.7 J-WSS-C-1-101-12-071 02/13/06 11/27/06 Subsurface REG mg/kg 5.6 J- 93.7 J- NA 23.5 J-
Page 6 of 17
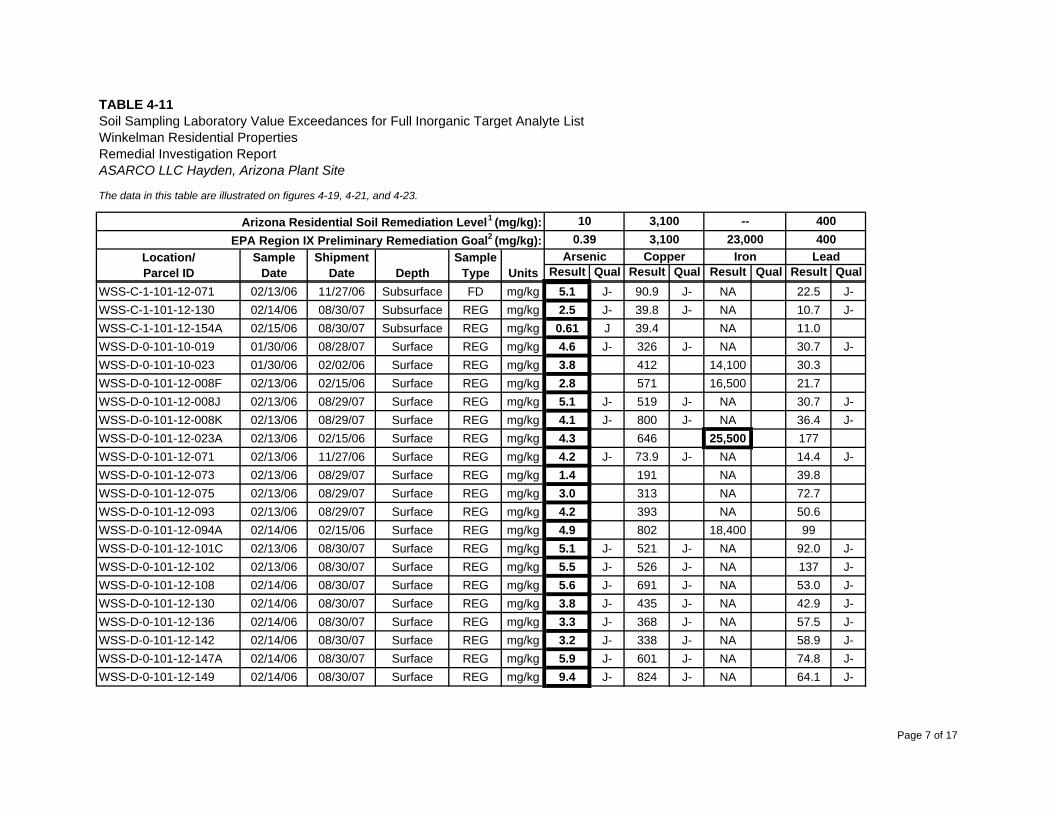
The data in this table are illustrated on figures 4-19, 4-21, and 4-23.
Result Qual Result Qual Result Qual Result Qual
--23,000
IronArsenic0.39
Copper
10
Units
Arizona Residential Soil Remediation Level1 (mg/kg): 400400
LeadEPA Region IX Preliminary Remediation Goal2 (mg/kg):
SampleType
SampleDate
3,1003,100
TABLE 4-11
Depth
Winkelman Residential PropertiesRemedial Investigation ReportASARCO LLC Hayden, Arizona Plant Site
Location/Parcel ID
Soil Sampling Laboratory Value Exceedances for Full Inorganic Target Analyte List
ShipmentDate
WSS-C-1-101-12-071 02/13/06 11/27/06 Subsurface FD mg/kg 5.1 J- 90.9 J- NA 22.5 J-WSS-C-1-101-12-130 02/14/06 08/30/07 Subsurface REG mg/kg 2.5 J- 39.8 J- NA 10.7 J-WSS-C-1-101-12-154A 02/15/06 08/30/07 Subsurface REG mg/kg 0.61 J 39.4 NA 11.0WSS-D-0-101-10-019 01/30/06 08/28/07 Surface REG mg/kg 4.6 J- 326 J- NA 30.7 J-WSS-D-0-101-10-023 01/30/06 02/02/06 Surface REG mg/kg 3.8 412 14,100 30.3WSS-D-0-101-12-008F 02/13/06 02/15/06 Surface REG mg/kg 2.8 571 16,500 21.7WSS-D-0-101-12-008J 02/13/06 08/29/07 Surface REG mg/kg 5.1 J- 519 J- NA 30.7 J-WSS-D-0-101-12-008K 02/13/06 08/29/07 Surface REG mg/kg 4.1 J- 800 J- NA 36.4 J-WSS-D-0-101-12-023A 02/13/06 02/15/06 Surface REG mg/kg 4.3 646 25,500 177WSS-D-0-101-12-071 02/13/06 11/27/06 Surface REG mg/kg 4.2 J- 73.9 J- NA 14.4 J-WSS-D-0-101-12-073 02/13/06 08/29/07 Surface REG mg/kg 1.4 191 NA 39.8WSS-D-0-101-12-075 02/13/06 08/29/07 Surface REG mg/kg 3.0 313 NA 72.7WSS-D-0-101-12-093 02/13/06 08/29/07 Surface REG mg/kg 4.2 393 NA 50.6WSS-D-0-101-12-094A 02/14/06 02/15/06 Surface REG mg/kg 4.9 802 18,400 99WSS-D-0-101-12-101C 02/13/06 08/30/07 Surface REG mg/kg 5.1 J- 521 J- NA 92.0 J-WSS-D-0-101-12-102 02/13/06 08/30/07 Surface REG mg/kg 5.5 J- 526 J- NA 137 J-WSS-D-0-101-12-108 02/14/06 08/30/07 Surface REG mg/kg 5.6 J- 691 J- NA 53.0 J-WSS-D-0-101-12-130 02/14/06 08/30/07 Surface REG mg/kg 3.8 J- 435 J- NA 42.9 J-WSS-D-0-101-12-136 02/14/06 08/30/07 Surface REG mg/kg 3.3 J- 368 J- NA 57.5 J-WSS-D-0-101-12-142 02/14/06 08/30/07 Surface REG mg/kg 3.2 J- 338 J- NA 58.9 J-WSS-D-0-101-12-147A 02/14/06 08/30/07 Surface REG mg/kg 5.9 J- 601 J- NA 74.8 J-WSS-D-0-101-12-149 02/14/06 08/30/07 Surface REG mg/kg 9.4 J- 824 J- NA 64.1 J-
Page 7 of 17
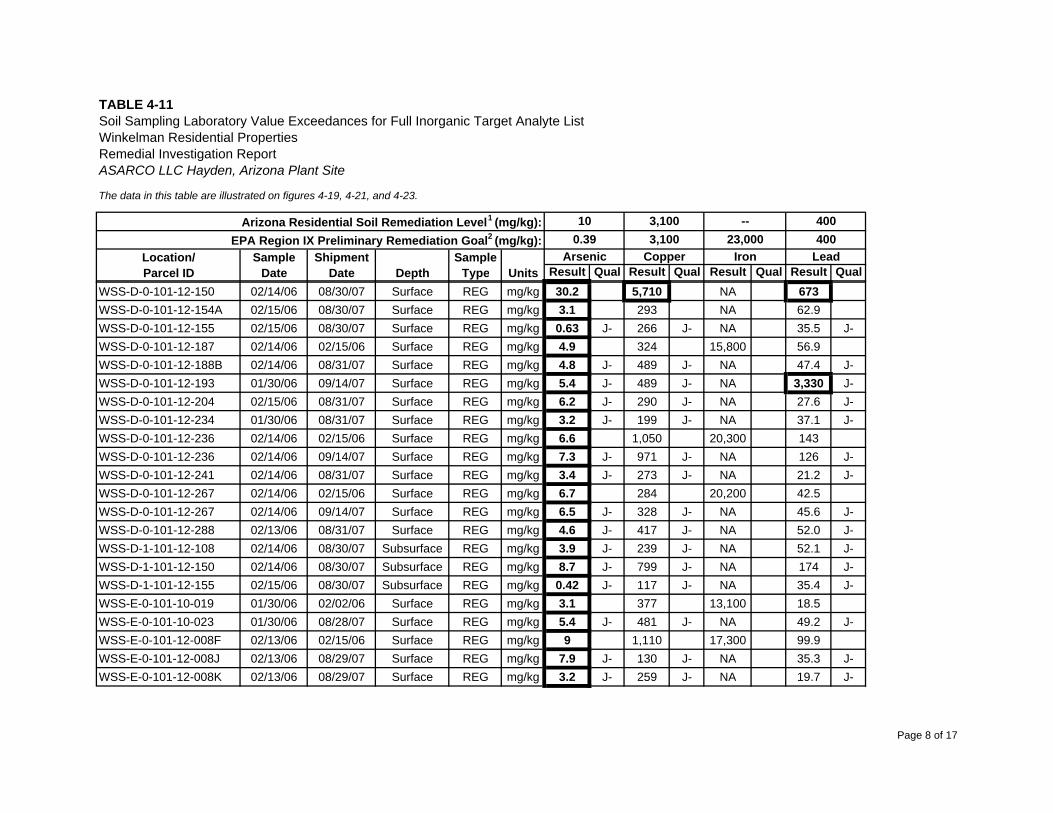
The data in this table are illustrated on figures 4-19, 4-21, and 4-23.
Result Qual Result Qual Result Qual Result Qual
--23,000
IronArsenic0.39
Copper
10
Units
Arizona Residential Soil Remediation Level1 (mg/kg): 400400
LeadEPA Region IX Preliminary Remediation Goal2 (mg/kg):
SampleType
SampleDate
3,1003,100
TABLE 4-11
Depth
Winkelman Residential PropertiesRemedial Investigation ReportASARCO LLC Hayden, Arizona Plant Site
Location/Parcel ID
Soil Sampling Laboratory Value Exceedances for Full Inorganic Target Analyte List
ShipmentDate
WSS-D-0-101-12-150 02/14/06 08/30/07 Surface REG mg/kg 30.2 5,710 NA 673WSS-D-0-101-12-154A 02/15/06 08/30/07 Surface REG mg/kg 3.1 293 NA 62.9WSS-D-0-101-12-155 02/15/06 08/30/07 Surface REG mg/kg 0.63 J- 266 J- NA 35.5 J-WSS-D-0-101-12-187 02/14/06 02/15/06 Surface REG mg/kg 4.9 324 15,800 56.9WSS-D-0-101-12-188B 02/14/06 08/31/07 Surface REG mg/kg 4.8 J- 489 J- NA 47.4 J-WSS-D-0-101-12-193 01/30/06 09/14/07 Surface REG mg/kg 5.4 J- 489 J- NA 3,330 J-WSS-D-0-101-12-204 02/15/06 08/31/07 Surface REG mg/kg 6.2 J- 290 J- NA 27.6 J-WSS-D-0-101-12-234 01/30/06 08/31/07 Surface REG mg/kg 3.2 J- 199 J- NA 37.1 J-WSS-D-0-101-12-236 02/14/06 02/15/06 Surface REG mg/kg 6.6 1,050 20,300 143WSS-D-0-101-12-236 02/14/06 09/14/07 Surface REG mg/kg 7.3 J- 971 J- NA 126 J-WSS-D-0-101-12-241 02/14/06 08/31/07 Surface REG mg/kg 3.4 J- 273 J- NA 21.2 J-WSS-D-0-101-12-267 02/14/06 02/15/06 Surface REG mg/kg 6.7 284 20,200 42.5WSS-D-0-101-12-267 02/14/06 09/14/07 Surface REG mg/kg 6.5 J- 328 J- NA 45.6 J-WSS-D-0-101-12-288 02/13/06 08/31/07 Surface REG mg/kg 4.6 J- 417 J- NA 52.0 J-WSS-D-1-101-12-108 02/14/06 08/30/07 Subsurface REG mg/kg 3.9 J- 239 J- NA 52.1 J-WSS-D-1-101-12-150 02/14/06 08/30/07 Subsurface REG mg/kg 8.7 J- 799 J- NA 174 J-WSS-D-1-101-12-155 02/15/06 08/30/07 Subsurface REG mg/kg 0.42 J- 117 J- NA 35.4 J-WSS-E-0-101-10-019 01/30/06 02/02/06 Surface REG mg/kg 3.1 377 13,100 18.5WSS-E-0-101-10-023 01/30/06 08/28/07 Surface REG mg/kg 5.4 J- 481 J- NA 49.2 J-WSS-E-0-101-12-008F 02/13/06 02/15/06 Surface REG mg/kg 9 1,110 17,300 99.9WSS-E-0-101-12-008J 02/13/06 08/29/07 Surface REG mg/kg 7.9 J- 130 J- NA 35.3 J-WSS-E-0-101-12-008K 02/13/06 08/29/07 Surface REG mg/kg 3.2 J- 259 J- NA 19.7 J-
Page 8 of 17
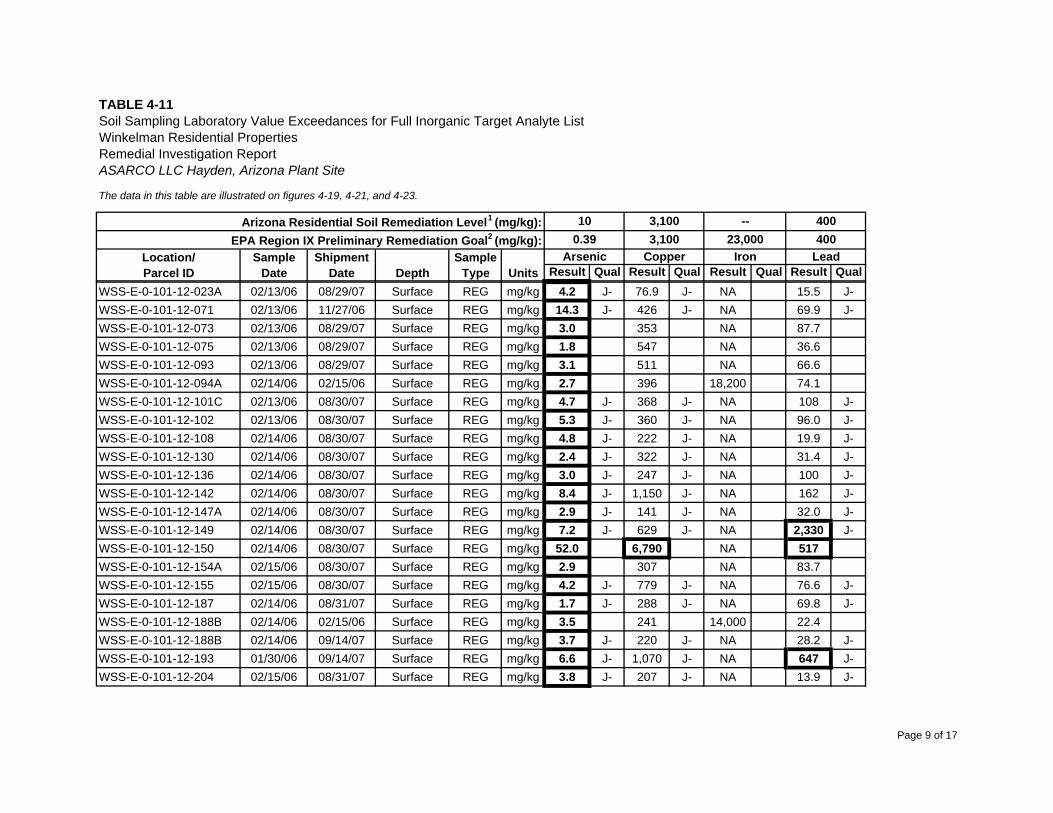
The data in this table are illustrated on figures 4-19, 4-21, and 4-23.
Result Qual Result Qual Result Qual Result Qual
--23,000
IronArsenic0.39
Copper
10
Units
Arizona Residential Soil Remediation Level1 (mg/kg): 400400
LeadEPA Region IX Preliminary Remediation Goal2 (mg/kg):
SampleType
SampleDate
3,1003,100
TABLE 4-11
Depth
Winkelman Residential PropertiesRemedial Investigation ReportASARCO LLC Hayden, Arizona Plant Site
Location/Parcel ID
Soil Sampling Laboratory Value Exceedances for Full Inorganic Target Analyte List
ShipmentDate
WSS-E-0-101-12-023A 02/13/06 08/29/07 Surface REG mg/kg 4.2 J- 76.9 J- NA 15.5 J-WSS-E-0-101-12-071 02/13/06 11/27/06 Surface REG mg/kg 14.3 J- 426 J- NA 69.9 J-WSS-E-0-101-12-073 02/13/06 08/29/07 Surface REG mg/kg 3.0 353 NA 87.7WSS-E-0-101-12-075 02/13/06 08/29/07 Surface REG mg/kg 1.8 547 NA 36.6WSS-E-0-101-12-093 02/13/06 08/29/07 Surface REG mg/kg 3.1 511 NA 66.6WSS-E-0-101-12-094A 02/14/06 02/15/06 Surface REG mg/kg 2.7 396 18,200 74.1WSS-E-0-101-12-101C 02/13/06 08/30/07 Surface REG mg/kg 4.7 J- 368 J- NA 108 J-WSS-E-0-101-12-102 02/13/06 08/30/07 Surface REG mg/kg 5.3 J- 360 J- NA 96.0 J-WSS-E-0-101-12-108 02/14/06 08/30/07 Surface REG mg/kg 4.8 J- 222 J- NA 19.9 J-WSS-E-0-101-12-130 02/14/06 08/30/07 Surface REG mg/kg 2.4 J- 322 J- NA 31.4 J-WSS-E-0-101-12-136 02/14/06 08/30/07 Surface REG mg/kg 3.0 J- 247 J- NA 100 J-WSS-E-0-101-12-142 02/14/06 08/30/07 Surface REG mg/kg 8.4 J- 1,150 J- NA 162 J-WSS-E-0-101-12-147A 02/14/06 08/30/07 Surface REG mg/kg 2.9 J- 141 J- NA 32.0 J-WSS-E-0-101-12-149 02/14/06 08/30/07 Surface REG mg/kg 7.2 J- 629 J- NA 2,330 J-WSS-E-0-101-12-150 02/14/06 08/30/07 Surface REG mg/kg 52.0 6,790 NA 517WSS-E-0-101-12-154A 02/15/06 08/30/07 Surface REG mg/kg 2.9 307 NA 83.7WSS-E-0-101-12-155 02/15/06 08/30/07 Surface REG mg/kg 4.2 J- 779 J- NA 76.6 J-WSS-E-0-101-12-187 02/14/06 08/31/07 Surface REG mg/kg 1.7 J- 288 J- NA 69.8 J-WSS-E-0-101-12-188B 02/14/06 02/15/06 Surface REG mg/kg 3.5 241 14,000 22.4WSS-E-0-101-12-188B 02/14/06 09/14/07 Surface REG mg/kg 3.7 J- 220 J- NA 28.2 J-WSS-E-0-101-12-193 01/30/06 09/14/07 Surface REG mg/kg 6.6 J- 1,070 J- NA 647 J-WSS-E-0-101-12-204 02/15/06 08/31/07 Surface REG mg/kg 3.8 J- 207 J- NA 13.9 J-
Page 9 of 17
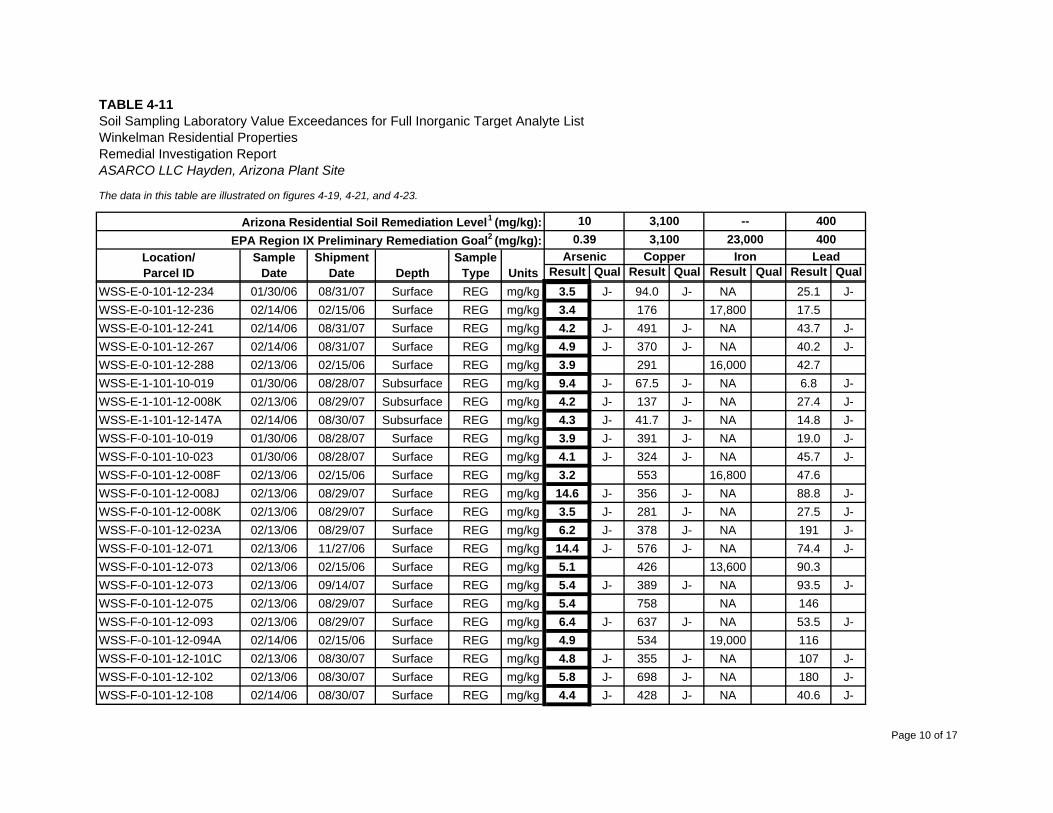
The data in this table are illustrated on figures 4-19, 4-21, and 4-23.
Result Qual Result Qual Result Qual Result Qual
--23,000
IronArsenic0.39
Copper
10
Units
Arizona Residential Soil Remediation Level1 (mg/kg): 400400
LeadEPA Region IX Preliminary Remediation Goal2 (mg/kg):
SampleType
SampleDate
3,1003,100
TABLE 4-11
Depth
Winkelman Residential PropertiesRemedial Investigation ReportASARCO LLC Hayden, Arizona Plant Site
Location/Parcel ID
Soil Sampling Laboratory Value Exceedances for Full Inorganic Target Analyte List
ShipmentDate
WSS-E-0-101-12-234 01/30/06 08/31/07 Surface REG mg/kg 3.5 J- 94.0 J- NA 25.1 J-WSS-E-0-101-12-236 02/14/06 02/15/06 Surface REG mg/kg 3.4 176 17,800 17.5WSS-E-0-101-12-241 02/14/06 08/31/07 Surface REG mg/kg 4.2 J- 491 J- NA 43.7 J-WSS-E-0-101-12-267 02/14/06 08/31/07 Surface REG mg/kg 4.9 J- 370 J- NA 40.2 J-WSS-E-0-101-12-288 02/13/06 02/15/06 Surface REG mg/kg 3.9 291 16,000 42.7WSS-E-1-101-10-019 01/30/06 08/28/07 Subsurface REG mg/kg 9.4 J- 67.5 J- NA 6.8 J-WSS-E-1-101-12-008K 02/13/06 08/29/07 Subsurface REG mg/kg 4.2 J- 137 J- NA 27.4 J-WSS-E-1-101-12-147A 02/14/06 08/30/07 Subsurface REG mg/kg 4.3 J- 41.7 J- NA 14.8 J-WSS-F-0-101-10-019 01/30/06 08/28/07 Surface REG mg/kg 3.9 J- 391 J- NA 19.0 J-WSS-F-0-101-10-023 01/30/06 08/28/07 Surface REG mg/kg 4.1 J- 324 J- NA 45.7 J-WSS-F-0-101-12-008F 02/13/06 02/15/06 Surface REG mg/kg 3.2 553 16,800 47.6WSS-F-0-101-12-008J 02/13/06 08/29/07 Surface REG mg/kg 14.6 J- 356 J- NA 88.8 J-WSS-F-0-101-12-008K 02/13/06 08/29/07 Surface REG mg/kg 3.5 J- 281 J- NA 27.5 J-WSS-F-0-101-12-023A 02/13/06 08/29/07 Surface REG mg/kg 6.2 J- 378 J- NA 191 J-WSS-F-0-101-12-071 02/13/06 11/27/06 Surface REG mg/kg 14.4 J- 576 J- NA 74.4 J-WSS-F-0-101-12-073 02/13/06 02/15/06 Surface REG mg/kg 5.1 426 13,600 90.3WSS-F-0-101-12-073 02/13/06 09/14/07 Surface REG mg/kg 5.4 J- 389 J- NA 93.5 J-WSS-F-0-101-12-075 02/13/06 08/29/07 Surface REG mg/kg 5.4 758 NA 146WSS-F-0-101-12-093 02/13/06 08/29/07 Surface REG mg/kg 6.4 J- 637 J- NA 53.5 J-WSS-F-0-101-12-094A 02/14/06 02/15/06 Surface REG mg/kg 4.9 534 19,000 116WSS-F-0-101-12-101C 02/13/06 08/30/07 Surface REG mg/kg 4.8 J- 355 J- NA 107 J-WSS-F-0-101-12-102 02/13/06 08/30/07 Surface REG mg/kg 5.8 J- 698 J- NA 180 J-WSS-F-0-101-12-108 02/14/06 08/30/07 Surface REG mg/kg 4.4 J- 428 J- NA 40.6 J-
Page 10 of 17

The data in this table are illustrated on figures 4-19, 4-21, and 4-23.
Result Qual Result Qual Result Qual Result Qual
--23,000
IronArsenic0.39
Copper
10
Units
Arizona Residential Soil Remediation Level1 (mg/kg): 400400
LeadEPA Region IX Preliminary Remediation Goal2 (mg/kg):
SampleType
SampleDate
3,1003,100
TABLE 4-11
Depth
Winkelman Residential PropertiesRemedial Investigation ReportASARCO LLC Hayden, Arizona Plant Site
Location/Parcel ID
Soil Sampling Laboratory Value Exceedances for Full Inorganic Target Analyte List
ShipmentDate
WSS-F-0-101-12-130 02/14/06 08/30/07 Surface REG mg/kg 6.8 J- 930 J- NA 124 J-WSS-F-0-101-12-136 02/14/06 02/15/06 Surface REG mg/kg 4.8 243 16,900 53.5WSS-F-0-101-12-136 02/14/06 02/15/06 Surface FD mg/kg 5.2 243 17,000 50.1WSS-F-0-101-12-142 02/14/06 08/30/07 Surface REG mg/kg 2.7 J- 148 J- NA 75.3 J-WSS-F-0-101-12-147A 02/14/06 08/30/07 Surface REG mg/kg 5.2 J- 397 J- NA 47.6 J-WSS-F-0-101-12-149 02/14/06 08/30/07 Surface REG mg/kg 4.0 J- 383 J- NA 35.9 J-WSS-F-0-101-12-150 02/14/06 08/30/07 Surface REG mg/kg 3.2 703 NA 98.7WSS-F-0-101-12-154A 02/15/06 08/30/07 Surface REG mg/kg 4.0 361 NA 78.9WSS-F-0-101-12-155 02/15/06 08/30/07 Surface REG mg/kg 2.4 J- 196 J- NA 40.1 J-WSS-F-0-101-12-187 02/14/06 08/31/07 Surface REG mg/kg 1.5 J- 375 J- NA 20.0 J-WSS-F-0-101-12-188B 02/14/06 08/31/07 Surface REG mg/kg 4.6 J- 344 J- NA 45.6 J-WSS-F-0-101-12-193 01/30/06 09/14/07 Surface REG mg/kg 4.1 J- 176 J- NA 54.9 J-WSS-F-0-101-12-204 02/15/06 08/31/07 Surface REG mg/kg 5.3 J- 802 J- NA 90.0 J-WSS-F-0-101-12-234 01/30/06 08/31/07 Surface REG mg/kg 4.5 J- 123 J- NA 274 J-WSS-F-0-101-12-236 02/14/06 02/15/06 Surface REG mg/kg 1.2 81.3 21,700 9.4WSS-F-0-101-12-241 02/14/06 08/31/07 Surface REG mg/kg 4.5 J- 364 J- NA 25.4 J-WSS-F-0-101-12-267 02/14/06 08/31/07 Surface REG mg/kg 3.3 J- 141 J- NA 42.4 J-WSS-F-0-101-12-288 02/13/06 08/31/07 Surface REG mg/kg 5.1 J- 78.3 J- NA 26.0 J-WSS-F-1-101-12-101C 02/13/06 08/30/07 Subsurface REG mg/kg 3.8 J- 55.1 J- NA 28.8 J-WSS-F-1-101-12-188B 02/14/06 08/31/07 Subsurface REG mg/kg 2.3 J- 64.4 J- NA 39.1 J-WSS-F-1-101-12-234 01/30/06 08/31/07 Subsurface REG mg/kg 4.3 J- 23.2 J- NA 21.5 J-WSS-G-0-101-10-019 01/30/06 08/28/07 Surface REG mg/kg 4.1 J- 443 J- NA 15.4 J-WSS-G-0-101-10-023 01/30/06 08/28/07 Surface REG mg/kg 5.1 409 NA 41.5
Page 11 of 17
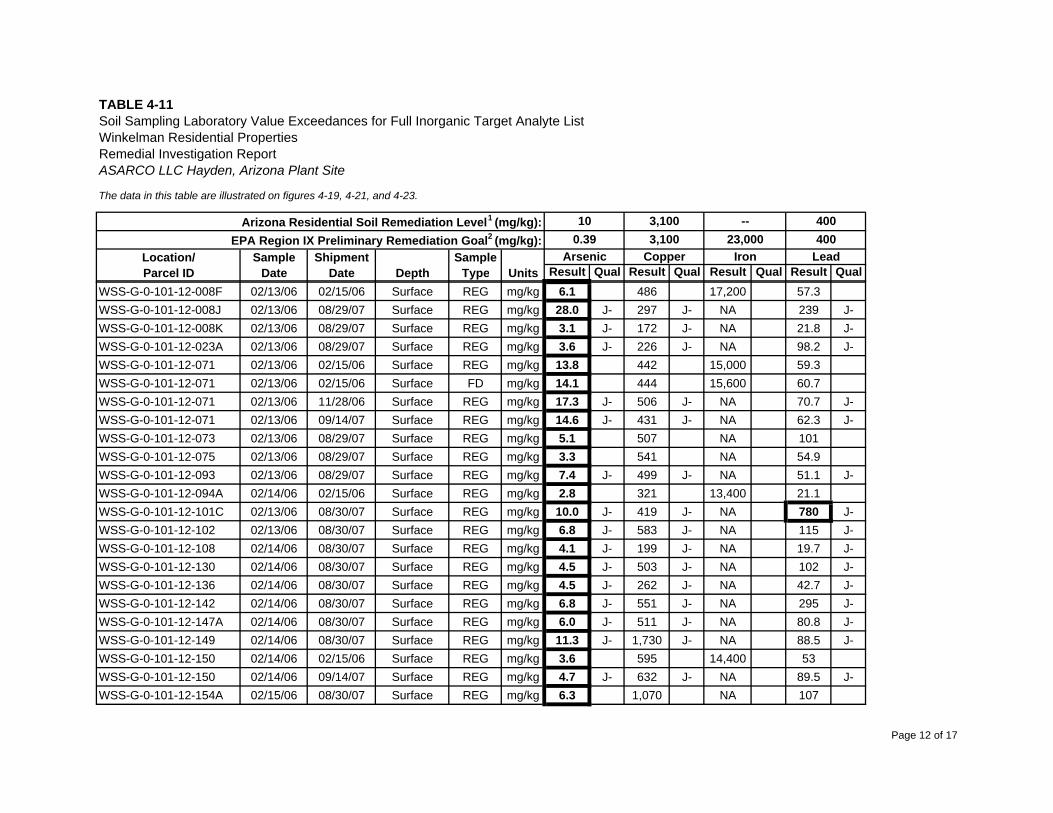
The data in this table are illustrated on figures 4-19, 4-21, and 4-23.
Result Qual Result Qual Result Qual Result Qual
--23,000
IronArsenic0.39
Copper
10
Units
Arizona Residential Soil Remediation Level1 (mg/kg): 400400
LeadEPA Region IX Preliminary Remediation Goal2 (mg/kg):
SampleType
SampleDate
3,1003,100
TABLE 4-11
Depth
Winkelman Residential PropertiesRemedial Investigation ReportASARCO LLC Hayden, Arizona Plant Site
Location/Parcel ID
Soil Sampling Laboratory Value Exceedances for Full Inorganic Target Analyte List
ShipmentDate
WSS-G-0-101-12-008F 02/13/06 02/15/06 Surface REG mg/kg 6.1 486 17,200 57.3WSS-G-0-101-12-008J 02/13/06 08/29/07 Surface REG mg/kg 28.0 J- 297 J- NA 239 J-WSS-G-0-101-12-008K 02/13/06 08/29/07 Surface REG mg/kg 3.1 J- 172 J- NA 21.8 J-WSS-G-0-101-12-023A 02/13/06 08/29/07 Surface REG mg/kg 3.6 J- 226 J- NA 98.2 J-WSS-G-0-101-12-071 02/13/06 02/15/06 Surface REG mg/kg 13.8 442 15,000 59.3WSS-G-0-101-12-071 02/13/06 02/15/06 Surface FD mg/kg 14.1 444 15,600 60.7WSS-G-0-101-12-071 02/13/06 11/28/06 Surface REG mg/kg 17.3 J- 506 J- NA 70.7 J-WSS-G-0-101-12-071 02/13/06 09/14/07 Surface REG mg/kg 14.6 J- 431 J- NA 62.3 J-WSS-G-0-101-12-073 02/13/06 08/29/07 Surface REG mg/kg 5.1 507 NA 101WSS-G-0-101-12-075 02/13/06 08/29/07 Surface REG mg/kg 3.3 541 NA 54.9WSS-G-0-101-12-093 02/13/06 08/29/07 Surface REG mg/kg 7.4 J- 499 J- NA 51.1 J-WSS-G-0-101-12-094A 02/14/06 02/15/06 Surface REG mg/kg 2.8 321 13,400 21.1WSS-G-0-101-12-101C 02/13/06 08/30/07 Surface REG mg/kg 10.0 J- 419 J- NA 780 J-WSS-G-0-101-12-102 02/13/06 08/30/07 Surface REG mg/kg 6.8 J- 583 J- NA 115 J-WSS-G-0-101-12-108 02/14/06 08/30/07 Surface REG mg/kg 4.1 J- 199 J- NA 19.7 J-WSS-G-0-101-12-130 02/14/06 08/30/07 Surface REG mg/kg 4.5 J- 503 J- NA 102 J-WSS-G-0-101-12-136 02/14/06 08/30/07 Surface REG mg/kg 4.5 J- 262 J- NA 42.7 J-WSS-G-0-101-12-142 02/14/06 08/30/07 Surface REG mg/kg 6.8 J- 551 J- NA 295 J-WSS-G-0-101-12-147A 02/14/06 08/30/07 Surface REG mg/kg 6.0 J- 511 J- NA 80.8 J-WSS-G-0-101-12-149 02/14/06 08/30/07 Surface REG mg/kg 11.3 J- 1,730 J- NA 88.5 J-WSS-G-0-101-12-150 02/14/06 02/15/06 Surface REG mg/kg 3.6 595 14,400 53WSS-G-0-101-12-150 02/14/06 09/14/07 Surface REG mg/kg 4.7 J- 632 J- NA 89.5 J-WSS-G-0-101-12-154A 02/15/06 08/30/07 Surface REG mg/kg 6.3 1,070 NA 107
Page 12 of 17
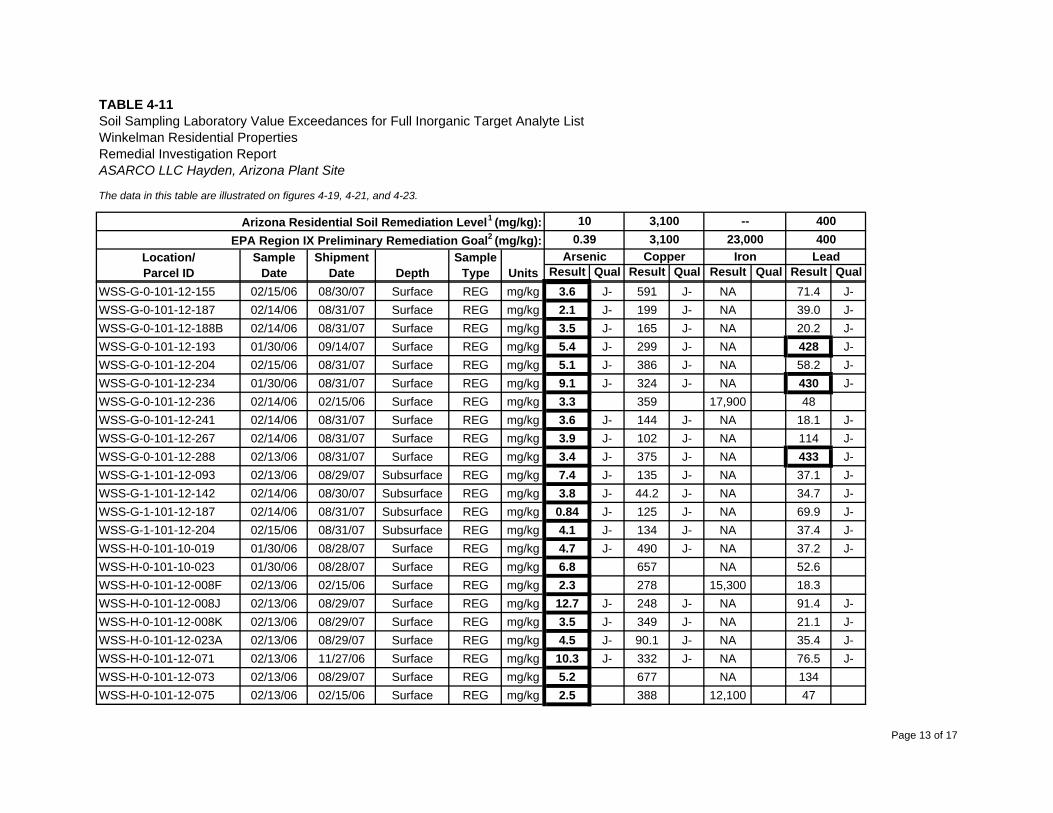
The data in this table are illustrated on figures 4-19, 4-21, and 4-23.
Result Qual Result Qual Result Qual Result Qual
--23,000
IronArsenic0.39
Copper
10
Units
Arizona Residential Soil Remediation Level1 (mg/kg): 400400
LeadEPA Region IX Preliminary Remediation Goal2 (mg/kg):
SampleType
SampleDate
3,1003,100
TABLE 4-11
Depth
Winkelman Residential PropertiesRemedial Investigation ReportASARCO LLC Hayden, Arizona Plant Site
Location/Parcel ID
Soil Sampling Laboratory Value Exceedances for Full Inorganic Target Analyte List
ShipmentDate
WSS-G-0-101-12-155 02/15/06 08/30/07 Surface REG mg/kg 3.6 J- 591 J- NA 71.4 J-WSS-G-0-101-12-187 02/14/06 08/31/07 Surface REG mg/kg 2.1 J- 199 J- NA 39.0 J-WSS-G-0-101-12-188B 02/14/06 08/31/07 Surface REG mg/kg 3.5 J- 165 J- NA 20.2 J-WSS-G-0-101-12-193 01/30/06 09/14/07 Surface REG mg/kg 5.4 J- 299 J- NA 428 J-WSS-G-0-101-12-204 02/15/06 08/31/07 Surface REG mg/kg 5.1 J- 386 J- NA 58.2 J-WSS-G-0-101-12-234 01/30/06 08/31/07 Surface REG mg/kg 9.1 J- 324 J- NA 430 J-WSS-G-0-101-12-236 02/14/06 02/15/06 Surface REG mg/kg 3.3 359 17,900 48WSS-G-0-101-12-241 02/14/06 08/31/07 Surface REG mg/kg 3.6 J- 144 J- NA 18.1 J-WSS-G-0-101-12-267 02/14/06 08/31/07 Surface REG mg/kg 3.9 J- 102 J- NA 114 J-WSS-G-0-101-12-288 02/13/06 08/31/07 Surface REG mg/kg 3.4 J- 375 J- NA 433 J-WSS-G-1-101-12-093 02/13/06 08/29/07 Subsurface REG mg/kg 7.4 J- 135 J- NA 37.1 J-WSS-G-1-101-12-142 02/14/06 08/30/07 Subsurface REG mg/kg 3.8 J- 44.2 J- NA 34.7 J-WSS-G-1-101-12-187 02/14/06 08/31/07 Subsurface REG mg/kg 0.84 J- 125 J- NA 69.9 J-WSS-G-1-101-12-204 02/15/06 08/31/07 Subsurface REG mg/kg 4.1 J- 134 J- NA 37.4 J-WSS-H-0-101-10-019 01/30/06 08/28/07 Surface REG mg/kg 4.7 J- 490 J- NA 37.2 J-WSS-H-0-101-10-023 01/30/06 08/28/07 Surface REG mg/kg 6.8 657 NA 52.6WSS-H-0-101-12-008F 02/13/06 02/15/06 Surface REG mg/kg 2.3 278 15,300 18.3WSS-H-0-101-12-008J 02/13/06 08/29/07 Surface REG mg/kg 12.7 J- 248 J- NA 91.4 J-WSS-H-0-101-12-008K 02/13/06 08/29/07 Surface REG mg/kg 3.5 J- 349 J- NA 21.1 J-WSS-H-0-101-12-023A 02/13/06 08/29/07 Surface REG mg/kg 4.5 J- 90.1 J- NA 35.4 J-WSS-H-0-101-12-071 02/13/06 11/27/06 Surface REG mg/kg 10.3 J- 332 J- NA 76.5 J-WSS-H-0-101-12-073 02/13/06 08/29/07 Surface REG mg/kg 5.2 677 NA 134WSS-H-0-101-12-075 02/13/06 02/15/06 Surface REG mg/kg 2.5 388 12,100 47
Page 13 of 17
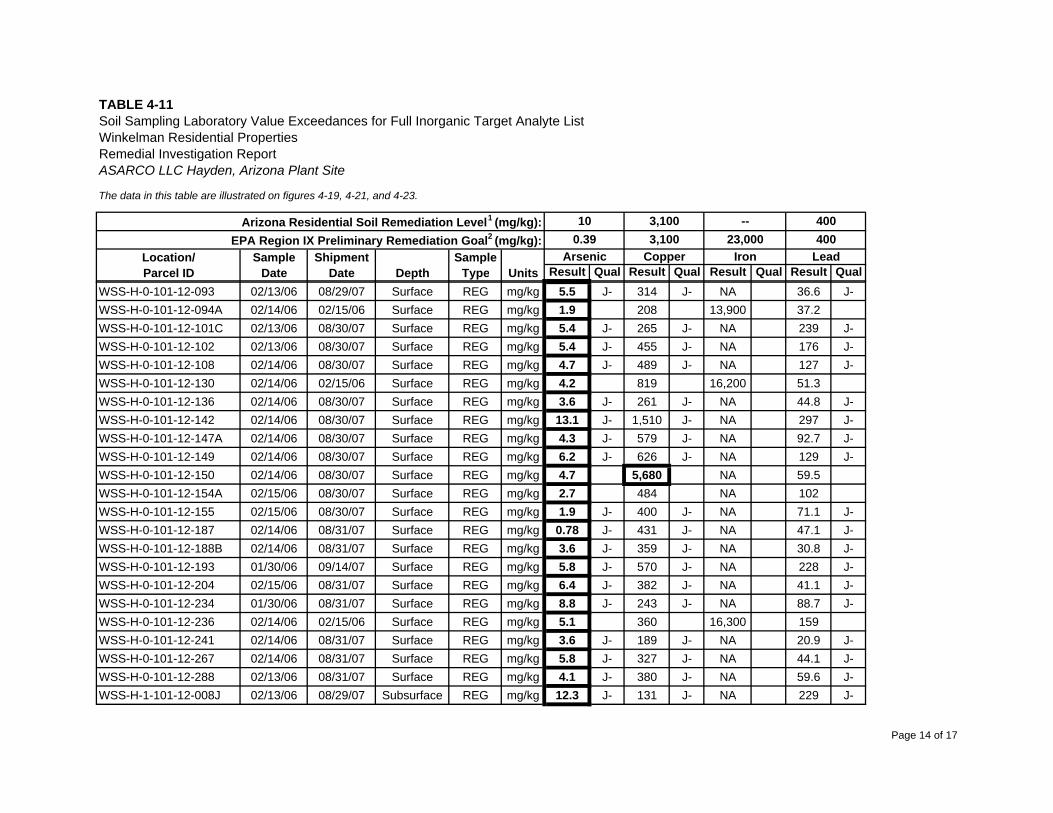
The data in this table are illustrated on figures 4-19, 4-21, and 4-23.
Result Qual Result Qual Result Qual Result Qual
--23,000
IronArsenic0.39
Copper
10
Units
Arizona Residential Soil Remediation Level1 (mg/kg): 400400
LeadEPA Region IX Preliminary Remediation Goal2 (mg/kg):
SampleType
SampleDate
3,1003,100
TABLE 4-11
Depth
Winkelman Residential PropertiesRemedial Investigation ReportASARCO LLC Hayden, Arizona Plant Site
Location/Parcel ID
Soil Sampling Laboratory Value Exceedances for Full Inorganic Target Analyte List
ShipmentDate
WSS-H-0-101-12-093 02/13/06 08/29/07 Surface REG mg/kg 5.5 J- 314 J- NA 36.6 J-WSS-H-0-101-12-094A 02/14/06 02/15/06 Surface REG mg/kg 1.9 208 13,900 37.2WSS-H-0-101-12-101C 02/13/06 08/30/07 Surface REG mg/kg 5.4 J- 265 J- NA 239 J-WSS-H-0-101-12-102 02/13/06 08/30/07 Surface REG mg/kg 5.4 J- 455 J- NA 176 J-WSS-H-0-101-12-108 02/14/06 08/30/07 Surface REG mg/kg 4.7 J- 489 J- NA 127 J-WSS-H-0-101-12-130 02/14/06 02/15/06 Surface REG mg/kg 4.2 819 16,200 51.3WSS-H-0-101-12-136 02/14/06 08/30/07 Surface REG mg/kg 3.6 J- 261 J- NA 44.8 J-WSS-H-0-101-12-142 02/14/06 08/30/07 Surface REG mg/kg 13.1 J- 1,510 J- NA 297 J-WSS-H-0-101-12-147A 02/14/06 08/30/07 Surface REG mg/kg 4.3 J- 579 J- NA 92.7 J-WSS-H-0-101-12-149 02/14/06 08/30/07 Surface REG mg/kg 6.2 J- 626 J- NA 129 J-WSS-H-0-101-12-150 02/14/06 08/30/07 Surface REG mg/kg 4.7 5,680 NA 59.5WSS-H-0-101-12-154A 02/15/06 08/30/07 Surface REG mg/kg 2.7 484 NA 102WSS-H-0-101-12-155 02/15/06 08/30/07 Surface REG mg/kg 1.9 J- 400 J- NA 71.1 J-WSS-H-0-101-12-187 02/14/06 08/31/07 Surface REG mg/kg 0.78 J- 431 J- NA 47.1 J-WSS-H-0-101-12-188B 02/14/06 08/31/07 Surface REG mg/kg 3.6 J- 359 J- NA 30.8 J-WSS-H-0-101-12-193 01/30/06 09/14/07 Surface REG mg/kg 5.8 J- 570 J- NA 228 J-WSS-H-0-101-12-204 02/15/06 08/31/07 Surface REG mg/kg 6.4 J- 382 J- NA 41.1 J-WSS-H-0-101-12-234 01/30/06 08/31/07 Surface REG mg/kg 8.8 J- 243 J- NA 88.7 J-WSS-H-0-101-12-236 02/14/06 02/15/06 Surface REG mg/kg 5.1 360 16,300 159WSS-H-0-101-12-241 02/14/06 08/31/07 Surface REG mg/kg 3.6 J- 189 J- NA 20.9 J-WSS-H-0-101-12-267 02/14/06 08/31/07 Surface REG mg/kg 5.8 J- 327 J- NA 44.1 J-WSS-H-0-101-12-288 02/13/06 08/31/07 Surface REG mg/kg 4.1 J- 380 J- NA 59.6 J-WSS-H-1-101-12-008J 02/13/06 08/29/07 Subsurface REG mg/kg 12.3 J- 131 J- NA 229 J-
Page 14 of 17

The data in this table are illustrated on figures 4-19, 4-21, and 4-23.
Result Qual Result Qual Result Qual Result Qual
--23,000
IronArsenic0.39
Copper
10
Units
Arizona Residential Soil Remediation Level1 (mg/kg): 400400
LeadEPA Region IX Preliminary Remediation Goal2 (mg/kg):
SampleType
SampleDate
3,1003,100
TABLE 4-11
Depth
Winkelman Residential PropertiesRemedial Investigation ReportASARCO LLC Hayden, Arizona Plant Site
Location/Parcel ID
Soil Sampling Laboratory Value Exceedances for Full Inorganic Target Analyte List
ShipmentDate
WSS-H-1-101-12-241 02/14/06 08/31/07 Subsurface REG mg/kg 2.2 J- 42.3 J- NA 7.2 J-WSS-I-0-101-10-019 01/30/06 08/28/07 Surface REG mg/kg 4.5 J- 383 J- NA 27.4 J-WSS-I-0-101-10-023 01/30/06 08/28/07 Surface REG mg/kg 6.9 J- 532 J- NA 40.6 J-WSS-I-0-101-12-008F 02/13/06 02/15/06 Surface REG mg/kg 3.7 462 17,100 34.8WSS-I-0-101-12-008J 02/13/06 08/29/07 Surface REG mg/kg 9.6 J- 168 J- NA 42.7 J-WSS-I-0-101-12-008K 02/13/06 08/29/07 Surface REG mg/kg 4.3 J- 589 J- NA 20.9 J-WSS-I-0-101-12-023A 02/13/06 08/29/07 Surface REG mg/kg 3.0 J- 140 J- NA 24.5 J-WSS-I-0-101-12-071 02/13/06 11/27/06 Surface REG mg/kg 16 J- 351 J- NA 66 J-WSS-I-0-101-12-073 02/13/06 08/29/07 Surface REG mg/kg 3.0 313 NA 58.1WSS-I-0-101-12-075 02/13/06 08/29/07 Surface REG mg/kg 1.9 248 NA 47.2WSS-I-0-101-12-093 02/13/06 08/29/07 Surface REG mg/kg 5.5 J- 460 J- NA 78.0 J-WSS-I-0-101-12-094A 02/14/06 02/15/06 Surface REG mg/kg 6.4 538 13,000 87WSS-I-0-101-12-101C 02/13/06 02/15/06 Surface REG mg/kg 3.3 284 13,600 80.2WSS-I-0-101-12-102 02/13/06 08/30/07 Surface REG mg/kg 6.5 J- 422 J- NA 360 J-WSS-I-0-101-12-108 02/14/06 08/30/07 Surface REG mg/kg 7.8 J- 479 J- NA 128 J-WSS-I-0-101-12-130 02/14/06 08/30/07 Surface REG mg/kg 4.6 J- 498 J- NA 133 J-WSS-I-0-101-12-136 02/14/06 08/30/07 Surface REG mg/kg 4.5 J- 620 J- NA 50.1 J-WSS-I-0-101-12-142 02/14/06 08/30/07 Surface REG mg/kg 9.5 J- 1,300 J- NA 308 J-WSS-I-0-101-12-147A 02/14/06 08/30/07 Surface REG mg/kg 4.8 J- 495 J- NA 119 J-WSS-I-0-101-12-149 02/14/06 02/15/06 Surface REG mg/kg 8.3 1,080 17,900 83WSS-I-0-101-12-150 02/14/06 08/30/07 Surface REG mg/kg 6.2 1,550 NA 110WSS-I-0-101-12-154A 02/15/06 08/30/07 Surface REG mg/kg 2.8 482 NA 100WSS-I-0-101-12-155 02/15/06 08/30/07 Surface REG mg/kg 1.7 J- 774 J- NA 79.3 J-
Page 15 of 17
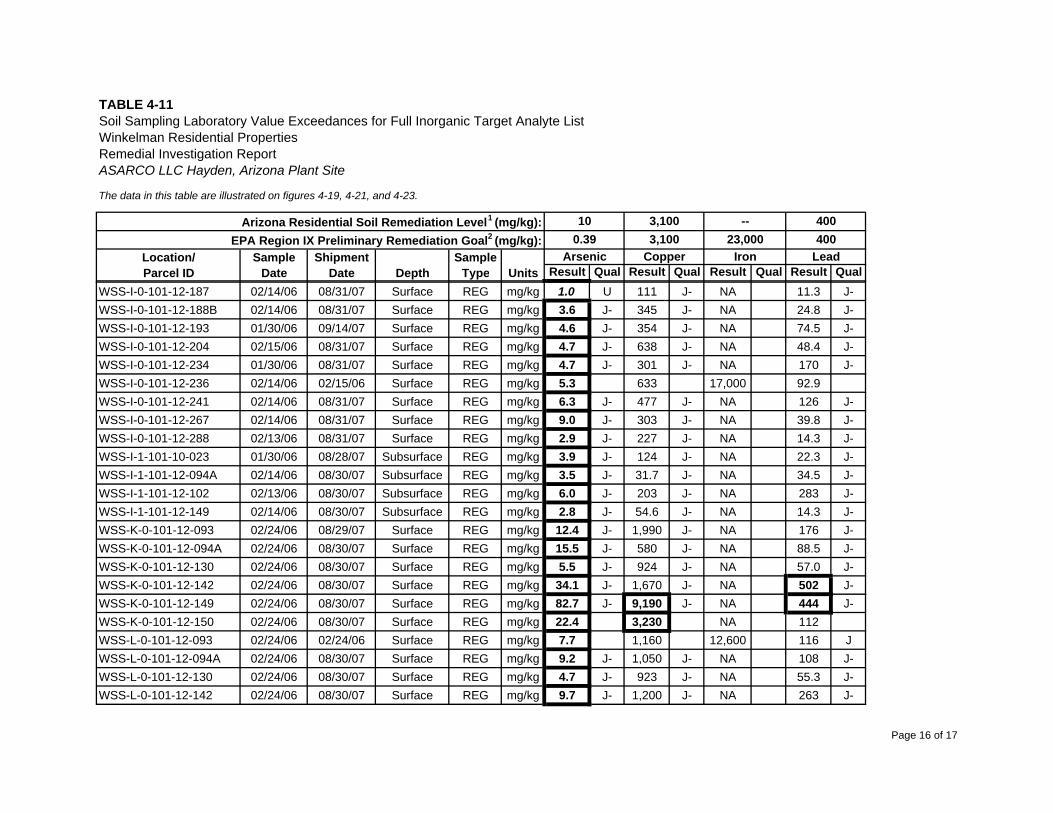
The data in this table are illustrated on figures 4-19, 4-21, and 4-23.
Result Qual Result Qual Result Qual Result Qual
--23,000
IronArsenic0.39
Copper
10
Units
Arizona Residential Soil Remediation Level1 (mg/kg): 400400
LeadEPA Region IX Preliminary Remediation Goal2 (mg/kg):
SampleType
SampleDate
3,1003,100
TABLE 4-11
Depth
Winkelman Residential PropertiesRemedial Investigation ReportASARCO LLC Hayden, Arizona Plant Site
Location/Parcel ID
Soil Sampling Laboratory Value Exceedances for Full Inorganic Target Analyte List
ShipmentDate
WSS-I-0-101-12-187 02/14/06 08/31/07 Surface REG mg/kg 1.0 U 111 J- NA 11.3 J-WSS-I-0-101-12-188B 02/14/06 08/31/07 Surface REG mg/kg 3.6 J- 345 J- NA 24.8 J-WSS-I-0-101-12-193 01/30/06 09/14/07 Surface REG mg/kg 4.6 J- 354 J- NA 74.5 J-WSS-I-0-101-12-204 02/15/06 08/31/07 Surface REG mg/kg 4.7 J- 638 J- NA 48.4 J-WSS-I-0-101-12-234 01/30/06 08/31/07 Surface REG mg/kg 4.7 J- 301 J- NA 170 J-WSS-I-0-101-12-236 02/14/06 02/15/06 Surface REG mg/kg 5.3 633 17,000 92.9WSS-I-0-101-12-241 02/14/06 08/31/07 Surface REG mg/kg 6.3 J- 477 J- NA 126 J-WSS-I-0-101-12-267 02/14/06 08/31/07 Surface REG mg/kg 9.0 J- 303 J- NA 39.8 J-WSS-I-0-101-12-288 02/13/06 08/31/07 Surface REG mg/kg 2.9 J- 227 J- NA 14.3 J-WSS-I-1-101-10-023 01/30/06 08/28/07 Subsurface REG mg/kg 3.9 J- 124 J- NA 22.3 J-WSS-I-1-101-12-094A 02/14/06 08/30/07 Subsurface REG mg/kg 3.5 J- 31.7 J- NA 34.5 J-WSS-I-1-101-12-102 02/13/06 08/30/07 Subsurface REG mg/kg 6.0 J- 203 J- NA 283 J-WSS-I-1-101-12-149 02/14/06 08/30/07 Subsurface REG mg/kg 2.8 J- 54.6 J- NA 14.3 J-WSS-K-0-101-12-093 02/24/06 08/29/07 Surface REG mg/kg 12.4 J- 1,990 J- NA 176 J-WSS-K-0-101-12-094A 02/24/06 08/30/07 Surface REG mg/kg 15.5 J- 580 J- NA 88.5 J-WSS-K-0-101-12-130 02/24/06 08/30/07 Surface REG mg/kg 5.5 J- 924 J- NA 57.0 J-WSS-K-0-101-12-142 02/24/06 08/30/07 Surface REG mg/kg 34.1 J- 1,670 J- NA 502 J-WSS-K-0-101-12-149 02/24/06 08/30/07 Surface REG mg/kg 82.7 J- 9,190 J- NA 444 J-WSS-K-0-101-12-150 02/24/06 08/30/07 Surface REG mg/kg 22.4 3,230 NA 112WSS-L-0-101-12-093 02/24/06 02/24/06 Surface REG mg/kg 7.7 1,160 12,600 116 JWSS-L-0-101-12-094A 02/24/06 08/30/07 Surface REG mg/kg 9.2 J- 1,050 J- NA 108 J-WSS-L-0-101-12-130 02/24/06 08/30/07 Surface REG mg/kg 4.7 J- 923 J- NA 55.3 J-WSS-L-0-101-12-142 02/24/06 08/30/07 Surface REG mg/kg 9.7 J- 1,200 J- NA 263 J-
Page 16 of 17
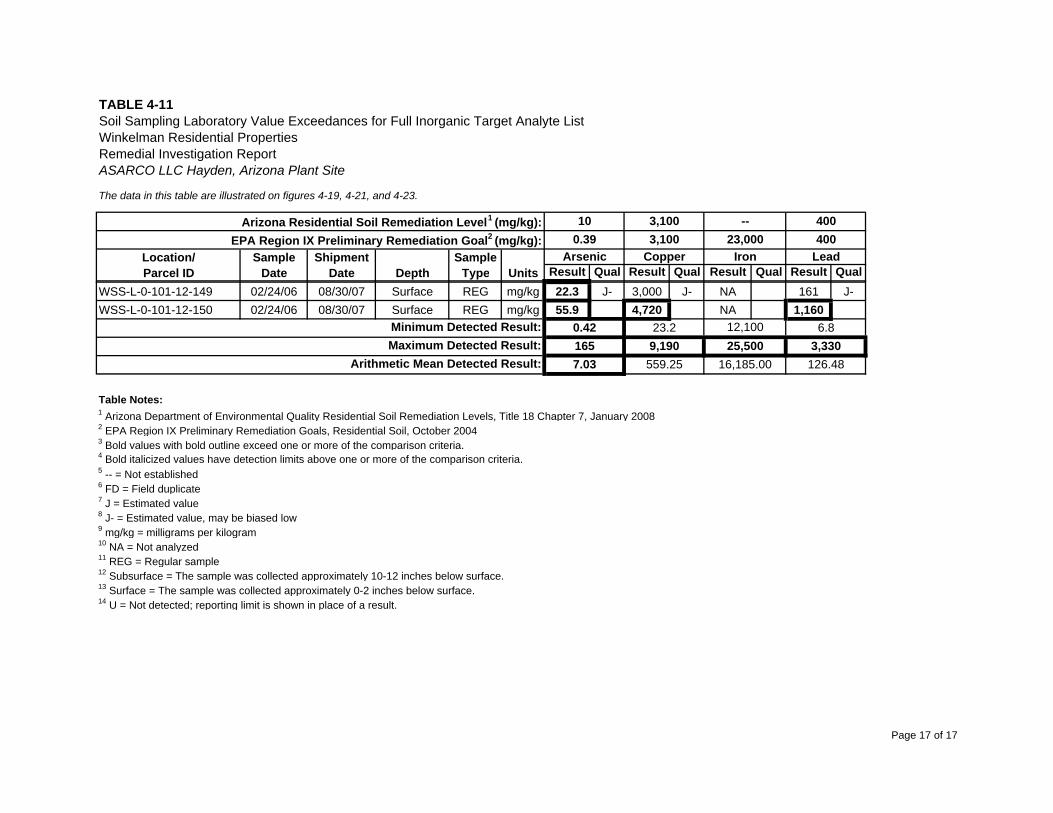
The data in this table are illustrated on figures 4-19, 4-21, and 4-23.
Result Qual Result Qual Result Qual Result Qual
--23,000
IronArsenic0.39
Copper
10
Units
Arizona Residential Soil Remediation Level1 (mg/kg): 400400
LeadEPA Region IX Preliminary Remediation Goal2 (mg/kg):
SampleType
SampleDate
3,1003,100
TABLE 4-11
Depth
Winkelman Residential PropertiesRemedial Investigation ReportASARCO LLC Hayden, Arizona Plant Site
Location/Parcel ID
Soil Sampling Laboratory Value Exceedances for Full Inorganic Target Analyte List
ShipmentDate
WSS-L-0-101-12-149 02/24/06 08/30/07 Surface REG mg/kg 22.3 J- 3,000 J- NA 161 J-WSS-L-0-101-12-150 02/24/06 08/30/07 Surface REG mg/kg 55.9 4,720 NA 1,160
Table Notes:1 Arizona Department of Environmental Quality Residential Soil Remediation Levels, Title 18 Chapter 7, January 20082 EPA Region IX Preliminary Remediation Goals, Residential Soil, October 20043 Bold values with bold outline exceed one or more of the comparison criteria.
5 -- = Not established6 FD = Field duplicate7 J = Estimated value8 J- = Estimated value, may be biased low9 mg/kg = milligrams per kilogram10 NA = Not analyzed11 REG = Regular sample12 Subsurface = The sample was collected approximately 10-12 inches below surface.13 Surface = The sample was collected approximately 0-2 inches below surface.14 U = Not detected; reporting limit is shown in place of a result.
4 Bold italicized values have detection limits above one or more of the comparison criteria.
Minimum Detected Result:Maximum Detected Result:
0.42
559.25 16,185.00 126.48Arithmetic Mean Detected Result:
23.2 12,100 6.89,190 25,500 3,330
7.03165
Page 17 of 17
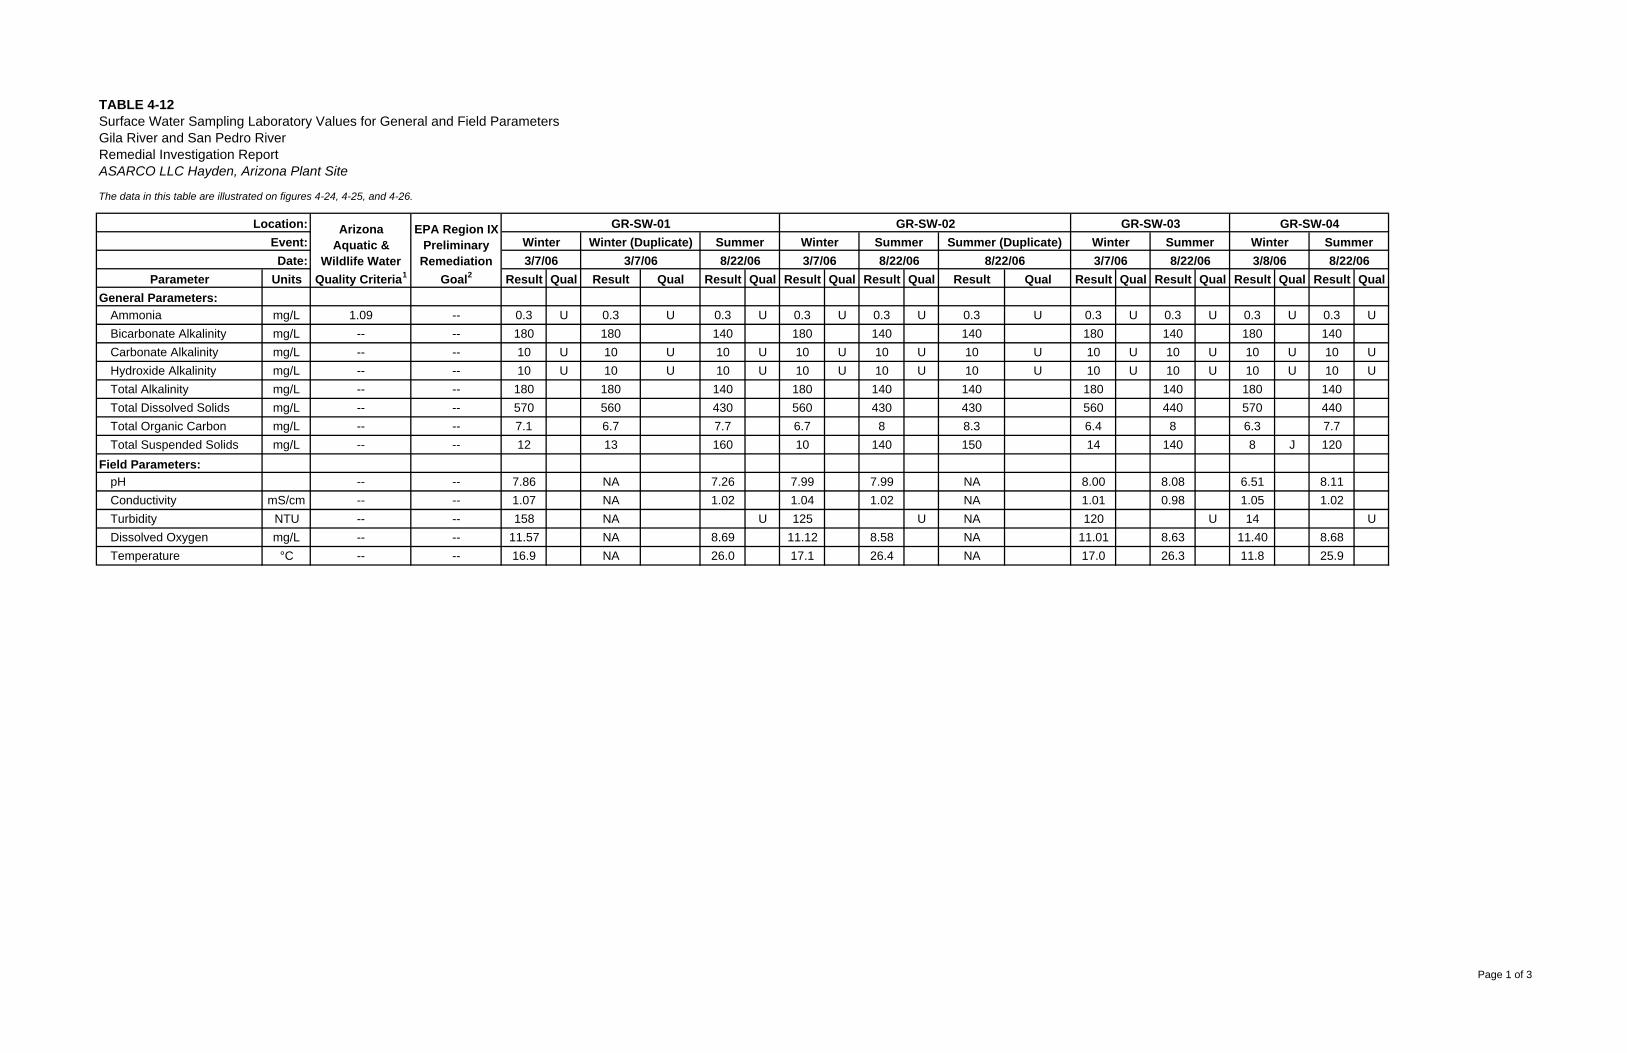
TABLE 4-12Surface Water Sampling Laboratory Values for General and Field Parameters
The data in this table are illustrated on figures 4-24, 4-25, and 4-26.
Parameter Units Result Qual Result Qual Result Qual Result Qual Result Qual Result Qual Result Qual Result Qual Result Qual Result QualGeneral Parameters:
Ammonia mg/L 1.09 -- 0.3 U 0.3 U 0.3 U 0.3 U 0.3 U 0.3 U 0.3 U 0.3 U 0.3 U 0.3 UBicarbonate Alkalinity mg/L -- -- 180 180 140 180 140 140 180 140 180 140Carbonate Alkalinity mg/L -- -- 10 U 10 U 10 U 10 U 10 U 10 U 10 U 10 U 10 U 10 UHydroxide Alkalinity mg/L -- -- 10 U 10 U 10 U 10 U 10 U 10 U 10 U 10 U 10 U 10 UTotal Alkalinity mg/L -- -- 180 180 140 180 140 140 180 140 180 140Total Dissolved Solids mg/L -- -- 570 560 430 560 430 430 560 440 570 440Total Organic Carbon mg/L -- -- 7.1 6.7 7.7 6.7 8 8.3 6.4 8 6.3 7.7Total Suspended Solids mg/L -- -- 12 13 160 10 140 150 14 140 8 J 120
Field Parameters:pH -- -- 7.86 NA 7.26 7.99 7.99 NA 8.00 8.08 6.51 8.11Conductivity mS/cm -- -- 1.07 NA 1.02 1.04 1.02 NA 1.01 0.98 1.05 1.02Turbidity NTU -- -- 158 NA U 125 U NA 120 U 14 UDissolved Oxygen mg/L -- -- 11.57 NA 8.69 11.12 8.58 NA 11.01 8.63 11.40 8.68Temperature °C -- -- 16.9 NA 26.0 17.1 26.4 NA 17.0 26.3 11.8 25.9
GR-SW-03GR-SW-01
Gila River and San Pedro RiverRemedial Investigation ReportASARCO LLC Hayden, Arizona Plant Site
GR-SW-04Location: ArizonaAquatic &
Wildlife WaterQuality Criteria1
EPA Region IXPreliminary
RemediationGoal2
Event: Winter Winter (Duplicate) Winter SummerSummer Winter Summer Winter Summer3/7/063/7/06 8/22/06 3/8/06
GR-SW-02Summer (Duplicate)
8/22/06 8/22/068/22/06Date: 3/7/06 3/7/06 8/22/06
Page 1 of 3
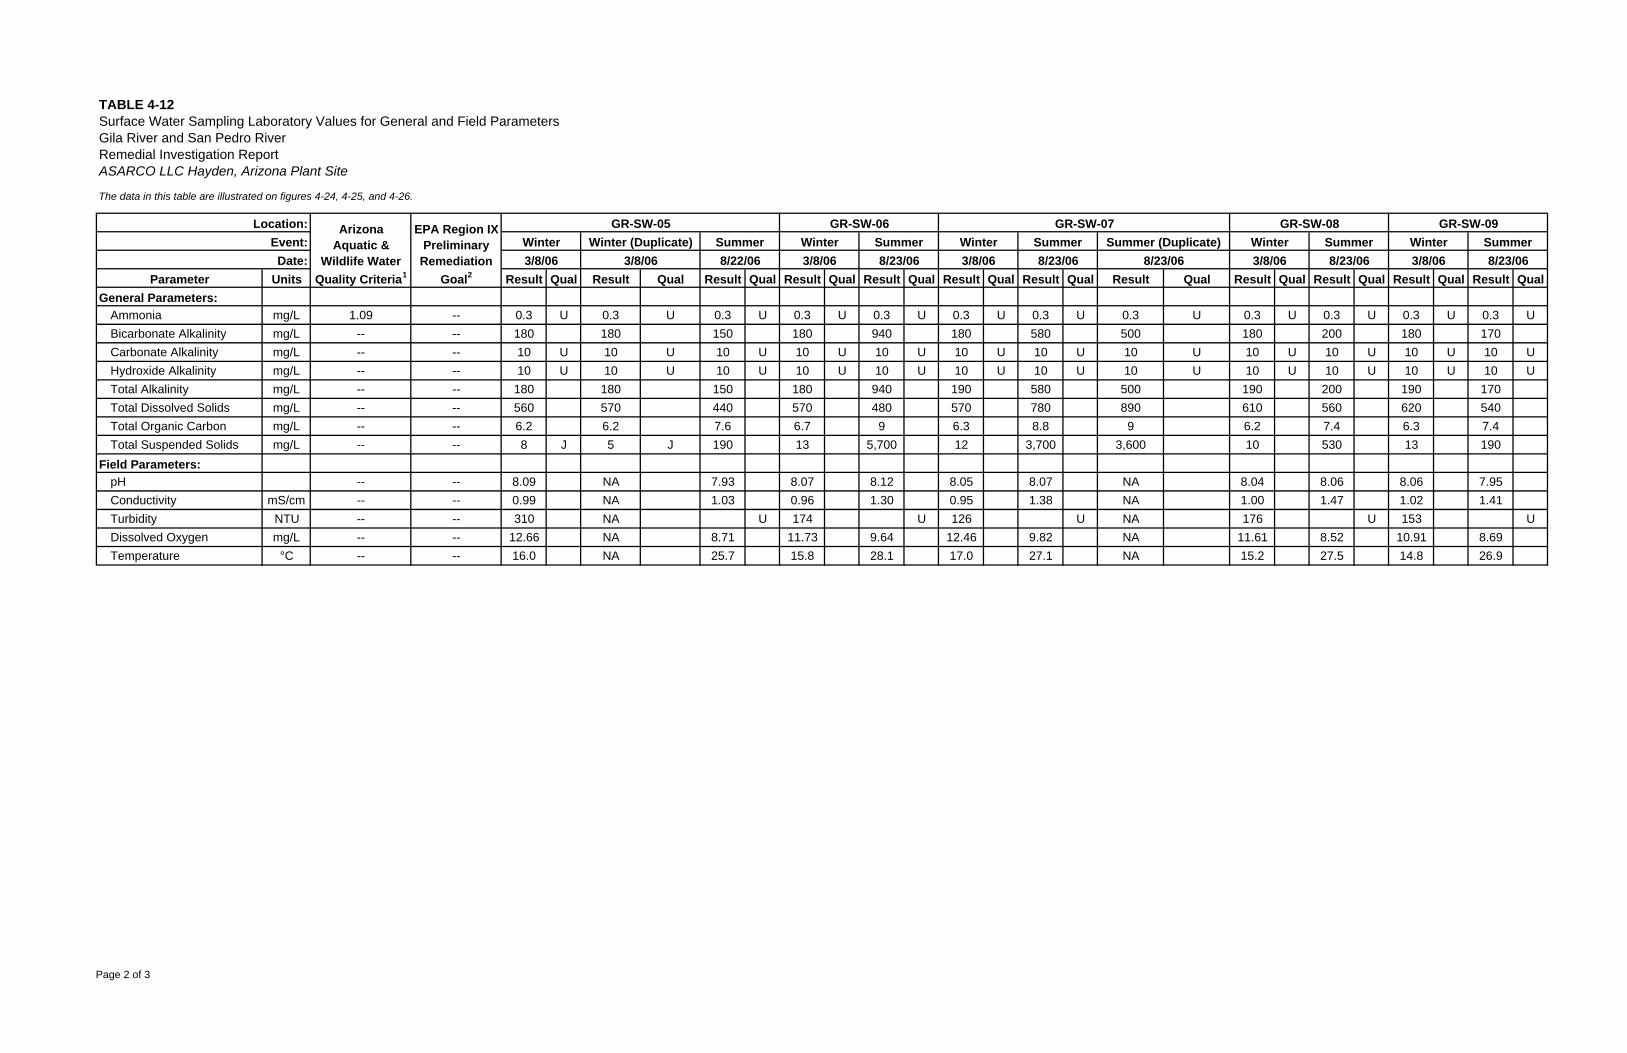
TABLE 4-12Surface Water Sampling Laboratory Values for General and Field Parameters
The data in this table are illustrated on figures 4-24, 4-25, and 4-26.
Parameter Units Result Qual Result Qual Result Qual Result Qual Result Qual Result Qual Result Qual Result Qual Result Qual Result Qual Result Qual Result QualGeneral Parameters:
Ammonia mg/L 1.09 -- 0.3 U 0.3 U 0.3 U 0.3 U 0.3 U 0.3 U 0.3 U 0.3 U 0.3 U 0.3 U 0.3 U 0.3 UBicarbonate Alkalinity mg/L -- -- 180 180 150 180 940 180 580 500 180 200 180 170Carbonate Alkalinity mg/L -- -- 10 U 10 U 10 U 10 U 10 U 10 U 10 U 10 U 10 U 10 U 10 U 10 UHydroxide Alkalinity mg/L -- -- 10 U 10 U 10 U 10 U 10 U 10 U 10 U 10 U 10 U 10 U 10 U 10 UTotal Alkalinity mg/L -- -- 180 180 150 180 940 190 580 500 190 200 190 170Total Dissolved Solids mg/L -- -- 560 570 440 570 480 570 780 890 610 560 620 540Total Organic Carbon mg/L -- -- 6.2 6.2 7.6 6.7 9 6.3 8.8 9 6.2 7.4 6.3 7.4Total Suspended Solids mg/L -- -- 8 J 5 J 190 13 5,700 12 3,700 3,600 10 530 13 190
Field Parameters:pH -- -- 8.09 NA 7.93 8.07 8.12 8.05 8.07 NA 8.04 8.06 8.06 7.95Conductivity mS/cm -- -- 0.99 NA 1.03 0.96 1.30 0.95 1.38 NA 1.00 1.47 1.02 1.41Turbidity NTU -- -- 310 NA U 174 U 126 U NA 176 U 153 UDissolved Oxygen mg/L -- -- 12.66 NA 8.71 11.73 9.64 12.46 9.82 NA 11.61 8.52 10.91 8.69Temperature °C -- -- 16.0 NA 25.7 15.8 28.1 17.0 27.1 NA 15.2 27.5 14.8 26.9
GR-SW-06 GR-SW-08 GR-SW-09GR-SW-07Winter Winter (Duplicate) Winter SummerSummer Winter Summer Winter SummerSummer (Duplicate) Winter Summer
8/23/06 3/8/06 8/23/068/23/06 3/8/06
GR-SW-05
3/8/06 3/8/06 8/22/06 8/23/06 3/8/068/23/063/8/06
Gila River and San Pedro RiverRemedial Investigation ReportASARCO LLC Hayden, Arizona Plant Site
Location: ArizonaAquatic &
Wildlife WaterQuality Criteria1
EPA Region IXPreliminary
RemediationGoal2
Event:Date:
Page 2 of 3
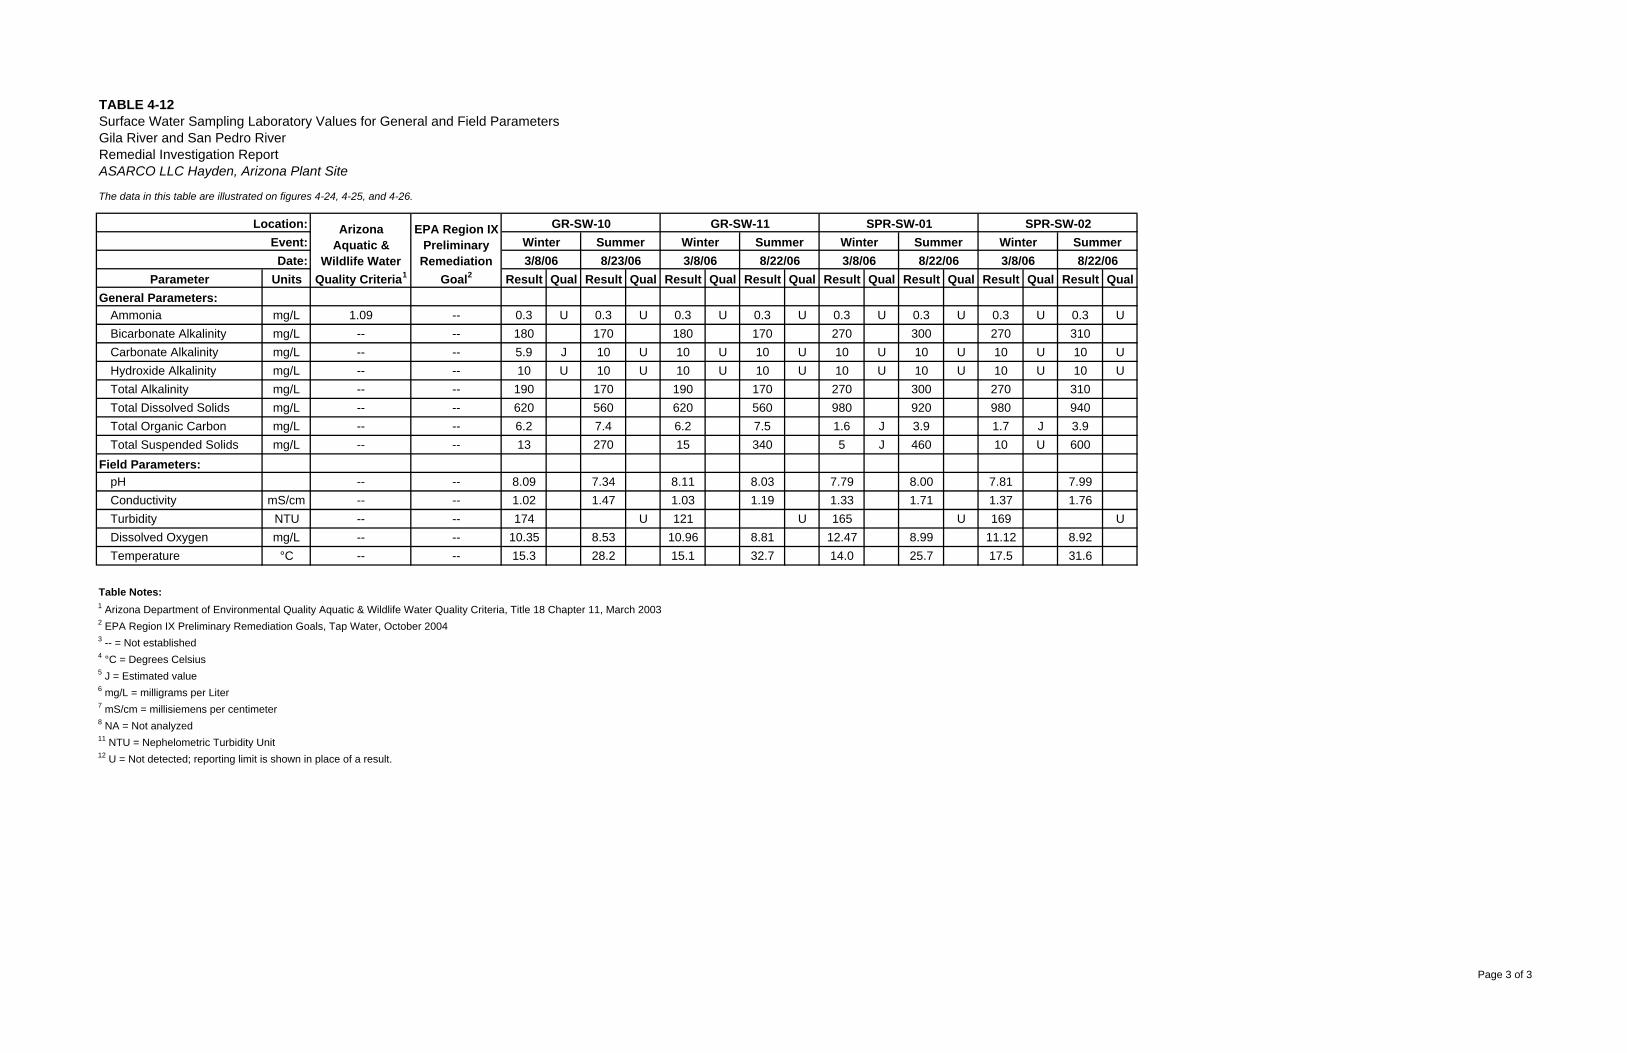
TABLE 4-12Surface Water Sampling Laboratory Values for General and Field Parameters
The data in this table are illustrated on figures 4-24, 4-25, and 4-26.
Parameter Units Result Qual Result Qual Result Qual Result Qual Result Qual Result Qual Result Qual Result QualGeneral Parameters:
Ammonia mg/L 1.09 -- 0.3 U 0.3 U 0.3 U 0.3 U 0.3 U 0.3 U 0.3 U 0.3 UBicarbonate Alkalinity mg/L -- -- 180 170 180 170 270 300 270 310Carbonate Alkalinity mg/L -- -- 5.9 J 10 U 10 U 10 U 10 U 10 U 10 U 10 UHydroxide Alkalinity mg/L -- -- 10 U 10 U 10 U 10 U 10 U 10 U 10 U 10 UTotal Alkalinity mg/L -- -- 190 170 190 170 270 300 270 310Total Dissolved Solids mg/L -- -- 620 560 620 560 980 920 980 940Total Organic Carbon mg/L -- -- 6.2 7.4 6.2 7.5 1.6 J 3.9 1.7 J 3.9Total Suspended Solids mg/L -- -- 13 270 15 340 5 J 460 10 U 600
Field Parameters:pH -- -- 8.09 7.34 8.11 8.03 7.79 8.00 7.81 7.99Conductivity mS/cm -- -- 1.02 1.47 1.03 1.19 1.33 1.71 1.37 1.76Turbidity NTU -- -- 174 U 121 U 165 U 169 UDissolved Oxygen mg/L -- -- 10.35 8.53 10.96 8.81 12.47 8.99 11.12 8.92Temperature °C -- -- 15.3 28.2 15.1 32.7 14.0 25.7 17.5 31.6
Table Notes:1 Arizona Department of Environmental Quality Aquatic & Wildlife Water Quality Criteria, Title 18 Chapter 11, March 20032 EPA Region IX Preliminary Remediation Goals, Tap Water, October 20043 -- = Not established4 °C = Degrees Celsius5 J = Estimated value6 mg/L = milligrams per Liter7 mS/cm = millisiemens per centimeter8 NA = Not analyzed11 NTU = Nephelometric Turbidity Unit12 U = Not detected; reporting limit is shown in place of a result.
GR-SW-10 GR-SW-11 SPR-SW-01 SPR-SW-02SummerWinter Winter SummerWinter Summer Winter Summer
8/22/068/23/06 3/8/06 8/22/06 3/8/06 8/22/06 3/8/063/8/06
Gila River and San Pedro RiverRemedial Investigation ReportASARCO LLC Hayden, Arizona Plant Site
Location: ArizonaAquatic &
Wildlife WaterQuality Criteria1
EPA Region IXPreliminary
RemediationGoal2
Event:Date:
Page 3 of 3
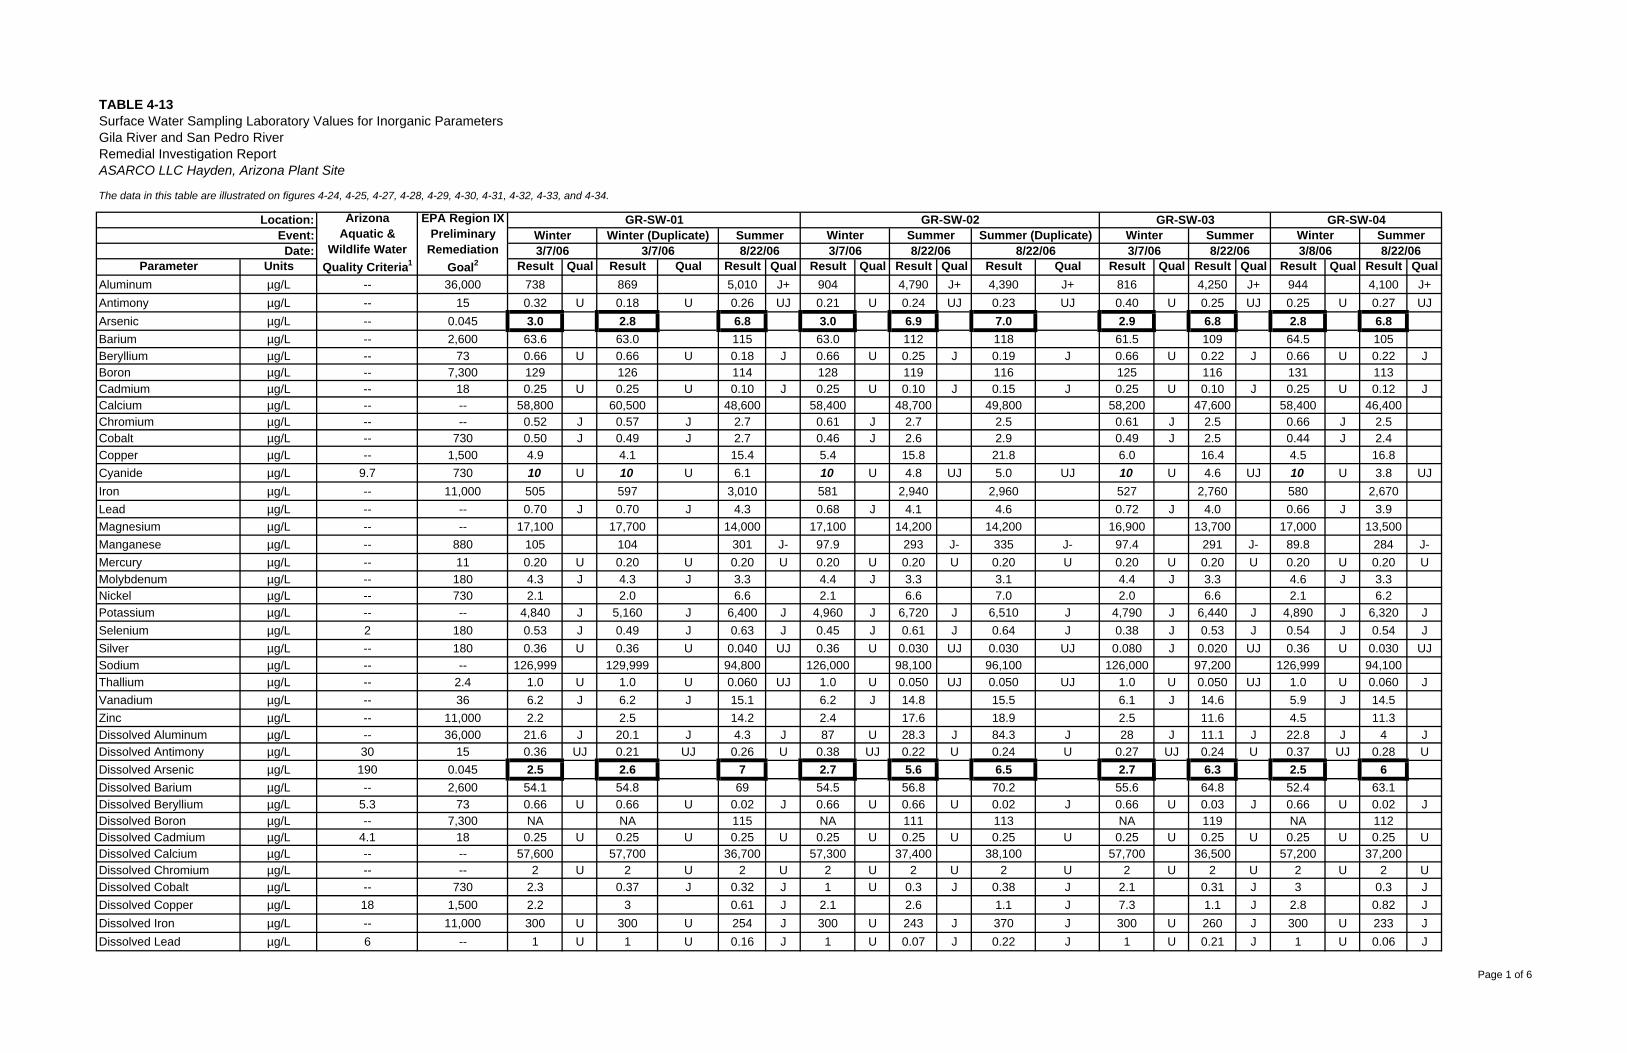
Surface Water Sampling Laboratory Values for Inorganic Parameters
The data in this table are illustrated on figures 4-24, 4-25, 4-27, 4-28, 4-29, 4-30, 4-31, 4-32, 4-33, and 4-34.
Parameter Units Result Qual Result Qual Result Qual Result Qual Result Qual Result Qual Result Qual Result Qual Result Qual Result QualAluminum µg/L -- 36,000 738 869 5,010 J+ 904 4,790 J+ 4,390 J+ 816 4,250 J+ 944 4,100 J+Antimony µg/L -- 15 0.32 U 0.18 U 0.26 UJ 0.21 U 0.24 UJ 0.23 UJ 0.40 U 0.25 UJ 0.25 U 0.27 UJArsenic µg/L -- 0.045 3.0 2.8 6.8 3.0 6.9 7.0 2.9 6.8 2.8 6.8Barium µg/L -- 2,600 63.6 63.0 115 63.0 112 118 61.5 109 64.5 105Beryllium µg/L -- 73 0.66 U 0.66 U 0.18 J 0.66 U 0.25 J 0.19 J 0.66 U 0.22 J 0.66 U 0.22 JBoron µg/L -- 7,300 129 126 114 128 119 116 125 116 131 113Cadmium µg/L -- 18 0.25 U 0.25 U 0.10 J 0.25 U 0.10 J 0.15 J 0.25 U 0.10 J 0.25 U 0.12 JCalcium µg/L -- -- 58,800 60,500 48,600 58,400 48,700 49,800 58,200 47,600 58,400 46,400Chromium µg/L -- -- 0.52 J 0.57 J 2.7 0.61 J 2.7 2.5 0.61 J 2.5 0.66 J 2.5Cobalt µg/L -- 730 0.50 J 0.49 J 2.7 0.46 J 2.6 2.9 0.49 J 2.5 0.44 J 2.4Copper µg/L -- 1,500 4.9 4.1 15.4 5.4 15.8 21.8 6.0 16.4 4.5 16.8Cyanide µg/L 9.7 730 10 U 10 U 6.1 10 U 4.8 UJ 5.0 UJ 10 U 4.6 UJ 10 U 3.8 UJIron µg/L -- 11,000 505 597 3,010 581 2,940 2,960 527 2,760 580 2,670Lead µg/L -- -- 0.70 J 0.70 J 4.3 0.68 J 4.1 4.6 0.72 J 4.0 0.66 J 3.9Magnesium µg/L -- -- 17,100 17,700 14,000 17,100 14,200 14,200 16,900 13,700 17,000 13,500Manganese µg/L -- 880 105 104 301 J- 97.9 293 J- 335 J- 97.4 291 J- 89.8 284 J-Mercury µg/L -- 11 0.20 U 0.20 U 0.20 U 0.20 U 0.20 U 0.20 U 0.20 U 0.20 U 0.20 U 0.20 UMolybdenum µg/L -- 180 4.3 J 4.3 J 3.3 4.4 J 3.3 3.1 4.4 J 3.3 4.6 J 3.3Nickel µg/L -- 730 2.1 2.0 6.6 2.1 6.6 7.0 2.0 6.6 2.1 6.2Potassium µg/L -- -- 4,840 J 5,160 J 6,400 J 4,960 J 6,720 J 6,510 J 4,790 J 6,440 J 4,890 J 6,320 JSelenium µg/L 2 180 0.53 J 0.49 J 0.63 J 0.45 J 0.61 J 0.64 J 0.38 J 0.53 J 0.54 J 0.54 JSilver µg/L -- 180 0.36 U 0.36 U 0.040 UJ 0.36 U 0.030 UJ 0.030 UJ 0.080 J 0.020 UJ 0.36 U 0.030 UJSodium µg/L -- -- 126,999 129,999 94,800 126,000 98,100 96,100 126,000 97,200 126,999 94,100Thallium µg/L -- 2.4 1.0 U 1.0 U 0.060 UJ 1.0 U 0.050 UJ 0.050 UJ 1.0 U 0.050 UJ 1.0 U 0.060 JVanadium µg/L -- 36 6.2 J 6.2 J 15.1 6.2 J 14.8 15.5 6.1 J 14.6 5.9 J 14.5Zinc µg/L -- 11,000 2.2 2.5 14.2 2.4 17.6 18.9 2.5 11.6 4.5 11.3Dissolved Aluminum µg/L -- 36,000 21.6 J 20.1 J 4.3 J 87 U 28.3 J 84.3 J 28 J 11.1 J 22.8 J 4 JDissolved Antimony µg/L 30 15 0.36 UJ 0.21 UJ 0.26 U 0.38 UJ 0.22 U 0.24 U 0.27 UJ 0.24 U 0.37 UJ 0.28 UDissolved Arsenic µg/L 190 0.045 2.5 2.6 7 2.7 5.6 6.5 2.7 6.3 2.5 6Dissolved Barium µg/L -- 2,600 54.1 54.8 69 54.5 56.8 70.2 55.6 64.8 52.4 63.1Dissolved Beryllium µg/L 5.3 73 0.66 U 0.66 U 0.02 J 0.66 U 0.66 U 0.02 J 0.66 U 0.03 J 0.66 U 0.02 JDissolved Boron µg/L -- 7,300 NA NA 115 NA 111 113 NA 119 NA 112Dissolved Cadmium µg/L 4.1 18 0.25 U 0.25 U 0.25 U 0.25 U 0.25 U 0.25 U 0.25 U 0.25 U 0.25 U 0.25 UDissolved Calcium µg/L -- -- 57,600 57,700 36,700 57,300 37,400 38,100 57,700 36,500 57,200 37,200Dissolved Chromium µg/L -- -- 2 U 2 U 2 U 2 U 2 U 2 U 2 U 2 U 2 U 2 UDissolved Cobalt µg/L -- 730 2.3 0.37 J 0.32 J 1 U 0.3 J 0.38 J 2.1 0.31 J 3 0.3 JDissolved Copper µg/L 18 1,500 2.2 3 0.61 J 2.1 2.6 1.1 J 7.3 1.1 J 2.8 0.82 JDissolved Iron µg/L -- 11,000 300 U 300 U 254 J 300 U 243 J 370 J 300 U 260 J 300 U 233 JDissolved Lead µg/L 6 -- 1 U 1 U 0.16 J 1 U 0.07 J 0.22 J 1 U 0.21 J 1 U 0.06 J
Winter Summer Summer (Duplicate) Winter Summer Winter SummerGR-SW-01 GR-SW-02Location: Arizona
Aquatic &Wildlife Water
Quality Criteria1
EPA Region IXPreliminary
RemediationGoal2
Date: 8/22/06Event: Winter
3/7/06
Gila River and San Pedro RiverRemedial Investigation ReportASARCO LLC Hayden, Arizona Plant Site
TABLE 4-13
8/22/06 8/22/06
GR-SW-04GR-SW-03
3/7/06 8/22/06 3/8/06 8/22/06Winter (Duplicate) Summer
3/7/06 3/7/06
Page 1 of 6
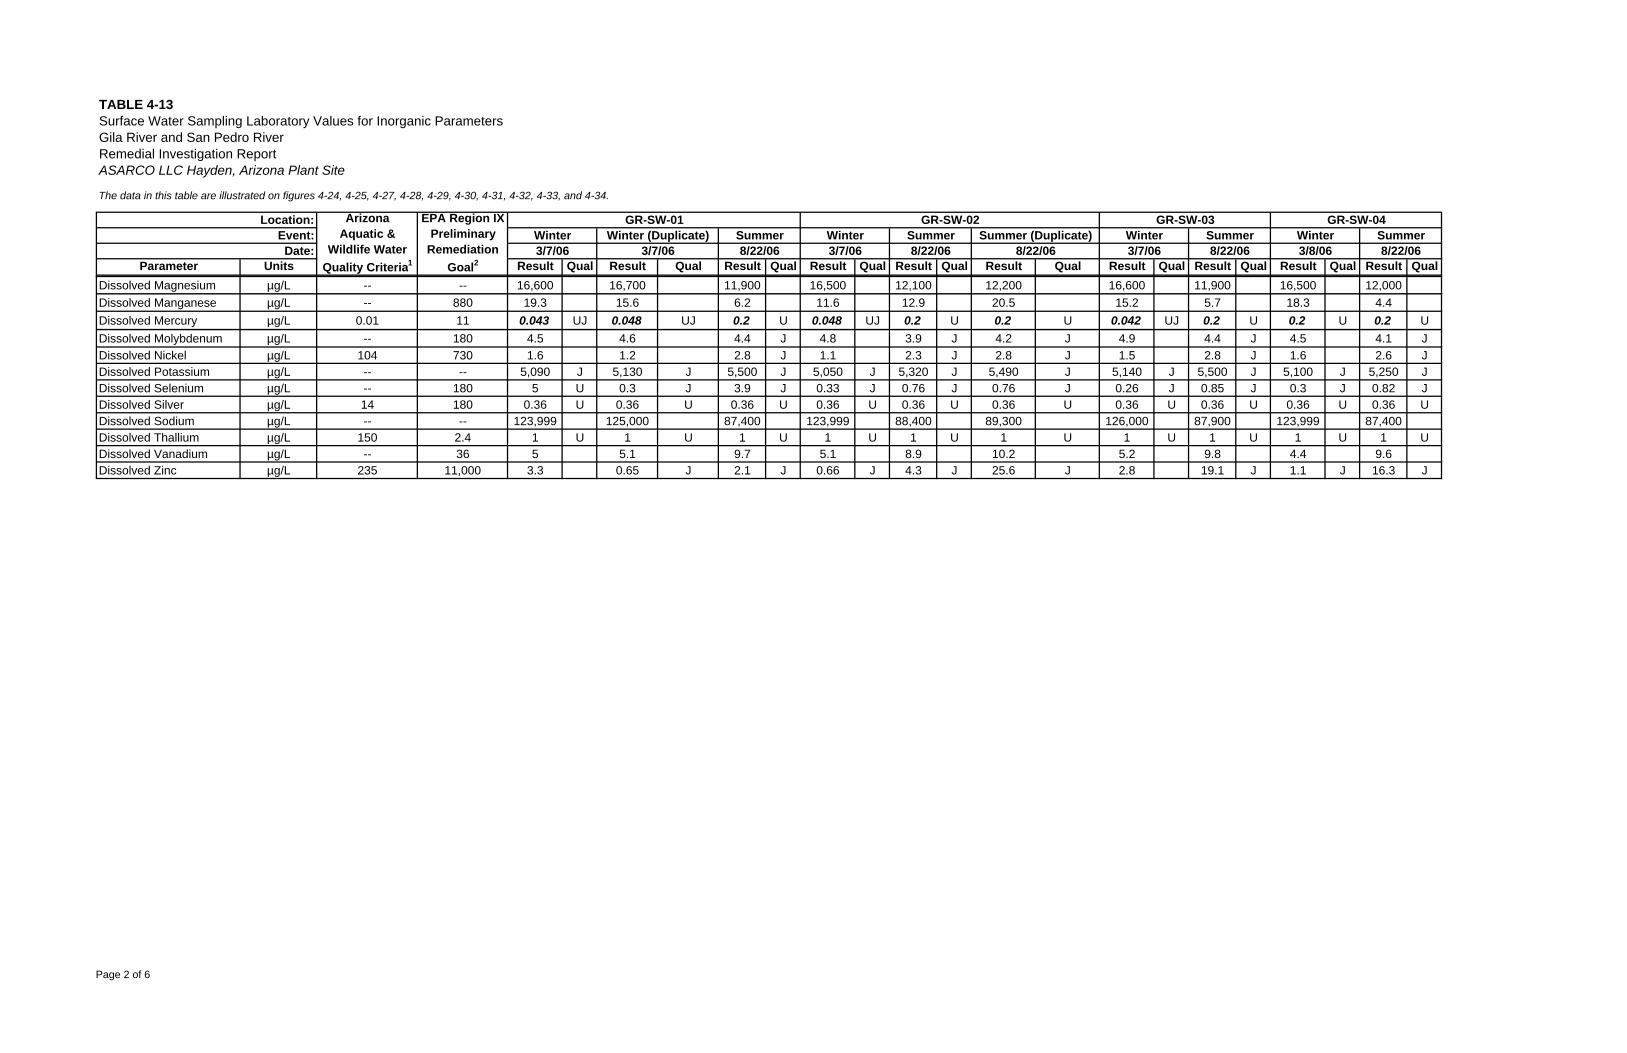
Surface Water Sampling Laboratory Values for Inorganic Parameters
The data in this table are illustrated on figures 4-24, 4-25, 4-27, 4-28, 4-29, 4-30, 4-31, 4-32, 4-33, and 4-34.
Parameter Units Result Qual Result Qual Result Qual Result Qual Result Qual Result Qual Result Qual Result Qual Result Qual Result Qual
Winter Summer Summer (Duplicate) Winter Summer Winter SummerGR-SW-01 GR-SW-02Location: Arizona
Aquatic &Wildlife Water
Quality Criteria1
EPA Region IXPreliminary
RemediationGoal2
Date: 8/22/06Event: Winter
3/7/06
Gila River and San Pedro RiverRemedial Investigation ReportASARCO LLC Hayden, Arizona Plant Site
TABLE 4-13
8/22/06 8/22/06
GR-SW-04GR-SW-03
3/7/06 8/22/06 3/8/06 8/22/06Winter (Duplicate) Summer
3/7/06 3/7/06
Dissolved Magnesium µg/L -- -- 16,600 16,700 11,900 16,500 12,100 12,200 16,600 11,900 16,500 12,000Dissolved Manganese µg/L -- 880 19.3 15.6 6.2 11.6 12.9 20.5 15.2 5.7 18.3 4.4Dissolved Mercury µg/L 0.01 11 0.043 UJ 0.048 UJ 0.2 U 0.048 UJ 0.2 U 0.2 U 0.042 UJ 0.2 U 0.2 U 0.2 UDissolved Molybdenum µg/L -- 180 4.5 4.6 4.4 J 4.8 3.9 J 4.2 J 4.9 4.4 J 4.5 4.1 JDissolved Nickel µg/L 104 730 1.6 1.2 2.8 J 1.1 2.3 J 2.8 J 1.5 2.8 J 1.6 2.6 JDissolved Potassium µg/L -- -- 5,090 J 5,130 J 5,500 J 5,050 J 5,320 J 5,490 J 5,140 J 5,500 J 5,100 J 5,250 JDissolved Selenium µg/L -- 180 5 U 0.3 J 3.9 J 0.33 J 0.76 J 0.76 J 0.26 J 0.85 J 0.3 J 0.82 JDissolved Silver µg/L 14 180 0.36 U 0.36 U 0.36 U 0.36 U 0.36 U 0.36 U 0.36 U 0.36 U 0.36 U 0.36 UDissolved Sodium µg/L -- -- 123,999 125,000 87,400 123,999 88,400 89,300 126,000 87,900 123,999 87,400Dissolved Thallium µg/L 150 2.4 1 U 1 U 1 U 1 U 1 U 1 U 1 U 1 U 1 U 1 UDissolved Vanadium µg/L -- 36 5 5.1 9.7 5.1 8.9 10.2 5.2 9.8 4.4 9.6Dissolved Zinc µg/L 235 11,000 3.3 0.65 J 2.1 J 0.66 J 4.3 J 25.6 J 2.8 19.1 J 1.1 J 16.3 J
Page 2 of 6
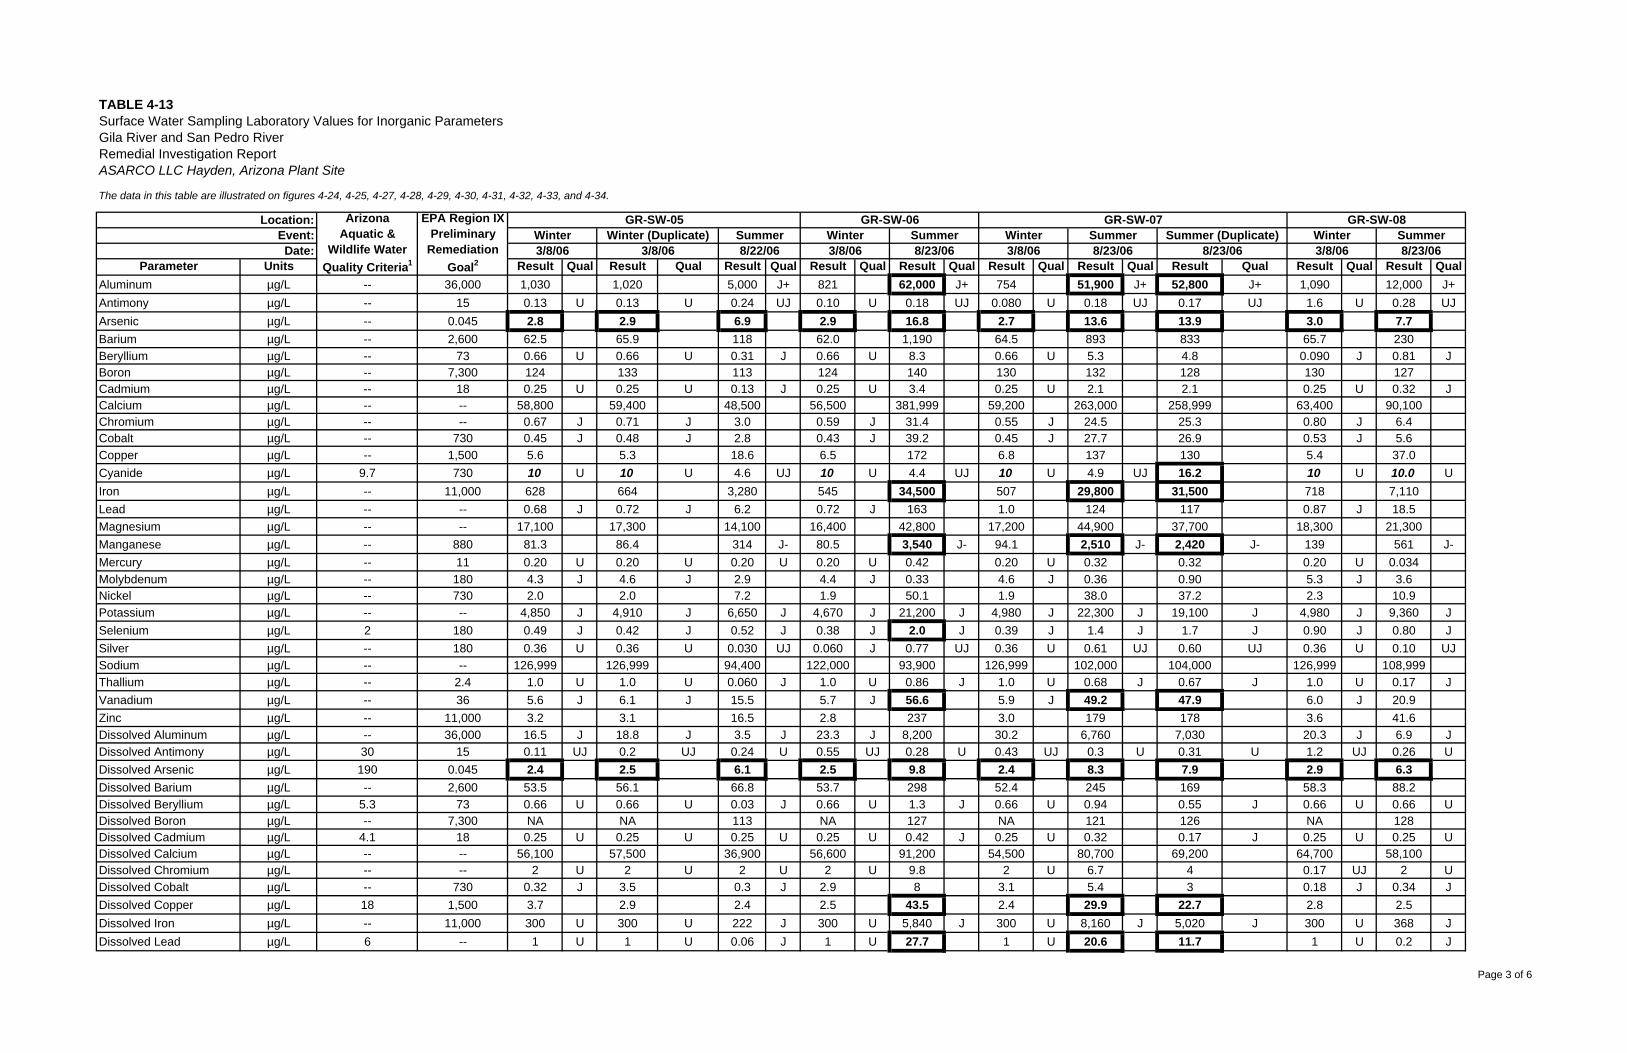
Surface Water Sampling Laboratory Values for Inorganic Parameters
The data in this table are illustrated on figures 4-24, 4-25, 4-27, 4-28, 4-29, 4-30, 4-31, 4-32, 4-33, and 4-34.
Parameter Units Result Qual Result Qual Result Qual Result Qual Result Qual Result Qual Result Qual Result Qual Result Qual Result QualAluminum µg/L -- 36,000 1,030 1,020 5,000 J+ 821 62,000 J+ 754 51,900 J+ 52,800 J+ 1,090 12,000 J+Antimony µg/L -- 15 0.13 U 0.13 U 0.24 UJ 0.10 U 0.18 UJ 0.080 U 0.18 UJ 0.17 UJ 1.6 U 0.28 UJArsenic µg/L -- 0.045 2.8 2.9 6.9 2.9 16.8 2.7 13.6 13.9 3.0 7.7Barium µg/L -- 2,600 62.5 65.9 118 62.0 1,190 64.5 893 833 65.7 230Beryllium µg/L -- 73 0.66 U 0.66 U 0.31 J 0.66 U 8.3 0.66 U 5.3 4.8 0.090 J 0.81 JBoron µg/L -- 7,300 124 133 113 124 140 130 132 128 130 127Cadmium µg/L -- 18 0.25 U 0.25 U 0.13 J 0.25 U 3.4 0.25 U 2.1 2.1 0.25 U 0.32 JCalcium µg/L -- -- 58,800 59,400 48,500 56,500 381,999 59,200 263,000 258,999 63,400 90,100Chromium µg/L -- -- 0.67 J 0.71 J 3.0 0.59 J 31.4 0.55 J 24.5 25.3 0.80 J 6.4Cobalt µg/L -- 730 0.45 J 0.48 J 2.8 0.43 J 39.2 0.45 J 27.7 26.9 0.53 J 5.6Copper µg/L -- 1,500 5.6 5.3 18.6 6.5 172 6.8 137 130 5.4 37.0Cyanide µg/L 9.7 730 10 U 10 U 4.6 UJ 10 U 4.4 UJ 10 U 4.9 UJ 16.2 10 U 10.0 UIron µg/L -- 11,000 628 664 3,280 545 34,500 507 29,800 31,500 718 7,110Lead µg/L -- -- 0.68 J 0.72 J 6.2 0.72 J 163 1.0 124 117 0.87 J 18.5Magnesium µg/L -- -- 17,100 17,300 14,100 16,400 42,800 17,200 44,900 37,700 18,300 21,300Manganese µg/L -- 880 81.3 86.4 314 J- 80.5 3,540 J- 94.1 2,510 J- 2,420 J- 139 561 J-Mercury µg/L -- 11 0.20 U 0.20 U 0.20 U 0.20 U 0.42 0.20 U 0.32 0.32 0.20 U 0.034Molybdenum µg/L -- 180 4.3 J 4.6 J 2.9 4.4 J 0.33 4.6 J 0.36 0.90 5.3 J 3.6Nickel µg/L -- 730 2.0 2.0 7.2 1.9 50.1 1.9 38.0 37.2 2.3 10.9Potassium µg/L -- -- 4,850 J 4,910 J 6,650 J 4,670 J 21,200 J 4,980 J 22,300 J 19,100 J 4,980 J 9,360 JSelenium µg/L 2 180 0.49 J 0.42 J 0.52 J 0.38 J 2.0 J 0.39 J 1.4 J 1.7 J 0.90 J 0.80 JSilver µg/L -- 180 0.36 U 0.36 U 0.030 UJ 0.060 J 0.77 UJ 0.36 U 0.61 UJ 0.60 UJ 0.36 U 0.10 UJSodium µg/L -- -- 126,999 126,999 94,400 122,000 93,900 126,999 102,000 104,000 126,999 108,999Thallium µg/L -- 2.4 1.0 U 1.0 U 0.060 J 1.0 U 0.86 J 1.0 U 0.68 J 0.67 J 1.0 U 0.17 JVanadium µg/L -- 36 5.6 J 6.1 J 15.5 5.7 J 56.6 5.9 J 49.2 47.9 6.0 J 20.9Zinc µg/L -- 11,000 3.2 3.1 16.5 2.8 237 3.0 179 178 3.6 41.6Dissolved Aluminum µg/L -- 36,000 16.5 J 18.8 J 3.5 J 23.3 J 8,200 30.2 6,760 7,030 20.3 J 6.9 JDissolved Antimony µg/L 30 15 0.11 UJ 0.2 UJ 0.24 U 0.55 UJ 0.28 U 0.43 UJ 0.3 U 0.31 U 1.2 UJ 0.26 UDissolved Arsenic µg/L 190 0.045 2.4 2.5 6.1 2.5 9.8 2.4 8.3 7.9 2.9 6.3Dissolved Barium µg/L -- 2,600 53.5 56.1 66.8 53.7 298 52.4 245 169 58.3 88.2Dissolved Beryllium µg/L 5.3 73 0.66 U 0.66 U 0.03 J 0.66 U 1.3 J 0.66 U 0.94 0.55 J 0.66 U 0.66 UDissolved Boron µg/L -- 7,300 NA NA 113 NA 127 NA 121 126 NA 128Dissolved Cadmium µg/L 4.1 18 0.25 U 0.25 U 0.25 U 0.25 U 0.42 J 0.25 U 0.32 0.17 J 0.25 U 0.25 UDissolved Calcium µg/L -- -- 56,100 57,500 36,900 56,600 91,200 54,500 80,700 69,200 64,700 58,100Dissolved Chromium µg/L -- -- 2 U 2 U 2 U 2 U 9.8 2 U 6.7 4 0.17 UJ 2 UDissolved Cobalt µg/L -- 730 0.32 J 3.5 0.3 J 2.9 8 3.1 5.4 3 0.18 J 0.34 JDissolved Copper µg/L 18 1,500 3.7 2.9 2.4 2.5 43.5 2.4 29.9 22.7 2.8 2.5Dissolved Iron µg/L -- 11,000 300 U 300 U 222 J 300 U 5,840 J 300 U 8,160 J 5,020 J 300 U 368 JDissolved Lead µg/L 6 -- 1 U 1 U 0.06 J 1 U 27.7 1 U 20.6 11.7 1 U 0.2 J
3/8/068/23/063/8/06 8/23/068/23/063/8/06 8/22/06 8/23/06 3/8/063/8/06Winter Summer Winter SummerWinter Summer Summer (Duplicate)
GR-SW-05Winter (Duplicate) SummerWinterEvent:
Date:
GR-SW-06 GR-SW-07 GR-SW-08
TABLE 4-13
Gila River and San Pedro RiverRemedial Investigation ReportASARCO LLC Hayden, Arizona Plant Site
Location: ArizonaAquatic &
Wildlife WaterQuality Criteria1
EPA Region IXPreliminary
RemediationGoal2
Page 3 of 6
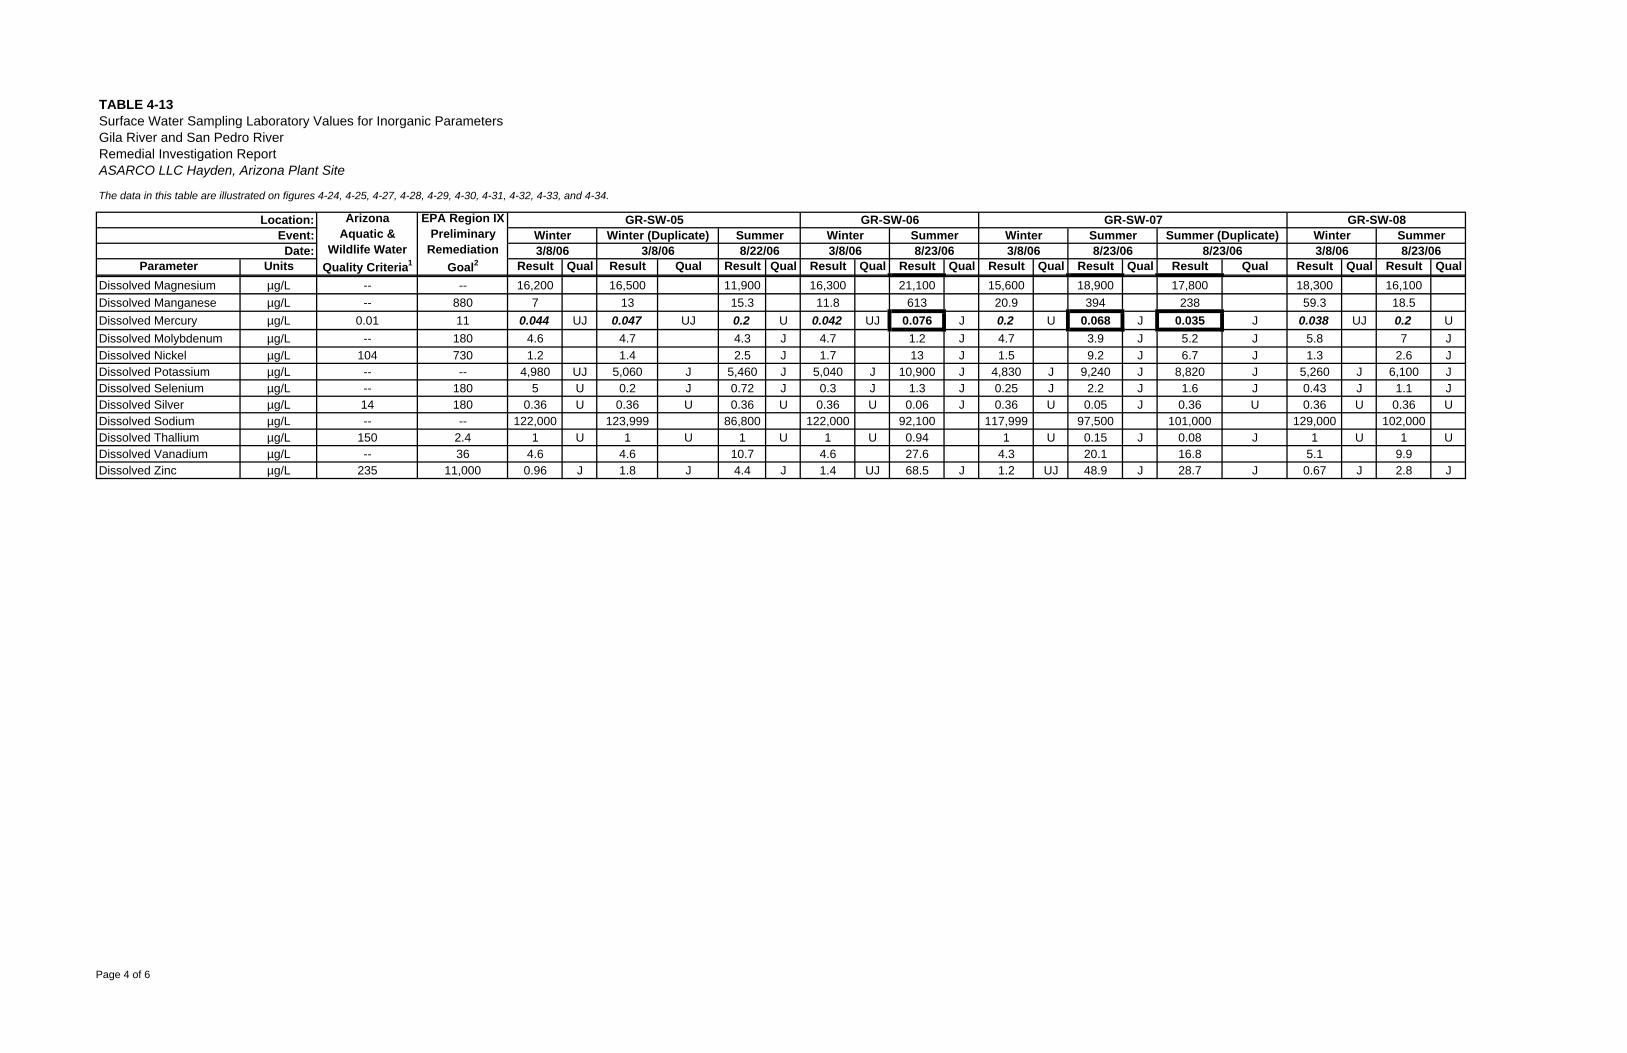
Surface Water Sampling Laboratory Values for Inorganic Parameters
The data in this table are illustrated on figures 4-24, 4-25, 4-27, 4-28, 4-29, 4-30, 4-31, 4-32, 4-33, and 4-34.
Parameter Units Result Qual Result Qual Result Qual Result Qual Result Qual Result Qual Result Qual Result Qual Result Qual Result Qual3/8/068/23/063/8/06 8/23/068/23/063/8/06 8/22/06 8/23/06 3/8/063/8/06
Winter Summer Winter SummerWinter Summer Summer (Duplicate)GR-SW-05
Winter (Duplicate) SummerWinterEvent:Date:
GR-SW-06 GR-SW-07 GR-SW-08
TABLE 4-13
Gila River and San Pedro RiverRemedial Investigation ReportASARCO LLC Hayden, Arizona Plant Site
Location: ArizonaAquatic &
Wildlife WaterQuality Criteria1
EPA Region IXPreliminary
RemediationGoal2
Dissolved Magnesium µg/L -- -- 16,200 16,500 11,900 16,300 21,100 15,600 18,900 17,800 18,300 16,100Dissolved Manganese µg/L -- 880 7 13 15.3 11.8 613 20.9 394 238 59.3 18.5Dissolved Mercury µg/L 0.01 11 0.044 UJ 0.047 UJ 0.2 U 0.042 UJ 0.076 J 0.2 U 0.068 J 0.035 J 0.038 UJ 0.2 UDissolved Molybdenum µg/L -- 180 4.6 4.7 4.3 J 4.7 1.2 J 4.7 3.9 J 5.2 J 5.8 7 JDissolved Nickel µg/L 104 730 1.2 1.4 2.5 J 1.7 13 J 1.5 9.2 J 6.7 J 1.3 2.6 JDissolved Potassium µg/L -- -- 4,980 UJ 5,060 J 5,460 J 5,040 J 10,900 J 4,830 J 9,240 J 8,820 J 5,260 J 6,100 JDissolved Selenium µg/L -- 180 5 U 0.2 J 0.72 J 0.3 J 1.3 J 0.25 J 2.2 J 1.6 J 0.43 J 1.1 JDissolved Silver µg/L 14 180 0.36 U 0.36 U 0.36 U 0.36 U 0.06 J 0.36 U 0.05 J 0.36 U 0.36 U 0.36 UDissolved Sodium µg/L -- -- 122,000 123,999 86,800 122,000 92,100 117,999 97,500 101,000 129,000 102,000Dissolved Thallium µg/L 150 2.4 1 U 1 U 1 U 1 U 0.94 1 U 0.15 J 0.08 J 1 U 1 UDissolved Vanadium µg/L -- 36 4.6 4.6 10.7 4.6 27.6 4.3 20.1 16.8 5.1 9.9Dissolved Zinc µg/L 235 11,000 0.96 J 1.8 J 4.4 J 1.4 UJ 68.5 J 1.2 UJ 48.9 J 28.7 J 0.67 J 2.8 J
Page 4 of 6
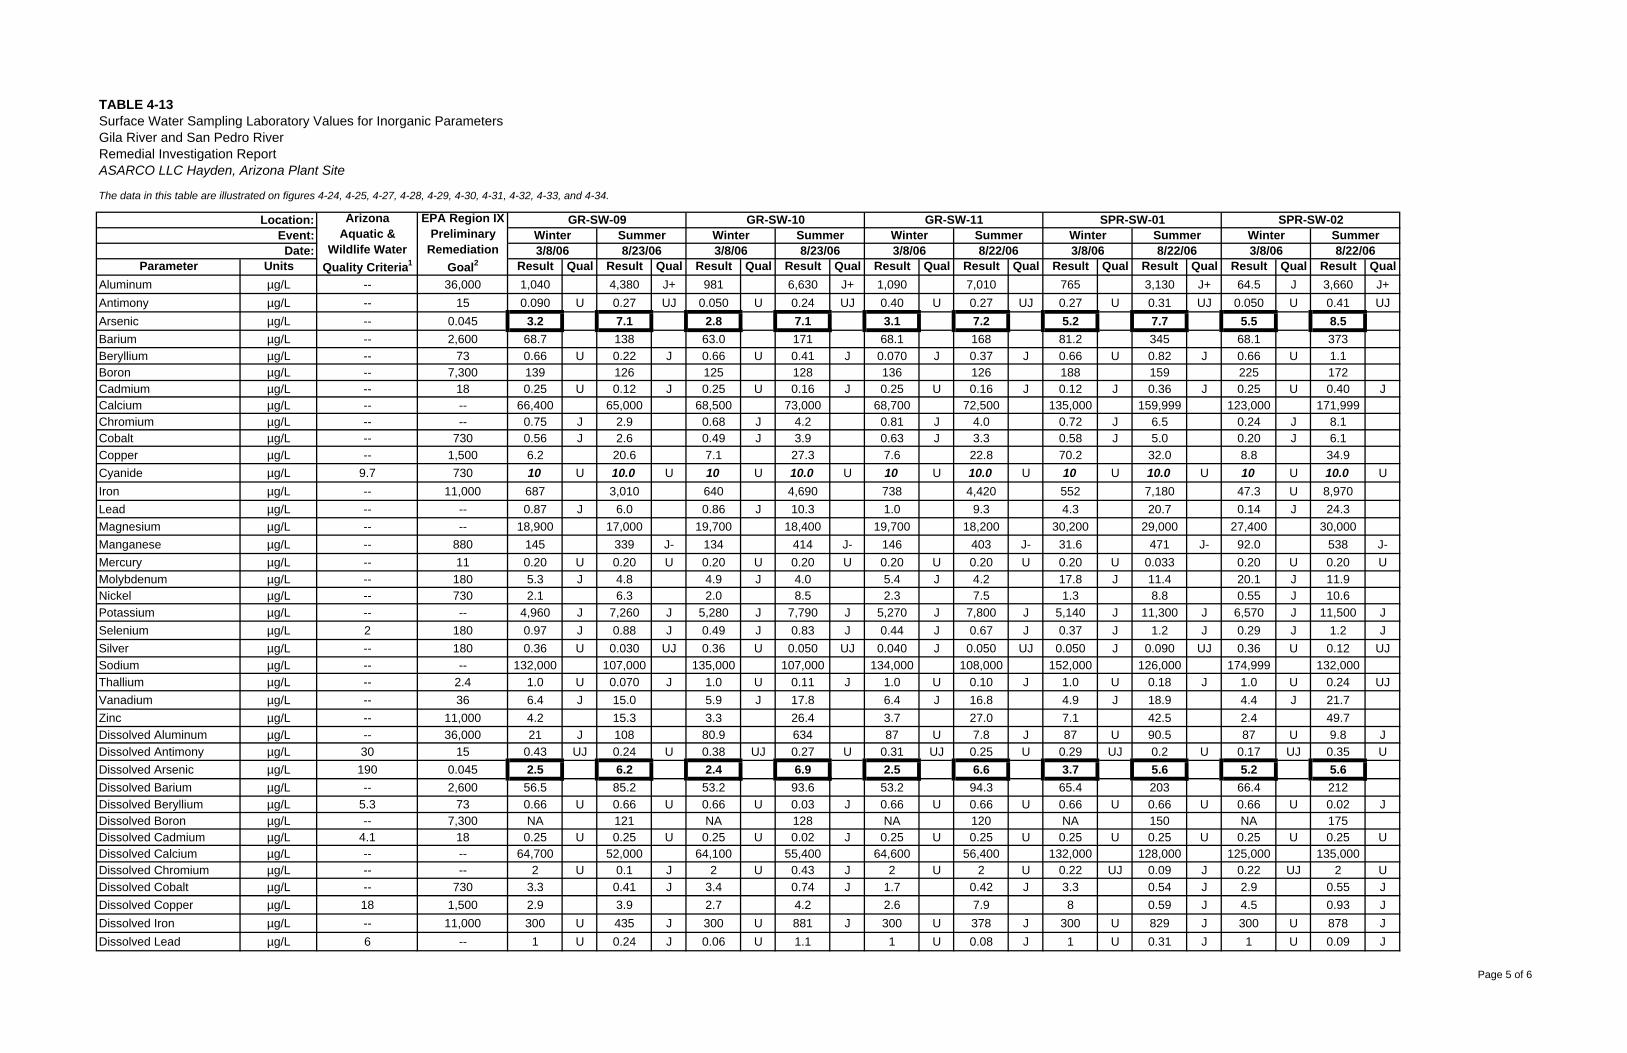
Surface Water Sampling Laboratory Values for Inorganic Parameters
The data in this table are illustrated on figures 4-24, 4-25, 4-27, 4-28, 4-29, 4-30, 4-31, 4-32, 4-33, and 4-34.
Parameter Units Result Qual Result Qual Result Qual Result Qual Result Qual Result Qual Result Qual Result Qual Result Qual Result QualAluminum µg/L -- 36,000 1,040 4,380 J+ 981 6,630 J+ 1,090 7,010 765 3,130 J+ 64.5 J 3,660 J+Antimony µg/L -- 15 0.090 U 0.27 UJ 0.050 U 0.24 UJ 0.40 U 0.27 UJ 0.27 U 0.31 UJ 0.050 U 0.41 UJArsenic µg/L -- 0.045 3.2 7.1 2.8 7.1 3.1 7.2 5.2 7.7 5.5 8.5Barium µg/L -- 2,600 68.7 138 63.0 171 68.1 168 81.2 345 68.1 373Beryllium µg/L -- 73 0.66 U 0.22 J 0.66 U 0.41 J 0.070 J 0.37 J 0.66 U 0.82 J 0.66 U 1.1Boron µg/L -- 7,300 139 126 125 128 136 126 188 159 225 172Cadmium µg/L -- 18 0.25 U 0.12 J 0.25 U 0.16 J 0.25 U 0.16 J 0.12 J 0.36 J 0.25 U 0.40 JCalcium µg/L -- -- 66,400 65,000 68,500 73,000 68,700 72,500 135,000 159,999 123,000 171,999Chromium µg/L -- -- 0.75 J 2.9 0.68 J 4.2 0.81 J 4.0 0.72 J 6.5 0.24 J 8.1Cobalt µg/L -- 730 0.56 J 2.6 0.49 J 3.9 0.63 J 3.3 0.58 J 5.0 0.20 J 6.1Copper µg/L -- 1,500 6.2 20.6 7.1 27.3 7.6 22.8 70.2 32.0 8.8 34.9Cyanide µg/L 9.7 730 10 U 10.0 U 10 U 10.0 U 10 U 10.0 U 10 U 10.0 U 10 U 10.0 UIron µg/L -- 11,000 687 3,010 640 4,690 738 4,420 552 7,180 47.3 U 8,970Lead µg/L -- -- 0.87 J 6.0 0.86 J 10.3 1.0 9.3 4.3 20.7 0.14 J 24.3Magnesium µg/L -- -- 18,900 17,000 19,700 18,400 19,700 18,200 30,200 29,000 27,400 30,000Manganese µg/L -- 880 145 339 J- 134 414 J- 146 403 J- 31.6 471 J- 92.0 538 J-Mercury µg/L -- 11 0.20 U 0.20 U 0.20 U 0.20 U 0.20 U 0.20 U 0.20 U 0.033 0.20 U 0.20 UMolybdenum µg/L -- 180 5.3 J 4.8 4.9 J 4.0 5.4 J 4.2 17.8 J 11.4 20.1 J 11.9Nickel µg/L -- 730 2.1 6.3 2.0 8.5 2.3 7.5 1.3 8.8 0.55 J 10.6Potassium µg/L -- -- 4,960 J 7,260 J 5,280 J 7,790 J 5,270 J 7,800 J 5,140 J 11,300 J 6,570 J 11,500 JSelenium µg/L 2 180 0.97 J 0.88 J 0.49 J 0.83 J 0.44 J 0.67 J 0.37 J 1.2 J 0.29 J 1.2 JSilver µg/L -- 180 0.36 U 0.030 UJ 0.36 U 0.050 UJ 0.040 J 0.050 UJ 0.050 J 0.090 UJ 0.36 U 0.12 UJSodium µg/L -- -- 132,000 107,000 135,000 107,000 134,000 108,000 152,000 126,000 174,999 132,000Thallium µg/L -- 2.4 1.0 U 0.070 J 1.0 U 0.11 J 1.0 U 0.10 J 1.0 U 0.18 J 1.0 U 0.24 UJVanadium µg/L -- 36 6.4 J 15.0 5.9 J 17.8 6.4 J 16.8 4.9 J 18.9 4.4 J 21.7Zinc µg/L -- 11,000 4.2 15.3 3.3 26.4 3.7 27.0 7.1 42.5 2.4 49.7Dissolved Aluminum µg/L -- 36,000 21 J 108 80.9 634 87 U 7.8 J 87 U 90.5 87 U 9.8 JDissolved Antimony µg/L 30 15 0.43 UJ 0.24 U 0.38 UJ 0.27 U 0.31 UJ 0.25 U 0.29 UJ 0.2 U 0.17 UJ 0.35 UDissolved Arsenic µg/L 190 0.045 2.5 6.2 2.4 6.9 2.5 6.6 3.7 5.6 5.2 5.6Dissolved Barium µg/L -- 2,600 56.5 85.2 53.2 93.6 53.2 94.3 65.4 203 66.4 212Dissolved Beryllium µg/L 5.3 73 0.66 U 0.66 U 0.66 U 0.03 J 0.66 U 0.66 U 0.66 U 0.66 U 0.66 U 0.02 JDissolved Boron µg/L -- 7,300 NA 121 NA 128 NA 120 NA 150 NA 175Dissolved Cadmium µg/L 4.1 18 0.25 U 0.25 U 0.25 U 0.02 J 0.25 U 0.25 U 0.25 U 0.25 U 0.25 U 0.25 UDissolved Calcium µg/L -- -- 64,700 52,000 64,100 55,400 64,600 56,400 132,000 128,000 125,000 135,000Dissolved Chromium µg/L -- -- 2 U 0.1 J 2 U 0.43 J 2 U 2 U 0.22 UJ 0.09 J 0.22 UJ 2 UDissolved Cobalt µg/L -- 730 3.3 0.41 J 3.4 0.74 J 1.7 0.42 J 3.3 0.54 J 2.9 0.55 JDissolved Copper µg/L 18 1,500 2.9 3.9 2.7 4.2 2.6 7.9 8 0.59 J 4.5 0.93 JDissolved Iron µg/L -- 11,000 300 U 435 J 300 U 881 J 300 U 378 J 300 U 829 J 300 U 878 JDissolved Lead µg/L 6 -- 1 U 0.24 J 0.06 U 1.1 1 U 0.08 J 1 U 0.31 J 1 U 0.09 J
3/8/06 8/23/068/23/063/8/06Date:Winter Summer
8/22/063/8/06 8/22/06 3/8/06 8/22/06 3/8/06Winter Summer Winter Summer
GR-SW-11 SPR-SW-01 SPR-SW-02GR-SW-10Winter Summer Winter Summer
GR-SW-09
TABLE 4-13
Gila River and San Pedro RiverRemedial Investigation ReportASARCO LLC Hayden, Arizona Plant Site
Location: ArizonaAquatic &
Wildlife WaterQuality Criteria1
EPA Region IXPreliminary
RemediationGoal2
Event:
Page 5 of 6

Surface Water Sampling Laboratory Values for Inorganic Parameters
The data in this table are illustrated on figures 4-24, 4-25, 4-27, 4-28, 4-29, 4-30, 4-31, 4-32, 4-33, and 4-34.
Parameter Units Result Qual Result Qual Result Qual Result Qual Result Qual Result Qual Result Qual Result Qual Result Qual Result Qual3/8/06 8/23/068/23/063/8/06Date:
Winter Summer8/22/063/8/06 8/22/06 3/8/06 8/22/06 3/8/06
Winter Summer Winter SummerGR-SW-11 SPR-SW-01 SPR-SW-02GR-SW-10
Winter Summer Winter SummerGR-SW-09
TABLE 4-13
Gila River and San Pedro RiverRemedial Investigation ReportASARCO LLC Hayden, Arizona Plant Site
Location: ArizonaAquatic &
Wildlife WaterQuality Criteria1
EPA Region IXPreliminary
RemediationGoal2
Event:
Dissolved Magnesium µg/L -- -- 18,300 15,200 18,100 15,900 18,300 16,100 28,900 25,200 27,200 26,400Dissolved Manganese µg/L -- 880 56.8 33.6 50.5 73.6 40.5 83.9 7.9 89.5 82.9 110Dissolved Mercury µg/L 0.01 11 0.037 UJ 0.2 U 0.043 UJ 0.2 U 0.039 UJ 0.2 U 0.053 UJ 0.2 U 0.048 UJ 0.2 UDissolved Molybdenum µg/L -- 180 5.4 5.9 J 5.1 6.4 J 5.3 6.7 J 16.6 16.7 J 20.3 21.9 JDissolved Nickel µg/L 104 730 1.8 2.7 J 1.6 3.5 J 1.4 2.8 J 0.89 UJ 3 J 0.65 UJ 2.4 JDissolved Potassium µg/L -- -- 5,260 J 5,990 J 5,190 J 6,260 J 5,220 J 6,160 J 5,350 J 8,010 J 7,210 J 8,720 JDissolved Selenium µg/L -- 180 0.31 J 0.8 J 0.2 J 1.3 J 0.26 J 1.2 J 0.65 J 2.8 J 0.43 J 1.3 JDissolved Silver µg/L 14 180 0.36 U 0.36 U 0.36 U 0.36 U 0.36 U 0.36 U 0.36 U 0.36 U 0.36 U 0.36 UDissolved Sodium µg/L -- -- 129,000 99,999 126,000 102,000 128,000 102,999 147,000 119,000 173,000 126,999Dissolved Thallium µg/L 150 2.4 1 U 1 U 1 U 1 U 1 U 1 U 1 U 1 U 1 U 1 UDissolved Vanadium µg/L -- 36 4.8 10.3 4.5 11.4 4.6 10.7 3.6 7.7 4.2 8Dissolved Zinc µg/L 235 11,000 2.5 3.1 J 1.6 UJ 9 J 1.3 UJ 2.6 J 1.3 J 2.8 J 2.5 2.2 J
Table Notes:1 Arizona Department of Environmental Quality Aquatic & Wildlife Water Quality Critereia, Title 18 Chapter 11, March 20032 EPA Region IX Preliminary Remediation Goals, Tap Water, October 20043 Bold values with bold outline exceed one or more of the comparison criteria.4 Bold italicized values have detection limits above one or more of the comparison criteria.5 -- = Not established6 °C = Degrees Celsius7 J = Estimated value8 J+ = Estimated value, may be biased high9 J- = Estimated value, may be biased low10 U = Not detected; reporting limit is shown in place of a result.11 µg/L = micrograms per Liter12 UJ = Not detected; reporting limit is approximate and is shown in place of a result.
Page 6 of 6
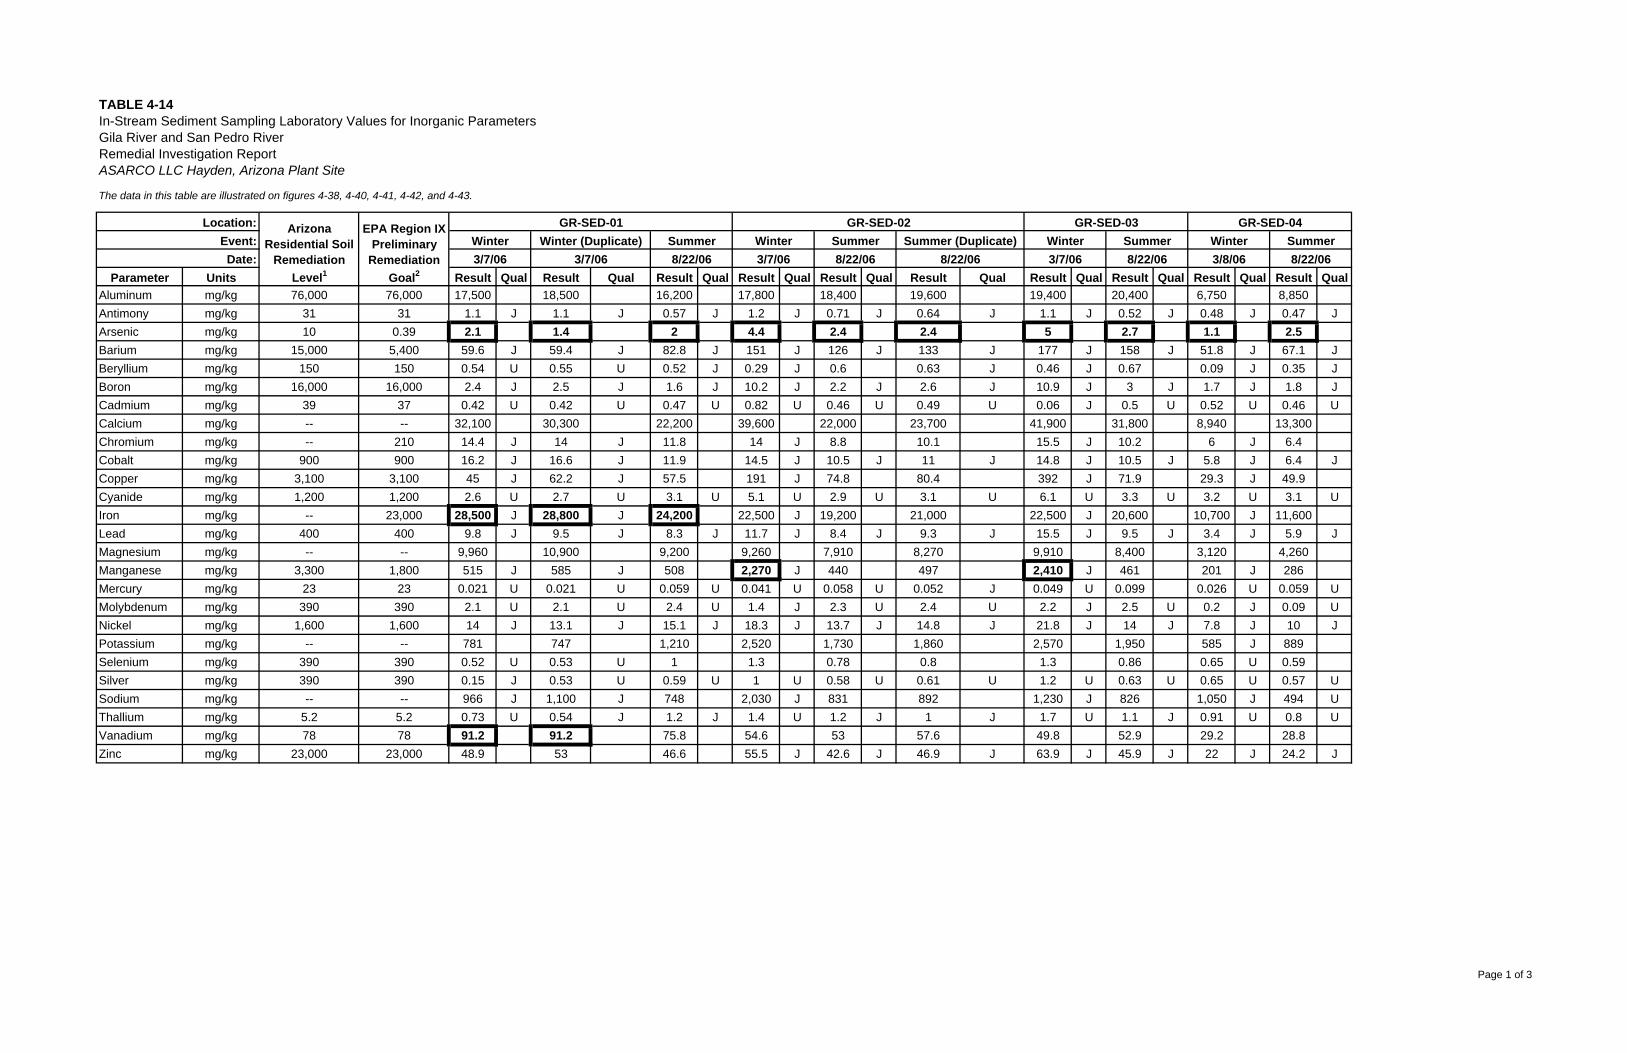
TABLE 4-14In-Stream Sediment Sampling Laboratory Values for Inorganic ParametersGila River and San Pedro RiverRemedial Investigation Report
The data in this table are illustrated on figures 4-38, 4-40, 4-41, 4-42, and 4-43.
Parameter Units Result Qual Result Qual Result Qual Result Qual Result Qual Result Qual Result Qual Result Qual Result Qual Result QualAluminum mg/kg 76,000 76,000 17,500 18,500 16,200 17,800 18,400 19,600 19,400 20,400 6,750 8,850Antimony mg/kg 31 31 1.1 J 1.1 J 0.57 J 1.2 J 0.71 J 0.64 J 1.1 J 0.52 J 0.48 J 0.47 JArsenic mg/kg 10 0.39 2.1 1.4 2 4.4 2.4 2.4 5 2.7 1.1 2.5Barium mg/kg 15,000 5,400 59.6 J 59.4 J 82.8 J 151 J 126 J 133 J 177 J 158 J 51.8 J 67.1 JBeryllium mg/kg 150 150 0.54 U 0.55 U 0.52 J 0.29 J 0.6 0.63 J 0.46 J 0.67 0.09 J 0.35 JBoron mg/kg 16,000 16,000 2.4 J 2.5 J 1.6 J 10.2 J 2.2 J 2.6 J 10.9 J 3 J 1.7 J 1.8 JCadmium mg/kg 39 37 0.42 U 0.42 U 0.47 U 0.82 U 0.46 U 0.49 U 0.06 J 0.5 U 0.52 U 0.46 UCalcium mg/kg -- -- 32,100 30,300 22,200 39,600 22,000 23,700 41,900 31,800 8,940 13,300Chromium mg/kg -- 210 14.4 J 14 J 11.8 14 J 8.8 10.1 15.5 J 10.2 6 J 6.4Cobalt mg/kg 900 900 16.2 J 16.6 J 11.9 14.5 J 10.5 J 11 J 14.8 J 10.5 J 5.8 J 6.4 JCopper mg/kg 3,100 3,100 45 J 62.2 J 57.5 191 J 74.8 80.4 392 J 71.9 29.3 J 49.9Cyanide mg/kg 1,200 1,200 2.6 U 2.7 U 3.1 U 5.1 U 2.9 U 3.1 U 6.1 U 3.3 U 3.2 U 3.1 UIron mg/kg -- 23,000 28,500 J 28,800 J 24,200 22,500 J 19,200 21,000 22,500 J 20,600 10,700 J 11,600Lead mg/kg 400 400 9.8 J 9.5 J 8.3 J 11.7 J 8.4 J 9.3 J 15.5 J 9.5 J 3.4 J 5.9 JMagnesium mg/kg -- -- 9,960 10,900 9,200 9,260 7,910 8,270 9,910 8,400 3,120 4,260Manganese mg/kg 3,300 1,800 515 J 585 J 508 2,270 J 440 497 2,410 J 461 201 J 286Mercury mg/kg 23 23 0.021 U 0.021 U 0.059 U 0.041 U 0.058 U 0.052 J 0.049 U 0.099 0.026 U 0.059 UMolybdenum mg/kg 390 390 2.1 U 2.1 U 2.4 U 1.4 J 2.3 U 2.4 U 2.2 J 2.5 U 0.2 J 0.09 UNickel mg/kg 1,600 1,600 14 J 13.1 J 15.1 J 18.3 J 13.7 J 14.8 J 21.8 J 14 J 7.8 J 10 JPotassium mg/kg -- -- 781 747 1,210 2,520 1,730 1,860 2,570 1,950 585 J 889Selenium mg/kg 390 390 0.52 U 0.53 U 1 1.3 0.78 0.8 1.3 0.86 0.65 U 0.59Silver mg/kg 390 390 0.15 J 0.53 U 0.59 U 1 U 0.58 U 0.61 U 1.2 U 0.63 U 0.65 U 0.57 USodium mg/kg -- -- 966 J 1,100 J 748 2,030 J 831 892 1,230 J 826 1,050 J 494 UThallium mg/kg 5.2 5.2 0.73 U 0.54 J 1.2 J 1.4 U 1.2 J 1 J 1.7 U 1.1 J 0.91 U 0.8 UVanadium mg/kg 78 78 91.2 91.2 75.8 54.6 53 57.6 49.8 52.9 29.2 28.8Zinc mg/kg 23,000 23,000 48.9 53 46.6 55.5 J 42.6 J 46.9 J 63.9 J 45.9 J 22 J 24.2 J
8/22/06 3/8/06 8/22/06Date: 3/7/06 3/7/06 8/22/06 3/7/06 8/22/06 8/22/06 3/7/06Winter Summer Summer (Duplicate) Winter Summer Winter Summer
GR-SED-02 GR-SED-03 GR-SED-04GR-SED-01Location: ArizonaResidential Soil
RemediationLevel1
EPA Region IXPreliminary
RemediationGoal2
ASARCO LLC Hayden, Arizona Plant Site
Winter Winter (Duplicate) SummerEvent:
Page 1 of 3
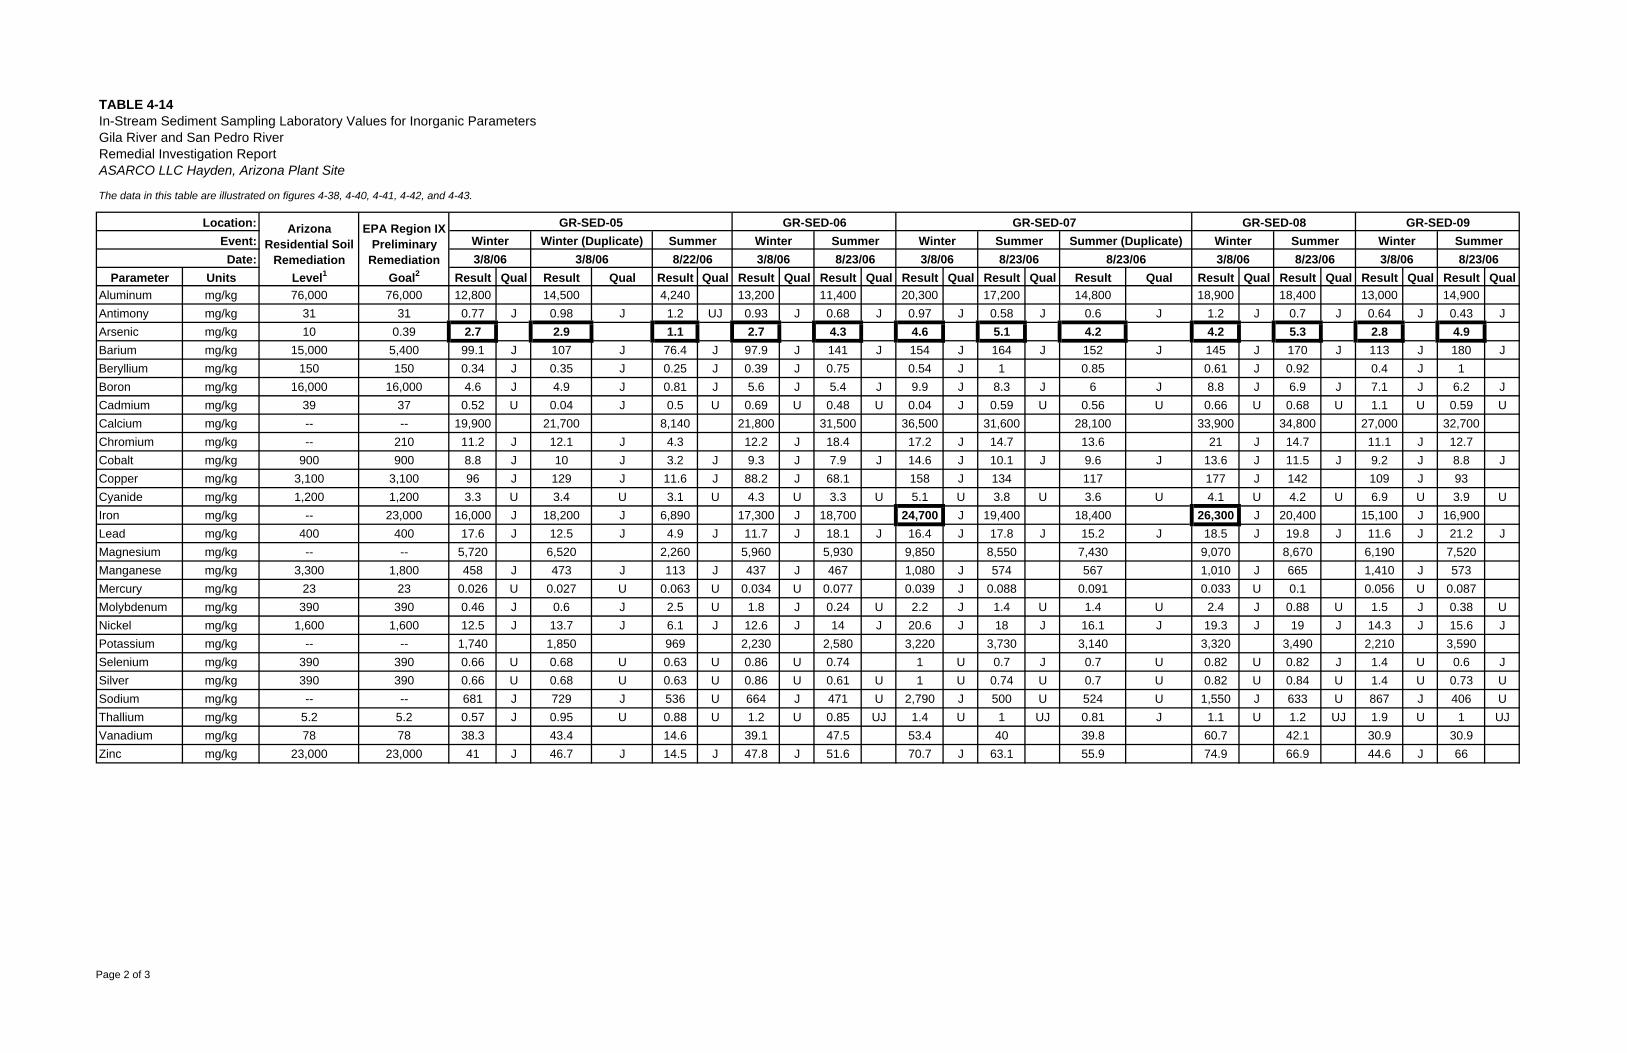
TABLE 4-14In-Stream Sediment Sampling Laboratory Values for Inorganic ParametersGila River and San Pedro RiverRemedial Investigation Report
The data in this table are illustrated on figures 4-38, 4-40, 4-41, 4-42, and 4-43.
Parameter Units Result Qual Result Qual Result Qual Result Qual Result Qual Result Qual Result Qual Result Qual Result Qual Result Qual Result Qual Result QualAluminum mg/kg 76,000 76,000 12,800 14,500 4,240 13,200 11,400 20,300 17,200 14,800 18,900 18,400 13,000 14,900Antimony mg/kg 31 31 0.77 J 0.98 J 1.2 UJ 0.93 J 0.68 J 0.97 J 0.58 J 0.6 J 1.2 J 0.7 J 0.64 J 0.43 JArsenic mg/kg 10 0.39 2.7 2.9 1.1 2.7 4.3 4.6 5.1 4.2 4.2 5.3 2.8 4.9Barium mg/kg 15,000 5,400 99.1 J 107 J 76.4 J 97.9 J 141 J 154 J 164 J 152 J 145 J 170 J 113 J 180 JBeryllium mg/kg 150 150 0.34 J 0.35 J 0.25 J 0.39 J 0.75 0.54 J 1 0.85 0.61 J 0.92 0.4 J 1Boron mg/kg 16,000 16,000 4.6 J 4.9 J 0.81 J 5.6 J 5.4 J 9.9 J 8.3 J 6 J 8.8 J 6.9 J 7.1 J 6.2 JCadmium mg/kg 39 37 0.52 U 0.04 J 0.5 U 0.69 U 0.48 U 0.04 J 0.59 U 0.56 U 0.66 U 0.68 U 1.1 U 0.59 UCalcium mg/kg -- -- 19,900 21,700 8,140 21,800 31,500 36,500 31,600 28,100 33,900 34,800 27,000 32,700Chromium mg/kg -- 210 11.2 J 12.1 J 4.3 12.2 J 18.4 17.2 J 14.7 13.6 21 J 14.7 11.1 J 12.7Cobalt mg/kg 900 900 8.8 J 10 J 3.2 J 9.3 J 7.9 J 14.6 J 10.1 J 9.6 J 13.6 J 11.5 J 9.2 J 8.8 JCopper mg/kg 3,100 3,100 96 J 129 J 11.6 J 88.2 J 68.1 158 J 134 117 177 J 142 109 J 93Cyanide mg/kg 1,200 1,200 3.3 U 3.4 U 3.1 U 4.3 U 3.3 U 5.1 U 3.8 U 3.6 U 4.1 U 4.2 U 6.9 U 3.9 UIron mg/kg -- 23,000 16,000 J 18,200 J 6,890 17,300 J 18,700 24,700 J 19,400 18,400 26,300 J 20,400 15,100 J 16,900Lead mg/kg 400 400 17.6 J 12.5 J 4.9 J 11.7 J 18.1 J 16.4 J 17.8 J 15.2 J 18.5 J 19.8 J 11.6 J 21.2 JMagnesium mg/kg -- -- 5,720 6,520 2,260 5,960 5,930 9,850 8,550 7,430 9,070 8,670 6,190 7,520Manganese mg/kg 3,300 1,800 458 J 473 J 113 J 437 J 467 1,080 J 574 567 1,010 J 665 1,410 J 573Mercury mg/kg 23 23 0.026 U 0.027 U 0.063 U 0.034 U 0.077 0.039 J 0.088 0.091 0.033 U 0.1 0.056 U 0.087Molybdenum mg/kg 390 390 0.46 J 0.6 J 2.5 U 1.8 J 0.24 U 2.2 J 1.4 U 1.4 U 2.4 J 0.88 U 1.5 J 0.38 UNickel mg/kg 1,600 1,600 12.5 J 13.7 J 6.1 J 12.6 J 14 J 20.6 J 18 J 16.1 J 19.3 J 19 J 14.3 J 15.6 JPotassium mg/kg -- -- 1,740 1,850 969 2,230 2,580 3,220 3,730 3,140 3,320 3,490 2,210 3,590Selenium mg/kg 390 390 0.66 U 0.68 U 0.63 U 0.86 U 0.74 1 U 0.7 J 0.7 U 0.82 U 0.82 J 1.4 U 0.6 JSilver mg/kg 390 390 0.66 U 0.68 U 0.63 U 0.86 U 0.61 U 1 U 0.74 U 0.7 U 0.82 U 0.84 U 1.4 U 0.73 USodium mg/kg -- -- 681 J 729 J 536 U 664 J 471 U 2,790 J 500 U 524 U 1,550 J 633 U 867 J 406 UThallium mg/kg 5.2 5.2 0.57 J 0.95 U 0.88 U 1.2 U 0.85 UJ 1.4 U 1 UJ 0.81 J 1.1 U 1.2 UJ 1.9 U 1 UJVanadium mg/kg 78 78 38.3 43.4 14.6 39.1 47.5 53.4 40 39.8 60.7 42.1 30.9 30.9Zinc mg/kg 23,000 23,000 41 J 46.7 J 14.5 J 47.8 J 51.6 70.7 J 63.1 55.9 74.9 66.9 44.6 J 66
8/23/06 3/8/06 8/23/068/23/06 3/8/063/8/06 8/22/06 3/8/06 8/23/06 3/8/06 8/23/063/8/06Winter SummerSummer Summer (Duplicate) Winter SummerSummer Winter Summer WinterWinter Winter (Duplicate)
GR-SED-09GR-SED-05 GR-SED-06 GR-SED-07 GR-SED-08
ASARCO LLC Hayden, Arizona Plant Site
Location: ArizonaResidential Soil
RemediationLevel1
EPA Region IXPreliminary
RemediationGoal2
Event:Date:
Page 2 of 3
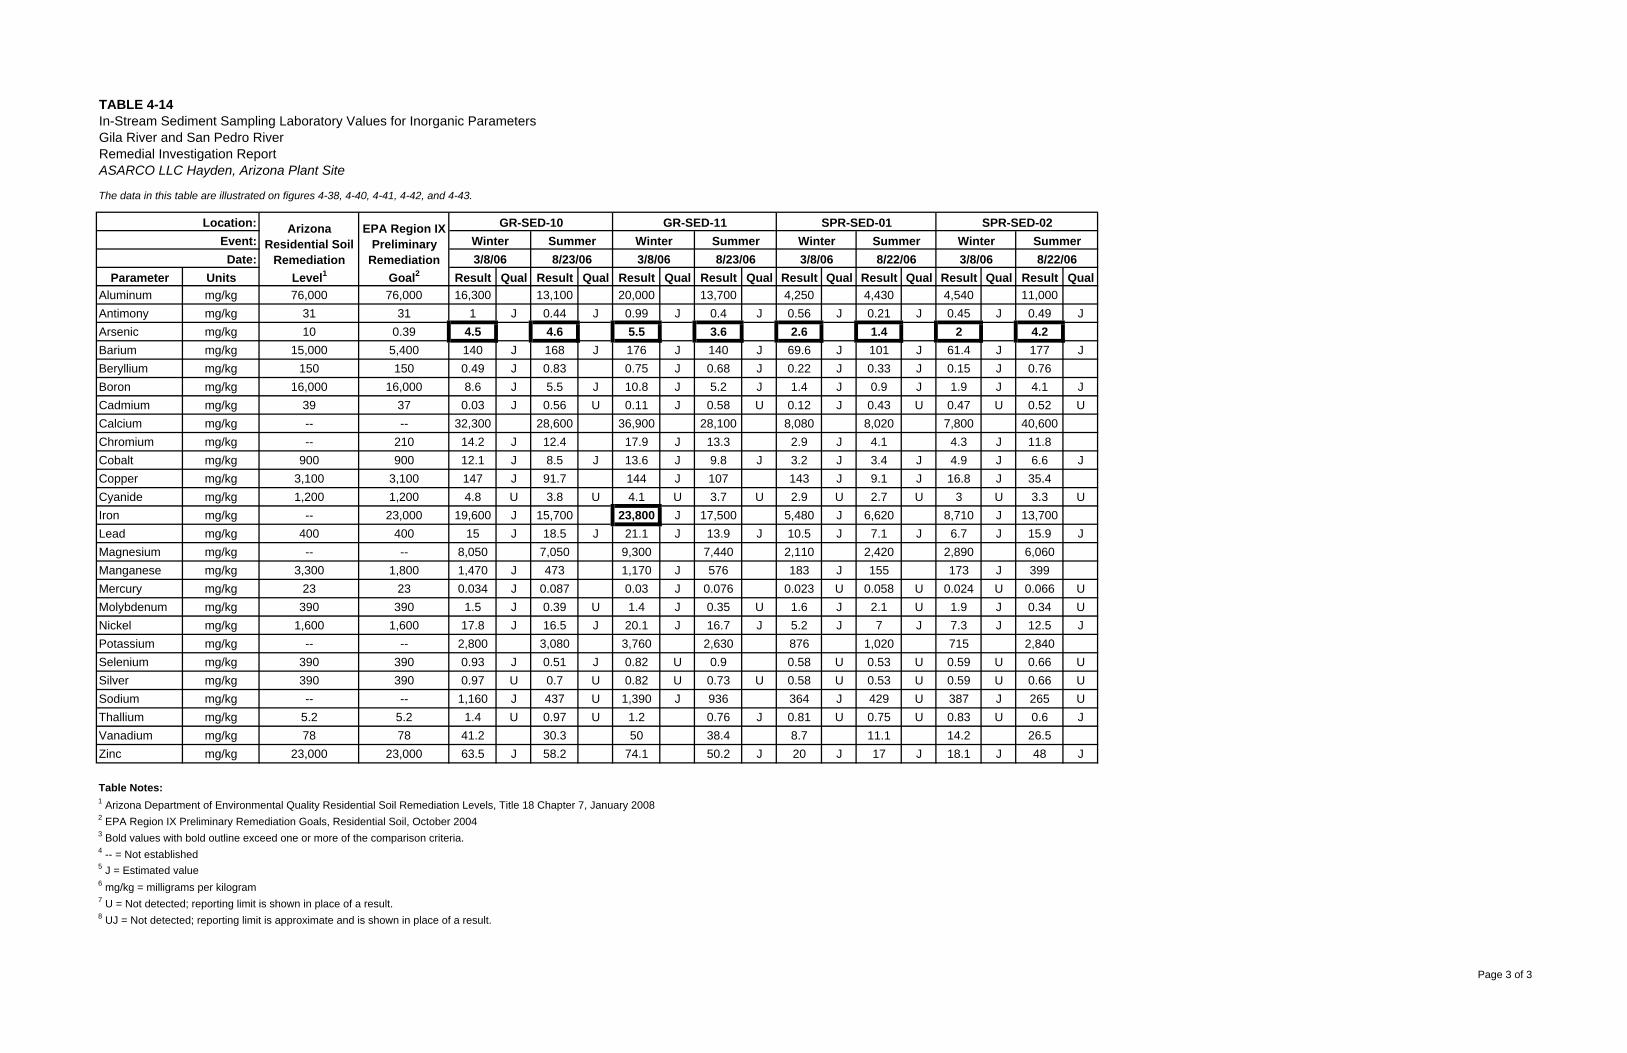
TABLE 4-14In-Stream Sediment Sampling Laboratory Values for Inorganic ParametersGila River and San Pedro RiverRemedial Investigation Report
The data in this table are illustrated on figures 4-38, 4-40, 4-41, 4-42, and 4-43.
Parameter Units Result Qual Result Qual Result Qual Result Qual Result Qual Result Qual Result Qual Result QualAluminum mg/kg 76,000 76,000 16,300 13,100 20,000 13,700 4,250 4,430 4,540 11,000Antimony mg/kg 31 31 1 J 0.44 J 0.99 J 0.4 J 0.56 J 0.21 J 0.45 J 0.49 JArsenic mg/kg 10 0.39 4.5 4.6 5.5 3.6 2.6 1.4 2 4.2Barium mg/kg 15,000 5,400 140 J 168 J 176 J 140 J 69.6 J 101 J 61.4 J 177 JBeryllium mg/kg 150 150 0.49 J 0.83 0.75 J 0.68 J 0.22 J 0.33 J 0.15 J 0.76Boron mg/kg 16,000 16,000 8.6 J 5.5 J 10.8 J 5.2 J 1.4 J 0.9 J 1.9 J 4.1 JCadmium mg/kg 39 37 0.03 J 0.56 U 0.11 J 0.58 U 0.12 J 0.43 U 0.47 U 0.52 UCalcium mg/kg -- -- 32,300 28,600 36,900 28,100 8,080 8,020 7,800 40,600Chromium mg/kg -- 210 14.2 J 12.4 17.9 J 13.3 2.9 J 4.1 4.3 J 11.8Cobalt mg/kg 900 900 12.1 J 8.5 J 13.6 J 9.8 J 3.2 J 3.4 J 4.9 J 6.6 JCopper mg/kg 3,100 3,100 147 J 91.7 144 J 107 143 J 9.1 J 16.8 J 35.4Cyanide mg/kg 1,200 1,200 4.8 U 3.8 U 4.1 U 3.7 U 2.9 U 2.7 U 3 U 3.3 UIron mg/kg -- 23,000 19,600 J 15,700 23,800 J 17,500 5,480 J 6,620 8,710 J 13,700Lead mg/kg 400 400 15 J 18.5 J 21.1 J 13.9 J 10.5 J 7.1 J 6.7 J 15.9 JMagnesium mg/kg -- -- 8,050 7,050 9,300 7,440 2,110 2,420 2,890 6,060Manganese mg/kg 3,300 1,800 1,470 J 473 1,170 J 576 183 J 155 173 J 399Mercury mg/kg 23 23 0.034 J 0.087 0.03 J 0.076 0.023 U 0.058 U 0.024 U 0.066 UMolybdenum mg/kg 390 390 1.5 J 0.39 U 1.4 J 0.35 U 1.6 J 2.1 U 1.9 J 0.34 UNickel mg/kg 1,600 1,600 17.8 J 16.5 J 20.1 J 16.7 J 5.2 J 7 J 7.3 J 12.5 JPotassium mg/kg -- -- 2,800 3,080 3,760 2,630 876 1,020 715 2,840Selenium mg/kg 390 390 0.93 J 0.51 J 0.82 U 0.9 0.58 U 0.53 U 0.59 U 0.66 USilver mg/kg 390 390 0.97 U 0.7 U 0.82 U 0.73 U 0.58 U 0.53 U 0.59 U 0.66 USodium mg/kg -- -- 1,160 J 437 U 1,390 J 936 364 J 429 U 387 J 265 UThallium mg/kg 5.2 5.2 1.4 U 0.97 U 1.2 0.76 J 0.81 U 0.75 U 0.83 U 0.6 JVanadium mg/kg 78 78 41.2 30.3 50 38.4 8.7 11.1 14.2 26.5Zinc mg/kg 23,000 23,000 63.5 J 58.2 74.1 50.2 J 20 J 17 J 18.1 J 48 J
Table Notes:1 Arizona Department of Environmental Quality Residential Soil Remediation Levels, Title 18 Chapter 7, January 20082 EPA Region IX Preliminary Remediation Goals, Residential Soil, October 20043 Bold values with bold outline exceed one or more of the comparison criteria.4 -- = Not established
6 mg/kg = milligrams per kilogram7 U = Not detected; reporting limit is shown in place of a result.8 UJ = Not detected; reporting limit is approximate and is shown in place of a result.
5 J = Estimated value
3/8/06 8/22/068/23/06 3/8/06 8/23/06 3/8/06 8/22/06 3/8/06Winter SummerSummer Winter SummerWinter Summer Winter
SPR-SED-02GR-SED-10 GR-SED-11 SPR-SED-01
ASARCO LLC Hayden, Arizona Plant Site
Location: ArizonaResidential Soil
RemediationLevel1
EPA Region IXPreliminary
RemediationGoal2
Event:Date:
Page 3 of 3
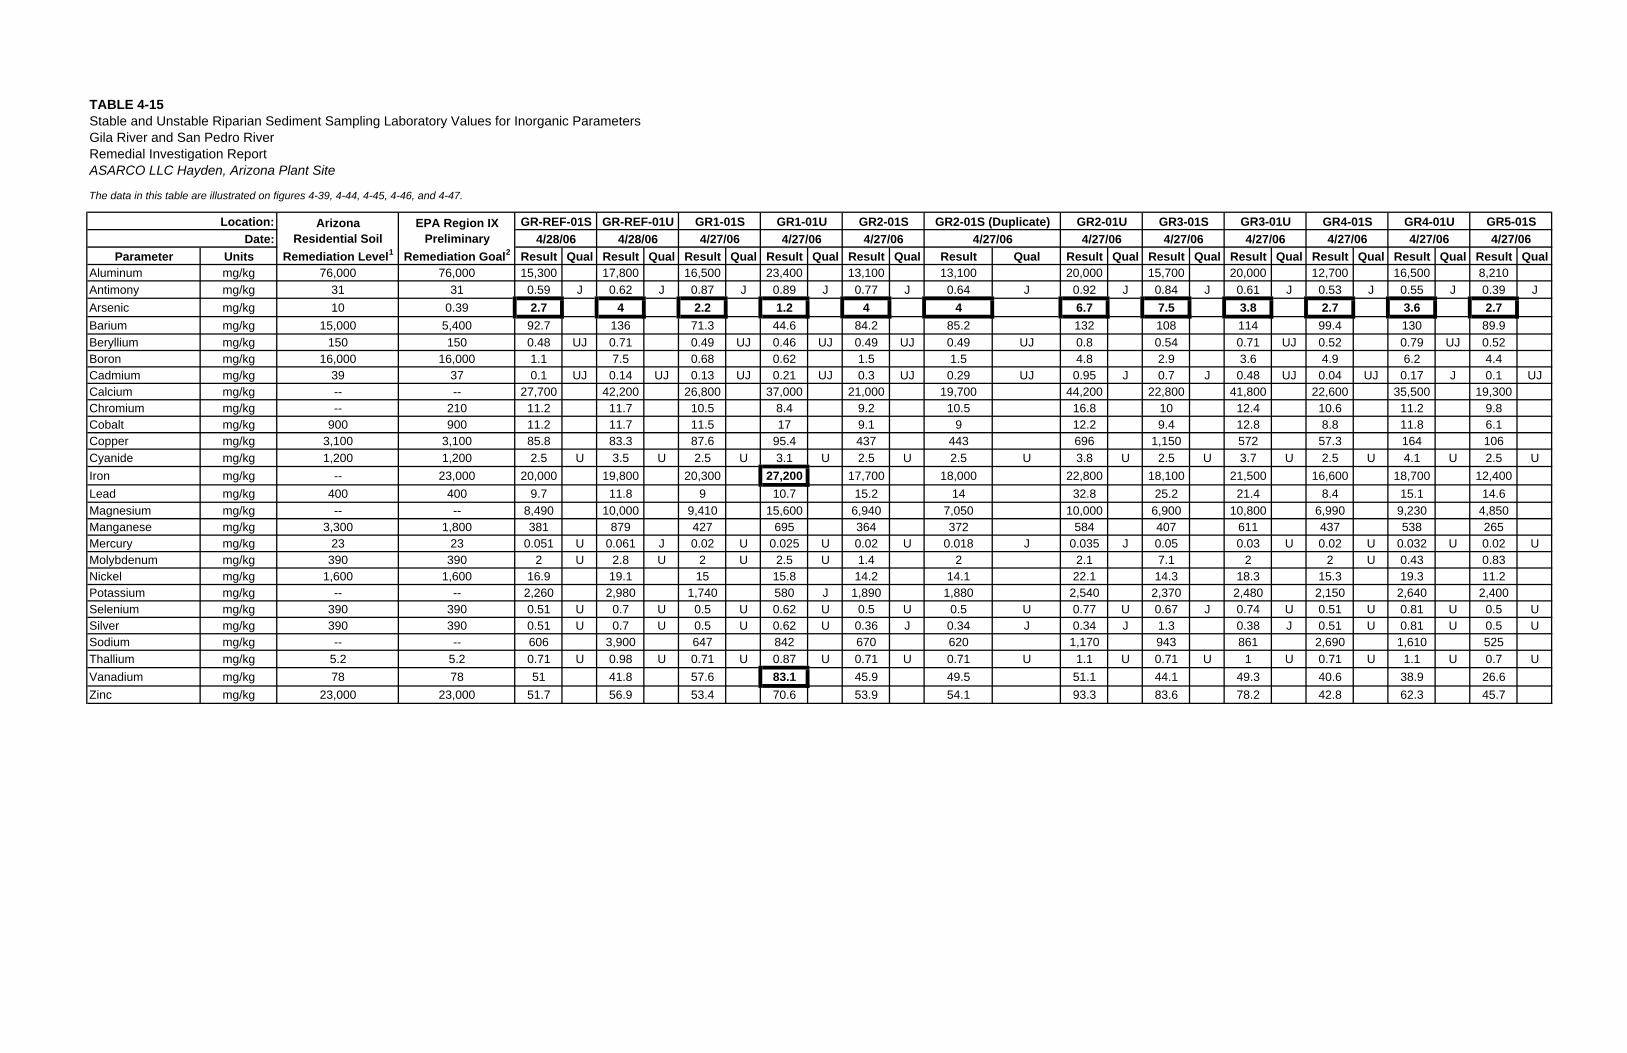
TABLE 4-15Stable and Unstable Riparian Sediment Sampling Laboratory Values for Inorganic ParametersGila River and San Pedro RiverRemedial Investigation Report
The data in this table are illustrated on figures 4-39, 4-44, 4-45, 4-46, and 4-47.
Parameter Units Result Qual Result Qual Result Qual Result Qual Result Qual Result Qual Result Qual Result Qual Result Qual Result Qual Result Qual Result QualAluminum mg/kg 76,000 76,000 15,300 17,800 16,500 23,400 13,100 13,100 20,000 15,700 20,000 12,700 16,500 8,210Antimony mg/kg 31 31 0.59 J 0.62 J 0.87 J 0.89 J 0.77 J 0.64 J 0.92 J 0.84 J 0.61 J 0.53 J 0.55 J 0.39 JArsenic mg/kg 10 0.39 2.7 4 2.2 1.2 4 4 6.7 7.5 3.8 2.7 3.6 2.7Barium mg/kg 15,000 5,400 92.7 136 71.3 44.6 84.2 85.2 132 108 114 99.4 130 89.9Beryllium mg/kg 150 150 0.48 UJ 0.71 0.49 UJ 0.46 UJ 0.49 UJ 0.49 UJ 0.8 0.54 0.71 UJ 0.52 0.79 UJ 0.52Boron mg/kg 16,000 16,000 1.1 7.5 0.68 0.62 1.5 1.5 4.8 2.9 3.6 4.9 6.2 4.4Cadmium mg/kg 39 37 0.1 UJ 0.14 UJ 0.13 UJ 0.21 UJ 0.3 UJ 0.29 UJ 0.95 J 0.7 J 0.48 UJ 0.04 UJ 0.17 J 0.1 UJCalcium mg/kg -- -- 27,700 42,200 26,800 37,000 21,000 19,700 44,200 22,800 41,800 22,600 35,500 19,300Chromium mg/kg -- 210 11.2 11.7 10.5 8.4 9.2 10.5 16.8 10 12.4 10.6 11.2 9.8Cobalt mg/kg 900 900 11.2 11.7 11.5 17 9.1 9 12.2 9.4 12.8 8.8 11.8 6.1Copper mg/kg 3,100 3,100 85.8 83.3 87.6 95.4 437 443 696 1,150 572 57.3 164 106Cyanide mg/kg 1,200 1,200 2.5 U 3.5 U 2.5 U 3.1 U 2.5 U 2.5 U 3.8 U 2.5 U 3.7 U 2.5 U 4.1 U 2.5 UIron mg/kg -- 23,000 20,000 19,800 20,300 27,200 17,700 18,000 22,800 18,100 21,500 16,600 18,700 12,400Lead mg/kg 400 400 9.7 11.8 9 10.7 15.2 14 32.8 25.2 21.4 8.4 15.1 14.6Magnesium mg/kg -- -- 8,490 10,000 9,410 15,600 6,940 7,050 10,000 6,900 10,800 6,990 9,230 4,850Manganese mg/kg 3,300 1,800 381 879 427 695 364 372 584 407 611 437 538 265Mercury mg/kg 23 23 0.051 U 0.061 J 0.02 U 0.025 U 0.02 U 0.018 J 0.035 J 0.05 0.03 U 0.02 U 0.032 U 0.02 UMolybdenum mg/kg 390 390 2 U 2.8 U 2 U 2.5 U 1.4 2 2.1 7.1 2 2 U 0.43 0.83Nickel mg/kg 1,600 1,600 16.9 19.1 15 15.8 14.2 14.1 22.1 14.3 18.3 15.3 19.3 11.2Potassium mg/kg -- -- 2,260 2,980 1,740 580 J 1,890 1,880 2,540 2,370 2,480 2,150 2,640 2,400Selenium mg/kg 390 390 0.51 U 0.7 U 0.5 U 0.62 U 0.5 U 0.5 U 0.77 U 0.67 J 0.74 U 0.51 U 0.81 U 0.5 USilver mg/kg 390 390 0.51 U 0.7 U 0.5 U 0.62 U 0.36 J 0.34 J 0.34 J 1.3 0.38 J 0.51 U 0.81 U 0.5 USodium mg/kg -- -- 606 3,900 647 842 670 620 1,170 943 861 2,690 1,610 525Thallium mg/kg 5.2 5.2 0.71 U 0.98 U 0.71 U 0.87 U 0.71 U 0.71 U 1.1 U 0.71 U 1 U 0.71 U 1.1 U 0.7 UVanadium mg/kg 78 78 51 41.8 57.6 83.1 45.9 49.5 51.1 44.1 49.3 40.6 38.9 26.6Zinc mg/kg 23,000 23,000 51.7 56.9 53.4 70.6 53.9 54.1 93.3 83.6 78.2 42.8 62.3 45.7
GR5-01SGR3-01U4/27/06 4/27/06 4/27/06Date: 4/27/06
ASARCO LLC Hayden, Arizona Plant Site
GR4-01ULocation: ArizonaResidential Soil
Remediation Level1
EPA Region IXPreliminary
Remediation Goal2
GR1-01S GR2-01U GR3-01S4/27/06 4/27/06 4/27/06 4/27/064/27/06 4/27/06
GR1-01U GR2-01S GR4-01SGR2-01S (Duplicate)GR-REF-01U4/28/06
GR-REF-01S4/28/06
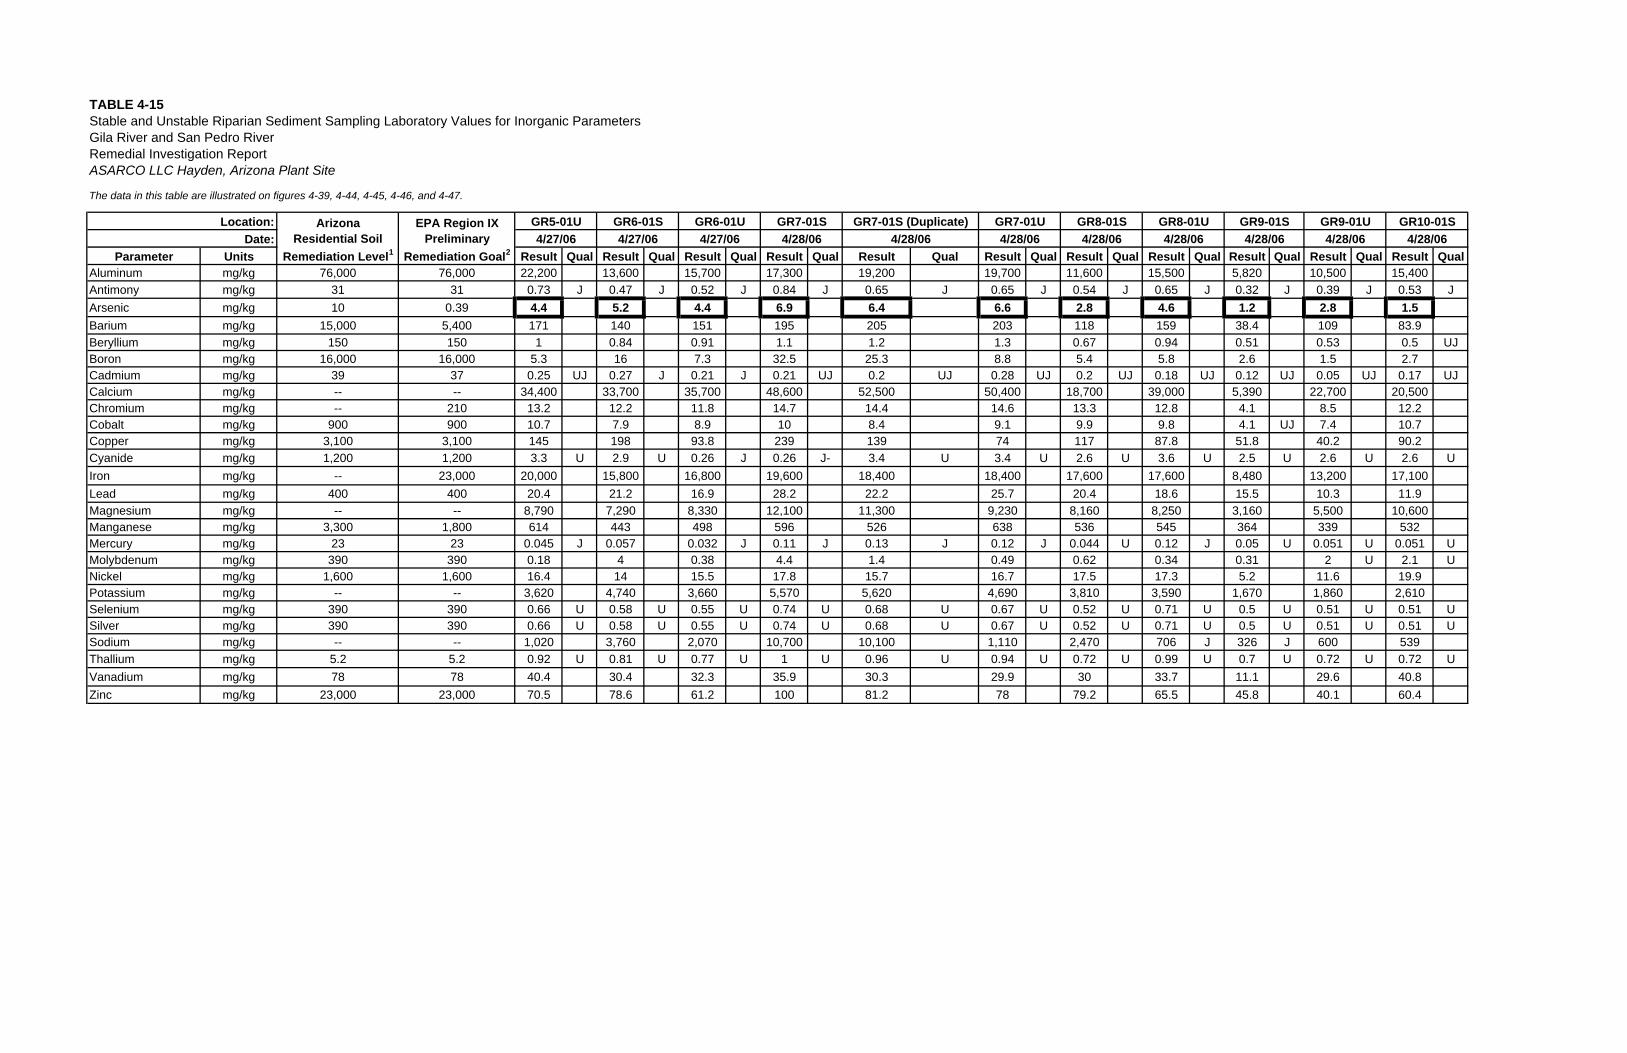
TABLE 4-15Stable and Unstable Riparian Sediment Sampling Laboratory Values for Inorganic ParametersGila River and San Pedro RiverRemedial Investigation Report
The data in this table are illustrated on figures 4-39, 4-44, 4-45, 4-46, and 4-47.
Parameter Units Result Qual Result Qual Result Qual Result Qual Result Qual Result Qual Result Qual Result Qual Result Qual Result Qual Result QualAluminum mg/kg 76,000 76,000 22,200 13,600 15,700 17,300 19,200 19,700 11,600 15,500 5,820 10,500 15,400Antimony mg/kg 31 31 0.73 J 0.47 J 0.52 J 0.84 J 0.65 J 0.65 J 0.54 J 0.65 J 0.32 J 0.39 J 0.53 JArsenic mg/kg 10 0.39 4.4 5.2 4.4 6.9 6.4 6.6 2.8 4.6 1.2 2.8 1.5Barium mg/kg 15,000 5,400 171 140 151 195 205 203 118 159 38.4 109 83.9Beryllium mg/kg 150 150 1 0.84 0.91 1.1 1.2 1.3 0.67 0.94 0.51 0.53 0.5 UJBoron mg/kg 16,000 16,000 5.3 16 7.3 32.5 25.3 8.8 5.4 5.8 2.6 1.5 2.7Cadmium mg/kg 39 37 0.25 UJ 0.27 J 0.21 J 0.21 UJ 0.2 UJ 0.28 UJ 0.2 UJ 0.18 UJ 0.12 UJ 0.05 UJ 0.17 UJCalcium mg/kg -- -- 34,400 33,700 35,700 48,600 52,500 50,400 18,700 39,000 5,390 22,700 20,500Chromium mg/kg -- 210 13.2 12.2 11.8 14.7 14.4 14.6 13.3 12.8 4.1 8.5 12.2Cobalt mg/kg 900 900 10.7 7.9 8.9 10 8.4 9.1 9.9 9.8 4.1 UJ 7.4 10.7Copper mg/kg 3,100 3,100 145 198 93.8 239 139 74 117 87.8 51.8 40.2 90.2Cyanide mg/kg 1,200 1,200 3.3 U 2.9 U 0.26 J 0.26 J- 3.4 U 3.4 U 2.6 U 3.6 U 2.5 U 2.6 U 2.6 UIron mg/kg -- 23,000 20,000 15,800 16,800 19,600 18,400 18,400 17,600 17,600 8,480 13,200 17,100Lead mg/kg 400 400 20.4 21.2 16.9 28.2 22.2 25.7 20.4 18.6 15.5 10.3 11.9Magnesium mg/kg -- -- 8,790 7,290 8,330 12,100 11,300 9,230 8,160 8,250 3,160 5,500 10,600Manganese mg/kg 3,300 1,800 614 443 498 596 526 638 536 545 364 339 532Mercury mg/kg 23 23 0.045 J 0.057 0.032 J 0.11 J 0.13 J 0.12 J 0.044 U 0.12 J 0.05 U 0.051 U 0.051 UMolybdenum mg/kg 390 390 0.18 4 0.38 4.4 1.4 0.49 0.62 0.34 0.31 2 U 2.1 UNickel mg/kg 1,600 1,600 16.4 14 15.5 17.8 15.7 16.7 17.5 17.3 5.2 11.6 19.9Potassium mg/kg -- -- 3,620 4,740 3,660 5,570 5,620 4,690 3,810 3,590 1,670 1,860 2,610Selenium mg/kg 390 390 0.66 U 0.58 U 0.55 U 0.74 U 0.68 U 0.67 U 0.52 U 0.71 U 0.5 U 0.51 U 0.51 USilver mg/kg 390 390 0.66 U 0.58 U 0.55 U 0.74 U 0.68 U 0.67 U 0.52 U 0.71 U 0.5 U 0.51 U 0.51 USodium mg/kg -- -- 1,020 3,760 2,070 10,700 10,100 1,110 2,470 706 J 326 J 600 539Thallium mg/kg 5.2 5.2 0.92 U 0.81 U 0.77 U 1 U 0.96 U 0.94 U 0.72 U 0.99 U 0.7 U 0.72 U 0.72 UVanadium mg/kg 78 78 40.4 30.4 32.3 35.9 30.3 29.9 30 33.7 11.1 29.6 40.8Zinc mg/kg 23,000 23,000 70.5 78.6 61.2 100 81.2 78 79.2 65.5 45.8 40.1 60.4
4/28/06 4/28/06 4/28/06 4/28/064/27/06 4/28/06GR9-01U GR10-01SGR7-01U GR8-01S GR8-01U GR9-01SGR5-01U GR6-01S GR6-01U GR7-01S GR7-01S (Duplicate)
4/28/064/27/06 4/27/06 4/28/06 4/28/06
ASARCO LLC Hayden, Arizona Plant Site
Location: ArizonaResidential Soil
Remediation Level1
EPA Region IXPreliminary
Remediation Goal2Date:
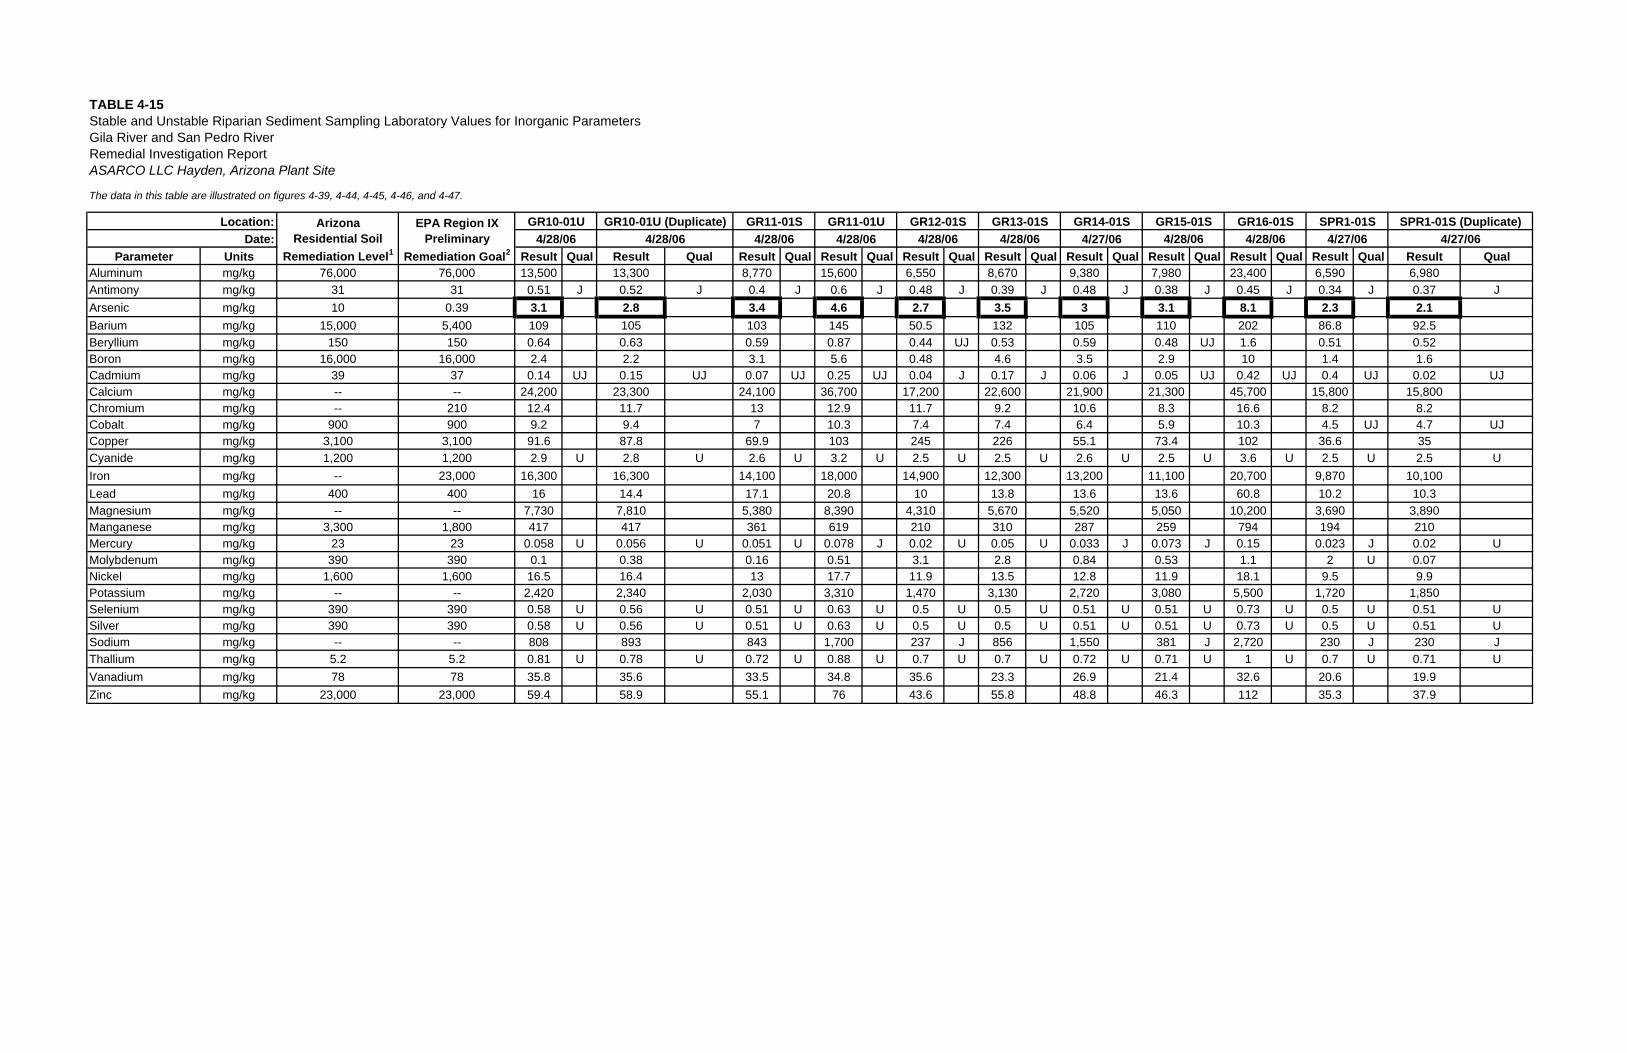
TABLE 4-15Stable and Unstable Riparian Sediment Sampling Laboratory Values for Inorganic ParametersGila River and San Pedro RiverRemedial Investigation Report
The data in this table are illustrated on figures 4-39, 4-44, 4-45, 4-46, and 4-47.
Parameter Units Result Qual Result Qual Result Qual Result Qual Result Qual Result Qual Result Qual Result Qual Result Qual Result Qual Result QualAluminum mg/kg 76,000 76,000 13,500 13,300 8,770 15,600 6,550 8,670 9,380 7,980 23,400 6,590 6,980Antimony mg/kg 31 31 0.51 J 0.52 J 0.4 J 0.6 J 0.48 J 0.39 J 0.48 J 0.38 J 0.45 J 0.34 J 0.37 JArsenic mg/kg 10 0.39 3.1 2.8 3.4 4.6 2.7 3.5 3 3.1 8.1 2.3 2.1Barium mg/kg 15,000 5,400 109 105 103 145 50.5 132 105 110 202 86.8 92.5Beryllium mg/kg 150 150 0.64 0.63 0.59 0.87 0.44 UJ 0.53 0.59 0.48 UJ 1.6 0.51 0.52Boron mg/kg 16,000 16,000 2.4 2.2 3.1 5.6 0.48 4.6 3.5 2.9 10 1.4 1.6Cadmium mg/kg 39 37 0.14 UJ 0.15 UJ 0.07 UJ 0.25 UJ 0.04 J 0.17 J 0.06 J 0.05 UJ 0.42 UJ 0.4 UJ 0.02 UJCalcium mg/kg -- -- 24,200 23,300 24,100 36,700 17,200 22,600 21,900 21,300 45,700 15,800 15,800Chromium mg/kg -- 210 12.4 11.7 13 12.9 11.7 9.2 10.6 8.3 16.6 8.2 8.2Cobalt mg/kg 900 900 9.2 9.4 7 10.3 7.4 7.4 6.4 5.9 10.3 4.5 UJ 4.7 UJCopper mg/kg 3,100 3,100 91.6 87.8 69.9 103 245 226 55.1 73.4 102 36.6 35Cyanide mg/kg 1,200 1,200 2.9 U 2.8 U 2.6 U 3.2 U 2.5 U 2.5 U 2.6 U 2.5 U 3.6 U 2.5 U 2.5 UIron mg/kg -- 23,000 16,300 16,300 14,100 18,000 14,900 12,300 13,200 11,100 20,700 9,870 10,100Lead mg/kg 400 400 16 14.4 17.1 20.8 10 13.8 13.6 13.6 60.8 10.2 10.3Magnesium mg/kg -- -- 7,730 7,810 5,380 8,390 4,310 5,670 5,520 5,050 10,200 3,690 3,890Manganese mg/kg 3,300 1,800 417 417 361 619 210 310 287 259 794 194 210Mercury mg/kg 23 23 0.058 U 0.056 U 0.051 U 0.078 J 0.02 U 0.05 U 0.033 J 0.073 J 0.15 0.023 J 0.02 UMolybdenum mg/kg 390 390 0.1 0.38 0.16 0.51 3.1 2.8 0.84 0.53 1.1 2 U 0.07Nickel mg/kg 1,600 1,600 16.5 16.4 13 17.7 11.9 13.5 12.8 11.9 18.1 9.5 9.9Potassium mg/kg -- -- 2,420 2,340 2,030 3,310 1,470 3,130 2,720 3,080 5,500 1,720 1,850Selenium mg/kg 390 390 0.58 U 0.56 U 0.51 U 0.63 U 0.5 U 0.5 U 0.51 U 0.51 U 0.73 U 0.5 U 0.51 USilver mg/kg 390 390 0.58 U 0.56 U 0.51 U 0.63 U 0.5 U 0.5 U 0.51 U 0.51 U 0.73 U 0.5 U 0.51 USodium mg/kg -- -- 808 893 843 1,700 237 J 856 1,550 381 J 2,720 230 J 230 JThallium mg/kg 5.2 5.2 0.81 U 0.78 U 0.72 U 0.88 U 0.7 U 0.7 U 0.72 U 0.71 U 1 U 0.7 U 0.71 UVanadium mg/kg 78 78 35.8 35.6 33.5 34.8 35.6 23.3 26.9 21.4 32.6 20.6 19.9Zinc mg/kg 23,000 23,000 59.4 58.9 55.1 76 43.6 55.8 48.8 46.3 112 35.3 37.9
SPR1-01S4/28/06 4/28/06 4/27/06
GR16-01SGR13-01SGR10-01U (Duplicate) GR11-01UGR10-01U4/28/06
GR11-01SDate: 4/28/06 4/28/06 4/28/06
GR12-01S SPR1-01S (Duplicate)4/27/06
GR15-01SGR14-01SArizonaResidential Soil
Remediation Level1
EPA Region IXPreliminary
Remediation Goal24/28/06 4/28/06 4/27/06
ASARCO LLC Hayden, Arizona Plant Site
Location:
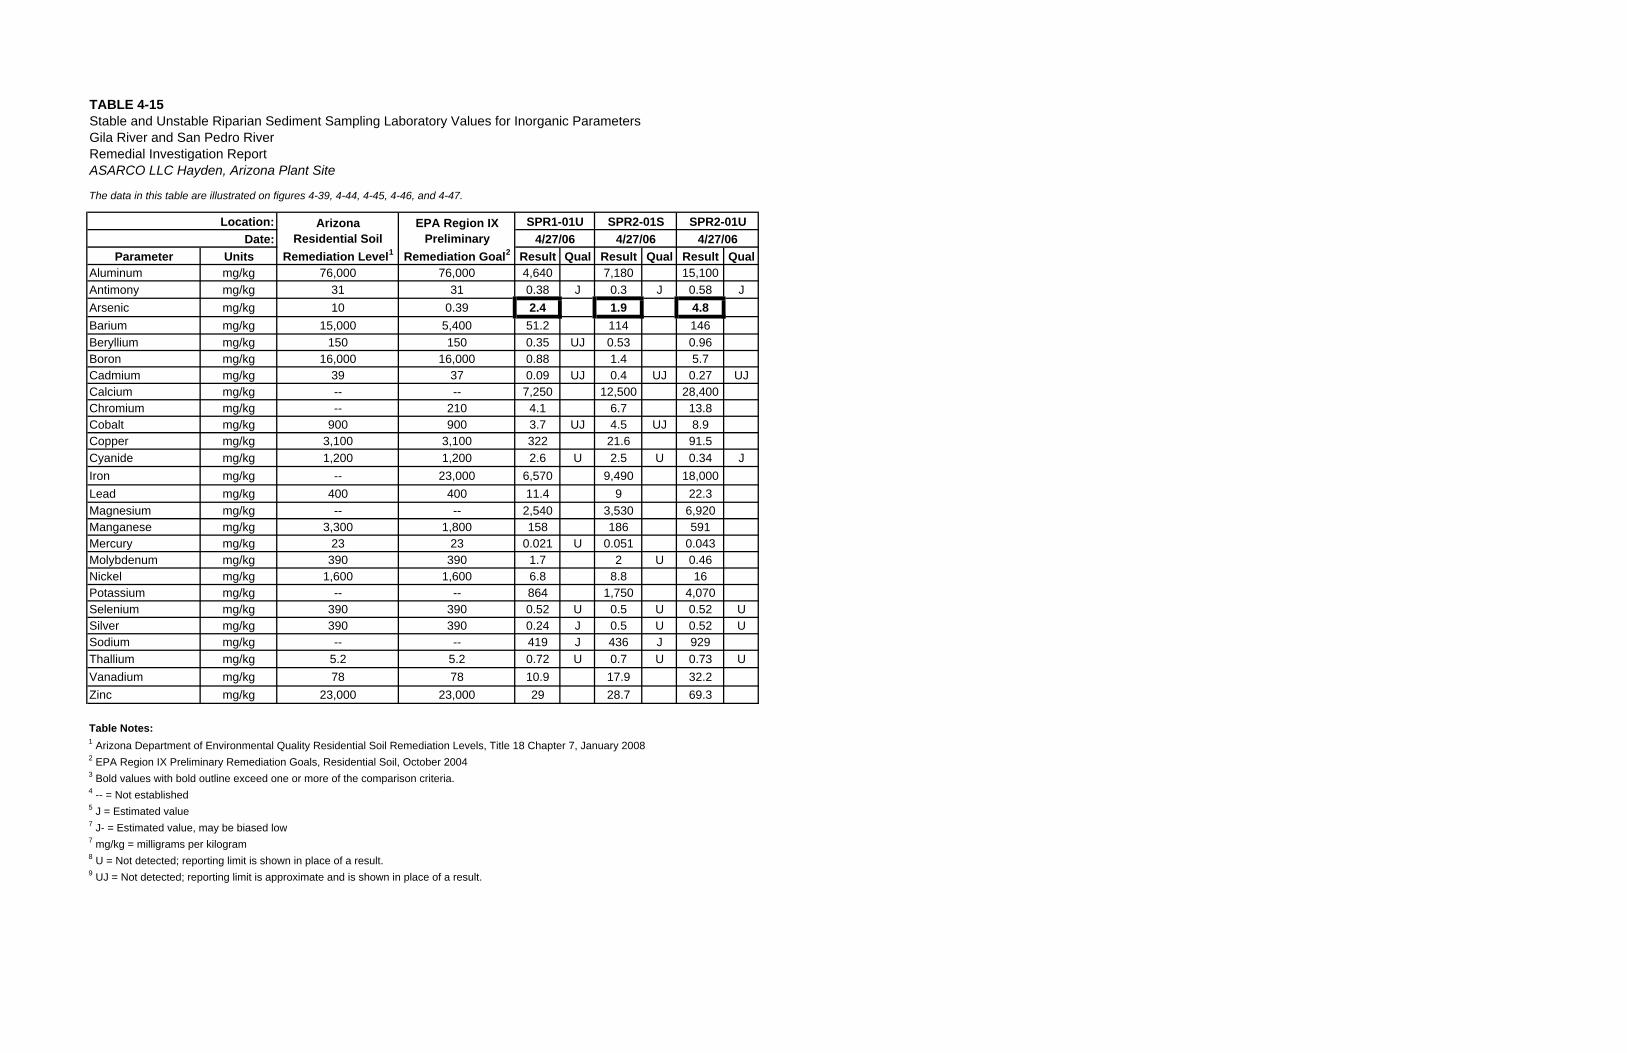
TABLE 4-15Stable and Unstable Riparian Sediment Sampling Laboratory Values for Inorganic ParametersGila River and San Pedro RiverRemedial Investigation Report
The data in this table are illustrated on figures 4-39, 4-44, 4-45, 4-46, and 4-47.
Parameter Units Result Qual Result Qual Result QualAluminum mg/kg 76,000 76,000 4,640 7,180 15,100Antimony mg/kg 31 31 0.38 J 0.3 J 0.58 JArsenic mg/kg 10 0.39 2.4 1.9 4.8Barium mg/kg 15,000 5,400 51.2 114 146Beryllium mg/kg 150 150 0.35 UJ 0.53 0.96Boron mg/kg 16,000 16,000 0.88 1.4 5.7Cadmium mg/kg 39 37 0.09 UJ 0.4 UJ 0.27 UJCalcium mg/kg -- -- 7,250 12,500 28,400Chromium mg/kg -- 210 4.1 6.7 13.8Cobalt mg/kg 900 900 3.7 UJ 4.5 UJ 8.9Copper mg/kg 3,100 3,100 322 21.6 91.5Cyanide mg/kg 1,200 1,200 2.6 U 2.5 U 0.34 JIron mg/kg -- 23,000 6,570 9,490 18,000Lead mg/kg 400 400 11.4 9 22.3Magnesium mg/kg -- -- 2,540 3,530 6,920Manganese mg/kg 3,300 1,800 158 186 591Mercury mg/kg 23 23 0.021 U 0.051 0.043Molybdenum mg/kg 390 390 1.7 2 U 0.46Nickel mg/kg 1,600 1,600 6.8 8.8 16Potassium mg/kg -- -- 864 1,750 4,070Selenium mg/kg 390 390 0.52 U 0.5 U 0.52 USilver mg/kg 390 390 0.24 J 0.5 U 0.52 USodium mg/kg -- -- 419 J 436 J 929Thallium mg/kg 5.2 5.2 0.72 U 0.7 U 0.73 UVanadium mg/kg 78 78 10.9 17.9 32.2Zinc mg/kg 23,000 23,000 29 28.7 69.3
Table Notes:1 Arizona Department of Environmental Quality Residential Soil Remediation Levels, Title 18 Chapter 7, January 20082 EPA Region IX Preliminary Remediation Goals, Residential Soil, October 20043 Bold values with bold outline exceed one or more of the comparison criteria.4 -- = Not established5 J = Estimated value7 J- = Estimated value, may be biased low7 mg/kg = milligrams per kilogram8 U = Not detected; reporting limit is shown in place of a result.9 UJ = Not detected; reporting limit is approximate and is shown in place of a result.
4/27/06SPR1-01U SPR2-01U
4/27/06SPR2-01S
4/27/06
ASARCO LLC Hayden, Arizona Plant Site
Location: ArizonaResidential Soil
Remediation Level1
EPA Region IXPreliminary
Remediation Goal2Date:
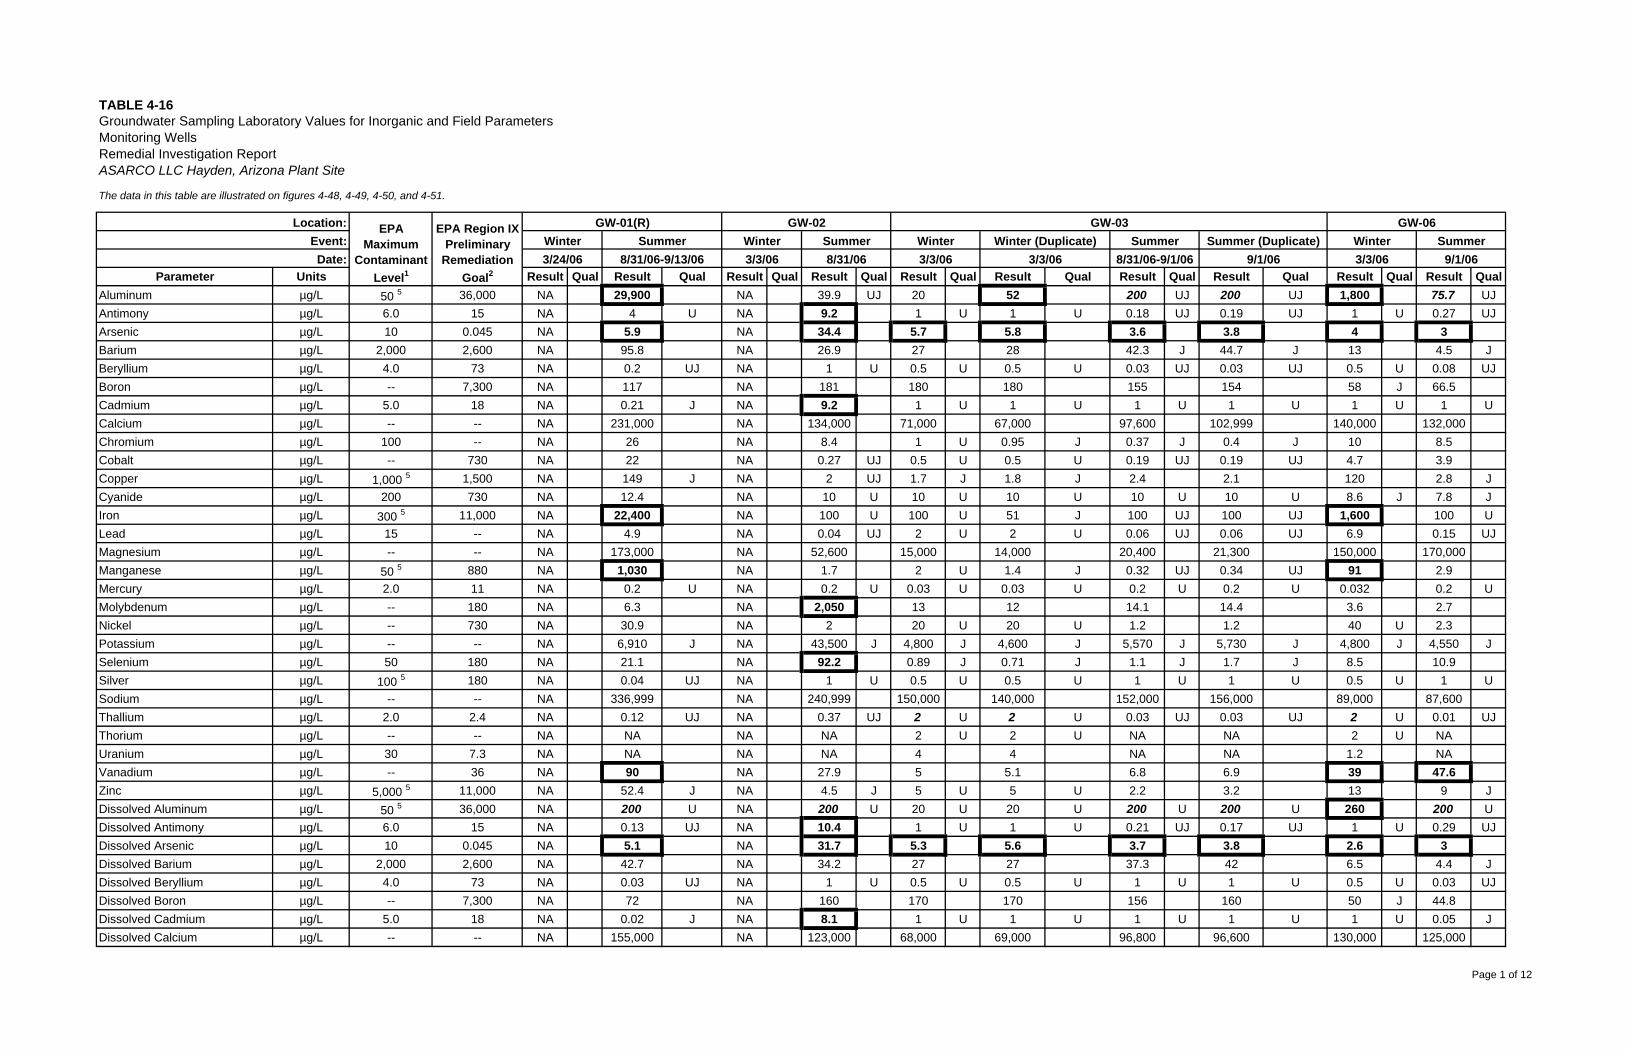
TABLE 4-16Groundwater Sampling Laboratory Values for Inorganic and Field ParametersMonitoring WellsRemedial Investigation ReportASARCO LLC Hayden, Arizona Plant Site
The data in this table are illustrated on figures 4-48, 4-49, 4-50, and 4-51.
Parameter Units Result Qual Result Qual Result Qual Result Qual Result Qual Result Qual Result Qual Result Qual Result Qual Result QualAluminum µg/L 50 5 36,000 NA 29,900 NA 39.9 UJ 20 52 200 UJ 200 UJ 1,800 75.7 UJAntimony µg/L 6.0 15 NA 4 U NA 9.2 1 U 1 U 0.18 UJ 0.19 UJ 1 U 0.27 UJArsenic µg/L 10 0.045 NA 5.9 NA 34.4 5.7 5.8 3.6 3.8 4 3Barium µg/L 2,000 2,600 NA 95.8 NA 26.9 27 28 42.3 J 44.7 J 13 4.5 JBeryllium µg/L 4.0 73 NA 0.2 UJ NA 1 U 0.5 U 0.5 U 0.03 UJ 0.03 UJ 0.5 U 0.08 UJBoron µg/L -- 7,300 NA 117 NA 181 180 180 155 154 58 J 66.5Cadmium µg/L 5.0 18 NA 0.21 J NA 9.2 1 U 1 U 1 U 1 U 1 U 1 UCalcium µg/L -- -- NA 231,000 NA 134,000 71,000 67,000 97,600 102,999 140,000 132,000Chromium µg/L 100 -- NA 26 NA 8.4 1 U 0.95 J 0.37 J 0.4 J 10 8.5Cobalt µg/L -- 730 NA 22 NA 0.27 UJ 0.5 U 0.5 U 0.19 UJ 0.19 UJ 4.7 3.9Copper µg/L 1,000 5 1,500 NA 149 J NA 2 UJ 1.7 J 1.8 J 2.4 2.1 120 2.8 JCyanide µg/L 200 730 NA 12.4 NA 10 U 10 U 10 U 10 U 10 U 8.6 J 7.8 JIron µg/L 300 5 11,000 NA 22,400 NA 100 U 100 U 51 J 100 UJ 100 UJ 1,600 100 ULead µg/L 15 -- NA 4.9 NA 0.04 UJ 2 U 2 U 0.06 UJ 0.06 UJ 6.9 0.15 UJMagnesium µg/L -- -- NA 173,000 NA 52,600 15,000 14,000 20,400 21,300 150,000 170,000Manganese µg/L 50 5 880 NA 1,030 NA 1.7 2 U 1.4 J 0.32 UJ 0.34 UJ 91 2.9Mercury µg/L 2.0 11 NA 0.2 U NA 0.2 U 0.03 U 0.03 U 0.2 U 0.2 U 0.032 0.2 UMolybdenum µg/L -- 180 NA 6.3 NA 2,050 13 12 14.1 14.4 3.6 2.7Nickel µg/L -- 730 NA 30.9 NA 2 20 U 20 U 1.2 1.2 40 U 2.3Potassium µg/L -- -- NA 6,910 J NA 43,500 J 4,800 J 4,600 J 5,570 J 5,730 J 4,800 J 4,550 JSelenium µg/L 50 180 NA 21.1 NA 92.2 0.89 J 0.71 J 1.1 J 1.7 J 8.5 10.9Silver µg/L 100 5 180 NA 0.04 UJ NA 1 U 0.5 U 0.5 U 1 U 1 U 0.5 U 1 USodium µg/L -- -- NA 336,999 NA 240,999 150,000 140,000 152,000 156,000 89,000 87,600Thallium µg/L 2.0 2.4 NA 0.12 UJ NA 0.37 UJ 2 U 2 U 0.03 UJ 0.03 UJ 2 U 0.01 UJThorium µg/L -- -- NA NA NA NA 2 U 2 U NA NA 2 U NAUranium µg/L 30 7.3 NA NA NA NA 4 4 NA NA 1.2 NAVanadium µg/L -- 36 NA 90 NA 27.9 5 5.1 6.8 6.9 39 47.6Zinc µg/L 5,000 5 11,000 NA 52.4 J NA 4.5 J 5 U 5 U 2.2 3.2 13 9 JDissolved Aluminum µg/L 50 5 36,000 NA 200 U NA 200 U 20 U 20 U 200 U 200 U 260 200 UDissolved Antimony µg/L 6.0 15 NA 0.13 UJ NA 10.4 1 U 1 U 0.21 UJ 0.17 UJ 1 U 0.29 UJDissolved Arsenic µg/L 10 0.045 NA 5.1 NA 31.7 5.3 5.6 3.7 3.8 2.6 3Dissolved Barium µg/L 2,000 2,600 NA 42.7 NA 34.2 27 27 37.3 42 6.5 4.4 JDissolved Beryllium µg/L 4.0 73 NA 0.03 UJ NA 1 U 0.5 U 0.5 U 1 U 1 U 0.5 U 0.03 UJDissolved Boron µg/L -- 7,300 NA 72 NA 160 170 170 156 160 50 J 44.8Dissolved Cadmium µg/L 5.0 18 NA 0.02 J NA 8.1 1 U 1 U 1 U 1 U 1 U 0.05 JDissolved Calcium µg/L -- -- NA 155,000 NA 123,000 68,000 69,000 96,800 96,600 130,000 125,000
Date: 9/1/069/1/06 3/3/06
EPA Region IXPreliminary
RemediationGoal2
Winter Summer Winter SummerLocation:
Event:GW-01(R) GW-02 GW-03 GW-06EPA
MaximumContaminant
Level1
Winter Winter (Duplicate) Summer Summer (Duplicate) Winter Summer8/31/063/24/06 8/31/06-9/13/06 3/3/06 3/3/06 3/3/06 8/31/06-9/1/06
Page 1 of 12
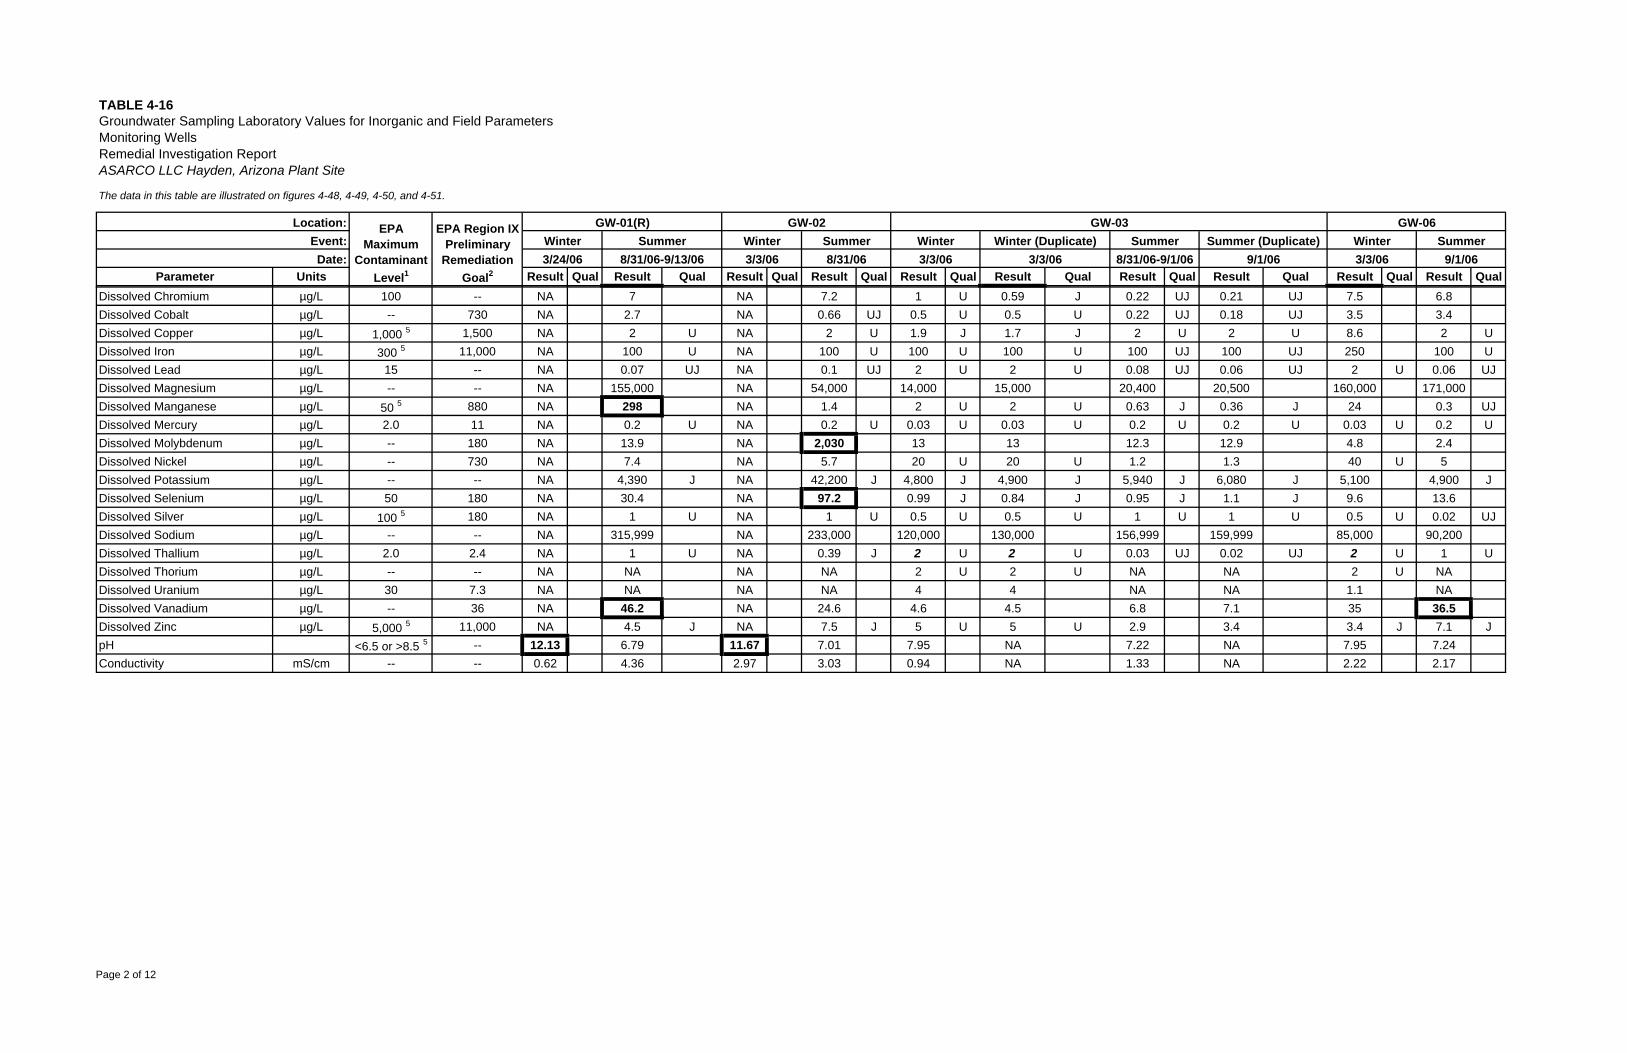
TABLE 4-16Groundwater Sampling Laboratory Values for Inorganic and Field ParametersMonitoring WellsRemedial Investigation ReportASARCO LLC Hayden, Arizona Plant Site
The data in this table are illustrated on figures 4-48, 4-49, 4-50, and 4-51.
Parameter Units Result Qual Result Qual Result Qual Result Qual Result Qual Result Qual Result Qual Result Qual Result Qual Result QualDate: 9/1/069/1/06 3/3/06
EPA Region IXPreliminary
RemediationGoal2
Winter Summer Winter SummerLocation:
Event:GW-01(R) GW-02 GW-03 GW-06EPA
MaximumContaminant
Level1
Winter Winter (Duplicate) Summer Summer (Duplicate) Winter Summer8/31/063/24/06 8/31/06-9/13/06 3/3/06 3/3/06 3/3/06 8/31/06-9/1/06
Dissolved Chromium µg/L 100 -- NA 7 NA 7.2 1 U 0.59 J 0.22 UJ 0.21 UJ 7.5 6.8Dissolved Cobalt µg/L -- 730 NA 2.7 NA 0.66 UJ 0.5 U 0.5 U 0.22 UJ 0.18 UJ 3.5 3.4Dissolved Copper µg/L 1,000 5 1,500 NA 2 U NA 2 U 1.9 J 1.7 J 2 U 2 U 8.6 2 UDissolved Iron µg/L 300 5 11,000 NA 100 U NA 100 U 100 U 100 U 100 UJ 100 UJ 250 100 UDissolved Lead µg/L 15 -- NA 0.07 UJ NA 0.1 UJ 2 U 2 U 0.08 UJ 0.06 UJ 2 U 0.06 UJDissolved Magnesium µg/L -- -- NA 155,000 NA 54,000 14,000 15,000 20,400 20,500 160,000 171,000Dissolved Manganese µg/L 50 5 880 NA 298 NA 1.4 2 U 2 U 0.63 J 0.36 J 24 0.3 UJDissolved Mercury µg/L 2.0 11 NA 0.2 U NA 0.2 U 0.03 U 0.03 U 0.2 U 0.2 U 0.03 U 0.2 UDissolved Molybdenum µg/L -- 180 NA 13.9 NA 2,030 13 13 12.3 12.9 4.8 2.4Dissolved Nickel µg/L -- 730 NA 7.4 NA 5.7 20 U 20 U 1.2 1.3 40 U 5Dissolved Potassium µg/L -- -- NA 4,390 J NA 42,200 J 4,800 J 4,900 J 5,940 J 6,080 J 5,100 4,900 JDissolved Selenium µg/L 50 180 NA 30.4 NA 97.2 0.99 J 0.84 J 0.95 J 1.1 J 9.6 13.6Dissolved Silver µg/L 100 5 180 NA 1 U NA 1 U 0.5 U 0.5 U 1 U 1 U 0.5 U 0.02 UJDissolved Sodium µg/L -- -- NA 315,999 NA 233,000 120,000 130,000 156,999 159,999 85,000 90,200Dissolved Thallium µg/L 2.0 2.4 NA 1 U NA 0.39 J 2 U 2 U 0.03 UJ 0.02 UJ 2 U 1 UDissolved Thorium µg/L -- -- NA NA NA NA 2 U 2 U NA NA 2 U NADissolved Uranium µg/L 30 7.3 NA NA NA NA 4 4 NA NA 1.1 NADissolved Vanadium µg/L -- 36 NA 46.2 NA 24.6 4.6 4.5 6.8 7.1 35 36.5Dissolved Zinc µg/L 5,000 5 11,000 NA 4.5 J NA 7.5 J 5 U 5 U 2.9 3.4 3.4 J 7.1 JpH <6.5 or >8.5 5 -- 12.13 6.79 11.67 7.01 7.95 NA 7.22 NA 7.95 7.24Conductivity mS/cm -- -- 0.62 4.36 2.97 3.03 0.94 NA 1.33 NA 2.22 2.17
Page 2 of 12
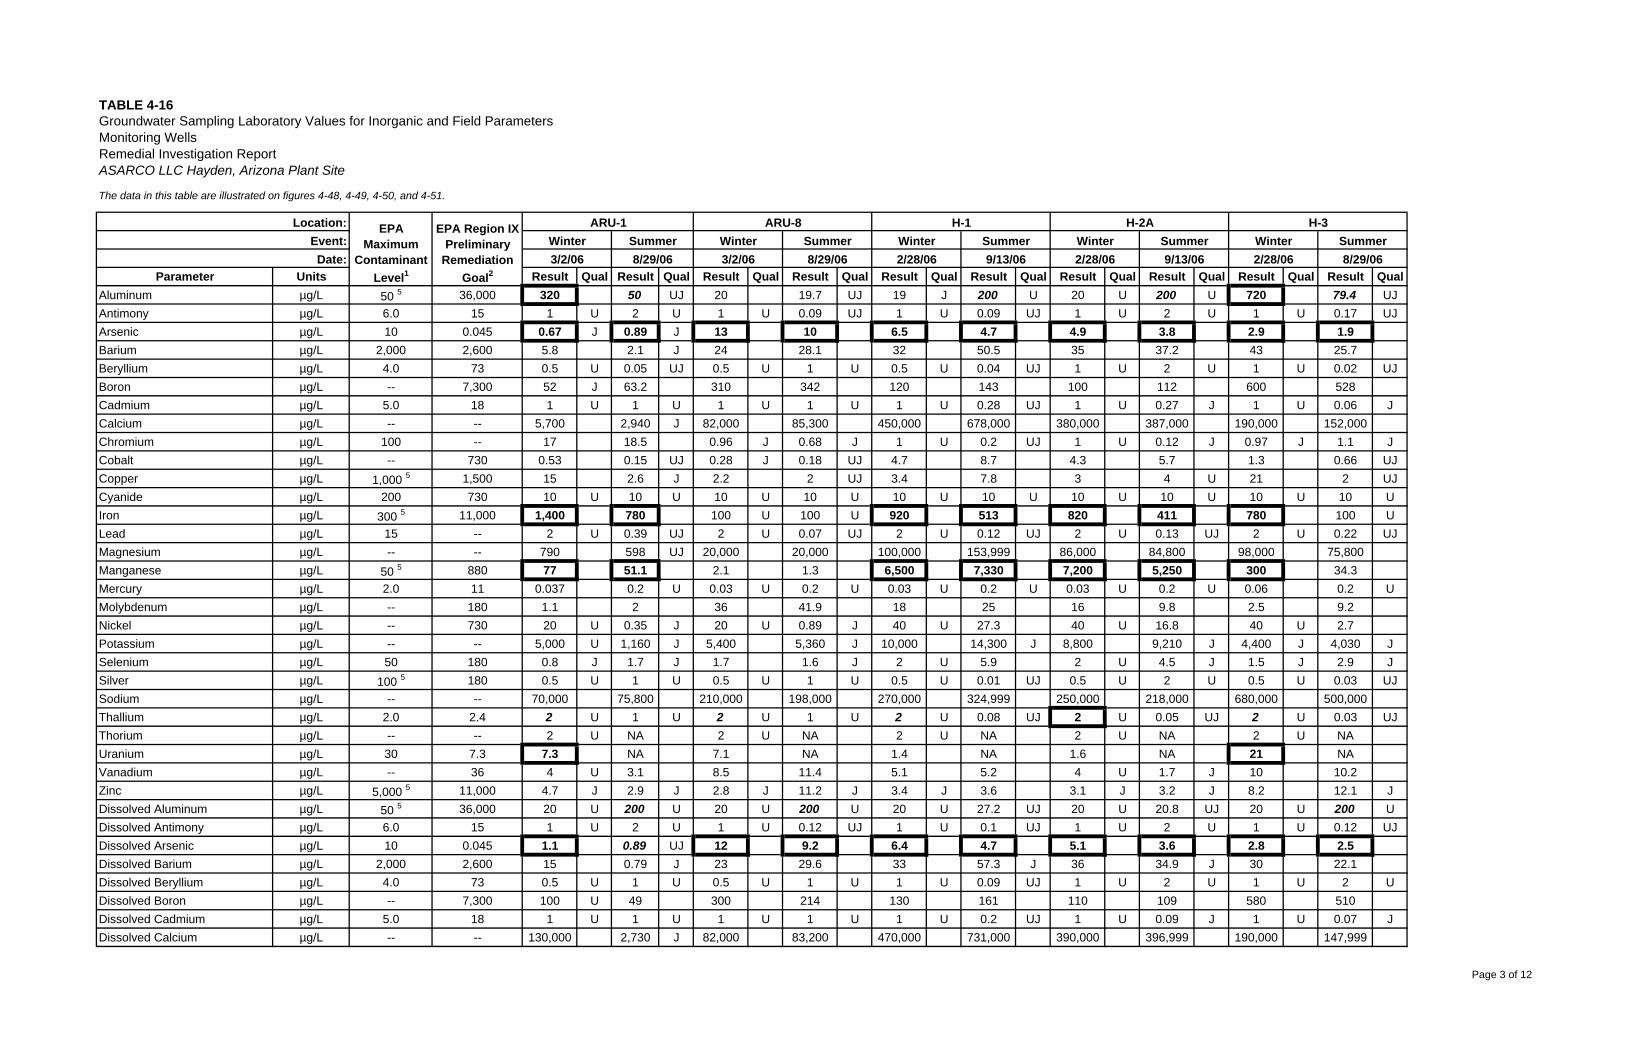
TABLE 4-16Groundwater Sampling Laboratory Values for Inorganic and Field ParametersMonitoring WellsRemedial Investigation ReportASARCO LLC Hayden, Arizona Plant Site
The data in this table are illustrated on figures 4-48, 4-49, 4-50, and 4-51.
Parameter Units Result Qual Result Qual Result Qual Result Qual Result Qual Result Qual Result Qual Result Qual Result Qual Result QualAluminum µg/L 50 5 36,000 320 50 UJ 20 19.7 UJ 19 J 200 U 20 U 200 U 720 79.4 UJAntimony µg/L 6.0 15 1 U 2 U 1 U 0.09 UJ 1 U 0.09 UJ 1 U 2 U 1 U 0.17 UJArsenic µg/L 10 0.045 0.67 J 0.89 J 13 10 6.5 4.7 4.9 3.8 2.9 1.9Barium µg/L 2,000 2,600 5.8 2.1 J 24 28.1 32 50.5 35 37.2 43 25.7Beryllium µg/L 4.0 73 0.5 U 0.05 UJ 0.5 U 1 U 0.5 U 0.04 UJ 1 U 2 U 1 U 0.02 UJBoron µg/L -- 7,300 52 J 63.2 310 342 120 143 100 112 600 528Cadmium µg/L 5.0 18 1 U 1 U 1 U 1 U 1 U 0.28 UJ 1 U 0.27 J 1 U 0.06 JCalcium µg/L -- -- 5,700 2,940 J 82,000 85,300 450,000 678,000 380,000 387,000 190,000 152,000Chromium µg/L 100 -- 17 18.5 0.96 J 0.68 J 1 U 0.2 UJ 1 U 0.12 J 0.97 J 1.1 JCobalt µg/L -- 730 0.53 0.15 UJ 0.28 J 0.18 UJ 4.7 8.7 4.3 5.7 1.3 0.66 UJCopper µg/L 1,000 5 1,500 15 2.6 J 2.2 2 UJ 3.4 7.8 3 4 U 21 2 UJCyanide µg/L 200 730 10 U 10 U 10 U 10 U 10 U 10 U 10 U 10 U 10 U 10 UIron µg/L 300 5 11,000 1,400 780 100 U 100 U 920 513 820 411 780 100 ULead µg/L 15 -- 2 U 0.39 UJ 2 U 0.07 UJ 2 U 0.12 UJ 2 U 0.13 UJ 2 U 0.22 UJMagnesium µg/L -- -- 790 598 UJ 20,000 20,000 100,000 153,999 86,000 84,800 98,000 75,800Manganese µg/L 50 5 880 77 51.1 2.1 1.3 6,500 7,330 7,200 5,250 300 34.3Mercury µg/L 2.0 11 0.037 0.2 U 0.03 U 0.2 U 0.03 U 0.2 U 0.03 U 0.2 U 0.06 0.2 UMolybdenum µg/L -- 180 1.1 2 36 41.9 18 25 16 9.8 2.5 9.2Nickel µg/L -- 730 20 U 0.35 J 20 U 0.89 J 40 U 27.3 40 U 16.8 40 U 2.7Potassium µg/L -- -- 5,000 U 1,160 J 5,400 5,360 J 10,000 14,300 J 8,800 9,210 J 4,400 J 4,030 JSelenium µg/L 50 180 0.8 J 1.7 J 1.7 1.6 J 2 U 5.9 2 U 4.5 J 1.5 J 2.9 JSilver µg/L 100 5 180 0.5 U 1 U 0.5 U 1 U 0.5 U 0.01 UJ 0.5 U 2 U 0.5 U 0.03 UJSodium µg/L -- -- 70,000 75,800 210,000 198,000 270,000 324,999 250,000 218,000 680,000 500,000Thallium µg/L 2.0 2.4 2 U 1 U 2 U 1 U 2 U 0.08 UJ 2 U 0.05 UJ 2 U 0.03 UJThorium µg/L -- -- 2 U NA 2 U NA 2 U NA 2 U NA 2 U NAUranium µg/L 30 7.3 7.3 NA 7.1 NA 1.4 NA 1.6 NA 21 NAVanadium µg/L -- 36 4 U 3.1 8.5 11.4 5.1 5.2 4 U 1.7 J 10 10.2Zinc µg/L 5,000 5 11,000 4.7 J 2.9 J 2.8 J 11.2 J 3.4 J 3.6 3.1 J 3.2 J 8.2 12.1 JDissolved Aluminum µg/L 50 5 36,000 20 U 200 U 20 U 200 U 20 U 27.2 UJ 20 U 20.8 UJ 20 U 200 UDissolved Antimony µg/L 6.0 15 1 U 2 U 1 U 0.12 UJ 1 U 0.1 UJ 1 U 2 U 1 U 0.12 UJDissolved Arsenic µg/L 10 0.045 1.1 0.89 UJ 12 9.2 6.4 4.7 5.1 3.6 2.8 2.5Dissolved Barium µg/L 2,000 2,600 15 0.79 J 23 29.6 33 57.3 J 36 34.9 J 30 22.1Dissolved Beryllium µg/L 4.0 73 0.5 U 1 U 0.5 U 1 U 1 U 0.09 UJ 1 U 2 U 1 U 2 UDissolved Boron µg/L -- 7,300 100 U 49 300 214 130 161 110 109 580 510Dissolved Cadmium µg/L 5.0 18 1 U 1 U 1 U 1 U 1 U 0.2 UJ 1 U 0.09 J 1 U 0.07 JDissolved Calcium µg/L -- -- 130,000 2,730 J 82,000 83,200 470,000 731,000 390,000 396,999 190,000 147,999
3/2/06 8/29/06Winter Winter
ARU-1Winter Summer
H-2A H-3Summer
2/28/06 8/29/06Winter Summer
3/2/06 2/28/06
Location: EPAMaximum
ContaminantLevel1
Date:
EPA Region IXPreliminary
RemediationGoal2
Summer Winter Summer8/29/06 2/28/06 9/13/06 9/13/06
ARU-8 H-1Event:
Page 3 of 12
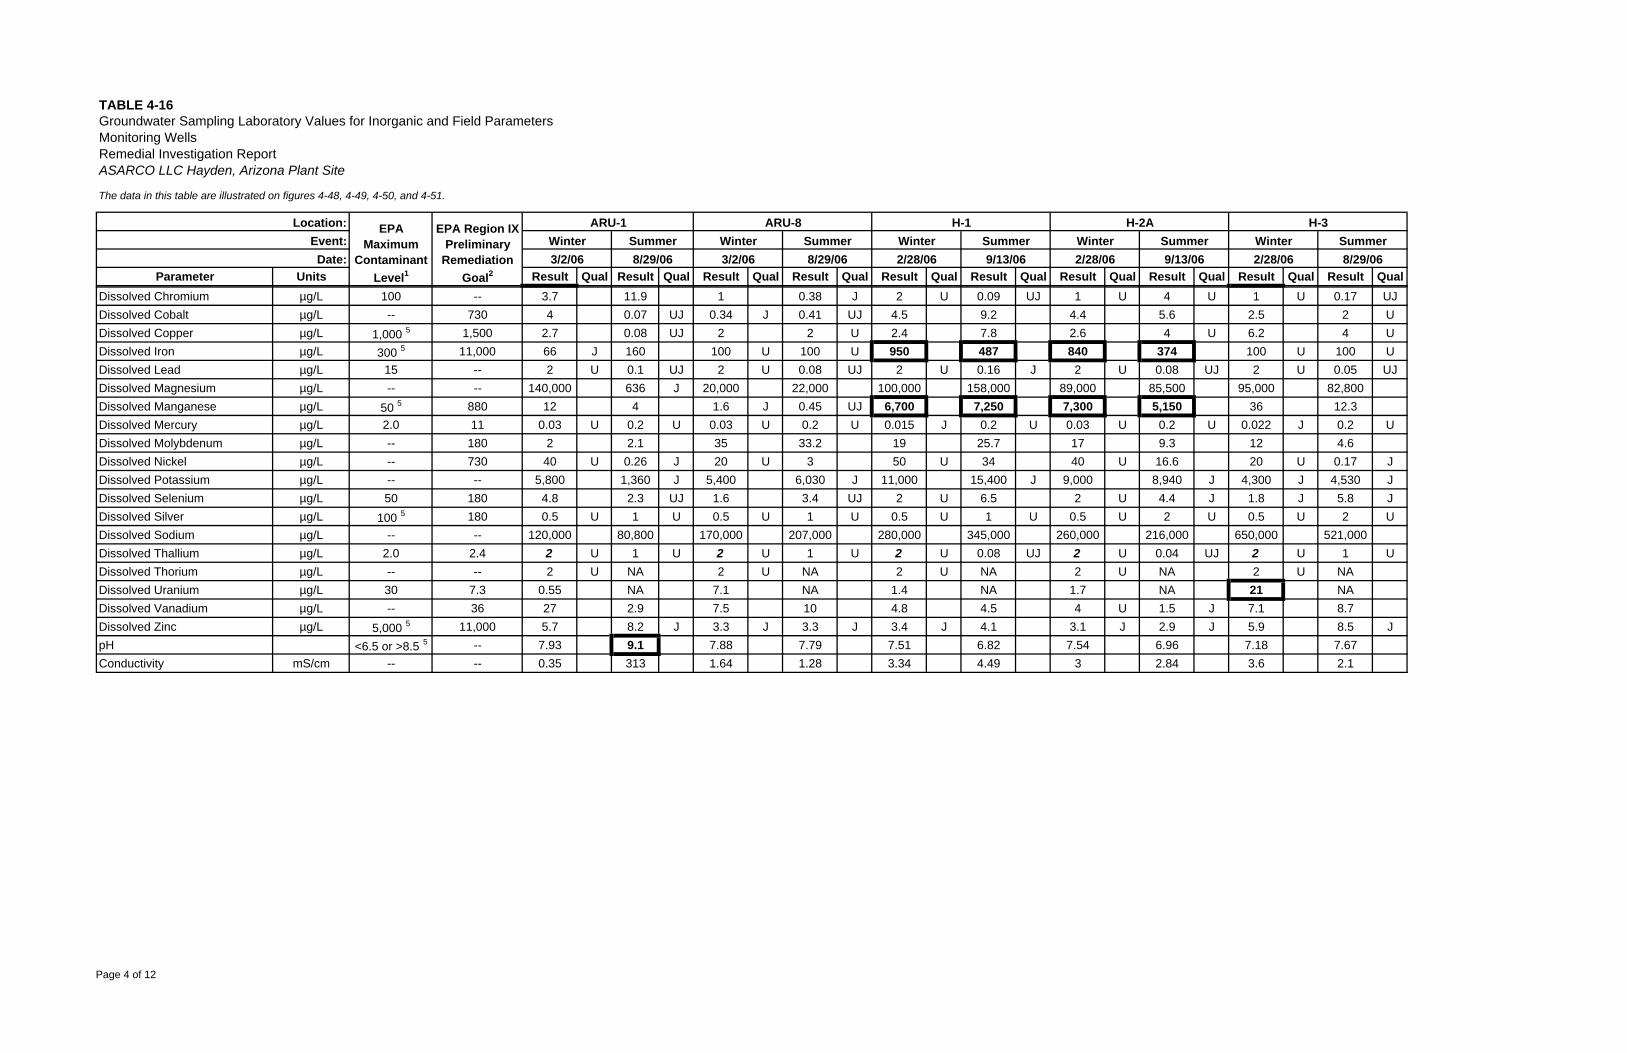
TABLE 4-16Groundwater Sampling Laboratory Values for Inorganic and Field ParametersMonitoring WellsRemedial Investigation ReportASARCO LLC Hayden, Arizona Plant Site
The data in this table are illustrated on figures 4-48, 4-49, 4-50, and 4-51.
Parameter Units Result Qual Result Qual Result Qual Result Qual Result Qual Result Qual Result Qual Result Qual Result Qual Result Qual3/2/06 8/29/06
Winter WinterARU-1
Winter SummerH-2A H-3
Summer2/28/06 8/29/06Winter Summer
3/2/06 2/28/06
Location: EPAMaximum
ContaminantLevel1
Date:
EPA Region IXPreliminary
RemediationGoal2
Summer Winter Summer8/29/06 2/28/06 9/13/06 9/13/06
ARU-8 H-1Event:
Dissolved Chromium µg/L 100 -- 3.7 11.9 1 0.38 J 2 U 0.09 UJ 1 U 4 U 1 U 0.17 UJDissolved Cobalt µg/L -- 730 4 0.07 UJ 0.34 J 0.41 UJ 4.5 9.2 4.4 5.6 2.5 2 UDissolved Copper µg/L 1,000 5 1,500 2.7 0.08 UJ 2 2 U 2.4 7.8 2.6 4 U 6.2 4 UDissolved Iron µg/L 300 5 11,000 66 J 160 100 U 100 U 950 487 840 374 100 U 100 UDissolved Lead µg/L 15 -- 2 U 0.1 UJ 2 U 0.08 UJ 2 U 0.16 J 2 U 0.08 UJ 2 U 0.05 UJDissolved Magnesium µg/L -- -- 140,000 636 J 20,000 22,000 100,000 158,000 89,000 85,500 95,000 82,800Dissolved Manganese µg/L 50 5 880 12 4 1.6 J 0.45 UJ 6,700 7,250 7,300 5,150 36 12.3Dissolved Mercury µg/L 2.0 11 0.03 U 0.2 U 0.03 U 0.2 U 0.015 J 0.2 U 0.03 U 0.2 U 0.022 J 0.2 UDissolved Molybdenum µg/L -- 180 2 2.1 35 33.2 19 25.7 17 9.3 12 4.6Dissolved Nickel µg/L -- 730 40 U 0.26 J 20 U 3 50 U 34 40 U 16.6 20 U 0.17 JDissolved Potassium µg/L -- -- 5,800 1,360 J 5,400 6,030 J 11,000 15,400 J 9,000 8,940 J 4,300 J 4,530 JDissolved Selenium µg/L 50 180 4.8 2.3 UJ 1.6 3.4 UJ 2 U 6.5 2 U 4.4 J 1.8 J 5.8 JDissolved Silver µg/L 100 5 180 0.5 U 1 U 0.5 U 1 U 0.5 U 1 U 0.5 U 2 U 0.5 U 2 UDissolved Sodium µg/L -- -- 120,000 80,800 170,000 207,000 280,000 345,000 260,000 216,000 650,000 521,000Dissolved Thallium µg/L 2.0 2.4 2 U 1 U 2 U 1 U 2 U 0.08 UJ 2 U 0.04 UJ 2 U 1 UDissolved Thorium µg/L -- -- 2 U NA 2 U NA 2 U NA 2 U NA 2 U NADissolved Uranium µg/L 30 7.3 0.55 NA 7.1 NA 1.4 NA 1.7 NA 21 NADissolved Vanadium µg/L -- 36 27 2.9 7.5 10 4.8 4.5 4 U 1.5 J 7.1 8.7Dissolved Zinc µg/L 5,000 5 11,000 5.7 8.2 J 3.3 J 3.3 J 3.4 J 4.1 3.1 J 2.9 J 5.9 8.5 JpH <6.5 or >8.5 5 -- 7.93 9.1 7.88 7.79 7.51 6.82 7.54 6.96 7.18 7.67Conductivity mS/cm -- -- 0.35 313 1.64 1.28 3.34 4.49 3 2.84 3.6 2.1
Page 4 of 12

TABLE 4-16Groundwater Sampling Laboratory Values for Inorganic and Field ParametersMonitoring WellsRemedial Investigation ReportASARCO LLC Hayden, Arizona Plant Site
The data in this table are illustrated on figures 4-48, 4-49, 4-50, and 4-51.
Parameter Units Result Qual Result Qual Result Qual Result Qual Result Qual Result Qual Result Qual Result Qual Result Qual Result Qual Result QualAluminum µg/L 50 5 36,000 38 200 U 38 200 U 20 U 23.7 UJ 20 U 200 U 815 100 383Antimony µg/L 6.0 15 1 U 0.11 UJ 1 U 0.11 UJ 1 U 0.12 UJ 1.1 1.1 UJ 0.21 UJ 1 U 0.44 UJArsenic µg/L 10 0.045 16 6.4 16 6.4 7.4 4.9 7.1 7.9 231 7.5 7.6Barium µg/L 2,000 2,600 60 45.2 60 45.2 56 177 23 36.4 7.6 UJ 34 39.3Beryllium µg/L 4.0 73 0.5 U 1 U 0.5 U 1 U 0.5 U 0.03 UJ 0.5 U 1 U 1 U 1 U 1 UBoron µg/L -- 7,300 310 316 310 316 140 193 120 190 679 160 130Cadmium µg/L 5.0 18 1 U 0.03 J 1 U 0.03 J 1 U 0.04 UJ 1 U 1 U 1 U 1 U 0.08 JCalcium µg/L -- -- 94,000 93,900 94,000 93,900 63,000 206,000 58,000 70,500 6,710 130,000 170,000Chromium µg/L 100 -- 1 U 0.38 J 1 U 0.38 J 1 U 0.27 UJ 1 0.36 J 18.1 9.9 3Cobalt µg/L -- 730 0.74 0.4 UJ 0.74 0.4 UJ 0.61 1.6 0.7 0.24 UJ 0.79 UJ 1.6 1.2Copper µg/L 1,000 5 1,500 5.1 2 UJ 5.1 2 UJ 3.5 6.3 2.9 2 UJ 4.6 J 10 11.7 JCyanide µg/L 200 730 10 U 10 U 10 U 10 U 10 U 10 U NA 10 U 10 U 10 U 10 UIron µg/L 300 5 11,000 1,300 100 U 1,300 100 U 140 404 100 U 100 U 623 210 145Lead µg/L 15 -- 2 U 0.07 UJ 2 U 0.07 UJ 2 U 0.11 UJ 2 U 0.03 UJ 0.57 UJ 2 U 0.42 UJMagnesium µg/L -- -- 22,000 22,900 22,000 22,900 16,000 51,600 18,000 20,200 1,510 UJ 170,000 59,500Manganese µg/L 50 5 880 270 75.1 270 75.1 850 2,190 3.7 5.2 19.5 26 40.8Mercury µg/L 2.0 11 0.019 J 0.2 U 0.019 J 0.2 U 0.03 U 0.2 U 0.03 U 0.2 U 0.2 U 0.019 J 0.2 UMolybdenum µg/L -- 180 2.9 26.5 2.9 26.5 15 18.5 65 65.9 3.5 30 300Nickel µg/L -- 730 20 U 2 20 U 2 10 U 8.4 10 U 1.2 3.5 40 U 3.8Potassium µg/L -- -- 5,900 5,350 J 5,900 5,350 J 5,500 9,870 J 4,900 J 6,680 J 1,390 J 10,000 7,390 JSelenium µg/L 50 180 2 U 1.3 J 2 U 1.3 J 2 U 3.1 J 2 U 13.1 2.9 J 100 35Silver µg/L 100 5 180 0.5 U 1 U 0.5 U 1 U 0.5 U 1 U 0.5 U 1 U 1 U 0.5 U 0.02 UJSodium µg/L -- -- 270,000 233,000 270,000 233,000 190,000 285,000 130,000 156,000 228,000 360,000 128,000Thallium µg/L 2.0 2.4 2 U 1 U 2 U 1 U 2 U 0.05 UJ 2 U 1 U 0.01 UJ 2 U 1 UThorium µg/L -- -- 2 U NA 2 U NA 2 U NA 2 U NA NA 2 U NAUranium µg/L 30 7.3 8.5 NA 8.5 NA 1.6 NA 3 NA NA 5.2 NAVanadium µg/L -- 36 8 7.2 8 7.2 4 U 0.75 UJ 3.8 J 9.8 598 70 60.7Zinc µg/L 5,000 5 11,000 4.4 J 6.3 J 4.4 J 6.3 J 5 U 2.5 5 U 2.1 J 4.6 J 5.8 5.6 JDissolved Aluminum µg/L 50 5 36,000 20 U 200 U 20 U 200 U 20 U 31.2 UJ 20 U 200 U 40.3 J 20 U 200 UDissolved Antimony µg/L 6.0 15 1 U 0.19 UJ 1 U 0.19 UJ 1 U 2 U 0.97 J 1.2 UJ 0.22 UJ 1 U 0.5 UJDissolved Arsenic µg/L 10 0.045 6.9 5.9 6.9 5.9 6.7 4.8 7.2 6.8 199 7 6.2Dissolved Barium µg/L 2,000 2,600 42 48.7 42 48.7 54 191 J 24 38.3 2.9 J 33 35Dissolved Beryllium µg/L 4.0 73 0.5 U 0.05 UJ 0.5 U 0.05 UJ 0.5 U 0.02 UJ 0.5 U 0.08 UJ 1 U 1 U 0.04 UJDissolved Boron µg/L -- 7,300 300 177 300 177 140 201 120 153 430 160 83.2Dissolved Cadmium µg/L 5.0 18 1 U 1 U 1 U 1 U 1 U 1 U 1 U 1 U 1 U 1 U 1 UDissolved Calcium µg/L -- -- 92,000 87,600 92,000 87,600 62,000 210,000 59,000 66,800 6,320 140,000 165,999
WinterH-4 H-5 H-6 H-7 H-8
Winter2/28/06
SummerWinterEPA Region IX
PreliminaryRemediation
Goal2
Summer2/28/06 8/29/06
Winter Summer2/27/06 8/29/06 8/30/06
Summer9/13/06
Summer Summer8/30/062/28/06 8/29/06 2/28/06
H-4Winter
Location: EPAMaximum
ContaminantLevel1
Event:Date:
Page 5 of 12
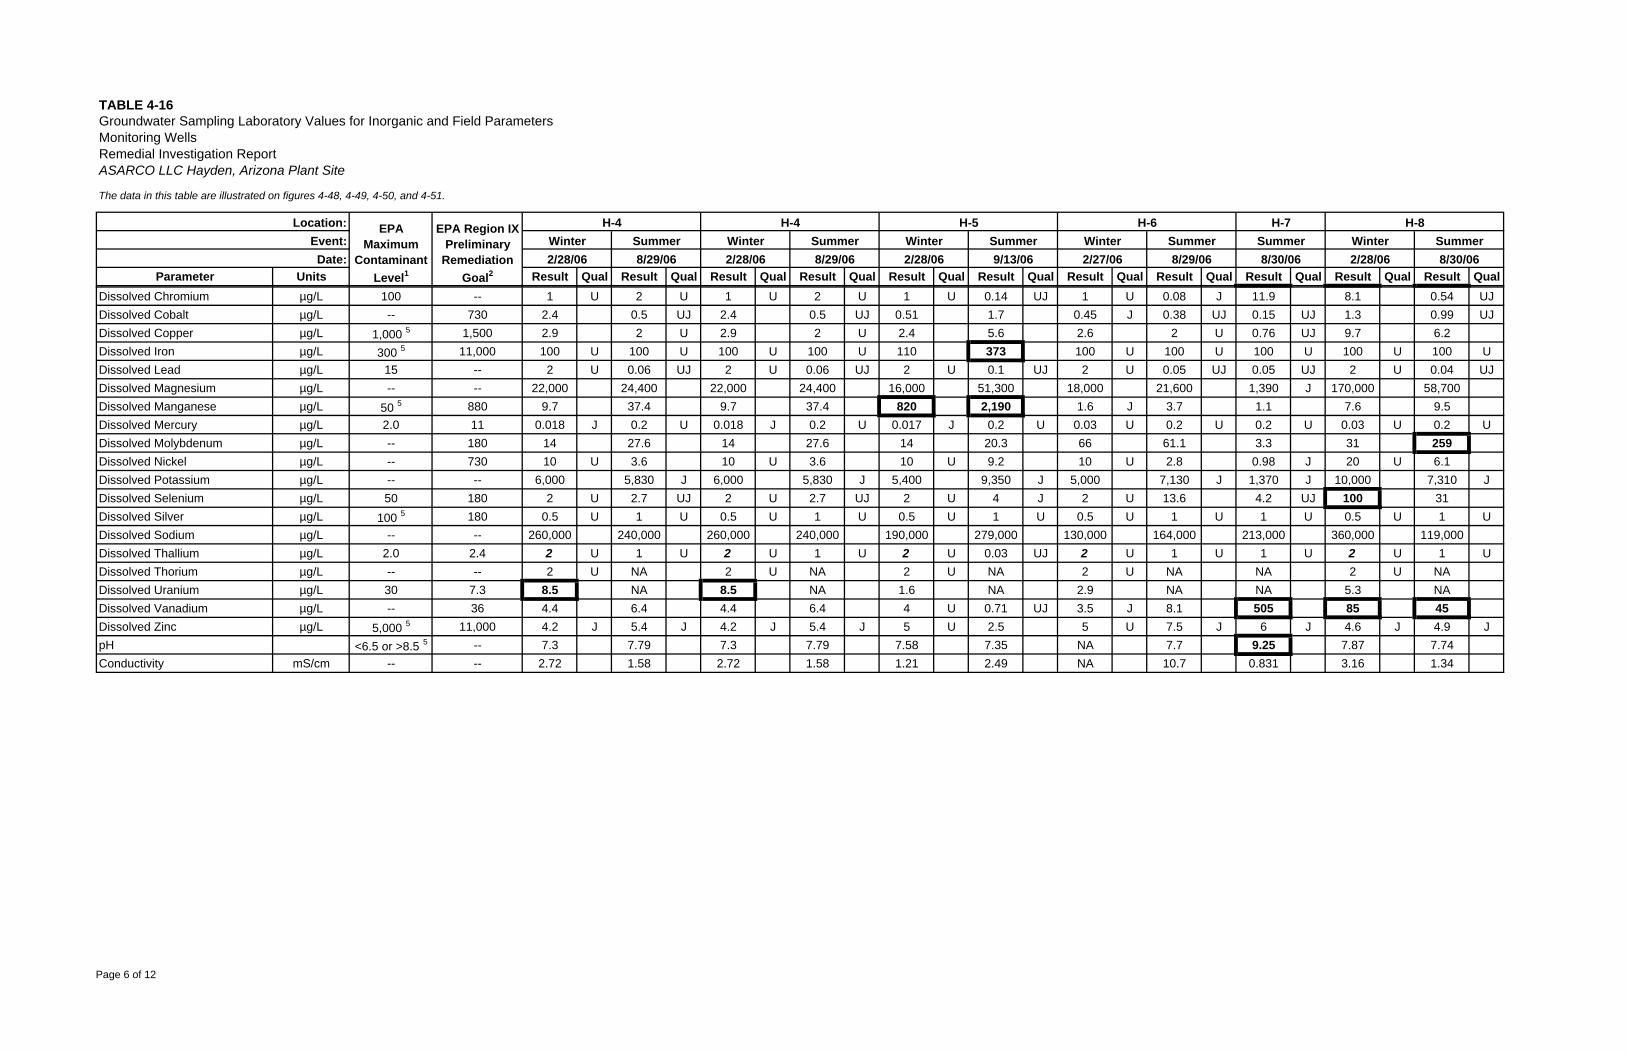
TABLE 4-16Groundwater Sampling Laboratory Values for Inorganic and Field ParametersMonitoring WellsRemedial Investigation ReportASARCO LLC Hayden, Arizona Plant Site
The data in this table are illustrated on figures 4-48, 4-49, 4-50, and 4-51.
Parameter Units Result Qual Result Qual Result Qual Result Qual Result Qual Result Qual Result Qual Result Qual Result Qual Result Qual Result Qual
WinterH-4 H-5 H-6 H-7 H-8
Winter2/28/06
SummerWinterEPA Region IX
PreliminaryRemediation
Goal2
Summer2/28/06 8/29/06
Winter Summer2/27/06 8/29/06 8/30/06
Summer9/13/06
Summer Summer8/30/062/28/06 8/29/06 2/28/06
H-4Winter
Location: EPAMaximum
ContaminantLevel1
Event:Date:
Dissolved Chromium µg/L 100 -- 1 U 2 U 1 U 2 U 1 U 0.14 UJ 1 U 0.08 J 11.9 8.1 0.54 UJDissolved Cobalt µg/L -- 730 2.4 0.5 UJ 2.4 0.5 UJ 0.51 1.7 0.45 J 0.38 UJ 0.15 UJ 1.3 0.99 UJDissolved Copper µg/L 1,000 5 1,500 2.9 2 U 2.9 2 U 2.4 5.6 2.6 2 U 0.76 UJ 9.7 6.2Dissolved Iron µg/L 300 5 11,000 100 U 100 U 100 U 100 U 110 373 100 U 100 U 100 U 100 U 100 UDissolved Lead µg/L 15 -- 2 U 0.06 UJ 2 U 0.06 UJ 2 U 0.1 UJ 2 U 0.05 UJ 0.05 UJ 2 U 0.04 UJDissolved Magnesium µg/L -- -- 22,000 24,400 22,000 24,400 16,000 51,300 18,000 21,600 1,390 J 170,000 58,700Dissolved Manganese µg/L 50 5 880 9.7 37.4 9.7 37.4 820 2,190 1.6 J 3.7 1.1 7.6 9.5Dissolved Mercury µg/L 2.0 11 0.018 J 0.2 U 0.018 J 0.2 U 0.017 J 0.2 U 0.03 U 0.2 U 0.2 U 0.03 U 0.2 UDissolved Molybdenum µg/L -- 180 14 27.6 14 27.6 14 20.3 66 61.1 3.3 31 259Dissolved Nickel µg/L -- 730 10 U 3.6 10 U 3.6 10 U 9.2 10 U 2.8 0.98 J 20 U 6.1Dissolved Potassium µg/L -- -- 6,000 5,830 J 6,000 5,830 J 5,400 9,350 J 5,000 7,130 J 1,370 J 10,000 7,310 JDissolved Selenium µg/L 50 180 2 U 2.7 UJ 2 U 2.7 UJ 2 U 4 J 2 U 13.6 4.2 UJ 100 31Dissolved Silver µg/L 100 5 180 0.5 U 1 U 0.5 U 1 U 0.5 U 1 U 0.5 U 1 U 1 U 0.5 U 1 UDissolved Sodium µg/L -- -- 260,000 240,000 260,000 240,000 190,000 279,000 130,000 164,000 213,000 360,000 119,000Dissolved Thallium µg/L 2.0 2.4 2 U 1 U 2 U 1 U 2 U 0.03 UJ 2 U 1 U 1 U 2 U 1 UDissolved Thorium µg/L -- -- 2 U NA 2 U NA 2 U NA 2 U NA NA 2 U NADissolved Uranium µg/L 30 7.3 8.5 NA 8.5 NA 1.6 NA 2.9 NA NA 5.3 NADissolved Vanadium µg/L -- 36 4.4 6.4 4.4 6.4 4 U 0.71 UJ 3.5 J 8.1 505 85 45Dissolved Zinc µg/L 5,000 5 11,000 4.2 J 5.4 J 4.2 J 5.4 J 5 U 2.5 5 U 7.5 J 6 J 4.6 J 4.9 JpH <6.5 or >8.5 5 -- 7.3 7.79 7.3 7.79 7.58 7.35 NA 7.7 9.25 7.87 7.74Conductivity mS/cm -- -- 2.72 1.58 2.72 1.58 1.21 2.49 NA 10.7 0.831 3.16 1.34
Page 6 of 12
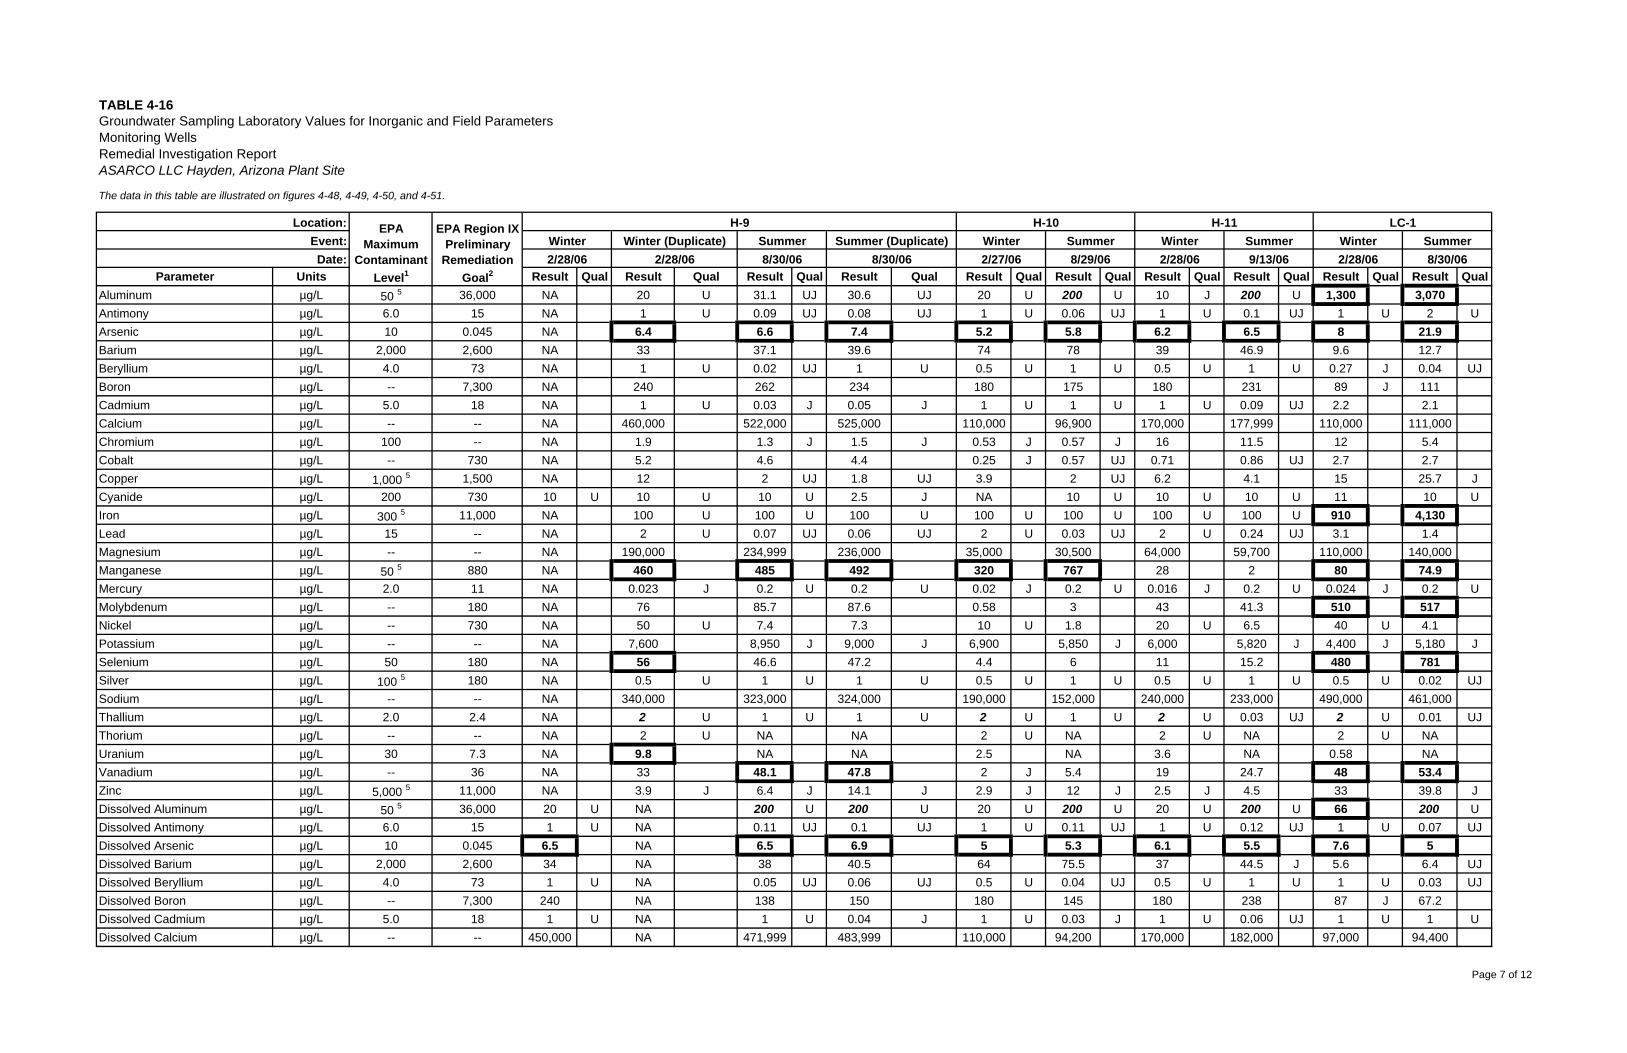
TABLE 4-16Groundwater Sampling Laboratory Values for Inorganic and Field ParametersMonitoring WellsRemedial Investigation ReportASARCO LLC Hayden, Arizona Plant Site
The data in this table are illustrated on figures 4-48, 4-49, 4-50, and 4-51.
Parameter Units Result Qual Result Qual Result Qual Result Qual Result Qual Result Qual Result Qual Result Qual Result Qual Result QualAluminum µg/L 50 5 36,000 NA 20 U 31.1 UJ 30.6 UJ 20 U 200 U 10 J 200 U 1,300 3,070Antimony µg/L 6.0 15 NA 1 U 0.09 UJ 0.08 UJ 1 U 0.06 UJ 1 U 0.1 UJ 1 U 2 UArsenic µg/L 10 0.045 NA 6.4 6.6 7.4 5.2 5.8 6.2 6.5 8 21.9Barium µg/L 2,000 2,600 NA 33 37.1 39.6 74 78 39 46.9 9.6 12.7Beryllium µg/L 4.0 73 NA 1 U 0.02 UJ 1 U 0.5 U 1 U 0.5 U 1 U 0.27 J 0.04 UJBoron µg/L -- 7,300 NA 240 262 234 180 175 180 231 89 J 111Cadmium µg/L 5.0 18 NA 1 U 0.03 J 0.05 J 1 U 1 U 1 U 0.09 UJ 2.2 2.1Calcium µg/L -- -- NA 460,000 522,000 525,000 110,000 96,900 170,000 177,999 110,000 111,000Chromium µg/L 100 -- NA 1.9 1.3 J 1.5 J 0.53 J 0.57 J 16 11.5 12 5.4Cobalt µg/L -- 730 NA 5.2 4.6 4.4 0.25 J 0.57 UJ 0.71 0.86 UJ 2.7 2.7Copper µg/L 1,000 5 1,500 NA 12 2 UJ 1.8 UJ 3.9 2 UJ 6.2 4.1 15 25.7 JCyanide µg/L 200 730 10 U 10 U 10 U 2.5 J NA 10 U 10 U 10 U 11 10 UIron µg/L 300 5 11,000 NA 100 U 100 U 100 U 100 U 100 U 100 U 100 U 910 4,130Lead µg/L 15 -- NA 2 U 0.07 UJ 0.06 UJ 2 U 0.03 UJ 2 U 0.24 UJ 3.1 1.4Magnesium µg/L -- -- NA 190,000 234,999 236,000 35,000 30,500 64,000 59,700 110,000 140,000Manganese µg/L 50 5 880 NA 460 485 492 320 767 28 2 80 74.9Mercury µg/L 2.0 11 NA 0.023 J 0.2 U 0.2 U 0.02 J 0.2 U 0.016 J 0.2 U 0.024 J 0.2 UMolybdenum µg/L -- 180 NA 76 85.7 87.6 0.58 3 43 41.3 510 517Nickel µg/L -- 730 NA 50 U 7.4 7.3 10 U 1.8 20 U 6.5 40 U 4.1Potassium µg/L -- -- NA 7,600 8,950 J 9,000 J 6,900 5,850 J 6,000 5,820 J 4,400 J 5,180 JSelenium µg/L 50 180 NA 56 46.6 47.2 4.4 6 11 15.2 480 781Silver µg/L 100 5 180 NA 0.5 U 1 U 1 U 0.5 U 1 U 0.5 U 1 U 0.5 U 0.02 UJSodium µg/L -- -- NA 340,000 323,000 324,000 190,000 152,000 240,000 233,000 490,000 461,000Thallium µg/L 2.0 2.4 NA 2 U 1 U 1 U 2 U 1 U 2 U 0.03 UJ 2 U 0.01 UJThorium µg/L -- -- NA 2 U NA NA 2 U NA 2 U NA 2 U NAUranium µg/L 30 7.3 NA 9.8 NA NA 2.5 NA 3.6 NA 0.58 NAVanadium µg/L -- 36 NA 33 48.1 47.8 2 J 5.4 19 24.7 48 53.4Zinc µg/L 5,000 5 11,000 NA 3.9 J 6.4 J 14.1 J 2.9 J 12 J 2.5 J 4.5 33 39.8 JDissolved Aluminum µg/L 50 5 36,000 20 U NA 200 U 200 U 20 U 200 U 20 U 200 U 66 200 UDissolved Antimony µg/L 6.0 15 1 U NA 0.11 UJ 0.1 UJ 1 U 0.11 UJ 1 U 0.12 UJ 1 U 0.07 UJDissolved Arsenic µg/L 10 0.045 6.5 NA 6.5 6.9 5 5.3 6.1 5.5 7.6 5Dissolved Barium µg/L 2,000 2,600 34 NA 38 40.5 64 75.5 37 44.5 J 5.6 6.4 UJDissolved Beryllium µg/L 4.0 73 1 U NA 0.05 UJ 0.06 UJ 0.5 U 0.04 UJ 0.5 U 1 U 1 U 0.03 UJDissolved Boron µg/L -- 7,300 240 NA 138 150 180 145 180 238 87 J 67.2Dissolved Cadmium µg/L 5.0 18 1 U NA 1 U 0.04 J 1 U 0.03 J 1 U 0.06 UJ 1 U 1 UDissolved Calcium µg/L -- -- 450,000 NA 471,999 483,999 110,000 94,200 170,000 182,000 97,000 94,400
2/28/06
H-10 H-11H-9Location: EPAMaximum
ContaminantLevel1
LC-1
8/30/06Winter Summer
2/27/06 8/29/06 2/28/06 9/13/06Winter Summer Winter Summer
EPA Region IXPreliminary
RemediationGoal2
Event:Date:
Winter Winter (Duplicate) Summer Summer (Duplicate)2/28/06 2/28/06 8/30/06 8/30/06
Page 7 of 12
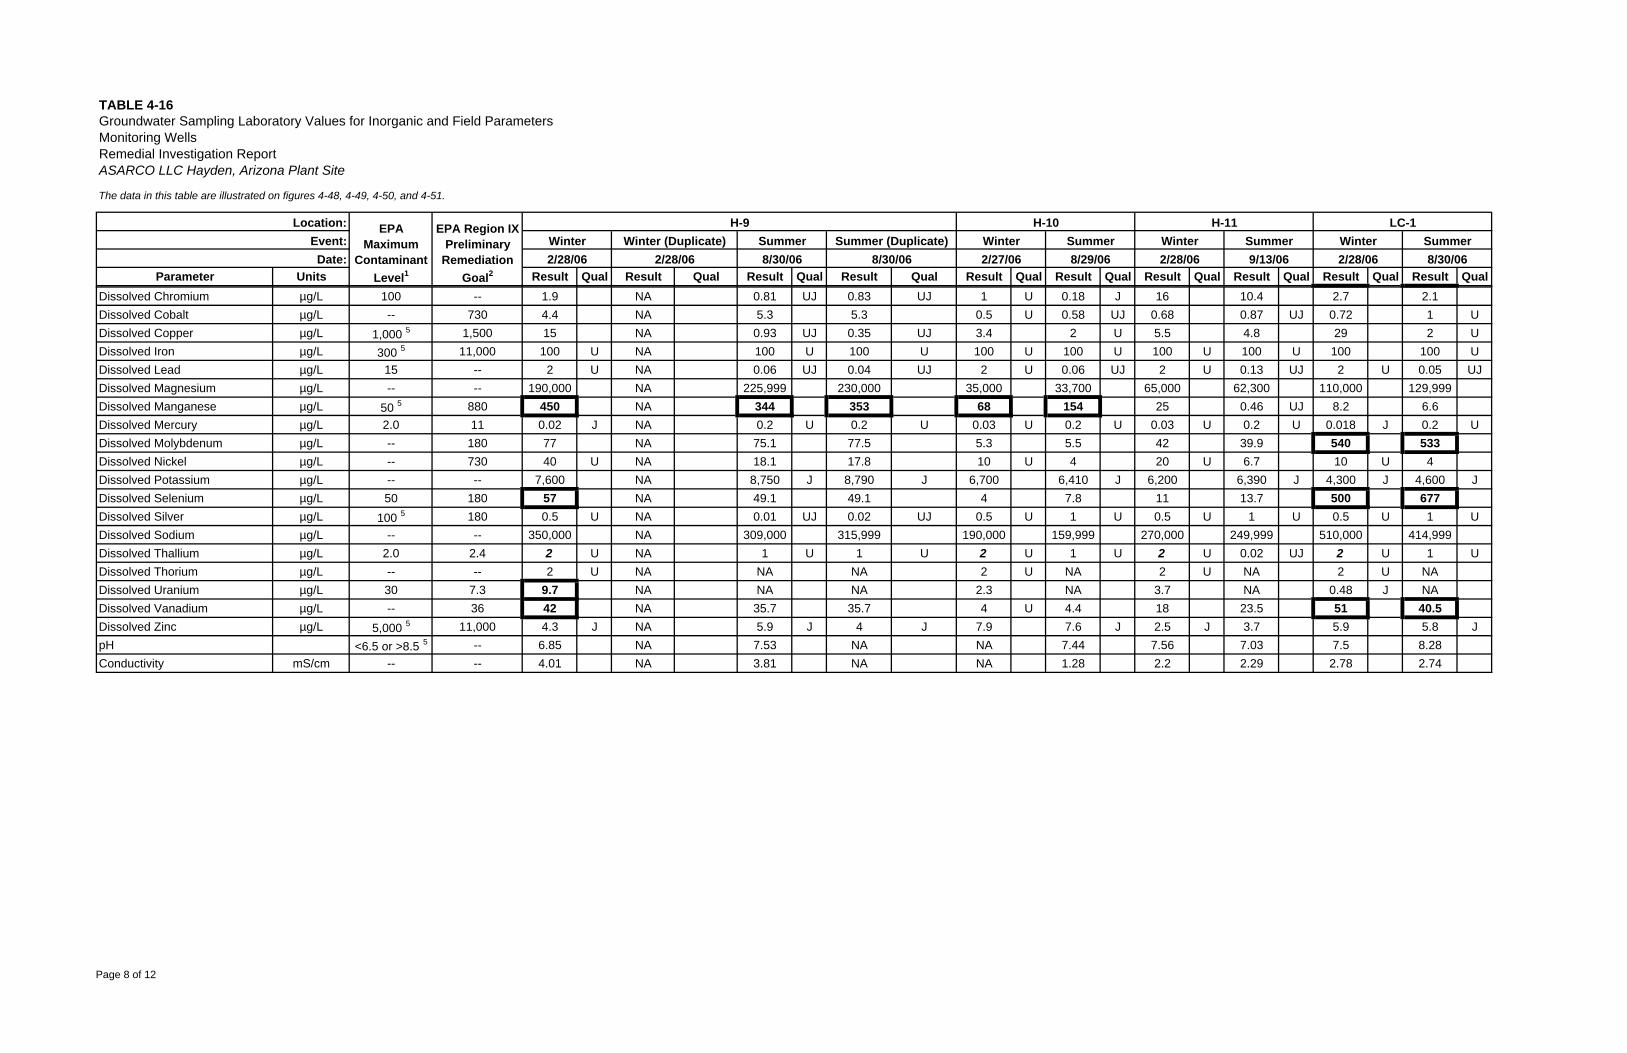
TABLE 4-16Groundwater Sampling Laboratory Values for Inorganic and Field ParametersMonitoring WellsRemedial Investigation ReportASARCO LLC Hayden, Arizona Plant Site
The data in this table are illustrated on figures 4-48, 4-49, 4-50, and 4-51.
Parameter Units Result Qual Result Qual Result Qual Result Qual Result Qual Result Qual Result Qual Result Qual Result Qual Result Qual2/28/06
H-10 H-11H-9Location: EPAMaximum
ContaminantLevel1
LC-1
8/30/06Winter Summer
2/27/06 8/29/06 2/28/06 9/13/06Winter Summer Winter Summer
EPA Region IXPreliminary
RemediationGoal2
Event:Date:
Winter Winter (Duplicate) Summer Summer (Duplicate)2/28/06 2/28/06 8/30/06 8/30/06
Dissolved Chromium µg/L 100 -- 1.9 NA 0.81 UJ 0.83 UJ 1 U 0.18 J 16 10.4 2.7 2.1Dissolved Cobalt µg/L -- 730 4.4 NA 5.3 5.3 0.5 U 0.58 UJ 0.68 0.87 UJ 0.72 1 UDissolved Copper µg/L 1,000 5 1,500 15 NA 0.93 UJ 0.35 UJ 3.4 2 U 5.5 4.8 29 2 UDissolved Iron µg/L 300 5 11,000 100 U NA 100 U 100 U 100 U 100 U 100 U 100 U 100 100 UDissolved Lead µg/L 15 -- 2 U NA 0.06 UJ 0.04 UJ 2 U 0.06 UJ 2 U 0.13 UJ 2 U 0.05 UJDissolved Magnesium µg/L -- -- 190,000 NA 225,999 230,000 35,000 33,700 65,000 62,300 110,000 129,999Dissolved Manganese µg/L 50 5 880 450 NA 344 353 68 154 25 0.46 UJ 8.2 6.6Dissolved Mercury µg/L 2.0 11 0.02 J NA 0.2 U 0.2 U 0.03 U 0.2 U 0.03 U 0.2 U 0.018 J 0.2 UDissolved Molybdenum µg/L -- 180 77 NA 75.1 77.5 5.3 5.5 42 39.9 540 533Dissolved Nickel µg/L -- 730 40 U NA 18.1 17.8 10 U 4 20 U 6.7 10 U 4Dissolved Potassium µg/L -- -- 7,600 NA 8,750 J 8,790 J 6,700 6,410 J 6,200 6,390 J 4,300 J 4,600 JDissolved Selenium µg/L 50 180 57 NA 49.1 49.1 4 7.8 11 13.7 500 677Dissolved Silver µg/L 100 5 180 0.5 U NA 0.01 UJ 0.02 UJ 0.5 U 1 U 0.5 U 1 U 0.5 U 1 UDissolved Sodium µg/L -- -- 350,000 NA 309,000 315,999 190,000 159,999 270,000 249,999 510,000 414,999Dissolved Thallium µg/L 2.0 2.4 2 U NA 1 U 1 U 2 U 1 U 2 U 0.02 UJ 2 U 1 UDissolved Thorium µg/L -- -- 2 U NA NA NA 2 U NA 2 U NA 2 U NADissolved Uranium µg/L 30 7.3 9.7 NA NA NA 2.3 NA 3.7 NA 0.48 J NADissolved Vanadium µg/L -- 36 42 NA 35.7 35.7 4 U 4.4 18 23.5 51 40.5Dissolved Zinc µg/L 5,000 5 11,000 4.3 J NA 5.9 J 4 J 7.9 7.6 J 2.5 J 3.7 5.9 5.8 JpH <6.5 or >8.5 5 -- 6.85 NA 7.53 NA NA 7.44 7.56 7.03 7.5 8.28Conductivity mS/cm -- -- 4.01 NA 3.81 NA NA 1.28 2.2 2.29 2.78 2.74
Page 8 of 12
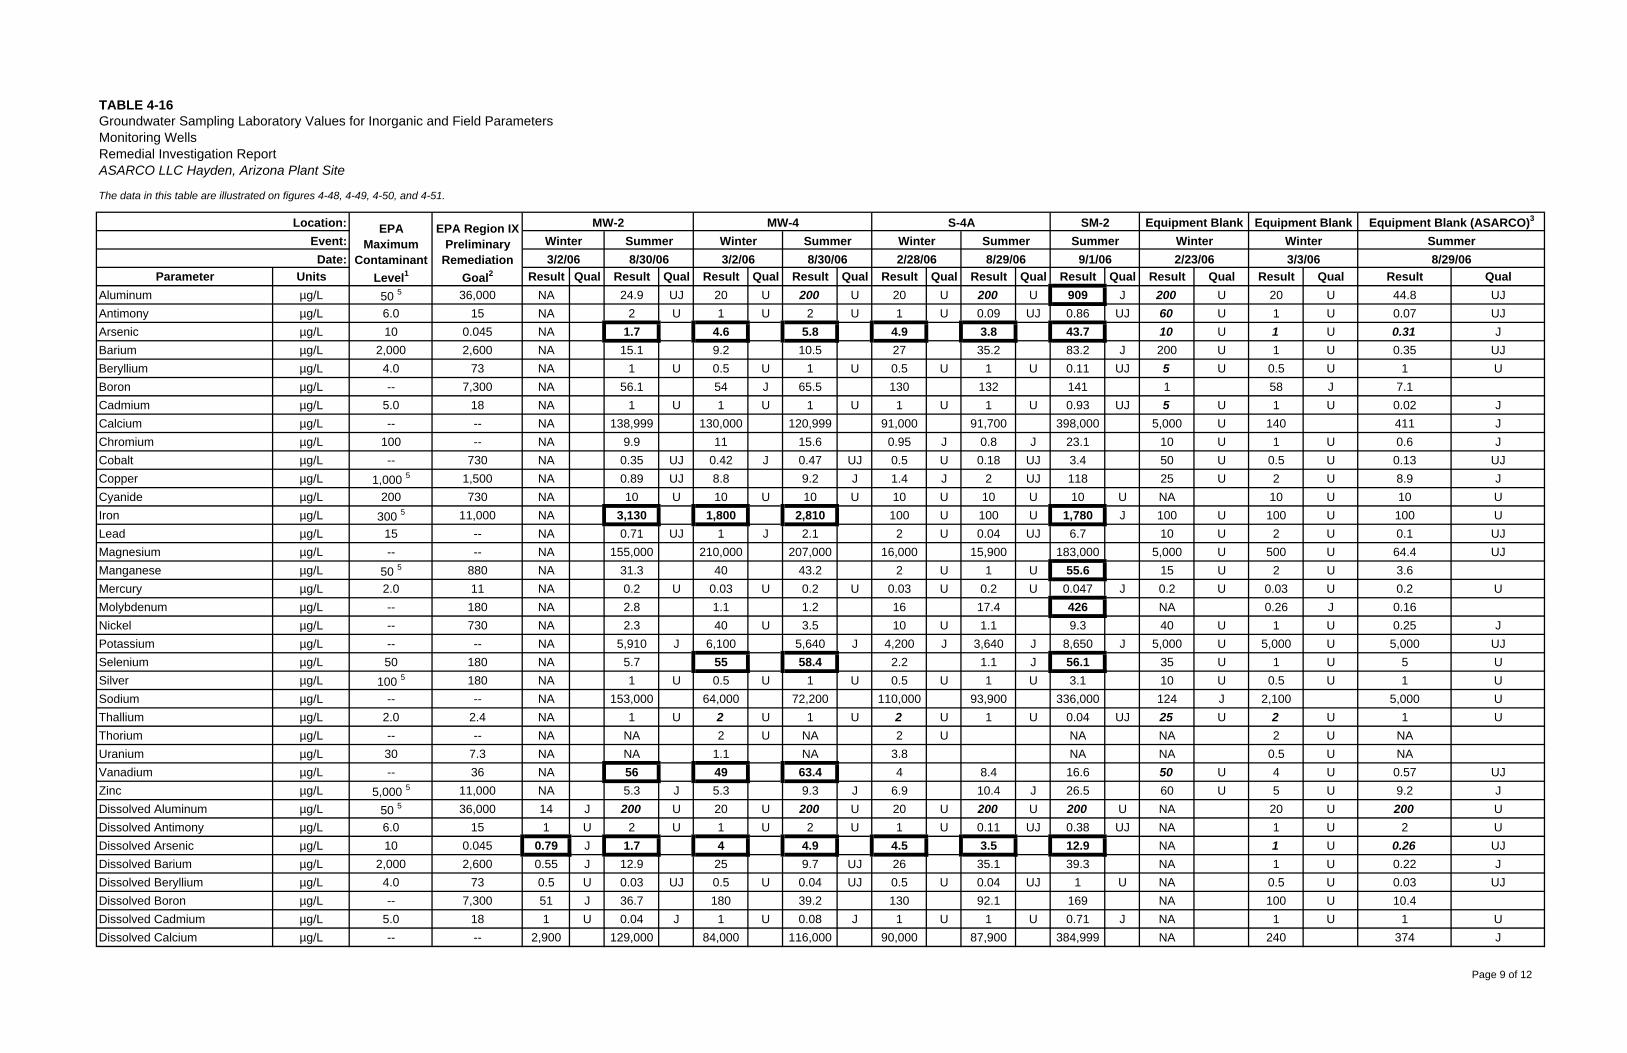
TABLE 4-16Groundwater Sampling Laboratory Values for Inorganic and Field ParametersMonitoring WellsRemedial Investigation ReportASARCO LLC Hayden, Arizona Plant Site
The data in this table are illustrated on figures 4-48, 4-49, 4-50, and 4-51.
Parameter Units Result Qual Result Qual Result Qual Result Qual Result Qual Result Qual Result Qual Result Qual Result Qual Result QualAluminum µg/L 50 5 36,000 NA 24.9 UJ 20 U 200 U 20 U 200 U 909 J 200 U 20 U 44.8 UJAntimony µg/L 6.0 15 NA 2 U 1 U 2 U 1 U 0.09 UJ 0.86 UJ 60 U 1 U 0.07 UJArsenic µg/L 10 0.045 NA 1.7 4.6 5.8 4.9 3.8 43.7 10 U 1 U 0.31 JBarium µg/L 2,000 2,600 NA 15.1 9.2 10.5 27 35.2 83.2 J 200 U 1 U 0.35 UJBeryllium µg/L 4.0 73 NA 1 U 0.5 U 1 U 0.5 U 1 U 0.11 UJ 5 U 0.5 U 1 UBoron µg/L -- 7,300 NA 56.1 54 J 65.5 130 132 141 1 58 J 7.1Cadmium µg/L 5.0 18 NA 1 U 1 U 1 U 1 U 1 U 0.93 UJ 5 U 1 U 0.02 JCalcium µg/L -- -- NA 138,999 130,000 120,999 91,000 91,700 398,000 5,000 U 140 411 JChromium µg/L 100 -- NA 9.9 11 15.6 0.95 J 0.8 J 23.1 10 U 1 U 0.6 JCobalt µg/L -- 730 NA 0.35 UJ 0.42 J 0.47 UJ 0.5 U 0.18 UJ 3.4 50 U 0.5 U 0.13 UJCopper µg/L 1,000 5 1,500 NA 0.89 UJ 8.8 9.2 J 1.4 J 2 UJ 118 25 U 2 U 8.9 JCyanide µg/L 200 730 NA 10 U 10 U 10 U 10 U 10 U 10 U NA 10 U 10 UIron µg/L 300 5 11,000 NA 3,130 1,800 2,810 100 U 100 U 1,780 J 100 U 100 U 100 ULead µg/L 15 -- NA 0.71 UJ 1 J 2.1 2 U 0.04 UJ 6.7 10 U 2 U 0.1 UJMagnesium µg/L -- -- NA 155,000 210,000 207,000 16,000 15,900 183,000 5,000 U 500 U 64.4 UJManganese µg/L 50 5 880 NA 31.3 40 43.2 2 U 1 U 55.6 15 U 2 U 3.6Mercury µg/L 2.0 11 NA 0.2 U 0.03 U 0.2 U 0.03 U 0.2 U 0.047 J 0.2 U 0.03 U 0.2 UMolybdenum µg/L -- 180 NA 2.8 1.1 1.2 16 17.4 426 NA 0.26 J 0.16Nickel µg/L -- 730 NA 2.3 40 U 3.5 10 U 1.1 9.3 40 U 1 U 0.25 JPotassium µg/L -- -- NA 5,910 J 6,100 5,640 J 4,200 J 3,640 J 8,650 J 5,000 U 5,000 U 5,000 UJSelenium µg/L 50 180 NA 5.7 55 58.4 2.2 1.1 J 56.1 35 U 1 U 5 USilver µg/L 100 5 180 NA 1 U 0.5 U 1 U 0.5 U 1 U 3.1 10 U 0.5 U 1 USodium µg/L -- -- NA 153,000 64,000 72,200 110,000 93,900 336,000 124 J 2,100 5,000 UThallium µg/L 2.0 2.4 NA 1 U 2 U 1 U 2 U 1 U 0.04 UJ 25 U 2 U 1 UThorium µg/L -- -- NA NA 2 U NA 2 U NA NA 2 U NAUranium µg/L 30 7.3 NA NA 1.1 NA 3.8 NA NA 0.5 U NAVanadium µg/L -- 36 NA 56 49 63.4 4 8.4 16.6 50 U 4 U 0.57 UJZinc µg/L 5,000 5 11,000 NA 5.3 J 5.3 9.3 J 6.9 10.4 J 26.5 60 U 5 U 9.2 JDissolved Aluminum µg/L 50 5 36,000 14 J 200 U 20 U 200 U 20 U 200 U 200 U NA 20 U 200 UDissolved Antimony µg/L 6.0 15 1 U 2 U 1 U 2 U 1 U 0.11 UJ 0.38 UJ NA 1 U 2 UDissolved Arsenic µg/L 10 0.045 0.79 J 1.7 4 4.9 4.5 3.5 12.9 NA 1 U 0.26 UJDissolved Barium µg/L 2,000 2,600 0.55 J 12.9 25 9.7 UJ 26 35.1 39.3 NA 1 U 0.22 JDissolved Beryllium µg/L 4.0 73 0.5 U 0.03 UJ 0.5 U 0.04 UJ 0.5 U 0.04 UJ 1 U NA 0.5 U 0.03 UJDissolved Boron µg/L -- 7,300 51 J 36.7 180 39.2 130 92.1 169 NA 100 U 10.4Dissolved Cadmium µg/L 5.0 18 1 U 0.04 J 1 U 0.08 J 1 U 1 U 0.71 J NA 1 U 1 UDissolved Calcium µg/L -- -- 2,900 129,000 84,000 116,000 90,000 87,900 384,999 NA 240 374 J
3/3/06WinterWinter
SM-2Summer
9/1/06
Equipment Blank
2/23/06 8/29/06
Equipment Blank (ASARCO)3
SummerEquipment BlankMW-4
3/2/06 8/30/063/2/06 8/30/06SummerWinter Summer Winter
MW-2EPAMaximum
ContaminantLevel1
Event:Date:
S-4AWinter Summer2/28/06 8/29/06
Location: EPA Region IXPreliminary
RemediationGoal2
Page 9 of 12
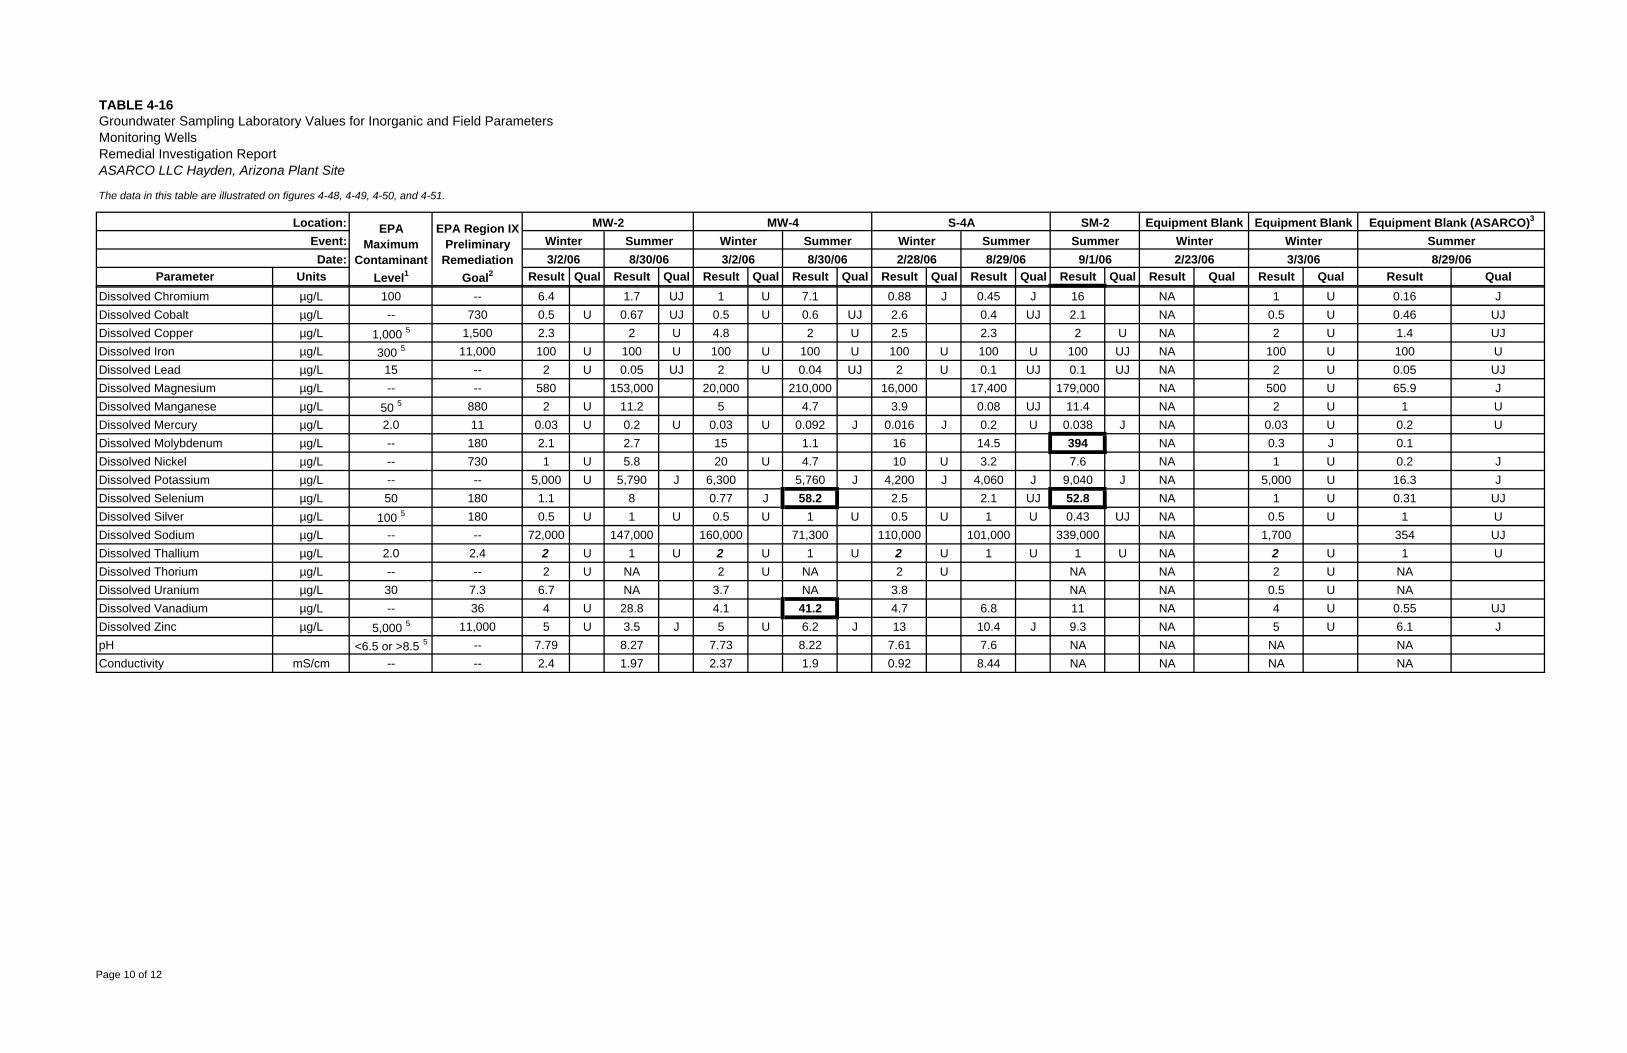
TABLE 4-16Groundwater Sampling Laboratory Values for Inorganic and Field ParametersMonitoring WellsRemedial Investigation ReportASARCO LLC Hayden, Arizona Plant Site
The data in this table are illustrated on figures 4-48, 4-49, 4-50, and 4-51.
Parameter Units Result Qual Result Qual Result Qual Result Qual Result Qual Result Qual Result Qual Result Qual Result Qual Result Qual3/3/06WinterWinter
SM-2Summer
9/1/06
Equipment Blank
2/23/06 8/29/06
Equipment Blank (ASARCO)3
SummerEquipment BlankMW-4
3/2/06 8/30/063/2/06 8/30/06SummerWinter Summer Winter
MW-2EPAMaximum
ContaminantLevel1
Event:Date:
S-4AWinter Summer2/28/06 8/29/06
Location: EPA Region IXPreliminary
RemediationGoal2
Dissolved Chromium µg/L 100 -- 6.4 1.7 UJ 1 U 7.1 0.88 J 0.45 J 16 NA 1 U 0.16 JDissolved Cobalt µg/L -- 730 0.5 U 0.67 UJ 0.5 U 0.6 UJ 2.6 0.4 UJ 2.1 NA 0.5 U 0.46 UJDissolved Copper µg/L 1,000 5 1,500 2.3 2 U 4.8 2 U 2.5 2.3 2 U NA 2 U 1.4 UJDissolved Iron µg/L 300 5 11,000 100 U 100 U 100 U 100 U 100 U 100 U 100 UJ NA 100 U 100 UDissolved Lead µg/L 15 -- 2 U 0.05 UJ 2 U 0.04 UJ 2 U 0.1 UJ 0.1 UJ NA 2 U 0.05 UJDissolved Magnesium µg/L -- -- 580 153,000 20,000 210,000 16,000 17,400 179,000 NA 500 U 65.9 JDissolved Manganese µg/L 50 5 880 2 U 11.2 5 4.7 3.9 0.08 UJ 11.4 NA 2 U 1 UDissolved Mercury µg/L 2.0 11 0.03 U 0.2 U 0.03 U 0.092 J 0.016 J 0.2 U 0.038 J NA 0.03 U 0.2 UDissolved Molybdenum µg/L -- 180 2.1 2.7 15 1.1 16 14.5 394 NA 0.3 J 0.1Dissolved Nickel µg/L -- 730 1 U 5.8 20 U 4.7 10 U 3.2 7.6 NA 1 U 0.2 JDissolved Potassium µg/L -- -- 5,000 U 5,790 J 6,300 5,760 J 4,200 J 4,060 J 9,040 J NA 5,000 U 16.3 JDissolved Selenium µg/L 50 180 1.1 8 0.77 J 58.2 2.5 2.1 UJ 52.8 NA 1 U 0.31 UJDissolved Silver µg/L 100 5 180 0.5 U 1 U 0.5 U 1 U 0.5 U 1 U 0.43 UJ NA 0.5 U 1 UDissolved Sodium µg/L -- -- 72,000 147,000 160,000 71,300 110,000 101,000 339,000 NA 1,700 354 UJDissolved Thallium µg/L 2.0 2.4 2 U 1 U 2 U 1 U 2 U 1 U 1 U NA 2 U 1 UDissolved Thorium µg/L -- -- 2 U NA 2 U NA 2 U NA NA 2 U NADissolved Uranium µg/L 30 7.3 6.7 NA 3.7 NA 3.8 NA NA 0.5 U NADissolved Vanadium µg/L -- 36 4 U 28.8 4.1 41.2 4.7 6.8 11 NA 4 U 0.55 UJDissolved Zinc µg/L 5,000 5 11,000 5 U 3.5 J 5 U 6.2 J 13 10.4 J 9.3 NA 5 U 6.1 JpH <6.5 or >8.5 5 -- 7.79 8.27 7.73 8.22 7.61 7.6 NA NA NA NAConductivity mS/cm -- -- 2.4 1.97 2.37 1.9 0.92 8.44 NA NA NA NA
Page 10 of 12
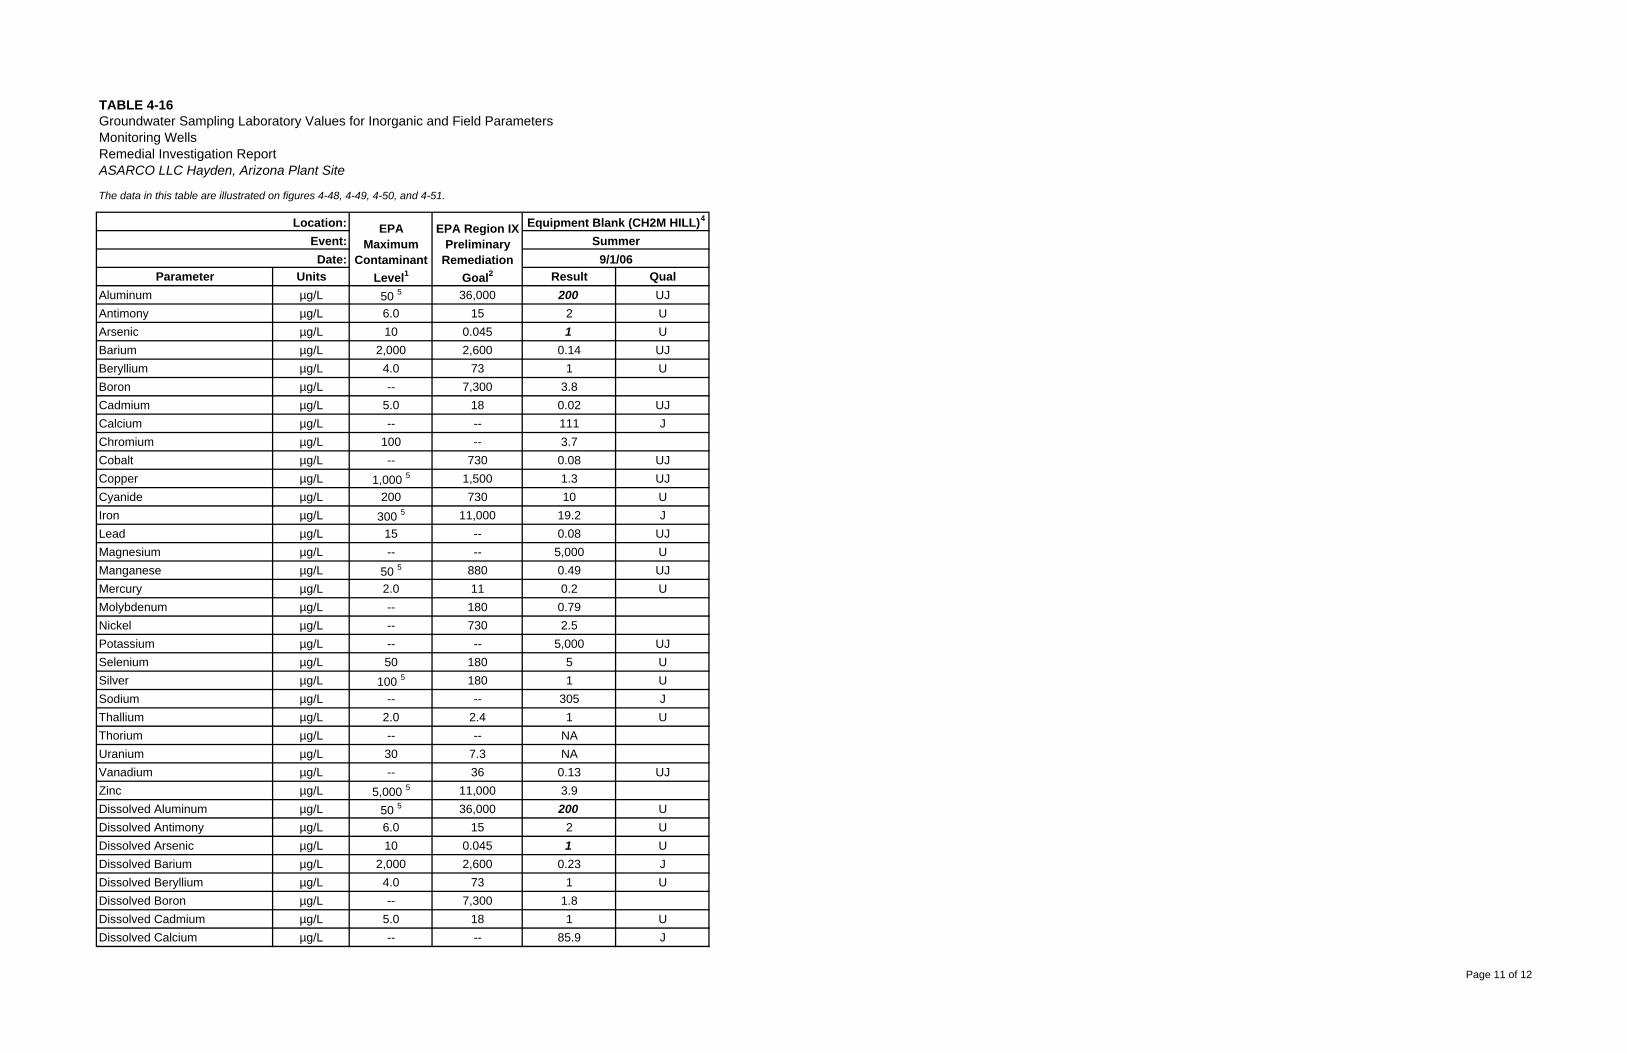
TABLE 4-16Groundwater Sampling Laboratory Values for Inorganic and Field ParametersMonitoring WellsRemedial Investigation ReportASARCO LLC Hayden, Arizona Plant Site
The data in this table are illustrated on figures 4-48, 4-49, 4-50, and 4-51.
Parameter Units Result QualAluminum µg/L 50 5 36,000 200 UJAntimony µg/L 6.0 15 2 UArsenic µg/L 10 0.045 1 UBarium µg/L 2,000 2,600 0.14 UJBeryllium µg/L 4.0 73 1 UBoron µg/L -- 7,300 3.8Cadmium µg/L 5.0 18 0.02 UJCalcium µg/L -- -- 111 JChromium µg/L 100 -- 3.7Cobalt µg/L -- 730 0.08 UJCopper µg/L 1,000 5 1,500 1.3 UJCyanide µg/L 200 730 10 UIron µg/L 300 5 11,000 19.2 JLead µg/L 15 -- 0.08 UJMagnesium µg/L -- -- 5,000 UManganese µg/L 50 5 880 0.49 UJMercury µg/L 2.0 11 0.2 UMolybdenum µg/L -- 180 0.79Nickel µg/L -- 730 2.5Potassium µg/L -- -- 5,000 UJSelenium µg/L 50 180 5 USilver µg/L 100 5 180 1 USodium µg/L -- -- 305 JThallium µg/L 2.0 2.4 1 UThorium µg/L -- -- NAUranium µg/L 30 7.3 NAVanadium µg/L -- 36 0.13 UJZinc µg/L 5,000 5 11,000 3.9Dissolved Aluminum µg/L 50 5 36,000 200 UDissolved Antimony µg/L 6.0 15 2 UDissolved Arsenic µg/L 10 0.045 1 UDissolved Barium µg/L 2,000 2,600 0.23 JDissolved Beryllium µg/L 4.0 73 1 UDissolved Boron µg/L -- 7,300 1.8Dissolved Cadmium µg/L 5.0 18 1 UDissolved Calcium µg/L -- -- 85.9 J
9/1/06Summer
Location: EPAMaximum
ContaminantLevel1
EPA Region IXPreliminary
RemediationGoal2
Event:Date:
Equipment Blank (CH2M HILL)4
Page 11 of 12

TABLE 4-16Groundwater Sampling Laboratory Values for Inorganic and Field ParametersMonitoring WellsRemedial Investigation ReportASARCO LLC Hayden, Arizona Plant Site
The data in this table are illustrated on figures 4-48, 4-49, 4-50, and 4-51.
Parameter Units Result Qual9/1/06
SummerLocation: EPA
MaximumContaminant
Level1
EPA Region IXPreliminary
RemediationGoal2
Event:Date:
Equipment Blank (CH2M HILL)4
Dissolved Chromium µg/L 100 -- 1.4 UJDissolved Cobalt µg/L -- 730 0.02 UJDissolved Copper µg/L 1,000 5 1,500 1.4 UJDissolved Iron µg/L 300 5 11,000 100 UJDissolved Lead µg/L 15 -- 0.06 UJDissolved Magnesium µg/L -- -- 5,000 UDissolved Manganese µg/L 50 5 880 0.25 JDissolved Mercury µg/L 2.0 11 0.038 JDissolved Molybdenum µg/L -- 180 0.32Dissolved Nickel µg/L -- 730 0.56 JDissolved Potassium µg/L -- -- 5,000 UJDissolved Selenium µg/L 50 180 5 UDissolved Silver µg/L 100 5 180 1 UDissolved Sodium µg/L -- -- 432 JDissolved Thallium µg/L 2.0 2.4 1 UDissolved Thorium µg/L -- -- NADissolved Uranium µg/L 30 7.3 NADissolved Vanadium µg/L -- 36 0.09 UJDissolved Zinc µg/L 5,000 5 11,000 2.7pH <6.5 or >8.5 5 -- NAConductivity mS/cm -- -- NA
Table Notes:1 EPA Maximum Contaminant Level, EPA 816-F-03-016, June 20032 EPA Region IX Preliminary Remediation Goals, Tap Water, October 2004
5 Secondary MCL6 Bold values with bold outline exceed one or more of the comparison criteria.
8 -- = Not established9 J = Estimated value10 mS/cm = millisiemens per centimeter11 NA = Not analyzed12 U = Not detected; reporting limit is shown in place of a result.13 µg/L = micrograms per Liter14 UJ = Not detected; reporting limit is approximate and is shown in place of a result.
3 Equipment blank taken from ASARCO sampling equipment.4 Equipment blank taken from CH2M HILL sampling equipment.
7 Bold italicized values have detection limits above one or more of the comparison criteria.
Page 12 of 12
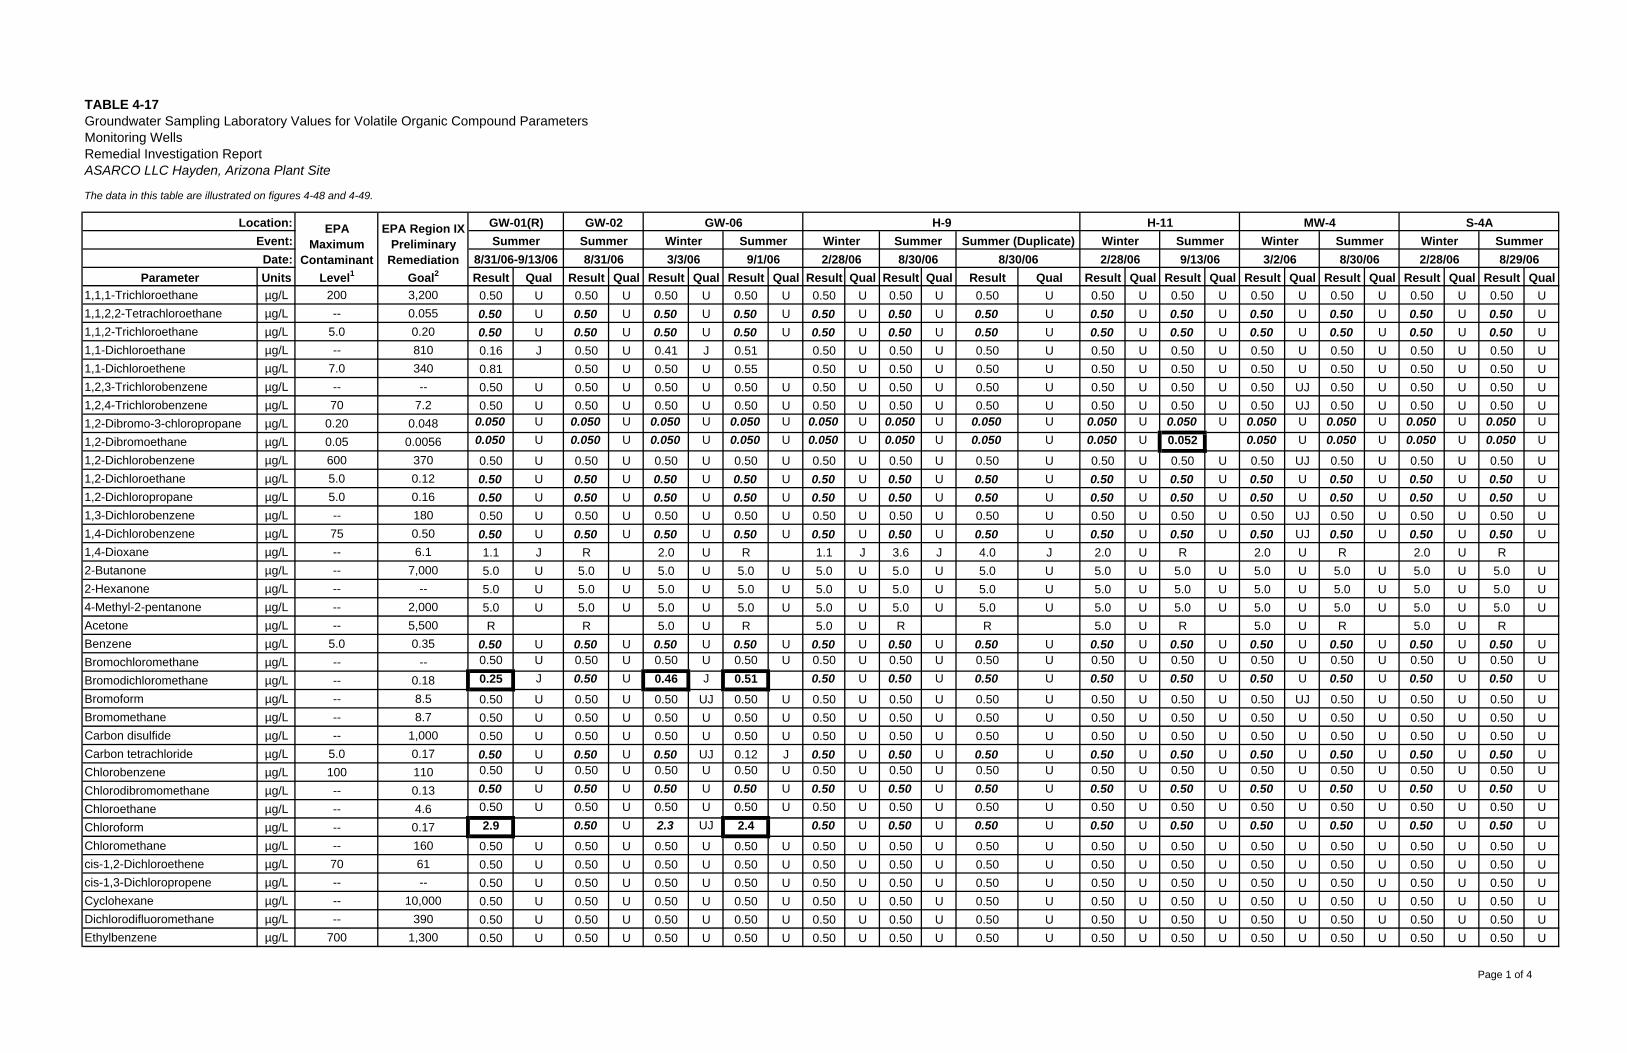
TABLE 4-17Groundwater Sampling Laboratory Values for Volatile Organic Compound ParametersMonitoring WellsRemedial Investigation ReportASARCO LLC Hayden, Arizona Plant Site
The data in this table are illustrated on figures 4-48 and 4-49.
Parameter Units Result Qual Result Qual Result Qual Result Qual Result Qual Result Qual Result Qual Result Qual Result Qual Result Qual Result Qual Result Qual Result Qual1,1,1-Trichloroethane µg/L 200 3,200 0.50 U 0.50 U 0.50 U 0.50 U 0.50 U 0.50 U 0.50 U 0.50 U 0.50 U 0.50 U 0.50 U 0.50 U 0.50 U1,1,2,2-Tetrachloroethane µg/L -- 0.055 0.50 U 0.50 U 0.50 U 0.50 U 0.50 U 0.50 U 0.50 U 0.50 U 0.50 U 0.50 U 0.50 U 0.50 U 0.50 U1,1,2-Trichloroethane µg/L 5.0 0.20 0.50 U 0.50 U 0.50 U 0.50 U 0.50 U 0.50 U 0.50 U 0.50 U 0.50 U 0.50 U 0.50 U 0.50 U 0.50 U1,1-Dichloroethane µg/L -- 810 0.16 J 0.50 U 0.41 J 0.51 0.50 U 0.50 U 0.50 U 0.50 U 0.50 U 0.50 U 0.50 U 0.50 U 0.50 U1,1-Dichloroethene µg/L 7.0 340 0.81 0.50 U 0.50 U 0.55 0.50 U 0.50 U 0.50 U 0.50 U 0.50 U 0.50 U 0.50 U 0.50 U 0.50 U1,2,3-Trichlorobenzene µg/L -- -- 0.50 U 0.50 U 0.50 U 0.50 U 0.50 U 0.50 U 0.50 U 0.50 U 0.50 U 0.50 UJ 0.50 U 0.50 U 0.50 U1,2,4-Trichlorobenzene µg/L 70 7.2 0.50 U 0.50 U 0.50 U 0.50 U 0.50 U 0.50 U 0.50 U 0.50 U 0.50 U 0.50 UJ 0.50 U 0.50 U 0.50 U1,2-Dibromo-3-chloropropane µg/L 0.20 0.048 0.050 U 0.050 U 0.050 U 0.050 U 0.050 U 0.050 U 0.050 U 0.050 U 0.050 U 0.050 U 0.050 U 0.050 U 0.050 U
1,2-Dibromoethane µg/L 0.05 0.0056 0.050 U 0.050 U 0.050 U 0.050 U 0.050 U 0.050 U 0.050 U 0.050 U 0.052 0.050 U 0.050 U 0.050 U 0.050 U
1,2-Dichlorobenzene µg/L 600 370 0.50 U 0.50 U 0.50 U 0.50 U 0.50 U 0.50 U 0.50 U 0.50 U 0.50 U 0.50 UJ 0.50 U 0.50 U 0.50 U1,2-Dichloroethane µg/L 5.0 0.12 0.50 U 0.50 U 0.50 U 0.50 U 0.50 U 0.50 U 0.50 U 0.50 U 0.50 U 0.50 U 0.50 U 0.50 U 0.50 U1,2-Dichloropropane µg/L 5.0 0.16 0.50 U 0.50 U 0.50 U 0.50 U 0.50 U 0.50 U 0.50 U 0.50 U 0.50 U 0.50 U 0.50 U 0.50 U 0.50 U1,3-Dichlorobenzene µg/L -- 180 0.50 U 0.50 U 0.50 U 0.50 U 0.50 U 0.50 U 0.50 U 0.50 U 0.50 U 0.50 UJ 0.50 U 0.50 U 0.50 U1,4-Dichlorobenzene µg/L 75 0.50 0.50 U 0.50 U 0.50 U 0.50 U 0.50 U 0.50 U 0.50 U 0.50 U 0.50 U 0.50 UJ 0.50 U 0.50 U 0.50 U1,4-Dioxane µg/L -- 6.1 1.1 J R 2.0 U R 1.1 J 3.6 J 4.0 J 2.0 U R 2.0 U R 2.0 U R2-Butanone µg/L -- 7,000 5.0 U 5.0 U 5.0 U 5.0 U 5.0 U 5.0 U 5.0 U 5.0 U 5.0 U 5.0 U 5.0 U 5.0 U 5.0 U2-Hexanone µg/L -- -- 5.0 U 5.0 U 5.0 U 5.0 U 5.0 U 5.0 U 5.0 U 5.0 U 5.0 U 5.0 U 5.0 U 5.0 U 5.0 U4-Methyl-2-pentanone µg/L -- 2,000 5.0 U 5.0 U 5.0 U 5.0 U 5.0 U 5.0 U 5.0 U 5.0 U 5.0 U 5.0 U 5.0 U 5.0 U 5.0 UAcetone µg/L -- 5,500 R R 5.0 U R 5.0 U R R 5.0 U R 5.0 U R 5.0 U RBenzene µg/L 5.0 0.35 0.50 U 0.50 U 0.50 U 0.50 U 0.50 U 0.50 U 0.50 U 0.50 U 0.50 U 0.50 U 0.50 U 0.50 U 0.50 UBromochloromethane µg/L -- -- 0.50 U 0.50 U 0.50 U 0.50 U 0.50 U 0.50 U 0.50 U 0.50 U 0.50 U 0.50 U 0.50 U 0.50 U 0.50 U
Bromodichloromethane µg/L -- 0.18 0.25 J 0.50 U 0.46 J 0.51 0.50 U 0.50 U 0.50 U 0.50 U 0.50 U 0.50 U 0.50 U 0.50 U 0.50 U
Bromoform µg/L -- 8.5 0.50 U 0.50 U 0.50 UJ 0.50 U 0.50 U 0.50 U 0.50 U 0.50 U 0.50 U 0.50 UJ 0.50 U 0.50 U 0.50 UBromomethane µg/L -- 8.7 0.50 U 0.50 U 0.50 U 0.50 U 0.50 U 0.50 U 0.50 U 0.50 U 0.50 U 0.50 U 0.50 U 0.50 U 0.50 UCarbon disulfide µg/L -- 1,000 0.50 U 0.50 U 0.50 U 0.50 U 0.50 U 0.50 U 0.50 U 0.50 U 0.50 U 0.50 U 0.50 U 0.50 U 0.50 UCarbon tetrachloride µg/L 5.0 0.17 0.50 U 0.50 U 0.50 UJ 0.12 J 0.50 U 0.50 U 0.50 U 0.50 U 0.50 U 0.50 U 0.50 U 0.50 U 0.50 UChlorobenzene µg/L 100 110 0.50 U 0.50 U 0.50 U 0.50 U 0.50 U 0.50 U 0.50 U 0.50 U 0.50 U 0.50 U 0.50 U 0.50 U 0.50 U
Chlorodibromomethane µg/L -- 0.13 0.50 U 0.50 U 0.50 U 0.50 U 0.50 U 0.50 U 0.50 U 0.50 U 0.50 U 0.50 U 0.50 U 0.50 U 0.50 U
Chloroethane µg/L -- 4.6 0.50 U 0.50 U 0.50 U 0.50 U 0.50 U 0.50 U 0.50 U 0.50 U 0.50 U 0.50 U 0.50 U 0.50 U 0.50 U
Chloroform µg/L -- 0.17 2.9 0.50 U 2.3 UJ 2.4 0.50 U 0.50 U 0.50 U 0.50 U 0.50 U 0.50 U 0.50 U 0.50 U 0.50 U
Chloromethane µg/L -- 160 0.50 U 0.50 U 0.50 U 0.50 U 0.50 U 0.50 U 0.50 U 0.50 U 0.50 U 0.50 U 0.50 U 0.50 U 0.50 Ucis-1,2-Dichloroethene µg/L 70 61 0.50 U 0.50 U 0.50 U 0.50 U 0.50 U 0.50 U 0.50 U 0.50 U 0.50 U 0.50 U 0.50 U 0.50 U 0.50 Ucis-1,3-Dichloropropene µg/L -- -- 0.50 U 0.50 U 0.50 U 0.50 U 0.50 U 0.50 U 0.50 U 0.50 U 0.50 U 0.50 U 0.50 U 0.50 U 0.50 UCyclohexane µg/L -- 10,000 0.50 U 0.50 U 0.50 U 0.50 U 0.50 U 0.50 U 0.50 U 0.50 U 0.50 U 0.50 U 0.50 U 0.50 U 0.50 UDichlorodifluoromethane µg/L -- 390 0.50 U 0.50 U 0.50 U 0.50 U 0.50 U 0.50 U 0.50 U 0.50 U 0.50 U 0.50 U 0.50 U 0.50 U 0.50 UEthylbenzene µg/L 700 1,300 0.50 U 0.50 U 0.50 U 0.50 U 0.50 U 0.50 U 0.50 U 0.50 U 0.50 U 0.50 U 0.50 U 0.50 U 0.50 U
S-4AWinter Summer2/28/06 8/29/068/31/06 3/2/068/30/06
WinterSummer (Duplicate)3/3/06 2/28/06 9/13/069/1/06
Summer Winter SummerGW-02 GW-06
Date:
Location:Event:
GW-01(R)EPAMaximum
ContaminantLevel1
EPA Region IXPreliminary
RemediationGoal2
8/31/06-9/13/06Summer SummerWinter
8/30/06 8/30/06
H-11H-9Summer
2/28/06Summer
MW-4Winter
Page 1 of 4
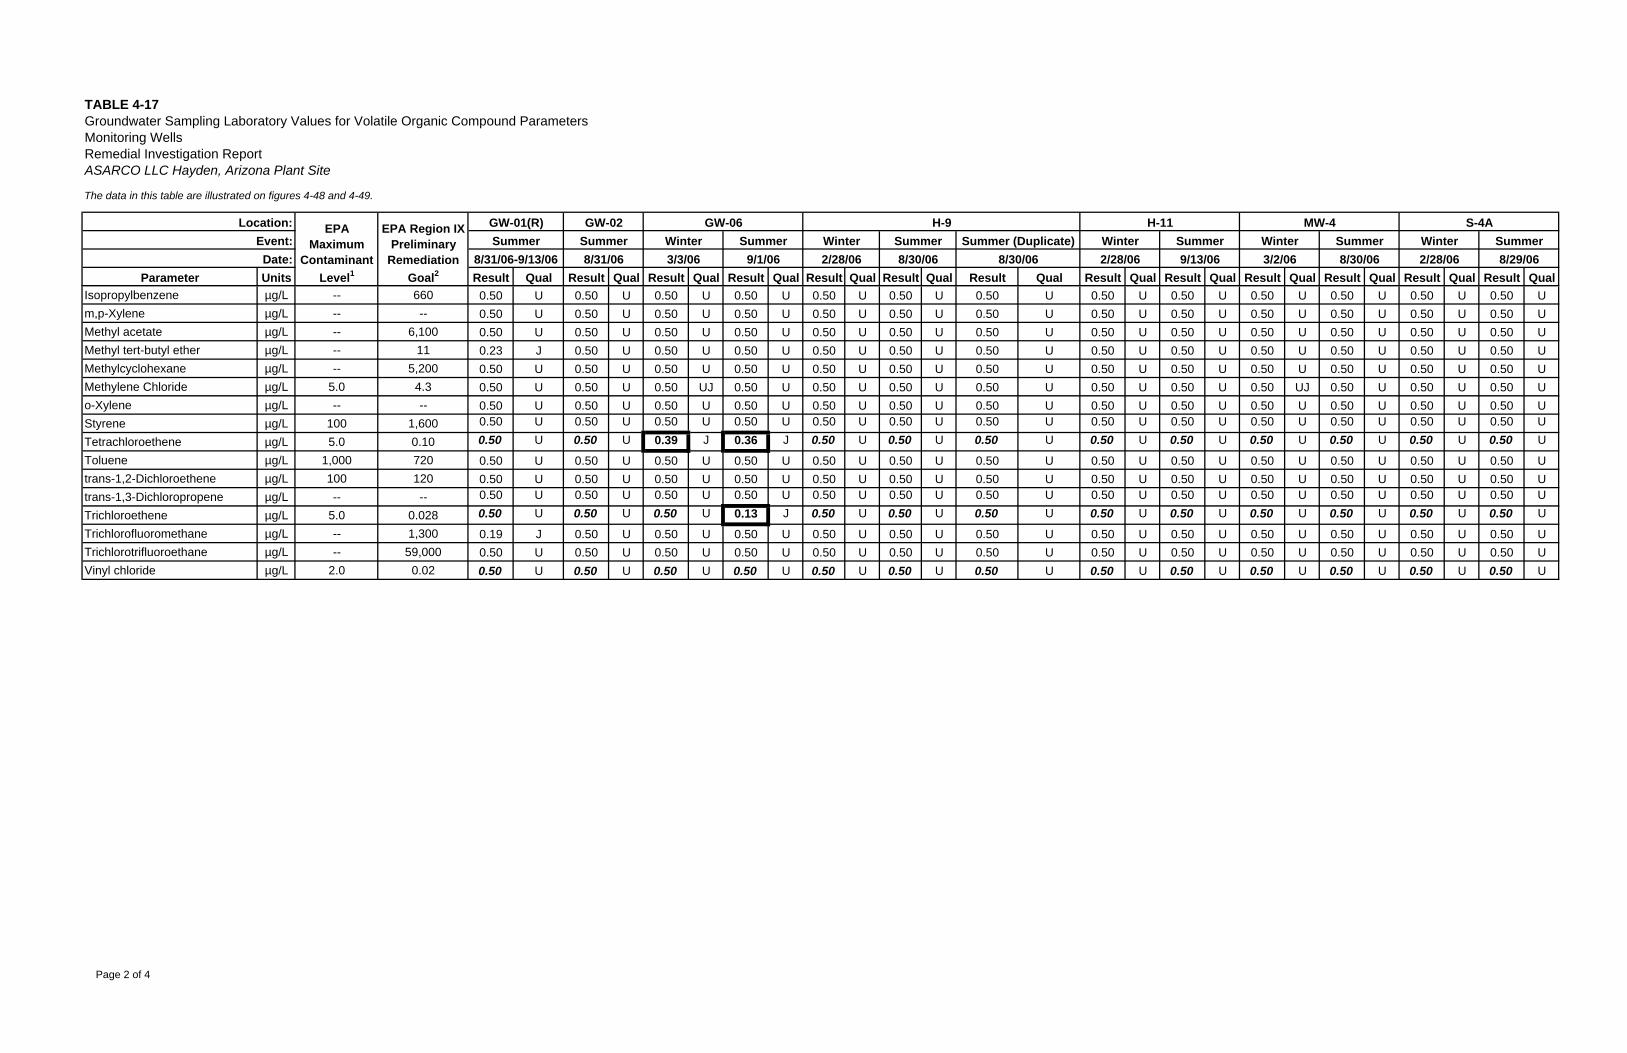
TABLE 4-17Groundwater Sampling Laboratory Values for Volatile Organic Compound ParametersMonitoring WellsRemedial Investigation ReportASARCO LLC Hayden, Arizona Plant Site
The data in this table are illustrated on figures 4-48 and 4-49.
Parameter Units Result Qual Result Qual Result Qual Result Qual Result Qual Result Qual Result Qual Result Qual Result Qual Result Qual Result Qual Result Qual Result Qual
S-4AWinter Summer2/28/06 8/29/068/31/06 3/2/068/30/06
WinterSummer (Duplicate)3/3/06 2/28/06 9/13/069/1/06
Summer Winter SummerGW-02 GW-06
Date:
Location:Event:
GW-01(R)EPAMaximum
ContaminantLevel1
EPA Region IXPreliminary
RemediationGoal2
8/31/06-9/13/06Summer SummerWinter
8/30/06 8/30/06
H-11H-9Summer
2/28/06Summer
MW-4Winter
Isopropylbenzene µg/L -- 660 0.50 U 0.50 U 0.50 U 0.50 U 0.50 U 0.50 U 0.50 U 0.50 U 0.50 U 0.50 U 0.50 U 0.50 U 0.50 Um,p-Xylene µg/L -- -- 0.50 U 0.50 U 0.50 U 0.50 U 0.50 U 0.50 U 0.50 U 0.50 U 0.50 U 0.50 U 0.50 U 0.50 U 0.50 UMethyl acetate µg/L -- 6,100 0.50 U 0.50 U 0.50 U 0.50 U 0.50 U 0.50 U 0.50 U 0.50 U 0.50 U 0.50 U 0.50 U 0.50 U 0.50 UMethyl tert-butyl ether µg/L -- 11 0.23 J 0.50 U 0.50 U 0.50 U 0.50 U 0.50 U 0.50 U 0.50 U 0.50 U 0.50 U 0.50 U 0.50 U 0.50 UMethylcyclohexane µg/L -- 5,200 0.50 U 0.50 U 0.50 U 0.50 U 0.50 U 0.50 U 0.50 U 0.50 U 0.50 U 0.50 U 0.50 U 0.50 U 0.50 UMethylene Chloride µg/L 5.0 4.3 0.50 U 0.50 U 0.50 UJ 0.50 U 0.50 U 0.50 U 0.50 U 0.50 U 0.50 U 0.50 UJ 0.50 U 0.50 U 0.50 Uo-Xylene µg/L -- -- 0.50 U 0.50 U 0.50 U 0.50 U 0.50 U 0.50 U 0.50 U 0.50 U 0.50 U 0.50 U 0.50 U 0.50 U 0.50 UStyrene µg/L 100 1,600 0.50 U 0.50 U 0.50 U 0.50 U 0.50 U 0.50 U 0.50 U 0.50 U 0.50 U 0.50 U 0.50 U 0.50 U 0.50 U
Tetrachloroethene µg/L 5.0 0.10 0.50 U 0.50 U 0.39 J 0.36 J 0.50 U 0.50 U 0.50 U 0.50 U 0.50 U 0.50 U 0.50 U 0.50 U 0.50 U
Toluene µg/L 1,000 720 0.50 U 0.50 U 0.50 U 0.50 U 0.50 U 0.50 U 0.50 U 0.50 U 0.50 U 0.50 U 0.50 U 0.50 U 0.50 Utrans-1,2-Dichloroethene µg/L 100 120 0.50 U 0.50 U 0.50 U 0.50 U 0.50 U 0.50 U 0.50 U 0.50 U 0.50 U 0.50 U 0.50 U 0.50 U 0.50 Utrans-1,3-Dichloropropene µg/L -- -- 0.50 U 0.50 U 0.50 U 0.50 U 0.50 U 0.50 U 0.50 U 0.50 U 0.50 U 0.50 U 0.50 U 0.50 U 0.50 U
Trichloroethene µg/L 5.0 0.028 0.50 U 0.50 U 0.50 U 0.13 J 0.50 U 0.50 U 0.50 U 0.50 U 0.50 U 0.50 U 0.50 U 0.50 U 0.50 U
Trichlorofluoromethane µg/L -- 1,300 0.19 J 0.50 U 0.50 U 0.50 U 0.50 U 0.50 U 0.50 U 0.50 U 0.50 U 0.50 U 0.50 U 0.50 U 0.50 UTrichlorotrifluoroethane µg/L -- 59,000 0.50 U 0.50 U 0.50 U 0.50 U 0.50 U 0.50 U 0.50 U 0.50 U 0.50 U 0.50 U 0.50 U 0.50 U 0.50 UVinyl chloride µg/L 2.0 0.02 0.50 U 0.50 U 0.50 U 0.50 U 0.50 U 0.50 U 0.50 U 0.50 U 0.50 U 0.50 U 0.50 U 0.50 U 0.50 U
Page 2 of 4
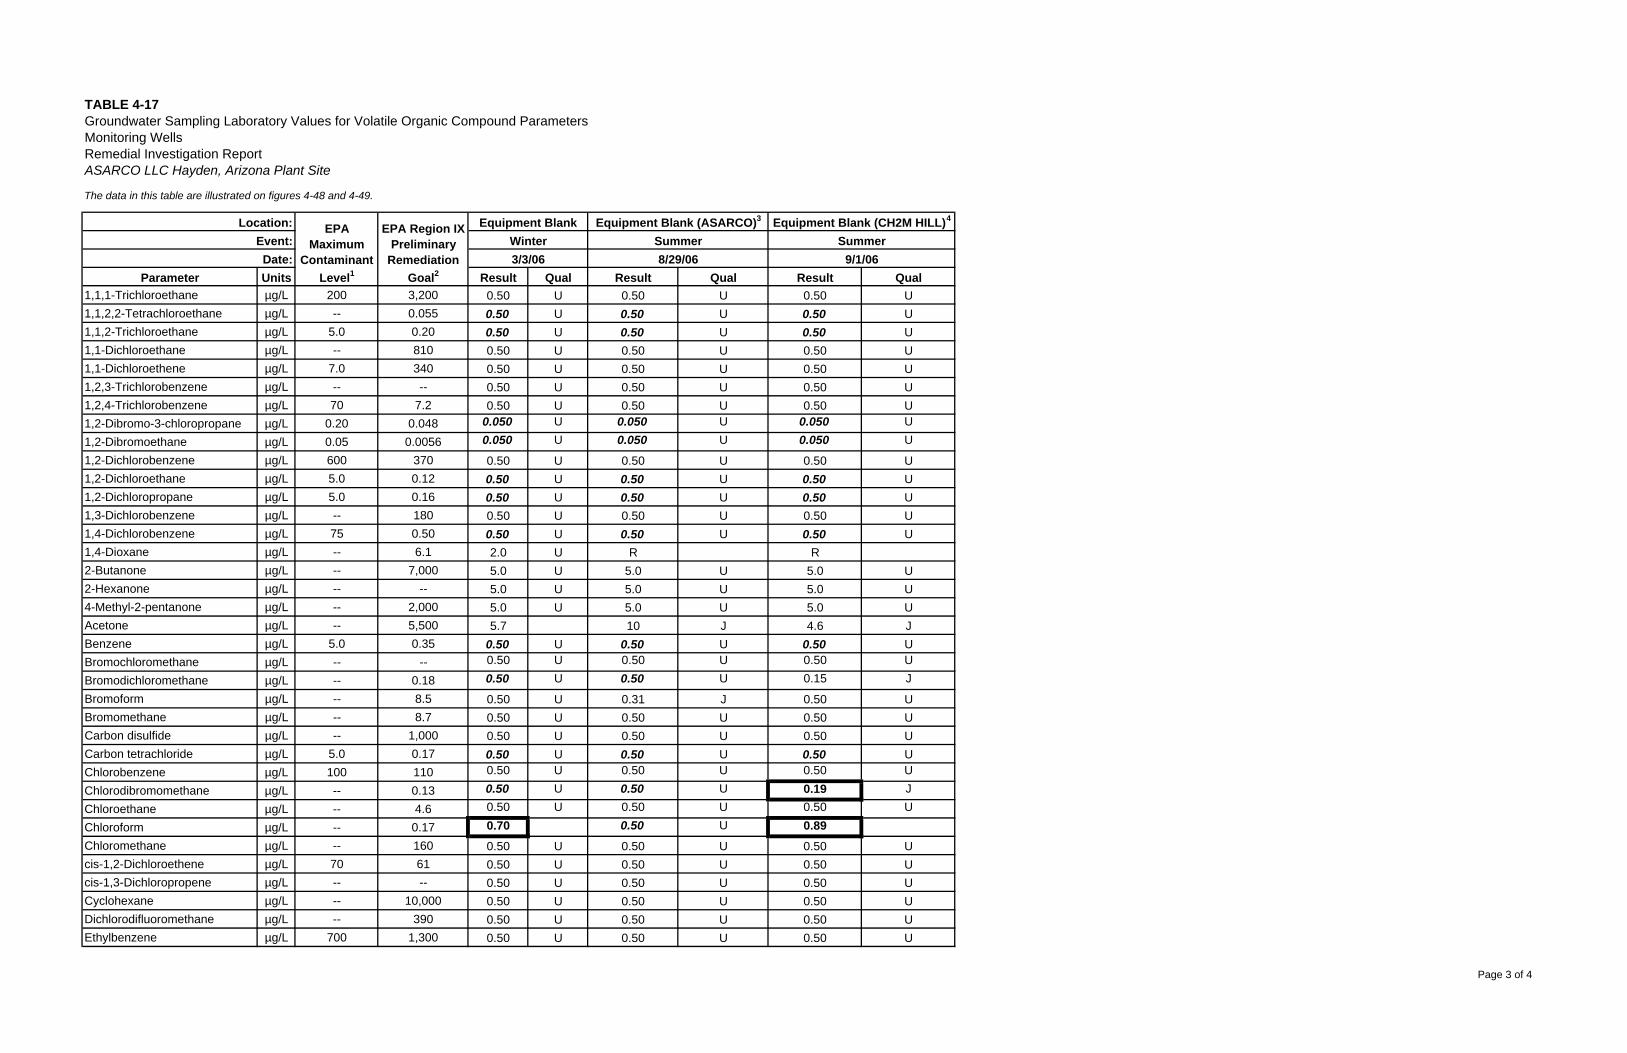
TABLE 4-17Groundwater Sampling Laboratory Values for Volatile Organic Compound ParametersMonitoring WellsRemedial Investigation ReportASARCO LLC Hayden, Arizona Plant Site
The data in this table are illustrated on figures 4-48 and 4-49.
Parameter Units Result Qual Result Qual Result Qual1,1,1-Trichloroethane µg/L 200 3,200 0.50 U 0.50 U 0.50 U1,1,2,2-Tetrachloroethane µg/L -- 0.055 0.50 U 0.50 U 0.50 U1,1,2-Trichloroethane µg/L 5.0 0.20 0.50 U 0.50 U 0.50 U1,1-Dichloroethane µg/L -- 810 0.50 U 0.50 U 0.50 U1,1-Dichloroethene µg/L 7.0 340 0.50 U 0.50 U 0.50 U1,2,3-Trichlorobenzene µg/L -- -- 0.50 U 0.50 U 0.50 U1,2,4-Trichlorobenzene µg/L 70 7.2 0.50 U 0.50 U 0.50 U1,2-Dibromo-3-chloropropane µg/L 0.20 0.048 0.050 U 0.050 U 0.050 U
1,2-Dibromoethane µg/L 0.05 0.0056 0.050 U 0.050 U 0.050 U
1,2-Dichlorobenzene µg/L 600 370 0.50 U 0.50 U 0.50 U1,2-Dichloroethane µg/L 5.0 0.12 0.50 U 0.50 U 0.50 U1,2-Dichloropropane µg/L 5.0 0.16 0.50 U 0.50 U 0.50 U1,3-Dichlorobenzene µg/L -- 180 0.50 U 0.50 U 0.50 U1,4-Dichlorobenzene µg/L 75 0.50 0.50 U 0.50 U 0.50 U1,4-Dioxane µg/L -- 6.1 2.0 U R R2-Butanone µg/L -- 7,000 5.0 U 5.0 U 5.0 U2-Hexanone µg/L -- -- 5.0 U 5.0 U 5.0 U4-Methyl-2-pentanone µg/L -- 2,000 5.0 U 5.0 U 5.0 UAcetone µg/L -- 5,500 5.7 10 J 4.6 JBenzene µg/L 5.0 0.35 0.50 U 0.50 U 0.50 UBromochloromethane µg/L -- -- 0.50 U 0.50 U 0.50 U
Bromodichloromethane µg/L -- 0.18 0.50 U 0.50 U 0.15 J
Bromoform µg/L -- 8.5 0.50 U 0.31 J 0.50 UBromomethane µg/L -- 8.7 0.50 U 0.50 U 0.50 UCarbon disulfide µg/L -- 1,000 0.50 U 0.50 U 0.50 UCarbon tetrachloride µg/L 5.0 0.17 0.50 U 0.50 U 0.50 UChlorobenzene µg/L 100 110 0.50 U 0.50 U 0.50 U
Chlorodibromomethane µg/L -- 0.13 0.50 U 0.50 U 0.19 J
Chloroethane µg/L -- 4.6 0.50 U 0.50 U 0.50 U
Chloroform µg/L -- 0.17 0.70 0.50 U 0.89Chloromethane µg/L -- 160 0.50 U 0.50 U 0.50 Ucis-1,2-Dichloroethene µg/L 70 61 0.50 U 0.50 U 0.50 Ucis-1,3-Dichloropropene µg/L -- -- 0.50 U 0.50 U 0.50 UCyclohexane µg/L -- 10,000 0.50 U 0.50 U 0.50 UDichlorodifluoromethane µg/L -- 390 0.50 U 0.50 U 0.50 UEthylbenzene µg/L 700 1,300 0.50 U 0.50 U 0.50 U
Location: EPAMaximum
ContaminantLevel1
EPA Region IXPreliminary
RemediationGoal2
Event:Date: 8/29/06 9/1/06
Equipment Blank Equipment Blank (ASARCO)3 Equipment Blank (CH2M HILL)4
Winter Summer Summer3/3/06
Page 3 of 4
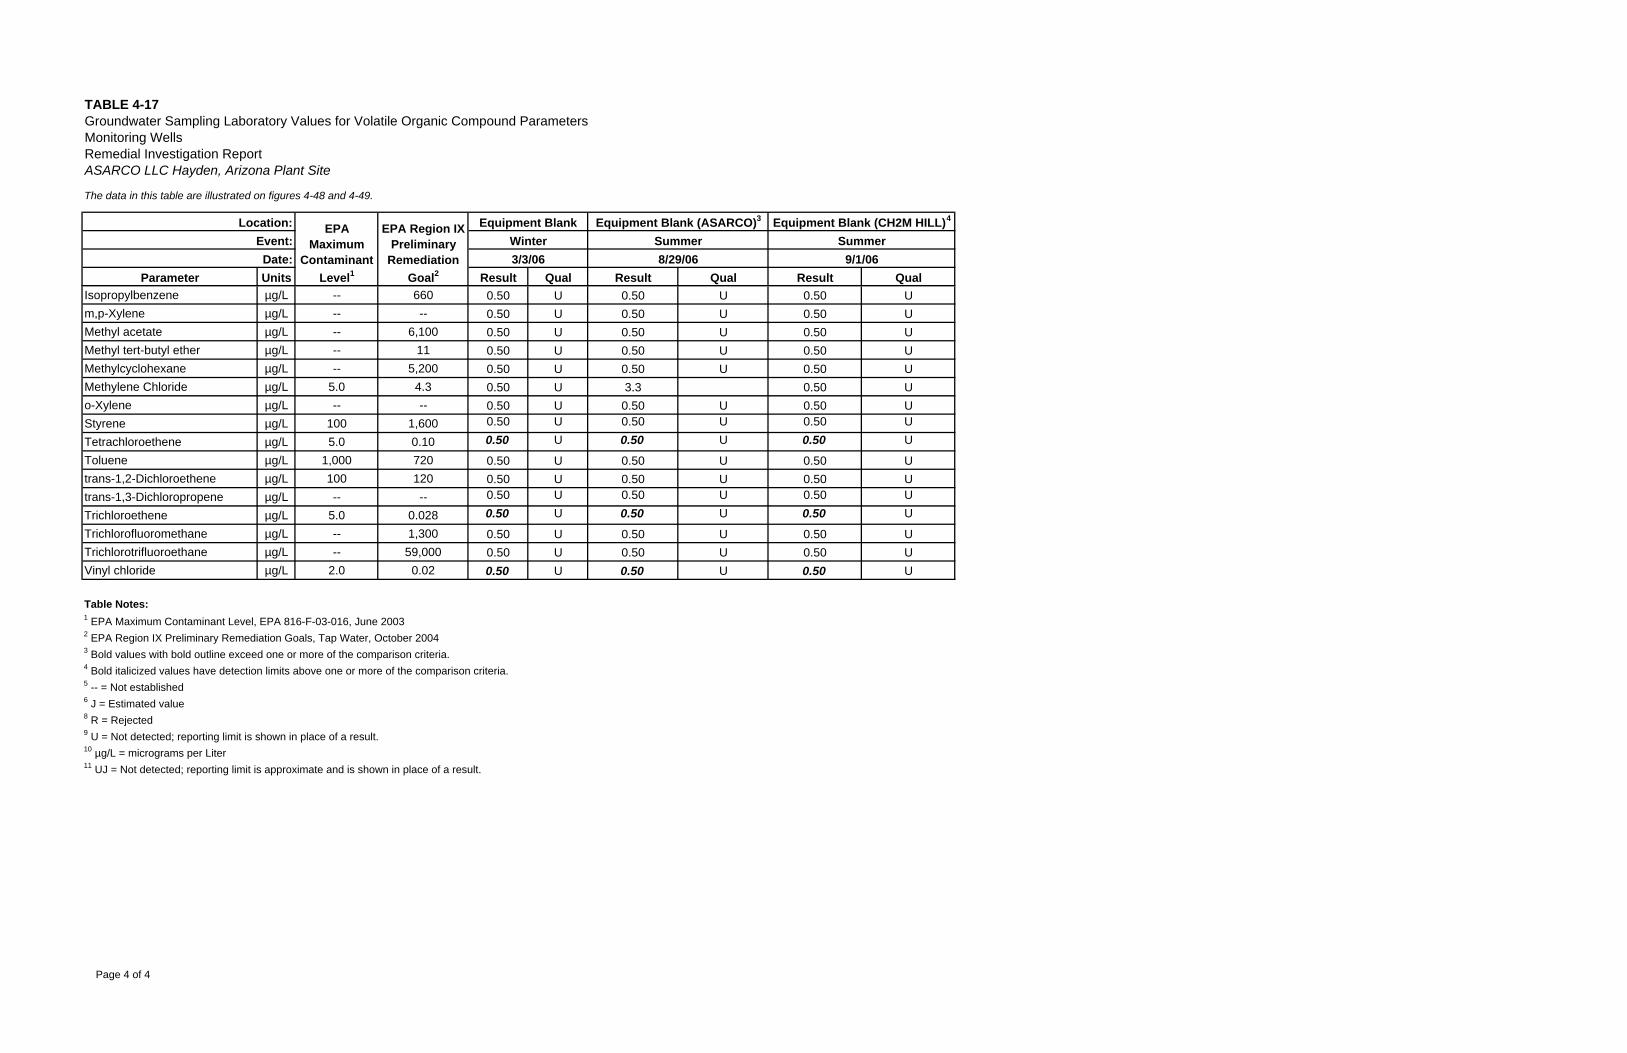
TABLE 4-17Groundwater Sampling Laboratory Values for Volatile Organic Compound ParametersMonitoring WellsRemedial Investigation ReportASARCO LLC Hayden, Arizona Plant Site
The data in this table are illustrated on figures 4-48 and 4-49.
Parameter Units Result Qual Result Qual Result Qual
Location: EPAMaximum
ContaminantLevel1
EPA Region IXPreliminary
RemediationGoal2
Event:Date: 8/29/06 9/1/06
Equipment Blank Equipment Blank (ASARCO)3 Equipment Blank (CH2M HILL)4
Winter Summer Summer3/3/06
Isopropylbenzene µg/L -- 660 0.50 U 0.50 U 0.50 Um,p-Xylene µg/L -- -- 0.50 U 0.50 U 0.50 UMethyl acetate µg/L -- 6,100 0.50 U 0.50 U 0.50 UMethyl tert-butyl ether µg/L -- 11 0.50 U 0.50 U 0.50 UMethylcyclohexane µg/L -- 5,200 0.50 U 0.50 U 0.50 UMethylene Chloride µg/L 5.0 4.3 0.50 U 3.3 0.50 Uo-Xylene µg/L -- -- 0.50 U 0.50 U 0.50 UStyrene µg/L 100 1,600 0.50 U 0.50 U 0.50 U
Tetrachloroethene µg/L 5.0 0.10 0.50 U 0.50 U 0.50 U
Toluene µg/L 1,000 720 0.50 U 0.50 U 0.50 Utrans-1,2-Dichloroethene µg/L 100 120 0.50 U 0.50 U 0.50 Utrans-1,3-Dichloropropene µg/L -- -- 0.50 U 0.50 U 0.50 U
Trichloroethene µg/L 5.0 0.028 0.50 U 0.50 U 0.50 U
Trichlorofluoromethane µg/L -- 1,300 0.50 U 0.50 U 0.50 UTrichlorotrifluoroethane µg/L -- 59,000 0.50 U 0.50 U 0.50 UVinyl chloride µg/L 2.0 0.02 0.50 U 0.50 U 0.50 U
Table Notes:1 EPA Maximum Contaminant Level, EPA 816-F-03-016, June 20032 EPA Region IX Preliminary Remediation Goals, Tap Water, October 20043 Bold values with bold outline exceed one or more of the comparison criteria.4 Bold italicized values have detection limits above one or more of the comparison criteria.5 -- = Not established6 J = Estimated value8 R = Rejected9 U = Not detected; reporting limit is shown in place of a result.10 µg/L = micrograms per Liter11 UJ = Not detected; reporting limit is approximate and is shown in place of a result.
Page 4 of 4
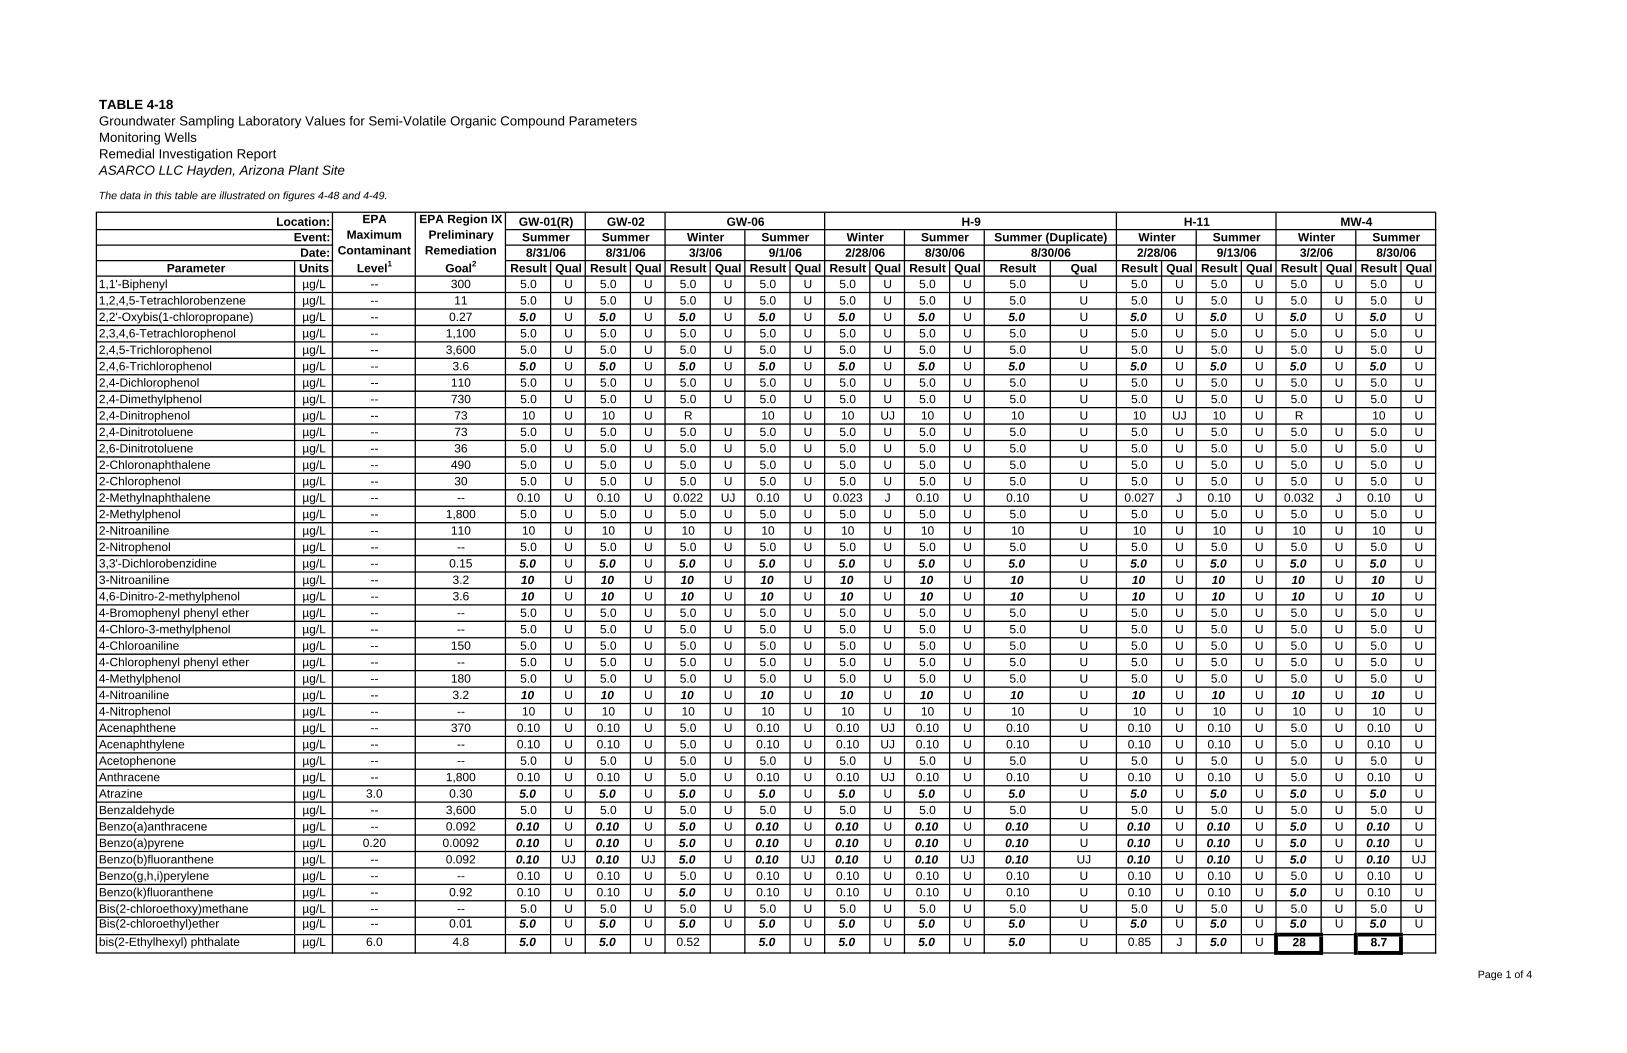
TABLE 4-18Groundwater Sampling Laboratory Values for Semi-Volatile Organic Compound ParametersMonitoring WellsRemedial Investigation ReportASARCO LLC Hayden, Arizona Plant Site
The data in this table are illustrated on figures 4-48 and 4-49.
Parameter Units Result Qual Result Qual Result Qual Result Qual Result Qual Result Qual Result Qual Result Qual Result Qual Result Qual Result Qual1,1'-Biphenyl µg/L -- 300 5.0 U 5.0 U 5.0 U 5.0 U 5.0 U 5.0 U 5.0 U 5.0 U 5.0 U 5.0 U 5.0 U1,2,4,5-Tetrachlorobenzene µg/L -- 11 5.0 U 5.0 U 5.0 U 5.0 U 5.0 U 5.0 U 5.0 U 5.0 U 5.0 U 5.0 U 5.0 U2,2'-Oxybis(1-chloropropane) µg/L -- 0.27 5.0 U 5.0 U 5.0 U 5.0 U 5.0 U 5.0 U 5.0 U 5.0 U 5.0 U 5.0 U 5.0 U2,3,4,6-Tetrachlorophenol µg/L -- 1,100 5.0 U 5.0 U 5.0 U 5.0 U 5.0 U 5.0 U 5.0 U 5.0 U 5.0 U 5.0 U 5.0 U2,4,5-Trichlorophenol µg/L -- 3,600 5.0 U 5.0 U 5.0 U 5.0 U 5.0 U 5.0 U 5.0 U 5.0 U 5.0 U 5.0 U 5.0 U2,4,6-Trichlorophenol µg/L -- 3.6 5.0 U 5.0 U 5.0 U 5.0 U 5.0 U 5.0 U 5.0 U 5.0 U 5.0 U 5.0 U 5.0 U2,4-Dichlorophenol µg/L -- 110 5.0 U 5.0 U 5.0 U 5.0 U 5.0 U 5.0 U 5.0 U 5.0 U 5.0 U 5.0 U 5.0 U2,4-Dimethylphenol µg/L -- 730 5.0 U 5.0 U 5.0 U 5.0 U 5.0 U 5.0 U 5.0 U 5.0 U 5.0 U 5.0 U 5.0 U2,4-Dinitrophenol µg/L -- 73 10 U 10 U R 10 U 10 UJ 10 U 10 U 10 UJ 10 U R 10 U2,4-Dinitrotoluene µg/L -- 73 5.0 U 5.0 U 5.0 U 5.0 U 5.0 U 5.0 U 5.0 U 5.0 U 5.0 U 5.0 U 5.0 U2,6-Dinitrotoluene µg/L -- 36 5.0 U 5.0 U 5.0 U 5.0 U 5.0 U 5.0 U 5.0 U 5.0 U 5.0 U 5.0 U 5.0 U2-Chloronaphthalene µg/L -- 490 5.0 U 5.0 U 5.0 U 5.0 U 5.0 U 5.0 U 5.0 U 5.0 U 5.0 U 5.0 U 5.0 U2-Chlorophenol µg/L -- 30 5.0 U 5.0 U 5.0 U 5.0 U 5.0 U 5.0 U 5.0 U 5.0 U 5.0 U 5.0 U 5.0 U2-Methylnaphthalene µg/L -- -- 0.10 U 0.10 U 0.022 UJ 0.10 U 0.023 J 0.10 U 0.10 U 0.027 J 0.10 U 0.032 J 0.10 U2-Methylphenol µg/L -- 1,800 5.0 U 5.0 U 5.0 U 5.0 U 5.0 U 5.0 U 5.0 U 5.0 U 5.0 U 5.0 U 5.0 U2-Nitroaniline µg/L -- 110 10 U 10 U 10 U 10 U 10 U 10 U 10 U 10 U 10 U 10 U 10 U2-Nitrophenol µg/L -- -- 5.0 U 5.0 U 5.0 U 5.0 U 5.0 U 5.0 U 5.0 U 5.0 U 5.0 U 5.0 U 5.0 U3,3'-Dichlorobenzidine µg/L -- 0.15 5.0 U 5.0 U 5.0 U 5.0 U 5.0 U 5.0 U 5.0 U 5.0 U 5.0 U 5.0 U 5.0 U3-Nitroaniline µg/L -- 3.2 10 U 10 U 10 U 10 U 10 U 10 U 10 U 10 U 10 U 10 U 10 U4,6-Dinitro-2-methylphenol µg/L -- 3.6 10 U 10 U 10 U 10 U 10 U 10 U 10 U 10 U 10 U 10 U 10 U4-Bromophenyl phenyl ether µg/L -- -- 5.0 U 5.0 U 5.0 U 5.0 U 5.0 U 5.0 U 5.0 U 5.0 U 5.0 U 5.0 U 5.0 U4-Chloro-3-methylphenol µg/L -- -- 5.0 U 5.0 U 5.0 U 5.0 U 5.0 U 5.0 U 5.0 U 5.0 U 5.0 U 5.0 U 5.0 U4-Chloroaniline µg/L -- 150 5.0 U 5.0 U 5.0 U 5.0 U 5.0 U 5.0 U 5.0 U 5.0 U 5.0 U 5.0 U 5.0 U4-Chlorophenyl phenyl ether µg/L -- -- 5.0 U 5.0 U 5.0 U 5.0 U 5.0 U 5.0 U 5.0 U 5.0 U 5.0 U 5.0 U 5.0 U4-Methylphenol µg/L -- 180 5.0 U 5.0 U 5.0 U 5.0 U 5.0 U 5.0 U 5.0 U 5.0 U 5.0 U 5.0 U 5.0 U4-Nitroaniline µg/L -- 3.2 10 U 10 U 10 U 10 U 10 U 10 U 10 U 10 U 10 U 10 U 10 U4-Nitrophenol µg/L -- -- 10 U 10 U 10 U 10 U 10 U 10 U 10 U 10 U 10 U 10 U 10 UAcenaphthene µg/L -- 370 0.10 U 0.10 U 5.0 U 0.10 U 0.10 UJ 0.10 U 0.10 U 0.10 U 0.10 U 5.0 U 0.10 UAcenaphthylene µg/L -- -- 0.10 U 0.10 U 5.0 U 0.10 U 0.10 UJ 0.10 U 0.10 U 0.10 U 0.10 U 5.0 U 0.10 UAcetophenone µg/L -- -- 5.0 U 5.0 U 5.0 U 5.0 U 5.0 U 5.0 U 5.0 U 5.0 U 5.0 U 5.0 U 5.0 UAnthracene µg/L -- 1,800 0.10 U 0.10 U 5.0 U 0.10 U 0.10 UJ 0.10 U 0.10 U 0.10 U 0.10 U 5.0 U 0.10 UAtrazine µg/L 3.0 0.30 5.0 U 5.0 U 5.0 U 5.0 U 5.0 U 5.0 U 5.0 U 5.0 U 5.0 U 5.0 U 5.0 UBenzaldehyde µg/L -- 3,600 5.0 U 5.0 U 5.0 U 5.0 U 5.0 U 5.0 U 5.0 U 5.0 U 5.0 U 5.0 U 5.0 UBenzo(a)anthracene µg/L -- 0.092 0.10 U 0.10 U 5.0 U 0.10 U 0.10 U 0.10 U 0.10 U 0.10 U 0.10 U 5.0 U 0.10 UBenzo(a)pyrene µg/L 0.20 0.0092 0.10 U 0.10 U 5.0 U 0.10 U 0.10 U 0.10 U 0.10 U 0.10 U 0.10 U 5.0 U 0.10 UBenzo(b)fluoranthene µg/L -- 0.092 0.10 UJ 0.10 UJ 5.0 U 0.10 UJ 0.10 U 0.10 UJ 0.10 UJ 0.10 U 0.10 U 5.0 U 0.10 UJBenzo(g,h,i)perylene µg/L -- -- 0.10 U 0.10 U 5.0 U 0.10 U 0.10 U 0.10 U 0.10 U 0.10 U 0.10 U 5.0 U 0.10 UBenzo(k)fluoranthene µg/L -- 0.92 0.10 U 0.10 U 5.0 U 0.10 U 0.10 U 0.10 U 0.10 U 0.10 U 0.10 U 5.0 U 0.10 UBis(2-chloroethoxy)methane µg/L -- -- 5.0 U 5.0 U 5.0 U 5.0 U 5.0 U 5.0 U 5.0 U 5.0 U 5.0 U 5.0 U 5.0 UBis(2-chloroethyl)ether µg/L -- 0.01 5.0 U 5.0 U 5.0 U 5.0 U 5.0 U 5.0 U 5.0 U 5.0 U 5.0 U 5.0 U 5.0 Ubis(2-Ethylhexyl) phthalate µg/L 6.0 4.8 5.0 U 5.0 U 0.52 5.0 U 5.0 U 5.0 U 5.0 U 0.85 J 5.0 U 28 8.7
3/2/06 8/30/06Winter SummerSummer Summer (Duplicate)
MW-4H-9 H-11Winter Winter Summer
9/13/063/3/06 9/1/06 8/30/06 8/30/068/31/06 8/31/06 2/28/06 2/28/06
GW-06Summer Summer Winter SummerGW-01(R) GW-02Location:
Event:EPA
MaximumContaminant
Level1
EPA Region IXPreliminary
RemediationGoal2
Date:
Page 1 of 4
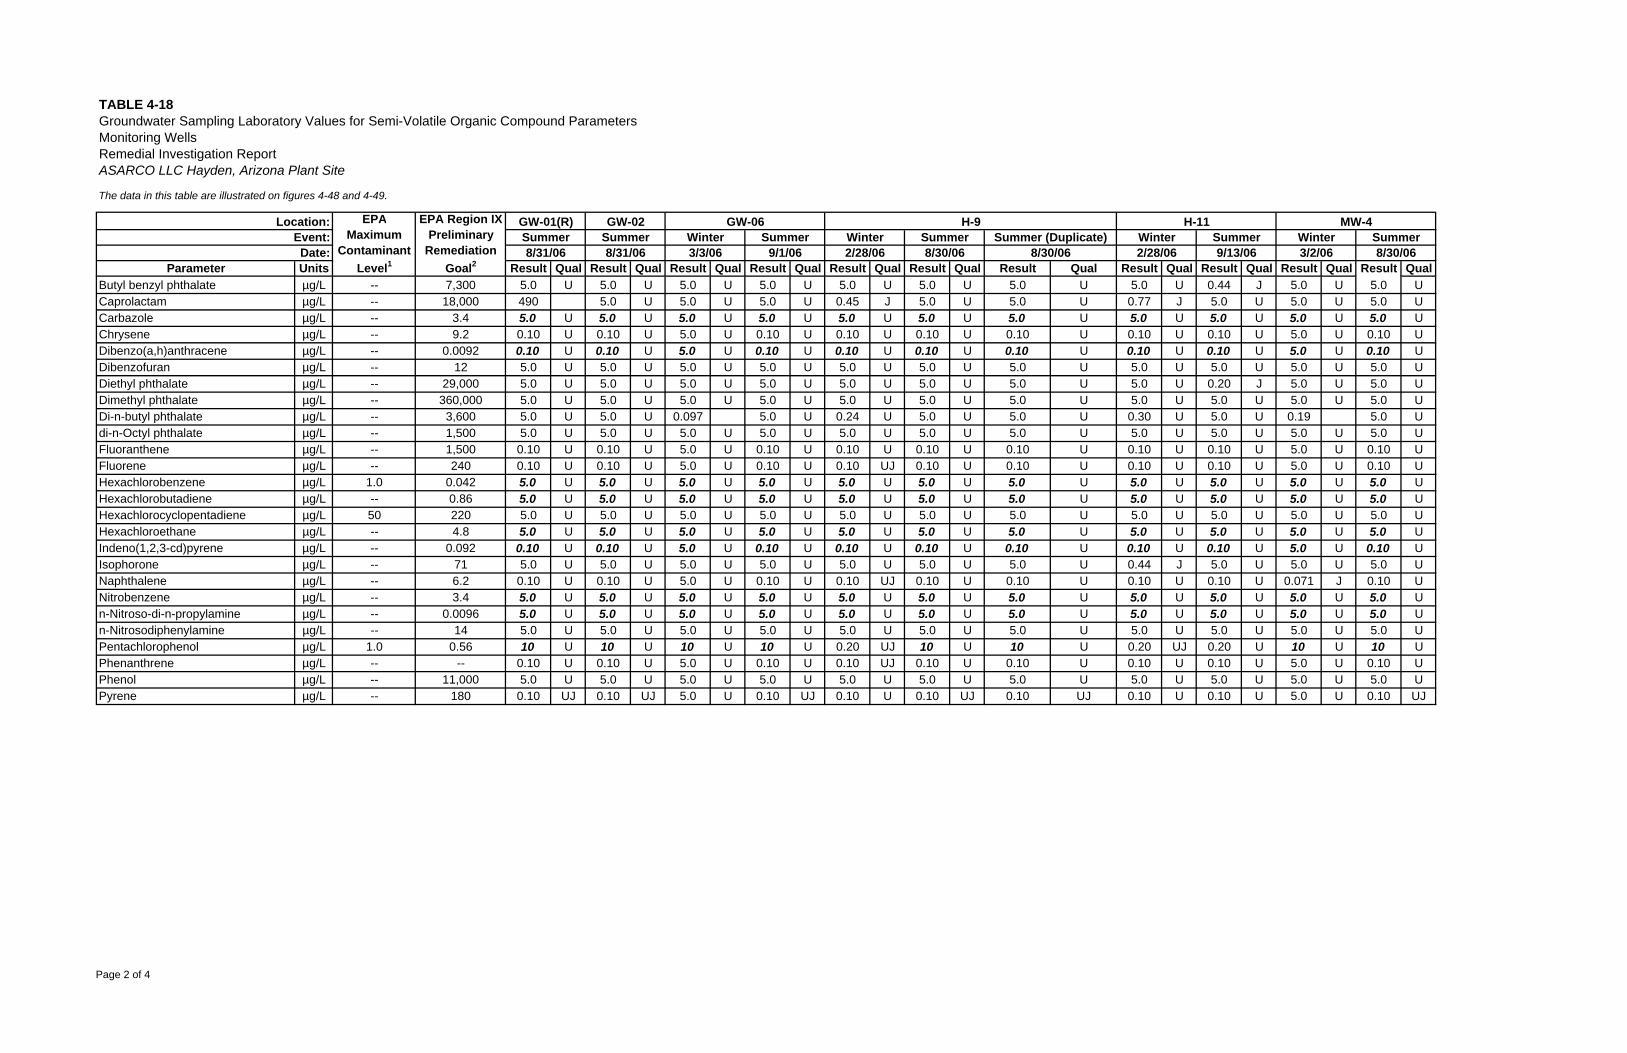
TABLE 4-18Groundwater Sampling Laboratory Values for Semi-Volatile Organic Compound ParametersMonitoring WellsRemedial Investigation ReportASARCO LLC Hayden, Arizona Plant Site
The data in this table are illustrated on figures 4-48 and 4-49.
Parameter Units Result Qual Result Qual Result Qual Result Qual Result Qual Result Qual Result Qual Result Qual Result Qual Result Qual Result Qual3/2/06 8/30/06Winter SummerSummer Summer (Duplicate)
MW-4H-9 H-11Winter Winter Summer
9/13/063/3/06 9/1/06 8/30/06 8/30/068/31/06 8/31/06 2/28/06 2/28/06
GW-06Summer Summer Winter SummerGW-01(R) GW-02Location:
Event:EPA
MaximumContaminant
Level1
EPA Region IXPreliminary
RemediationGoal2
Date:
Butyl benzyl phthalate µg/L -- 7,300 5.0 U 5.0 U 5.0 U 5.0 U 5.0 U 5.0 U 5.0 U 5.0 U 0.44 J 5.0 U 5.0 UCaprolactam µg/L -- 18,000 490 5.0 U 5.0 U 5.0 U 0.45 J 5.0 U 5.0 U 0.77 J 5.0 U 5.0 U 5.0 UCarbazole µg/L -- 3.4 5.0 U 5.0 U 5.0 U 5.0 U 5.0 U 5.0 U 5.0 U 5.0 U 5.0 U 5.0 U 5.0 UChrysene µg/L -- 9.2 0.10 U 0.10 U 5.0 U 0.10 U 0.10 U 0.10 U 0.10 U 0.10 U 0.10 U 5.0 U 0.10 UDibenzo(a,h)anthracene µg/L -- 0.0092 0.10 U 0.10 U 5.0 U 0.10 U 0.10 U 0.10 U 0.10 U 0.10 U 0.10 U 5.0 U 0.10 UDibenzofuran µg/L -- 12 5.0 U 5.0 U 5.0 U 5.0 U 5.0 U 5.0 U 5.0 U 5.0 U 5.0 U 5.0 U 5.0 UDiethyl phthalate µg/L -- 29,000 5.0 U 5.0 U 5.0 U 5.0 U 5.0 U 5.0 U 5.0 U 5.0 U 0.20 J 5.0 U 5.0 UDimethyl phthalate µg/L -- 360,000 5.0 U 5.0 U 5.0 U 5.0 U 5.0 U 5.0 U 5.0 U 5.0 U 5.0 U 5.0 U 5.0 UDi-n-butyl phthalate µg/L -- 3,600 5.0 U 5.0 U 0.097 5.0 U 0.24 U 5.0 U 5.0 U 0.30 U 5.0 U 0.19 5.0 Udi-n-Octyl phthalate µg/L -- 1,500 5.0 U 5.0 U 5.0 U 5.0 U 5.0 U 5.0 U 5.0 U 5.0 U 5.0 U 5.0 U 5.0 UFluoranthene µg/L -- 1,500 0.10 U 0.10 U 5.0 U 0.10 U 0.10 U 0.10 U 0.10 U 0.10 U 0.10 U 5.0 U 0.10 UFluorene µg/L -- 240 0.10 U 0.10 U 5.0 U 0.10 U 0.10 UJ 0.10 U 0.10 U 0.10 U 0.10 U 5.0 U 0.10 UHexachlorobenzene µg/L 1.0 0.042 5.0 U 5.0 U 5.0 U 5.0 U 5.0 U 5.0 U 5.0 U 5.0 U 5.0 U 5.0 U 5.0 UHexachlorobutadiene µg/L -- 0.86 5.0 U 5.0 U 5.0 U 5.0 U 5.0 U 5.0 U 5.0 U 5.0 U 5.0 U 5.0 U 5.0 UHexachlorocyclopentadiene µg/L 50 220 5.0 U 5.0 U 5.0 U 5.0 U 5.0 U 5.0 U 5.0 U 5.0 U 5.0 U 5.0 U 5.0 UHexachloroethane µg/L -- 4.8 5.0 U 5.0 U 5.0 U 5.0 U 5.0 U 5.0 U 5.0 U 5.0 U 5.0 U 5.0 U 5.0 UIndeno(1,2,3-cd)pyrene µg/L -- 0.092 0.10 U 0.10 U 5.0 U 0.10 U 0.10 U 0.10 U 0.10 U 0.10 U 0.10 U 5.0 U 0.10 UIsophorone µg/L -- 71 5.0 U 5.0 U 5.0 U 5.0 U 5.0 U 5.0 U 5.0 U 0.44 J 5.0 U 5.0 U 5.0 UNaphthalene µg/L -- 6.2 0.10 U 0.10 U 5.0 U 0.10 U 0.10 UJ 0.10 U 0.10 U 0.10 U 0.10 U 0.071 J 0.10 UNitrobenzene µg/L -- 3.4 5.0 U 5.0 U 5.0 U 5.0 U 5.0 U 5.0 U 5.0 U 5.0 U 5.0 U 5.0 U 5.0 Un-Nitroso-di-n-propylamine µg/L -- 0.0096 5.0 U 5.0 U 5.0 U 5.0 U 5.0 U 5.0 U 5.0 U 5.0 U 5.0 U 5.0 U 5.0 Un-Nitrosodiphenylamine µg/L -- 14 5.0 U 5.0 U 5.0 U 5.0 U 5.0 U 5.0 U 5.0 U 5.0 U 5.0 U 5.0 U 5.0 UPentachlorophenol µg/L 1.0 0.56 10 U 10 U 10 U 10 U 0.20 UJ 10 U 10 U 0.20 UJ 0.20 U 10 U 10 UPhenanthrene µg/L -- -- 0.10 U 0.10 U 5.0 U 0.10 U 0.10 UJ 0.10 U 0.10 U 0.10 U 0.10 U 5.0 U 0.10 UPhenol µg/L -- 11,000 5.0 U 5.0 U 5.0 U 5.0 U 5.0 U 5.0 U 5.0 U 5.0 U 5.0 U 5.0 U 5.0 UPyrene µg/L -- 180 0.10 UJ 0.10 UJ 5.0 U 0.10 UJ 0.10 U 0.10 UJ 0.10 UJ 0.10 U 0.10 U 5.0 U 0.10 UJ
Page 2 of 4
------
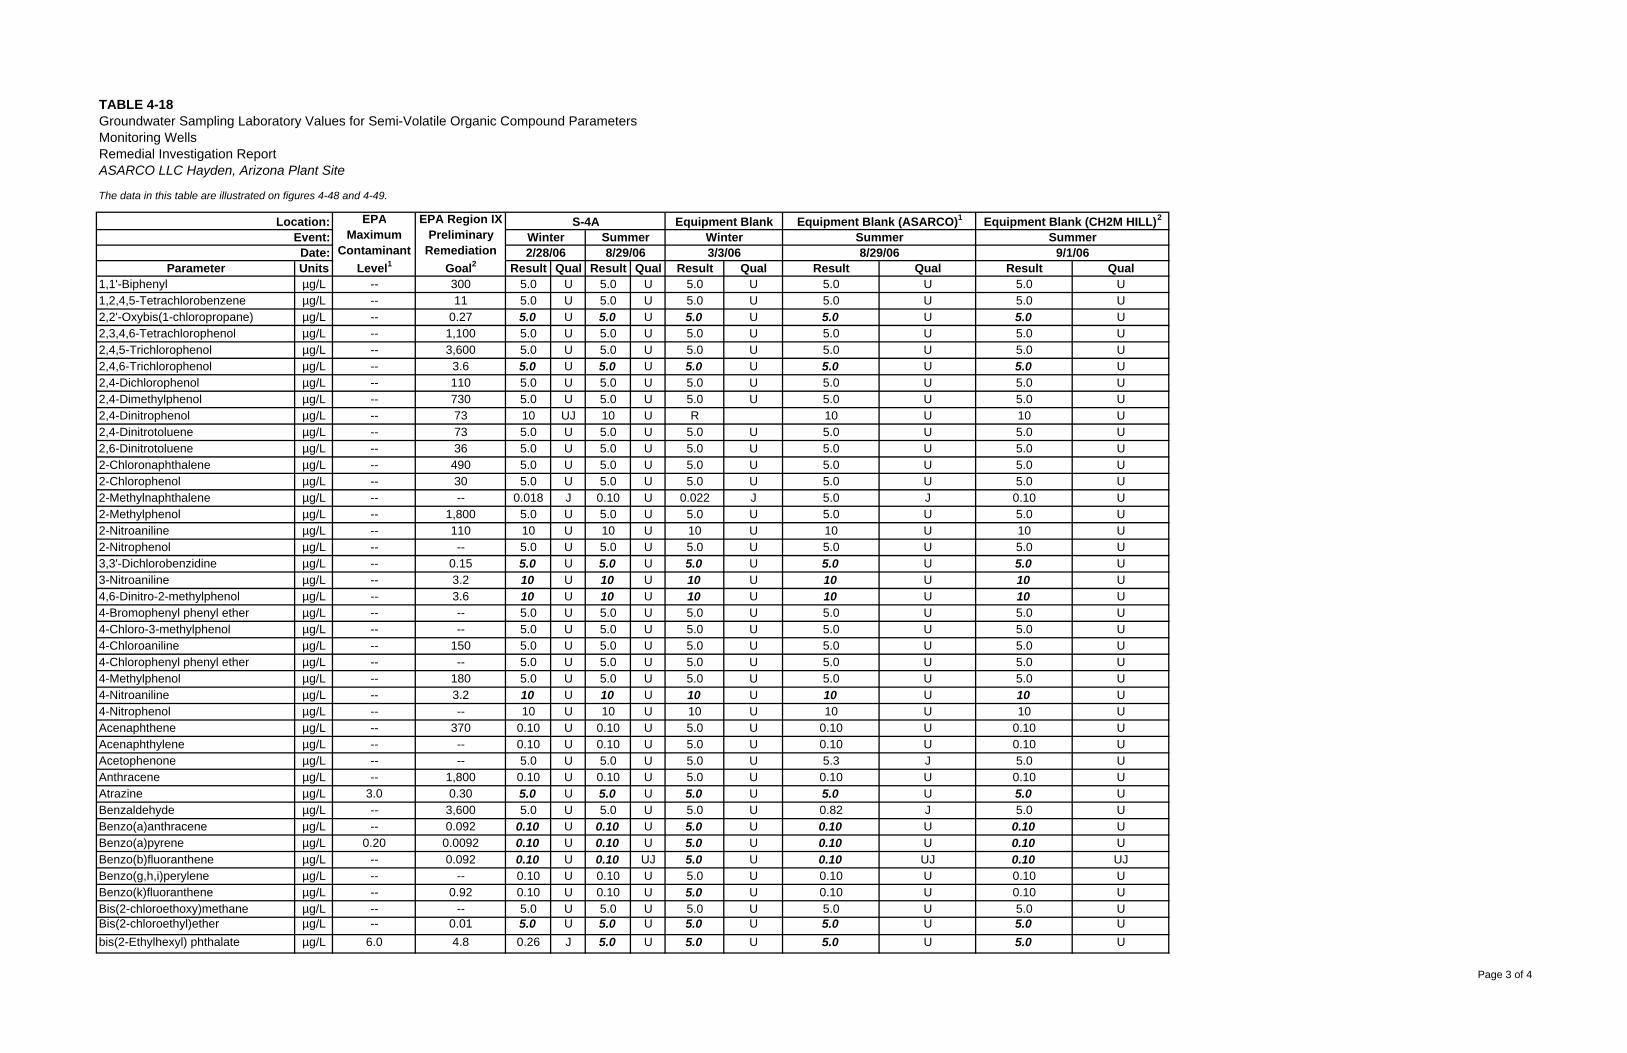
TABLE 4-18Groundwater Sampling Laboratory Values for Semi-Volatile Organic Compound ParametersMonitoring WellsRemedial Investigation ReportASARCO LLC Hayden, Arizona Plant Site
The data in this table are illustrated on figures 4-48 and 4-49.
Parameter Units Result Qual Result Qual Result Qual Result Qual Result Qual1,1'-Biphenyl µg/L -- 300 5.0 U 5.0 U 5.0 U 5.0 U 5.0 U1,2,4,5-Tetrachlorobenzene µg/L -- 11 5.0 U 5.0 U 5.0 U 5.0 U 5.0 U2,2'-Oxybis(1-chloropropane) µg/L -- 0.27 5.0 U 5.0 U 5.0 U 5.0 U 5.0 U2,3,4,6-Tetrachlorophenol µg/L -- 1,100 5.0 U 5.0 U 5.0 U 5.0 U 5.0 U2,4,5-Trichlorophenol µg/L -- 3,600 5.0 U 5.0 U 5.0 U 5.0 U 5.0 U2,4,6-Trichlorophenol µg/L -- 3.6 5.0 U 5.0 U 5.0 U 5.0 U 5.0 U2,4-Dichlorophenol µg/L -- 110 5.0 U 5.0 U 5.0 U 5.0 U 5.0 U2,4-Dimethylphenol µg/L -- 730 5.0 U 5.0 U 5.0 U 5.0 U 5.0 U2,4-Dinitrophenol µg/L -- 73 10 UJ 10 U R 10 U 10 U2,4-Dinitrotoluene µg/L -- 73 5.0 U 5.0 U 5.0 U 5.0 U 5.0 U2,6-Dinitrotoluene µg/L -- 36 5.0 U 5.0 U 5.0 U 5.0 U 5.0 U2-Chloronaphthalene µg/L -- 490 5.0 U 5.0 U 5.0 U 5.0 U 5.0 U2-Chlorophenol µg/L -- 30 5.0 U 5.0 U 5.0 U 5.0 U 5.0 U2-Methylnaphthalene µg/L -- -- 0.018 J 0.10 U 0.022 J 5.0 J 0.10 U2-Methylphenol µg/L -- 1,800 5.0 U 5.0 U 5.0 U 5.0 U 5.0 U2-Nitroaniline µg/L -- 110 10 U 10 U 10 U 10 U 10 U2-Nitrophenol µg/L -- -- 5.0 U 5.0 U 5.0 U 5.0 U 5.0 U3,3'-Dichlorobenzidine µg/L -- 0.15 5.0 U 5.0 U 5.0 U 5.0 U 5.0 U3-Nitroaniline µg/L -- 3.2 10 U 10 U 10 U 10 U 10 U4,6-Dinitro-2-methylphenol µg/L -- 3.6 10 U 10 U 10 U 10 U 10 U4-Bromophenyl phenyl ether µg/L -- -- 5.0 U 5.0 U 5.0 U 5.0 U 5.0 U4-Chloro-3-methylphenol µg/L -- -- 5.0 U 5.0 U 5.0 U 5.0 U 5.0 U4-Chloroaniline µg/L -- 150 5.0 U 5.0 U 5.0 U 5.0 U 5.0 U4-Chlorophenyl phenyl ether µg/L -- -- 5.0 U 5.0 U 5.0 U 5.0 U 5.0 U4-Methylphenol µg/L -- 180 5.0 U 5.0 U 5.0 U 5.0 U 5.0 U4-Nitroaniline µg/L -- 3.2 10 U 10 U 10 U 10 U 10 U4-Nitrophenol µg/L -- -- 10 U 10 U 10 U 10 U 10 UAcenaphthene µg/L -- 370 0.10 U 0.10 U 5.0 U 0.10 U 0.10 UAcenaphthylene µg/L -- -- 0.10 U 0.10 U 5.0 U 0.10 U 0.10 UAcetophenone µg/L -- -- 5.0 U 5.0 U 5.0 U 5.3 J 5.0 UAnthracene µg/L -- 1,800 0.10 U 0.10 U 5.0 U 0.10 U 0.10 UAtrazine µg/L 3.0 0.30 5.0 U 5.0 U 5.0 U 5.0 U 5.0 UBenzaldehyde µg/L -- 3,600 5.0 U 5.0 U 5.0 U 0.82 J 5.0 UBenzo(a)anthracene µg/L -- 0.092 0.10 U 0.10 U 5.0 U 0.10 U 0.10 UBenzo(a)pyrene µg/L 0.20 0.0092 0.10 U 0.10 U 5.0 U 0.10 U 0.10 UBenzo(b)fluoranthene µg/L -- 0.092 0.10 U 0.10 UJ 5.0 U 0.10 UJ 0.10 UJBenzo(g,h,i)perylene µg/L -- -- 0.10 U 0.10 U 5.0 U 0.10 U 0.10 UBenzo(k)fluoranthene µg/L -- 0.92 0.10 U 0.10 U 5.0 U 0.10 U 0.10 UBis(2-chloroethoxy)methane µg/L -- -- 5.0 U 5.0 U 5.0 U 5.0 U 5.0 UBis(2-chloroethyl)ether µg/L -- 0.01 5.0 U 5.0 U 5.0 U 5.0 U 5.0 Ubis(2-Ethylhexyl) phthalate µg/L 6.0 4.8 0.26 J 5.0 U 5.0 U 5.0 U 5.0 U
Location: EPAMaximum
ContaminantLevel1
EPA Region IXPreliminary
RemediationGoal2
Event:Date: 3/3/06 8/29/06 9/1/06
Equipment Blank Equipment Blank (ASARCO)1 Equipment Blank (CH2M HILL)2
Winter Summer SummerS-4A
Winter Summer2/28/06 8/29/06
Page 3 of 4
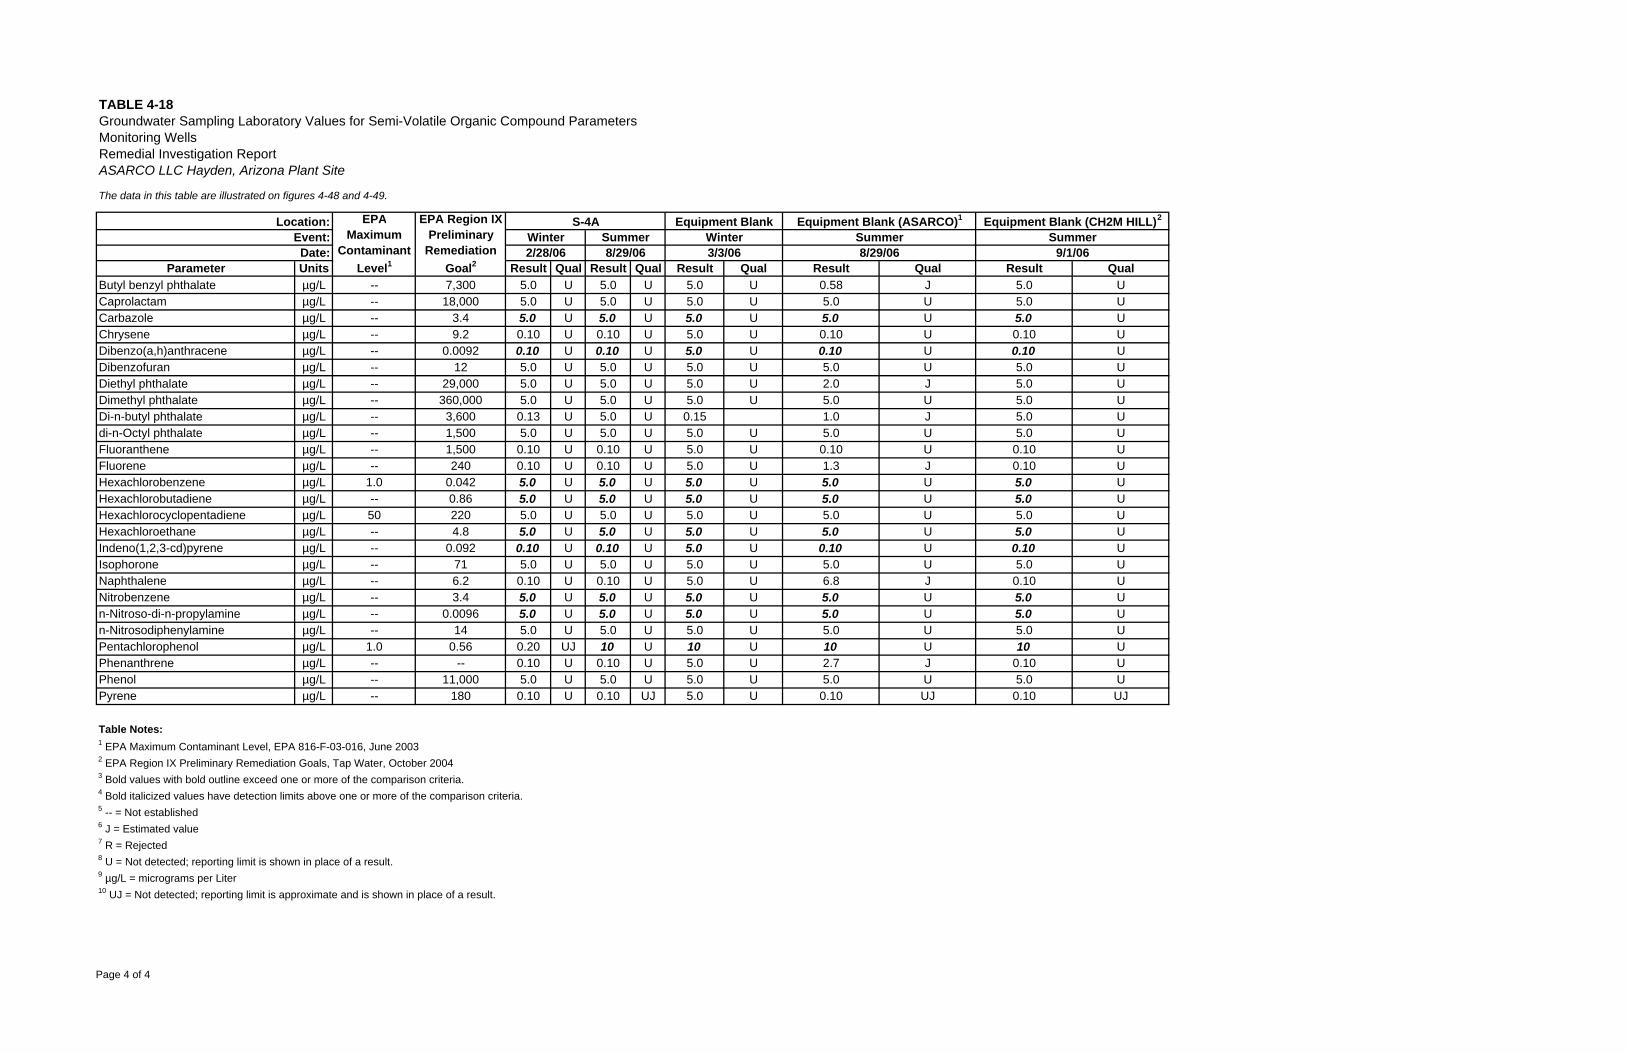
TABLE 4-18Groundwater Sampling Laboratory Values for Semi-Volatile Organic Compound ParametersMonitoring WellsRemedial Investigation ReportASARCO LLC Hayden, Arizona Plant Site
The data in this table are illustrated on figures 4-48 and 4-49.
Parameter Units Result Qual Result Qual Result Qual Result Qual Result Qual
Location: EPAMaximum
ContaminantLevel1
EPA Region IXPreliminary
RemediationGoal2
Event:Date: 3/3/06 8/29/06 9/1/06
Equipment Blank Equipment Blank (ASARCO)1 Equipment Blank (CH2M HILL)2
Winter Summer SummerS-4A
Winter Summer2/28/06 8/29/06
Butyl benzyl phthalate µg/L -- 7,300 5.0 U 5.0 U 5.0 U 0.58 J 5.0 UCaprolactam µg/L -- 18,000 5.0 U 5.0 U 5.0 U 5.0 U 5.0 UCarbazole µg/L -- 3.4 5.0 U 5.0 U 5.0 U 5.0 U 5.0 UChrysene µg/L -- 9.2 0.10 U 0.10 U 5.0 U 0.10 U 0.10 UDibenzo(a,h)anthracene µg/L -- 0.0092 0.10 U 0.10 U 5.0 U 0.10 U 0.10 UDibenzofuran µg/L -- 12 5.0 U 5.0 U 5.0 U 5.0 U 5.0 UDiethyl phthalate µg/L -- 29,000 5.0 U 5.0 U 5.0 U 2.0 J 5.0 UDimethyl phthalate µg/L -- 360,000 5.0 U 5.0 U 5.0 U 5.0 U 5.0 UDi-n-butyl phthalate µg/L -- 3,600 0.13 U 5.0 U 0.15 1.0 J 5.0 Udi-n-Octyl phthalate µg/L -- 1,500 5.0 U 5.0 U 5.0 U 5.0 U 5.0 UFluoranthene µg/L -- 1,500 0.10 U 0.10 U 5.0 U 0.10 U 0.10 UFluorene µg/L -- 240 0.10 U 0.10 U 5.0 U 1.3 J 0.10 UHexachlorobenzene µg/L 1.0 0.042 5.0 U 5.0 U 5.0 U 5.0 U 5.0 UHexachlorobutadiene µg/L -- 0.86 5.0 U 5.0 U 5.0 U 5.0 U 5.0 UHexachlorocyclopentadiene µg/L 50 220 5.0 U 5.0 U 5.0 U 5.0 U 5.0 UHexachloroethane µg/L -- 4.8 5.0 U 5.0 U 5.0 U 5.0 U 5.0 UIndeno(1,2,3-cd)pyrene µg/L -- 0.092 0.10 U 0.10 U 5.0 U 0.10 U 0.10 UIsophorone µg/L -- 71 5.0 U 5.0 U 5.0 U 5.0 U 5.0 UNaphthalene µg/L -- 6.2 0.10 U 0.10 U 5.0 U 6.8 J 0.10 UNitrobenzene µg/L -- 3.4 5.0 U 5.0 U 5.0 U 5.0 U 5.0 Un-Nitroso-di-n-propylamine µg/L -- 0.0096 5.0 U 5.0 U 5.0 U 5.0 U 5.0 Un-Nitrosodiphenylamine µg/L -- 14 5.0 U 5.0 U 5.0 U 5.0 U 5.0 UPentachlorophenol µg/L 1.0 0.56 0.20 UJ 10 U 10 U 10 U 10 UPhenanthrene µg/L -- -- 0.10 U 0.10 U 5.0 U 2.7 J 0.10 UPhenol µg/L -- 11,000 5.0 U 5.0 U 5.0 U 5.0 U 5.0 UPyrene µg/L -- 180 0.10 U 0.10 UJ 5.0 U 0.10 UJ 0.10 UJ
Table Notes:1 EPA Maximum Contaminant Level, EPA 816-F-03-016, June 20032 EPA Region IX Preliminary Remediation Goals, Tap Water, October 20043 Bold values with bold outline exceed one or more of the comparison criteria.4 Bold italicized values have detection limits above one or more of the comparison criteria.5 -- = Not established6 J = Estimated value7 R = Rejected8 U = Not detected; reporting limit is shown in place of a result.9 µg/L = micrograms per Liter10 UJ = Not detected; reporting limit is approximate and is shown in place of a result.
Page 4 of 4
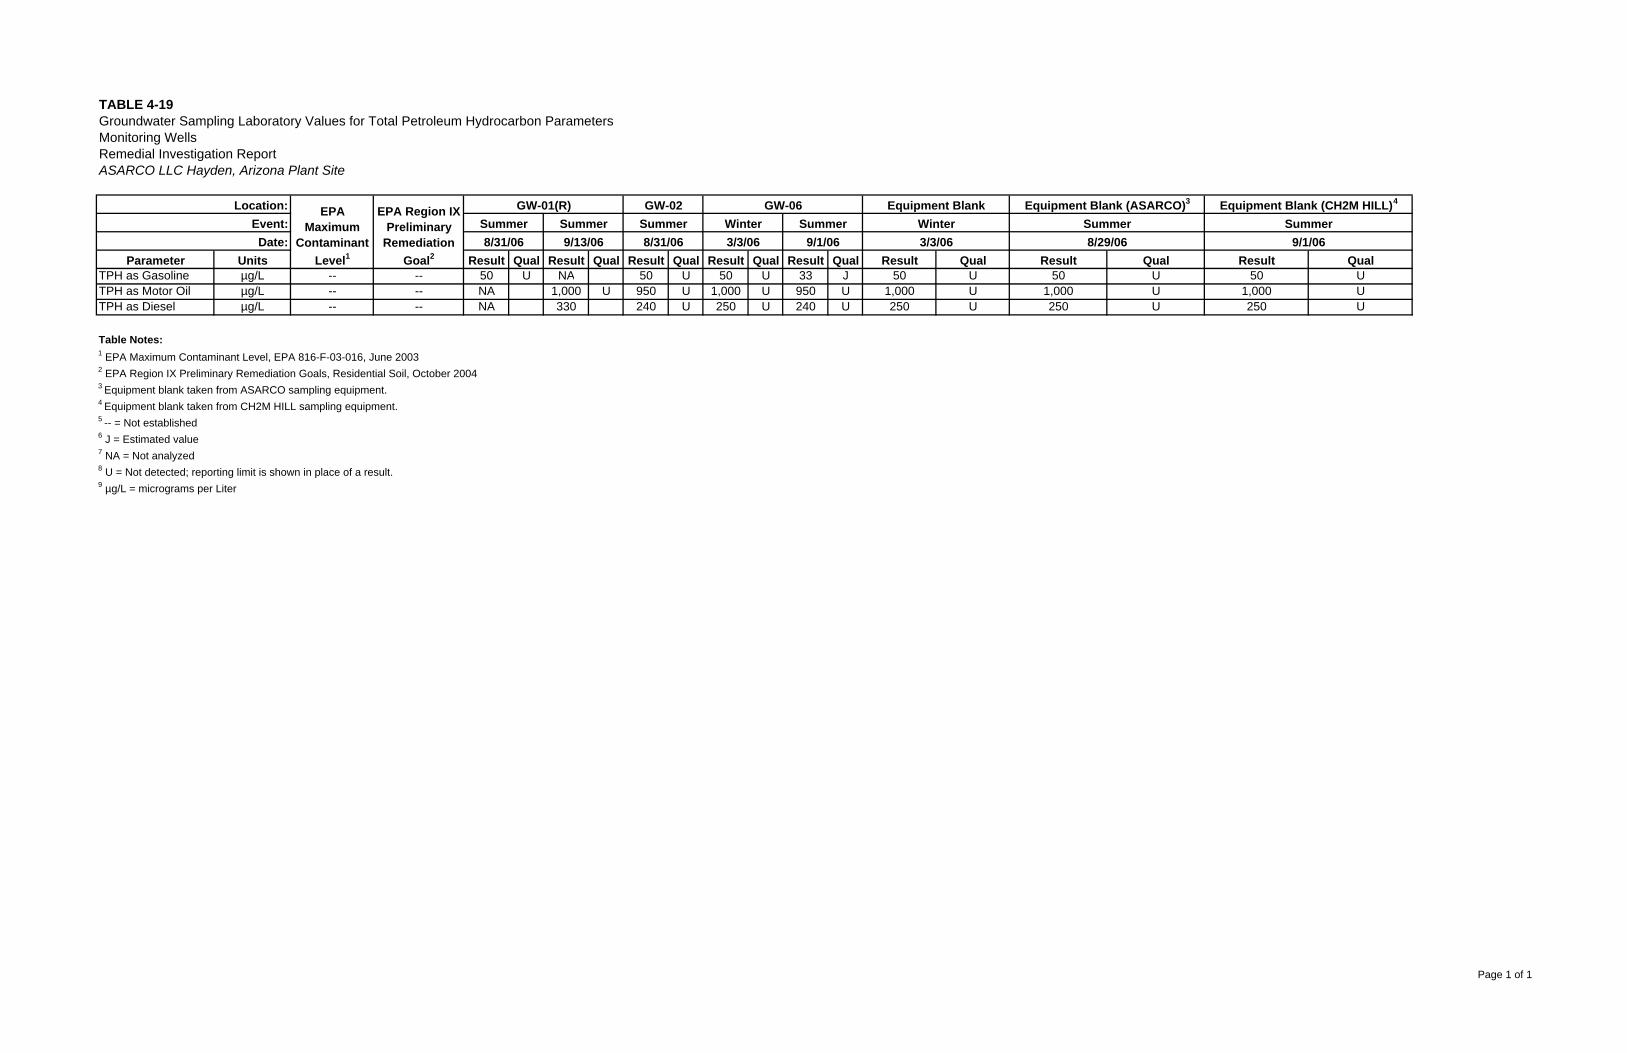
TABLE 4-19Groundwater Sampling Laboratory Values for Total Petroleum Hydrocarbon ParametersMonitoring WellsRemedial Investigation ReportASARCO LLC Hayden, Arizona Plant Site
Parameter Units Result Qual Result Qual Result Qual Result Qual Result Qual Result Qual Result Qual Result QualTPH as Gasoline µg/L -- -- 50 U NA 50 U 50 U 33 J 50 U 50 U 50 UTPH as Motor Oil µg/L -- -- NA 1,000 U 950 U 1,000 U 950 U 1,000 U 1,000 U 1,000 UTPH as Diesel µg/L -- -- NA 330 240 U 250 U 240 U 250 U 250 U 250 U
Table Notes:1 EPA Maximum Contaminant Level, EPA 816-F-03-016, June 20032 EPA Region IX Preliminary Remediation Goals, Residential Soil, October 20043 Equipment blank taken from ASARCO sampling equipment.4 Equipment blank taken from CH2M HILL sampling equipment.5 -- = Not established6 J = Estimated value7 NA = Not analyzed8 U = Not detected; reporting limit is shown in place of a result.9 µg/L = micrograms per Liter
9/1/06
Equipment Blank Equipment Blank (ASARCO)3 Equipment Blank (CH2M HILL)4
Winter Summer Summer3/3/06 8/29/06
Summer SummerSummer9/1/068/31/06 8/31/06 3/3/069/13/06
GW-01(R) GW-02 GW-06Event:
Location: EPAMaximum
ContaminantLevel1
EPA Region IXPreliminary
RemediationGoal2
Date:Winter Summer
Page 1 of 1
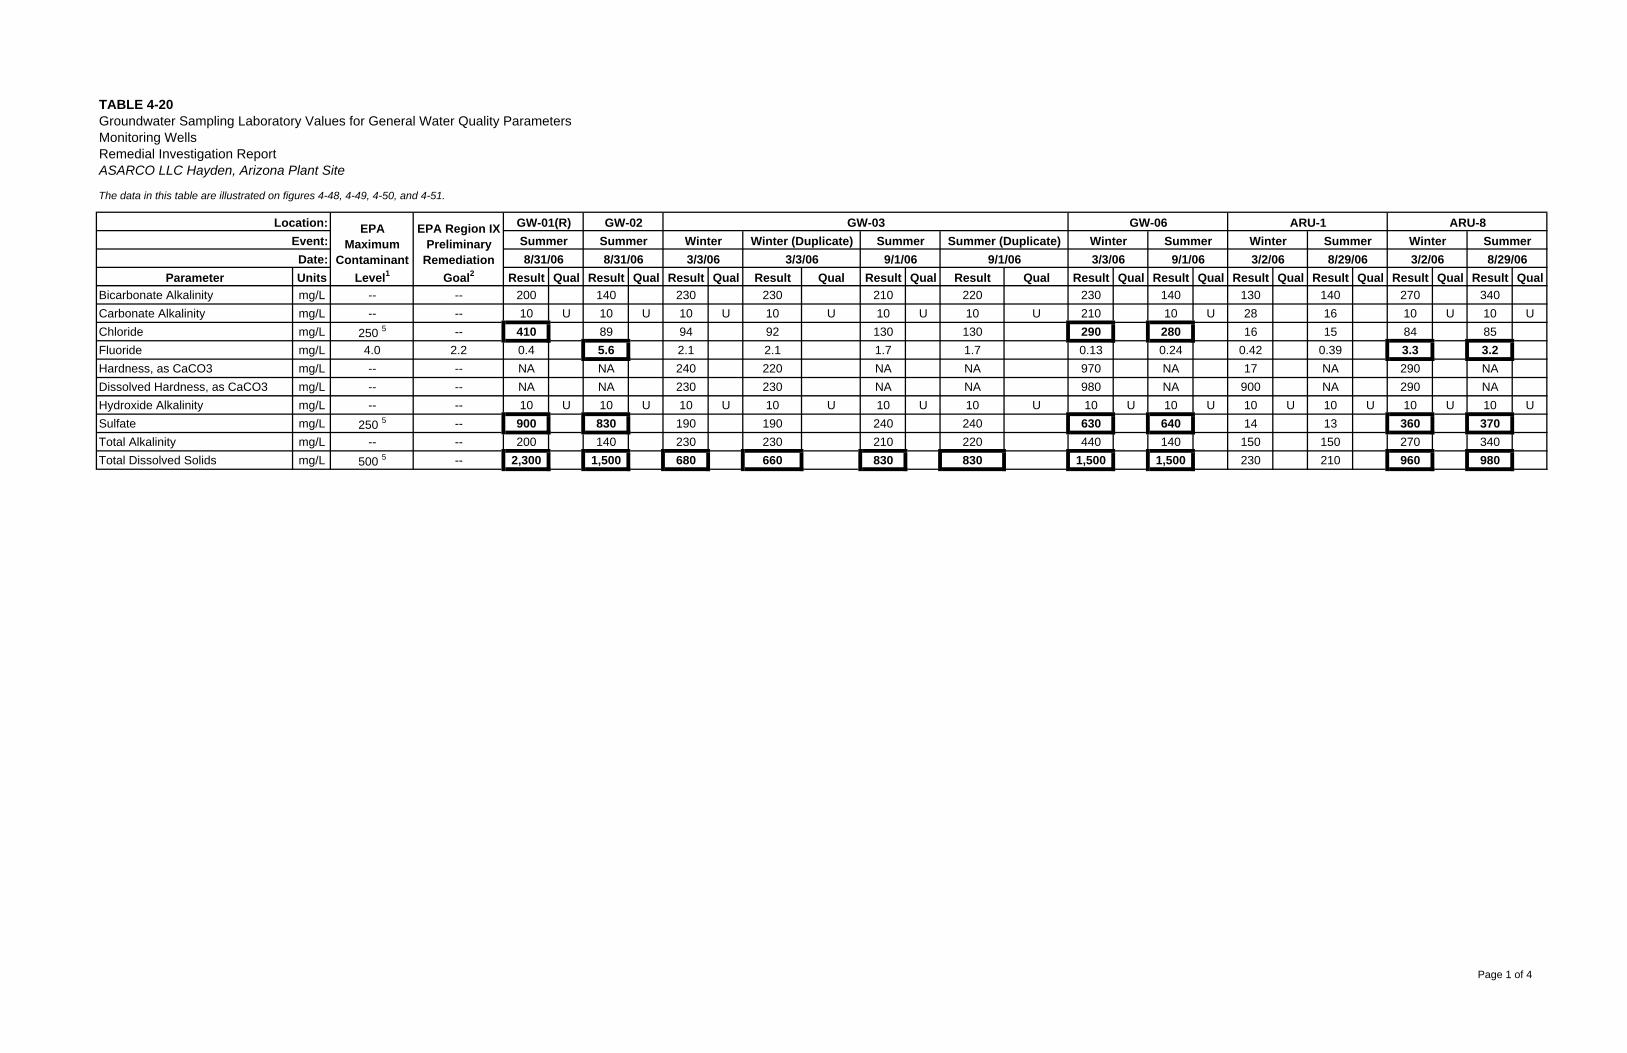
TABLE 4-20Groundwater Sampling Laboratory Values for General Water Quality ParametersMonitoring WellsRemedial Investigation ReportASARCO LLC Hayden, Arizona Plant Site
The data in this table are illustrated on figures 4-48, 4-49, 4-50, and 4-51.
Parameter Units Result Qual Result Qual Result Qual Result Qual Result Qual Result Qual Result Qual Result Qual Result Qual Result Qual Result Qual Result QualBicarbonate Alkalinity mg/L -- -- 200 140 230 230 210 220 230 140 130 140 270 340Carbonate Alkalinity mg/L -- -- 10 U 10 U 10 U 10 U 10 U 10 U 210 10 U 28 16 10 U 10 UChloride mg/L 250 5 -- 410 89 94 92 130 130 290 280 16 15 84 85Fluoride mg/L 4.0 2.2 0.4 5.6 2.1 2.1 1.7 1.7 0.13 0.24 0.42 0.39 3.3 3.2Hardness, as CaCO3 mg/L -- -- NA NA 240 220 NA NA 970 NA 17 NA 290 NADissolved Hardness, as CaCO3 mg/L -- -- NA NA 230 230 NA NA 980 NA 900 NA 290 NAHydroxide Alkalinity mg/L -- -- 10 U 10 U 10 U 10 U 10 U 10 U 10 U 10 U 10 U 10 U 10 U 10 USulfate mg/L 250 5 -- 900 830 190 190 240 240 630 640 14 13 360 370Total Alkalinity mg/L -- -- 200 140 230 230 210 220 440 140 150 150 270 340Total Dissolved Solids mg/L 500 5 -- 2,300 1,500 680 660 830 830 1,500 1,500 230 210 960 980
GW-03 GW-06Location: EPAMaximum
ContaminantLevel1
EPA Region IXPreliminary
RemediationGoal2
Date:Event: Summer
8/31/06 3/3/06Summer Summer Winter Winter (Duplicate) Summer Summer (Duplicate) WinterGW-01(R) GW-02
9/1/068/31/06 3/3/06 9/1/06 3/3/06 9/1/06 3/2/06 8/29/06 3/2/06 8/29/06
ARU-1 ARU-8Winter Summer Winter Summer
Page 1 of 4
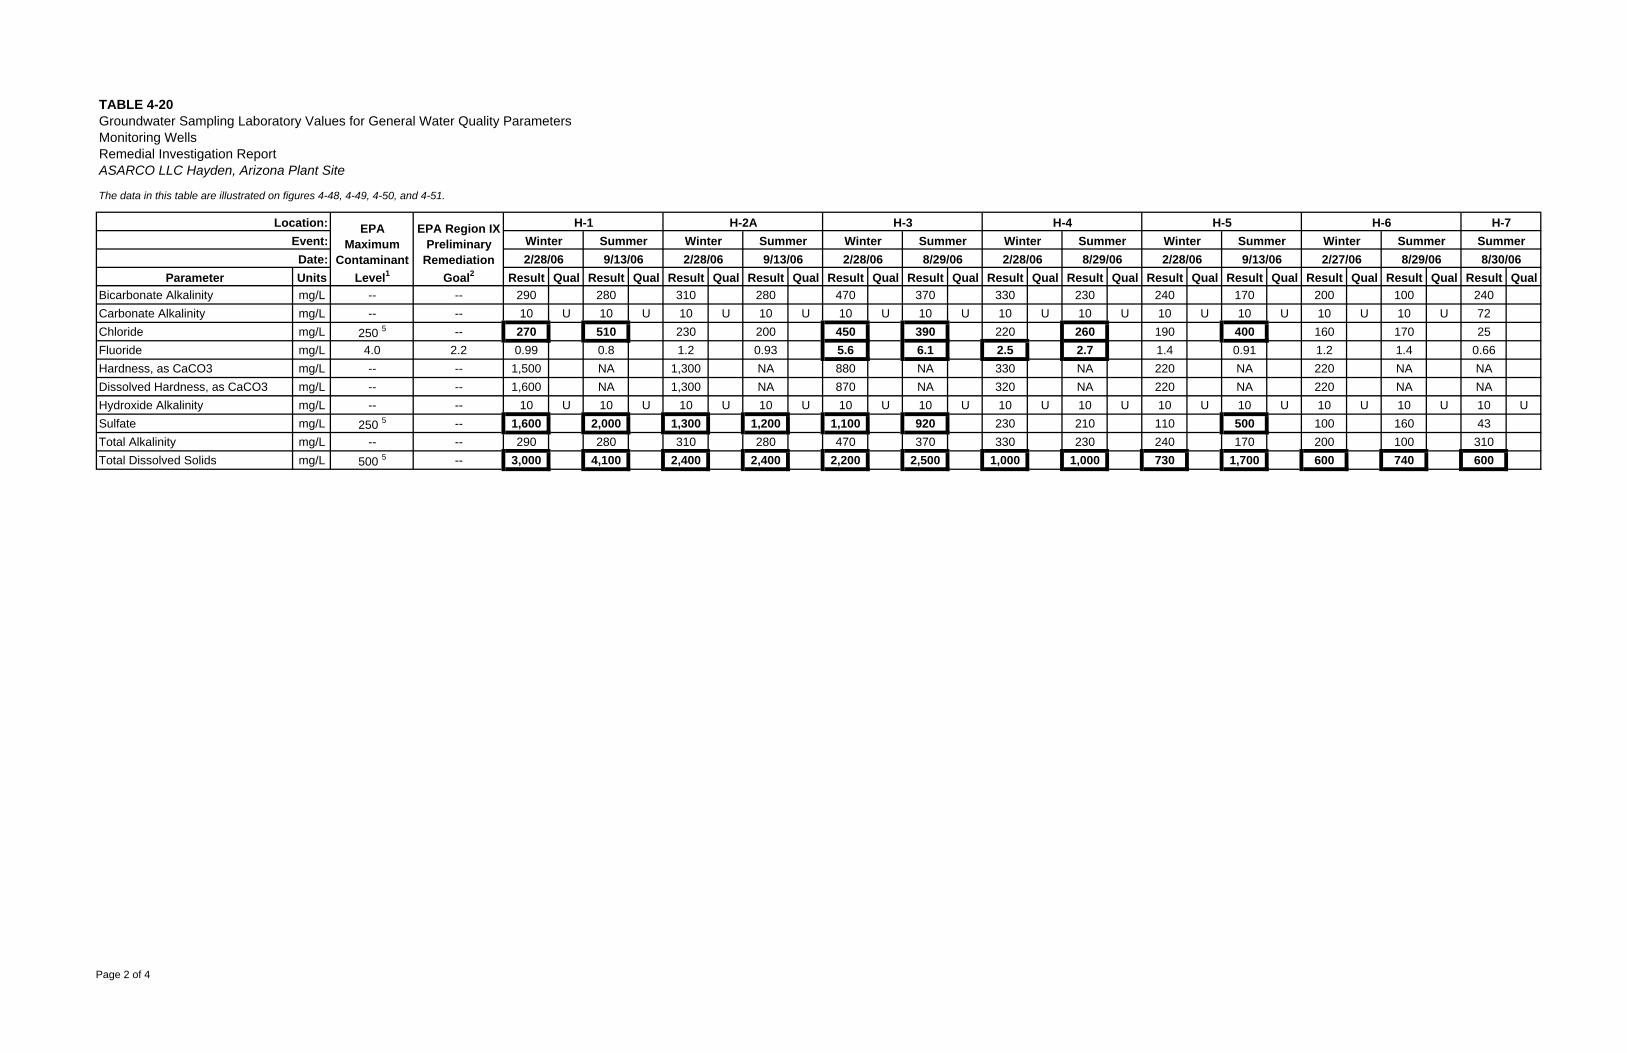
TABLE 4-20Groundwater Sampling Laboratory Values for General Water Quality ParametersMonitoring WellsRemedial Investigation ReportASARCO LLC Hayden, Arizona Plant Site
The data in this table are illustrated on figures 4-48, 4-49, 4-50, and 4-51.
Parameter Units Result Qual Result Qual Result Qual Result Qual Result Qual Result Qual Result Qual Result Qual Result Qual Result Qual Result Qual Result Qual Result QualBicarbonate Alkalinity mg/L -- -- 290 280 310 280 470 370 330 230 240 170 200 100 240Carbonate Alkalinity mg/L -- -- 10 U 10 U 10 U 10 U 10 U 10 U 10 U 10 U 10 U 10 U 10 U 10 U 72Chloride mg/L 250 5 -- 270 510 230 200 450 390 220 260 190 400 160 170 25Fluoride mg/L 4.0 2.2 0.99 0.8 1.2 0.93 5.6 6.1 2.5 2.7 1.4 0.91 1.2 1.4 0.66Hardness, as CaCO3 mg/L -- -- 1,500 NA 1,300 NA 880 NA 330 NA 220 NA 220 NA NADissolved Hardness, as CaCO3 mg/L -- -- 1,600 NA 1,300 NA 870 NA 320 NA 220 NA 220 NA NAHydroxide Alkalinity mg/L -- -- 10 U 10 U 10 U 10 U 10 U 10 U 10 U 10 U 10 U 10 U 10 U 10 U 10 USulfate mg/L 250 5 -- 1,600 2,000 1,300 1,200 1,100 920 230 210 110 500 100 160 43Total Alkalinity mg/L -- -- 290 280 310 280 470 370 330 230 240 170 200 100 310Total Dissolved Solids mg/L 500 5 -- 3,000 4,100 2,400 2,400 2,200 2,500 1,000 1,000 730 1,700 600 740 600
Location: EPAMaximum
ContaminantLevel1
EPA Region IXPreliminary
RemediationGoal2
Event:Date:
H-1 H-2A H-3 H-4 H-5 H-6 H-7Winter Summer Winter Summer Winter SummerWinter Summer Winter Summer SummerWinter
8/29/06 2/28/06Summer
2/28/06 8/29/06 2/28/06 2/27/06 8/29/06 8/30/062/28/06 9/13/06 2/28/06 9/13/06 9/13/06
Page 2 of 4
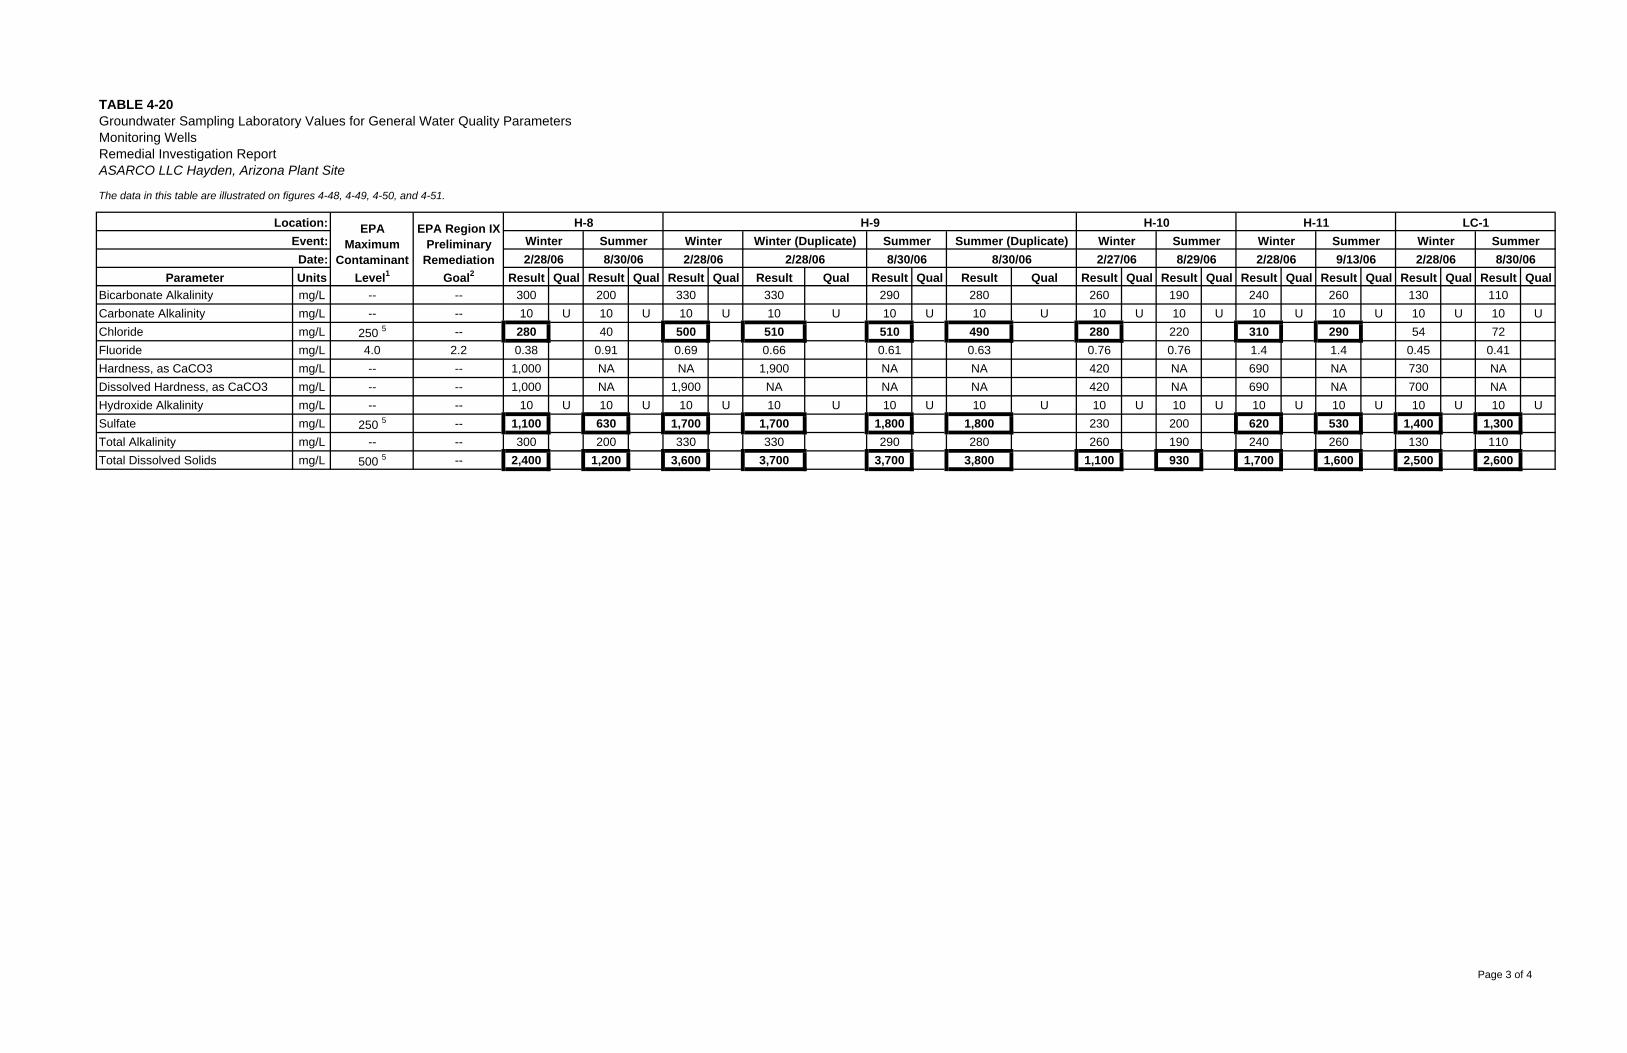
TABLE 4-20Groundwater Sampling Laboratory Values for General Water Quality ParametersMonitoring WellsRemedial Investigation ReportASARCO LLC Hayden, Arizona Plant Site
The data in this table are illustrated on figures 4-48, 4-49, 4-50, and 4-51.
Parameter Units Result Qual Result Qual Result Qual Result Qual Result Qual Result Qual Result Qual Result Qual Result Qual Result Qual Result Qual Result QualBicarbonate Alkalinity mg/L -- -- 300 200 330 330 290 280 260 190 240 260 130 110Carbonate Alkalinity mg/L -- -- 10 U 10 U 10 U 10 U 10 U 10 U 10 U 10 U 10 U 10 U 10 U 10 UChloride mg/L 250 5 -- 280 40 500 510 510 490 280 220 310 290 54 72Fluoride mg/L 4.0 2.2 0.38 0.91 0.69 0.66 0.61 0.63 0.76 0.76 1.4 1.4 0.45 0.41Hardness, as CaCO3 mg/L -- -- 1,000 NA NA 1,900 NA NA 420 NA 690 NA 730 NADissolved Hardness, as CaCO3 mg/L -- -- 1,000 NA 1,900 NA NA NA 420 NA 690 NA 700 NAHydroxide Alkalinity mg/L -- -- 10 U 10 U 10 U 10 U 10 U 10 U 10 U 10 U 10 U 10 U 10 U 10 USulfate mg/L 250 5 -- 1,100 630 1,700 1,700 1,800 1,800 230 200 620 530 1,400 1,300Total Alkalinity mg/L -- -- 300 200 330 330 290 280 260 190 240 260 130 110Total Dissolved Solids mg/L 500 5 -- 2,400 1,200 3,600 3,700 3,700 3,800 1,100 930 1,700 1,600 2,500 2,600
Location: EPAMaximum
ContaminantLevel1
EPA Region IXPreliminary
RemediationGoal2
Event:Date:
H-10 H-11H-8 LC-1Winter Summer
H-9Winter SummerWinter (Duplicate) Summer Summer (Duplicate) Winter SummerWinterWinter Summer
2/28/06 8/30/06 2/28/06 2/28/06 8/30/06 8/30/06 2/28/06 8/30/068/29/06 2/28/06 9/13/062/27/06
Page 3 of 4
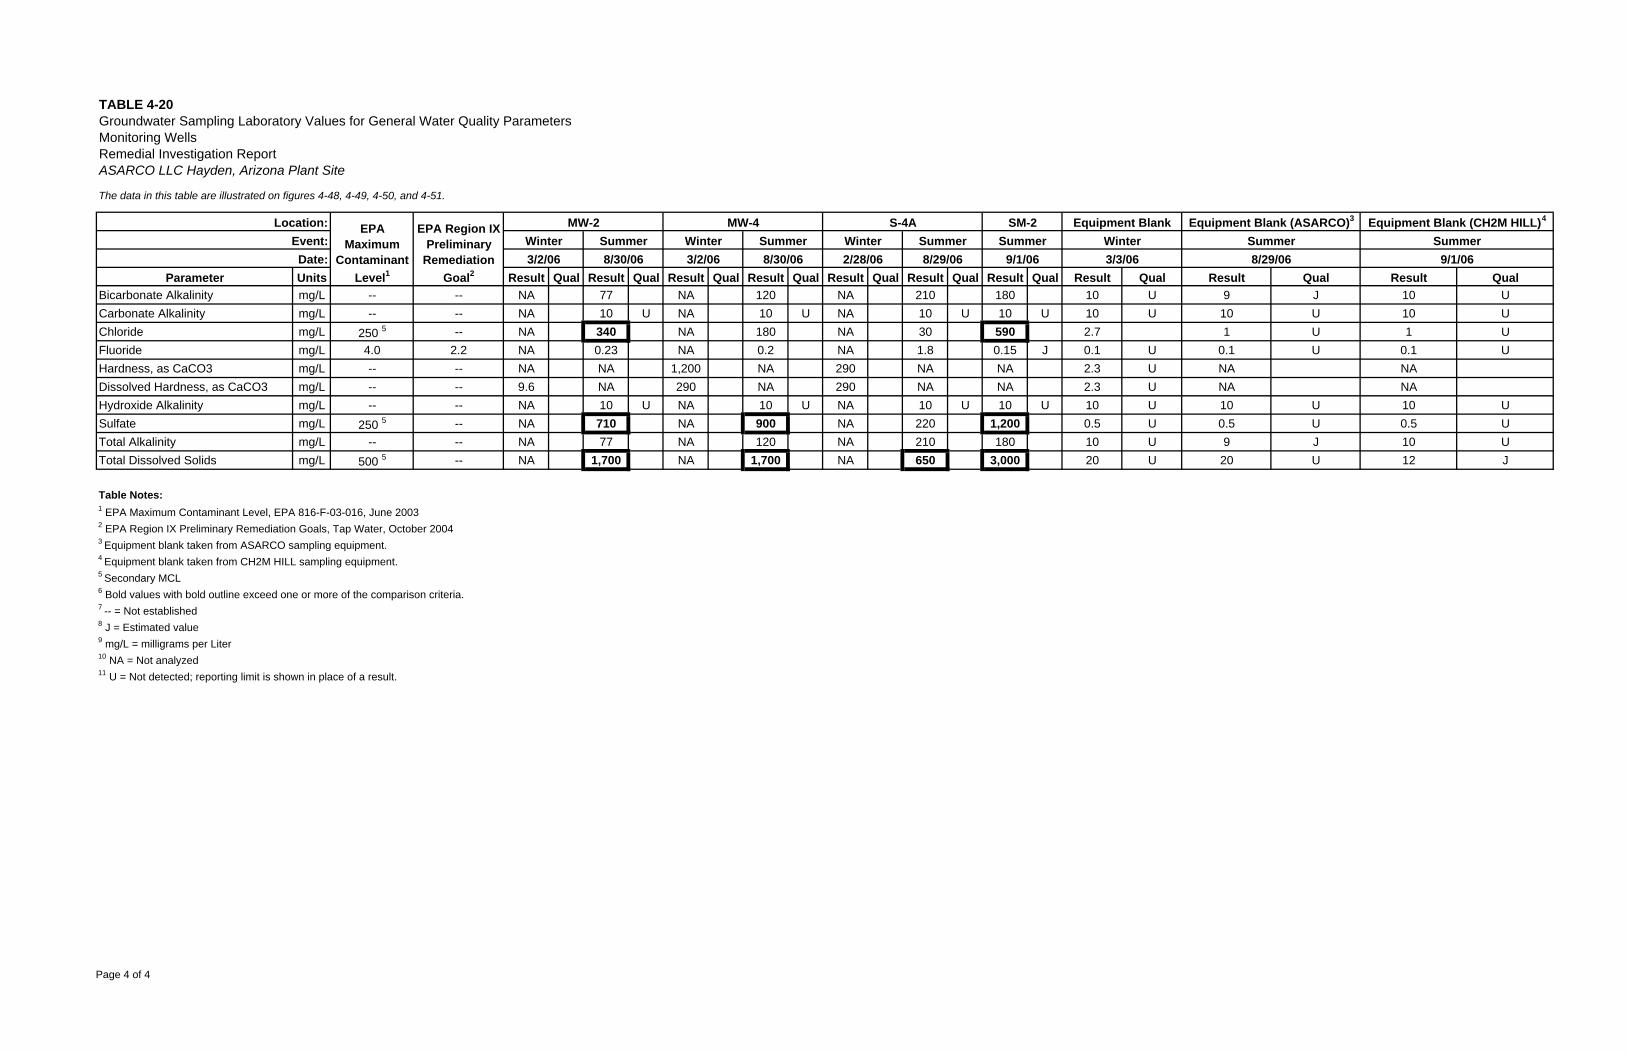
TABLE 4-20Groundwater Sampling Laboratory Values for General Water Quality ParametersMonitoring WellsRemedial Investigation ReportASARCO LLC Hayden, Arizona Plant Site
The data in this table are illustrated on figures 4-48, 4-49, 4-50, and 4-51.
Parameter Units Result Qual Result Qual Result Qual Result Qual Result Qual Result Qual Result Qual Result Qual Result Qual Result QualBicarbonate Alkalinity mg/L -- -- NA 77 NA 120 NA 210 180 10 U 9 J 10 UCarbonate Alkalinity mg/L -- -- NA 10 U NA 10 U NA 10 U 10 U 10 U 10 U 10 UChloride mg/L 250 5 -- NA 340 NA 180 NA 30 590 2.7 1 U 1 UFluoride mg/L 4.0 2.2 NA 0.23 NA 0.2 NA 1.8 0.15 J 0.1 U 0.1 U 0.1 UHardness, as CaCO3 mg/L -- -- NA NA 1,200 NA 290 NA NA 2.3 U NA NADissolved Hardness, as CaCO3 mg/L -- -- 9.6 NA 290 NA 290 NA NA 2.3 U NA NAHydroxide Alkalinity mg/L -- -- NA 10 U NA 10 U NA 10 U 10 U 10 U 10 U 10 USulfate mg/L 250 5 -- NA 710 NA 900 NA 220 1,200 0.5 U 0.5 U 0.5 UTotal Alkalinity mg/L -- -- NA 77 NA 120 NA 210 180 10 U 9 J 10 UTotal Dissolved Solids mg/L 500 5 -- NA 1,700 NA 1,700 NA 650 3,000 20 U 20 U 12 J
Table Notes:1 EPA Maximum Contaminant Level, EPA 816-F-03-016, June 20032 EPA Region IX Preliminary Remediation Goals, Tap Water, October 20043 Equipment blank taken from ASARCO sampling equipment.4 Equipment blank taken from CH2M HILL sampling equipment.5 Secondary MCL6 Bold values with bold outline exceed one or more of the comparison criteria.7 -- = Not established8 J = Estimated value9 mg/L = milligrams per Liter10 NA = Not analyzed11 U = Not detected; reporting limit is shown in place of a result.
MW-4Summer
Location: EPAMaximum
ContaminantLevel1
EPA Region IXPreliminary
RemediationGoal2
Event:Date:
Winter3/2/06 8/30/06
SM-2Summer
9/1/063/2/06 8/30/06SummerWinter
MW-2
3/3/06 8/29/06 9/1/06
Equipment Blank Equipment Blank (ASARCO)3 Equipment Blank (CH2M HILL)4
Winter Summer SummerS-4A
Winter Summer2/28/06 8/29/06
Page 4 of 4
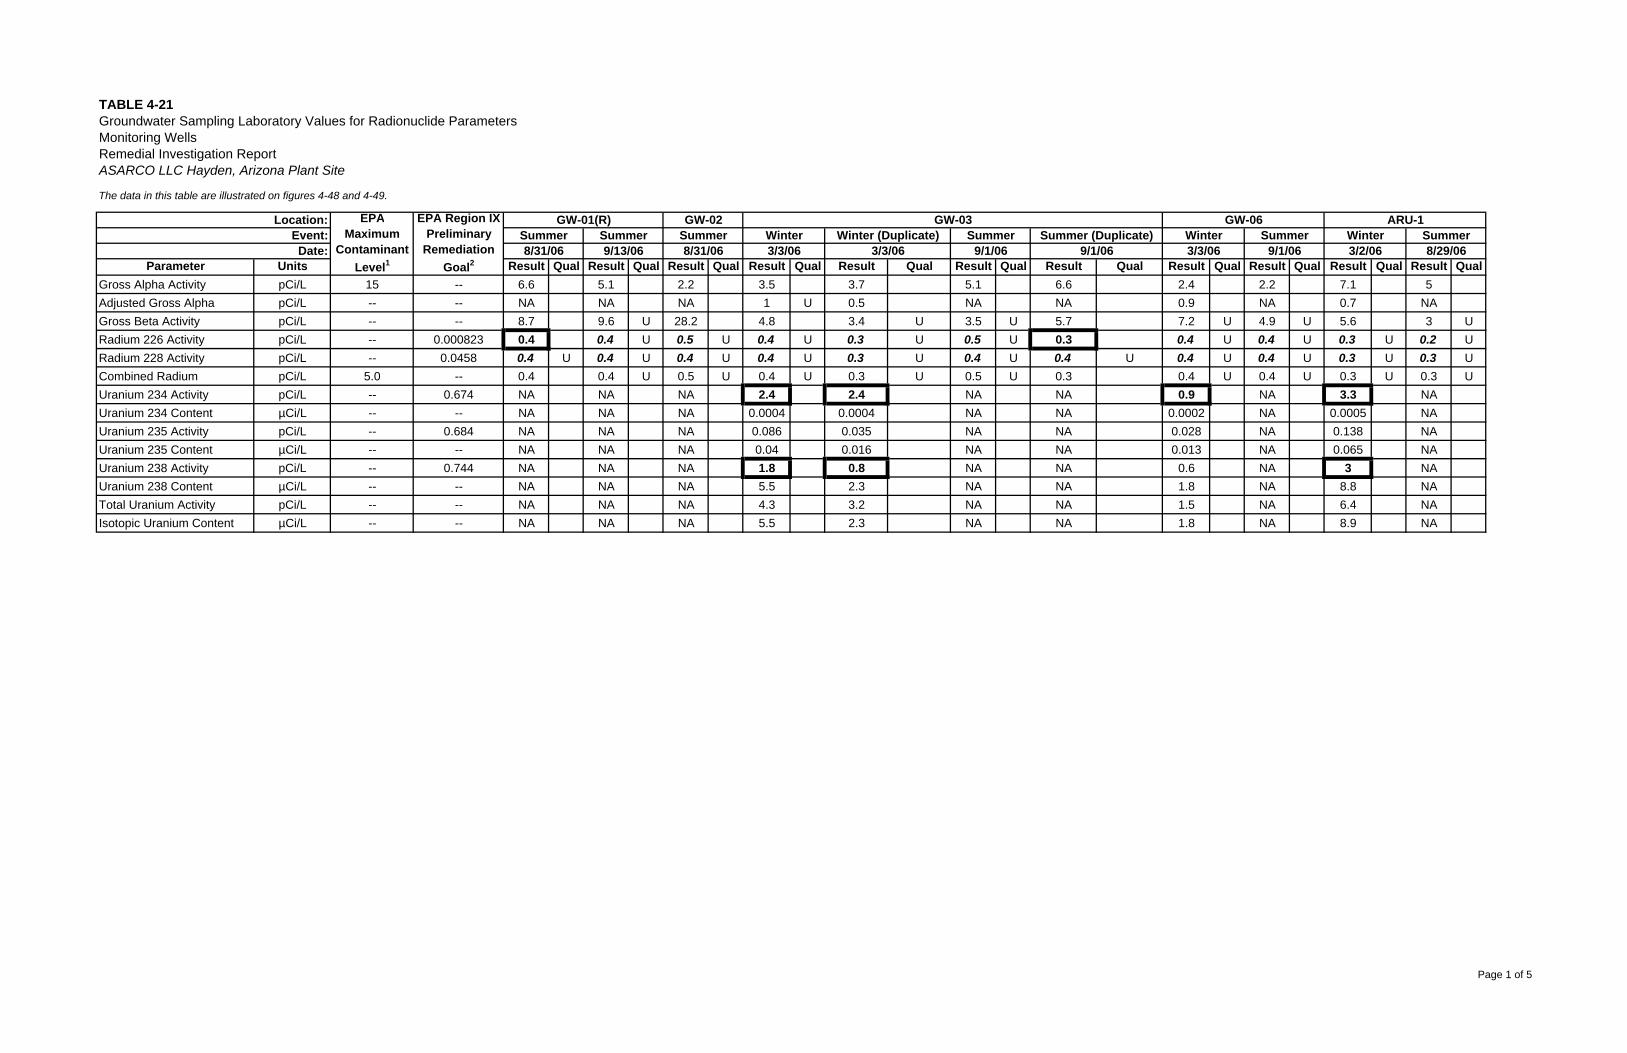
TABLE 4-21Groundwater Sampling Laboratory Values for Radionuclide ParametersMonitoring Wells
The data in this table are illustrated on figures 4-48 and 4-49.
Parameter Units Result Qual Result Qual Result Qual Result Qual Result Qual Result Qual Result Qual Result Qual Result Qual Result Qual Result QualGross Alpha Activity pCi/L 15 -- 6.6 5.1 2.2 3.5 3.7 5.1 6.6 2.4 2.2 7.1 5Adjusted Gross Alpha pCi/L -- -- NA NA NA 1 U 0.5 NA NA 0.9 NA 0.7 NAGross Beta Activity pCi/L -- -- 8.7 9.6 U 28.2 4.8 3.4 U 3.5 U 5.7 7.2 U 4.9 U 5.6 3 URadium 226 Activity pCi/L -- 0.000823 0.4 0.4 U 0.5 U 0.4 U 0.3 U 0.5 U 0.3 0.4 U 0.4 U 0.3 U 0.2 URadium 228 Activity pCi/L -- 0.0458 0.4 U 0.4 U 0.4 U 0.4 U 0.3 U 0.4 U 0.4 U 0.4 U 0.4 U 0.3 U 0.3 UCombined Radium pCi/L 5.0 -- 0.4 0.4 U 0.5 U 0.4 U 0.3 U 0.5 U 0.3 0.4 U 0.4 U 0.3 U 0.3 UUranium 234 Activity pCi/L -- 0.674 NA NA NA 2.4 2.4 NA NA 0.9 NA 3.3 NAUranium 234 Content µCi/L -- -- NA NA NA 0.0004 0.0004 NA NA 0.0002 NA 0.0005 NAUranium 235 Activity pCi/L -- 0.684 NA NA NA 0.086 0.035 NA NA 0.028 NA 0.138 NAUranium 235 Content µCi/L -- -- NA NA NA 0.04 0.016 NA NA 0.013 NA 0.065 NAUranium 238 Activity pCi/L -- 0.744 NA NA NA 1.8 0.8 NA NA 0.6 NA 3 NAUranium 238 Content µCi/L -- -- NA NA NA 5.5 2.3 NA NA 1.8 NA 8.8 NATotal Uranium Activity pCi/L -- -- NA NA NA 4.3 3.2 NA NA 1.5 NA 6.4 NAIsotopic Uranium Content µCi/L -- -- NA NA NA 5.5 2.3 NA NA 1.8 NA 8.9 NA
8/31/06 3/3/06 9/1/068/31/06 3/3/06 9/1/06 3/3/06 9/1/06Summer Winter SummerWinter (Duplicate) Summer
8/29/06
GW-02 GW-03 GW-06 ARU-1WinterEvent: Winter
Remedial Investigation ReportASARCO LLC Hayden, Arizona Plant Site
Location: EPAMaximum
ContaminantLevel1
EPA Region IXPreliminary
RemediationGoal2
Date: 3/2/06Summer
9/13/06
GW-01(R)SummerSummer Summer (Duplicate)
Page 1 of 5

TABLE 4-21Groundwater Sampling Laboratory Values for Radionuclide ParametersMonitoring WellsRemedial Investigation ReportASARCO LLC Hayden, Arizona Plant Site
The data in this table are illustrated on figures 4-48 and 4-49.
Parameter Units Result Qual Result Qual Result Qual Result Qual Result Qual Result Qual Result Qual Result Qual Result Qual Result Qual Result Qual Result QualGross Alpha Activity pCi/L 15 -- 5.4 7.8 2.2 3.5 1.7 4 21.7 16.3 8.8 6.2 2.1 6.7Adjusted Gross Alpha pCi/L -- -- 0.1 NA 0.2 NA 1 U NA 2.3 NA 0.9 NA 1 NAGross Beta Activity pCi/L -- -- 9.8 6.5 7.8 U 7.9 8.1 U 7.9 15 9.4 U 11 6.6 U 7.2 6.9Radium 226 Activity pCi/L -- 0.000823 0.3 U 0.2 U 0.4 U 0.5 U 0.4 U 0.5 U 0.4 U 0.3 U 0.3 U 0.3 U 0.3 U 0.6 URadium 228 Activity pCi/L -- 0.0458 0.3 U 0.3 U 0.4 U 0.4 U 0.4 U 0.4 U 0.4 U 0.3 U 0.4 U 0.4 U 0.3 U 0.3 UCombined Radium pCi/L 5.0 -- 0.3 U 0.3 U 0.4 U 0.5 U 0.4 U 0.5 U 0.4 U 0.3 U 0.4 U 0.4 U 0.3 U 0.6 UUranium 234 Activity pCi/L -- 0.674 2.8 NA 1.1 NA 1.4 NA 13.9 NA 4.8 NA 0.6 NAUranium 234 Content µCi/L -- -- 0.0004 NA 0.0002 NA 0.0002 NA 0.0022 NA 0.0008 NA 0.0001 NAUranium 235 Activity pCi/L -- 0.684 0.111 NA 0.038 NA 0.04 NA 0.247 NA 0.136 NA 0.023 NAUranium 235 Content µCi/L -- -- 0.052 NA 0.018 NA 0.019 NA 0.115 NA 0.063 NA 0.011 NAUranium 238 Activity pCi/L -- 0.744 2.4 NA 0.8 NA 0.9 NA 5.3 NA 2.9 NA 0.5 NAUranium 238 Content µCi/L -- -- 7.1 NA 2.4 NA 2.6 NA 15.8 NA 8.7 NA 1.4 NATotal Uranium Activity pCi/L -- -- 5.3 NA 2 NA 2.3 NA 19.4 NA 7.9 NA 1.1 NAIsotopic Uranium Content µCi/L -- -- 7.1 NA 2.4 NA 2.6 NA 15.9 NA 8.7 NA 1.5 NA
Location: EPAMaximum
ContaminantLevel1
EPA Region IXPreliminary
RemediationGoal2
Event:Date: 8/29/06 2/28/06 8/29/062/28/06 9/13/06 2/28/06 9/13/06 2/28/06 9/13/06
Winter SummerWinter SummerH-3 H-4
Winter SummerWinter Summer Winter Summer2/28/06
H-5Winter
ARU-8 H-1 H-2ASummer
3/2/06 8/29/06
Page 2 of 5
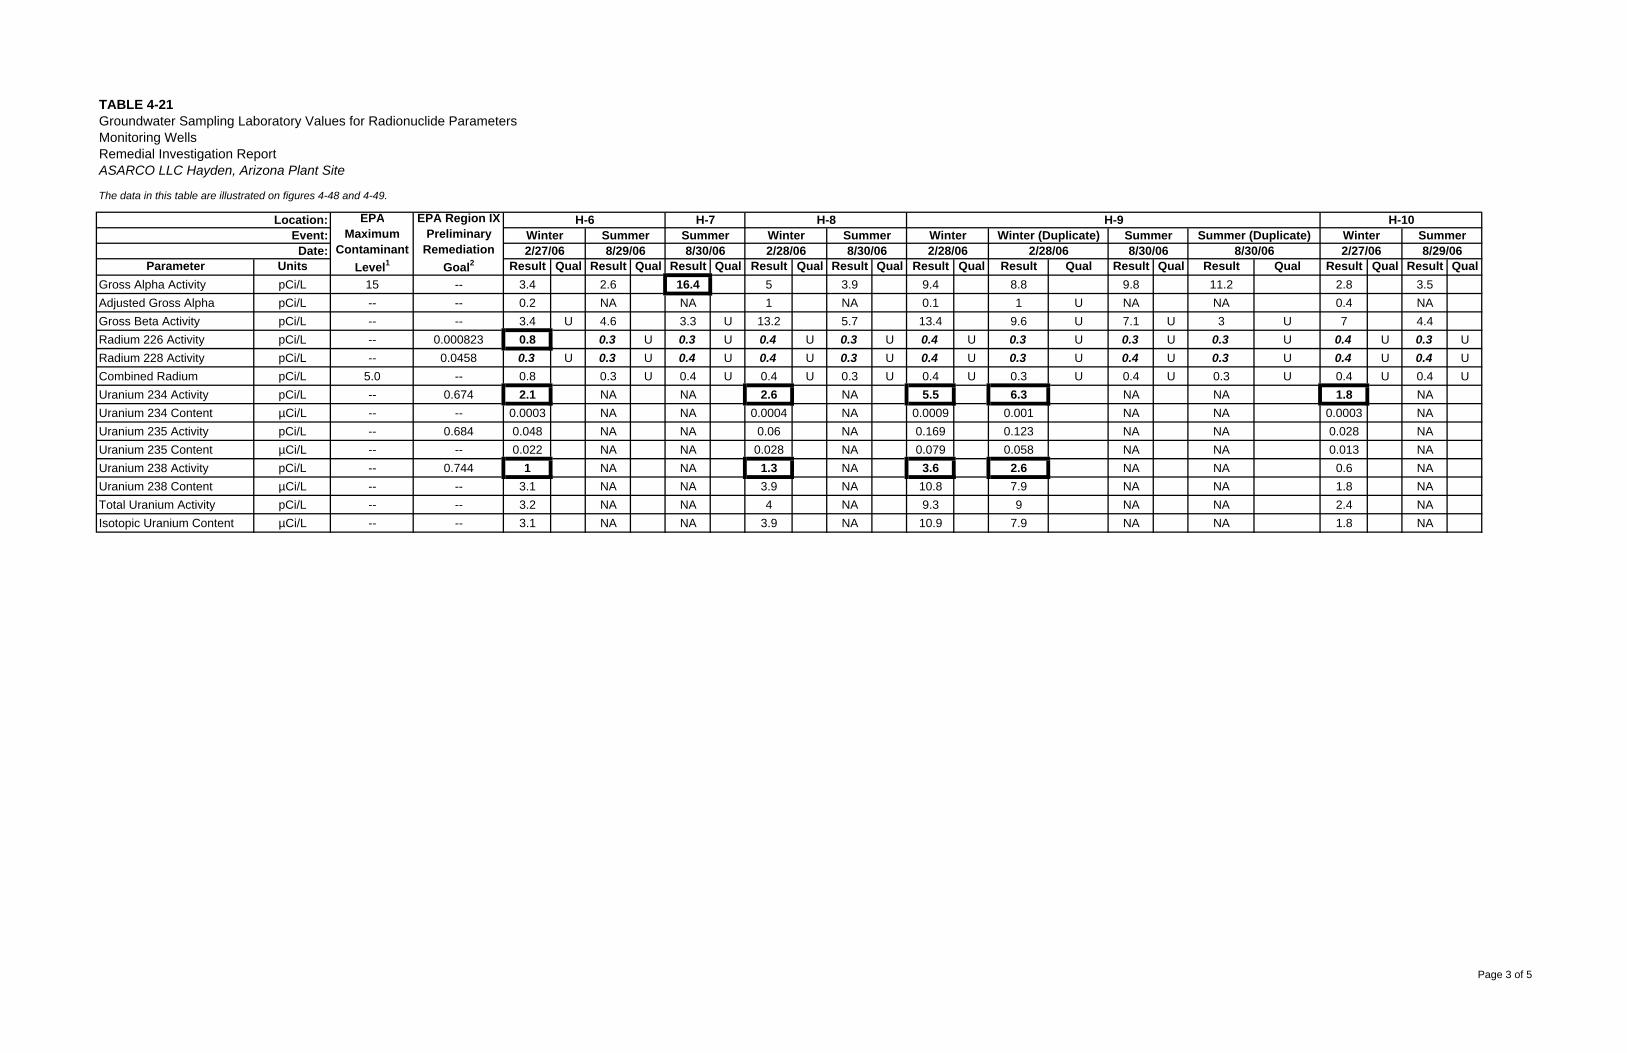
TABLE 4-21Groundwater Sampling Laboratory Values for Radionuclide ParametersMonitoring Wells
The data in this table are illustrated on figures 4-48 and 4-49.
Parameter Units Result Qual Result Qual Result Qual Result Qual Result Qual Result Qual Result Qual Result Qual Result Qual Result Qual Result QualGross Alpha Activity pCi/L 15 -- 3.4 2.6 16.4 5 3.9 9.4 8.8 9.8 11.2 2.8 3.5Adjusted Gross Alpha pCi/L -- -- 0.2 NA NA 1 NA 0.1 1 U NA NA 0.4 NAGross Beta Activity pCi/L -- -- 3.4 U 4.6 3.3 U 13.2 5.7 13.4 9.6 U 7.1 U 3 U 7 4.4Radium 226 Activity pCi/L -- 0.000823 0.8 0.3 U 0.3 U 0.4 U 0.3 U 0.4 U 0.3 U 0.3 U 0.3 U 0.4 U 0.3 URadium 228 Activity pCi/L -- 0.0458 0.3 U 0.3 U 0.4 U 0.4 U 0.3 U 0.4 U 0.3 U 0.4 U 0.3 U 0.4 U 0.4 UCombined Radium pCi/L 5.0 -- 0.8 0.3 U 0.4 U 0.4 U 0.3 U 0.4 U 0.3 U 0.4 U 0.3 U 0.4 U 0.4 UUranium 234 Activity pCi/L -- 0.674 2.1 NA NA 2.6 NA 5.5 6.3 NA NA 1.8 NAUranium 234 Content µCi/L -- -- 0.0003 NA NA 0.0004 NA 0.0009 0.001 NA NA 0.0003 NAUranium 235 Activity pCi/L -- 0.684 0.048 NA NA 0.06 NA 0.169 0.123 NA NA 0.028 NAUranium 235 Content µCi/L -- -- 0.022 NA NA 0.028 NA 0.079 0.058 NA NA 0.013 NAUranium 238 Activity pCi/L -- 0.744 1 NA NA 1.3 NA 3.6 2.6 NA NA 0.6 NAUranium 238 Content µCi/L -- -- 3.1 NA NA 3.9 NA 10.8 7.9 NA NA 1.8 NATotal Uranium Activity pCi/L -- -- 3.2 NA NA 4 NA 9.3 9 NA NA 2.4 NAIsotopic Uranium Content µCi/L -- -- 3.1 NA NA 3.9 NA 10.9 7.9 NA NA 1.8 NA
Remedial Investigation ReportASARCO LLC Hayden, Arizona Plant Site
Location: EPAMaximum
ContaminantLevel1
EPA Region IXPreliminary
RemediationGoal2
Event:Date: 2/28/06 8/30/06 8/30/06 2/27/06 8/29/062/27/06 8/29/06 8/30/06 2/28/06 8/30/06 2/28/06
Summer Winter Winter (Duplicate) Summer Summer (Duplicate) Winter SummerSummer WinterWinter SummerH-6 H-7 H-8 H-9 H-10
Page 3 of 5
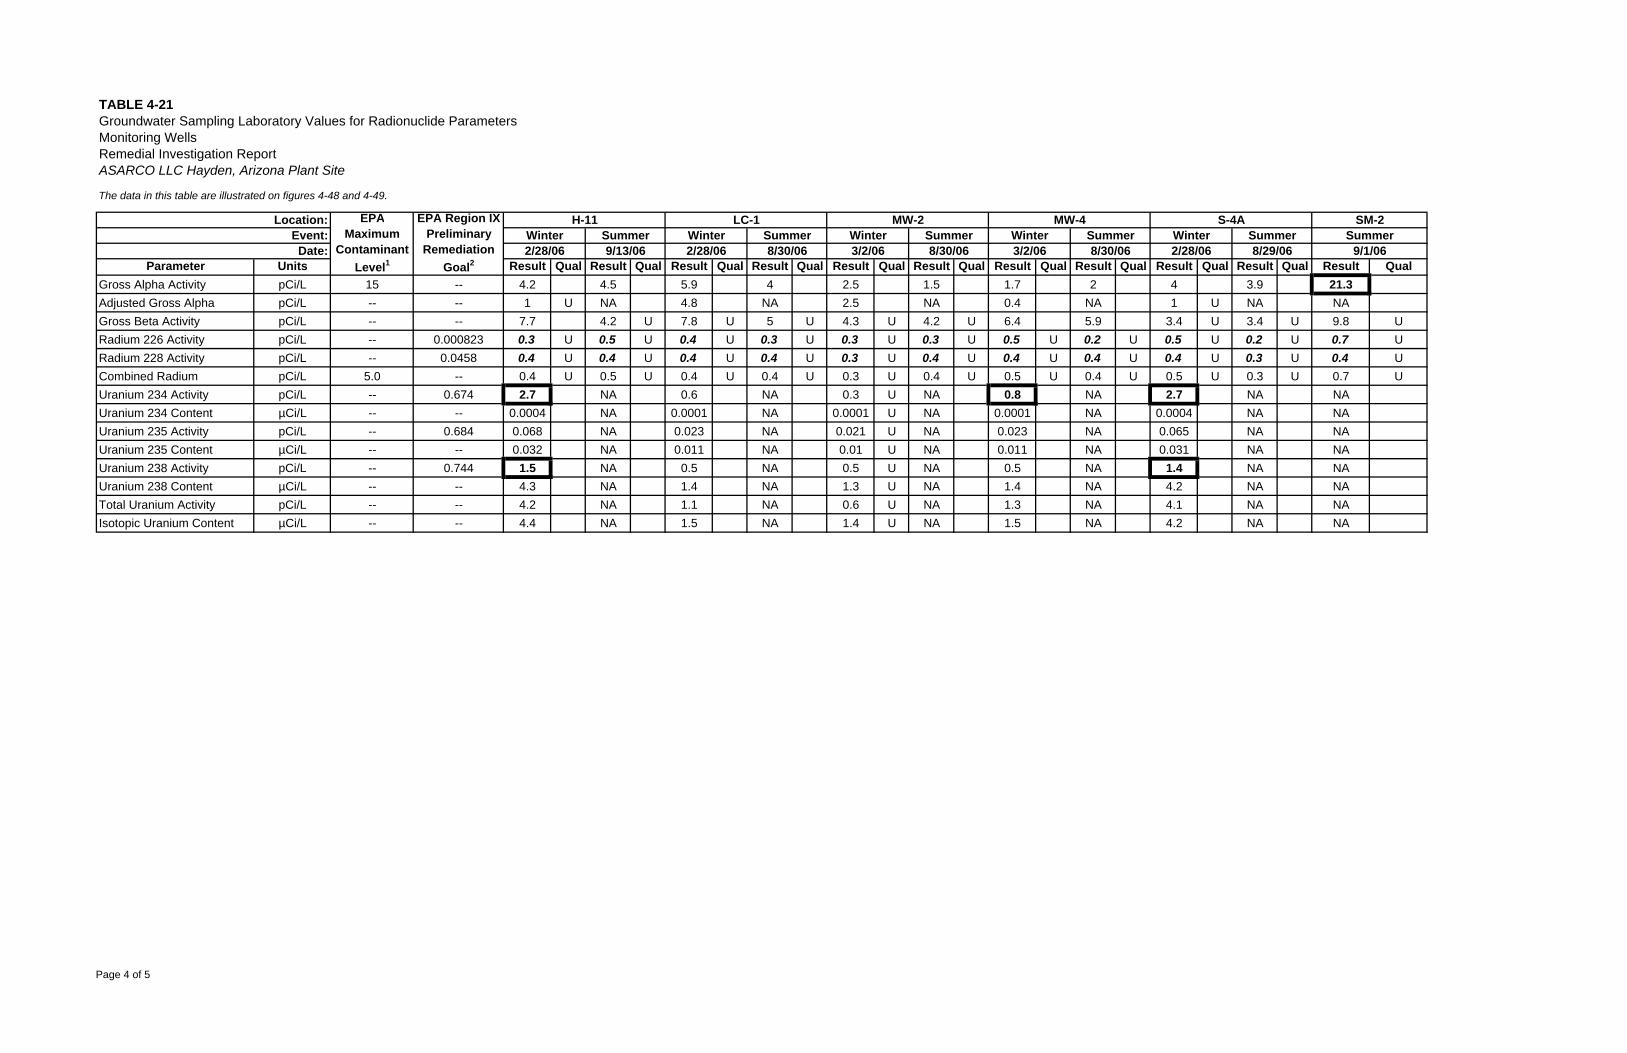
TABLE 4-21Groundwater Sampling Laboratory Values for Radionuclide ParametersMonitoring Wells
The data in this table are illustrated on figures 4-48 and 4-49.
Parameter Units Result Qual Result Qual Result Qual Result Qual Result Qual Result Qual Result Qual Result Qual Result Qual Result Qual Result QualGross Alpha Activity pCi/L 15 -- 4.2 4.5 5.9 4 2.5 1.5 1.7 2 4 3.9 21.3Adjusted Gross Alpha pCi/L -- -- 1 U NA 4.8 NA 2.5 NA 0.4 NA 1 U NA NAGross Beta Activity pCi/L -- -- 7.7 4.2 U 7.8 U 5 U 4.3 U 4.2 U 6.4 5.9 3.4 U 3.4 U 9.8 URadium 226 Activity pCi/L -- 0.000823 0.3 U 0.5 U 0.4 U 0.3 U 0.3 U 0.3 U 0.5 U 0.2 U 0.5 U 0.2 U 0.7 URadium 228 Activity pCi/L -- 0.0458 0.4 U 0.4 U 0.4 U 0.4 U 0.3 U 0.4 U 0.4 U 0.4 U 0.4 U 0.3 U 0.4 UCombined Radium pCi/L 5.0 -- 0.4 U 0.5 U 0.4 U 0.4 U 0.3 U 0.4 U 0.5 U 0.4 U 0.5 U 0.3 U 0.7 UUranium 234 Activity pCi/L -- 0.674 2.7 NA 0.6 NA 0.3 U NA 0.8 NA 2.7 NA NAUranium 234 Content µCi/L -- -- 0.0004 NA 0.0001 NA 0.0001 U NA 0.0001 NA 0.0004 NA NAUranium 235 Activity pCi/L -- 0.684 0.068 NA 0.023 NA 0.021 U NA 0.023 NA 0.065 NA NAUranium 235 Content µCi/L -- -- 0.032 NA 0.011 NA 0.01 U NA 0.011 NA 0.031 NA NAUranium 238 Activity pCi/L -- 0.744 1.5 NA 0.5 NA 0.5 U NA 0.5 NA 1.4 NA NAUranium 238 Content µCi/L -- -- 4.3 NA 1.4 NA 1.3 U NA 1.4 NA 4.2 NA NATotal Uranium Activity pCi/L -- -- 4.2 NA 1.1 NA 0.6 U NA 1.3 NA 4.1 NA NAIsotopic Uranium Content µCi/L -- -- 4.4 NA 1.5 NA 1.4 U NA 1.5 NA 4.2 NA NA
Remedial Investigation ReportASARCO LLC Hayden, Arizona Plant Site
Location: EPAMaximum
ContaminantLevel1
EPA Region IXPreliminary
RemediationGoal2
Event:Date:
Winter8/30/06 3/2/062/28/06 9/13/06 8/30/06
Summer8/29/063/2/06 8/30/06
SummerWinterSummer2/28/06Winter SummerWinter Summer
MW-4H-11 LC-1 MW-2 SM-2Summer
9/1/06
S-4AWinter2/28/06
Page 4 of 5
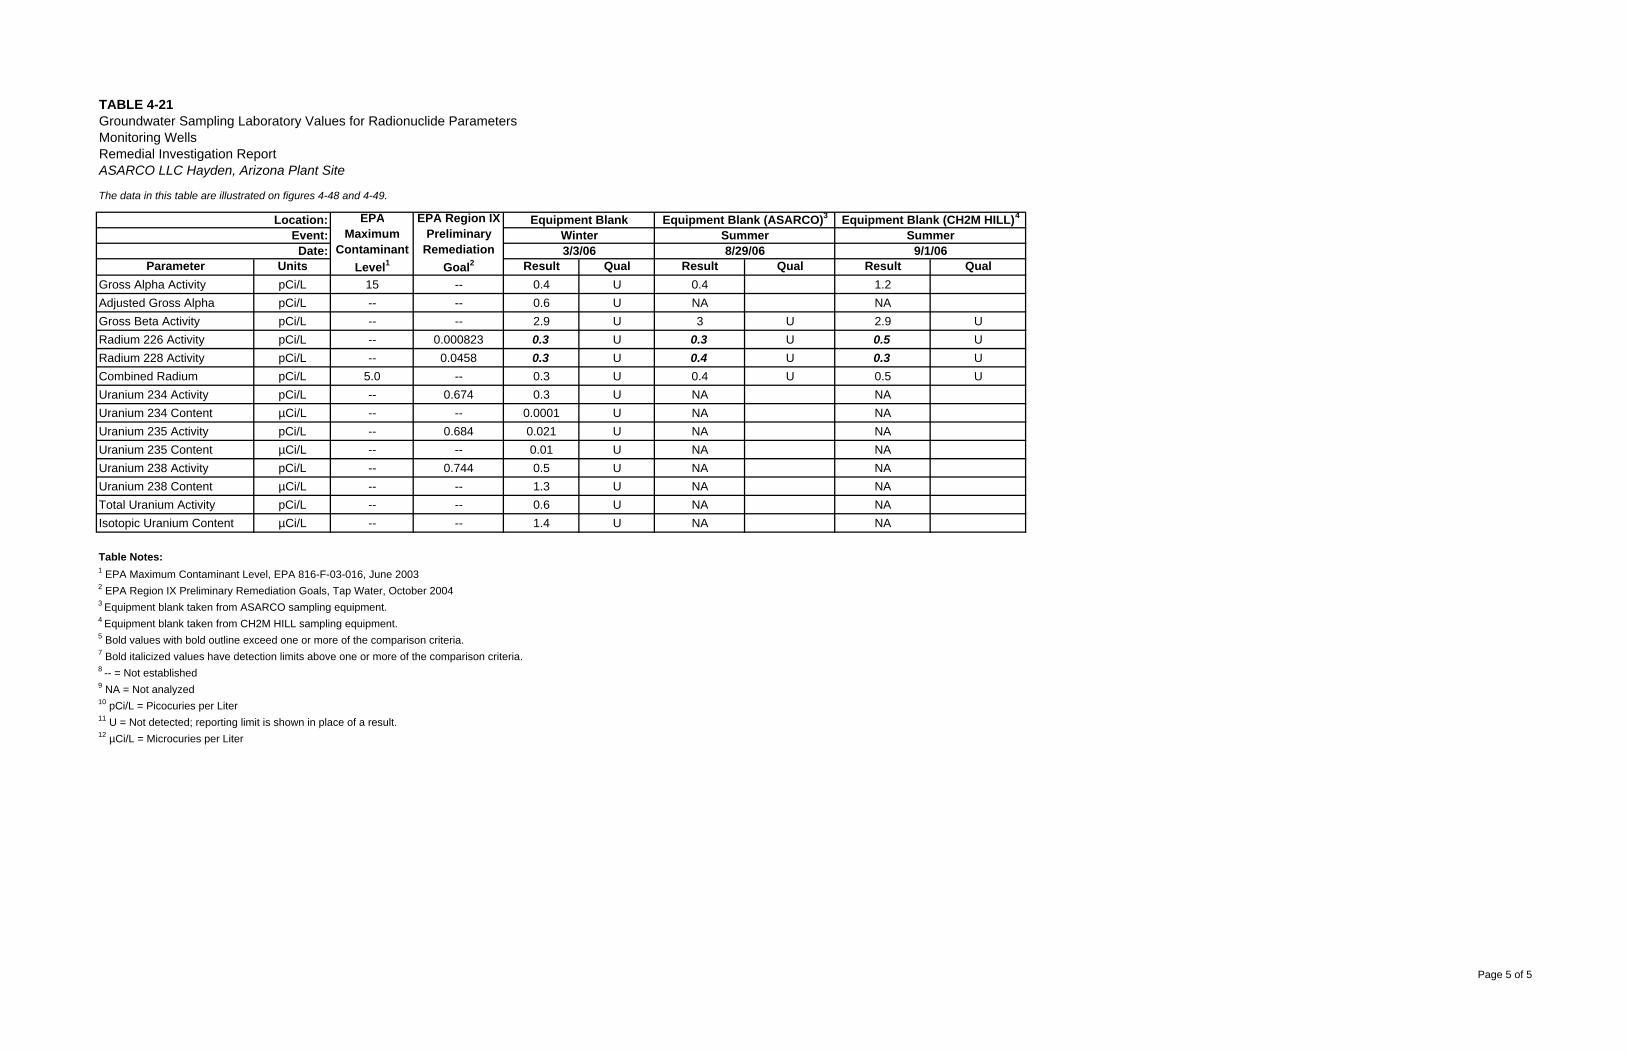
TABLE 4-21Groundwater Sampling Laboratory Values for Radionuclide ParametersMonitoring Wells
The data in this table are illustrated on figures 4-48 and 4-49.
Parameter Units Result Qual Result Qual Result QualGross Alpha Activity pCi/L 15 -- 0.4 U 0.4 1.2Adjusted Gross Alpha pCi/L -- -- 0.6 U NA NAGross Beta Activity pCi/L -- -- 2.9 U 3 U 2.9 URadium 226 Activity pCi/L -- 0.000823 0.3 U 0.3 U 0.5 URadium 228 Activity pCi/L -- 0.0458 0.3 U 0.4 U 0.3 UCombined Radium pCi/L 5.0 -- 0.3 U 0.4 U 0.5 UUranium 234 Activity pCi/L -- 0.674 0.3 U NA NAUranium 234 Content µCi/L -- -- 0.0001 U NA NAUranium 235 Activity pCi/L -- 0.684 0.021 U NA NAUranium 235 Content µCi/L -- -- 0.01 U NA NAUranium 238 Activity pCi/L -- 0.744 0.5 U NA NAUranium 238 Content µCi/L -- -- 1.3 U NA NATotal Uranium Activity pCi/L -- -- 0.6 U NA NAIsotopic Uranium Content µCi/L -- -- 1.4 U NA NA
Table Notes:1 EPA Maximum Contaminant Level, EPA 816-F-03-016, June 20032 EPA Region IX Preliminary Remediation Goals, Tap Water, October 20043 Equipment blank taken from ASARCO sampling equipment.4 Equipment blank taken from CH2M HILL sampling equipment.5 Bold values with bold outline exceed one or more of the comparison criteria.7 Bold italicized values have detection limits above one or more of the comparison criteria.8 -- = Not established9 NA = Not analyzed10 pCi/L = Picocuries per Liter11 U = Not detected; reporting limit is shown in place of a result.12 µCi/L = Microcuries per Liter
Remedial Investigation ReportASARCO LLC Hayden, Arizona Plant Site
Location: EPAMaximum
ContaminantLevel1
EPA Region IXPreliminary
RemediationGoal2
Event:Date: 9/1/06
Equipment Blank Equipment Blank (ASARCO)3 Equipment Blank (CH2M HILL)4
Winter Summer Summer3/3/06 8/29/06
Page 5 of 5
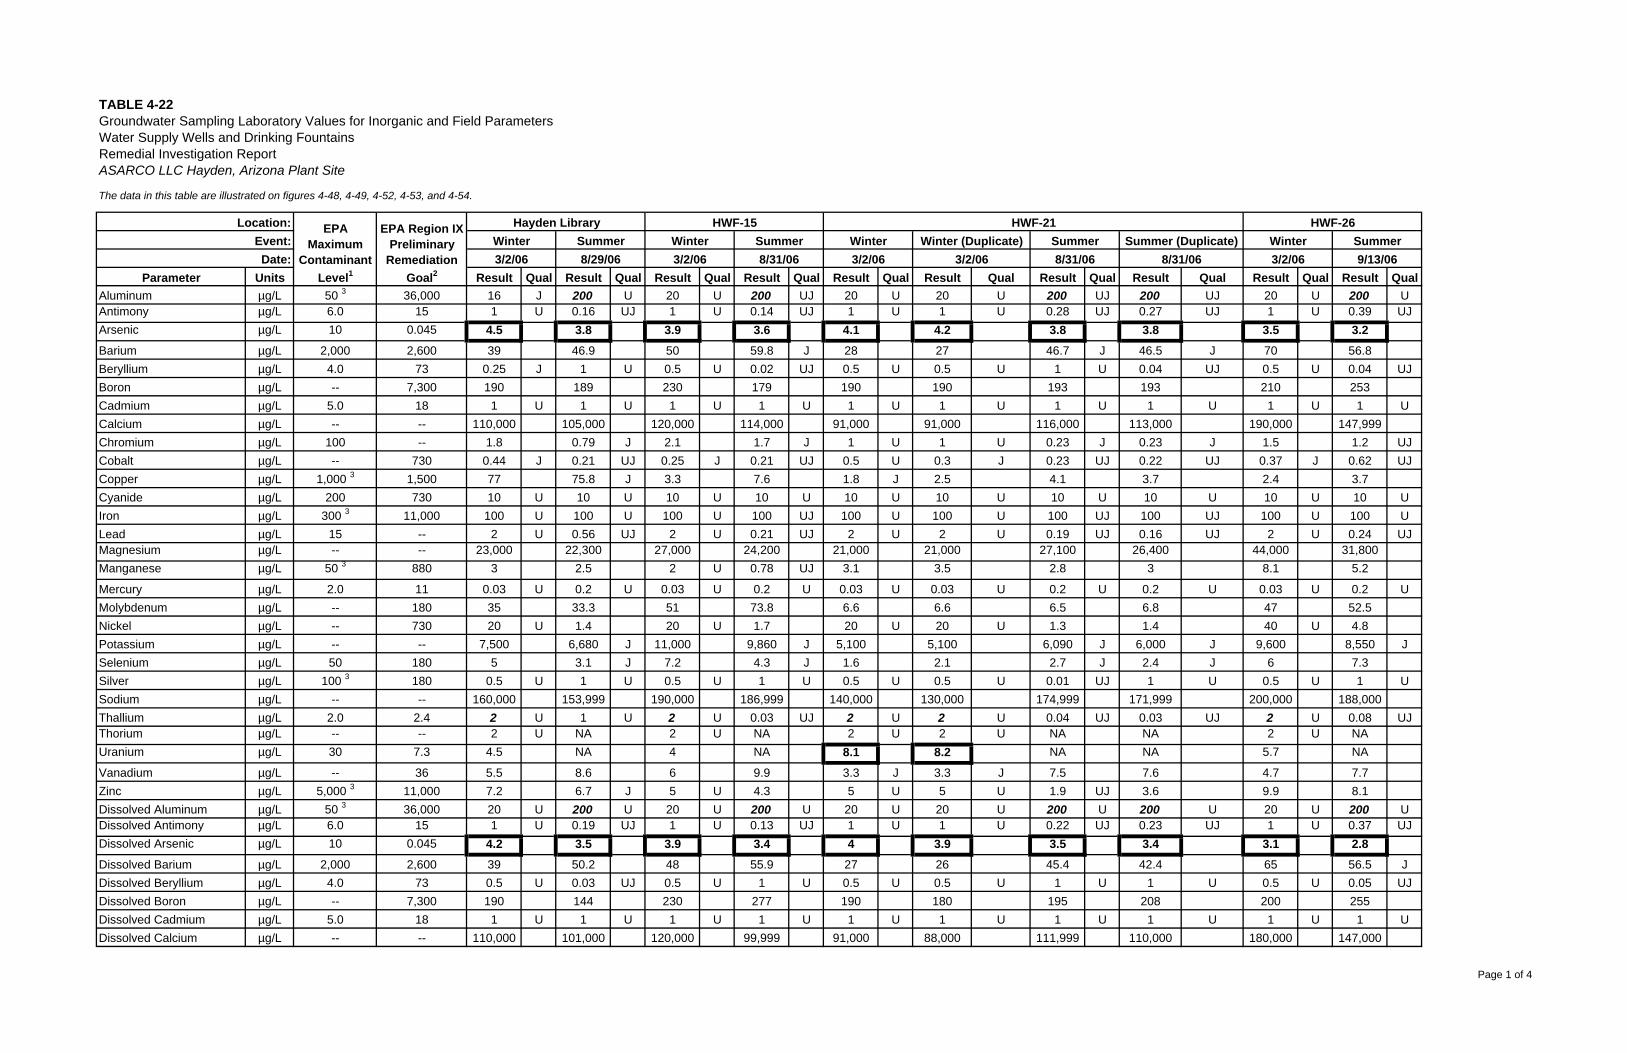
TABLE 4-22Groundwater Sampling Laboratory Values for Inorganic and Field ParametersWater Supply Wells and Drinking FountainsRemedial Investigation ReportASARCO LLC Hayden, Arizona Plant Site
The data in this table are illustrated on figures 4-48, 4-49, 4-52, 4-53, and 4-54.
Parameter Units Result Qual Result Qual Result Qual Result Qual Result Qual Result Qual Result Qual Result Qual Result Qual Result QualAluminum µg/L 50 3 36,000 16 J 200 U 20 U 200 UJ 20 U 20 U 200 UJ 200 UJ 20 U 200 UAntimony µg/L 6.0 15 1 U 0.16 UJ 1 U 0.14 UJ 1 U 1 U 0.28 UJ 0.27 UJ 1 U 0.39 UJArsenic µg/L 10 0.045 4.5 3.8 3.9 3.6 4.1 4.2 3.8 3.8 3.5 3.2Barium µg/L 2,000 2,600 39 46.9 50 59.8 J 28 27 46.7 J 46.5 J 70 56.8Beryllium µg/L 4.0 73 0.25 J 1 U 0.5 U 0.02 UJ 0.5 U 0.5 U 1 U 0.04 UJ 0.5 U 0.04 UJBoron µg/L -- 7,300 190 189 230 179 190 190 193 193 210 253Cadmium µg/L 5.0 18 1 U 1 U 1 U 1 U 1 U 1 U 1 U 1 U 1 U 1 UCalcium µg/L -- -- 110,000 105,000 120,000 114,000 91,000 91,000 116,000 113,000 190,000 147,999Chromium µg/L 100 -- 1.8 0.79 J 2.1 1.7 J 1 U 1 U 0.23 J 0.23 J 1.5 1.2 UJCobalt µg/L -- 730 0.44 J 0.21 UJ 0.25 J 0.21 UJ 0.5 U 0.3 J 0.23 UJ 0.22 UJ 0.37 J 0.62 UJCopper µg/L 1,000 3 1,500 77 75.8 J 3.3 7.6 1.8 J 2.5 4.1 3.7 2.4 3.7Cyanide µg/L 200 730 10 U 10 U 10 U 10 U 10 U 10 U 10 U 10 U 10 U 10 UIron µg/L 300 3 11,000 100 U 100 U 100 U 100 UJ 100 U 100 U 100 UJ 100 UJ 100 U 100 ULead µg/L 15 -- 2 U 0.56 UJ 2 U 0.21 UJ 2 U 2 U 0.19 UJ 0.16 UJ 2 U 0.24 UJMagnesium µg/L -- -- 23,000 22,300 27,000 24,200 21,000 21,000 27,100 26,400 44,000 31,800Manganese µg/L 50 3 880 3 2.5 2 U 0.78 UJ 3.1 3.5 2.8 3 8.1 5.2
Mercury µg/L 2.0 11 0.03 U 0.2 U 0.03 U 0.2 U 0.03 U 0.03 U 0.2 U 0.2 U 0.03 U 0.2 UMolybdenum µg/L -- 180 35 33.3 51 73.8 6.6 6.6 6.5 6.8 47 52.5Nickel µg/L -- 730 20 U 1.4 20 U 1.7 20 U 20 U 1.3 1.4 40 U 4.8Potassium µg/L -- -- 7,500 6,680 J 11,000 9,860 J 5,100 5,100 6,090 J 6,000 J 9,600 8,550 JSelenium µg/L 50 180 5 3.1 J 7.2 4.3 J 1.6 2.1 2.7 J 2.4 J 6 7.3Silver µg/L 100 3 180 0.5 U 1 U 0.5 U 1 U 0.5 U 0.5 U 0.01 UJ 1 U 0.5 U 1 USodium µg/L -- -- 160,000 153,999 190,000 186,999 140,000 130,000 174,999 171,999 200,000 188,000Thallium µg/L 2.0 2.4 2 U 1 U 2 U 0.03 UJ 2 U 2 U 0.04 UJ 0.03 UJ 2 U 0.08 UJThorium µg/L -- -- 2 U NA 2 U NA 2 U 2 U NA NA 2 U NAUranium µg/L 30 7.3 4.5 NA 4 NA 8.1 8.2 NA NA 5.7 NA
Vanadium µg/L -- 36 5.5 8.6 6 9.9 3.3 J 3.3 J 7.5 7.6 4.7 7.7Zinc µg/L 5,000 3 11,000 7.2 6.7 J 5 U 4.3 5 U 5 U 1.9 UJ 3.6 9.9 8.1Dissolved Aluminum µg/L 50 3 36,000 20 U 200 U 20 U 200 U 20 U 20 U 200 U 200 U 20 U 200 UDissolved Antimony µg/L 6.0 15 1 U 0.19 UJ 1 U 0.13 UJ 1 U 1 U 0.22 UJ 0.23 UJ 1 U 0.37 UJDissolved Arsenic µg/L 10 0.045 4.2 3.5 3.9 3.4 4 3.9 3.5 3.4 3.1 2.8Dissolved Barium µg/L 2,000 2,600 39 50.2 48 55.9 27 26 45.4 42.4 65 56.5 JDissolved Beryllium µg/L 4.0 73 0.5 U 0.03 UJ 0.5 U 1 U 0.5 U 0.5 U 1 U 1 U 0.5 U 0.05 UJDissolved Boron µg/L -- 7,300 190 144 230 277 190 180 195 208 200 255Dissolved Cadmium µg/L 5.0 18 1 U 1 U 1 U 1 U 1 U 1 U 1 U 1 U 1 U 1 UDissolved Calcium µg/L -- -- 110,000 101,000 120,000 99,999 91,000 88,000 111,999 110,000 180,000 147,000
Location:Event:Date:
Summer3/2/06 8/29/06
Hayden LibraryWinter
EPAMaximum
ContaminantLevel1
EPA Region IXPreliminary
RemediationGoal2
HWF-15 HWF-21
3/2/06 8/31/06 3/2/06 3/2/06 8/31/06 8/31/06
HWF-26Winter Summer Winter Winter (Duplicate) Summer Summer (Duplicate) Winter Summer
3/2/06 9/13/06
Page 1 of 4
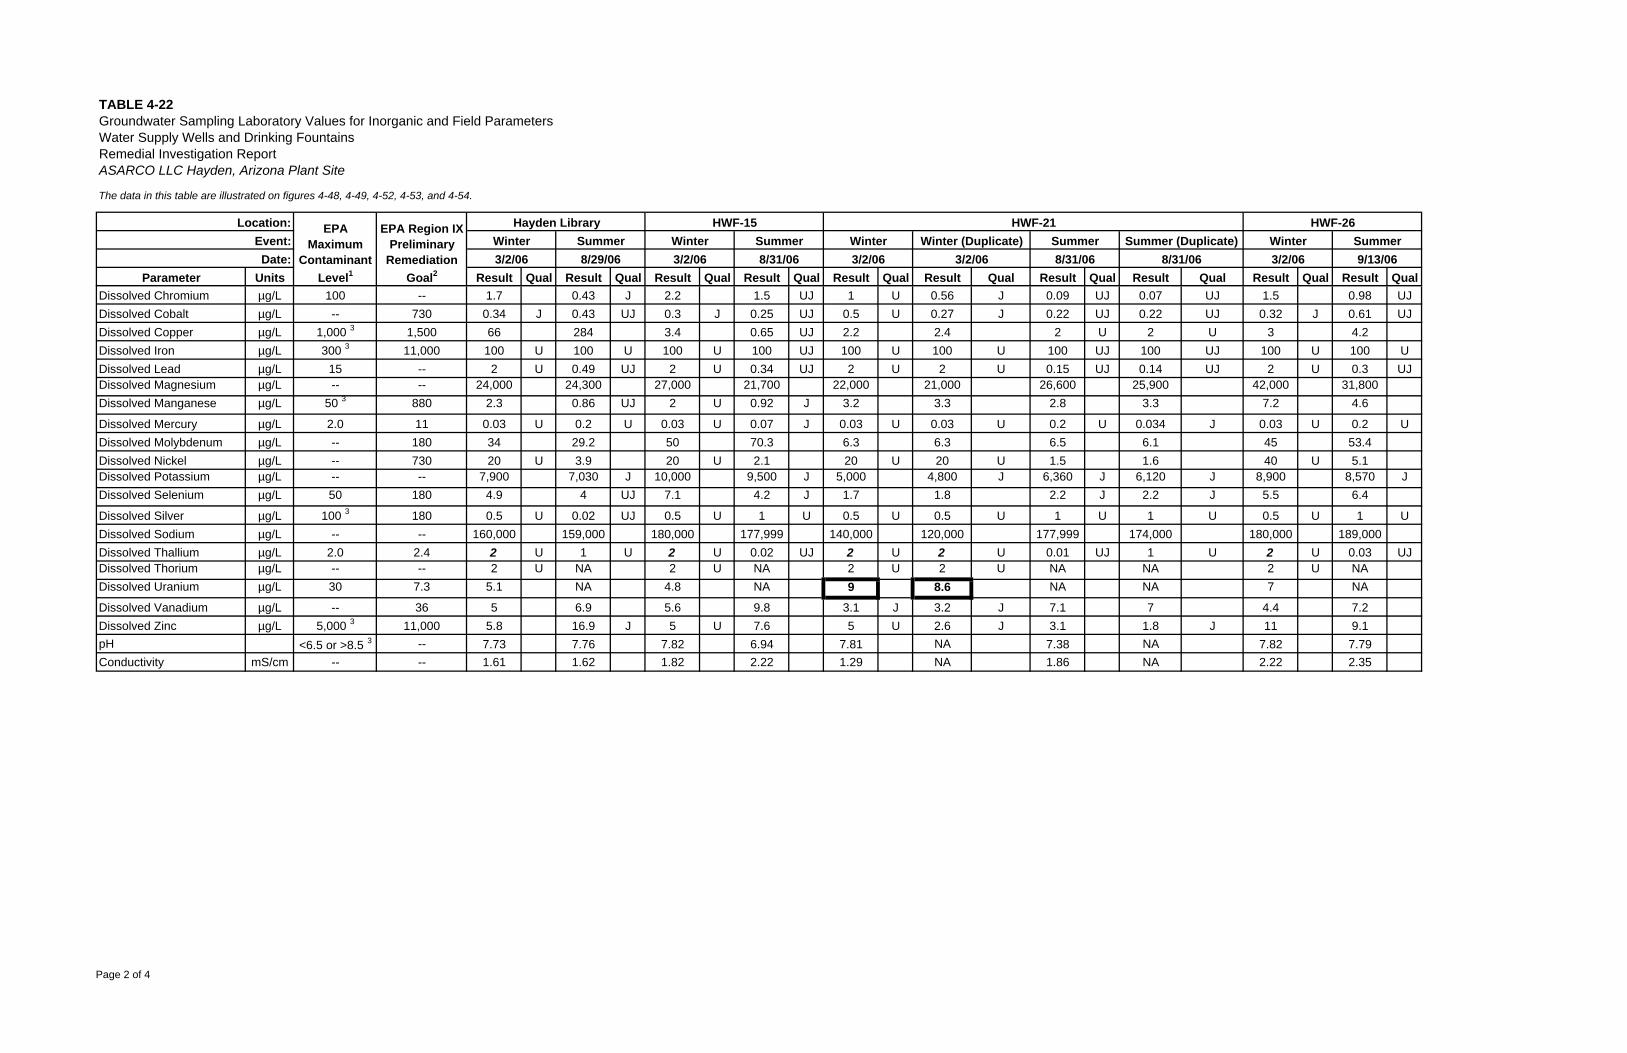
TABLE 4-22Groundwater Sampling Laboratory Values for Inorganic and Field ParametersWater Supply Wells and Drinking FountainsRemedial Investigation ReportASARCO LLC Hayden, Arizona Plant Site
The data in this table are illustrated on figures 4-48, 4-49, 4-52, 4-53, and 4-54.
Parameter Units Result Qual Result Qual Result Qual Result Qual Result Qual Result Qual Result Qual Result Qual Result Qual Result Qual
Location:Event:Date:
Summer3/2/06 8/29/06
Hayden LibraryWinter
EPAMaximum
ContaminantLevel1
EPA Region IXPreliminary
RemediationGoal2
HWF-15 HWF-21
3/2/06 8/31/06 3/2/06 3/2/06 8/31/06 8/31/06
HWF-26Winter Summer Winter Winter (Duplicate) Summer Summer (Duplicate) Winter Summer
3/2/06 9/13/06
Dissolved Chromium µg/L 100 -- 1.7 0.43 J 2.2 1.5 UJ 1 U 0.56 J 0.09 UJ 0.07 UJ 1.5 0.98 UJDissolved Cobalt µg/L -- 730 0.34 J 0.43 UJ 0.3 J 0.25 UJ 0.5 U 0.27 J 0.22 UJ 0.22 UJ 0.32 J 0.61 UJDissolved Copper µg/L 1,000 3 1,500 66 284 3.4 0.65 UJ 2.2 2.4 2 U 2 U 3 4.2Dissolved Iron µg/L 300 3 11,000 100 U 100 U 100 U 100 UJ 100 U 100 U 100 UJ 100 UJ 100 U 100 UDissolved Lead µg/L 15 -- 2 U 0.49 UJ 2 U 0.34 UJ 2 U 2 U 0.15 UJ 0.14 UJ 2 U 0.3 UJDissolved Magnesium µg/L -- -- 24,000 24,300 27,000 21,700 22,000 21,000 26,600 25,900 42,000 31,800Dissolved Manganese µg/L 50 3 880 2.3 0.86 UJ 2 U 0.92 J 3.2 3.3 2.8 3.3 7.2 4.6
Dissolved Mercury µg/L 2.0 11 0.03 U 0.2 U 0.03 U 0.07 J 0.03 U 0.03 U 0.2 U 0.034 J 0.03 U 0.2 UDissolved Molybdenum µg/L -- 180 34 29.2 50 70.3 6.3 6.3 6.5 6.1 45 53.4Dissolved Nickel µg/L -- 730 20 U 3.9 20 U 2.1 20 U 20 U 1.5 1.6 40 U 5.1Dissolved Potassium µg/L -- -- 7,900 7,030 J 10,000 9,500 J 5,000 4,800 J 6,360 J 6,120 J 8,900 8,570 JDissolved Selenium µg/L 50 180 4.9 4 UJ 7.1 4.2 J 1.7 1.8 2.2 J 2.2 J 5.5 6.4
Dissolved Silver µg/L 100 3 180 0.5 U 0.02 UJ 0.5 U 1 U 0.5 U 0.5 U 1 U 1 U 0.5 U 1 UDissolved Sodium µg/L -- -- 160,000 159,000 180,000 177,999 140,000 120,000 177,999 174,000 180,000 189,000Dissolved Thallium µg/L 2.0 2.4 2 U 1 U 2 U 0.02 UJ 2 U 2 U 0.01 UJ 1 U 2 U 0.03 UJDissolved Thorium µg/L -- -- 2 U NA 2 U NA 2 U 2 U NA NA 2 U NADissolved Uranium µg/L 30 7.3 5.1 NA 4.8 NA 9 8.6 NA NA 7 NA
Dissolved Vanadium µg/L -- 36 5 6.9 5.6 9.8 3.1 J 3.2 J 7.1 7 4.4 7.2Dissolved Zinc µg/L 5,000 3 11,000 5.8 16.9 J 5 U 7.6 5 U 2.6 J 3.1 1.8 J 11 9.1pH <6.5 or >8.5 3 -- 7.73 7.76 7.82 6.94 7.81 NA 7.38 NA 7.82 7.79Conductivity mS/cm -- -- 1.61 1.62 1.82 2.22 1.29 NA 1.86 NA 2.22 2.35
Page 2 of 4
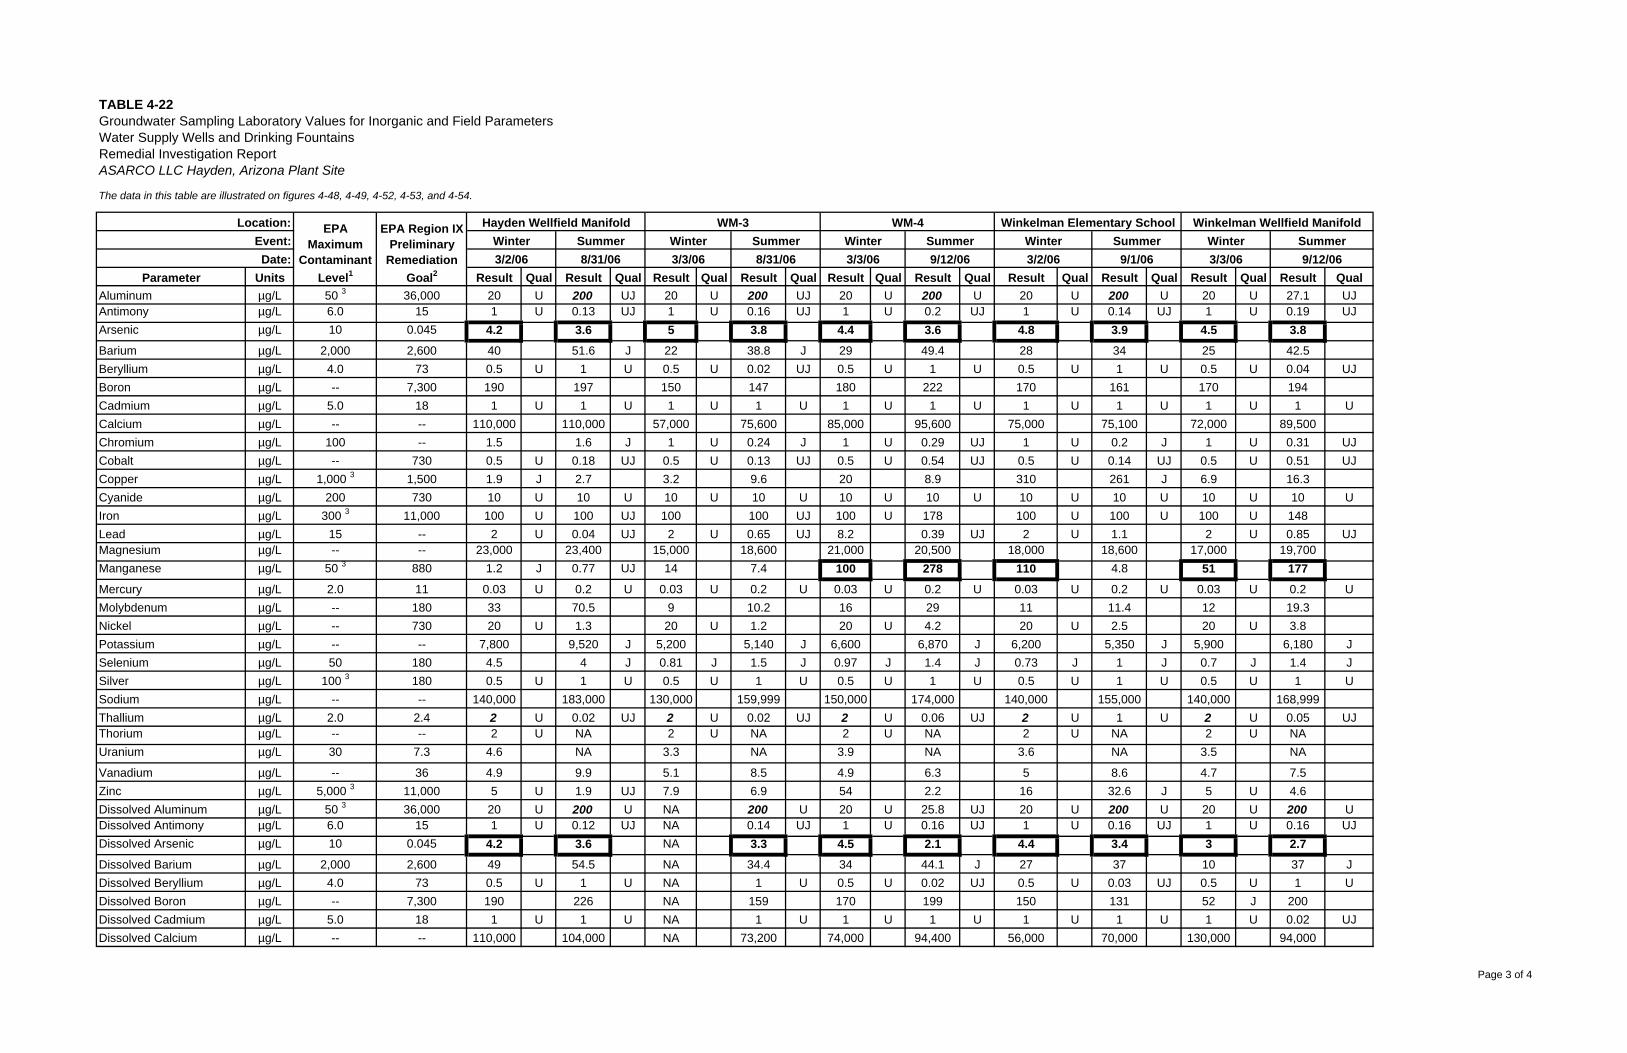
TABLE 4-22Groundwater Sampling Laboratory Values for Inorganic and Field ParametersWater Supply Wells and Drinking FountainsRemedial Investigation ReportASARCO LLC Hayden, Arizona Plant Site
The data in this table are illustrated on figures 4-48, 4-49, 4-52, 4-53, and 4-54.
Parameter Units Result Qual Result Qual Result Qual Result Qual Result Qual Result Qual Result Qual Result Qual Result Qual Result QualAluminum µg/L 50 3 36,000 20 U 200 UJ 20 U 200 UJ 20 U 200 U 20 U 200 U 20 U 27.1 UJAntimony µg/L 6.0 15 1 U 0.13 UJ 1 U 0.16 UJ 1 U 0.2 UJ 1 U 0.14 UJ 1 U 0.19 UJArsenic µg/L 10 0.045 4.2 3.6 5 3.8 4.4 3.6 4.8 3.9 4.5 3.8Barium µg/L 2,000 2,600 40 51.6 J 22 38.8 J 29 49.4 28 34 25 42.5Beryllium µg/L 4.0 73 0.5 U 1 U 0.5 U 0.02 UJ 0.5 U 1 U 0.5 U 1 U 0.5 U 0.04 UJBoron µg/L -- 7,300 190 197 150 147 180 222 170 161 170 194Cadmium µg/L 5.0 18 1 U 1 U 1 U 1 U 1 U 1 U 1 U 1 U 1 U 1 UCalcium µg/L -- -- 110,000 110,000 57,000 75,600 85,000 95,600 75,000 75,100 72,000 89,500Chromium µg/L 100 -- 1.5 1.6 J 1 U 0.24 J 1 U 0.29 UJ 1 U 0.2 J 1 U 0.31 UJCobalt µg/L -- 730 0.5 U 0.18 UJ 0.5 U 0.13 UJ 0.5 U 0.54 UJ 0.5 U 0.14 UJ 0.5 U 0.51 UJCopper µg/L 1,000 3 1,500 1.9 J 2.7 3.2 9.6 20 8.9 310 261 J 6.9 16.3Cyanide µg/L 200 730 10 U 10 U 10 U 10 U 10 U 10 U 10 U 10 U 10 U 10 UIron µg/L 300 3 11,000 100 U 100 UJ 100 100 UJ 100 U 178 100 U 100 U 100 U 148Lead µg/L 15 -- 2 U 0.04 UJ 2 U 0.65 UJ 8.2 0.39 UJ 2 U 1.1 2 U 0.85 UJMagnesium µg/L -- -- 23,000 23,400 15,000 18,600 21,000 20,500 18,000 18,600 17,000 19,700Manganese µg/L 50 3 880 1.2 J 0.77 UJ 14 7.4 100 278 110 4.8 51 177Mercury µg/L 2.0 11 0.03 U 0.2 U 0.03 U 0.2 U 0.03 U 0.2 U 0.03 U 0.2 U 0.03 U 0.2 UMolybdenum µg/L -- 180 33 70.5 9 10.2 16 29 11 11.4 12 19.3Nickel µg/L -- 730 20 U 1.3 20 U 1.2 20 U 4.2 20 U 2.5 20 U 3.8Potassium µg/L -- -- 7,800 9,520 J 5,200 5,140 J 6,600 6,870 J 6,200 5,350 J 5,900 6,180 JSelenium µg/L 50 180 4.5 4 J 0.81 J 1.5 J 0.97 J 1.4 J 0.73 J 1 J 0.7 J 1.4 JSilver µg/L 100 3 180 0.5 U 1 U 0.5 U 1 U 0.5 U 1 U 0.5 U 1 U 0.5 U 1 USodium µg/L -- -- 140,000 183,000 130,000 159,999 150,000 174,000 140,000 155,000 140,000 168,999Thallium µg/L 2.0 2.4 2 U 0.02 UJ 2 U 0.02 UJ 2 U 0.06 UJ 2 U 1 U 2 U 0.05 UJThorium µg/L -- -- 2 U NA 2 U NA 2 U NA 2 U NA 2 U NAUranium µg/L 30 7.3 4.6 NA 3.3 NA 3.9 NA 3.6 NA 3.5 NA
Vanadium µg/L -- 36 4.9 9.9 5.1 8.5 4.9 6.3 5 8.6 4.7 7.5Zinc µg/L 5,000 3 11,000 5 U 1.9 UJ 7.9 6.9 54 2.2 16 32.6 J 5 U 4.6Dissolved Aluminum µg/L 50 3 36,000 20 U 200 U NA 200 U 20 U 25.8 UJ 20 U 200 U 20 U 200 UDissolved Antimony µg/L 6.0 15 1 U 0.12 UJ NA 0.14 UJ 1 U 0.16 UJ 1 U 0.16 UJ 1 U 0.16 UJDissolved Arsenic µg/L 10 0.045 4.2 3.6 NA 3.3 4.5 2.1 4.4 3.4 3 2.7Dissolved Barium µg/L 2,000 2,600 49 54.5 NA 34.4 34 44.1 J 27 37 10 37 JDissolved Beryllium µg/L 4.0 73 0.5 U 1 U NA 1 U 0.5 U 0.02 UJ 0.5 U 0.03 UJ 0.5 U 1 UDissolved Boron µg/L -- 7,300 190 226 NA 159 170 199 150 131 52 J 200Dissolved Cadmium µg/L 5.0 18 1 U 1 U NA 1 U 1 U 1 U 1 U 1 U 1 U 0.02 UJDissolved Calcium µg/L -- -- 110,000 104,000 NA 73,200 74,000 94,400 56,000 70,000 130,000 94,000
Winter Summer WinterWinkelman Wellfield ManifoldHayden Wellfield Manifold WM-3 WM-4 Winkelman Elementary School
Summer Winter SummerSummer Winter Summer Winter3/3/06 9/12/069/12/06 3/2/06 9/1/063/3/06 8/31/06 3/3/063/2/06 8/31/06
Location: EPAMaximum
ContaminantLevel1
EPA Region IXPreliminary
RemediationGoal2
Event:Date:
Page 3 of 4
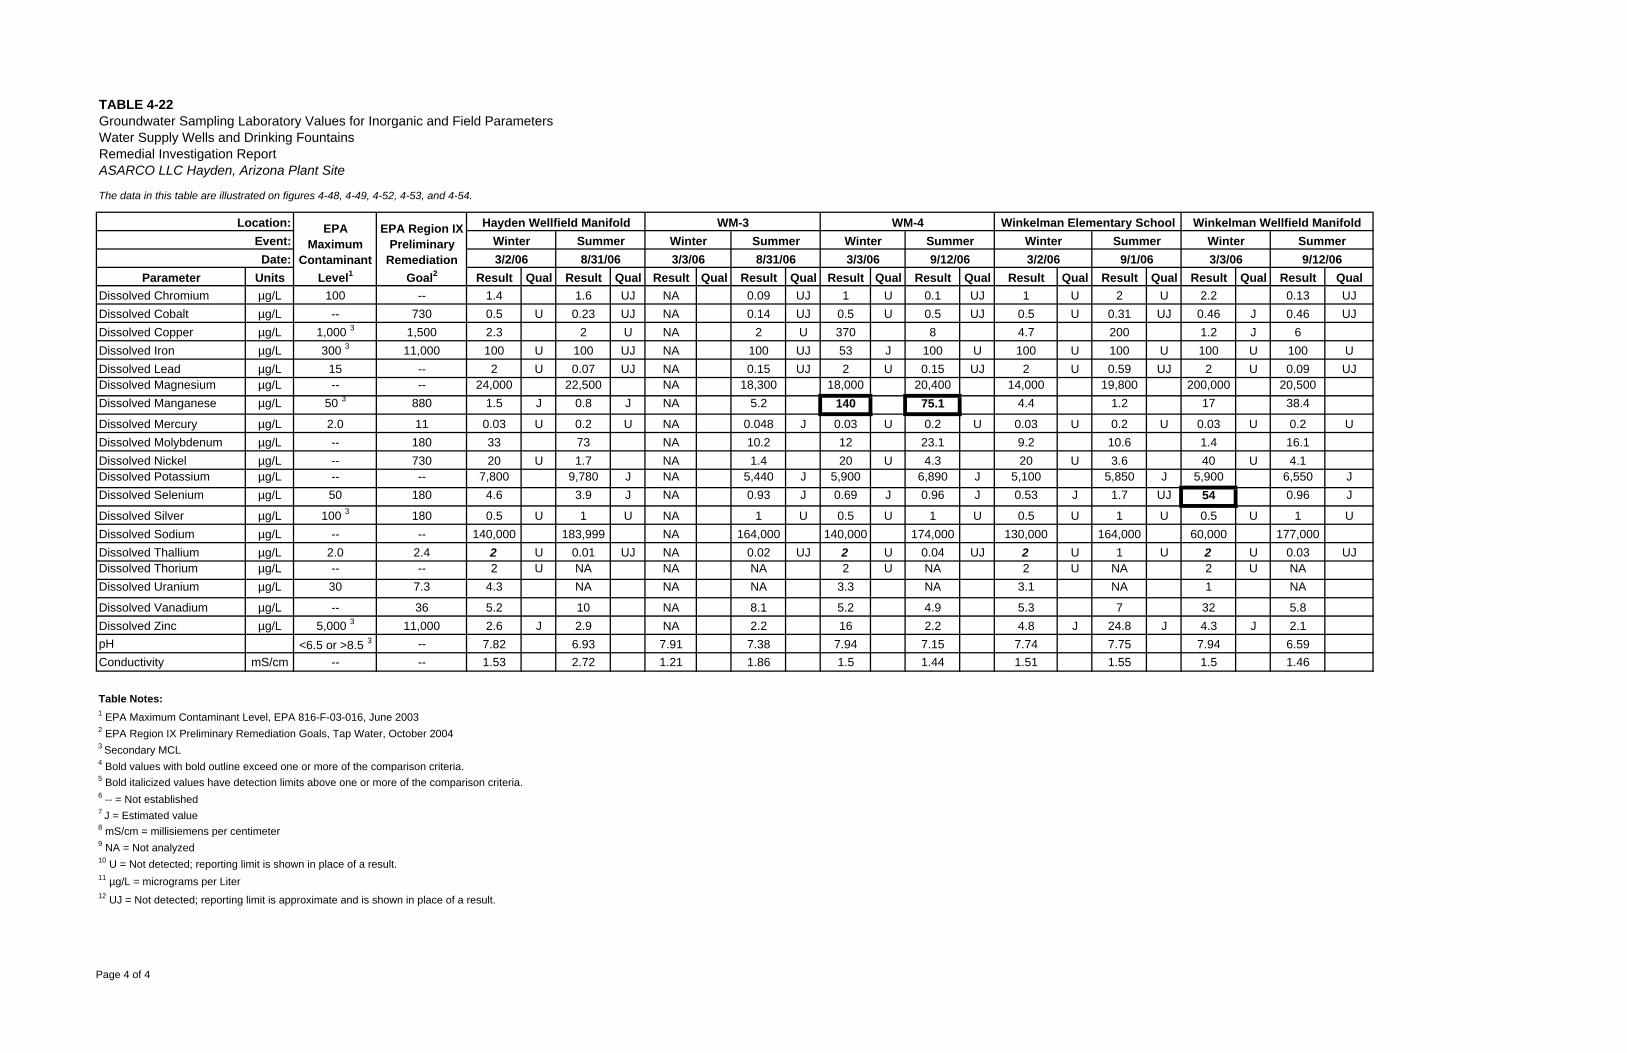
TABLE 4-22Groundwater Sampling Laboratory Values for Inorganic and Field ParametersWater Supply Wells and Drinking FountainsRemedial Investigation ReportASARCO LLC Hayden, Arizona Plant Site
The data in this table are illustrated on figures 4-48, 4-49, 4-52, 4-53, and 4-54.
Parameter Units Result Qual Result Qual Result Qual Result Qual Result Qual Result Qual Result Qual Result Qual Result Qual Result Qual
Winter Summer WinterWinkelman Wellfield ManifoldHayden Wellfield Manifold WM-3 WM-4 Winkelman Elementary School
Summer Winter SummerSummer Winter Summer Winter3/3/06 9/12/069/12/06 3/2/06 9/1/063/3/06 8/31/06 3/3/063/2/06 8/31/06
Location: EPAMaximum
ContaminantLevel1
EPA Region IXPreliminary
RemediationGoal2
Event:Date:
Dissolved Chromium µg/L 100 -- 1.4 1.6 UJ NA 0.09 UJ 1 U 0.1 UJ 1 U 2 U 2.2 0.13 UJDissolved Cobalt µg/L -- 730 0.5 U 0.23 UJ NA 0.14 UJ 0.5 U 0.5 UJ 0.5 U 0.31 UJ 0.46 J 0.46 UJDissolved Copper µg/L 1,000 3 1,500 2.3 2 U NA 2 U 370 8 4.7 200 1.2 J 6Dissolved Iron µg/L 300 3 11,000 100 U 100 UJ NA 100 UJ 53 J 100 U 100 U 100 U 100 U 100 UDissolved Lead µg/L 15 -- 2 U 0.07 UJ NA 0.15 UJ 2 U 0.15 UJ 2 U 0.59 UJ 2 U 0.09 UJDissolved Magnesium µg/L -- -- 24,000 22,500 NA 18,300 18,000 20,400 14,000 19,800 200,000 20,500Dissolved Manganese µg/L 50 3 880 1.5 J 0.8 J NA 5.2 140 75.1 4.4 1.2 17 38.4
Dissolved Mercury µg/L 2.0 11 0.03 U 0.2 U NA 0.048 J 0.03 U 0.2 U 0.03 U 0.2 U 0.03 U 0.2 UDissolved Molybdenum µg/L -- 180 33 73 NA 10.2 12 23.1 9.2 10.6 1.4 16.1Dissolved Nickel µg/L -- 730 20 U 1.7 NA 1.4 20 U 4.3 20 U 3.6 40 U 4.1Dissolved Potassium µg/L -- -- 7,800 9,780 J NA 5,440 J 5,900 6,890 J 5,100 5,850 J 5,900 6,550 JDissolved Selenium µg/L 50 180 4.6 3.9 J NA 0.93 J 0.69 J 0.96 J 0.53 J 1.7 UJ 54 0.96 J
Dissolved Silver µg/L 100 3 180 0.5 U 1 U NA 1 U 0.5 U 1 U 0.5 U 1 U 0.5 U 1 UDissolved Sodium µg/L -- -- 140,000 183,999 NA 164,000 140,000 174,000 130,000 164,000 60,000 177,000Dissolved Thallium µg/L 2.0 2.4 2 U 0.01 UJ NA 0.02 UJ 2 U 0.04 UJ 2 U 1 U 2 U 0.03 UJDissolved Thorium µg/L -- -- 2 U NA NA NA 2 U NA 2 U NA 2 U NADissolved Uranium µg/L 30 7.3 4.3 NA NA NA 3.3 NA 3.1 NA 1 NA
Dissolved Vanadium µg/L -- 36 5.2 10 NA 8.1 5.2 4.9 5.3 7 32 5.8Dissolved Zinc µg/L 5,000 3 11,000 2.6 J 2.9 NA 2.2 16 2.2 4.8 J 24.8 J 4.3 J 2.1pH <6.5 or >8.5 3 -- 7.82 6.93 7.91 7.38 7.94 7.15 7.74 7.75 7.94 6.59Conductivity mS/cm -- -- 1.53 2.72 1.21 1.86 1.5 1.44 1.51 1.55 1.5 1.46
Table Notes:1 EPA Maximum Contaminant Level, EPA 816-F-03-016, June 20032 EPA Region IX Preliminary Remediation Goals, Tap Water, October 20043 Secondary MCL4 Bold values with bold outline exceed one or more of the comparison criteria.
6 -- = Not established7 J = Estimated value8 mS/cm = millisiemens per centimeter9 NA = Not analyzed10 U = Not detected; reporting limit is shown in place of a result.11 µg/L = micrograms per Liter12 UJ = Not detected; reporting limit is approximate and is shown in place of a result.
5 Bold italicized values have detection limits above one or more of the comparison criteria.
Page 4 of 4
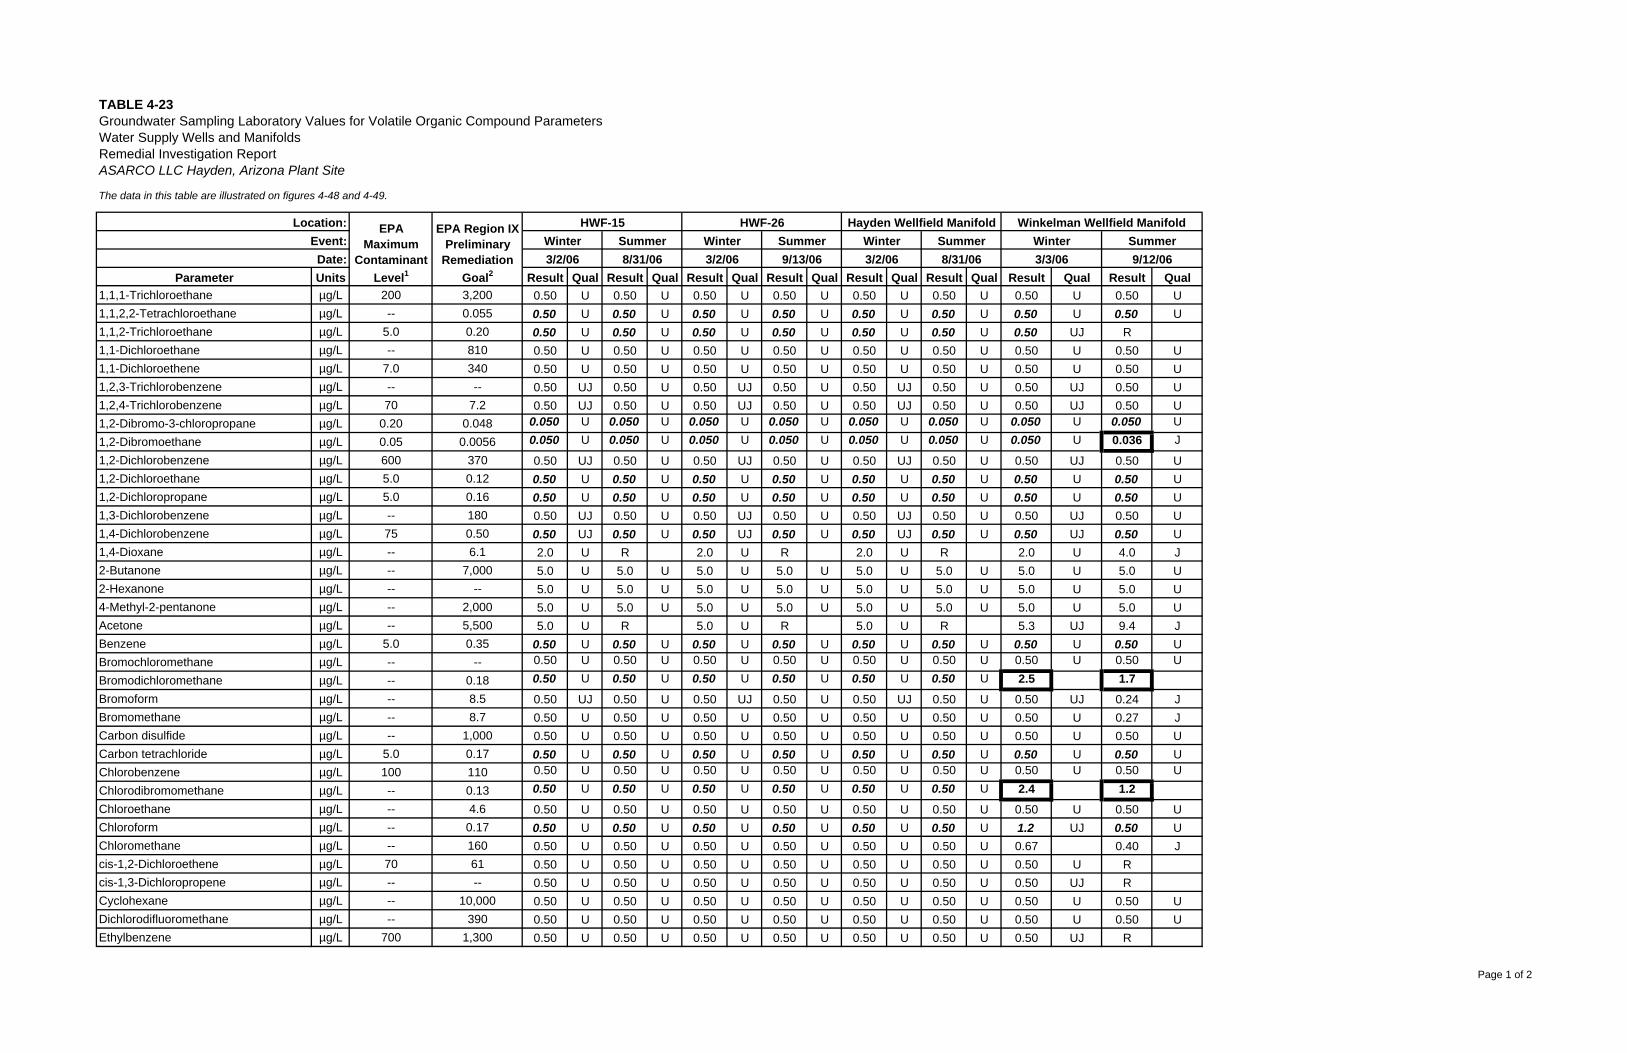
TABLE 4-23Groundwater Sampling Laboratory Values for Volatile Organic Compound ParametersWater Supply Wells and ManifoldsRemedial Investigation ReportASARCO LLC Hayden, Arizona Plant Site
The data in this table are illustrated on figures 4-48 and 4-49.
Parameter Units Result Qual Result Qual Result Qual Result Qual Result Qual Result Qual Result Qual Result Qual1,1,1-Trichloroethane µg/L 200 3,200 0.50 U 0.50 U 0.50 U 0.50 U 0.50 U 0.50 U 0.50 U 0.50 U1,1,2,2-Tetrachloroethane µg/L -- 0.055 0.50 U 0.50 U 0.50 U 0.50 U 0.50 U 0.50 U 0.50 U 0.50 U1,1,2-Trichloroethane µg/L 5.0 0.20 0.50 U 0.50 U 0.50 U 0.50 U 0.50 U 0.50 U 0.50 UJ R1,1-Dichloroethane µg/L -- 810 0.50 U 0.50 U 0.50 U 0.50 U 0.50 U 0.50 U 0.50 U 0.50 U1,1-Dichloroethene µg/L 7.0 340 0.50 U 0.50 U 0.50 U 0.50 U 0.50 U 0.50 U 0.50 U 0.50 U1,2,3-Trichlorobenzene µg/L -- -- 0.50 UJ 0.50 U 0.50 UJ 0.50 U 0.50 UJ 0.50 U 0.50 UJ 0.50 U1,2,4-Trichlorobenzene µg/L 70 7.2 0.50 UJ 0.50 U 0.50 UJ 0.50 U 0.50 UJ 0.50 U 0.50 UJ 0.50 U1,2-Dibromo-3-chloropropane µg/L 0.20 0.048 0.050 U 0.050 U 0.050 U 0.050 U 0.050 U 0.050 U 0.050 U 0.050 U
1,2-Dibromoethane µg/L 0.05 0.0056 0.050 U 0.050 U 0.050 U 0.050 U 0.050 U 0.050 U 0.050 U 0.036 J
1,2-Dichlorobenzene µg/L 600 370 0.50 UJ 0.50 U 0.50 UJ 0.50 U 0.50 UJ 0.50 U 0.50 UJ 0.50 U1,2-Dichloroethane µg/L 5.0 0.12 0.50 U 0.50 U 0.50 U 0.50 U 0.50 U 0.50 U 0.50 U 0.50 U1,2-Dichloropropane µg/L 5.0 0.16 0.50 U 0.50 U 0.50 U 0.50 U 0.50 U 0.50 U 0.50 U 0.50 U1,3-Dichlorobenzene µg/L -- 180 0.50 UJ 0.50 U 0.50 UJ 0.50 U 0.50 UJ 0.50 U 0.50 UJ 0.50 U1,4-Dichlorobenzene µg/L 75 0.50 0.50 UJ 0.50 U 0.50 UJ 0.50 U 0.50 UJ 0.50 U 0.50 UJ 0.50 U1,4-Dioxane µg/L -- 6.1 2.0 U R 2.0 U R 2.0 U R 2.0 U 4.0 J2-Butanone µg/L -- 7,000 5.0 U 5.0 U 5.0 U 5.0 U 5.0 U 5.0 U 5.0 U 5.0 U2-Hexanone µg/L -- -- 5.0 U 5.0 U 5.0 U 5.0 U 5.0 U 5.0 U 5.0 U 5.0 U4-Methyl-2-pentanone µg/L -- 2,000 5.0 U 5.0 U 5.0 U 5.0 U 5.0 U 5.0 U 5.0 U 5.0 UAcetone µg/L -- 5,500 5.0 U R 5.0 U R 5.0 U R 5.3 UJ 9.4 JBenzene µg/L 5.0 0.35 0.50 U 0.50 U 0.50 U 0.50 U 0.50 U 0.50 U 0.50 U 0.50 UBromochloromethane µg/L -- -- 0.50 U 0.50 U 0.50 U 0.50 U 0.50 U 0.50 U 0.50 U 0.50 U
Bromodichloromethane µg/L -- 0.18 0.50 U 0.50 U 0.50 U 0.50 U 0.50 U 0.50 U 2.5 1.7Bromoform µg/L -- 8.5 0.50 UJ 0.50 U 0.50 UJ 0.50 U 0.50 UJ 0.50 U 0.50 UJ 0.24 JBromomethane µg/L -- 8.7 0.50 U 0.50 U 0.50 U 0.50 U 0.50 U 0.50 U 0.50 U 0.27 JCarbon disulfide µg/L -- 1,000 0.50 U 0.50 U 0.50 U 0.50 U 0.50 U 0.50 U 0.50 U 0.50 UCarbon tetrachloride µg/L 5.0 0.17 0.50 U 0.50 U 0.50 U 0.50 U 0.50 U 0.50 U 0.50 U 0.50 UChlorobenzene µg/L 100 110 0.50 U 0.50 U 0.50 U 0.50 U 0.50 U 0.50 U 0.50 U 0.50 U
Chlorodibromomethane µg/L -- 0.13 0.50 U 0.50 U 0.50 U 0.50 U 0.50 U 0.50 U 2.4 1.2Chloroethane µg/L -- 4.6 0.50 U 0.50 U 0.50 U 0.50 U 0.50 U 0.50 U 0.50 U 0.50 UChloroform µg/L -- 0.17 0.50 U 0.50 U 0.50 U 0.50 U 0.50 U 0.50 U 1.2 UJ 0.50 UChloromethane µg/L -- 160 0.50 U 0.50 U 0.50 U 0.50 U 0.50 U 0.50 U 0.67 0.40 Jcis-1,2-Dichloroethene µg/L 70 61 0.50 U 0.50 U 0.50 U 0.50 U 0.50 U 0.50 U 0.50 U Rcis-1,3-Dichloropropene µg/L -- -- 0.50 U 0.50 U 0.50 U 0.50 U 0.50 U 0.50 U 0.50 UJ RCyclohexane µg/L -- 10,000 0.50 U 0.50 U 0.50 U 0.50 U 0.50 U 0.50 U 0.50 U 0.50 UDichlorodifluoromethane µg/L -- 390 0.50 U 0.50 U 0.50 U 0.50 U 0.50 U 0.50 U 0.50 U 0.50 UEthylbenzene µg/L 700 1,300 0.50 U 0.50 U 0.50 U 0.50 U 0.50 U 0.50 U 0.50 UJ R
Location:Event:Date:
EPAMaximum
ContaminantLevel1
8/31/06
HWF-26Winter Summer Winter Summer
HWF-15Winter Summer Winter Summer
EPA Region IXPreliminary
RemediationGoal2
3/2/06 3/3/06 9/12/063/2/06 9/13/06 3/2/06 8/31/06
Hayden Wellfield Manifold Winkelman Wellfield Manifold
Page 1 of 2
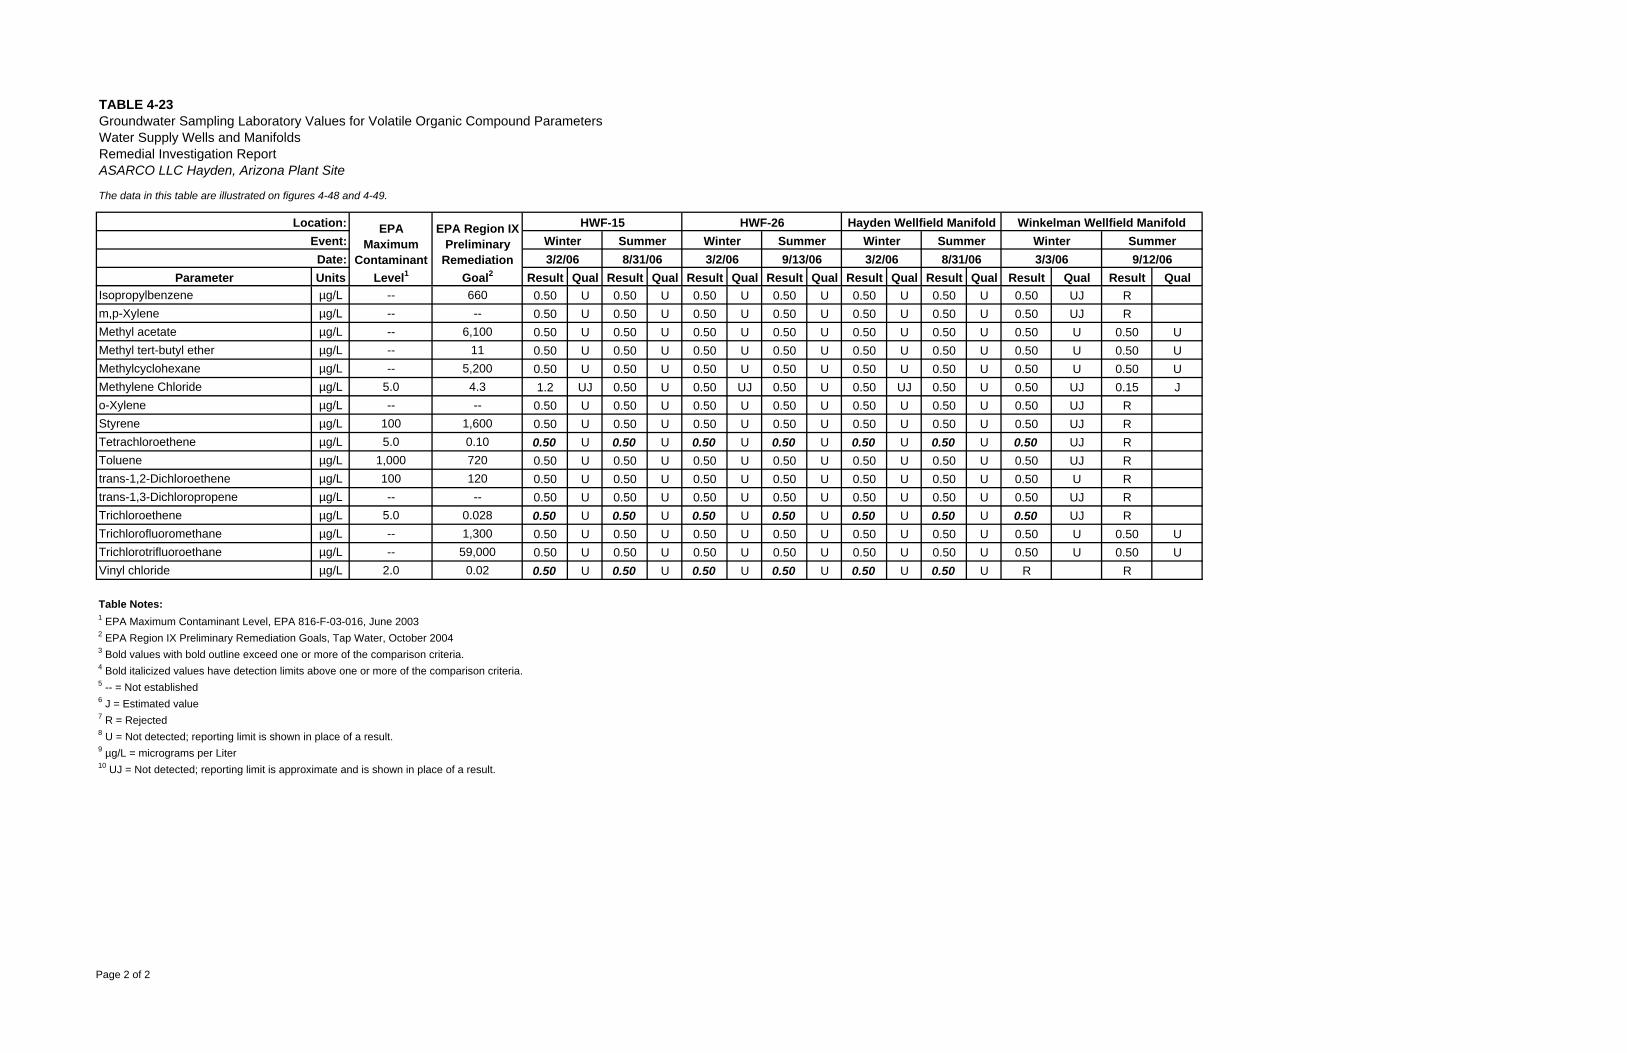
TABLE 4-23Groundwater Sampling Laboratory Values for Volatile Organic Compound ParametersWater Supply Wells and ManifoldsRemedial Investigation ReportASARCO LLC Hayden, Arizona Plant Site
The data in this table are illustrated on figures 4-48 and 4-49.
Parameter Units Result Qual Result Qual Result Qual Result Qual Result Qual Result Qual Result Qual Result Qual
Location:Event:Date:
EPAMaximum
ContaminantLevel1
8/31/06
HWF-26Winter Summer Winter Summer
HWF-15Winter Summer Winter Summer
EPA Region IXPreliminary
RemediationGoal2
3/2/06 3/3/06 9/12/063/2/06 9/13/06 3/2/06 8/31/06
Hayden Wellfield Manifold Winkelman Wellfield Manifold
Isopropylbenzene µg/L -- 660 0.50 U 0.50 U 0.50 U 0.50 U 0.50 U 0.50 U 0.50 UJ Rm,p-Xylene µg/L -- -- 0.50 U 0.50 U 0.50 U 0.50 U 0.50 U 0.50 U 0.50 UJ RMethyl acetate µg/L -- 6,100 0.50 U 0.50 U 0.50 U 0.50 U 0.50 U 0.50 U 0.50 U 0.50 UMethyl tert-butyl ether µg/L -- 11 0.50 U 0.50 U 0.50 U 0.50 U 0.50 U 0.50 U 0.50 U 0.50 UMethylcyclohexane µg/L -- 5,200 0.50 U 0.50 U 0.50 U 0.50 U 0.50 U 0.50 U 0.50 U 0.50 UMethylene Chloride µg/L 5.0 4.3 1.2 UJ 0.50 U 0.50 UJ 0.50 U 0.50 UJ 0.50 U 0.50 UJ 0.15 Jo-Xylene µg/L -- -- 0.50 U 0.50 U 0.50 U 0.50 U 0.50 U 0.50 U 0.50 UJ RStyrene µg/L 100 1,600 0.50 U 0.50 U 0.50 U 0.50 U 0.50 U 0.50 U 0.50 UJ RTetrachloroethene µg/L 5.0 0.10 0.50 U 0.50 U 0.50 U 0.50 U 0.50 U 0.50 U 0.50 UJ RToluene µg/L 1,000 720 0.50 U 0.50 U 0.50 U 0.50 U 0.50 U 0.50 U 0.50 UJ Rtrans-1,2-Dichloroethene µg/L 100 120 0.50 U 0.50 U 0.50 U 0.50 U 0.50 U 0.50 U 0.50 U Rtrans-1,3-Dichloropropene µg/L -- -- 0.50 U 0.50 U 0.50 U 0.50 U 0.50 U 0.50 U 0.50 UJ RTrichloroethene µg/L 5.0 0.028 0.50 U 0.50 U 0.50 U 0.50 U 0.50 U 0.50 U 0.50 UJ RTrichlorofluoromethane µg/L -- 1,300 0.50 U 0.50 U 0.50 U 0.50 U 0.50 U 0.50 U 0.50 U 0.50 UTrichlorotrifluoroethane µg/L -- 59,000 0.50 U 0.50 U 0.50 U 0.50 U 0.50 U 0.50 U 0.50 U 0.50 UVinyl chloride µg/L 2.0 0.02 0.50 U 0.50 U 0.50 U 0.50 U 0.50 U 0.50 U R R
Table Notes:1 EPA Maximum Contaminant Level, EPA 816-F-03-016, June 20032 EPA Region IX Preliminary Remediation Goals, Tap Water, October 20043 Bold values with bold outline exceed one or more of the comparison criteria.4 Bold italicized values have detection limits above one or more of the comparison criteria.5 -- = Not established6 J = Estimated value7 R = Rejected8 U = Not detected; reporting limit is shown in place of a result.9 µg/L = micrograms per Liter10 UJ = Not detected; reporting limit is approximate and is shown in place of a result.
Page 2 of 2
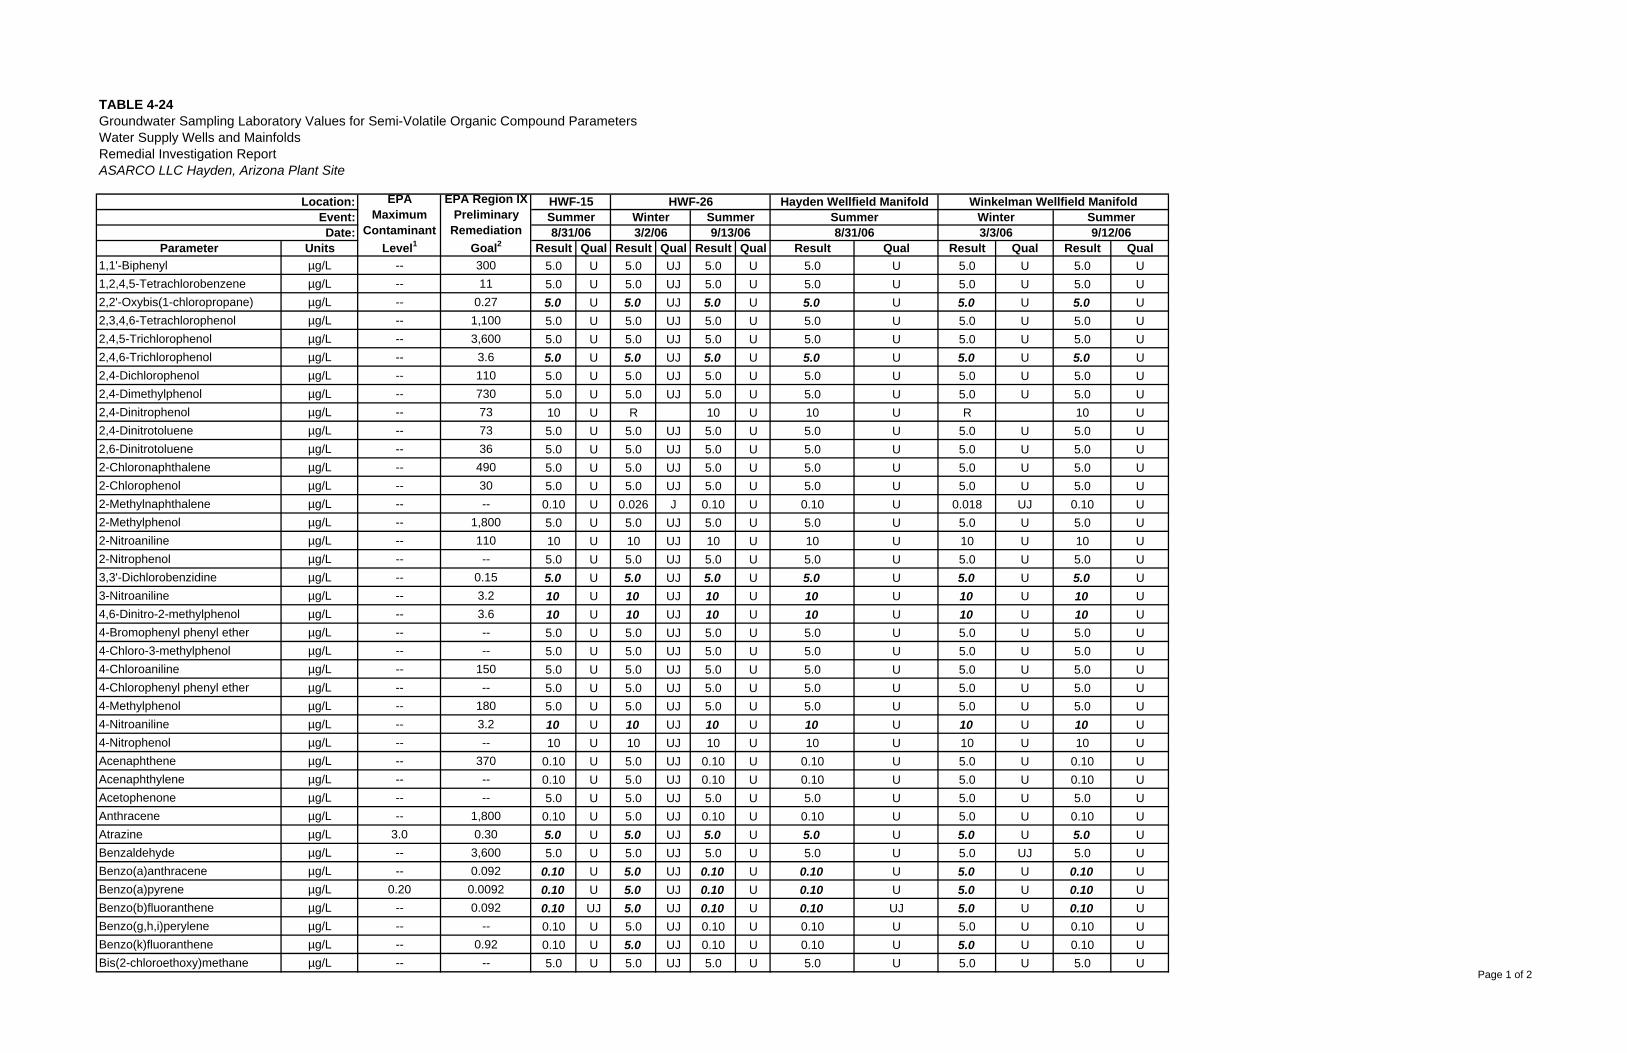
TABLE 4-24Groundwater Sampling Laboratory Values for Semi-Volatile Organic Compound ParametersWater Supply Wells and MainfoldsRemedial Investigation ReportASARCO LLC Hayden, Arizona Plant Site
Parameter Units Result Qual Result Qual Result Qual Result Qual Result Qual Result Qual1,1'-Biphenyl µg/L -- 300 5.0 U 5.0 UJ 5.0 U 5.0 U 5.0 U 5.0 U1,2,4,5-Tetrachlorobenzene µg/L -- 11 5.0 U 5.0 UJ 5.0 U 5.0 U 5.0 U 5.0 U2,2'-Oxybis(1-chloropropane) µg/L -- 0.27 5.0 U 5.0 UJ 5.0 U 5.0 U 5.0 U 5.0 U2,3,4,6-Tetrachlorophenol µg/L -- 1,100 5.0 U 5.0 UJ 5.0 U 5.0 U 5.0 U 5.0 U2,4,5-Trichlorophenol µg/L -- 3,600 5.0 U 5.0 UJ 5.0 U 5.0 U 5.0 U 5.0 U2,4,6-Trichlorophenol µg/L -- 3.6 5.0 U 5.0 UJ 5.0 U 5.0 U 5.0 U 5.0 U2,4-Dichlorophenol µg/L -- 110 5.0 U 5.0 UJ 5.0 U 5.0 U 5.0 U 5.0 U2,4-Dimethylphenol µg/L -- 730 5.0 U 5.0 UJ 5.0 U 5.0 U 5.0 U 5.0 U2,4-Dinitrophenol µg/L -- 73 10 U R 10 U 10 U R 10 U2,4-Dinitrotoluene µg/L -- 73 5.0 U 5.0 UJ 5.0 U 5.0 U 5.0 U 5.0 U2,6-Dinitrotoluene µg/L -- 36 5.0 U 5.0 UJ 5.0 U 5.0 U 5.0 U 5.0 U2-Chloronaphthalene µg/L -- 490 5.0 U 5.0 UJ 5.0 U 5.0 U 5.0 U 5.0 U2-Chlorophenol µg/L -- 30 5.0 U 5.0 UJ 5.0 U 5.0 U 5.0 U 5.0 U2-Methylnaphthalene µg/L -- -- 0.10 U 0.026 J 0.10 U 0.10 U 0.018 UJ 0.10 U2-Methylphenol µg/L -- 1,800 5.0 U 5.0 UJ 5.0 U 5.0 U 5.0 U 5.0 U2-Nitroaniline µg/L -- 110 10 U 10 UJ 10 U 10 U 10 U 10 U2-Nitrophenol µg/L -- -- 5.0 U 5.0 UJ 5.0 U 5.0 U 5.0 U 5.0 U3,3'-Dichlorobenzidine µg/L -- 0.15 5.0 U 5.0 UJ 5.0 U 5.0 U 5.0 U 5.0 U3-Nitroaniline µg/L -- 3.2 10 U 10 UJ 10 U 10 U 10 U 10 U4,6-Dinitro-2-methylphenol µg/L -- 3.6 10 U 10 UJ 10 U 10 U 10 U 10 U4-Bromophenyl phenyl ether µg/L -- -- 5.0 U 5.0 UJ 5.0 U 5.0 U 5.0 U 5.0 U4-Chloro-3-methylphenol µg/L -- -- 5.0 U 5.0 UJ 5.0 U 5.0 U 5.0 U 5.0 U4-Chloroaniline µg/L -- 150 5.0 U 5.0 UJ 5.0 U 5.0 U 5.0 U 5.0 U4-Chlorophenyl phenyl ether µg/L -- -- 5.0 U 5.0 UJ 5.0 U 5.0 U 5.0 U 5.0 U4-Methylphenol µg/L -- 180 5.0 U 5.0 UJ 5.0 U 5.0 U 5.0 U 5.0 U4-Nitroaniline µg/L -- 3.2 10 U 10 UJ 10 U 10 U 10 U 10 U4-Nitrophenol µg/L -- -- 10 U 10 UJ 10 U 10 U 10 U 10 UAcenaphthene µg/L -- 370 0.10 U 5.0 UJ 0.10 U 0.10 U 5.0 U 0.10 UAcenaphthylene µg/L -- -- 0.10 U 5.0 UJ 0.10 U 0.10 U 5.0 U 0.10 UAcetophenone µg/L -- -- 5.0 U 5.0 UJ 5.0 U 5.0 U 5.0 U 5.0 UAnthracene µg/L -- 1,800 0.10 U 5.0 UJ 0.10 U 0.10 U 5.0 U 0.10 UAtrazine µg/L 3.0 0.30 5.0 U 5.0 UJ 5.0 U 5.0 U 5.0 U 5.0 UBenzaldehyde µg/L -- 3,600 5.0 U 5.0 UJ 5.0 U 5.0 U 5.0 UJ 5.0 UBenzo(a)anthracene µg/L -- 0.092 0.10 U 5.0 UJ 0.10 U 0.10 U 5.0 U 0.10 UBenzo(a)pyrene µg/L 0.20 0.0092 0.10 U 5.0 UJ 0.10 U 0.10 U 5.0 U 0.10 UBenzo(b)fluoranthene µg/L -- 0.092 0.10 UJ 5.0 UJ 0.10 U 0.10 UJ 5.0 U 0.10 UBenzo(g,h,i)perylene µg/L -- -- 0.10 U 5.0 UJ 0.10 U 0.10 U 5.0 U 0.10 UBenzo(k)fluoranthene µg/L -- 0.92 0.10 U 5.0 UJ 0.10 U 0.10 U 5.0 U 0.10 UBis(2-chloroethoxy)methane µg/L -- -- 5.0 U 5.0 UJ 5.0 U 5.0 U 5.0 U 5.0 U
HWF-15
8/31/06Summer
EPA Region IXPreliminary
RemediationGoal2
Location:Event:Date:
EPAMaximum
ContaminantLevel1
Winkelman Wellfield ManifoldSummer Summer Winter Summer
HWF-26 Hayden Wellfield ManifoldWinter
9/12/063/2/06 9/13/06 8/31/06 3/3/06
Page 1 of 2
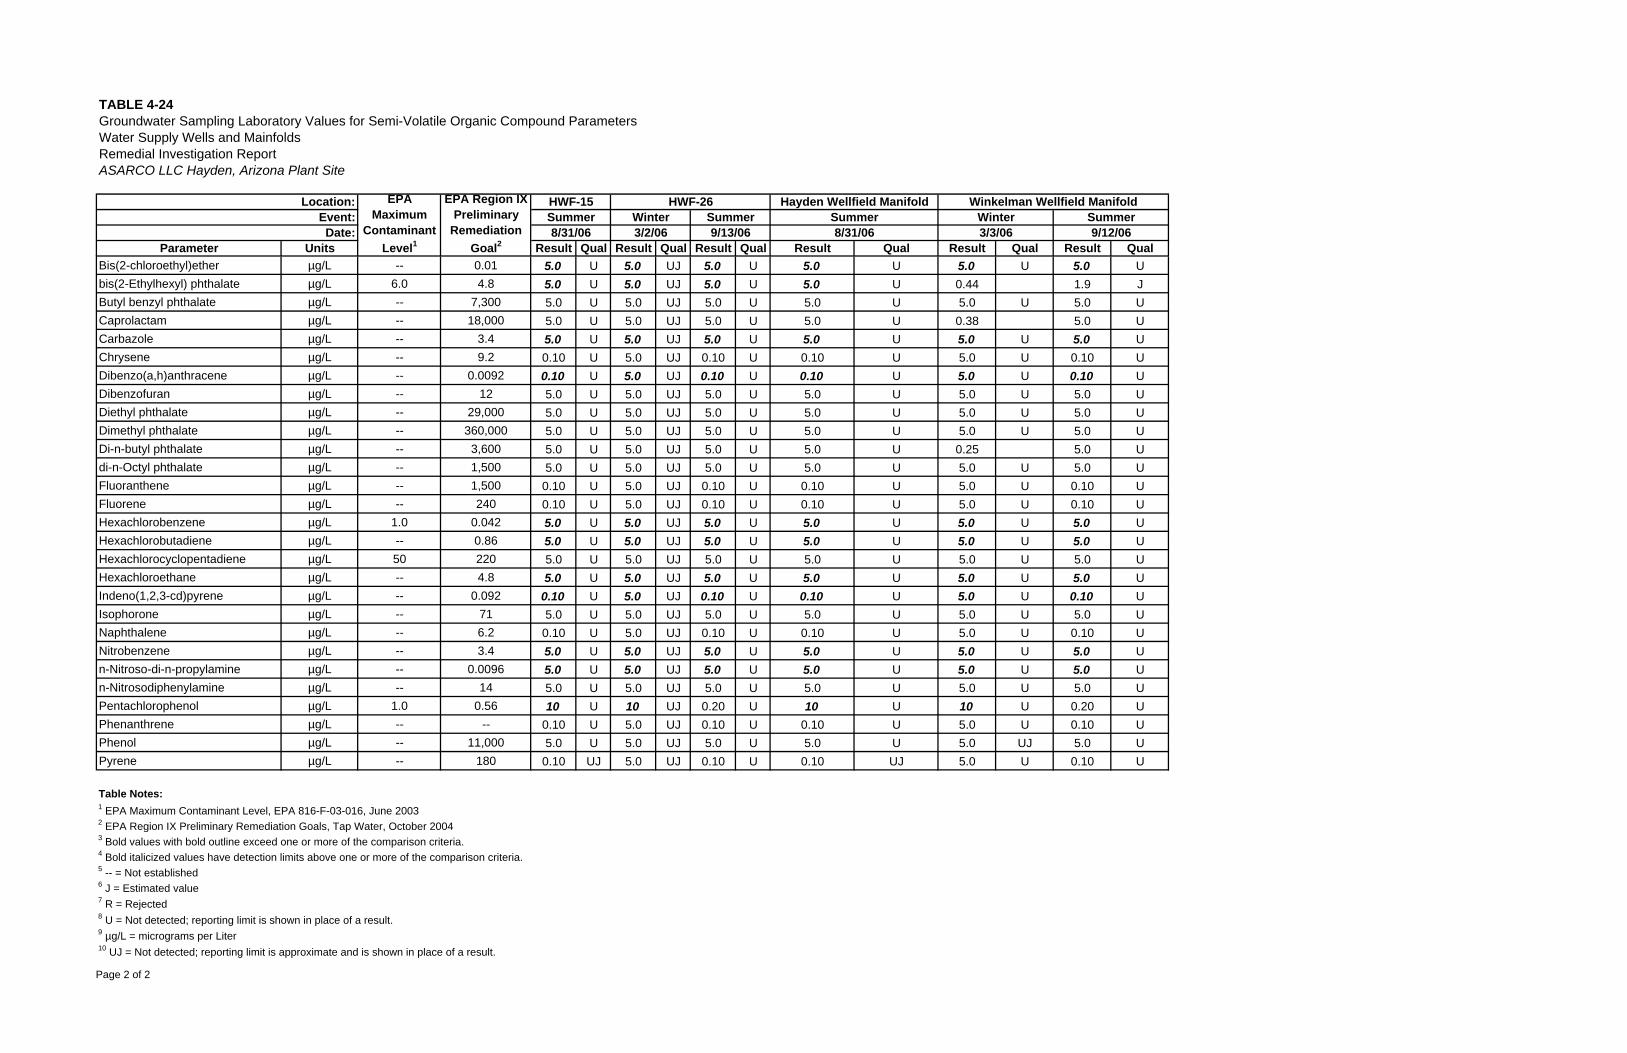
TABLE 4-24Groundwater Sampling Laboratory Values for Semi-Volatile Organic Compound ParametersWater Supply Wells and MainfoldsRemedial Investigation ReportASARCO LLC Hayden, Arizona Plant Site
Parameter Units Result Qual Result Qual Result Qual Result Qual Result Qual Result Qual
HWF-15
8/31/06Summer
EPA Region IXPreliminary
RemediationGoal2
Location:Event:Date:
EPAMaximum
ContaminantLevel1
Winkelman Wellfield ManifoldSummer Summer Winter Summer
HWF-26 Hayden Wellfield ManifoldWinter
9/12/063/2/06 9/13/06 8/31/06 3/3/06
Bis(2-chloroethyl)ether µg/L -- 0.01 5.0 U 5.0 UJ 5.0 U 5.0 U 5.0 U 5.0 Ubis(2-Ethylhexyl) phthalate µg/L 6.0 4.8 5.0 U 5.0 UJ 5.0 U 5.0 U 0.44 1.9 JButyl benzyl phthalate µg/L -- 7,300 5.0 U 5.0 UJ 5.0 U 5.0 U 5.0 U 5.0 UCaprolactam µg/L -- 18,000 5.0 U 5.0 UJ 5.0 U 5.0 U 0.38 5.0 UCarbazole µg/L -- 3.4 5.0 U 5.0 UJ 5.0 U 5.0 U 5.0 U 5.0 UChrysene µg/L -- 9.2 0.10 U 5.0 UJ 0.10 U 0.10 U 5.0 U 0.10 UDibenzo(a,h)anthracene µg/L -- 0.0092 0.10 U 5.0 UJ 0.10 U 0.10 U 5.0 U 0.10 UDibenzofuran µg/L -- 12 5.0 U 5.0 UJ 5.0 U 5.0 U 5.0 U 5.0 UDiethyl phthalate µg/L -- 29,000 5.0 U 5.0 UJ 5.0 U 5.0 U 5.0 U 5.0 UDimethyl phthalate µg/L -- 360,000 5.0 U 5.0 UJ 5.0 U 5.0 U 5.0 U 5.0 UDi-n-butyl phthalate µg/L -- 3,600 5.0 U 5.0 UJ 5.0 U 5.0 U 0.25 5.0 Udi-n-Octyl phthalate µg/L -- 1,500 5.0 U 5.0 UJ 5.0 U 5.0 U 5.0 U 5.0 UFluoranthene µg/L -- 1,500 0.10 U 5.0 UJ 0.10 U 0.10 U 5.0 U 0.10 UFluorene µg/L -- 240 0.10 U 5.0 UJ 0.10 U 0.10 U 5.0 U 0.10 UHexachlorobenzene µg/L 1.0 0.042 5.0 U 5.0 UJ 5.0 U 5.0 U 5.0 U 5.0 UHexachlorobutadiene µg/L -- 0.86 5.0 U 5.0 UJ 5.0 U 5.0 U 5.0 U 5.0 UHexachlorocyclopentadiene µg/L 50 220 5.0 U 5.0 UJ 5.0 U 5.0 U 5.0 U 5.0 UHexachloroethane µg/L -- 4.8 5.0 U 5.0 UJ 5.0 U 5.0 U 5.0 U 5.0 UIndeno(1,2,3-cd)pyrene µg/L -- 0.092 0.10 U 5.0 UJ 0.10 U 0.10 U 5.0 U 0.10 UIsophorone µg/L -- 71 5.0 U 5.0 UJ 5.0 U 5.0 U 5.0 U 5.0 UNaphthalene µg/L -- 6.2 0.10 U 5.0 UJ 0.10 U 0.10 U 5.0 U 0.10 UNitrobenzene µg/L -- 3.4 5.0 U 5.0 UJ 5.0 U 5.0 U 5.0 U 5.0 Un-Nitroso-di-n-propylamine µg/L -- 0.0096 5.0 U 5.0 UJ 5.0 U 5.0 U 5.0 U 5.0 Un-Nitrosodiphenylamine µg/L -- 14 5.0 U 5.0 UJ 5.0 U 5.0 U 5.0 U 5.0 UPentachlorophenol µg/L 1.0 0.56 10 U 10 UJ 0.20 U 10 U 10 U 0.20 UPhenanthrene µg/L -- -- 0.10 U 5.0 UJ 0.10 U 0.10 U 5.0 U 0.10 UPhenol µg/L -- 11,000 5.0 U 5.0 UJ 5.0 U 5.0 U 5.0 UJ 5.0 UPyrene µg/L -- 180 0.10 UJ 5.0 UJ 0.10 U 0.10 UJ 5.0 U 0.10 U
Table Notes:1 EPA Maximum Contaminant Level, EPA 816-F-03-016, June 20032 EPA Region IX Preliminary Remediation Goals, Tap Water, October 20043 Bold values with bold outline exceed one or more of the comparison criteria.4 Bold italicized values have detection limits above one or more of the comparison criteria.5 -- = Not established6 J = Estimated value7 R = Rejected8 U = Not detected; reporting limit is shown in place of a result.9 µg/L = micrograms per Liter10 UJ = Not detected; reporting limit is approximate and is shown in place of a result.
Page 2 of 2
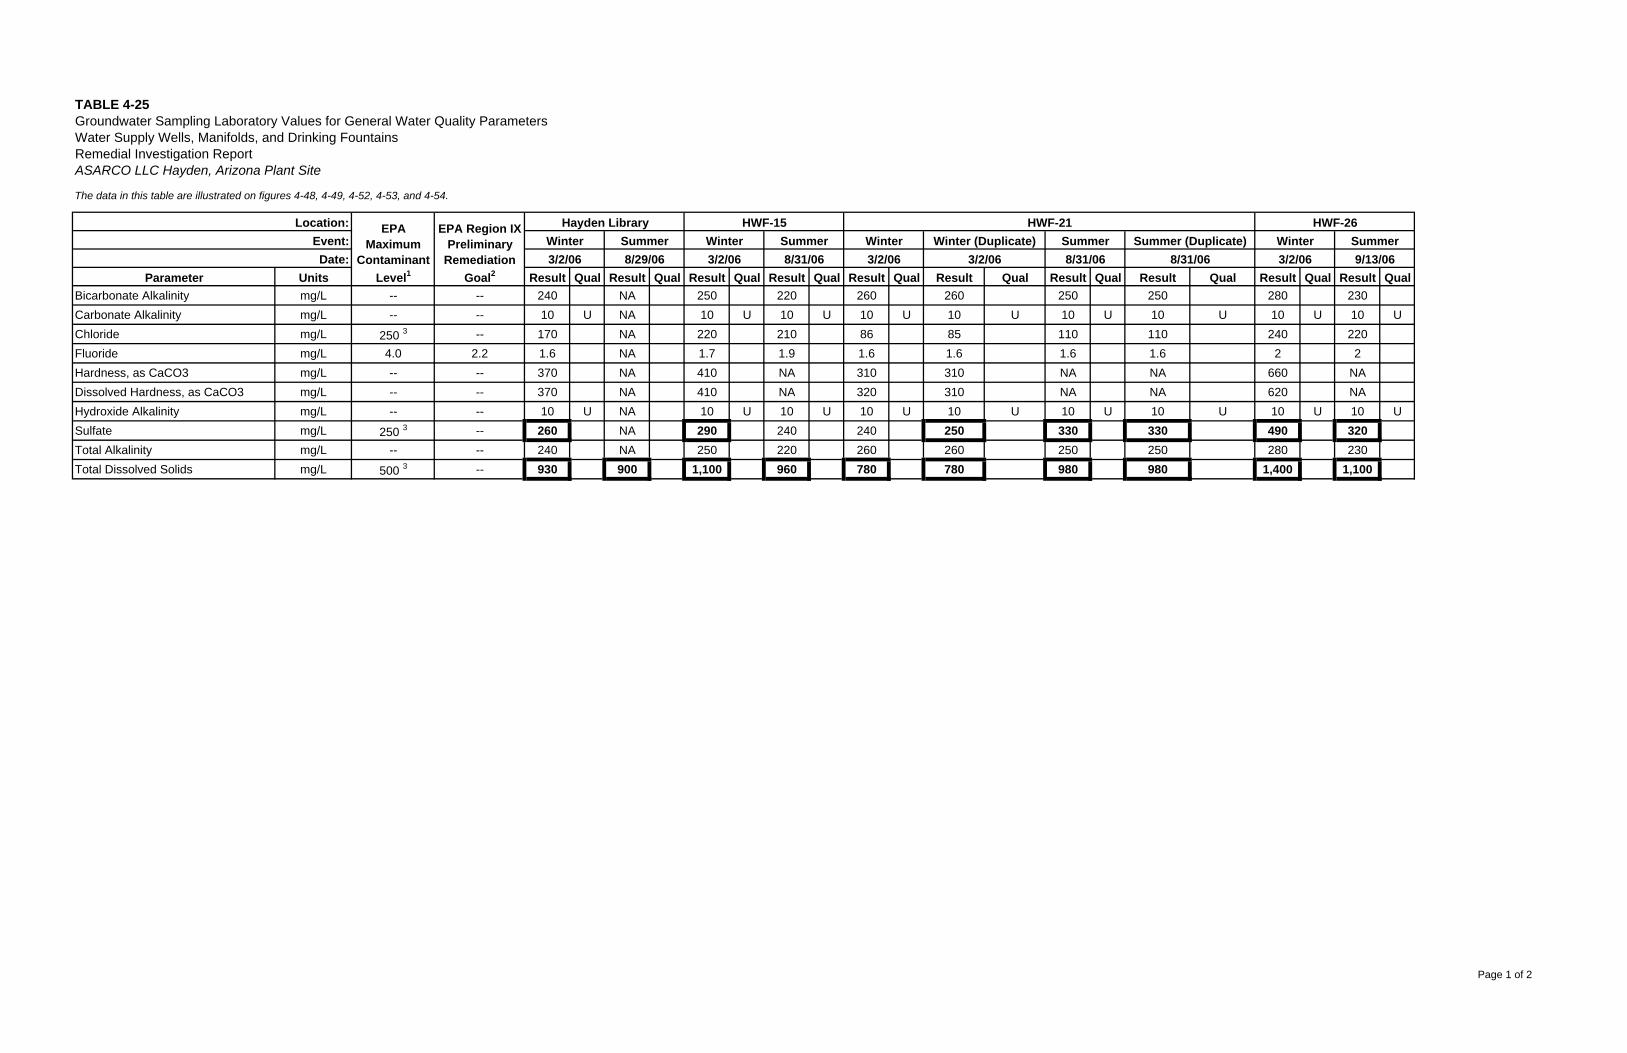
TABLE 4-25Groundwater Sampling Laboratory Values for General Water Quality ParametersWater Supply Wells, Manifolds, and Drinking FountainsRemedial Investigation ReportASARCO LLC Hayden, Arizona Plant Site
The data in this table are illustrated on figures 4-48, 4-49, 4-52, 4-53, and 4-54.
Parameter Units Result Qual Result Qual Result Qual Result Qual Result Qual Result Qual Result Qual Result Qual Result Qual Result QualBicarbonate Alkalinity mg/L -- -- 240 NA 250 220 260 260 250 250 280 230Carbonate Alkalinity mg/L -- -- 10 U NA 10 U 10 U 10 U 10 U 10 U 10 U 10 U 10 UChloride mg/L 250 3 -- 170 NA 220 210 86 85 110 110 240 220Fluoride mg/L 4.0 2.2 1.6 NA 1.7 1.9 1.6 1.6 1.6 1.6 2 2Hardness, as CaCO3 mg/L -- -- 370 NA 410 NA 310 310 NA NA 660 NADissolved Hardness, as CaCO3 mg/L -- -- 370 NA 410 NA 320 310 NA NA 620 NAHydroxide Alkalinity mg/L -- -- 10 U NA 10 U 10 U 10 U 10 U 10 U 10 U 10 U 10 USulfate mg/L 250 3 -- 260 NA 290 240 240 250 330 330 490 320Total Alkalinity mg/L -- -- 240 NA 250 220 260 260 250 250 280 230Total Dissolved Solids mg/L 500 3 -- 930 900 1,100 960 780 780 980 980 1,400 1,100
3/2/06 3/2/06 8/31/06
HWF-15 HWF-21Summer (Duplicate)
8/31/06
Location: EPAMaximum
ContaminantLevel1
EPA Region IXPreliminary
RemediationGoal2
Event:Date:
SummerWinterHWF-26Hayden Library
Winter Summer Winter Summer Winter Winter (Duplicate) Summer3/2/06 8/29/06 3/2/06 8/31/06 3/2/06 9/13/06
Page 1 of 2
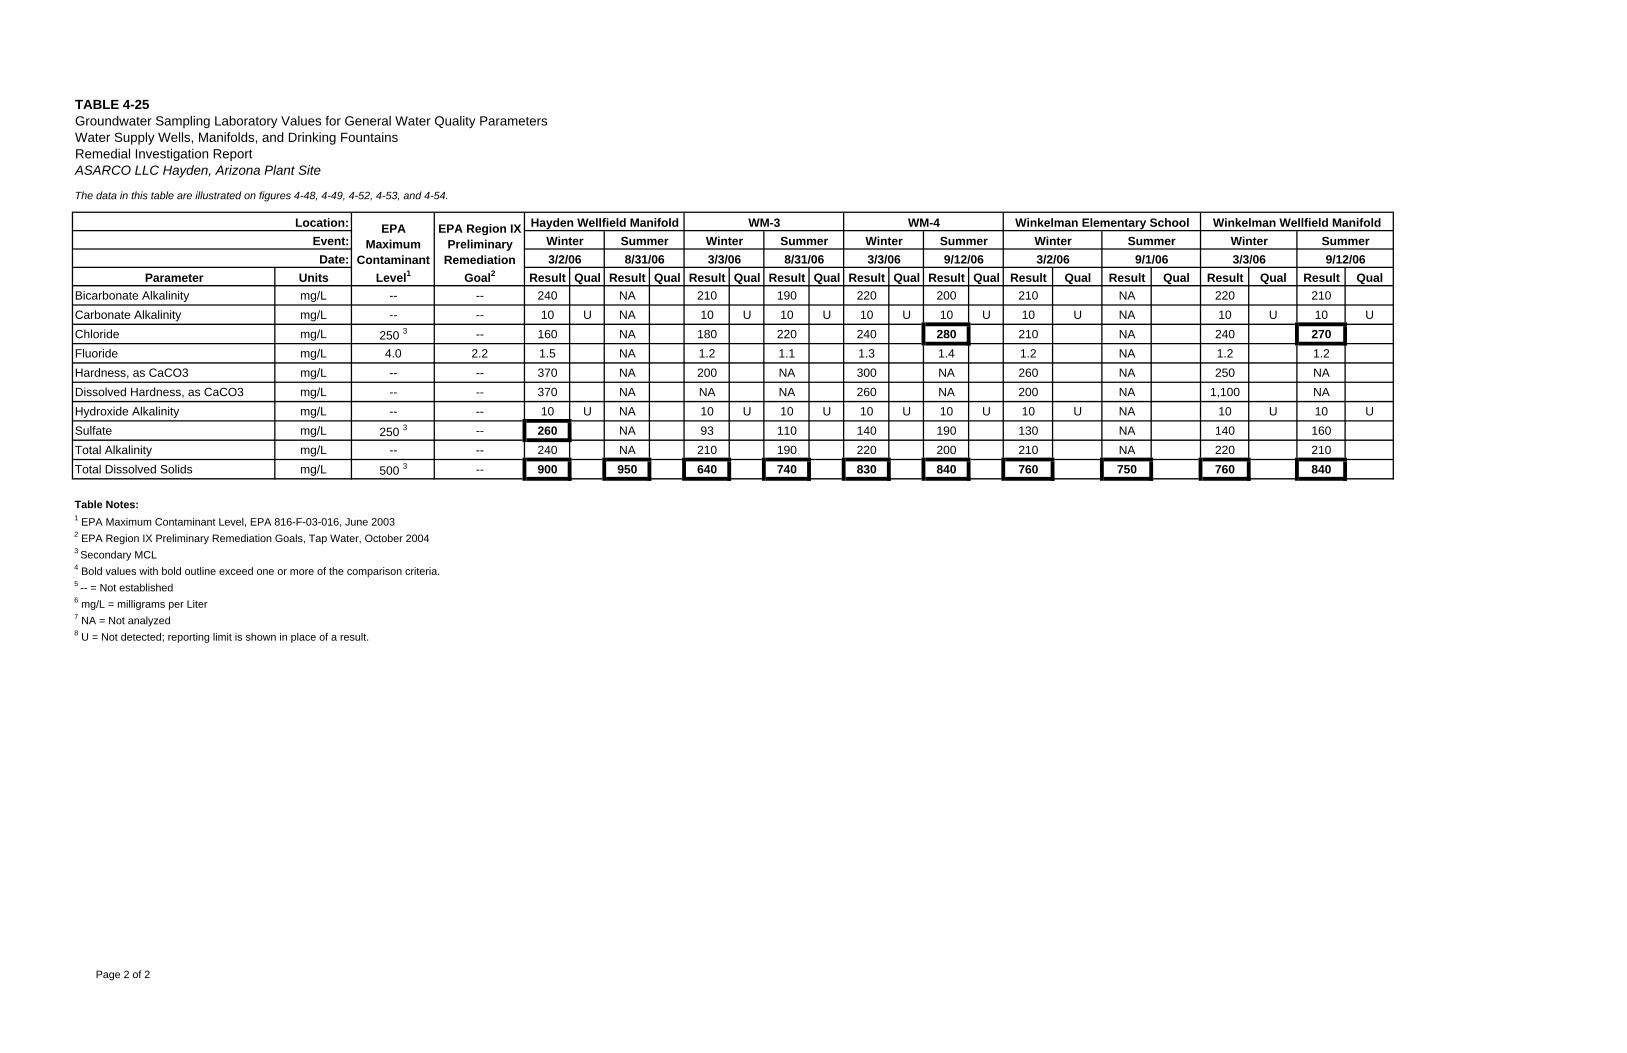
TABLE 4-25Groundwater Sampling Laboratory Values for General Water Quality ParametersWater Supply Wells, Manifolds, and Drinking FountainsRemedial Investigation ReportASARCO LLC Hayden, Arizona Plant Site
The data in this table are illustrated on figures 4-48, 4-49, 4-52, 4-53, and 4-54.
Parameter Units Result Qual Result Qual Result Qual Result Qual Result Qual Result Qual Result Qual Result Qual Result Qual Result QualBicarbonate Alkalinity mg/L -- -- 240 NA 210 190 220 200 210 NA 220 210Carbonate Alkalinity mg/L -- -- 10 U NA 10 U 10 U 10 U 10 U 10 U NA 10 U 10 UChloride mg/L 250 3 -- 160 NA 180 220 240 280 210 NA 240 270Fluoride mg/L 4.0 2.2 1.5 NA 1.2 1.1 1.3 1.4 1.2 NA 1.2 1.2Hardness, as CaCO3 mg/L -- -- 370 NA 200 NA 300 NA 260 NA 250 NADissolved Hardness, as CaCO3 mg/L -- -- 370 NA NA NA 260 NA 200 NA 1,100 NAHydroxide Alkalinity mg/L -- -- 10 U NA 10 U 10 U 10 U 10 U 10 U NA 10 U 10 USulfate mg/L 250 3 -- 260 NA 93 110 140 190 130 NA 140 160Total Alkalinity mg/L -- -- 240 NA 210 190 220 200 210 NA 220 210Total Dissolved Solids mg/L 500 3 -- 900 950 640 740 830 840 760 750 760 840
Table Notes:1 EPA Maximum Contaminant Level, EPA 816-F-03-016, June 20032 EPA Region IX Preliminary Remediation Goals, Tap Water, October 20043 Secondary MCL4 Bold values with bold outline exceed one or more of the comparison criteria.5 -- = Not established6 mg/L = milligrams per Liter7 NA = Not analyzed8 U = Not detected; reporting limit is shown in place of a result.
Winkelman Wellfield ManifoldHayden Wellfield Manifold WM-3 WM-4 Winkelman Elementary SchoolLocation:WinterWinter Summer SummerWinter Summer Winter Summer Winter Summer
3/3/06 8/31/063/2/06 8/31/06
EPAMaximum
ContaminantLevel1
EPA Region IXPreliminary
RemediationGoal2
Event:Date: 3/3/06 9/12/063/3/06 9/12/06 3/2/06 9/1/06
Page 2 of 2
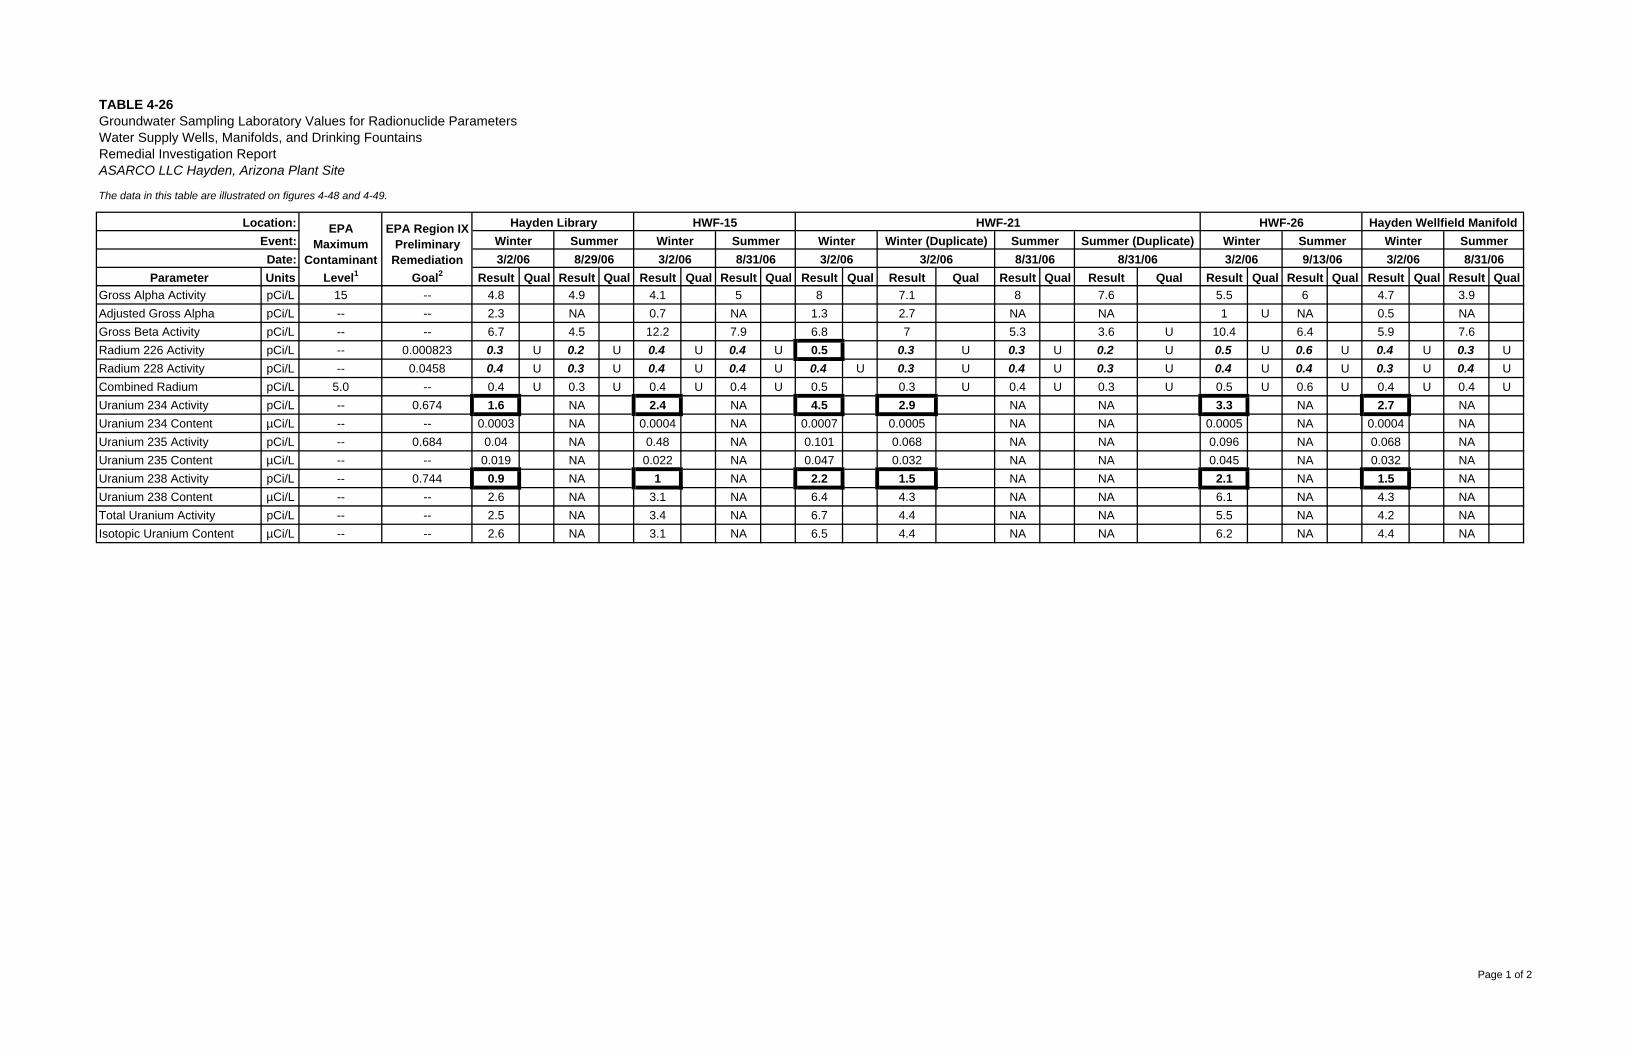
TABLE 4-26Groundwater Sampling Laboratory Values for Radionuclide ParametersWater Supply Wells, Manifolds, and Drinking FountainsRemedial Investigation ReportASARCO LLC Hayden, Arizona Plant Site
The data in this table are illustrated on figures 4-48 and 4-49.
Parameter Units Result Qual Result Qual Result Qual Result Qual Result Qual Result Qual Result Qual Result Qual Result Qual Result Qual Result Qual Result QualGross Alpha Activity pCi/L 15 -- 4.8 4.9 4.1 5 8 7.1 8 7.6 5.5 6 4.7 3.9Adjusted Gross Alpha pCi/L -- -- 2.3 NA 0.7 NA 1.3 2.7 NA NA 1 U NA 0.5 NAGross Beta Activity pCi/L -- -- 6.7 4.5 12.2 7.9 6.8 7 5.3 3.6 U 10.4 6.4 5.9 7.6Radium 226 Activity pCi/L -- 0.000823 0.3 U 0.2 U 0.4 U 0.4 U 0.5 0.3 U 0.3 U 0.2 U 0.5 U 0.6 U 0.4 U 0.3 URadium 228 Activity pCi/L -- 0.0458 0.4 U 0.3 U 0.4 U 0.4 U 0.4 U 0.3 U 0.4 U 0.3 U 0.4 U 0.4 U 0.3 U 0.4 UCombined Radium pCi/L 5.0 -- 0.4 U 0.3 U 0.4 U 0.4 U 0.5 0.3 U 0.4 U 0.3 U 0.5 U 0.6 U 0.4 U 0.4 UUranium 234 Activity pCi/L -- 0.674 1.6 NA 2.4 NA 4.5 2.9 NA NA 3.3 NA 2.7 NAUranium 234 Content µCi/L -- -- 0.0003 NA 0.0004 NA 0.0007 0.0005 NA NA 0.0005 NA 0.0004 NAUranium 235 Activity pCi/L -- 0.684 0.04 NA 0.48 NA 0.101 0.068 NA NA 0.096 NA 0.068 NAUranium 235 Content µCi/L -- -- 0.019 NA 0.022 NA 0.047 0.032 NA NA 0.045 NA 0.032 NAUranium 238 Activity pCi/L -- 0.744 0.9 NA 1 NA 2.2 1.5 NA NA 2.1 NA 1.5 NAUranium 238 Content µCi/L -- -- 2.6 NA 3.1 NA 6.4 4.3 NA NA 6.1 NA 4.3 NATotal Uranium Activity pCi/L -- -- 2.5 NA 3.4 NA 6.7 4.4 NA NA 5.5 NA 4.2 NAIsotopic Uranium Content µCi/L -- -- 2.6 NA 3.1 NA 6.5 4.4 NA NA 6.2 NA 4.4 NA
3/2/06 9/13/06 3/2/06 8/31/063/2/06 3/2/06 8/31/06 8/31/063/2/06 8/29/06 3/2/06 8/31/06Summer Winter Summer Winter Winter (Duplicate) Summer Summer (Duplicate) Winter
Hayden Wellfield ManifoldWinter SummerWinter
HWF-15 HWF-21 HWF-26Hayden LibrarySummer
Location: EPAMaximum
ContaminantLevel1
EPA Region IXPreliminary
RemediationGoal2
Event:Date:
Page 1 of 2
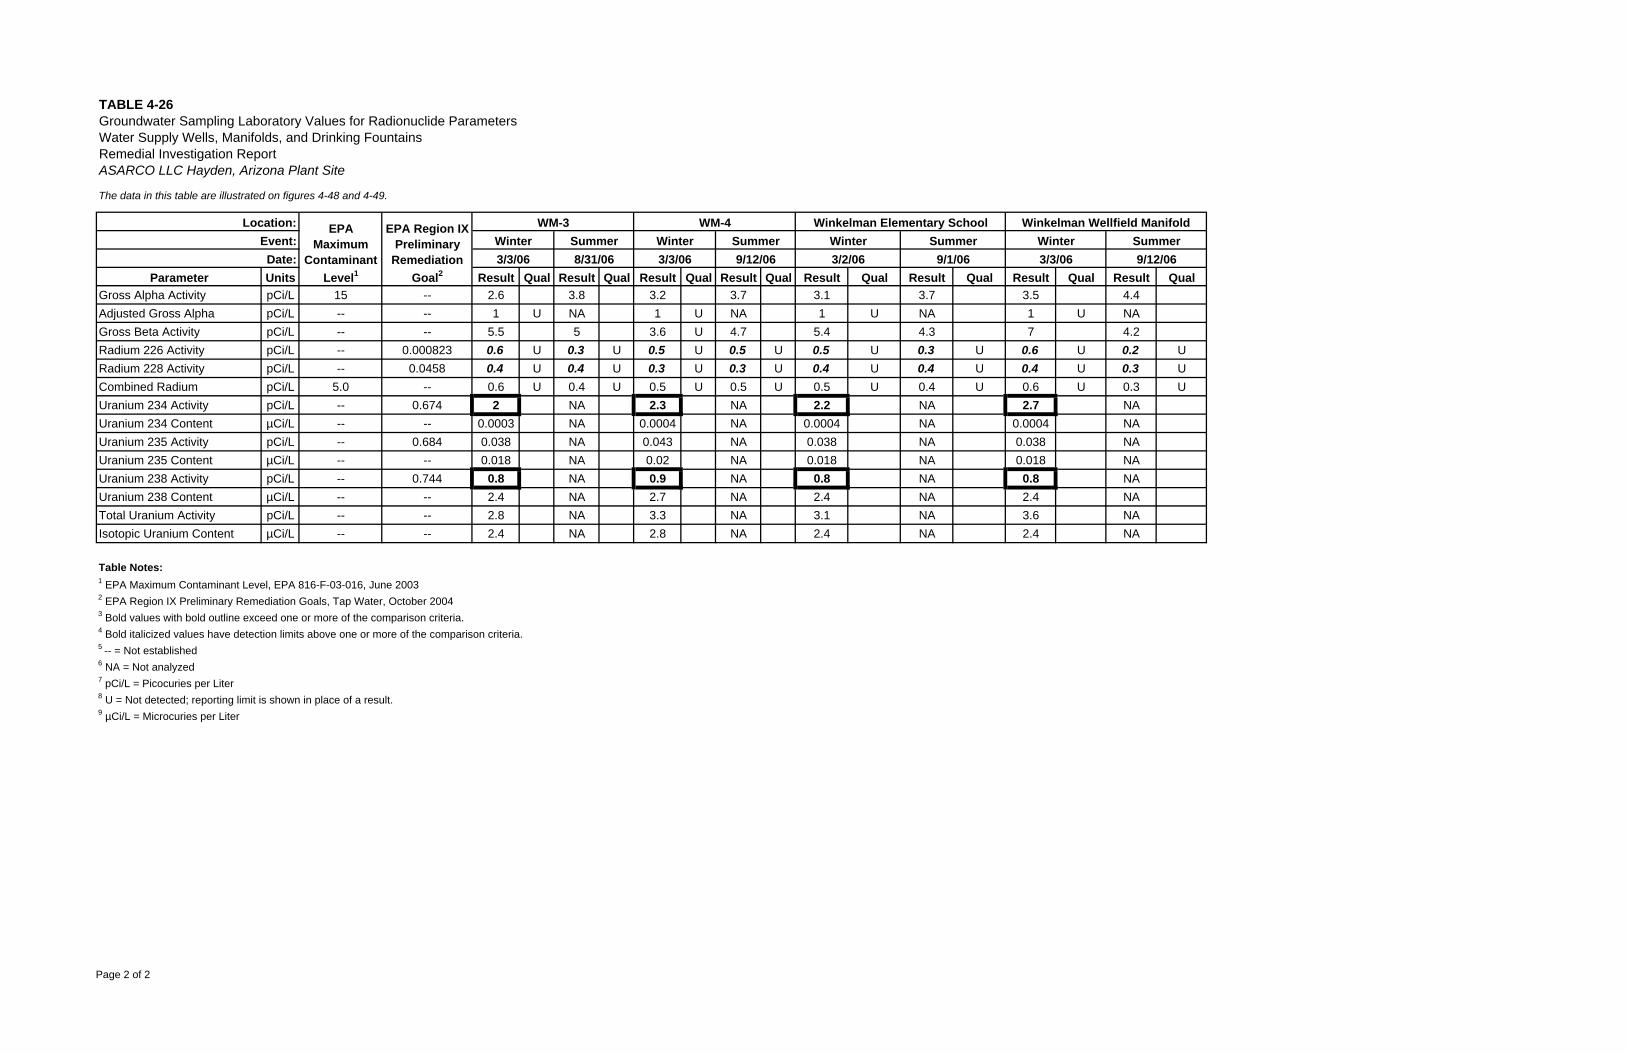
TABLE 4-26Groundwater Sampling Laboratory Values for Radionuclide ParametersWater Supply Wells, Manifolds, and Drinking FountainsRemedial Investigation ReportASARCO LLC Hayden, Arizona Plant Site
The data in this table are illustrated on figures 4-48 and 4-49.
Parameter Units Result Qual Result Qual Result Qual Result Qual Result Qual Result Qual Result Qual Result QualGross Alpha Activity pCi/L 15 -- 2.6 3.8 3.2 3.7 3.1 3.7 3.5 4.4Adjusted Gross Alpha pCi/L -- -- 1 U NA 1 U NA 1 U NA 1 U NAGross Beta Activity pCi/L -- -- 5.5 5 3.6 U 4.7 5.4 4.3 7 4.2Radium 226 Activity pCi/L -- 0.000823 0.6 U 0.3 U 0.5 U 0.5 U 0.5 U 0.3 U 0.6 U 0.2 URadium 228 Activity pCi/L -- 0.0458 0.4 U 0.4 U 0.3 U 0.3 U 0.4 U 0.4 U 0.4 U 0.3 UCombined Radium pCi/L 5.0 -- 0.6 U 0.4 U 0.5 U 0.5 U 0.5 U 0.4 U 0.6 U 0.3 UUranium 234 Activity pCi/L -- 0.674 2 NA 2.3 NA 2.2 NA 2.7 NAUranium 234 Content µCi/L -- -- 0.0003 NA 0.0004 NA 0.0004 NA 0.0004 NAUranium 235 Activity pCi/L -- 0.684 0.038 NA 0.043 NA 0.038 NA 0.038 NAUranium 235 Content µCi/L -- -- 0.018 NA 0.02 NA 0.018 NA 0.018 NAUranium 238 Activity pCi/L -- 0.744 0.8 NA 0.9 NA 0.8 NA 0.8 NAUranium 238 Content µCi/L -- -- 2.4 NA 2.7 NA 2.4 NA 2.4 NATotal Uranium Activity pCi/L -- -- 2.8 NA 3.3 NA 3.1 NA 3.6 NAIsotopic Uranium Content µCi/L -- -- 2.4 NA 2.8 NA 2.4 NA 2.4 NA
Table Notes:1 EPA Maximum Contaminant Level, EPA 816-F-03-016, June 20032 EPA Region IX Preliminary Remediation Goals, Tap Water, October 20043 Bold values with bold outline exceed one or more of the comparison criteria.4 Bold italicized values have detection limits above one or more of the comparison criteria.5 -- = Not established6 NA = Not analyzed7 pCi/L = Picocuries per Liter8 U = Not detected; reporting limit is shown in place of a result.9 µCi/L = Microcuries per Liter
3/3/06 9/12/063/3/06 9/12/06 3/2/06 9/1/068/31/063/3/06Winter Summer Winter SummerWinter Summer Winter Summer
Winkelman Elementary School Winkelman Wellfield ManifoldWM-3 WM-4Location: EPAMaximum
ContaminantLevel1
EPA Region IXPreliminary
RemediationGoal2
Event:Date:
Page 2 of 2
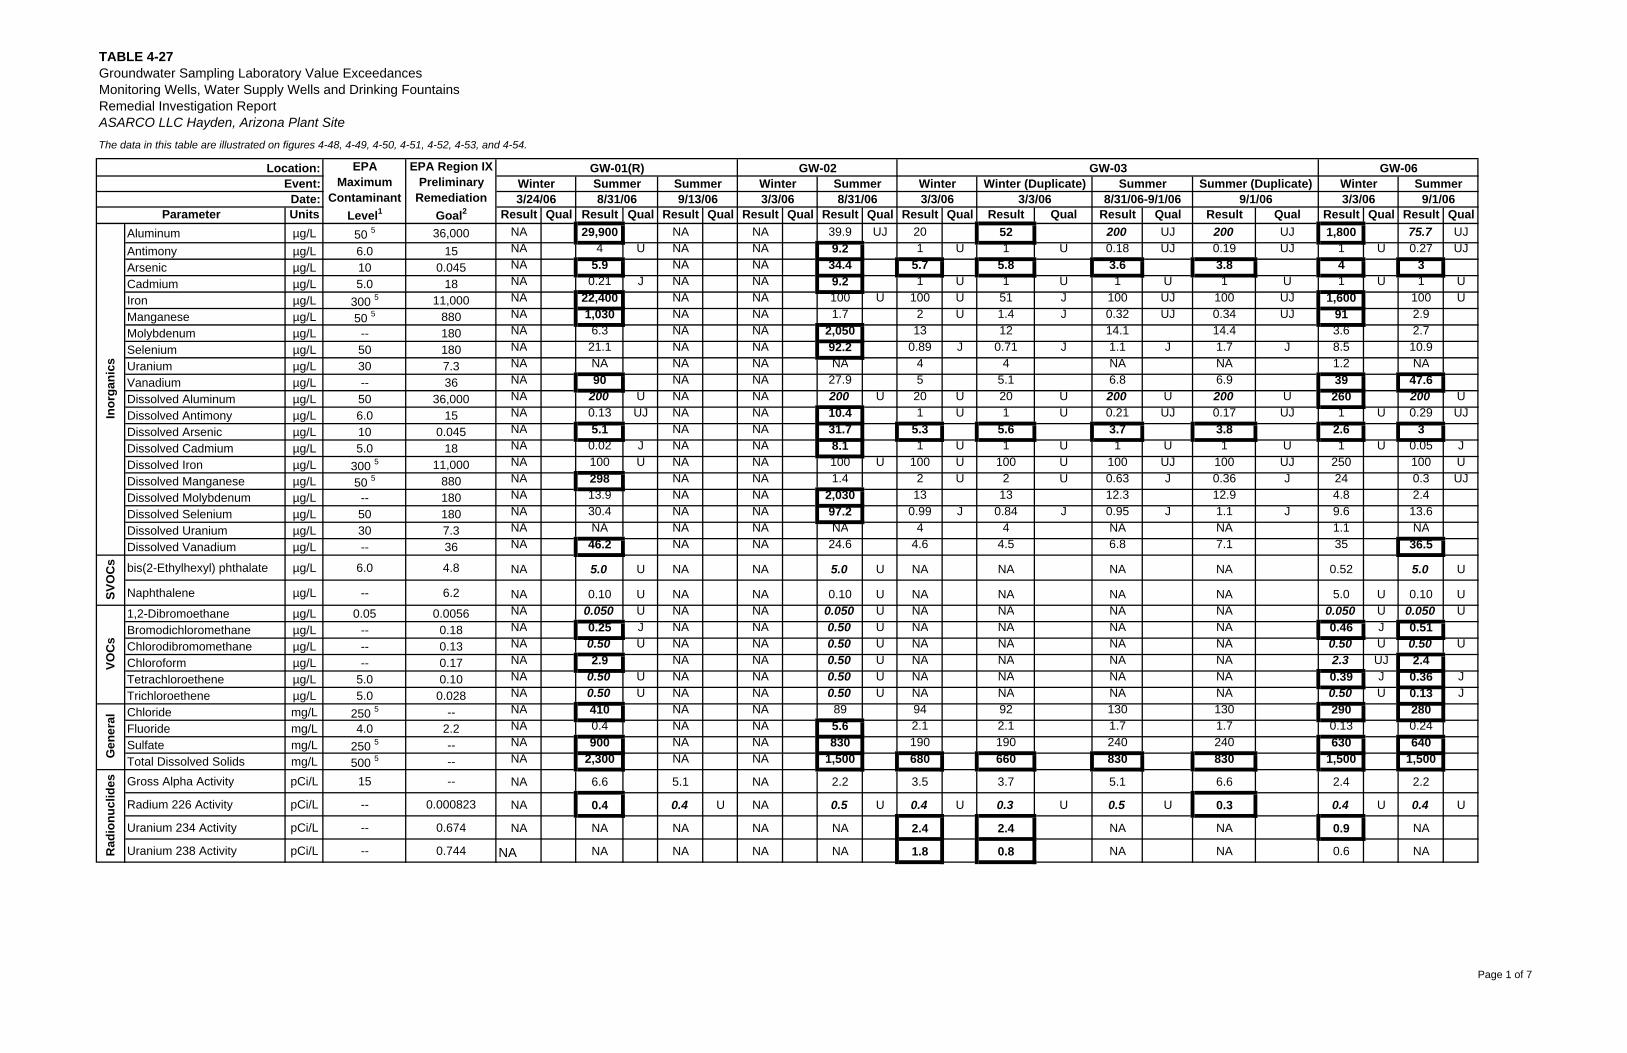
TABLE 4-27Groundwater Sampling Laboratory Value ExceedancesMonitoring Wells, Water Supply Wells and Drinking Fountains
The data in this table are illustrated on figures 4-48, 4-49, 4-50, 4-51, 4-52, 4-53, and 4-54.
Units Result Qual Result Qual Result Qual Result Qual Result Qual Result Qual Result Qual Result Qual Result Qual Result Qual Result QualAluminum µg/L 50 5 36,000 NA 29,900 NA NA 39.9 UJ 20 52 200 UJ 200 UJ 1,800 75.7 UJAntimony µg/L 6.0 15 NA 4 U NA NA 9.2 1 U 1 U 0.18 UJ 0.19 UJ 1 U 0.27 UJArsenic µg/L 10 0.045 NA 5.9 NA NA 34.4 5.7 5.8 3.6 3.8 4 3Cadmium µg/L 5.0 18 NA 0.21 J NA NA 9.2 1 U 1 U 1 U 1 U 1 U 1 UIron µg/L 300 5 11,000 NA 22,400 NA NA 100 U 100 U 51 J 100 UJ 100 UJ 1,600 100 UManganese µg/L 50 5 880 NA 1,030 NA NA 1.7 2 U 1.4 J 0.32 UJ 0.34 UJ 91 2.9Molybdenum µg/L -- 180 NA 6.3 NA NA 2,050 13 12 14.1 14.4 3.6 2.7Selenium µg/L 50 180 NA 21.1 NA NA 92.2 0.89 J 0.71 J 1.1 J 1.7 J 8.5 10.9Uranium µg/L 30 7.3 NA NA NA NA NA 4 4 NA NA 1.2 NAVanadium µg/L -- 36 NA 90 NA NA 27.9 5 5.1 6.8 6.9 39 47.6Dissolved Aluminum µg/L 50 36,000 NA 200 U NA NA 200 U 20 U 20 U 200 U 200 U 260 200 UDissolved Antimony µg/L 6.0 15 NA 0.13 UJ NA NA 10.4 1 U 1 U 0.21 UJ 0.17 UJ 1 U 0.29 UJDissolved Arsenic µg/L 10 0.045 NA 5.1 NA NA 31.7 5.3 5.6 3.7 3.8 2.6 3Dissolved Cadmium µg/L 5.0 18 NA 0.02 J NA NA 8.1 1 U 1 U 1 U 1 U 1 U 0.05 JDissolved Iron µg/L 300 5 11,000 NA 100 U NA NA 100 U 100 U 100 U 100 UJ 100 UJ 250 100 UDissolved Manganese µg/L 50 5 880 NA 298 NA NA 1.4 2 U 2 U 0.63 J 0.36 J 24 0.3 UJDissolved Molybdenum µg/L -- 180 NA 13.9 NA NA 2,030 13 13 12.3 12.9 4.8 2.4Dissolved Selenium µg/L 50 180 NA 30.4 NA NA 97.2 0.99 J 0.84 J 0.95 J 1.1 J 9.6 13.6Dissolved Uranium µg/L 30 7.3 NA NA NA NA NA 4 4 NA NA 1.1 NADissolved Vanadium µg/L -- 36 NA 46.2 NA NA 24.6 4.6 4.5 6.8 7.1 35 36.5
bis(2-Ethylhexyl) phthalate µg/L 6.0 4.8 NA 5.0 U NA NA 5.0 U NA NA NA NA 0.52 5.0 U
Naphthalene µg/L -- 6.2 NA 0.10 U NA NA 0.10 U NA NA NA NA 5.0 U 0.10 U1,2-Dibromoethane µg/L 0.05 0.0056 NA 0.050 U NA NA 0.050 U NA NA NA NA 0.050 U 0.050 UBromodichloromethane µg/L -- 0.18 NA 0.25 J NA NA 0.50 U NA NA NA NA 0.46 J 0.51Chlorodibromomethane µg/L -- 0.13 NA 0.50 U NA NA 0.50 U NA NA NA NA 0.50 U 0.50 UChloroform µg/L -- 0.17 NA 2.9 NA NA 0.50 U NA NA NA NA 2.3 UJ 2.4Tetrachloroethene µg/L 5.0 0.10 NA 0.50 U NA NA 0.50 U NA NA NA NA 0.39 J 0.36 JTrichloroethene µg/L 5.0 0.028 NA 0.50 U NA NA 0.50 U NA NA NA NA 0.50 U 0.13 JChloride mg/L 250 5 -- NA 410 NA NA 89 94 92 130 130 290 280Fluoride mg/L 4.0 2.2 NA 0.4 NA NA 5.6 2.1 2.1 1.7 1.7 0.13 0.24Sulfate mg/L 250 5 -- NA 900 NA NA 830 190 190 240 240 630 640Total Dissolved Solids mg/L 500 5 -- NA 2,300 NA NA 1,500 680 660 830 830 1,500 1,500
Gross Alpha Activity pCi/L 15 -- NA 6.6 5.1 NA 2.2 3.5 3.7 5.1 6.6 2.4 2.2
Radium 226 Activity pCi/L -- 0.000823 NA 0.4 0.4 U NA 0.5 U 0.4 U 0.3 U 0.5 U 0.3 0.4 U 0.4 U
Uranium 234 Activity pCi/L -- 0.674 NA NA NA NA NA 2.4 2.4 NA NA 0.9 NA
Uranium 238 Activity pCi/L -- 0.744 NA NA NA NA NA 1.8 0.8 NA NA 0.6 NA
Remedial Investigation ReportASARCO LLC Hayden, Arizona Plant Site
9/13/06
GW-01(R)EPA Region IXPreliminary
RemediationGoal2
Date:
Location:Event:
EPAMaximum
ContaminantLevel1Parameter
GW-06GW-02 GW-03Winter Summer Winter Summer Winter SummerWinter Winter (Duplicate) Summer Summer (Duplicate)Summer
3/3/06 8/31/06-9/1/06 9/1/068/31/06 3/3/06 3/3/068/31/06
Inor
gani
cs
9/1/06 3/3/063/24/06
Rad
ionu
clid
es
SVO
Cs
VOC
sG
ener
al
Page 1 of 7
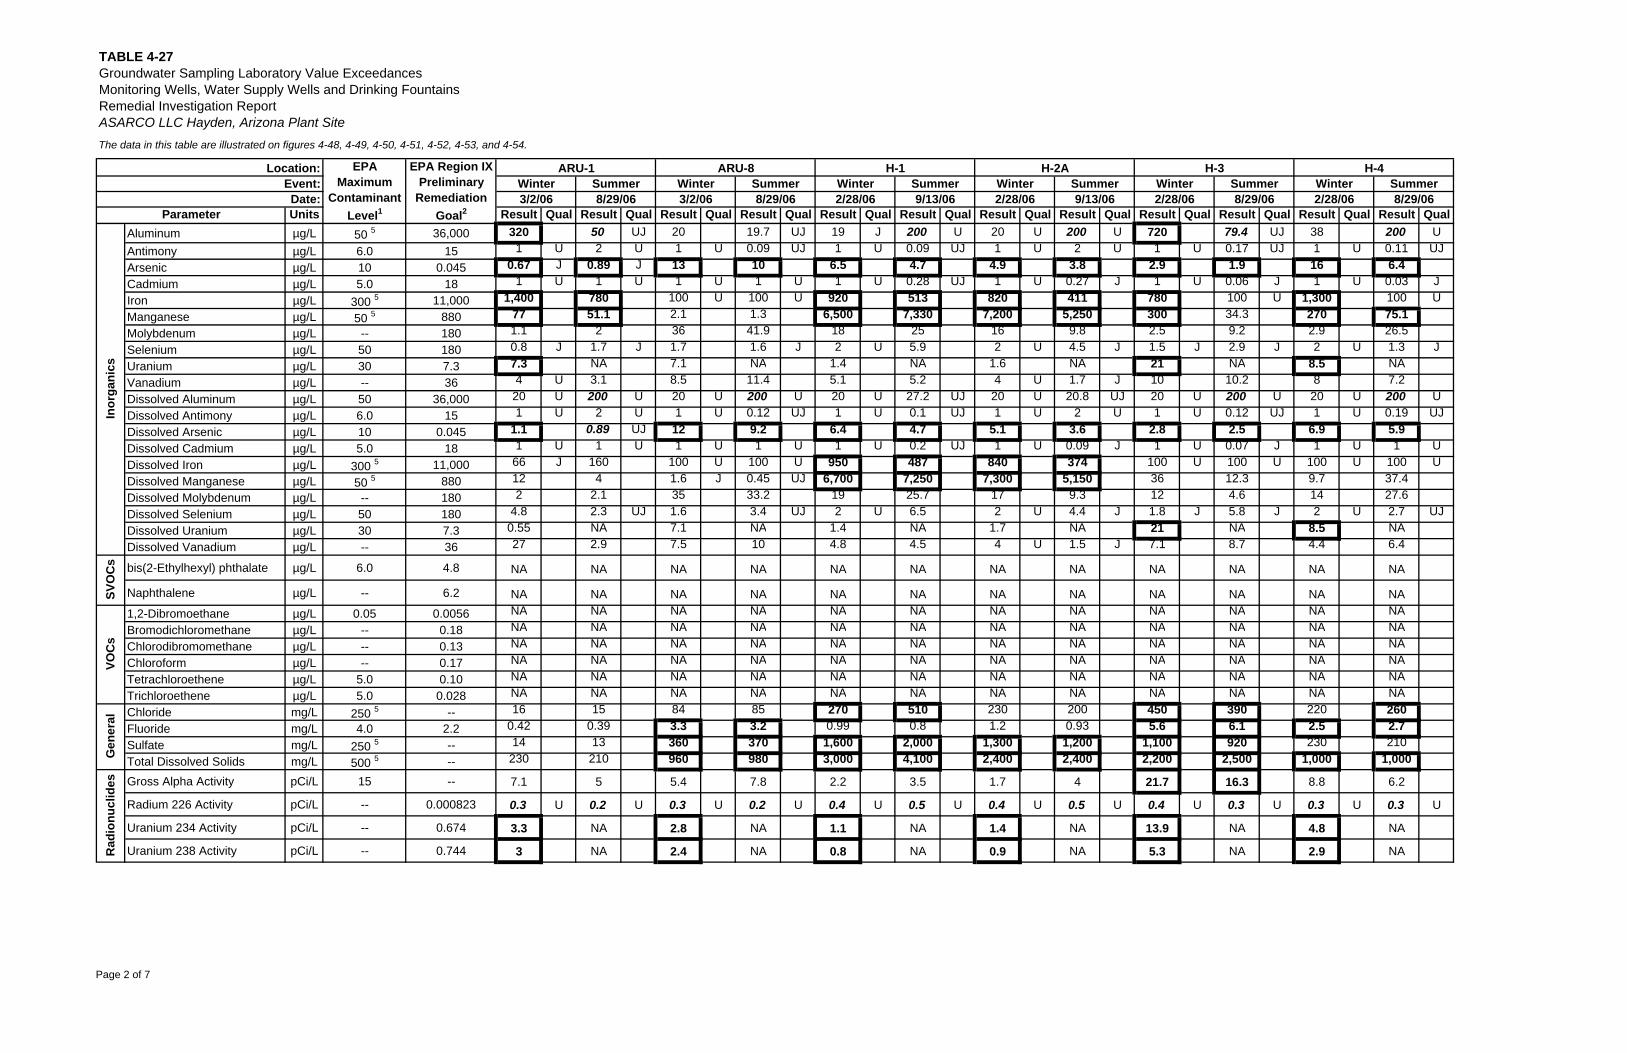
TABLE 4-27Groundwater Sampling Laboratory Value ExceedancesMonitoring Wells, Water Supply Wells and Drinking Fountains
The data in this table are illustrated on figures 4-48, 4-49, 4-50, 4-51, 4-52, 4-53, and 4-54.
Units Result Qual Result Qual Result Qual Result Qual Result Qual Result Qual Result Qual Result Qual Result Qual Result Qual Result Qual Result QualAluminum µg/L 50 5 36,000 320 50 UJ 20 19.7 UJ 19 J 200 U 20 U 200 U 720 79.4 UJ 38 200 UAntimony µg/L 6.0 15 1 U 2 U 1 U 0.09 UJ 1 U 0.09 UJ 1 U 2 U 1 U 0.17 UJ 1 U 0.11 UJArsenic µg/L 10 0.045 0.67 J 0.89 J 13 10 6.5 4.7 4.9 3.8 2.9 1.9 16 6.4Cadmium µg/L 5.0 18 1 U 1 U 1 U 1 U 1 U 0.28 UJ 1 U 0.27 J 1 U 0.06 J 1 U 0.03 JIron µg/L 300 5 11,000 1,400 780 100 U 100 U 920 513 820 411 780 100 U 1,300 100 UManganese µg/L 50 5 880 77 51.1 2.1 1.3 6,500 7,330 7,200 5,250 300 34.3 270 75.1Molybdenum µg/L -- 180 1.1 2 36 41.9 18 25 16 9.8 2.5 9.2 2.9 26.5Selenium µg/L 50 180 0.8 J 1.7 J 1.7 1.6 J 2 U 5.9 2 U 4.5 J 1.5 J 2.9 J 2 U 1.3 JUranium µg/L 30 7.3 7.3 NA 7.1 NA 1.4 NA 1.6 NA 21 NA 8.5 NAVanadium µg/L -- 36 4 U 3.1 8.5 11.4 5.1 5.2 4 U 1.7 J 10 10.2 8 7.2Dissolved Aluminum µg/L 50 36,000 20 U 200 U 20 U 200 U 20 U 27.2 UJ 20 U 20.8 UJ 20 U 200 U 20 U 200 UDissolved Antimony µg/L 6.0 15 1 U 2 U 1 U 0.12 UJ 1 U 0.1 UJ 1 U 2 U 1 U 0.12 UJ 1 U 0.19 UJDissolved Arsenic µg/L 10 0.045 1.1 0.89 UJ 12 9.2 6.4 4.7 5.1 3.6 2.8 2.5 6.9 5.9Dissolved Cadmium µg/L 5.0 18 1 U 1 U 1 U 1 U 1 U 0.2 UJ 1 U 0.09 J 1 U 0.07 J 1 U 1 UDissolved Iron µg/L 300 5 11,000 66 J 160 100 U 100 U 950 487 840 374 100 U 100 U 100 U 100 UDissolved Manganese µg/L 50 5 880 12 4 1.6 J 0.45 UJ 6,700 7,250 7,300 5,150 36 12.3 9.7 37.4Dissolved Molybdenum µg/L -- 180 2 2.1 35 33.2 19 25.7 17 9.3 12 4.6 14 27.6Dissolved Selenium µg/L 50 180 4.8 2.3 UJ 1.6 3.4 UJ 2 U 6.5 2 U 4.4 J 1.8 J 5.8 J 2 U 2.7 UJDissolved Uranium µg/L 30 7.3 0.55 NA 7.1 NA 1.4 NA 1.7 NA 21 NA 8.5 NADissolved Vanadium µg/L -- 36 27 2.9 7.5 10 4.8 4.5 4 U 1.5 J 7.1 8.7 4.4 6.4
bis(2-Ethylhexyl) phthalate µg/L 6.0 4.8 NA NA NA NA NA NA NA NA NA NA NA NA
Naphthalene µg/L -- 6.2 NA NA NA NA NA NA NA NA NA NA NA NA1,2-Dibromoethane µg/L 0.05 0.0056 NA NA NA NA NA NA NA NA NA NA NA NABromodichloromethane µg/L -- 0.18 NA NA NA NA NA NA NA NA NA NA NA NAChlorodibromomethane µg/L -- 0.13 NA NA NA NA NA NA NA NA NA NA NA NAChloroform µg/L -- 0.17 NA NA NA NA NA NA NA NA NA NA NA NATetrachloroethene µg/L 5.0 0.10 NA NA NA NA NA NA NA NA NA NA NA NATrichloroethene µg/L 5.0 0.028 NA NA NA NA NA NA NA NA NA NA NA NAChloride mg/L 250 5 -- 16 15 84 85 270 510 230 200 450 390 220 260Fluoride mg/L 4.0 2.2 0.42 0.39 3.3 3.2 0.99 0.8 1.2 0.93 5.6 6.1 2.5 2.7Sulfate mg/L 250 5 -- 14 13 360 370 1,600 2,000 1,300 1,200 1,100 920 230 210Total Dissolved Solids mg/L 500 5 -- 230 210 960 980 3,000 4,100 2,400 2,400 2,200 2,500 1,000 1,000
Gross Alpha Activity pCi/L 15 -- 7.1 5 5.4 7.8 2.2 3.5 1.7 4 21.7 16.3 8.8 6.2
Radium 226 Activity pCi/L -- 0.000823 0.3 U 0.2 U 0.3 U 0.2 U 0.4 U 0.5 U 0.4 U 0.5 U 0.4 U 0.3 U 0.3 U 0.3 U
Uranium 234 Activity pCi/L -- 0.674 3.3 NA 2.8 NA 1.1 NA 1.4 NA 13.9 NA 4.8 NA
Uranium 238 Activity pCi/L -- 0.744 3 NA 2.4 NA 0.8 NA 0.9 NA 5.3 NA 2.9 NARad
ionu
clid
es
Inor
gani
csSV
OC
sVO
Cs
Gen
eral
ASARCO LLC Hayden, Arizona Plant Site
Location: EPAMaximum
ContaminantLevel1
EPA Region IXPreliminary
RemediationGoal2
Event:Date:
Parameter
H-1 H-2A H-3
Remedial Investigation Report
H-4ARU-1 ARU-8WinterWinter Summer Winter Summer Winter Summer Winter SummerWinter SummerSummer
8/29/06 2/28/069/13/06 8/29/063/2/06 2/28/06 2/28/06 8/29/069/13/063/2/06 8/29/06 2/28/06
Page 2 of 7
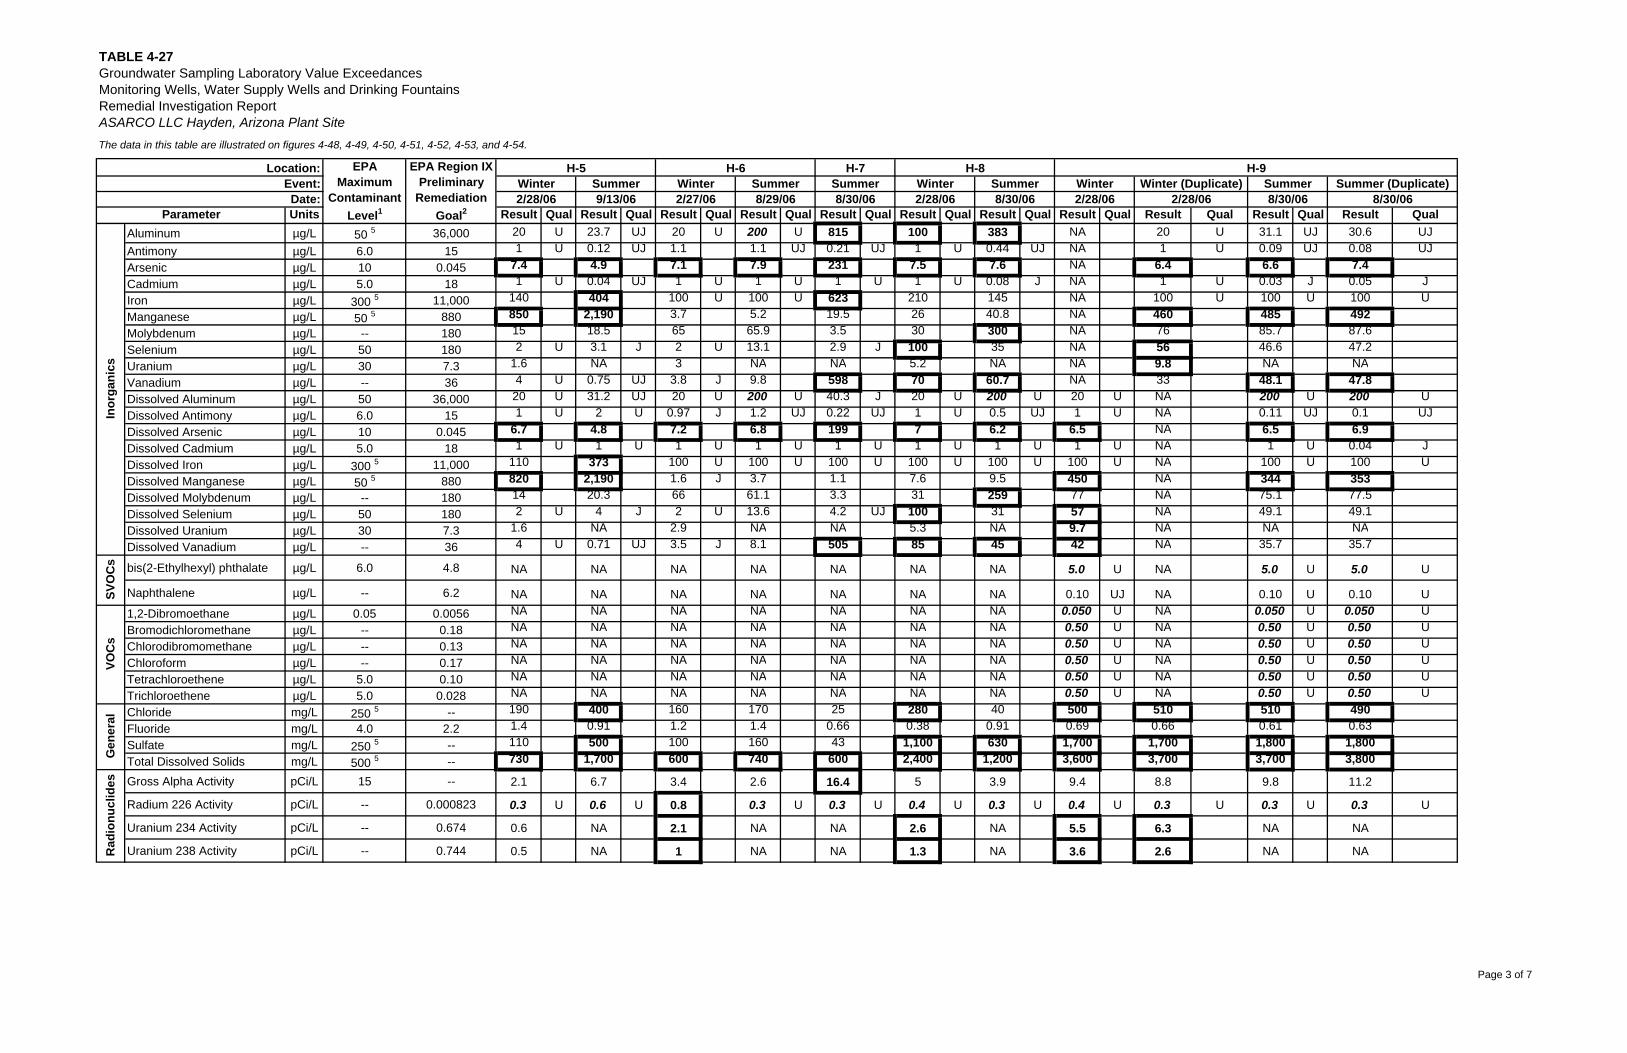
TABLE 4-27Groundwater Sampling Laboratory Value ExceedancesMonitoring Wells, Water Supply Wells and Drinking Fountains
The data in this table are illustrated on figures 4-48, 4-49, 4-50, 4-51, 4-52, 4-53, and 4-54.
Units Result Qual Result Qual Result Qual Result Qual Result Qual Result Qual Result Qual Result Qual Result Qual Result Qual Result QualAluminum µg/L 50 5 36,000 20 U 23.7 UJ 20 U 200 U 815 100 383 NA 20 U 31.1 UJ 30.6 UJAntimony µg/L 6.0 15 1 U 0.12 UJ 1.1 1.1 UJ 0.21 UJ 1 U 0.44 UJ NA 1 U 0.09 UJ 0.08 UJArsenic µg/L 10 0.045 7.4 4.9 7.1 7.9 231 7.5 7.6 NA 6.4 6.6 7.4Cadmium µg/L 5.0 18 1 U 0.04 UJ 1 U 1 U 1 U 1 U 0.08 J NA 1 U 0.03 J 0.05 JIron µg/L 300 5 11,000 140 404 100 U 100 U 623 210 145 NA 100 U 100 U 100 UManganese µg/L 50 5 880 850 2,190 3.7 5.2 19.5 26 40.8 NA 460 485 492Molybdenum µg/L -- 180 15 18.5 65 65.9 3.5 30 300 NA 76 85.7 87.6Selenium µg/L 50 180 2 U 3.1 J 2 U 13.1 2.9 J 100 35 NA 56 46.6 47.2Uranium µg/L 30 7.3 1.6 NA 3 NA NA 5.2 NA NA 9.8 NA NAVanadium µg/L -- 36 4 U 0.75 UJ 3.8 J 9.8 598 70 60.7 NA 33 48.1 47.8Dissolved Aluminum µg/L 50 36,000 20 U 31.2 UJ 20 U 200 U 40.3 J 20 U 200 U 20 U NA 200 U 200 UDissolved Antimony µg/L 6.0 15 1 U 2 U 0.97 J 1.2 UJ 0.22 UJ 1 U 0.5 UJ 1 U NA 0.11 UJ 0.1 UJDissolved Arsenic µg/L 10 0.045 6.7 4.8 7.2 6.8 199 7 6.2 6.5 NA 6.5 6.9Dissolved Cadmium µg/L 5.0 18 1 U 1 U 1 U 1 U 1 U 1 U 1 U 1 U NA 1 U 0.04 JDissolved Iron µg/L 300 5 11,000 110 373 100 U 100 U 100 U 100 U 100 U 100 U NA 100 U 100 UDissolved Manganese µg/L 50 5 880 820 2,190 1.6 J 3.7 1.1 7.6 9.5 450 NA 344 353Dissolved Molybdenum µg/L -- 180 14 20.3 66 61.1 3.3 31 259 77 NA 75.1 77.5Dissolved Selenium µg/L 50 180 2 U 4 J 2 U 13.6 4.2 UJ 100 31 57 NA 49.1 49.1Dissolved Uranium µg/L 30 7.3 1.6 NA 2.9 NA NA 5.3 NA 9.7 NA NA NADissolved Vanadium µg/L -- 36 4 U 0.71 UJ 3.5 J 8.1 505 85 45 42 NA 35.7 35.7
bis(2-Ethylhexyl) phthalate µg/L 6.0 4.8 NA NA NA NA NA NA NA 5.0 U NA 5.0 U 5.0 U
Naphthalene µg/L -- 6.2 NA NA NA NA NA NA NA 0.10 UJ NA 0.10 U 0.10 U1,2-Dibromoethane µg/L 0.05 0.0056 NA NA NA NA NA NA NA 0.050 U NA 0.050 U 0.050 UBromodichloromethane µg/L -- 0.18 NA NA NA NA NA NA NA 0.50 U NA 0.50 U 0.50 UChlorodibromomethane µg/L -- 0.13 NA NA NA NA NA NA NA 0.50 U NA 0.50 U 0.50 UChloroform µg/L -- 0.17 NA NA NA NA NA NA NA 0.50 U NA 0.50 U 0.50 UTetrachloroethene µg/L 5.0 0.10 NA NA NA NA NA NA NA 0.50 U NA 0.50 U 0.50 UTrichloroethene µg/L 5.0 0.028 NA NA NA NA NA NA NA 0.50 U NA 0.50 U 0.50 UChloride mg/L 250 5 -- 190 400 160 170 25 280 40 500 510 510 490Fluoride mg/L 4.0 2.2 1.4 0.91 1.2 1.4 0.66 0.38 0.91 0.69 0.66 0.61 0.63Sulfate mg/L 250 5 -- 110 500 100 160 43 1,100 630 1,700 1,700 1,800 1,800Total Dissolved Solids mg/L 500 5 -- 730 1,700 600 740 600 2,400 1,200 3,600 3,700 3,700 3,800
Gross Alpha Activity pCi/L 15 -- 2.1 6.7 3.4 2.6 16.4 5 3.9 9.4 8.8 9.8 11.2
Radium 226 Activity pCi/L -- 0.000823 0.3 U 0.6 U 0.8 0.3 U 0.3 U 0.4 U 0.3 U 0.4 U 0.3 U 0.3 U 0.3 U
Uranium 234 Activity pCi/L -- 0.674 0.6 NA 2.1 NA NA 2.6 NA 5.5 6.3 NA NA
Uranium 238 Activity pCi/L -- 0.744 0.5 NA 1 NA NA 1.3 NA 3.6 2.6 NA NA
VOC
sG
ener
alR
adio
nucl
ides
Remedial Investigation ReportASARCO LLC Hayden, Arizona Plant Site
Location: EPAMaximum
ContaminantLevel1
Event:Date:
Parameter
Inor
gani
csSV
OC
s
H-5 H-6 H-7Winter
EPA Region IXPreliminary
RemediationGoal2
H-8 H-9Summer Winter Summer Summer Winter Summer Winter Winter (Duplicate) Summer Summer (Duplicate)
2/28/06 9/13/06 2/28/068/29/06 2/28/06 8/30/068/30/06 2/28/06 8/30/062/27/06 8/30/06
Page 3 of 7
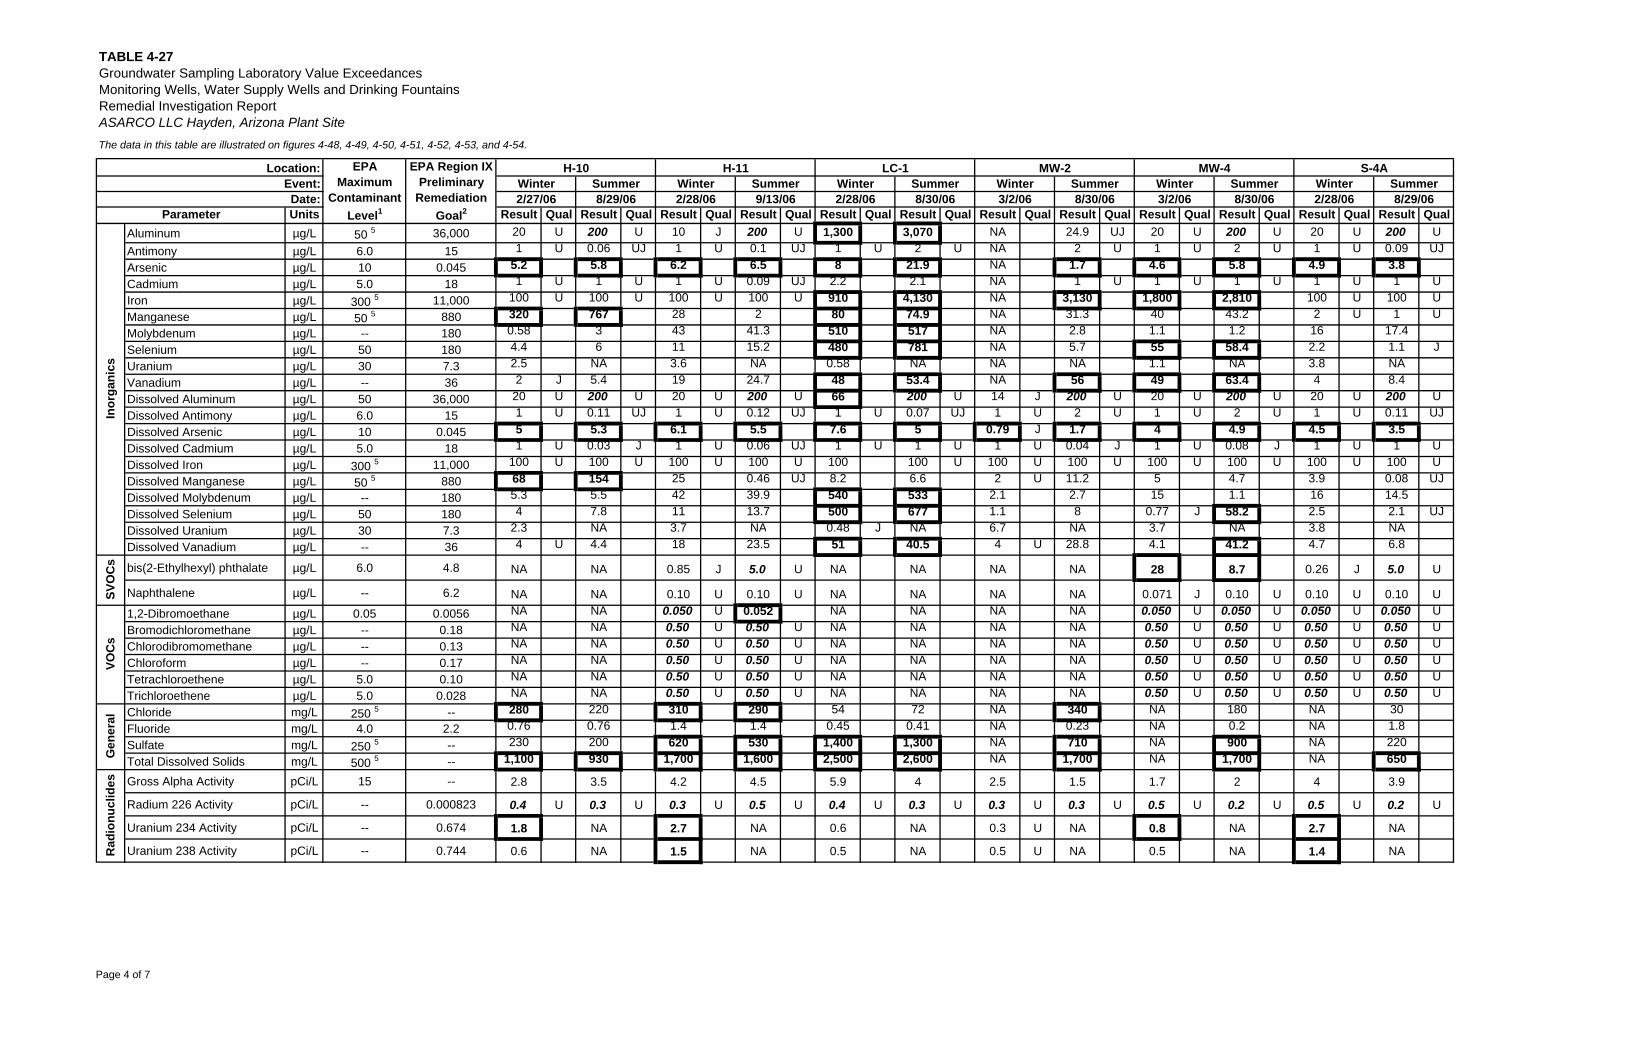
TABLE 4-27Groundwater Sampling Laboratory Value ExceedancesMonitoring Wells, Water Supply Wells and Drinking Fountains
The data in this table are illustrated on figures 4-48, 4-49, 4-50, 4-51, 4-52, 4-53, and 4-54.
Units Result Qual Result Qual Result Qual Result Qual Result Qual Result Qual Result Qual Result Qual Result Qual Result Qual Result Qual Result QualAluminum µg/L 50 5 36,000 20 U 200 U 10 J 200 U 1,300 3,070 NA 24.9 UJ 20 U 200 U 20 U 200 UAntimony µg/L 6.0 15 1 U 0.06 UJ 1 U 0.1 UJ 1 U 2 U NA 2 U 1 U 2 U 1 U 0.09 UJArsenic µg/L 10 0.045 5.2 5.8 6.2 6.5 8 21.9 NA 1.7 4.6 5.8 4.9 3.8Cadmium µg/L 5.0 18 1 U 1 U 1 U 0.09 UJ 2.2 2.1 NA 1 U 1 U 1 U 1 U 1 UIron µg/L 300 5 11,000 100 U 100 U 100 U 100 U 910 4,130 NA 3,130 1,800 2,810 100 U 100 UManganese µg/L 50 5 880 320 767 28 2 80 74.9 NA 31.3 40 43.2 2 U 1 UMolybdenum µg/L -- 180 0.58 3 43 41.3 510 517 NA 2.8 1.1 1.2 16 17.4Selenium µg/L 50 180 4.4 6 11 15.2 480 781 NA 5.7 55 58.4 2.2 1.1 JUranium µg/L 30 7.3 2.5 NA 3.6 NA 0.58 NA NA NA 1.1 NA 3.8 NAVanadium µg/L -- 36 2 J 5.4 19 24.7 48 53.4 NA 56 49 63.4 4 8.4Dissolved Aluminum µg/L 50 36,000 20 U 200 U 20 U 200 U 66 200 U 14 J 200 U 20 U 200 U 20 U 200 UDissolved Antimony µg/L 6.0 15 1 U 0.11 UJ 1 U 0.12 UJ 1 U 0.07 UJ 1 U 2 U 1 U 2 U 1 U 0.11 UJDissolved Arsenic µg/L 10 0.045 5 5.3 6.1 5.5 7.6 5 0.79 J 1.7 4 4.9 4.5 3.5Dissolved Cadmium µg/L 5.0 18 1 U 0.03 J 1 U 0.06 UJ 1 U 1 U 1 U 0.04 J 1 U 0.08 J 1 U 1 UDissolved Iron µg/L 300 5 11,000 100 U 100 U 100 U 100 U 100 100 U 100 U 100 U 100 U 100 U 100 U 100 UDissolved Manganese µg/L 50 5 880 68 154 25 0.46 UJ 8.2 6.6 2 U 11.2 5 4.7 3.9 0.08 UJDissolved Molybdenum µg/L -- 180 5.3 5.5 42 39.9 540 533 2.1 2.7 15 1.1 16 14.5Dissolved Selenium µg/L 50 180 4 7.8 11 13.7 500 677 1.1 8 0.77 J 58.2 2.5 2.1 UJDissolved Uranium µg/L 30 7.3 2.3 NA 3.7 NA 0.48 J NA 6.7 NA 3.7 NA 3.8 NADissolved Vanadium µg/L -- 36 4 U 4.4 18 23.5 51 40.5 4 U 28.8 4.1 41.2 4.7 6.8
bis(2-Ethylhexyl) phthalate µg/L 6.0 4.8 NA NA 0.85 J 5.0 U NA NA NA NA 28 8.7 0.26 J 5.0 U
Naphthalene µg/L -- 6.2 NA NA 0.10 U 0.10 U NA NA NA NA 0.071 J 0.10 U 0.10 U 0.10 U1,2-Dibromoethane µg/L 0.05 0.0056 NA NA 0.050 U 0.052 NA NA NA NA 0.050 U 0.050 U 0.050 U 0.050 UBromodichloromethane µg/L -- 0.18 NA NA 0.50 U 0.50 U NA NA NA NA 0.50 U 0.50 U 0.50 U 0.50 UChlorodibromomethane µg/L -- 0.13 NA NA 0.50 U 0.50 U NA NA NA NA 0.50 U 0.50 U 0.50 U 0.50 UChloroform µg/L -- 0.17 NA NA 0.50 U 0.50 U NA NA NA NA 0.50 U 0.50 U 0.50 U 0.50 UTetrachloroethene µg/L 5.0 0.10 NA NA 0.50 U 0.50 U NA NA NA NA 0.50 U 0.50 U 0.50 U 0.50 UTrichloroethene µg/L 5.0 0.028 NA NA 0.50 U 0.50 U NA NA NA NA 0.50 U 0.50 U 0.50 U 0.50 UChloride mg/L 250 5 -- 280 220 310 290 54 72 NA 340 NA 180 NA 30Fluoride mg/L 4.0 2.2 0.76 0.76 1.4 1.4 0.45 0.41 NA 0.23 NA 0.2 NA 1.8Sulfate mg/L 250 5 -- 230 200 620 530 1,400 1,300 NA 710 NA 900 NA 220Total Dissolved Solids mg/L 500 5 -- 1,100 930 1,700 1,600 2,500 2,600 NA 1,700 NA 1,700 NA 650
Gross Alpha Activity pCi/L 15 -- 2.8 3.5 4.2 4.5 5.9 4 2.5 1.5 1.7 2 4 3.9
Radium 226 Activity pCi/L -- 0.000823 0.4 U 0.3 U 0.3 U 0.5 U 0.4 U 0.3 U 0.3 U 0.3 U 0.5 U 0.2 U 0.5 U 0.2 U
Uranium 234 Activity pCi/L -- 0.674 1.8 NA 2.7 NA 0.6 NA 0.3 U NA 0.8 NA 2.7 NA
Uranium 238 Activity pCi/L -- 0.744 0.6 NA 1.5 NA 0.5 NA 0.5 U NA 0.5 NA 1.4 NARad
ionu
clid
es
Inor
gani
csSV
OC
sVO
Cs
Gen
eral
Remedial Investigation ReportASARCO LLC Hayden, Arizona Plant Site
Location: EPAMaximum
ContaminantLevel1
Event:Date:
Parameter8/29/06
Summer2/28/06 8/30/06 3/2/06 8/30/06 3/2/06 8/30/06
Summer WinterSummerH-10
2/27/06WinterWinter
EPA Region IXPreliminary
RemediationGoal2
S-4AH-11 LC-1 MW-2 MW-4SummerWinter Summer Winter9/13/06
Winter Summer2/28/068/29/06 2/28/06
Page 4 of 7
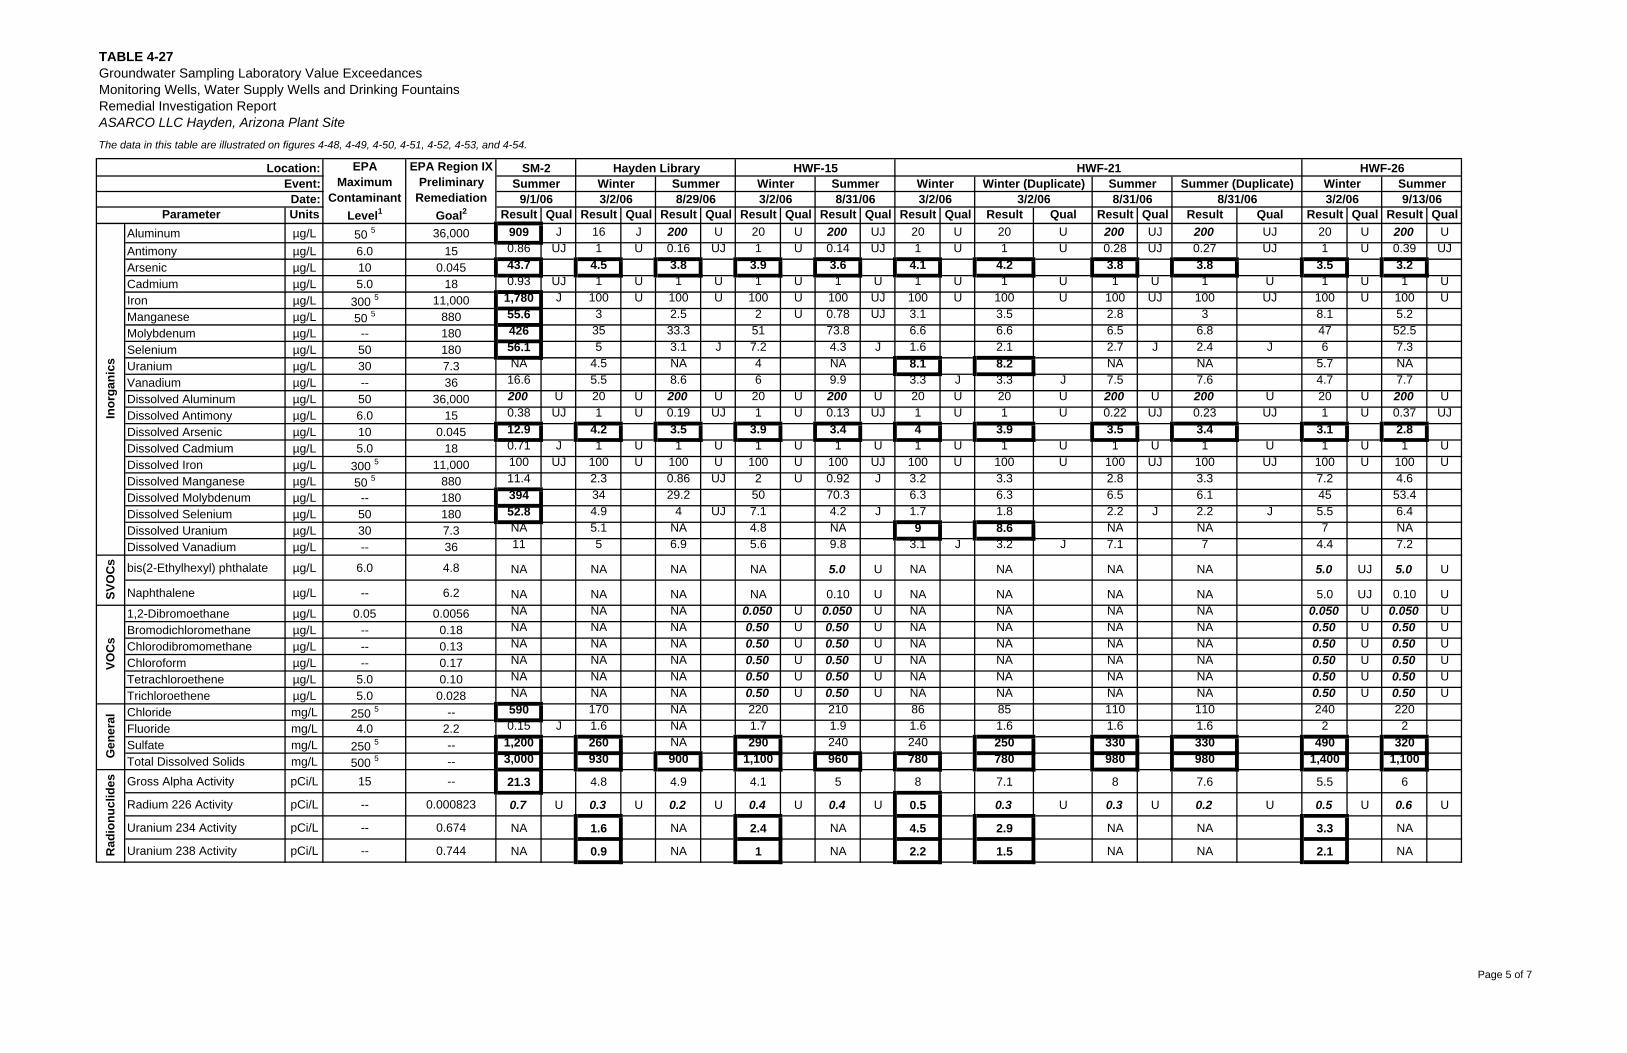
TABLE 4-27Groundwater Sampling Laboratory Value ExceedancesMonitoring Wells, Water Supply Wells and Drinking Fountains
The data in this table are illustrated on figures 4-48, 4-49, 4-50, 4-51, 4-52, 4-53, and 4-54.
Units Result Qual Result Qual Result Qual Result Qual Result Qual Result Qual Result Qual Result Qual Result Qual Result Qual Result QualAluminum µg/L 50 5 36,000 909 J 16 J 200 U 20 U 200 UJ 20 U 20 U 200 UJ 200 UJ 20 U 200 UAntimony µg/L 6.0 15 0.86 UJ 1 U 0.16 UJ 1 U 0.14 UJ 1 U 1 U 0.28 UJ 0.27 UJ 1 U 0.39 UJArsenic µg/L 10 0.045 43.7 4.5 3.8 3.9 3.6 4.1 4.2 3.8 3.8 3.5 3.2Cadmium µg/L 5.0 18 0.93 UJ 1 U 1 U 1 U 1 U 1 U 1 U 1 U 1 U 1 U 1 UIron µg/L 300 5 11,000 1,780 J 100 U 100 U 100 U 100 UJ 100 U 100 U 100 UJ 100 UJ 100 U 100 UManganese µg/L 50 5 880 55.6 3 2.5 2 U 0.78 UJ 3.1 3.5 2.8 3 8.1 5.2Molybdenum µg/L -- 180 426 35 33.3 51 73.8 6.6 6.6 6.5 6.8 47 52.5Selenium µg/L 50 180 56.1 5 3.1 J 7.2 4.3 J 1.6 2.1 2.7 J 2.4 J 6 7.3Uranium µg/L 30 7.3 NA 4.5 NA 4 NA 8.1 8.2 NA NA 5.7 NAVanadium µg/L -- 36 16.6 5.5 8.6 6 9.9 3.3 J 3.3 J 7.5 7.6 4.7 7.7Dissolved Aluminum µg/L 50 36,000 200 U 20 U 200 U 20 U 200 U 20 U 20 U 200 U 200 U 20 U 200 UDissolved Antimony µg/L 6.0 15 0.38 UJ 1 U 0.19 UJ 1 U 0.13 UJ 1 U 1 U 0.22 UJ 0.23 UJ 1 U 0.37 UJDissolved Arsenic µg/L 10 0.045 12.9 4.2 3.5 3.9 3.4 4 3.9 3.5 3.4 3.1 2.8Dissolved Cadmium µg/L 5.0 18 0.71 J 1 U 1 U 1 U 1 U 1 U 1 U 1 U 1 U 1 U 1 UDissolved Iron µg/L 300 5 11,000 100 UJ 100 U 100 U 100 U 100 UJ 100 U 100 U 100 UJ 100 UJ 100 U 100 UDissolved Manganese µg/L 50 5 880 11.4 2.3 0.86 UJ 2 U 0.92 J 3.2 3.3 2.8 3.3 7.2 4.6Dissolved Molybdenum µg/L -- 180 394 34 29.2 50 70.3 6.3 6.3 6.5 6.1 45 53.4Dissolved Selenium µg/L 50 180 52.8 4.9 4 UJ 7.1 4.2 J 1.7 1.8 2.2 J 2.2 J 5.5 6.4Dissolved Uranium µg/L 30 7.3 NA 5.1 NA 4.8 NA 9 8.6 NA NA 7 NADissolved Vanadium µg/L -- 36 11 5 6.9 5.6 9.8 3.1 J 3.2 J 7.1 7 4.4 7.2
bis(2-Ethylhexyl) phthalate µg/L 6.0 4.8 NA NA NA NA 5.0 U NA NA NA NA 5.0 UJ 5.0 U
Naphthalene µg/L -- 6.2 NA NA NA NA 0.10 U NA NA NA NA 5.0 UJ 0.10 U1,2-Dibromoethane µg/L 0.05 0.0056 NA NA NA 0.050 U 0.050 U NA NA NA NA 0.050 U 0.050 UBromodichloromethane µg/L -- 0.18 NA NA NA 0.50 U 0.50 U NA NA NA NA 0.50 U 0.50 UChlorodibromomethane µg/L -- 0.13 NA NA NA 0.50 U 0.50 U NA NA NA NA 0.50 U 0.50 UChloroform µg/L -- 0.17 NA NA NA 0.50 U 0.50 U NA NA NA NA 0.50 U 0.50 UTetrachloroethene µg/L 5.0 0.10 NA NA NA 0.50 U 0.50 U NA NA NA NA 0.50 U 0.50 UTrichloroethene µg/L 5.0 0.028 NA NA NA 0.50 U 0.50 U NA NA NA NA 0.50 U 0.50 UChloride mg/L 250 5 -- 590 170 NA 220 210 86 85 110 110 240 220Fluoride mg/L 4.0 2.2 0.15 J 1.6 NA 1.7 1.9 1.6 1.6 1.6 1.6 2 2Sulfate mg/L 250 5 -- 1,200 260 NA 290 240 240 250 330 330 490 320Total Dissolved Solids mg/L 500 5 -- 3,000 930 900 1,100 960 780 780 980 980 1,400 1,100
Gross Alpha Activity pCi/L 15 -- 21.3 4.8 4.9 4.1 5 8 7.1 8 7.6 5.5 6
Radium 226 Activity pCi/L -- 0.000823 0.7 U 0.3 U 0.2 U 0.4 U 0.4 U 0.5 0.3 U 0.3 U 0.2 U 0.5 U 0.6 U
Uranium 234 Activity pCi/L -- 0.674 NA 1.6 NA 2.4 NA 4.5 2.9 NA NA 3.3 NA
Uranium 238 Activity pCi/L -- 0.744 NA 0.9 NA 1 NA 2.2 1.5 NA NA 2.1 NA
VOC
sG
ener
alR
adio
nucl
ides
Remedial Investigation ReportASARCO LLC Hayden, Arizona Plant Site
Location: EPAMaximum
ContaminantLevel1
Event:Date:
Parameter
Inor
gani
csSV
OC
s
Summer9/1/06
Winter (Duplicate) Summer Summer (Duplicate) WinterHWF-21 HWF-26Hayden Library HWF-15SM-2
Winter Summer Winter Summer Winter9/13/06
Summer3/2/068/31/068/29/06 8/31/068/31/063/2/06 3/2/06
EPA Region IXPreliminary
RemediationGoal2
3/2/06 3/2/06
Page 5 of 7
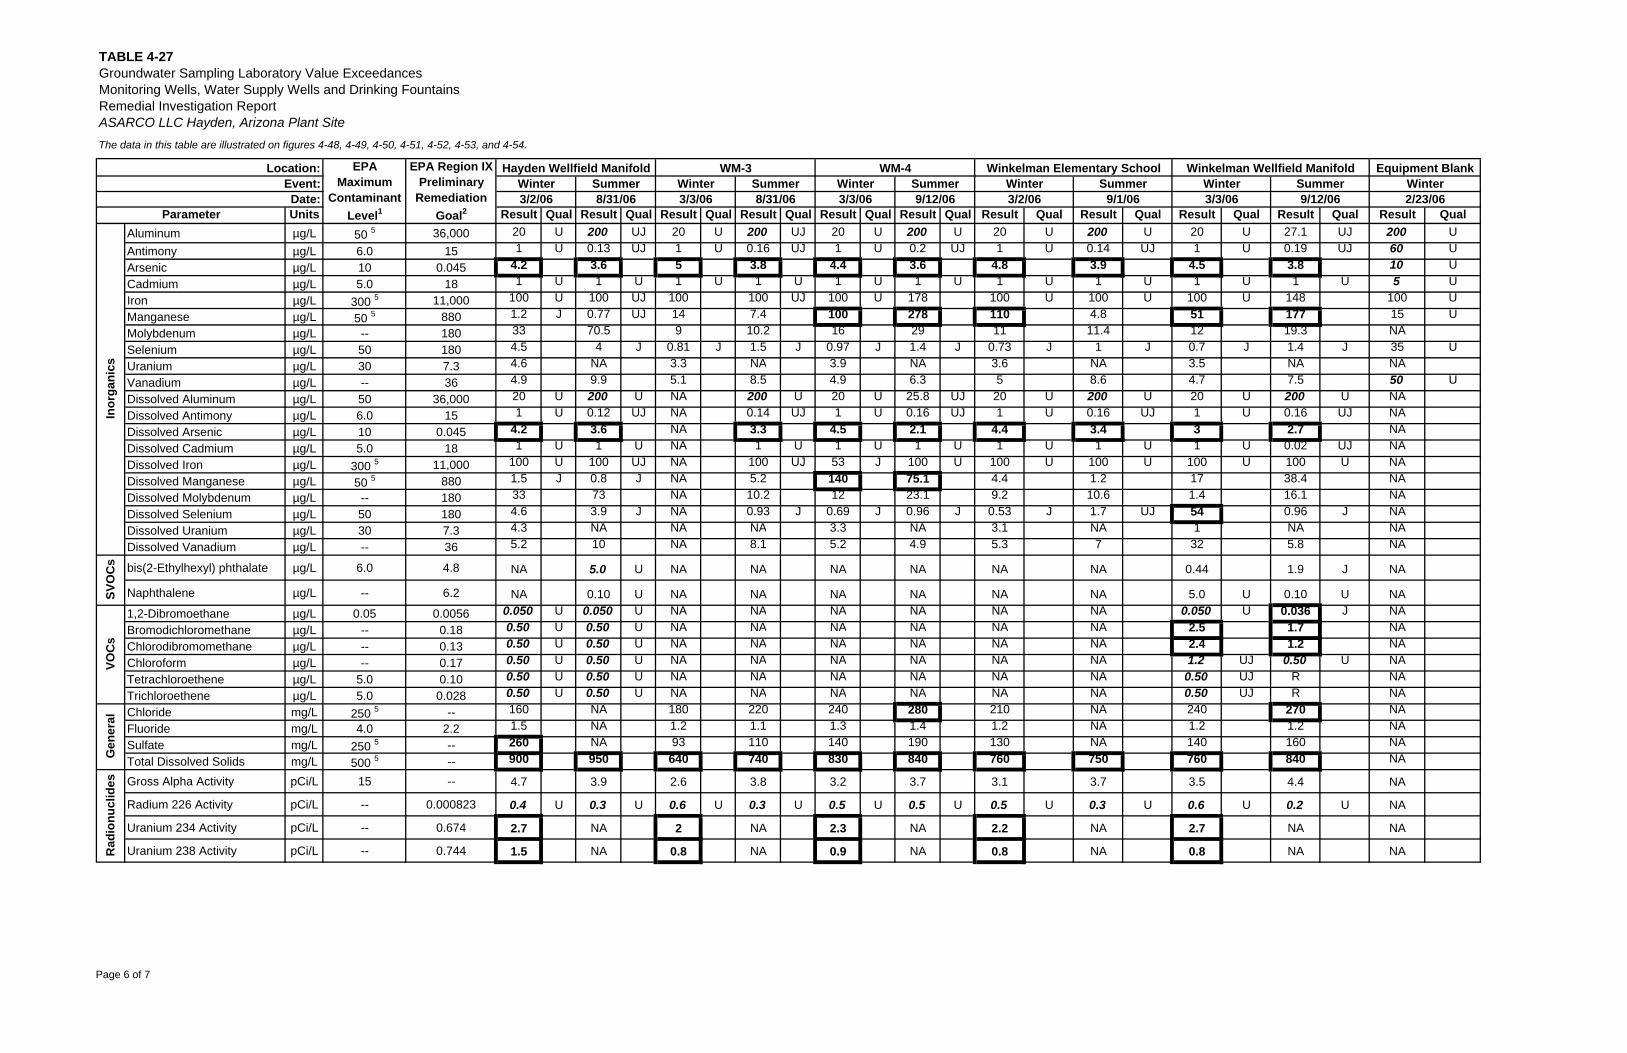
TABLE 4-27Groundwater Sampling Laboratory Value ExceedancesMonitoring Wells, Water Supply Wells and Drinking Fountains
The data in this table are illustrated on figures 4-48, 4-49, 4-50, 4-51, 4-52, 4-53, and 4-54.
Units Result Qual Result Qual Result Qual Result Qual Result Qual Result Qual Result Qual Result Qual Result Qual Result Qual Result QualAluminum µg/L 50 5 36,000 20 U 200 UJ 20 U 200 UJ 20 U 200 U 20 U 200 U 20 U 27.1 UJ 200 UAntimony µg/L 6.0 15 1 U 0.13 UJ 1 U 0.16 UJ 1 U 0.2 UJ 1 U 0.14 UJ 1 U 0.19 UJ 60 UArsenic µg/L 10 0.045 4.2 3.6 5 3.8 4.4 3.6 4.8 3.9 4.5 3.8 10 UCadmium µg/L 5.0 18 1 U 1 U 1 U 1 U 1 U 1 U 1 U 1 U 1 U 1 U 5 UIron µg/L 300 5 11,000 100 U 100 UJ 100 100 UJ 100 U 178 100 U 100 U 100 U 148 100 UManganese µg/L 50 5 880 1.2 J 0.77 UJ 14 7.4 100 278 110 4.8 51 177 15 UMolybdenum µg/L -- 180 33 70.5 9 10.2 16 29 11 11.4 12 19.3 NASelenium µg/L 50 180 4.5 4 J 0.81 J 1.5 J 0.97 J 1.4 J 0.73 J 1 J 0.7 J 1.4 J 35 UUranium µg/L 30 7.3 4.6 NA 3.3 NA 3.9 NA 3.6 NA 3.5 NA NAVanadium µg/L -- 36 4.9 9.9 5.1 8.5 4.9 6.3 5 8.6 4.7 7.5 50 UDissolved Aluminum µg/L 50 36,000 20 U 200 U NA 200 U 20 U 25.8 UJ 20 U 200 U 20 U 200 U NADissolved Antimony µg/L 6.0 15 1 U 0.12 UJ NA 0.14 UJ 1 U 0.16 UJ 1 U 0.16 UJ 1 U 0.16 UJ NADissolved Arsenic µg/L 10 0.045 4.2 3.6 NA 3.3 4.5 2.1 4.4 3.4 3 2.7 NADissolved Cadmium µg/L 5.0 18 1 U 1 U NA 1 U 1 U 1 U 1 U 1 U 1 U 0.02 UJ NADissolved Iron µg/L 300 5 11,000 100 U 100 UJ NA 100 UJ 53 J 100 U 100 U 100 U 100 U 100 U NADissolved Manganese µg/L 50 5 880 1.5 J 0.8 J NA 5.2 140 75.1 4.4 1.2 17 38.4 NADissolved Molybdenum µg/L -- 180 33 73 NA 10.2 12 23.1 9.2 10.6 1.4 16.1 NADissolved Selenium µg/L 50 180 4.6 3.9 J NA 0.93 J 0.69 J 0.96 J 0.53 J 1.7 UJ 54 0.96 J NADissolved Uranium µg/L 30 7.3 4.3 NA NA NA 3.3 NA 3.1 NA 1 NA NADissolved Vanadium µg/L -- 36 5.2 10 NA 8.1 5.2 4.9 5.3 7 32 5.8 NA
bis(2-Ethylhexyl) phthalate µg/L 6.0 4.8 NA 5.0 U NA NA NA NA NA NA 0.44 1.9 J NA
Naphthalene µg/L -- 6.2 NA 0.10 U NA NA NA NA NA NA 5.0 U 0.10 U NA1,2-Dibromoethane µg/L 0.05 0.0056 0.050 U 0.050 U NA NA NA NA NA NA 0.050 U 0.036 J NABromodichloromethane µg/L -- 0.18 0.50 U 0.50 U NA NA NA NA NA NA 2.5 1.7 NAChlorodibromomethane µg/L -- 0.13 0.50 U 0.50 U NA NA NA NA NA NA 2.4 1.2 NAChloroform µg/L -- 0.17 0.50 U 0.50 U NA NA NA NA NA NA 1.2 UJ 0.50 U NATetrachloroethene µg/L 5.0 0.10 0.50 U 0.50 U NA NA NA NA NA NA 0.50 UJ R NATrichloroethene µg/L 5.0 0.028 0.50 U 0.50 U NA NA NA NA NA NA 0.50 UJ R NAChloride mg/L 250 5 -- 160 NA 180 220 240 280 210 NA 240 270 NAFluoride mg/L 4.0 2.2 1.5 NA 1.2 1.1 1.3 1.4 1.2 NA 1.2 1.2 NASulfate mg/L 250 5 -- 260 NA 93 110 140 190 130 NA 140 160 NATotal Dissolved Solids mg/L 500 5 -- 900 950 640 740 830 840 760 750 760 840 NA
Gross Alpha Activity pCi/L 15 -- 4.7 3.9 2.6 3.8 3.2 3.7 3.1 3.7 3.5 4.4 NA
Radium 226 Activity pCi/L -- 0.000823 0.4 U 0.3 U 0.6 U 0.3 U 0.5 U 0.5 U 0.5 U 0.3 U 0.6 U 0.2 U NA
Uranium 234 Activity pCi/L -- 0.674 2.7 NA 2 NA 2.3 NA 2.2 NA 2.7 NA NA
Uranium 238 Activity pCi/L -- 0.744 1.5 NA 0.8 NA 0.9 NA 0.8 NA 0.8 NA NARad
ionu
clid
es
Inor
gani
csSV
OC
sVO
Cs
Gen
eral
Remedial Investigation ReportASARCO LLC Hayden, Arizona Plant Site
Location: EPAMaximum
ContaminantLevel1
Event:Date:
Parameter
Equipment Blank
2/23/06
Hayden Wellfield Manifold WM-4EPA Region IXPreliminary
RemediationGoal2
WinterWinkelman Elementary School Winkelman Wellfield Manifold
Summer Winter SummerWM-3
Winter9/1/063/2/06 8/31/06 8/31/06 3/3/06 9/12/06
Summer3/3/06
Winter Winter Summer3/3/06 9/12/06 3/2/06
Winter Summer
Page 6 of 7
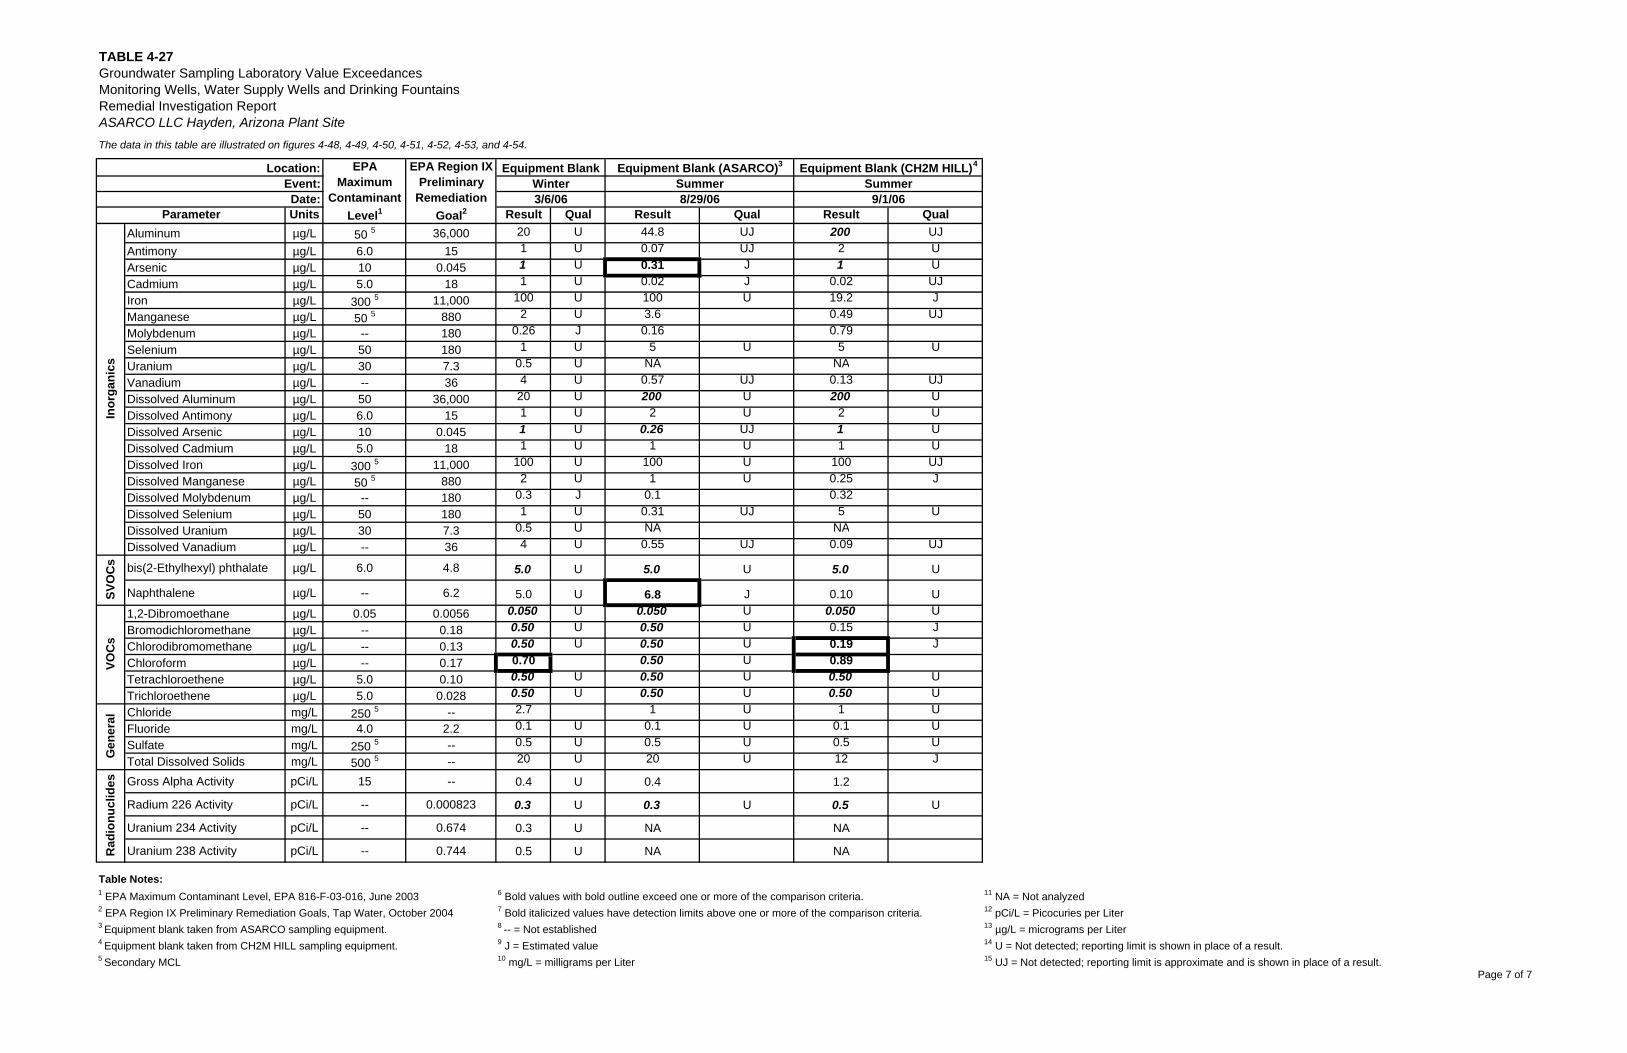
TABLE 4-27Groundwater Sampling Laboratory Value ExceedancesMonitoring Wells, Water Supply Wells and Drinking Fountains
The data in this table are illustrated on figures 4-48, 4-49, 4-50, 4-51, 4-52, 4-53, and 4-54.
Units Result Qual Result Qual Result QualAluminum µg/L 50 5 36,000 20 U 44.8 UJ 200 UJAntimony µg/L 6.0 15 1 U 0.07 UJ 2 UArsenic µg/L 10 0.045 1 U 0.31 J 1 UCadmium µg/L 5.0 18 1 U 0.02 J 0.02 UJIron µg/L 300 5 11,000 100 U 100 U 19.2 JManganese µg/L 50 5 880 2 U 3.6 0.49 UJMolybdenum µg/L -- 180 0.26 J 0.16 0.79Selenium µg/L 50 180 1 U 5 U 5 UUranium µg/L 30 7.3 0.5 U NA NAVanadium µg/L -- 36 4 U 0.57 UJ 0.13 UJDissolved Aluminum µg/L 50 36,000 20 U 200 U 200 UDissolved Antimony µg/L 6.0 15 1 U 2 U 2 UDissolved Arsenic µg/L 10 0.045 1 U 0.26 UJ 1 UDissolved Cadmium µg/L 5.0 18 1 U 1 U 1 UDissolved Iron µg/L 300 5 11,000 100 U 100 U 100 UJDissolved Manganese µg/L 50 5 880 2 U 1 U 0.25 JDissolved Molybdenum µg/L -- 180 0.3 J 0.1 0.32Dissolved Selenium µg/L 50 180 1 U 0.31 UJ 5 UDissolved Uranium µg/L 30 7.3 0.5 U NA NADissolved Vanadium µg/L -- 36 4 U 0.55 UJ 0.09 UJ
bis(2-Ethylhexyl) phthalate µg/L 6.0 4.8 5.0 U 5.0 U 5.0 U
Naphthalene µg/L -- 6.2 5.0 U 6.8 J 0.10 U1,2-Dibromoethane µg/L 0.05 0.0056 0.050 U 0.050 U 0.050 UBromodichloromethane µg/L -- 0.18 0.50 U 0.50 U 0.15 JChlorodibromomethane µg/L -- 0.13 0.50 U 0.50 U 0.19 JChloroform µg/L -- 0.17 0.70 0.50 U 0.89Tetrachloroethene µg/L 5.0 0.10 0.50 U 0.50 U 0.50 UTrichloroethene µg/L 5.0 0.028 0.50 U 0.50 U 0.50 UChloride mg/L 250 5 -- 2.7 1 U 1 UFluoride mg/L 4.0 2.2 0.1 U 0.1 U 0.1 USulfate mg/L 250 5 -- 0.5 U 0.5 U 0.5 UTotal Dissolved Solids mg/L 500 5 -- 20 U 20 U 12 J
Gross Alpha Activity pCi/L 15 -- 0.4 U 0.4 1.2
Radium 226 Activity pCi/L -- 0.000823 0.3 U 0.3 U 0.5 U
Uranium 234 Activity pCi/L -- 0.674 0.3 U NA NA
Uranium 238 Activity pCi/L -- 0.744 0.5 U NA NA
Table Notes:1 EPA Maximum Contaminant Level, EPA 816-F-03-016, June 2003 6 Bold values with bold outline exceed one or more of the comparison criteria. 11 NA = Not analyzed2 EPA Region IX Preliminary Remediation Goals, Tap Water, October 2004 7 Bold italicized values have detection limits above one or more of the comparison criteria. 12 pCi/L = Picocuries per Liter3 Equipment blank taken from ASARCO sampling equipment. 8 -- = Not established 13 µg/L = micrograms per Liter4 Equipment blank taken from CH2M HILL sampling equipment. 9 J = Estimated value 14 U = Not detected; reporting limit is shown in place of a result.5 Secondary MCL 10 mg/L = milligrams per Liter 15 UJ = Not detected; reporting limit is approximate and is shown in place of a result.
Remedial Investigation ReportASARCO LLC Hayden, Arizona Plant Site
Location: EPAMaximum
ContaminantLevel1
Inor
gani
csSV
OC
sVO
Cs
Gen
eral
Rad
ionu
clid
es
Equipment Blank Equipment Blank (CH2M HILL)4
SummerEquipment Blank (ASARCO)3
Winter Summer9/1/068/29/063/6/06
EPA Region IXPreliminary
RemediationGoal2
Event:Date:
Parameter
Page 7 of 7
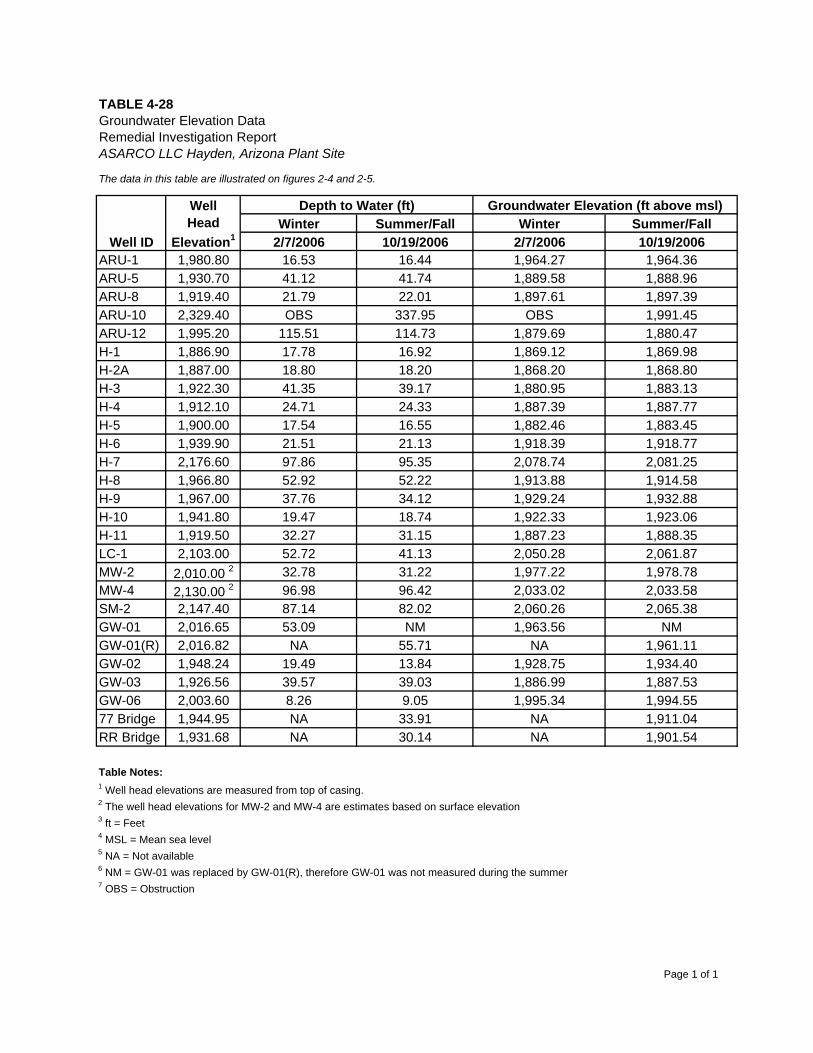
The data in this table are illustrated on figures 2-4 and 2-5.
Winter Summer/Fall Winter Summer/Fall2/7/2006 10/19/2006 2/7/2006 10/19/2006
ARU-1 1,980.80 16.53 16.44 1,964.27 1,964.36ARU-5 1,930.70 41.12 41.74 1,889.58 1,888.96ARU-8 1,919.40 21.79 22.01 1,897.61 1,897.39ARU-10 2,329.40 OBS 337.95 OBS 1,991.45ARU-12 1,995.20 115.51 114.73 1,879.69 1,880.47H-1 1,886.90 17.78 16.92 1,869.12 1,869.98H-2A 1,887.00 18.80 18.20 1,868.20 1,868.80H-3 1,922.30 41.35 39.17 1,880.95 1,883.13H-4 1,912.10 24.71 24.33 1,887.39 1,887.77H-5 1,900.00 17.54 16.55 1,882.46 1,883.45H-6 1,939.90 21.51 21.13 1,918.39 1,918.77H-7 2,176.60 97.86 95.35 2,078.74 2,081.25H-8 1,966.80 52.92 52.22 1,913.88 1,914.58H-9 1,967.00 37.76 34.12 1,929.24 1,932.88H-10 1,941.80 19.47 18.74 1,922.33 1,923.06H-11 1,919.50 32.27 31.15 1,887.23 1,888.35LC-1 2,103.00 52.72 41.13 2,050.28 2,061.87MW-2 2,010.00 2 32.78 31.22 1,977.22 1,978.78MW-4 2,130.00 2 96.98 96.42 2,033.02 2,033.58SM-2 2,147.40 87.14 82.02 2,060.26 2,065.38GW-01 2,016.65 53.09 NM 1,963.56 NMGW-01(R) 2,016.82 NA 55.71 NA 1,961.11GW-02 1,948.24 19.49 13.84 1,928.75 1,934.40GW-03 1,926.56 39.57 39.03 1,886.99 1,887.53GW-06 2,003.60 8.26 9.05 1,995.34 1,994.5577 Bridge 1,944.95 NA 33.91 NA 1,911.04RR Bridge 1,931.68 NA 30.14 NA 1,901.54
1 Well head elevations are measured from top of casing.2 The well head elevations for MW-2 and MW-4 are estimates based on surface elevation3 ft = Feet4 MSL = Mean sea level5 NA = Not available6 NM = GW-01 was replaced by GW-01(R), therefore GW-01 was not measured during the summer7 OBS = Obstruction
Table Notes:
TABLE 4-28
Depth to Water (ft) Groundwater Elevation (ft above msl)WellHead
Elevation1Well ID
Remedial Investigation ReportASARCO LLC Hayden, Arizona Plant Site
Groundwater Elevation Data
Page 1 of 1
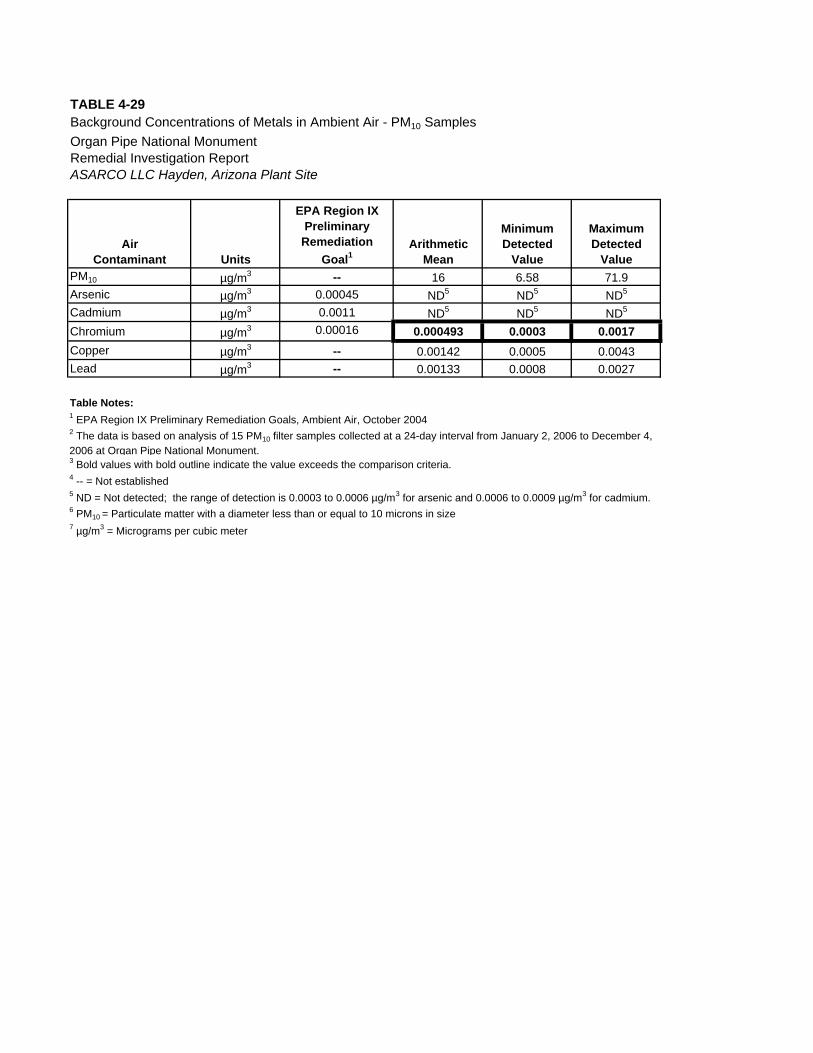
TABLE 4-29Background Concentrations of Metals in Ambient Air - PM10 SamplesOrgan Pipe National MonumentRemedial Investigation ReportASARCO LLC Hayden, Arizona Plant Site
AirContaminant Units
EPA Region IXPreliminary
RemediationGoal1
ArithmeticMean
MinimumDetected
Value
MaximumDetected
ValuePM10 µg/m3 -- 16 6.58 71.9Arsenic µg/m3 0.00045 ND5 ND5 ND5
Cadmium µg/m3 0.0011 ND5 ND5 ND5
Chromium µg/m3 0.00016 0.000493 0.0003 0.0017Copper µg/m3 -- 0.00142 0.0005 0.0043Lead µg/m3 -- 0.00133 0.0008 0.0027
Table Notes:1 EPA Region IX Preliminary Remediation Goals, Ambient Air, October 2004
3 Bold values with bold outline indicate the value exceeds the comparison criteria.4 -- = Not established5 ND = Not detected; the range of detection is 0.0003 to 0.0006 µg/m3 for arsenic and 0.0006 to 0.0009 µg/m3 for cadmium.6 PM10 = Particulate matter with a diameter less than or equal to 10 microns in size7 µg/m3 = Micrograms per cubic meter
2 The data is based on analysis of 15 PM10 filter samples collected at a 24-day interval from January 2, 2006 to December 4, 2006 at Organ Pipe National Monument.
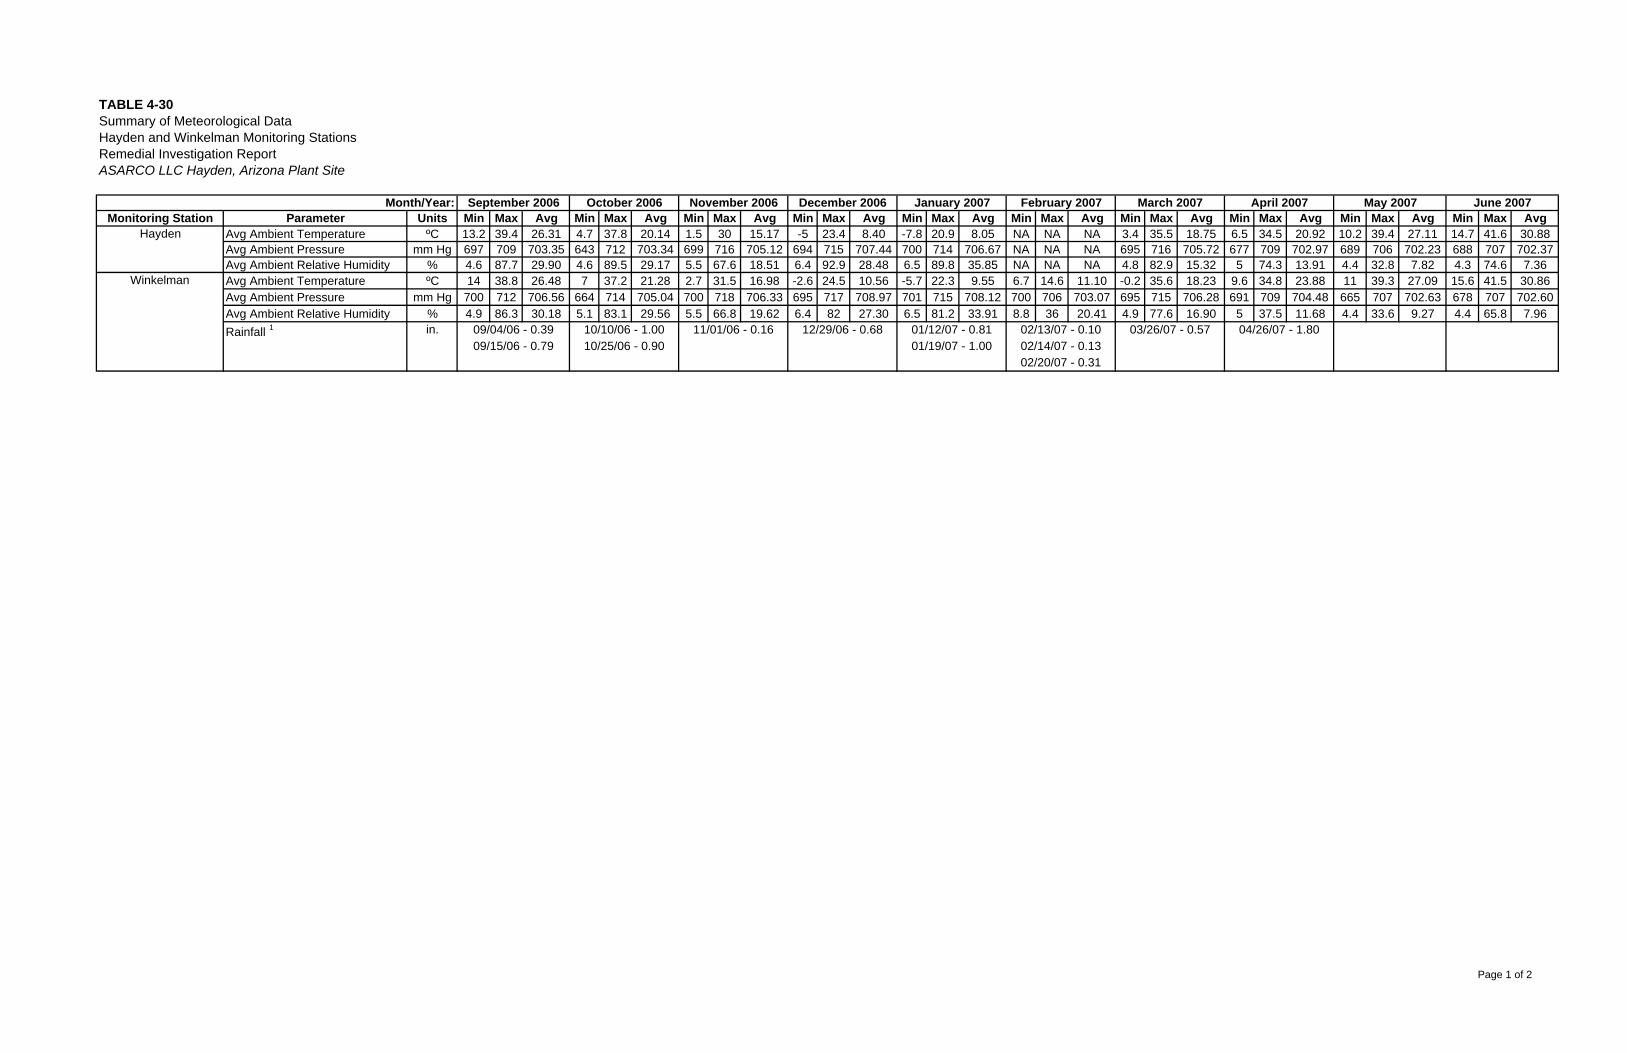
TABLE 4-30Summary of Meteorological DataHayden and Winkelman Monitoring StationsRemedial Investigation ReportASARCO LLC Hayden, Arizona Plant Site
Monitoring Station Parameter Units Min Max Avg Min Max Avg Min Max Avg Min Max Avg Min Max Avg Min Max Avg Min Max Avg Min Max Avg Min Max Avg Min Max AvgAvg Ambient Temperature ºC 13.2 39.4 26.31 4.7 37.8 20.14 1.5 30 15.17 -5 23.4 8.40 -7.8 20.9 8.05 NA NA NA 3.4 35.5 18.75 6.5 34.5 20.92 10.2 39.4 27.11 14.7 41.6 30.88Avg Ambient Pressure mm Hg 697 709 703.35 643 712 703.34 699 716 705.12 694 715 707.44 700 714 706.67 NA NA NA 695 716 705.72 677 709 702.97 689 706 702.23 688 707 702.37Avg Ambient Relative Humidity % 4.6 87.7 29.90 4.6 89.5 29.17 5.5 67.6 18.51 6.4 92.9 28.48 6.5 89.8 35.85 NA NA NA 4.8 82.9 15.32 5 74.3 13.91 4.4 32.8 7.82 4.3 74.6 7.36Avg Ambient Temperature ºC 14 38.8 26.48 7 37.2 21.28 2.7 31.5 16.98 -2.6 24.5 10.56 -5.7 22.3 9.55 6.7 14.6 11.10 -0.2 35.6 18.23 9.6 34.8 23.88 11 39.3 27.09 15.6 41.5 30.86Avg Ambient Pressure mm Hg 700 712 706.56 664 714 705.04 700 718 706.33 695 717 708.97 701 715 708.12 700 706 703.07 695 715 706.28 691 709 704.48 665 707 702.63 678 707 702.60Avg Ambient Relative Humidity % 4.9 86.3 30.18 5.1 83.1 29.56 5.5 66.8 19.62 6.4 82 27.30 6.5 81.2 33.91 8.8 36 20.41 4.9 77.6 16.90 5 37.5 11.68 4.4 33.6 9.27 4.4 65.8 7.96
02/20/07 - 0.3101/19/07 - 1.00 02/14/07 - 0.13
02/13/07 - 0.10 03/26/07 - 0.57 04/26/07 - 1.8001/12/07 - 0.8110/10/06 - 1.00 11/01/06 - 0.16 12/29/06 - 0.6810/25/06 - 0.90
09/04/06 - 0.3909/15/06 - 0.79
Month/Year:
Hayden
Rainfall 1
Winkelman
in.
January 2007 February 2007 March 2007 April 2007 May 2007 June 2007December 2006September 2006 October 2006 November 2006
Page 1 of 2
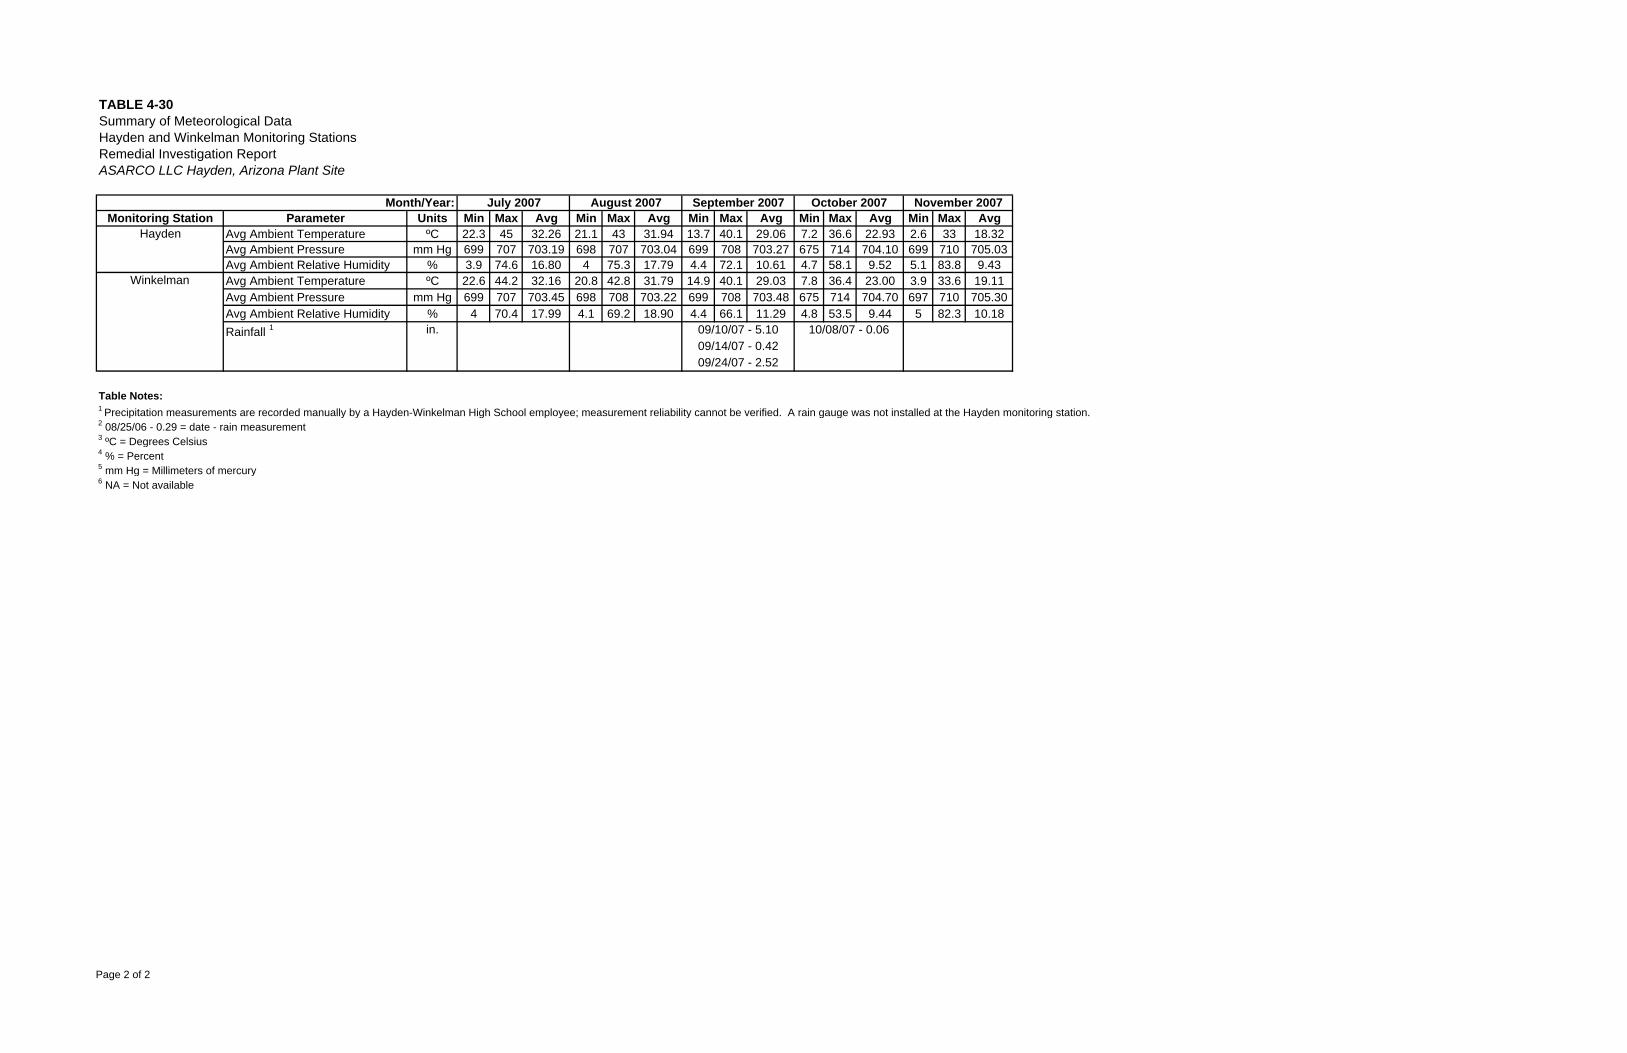
TABLE 4-30Summary of Meteorological DataHayden and Winkelman Monitoring StationsRemedial Investigation ReportASARCO LLC Hayden, Arizona Plant Site
Monitoring Station Parameter Units Min Max Avg Min Max Avg Min Max Avg Min Max Avg Min Max AvgAvg Ambient Temperature ºC 22.3 45 32.26 21.1 43 31.94 13.7 40.1 29.06 7.2 36.6 22.93 2.6 33 18.32Avg Ambient Pressure mm Hg 699 707 703.19 698 707 703.04 699 708 703.27 675 714 704.10 699 710 705.03Avg Ambient Relative Humidity % 3.9 74.6 16.80 4 75.3 17.79 4.4 72.1 10.61 4.7 58.1 9.52 5.1 83.8 9.43Avg Ambient Temperature ºC 22.6 44.2 32.16 20.8 42.8 31.79 14.9 40.1 29.03 7.8 36.4 23.00 3.9 33.6 19.11Avg Ambient Pressure mm Hg 699 707 703.45 698 708 703.22 699 708 703.48 675 714 704.70 697 710 705.30Avg Ambient Relative Humidity % 4 70.4 17.99 4.1 69.2 18.90 4.4 66.1 11.29 4.8 53.5 9.44 5 82.3 10.18
Table Notes:1 Precipitation measurements are recorded manually by a Hayden-Winkelman High School employee; measurement reliability cannot be verified. A rain gauge was not installed at the Hayden monitoring station.2 08/25/06 - 0.29 = date - rain measurement3 ºC = Degrees Celsius4 % = Percent5 mm Hg = Millimeters of mercury6 NA = Not available
Hayden
Winkelman
Rainfall 1 in. 10/08/07 - 0.0609/10/07 - 5.1009/14/07 - 0.4209/24/07 - 2.52
September 2007 October 2007 November 2007August 2007Month/Year: July 2007
Page 2 of 2
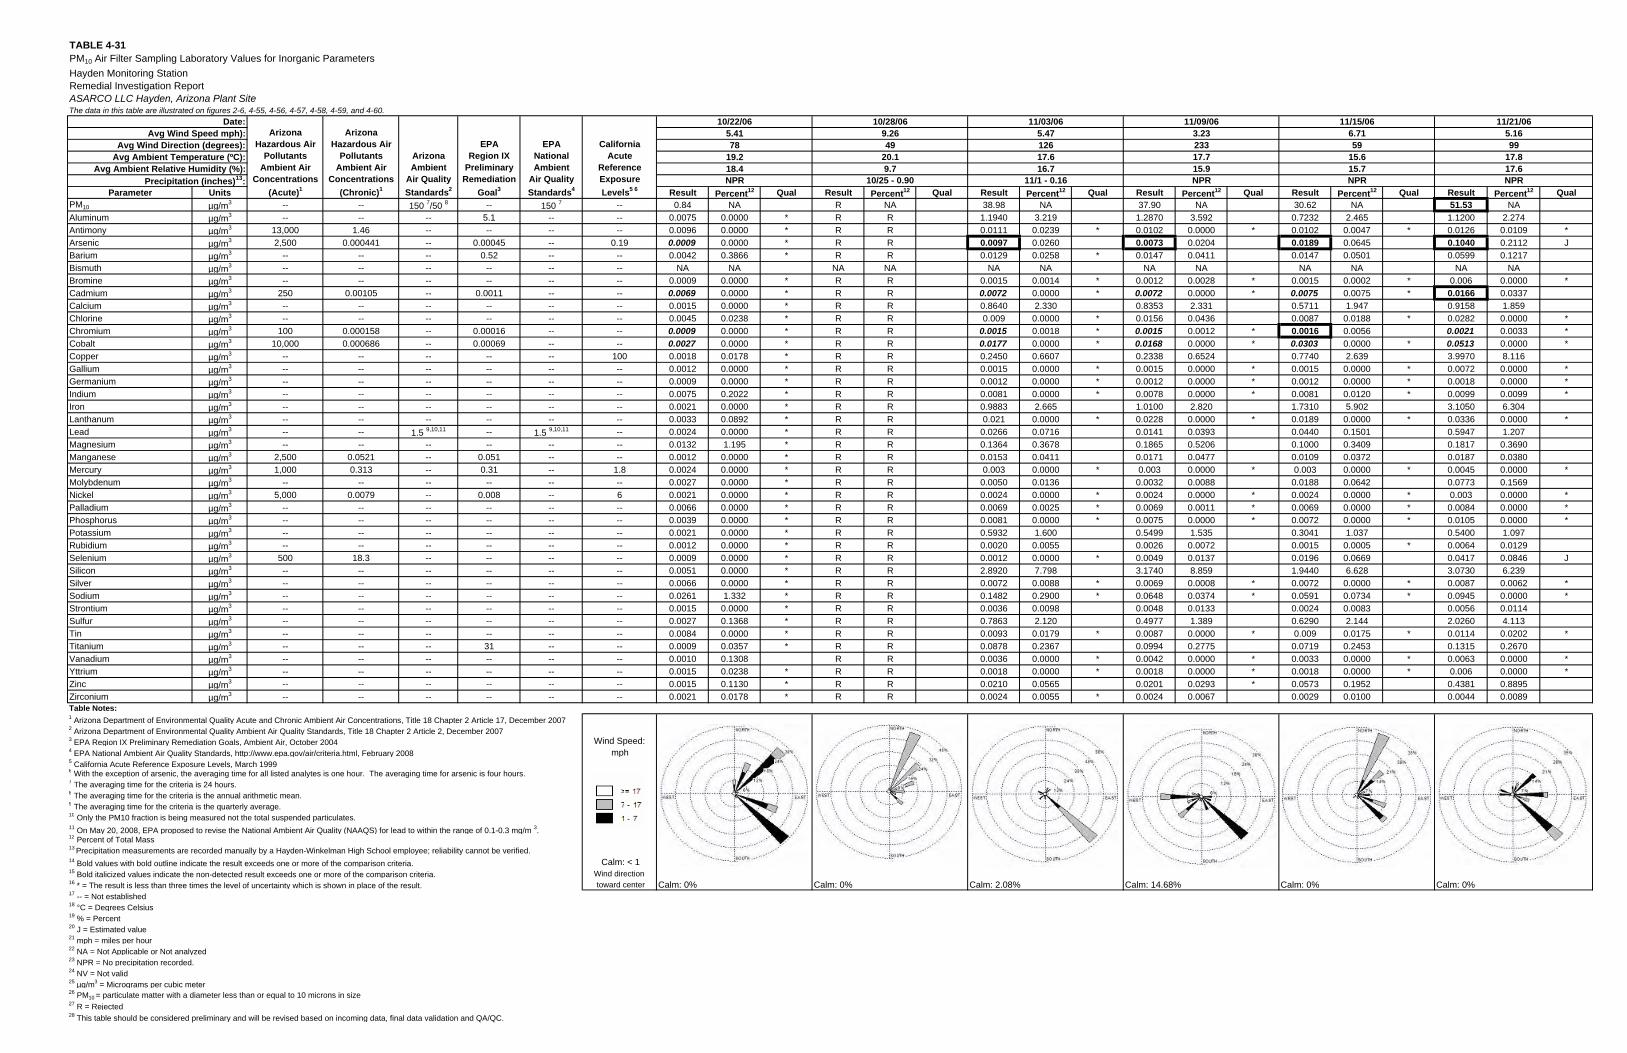
TABLE 4-31PM10 Air Filter Sampling Laboratory Values for Inorganic ParametersHayden Monitoring StationRemedial Investigation ReportASARCO LLC Hayden, Arizona Plant SiteThe data in this table are illustrated on figures 2-6, 4-55, 4-56, 4-57, 4-58, 4-59, and 4-60.
Parameter Units Result Percent12 Qual Result Percent12 Qual Result Percent12 Qual Result Percent12 Qual Result Percent12 Qual Result Percent12 QualPM10 µg/m3 -- -- 150 7/50 8 -- 150 7 -- 0.84 NA R NA 38.98 NA 37.90 NA 30.62 NA 51.53 NAAluminum µg/m3 -- -- -- 5.1 -- -- 0.0075 0.0000 * R R 1.1940 3.219 1.2870 3.592 0.7232 2.465 1.1200 2.274Antimony µg/m3 13,000 1.46 -- -- -- -- 0.0096 0.0000 * R R 0.0111 0.0239 * 0.0102 0.0000 * 0.0102 0.0047 * 0.0126 0.0109 *Arsenic µg/m3 2,500 0.000441 -- 0.00045 -- 0.19 0.0009 0.0000 * R R 0.0097 0.0260 0.0073 0.0204 0.0189 0.0645 0.1040 0.2112 JBarium µg/m3 -- -- -- 0.52 -- -- 0.0042 0.3866 * R R 0.0129 0.0258 * 0.0147 0.0411 0.0147 0.0501 0.0599 0.1217Bismuth µg/m3 -- -- -- -- -- -- NA NA NA NA NA NA NA NA NA NA NA NABromine µg/m3 -- -- -- -- -- -- 0.0009 0.0000 * R R 0.0015 0.0014 * 0.0012 0.0028 * 0.0015 0.0002 * 0.006 0.0000 *Cadmium µg/m3 250 0.00105 -- 0.0011 -- -- 0.0069 0.0000 * R R 0.0072 0.0000 * 0.0072 0.0000 * 0.0075 0.0075 * 0.0166 0.0337Calcium µg/m3 -- -- -- -- -- -- 0.0015 0.0000 * R R 0.8640 2.330 0.8353 2.331 0.5711 1.947 0.9158 1.859Chlorine µg/m3 -- -- -- -- -- -- 0.0045 0.0238 * R R 0.009 0.0000 * 0.0156 0.0436 0.0087 0.0188 * 0.0282 0.0000 *Chromium µg/m3 100 0.000158 -- 0.00016 -- -- 0.0009 0.0000 * R R 0.0015 0.0018 * 0.0015 0.0012 * 0.0016 0.0056 0.0021 0.0033 *Cobalt µg/m3 10,000 0.000686 -- 0.00069 -- -- 0.0027 0.0000 * R R 0.0177 0.0000 * 0.0168 0.0000 * 0.0303 0.0000 * 0.0513 0.0000 *Copper µg/m3 -- -- -- -- -- 100 0.0018 0.0178 * R R 0.2450 0.6607 0.2338 0.6524 0.7740 2.639 3.9970 8.116Gallium µg/m3 -- -- -- -- -- -- 0.0012 0.0000 * R R 0.0015 0.0000 * 0.0015 0.0000 * 0.0015 0.0000 * 0.0072 0.0000 *Germanium µg/m3 -- -- -- -- -- -- 0.0009 0.0000 * R R 0.0012 0.0000 * 0.0012 0.0000 * 0.0012 0.0000 * 0.0018 0.0000 *Indium µg/m3 -- -- -- -- -- -- 0.0075 0.2022 * R R 0.0081 0.0000 * 0.0078 0.0000 * 0.0081 0.0120 * 0.0099 0.0099 *Iron µg/m3 -- -- -- -- -- -- 0.0021 0.0000 * R R 0.9883 2.665 1.0100 2.820 1.7310 5.902 3.1050 6.304Lanthanum µg/m3 -- -- -- -- -- -- 0.0033 0.0892 * R R 0.021 0.0000 * 0.0228 0.0000 * 0.0189 0.0000 * 0.0336 0.0000 *Lead µg/m3 -- -- 1.5 9,10,11 -- 1.5 9,10,11 -- 0.0024 0.0000 * R R 0.0266 0.0716 0.0141 0.0393 0.0440 0.1501 0.5947 1.207Magnesium µg/m3 -- -- -- -- -- -- 0.0132 1.195 * R R 0.1364 0.3678 0.1865 0.5206 0.1000 0.3409 0.1817 0.3690Manganese µg/m3 2,500 0.0521 -- 0.051 -- -- 0.0012 0.0000 * R R 0.0153 0.0411 0.0171 0.0477 0.0109 0.0372 0.0187 0.0380Mercury µg/m3 1,000 0.313 -- 0.31 -- 1.8 0.0024 0.0000 * R R 0.003 0.0000 * 0.003 0.0000 * 0.003 0.0000 * 0.0045 0.0000 *Molybdenum µg/m3 -- -- -- -- -- -- 0.0027 0.0000 * R R 0.0050 0.0136 0.0032 0.0088 0.0188 0.0642 0.0773 0.1569Nickel µg/m3 5,000 0.0079 -- 0.008 -- 6 0.0021 0.0000 * R R 0.0024 0.0000 * 0.0024 0.0000 * 0.0024 0.0000 * 0.003 0.0000 *Palladium µg/m3 -- -- -- -- -- -- 0.0066 0.0000 * R R 0.0069 0.0025 * 0.0069 0.0011 * 0.0069 0.0000 * 0.0084 0.0000 *Phosphorus µg/m3 -- -- -- -- -- -- 0.0039 0.0000 * R R 0.0081 0.0000 * 0.0075 0.0000 * 0.0072 0.0000 * 0.0105 0.0000 *Potassium µg/m3 -- -- -- -- -- -- 0.0021 0.0000 * R R 0.5932 1.600 0.5499 1.535 0.3041 1.037 0.5400 1.097Rubidium µg/m3 -- -- -- -- -- -- 0.0012 0.0000 * R R 0.0020 0.0055 0.0026 0.0072 0.0015 0.0005 * 0.0064 0.0129Selenium µg/m3 500 18.3 -- -- -- -- 0.0009 0.0000 * R R 0.0012 0.0000 * 0.0049 0.0137 0.0196 0.0669 0.0417 0.0846 JSilicon µg/m3 -- -- -- -- -- -- 0.0051 0.0000 * R R 2.8920 7.798 3.1740 8.859 1.9440 6.628 3.0730 6.239Silver µg/m3 -- -- -- -- -- -- 0.0066 0.0000 * R R 0.0072 0.0088 * 0.0069 0.0008 * 0.0072 0.0000 * 0.0087 0.0062 *Sodium µg/m3 -- -- -- -- -- -- 0.0261 1.332 * R R 0.1482 0.2900 * 0.0648 0.0374 * 0.0591 0.0734 * 0.0945 0.0000 *Strontium µg/m3 -- -- -- -- -- -- 0.0015 0.0000 * R R 0.0036 0.0098 0.0048 0.0133 0.0024 0.0083 0.0056 0.0114Sulfur µg/m3 -- -- -- -- -- -- 0.0027 0.1368 * R R 0.7863 2.120 0.4977 1.389 0.6290 2.144 2.0260 4.113Tin µg/m3 -- -- -- -- -- -- 0.0084 0.0000 * R R 0.0093 0.0179 * 0.0087 0.0000 * 0.009 0.0175 * 0.0114 0.0202 *Titanium µg/m3 -- -- -- 31 -- -- 0.0009 0.0357 * R R 0.0878 0.2367 0.0994 0.2775 0.0719 0.2453 0.1315 0.2670Vanadium µg/m3 -- -- -- -- -- -- 0.0010 0.1308 R R 0.0036 0.0000 * 0.0042 0.0000 * 0.0033 0.0000 * 0.0063 0.0000 *Yttrium µg/m3 -- -- -- -- -- -- 0.0015 0.0238 * R R 0.0018 0.0000 * 0.0018 0.0000 * 0.0018 0.0000 * 0.006 0.0000 *Zinc µg/m3 -- -- -- -- -- -- 0.0015 0.1130 * R R 0.0210 0.0565 0.0201 0.0293 * 0.0573 0.1952 0.4381 0.8895Zirconium µg/m3 -- -- -- -- -- -- 0.0021 0.0178 * R R 0.0024 0.0055 * 0.0024 0.0067 0.0029 0.0100 0.0044 0.0089Table Notes:1 Arizona Department of Environmental Quality Acute and Chronic Ambient Air Concentrations, Title 18 Chapter 2 Article 17, December 20072 Arizona Department of Environmental Quality Ambient Air Quality Standards, Title 18 Chapter 2 Article 2, December 20073 EPA Region IX Preliminary Remediation Goals, Ambient Air, October 2004 Wind Speed: 4 EPA National Ambient Air Quality Standards, http://www.epa.gov/air/criteria.html, February 2008 mph5 California Acute Reference Exposure Levels, March 19996 With the exception of arsenic, the averaging time for all listed analytes is one hour. The averaging time for arsenic is four hours.7 The averaging time for the criteria is 24 hours.8 The averaging time for the criteria is the annual arithmetic mean.9 The averaging time for the criteria is the quarterly average.10 Only the PM10 fraction is being measured not the total suspended particulates.11 On May 20, 2008, EPA proposed to revise the National Ambient Air Quality (NAAQS) for lead to within the range of 0.1-0.3 mg/m 3.12 Percent of Total Mass13 Precipitation measurements are recorded manually by a Hayden-Winkelman High School employee; reliability cannot be verified.14 Bold values with bold outline indicate the result exceeds one or more of the comparison criteria. Calm: < 115 Bold italicized values indicate the non-detected result exceeds one or more of the comparison criteria. Wind direction16 * = The result is less than three times the level of uncertainty which is shown in place of the result. toward center Calm: 0% Calm: 0% Calm: 2.08% Calm: 14.68% Calm: 0% Calm: 0%17 -- = Not established18 °C = Degrees Celsius19 % = Percent20 J = Estimated value21 mph = miles per hour22 NA = Not Applicable or Not analyzed23 NPR = No precipitation recorded.24 NV = Not valid25 µg/m3 = Micrograms per cubic meter26 PM10 = particulate matter with a diameter less than or equal to 10 microns in size27 R = Rejected28 This table should be considered preliminary and will be revised based on incoming data, final data validation and QA/QC.
EPANationalAmbient
Air QualityStandards4
11/15/06 11/21/06
CaliforniaAcute
ReferenceExposureLevels5 6
10/22/06 10/28/06 11/03/06 11/09/06Date:Arizona
Hazardous AirPollutants
Ambient AirConcentrations
(Acute)1
ArizonaHazardous Air
PollutantsAmbient Air
Concentrations(Chronic)1
EPARegion IX
PreliminaryRemediation
Goal3
Avg Wind Speed mph):
Avg Ambient Relative Humidity (%):
Avg Wind Direction (degrees):Avg Ambient Temperature (ºC): Arizona
AmbientAir QualityStandards2
5.4178
19.218.4
9.2649
20.19.7
5.4712617.616.7
3.2323317.715.9
6.7159
15.615.7
5.1699
17.817.6
Precipitation (inches)13: NPR 10/25 - 0.90 11/1 - 0.16 NPR NPR NPR
D >= 17
D 1 - 17 -1 - 7
•• ,------··1M()·RT),1·- , , __ •-.
.- ··r··----' ,.,,.- --- . ; .
__ , .. ---- __ .. ; ... _ .
··-,,_ •••. ll''\-,
<'4~. .... ..
•"'1\
I~' ':.
---~ ----~-----;~~>r.l
·. ·--... _
·. ' .
-., .. ___ ~ -- -
·-· -··t···· / . ,·
.... .. trol,llll .-•·
F~);~III~~ ·. \ ... \. __ ···------+----· __ ,., _.I
. --..... ,_ ~------., -
-. ·-... __
_, ... -·
\.,, ·. •,.
__ t!pi.mt--· ·
•••••··••· ···1tii·iUH ··•• .. h, .
-., .... -~--·· ·, ____ _
·--- -- , .... _ troLIT!'--•···
... ,- -··· ··1...-:iRlll ····--.,._
··-.. • •••. l 5'11i,,
••• a .11ir ' ,.
;·, "'! \ \
--- ; ·-,.--- ...
_,.-··_.:·_:J __ ---
_,----f ,,~ :.. ----~·····•· ····f····-~---- '"1\----}- ---)----.· .. J-~rrr __ .·; :om: ' -. '· .. ·•,_·+··
·- ·----r- ----',_
--..... -:--- -· -- --+--'•"" __ ,
,.- -•'
-., ..... . j~UTtt-----
__ .. --- ---· ·1.-)5fll1'••·--... _
·-. . ,· - : · --....... __ -~-•. _.,, __ ,,.-·· --· T'··--- -
... ,.. .. -· ··· '"'·
7~:''.,/}~t> ,, __
·+--,•r•" ·,., --, -· i~II™ -•'
_,,.-
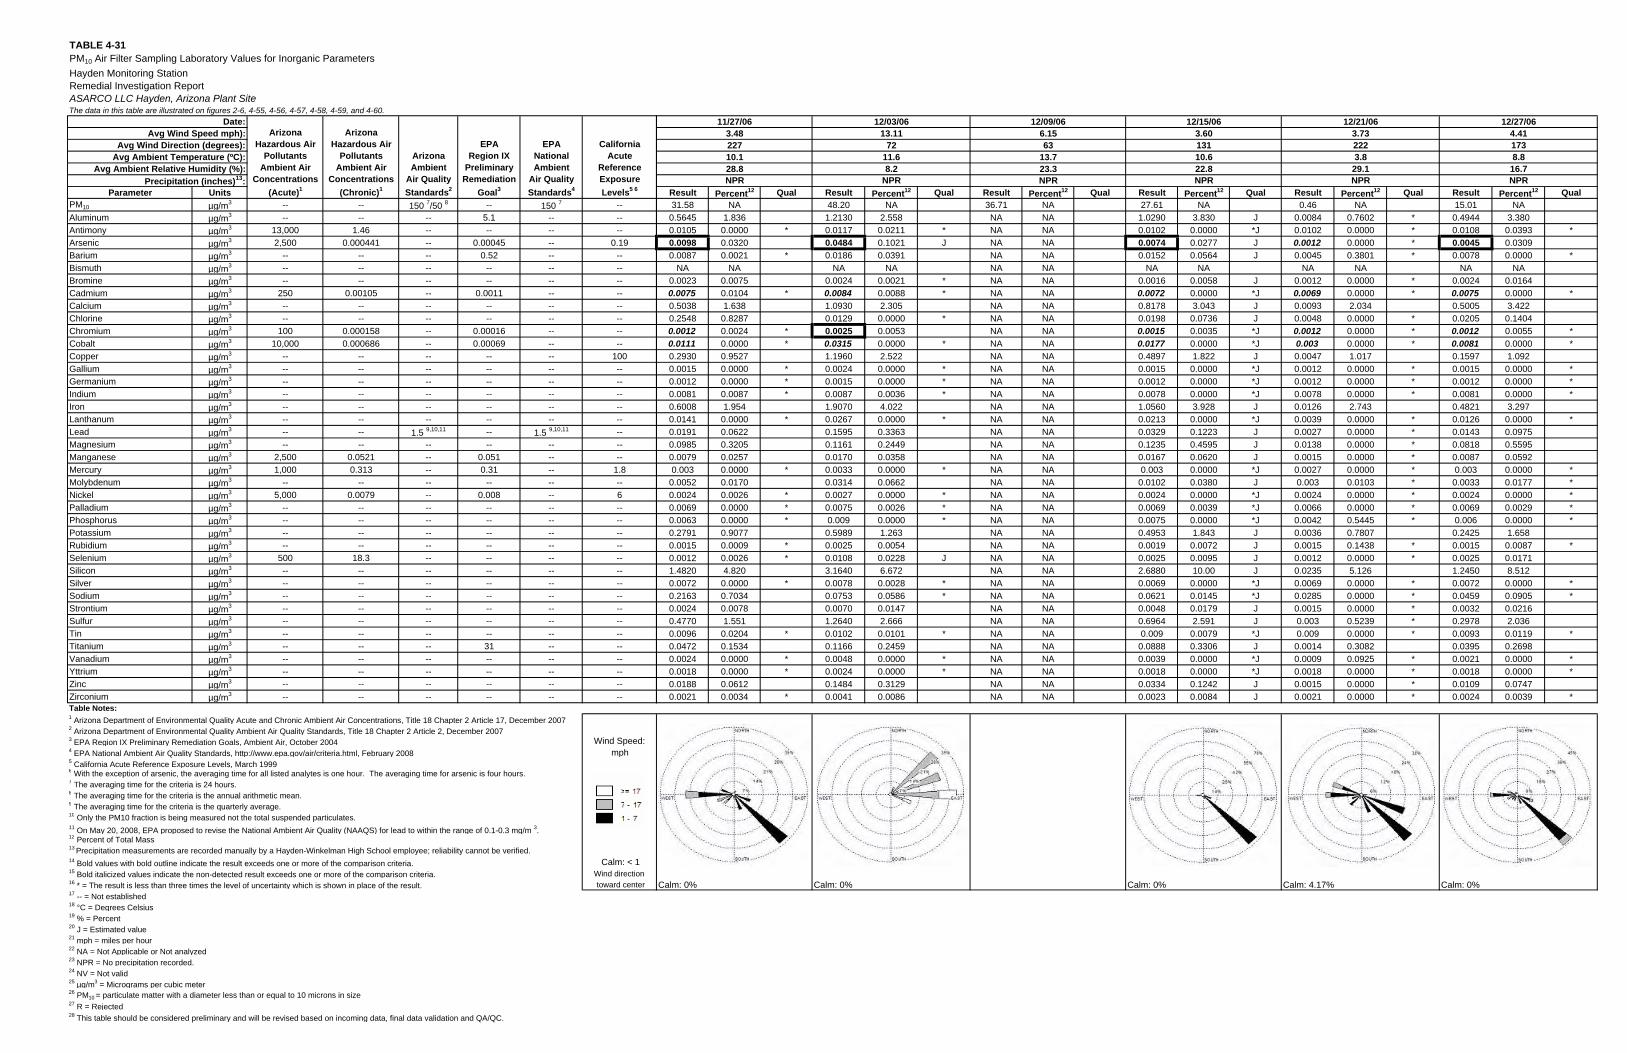
TABLE 4-31PM10 Air Filter Sampling Laboratory Values for Inorganic ParametersHayden Monitoring StationRemedial Investigation ReportASARCO LLC Hayden, Arizona Plant SiteThe data in this table are illustrated on figures 2-6, 4-55, 4-56, 4-57, 4-58, 4-59, and 4-60.
Parameter UnitsPM10 µg/m3 -- -- 150 7/50 8 -- 150 7 --Aluminum µg/m3 -- -- -- 5.1 -- --Antimony µg/m3 13,000 1.46 -- -- -- --Arsenic µg/m3 2,500 0.000441 -- 0.00045 -- 0.19Barium µg/m3 -- -- -- 0.52 -- --Bismuth µg/m3 -- -- -- -- -- --Bromine µg/m3 -- -- -- -- -- --Cadmium µg/m3 250 0.00105 -- 0.0011 -- --Calcium µg/m3 -- -- -- -- -- --Chlorine µg/m3 -- -- -- -- -- --Chromium µg/m3 100 0.000158 -- 0.00016 -- --Cobalt µg/m3 10,000 0.000686 -- 0.00069 -- --Copper µg/m3 -- -- -- -- -- 100Gallium µg/m3 -- -- -- -- -- --Germanium µg/m3 -- -- -- -- -- --Indium µg/m3 -- -- -- -- -- --Iron µg/m3 -- -- -- -- -- --Lanthanum µg/m3 -- -- -- -- -- --Lead µg/m3 -- -- 1.5 9,10,11 -- 1.5 9,10,11 --Magnesium µg/m3 -- -- -- -- -- --Manganese µg/m3 2,500 0.0521 -- 0.051 -- --Mercury µg/m3 1,000 0.313 -- 0.31 -- 1.8Molybdenum µg/m3 -- -- -- -- -- --Nickel µg/m3 5,000 0.0079 -- 0.008 -- 6Palladium µg/m3 -- -- -- -- -- --Phosphorus µg/m3 -- -- -- -- -- --Potassium µg/m3 -- -- -- -- -- --Rubidium µg/m3 -- -- -- -- -- --Selenium µg/m3 500 18.3 -- -- -- --Silicon µg/m3 -- -- -- -- -- --Silver µg/m3 -- -- -- -- -- --Sodium µg/m3 -- -- -- -- -- --Strontium µg/m3 -- -- -- -- -- --Sulfur µg/m3 -- -- -- -- -- --Tin µg/m3 -- -- -- -- -- --Titanium µg/m3 -- -- -- 31 -- --Vanadium µg/m3 -- -- -- -- -- --Yttrium µg/m3 -- -- -- -- -- --Zinc µg/m3 -- -- -- -- -- --Zirconium µg/m3 -- -- -- -- -- --Table Notes:1 Arizona Department of Environmental Quality Acute and Chronic Ambient Air Concentrations, Title 18 Chapter 2 Article 17, December 20072 Arizona Department of Environmental Quality Ambient Air Quality Standards, Title 18 Chapter 2 Article 2, December 20073 EPA Region IX Preliminary Remediation Goals, Ambient Air, October 2004 Wind Speed: 4 EPA National Ambient Air Quality Standards, http://www.epa.gov/air/criteria.html, February 2008 mph5 California Acute Reference Exposure Levels, March 19996 With the exception of arsenic, the averaging time for all listed analytes is one hour. The averaging time for arsenic is four hours.7 The averaging time for the criteria is 24 hours.8 The averaging time for the criteria is the annual arithmetic mean.9 The averaging time for the criteria is the quarterly average.10 Only the PM10 fraction is being measured not the total suspended particulates.11 On May 20, 2008, EPA proposed to revise the National Ambient Air Quality (NAAQS) for lead to within the range of 0.1-0.3 mg/m 3.12 Percent of Total Mass13 Precipitation measurements are recorded manually by a Hayden-Winkelman High School employee; reliability cannot be verified.14 Bold values with bold outline indicate the result exceeds one or more of the comparison criteria. Calm: < 115 Bold italicized values indicate the non-detected result exceeds one or more of the comparison criteria. Wind direction16 * = The result is less than three times the level of uncertainty which is shown in place of the result. toward center17 -- = Not established18 °C = Degrees Celsius19 % = Percent20 J = Estimated value21 mph = miles per hour22 NA = Not Applicable or Not analyzed23 NPR = No precipitation recorded.24 NV = Not valid25 µg/m3 = Micrograms per cubic meter26 PM10 = particulate matter with a diameter less than or equal to 10 microns in size27 R = Rejected28 This table should be considered preliminary and will be revised based on incoming data, final data validation and QA/QC.
EPANationalAmbient
Air QualityStandards4
CaliforniaAcute
ReferenceExposureLevels5 6
Date:Arizona
Hazardous AirPollutants
Ambient AirConcentrations
(Acute)1
ArizonaHazardous Air
PollutantsAmbient Air
Concentrations(Chronic)1
EPARegion IX
PreliminaryRemediation
Goal3
Avg Wind Speed mph):
Avg Ambient Relative Humidity (%):
Avg Wind Direction (degrees):Avg Ambient Temperature (ºC): Arizona
AmbientAir QualityStandards2
Precipitation (inches)13:Result Percent12 Qual Result Percent12 Qual Result Percent12 Qual Result Percent12 Qual Result Percent12 Qual Result Percent12 Qual31.58 NA 48.20 NA 36.71 NA 27.61 NA 0.46 NA 15.01 NA
0.5645 1.836 1.2130 2.558 NA NA 1.0290 3.830 J 0.0084 0.7602 * 0.4944 3.3800.0105 0.0000 * 0.0117 0.0211 * NA NA 0.0102 0.0000 *J 0.0102 0.0000 * 0.0108 0.0393 *0.0098 0.0320 0.0484 0.1021 J NA NA 0.0074 0.0277 J 0.0012 0.0000 * 0.0045 0.03090.0087 0.0021 * 0.0186 0.0391 NA NA 0.0152 0.0564 J 0.0045 0.3801 * 0.0078 0.0000 *
NA NA NA NA NA NA NA NA NA NA NA NA0.0023 0.0075 0.0024 0.0021 * NA NA 0.0016 0.0058 J 0.0012 0.0000 * 0.0024 0.01640.0075 0.0104 * 0.0084 0.0088 * NA NA 0.0072 0.0000 *J 0.0069 0.0000 * 0.0075 0.0000 *0.5038 1.638 1.0930 2.305 NA NA 0.8178 3.043 J 0.0093 2.034 0.5005 3.4220.2548 0.8287 0.0129 0.0000 * NA NA 0.0198 0.0736 J 0.0048 0.0000 * 0.0205 0.14040.0012 0.0024 * 0.0025 0.0053 NA NA 0.0015 0.0035 *J 0.0012 0.0000 * 0.0012 0.0055 *0.0111 0.0000 * 0.0315 0.0000 * NA NA 0.0177 0.0000 *J 0.003 0.0000 * 0.0081 0.0000 *0.2930 0.9527 1.1960 2.522 NA NA 0.4897 1.822 J 0.0047 1.017 0.1597 1.0920.0015 0.0000 * 0.0024 0.0000 * NA NA 0.0015 0.0000 *J 0.0012 0.0000 * 0.0015 0.0000 *0.0012 0.0000 * 0.0015 0.0000 * NA NA 0.0012 0.0000 *J 0.0012 0.0000 * 0.0012 0.0000 *0.0081 0.0087 * 0.0087 0.0036 * NA NA 0.0078 0.0000 *J 0.0078 0.0000 * 0.0081 0.0000 *0.6008 1.954 1.9070 4.022 NA NA 1.0560 3.928 J 0.0126 2.743 0.4821 3.2970.0141 0.0000 * 0.0267 0.0000 * NA NA 0.0213 0.0000 *J 0.0039 0.0000 * 0.0126 0.0000 *0.0191 0.0622 0.1595 0.3363 NA NA 0.0329 0.1223 J 0.0027 0.0000 * 0.0143 0.09750.0985 0.3205 0.1161 0.2449 NA NA 0.1235 0.4595 J 0.0138 0.0000 * 0.0818 0.55950.0079 0.0257 0.0170 0.0358 NA NA 0.0167 0.0620 J 0.0015 0.0000 * 0.0087 0.05920.003 0.0000 * 0.0033 0.0000 * NA NA 0.003 0.0000 *J 0.0027 0.0000 * 0.003 0.0000 *
0.0052 0.0170 0.0314 0.0662 NA NA 0.0102 0.0380 J 0.003 0.0103 * 0.0033 0.0177 *0.0024 0.0026 * 0.0027 0.0000 * NA NA 0.0024 0.0000 *J 0.0024 0.0000 * 0.0024 0.0000 *0.0069 0.0000 * 0.0075 0.0026 * NA NA 0.0069 0.0039 *J 0.0066 0.0000 * 0.0069 0.0029 *0.0063 0.0000 * 0.009 0.0000 * NA NA 0.0075 0.0000 *J 0.0042 0.5445 * 0.006 0.0000 *0.2791 0.9077 0.5989 1.263 NA NA 0.4953 1.843 J 0.0036 0.7807 0.2425 1.6580.0015 0.0009 * 0.0025 0.0054 NA NA 0.0019 0.0072 J 0.0015 0.1438 * 0.0015 0.0087 *0.0012 0.0026 * 0.0108 0.0228 J NA NA 0.0025 0.0095 J 0.0012 0.0000 * 0.0025 0.01711.4820 4.820 3.1640 6.672 NA NA 2.6880 10.00 J 0.0235 5.126 1.2450 8.5120.0072 0.0000 * 0.0078 0.0028 * NA NA 0.0069 0.0000 *J 0.0069 0.0000 * 0.0072 0.0000 *0.2163 0.7034 0.0753 0.0586 * NA NA 0.0621 0.0145 *J 0.0285 0.0000 * 0.0459 0.0905 *0.0024 0.0078 0.0070 0.0147 NA NA 0.0048 0.0179 J 0.0015 0.0000 * 0.0032 0.02160.4770 1.551 1.2640 2.666 NA NA 0.6964 2.591 J 0.003 0.5239 * 0.2978 2.0360.0096 0.0204 * 0.0102 0.0101 * NA NA 0.009 0.0079 *J 0.009 0.0000 * 0.0093 0.0119 *0.0472 0.1534 0.1166 0.2459 NA NA 0.0888 0.3306 J 0.0014 0.3082 0.0395 0.26980.0024 0.0000 * 0.0048 0.0000 * NA NA 0.0039 0.0000 *J 0.0009 0.0925 * 0.0021 0.0000 *0.0018 0.0000 * 0.0024 0.0000 * NA NA 0.0018 0.0000 *J 0.0018 0.0000 * 0.0018 0.0000 *0.0188 0.0612 0.1484 0.3129 NA NA 0.0334 0.1242 J 0.0015 0.0000 * 0.0109 0.07470.0021 0.0034 * 0.0041 0.0086 NA NA 0.0023 0.0084 J 0.0021 0.0000 * 0.0024 0.0039 *
Calm: 0% Calm: 0% Calm: 0% Calm: 4.17% Calm: 0%
NPR
6.1563
13.723.3
12/27/0612/15/06 12/21/0612/09/0611/27/06 12/03/063.4822710.128.8
13.1172
11.68.2
3.6013110.622.8
3.732223.8
29.1
4.411738.8
16.7NPR NPR NPR NPR NPR
•• -----···-:.;:ilfll,I ·-,, __ ·, •. _
··---- :····---- ', ·•.. :l-5-'lli -· ··t-··--- ',., -~ \ _,.--··"~· .. ,
D >= 17
D 1 - 17 -1 - 7
. ..,.---··: ---, 2,... '\
~:~::~ ·-··.•·; .. J?:) t······ ,
., ••• ••• ;OOI.ITH-,
·· ... _
.... -- ·· ;i.oRT!l·-- .•
_ .. ---- -~ ··-·----. ·-... ~""
,.,,•' ----------- .. ... tE:Ol/l'li--,- -
•• ,- "" "FICilirt,I···· --., ,_
---:--------. ,,' . :.-, ·-- ·--.,, ~i ... \ . __,,. _ .. ... - -.,_ ~~
~~\;\~<~,:t'})) . , ,. .. ,•·
'·-- ., ... _ toolffli-·'··
•• ,---- ···;;,:;1m1 -,, -., •••····· '•:i"im<·•• .. • ,_ ···; ·•·... > .
.. ', __ ... -···· ', .~ ... \ . .... --·· -···-:---·• ·····--. ,; .. __ ' / ... ...-· ·-.. , "\ \
i::'; _._·.:.~~· ;) <:\(~ '.! ,-•··· -., ... lool.lT11--• ·-- - --- -~601.iTH __ , •
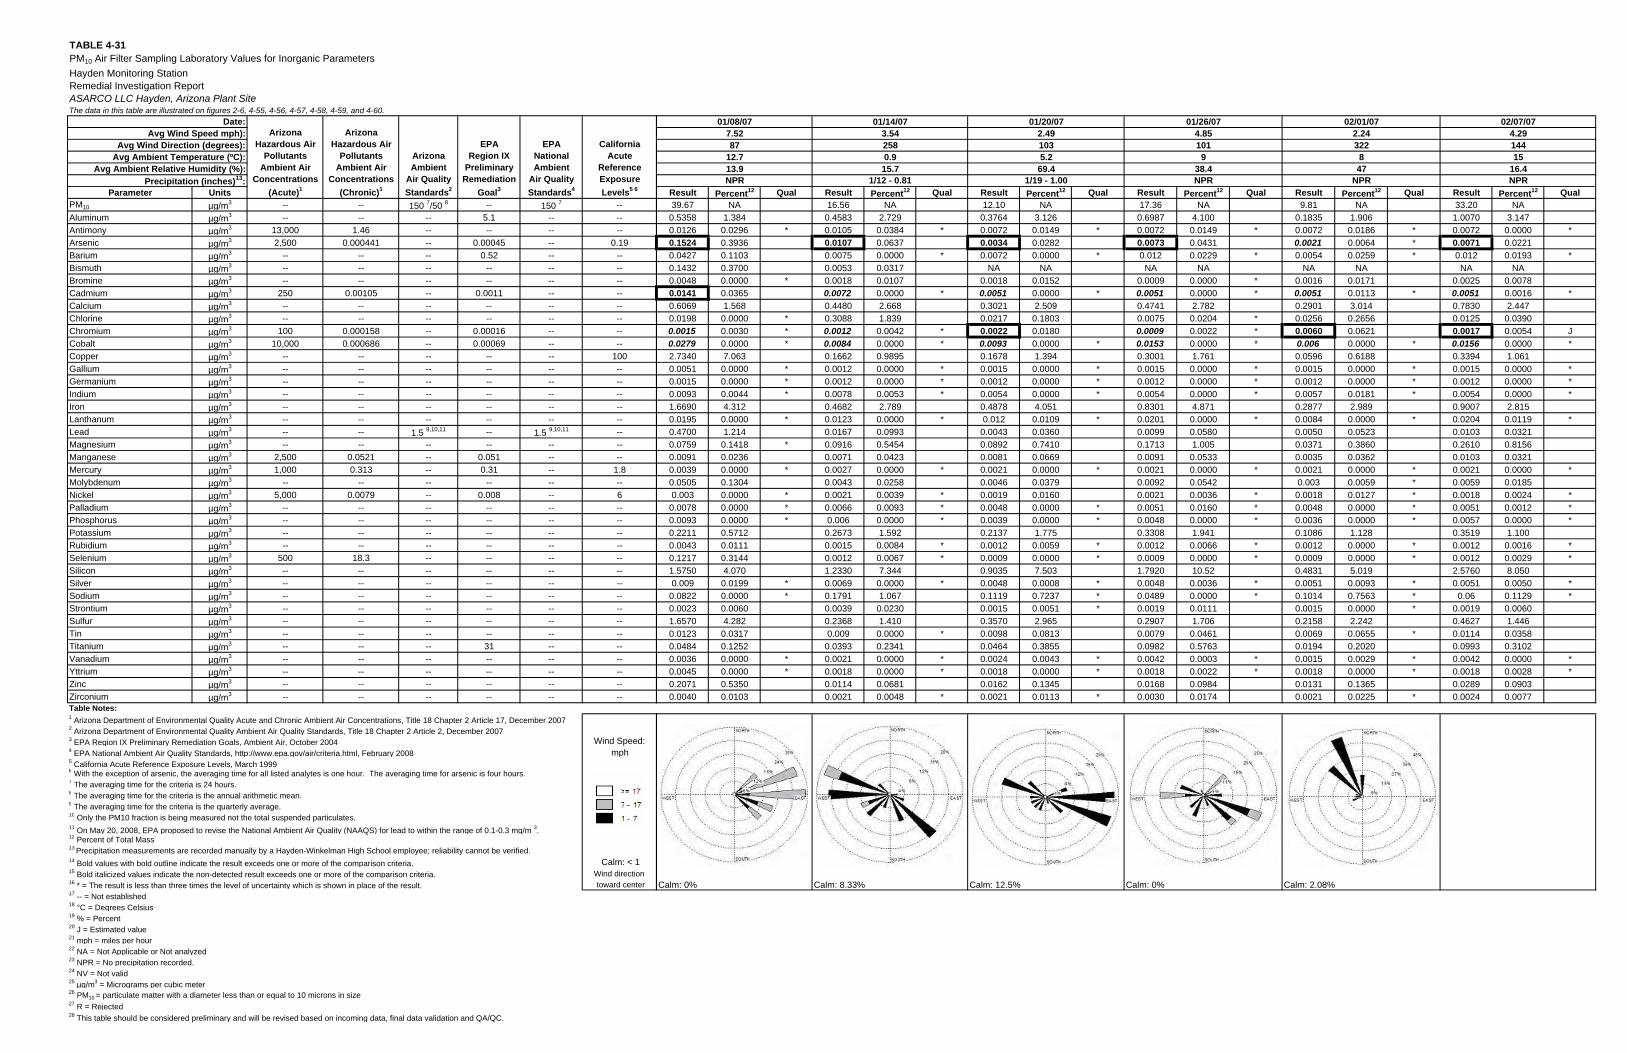
TABLE 4-31PM10 Air Filter Sampling Laboratory Values for Inorganic ParametersHayden Monitoring StationRemedial Investigation ReportASARCO LLC Hayden, Arizona Plant SiteThe data in this table are illustrated on figures 2-6, 4-55, 4-56, 4-57, 4-58, 4-59, and 4-60.
Parameter UnitsPM10 µg/m3 -- -- 150 7/50 8 -- 150 7 --Aluminum µg/m3 -- -- -- 5.1 -- --Antimony µg/m3 13,000 1.46 -- -- -- --Arsenic µg/m3 2,500 0.000441 -- 0.00045 -- 0.19Barium µg/m3 -- -- -- 0.52 -- --Bismuth µg/m3 -- -- -- -- -- --Bromine µg/m3 -- -- -- -- -- --Cadmium µg/m3 250 0.00105 -- 0.0011 -- --Calcium µg/m3 -- -- -- -- -- --Chlorine µg/m3 -- -- -- -- -- --Chromium µg/m3 100 0.000158 -- 0.00016 -- --Cobalt µg/m3 10,000 0.000686 -- 0.00069 -- --Copper µg/m3 -- -- -- -- -- 100Gallium µg/m3 -- -- -- -- -- --Germanium µg/m3 -- -- -- -- -- --Indium µg/m3 -- -- -- -- -- --Iron µg/m3 -- -- -- -- -- --Lanthanum µg/m3 -- -- -- -- -- --Lead µg/m3 -- -- 1.5 9,10,11 -- 1.5 9,10,11 --Magnesium µg/m3 -- -- -- -- -- --Manganese µg/m3 2,500 0.0521 -- 0.051 -- --Mercury µg/m3 1,000 0.313 -- 0.31 -- 1.8Molybdenum µg/m3 -- -- -- -- -- --Nickel µg/m3 5,000 0.0079 -- 0.008 -- 6Palladium µg/m3 -- -- -- -- -- --Phosphorus µg/m3 -- -- -- -- -- --Potassium µg/m3 -- -- -- -- -- --Rubidium µg/m3 -- -- -- -- -- --Selenium µg/m3 500 18.3 -- -- -- --Silicon µg/m3 -- -- -- -- -- --Silver µg/m3 -- -- -- -- -- --Sodium µg/m3 -- -- -- -- -- --Strontium µg/m3 -- -- -- -- -- --Sulfur µg/m3 -- -- -- -- -- --Tin µg/m3 -- -- -- -- -- --Titanium µg/m3 -- -- -- 31 -- --Vanadium µg/m3 -- -- -- -- -- --Yttrium µg/m3 -- -- -- -- -- --Zinc µg/m3 -- -- -- -- -- --Zirconium µg/m3 -- -- -- -- -- --Table Notes:1 Arizona Department of Environmental Quality Acute and Chronic Ambient Air Concentrations, Title 18 Chapter 2 Article 17, December 20072 Arizona Department of Environmental Quality Ambient Air Quality Standards, Title 18 Chapter 2 Article 2, December 20073 EPA Region IX Preliminary Remediation Goals, Ambient Air, October 2004 Wind Speed: 4 EPA National Ambient Air Quality Standards, http://www.epa.gov/air/criteria.html, February 2008 mph5 California Acute Reference Exposure Levels, March 19996 With the exception of arsenic, the averaging time for all listed analytes is one hour. The averaging time for arsenic is four hours.7 The averaging time for the criteria is 24 hours.8 The averaging time for the criteria is the annual arithmetic mean.9 The averaging time for the criteria is the quarterly average.10 Only the PM10 fraction is being measured not the total suspended particulates.11 On May 20, 2008, EPA proposed to revise the National Ambient Air Quality (NAAQS) for lead to within the range of 0.1-0.3 mg/m 3.12 Percent of Total Mass13 Precipitation measurements are recorded manually by a Hayden-Winkelman High School employee; reliability cannot be verified.14 Bold values with bold outline indicate the result exceeds one or more of the comparison criteria. Calm: < 115 Bold italicized values indicate the non-detected result exceeds one or more of the comparison criteria. Wind direction16 * = The result is less than three times the level of uncertainty which is shown in place of the result. toward center17 -- = Not established18 °C = Degrees Celsius19 % = Percent20 J = Estimated value21 mph = miles per hour22 NA = Not Applicable or Not analyzed23 NPR = No precipitation recorded.24 NV = Not valid25 µg/m3 = Micrograms per cubic meter26 PM10 = particulate matter with a diameter less than or equal to 10 microns in size27 R = Rejected28 This table should be considered preliminary and will be revised based on incoming data, final data validation and QA/QC.
EPANationalAmbient
Air QualityStandards4
CaliforniaAcute
ReferenceExposureLevels5 6
Date:Arizona
Hazardous AirPollutants
Ambient AirConcentrations
(Acute)1
ArizonaHazardous Air
PollutantsAmbient Air
Concentrations(Chronic)1
EPARegion IX
PreliminaryRemediation
Goal3
Avg Wind Speed mph):
Avg Ambient Relative Humidity (%):
Avg Wind Direction (degrees):Avg Ambient Temperature (ºC): Arizona
AmbientAir QualityStandards2
Precipitation (inches)13:Result Percent12 Qual Result Percent12 Qual Result Percent12 Qual Result Percent12 Qual Result Percent12 Qual Result Percent12 Qual39.67 NA 16.56 NA 12.10 NA 17.36 NA 9.81 NA 33.20 NA
0.5358 1.384 0.4583 2.729 0.3764 3.126 0.6987 4.100 0.1835 1.906 1.0070 3.1470.0126 0.0296 * 0.0105 0.0384 * 0.0072 0.0149 * 0.0072 0.0149 * 0.0072 0.0186 * 0.0072 0.0000 *0.1524 0.3936 0.0107 0.0637 0.0034 0.0282 0.0073 0.0431 0.0021 0.0064 * 0.0071 0.02210.0427 0.1103 0.0075 0.0000 * 0.0072 0.0000 * 0.012 0.0229 * 0.0054 0.0259 * 0.012 0.0193 *0.1432 0.3700 0.0053 0.0317 NA NA NA NA NA NA NA NA0.0048 0.0000 * 0.0018 0.0107 0.0018 0.0152 0.0009 0.0000 * 0.0016 0.0171 0.0025 0.00780.0141 0.0365 0.0072 0.0000 * 0.0051 0.0000 * 0.0051 0.0000 * 0.0051 0.0113 * 0.0051 0.0016 *0.6069 1.568 0.4480 2.668 0.3021 2.509 0.4741 2.782 0.2901 3.014 0.7830 2.4470.0198 0.0000 * 0.3088 1.839 0.0217 0.1803 0.0075 0.0204 * 0.0256 0.2656 0.0125 0.03900.0015 0.0030 * 0.0012 0.0042 * 0.0022 0.0180 0.0009 0.0022 * 0.0060 0.0621 0.0017 0.0054 J0.0279 0.0000 * 0.0084 0.0000 * 0.0093 0.0000 * 0.0153 0.0000 * 0.006 0.0000 * 0.0156 0.0000 *2.7340 7.063 0.1662 0.9895 0.1678 1.394 0.3001 1.761 0.0596 0.6188 0.3394 1.0610.0051 0.0000 * 0.0012 0.0000 * 0.0015 0.0000 * 0.0015 0.0000 * 0.0015 0.0000 * 0.0015 0.0000 *0.0015 0.0000 * 0.0012 0.0000 * 0.0012 0.0000 * 0.0012 0.0000 * 0.0012 0.0000 * 0.0012 0.0000 *0.0093 0.0044 * 0.0078 0.0053 * 0.0054 0.0000 * 0.0054 0.0000 * 0.0057 0.0181 * 0.0054 0.0000 *1.6690 4.312 0.4682 2.789 0.4878 4.051 0.8301 4.871 0.2877 2.989 0.9007 2.8150.0195 0.0000 * 0.0123 0.0000 * 0.012 0.0109 * 0.0201 0.0000 * 0.0084 0.0000 * 0.0204 0.0119 *0.4700 1.214 0.0167 0.0993 0.0043 0.0360 0.0099 0.0580 0.0050 0.0523 0.0103 0.03210.0759 0.1418 * 0.0916 0.5454 0.0892 0.7410 0.1713 1.005 0.0371 0.3860 0.2610 0.81560.0091 0.0236 0.0071 0.0423 0.0081 0.0669 0.0091 0.0533 0.0035 0.0362 0.0103 0.03210.0039 0.0000 * 0.0027 0.0000 * 0.0021 0.0000 * 0.0021 0.0000 * 0.0021 0.0000 * 0.0021 0.0000 *0.0505 0.1304 0.0043 0.0258 0.0046 0.0379 0.0092 0.0542 0.003 0.0059 * 0.0059 0.01850.003 0.0000 * 0.0021 0.0039 * 0.0019 0.0160 0.0021 0.0036 * 0.0018 0.0127 * 0.0018 0.0024 *
0.0078 0.0000 * 0.0066 0.0093 * 0.0048 0.0000 * 0.0051 0.0160 * 0.0048 0.0000 * 0.0051 0.0012 *0.0093 0.0000 * 0.006 0.0000 * 0.0039 0.0000 * 0.0048 0.0000 * 0.0036 0.0000 * 0.0057 0.0000 *0.2211 0.5712 0.2673 1.592 0.2137 1.775 0.3308 1.941 0.1086 1.128 0.3519 1.1000.0043 0.0111 0.0015 0.0084 * 0.0012 0.0059 * 0.0012 0.0066 * 0.0012 0.0000 * 0.0012 0.0016 *0.1217 0.3144 0.0012 0.0067 * 0.0009 0.0000 * 0.0009 0.0000 * 0.0009 0.0000 * 0.0012 0.0029 *1.5750 4.070 1.2330 7.344 0.9035 7.503 1.7920 10.52 0.4831 5.019 2.5760 8.0500.009 0.0199 * 0.0069 0.0000 * 0.0048 0.0008 * 0.0048 0.0036 * 0.0051 0.0093 * 0.0051 0.0050 *
0.0822 0.0000 * 0.1791 1.067 0.1119 0.7237 * 0.0489 0.0000 * 0.1014 0.7563 * 0.06 0.1129 *0.0023 0.0060 0.0039 0.0230 0.0015 0.0051 * 0.0019 0.0111 0.0015 0.0000 * 0.0019 0.00601.6570 4.282 0.2368 1.410 0.3570 2.965 0.2907 1.706 0.2158 2.242 0.4627 1.4460.0123 0.0317 0.009 0.0000 * 0.0098 0.0813 0.0079 0.0461 0.0069 0.0655 * 0.0114 0.03580.0484 0.1252 0.0393 0.2341 0.0464 0.3855 0.0982 0.5763 0.0194 0.2020 0.0993 0.31020.0036 0.0000 * 0.0021 0.0000 * 0.0024 0.0043 * 0.0042 0.0003 * 0.0015 0.0029 * 0.0042 0.0000 *0.0045 0.0000 * 0.0018 0.0000 * 0.0018 0.0000 * 0.0018 0.0022 * 0.0018 0.0000 * 0.0018 0.0028 *0.2071 0.5350 0.0114 0.0681 0.0162 0.1345 0.0168 0.0984 0.0131 0.1365 0.0289 0.09030.0040 0.0103 0.0021 0.0048 * 0.0021 0.0113 * 0.0030 0.0174 0.0021 0.0225 * 0.0024 0.0077
Calm: 0% Calm: 8.33% Calm: 12.5% Calm: 0% Calm: 2.08%
02/07/0702/01/0701/08/07 01/14/07 01/20/07 01/26/077.5287
12.713.9
3.542580.915.7
2.491035.2
69.4
4.851019
38.4
2.24322847
4.2914415
16.4NPR 1/12 - 0.81 1/19 - 1.00 NPR NPR NPR
D >= 17
D 1 - 17 -1 - 7
__ .. , . l":nmc ·,, ··,._ ., , .. --- ···: ···---- .
'.'
,•·• '', ,- •· ·-... __ ·-,, _ ,. , , • '' , •• ' •• • :'•• -•• _ , lillri-,
~~(:~_:(~~~ , ' , . ,
· --- .------··•'
··•·••·· --,-· , .. -· · --- , .. _:E:()l/fl1--' ···' "'' . ,
-- - -- .!.. , • • • -
·--' • --~~I/Ttl-, __ ,, .-·•
• •• ,.- :1o0 ri111 · ,, · • , . , •• ---- ' NO'ITH
... --· -- --·---- ·• .. ,_ ,• .··· __ ,. ... ·+--····-- ... ,,. ___ ___ _ ' .. ,,.-"-· ---- . ···,'" ' · -.. ·---.,, '~""' ,' __ _ , ,, ·•-.. . ------,- -- ::!: •~---... _
'~/:~ : <~'~(~-~ ---\i ---- .... _, .... -
·--., ______ ______ lli;OIJT1l -·• ·· _, .,,• '
· ---, .... -~~!J111----
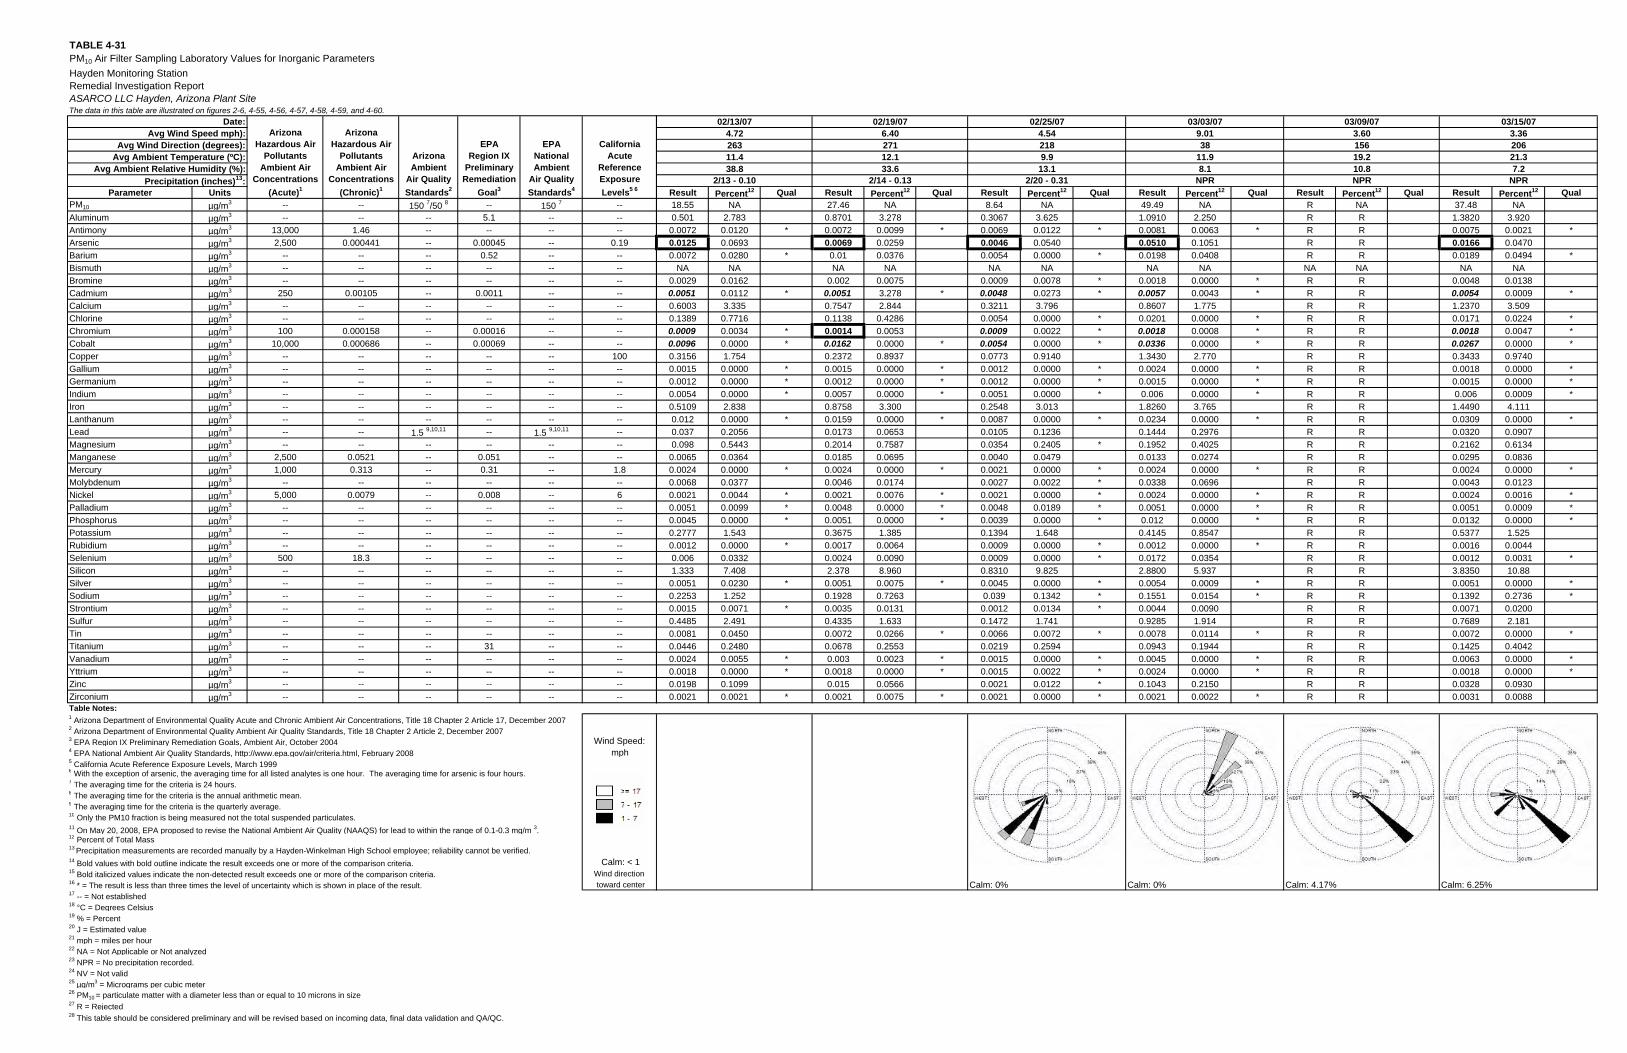
TABLE 4-31PM10 Air Filter Sampling Laboratory Values for Inorganic ParametersHayden Monitoring StationRemedial Investigation ReportASARCO LLC Hayden, Arizona Plant SiteThe data in this table are illustrated on figures 2-6, 4-55, 4-56, 4-57, 4-58, 4-59, and 4-60.
Parameter UnitsPM10 µg/m3 -- -- 150 7/50 8 -- 150 7 --Aluminum µg/m3 -- -- -- 5.1 -- --Antimony µg/m3 13,000 1.46 -- -- -- --Arsenic µg/m3 2,500 0.000441 -- 0.00045 -- 0.19Barium µg/m3 -- -- -- 0.52 -- --Bismuth µg/m3 -- -- -- -- -- --Bromine µg/m3 -- -- -- -- -- --Cadmium µg/m3 250 0.00105 -- 0.0011 -- --Calcium µg/m3 -- -- -- -- -- --Chlorine µg/m3 -- -- -- -- -- --Chromium µg/m3 100 0.000158 -- 0.00016 -- --Cobalt µg/m3 10,000 0.000686 -- 0.00069 -- --Copper µg/m3 -- -- -- -- -- 100Gallium µg/m3 -- -- -- -- -- --Germanium µg/m3 -- -- -- -- -- --Indium µg/m3 -- -- -- -- -- --Iron µg/m3 -- -- -- -- -- --Lanthanum µg/m3 -- -- -- -- -- --Lead µg/m3 -- -- 1.5 9,10,11 -- 1.5 9,10,11 --Magnesium µg/m3 -- -- -- -- -- --Manganese µg/m3 2,500 0.0521 -- 0.051 -- --Mercury µg/m3 1,000 0.313 -- 0.31 -- 1.8Molybdenum µg/m3 -- -- -- -- -- --Nickel µg/m3 5,000 0.0079 -- 0.008 -- 6Palladium µg/m3 -- -- -- -- -- --Phosphorus µg/m3 -- -- -- -- -- --Potassium µg/m3 -- -- -- -- -- --Rubidium µg/m3 -- -- -- -- -- --Selenium µg/m3 500 18.3 -- -- -- --Silicon µg/m3 -- -- -- -- -- --Silver µg/m3 -- -- -- -- -- --Sodium µg/m3 -- -- -- -- -- --Strontium µg/m3 -- -- -- -- -- --Sulfur µg/m3 -- -- -- -- -- --Tin µg/m3 -- -- -- -- -- --Titanium µg/m3 -- -- -- 31 -- --Vanadium µg/m3 -- -- -- -- -- --Yttrium µg/m3 -- -- -- -- -- --Zinc µg/m3 -- -- -- -- -- --Zirconium µg/m3 -- -- -- -- -- --Table Notes:1 Arizona Department of Environmental Quality Acute and Chronic Ambient Air Concentrations, Title 18 Chapter 2 Article 17, December 20072 Arizona Department of Environmental Quality Ambient Air Quality Standards, Title 18 Chapter 2 Article 2, December 20073 EPA Region IX Preliminary Remediation Goals, Ambient Air, October 2004 Wind Speed: 4 EPA National Ambient Air Quality Standards, http://www.epa.gov/air/criteria.html, February 2008 mph5 California Acute Reference Exposure Levels, March 19996 With the exception of arsenic, the averaging time for all listed analytes is one hour. The averaging time for arsenic is four hours.7 The averaging time for the criteria is 24 hours.8 The averaging time for the criteria is the annual arithmetic mean.9 The averaging time for the criteria is the quarterly average.10 Only the PM10 fraction is being measured not the total suspended particulates.11 On May 20, 2008, EPA proposed to revise the National Ambient Air Quality (NAAQS) for lead to within the range of 0.1-0.3 mg/m 3.12 Percent of Total Mass13 Precipitation measurements are recorded manually by a Hayden-Winkelman High School employee; reliability cannot be verified.14 Bold values with bold outline indicate the result exceeds one or more of the comparison criteria. Calm: < 115 Bold italicized values indicate the non-detected result exceeds one or more of the comparison criteria. Wind direction16 * = The result is less than three times the level of uncertainty which is shown in place of the result. toward center17 -- = Not established18 °C = Degrees Celsius19 % = Percent20 J = Estimated value21 mph = miles per hour22 NA = Not Applicable or Not analyzed23 NPR = No precipitation recorded.24 NV = Not valid25 µg/m3 = Micrograms per cubic meter26 PM10 = particulate matter with a diameter less than or equal to 10 microns in size27 R = Rejected28 This table should be considered preliminary and will be revised based on incoming data, final data validation and QA/QC.
EPANationalAmbient
Air QualityStandards4
CaliforniaAcute
ReferenceExposureLevels5 6
Date:Arizona
Hazardous AirPollutants
Ambient AirConcentrations
(Acute)1
ArizonaHazardous Air
PollutantsAmbient Air
Concentrations(Chronic)1
EPARegion IX
PreliminaryRemediation
Goal3
Avg Wind Speed mph):
Avg Ambient Relative Humidity (%):
Avg Wind Direction (degrees):Avg Ambient Temperature (ºC): Arizona
AmbientAir QualityStandards2
Precipitation (inches)13:Result Percent12 Qual Result Percent12 Qual Result Percent12 Qual Result Percent12 Qual Result Percent12 Qual Result Percent12 Qual18.55 NA 27.46 NA 8.64 NA 49.49 NA R NA 37.48 NA0.501 2.783 0.8701 3.278 0.3067 3.625 1.0910 2.250 R R 1.3820 3.920
0.0072 0.0120 * 0.0072 0.0099 * 0.0069 0.0122 * 0.0081 0.0063 * R R 0.0075 0.0021 *0.0125 0.0693 0.0069 0.0259 0.0046 0.0540 0.0510 0.1051 R R 0.0166 0.04700.0072 0.0280 * 0.01 0.0376 0.0054 0.0000 * 0.0198 0.0408 R R 0.0189 0.0494 *
NA NA NA NA NA NA NA NA NA NA NA NA0.0029 0.0162 0.002 0.0075 0.0009 0.0078 * 0.0018 0.0000 * R R 0.0048 0.01380.0051 0.0112 * 0.0051 3.278 * 0.0048 0.0273 * 0.0057 0.0043 * R R 0.0054 0.0009 *0.6003 3.335 0.7547 2.844 0.3211 3.796 0.8607 1.775 R R 1.2370 3.5090.1389 0.7716 0.1138 0.4286 0.0054 0.0000 * 0.0201 0.0000 * R R 0.0171 0.0224 *0.0009 0.0034 * 0.0014 0.0053 0.0009 0.0022 * 0.0018 0.0008 * R R 0.0018 0.0047 *0.0096 0.0000 * 0.0162 0.0000 * 0.0054 0.0000 * 0.0336 0.0000 * R R 0.0267 0.0000 *0.3156 1.754 0.2372 0.8937 0.0773 0.9140 1.3430 2.770 R R 0.3433 0.97400.0015 0.0000 * 0.0015 0.0000 * 0.0012 0.0000 * 0.0024 0.0000 * R R 0.0018 0.0000 *0.0012 0.0000 * 0.0012 0.0000 * 0.0012 0.0000 * 0.0015 0.0000 * R R 0.0015 0.0000 *0.0054 0.0000 * 0.0057 0.0000 * 0.0051 0.0000 * 0.006 0.0000 * R R 0.006 0.0009 *0.5109 2.838 0.8758 3.300 0.2548 3.013 1.8260 3.765 R R 1.4490 4.1110.012 0.0000 * 0.0159 0.0000 * 0.0087 0.0000 * 0.0234 0.0000 * R R 0.0309 0.0000 *0.037 0.2056 0.0173 0.0653 0.0105 0.1236 0.1444 0.2976 R R 0.0320 0.09070.098 0.5443 0.2014 0.7587 0.0354 0.2405 * 0.1952 0.4025 R R 0.2162 0.6134
0.0065 0.0364 0.0185 0.0695 0.0040 0.0479 0.0133 0.0274 R R 0.0295 0.08360.0024 0.0000 * 0.0024 0.0000 * 0.0021 0.0000 * 0.0024 0.0000 * R R 0.0024 0.0000 *0.0068 0.0377 0.0046 0.0174 0.0027 0.0022 * 0.0338 0.0696 R R 0.0043 0.01230.0021 0.0044 * 0.0021 0.0076 * 0.0021 0.0000 * 0.0024 0.0000 * R R 0.0024 0.0016 *0.0051 0.0099 * 0.0048 0.0000 * 0.0048 0.0189 * 0.0051 0.0000 * R R 0.0051 0.0009 *0.0045 0.0000 * 0.0051 0.0000 * 0.0039 0.0000 * 0.012 0.0000 * R R 0.0132 0.0000 *0.2777 1.543 0.3675 1.385 0.1394 1.648 0.4145 0.8547 R R 0.5377 1.5250.0012 0.0000 * 0.0017 0.0064 0.0009 0.0000 * 0.0012 0.0000 * R R 0.0016 0.00440.006 0.0332 0.0024 0.0090 0.0009 0.0000 * 0.0172 0.0354 R R 0.0012 0.0031 *1.333 7.408 2.378 8.960 0.8310 9.825 2.8800 5.937 R R 3.8350 10.88
0.0051 0.0230 * 0.0051 0.0075 * 0.0045 0.0000 * 0.0054 0.0009 * R R 0.0051 0.0000 *0.2253 1.252 0.1928 0.7263 0.039 0.1342 * 0.1551 0.0154 * R R 0.1392 0.2736 *0.0015 0.0071 * 0.0035 0.0131 0.0012 0.0134 * 0.0044 0.0090 R R 0.0071 0.02000.4485 2.491 0.4335 1.633 0.1472 1.741 0.9285 1.914 R R 0.7689 2.1810.0081 0.0450 0.0072 0.0266 * 0.0066 0.0072 * 0.0078 0.0114 * R R 0.0072 0.0000 *0.0446 0.2480 0.0678 0.2553 0.0219 0.2594 0.0943 0.1944 R R 0.1425 0.40420.0024 0.0055 * 0.003 0.0023 * 0.0015 0.0000 * 0.0045 0.0000 * R R 0.0063 0.0000 *0.0018 0.0000 * 0.0018 0.0000 * 0.0015 0.0022 * 0.0024 0.0000 * R R 0.0018 0.0000 *0.0198 0.1099 0.015 0.0566 0.0021 0.0122 * 0.1043 0.2150 R R 0.0328 0.09300.0021 0.0021 * 0.0021 0.0075 * 0.0021 0.0000 * 0.0021 0.0022 * R R 0.0031 0.0088
Calm: 0% Calm: 0% Calm: 4.17% Calm: 6.25%
02/19/07 02/25/07 03/03/07 03/09/07 03/15/0702/13/074.7226311.438.8
6.4027112.133.6
4.542189.9
13.1
9.0138
11.98.1
3.6015619.210.8
3.3620621.37.2
2/13 - 0.10 2/14 - 0.13 2/20 - 0.31 NPR NPR NPR
D >= 17
D 1 - 17 -1 - 7
... , -
'',.,,.--
, •• ' \_:.):'::);:1 :~:~~:, .. .,., .,' ,• }
. -• '
··~.~-- ··- . ,... . --~-- ----l~l,ll)j--------/ ·-
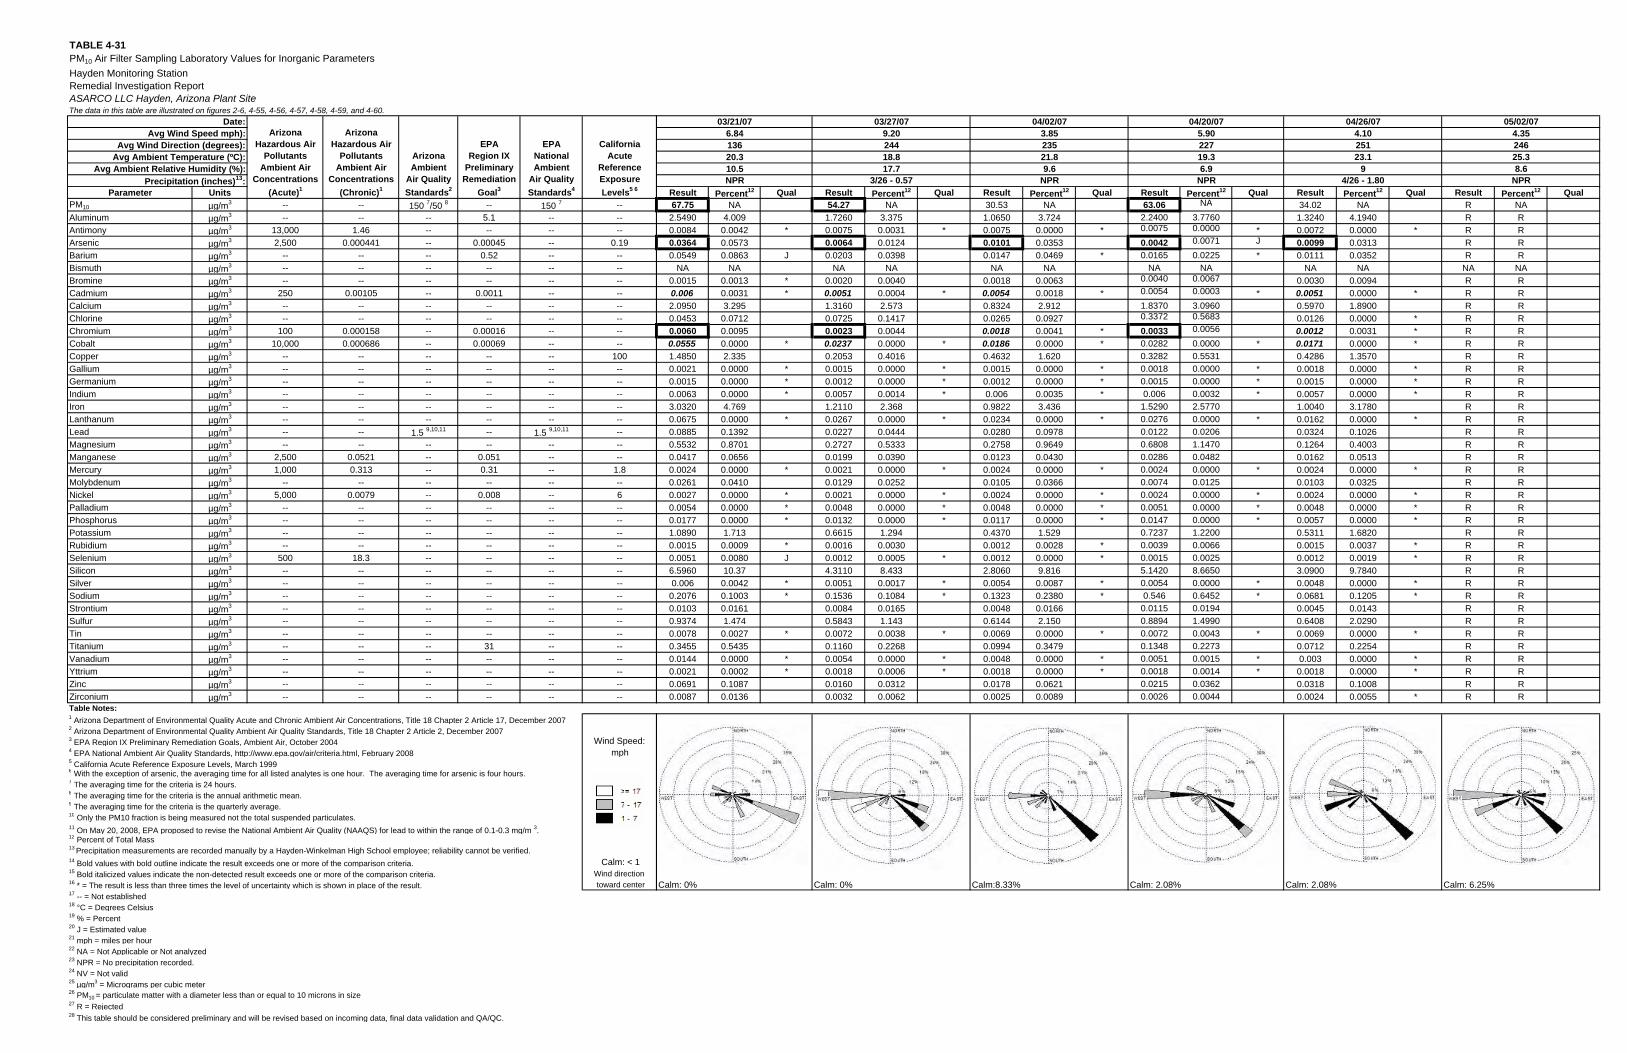
TABLE 4-31PM10 Air Filter Sampling Laboratory Values for Inorganic ParametersHayden Monitoring StationRemedial Investigation ReportASARCO LLC Hayden, Arizona Plant SiteThe data in this table are illustrated on figures 2-6, 4-55, 4-56, 4-57, 4-58, 4-59, and 4-60.
Parameter UnitsPM10 µg/m3 -- -- 150 7/50 8 -- 150 7 --Aluminum µg/m3 -- -- -- 5.1 -- --Antimony µg/m3 13,000 1.46 -- -- -- --Arsenic µg/m3 2,500 0.000441 -- 0.00045 -- 0.19Barium µg/m3 -- -- -- 0.52 -- --Bismuth µg/m3 -- -- -- -- -- --Bromine µg/m3 -- -- -- -- -- --Cadmium µg/m3 250 0.00105 -- 0.0011 -- --Calcium µg/m3 -- -- -- -- -- --Chlorine µg/m3 -- -- -- -- -- --Chromium µg/m3 100 0.000158 -- 0.00016 -- --Cobalt µg/m3 10,000 0.000686 -- 0.00069 -- --Copper µg/m3 -- -- -- -- -- 100Gallium µg/m3 -- -- -- -- -- --Germanium µg/m3 -- -- -- -- -- --Indium µg/m3 -- -- -- -- -- --Iron µg/m3 -- -- -- -- -- --Lanthanum µg/m3 -- -- -- -- -- --Lead µg/m3 -- -- 1.5 9,10,11 -- 1.5 9,10,11 --Magnesium µg/m3 -- -- -- -- -- --Manganese µg/m3 2,500 0.0521 -- 0.051 -- --Mercury µg/m3 1,000 0.313 -- 0.31 -- 1.8Molybdenum µg/m3 -- -- -- -- -- --Nickel µg/m3 5,000 0.0079 -- 0.008 -- 6Palladium µg/m3 -- -- -- -- -- --Phosphorus µg/m3 -- -- -- -- -- --Potassium µg/m3 -- -- -- -- -- --Rubidium µg/m3 -- -- -- -- -- --Selenium µg/m3 500 18.3 -- -- -- --Silicon µg/m3 -- -- -- -- -- --Silver µg/m3 -- -- -- -- -- --Sodium µg/m3 -- -- -- -- -- --Strontium µg/m3 -- -- -- -- -- --Sulfur µg/m3 -- -- -- -- -- --Tin µg/m3 -- -- -- -- -- --Titanium µg/m3 -- -- -- 31 -- --Vanadium µg/m3 -- -- -- -- -- --Yttrium µg/m3 -- -- -- -- -- --Zinc µg/m3 -- -- -- -- -- --Zirconium µg/m3 -- -- -- -- -- --Table Notes:1 Arizona Department of Environmental Quality Acute and Chronic Ambient Air Concentrations, Title 18 Chapter 2 Article 17, December 20072 Arizona Department of Environmental Quality Ambient Air Quality Standards, Title 18 Chapter 2 Article 2, December 20073 EPA Region IX Preliminary Remediation Goals, Ambient Air, October 2004 Wind Speed: 4 EPA National Ambient Air Quality Standards, http://www.epa.gov/air/criteria.html, February 2008 mph5 California Acute Reference Exposure Levels, March 19996 With the exception of arsenic, the averaging time for all listed analytes is one hour. The averaging time for arsenic is four hours.7 The averaging time for the criteria is 24 hours.8 The averaging time for the criteria is the annual arithmetic mean.9 The averaging time for the criteria is the quarterly average.10 Only the PM10 fraction is being measured not the total suspended particulates.11 On May 20, 2008, EPA proposed to revise the National Ambient Air Quality (NAAQS) for lead to within the range of 0.1-0.3 mg/m 3.12 Percent of Total Mass13 Precipitation measurements are recorded manually by a Hayden-Winkelman High School employee; reliability cannot be verified.14 Bold values with bold outline indicate the result exceeds one or more of the comparison criteria. Calm: < 115 Bold italicized values indicate the non-detected result exceeds one or more of the comparison criteria. Wind direction16 * = The result is less than three times the level of uncertainty which is shown in place of the result. toward center17 -- = Not established18 °C = Degrees Celsius19 % = Percent20 J = Estimated value21 mph = miles per hour22 NA = Not Applicable or Not analyzed23 NPR = No precipitation recorded.24 NV = Not valid25 µg/m3 = Micrograms per cubic meter26 PM10 = particulate matter with a diameter less than or equal to 10 microns in size27 R = Rejected28 This table should be considered preliminary and will be revised based on incoming data, final data validation and QA/QC.
EPANationalAmbient
Air QualityStandards4
CaliforniaAcute
ReferenceExposureLevels5 6
Date:Arizona
Hazardous AirPollutants
Ambient AirConcentrations
(Acute)1
ArizonaHazardous Air
PollutantsAmbient Air
Concentrations(Chronic)1
EPARegion IX
PreliminaryRemediation
Goal3
Avg Wind Speed mph):
Avg Ambient Relative Humidity (%):
Avg Wind Direction (degrees):Avg Ambient Temperature (ºC): Arizona
AmbientAir QualityStandards2
Precipitation (inches)13:Result Percent12 Qual Result Percent12 Qual Result Percent12 Qual Result Percent12 Qual Result Percent12 Qual Result Percent12 Qual67.75 NA 54.27 NA 30.53 NA 63.06 NA 34.02 NA R NA
2.5490 4.009 1.7260 3.375 1.0650 3.724 2.2400 3.7760 1.3240 4.1940 R R0.0084 0.0042 * 0.0075 0.0031 * 0.0075 0.0000 * 0.0075 0.0000 * 0.0072 0.0000 * R R0.0364 0.0573 0.0064 0.0124 0.0101 0.0353 0.0042 0.0071 J 0.0099 0.0313 R R0.0549 0.0863 J 0.0203 0.0398 0.0147 0.0469 * 0.0165 0.0225 * 0.0111 0.0352 R R
NA NA NA NA NA NA NA NA NA NA NA NA0.0015 0.0013 * 0.0020 0.0040 0.0018 0.0063 0.0040 0.0067 0.0030 0.0094 R R0.006 0.0031 * 0.0051 0.0004 * 0.0054 0.0018 * 0.0054 0.0003 * 0.0051 0.0000 * R R2.0950 3.295 1.3160 2.573 0.8324 2.912 1.8370 3.0960 0.5970 1.8900 R R0.0453 0.0712 0.0725 0.1417 0.0265 0.0927 0.3372 0.5683 0.0126 0.0000 * R R0.0060 0.0095 0.0023 0.0044 0.0018 0.0041 * 0.0033 0.0056 0.0012 0.0031 * R R0.0555 0.0000 * 0.0237 0.0000 * 0.0186 0.0000 * 0.0282 0.0000 * 0.0171 0.0000 * R R1.4850 2.335 0.2053 0.4016 0.4632 1.620 0.3282 0.5531 0.4286 1.3570 R R0.0021 0.0000 * 0.0015 0.0000 * 0.0015 0.0000 * 0.0018 0.0000 * 0.0018 0.0000 * R R0.0015 0.0000 * 0.0012 0.0000 * 0.0012 0.0000 * 0.0015 0.0000 * 0.0015 0.0000 * R R0.0063 0.0000 * 0.0057 0.0014 * 0.006 0.0035 * 0.006 0.0032 * 0.0057 0.0000 * R R3.0320 4.769 1.2110 2.368 0.9822 3.436 1.5290 2.5770 1.0040 3.1780 R R0.0675 0.0000 * 0.0267 0.0000 * 0.0234 0.0000 * 0.0276 0.0000 * 0.0162 0.0000 * R R0.0885 0.1392 0.0227 0.0444 0.0280 0.0978 0.0122 0.0206 0.0324 0.1026 R R0.5532 0.8701 0.2727 0.5333 0.2758 0.9649 0.6808 1.1470 0.1264 0.4003 R R0.0417 0.0656 0.0199 0.0390 0.0123 0.0430 0.0286 0.0482 0.0162 0.0513 R R0.0024 0.0000 * 0.0021 0.0000 * 0.0024 0.0000 * 0.0024 0.0000 * 0.0024 0.0000 * R R0.0261 0.0410 0.0129 0.0252 0.0105 0.0366 0.0074 0.0125 0.0103 0.0325 R R0.0027 0.0000 * 0.0021 0.0000 * 0.0024 0.0000 * 0.0024 0.0000 * 0.0024 0.0000 * R R0.0054 0.0000 * 0.0048 0.0000 * 0.0048 0.0000 * 0.0051 0.0000 * 0.0048 0.0000 * R R0.0177 0.0000 * 0.0132 0.0000 * 0.0117 0.0000 * 0.0147 0.0000 * 0.0057 0.0000 * R R1.0890 1.713 0.6615 1.294 0.4370 1.529 0.7237 1.2200 0.5311 1.6820 R R0.0015 0.0009 * 0.0016 0.0030 0.0012 0.0028 * 0.0039 0.0066 0.0015 0.0037 * R R0.0051 0.0080 J 0.0012 0.0005 * 0.0012 0.0000 * 0.0015 0.0025 0.0012 0.0019 * R R6.5960 10.37 4.3110 8.433 2.8060 9.816 5.1420 8.6650 3.0900 9.7840 R R0.006 0.0042 * 0.0051 0.0017 * 0.0054 0.0087 * 0.0054 0.0000 * 0.0048 0.0000 * R R
0.2076 0.1003 * 0.1536 0.1084 * 0.1323 0.2380 * 0.546 0.6452 * 0.0681 0.1205 * R R0.0103 0.0161 0.0084 0.0165 0.0048 0.0166 0.0115 0.0194 0.0045 0.0143 R R0.9374 1.474 0.5843 1.143 0.6144 2.150 0.8894 1.4990 0.6408 2.0290 R R0.0078 0.0027 * 0.0072 0.0038 * 0.0069 0.0000 * 0.0072 0.0043 * 0.0069 0.0000 * R R0.3455 0.5435 0.1160 0.2268 0.0994 0.3479 0.1348 0.2273 0.0712 0.2254 R R0.0144 0.0000 * 0.0054 0.0000 * 0.0048 0.0000 * 0.0051 0.0015 * 0.003 0.0000 * R R0.0021 0.0002 * 0.0018 0.0006 * 0.0018 0.0000 * 0.0018 0.0014 * 0.0018 0.0000 * R R0.0691 0.1087 0.0160 0.0312 0.0178 0.0621 0.0215 0.0362 0.0318 0.1008 R R0.0087 0.0136 0.0032 0.0062 0.0025 0.0089 0.0026 0.0044 0.0024 0.0055 * R R
Calm: 0% Calm: 0% Calm:8.33% Calm: 2.08% Calm: 2.08% Calm: 6.25%
04/20/075.9022719.3
03/27/07 04/02/0703/21/076.8413620.310.5
9.2024418.817.7
3.8523521.89.6
04/26/07 05/02/074.10 4.35251 24623.1 25.3
9 8.66.9NPR 3/26 - 0.57 NPR NPR 4/26 - 1.80 NPR
D >= 17
D 1 - 17 -1 - 7
. jit:irst11··--..• ,.__ -·· ··ilY.l~ ---, .,,_ _,.,- ,.----·-i·-···- .• •' ,-•· ,.--- . ·----- -.,
.• --- --·'/ · ··-.,, ] ~ ... \_ ,. __ . . .... ,.... ··-. ,, Jillt
. -- , .,_ . ~.. -- - --- ., • • ~Iii,
i-,:> <~ i \~ ~ ;/:~;•• -_- -_-_,1.,_--_-_ .. -- -. ....... ; _____ _,. .
·.,____ · - . . , ·-., --------------:--------- , • -,.,__ ,.,,.-· , .,, •'
---..... i~1.111t----- ----- ---.,. _____ l£:(ll!l}t- ·-··
- -- -~ii:i"ihl+ ·--- .•• ,._
··-,,_ . '
,.,- · '',- ·· ··-. , . ]Cllri, .. ,--· ----,_ .-:-.,,
~~H _,,.
----------~~l.ll)t--•··
_ .. ,- ··· 1uoinM ····--..• , .. --- , - ~-
_,, , -·· ··--, ·• •• ,_ Jilli
.~ llii,.
im('.:~ i~~ ____ _ ___ ! __ ,.. ,,• '
- ••• S:OLffH--•·
__ •• ,--- ;"orin1 ·-----. ••• • b•
,.--·· , .. ,----- :·----..
---
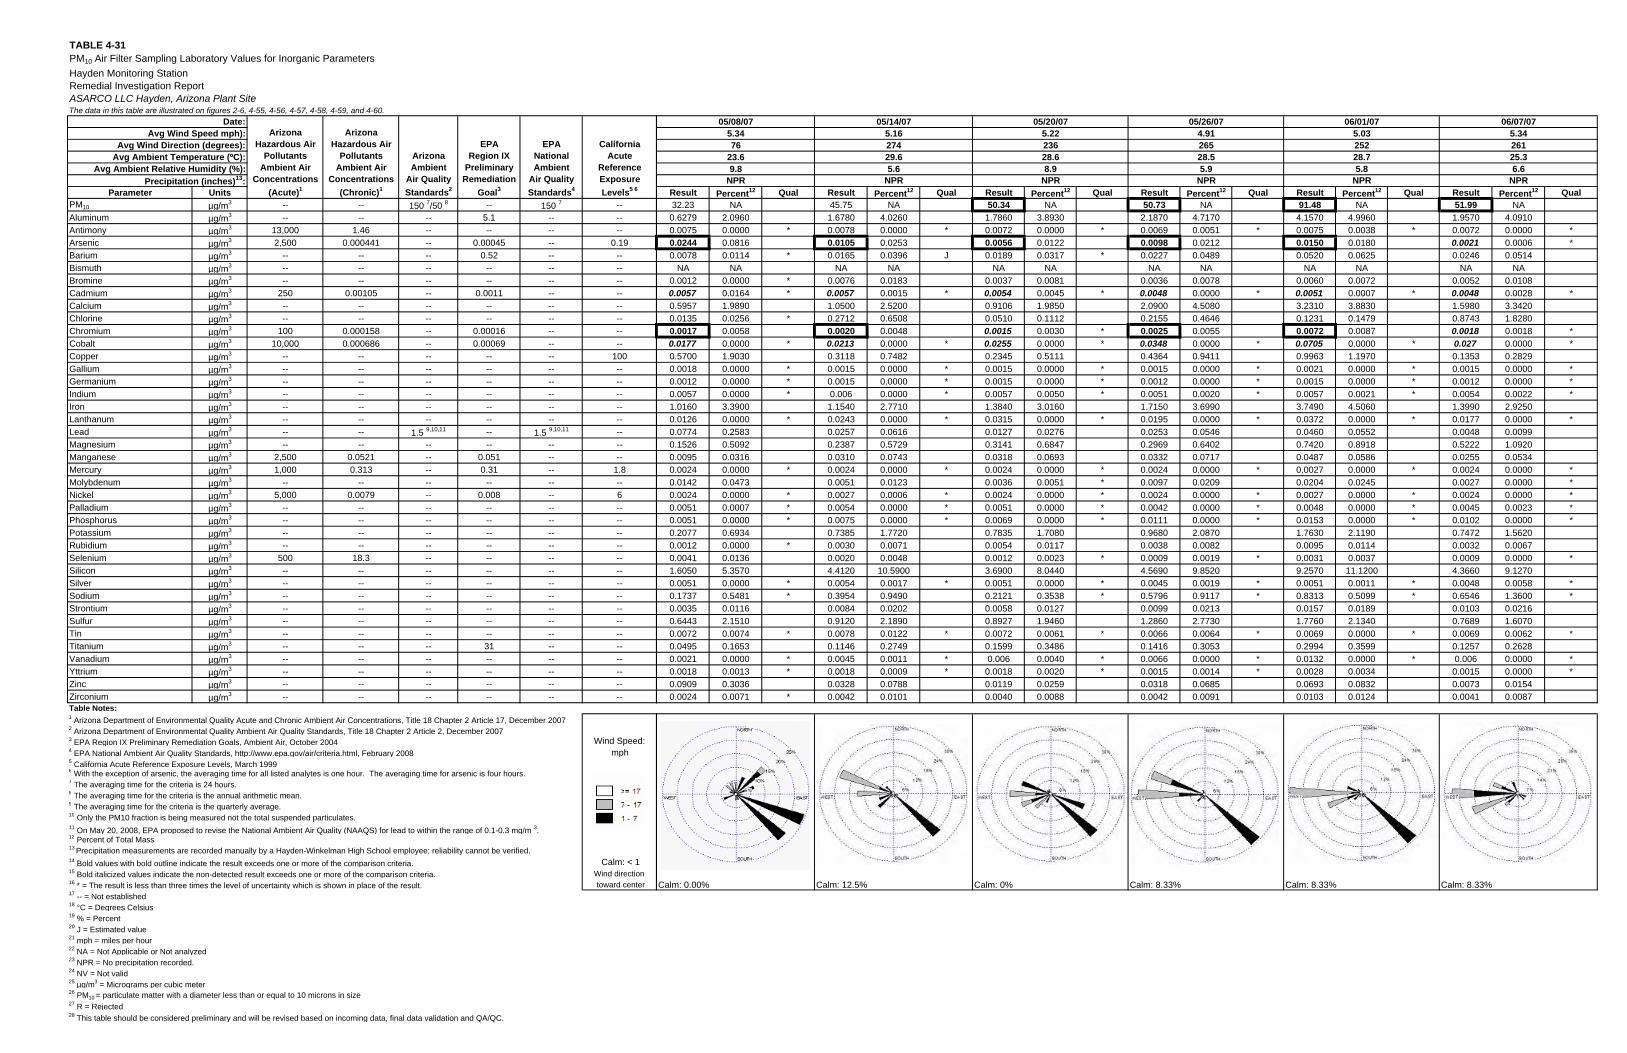
TABLE 4-31PM10 Air Filter Sampling Laboratory Values for Inorganic ParametersHayden Monitoring StationRemedial Investigation ReportASARCO LLC Hayden, Arizona Plant SiteThe data in this table are illustrated on figures 2-6, 4-55, 4-56, 4-57, 4-58, 4-59, and 4-60.
Parameter UnitsPM10 µg/m3 -- -- 150 7/50 8 -- 150 7 --Aluminum µg/m3 -- -- -- 5.1 -- --Antimony µg/m3 13,000 1.46 -- -- -- --Arsenic µg/m3 2,500 0.000441 -- 0.00045 -- 0.19Barium µg/m3 -- -- -- 0.52 -- --Bismuth µg/m3 -- -- -- -- -- --Bromine µg/m3 -- -- -- -- -- --Cadmium µg/m3 250 0.00105 -- 0.0011 -- --Calcium µg/m3 -- -- -- -- -- --Chlorine µg/m3 -- -- -- -- -- --Chromium µg/m3 100 0.000158 -- 0.00016 -- --Cobalt µg/m3 10,000 0.000686 -- 0.00069 -- --Copper µg/m3 -- -- -- -- -- 100Gallium µg/m3 -- -- -- -- -- --Germanium µg/m3 -- -- -- -- -- --Indium µg/m3 -- -- -- -- -- --Iron µg/m3 -- -- -- -- -- --Lanthanum µg/m3 -- -- -- -- -- --Lead µg/m3 -- -- 1.5 9,10,11 -- 1.5 9,10,11 --Magnesium µg/m3 -- -- -- -- -- --Manganese µg/m3 2,500 0.0521 -- 0.051 -- --Mercury µg/m3 1,000 0.313 -- 0.31 -- 1.8Molybdenum µg/m3 -- -- -- -- -- --Nickel µg/m3 5,000 0.0079 -- 0.008 -- 6Palladium µg/m3 -- -- -- -- -- --Phosphorus µg/m3 -- -- -- -- -- --Potassium µg/m3 -- -- -- -- -- --Rubidium µg/m3 -- -- -- -- -- --Selenium µg/m3 500 18.3 -- -- -- --Silicon µg/m3 -- -- -- -- -- --Silver µg/m3 -- -- -- -- -- --Sodium µg/m3 -- -- -- -- -- --Strontium µg/m3 -- -- -- -- -- --Sulfur µg/m3 -- -- -- -- -- --Tin µg/m3 -- -- -- -- -- --Titanium µg/m3 -- -- -- 31 -- --Vanadium µg/m3 -- -- -- -- -- --Yttrium µg/m3 -- -- -- -- -- --Zinc µg/m3 -- -- -- -- -- --Zirconium µg/m3 -- -- -- -- -- --Table Notes:1 Arizona Department of Environmental Quality Acute and Chronic Ambient Air Concentrations, Title 18 Chapter 2 Article 17, December 20072 Arizona Department of Environmental Quality Ambient Air Quality Standards, Title 18 Chapter 2 Article 2, December 20073 EPA Region IX Preliminary Remediation Goals, Ambient Air, October 2004 Wind Speed: 4 EPA National Ambient Air Quality Standards, http://www.epa.gov/air/criteria.html, February 2008 mph5 California Acute Reference Exposure Levels, March 19996 With the exception of arsenic, the averaging time for all listed analytes is one hour. The averaging time for arsenic is four hours.7 The averaging time for the criteria is 24 hours.8 The averaging time for the criteria is the annual arithmetic mean.9 The averaging time for the criteria is the quarterly average.10 Only the PM10 fraction is being measured not the total suspended particulates.11 On May 20, 2008, EPA proposed to revise the National Ambient Air Quality (NAAQS) for lead to within the range of 0.1-0.3 mg/m 3.12 Percent of Total Mass13 Precipitation measurements are recorded manually by a Hayden-Winkelman High School employee; reliability cannot be verified.14 Bold values with bold outline indicate the result exceeds one or more of the comparison criteria. Calm: < 115 Bold italicized values indicate the non-detected result exceeds one or more of the comparison criteria. Wind direction16 * = The result is less than three times the level of uncertainty which is shown in place of the result. toward center17 -- = Not established18 °C = Degrees Celsius19 % = Percent20 J = Estimated value21 mph = miles per hour22 NA = Not Applicable or Not analyzed23 NPR = No precipitation recorded.24 NV = Not valid25 µg/m3 = Micrograms per cubic meter26 PM10 = particulate matter with a diameter less than or equal to 10 microns in size27 R = Rejected28 This table should be considered preliminary and will be revised based on incoming data, final data validation and QA/QC.
EPANationalAmbient
Air QualityStandards4
CaliforniaAcute
ReferenceExposureLevels5 6
Date:Arizona
Hazardous AirPollutants
Ambient AirConcentrations
(Acute)1
ArizonaHazardous Air
PollutantsAmbient Air
Concentrations(Chronic)1
EPARegion IX
PreliminaryRemediation
Goal3
Avg Wind Speed mph):
Avg Ambient Relative Humidity (%):
Avg Wind Direction (degrees):Avg Ambient Temperature (ºC): Arizona
AmbientAir QualityStandards2
Precipitation (inches)13:Result Percent12 Qual Result Percent12 Qual Result Percent12 Qual Result Percent12 Qual Result Percent12 Qual Result Percent12 Qual32.23 NA 45.75 NA 50.34 NA 50.73 NA 91.48 NA 51.99 NA0.6279 2.0960 1.6780 4.0260 1.7860 3.8930 2.1870 4.7170 4.1570 4.9960 1.9570 4.09100.0075 0.0000 * 0.0078 0.0000 * 0.0072 0.0000 * 0.0069 0.0051 * 0.0075 0.0038 * 0.0072 0.0000 *0.0244 0.0816 0.0105 0.0253 0.0056 0.0122 0.0098 0.0212 0.0150 0.0180 0.0021 0.0006 *0.0078 0.0114 * 0.0165 0.0396 J 0.0189 0.0317 * 0.0227 0.0489 0.0520 0.0625 0.0246 0.0514
NA NA NA NA NA NA NA NA NA NA NA NA0.0012 0.0000 * 0.0076 0.0183 0.0037 0.0081 0.0036 0.0078 0.0060 0.0072 0.0052 0.01080.0057 0.0164 * 0.0057 0.0015 * 0.0054 0.0045 * 0.0048 0.0000 * 0.0051 0.0007 * 0.0048 0.0028 *0.5957 1.9890 1.0500 2.5200 0.9106 1.9850 2.0900 4.5080 3.2310 3.8830 1.5980 3.34200.0135 0.0256 * 0.2712 0.6508 0.0510 0.1112 0.2155 0.4646 0.1231 0.1479 0.8743 1.82800.0017 0.0058 0.0020 0.0048 0.0015 0.0030 * 0.0025 0.0055 0.0072 0.0087 0.0018 0.0018 *0.0177 0.0000 * 0.0213 0.0000 * 0.0255 0.0000 * 0.0348 0.0000 * 0.0705 0.0000 * 0.027 0.0000 *0.5700 1.9030 0.3118 0.7482 0.2345 0.5111 0.4364 0.9411 0.9963 1.1970 0.1353 0.28290.0018 0.0000 * 0.0015 0.0000 * 0.0015 0.0000 * 0.0015 0.0000 * 0.0021 0.0000 * 0.0015 0.0000 *0.0012 0.0000 * 0.0015 0.0000 * 0.0015 0.0000 * 0.0012 0.0000 * 0.0015 0.0000 * 0.0012 0.0000 *0.0057 0.0000 * 0.006 0.0000 * 0.0057 0.0050 * 0.0051 0.0020 * 0.0057 0.0021 * 0.0054 0.0022 *1.0160 3.3900 1.1540 2.7710 1.3840 3.0160 1.7150 3.6990 3.7490 4.5060 1.3990 2.92500.0126 0.0000 * 0.0243 0.0000 * 0.0315 0.0000 * 0.0195 0.0000 * 0.0372 0.0000 * 0.0177 0.0000 *0.0774 0.2583 0.0257 0.0616 0.0127 0.0276 0.0253 0.0546 0.0460 0.0552 0.0048 0.00990.1526 0.5092 0.2387 0.5729 0.3141 0.6847 0.2969 0.6402 0.7420 0.8918 0.5222 1.09200.0095 0.0316 0.0310 0.0743 0.0318 0.0693 0.0332 0.0717 0.0487 0.0586 0.0255 0.05340.0024 0.0000 * 0.0024 0.0000 * 0.0024 0.0000 * 0.0024 0.0000 * 0.0027 0.0000 * 0.0024 0.0000 *0.0142 0.0473 0.0051 0.0123 0.0036 0.0051 * 0.0097 0.0209 0.0204 0.0245 0.0027 0.0000 *0.0024 0.0000 * 0.0027 0.0006 * 0.0024 0.0000 * 0.0024 0.0000 * 0.0027 0.0000 * 0.0024 0.0000 *0.0051 0.0007 * 0.0054 0.0000 * 0.0051 0.0000 * 0.0042 0.0000 * 0.0048 0.0000 * 0.0045 0.0023 *0.0051 0.0000 * 0.0075 0.0000 * 0.0069 0.0000 * 0.0111 0.0000 * 0.0153 0.0000 * 0.0102 0.0000 *0.2077 0.6934 0.7385 1.7720 0.7835 1.7080 0.9680 2.0870 1.7630 2.1190 0.7472 1.56200.0012 0.0000 * 0.0030 0.0071 0.0054 0.0117 0.0038 0.0082 0.0095 0.0114 0.0032 0.00670.0041 0.0136 0.0020 0.0048 0.0012 0.0023 * 0.0009 0.0019 * 0.0031 0.0037 0.0009 0.0000 *1.6050 5.3570 4.4120 10.5900 3.6900 8.0440 4.5690 9.8520 9.2570 11.1200 4.3660 9.12700.0051 0.0000 * 0.0054 0.0017 * 0.0051 0.0000 * 0.0045 0.0019 * 0.0051 0.0011 * 0.0048 0.0058 *0.1737 0.5481 * 0.3954 0.9490 0.2121 0.3538 * 0.5796 0.9117 * 0.8313 0.5099 * 0.6546 1.3600 *0.0035 0.0116 0.0084 0.0202 0.0058 0.0127 0.0099 0.0213 0.0157 0.0189 0.0103 0.02160.6443 2.1510 0.9120 2.1890 0.8927 1.9460 1.2860 2.7730 1.7760 2.1340 0.7689 1.60700.0072 0.0074 * 0.0078 0.0122 * 0.0072 0.0061 * 0.0066 0.0064 * 0.0069 0.0000 * 0.0069 0.0062 *0.0495 0.1653 0.1146 0.2749 0.1599 0.3486 0.1416 0.3053 0.2994 0.3599 0.1257 0.26280.0021 0.0000 * 0.0045 0.0011 * 0.006 0.0040 * 0.0066 0.0000 * 0.0132 0.0000 * 0.006 0.0000 *0.0018 0.0013 * 0.0018 0.0009 * 0.0018 0.0020 * 0.0015 0.0014 * 0.0028 0.0034 0.0015 0.0000 *0.0909 0.3036 0.0328 0.0788 0.0119 0.0259 0.0318 0.0685 0.0693 0.0832 0.0073 0.01540.0024 0.0071 * 0.0042 0.0101 0.0040 0.0088 0.0042 0.0091 0.0103 0.0124 0.0041 0.0087
Calm: 0.00% Calm: 12.5% Calm: 0% Calm: 8.33% Calm: 8.33% Calm: 8.33%
05/08/075.3476
23.69.8
NPR
05/14/07 05/20/07 05/26/07 06/01/07 06/07/075.16 5.22 4.91 5.03 5.34274 236 265 252 26129.6 28.6 28.5 28.7 25.3
6.65.6 8.9 5.9 5.8NPR NPR NPR NPR NPR
D >= 17
D 1 - 17 -1 - 7
... ,. - -- FOOH" .,_ -··,. ., ... , -· .. ···- ·• ,,,
' -. / . , / · ···•, , :.is%',,,
, .. ,· ' ~
~\•::(~:~;:~:--? , , • '
'···--, ...... t~ --,·
'•
,, ·-
__ •• , ---- :i6:IM'N"-., ··-._ .--·· --- · 1wo·1IT11·-, , ··-.
··--. ,--~ __ j __ ~--·----. ', -~"".
··-,, ·• .• ,_ !i"'
--.,. -~"-: '' .. ,,•'"",
/
I"\
'~·: ---<---- ;£,s,&Ti
, ..
1::i\,~~~f ~{::' ···----:--- •· ·
--., ..•. :l;Qi.,ITII -'"
, ,• ' ·-., ······+·"···· _,• ·,.,
·---, -- ..• 'l:"L!Tl! ,.
·. ,
,.---- :····- ··---. •••• ,, !I-.,
-- -,_ .-:Iii,,
. ·- ~!i:('Llfl1--•··
__ ,,.,
---····1M)RTH . , , _
/ ,.-- -···: ···--
_,,•
........ -····· ~--.,
. , , _
·-,,, · · ·• •• __ _ Jillt
·~-·· -= .. \.,, ,i-i
~~====~~~-A .. : : !E,i.~;
·•, --,.,_ -+---·
··· --~~Lll14-·•·
j
_,.,,•'
_ •• ,--- :1£1irnl"••- -- -
.---- ' ··-,, , . ,/· ··-. __ li"'I,,,,,
,•·' '""'·
~~ ~}~:~~):il ·-. ,• ---,. ,. ___ J~:·:_,.-,/
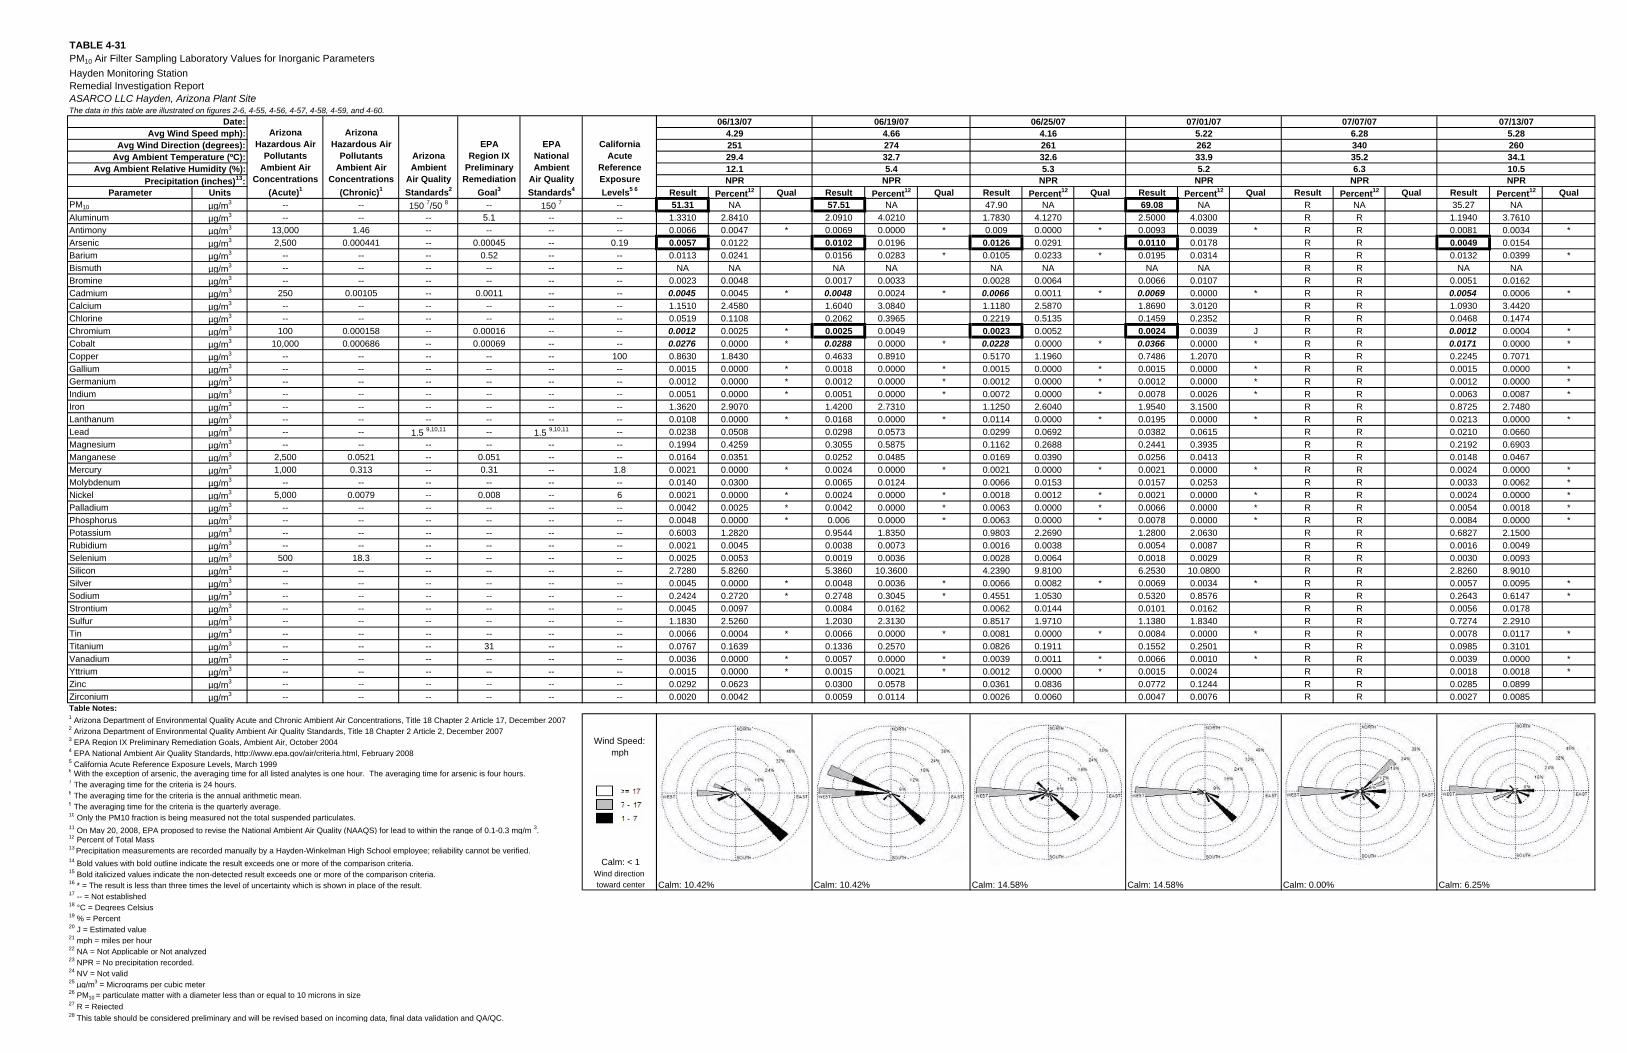
TABLE 4-31PM10 Air Filter Sampling Laboratory Values for Inorganic ParametersHayden Monitoring StationRemedial Investigation ReportASARCO LLC Hayden, Arizona Plant SiteThe data in this table are illustrated on figures 2-6, 4-55, 4-56, 4-57, 4-58, 4-59, and 4-60.
Parameter UnitsPM10 µg/m3 -- -- 150 7/50 8 -- 150 7 --Aluminum µg/m3 -- -- -- 5.1 -- --Antimony µg/m3 13,000 1.46 -- -- -- --Arsenic µg/m3 2,500 0.000441 -- 0.00045 -- 0.19Barium µg/m3 -- -- -- 0.52 -- --Bismuth µg/m3 -- -- -- -- -- --Bromine µg/m3 -- -- -- -- -- --Cadmium µg/m3 250 0.00105 -- 0.0011 -- --Calcium µg/m3 -- -- -- -- -- --Chlorine µg/m3 -- -- -- -- -- --Chromium µg/m3 100 0.000158 -- 0.00016 -- --Cobalt µg/m3 10,000 0.000686 -- 0.00069 -- --Copper µg/m3 -- -- -- -- -- 100Gallium µg/m3 -- -- -- -- -- --Germanium µg/m3 -- -- -- -- -- --Indium µg/m3 -- -- -- -- -- --Iron µg/m3 -- -- -- -- -- --Lanthanum µg/m3 -- -- -- -- -- --Lead µg/m3 -- -- 1.5 9,10,11 -- 1.5 9,10,11 --Magnesium µg/m3 -- -- -- -- -- --Manganese µg/m3 2,500 0.0521 -- 0.051 -- --Mercury µg/m3 1,000 0.313 -- 0.31 -- 1.8Molybdenum µg/m3 -- -- -- -- -- --Nickel µg/m3 5,000 0.0079 -- 0.008 -- 6Palladium µg/m3 -- -- -- -- -- --Phosphorus µg/m3 -- -- -- -- -- --Potassium µg/m3 -- -- -- -- -- --Rubidium µg/m3 -- -- -- -- -- --Selenium µg/m3 500 18.3 -- -- -- --Silicon µg/m3 -- -- -- -- -- --Silver µg/m3 -- -- -- -- -- --Sodium µg/m3 -- -- -- -- -- --Strontium µg/m3 -- -- -- -- -- --Sulfur µg/m3 -- -- -- -- -- --Tin µg/m3 -- -- -- -- -- --Titanium µg/m3 -- -- -- 31 -- --Vanadium µg/m3 -- -- -- -- -- --Yttrium µg/m3 -- -- -- -- -- --Zinc µg/m3 -- -- -- -- -- --Zirconium µg/m3 -- -- -- -- -- --Table Notes:1 Arizona Department of Environmental Quality Acute and Chronic Ambient Air Concentrations, Title 18 Chapter 2 Article 17, December 20072 Arizona Department of Environmental Quality Ambient Air Quality Standards, Title 18 Chapter 2 Article 2, December 20073 EPA Region IX Preliminary Remediation Goals, Ambient Air, October 2004 Wind Speed: 4 EPA National Ambient Air Quality Standards, http://www.epa.gov/air/criteria.html, February 2008 mph5 California Acute Reference Exposure Levels, March 19996 With the exception of arsenic, the averaging time for all listed analytes is one hour. The averaging time for arsenic is four hours.7 The averaging time for the criteria is 24 hours.8 The averaging time for the criteria is the annual arithmetic mean.9 The averaging time for the criteria is the quarterly average.10 Only the PM10 fraction is being measured not the total suspended particulates.11 On May 20, 2008, EPA proposed to revise the National Ambient Air Quality (NAAQS) for lead to within the range of 0.1-0.3 mg/m 3.12 Percent of Total Mass13 Precipitation measurements are recorded manually by a Hayden-Winkelman High School employee; reliability cannot be verified.14 Bold values with bold outline indicate the result exceeds one or more of the comparison criteria. Calm: < 115 Bold italicized values indicate the non-detected result exceeds one or more of the comparison criteria. Wind direction16 * = The result is less than three times the level of uncertainty which is shown in place of the result. toward center17 -- = Not established18 °C = Degrees Celsius19 % = Percent20 J = Estimated value21 mph = miles per hour22 NA = Not Applicable or Not analyzed23 NPR = No precipitation recorded.24 NV = Not valid25 µg/m3 = Micrograms per cubic meter26 PM10 = particulate matter with a diameter less than or equal to 10 microns in size27 R = Rejected28 This table should be considered preliminary and will be revised based on incoming data, final data validation and QA/QC.
EPANationalAmbient
Air QualityStandards4
CaliforniaAcute
ReferenceExposureLevels5 6
Date:Arizona
Hazardous AirPollutants
Ambient AirConcentrations
(Acute)1
ArizonaHazardous Air
PollutantsAmbient Air
Concentrations(Chronic)1
EPARegion IX
PreliminaryRemediation
Goal3
Avg Wind Speed mph):
Avg Ambient Relative Humidity (%):
Avg Wind Direction (degrees):Avg Ambient Temperature (ºC): Arizona
AmbientAir QualityStandards2
Precipitation (inches)13:Result Percent12 Qual Result Percent12 Qual Result Percent12 Qual Result Percent12 Qual Result Percent12 Qual Result Percent12 Qual51.31 NA 57.51 NA 47.90 NA 69.08 NA R NA 35.27 NA
1.3310 2.8410 2.0910 4.0210 1.7830 4.1270 2.5000 4.0300 R R 1.1940 3.76100.0066 0.0047 * 0.0069 0.0000 * 0.009 0.0000 * 0.0093 0.0039 * R R 0.0081 0.0034 *0.0057 0.0122 0.0102 0.0196 0.0126 0.0291 0.0110 0.0178 R R 0.0049 0.01540.0113 0.0241 0.0156 0.0283 * 0.0105 0.0233 * 0.0195 0.0314 R R 0.0132 0.0399 *
NA NA NA NA NA NA NA NA R R NA NA0.0023 0.0048 0.0017 0.0033 0.0028 0.0064 0.0066 0.0107 R R 0.0051 0.01620.0045 0.0045 * 0.0048 0.0024 * 0.0066 0.0011 * 0.0069 0.0000 * R R 0.0054 0.0006 *1.1510 2.4580 1.6040 3.0840 1.1180 2.5870 1.8690 3.0120 R R 1.0930 3.44200.0519 0.1108 0.2062 0.3965 0.2219 0.5135 0.1459 0.2352 R R 0.0468 0.14740.0012 0.0025 * 0.0025 0.0049 0.0023 0.0052 0.0024 0.0039 J R R 0.0012 0.0004 *0.0276 0.0000 * 0.0288 0.0000 * 0.0228 0.0000 * 0.0366 0.0000 * R R 0.0171 0.0000 *0.8630 1.8430 0.4633 0.8910 0.5170 1.1960 0.7486 1.2070 R R 0.2245 0.70710.0015 0.0000 * 0.0018 0.0000 * 0.0015 0.0000 * 0.0015 0.0000 * R R 0.0015 0.0000 *0.0012 0.0000 * 0.0012 0.0000 * 0.0012 0.0000 * 0.0012 0.0000 * R R 0.0012 0.0000 *0.0051 0.0000 * 0.0051 0.0000 * 0.0072 0.0000 * 0.0078 0.0026 * R R 0.0063 0.0087 *1.3620 2.9070 1.4200 2.7310 1.1250 2.6040 1.9540 3.1500 R R 0.8725 2.74800.0108 0.0000 * 0.0168 0.0000 * 0.0114 0.0000 * 0.0195 0.0000 * R R 0.0213 0.0000 *0.0238 0.0508 0.0298 0.0573 0.0299 0.0692 0.0382 0.0615 R R 0.0210 0.06600.1994 0.4259 0.3055 0.5875 0.1162 0.2688 0.2441 0.3935 R R 0.2192 0.69030.0164 0.0351 0.0252 0.0485 0.0169 0.0390 0.0256 0.0413 R R 0.0148 0.04670.0021 0.0000 * 0.0024 0.0000 * 0.0021 0.0000 * 0.0021 0.0000 * R R 0.0024 0.0000 *0.0140 0.0300 0.0065 0.0124 0.0066 0.0153 0.0157 0.0253 R R 0.0033 0.0062 *0.0021 0.0000 * 0.0024 0.0000 * 0.0018 0.0012 * 0.0021 0.0000 * R R 0.0024 0.0000 *0.0042 0.0025 * 0.0042 0.0000 * 0.0063 0.0000 * 0.0066 0.0000 * R R 0.0054 0.0018 *0.0048 0.0000 * 0.006 0.0000 * 0.0063 0.0000 * 0.0078 0.0000 * R R 0.0084 0.0000 *0.6003 1.2820 0.9544 1.8350 0.9803 2.2690 1.2800 2.0630 R R 0.6827 2.15000.0021 0.0045 0.0038 0.0073 0.0016 0.0038 0.0054 0.0087 R R 0.0016 0.00490.0025 0.0053 0.0019 0.0036 0.0028 0.0064 0.0018 0.0029 R R 0.0030 0.00932.7280 5.8260 5.3860 10.3600 4.2390 9.8100 6.2530 10.0800 R R 2.8260 8.90100.0045 0.0000 * 0.0048 0.0036 * 0.0066 0.0082 * 0.0069 0.0034 * R R 0.0057 0.0095 *0.2424 0.2720 * 0.2748 0.3045 * 0.4551 1.0530 0.5320 0.8576 R R 0.2643 0.6147 *0.0045 0.0097 0.0084 0.0162 0.0062 0.0144 0.0101 0.0162 R R 0.0056 0.01781.1830 2.5260 1.2030 2.3130 0.8517 1.9710 1.1380 1.8340 R R 0.7274 2.29100.0066 0.0004 * 0.0066 0.0000 * 0.0081 0.0000 * 0.0084 0.0000 * R R 0.0078 0.0117 *0.0767 0.1639 0.1336 0.2570 0.0826 0.1911 0.1552 0.2501 R R 0.0985 0.31010.0036 0.0000 * 0.0057 0.0000 * 0.0039 0.0011 * 0.0066 0.0010 * R R 0.0039 0.0000 *0.0015 0.0000 * 0.0015 0.0021 * 0.0012 0.0000 * 0.0015 0.0024 R R 0.0018 0.0018 *0.0292 0.0623 0.0300 0.0578 0.0361 0.0836 0.0772 0.1244 R R 0.0285 0.08990.0020 0.0042 0.0059 0.0114 0.0026 0.0060 0.0047 0.0076 R R 0.0027 0.0085
Calm: 10.42% Calm: 10.42% Calm: 14.58% Calm: 14.58% Calm: 0.00% Calm: 6.25%
5.3 5.2 6.3 10.532.6 33.9 35.2 34.1261 262 340 2604.16 5.22 6.28 5.28
06/25/07 07/01/07 07/07/07 07/13/07
12.1
06/19/074.6627432.75.4
06/13/074.2925129.4
NPR NPRNPR NPR NPR NPR
D >= 17
D 1 - 17 -1 - 7
.•• ,.----··JIIOM'H '·,, -.,,_
·• , ,,_
· ••••,, U"'i-',,,
,/~ ,.· ····.,,·-- ! ·-._--\,''\\,,, . / ~ ... .-· ~--., ,'~ \ . ' ' • E<"i : : '"" E8T , • , ";° -- • - .' - ··:E,o,eT:
\>\,\:f :: / '
,.-- ·· ·r·· ·-·
--~f!OL1111 --··
•• ,---- :l!Oi:rni·-, ___ • . , ··-,,_
(#;:~ -C)~1 '••,., ••••••••• , ,!..od"p• _,.,-
----~~IJTl1-----
:HOrrrtt··, ,._•, ,
: --. ··-,,_ , . ,,' •••.,, dliri
',..,.: · , •• , · !~ ...... ,,
__ ,, ---. ,, ':J·. ,.._,,, . r . ..----,. 1£.,.;
~ .. :~ ))?") '•
___ , ., _____ ~----··
------. .
-~~ i.mt---··
,.,,•'
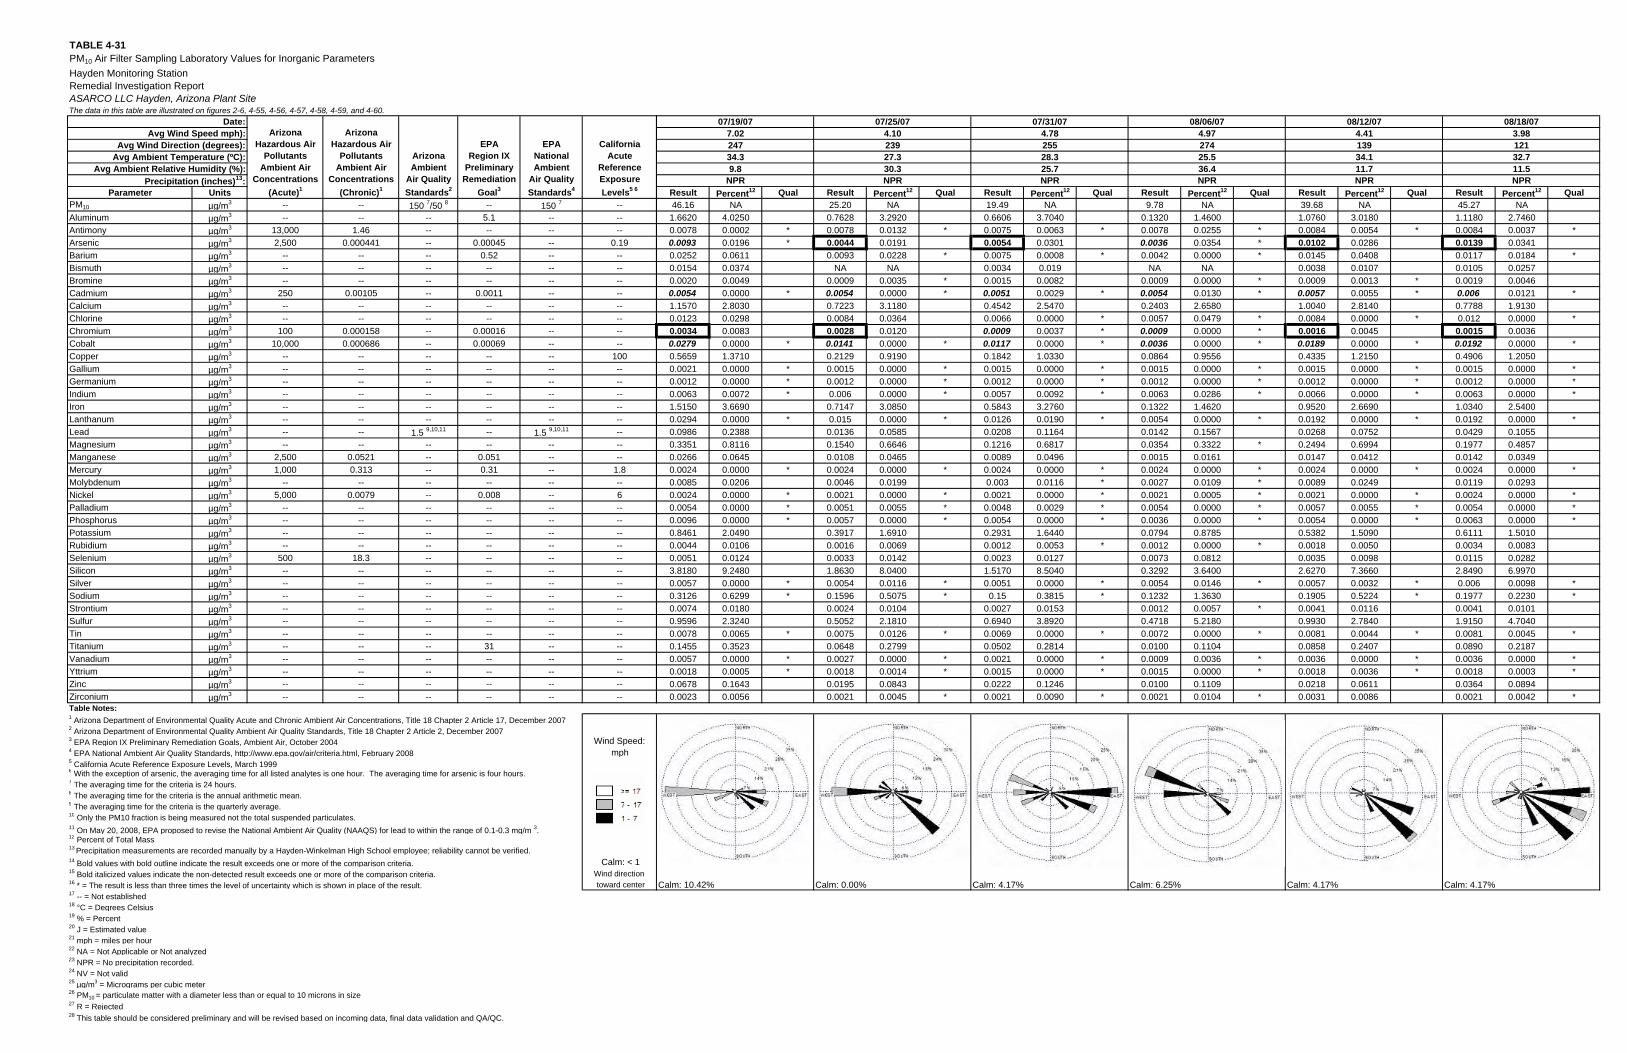
TABLE 4-31PM10 Air Filter Sampling Laboratory Values for Inorganic ParametersHayden Monitoring StationRemedial Investigation ReportASARCO LLC Hayden, Arizona Plant SiteThe data in this table are illustrated on figures 2-6, 4-55, 4-56, 4-57, 4-58, 4-59, and 4-60.
Parameter UnitsPM10 µg/m3 -- -- 150 7/50 8 -- 150 7 --Aluminum µg/m3 -- -- -- 5.1 -- --Antimony µg/m3 13,000 1.46 -- -- -- --Arsenic µg/m3 2,500 0.000441 -- 0.00045 -- 0.19Barium µg/m3 -- -- -- 0.52 -- --Bismuth µg/m3 -- -- -- -- -- --Bromine µg/m3 -- -- -- -- -- --Cadmium µg/m3 250 0.00105 -- 0.0011 -- --Calcium µg/m3 -- -- -- -- -- --Chlorine µg/m3 -- -- -- -- -- --Chromium µg/m3 100 0.000158 -- 0.00016 -- --Cobalt µg/m3 10,000 0.000686 -- 0.00069 -- --Copper µg/m3 -- -- -- -- -- 100Gallium µg/m3 -- -- -- -- -- --Germanium µg/m3 -- -- -- -- -- --Indium µg/m3 -- -- -- -- -- --Iron µg/m3 -- -- -- -- -- --Lanthanum µg/m3 -- -- -- -- -- --Lead µg/m3 -- -- 1.5 9,10,11 -- 1.5 9,10,11 --Magnesium µg/m3 -- -- -- -- -- --Manganese µg/m3 2,500 0.0521 -- 0.051 -- --Mercury µg/m3 1,000 0.313 -- 0.31 -- 1.8Molybdenum µg/m3 -- -- -- -- -- --Nickel µg/m3 5,000 0.0079 -- 0.008 -- 6Palladium µg/m3 -- -- -- -- -- --Phosphorus µg/m3 -- -- -- -- -- --Potassium µg/m3 -- -- -- -- -- --Rubidium µg/m3 -- -- -- -- -- --Selenium µg/m3 500 18.3 -- -- -- --Silicon µg/m3 -- -- -- -- -- --Silver µg/m3 -- -- -- -- -- --Sodium µg/m3 -- -- -- -- -- --Strontium µg/m3 -- -- -- -- -- --Sulfur µg/m3 -- -- -- -- -- --Tin µg/m3 -- -- -- -- -- --Titanium µg/m3 -- -- -- 31 -- --Vanadium µg/m3 -- -- -- -- -- --Yttrium µg/m3 -- -- -- -- -- --Zinc µg/m3 -- -- -- -- -- --Zirconium µg/m3 -- -- -- -- -- --Table Notes:1 Arizona Department of Environmental Quality Acute and Chronic Ambient Air Concentrations, Title 18 Chapter 2 Article 17, December 20072 Arizona Department of Environmental Quality Ambient Air Quality Standards, Title 18 Chapter 2 Article 2, December 20073 EPA Region IX Preliminary Remediation Goals, Ambient Air, October 2004 Wind Speed: 4 EPA National Ambient Air Quality Standards, http://www.epa.gov/air/criteria.html, February 2008 mph5 California Acute Reference Exposure Levels, March 19996 With the exception of arsenic, the averaging time for all listed analytes is one hour. The averaging time for arsenic is four hours.7 The averaging time for the criteria is 24 hours.8 The averaging time for the criteria is the annual arithmetic mean.9 The averaging time for the criteria is the quarterly average.10 Only the PM10 fraction is being measured not the total suspended particulates.11 On May 20, 2008, EPA proposed to revise the National Ambient Air Quality (NAAQS) for lead to within the range of 0.1-0.3 mg/m 3.12 Percent of Total Mass13 Precipitation measurements are recorded manually by a Hayden-Winkelman High School employee; reliability cannot be verified.14 Bold values with bold outline indicate the result exceeds one or more of the comparison criteria. Calm: < 115 Bold italicized values indicate the non-detected result exceeds one or more of the comparison criteria. Wind direction16 * = The result is less than three times the level of uncertainty which is shown in place of the result. toward center17 -- = Not established18 °C = Degrees Celsius19 % = Percent20 J = Estimated value21 mph = miles per hour22 NA = Not Applicable or Not analyzed23 NPR = No precipitation recorded.24 NV = Not valid25 µg/m3 = Micrograms per cubic meter26 PM10 = particulate matter with a diameter less than or equal to 10 microns in size27 R = Rejected28 This table should be considered preliminary and will be revised based on incoming data, final data validation and QA/QC.
EPANationalAmbient
Air QualityStandards4
CaliforniaAcute
ReferenceExposureLevels5 6
Date:Arizona
Hazardous AirPollutants
Ambient AirConcentrations
(Acute)1
ArizonaHazardous Air
PollutantsAmbient Air
Concentrations(Chronic)1
EPARegion IX
PreliminaryRemediation
Goal3
Avg Wind Speed mph):
Avg Ambient Relative Humidity (%):
Avg Wind Direction (degrees):Avg Ambient Temperature (ºC): Arizona
AmbientAir QualityStandards2
Precipitation (inches)13:Result Percent12 Qual Result Percent12 Qual Result Percent12 Qual Result Percent12 Qual Result Percent12 Qual Result Percent12 Qual46.16 NA 25.20 NA 19.49 NA 9.78 NA 39.68 NA 45.27 NA1.6620 4.0250 0.7628 3.2920 0.6606 3.7040 0.1320 1.4600 1.0760 3.0180 1.1180 2.74600.0078 0.0002 * 0.0078 0.0132 * 0.0075 0.0063 * 0.0078 0.0255 * 0.0084 0.0054 * 0.0084 0.0037 *0.0093 0.0196 * 0.0044 0.0191 0.0054 0.0301 0.0036 0.0354 * 0.0102 0.0286 0.0139 0.03410.0252 0.0611 0.0093 0.0228 * 0.0075 0.0008 * 0.0042 0.0000 * 0.0145 0.0408 0.0117 0.0184 *0.0154 0.0374 NA NA 0.0034 0.019 NA NA 0.0038 0.0107 0.0105 0.02570.0020 0.0049 0.0009 0.0035 * 0.0015 0.0082 0.0009 0.0000 * 0.0009 0.0013 * 0.0019 0.00460.0054 0.0000 * 0.0054 0.0000 * 0.0051 0.0029 * 0.0054 0.0130 * 0.0057 0.0055 * 0.006 0.0121 *1.1570 2.8030 0.7223 3.1180 0.4542 2.5470 0.2403 2.6580 1.0040 2.8140 0.7788 1.91300.0123 0.0298 0.0084 0.0364 0.0066 0.0000 * 0.0057 0.0479 * 0.0084 0.0000 * 0.012 0.0000 *0.0034 0.0083 0.0028 0.0120 0.0009 0.0037 * 0.0009 0.0000 * 0.0016 0.0045 0.0015 0.00360.0279 0.0000 * 0.0141 0.0000 * 0.0117 0.0000 * 0.0036 0.0000 * 0.0189 0.0000 * 0.0192 0.0000 *0.5659 1.3710 0.2129 0.9190 0.1842 1.0330 0.0864 0.9556 0.4335 1.2150 0.4906 1.20500.0021 0.0000 * 0.0015 0.0000 * 0.0015 0.0000 * 0.0015 0.0000 * 0.0015 0.0000 * 0.0015 0.0000 *0.0012 0.0000 * 0.0012 0.0000 * 0.0012 0.0000 * 0.0012 0.0000 * 0.0012 0.0000 * 0.0012 0.0000 *0.0063 0.0072 * 0.006 0.0000 * 0.0057 0.0092 * 0.0063 0.0286 * 0.0066 0.0000 * 0.0063 0.0000 *1.5150 3.6690 0.7147 3.0850 0.5843 3.2760 0.1322 1.4620 0.9520 2.6690 1.0340 2.54000.0294 0.0000 * 0.015 0.0000 * 0.0126 0.0190 * 0.0054 0.0000 * 0.0192 0.0000 * 0.0192 0.0000 *0.0986 0.2388 0.0136 0.0585 0.0208 0.1164 0.0142 0.1567 0.0268 0.0752 0.0429 0.10550.3351 0.8116 0.1540 0.6646 0.1216 0.6817 0.0354 0.3322 * 0.2494 0.6994 0.1977 0.48570.0266 0.0645 0.0108 0.0465 0.0089 0.0496 0.0015 0.0161 0.0147 0.0412 0.0142 0.03490.0024 0.0000 * 0.0024 0.0000 * 0.0024 0.0000 * 0.0024 0.0000 * 0.0024 0.0000 * 0.0024 0.0000 *0.0085 0.0206 0.0046 0.0199 0.003 0.0116 * 0.0027 0.0109 * 0.0089 0.0249 0.0119 0.02930.0024 0.0000 * 0.0021 0.0000 * 0.0021 0.0000 * 0.0021 0.0005 * 0.0021 0.0000 * 0.0024 0.0000 *0.0054 0.0000 * 0.0051 0.0055 * 0.0048 0.0029 * 0.0054 0.0000 * 0.0057 0.0055 * 0.0054 0.0000 *0.0096 0.0000 * 0.0057 0.0000 * 0.0054 0.0000 * 0.0036 0.0000 * 0.0054 0.0000 * 0.0063 0.0000 *0.8461 2.0490 0.3917 1.6910 0.2931 1.6440 0.0794 0.8785 0.5382 1.5090 0.6111 1.50100.0044 0.0106 0.0016 0.0069 0.0012 0.0053 * 0.0012 0.0000 * 0.0018 0.0050 0.0034 0.00830.0051 0.0124 0.0033 0.0142 0.0023 0.0127 0.0073 0.0812 0.0035 0.0098 0.0115 0.02823.8180 9.2480 1.8630 8.0400 1.5170 8.5040 0.3292 3.6400 2.6270 7.3660 2.8490 6.99700.0057 0.0000 * 0.0054 0.0116 * 0.0051 0.0000 * 0.0054 0.0146 * 0.0057 0.0032 * 0.006 0.0098 *0.3126 0.6299 * 0.1596 0.5075 * 0.15 0.3815 * 0.1232 1.3630 0.1905 0.5224 * 0.1977 0.2230 *0.0074 0.0180 0.0024 0.0104 0.0027 0.0153 0.0012 0.0057 * 0.0041 0.0116 0.0041 0.01010.9596 2.3240 0.5052 2.1810 0.6940 3.8920 0.4718 5.2180 0.9930 2.7840 1.9150 4.70400.0078 0.0065 * 0.0075 0.0126 * 0.0069 0.0000 * 0.0072 0.0000 * 0.0081 0.0044 * 0.0081 0.0045 *0.1455 0.3523 0.0648 0.2799 0.0502 0.2814 0.0100 0.1104 0.0858 0.2407 0.0890 0.21870.0057 0.0000 * 0.0027 0.0000 * 0.0021 0.0000 * 0.0009 0.0036 * 0.0036 0.0000 * 0.0036 0.0000 *0.0018 0.0005 * 0.0018 0.0014 * 0.0015 0.0000 * 0.0015 0.0000 * 0.0018 0.0036 * 0.0018 0.0003 *0.0678 0.1643 0.0195 0.0843 0.0222 0.1246 0.0100 0.1109 0.0218 0.0611 0.0364 0.08940.0023 0.0056 0.0021 0.0045 * 0.0021 0.0090 * 0.0021 0.0104 * 0.0031 0.0086 0.0021 0.0042 *
Calm: 10.42% Calm: 0.00% Calm: 4.17% Calm: 6.25% Calm: 4.17% Calm: 4.17%
NPR11.5
NPR NPR
32.7121274
25.536.4
139
11.734.1
4.97 4.41 3.98
9.8 30.3 25.7
239 25534.3 27.3 28.3
NPR NPR NPR
07/19/07 07/25/07 07/31/077.02 4.10 4.78247
08/06/07 08/12/07 08/18/07
D >= 17
D 1 - 17 -1 - 7
,.. •··--._ ·•,
' .. -------·· -·· ·;,--. ···•,,, ';~ . __ .. ,-- · ,, -..
.• . ·,. ~ \\
. ' •• ·• '' ' • -,-~ ... 21"! '
. .. - - - ~'•• , . l
i~.\~\k~ ,:_!f:l .-•' .
·---1--.,
·- ., ___ _ ,,.,-
----~~I.ITH- --··
. . -~---·· --- :~~---··
.•.. •• '···· ""i.ti"A114···---.,.
_,,·· .,,.-· --_ -~-~-~--~- ·-.. , '• \~----. .,• , .. ---·· ',
~:~ ::~~)) /
, .... _)_o~--·
•• ,----····11f)fi'Tl1 '
_,- ·-... ,. - ··· y.olffii ····--., .
., ___ , .. -- ·· ····- ··-,,_ _.,•• • • •· •···:-•... ••••,, HIii,
UL~ \::::~:::::1~~~/
., • ' ·,., __ --- .:~1,11'11--•··
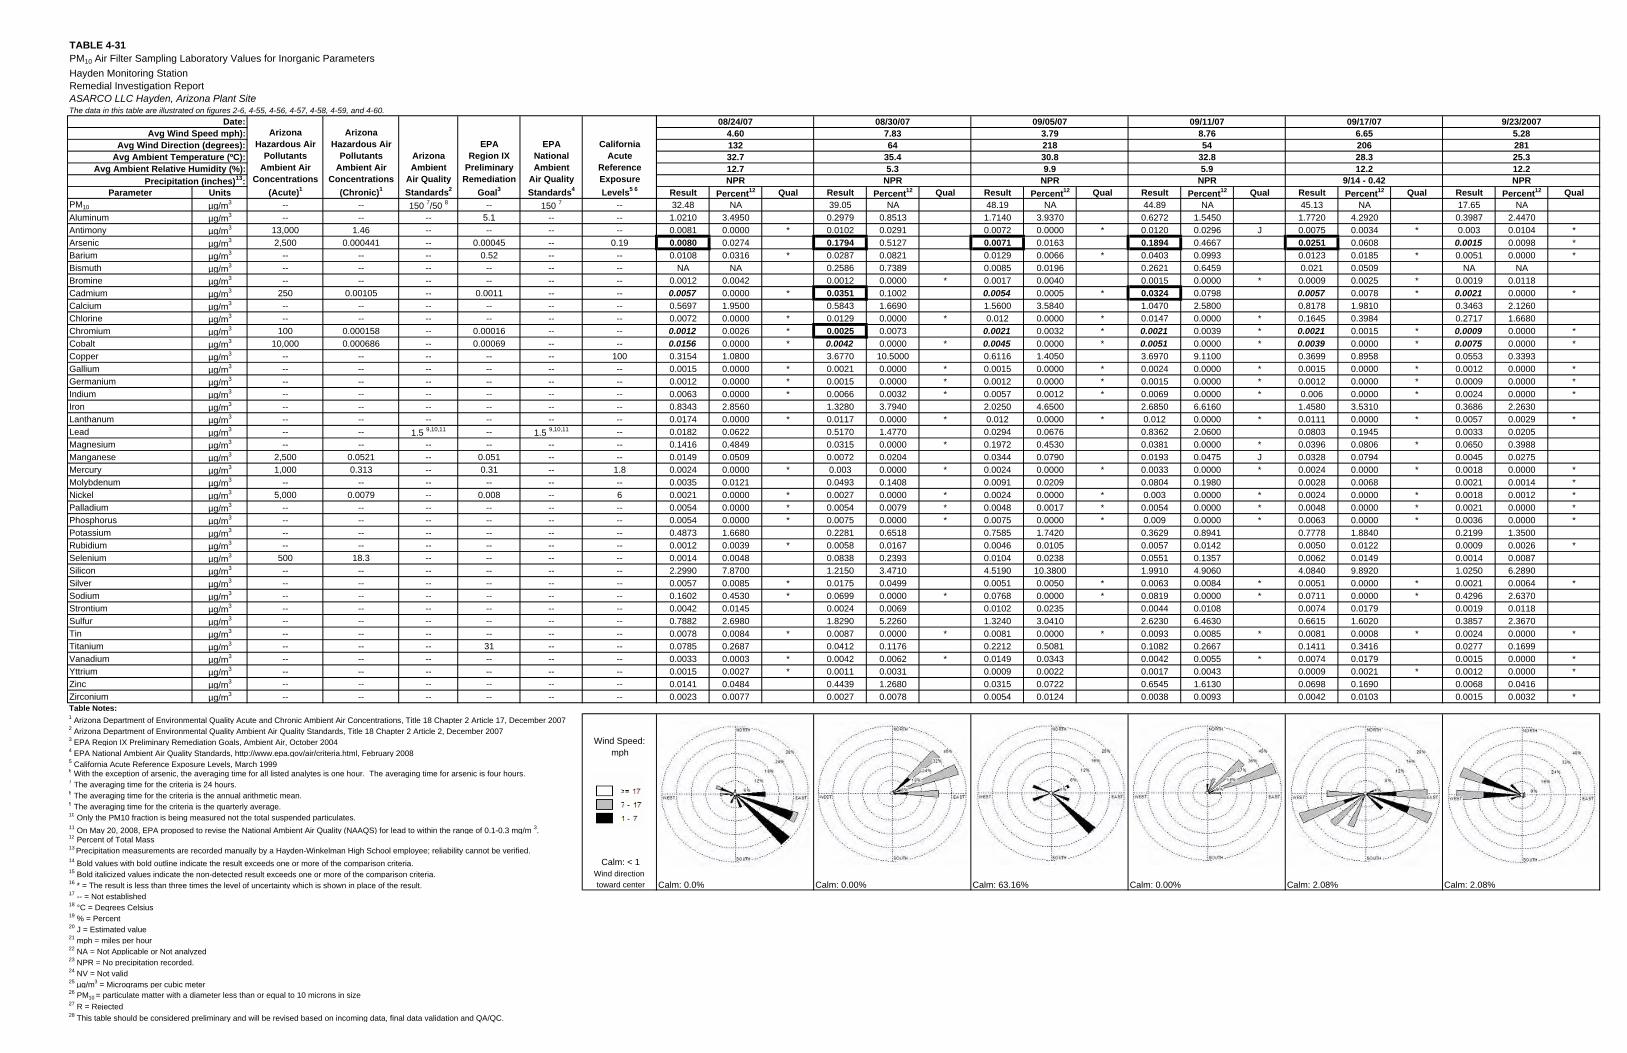
TABLE 4-31PM10 Air Filter Sampling Laboratory Values for Inorganic ParametersHayden Monitoring StationRemedial Investigation ReportASARCO LLC Hayden, Arizona Plant SiteThe data in this table are illustrated on figures 2-6, 4-55, 4-56, 4-57, 4-58, 4-59, and 4-60.
Parameter UnitsPM10 µg/m3 -- -- 150 7/50 8 -- 150 7 --Aluminum µg/m3 -- -- -- 5.1 -- --Antimony µg/m3 13,000 1.46 -- -- -- --Arsenic µg/m3 2,500 0.000441 -- 0.00045 -- 0.19Barium µg/m3 -- -- -- 0.52 -- --Bismuth µg/m3 -- -- -- -- -- --Bromine µg/m3 -- -- -- -- -- --Cadmium µg/m3 250 0.00105 -- 0.0011 -- --Calcium µg/m3 -- -- -- -- -- --Chlorine µg/m3 -- -- -- -- -- --Chromium µg/m3 100 0.000158 -- 0.00016 -- --Cobalt µg/m3 10,000 0.000686 -- 0.00069 -- --Copper µg/m3 -- -- -- -- -- 100Gallium µg/m3 -- -- -- -- -- --Germanium µg/m3 -- -- -- -- -- --Indium µg/m3 -- -- -- -- -- --Iron µg/m3 -- -- -- -- -- --Lanthanum µg/m3 -- -- -- -- -- --Lead µg/m3 -- -- 1.5 9,10,11 -- 1.5 9,10,11 --Magnesium µg/m3 -- -- -- -- -- --Manganese µg/m3 2,500 0.0521 -- 0.051 -- --Mercury µg/m3 1,000 0.313 -- 0.31 -- 1.8Molybdenum µg/m3 -- -- -- -- -- --Nickel µg/m3 5,000 0.0079 -- 0.008 -- 6Palladium µg/m3 -- -- -- -- -- --Phosphorus µg/m3 -- -- -- -- -- --Potassium µg/m3 -- -- -- -- -- --Rubidium µg/m3 -- -- -- -- -- --Selenium µg/m3 500 18.3 -- -- -- --Silicon µg/m3 -- -- -- -- -- --Silver µg/m3 -- -- -- -- -- --Sodium µg/m3 -- -- -- -- -- --Strontium µg/m3 -- -- -- -- -- --Sulfur µg/m3 -- -- -- -- -- --Tin µg/m3 -- -- -- -- -- --Titanium µg/m3 -- -- -- 31 -- --Vanadium µg/m3 -- -- -- -- -- --Yttrium µg/m3 -- -- -- -- -- --Zinc µg/m3 -- -- -- -- -- --Zirconium µg/m3 -- -- -- -- -- --Table Notes:1 Arizona Department of Environmental Quality Acute and Chronic Ambient Air Concentrations, Title 18 Chapter 2 Article 17, December 20072 Arizona Department of Environmental Quality Ambient Air Quality Standards, Title 18 Chapter 2 Article 2, December 20073 EPA Region IX Preliminary Remediation Goals, Ambient Air, October 2004 Wind Speed: 4 EPA National Ambient Air Quality Standards, http://www.epa.gov/air/criteria.html, February 2008 mph5 California Acute Reference Exposure Levels, March 19996 With the exception of arsenic, the averaging time for all listed analytes is one hour. The averaging time for arsenic is four hours.7 The averaging time for the criteria is 24 hours.8 The averaging time for the criteria is the annual arithmetic mean.9 The averaging time for the criteria is the quarterly average.10 Only the PM10 fraction is being measured not the total suspended particulates.11 On May 20, 2008, EPA proposed to revise the National Ambient Air Quality (NAAQS) for lead to within the range of 0.1-0.3 mg/m 3.12 Percent of Total Mass13 Precipitation measurements are recorded manually by a Hayden-Winkelman High School employee; reliability cannot be verified.14 Bold values with bold outline indicate the result exceeds one or more of the comparison criteria. Calm: < 115 Bold italicized values indicate the non-detected result exceeds one or more of the comparison criteria. Wind direction16 * = The result is less than three times the level of uncertainty which is shown in place of the result. toward center17 -- = Not established18 °C = Degrees Celsius19 % = Percent20 J = Estimated value21 mph = miles per hour22 NA = Not Applicable or Not analyzed23 NPR = No precipitation recorded.24 NV = Not valid25 µg/m3 = Micrograms per cubic meter26 PM10 = particulate matter with a diameter less than or equal to 10 microns in size27 R = Rejected28 This table should be considered preliminary and will be revised based on incoming data, final data validation and QA/QC.
EPANationalAmbient
Air QualityStandards4
CaliforniaAcute
ReferenceExposureLevels5 6
Date:Arizona
Hazardous AirPollutants
Ambient AirConcentrations
(Acute)1
ArizonaHazardous Air
PollutantsAmbient Air
Concentrations(Chronic)1
EPARegion IX
PreliminaryRemediation
Goal3
Avg Wind Speed mph):
Avg Ambient Relative Humidity (%):
Avg Wind Direction (degrees):Avg Ambient Temperature (ºC): Arizona
AmbientAir QualityStandards2
Precipitation (inches)13:Result Percent12 Qual Result Percent12 Qual Result Percent12 Qual Result Percent12 Qual Result Percent12 Qual Result Percent12 Qual32.48 NA 39.05 NA 48.19 NA 44.89 NA 45.13 NA 17.65 NA1.0210 3.4950 0.2979 0.8513 1.7140 3.9370 0.6272 1.5450 1.7720 4.2920 0.3987 2.44700.0081 0.0000 * 0.0102 0.0291 0.0072 0.0000 * 0.0120 0.0296 J 0.0075 0.0034 * 0.003 0.0104 *0.0080 0.0274 0.1794 0.5127 0.0071 0.0163 0.1894 0.4667 0.0251 0.0608 0.0015 0.0098 *0.0108 0.0316 * 0.0287 0.0821 0.0129 0.0066 * 0.0403 0.0993 0.0123 0.0185 * 0.0051 0.0000 *
NA NA 0.2586 0.7389 0.0085 0.0196 0.2621 0.6459 0.021 0.0509 NA NA0.0012 0.0042 0.0012 0.0000 * 0.0017 0.0040 0.0015 0.0000 * 0.0009 0.0025 * 0.0019 0.01180.0057 0.0000 * 0.0351 0.1002 0.0054 0.0005 * 0.0324 0.0798 0.0057 0.0078 * 0.0021 0.0000 *0.5697 1.9500 0.5843 1.6690 1.5600 3.5840 1.0470 2.5800 0.8178 1.9810 0.3463 2.12600.0072 0.0000 * 0.0129 0.0000 * 0.012 0.0000 * 0.0147 0.0000 * 0.1645 0.3984 0.2717 1.66800.0012 0.0026 * 0.0025 0.0073 0.0021 0.0032 * 0.0021 0.0039 * 0.0021 0.0015 * 0.0009 0.0000 *0.0156 0.0000 * 0.0042 0.0000 * 0.0045 0.0000 * 0.0051 0.0000 * 0.0039 0.0000 * 0.0075 0.0000 *0.3154 1.0800 3.6770 10.5000 0.6116 1.4050 3.6970 9.1100 0.3699 0.8958 0.0553 0.33930.0015 0.0000 * 0.0021 0.0000 * 0.0015 0.0000 * 0.0024 0.0000 * 0.0015 0.0000 * 0.0012 0.0000 *0.0012 0.0000 * 0.0015 0.0000 * 0.0012 0.0000 * 0.0015 0.0000 * 0.0012 0.0000 * 0.0009 0.0000 *0.0063 0.0000 * 0.0066 0.0032 * 0.0057 0.0012 * 0.0069 0.0000 * 0.006 0.0000 * 0.0024 0.0000 *0.8343 2.8560 1.3280 3.7940 2.0250 4.6500 2.6850 6.6160 1.4580 3.5310 0.3686 2.26300.0174 0.0000 * 0.0117 0.0000 * 0.012 0.0000 * 0.012 0.0000 * 0.0111 0.0000 * 0.0057 0.0029 *0.0182 0.0622 0.5170 1.4770 0.0294 0.0676 0.8362 2.0600 0.0803 0.1945 0.0033 0.02050.1416 0.4849 0.0315 0.0000 * 0.1972 0.4530 0.0381 0.0000 * 0.0396 0.0806 * 0.0650 0.39880.0149 0.0509 0.0072 0.0204 0.0344 0.0790 0.0193 0.0475 J 0.0328 0.0794 0.0045 0.02750.0024 0.0000 * 0.003 0.0000 * 0.0024 0.0000 * 0.0033 0.0000 * 0.0024 0.0000 * 0.0018 0.0000 *0.0035 0.0121 0.0493 0.1408 0.0091 0.0209 0.0804 0.1980 0.0028 0.0068 0.0021 0.0014 *0.0021 0.0000 * 0.0027 0.0000 * 0.0024 0.0000 * 0.003 0.0000 * 0.0024 0.0000 * 0.0018 0.0012 *0.0054 0.0000 * 0.0054 0.0079 * 0.0048 0.0017 * 0.0054 0.0000 * 0.0048 0.0000 * 0.0021 0.0000 *0.0054 0.0000 * 0.0075 0.0000 * 0.0075 0.0000 * 0.009 0.0000 * 0.0063 0.0000 * 0.0036 0.0000 *0.4873 1.6680 0.2281 0.6518 0.7585 1.7420 0.3629 0.8941 0.7778 1.8840 0.2199 1.35000.0012 0.0039 * 0.0058 0.0167 0.0046 0.0105 0.0057 0.0142 0.0050 0.0122 0.0009 0.0026 *0.0014 0.0048 0.0838 0.2393 0.0104 0.0238 0.0551 0.1357 0.0062 0.0149 0.0014 0.00872.2990 7.8700 1.2150 3.4710 4.5190 10.3800 1.9910 4.9060 4.0840 9.8920 1.0250 6.28900.0057 0.0085 * 0.0175 0.0499 0.0051 0.0050 * 0.0063 0.0084 * 0.0051 0.0000 * 0.0021 0.0064 *0.1602 0.4530 * 0.0699 0.0000 * 0.0768 0.0000 * 0.0819 0.0000 * 0.0711 0.0000 * 0.4296 2.63700.0042 0.0145 0.0024 0.0069 0.0102 0.0235 0.0044 0.0108 0.0074 0.0179 0.0019 0.01180.7882 2.6980 1.8290 5.2260 1.3240 3.0410 2.6230 6.4630 0.6615 1.6020 0.3857 2.36700.0078 0.0084 * 0.0087 0.0000 * 0.0081 0.0000 * 0.0093 0.0085 * 0.0081 0.0008 * 0.0024 0.0000 *0.0785 0.2687 0.0412 0.1176 0.2212 0.5081 0.1082 0.2667 0.1411 0.3416 0.0277 0.16990.0033 0.0003 * 0.0042 0.0062 * 0.0149 0.0343 0.0042 0.0055 * 0.0074 0.0179 0.0015 0.0000 *0.0015 0.0027 * 0.0011 0.0031 0.0009 0.0022 0.0017 0.0043 0.0009 0.0021 * 0.0012 0.0000 *0.0141 0.0484 0.4439 1.2680 0.0315 0.0722 0.6545 1.6130 0.0698 0.1690 0.0068 0.04160.0023 0.0077 0.0027 0.0078 0.0054 0.0124 0.0038 0.0093 0.0042 0.0103 0.0015 0.0032 *
Calm: 0.0% Calm: 0.00% Calm: 63.16% Calm: 0.00% Calm: 2.08% Calm: 2.08%
20630.8 32.8 28.3
12.2NPR NPR 9/14 - 0.42
12.7 5.3NPR NPR
64
5.932.7 35.4
218 54
9.9
1324.60
09/17/0708/24/07 08/30/07 09/05/07 09/11/075.287.83 3.79 8.76 6.65
9/23/2007
28125.312.2NPR
D >= 17
D 1 - 17 -1 - 7
.. , .-•- ·-Fo~------.,. _.--
----- -- ---- lsoLfT'tl- -•-·
·. •,
_ •• ,-· -- _,MO'iTH · -•-- . , ,
.. • ' ·--•-,.!.----
'----- •• ~i.mt--'
•• ,----· '..oRTH
•' -----:--... ·•,,,
•• •• 2i"i ,,• ' \ ..•.
.,_ ••• •• _ ... • • _, .•·· --. , ,~fti_
• ' •• :• ••-.,,,, I~ ••
~:':_ '}:~ )-;: ,,.,
-------- --- .••. lroLIT)I.••·
_._ •• ,- ----··:j;;:.FI™ ''-.,. •' --- i--·-· ---.. ·•,,,
, ... : -;'/(~~----·_-,: __ -.-.· ·_··_:;:
'•,, ··-·-·t·-·-··'· , ··· ... _ ' •,. ·-•--.:-----··•'
------·----+--····· ,,•' -----~~U114-·•
••• ----- ·-·1.:.cilfll-!·-,, __ • __
•' - 1 ---.. .... ·, ,, ~illi\
,,.-· ... • ,.•' --., 1f.--. \ . -- --;-·---,. r':?'li \,
~~---:~ i~--.~ ~ __ ,.
··-·-----:----------, •••• _ tool.Ill-I--•
•• ,--- --- -~L6~ -----.,._
·•,,
\., .:... , .. - __ , , •'
- - . . • OOll'tt-·'
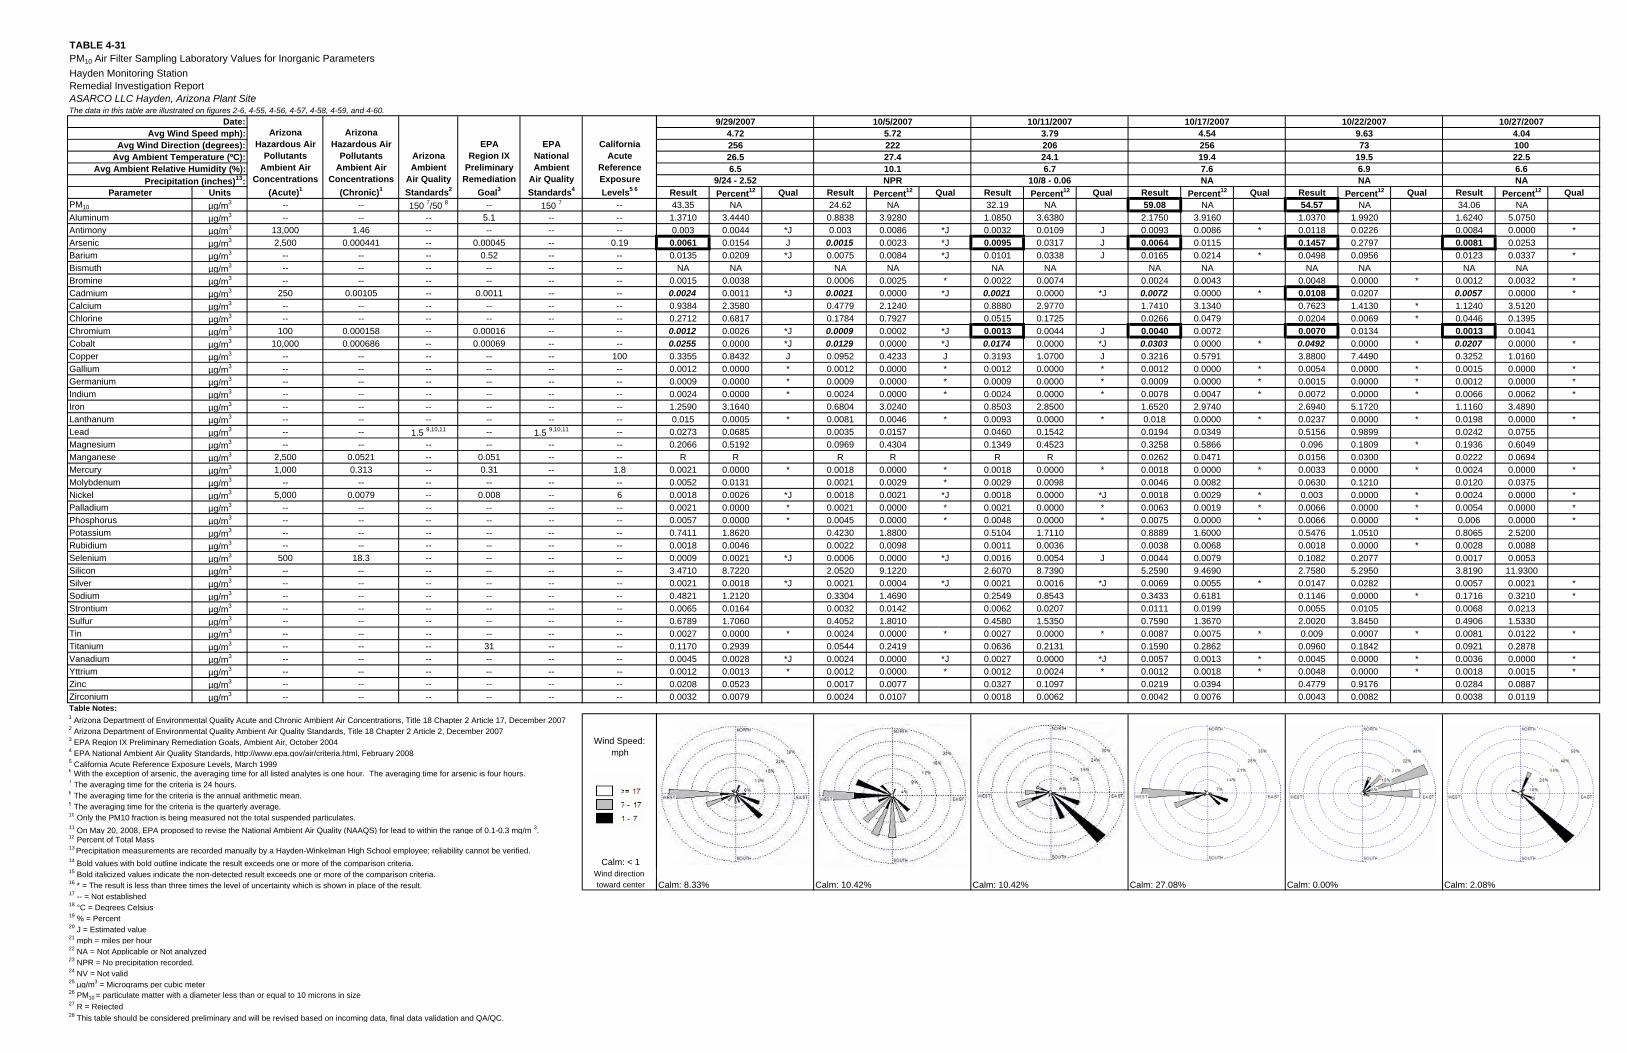
TABLE 4-31PM10 Air Filter Sampling Laboratory Values for Inorganic ParametersHayden Monitoring StationRemedial Investigation ReportASARCO LLC Hayden, Arizona Plant SiteThe data in this table are illustrated on figures 2-6, 4-55, 4-56, 4-57, 4-58, 4-59, and 4-60.
Parameter UnitsPM10 µg/m3 -- -- 150 7/50 8 -- 150 7 --Aluminum µg/m3 -- -- -- 5.1 -- --Antimony µg/m3 13,000 1.46 -- -- -- --Arsenic µg/m3 2,500 0.000441 -- 0.00045 -- 0.19Barium µg/m3 -- -- -- 0.52 -- --Bismuth µg/m3 -- -- -- -- -- --Bromine µg/m3 -- -- -- -- -- --Cadmium µg/m3 250 0.00105 -- 0.0011 -- --Calcium µg/m3 -- -- -- -- -- --Chlorine µg/m3 -- -- -- -- -- --Chromium µg/m3 100 0.000158 -- 0.00016 -- --Cobalt µg/m3 10,000 0.000686 -- 0.00069 -- --Copper µg/m3 -- -- -- -- -- 100Gallium µg/m3 -- -- -- -- -- --Germanium µg/m3 -- -- -- -- -- --Indium µg/m3 -- -- -- -- -- --Iron µg/m3 -- -- -- -- -- --Lanthanum µg/m3 -- -- -- -- -- --Lead µg/m3 -- -- 1.5 9,10,11 -- 1.5 9,10,11 --Magnesium µg/m3 -- -- -- -- -- --Manganese µg/m3 2,500 0.0521 -- 0.051 -- --Mercury µg/m3 1,000 0.313 -- 0.31 -- 1.8Molybdenum µg/m3 -- -- -- -- -- --Nickel µg/m3 5,000 0.0079 -- 0.008 -- 6Palladium µg/m3 -- -- -- -- -- --Phosphorus µg/m3 -- -- -- -- -- --Potassium µg/m3 -- -- -- -- -- --Rubidium µg/m3 -- -- -- -- -- --Selenium µg/m3 500 18.3 -- -- -- --Silicon µg/m3 -- -- -- -- -- --Silver µg/m3 -- -- -- -- -- --Sodium µg/m3 -- -- -- -- -- --Strontium µg/m3 -- -- -- -- -- --Sulfur µg/m3 -- -- -- -- -- --Tin µg/m3 -- -- -- -- -- --Titanium µg/m3 -- -- -- 31 -- --Vanadium µg/m3 -- -- -- -- -- --Yttrium µg/m3 -- -- -- -- -- --Zinc µg/m3 -- -- -- -- -- --Zirconium µg/m3 -- -- -- -- -- --Table Notes:1 Arizona Department of Environmental Quality Acute and Chronic Ambient Air Concentrations, Title 18 Chapter 2 Article 17, December 20072 Arizona Department of Environmental Quality Ambient Air Quality Standards, Title 18 Chapter 2 Article 2, December 20073 EPA Region IX Preliminary Remediation Goals, Ambient Air, October 2004 Wind Speed: 4 EPA National Ambient Air Quality Standards, http://www.epa.gov/air/criteria.html, February 2008 mph5 California Acute Reference Exposure Levels, March 19996 With the exception of arsenic, the averaging time for all listed analytes is one hour. The averaging time for arsenic is four hours.7 The averaging time for the criteria is 24 hours.8 The averaging time for the criteria is the annual arithmetic mean.9 The averaging time for the criteria is the quarterly average.10 Only the PM10 fraction is being measured not the total suspended particulates.11 On May 20, 2008, EPA proposed to revise the National Ambient Air Quality (NAAQS) for lead to within the range of 0.1-0.3 mg/m 3.12 Percent of Total Mass13 Precipitation measurements are recorded manually by a Hayden-Winkelman High School employee; reliability cannot be verified.14 Bold values with bold outline indicate the result exceeds one or more of the comparison criteria. Calm: < 115 Bold italicized values indicate the non-detected result exceeds one or more of the comparison criteria. Wind direction16 * = The result is less than three times the level of uncertainty which is shown in place of the result. toward center17 -- = Not established18 °C = Degrees Celsius19 % = Percent20 J = Estimated value21 mph = miles per hour22 NA = Not Applicable or Not analyzed23 NPR = No precipitation recorded.24 NV = Not valid25 µg/m3 = Micrograms per cubic meter26 PM10 = particulate matter with a diameter less than or equal to 10 microns in size27 R = Rejected28 This table should be considered preliminary and will be revised based on incoming data, final data validation and QA/QC.
EPANationalAmbient
Air QualityStandards4
CaliforniaAcute
ReferenceExposureLevels5 6
Date:Arizona
Hazardous AirPollutants
Ambient AirConcentrations
(Acute)1
ArizonaHazardous Air
PollutantsAmbient Air
Concentrations(Chronic)1
EPARegion IX
PreliminaryRemediation
Goal3
Avg Wind Speed mph):
Avg Ambient Relative Humidity (%):
Avg Wind Direction (degrees):Avg Ambient Temperature (ºC): Arizona
AmbientAir QualityStandards2
Precipitation (inches)13:Result Percent12 Qual Result Percent12 Qual Result Percent12 Qual Result Percent12 Qual Result Percent12 Qual Result Percent12 Qual43.35 NA 24.62 NA 32.19 NA 59.08 NA 54.57 NA 34.06 NA1.3710 3.4440 0.8838 3.9280 1.0850 3.6380 2.1750 3.9160 1.0370 1.9920 1.6240 5.07500.003 0.0044 *J 0.003 0.0086 *J 0.0032 0.0109 J 0.0093 0.0086 * 0.0118 0.0226 0.0084 0.0000 *0.0061 0.0154 J 0.0015 0.0023 *J 0.0095 0.0317 J 0.0064 0.0115 0.1457 0.2797 0.0081 0.02530.0135 0.0209 *J 0.0075 0.0084 *J 0.0101 0.0338 J 0.0165 0.0214 * 0.0498 0.0956 0.0123 0.0337 *
NA NA NA NA NA NA NA NA NA NA NA NA0.0015 0.0038 0.0006 0.0025 * 0.0022 0.0074 0.0024 0.0043 0.0048 0.0000 * 0.0012 0.0032 *0.0024 0.0011 *J 0.0021 0.0000 *J 0.0021 0.0000 *J 0.0072 0.0000 * 0.0108 0.0207 0.0057 0.0000 *0.9384 2.3580 0.4779 2.1240 0.8880 2.9770 1.7410 3.1340 0.7623 1.4130 * 1.1240 3.51200.2712 0.6817 0.1784 0.7927 0.0515 0.1725 0.0266 0.0479 0.0204 0.0069 * 0.0446 0.13950.0012 0.0026 *J 0.0009 0.0002 *J 0.0013 0.0044 J 0.0040 0.0072 0.0070 0.0134 0.0013 0.00410.0255 0.0000 *J 0.0129 0.0000 *J 0.0174 0.0000 *J 0.0303 0.0000 * 0.0492 0.0000 * 0.0207 0.0000 *0.3355 0.8432 J 0.0952 0.4233 J 0.3193 1.0700 J 0.3216 0.5791 3.8800 7.4490 0.3252 1.01600.0012 0.0000 * 0.0012 0.0000 * 0.0012 0.0000 * 0.0012 0.0000 * 0.0054 0.0000 * 0.0015 0.0000 *0.0009 0.0000 * 0.0009 0.0000 * 0.0009 0.0000 * 0.0009 0.0000 * 0.0015 0.0000 * 0.0012 0.0000 *0.0024 0.0000 * 0.0024 0.0000 * 0.0024 0.0000 * 0.0078 0.0047 * 0.0072 0.0000 * 0.0066 0.0062 *1.2590 3.1640 0.6804 3.0240 0.8503 2.8500 1.6520 2.9740 2.6940 5.1720 1.1160 3.48900.015 0.0005 * 0.0081 0.0046 * 0.0093 0.0000 * 0.018 0.0000 * 0.0237 0.0000 * 0.0198 0.0000 *0.0273 0.0685 0.0035 0.0157 0.0460 0.1542 0.0194 0.0349 0.5156 0.9899 0.0242 0.07550.2066 0.5192 0.0969 0.4304 0.1349 0.4523 0.3258 0.5866 0.096 0.1809 * 0.1936 0.6049
R R R R R R 0.0262 0.0471 0.0156 0.0300 0.0222 0.06940.0021 0.0000 * 0.0018 0.0000 * 0.0018 0.0000 * 0.0018 0.0000 * 0.0033 0.0000 * 0.0024 0.0000 *0.0052 0.0131 0.0021 0.0029 * 0.0029 0.0098 0.0046 0.0082 0.0630 0.1210 0.0120 0.03750.0018 0.0026 *J 0.0018 0.0021 *J 0.0018 0.0000 *J 0.0018 0.0029 * 0.003 0.0000 * 0.0024 0.0000 *0.0021 0.0000 * 0.0021 0.0000 * 0.0021 0.0000 * 0.0063 0.0019 * 0.0066 0.0000 * 0.0054 0.0000 *0.0057 0.0000 * 0.0045 0.0000 * 0.0048 0.0000 * 0.0075 0.0000 * 0.0066 0.0000 * 0.006 0.0000 *0.7411 1.8620 0.4230 1.8800 0.5104 1.7110 0.8889 1.6000 0.5476 1.0510 0.8065 2.52000.0018 0.0046 0.0022 0.0098 0.0011 0.0036 0.0038 0.0068 0.0018 0.0000 * 0.0028 0.00880.0009 0.0021 *J 0.0006 0.0000 *J 0.0016 0.0054 J 0.0044 0.0079 0.1082 0.2077 0.0017 0.00533.4710 8.7220 2.0520 9.1220 2.6070 8.7390 5.2590 9.4690 2.7580 5.2950 3.8190 11.93000.0021 0.0018 *J 0.0021 0.0004 *J 0.0021 0.0016 *J 0.0069 0.0055 * 0.0147 0.0282 0.0057 0.0021 *0.4821 1.2120 0.3304 1.4690 0.2549 0.8543 0.3433 0.6181 0.1146 0.0000 * 0.1716 0.3210 *0.0065 0.0164 0.0032 0.0142 0.0062 0.0207 0.0111 0.0199 0.0055 0.0105 0.0068 0.02130.6789 1.7060 0.4052 1.8010 0.4580 1.5350 0.7590 1.3670 2.0020 3.8450 0.4906 1.53300.0027 0.0000 * 0.0024 0.0000 * 0.0027 0.0000 * 0.0087 0.0075 * 0.009 0.0007 * 0.0081 0.0122 *0.1170 0.2939 0.0544 0.2419 0.0636 0.2131 0.1590 0.2862 0.0960 0.1842 0.0921 0.28780.0045 0.0028 *J 0.0024 0.0000 *J 0.0027 0.0000 *J 0.0057 0.0013 * 0.0045 0.0000 * 0.0036 0.0000 *0.0012 0.0013 * 0.0012 0.0000 * 0.0012 0.0024 * 0.0012 0.0018 * 0.0048 0.0000 * 0.0018 0.0015 *0.0208 0.0523 0.0017 0.0077 0.0327 0.1097 0.0219 0.0394 0.4779 0.9176 0.0284 0.08870.0032 0.0079 0.0024 0.0107 0.0018 0.0062 0.0042 0.0076 0.0043 0.0082 0.0038 0.0119
Calm: 8.33% Calm: 10.42% Calm: 10.42% Calm: 27.08% Calm: 0.00% Calm: 2.08%
4.729/29/2007 10/5/2007 10/11/2007 10/17/2007 10/22/2007 10/27/2007
5.72 3.79 4.54 9.63 4.04100222 206256
26.56.5
27.4 24.1 19.4 19.5 22.5256 73
6.610.1 6.7 7.6 6.99/24 - 2.52 NPR 10/8 - 0.06 NA NA NA
•• ,------ ~io"iiTH .,, -. •• ,.- . :MORTll"•,, ..• ,._
D >= 17
D 1 - 17 -1 - 7
• .. • ' , • •-~ -~- H • • •• ·•···• , , ';;.,\_
.---- --· ~;."i , ,---·r---, '" \,
i:,~ )f . ··--t .. -,.,
- ··-··-·•'".... ,,, ' .. ,__ . . ~li:Oi.mi __ , ___ ,
•• ---··· ~H)R"ni ·-, .. •. _
., ·····:···-··- ··•, .. _ _ .. ·· ···--•' -. ·•,,,
. .. ,,.----· _ ........ , .. _ ····-, ~'Ii----··... .-······•''' --. ···~;.~l:li. !i"i\,_ , .. ,·· : ,i-~... . ····- ',
~Si t),> <}~ ~j .,.,,•' ---·--- .• ~~UTlt--•·
'·---., .... _ .60Lffli--'.
•• ,-· ~NO IUH '-,,. __ _
·····'·-··- ·-··r·- ·;.,..._H-• ..... _
--.,, 2·, ...
····-·t·
"' ; j&.~.1
··-----·:---·· ,, •'
,_ ·--, •••• -~~LITM -·' -
-, __
----·---lt-01.1Tt1 -·--·
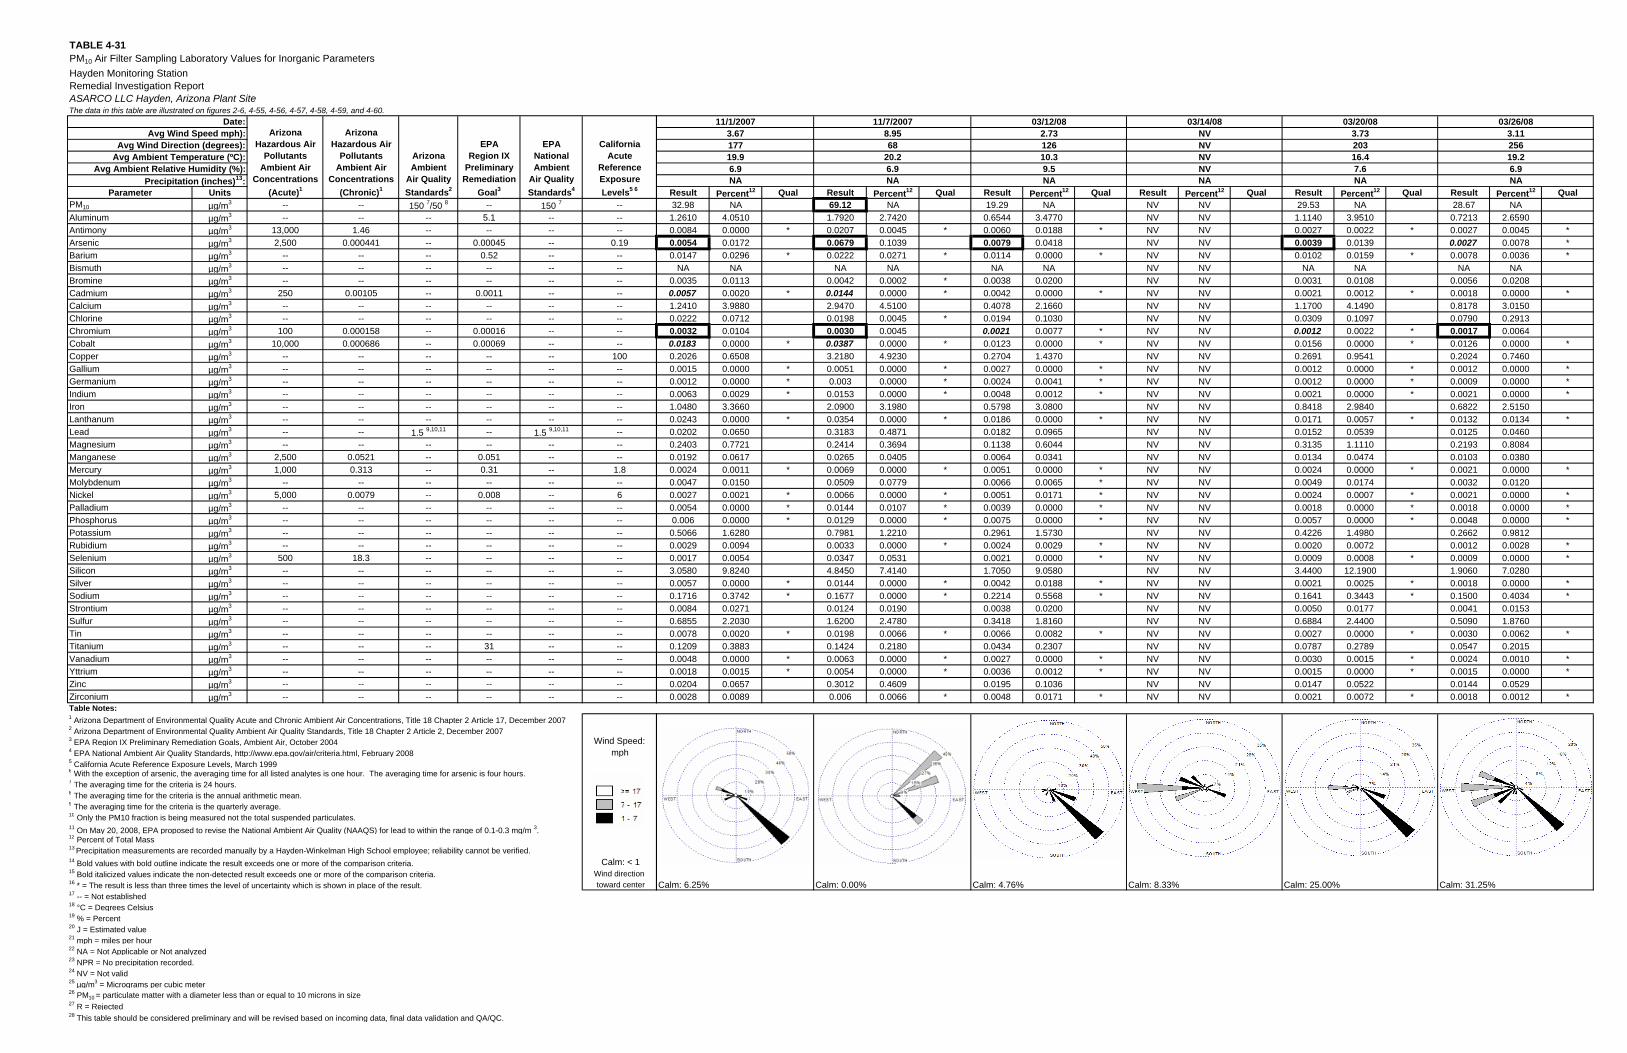
TABLE 4-31PM10 Air Filter Sampling Laboratory Values for Inorganic ParametersHayden Monitoring StationRemedial Investigation ReportASARCO LLC Hayden, Arizona Plant SiteThe data in this table are illustrated on figures 2-6, 4-55, 4-56, 4-57, 4-58, 4-59, and 4-60.
Parameter UnitsPM10 µg/m3 -- -- 150 7/50 8 -- 150 7 --Aluminum µg/m3 -- -- -- 5.1 -- --Antimony µg/m3 13,000 1.46 -- -- -- --Arsenic µg/m3 2,500 0.000441 -- 0.00045 -- 0.19Barium µg/m3 -- -- -- 0.52 -- --Bismuth µg/m3 -- -- -- -- -- --Bromine µg/m3 -- -- -- -- -- --Cadmium µg/m3 250 0.00105 -- 0.0011 -- --Calcium µg/m3 -- -- -- -- -- --Chlorine µg/m3 -- -- -- -- -- --Chromium µg/m3 100 0.000158 -- 0.00016 -- --Cobalt µg/m3 10,000 0.000686 -- 0.00069 -- --Copper µg/m3 -- -- -- -- -- 100Gallium µg/m3 -- -- -- -- -- --Germanium µg/m3 -- -- -- -- -- --Indium µg/m3 -- -- -- -- -- --Iron µg/m3 -- -- -- -- -- --Lanthanum µg/m3 -- -- -- -- -- --Lead µg/m3 -- -- 1.5 9,10,11 -- 1.5 9,10,11 --Magnesium µg/m3 -- -- -- -- -- --Manganese µg/m3 2,500 0.0521 -- 0.051 -- --Mercury µg/m3 1,000 0.313 -- 0.31 -- 1.8Molybdenum µg/m3 -- -- -- -- -- --Nickel µg/m3 5,000 0.0079 -- 0.008 -- 6Palladium µg/m3 -- -- -- -- -- --Phosphorus µg/m3 -- -- -- -- -- --Potassium µg/m3 -- -- -- -- -- --Rubidium µg/m3 -- -- -- -- -- --Selenium µg/m3 500 18.3 -- -- -- --Silicon µg/m3 -- -- -- -- -- --Silver µg/m3 -- -- -- -- -- --Sodium µg/m3 -- -- -- -- -- --Strontium µg/m3 -- -- -- -- -- --Sulfur µg/m3 -- -- -- -- -- --Tin µg/m3 -- -- -- -- -- --Titanium µg/m3 -- -- -- 31 -- --Vanadium µg/m3 -- -- -- -- -- --Yttrium µg/m3 -- -- -- -- -- --Zinc µg/m3 -- -- -- -- -- --Zirconium µg/m3 -- -- -- -- -- --Table Notes:1 Arizona Department of Environmental Quality Acute and Chronic Ambient Air Concentrations, Title 18 Chapter 2 Article 17, December 20072 Arizona Department of Environmental Quality Ambient Air Quality Standards, Title 18 Chapter 2 Article 2, December 20073 EPA Region IX Preliminary Remediation Goals, Ambient Air, October 2004 Wind Speed: 4 EPA National Ambient Air Quality Standards, http://www.epa.gov/air/criteria.html, February 2008 mph5 California Acute Reference Exposure Levels, March 19996 With the exception of arsenic, the averaging time for all listed analytes is one hour. The averaging time for arsenic is four hours.7 The averaging time for the criteria is 24 hours.8 The averaging time for the criteria is the annual arithmetic mean.9 The averaging time for the criteria is the quarterly average.10 Only the PM10 fraction is being measured not the total suspended particulates.11 On May 20, 2008, EPA proposed to revise the National Ambient Air Quality (NAAQS) for lead to within the range of 0.1-0.3 mg/m 3.12 Percent of Total Mass13 Precipitation measurements are recorded manually by a Hayden-Winkelman High School employee; reliability cannot be verified.14 Bold values with bold outline indicate the result exceeds one or more of the comparison criteria. Calm: < 115 Bold italicized values indicate the non-detected result exceeds one or more of the comparison criteria. Wind direction16 * = The result is less than three times the level of uncertainty which is shown in place of the result. toward center17 -- = Not established18 °C = Degrees Celsius19 % = Percent20 J = Estimated value21 mph = miles per hour22 NA = Not Applicable or Not analyzed23 NPR = No precipitation recorded.24 NV = Not valid25 µg/m3 = Micrograms per cubic meter26 PM10 = particulate matter with a diameter less than or equal to 10 microns in size27 R = Rejected28 This table should be considered preliminary and will be revised based on incoming data, final data validation and QA/QC.
EPANationalAmbient
Air QualityStandards4
CaliforniaAcute
ReferenceExposureLevels5 6
Date:Arizona
Hazardous AirPollutants
Ambient AirConcentrations
(Acute)1
ArizonaHazardous Air
PollutantsAmbient Air
Concentrations(Chronic)1
EPARegion IX
PreliminaryRemediation
Goal3
Avg Wind Speed mph):
Avg Ambient Relative Humidity (%):
Avg Wind Direction (degrees):Avg Ambient Temperature (ºC): Arizona
AmbientAir QualityStandards2
Precipitation (inches)13:Result Percent12 Qual Result Percent12 Qual Result Percent12 Qual Result Percent12 Qual Result Percent12 Qual Result Percent12 Qual32.98 NA 69.12 NA 19.29 NA NV NV 29.53 NA 28.67 NA1.2610 4.0510 1.7920 2.7420 0.6544 3.4770 NV NV 1.1140 3.9510 0.7213 2.65900.0084 0.0000 * 0.0207 0.0045 * 0.0060 0.0188 * NV NV 0.0027 0.0022 * 0.0027 0.0045 *0.0054 0.0172 0.0679 0.1039 0.0079 0.0418 NV NV 0.0039 0.0139 0.0027 0.0078 *0.0147 0.0296 * 0.0222 0.0271 * 0.0114 0.0000 * NV NV 0.0102 0.0159 * 0.0078 0.0036 *
NA NA NA NA NA NA NV NV NA NA NA NA0.0035 0.0113 0.0042 0.0002 * 0.0038 0.0200 NV NV 0.0031 0.0108 0.0056 0.02080.0057 0.0020 * 0.0144 0.0000 * 0.0042 0.0000 * NV NV 0.0021 0.0012 * 0.0018 0.0000 *1.2410 3.9880 2.9470 4.5100 0.4078 2.1660 NV NV 1.1700 4.1490 0.8178 3.01500.0222 0.0712 0.0198 0.0045 * 0.0194 0.1030 NV NV 0.0309 0.1097 0.0790 0.29130.0032 0.0104 0.0030 0.0045 0.0021 0.0077 * NV NV 0.0012 0.0022 * 0.0017 0.00640.0183 0.0000 * 0.0387 0.0000 * 0.0123 0.0000 * NV NV 0.0156 0.0000 * 0.0126 0.0000 *0.2026 0.6508 3.2180 4.9230 0.2704 1.4370 NV NV 0.2691 0.9541 0.2024 0.74600.0015 0.0000 * 0.0051 0.0000 * 0.0027 0.0000 * NV NV 0.0012 0.0000 * 0.0012 0.0000 *0.0012 0.0000 * 0.003 0.0000 * 0.0024 0.0041 * NV NV 0.0012 0.0000 * 0.0009 0.0000 *0.0063 0.0029 * 0.0153 0.0000 * 0.0048 0.0012 * NV NV 0.0021 0.0000 * 0.0021 0.0000 *1.0480 3.3660 2.0900 3.1980 0.5798 3.0800 NV NV 0.8418 2.9840 0.6822 2.51500.0243 0.0000 * 0.0354 0.0000 * 0.0186 0.0000 * NV NV 0.0171 0.0057 * 0.0132 0.0134 *0.0202 0.0650 0.3183 0.4871 0.0182 0.0965 NV NV 0.0152 0.0539 0.0125 0.04600.2403 0.7721 0.2414 0.3694 0.1138 0.6044 NV NV 0.3135 1.1110 0.2193 0.80840.0192 0.0617 0.0265 0.0405 0.0064 0.0341 NV NV 0.0134 0.0474 0.0103 0.03800.0024 0.0011 * 0.0069 0.0000 * 0.0051 0.0000 * NV NV 0.0024 0.0000 * 0.0021 0.0000 *0.0047 0.0150 0.0509 0.0779 0.0066 0.0065 * NV NV 0.0049 0.0174 0.0032 0.01200.0027 0.0021 * 0.0066 0.0000 * 0.0051 0.0171 * NV NV 0.0024 0.0007 * 0.0021 0.0000 *0.0054 0.0000 * 0.0144 0.0107 * 0.0039 0.0000 * NV NV 0.0018 0.0000 * 0.0018 0.0000 *0.006 0.0000 * 0.0129 0.0000 * 0.0075 0.0000 * NV NV 0.0057 0.0000 * 0.0048 0.0000 *0.5066 1.6280 0.7981 1.2210 0.2961 1.5730 NV NV 0.4226 1.4980 0.2662 0.98120.0029 0.0094 0.0033 0.0000 * 0.0024 0.0029 * NV NV 0.0020 0.0072 0.0012 0.0028 *0.0017 0.0054 0.0347 0.0531 0.0021 0.0000 * NV NV 0.0009 0.0008 * 0.0009 0.0000 *3.0580 9.8240 4.8450 7.4140 1.7050 9.0580 NV NV 3.4400 12.1900 1.9060 7.02800.0057 0.0000 * 0.0144 0.0000 * 0.0042 0.0188 * NV NV 0.0021 0.0025 * 0.0018 0.0000 *0.1716 0.3742 * 0.1677 0.0000 * 0.2214 0.5568 * NV NV 0.1641 0.3443 * 0.1500 0.4034 *0.0084 0.0271 0.0124 0.0190 0.0038 0.0200 NV NV 0.0050 0.0177 0.0041 0.01530.6855 2.2030 1.6200 2.4780 0.3418 1.8160 NV NV 0.6884 2.4400 0.5090 1.87600.0078 0.0020 * 0.0198 0.0066 * 0.0066 0.0082 * NV NV 0.0027 0.0000 * 0.0030 0.0062 *0.1209 0.3883 0.1424 0.2180 0.0434 0.2307 NV NV 0.0787 0.2789 0.0547 0.20150.0048 0.0000 * 0.0063 0.0000 * 0.0027 0.0000 * NV NV 0.0030 0.0015 * 0.0024 0.0010 *0.0018 0.0015 * 0.0054 0.0000 * 0.0036 0.0012 * NV NV 0.0015 0.0000 * 0.0015 0.0000 *0.0204 0.0657 0.3012 0.4609 0.0195 0.1036 NV NV 0.0147 0.0522 0.0144 0.05290.0028 0.0089 0.006 0.0066 * 0.0048 0.0171 * NV NV 0.0021 0.0072 * 0.0018 0.0012 *
Calm: 6.25% Calm: 0.00% Calm: 4.76% Calm: 8.33% Calm: 25.00% Calm: 31.25%
NA NA NA NA9.5 NV 7.6 6.910.3 NV 16.4 19.2126 NV 203 2562.73 NV 3.73 3.11
03/12/08 03/14/08 03/20/08 03/26/0811/1/2007 11/7/20073.67 8.95177 6819.9 20.26.9 6.9
NANA
D >= 17
D 1 - 17 -1 - 7
•• ,---- :..:i RT14 ·-, , _
; . ..,::---:,,····/---'···
,.,
·-·t·•'"""" ., ______ if!OIIT11 -·'
50%
,,•' ---- ----·-i··· ··"" --
--- j ~oun, .. -. . ---------- __ __ l~UTH --- --- ---
35% 20%
28%
- - . 12%
. ,.% ' ~ - ,-" · '" ' ' ": ' EAST :
' ' ' '
.
; EAST :
-------:-----·· ls_o uTM . -·· ,,-
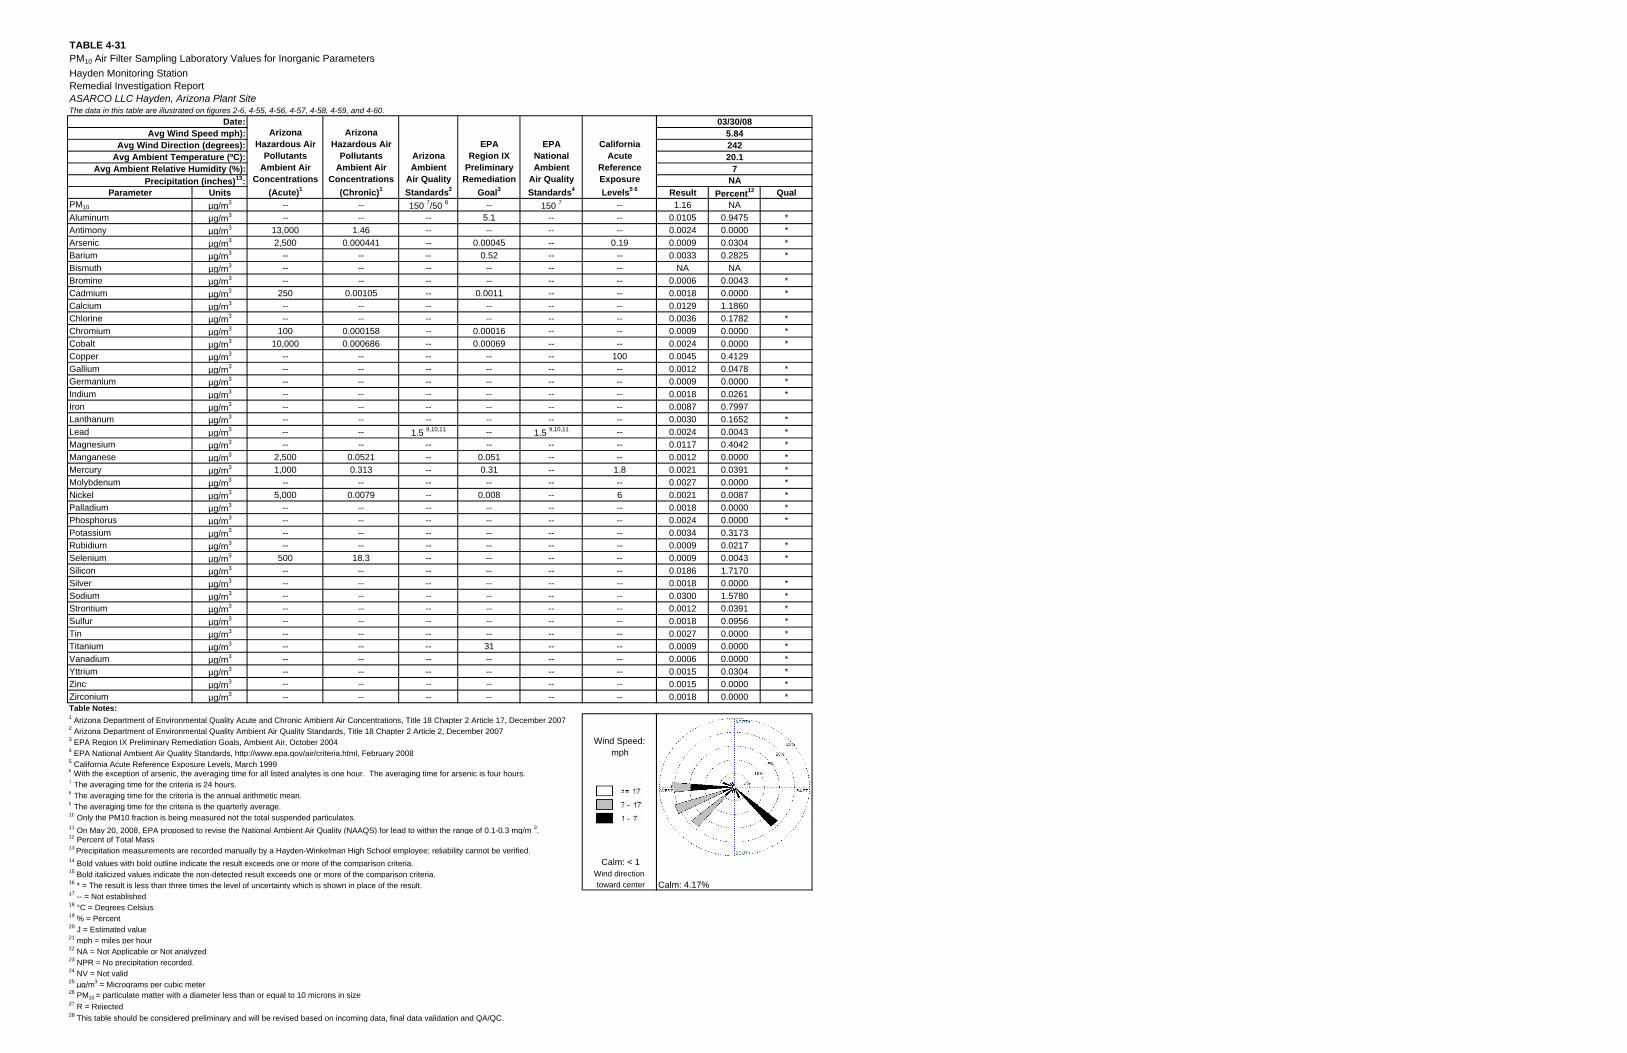
TABLE 4-31PM10 Air Filter Sampling Laboratory Values for Inorganic ParametersHayden Monitoring StationRemedial Investigation ReportASARCO LLC Hayden, Arizona Plant SiteThe data in this table are illustrated on figures 2-6, 4-55, 4-56, 4-57, 4-58, 4-59, and 4-60.
Parameter UnitsPM10 µg/m3 -- -- 150 7/50 8 -- 150 7 --Aluminum µg/m3 -- -- -- 5.1 -- --Antimony µg/m3 13,000 1.46 -- -- -- --Arsenic µg/m3 2,500 0.000441 -- 0.00045 -- 0.19Barium µg/m3 -- -- -- 0.52 -- --Bismuth µg/m3 -- -- -- -- -- --Bromine µg/m3 -- -- -- -- -- --Cadmium µg/m3 250 0.00105 -- 0.0011 -- --Calcium µg/m3 -- -- -- -- -- --Chlorine µg/m3 -- -- -- -- -- --Chromium µg/m3 100 0.000158 -- 0.00016 -- --Cobalt µg/m3 10,000 0.000686 -- 0.00069 -- --Copper µg/m3 -- -- -- -- -- 100Gallium µg/m3 -- -- -- -- -- --Germanium µg/m3 -- -- -- -- -- --Indium µg/m3 -- -- -- -- -- --Iron µg/m3 -- -- -- -- -- --Lanthanum µg/m3 -- -- -- -- -- --Lead µg/m3 -- -- 1.5 9,10,11 -- 1.5 9,10,11 --Magnesium µg/m3 -- -- -- -- -- --Manganese µg/m3 2,500 0.0521 -- 0.051 -- --Mercury µg/m3 1,000 0.313 -- 0.31 -- 1.8Molybdenum µg/m3 -- -- -- -- -- --Nickel µg/m3 5,000 0.0079 -- 0.008 -- 6Palladium µg/m3 -- -- -- -- -- --Phosphorus µg/m3 -- -- -- -- -- --Potassium µg/m3 -- -- -- -- -- --Rubidium µg/m3 -- -- -- -- -- --Selenium µg/m3 500 18.3 -- -- -- --Silicon µg/m3 -- -- -- -- -- --Silver µg/m3 -- -- -- -- -- --Sodium µg/m3 -- -- -- -- -- --Strontium µg/m3 -- -- -- -- -- --Sulfur µg/m3 -- -- -- -- -- --Tin µg/m3 -- -- -- -- -- --Titanium µg/m3 -- -- -- 31 -- --Vanadium µg/m3 -- -- -- -- -- --Yttrium µg/m3 -- -- -- -- -- --Zinc µg/m3 -- -- -- -- -- --Zirconium µg/m3 -- -- -- -- -- --Table Notes:1 Arizona Department of Environmental Quality Acute and Chronic Ambient Air Concentrations, Title 18 Chapter 2 Article 17, December 20072 Arizona Department of Environmental Quality Ambient Air Quality Standards, Title 18 Chapter 2 Article 2, December 20073 EPA Region IX Preliminary Remediation Goals, Ambient Air, October 2004 Wind Speed: 4 EPA National Ambient Air Quality Standards, http://www.epa.gov/air/criteria.html, February 2008 mph5 California Acute Reference Exposure Levels, March 19996 With the exception of arsenic, the averaging time for all listed analytes is one hour. The averaging time for arsenic is four hours.7 The averaging time for the criteria is 24 hours.8 The averaging time for the criteria is the annual arithmetic mean.9 The averaging time for the criteria is the quarterly average.10 Only the PM10 fraction is being measured not the total suspended particulates.11 On May 20, 2008, EPA proposed to revise the National Ambient Air Quality (NAAQS) for lead to within the range of 0.1-0.3 mg/m 3.12 Percent of Total Mass13 Precipitation measurements are recorded manually by a Hayden-Winkelman High School employee; reliability cannot be verified.14 Bold values with bold outline indicate the result exceeds one or more of the comparison criteria. Calm: < 115 Bold italicized values indicate the non-detected result exceeds one or more of the comparison criteria. Wind direction16 * = The result is less than three times the level of uncertainty which is shown in place of the result. toward center17 -- = Not established18 °C = Degrees Celsius19 % = Percent20 J = Estimated value21 mph = miles per hour22 NA = Not Applicable or Not analyzed23 NPR = No precipitation recorded.24 NV = Not valid25 µg/m3 = Micrograms per cubic meter26 PM10 = particulate matter with a diameter less than or equal to 10 microns in size27 R = Rejected28 This table should be considered preliminary and will be revised based on incoming data, final data validation and QA/QC.
EPANationalAmbient
Air QualityStandards4
CaliforniaAcute
ReferenceExposureLevels5 6
Date:Arizona
Hazardous AirPollutants
Ambient AirConcentrations
(Acute)1
ArizonaHazardous Air
PollutantsAmbient Air
Concentrations(Chronic)1
EPARegion IX
PreliminaryRemediation
Goal3
Avg Wind Speed mph):
Avg Ambient Relative Humidity (%):
Avg Wind Direction (degrees):Avg Ambient Temperature (ºC): Arizona
AmbientAir QualityStandards2
Precipitation (inches)13:Result Percent12 Qual1.16 NA
0.0105 0.9475 *0.0024 0.0000 *0.0009 0.0304 *0.0033 0.2825 *
NA NA0.0006 0.0043 *0.0018 0.0000 *0.0129 1.18600.0036 0.1782 *0.0009 0.0000 *0.0024 0.0000 *0.0045 0.41290.0012 0.0478 *0.0009 0.0000 *0.0018 0.0261 *0.0087 0.79970.0030 0.1652 *0.0024 0.0043 *0.0117 0.4042 *0.0012 0.0000 *0.0021 0.0391 *0.0027 0.0000 *0.0021 0.0087 *0.0018 0.0000 *0.0024 0.0000 *0.0034 0.31730.0009 0.0217 *0.0009 0.0043 *0.0186 1.71700.0018 0.0000 *0.0300 1.5780 *0.0012 0.0391 *0.0018 0.0956 *0.0027 0.0000 *0.0009 0.0000 *0.0006 0.0000 *0.0015 0.0304 *0.0015 0.0000 *0.0018 0.0000 *
Calm: 4.17%
7NA
24220.1
03/30/085.84
D >= 17
D 1 - 17 -1 - 7 . ·. ·- -~-- -- .·
···· ·· ... ·::.: .••...• l'°: ::.:::•.·· ····
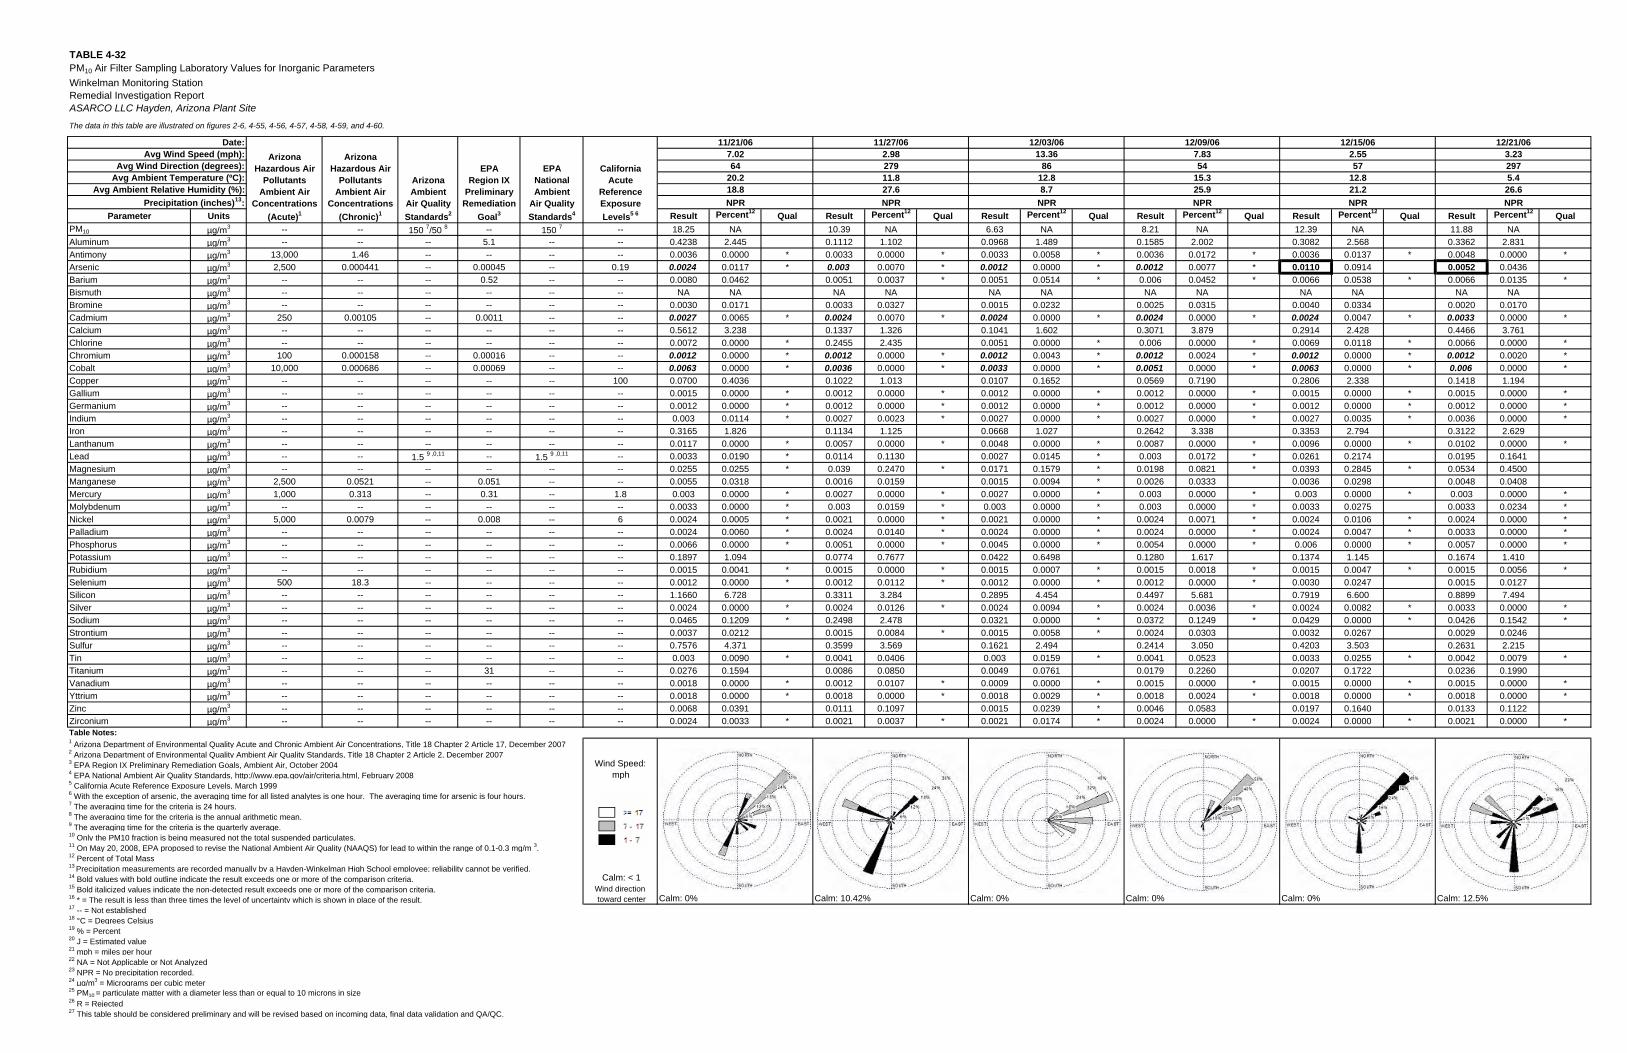
TABLE 4-32PM10 Air Filter Sampling Laboratory Values for Inorganic ParametersWinkelman Monitoring StationRemedial Investigation ReportASARCO LLC Hayden, Arizona Plant Site
The data in this table are illustrated on figures 2-6, 4-55, 4-56, 4-57, 4-58, 4-59, and 4-60.
Parameter Units Result Percent12 Qual Result Percent12 Qual Result Percent12 Qual Result Percent12 Qual Result Percent12 Qual Result Percent12 QualPM10 µg/m3 -- -- 150 7/50 8 -- 150 7 -- 18.25 NA 10.39 NA 6.63 NA 8.21 NA 12.39 NA 11.88 NAAluminum µg/m3 -- -- -- 5.1 -- -- 0.4238 2.445 0.1112 1.102 0.0968 1.489 0.1585 2.002 0.3082 2.568 0.3362 2.831Antimony µg/m3 13,000 1.46 -- -- -- -- 0.0036 0.0000 * 0.0033 0.0000 * 0.0033 0.0058 * 0.0036 0.0172 * 0.0036 0.0137 * 0.0048 0.0000 *Arsenic µg/m3 2,500 0.000441 -- 0.00045 -- 0.19 0.0024 0.0117 * 0.003 0.0070 * 0.0012 0.0000 * 0.0012 0.0077 * 0.0110 0.0914 0.0052 0.0436Barium µg/m3 -- -- -- 0.52 -- -- 0.0080 0.0462 0.0051 0.0037 * 0.0051 0.0514 * 0.006 0.0452 * 0.0066 0.0538 * 0.0066 0.0135 *Bismuth µg/m3 -- -- -- -- -- -- NA NA NA NA NA NA NA NA NA NA NA NABromine µg/m3 -- -- -- -- -- -- 0.0030 0.0171 0.0033 0.0327 0.0015 0.0232 0.0025 0.0315 0.0040 0.0334 0.0020 0.0170Cadmium µg/m3 250 0.00105 -- 0.0011 -- -- 0.0027 0.0065 * 0.0024 0.0070 * 0.0024 0.0000 * 0.0024 0.0000 * 0.0024 0.0047 * 0.0033 0.0000 *Calcium µg/m3 -- -- -- -- -- -- 0.5612 3.238 0.1337 1.326 0.1041 1.602 0.3071 3.879 0.2914 2.428 0.4466 3.761Chlorine µg/m3 -- -- -- -- -- -- 0.0072 0.0000 * 0.2455 2.435 0.0051 0.0000 * 0.006 0.0000 * 0.0069 0.0118 * 0.0066 0.0000 *Chromium µg/m3 100 0.000158 -- 0.00016 -- -- 0.0012 0.0000 * 0.0012 0.0000 * 0.0012 0.0043 * 0.0012 0.0024 * 0.0012 0.0000 * 0.0012 0.0020 *Cobalt µg/m3 10,000 0.000686 -- 0.00069 -- -- 0.0063 0.0000 * 0.0036 0.0000 * 0.0033 0.0000 * 0.0051 0.0000 * 0.0063 0.0000 * 0.006 0.0000 *Copper µg/m3 -- -- -- -- -- 100 0.0700 0.4036 0.1022 1.013 0.0107 0.1652 0.0569 0.7190 0.2806 2.338 0.1418 1.194Gallium µg/m3 -- -- -- -- -- -- 0.0015 0.0000 * 0.0012 0.0000 * 0.0012 0.0000 * 0.0012 0.0000 * 0.0015 0.0000 * 0.0015 0.0000 *Germanium µg/m3 -- -- -- -- -- -- 0.0012 0.0000 * 0.0012 0.0000 * 0.0012 0.0000 * 0.0012 0.0000 * 0.0012 0.0000 * 0.0012 0.0000 *Indium µg/m3 -- -- -- -- -- -- 0.003 0.0114 * 0.0027 0.0023 * 0.0027 0.0000 * 0.0027 0.0000 * 0.0027 0.0035 * 0.0036 0.0000 *Iron µg/m3 -- -- -- -- -- -- 0.3165 1.826 0.1134 1.125 0.0668 1.027 0.2642 3.338 0.3353 2.794 0.3122 2.629Lanthanum µg/m3 -- -- -- -- -- -- 0.0117 0.0000 * 0.0057 0.0000 * 0.0048 0.0000 * 0.0087 0.0000 * 0.0096 0.0000 * 0.0102 0.0000 *Lead µg/m3 -- -- 1.5 9 ,0,11 -- 1.5 9 ,0,11 -- 0.0033 0.0190 * 0.0114 0.1130 0.0027 0.0145 * 0.003 0.0172 * 0.0261 0.2174 0.0195 0.1641Magnesium µg/m3 -- -- -- -- -- -- 0.0255 0.0255 * 0.039 0.2470 * 0.0171 0.1579 * 0.0198 0.0821 * 0.0393 0.2845 * 0.0534 0.4500Manganese µg/m3 2,500 0.0521 -- 0.051 -- -- 0.0055 0.0318 0.0016 0.0159 0.0015 0.0094 * 0.0026 0.0333 0.0036 0.0298 0.0048 0.0408Mercury µg/m3 1,000 0.313 -- 0.31 -- 1.8 0.003 0.0000 * 0.0027 0.0000 * 0.0027 0.0000 * 0.003 0.0000 * 0.003 0.0000 * 0.003 0.0000 *Molybdenum µg/m3 -- -- -- -- -- -- 0.0033 0.0000 * 0.003 0.0159 * 0.003 0.0000 * 0.003 0.0000 * 0.0033 0.0275 0.0033 0.0234 *Nickel µg/m3 5,000 0.0079 -- 0.008 -- 6 0.0024 0.0005 * 0.0021 0.0000 * 0.0021 0.0000 * 0.0024 0.0071 * 0.0024 0.0106 * 0.0024 0.0000 *Palladium µg/m3 -- -- -- -- -- -- 0.0024 0.0060 * 0.0024 0.0140 * 0.0024 0.0000 * 0.0024 0.0000 * 0.0024 0.0047 * 0.0033 0.0000 *Phosphorus µg/m3 -- -- -- -- -- -- 0.0066 0.0000 * 0.0051 0.0000 * 0.0045 0.0000 * 0.0054 0.0000 * 0.006 0.0000 * 0.0057 0.0000 *Potassium µg/m3 -- -- -- -- -- -- 0.1897 1.094 0.0774 0.7677 0.0422 0.6498 0.1280 1.617 0.1374 1.145 0.1674 1.410Rubidium µg/m3 -- -- -- -- -- -- 0.0015 0.0041 * 0.0015 0.0000 * 0.0015 0.0007 * 0.0015 0.0018 * 0.0015 0.0047 * 0.0015 0.0056 *Selenium µg/m3 500 18.3 -- -- -- -- 0.0012 0.0000 * 0.0012 0.0112 * 0.0012 0.0000 * 0.0012 0.0000 * 0.0030 0.0247 0.0015 0.0127Silicon µg/m3 -- -- -- -- -- -- 1.1660 6.728 0.3311 3.284 0.2895 4.454 0.4497 5.681 0.7919 6.600 0.8899 7.494Silver µg/m3 -- -- -- -- -- -- 0.0024 0.0000 * 0.0024 0.0126 * 0.0024 0.0094 * 0.0024 0.0036 * 0.0024 0.0082 * 0.0033 0.0000 *Sodium µg/m3 -- -- -- -- -- -- 0.0465 0.1209 * 0.2498 2.478 0.0321 0.0000 * 0.0372 0.1249 * 0.0429 0.0000 * 0.0426 0.1542 *Strontium µg/m3 -- -- -- -- -- -- 0.0037 0.0212 0.0015 0.0084 * 0.0015 0.0058 * 0.0024 0.0303 0.0032 0.0267 0.0029 0.0246Sulfur µg/m3 -- -- -- -- -- -- 0.7576 4.371 0.3599 3.569 0.1621 2.494 0.2414 3.050 0.4203 3.503 0.2631 2.215Tin µg/m3 -- -- -- -- -- -- 0.003 0.0090 * 0.0041 0.0406 0.003 0.0159 * 0.0041 0.0523 0.0033 0.0255 * 0.0042 0.0079 *Titanium µg/m3 -- -- -- 31 -- -- 0.0276 0.1594 0.0086 0.0850 0.0049 0.0761 0.0179 0.2260 0.0207 0.1722 0.0236 0.1990Vanadium µg/m3 -- -- -- -- -- -- 0.0018 0.0000 * 0.0012 0.0107 * 0.0009 0.0000 * 0.0015 0.0000 * 0.0015 0.0000 * 0.0015 0.0000 *Yttrium µg/m3 -- -- -- -- -- -- 0.0018 0.0000 * 0.0018 0.0000 * 0.0018 0.0029 * 0.0018 0.0024 * 0.0018 0.0000 * 0.0018 0.0000 *Zinc µg/m3 -- -- -- -- -- -- 0.0068 0.0391 0.0111 0.1097 0.0015 0.0239 * 0.0046 0.0583 0.0197 0.1640 0.0133 0.1122Zirconium µg/m3 -- -- -- -- -- -- 0.0024 0.0033 * 0.0021 0.0037 * 0.0021 0.0174 * 0.0024 0.0000 * 0.0024 0.0000 * 0.0021 0.0000 *Table Notes:1 Arizona Department of Environmental Quality Acute and Chronic Ambient Air Concentrations, Title 18 Chapter 2 Article 17, December 20072 Arizona Department of Environmental Quality Ambient Air Quality Standards, Title 18 Chapter 2 Article 2, December 20073 EPA Region IX Preliminary Remediation Goals, Ambient Air, October 2004 Wind Speed: 4 EPA National Ambient Air Quality Standards, http://www.epa.gov/air/criteria.html, February 2008 mph5 California Acute Reference Exposure Levels, March 19996 With the exception of arsenic, the averaging time for all listed analytes is one hour. The averaging time for arsenic is four hours.7 The averaging time for the criteria is 24 hours.8 The averaging time for the criteria is the annual arithmetic mean.9 The averaging time for the criteria is the quarterly average.10 Only the PM10 fraction is being measured not the total suspended particulates.11 On May 20, 2008, EPA proposed to revise the National Ambient Air Quality (NAAQS) for lead to within the range of 0.1-0.3 mg/m 3.12 Percent of Total Mass13 Precipitation measurements are recorded manually by a Hayden-Winkelman High School employee; reliability cannot be verified.14 Bold values with bold outline indicate the result exceeds one or more of the comparison criteria. Calm: < 115 Bold italicized values indicate the non-detected result exceeds one or more of the comparison criteria. Wind direction16 * = The result is less than three times the level of uncertainty which is shown in place of the result. toward center Calm: 0% Calm: 10.42% Calm: 0% Calm: 0% Calm: 0% Calm: 12.5%17 -- = Not established18 °C = Degrees Celsius19 % = Percent20 J = Estimated value21 mph = miles per hour22 NA = Not Applicable or Not Analyzed23 NPR = No precipitation recorded.24 µg/m3 = Micrograms per cubic meter25 PM10 = particulate matter with a diameter less than or equal to 10 microns in size26 R = Rejected27 This table should be considered preliminary and will be revised based on incoming data, final data validation and QA/QC.
EPARegion IX
PreliminaryRemediation
Goal3
Avg Wind Speed (mph):
21.2 26.6
12/09/06 12/15/06 12/21/062.5557
7.8354
15.3 12.8
3.232975.4
25.9Avg Ambient Relative Humidity (%):
8612.88.7
Avg Wind Direction (degrees):Avg Ambient Temperature (ºC):
13.36EPA
NationalAmbient
Air QualityStandards4
CaliforniaAcute
ReferenceExposureLevels5 6
ArizonaHazardous Air
PollutantsAmbient Air
Concentrations(Acute)1
ArizonaAmbient
Air QualityStandards2
11/21/06 11/27/06 12/03/06Date:Arizona
Hazardous AirPollutants
Ambient AirConcentrations
(Chronic)1
2.9827911.827.6
7.0264
20.218.8
Precipitation (inches)13: NPR NPR NPR NPR NPR NPR
D >= 17
D 7 - 17 -1 - 7
HOO )6•i111" •-, .,. __
l/;:t,fi~~j ·' . -•' ... , +-----·
,,__________ :.. _, ,.,·
,., , •' ____ _ t~lllli--•· .l~imi--• ·
- - - ••• .!.. • • , • • • -
__ j E:(luTH--•·
_, , • '
'·----, .. .... tE:OLllti-·• · __ ,,•·
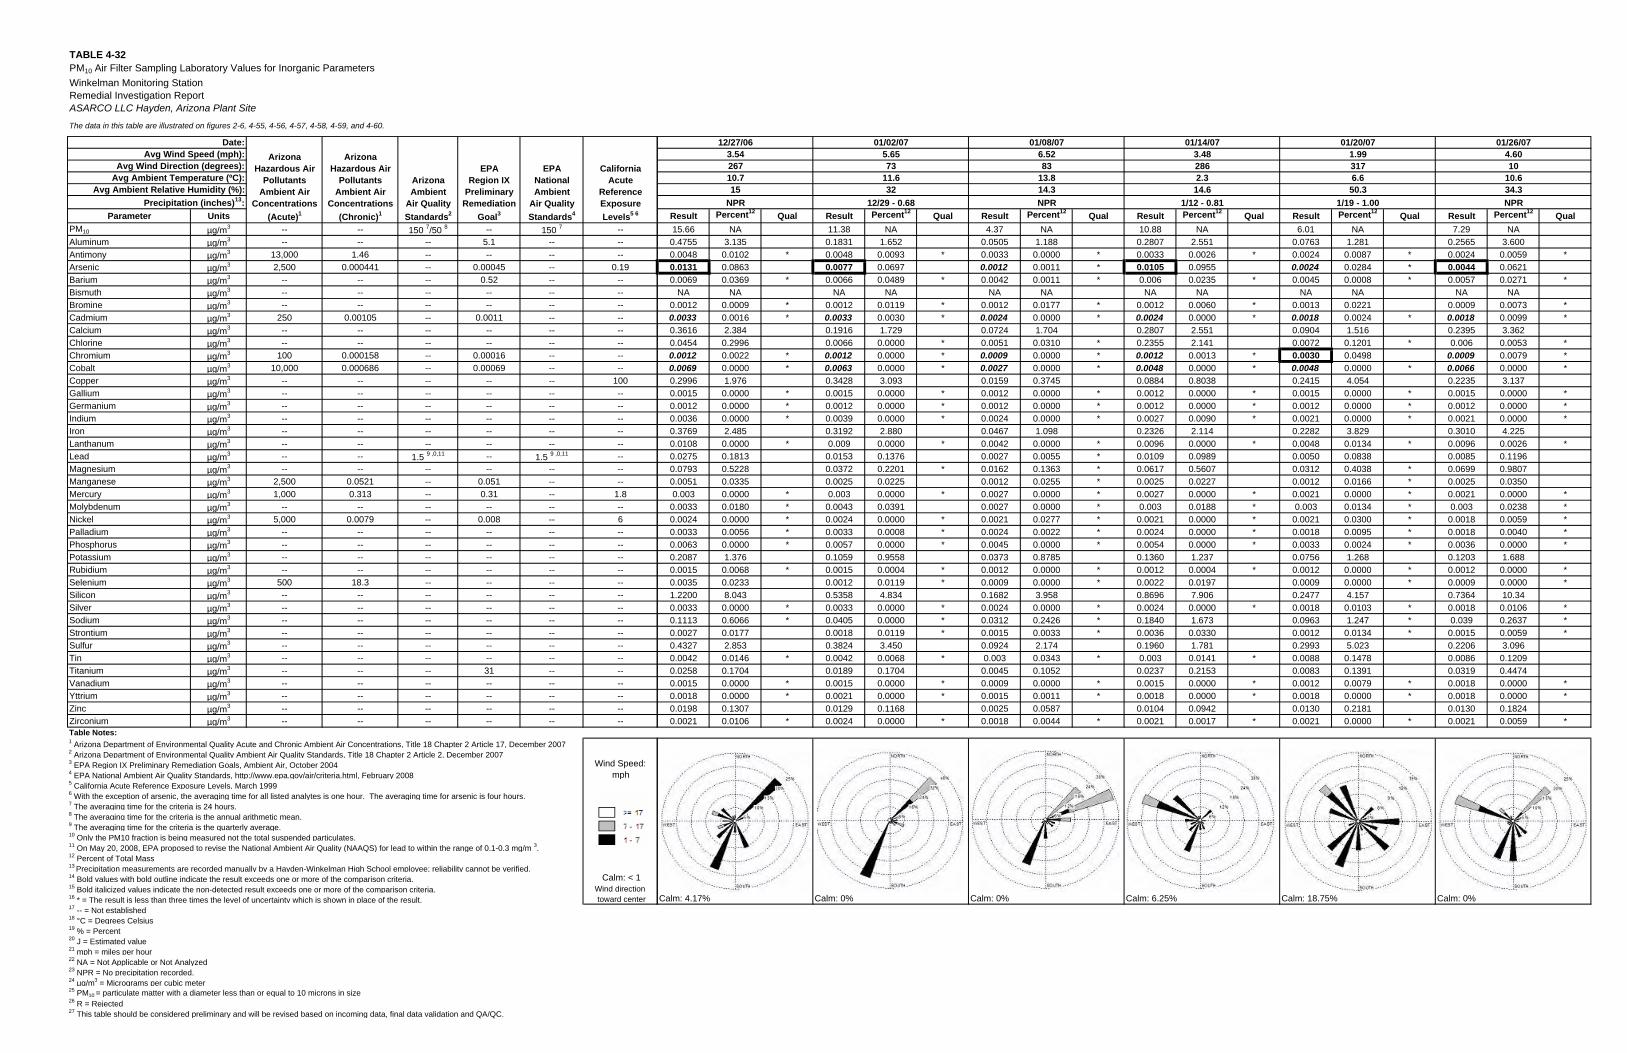
TABLE 4-32PM10 Air Filter Sampling Laboratory Values for Inorganic ParametersWinkelman Monitoring StationRemedial Investigation ReportASARCO LLC Hayden, Arizona Plant Site
The data in this table are illustrated on figures 2-6, 4-55, 4-56, 4-57, 4-58, 4-59, and 4-60.
Parameter UnitsPM10 µg/m3 -- -- 150 7/50 8 -- 150 7 --Aluminum µg/m3 -- -- -- 5.1 -- --Antimony µg/m3 13,000 1.46 -- -- -- --Arsenic µg/m3 2,500 0.000441 -- 0.00045 -- 0.19Barium µg/m3 -- -- -- 0.52 -- --Bismuth µg/m3 -- -- -- -- -- --Bromine µg/m3 -- -- -- -- -- --Cadmium µg/m3 250 0.00105 -- 0.0011 -- --Calcium µg/m3 -- -- -- -- -- --Chlorine µg/m3 -- -- -- -- -- --Chromium µg/m3 100 0.000158 -- 0.00016 -- --Cobalt µg/m3 10,000 0.000686 -- 0.00069 -- --Copper µg/m3 -- -- -- -- -- 100Gallium µg/m3 -- -- -- -- -- --Germanium µg/m3 -- -- -- -- -- --Indium µg/m3 -- -- -- -- -- --Iron µg/m3 -- -- -- -- -- --Lanthanum µg/m3 -- -- -- -- -- --Lead µg/m3 -- -- 1.5 9 ,0,11 -- 1.5 9 ,0,11 --Magnesium µg/m3 -- -- -- -- -- --Manganese µg/m3 2,500 0.0521 -- 0.051 -- --Mercury µg/m3 1,000 0.313 -- 0.31 -- 1.8Molybdenum µg/m3 -- -- -- -- -- --Nickel µg/m3 5,000 0.0079 -- 0.008 -- 6Palladium µg/m3 -- -- -- -- -- --Phosphorus µg/m3 -- -- -- -- -- --Potassium µg/m3 -- -- -- -- -- --Rubidium µg/m3 -- -- -- -- -- --Selenium µg/m3 500 18.3 -- -- -- --Silicon µg/m3 -- -- -- -- -- --Silver µg/m3 -- -- -- -- -- --Sodium µg/m3 -- -- -- -- -- --Strontium µg/m3 -- -- -- -- -- --Sulfur µg/m3 -- -- -- -- -- --Tin µg/m3 -- -- -- -- -- --Titanium µg/m3 -- -- -- 31 -- --Vanadium µg/m3 -- -- -- -- -- --Yttrium µg/m3 -- -- -- -- -- --Zinc µg/m3 -- -- -- -- -- --Zirconium µg/m3 -- -- -- -- -- --Table Notes:1 Arizona Department of Environmental Quality Acute and Chronic Ambient Air Concentrations, Title 18 Chapter 2 Article 17, December 20072 Arizona Department of Environmental Quality Ambient Air Quality Standards, Title 18 Chapter 2 Article 2, December 20073 EPA Region IX Preliminary Remediation Goals, Ambient Air, October 2004 Wind Speed: 4 EPA National Ambient Air Quality Standards, http://www.epa.gov/air/criteria.html, February 2008 mph5 California Acute Reference Exposure Levels, March 19996 With the exception of arsenic, the averaging time for all listed analytes is one hour. The averaging time for arsenic is four hours.7 The averaging time for the criteria is 24 hours.8 The averaging time for the criteria is the annual arithmetic mean.9 The averaging time for the criteria is the quarterly average.10 Only the PM10 fraction is being measured not the total suspended particulates.11 On May 20, 2008, EPA proposed to revise the National Ambient Air Quality (NAAQS) for lead to within the range of 0.1-0.3 mg/m 3.12 Percent of Total Mass13 Precipitation measurements are recorded manually by a Hayden-Winkelman High School employee; reliability cannot be verified.14 Bold values with bold outline indicate the result exceeds one or more of the comparison criteria. Calm: < 115 Bold italicized values indicate the non-detected result exceeds one or more of the comparison criteria. Wind direction16 * = The result is less than three times the level of uncertainty which is shown in place of the result. toward center17 -- = Not established18 °C = Degrees Celsius19 % = Percent20 J = Estimated value21 mph = miles per hour22 NA = Not Applicable or Not Analyzed23 NPR = No precipitation recorded.24 µg/m3 = Micrograms per cubic meter25 PM10 = particulate matter with a diameter less than or equal to 10 microns in size26 R = Rejected27 This table should be considered preliminary and will be revised based on incoming data, final data validation and QA/QC.
EPARegion IX
PreliminaryRemediation
Goal3
Avg Wind Speed (mph):
Avg Ambient Relative Humidity (%):
Avg Wind Direction (degrees):Avg Ambient Temperature (ºC):
EPANationalAmbient
Air QualityStandards4
CaliforniaAcute
ReferenceExposureLevels5 6
ArizonaHazardous Air
PollutantsAmbient Air
Concentrations(Acute)1
ArizonaAmbient
Air QualityStandards2
Date:Arizona
Hazardous AirPollutants
Ambient AirConcentrations
(Chronic)1Precipitation (inches)13:
Result Percent12 Qual Result Percent12 Qual Result Percent12 Qual Result Percent12 Qual Result Percent12 Qual Result Percent12 Qual15.66 NA 11.38 NA 4.37 NA 10.88 NA 6.01 NA 7.29 NA
0.4755 3.135 0.1831 1.652 0.0505 1.188 0.2807 2.551 0.0763 1.281 0.2565 3.6000.0048 0.0102 * 0.0048 0.0093 * 0.0033 0.0000 * 0.0033 0.0026 * 0.0024 0.0087 * 0.0024 0.0059 *0.0131 0.0863 0.0077 0.0697 0.0012 0.0011 * 0.0105 0.0955 0.0024 0.0284 * 0.0044 0.06210.0069 0.0369 * 0.0066 0.0489 * 0.0042 0.0011 * 0.006 0.0235 * 0.0045 0.0008 * 0.0057 0.0271 *
NA NA NA NA NA NA NA NA NA NA NA NA0.0012 0.0009 * 0.0012 0.0119 * 0.0012 0.0177 * 0.0012 0.0060 * 0.0013 0.0221 0.0009 0.0073 *0.0033 0.0016 * 0.0033 0.0030 * 0.0024 0.0000 * 0.0024 0.0000 * 0.0018 0.0024 * 0.0018 0.0099 *0.3616 2.384 0.1916 1.729 0.0724 1.704 0.2807 2.551 0.0904 1.516 0.2395 3.3620.0454 0.2996 0.0066 0.0000 * 0.0051 0.0310 * 0.2355 2.141 0.0072 0.1201 * 0.006 0.0053 *0.0012 0.0022 * 0.0012 0.0000 * 0.0009 0.0000 * 0.0012 0.0013 * 0.0030 0.0498 0.0009 0.0079 *0.0069 0.0000 * 0.0063 0.0000 * 0.0027 0.0000 * 0.0048 0.0000 * 0.0048 0.0000 * 0.0066 0.0000 *0.2996 1.976 0.3428 3.093 0.0159 0.3745 0.0884 0.8038 0.2415 4.054 0.2235 3.1370.0015 0.0000 * 0.0015 0.0000 * 0.0012 0.0000 * 0.0012 0.0000 * 0.0015 0.0000 * 0.0015 0.0000 *0.0012 0.0000 * 0.0012 0.0000 * 0.0012 0.0000 * 0.0012 0.0000 * 0.0012 0.0000 * 0.0012 0.0000 *0.0036 0.0000 * 0.0039 0.0000 * 0.0024 0.0000 * 0.0027 0.0090 * 0.0021 0.0000 * 0.0021 0.0000 *0.3769 2.485 0.3192 2.880 0.0467 1.098 0.2326 2.114 0.2282 3.829 0.3010 4.2250.0108 0.0000 * 0.009 0.0000 * 0.0042 0.0000 * 0.0096 0.0000 * 0.0048 0.0134 * 0.0096 0.0026 *0.0275 0.1813 0.0153 0.1376 0.0027 0.0055 * 0.0109 0.0989 0.0050 0.0838 0.0085 0.11960.0793 0.5228 0.0372 0.2201 * 0.0162 0.1363 * 0.0617 0.5607 0.0312 0.4038 * 0.0699 0.98070.0051 0.0335 0.0025 0.0225 0.0012 0.0255 * 0.0025 0.0227 0.0012 0.0166 * 0.0025 0.03500.003 0.0000 * 0.003 0.0000 * 0.0027 0.0000 * 0.0027 0.0000 * 0.0021 0.0000 * 0.0021 0.0000 *
0.0033 0.0180 * 0.0043 0.0391 0.0027 0.0000 * 0.003 0.0188 * 0.003 0.0134 * 0.003 0.0238 *0.0024 0.0000 * 0.0024 0.0000 * 0.0021 0.0277 * 0.0021 0.0000 * 0.0021 0.0300 * 0.0018 0.0059 *0.0033 0.0056 * 0.0033 0.0008 * 0.0024 0.0022 * 0.0024 0.0000 * 0.0018 0.0095 * 0.0018 0.0040 *0.0063 0.0000 * 0.0057 0.0000 * 0.0045 0.0000 * 0.0054 0.0000 * 0.0033 0.0024 * 0.0036 0.0000 *0.2087 1.376 0.1059 0.9558 0.0373 0.8785 0.1360 1.237 0.0756 1.268 0.1203 1.6880.0015 0.0068 * 0.0015 0.0004 * 0.0012 0.0000 * 0.0012 0.0004 * 0.0012 0.0000 * 0.0012 0.0000 *0.0035 0.0233 0.0012 0.0119 * 0.0009 0.0000 * 0.0022 0.0197 0.0009 0.0000 * 0.0009 0.0000 *1.2200 8.043 0.5358 4.834 0.1682 3.958 0.8696 7.906 0.2477 4.157 0.7364 10.340.0033 0.0000 * 0.0033 0.0000 * 0.0024 0.0000 * 0.0024 0.0000 * 0.0018 0.0103 * 0.0018 0.0106 *0.1113 0.6066 * 0.0405 0.0000 * 0.0312 0.2426 * 0.1840 1.673 0.0963 1.247 * 0.039 0.2637 *0.0027 0.0177 0.0018 0.0119 * 0.0015 0.0033 * 0.0036 0.0330 0.0012 0.0134 * 0.0015 0.0059 *0.4327 2.853 0.3824 3.450 0.0924 2.174 0.1960 1.781 0.2993 5.023 0.2206 3.0960.0042 0.0146 * 0.0042 0.0068 * 0.003 0.0343 * 0.003 0.0141 * 0.0088 0.1478 0.0086 0.12090.0258 0.1704 0.0189 0.1704 0.0045 0.1052 0.0237 0.2153 0.0083 0.1391 0.0319 0.44740.0015 0.0000 * 0.0015 0.0000 * 0.0009 0.0000 * 0.0015 0.0000 * 0.0012 0.0079 * 0.0018 0.0000 *0.0018 0.0000 * 0.0021 0.0000 * 0.0015 0.0011 * 0.0018 0.0000 * 0.0018 0.0000 * 0.0018 0.0000 *0.0198 0.1307 0.0129 0.1168 0.0025 0.0587 0.0104 0.0942 0.0130 0.2181 0.0130 0.18240.0021 0.0106 * 0.0024 0.0000 * 0.0018 0.0044 * 0.0021 0.0017 * 0.0021 0.0000 * 0.0021 0.0059 *
Calm: 4.17% Calm: 0% Calm: 0% Calm: 6.25% Calm: 18.75% Calm: 0%
4.6010
10.634.3
1.993176.650.3
3.482862.314.6
5.65 6.52
15
7311.632
8313.814.3
01/14/07 01/20/07 01/26/0712/27/06 01/02/07 01/08/073.5426710.7
NPR 12/29 - 0.68 NPR 1/12 - 0.81 1/19 - 1.00 NPR
D >= 17
D 7 - 17 -1 - 7
___ , .. --- ; ... ._,,.,,,·
, .•'
~sir· -- -f --
\ ..
·,.,_ - .•• -- ~!l:('lfllt •• , -
.. ,--- :I()~ -----··r··-·--
.-•'
__ , .,,•' ,,•'
.-- -~IOrmi .• ,,_
, .. -- :···· ··•,,,
, __ , . ,,-- · · ···-:---- - ···• •• , _ Jillri
•' ,-· ,~'Iii_
~J~-\~ >t~ . --, .. ·-+- - ··
··., ', .
; ' ···:£,..91' :
! .
·-----. -+-------·' __ ,,., -,. ___ __ J,OUlli- ,.
'• •,
--------- --~"™-"' ,,•'
_ ___ .• ,---- ]liO~ ·-,, ____ _
/,,•·•'·~>---:·.·.::··--- :-·---
--·•'
···-··t··'"""" __ ,.,-• '
-- - -~1!!(11.1'™ __ ,
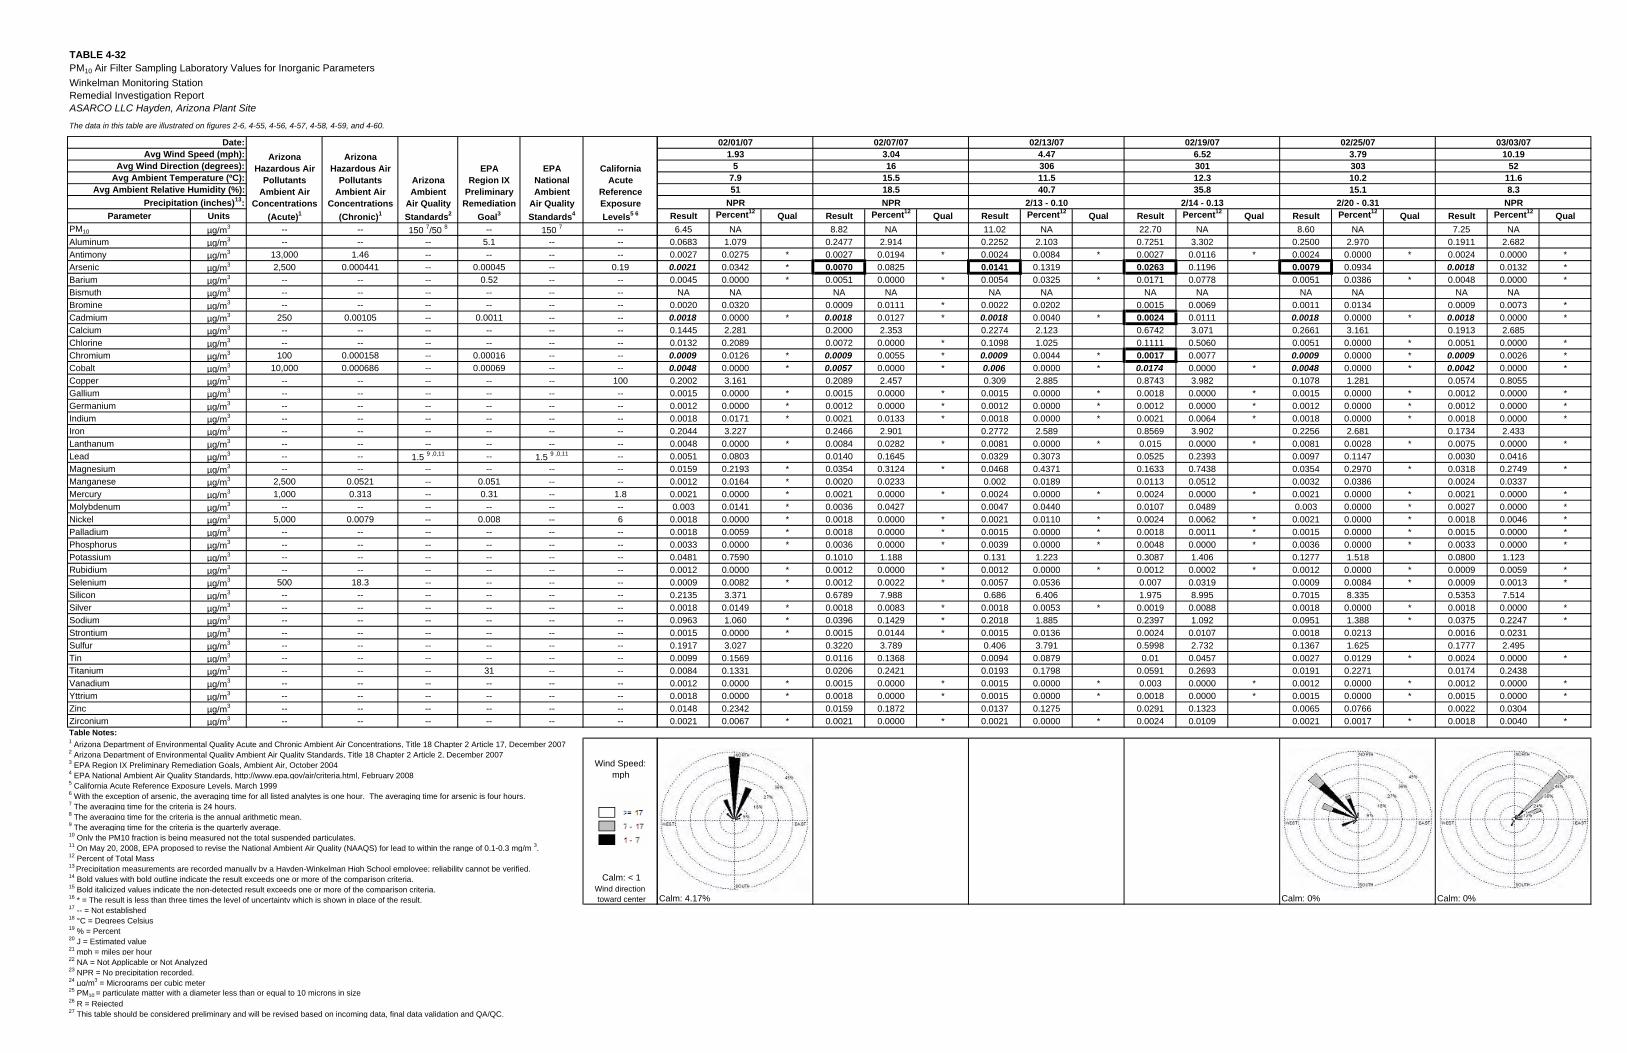
TABLE 4-32PM10 Air Filter Sampling Laboratory Values for Inorganic ParametersWinkelman Monitoring StationRemedial Investigation ReportASARCO LLC Hayden, Arizona Plant Site
The data in this table are illustrated on figures 2-6, 4-55, 4-56, 4-57, 4-58, 4-59, and 4-60.
Parameter UnitsPM10 µg/m3 -- -- 150 7/50 8 -- 150 7 --Aluminum µg/m3 -- -- -- 5.1 -- --Antimony µg/m3 13,000 1.46 -- -- -- --Arsenic µg/m3 2,500 0.000441 -- 0.00045 -- 0.19Barium µg/m3 -- -- -- 0.52 -- --Bismuth µg/m3 -- -- -- -- -- --Bromine µg/m3 -- -- -- -- -- --Cadmium µg/m3 250 0.00105 -- 0.0011 -- --Calcium µg/m3 -- -- -- -- -- --Chlorine µg/m3 -- -- -- -- -- --Chromium µg/m3 100 0.000158 -- 0.00016 -- --Cobalt µg/m3 10,000 0.000686 -- 0.00069 -- --Copper µg/m3 -- -- -- -- -- 100Gallium µg/m3 -- -- -- -- -- --Germanium µg/m3 -- -- -- -- -- --Indium µg/m3 -- -- -- -- -- --Iron µg/m3 -- -- -- -- -- --Lanthanum µg/m3 -- -- -- -- -- --Lead µg/m3 -- -- 1.5 9 ,0,11 -- 1.5 9 ,0,11 --Magnesium µg/m3 -- -- -- -- -- --Manganese µg/m3 2,500 0.0521 -- 0.051 -- --Mercury µg/m3 1,000 0.313 -- 0.31 -- 1.8Molybdenum µg/m3 -- -- -- -- -- --Nickel µg/m3 5,000 0.0079 -- 0.008 -- 6Palladium µg/m3 -- -- -- -- -- --Phosphorus µg/m3 -- -- -- -- -- --Potassium µg/m3 -- -- -- -- -- --Rubidium µg/m3 -- -- -- -- -- --Selenium µg/m3 500 18.3 -- -- -- --Silicon µg/m3 -- -- -- -- -- --Silver µg/m3 -- -- -- -- -- --Sodium µg/m3 -- -- -- -- -- --Strontium µg/m3 -- -- -- -- -- --Sulfur µg/m3 -- -- -- -- -- --Tin µg/m3 -- -- -- -- -- --Titanium µg/m3 -- -- -- 31 -- --Vanadium µg/m3 -- -- -- -- -- --Yttrium µg/m3 -- -- -- -- -- --Zinc µg/m3 -- -- -- -- -- --Zirconium µg/m3 -- -- -- -- -- --Table Notes:1 Arizona Department of Environmental Quality Acute and Chronic Ambient Air Concentrations, Title 18 Chapter 2 Article 17, December 20072 Arizona Department of Environmental Quality Ambient Air Quality Standards, Title 18 Chapter 2 Article 2, December 20073 EPA Region IX Preliminary Remediation Goals, Ambient Air, October 2004 Wind Speed: 4 EPA National Ambient Air Quality Standards, http://www.epa.gov/air/criteria.html, February 2008 mph5 California Acute Reference Exposure Levels, March 19996 With the exception of arsenic, the averaging time for all listed analytes is one hour. The averaging time for arsenic is four hours.7 The averaging time for the criteria is 24 hours.8 The averaging time for the criteria is the annual arithmetic mean.9 The averaging time for the criteria is the quarterly average.10 Only the PM10 fraction is being measured not the total suspended particulates.11 On May 20, 2008, EPA proposed to revise the National Ambient Air Quality (NAAQS) for lead to within the range of 0.1-0.3 mg/m 3.12 Percent of Total Mass13 Precipitation measurements are recorded manually by a Hayden-Winkelman High School employee; reliability cannot be verified.14 Bold values with bold outline indicate the result exceeds one or more of the comparison criteria. Calm: < 115 Bold italicized values indicate the non-detected result exceeds one or more of the comparison criteria. Wind direction16 * = The result is less than three times the level of uncertainty which is shown in place of the result. toward center17 -- = Not established18 °C = Degrees Celsius19 % = Percent20 J = Estimated value21 mph = miles per hour22 NA = Not Applicable or Not Analyzed23 NPR = No precipitation recorded.24 µg/m3 = Micrograms per cubic meter25 PM10 = particulate matter with a diameter less than or equal to 10 microns in size26 R = Rejected27 This table should be considered preliminary and will be revised based on incoming data, final data validation and QA/QC.
EPARegion IX
PreliminaryRemediation
Goal3
Avg Wind Speed (mph):
Avg Ambient Relative Humidity (%):
Avg Wind Direction (degrees):Avg Ambient Temperature (ºC):
EPANationalAmbient
Air QualityStandards4
CaliforniaAcute
ReferenceExposureLevels5 6
ArizonaHazardous Air
PollutantsAmbient Air
Concentrations(Acute)1
ArizonaAmbient
Air QualityStandards2
Date:Arizona
Hazardous AirPollutants
Ambient AirConcentrations
(Chronic)1Precipitation (inches)13:
Result Percent12 Qual Result Percent12 Qual Result Percent12 Qual Result Percent12 Qual Result Percent12 Qual Result Percent12 Qual6.45 NA 8.82 NA 11.02 NA 22.70 NA 8.60 NA 7.25 NA
0.0683 1.079 0.2477 2.914 0.2252 2.103 0.7251 3.302 0.2500 2.970 0.1911 2.6820.0027 0.0275 * 0.0027 0.0194 * 0.0024 0.0084 * 0.0027 0.0116 * 0.0024 0.0000 * 0.0024 0.0000 *0.0021 0.0342 * 0.0070 0.0825 0.0141 0.1319 0.0263 0.1196 0.0079 0.0934 0.0018 0.0132 *0.0045 0.0000 * 0.0051 0.0000 * 0.0054 0.0325 * 0.0171 0.0778 0.0051 0.0386 * 0.0048 0.0000 *
NA NA NA NA NA NA NA NA NA NA NA NA0.0020 0.0320 0.0009 0.0111 * 0.0022 0.0202 0.0015 0.0069 0.0011 0.0134 0.0009 0.0073 *0.0018 0.0000 * 0.0018 0.0127 * 0.0018 0.0040 * 0.0024 0.0111 0.0018 0.0000 * 0.0018 0.0000 *0.1445 2.281 0.2000 2.353 0.2274 2.123 0.6742 3.071 0.2661 3.161 0.1913 2.6850.0132 0.2089 0.0072 0.0000 * 0.1098 1.025 0.1111 0.5060 0.0051 0.0000 * 0.0051 0.0000 *0.0009 0.0126 * 0.0009 0.0055 * 0.0009 0.0044 * 0.0017 0.0077 0.0009 0.0000 * 0.0009 0.0026 *0.0048 0.0000 * 0.0057 0.0000 * 0.006 0.0000 * 0.0174 0.0000 * 0.0048 0.0000 * 0.0042 0.0000 *0.2002 3.161 0.2089 2.457 0.309 2.885 0.8743 3.982 0.1078 1.281 0.0574 0.80550.0015 0.0000 * 0.0015 0.0000 * 0.0015 0.0000 * 0.0018 0.0000 * 0.0015 0.0000 * 0.0012 0.0000 *0.0012 0.0000 * 0.0012 0.0000 * 0.0012 0.0000 * 0.0012 0.0000 * 0.0012 0.0000 * 0.0012 0.0000 *0.0018 0.0171 * 0.0021 0.0133 * 0.0018 0.0000 * 0.0021 0.0064 * 0.0018 0.0000 * 0.0018 0.0000 *0.2044 3.227 0.2466 2.901 0.2772 2.589 0.8569 3.902 0.2256 2.681 0.1734 2.4330.0048 0.0000 * 0.0084 0.0282 * 0.0081 0.0000 * 0.015 0.0000 * 0.0081 0.0028 * 0.0075 0.0000 *0.0051 0.0803 0.0140 0.1645 0.0329 0.3073 0.0525 0.2393 0.0097 0.1147 0.0030 0.04160.0159 0.2193 * 0.0354 0.3124 * 0.0468 0.4371 0.1633 0.7438 0.0354 0.2970 * 0.0318 0.2749 *0.0012 0.0164 * 0.0020 0.0233 0.002 0.0189 0.0113 0.0512 0.0032 0.0386 0.0024 0.03370.0021 0.0000 * 0.0021 0.0000 * 0.0024 0.0000 * 0.0024 0.0000 * 0.0021 0.0000 * 0.0021 0.0000 *0.003 0.0141 * 0.0036 0.0427 0.0047 0.0440 0.0107 0.0489 0.003 0.0000 * 0.0027 0.0000 *
0.0018 0.0000 * 0.0018 0.0000 * 0.0021 0.0110 * 0.0024 0.0062 * 0.0021 0.0000 * 0.0018 0.0046 *0.0018 0.0059 * 0.0018 0.0000 * 0.0015 0.0000 * 0.0018 0.0011 * 0.0015 0.0000 * 0.0015 0.0000 *0.0033 0.0000 * 0.0036 0.0000 * 0.0039 0.0000 * 0.0048 0.0000 * 0.0036 0.0000 * 0.0033 0.0000 *0.0481 0.7590 0.1010 1.188 0.131 1.223 0.3087 1.406 0.1277 1.518 0.0800 1.1230.0012 0.0000 * 0.0012 0.0000 * 0.0012 0.0000 * 0.0012 0.0002 * 0.0012 0.0000 * 0.0009 0.0059 *0.0009 0.0082 * 0.0012 0.0022 * 0.0057 0.0536 0.007 0.0319 0.0009 0.0084 * 0.0009 0.0013 *0.2135 3.371 0.6789 7.988 0.686 6.406 1.975 8.995 0.7015 8.335 0.5353 7.5140.0018 0.0149 * 0.0018 0.0083 * 0.0018 0.0053 * 0.0019 0.0088 0.0018 0.0000 * 0.0018 0.0000 *0.0963 1.060 * 0.0396 0.1429 * 0.2018 1.885 0.2397 1.092 0.0951 1.388 * 0.0375 0.2247 *0.0015 0.0000 * 0.0015 0.0144 * 0.0015 0.0136 0.0024 0.0107 0.0018 0.0213 0.0016 0.02310.1917 3.027 0.3220 3.789 0.406 3.791 0.5998 2.732 0.1367 1.625 0.1777 2.4950.0099 0.1569 0.0116 0.1368 0.0094 0.0879 0.01 0.0457 0.0027 0.0129 * 0.0024 0.0000 *0.0084 0.1331 0.0206 0.2421 0.0193 0.1798 0.0591 0.2693 0.0191 0.2271 0.0174 0.24380.0012 0.0000 * 0.0015 0.0000 * 0.0015 0.0000 * 0.003 0.0000 * 0.0012 0.0000 * 0.0012 0.0000 *0.0018 0.0000 * 0.0018 0.0000 * 0.0015 0.0000 * 0.0018 0.0000 * 0.0015 0.0000 * 0.0015 0.0000 *0.0148 0.2342 0.0159 0.1872 0.0137 0.1275 0.0291 0.1323 0.0065 0.0766 0.0022 0.03040.0021 0.0067 * 0.0021 0.0000 * 0.0021 0.0000 * 0.0024 0.0109 0.0021 0.0017 * 0.0018 0.0040 *
Calm: 4.17% Calm: 0% Calm: 0%
10.1952
11.68.3
3.7930310.215.1
6.5230112.335.8
4.4730611.540.7
3.0416
15.518.5
1.935
7.951
03/03/0702/07/07 02/13/07 02/19/07 02/25/0702/01/07
NPR NPR 2/13 - 0.10 2/14 - 0.13 2/20 - 0.31 NPR
D >= 17
D 7 - 17 -1 - 7
·,. __ _ ····--t·•'"""" ,.,,•' .. . ..i~lITTI-·'··
.- -·· ,-· •• - -~iiof!TH ,, ·-., ._
-... _ t _,. ,-•' ' ..• ·- -~li:',)l,l'Jl,I __ , --
,· __ .,.···'··· .... - /
-. •, ,.,·
-~----·-· ·------- .t~IJ'™-·•·
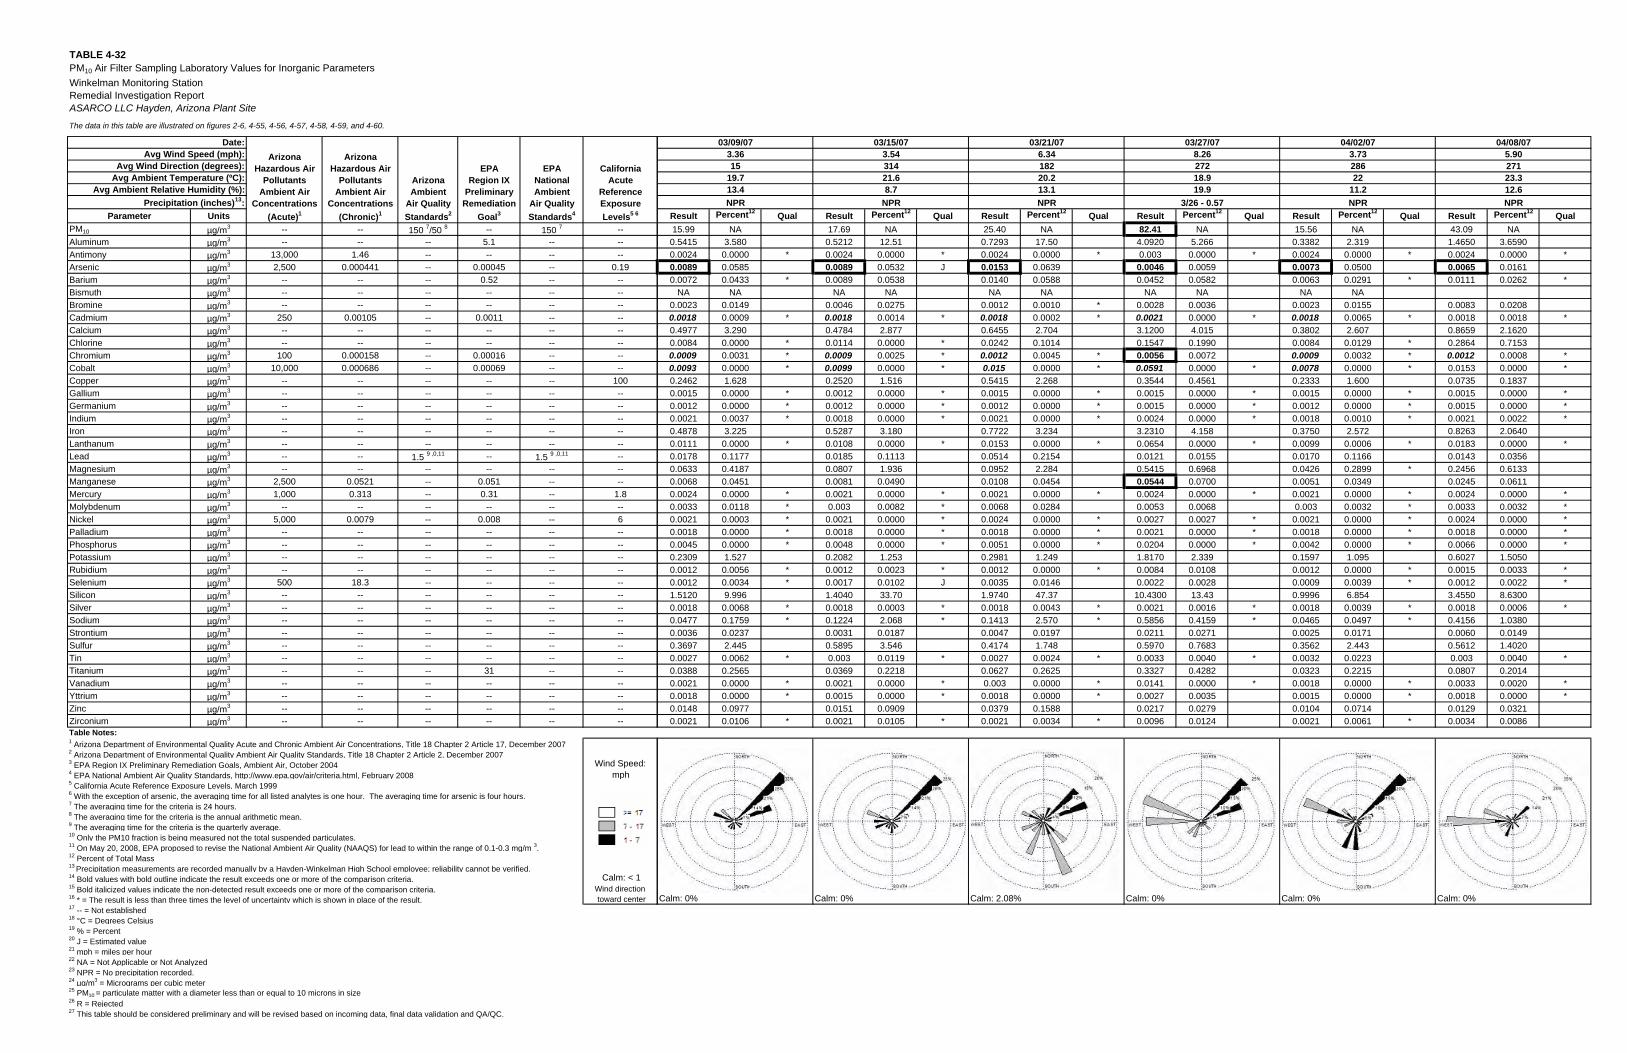
TABLE 4-32PM10 Air Filter Sampling Laboratory Values for Inorganic ParametersWinkelman Monitoring StationRemedial Investigation ReportASARCO LLC Hayden, Arizona Plant Site
The data in this table are illustrated on figures 2-6, 4-55, 4-56, 4-57, 4-58, 4-59, and 4-60.
Parameter UnitsPM10 µg/m3 -- -- 150 7/50 8 -- 150 7 --Aluminum µg/m3 -- -- -- 5.1 -- --Antimony µg/m3 13,000 1.46 -- -- -- --Arsenic µg/m3 2,500 0.000441 -- 0.00045 -- 0.19Barium µg/m3 -- -- -- 0.52 -- --Bismuth µg/m3 -- -- -- -- -- --Bromine µg/m3 -- -- -- -- -- --Cadmium µg/m3 250 0.00105 -- 0.0011 -- --Calcium µg/m3 -- -- -- -- -- --Chlorine µg/m3 -- -- -- -- -- --Chromium µg/m3 100 0.000158 -- 0.00016 -- --Cobalt µg/m3 10,000 0.000686 -- 0.00069 -- --Copper µg/m3 -- -- -- -- -- 100Gallium µg/m3 -- -- -- -- -- --Germanium µg/m3 -- -- -- -- -- --Indium µg/m3 -- -- -- -- -- --Iron µg/m3 -- -- -- -- -- --Lanthanum µg/m3 -- -- -- -- -- --Lead µg/m3 -- -- 1.5 9 ,0,11 -- 1.5 9 ,0,11 --Magnesium µg/m3 -- -- -- -- -- --Manganese µg/m3 2,500 0.0521 -- 0.051 -- --Mercury µg/m3 1,000 0.313 -- 0.31 -- 1.8Molybdenum µg/m3 -- -- -- -- -- --Nickel µg/m3 5,000 0.0079 -- 0.008 -- 6Palladium µg/m3 -- -- -- -- -- --Phosphorus µg/m3 -- -- -- -- -- --Potassium µg/m3 -- -- -- -- -- --Rubidium µg/m3 -- -- -- -- -- --Selenium µg/m3 500 18.3 -- -- -- --Silicon µg/m3 -- -- -- -- -- --Silver µg/m3 -- -- -- -- -- --Sodium µg/m3 -- -- -- -- -- --Strontium µg/m3 -- -- -- -- -- --Sulfur µg/m3 -- -- -- -- -- --Tin µg/m3 -- -- -- -- -- --Titanium µg/m3 -- -- -- 31 -- --Vanadium µg/m3 -- -- -- -- -- --Yttrium µg/m3 -- -- -- -- -- --Zinc µg/m3 -- -- -- -- -- --Zirconium µg/m3 -- -- -- -- -- --Table Notes:1 Arizona Department of Environmental Quality Acute and Chronic Ambient Air Concentrations, Title 18 Chapter 2 Article 17, December 20072 Arizona Department of Environmental Quality Ambient Air Quality Standards, Title 18 Chapter 2 Article 2, December 20073 EPA Region IX Preliminary Remediation Goals, Ambient Air, October 2004 Wind Speed: 4 EPA National Ambient Air Quality Standards, http://www.epa.gov/air/criteria.html, February 2008 mph5 California Acute Reference Exposure Levels, March 19996 With the exception of arsenic, the averaging time for all listed analytes is one hour. The averaging time for arsenic is four hours.7 The averaging time for the criteria is 24 hours.8 The averaging time for the criteria is the annual arithmetic mean.9 The averaging time for the criteria is the quarterly average.10 Only the PM10 fraction is being measured not the total suspended particulates.11 On May 20, 2008, EPA proposed to revise the National Ambient Air Quality (NAAQS) for lead to within the range of 0.1-0.3 mg/m 3.12 Percent of Total Mass13 Precipitation measurements are recorded manually by a Hayden-Winkelman High School employee; reliability cannot be verified.14 Bold values with bold outline indicate the result exceeds one or more of the comparison criteria. Calm: < 115 Bold italicized values indicate the non-detected result exceeds one or more of the comparison criteria. Wind direction16 * = The result is less than three times the level of uncertainty which is shown in place of the result. toward center17 -- = Not established18 °C = Degrees Celsius19 % = Percent20 J = Estimated value21 mph = miles per hour22 NA = Not Applicable or Not Analyzed23 NPR = No precipitation recorded.24 µg/m3 = Micrograms per cubic meter25 PM10 = particulate matter with a diameter less than or equal to 10 microns in size26 R = Rejected27 This table should be considered preliminary and will be revised based on incoming data, final data validation and QA/QC.
EPARegion IX
PreliminaryRemediation
Goal3
Avg Wind Speed (mph):
Avg Ambient Relative Humidity (%):
Avg Wind Direction (degrees):Avg Ambient Temperature (ºC):
EPANationalAmbient
Air QualityStandards4
CaliforniaAcute
ReferenceExposureLevels5 6
ArizonaHazardous Air
PollutantsAmbient Air
Concentrations(Acute)1
ArizonaAmbient
Air QualityStandards2
Date:Arizona
Hazardous AirPollutants
Ambient AirConcentrations
(Chronic)1Precipitation (inches)13:
Result Percent12 Qual Result Percent12 Qual Result Percent12 Qual Result Percent12 Qual Result Percent12 Qual Result Percent12 Qual15.99 NA 17.69 NA 25.40 NA 82.41 NA 15.56 NA 43.09 NA
0.5415 3.580 0.5212 12.51 0.7293 17.50 4.0920 5.266 0.3382 2.319 1.4650 3.65900.0024 0.0000 * 0.0024 0.0000 * 0.0024 0.0000 * 0.003 0.0000 * 0.0024 0.0000 * 0.0024 0.0000 *0.0089 0.0585 0.0089 0.0532 J 0.0153 0.0639 0.0046 0.0059 0.0073 0.0500 0.0065 0.01610.0072 0.0433 * 0.0089 0.0538 0.0140 0.0588 0.0452 0.0582 0.0063 0.0291 * 0.0111 0.0262 *
NA NA NA NA NA NA NA NA NA NA0.0023 0.0149 0.0046 0.0275 0.0012 0.0010 * 0.0028 0.0036 0.0023 0.0155 0.0083 0.02080.0018 0.0009 * 0.0018 0.0014 * 0.0018 0.0002 * 0.0021 0.0000 * 0.0018 0.0065 * 0.0018 0.0018 *0.4977 3.290 0.4784 2.877 0.6455 2.704 3.1200 4.015 0.3802 2.607 0.8659 2.16200.0084 0.0000 * 0.0114 0.0000 * 0.0242 0.1014 0.1547 0.1990 0.0084 0.0129 * 0.2864 0.71530.0009 0.0031 * 0.0009 0.0025 * 0.0012 0.0045 * 0.0056 0.0072 0.0009 0.0032 * 0.0012 0.0008 *0.0093 0.0000 * 0.0099 0.0000 * 0.015 0.0000 * 0.0591 0.0000 * 0.0078 0.0000 * 0.0153 0.0000 *0.2462 1.628 0.2520 1.516 0.5415 2.268 0.3544 0.4561 0.2333 1.600 0.0735 0.18370.0015 0.0000 * 0.0012 0.0000 * 0.0015 0.0000 * 0.0015 0.0000 * 0.0015 0.0000 * 0.0015 0.0000 *0.0012 0.0000 * 0.0012 0.0000 * 0.0012 0.0000 * 0.0015 0.0000 * 0.0012 0.0000 * 0.0015 0.0000 *0.0021 0.0037 * 0.0018 0.0000 * 0.0021 0.0000 * 0.0024 0.0000 * 0.0018 0.0010 * 0.0021 0.0022 *0.4878 3.225 0.5287 3.180 0.7722 3.234 3.2310 4.158 0.3750 2.572 0.8263 2.06400.0111 0.0000 * 0.0108 0.0000 * 0.0153 0.0000 * 0.0654 0.0000 * 0.0099 0.0006 * 0.0183 0.0000 *0.0178 0.1177 0.0185 0.1113 0.0514 0.2154 0.0121 0.0155 0.0170 0.1166 0.0143 0.03560.0633 0.4187 0.0807 1.936 0.0952 2.284 0.5415 0.6968 0.0426 0.2899 * 0.2456 0.61330.0068 0.0451 0.0081 0.0490 0.0108 0.0454 0.0544 0.0700 0.0051 0.0349 0.0245 0.06110.0024 0.0000 * 0.0021 0.0000 * 0.0021 0.0000 * 0.0024 0.0000 * 0.0021 0.0000 * 0.0024 0.0000 *0.0033 0.0118 * 0.003 0.0082 * 0.0068 0.0284 0.0053 0.0068 0.003 0.0032 * 0.0033 0.0032 *0.0021 0.0003 * 0.0021 0.0000 * 0.0024 0.0000 * 0.0027 0.0027 * 0.0021 0.0000 * 0.0024 0.0000 *0.0018 0.0000 * 0.0018 0.0000 * 0.0018 0.0000 * 0.0021 0.0000 * 0.0018 0.0000 * 0.0018 0.0000 *0.0045 0.0000 * 0.0048 0.0000 * 0.0051 0.0000 * 0.0204 0.0000 * 0.0042 0.0000 * 0.0066 0.0000 *0.2309 1.527 0.2082 1.253 0.2981 1.249 1.8170 2.339 0.1597 1.095 0.6027 1.50500.0012 0.0056 * 0.0012 0.0023 * 0.0012 0.0000 * 0.0084 0.0108 0.0012 0.0000 * 0.0015 0.0033 *0.0012 0.0034 * 0.0017 0.0102 J 0.0035 0.0146 0.0022 0.0028 0.0009 0.0039 * 0.0012 0.0022 *1.5120 9.996 1.4040 33.70 1.9740 47.37 10.4300 13.43 0.9996 6.854 3.4550 8.63000.0018 0.0068 * 0.0018 0.0003 * 0.0018 0.0043 * 0.0021 0.0016 * 0.0018 0.0039 * 0.0018 0.0006 *0.0477 0.1759 * 0.1224 2.068 * 0.1413 2.570 * 0.5856 0.4159 * 0.0465 0.0497 * 0.4156 1.03800.0036 0.0237 0.0031 0.0187 0.0047 0.0197 0.0211 0.0271 0.0025 0.0171 0.0060 0.01490.3697 2.445 0.5895 3.546 0.4174 1.748 0.5970 0.7683 0.3562 2.443 0.5612 1.40200.0027 0.0062 * 0.003 0.0119 * 0.0027 0.0024 * 0.0033 0.0040 * 0.0032 0.0223 0.003 0.0040 *0.0388 0.2565 0.0369 0.2218 0.0627 0.2625 0.3327 0.4282 0.0323 0.2215 0.0807 0.20140.0021 0.0000 * 0.0021 0.0000 * 0.003 0.0000 * 0.0141 0.0000 * 0.0018 0.0000 * 0.0033 0.0020 *0.0018 0.0000 * 0.0015 0.0000 * 0.0018 0.0000 * 0.0027 0.0035 0.0015 0.0000 * 0.0018 0.0000 *0.0148 0.0977 0.0151 0.0909 0.0379 0.1588 0.0217 0.0279 0.0104 0.0714 0.0129 0.03210.0021 0.0106 * 0.0021 0.0105 * 0.0021 0.0034 * 0.0096 0.0124 0.0021 0.0061 * 0.0034 0.0086
Calm: 0% Calm: 0% Calm: 2.08% Calm: 0% Calm: 0% Calm: 0%
12.6
04/08/075.9027123.3
6.3418220.213.1
3.5431421.68.7
3.3615
19.713.4
04/02/0703/09/07 03/15/07 03/21/07 03/27/073.7328622
11.2
8.2627218.919.9
NPR NPR NPR 3/26 - 0.57 NPR NPR
D >= 17
D 7 - 17 -1 - 7
'•, . ,
. , . ,
__ •• ,--- ]worill!· ·,, •••• __
r" " ' " .. ······--
,,_ ··, .•. ,_T __ _ .. ..... , ... •• •. -~E:"JlITTI _.,-·
··--:~~= r : r
/
. , .,
__ •• , •• ---··· ·:ioATH' •,, -.,.
.. •,
., __ ,.,• · --,.,_ ...... ; .. , .. ---··
--- .. l~IITM--• ·· ,.,,•·
.. •,
.••• •······ ]wo.m-1·-,, •• ,. --- .....
- - , . • . ,.! .• -·
······;----·-·· - --~~l.fTlt----··'·/•'
--·· - 1i.:iFi™'•,, ··-.
. , ·:,···-·- ·•,,, .... -•' ' ;/_,,,-· •••. ~t"'i\
/ ,.. , •• ,· --•• , 3"": ' . ---··1 ··--- :1: ....
~ .. :_:_,:::,;:7\:,. ~--, ····-~----- --·•' __ .,· ··-·; .,... '
____ jS;Ql.lll-l--•·· •'·'' '
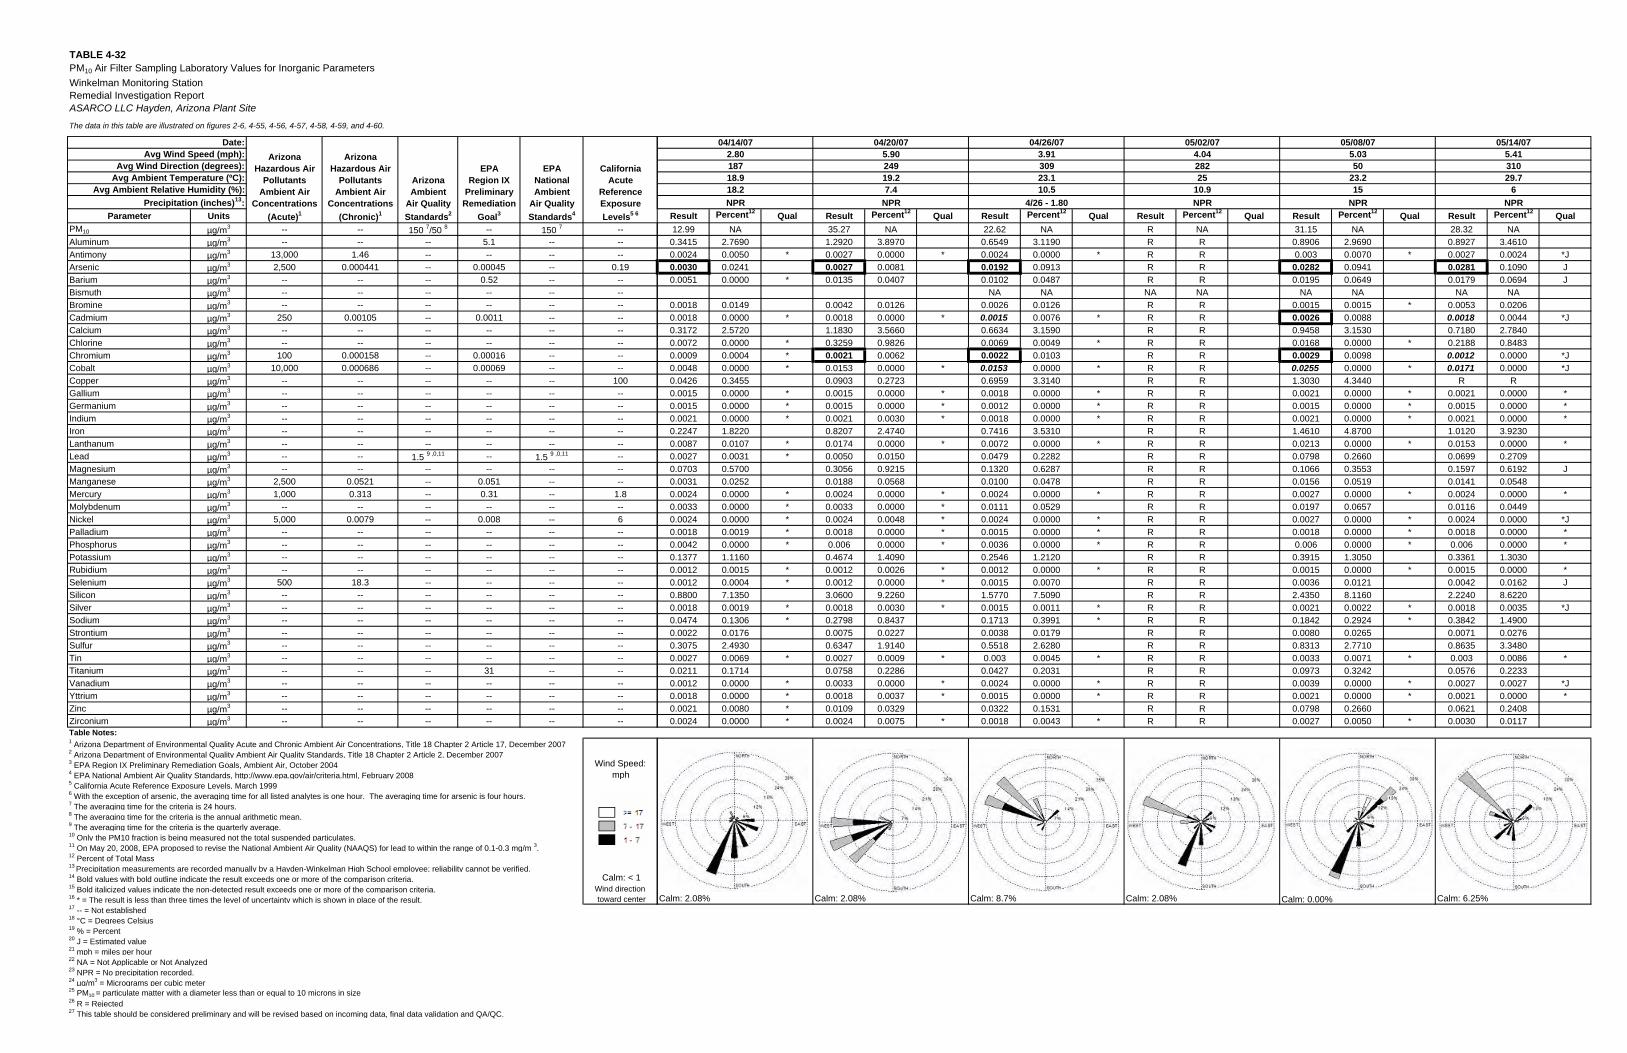
TABLE 4-32PM10 Air Filter Sampling Laboratory Values for Inorganic ParametersWinkelman Monitoring StationRemedial Investigation ReportASARCO LLC Hayden, Arizona Plant Site
The data in this table are illustrated on figures 2-6, 4-55, 4-56, 4-57, 4-58, 4-59, and 4-60.
Parameter UnitsPM10 µg/m3 -- -- 150 7/50 8 -- 150 7 --Aluminum µg/m3 -- -- -- 5.1 -- --Antimony µg/m3 13,000 1.46 -- -- -- --Arsenic µg/m3 2,500 0.000441 -- 0.00045 -- 0.19Barium µg/m3 -- -- -- 0.52 -- --Bismuth µg/m3 -- -- -- -- -- --Bromine µg/m3 -- -- -- -- -- --Cadmium µg/m3 250 0.00105 -- 0.0011 -- --Calcium µg/m3 -- -- -- -- -- --Chlorine µg/m3 -- -- -- -- -- --Chromium µg/m3 100 0.000158 -- 0.00016 -- --Cobalt µg/m3 10,000 0.000686 -- 0.00069 -- --Copper µg/m3 -- -- -- -- -- 100Gallium µg/m3 -- -- -- -- -- --Germanium µg/m3 -- -- -- -- -- --Indium µg/m3 -- -- -- -- -- --Iron µg/m3 -- -- -- -- -- --Lanthanum µg/m3 -- -- -- -- -- --Lead µg/m3 -- -- 1.5 9 ,0,11 -- 1.5 9 ,0,11 --Magnesium µg/m3 -- -- -- -- -- --Manganese µg/m3 2,500 0.0521 -- 0.051 -- --Mercury µg/m3 1,000 0.313 -- 0.31 -- 1.8Molybdenum µg/m3 -- -- -- -- -- --Nickel µg/m3 5,000 0.0079 -- 0.008 -- 6Palladium µg/m3 -- -- -- -- -- --Phosphorus µg/m3 -- -- -- -- -- --Potassium µg/m3 -- -- -- -- -- --Rubidium µg/m3 -- -- -- -- -- --Selenium µg/m3 500 18.3 -- -- -- --Silicon µg/m3 -- -- -- -- -- --Silver µg/m3 -- -- -- -- -- --Sodium µg/m3 -- -- -- -- -- --Strontium µg/m3 -- -- -- -- -- --Sulfur µg/m3 -- -- -- -- -- --Tin µg/m3 -- -- -- -- -- --Titanium µg/m3 -- -- -- 31 -- --Vanadium µg/m3 -- -- -- -- -- --Yttrium µg/m3 -- -- -- -- -- --Zinc µg/m3 -- -- -- -- -- --Zirconium µg/m3 -- -- -- -- -- --Table Notes:1 Arizona Department of Environmental Quality Acute and Chronic Ambient Air Concentrations, Title 18 Chapter 2 Article 17, December 20072 Arizona Department of Environmental Quality Ambient Air Quality Standards, Title 18 Chapter 2 Article 2, December 20073 EPA Region IX Preliminary Remediation Goals, Ambient Air, October 2004 Wind Speed: 4 EPA National Ambient Air Quality Standards, http://www.epa.gov/air/criteria.html, February 2008 mph5 California Acute Reference Exposure Levels, March 19996 With the exception of arsenic, the averaging time for all listed analytes is one hour. The averaging time for arsenic is four hours.7 The averaging time for the criteria is 24 hours.8 The averaging time for the criteria is the annual arithmetic mean.9 The averaging time for the criteria is the quarterly average.10 Only the PM10 fraction is being measured not the total suspended particulates.11 On May 20, 2008, EPA proposed to revise the National Ambient Air Quality (NAAQS) for lead to within the range of 0.1-0.3 mg/m 3.12 Percent of Total Mass13 Precipitation measurements are recorded manually by a Hayden-Winkelman High School employee; reliability cannot be verified.14 Bold values with bold outline indicate the result exceeds one or more of the comparison criteria. Calm: < 115 Bold italicized values indicate the non-detected result exceeds one or more of the comparison criteria. Wind direction16 * = The result is less than three times the level of uncertainty which is shown in place of the result. toward center17 -- = Not established18 °C = Degrees Celsius19 % = Percent20 J = Estimated value21 mph = miles per hour22 NA = Not Applicable or Not Analyzed23 NPR = No precipitation recorded.24 µg/m3 = Micrograms per cubic meter25 PM10 = particulate matter with a diameter less than or equal to 10 microns in size26 R = Rejected27 This table should be considered preliminary and will be revised based on incoming data, final data validation and QA/QC.
EPARegion IX
PreliminaryRemediation
Goal3
Avg Wind Speed (mph):
Avg Ambient Relative Humidity (%):
Avg Wind Direction (degrees):Avg Ambient Temperature (ºC):
EPANationalAmbient
Air QualityStandards4
CaliforniaAcute
ReferenceExposureLevels5 6
ArizonaHazardous Air
PollutantsAmbient Air
Concentrations(Acute)1
ArizonaAmbient
Air QualityStandards2
Date:Arizona
Hazardous AirPollutants
Ambient AirConcentrations
(Chronic)1Precipitation (inches)13:
Result Percent12 Qual Result Percent12 Qual Result Percent12 Qual Result Percent12 Qual Result Percent12 Qual Result Percent12 Qual12.99 NA 35.27 NA 22.62 NA R NA 31.15 NA 28.32 NA
0.3415 2.7690 1.2920 3.8970 0.6549 3.1190 R R 0.8906 2.9690 0.8927 3.46100.0024 0.0050 * 0.0027 0.0000 * 0.0024 0.0000 * R R 0.003 0.0070 * 0.0027 0.0024 *J0.0030 0.0241 0.0027 0.0081 0.0192 0.0913 R R 0.0282 0.0941 0.0281 0.1090 J0.0051 0.0000 * 0.0135 0.0407 0.0102 0.0487 R R 0.0195 0.0649 0.0179 0.0694 J
NA NA NA NA NA NA NA NA0.0018 0.0149 0.0042 0.0126 0.0026 0.0126 R R 0.0015 0.0015 * 0.0053 0.02060.0018 0.0000 * 0.0018 0.0000 * 0.0015 0.0076 * R R 0.0026 0.0088 0.0018 0.0044 *J0.3172 2.5720 1.1830 3.5660 0.6634 3.1590 R R 0.9458 3.1530 0.7180 2.78400.0072 0.0000 * 0.3259 0.9826 0.0069 0.0049 * R R 0.0168 0.0000 * 0.2188 0.84830.0009 0.0004 * 0.0021 0.0062 0.0022 0.0103 R R 0.0029 0.0098 0.0012 0.0000 *J0.0048 0.0000 * 0.0153 0.0000 * 0.0153 0.0000 * R R 0.0255 0.0000 * 0.0171 0.0000 *J0.0426 0.3455 0.0903 0.2723 0.6959 3.3140 R R 1.3030 4.3440 R R0.0015 0.0000 * 0.0015 0.0000 * 0.0018 0.0000 * R R 0.0021 0.0000 * 0.0021 0.0000 *0.0015 0.0000 * 0.0015 0.0000 * 0.0012 0.0000 * R R 0.0015 0.0000 * 0.0015 0.0000 *0.0021 0.0000 * 0.0021 0.0030 * 0.0018 0.0000 * R R 0.0021 0.0000 * 0.0021 0.0000 *0.2247 1.8220 0.8207 2.4740 0.7416 3.5310 R R 1.4610 4.8700 1.0120 3.92300.0087 0.0107 * 0.0174 0.0000 * 0.0072 0.0000 * R R 0.0213 0.0000 * 0.0153 0.0000 *0.0027 0.0031 * 0.0050 0.0150 0.0479 0.2282 R R 0.0798 0.2660 0.0699 0.27090.0703 0.5700 0.3056 0.9215 0.1320 0.6287 R R 0.1066 0.3553 0.1597 0.6192 J0.0031 0.0252 0.0188 0.0568 0.0100 0.0478 R R 0.0156 0.0519 0.0141 0.05480.0024 0.0000 * 0.0024 0.0000 * 0.0024 0.0000 * R R 0.0027 0.0000 * 0.0024 0.0000 *0.0033 0.0000 * 0.0033 0.0000 * 0.0111 0.0529 R R 0.0197 0.0657 0.0116 0.04490.0024 0.0000 * 0.0024 0.0048 * 0.0024 0.0000 * R R 0.0027 0.0000 * 0.0024 0.0000 *J0.0018 0.0019 * 0.0018 0.0000 * 0.0015 0.0000 * R R 0.0018 0.0000 * 0.0018 0.0000 *0.0042 0.0000 * 0.006 0.0000 * 0.0036 0.0000 * R R 0.006 0.0000 * 0.006 0.0000 *0.1377 1.1160 0.4674 1.4090 0.2546 1.2120 R R 0.3915 1.3050 0.3361 1.30300.0012 0.0015 * 0.0012 0.0026 * 0.0012 0.0000 * R R 0.0015 0.0000 * 0.0015 0.0000 *0.0012 0.0004 * 0.0012 0.0000 * 0.0015 0.0070 R R 0.0036 0.0121 0.0042 0.0162 J0.8800 7.1350 3.0600 9.2260 1.5770 7.5090 R R 2.4350 8.1160 2.2240 8.62200.0018 0.0019 * 0.0018 0.0030 * 0.0015 0.0011 * R R 0.0021 0.0022 * 0.0018 0.0035 *J0.0474 0.1306 * 0.2798 0.8437 0.1713 0.3991 * R R 0.1842 0.2924 * 0.3842 1.49000.0022 0.0176 0.0075 0.0227 0.0038 0.0179 R R 0.0080 0.0265 0.0071 0.02760.3075 2.4930 0.6347 1.9140 0.5518 2.6280 R R 0.8313 2.7710 0.8635 3.34800.0027 0.0069 * 0.0027 0.0009 * 0.003 0.0045 * R R 0.0033 0.0071 * 0.003 0.0086 *0.0211 0.1714 0.0758 0.2286 0.0427 0.2031 R R 0.0973 0.3242 0.0576 0.22330.0012 0.0000 * 0.0033 0.0000 * 0.0024 0.0000 * R R 0.0039 0.0000 * 0.0027 0.0027 *J0.0018 0.0000 * 0.0018 0.0037 * 0.0015 0.0000 * R R 0.0021 0.0000 * 0.0021 0.0000 *0.0021 0.0080 * 0.0109 0.0329 0.0322 0.1531 R R 0.0798 0.2660 0.0621 0.24080.0024 0.0000 * 0.0024 0.0075 * 0.0018 0.0043 * R R 0.0027 0.0050 * 0.0030 0.0117
Calm: 2.08% Calm: 2.08% Calm: 8.7% Calm: 2.08% Calm: 0.00% Calm: 6.25%
7.4
04/20/075.9024919.2
18.2
04/14/07
23.1
2.8018718.9 29.7
10.5
05/02/074.0428225
10.9
04/26/073.91309
05/14/075.41310
6NPR NPR 4/26 - 1.80 NPR NPR
15NPR
05/08/075.0350
23.2
·-..
D >= 17
D 7 - 17 -1 - 7
• _ •• , -· .. ~MO~··•• -.,._
. ••. ,,
•• ' _ •• , .- ,:ll(lrml '••·-- •.• ••• : L • • ••• ••,,. •
.,. ,/· . . •' . -.
--. ··--.• >i•........... / __ .. -- . ---. ·--
t,.•~~·/i. ;:.-·.:-~:_:_:_i.~:::_· __ -.·f
0
.:~' •.• ~::·~~;,'._,, __ ·:,. (_~ ~ :;{: ::;:,~:~· \ ~ _,, .. "~ ----··---' · --- ·-- ---' ' :' ·' : - : \.._ ·. ··--.. .;,,/ _/ / t""
......... .... ·--..: ____ _.: ::::::::_::.,-/ / / ·-. --- .;,_.-- .- / _,., •, ··-··t···· .• -· ., ,.·
•' •, .. - _,. .. , •·
--, · ·--~~I/TH.-•·_,.,'
-•• ' . _ .. ,--··· · 1woiifij ···-....
--., ,,•'
···· ····-·~~IJT11--•· ·
., __
··-·-·- ---~~Lffi1-·• ··· ·
__ __ .. ,.- 1wo·~·-,, ..... _
,/···· -- --~--.... ··--,
·· /•·,~ '.:--~ -;~:;_;\.~ ,.,· ,.··· ··-···-1·-··· ·· ·•' ... ·
,.,,•' ·•, .. __ ··- - -- ,... , •
--, ....• ~Lfl'M--•····''···
____ .,. --_/. ,
-., .... :~i.mt-·•
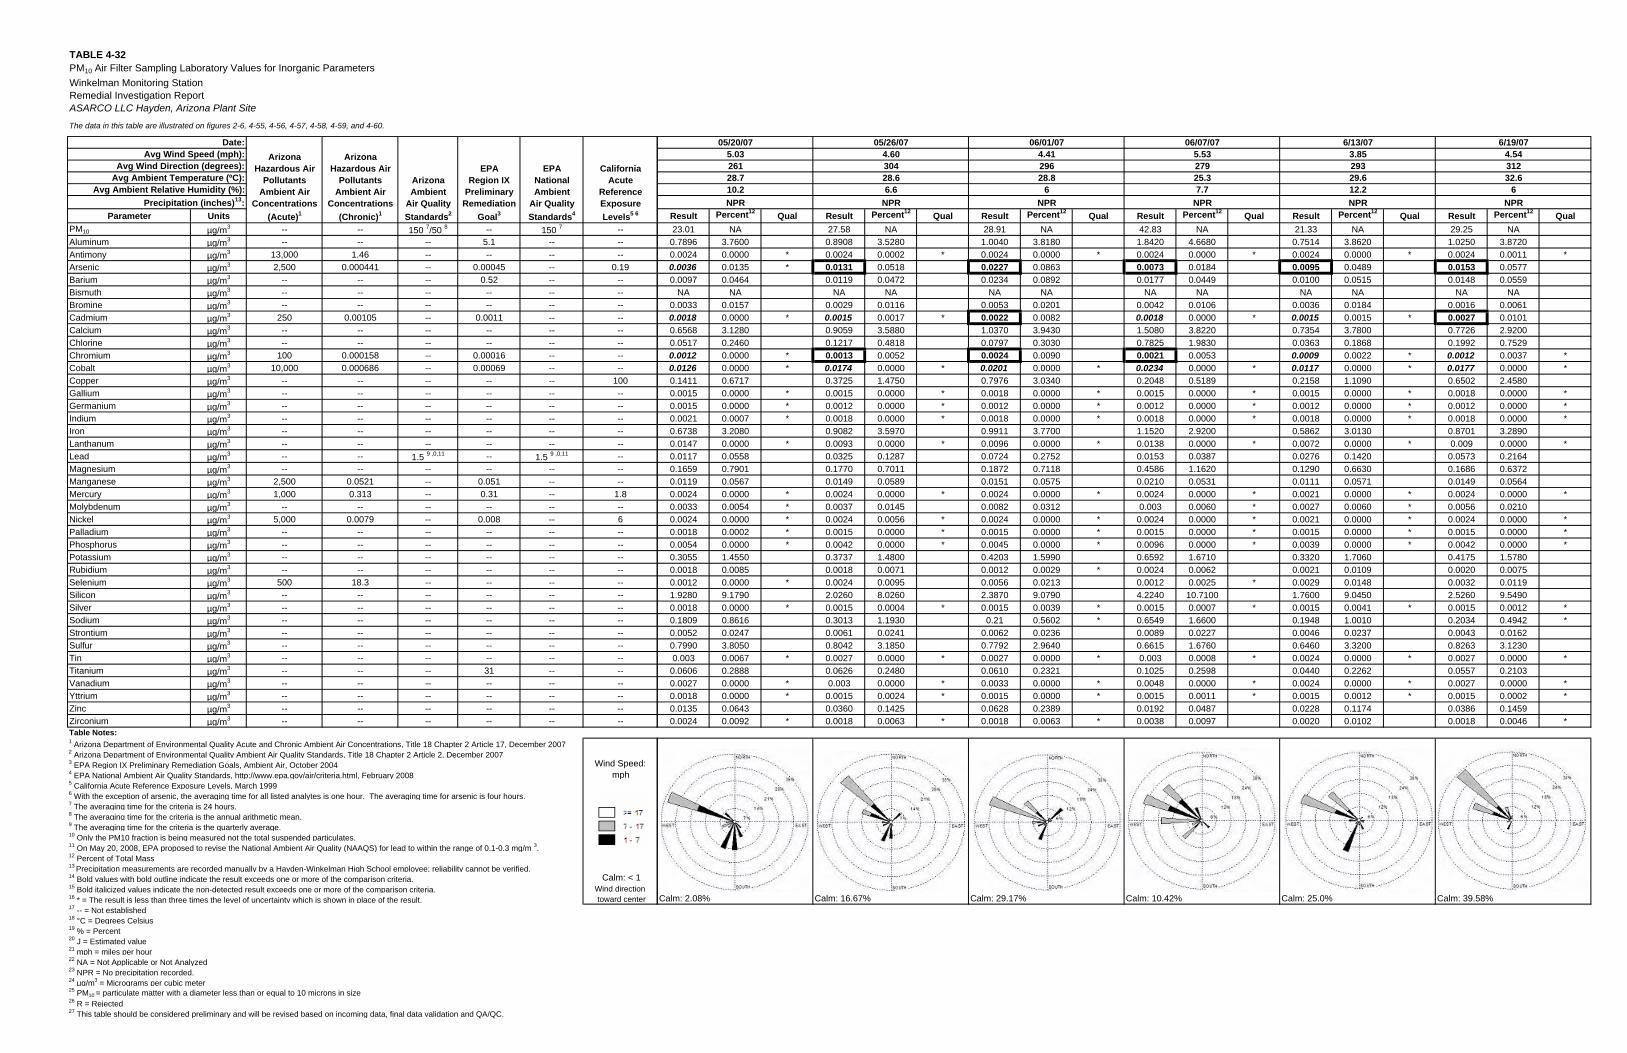
TABLE 4-32PM10 Air Filter Sampling Laboratory Values for Inorganic ParametersWinkelman Monitoring StationRemedial Investigation ReportASARCO LLC Hayden, Arizona Plant Site
The data in this table are illustrated on figures 2-6, 4-55, 4-56, 4-57, 4-58, 4-59, and 4-60.
Parameter UnitsPM10 µg/m3 -- -- 150 7/50 8 -- 150 7 --Aluminum µg/m3 -- -- -- 5.1 -- --Antimony µg/m3 13,000 1.46 -- -- -- --Arsenic µg/m3 2,500 0.000441 -- 0.00045 -- 0.19Barium µg/m3 -- -- -- 0.52 -- --Bismuth µg/m3 -- -- -- -- -- --Bromine µg/m3 -- -- -- -- -- --Cadmium µg/m3 250 0.00105 -- 0.0011 -- --Calcium µg/m3 -- -- -- -- -- --Chlorine µg/m3 -- -- -- -- -- --Chromium µg/m3 100 0.000158 -- 0.00016 -- --Cobalt µg/m3 10,000 0.000686 -- 0.00069 -- --Copper µg/m3 -- -- -- -- -- 100Gallium µg/m3 -- -- -- -- -- --Germanium µg/m3 -- -- -- -- -- --Indium µg/m3 -- -- -- -- -- --Iron µg/m3 -- -- -- -- -- --Lanthanum µg/m3 -- -- -- -- -- --Lead µg/m3 -- -- 1.5 9 ,0,11 -- 1.5 9 ,0,11 --Magnesium µg/m3 -- -- -- -- -- --Manganese µg/m3 2,500 0.0521 -- 0.051 -- --Mercury µg/m3 1,000 0.313 -- 0.31 -- 1.8Molybdenum µg/m3 -- -- -- -- -- --Nickel µg/m3 5,000 0.0079 -- 0.008 -- 6Palladium µg/m3 -- -- -- -- -- --Phosphorus µg/m3 -- -- -- -- -- --Potassium µg/m3 -- -- -- -- -- --Rubidium µg/m3 -- -- -- -- -- --Selenium µg/m3 500 18.3 -- -- -- --Silicon µg/m3 -- -- -- -- -- --Silver µg/m3 -- -- -- -- -- --Sodium µg/m3 -- -- -- -- -- --Strontium µg/m3 -- -- -- -- -- --Sulfur µg/m3 -- -- -- -- -- --Tin µg/m3 -- -- -- -- -- --Titanium µg/m3 -- -- -- 31 -- --Vanadium µg/m3 -- -- -- -- -- --Yttrium µg/m3 -- -- -- -- -- --Zinc µg/m3 -- -- -- -- -- --Zirconium µg/m3 -- -- -- -- -- --Table Notes:1 Arizona Department of Environmental Quality Acute and Chronic Ambient Air Concentrations, Title 18 Chapter 2 Article 17, December 20072 Arizona Department of Environmental Quality Ambient Air Quality Standards, Title 18 Chapter 2 Article 2, December 20073 EPA Region IX Preliminary Remediation Goals, Ambient Air, October 2004 Wind Speed: 4 EPA National Ambient Air Quality Standards, http://www.epa.gov/air/criteria.html, February 2008 mph5 California Acute Reference Exposure Levels, March 19996 With the exception of arsenic, the averaging time for all listed analytes is one hour. The averaging time for arsenic is four hours.7 The averaging time for the criteria is 24 hours.8 The averaging time for the criteria is the annual arithmetic mean.9 The averaging time for the criteria is the quarterly average.10 Only the PM10 fraction is being measured not the total suspended particulates.11 On May 20, 2008, EPA proposed to revise the National Ambient Air Quality (NAAQS) for lead to within the range of 0.1-0.3 mg/m 3.12 Percent of Total Mass13 Precipitation measurements are recorded manually by a Hayden-Winkelman High School employee; reliability cannot be verified.14 Bold values with bold outline indicate the result exceeds one or more of the comparison criteria. Calm: < 115 Bold italicized values indicate the non-detected result exceeds one or more of the comparison criteria. Wind direction16 * = The result is less than three times the level of uncertainty which is shown in place of the result. toward center17 -- = Not established18 °C = Degrees Celsius19 % = Percent20 J = Estimated value21 mph = miles per hour22 NA = Not Applicable or Not Analyzed23 NPR = No precipitation recorded.24 µg/m3 = Micrograms per cubic meter25 PM10 = particulate matter with a diameter less than or equal to 10 microns in size26 R = Rejected27 This table should be considered preliminary and will be revised based on incoming data, final data validation and QA/QC.
EPARegion IX
PreliminaryRemediation
Goal3
Avg Wind Speed (mph):
Avg Ambient Relative Humidity (%):
Avg Wind Direction (degrees):Avg Ambient Temperature (ºC):
EPANationalAmbient
Air QualityStandards4
CaliforniaAcute
ReferenceExposureLevels5 6
ArizonaHazardous Air
PollutantsAmbient Air
Concentrations(Acute)1
ArizonaAmbient
Air QualityStandards2
Date:Arizona
Hazardous AirPollutants
Ambient AirConcentrations
(Chronic)1Precipitation (inches)13:
Result Percent12 Qual Result Percent12 Qual Result Percent12 Qual Result Percent12 Qual Result Percent12 Qual Result Percent12 Qual23.01 NA 27.58 NA 28.91 NA 42.83 NA 21.33 NA 29.25 NA
0.7896 3.7600 0.8908 3.5280 1.0040 3.8180 1.8420 4.6680 0.7514 3.8620 1.0250 3.87200.0024 0.0000 * 0.0024 0.0002 * 0.0024 0.0000 * 0.0024 0.0000 * 0.0024 0.0000 * 0.0024 0.0011 *0.0036 0.0135 * 0.0131 0.0518 0.0227 0.0863 0.0073 0.0184 0.0095 0.0489 0.0153 0.05770.0097 0.0464 0.0119 0.0472 0.0234 0.0892 0.0177 0.0449 0.0100 0.0515 0.0148 0.0559
NA NA NA NA NA NA NA NA NA NA NA NA0.0033 0.0157 0.0029 0.0116 0.0053 0.0201 0.0042 0.0106 0.0036 0.0184 0.0016 0.00610.0018 0.0000 * 0.0015 0.0017 * 0.0022 0.0082 0.0018 0.0000 * 0.0015 0.0015 * 0.0027 0.01010.6568 3.1280 0.9059 3.5880 1.0370 3.9430 1.5080 3.8220 0.7354 3.7800 0.7726 2.92000.0517 0.2460 0.1217 0.4818 0.0797 0.3030 0.7825 1.9830 0.0363 0.1868 0.1992 0.75290.0012 0.0000 * 0.0013 0.0052 0.0024 0.0090 0.0021 0.0053 0.0009 0.0022 * 0.0012 0.0037 *0.0126 0.0000 * 0.0174 0.0000 * 0.0201 0.0000 * 0.0234 0.0000 * 0.0117 0.0000 * 0.0177 0.0000 *0.1411 0.6717 0.3725 1.4750 0.7976 3.0340 0.2048 0.5189 0.2158 1.1090 0.6502 2.45800.0015 0.0000 * 0.0015 0.0000 * 0.0018 0.0000 * 0.0015 0.0000 * 0.0015 0.0000 * 0.0018 0.0000 *0.0015 0.0000 * 0.0012 0.0000 * 0.0012 0.0000 * 0.0012 0.0000 * 0.0012 0.0000 * 0.0012 0.0000 *0.0021 0.0007 * 0.0018 0.0000 * 0.0018 0.0000 * 0.0018 0.0000 * 0.0018 0.0000 * 0.0018 0.0000 *0.6738 3.2080 0.9082 3.5970 0.9911 3.7700 1.1520 2.9200 0.5862 3.0130 0.8701 3.28900.0147 0.0000 * 0.0093 0.0000 * 0.0096 0.0000 * 0.0138 0.0000 * 0.0072 0.0000 * 0.009 0.0000 *0.0117 0.0558 0.0325 0.1287 0.0724 0.2752 0.0153 0.0387 0.0276 0.1420 0.0573 0.21640.1659 0.7901 0.1770 0.7011 0.1872 0.7118 0.4586 1.1620 0.1290 0.6630 0.1686 0.63720.0119 0.0567 0.0149 0.0589 0.0151 0.0575 0.0210 0.0531 0.0111 0.0571 0.0149 0.05640.0024 0.0000 * 0.0024 0.0000 * 0.0024 0.0000 * 0.0024 0.0000 * 0.0021 0.0000 * 0.0024 0.0000 *0.0033 0.0054 * 0.0037 0.0145 0.0082 0.0312 0.003 0.0060 * 0.0027 0.0060 * 0.0056 0.02100.0024 0.0000 * 0.0024 0.0056 * 0.0024 0.0000 * 0.0024 0.0000 * 0.0021 0.0000 * 0.0024 0.0000 *0.0018 0.0002 * 0.0015 0.0000 * 0.0015 0.0000 * 0.0015 0.0000 * 0.0015 0.0000 * 0.0015 0.0000 *0.0054 0.0000 * 0.0042 0.0000 * 0.0045 0.0000 * 0.0096 0.0000 * 0.0039 0.0000 * 0.0042 0.0000 *0.3055 1.4550 0.3737 1.4800 0.4203 1.5990 0.6592 1.6710 0.3320 1.7060 0.4175 1.57800.0018 0.0085 0.0018 0.0071 0.0012 0.0029 * 0.0024 0.0062 0.0021 0.0109 0.0020 0.00750.0012 0.0000 * 0.0024 0.0095 0.0056 0.0213 0.0012 0.0025 * 0.0029 0.0148 0.0032 0.01191.9280 9.1790 2.0260 8.0260 2.3870 9.0790 4.2240 10.7100 1.7600 9.0450 2.5260 9.54900.0018 0.0000 * 0.0015 0.0004 * 0.0015 0.0039 * 0.0015 0.0007 * 0.0015 0.0041 * 0.0015 0.0012 *0.1809 0.8616 0.3013 1.1930 0.21 0.5602 * 0.6549 1.6600 0.1948 1.0010 0.2034 0.4942 *0.0052 0.0247 0.0061 0.0241 0.0062 0.0236 0.0089 0.0227 0.0046 0.0237 0.0043 0.01620.7990 3.8050 0.8042 3.1850 0.7792 2.9640 0.6615 1.6760 0.6460 3.3200 0.8263 3.12300.003 0.0067 * 0.0027 0.0000 * 0.0027 0.0000 * 0.003 0.0008 * 0.0024 0.0000 * 0.0027 0.0000 *
0.0606 0.2888 0.0626 0.2480 0.0610 0.2321 0.1025 0.2598 0.0440 0.2262 0.0557 0.21030.0027 0.0000 * 0.003 0.0000 * 0.0033 0.0000 * 0.0048 0.0000 * 0.0024 0.0000 * 0.0027 0.0000 *0.0018 0.0000 * 0.0015 0.0024 * 0.0015 0.0000 * 0.0015 0.0011 * 0.0015 0.0012 * 0.0015 0.0002 *0.0135 0.0643 0.0360 0.1425 0.0628 0.2389 0.0192 0.0487 0.0228 0.1174 0.0386 0.14590.0024 0.0092 * 0.0018 0.0063 * 0.0018 0.0063 * 0.0038 0.0097 0.0020 0.0102 0.0018 0.0046 *
Calm: 2.08% Calm: 16.67% Calm: 29.17% Calm: 10.42% Calm: 25.0% Calm: 39.58%
261 296
10.2
05/26/074.6030428.66.6
05/20/075.03
32.628.76
06/07/075.5327925.37.7
06/01/074.41
12.2 628.8
6/13/07 6/19/073.85 4.54293 31229.6
NPR NPR NPR NPRNPR NPR
D >= 17
D 7 - 17 -1 - 7
_ ••••• , .- iMOi:illl'•,, . .• , . . ••• • --••' ·· !MOMH "•,, . , , _
• ..
/ _,•·
-- - --, • .••.• ~i;:QL'™--•·· •' ·' , • '
··-
!MOllltl"•,, .•• ,.
_, _,----- , -.... "• , ,.
,.-·•'' ,,- - - . .. . ,., __ ·-- ••• ___ ! illri
~:.--.~ }j>;.; · ·-··•- !.••··· __ .,·
··---._ ···-. 7 ,.,.-
__ __ •• , .. -- :..:iinff ·• , ,
,.--·-·····--- ··-- ._
,.,..-·"~..-:/::·· ···:.--- \·_::·.-._::-.;::·~...:_:·\. ,,r : . .· -~---, ;~ \ \
'. --,~ - : . . __ E<, _ ---i--- . - ,.i t&f.lT: \.,, \ \ .. ___ ·· .. · .. _ J::_:_./:_/i
. -•' ··----,.;-------,.,-'·· .. •, __
·------- -~l.lllt .,- ··------ •• ~i!.C'Lil11-·•· · -.. t~Lffl:t--•··

TABLE 4-32PM10 Air Filter Sampling Laboratory Values for Inorganic ParametersWinkelman Monitoring StationRemedial Investigation ReportASARCO LLC Hayden, Arizona Plant Site
The data in this table are illustrated on figures 2-6, 4-55, 4-56, 4-57, 4-58, 4-59, and 4-60.
Parameter UnitsPM10 µg/m3 -- -- 150 7/50 8 -- 150 7 --Aluminum µg/m3 -- -- -- 5.1 -- --Antimony µg/m3 13,000 1.46 -- -- -- --Arsenic µg/m3 2,500 0.000441 -- 0.00045 -- 0.19Barium µg/m3 -- -- -- 0.52 -- --Bismuth µg/m3 -- -- -- -- -- --Bromine µg/m3 -- -- -- -- -- --Cadmium µg/m3 250 0.00105 -- 0.0011 -- --Calcium µg/m3 -- -- -- -- -- --Chlorine µg/m3 -- -- -- -- -- --Chromium µg/m3 100 0.000158 -- 0.00016 -- --Cobalt µg/m3 10,000 0.000686 -- 0.00069 -- --Copper µg/m3 -- -- -- -- -- 100Gallium µg/m3 -- -- -- -- -- --Germanium µg/m3 -- -- -- -- -- --Indium µg/m3 -- -- -- -- -- --Iron µg/m3 -- -- -- -- -- --Lanthanum µg/m3 -- -- -- -- -- --Lead µg/m3 -- -- 1.5 9 ,0,11 -- 1.5 9 ,0,11 --Magnesium µg/m3 -- -- -- -- -- --Manganese µg/m3 2,500 0.0521 -- 0.051 -- --Mercury µg/m3 1,000 0.313 -- 0.31 -- 1.8Molybdenum µg/m3 -- -- -- -- -- --Nickel µg/m3 5,000 0.0079 -- 0.008 -- 6Palladium µg/m3 -- -- -- -- -- --Phosphorus µg/m3 -- -- -- -- -- --Potassium µg/m3 -- -- -- -- -- --Rubidium µg/m3 -- -- -- -- -- --Selenium µg/m3 500 18.3 -- -- -- --Silicon µg/m3 -- -- -- -- -- --Silver µg/m3 -- -- -- -- -- --Sodium µg/m3 -- -- -- -- -- --Strontium µg/m3 -- -- -- -- -- --Sulfur µg/m3 -- -- -- -- -- --Tin µg/m3 -- -- -- -- -- --Titanium µg/m3 -- -- -- 31 -- --Vanadium µg/m3 -- -- -- -- -- --Yttrium µg/m3 -- -- -- -- -- --Zinc µg/m3 -- -- -- -- -- --Zirconium µg/m3 -- -- -- -- -- --Table Notes:1 Arizona Department of Environmental Quality Acute and Chronic Ambient Air Concentrations, Title 18 Chapter 2 Article 17, December 20072 Arizona Department of Environmental Quality Ambient Air Quality Standards, Title 18 Chapter 2 Article 2, December 20073 EPA Region IX Preliminary Remediation Goals, Ambient Air, October 2004 Wind Speed: 4 EPA National Ambient Air Quality Standards, http://www.epa.gov/air/criteria.html, February 2008 mph5 California Acute Reference Exposure Levels, March 19996 With the exception of arsenic, the averaging time for all listed analytes is one hour. The averaging time for arsenic is four hours.7 The averaging time for the criteria is 24 hours.8 The averaging time for the criteria is the annual arithmetic mean.9 The averaging time for the criteria is the quarterly average.10 Only the PM10 fraction is being measured not the total suspended particulates.11 On May 20, 2008, EPA proposed to revise the National Ambient Air Quality (NAAQS) for lead to within the range of 0.1-0.3 mg/m 3.12 Percent of Total Mass13 Precipitation measurements are recorded manually by a Hayden-Winkelman High School employee; reliability cannot be verified.14 Bold values with bold outline indicate the result exceeds one or more of the comparison criteria. Calm: < 115 Bold italicized values indicate the non-detected result exceeds one or more of the comparison criteria. Wind direction16 * = The result is less than three times the level of uncertainty which is shown in place of the result. toward center17 -- = Not established18 °C = Degrees Celsius19 % = Percent20 J = Estimated value21 mph = miles per hour22 NA = Not Applicable or Not Analyzed23 NPR = No precipitation recorded.24 µg/m3 = Micrograms per cubic meter25 PM10 = particulate matter with a diameter less than or equal to 10 microns in size26 R = Rejected27 This table should be considered preliminary and will be revised based on incoming data, final data validation and QA/QC.
EPARegion IX
PreliminaryRemediation
Goal3
Avg Wind Speed (mph):
Avg Ambient Relative Humidity (%):
Avg Wind Direction (degrees):Avg Ambient Temperature (ºC):
EPANationalAmbient
Air QualityStandards4
CaliforniaAcute
ReferenceExposureLevels5 6
ArizonaHazardous Air
PollutantsAmbient Air
Concentrations(Acute)1
ArizonaAmbient
Air QualityStandards2
Date:Arizona
Hazardous AirPollutants
Ambient AirConcentrations
(Chronic)1Precipitation (inches)13:
Result Percent12 Qual Result Percent12 Qual Result Percent12 Qual Result Percent12 Qual Result Percent12 Qual Result Percent12 Qual26.37 NA 24.90 NA 17.90 NA 27.11 NA 27.28 NA 16.22 NA
0.7830 3.2910 0.7091 3.1690 0.4897 3.0520 0.6992 2.8640 0.9426 3.8610 0.4499 3.01600.003 0.0020 * 0.0036 0.0000 * 0.0036 0.0000 *J 0.0036 0.0015 * 0.0036 0.0000 * 0.0033 0.0000 *
0.0231 0.0972 0.0122 0.0547 0.0032 0.0203 J 0.0044 0.0179 0.0039 0.0110 * 0.0023 0.01520.0104 0.0435 0.0131 0.0585 0.0072 0.0000 *J 0.0097 0.0395 0.0142 0.0582 0.0069 0.0000 *
NA NA 0.0056 0.0253 NA NA 0.0026 0.0108 0.0032 0.0131 NA NA0.0016 0.0069 0.0057 0.0255 0.0029 0.0182 0.0038 0.0156 0.0021 0.0085 0.0006 0.00410.0029 0.0121 0.0024 0.0027 * 0.0024 0.0000 *J 0.0024 0.0029 * 0.0024 0.0012 * 0.0024 0.0006 *0.7190 3.0220 0.6483 2.8980 0.4378 2.7290 0.6648 2.7230 0.5598 2.2930 0.4473 2.99900.1738 0.7306 0.1078 0.4817 0.0063 0.0367 * 0.0224 0.0918 0.0169 0.0690 0.006 0.0256 *0.0015 0.0061 0.0009 0.0023 * 0.0009 0.0047 *J 0.0017 0.0069 0.0012 0.0040 * 0.0009 0.0009 *0.0186 0.0000 * 0.009 0.0000 * 0.0057 0.0000 *J 0.0084 0.0000 * 0.0096 0.0000 * 0.0054 0.0000 *0.9567 4.0210 0.3910 1.7480 0.2072 1.2910 J 0.5490 2.2480 0.4033 1.6520 0.1336 0.89550.0018 0.0000 * 0.0009 0.0000 * 0.0006 0.0000 * 0.0006 0.0000 * 0.0009 0.0000 * 0.0006 0.0000 *0.0012 0.0000 * 0.0006 0.0000 * 0.0006 0.0000 * 0.0006 0.0000 * 0.0006 0.0000 * 0.0006 0.0000 *0.0024 0.0016 * 0.0027 0.0008 * 0.0027 0.0000 * 0.0027 0.0031 * 0.0027 0.0000 * 0.0027 0.0000 *0.9035 3.7980 0.6060 2.7080 0.4540 2.8300 0.6545 2.6800 0.7331 3.0020 0.3824 2.56300.0081 0.0000 * 0.0129 0.0000 * 0.0114 0.0000 * 0.0135 0.0000 * 0.0153 0.0000 * 0.0111 0.0000 *0.0830 0.3489 0.0465 0.2079 0.0076 0.0475 0.0256 0.1049 0.0266 0.1090 0.0080 0.05370.1196 0.5027 0.1492 0.6666 0.0666 0.4153 0.1411 0.5777 0.1380 0.5650 0.0839 0.56250.0097 0.0406 0.0102 0.0455 0.0064 0.0399 J 0.0096 0.0391 0.0140 0.0573 0.0061 0.04070.0021 0.0000 * 0.0012 0.0000 * 0.0012 0.0000 * 0.0012 0.0000 * 0.0012 0.0000 * 0.0012 0.0000 *0.0105 0.0441 0.0015 0.0065 * 0.0015 0.0009 * 0.0015 0.0048 * 0.0018 0.0058 * 0.0015 0.0000 *0.0018 0.0000 * 0.0003 0.0011 * 0.0003 0.0015 *J 0.0003 0.0008 * 0.0006 0.0019 * 0.0003 0.0000 *0.0021 0.0000 * 0.0024 0.0000 * 0.0024 0.0000 * 0.0024 0.0000 * 0.0024 0.0000 * 0.0024 0.0000 *0.0048 0.0000 * 0.0057 0.0000 * 0.0042 0.0000 * 0.006 0.0000 * 0.006 0.0000 * 0.0045 0.0041 *0.3415 1.4350 0.4020 1.7970 0.2529 1.5760 0.3511 1.4380 0.3971 1.6270 0.2167 1.45300.0009 0.0000 * 0.0006 0.0032 * 0.0007 0.0041 0.0006 0.0008 * 0.0010 0.0040 0.0007 0.00440.0028 0.0119 0.0079 0.0354 0.0020 0.0123 J 0.0037 0.0152 0.0028 0.0116 0.0029 0.01961.9580 8.2290 1.7930 8.0130 1.2110 7.5520 1.7350 7.1080 2.1700 8.8880 1.0910 7.31300.0021 0.0026 * 0.0024 0.0023 * 0.0024 0.0150 *J 0.0024 0.0077 * 0.0024 0.0000 * 0.0024 0.0028 *0.4041 1.6980 0.2139 0.9562 0.1266 0.5474 * 0.1782 0.4830 * 0.1899 0.6296 * 0.1134 0.3964 *0.0044 0.0184 0.0032 0.0141 0.0023 0.0141 0.0033 0.0137 0.0044 0.0179 0.0024 0.01610.6912 2.9050 0.5947 2.6580 0.4601 2.8680 0.6869 2.8130 0.6356 2.6030 0.4944 3.31400.0027 0.0000 * 0.0039 0.0141 * 0.0036 0.0053 * 0.0036 0.0058 * 0.0036 0.0044 * 0.0036 0.0079 *0.0511 0.2147 0.0487 0.2176 0.0400 0.2495 0.0536 0.2194 0.0627 0.2569 0.0417 0.27970.0024 0.0000 * 0.0024 0.0000 * 0.0018 0.0000 *J 0.0024 0.0017 * 0.0027 0.0000 * 0.0018 0.0000 *0.0015 0.0000 * 0.0009 0.0015 * 0.0009 0.0000 * 0.0009 0.0000 * 0.0009 0.0000 * 0.0009 0.0000 *0.0543 0.2284 0.0901 0.4028 R R 0.0233 0.0955 0.0292 0.1196 0.0085 0.05710.0015 0.0067 * 0.0013 0.0059 0.0013 0.0082 0.0012 0.0048 * 0.0026 0.0106 0.0012 0.0016 *
Calm: 41.67% Calm: 50.00% Calm: 8.33% Calm: 25.00% Calm: 18.75% Calm: 14.58%
11.8 32.95.5 5.3 8.6 12.434.1 27.2
303 29632.6 33.8 35 33.9
7 2853.67 4.60 6.03 4.66
6/25/07 7/1/07 7/7/07 7/13/07
NPRNPRNPR NPR NPR NPR
290 284
7/19/07 7/25/075.97 3.42
D >= 17
D 7 - 17 -1 - 7
•• ,.- - - -:'40M14 , , ·-, ._
, .,----- : .... ----. ·•, __ _
t~?1~~t?/1':-.
\.... ··----+·-···· '•,., "••·-·---:----- .. • ' __ .,·
--,_ ··-· ;----·- ___ ,,•'
' ·-' ··- ~~I.I™-· ' -
••• '•••• . jit:aii'rn "•, .. h, -- ... ,WORT14-,, __
.. .- ,,,-· , .. l . ··•.,. "!"" •..
_, , • .---.---.. 2'Criri
/ ~ _<;\\ \ : ... \ \.\. __ t\,, ·--.+--·\)-·-.:_;_.~.-.:::/--)~''.'
·------+----··
_,.,·
•, ·-----;--- --· ·· .. ,, __
·-, __ ···t····••" ----~~I.ITM-----
,,• ' ,,•' ·-----........ l~IITH---- ------·-•-... ,., , --
··---- ~BQIJT11.· '
,,•'
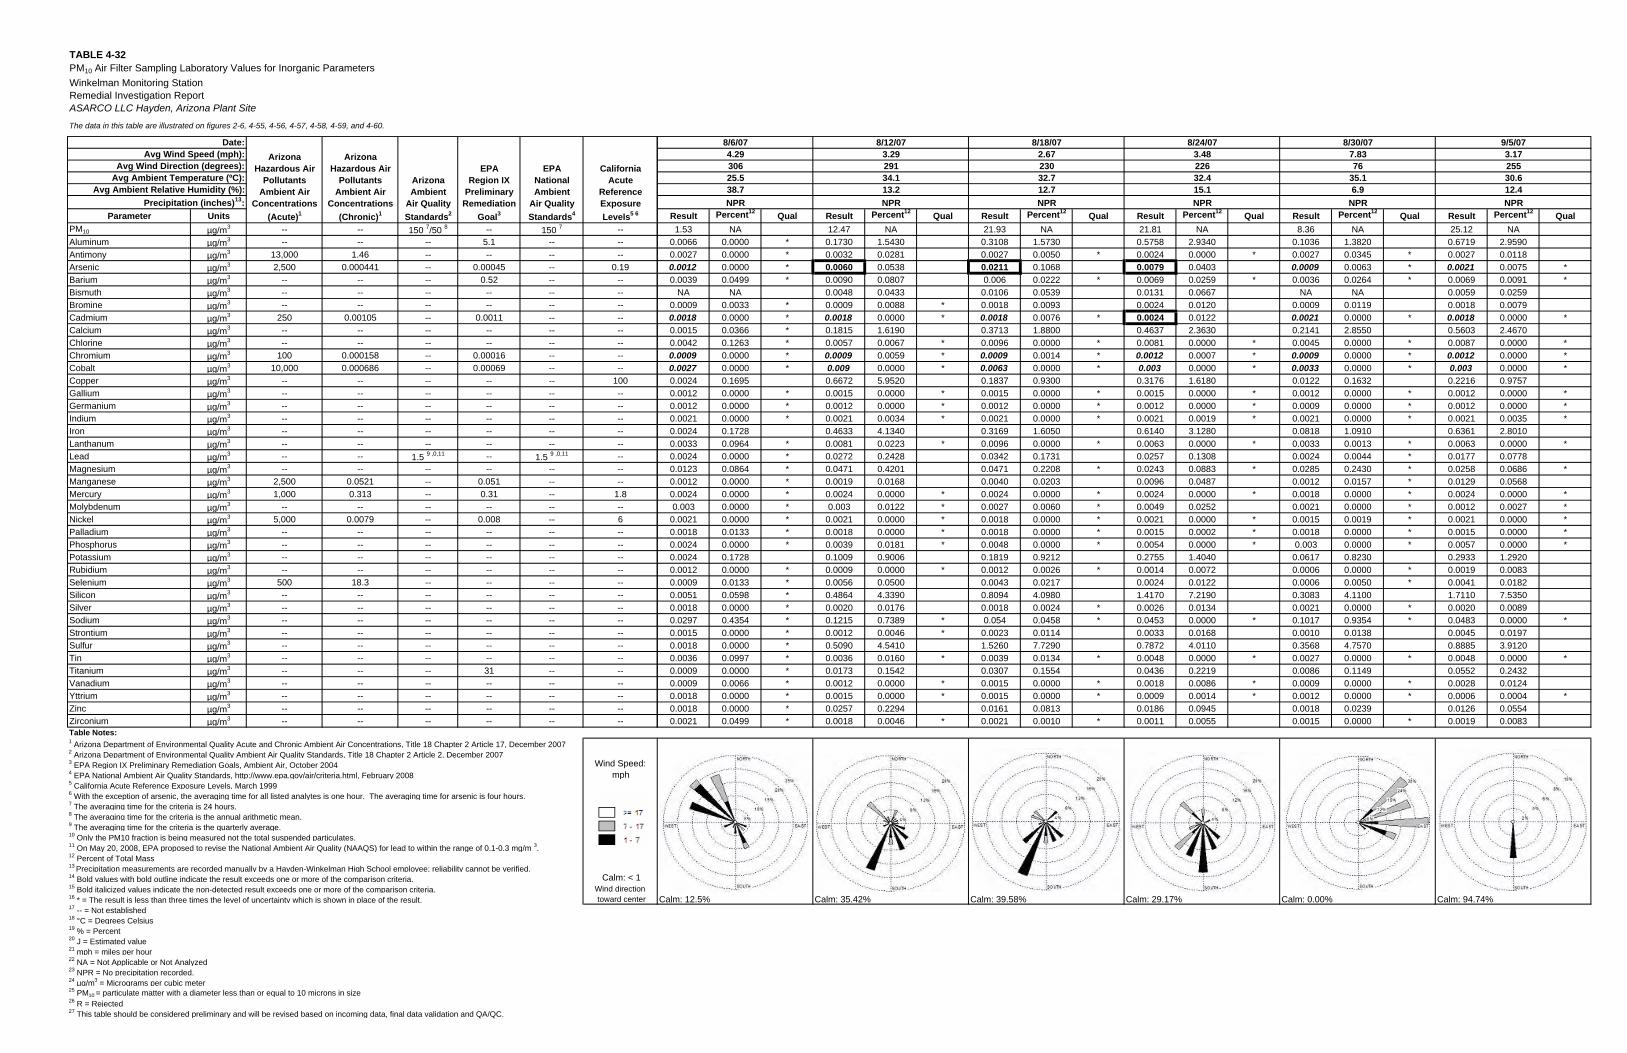
TABLE 4-32PM10 Air Filter Sampling Laboratory Values for Inorganic ParametersWinkelman Monitoring StationRemedial Investigation ReportASARCO LLC Hayden, Arizona Plant Site
The data in this table are illustrated on figures 2-6, 4-55, 4-56, 4-57, 4-58, 4-59, and 4-60.
Parameter UnitsPM10 µg/m3 -- -- 150 7/50 8 -- 150 7 --Aluminum µg/m3 -- -- -- 5.1 -- --Antimony µg/m3 13,000 1.46 -- -- -- --Arsenic µg/m3 2,500 0.000441 -- 0.00045 -- 0.19Barium µg/m3 -- -- -- 0.52 -- --Bismuth µg/m3 -- -- -- -- -- --Bromine µg/m3 -- -- -- -- -- --Cadmium µg/m3 250 0.00105 -- 0.0011 -- --Calcium µg/m3 -- -- -- -- -- --Chlorine µg/m3 -- -- -- -- -- --Chromium µg/m3 100 0.000158 -- 0.00016 -- --Cobalt µg/m3 10,000 0.000686 -- 0.00069 -- --Copper µg/m3 -- -- -- -- -- 100Gallium µg/m3 -- -- -- -- -- --Germanium µg/m3 -- -- -- -- -- --Indium µg/m3 -- -- -- -- -- --Iron µg/m3 -- -- -- -- -- --Lanthanum µg/m3 -- -- -- -- -- --Lead µg/m3 -- -- 1.5 9 ,0,11 -- 1.5 9 ,0,11 --Magnesium µg/m3 -- -- -- -- -- --Manganese µg/m3 2,500 0.0521 -- 0.051 -- --Mercury µg/m3 1,000 0.313 -- 0.31 -- 1.8Molybdenum µg/m3 -- -- -- -- -- --Nickel µg/m3 5,000 0.0079 -- 0.008 -- 6Palladium µg/m3 -- -- -- -- -- --Phosphorus µg/m3 -- -- -- -- -- --Potassium µg/m3 -- -- -- -- -- --Rubidium µg/m3 -- -- -- -- -- --Selenium µg/m3 500 18.3 -- -- -- --Silicon µg/m3 -- -- -- -- -- --Silver µg/m3 -- -- -- -- -- --Sodium µg/m3 -- -- -- -- -- --Strontium µg/m3 -- -- -- -- -- --Sulfur µg/m3 -- -- -- -- -- --Tin µg/m3 -- -- -- -- -- --Titanium µg/m3 -- -- -- 31 -- --Vanadium µg/m3 -- -- -- -- -- --Yttrium µg/m3 -- -- -- -- -- --Zinc µg/m3 -- -- -- -- -- --Zirconium µg/m3 -- -- -- -- -- --Table Notes:1 Arizona Department of Environmental Quality Acute and Chronic Ambient Air Concentrations, Title 18 Chapter 2 Article 17, December 20072 Arizona Department of Environmental Quality Ambient Air Quality Standards, Title 18 Chapter 2 Article 2, December 20073 EPA Region IX Preliminary Remediation Goals, Ambient Air, October 2004 Wind Speed: 4 EPA National Ambient Air Quality Standards, http://www.epa.gov/air/criteria.html, February 2008 mph5 California Acute Reference Exposure Levels, March 19996 With the exception of arsenic, the averaging time for all listed analytes is one hour. The averaging time for arsenic is four hours.7 The averaging time for the criteria is 24 hours.8 The averaging time for the criteria is the annual arithmetic mean.9 The averaging time for the criteria is the quarterly average.10 Only the PM10 fraction is being measured not the total suspended particulates.11 On May 20, 2008, EPA proposed to revise the National Ambient Air Quality (NAAQS) for lead to within the range of 0.1-0.3 mg/m 3.12 Percent of Total Mass13 Precipitation measurements are recorded manually by a Hayden-Winkelman High School employee; reliability cannot be verified.14 Bold values with bold outline indicate the result exceeds one or more of the comparison criteria. Calm: < 115 Bold italicized values indicate the non-detected result exceeds one or more of the comparison criteria. Wind direction16 * = The result is less than three times the level of uncertainty which is shown in place of the result. toward center17 -- = Not established18 °C = Degrees Celsius19 % = Percent20 J = Estimated value21 mph = miles per hour22 NA = Not Applicable or Not Analyzed23 NPR = No precipitation recorded.24 µg/m3 = Micrograms per cubic meter25 PM10 = particulate matter with a diameter less than or equal to 10 microns in size26 R = Rejected27 This table should be considered preliminary and will be revised based on incoming data, final data validation and QA/QC.
EPARegion IX
PreliminaryRemediation
Goal3
Avg Wind Speed (mph):
Avg Ambient Relative Humidity (%):
Avg Wind Direction (degrees):Avg Ambient Temperature (ºC):
EPANationalAmbient
Air QualityStandards4
CaliforniaAcute
ReferenceExposureLevels5 6
ArizonaHazardous Air
PollutantsAmbient Air
Concentrations(Acute)1
ArizonaAmbient
Air QualityStandards2
Date:Arizona
Hazardous AirPollutants
Ambient AirConcentrations
(Chronic)1Precipitation (inches)13:
Result Percent12 Qual Result Percent12 Qual Result Percent12 Qual Result Percent12 Qual Result Percent12 Qual Result Percent12 Qual1.53 NA 12.47 NA 21.93 NA 21.81 NA 8.36 NA 25.12 NA
0.0066 0.0000 * 0.1730 1.5430 0.3108 1.5730 0.5758 2.9340 0.1036 1.3820 0.6719 2.95900.0027 0.0000 * 0.0032 0.0281 0.0027 0.0050 * 0.0024 0.0000 * 0.0027 0.0345 * 0.0027 0.01180.0012 0.0000 * 0.0060 0.0538 0.0211 0.1068 0.0079 0.0403 0.0009 0.0063 * 0.0021 0.0075 *0.0039 0.0499 * 0.0090 0.0807 0.006 0.0222 * 0.0069 0.0259 * 0.0036 0.0264 * 0.0069 0.0091 *
NA NA 0.0048 0.0433 0.0106 0.0539 0.0131 0.0667 NA NA 0.0059 0.02590.0009 0.0033 * 0.0009 0.0088 * 0.0018 0.0093 0.0024 0.0120 0.0009 0.0119 0.0018 0.00790.0018 0.0000 * 0.0018 0.0000 * 0.0018 0.0076 * 0.0024 0.0122 0.0021 0.0000 * 0.0018 0.0000 *0.0015 0.0366 * 0.1815 1.6190 0.3713 1.8800 0.4637 2.3630 0.2141 2.8550 0.5603 2.46700.0042 0.1263 * 0.0057 0.0067 * 0.0096 0.0000 * 0.0081 0.0000 * 0.0045 0.0000 * 0.0087 0.0000 *0.0009 0.0000 * 0.0009 0.0059 * 0.0009 0.0014 * 0.0012 0.0007 * 0.0009 0.0000 * 0.0012 0.0000 *0.0027 0.0000 * 0.009 0.0000 * 0.0063 0.0000 * 0.003 0.0000 * 0.0033 0.0000 * 0.003 0.0000 *0.0024 0.1695 0.6672 5.9520 0.1837 0.9300 0.3176 1.6180 0.0122 0.1632 0.2216 0.97570.0012 0.0000 * 0.0015 0.0000 * 0.0015 0.0000 * 0.0015 0.0000 * 0.0012 0.0000 * 0.0012 0.0000 *0.0012 0.0000 * 0.0012 0.0000 * 0.0012 0.0000 * 0.0012 0.0000 * 0.0009 0.0000 * 0.0012 0.0000 *0.0021 0.0000 * 0.0021 0.0034 * 0.0021 0.0000 * 0.0021 0.0019 * 0.0021 0.0000 * 0.0021 0.0035 *0.0024 0.1728 0.4633 4.1340 0.3169 1.6050 0.6140 3.1280 0.0818 1.0910 0.6361 2.80100.0033 0.0964 * 0.0081 0.0223 * 0.0096 0.0000 * 0.0063 0.0000 * 0.0033 0.0013 * 0.0063 0.0000 *0.0024 0.0000 * 0.0272 0.2428 0.0342 0.1731 0.0257 0.1308 0.0024 0.0044 * 0.0177 0.07780.0123 0.0864 * 0.0471 0.4201 0.0471 0.2208 * 0.0243 0.0883 * 0.0285 0.2430 * 0.0258 0.0686 *0.0012 0.0000 * 0.0019 0.0168 0.0040 0.0203 0.0096 0.0487 0.0012 0.0157 * 0.0129 0.05680.0024 0.0000 * 0.0024 0.0000 * 0.0024 0.0000 * 0.0024 0.0000 * 0.0018 0.0000 * 0.0024 0.0000 *0.003 0.0000 * 0.003 0.0122 * 0.0027 0.0060 * 0.0049 0.0252 0.0021 0.0000 * 0.0012 0.0027 *
0.0021 0.0000 * 0.0021 0.0000 * 0.0018 0.0000 * 0.0021 0.0000 * 0.0015 0.0019 * 0.0021 0.0000 *0.0018 0.0133 * 0.0018 0.0000 * 0.0018 0.0000 * 0.0015 0.0002 * 0.0018 0.0000 * 0.0015 0.0000 *0.0024 0.0000 * 0.0039 0.0181 * 0.0048 0.0000 * 0.0054 0.0000 * 0.003 0.0000 * 0.0057 0.0000 *0.0024 0.1728 0.1009 0.9006 0.1819 0.9212 0.2755 1.4040 0.0617 0.8230 0.2933 1.29200.0012 0.0000 * 0.0009 0.0000 * 0.0012 0.0026 * 0.0014 0.0072 0.0006 0.0000 * 0.0019 0.00830.0009 0.0133 * 0.0056 0.0500 0.0043 0.0217 0.0024 0.0122 0.0006 0.0050 * 0.0041 0.01820.0051 0.0598 * 0.4864 4.3390 0.8094 4.0980 1.4170 7.2190 0.3083 4.1100 1.7110 7.53500.0018 0.0000 * 0.0020 0.0176 0.0018 0.0024 * 0.0026 0.0134 0.0021 0.0000 * 0.0020 0.00890.0297 0.4354 * 0.1215 0.7389 * 0.054 0.0458 * 0.0453 0.0000 * 0.1017 0.9354 * 0.0483 0.0000 *0.0015 0.0000 * 0.0012 0.0046 * 0.0023 0.0114 0.0033 0.0168 0.0010 0.0138 0.0045 0.01970.0018 0.0000 * 0.5090 4.5410 1.5260 7.7290 0.7872 4.0110 0.3568 4.7570 0.8885 3.91200.0036 0.0997 * 0.0036 0.0160 * 0.0039 0.0134 * 0.0048 0.0000 * 0.0027 0.0000 * 0.0048 0.0000 *0.0009 0.0000 * 0.0173 0.1542 0.0307 0.1554 0.0436 0.2219 0.0086 0.1149 0.0552 0.24320.0009 0.0066 * 0.0012 0.0000 * 0.0015 0.0000 * 0.0018 0.0086 * 0.0009 0.0000 * 0.0028 0.01240.0018 0.0000 * 0.0015 0.0000 * 0.0015 0.0000 * 0.0009 0.0014 * 0.0012 0.0000 * 0.0006 0.0004 *0.0018 0.0000 * 0.0257 0.2294 0.0161 0.0813 0.0186 0.0945 0.0018 0.0239 0.0126 0.05540.0021 0.0499 * 0.0018 0.0046 * 0.0021 0.0010 * 0.0011 0.0055 0.0015 0.0000 * 0.0019 0.0083
Calm: 12.5% Calm: 35.42% Calm: 39.58% Calm: 29.17% Calm: 0.00% Calm: 94.74%
12.438.7 13.2 12.7 15.1
25525.5 34.1 32.7 32.4 30.6306 291 230 226
NPR
4.29 3.29 2.67 3.48 3.17
NPR NPR NPR NPR
8/18/078/12/078/6/07 9/5/078/24/07
NPR6.9
8/30/077.83
35.176
.••····~wo!ffM ·•, .. _ . -.,._
D >= 17
D 7 - 17 -1 - 7
-... , ___ _
'··------+· ,. ,,., ·
. , ,--·· . .... ··-,,_ / ·· ... "\· ...
e,;t ?-~~''.) . •·••+••r •
----- --·-- -~~LlfM--'-- ____ t~lfttt ----- -·
_ •• · •···•'·· --;MCi-i:tfM ··•• •• ,._
//./~_: .. / ,/ .. ::·_:·<·--;;,
':~\\ti}~~::'.-~ --... . Csol.fTM------
>--······-· __ :·.:~::·.:·_· __ ··-... _ ··-,;,_ .,.- : ----~~ .... ,... ,...---r-,~ \:_~;
;.,,~/ : :., \ BT; \ .. J,,,• , r /
-... ,_ --·•' .... ,.,_ . __ .. -
-- - --• •••• -!,. •• , •• • - - ·' ,,•'
___ jE9LJTM--•·
.••' " •. --··1MORTH '•,,
----- ·r··· ·----. ·· ...... ···-.... 1i'li-\
·,,_ Pli , __ .,
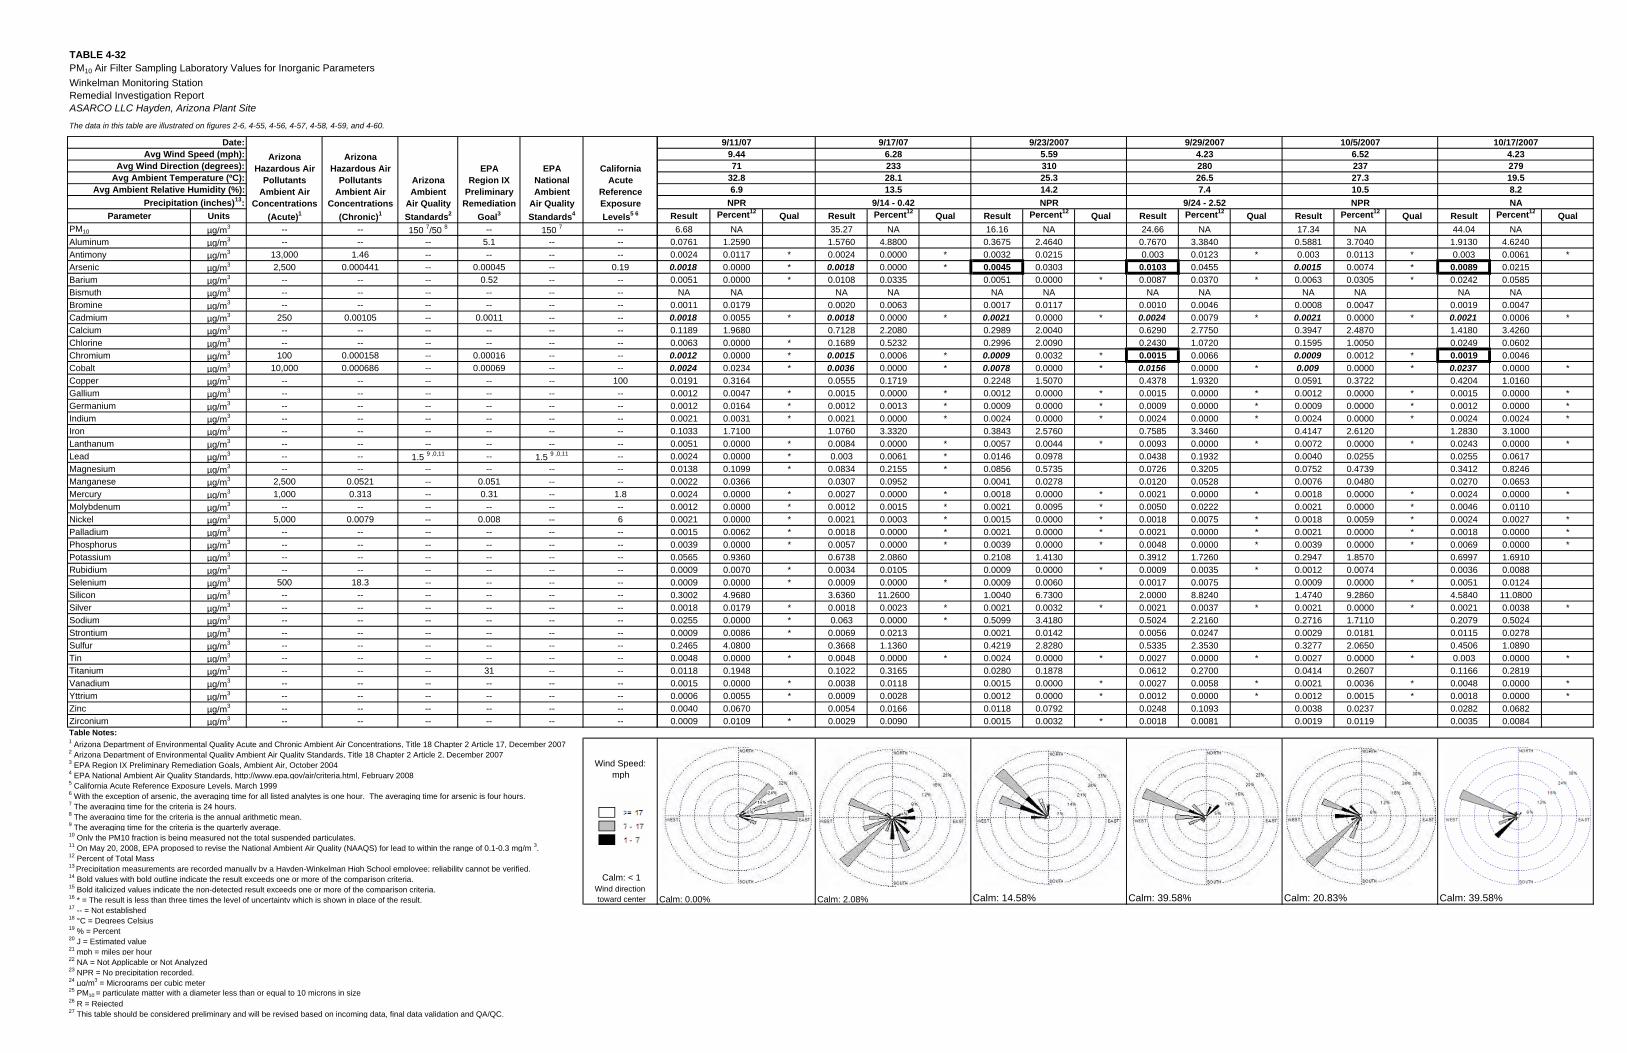
TABLE 4-32PM10 Air Filter Sampling Laboratory Values for Inorganic ParametersWinkelman Monitoring StationRemedial Investigation ReportASARCO LLC Hayden, Arizona Plant Site
The data in this table are illustrated on figures 2-6, 4-55, 4-56, 4-57, 4-58, 4-59, and 4-60.
Parameter UnitsPM10 µg/m3 -- -- 150 7/50 8 -- 150 7 --Aluminum µg/m3 -- -- -- 5.1 -- --Antimony µg/m3 13,000 1.46 -- -- -- --Arsenic µg/m3 2,500 0.000441 -- 0.00045 -- 0.19Barium µg/m3 -- -- -- 0.52 -- --Bismuth µg/m3 -- -- -- -- -- --Bromine µg/m3 -- -- -- -- -- --Cadmium µg/m3 250 0.00105 -- 0.0011 -- --Calcium µg/m3 -- -- -- -- -- --Chlorine µg/m3 -- -- -- -- -- --Chromium µg/m3 100 0.000158 -- 0.00016 -- --Cobalt µg/m3 10,000 0.000686 -- 0.00069 -- --Copper µg/m3 -- -- -- -- -- 100Gallium µg/m3 -- -- -- -- -- --Germanium µg/m3 -- -- -- -- -- --Indium µg/m3 -- -- -- -- -- --Iron µg/m3 -- -- -- -- -- --Lanthanum µg/m3 -- -- -- -- -- --Lead µg/m3 -- -- 1.5 9 ,0,11 -- 1.5 9 ,0,11 --Magnesium µg/m3 -- -- -- -- -- --Manganese µg/m3 2,500 0.0521 -- 0.051 -- --Mercury µg/m3 1,000 0.313 -- 0.31 -- 1.8Molybdenum µg/m3 -- -- -- -- -- --Nickel µg/m3 5,000 0.0079 -- 0.008 -- 6Palladium µg/m3 -- -- -- -- -- --Phosphorus µg/m3 -- -- -- -- -- --Potassium µg/m3 -- -- -- -- -- --Rubidium µg/m3 -- -- -- -- -- --Selenium µg/m3 500 18.3 -- -- -- --Silicon µg/m3 -- -- -- -- -- --Silver µg/m3 -- -- -- -- -- --Sodium µg/m3 -- -- -- -- -- --Strontium µg/m3 -- -- -- -- -- --Sulfur µg/m3 -- -- -- -- -- --Tin µg/m3 -- -- -- -- -- --Titanium µg/m3 -- -- -- 31 -- --Vanadium µg/m3 -- -- -- -- -- --Yttrium µg/m3 -- -- -- -- -- --Zinc µg/m3 -- -- -- -- -- --Zirconium µg/m3 -- -- -- -- -- --Table Notes:1 Arizona Department of Environmental Quality Acute and Chronic Ambient Air Concentrations, Title 18 Chapter 2 Article 17, December 20072 Arizona Department of Environmental Quality Ambient Air Quality Standards, Title 18 Chapter 2 Article 2, December 20073 EPA Region IX Preliminary Remediation Goals, Ambient Air, October 2004 Wind Speed: 4 EPA National Ambient Air Quality Standards, http://www.epa.gov/air/criteria.html, February 2008 mph5 California Acute Reference Exposure Levels, March 19996 With the exception of arsenic, the averaging time for all listed analytes is one hour. The averaging time for arsenic is four hours.7 The averaging time for the criteria is 24 hours.8 The averaging time for the criteria is the annual arithmetic mean.9 The averaging time for the criteria is the quarterly average.10 Only the PM10 fraction is being measured not the total suspended particulates.11 On May 20, 2008, EPA proposed to revise the National Ambient Air Quality (NAAQS) for lead to within the range of 0.1-0.3 mg/m 3.12 Percent of Total Mass13 Precipitation measurements are recorded manually by a Hayden-Winkelman High School employee; reliability cannot be verified.14 Bold values with bold outline indicate the result exceeds one or more of the comparison criteria. Calm: < 115 Bold italicized values indicate the non-detected result exceeds one or more of the comparison criteria. Wind direction16 * = The result is less than three times the level of uncertainty which is shown in place of the result. toward center17 -- = Not established18 °C = Degrees Celsius19 % = Percent20 J = Estimated value21 mph = miles per hour22 NA = Not Applicable or Not Analyzed23 NPR = No precipitation recorded.24 µg/m3 = Micrograms per cubic meter25 PM10 = particulate matter with a diameter less than or equal to 10 microns in size26 R = Rejected27 This table should be considered preliminary and will be revised based on incoming data, final data validation and QA/QC.
EPARegion IX
PreliminaryRemediation
Goal3
Avg Wind Speed (mph):
Avg Ambient Relative Humidity (%):
Avg Wind Direction (degrees):Avg Ambient Temperature (ºC):
EPANationalAmbient
Air QualityStandards4
CaliforniaAcute
ReferenceExposureLevels5 6
ArizonaHazardous Air
PollutantsAmbient Air
Concentrations(Acute)1
ArizonaAmbient
Air QualityStandards2
Date:Arizona
Hazardous AirPollutants
Ambient AirConcentrations
(Chronic)1Precipitation (inches)13:
Result Percent12 Qual Result Percent12 Qual Result Percent12 Qual Result Percent12 Qual Result Percent12 Qual Result Percent12 Qual6.68 NA 35.27 NA 16.16 NA 24.66 NA 17.34 NA 44.04 NA
0.0761 1.2590 1.5760 4.8800 0.3675 2.4640 0.7670 3.3840 0.5881 3.7040 1.9130 4.62400.0024 0.0117 * 0.0024 0.0000 * 0.0032 0.0215 0.003 0.0123 * 0.003 0.0113 * 0.003 0.0061 *0.0018 0.0000 * 0.0018 0.0000 * 0.0045 0.0303 0.0103 0.0455 0.0015 0.0074 * 0.0089 0.02150.0051 0.0000 * 0.0108 0.0335 0.0051 0.0000 * 0.0087 0.0370 * 0.0063 0.0305 * 0.0242 0.0585
NA NA NA NA NA NA NA NA NA NA NA NA0.0011 0.0179 0.0020 0.0063 0.0017 0.0117 0.0010 0.0046 0.0008 0.0047 0.0019 0.00470.0018 0.0055 * 0.0018 0.0000 * 0.0021 0.0000 * 0.0024 0.0079 * 0.0021 0.0000 * 0.0021 0.0006 *0.1189 1.9680 0.7128 2.2080 0.2989 2.0040 0.6290 2.7750 0.3947 2.4870 1.4180 3.42600.0063 0.0000 * 0.1689 0.5232 0.2996 2.0090 0.2430 1.0720 0.1595 1.0050 0.0249 0.06020.0012 0.0000 * 0.0015 0.0006 * 0.0009 0.0032 * 0.0015 0.0066 0.0009 0.0012 * 0.0019 0.00460.0024 0.0234 * 0.0036 0.0000 * 0.0078 0.0000 * 0.0156 0.0000 * 0.009 0.0000 * 0.0237 0.0000 *0.0191 0.3164 0.0555 0.1719 0.2248 1.5070 0.4378 1.9320 0.0591 0.3722 0.4204 1.01600.0012 0.0047 * 0.0015 0.0000 * 0.0012 0.0000 * 0.0015 0.0000 * 0.0012 0.0000 * 0.0015 0.0000 *0.0012 0.0164 * 0.0012 0.0013 * 0.0009 0.0000 * 0.0009 0.0000 * 0.0009 0.0000 * 0.0012 0.0000 *0.0021 0.0031 * 0.0021 0.0000 * 0.0024 0.0000 * 0.0024 0.0000 * 0.0024 0.0000 * 0.0024 0.0024 *0.1033 1.7100 1.0760 3.3320 0.3843 2.5760 0.7585 3.3460 0.4147 2.6120 1.2830 3.10000.0051 0.0000 * 0.0084 0.0000 * 0.0057 0.0044 * 0.0093 0.0000 * 0.0072 0.0000 * 0.0243 0.0000 *0.0024 0.0000 * 0.003 0.0061 * 0.0146 0.0978 0.0438 0.1932 0.0040 0.0255 0.0255 0.06170.0138 0.1099 * 0.0834 0.2155 * 0.0856 0.5735 0.0726 0.3205 0.0752 0.4739 0.3412 0.82460.0022 0.0366 0.0307 0.0952 0.0041 0.0278 0.0120 0.0528 0.0076 0.0480 0.0270 0.06530.0024 0.0000 * 0.0027 0.0000 * 0.0018 0.0000 * 0.0021 0.0000 * 0.0018 0.0000 * 0.0024 0.0000 *0.0012 0.0000 * 0.0012 0.0015 * 0.0021 0.0095 * 0.0050 0.0222 0.0021 0.0000 * 0.0046 0.01100.0021 0.0000 * 0.0021 0.0003 * 0.0015 0.0000 * 0.0018 0.0075 * 0.0018 0.0059 * 0.0024 0.0027 *0.0015 0.0062 * 0.0018 0.0000 * 0.0021 0.0000 * 0.0021 0.0000 * 0.0021 0.0000 * 0.0018 0.0000 *0.0039 0.0000 * 0.0057 0.0000 * 0.0039 0.0000 * 0.0048 0.0000 * 0.0039 0.0000 * 0.0069 0.0000 *0.0565 0.9360 0.6738 2.0860 0.2108 1.4130 0.3912 1.7260 0.2947 1.8570 0.6997 1.69100.0009 0.0070 * 0.0034 0.0105 0.0009 0.0000 * 0.0009 0.0035 * 0.0012 0.0074 0.0036 0.00880.0009 0.0000 * 0.0009 0.0000 * 0.0009 0.0060 0.0017 0.0075 0.0009 0.0000 * 0.0051 0.01240.3002 4.9680 3.6360 11.2600 1.0040 6.7300 2.0000 8.8240 1.4740 9.2860 4.5840 11.08000.0018 0.0179 * 0.0018 0.0023 * 0.0021 0.0032 * 0.0021 0.0037 * 0.0021 0.0000 * 0.0021 0.0038 *0.0255 0.0000 * 0.063 0.0000 * 0.5099 3.4180 0.5024 2.2160 0.2716 1.7110 0.2079 0.50240.0009 0.0086 * 0.0069 0.0213 0.0021 0.0142 0.0056 0.0247 0.0029 0.0181 0.0115 0.02780.2465 4.0800 0.3668 1.1360 0.4219 2.8280 0.5335 2.3530 0.3277 2.0650 0.4506 1.08900.0048 0.0000 * 0.0048 0.0000 * 0.0024 0.0000 * 0.0027 0.0000 * 0.0027 0.0000 * 0.003 0.0000 *0.0118 0.1948 0.1022 0.3165 0.0280 0.1878 0.0612 0.2700 0.0414 0.2607 0.1166 0.28190.0015 0.0000 * 0.0038 0.0118 0.0015 0.0000 * 0.0027 0.0058 * 0.0021 0.0036 * 0.0048 0.0000 *0.0006 0.0055 * 0.0009 0.0028 0.0012 0.0000 * 0.0012 0.0000 * 0.0012 0.0015 * 0.0018 0.0000 *0.0040 0.0670 0.0054 0.0166 0.0118 0.0792 0.0248 0.1093 0.0038 0.0237 0.0282 0.06820.0009 0.0109 * 0.0029 0.0090 0.0015 0.0032 * 0.0018 0.0081 0.0019 0.0119 0.0035 0.0084
Calm: 0.00% Calm: 2.08% Calm: 14.58% Calm: 39.58% Calm: 20.83% Calm: 39.58%
9/29/20075.59 6.52 4.234.23
9/23/2007 10/5/2007 10/17/2007
310 237 279280
8.225.3 27.3 19.526.5
9/24 - 2.527.414.2 10.5
NPR NPR NA6.9 13.5
71 23332.8 28.1
NPR 9/14 - 0.42
9.44 6.289/17/079/11/07
D >= 17
D 7 - 17 -1 - 7
•• ,-· .----~...orcm ·-,,. . ,._ . , ... ,-·- . ···- ··-,,.
/, //_.-- . ·····;,.. '"
,mi· L.{,i;i_,1.~_,_•·:' · '>,, \........ •. '•······~----·
' -•••• •• _J ----
' • . -, __
··· !k)IJl'k.-•··
,, •'
___ •• ,- .. 11o0rrrt1 ··- --- .,.
--...• 11:0l.l'ni-~-·
--- ""]i,,:ilffil·,, -., •
( ~_._,_·,_;~!!~~•:;:~<;~_/ ····';'"•"··
,, •'
----------~~1/Tll--'-
.. .,- ' .. ·· ,,,_
,. ---·-- ·· · · · · ···,, ~5-111---.
~~ ~':·~,;·)-~ ., .,
·-----:-----··
········•'" .... ·---~~1/l'W--•····•''"'
..·-' ,.---···1·•, ... _ ·-.,_
~.~_·:-_:: r, j _,_-,;·'.~--
·-._
-+----·
,,
-+--···· ·-----, .... _J~Llffl --•···
,,.,
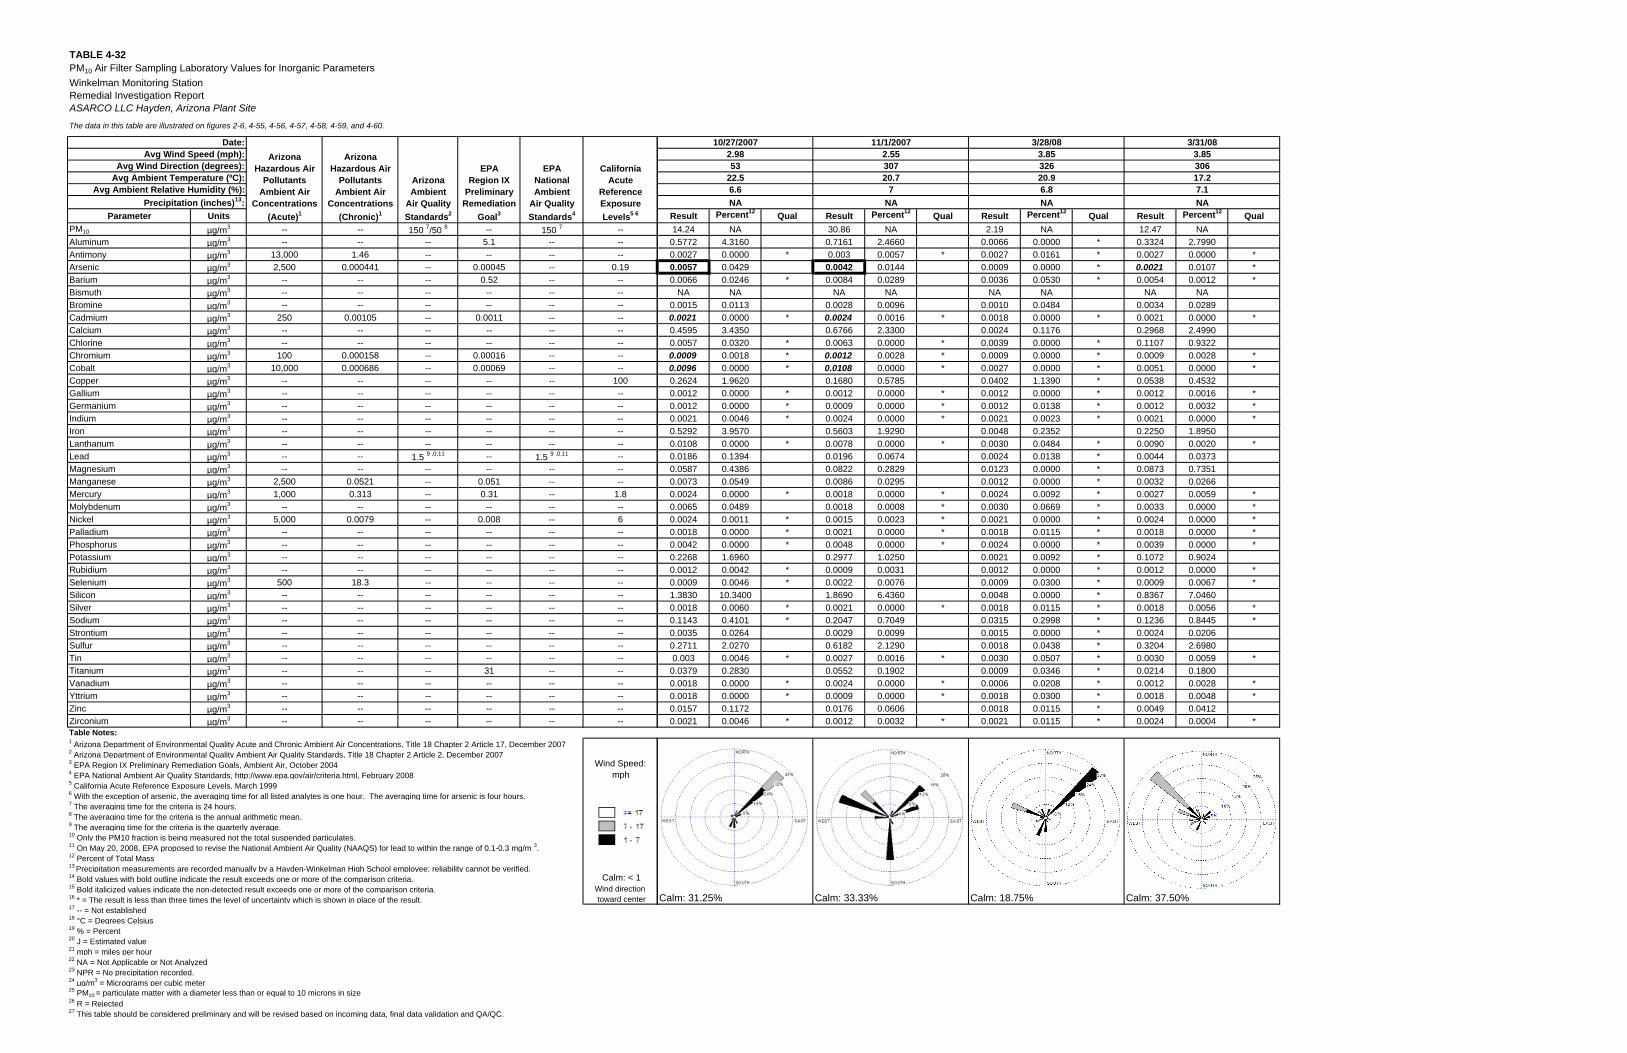
TABLE 4-32PM10 Air Filter Sampling Laboratory Values for Inorganic ParametersWinkelman Monitoring StationRemedial Investigation ReportASARCO LLC Hayden, Arizona Plant Site
The data in this table are illustrated on figures 2-6, 4-55, 4-56, 4-57, 4-58, 4-59, and 4-60.
Parameter UnitsPM10 µg/m3 -- -- 150 7/50 8 -- 150 7 --Aluminum µg/m3 -- -- -- 5.1 -- --Antimony µg/m3 13,000 1.46 -- -- -- --Arsenic µg/m3 2,500 0.000441 -- 0.00045 -- 0.19Barium µg/m3 -- -- -- 0.52 -- --Bismuth µg/m3 -- -- -- -- -- --Bromine µg/m3 -- -- -- -- -- --Cadmium µg/m3 250 0.00105 -- 0.0011 -- --Calcium µg/m3 -- -- -- -- -- --Chlorine µg/m3 -- -- -- -- -- --Chromium µg/m3 100 0.000158 -- 0.00016 -- --Cobalt µg/m3 10,000 0.000686 -- 0.00069 -- --Copper µg/m3 -- -- -- -- -- 100Gallium µg/m3 -- -- -- -- -- --Germanium µg/m3 -- -- -- -- -- --Indium µg/m3 -- -- -- -- -- --Iron µg/m3 -- -- -- -- -- --Lanthanum µg/m3 -- -- -- -- -- --Lead µg/m3 -- -- 1.5 9 ,0,11 -- 1.5 9 ,0,11 --Magnesium µg/m3 -- -- -- -- -- --Manganese µg/m3 2,500 0.0521 -- 0.051 -- --Mercury µg/m3 1,000 0.313 -- 0.31 -- 1.8Molybdenum µg/m3 -- -- -- -- -- --Nickel µg/m3 5,000 0.0079 -- 0.008 -- 6Palladium µg/m3 -- -- -- -- -- --Phosphorus µg/m3 -- -- -- -- -- --Potassium µg/m3 -- -- -- -- -- --Rubidium µg/m3 -- -- -- -- -- --Selenium µg/m3 500 18.3 -- -- -- --Silicon µg/m3 -- -- -- -- -- --Silver µg/m3 -- -- -- -- -- --Sodium µg/m3 -- -- -- -- -- --Strontium µg/m3 -- -- -- -- -- --Sulfur µg/m3 -- -- -- -- -- --Tin µg/m3 -- -- -- -- -- --Titanium µg/m3 -- -- -- 31 -- --Vanadium µg/m3 -- -- -- -- -- --Yttrium µg/m3 -- -- -- -- -- --Zinc µg/m3 -- -- -- -- -- --Zirconium µg/m3 -- -- -- -- -- --Table Notes:1 Arizona Department of Environmental Quality Acute and Chronic Ambient Air Concentrations, Title 18 Chapter 2 Article 17, December 20072 Arizona Department of Environmental Quality Ambient Air Quality Standards, Title 18 Chapter 2 Article 2, December 20073 EPA Region IX Preliminary Remediation Goals, Ambient Air, October 2004 Wind Speed: 4 EPA National Ambient Air Quality Standards, http://www.epa.gov/air/criteria.html, February 2008 mph5 California Acute Reference Exposure Levels, March 19996 With the exception of arsenic, the averaging time for all listed analytes is one hour. The averaging time for arsenic is four hours.7 The averaging time for the criteria is 24 hours.8 The averaging time for the criteria is the annual arithmetic mean.9 The averaging time for the criteria is the quarterly average.10 Only the PM10 fraction is being measured not the total suspended particulates.11 On May 20, 2008, EPA proposed to revise the National Ambient Air Quality (NAAQS) for lead to within the range of 0.1-0.3 mg/m 3.12 Percent of Total Mass13 Precipitation measurements are recorded manually by a Hayden-Winkelman High School employee; reliability cannot be verified.14 Bold values with bold outline indicate the result exceeds one or more of the comparison criteria. Calm: < 115 Bold italicized values indicate the non-detected result exceeds one or more of the comparison criteria. Wind direction16 * = The result is less than three times the level of uncertainty which is shown in place of the result. toward center17 -- = Not established18 °C = Degrees Celsius19 % = Percent20 J = Estimated value21 mph = miles per hour22 NA = Not Applicable or Not Analyzed23 NPR = No precipitation recorded.24 µg/m3 = Micrograms per cubic meter25 PM10 = particulate matter with a diameter less than or equal to 10 microns in size26 R = Rejected27 This table should be considered preliminary and will be revised based on incoming data, final data validation and QA/QC.
EPARegion IX
PreliminaryRemediation
Goal3
Avg Wind Speed (mph):
Avg Ambient Relative Humidity (%):
Avg Wind Direction (degrees):Avg Ambient Temperature (ºC):
EPANationalAmbient
Air QualityStandards4
CaliforniaAcute
ReferenceExposureLevels5 6
ArizonaHazardous Air
PollutantsAmbient Air
Concentrations(Acute)1
ArizonaAmbient
Air QualityStandards2
Date:Arizona
Hazardous AirPollutants
Ambient AirConcentrations
(Chronic)1Precipitation (inches)13:
Result Percent12 Qual Result Percent12 Qual Result Percent12 Qual Result Percent12 Qual14.24 NA 30.86 NA 2.19 NA 12.47 NA
0.5772 4.3160 0.7161 2.4660 0.0066 0.0000 * 0.3324 2.79900.0027 0.0000 * 0.003 0.0057 * 0.0027 0.0161 * 0.0027 0.0000 *0.0057 0.0429 0.0042 0.0144 0.0009 0.0000 * 0.0021 0.0107 *0.0066 0.0246 * 0.0084 0.0289 0.0036 0.0530 * 0.0054 0.0012 *
NA NA NA NA NA NA NA NA0.0015 0.0113 0.0028 0.0096 0.0010 0.0484 0.0034 0.02890.0021 0.0000 * 0.0024 0.0016 * 0.0018 0.0000 * 0.0021 0.0000 *0.4595 3.4350 0.6766 2.3300 0.0024 0.1176 0.2968 2.49900.0057 0.0320 * 0.0063 0.0000 * 0.0039 0.0000 * 0.1107 0.93220.0009 0.0018 * 0.0012 0.0028 * 0.0009 0.0000 * 0.0009 0.0028 *0.0096 0.0000 * 0.0108 0.0000 * 0.0027 0.0000 * 0.0051 0.0000 *0.2624 1.9620 0.1680 0.5785 0.0402 1.1390 * 0.0538 0.45320.0012 0.0000 * 0.0012 0.0000 * 0.0012 0.0000 * 0.0012 0.0016 *0.0012 0.0000 * 0.0009 0.0000 * 0.0012 0.0138 * 0.0012 0.0032 *0.0021 0.0046 * 0.0024 0.0000 * 0.0021 0.0023 * 0.0021 0.0000 *0.5292 3.9570 0.5603 1.9290 0.0048 0.2352 0.2250 1.89500.0108 0.0000 * 0.0078 0.0000 * 0.0030 0.0484 * 0.0090 0.0020 *0.0186 0.1394 0.0196 0.0674 0.0024 0.0138 * 0.0044 0.03730.0587 0.4386 0.0822 0.2829 0.0123 0.0000 * 0.0873 0.73510.0073 0.0549 0.0086 0.0295 0.0012 0.0000 * 0.0032 0.02660.0024 0.0000 * 0.0018 0.0000 * 0.0024 0.0092 * 0.0027 0.0059 *0.0065 0.0489 0.0018 0.0008 * 0.0030 0.0669 * 0.0033 0.0000 *0.0024 0.0011 * 0.0015 0.0023 * 0.0021 0.0000 * 0.0024 0.0000 *0.0018 0.0000 * 0.0021 0.0000 * 0.0018 0.0115 * 0.0018 0.0000 *0.0042 0.0000 * 0.0048 0.0000 * 0.0024 0.0000 * 0.0039 0.0000 *0.2268 1.6960 0.2977 1.0250 0.0021 0.0092 * 0.1072 0.90240.0012 0.0042 * 0.0009 0.0031 0.0012 0.0000 * 0.0012 0.0000 *0.0009 0.0046 * 0.0022 0.0076 0.0009 0.0300 * 0.0009 0.0067 *1.3830 10.3400 1.8690 6.4360 0.0048 0.0000 * 0.8367 7.04600.0018 0.0060 * 0.0021 0.0000 * 0.0018 0.0115 * 0.0018 0.0056 *0.1143 0.4101 * 0.2047 0.7049 0.0315 0.2998 * 0.1236 0.8445 *0.0035 0.0264 0.0029 0.0099 0.0015 0.0000 * 0.0024 0.02060.2711 2.0270 0.6182 2.1290 0.0018 0.0438 * 0.3204 2.69800.003 0.0046 * 0.0027 0.0016 * 0.0030 0.0507 * 0.0030 0.0059 *
0.0379 0.2830 0.0552 0.1902 0.0009 0.0346 * 0.0214 0.18000.0018 0.0000 * 0.0024 0.0000 * 0.0006 0.0208 * 0.0012 0.0028 *0.0018 0.0000 * 0.0009 0.0000 * 0.0018 0.0300 * 0.0018 0.0048 *0.0157 0.1172 0.0176 0.0606 0.0018 0.0115 * 0.0049 0.04120.0021 0.0046 * 0.0012 0.0032 * 0.0021 0.0115 * 0.0024 0.0004 *
Calm: 31.25% Calm: 33.33% Calm: 18.75% Calm: 37.50%
10/27/2007 11/1/20072.98 2.5553
6.6
30720.7
722.5
NANA
3/28/08 3/31/083.85 3.85326 30620.9 17.26.8 7.1NA NA
--
~ -~ -
--
~
'
~
' ' ' ~
~
L__
'--
'--
' ' ' ' ~
L..--
L---
1----
' ' ' ' ' "----..,___ e----
I I
I I I I l I l l I I I I I I I I I I I I I I l l l l l I I I I I I I I I I I I l I l I I I I
I I I I I I I I I l I l I 7 I 7 I I I I I I I I I I I I I I I I I I I I I
I I l l I I I I I I I I l I I I I I I I l I I I I I I I l 7 I I I I I I 7 7 7 7 I I
~
D 0 = 17
D 1 - 11
- 1 - 7
~
~
I l l
I I ~ I
I l 7 I l I l
I I I I I I I l l l l I l I l I 7
I I I I 7 l I I I 7 I I I I 7 I l
I
l l
I
l I
I
I I ~ I
I l I I 1 I l I I 1 I I I I 7 7 I I I 7 I I I I 7 I l
I
l I
I
I I
l I
I I
I ~ I
I I 1
I I I I 1 I I I I 7 I I I I 7 I I I I 7 I I
I
I l
I
I
l I
I
I l
I ~ I
I 7 1
I I I 7 1 I I I I 7 I I I I 7 I I I I 7 I I I I I 7 7 I I 7 7 I I I I 7 I I I 7 I I I 7
I I I I I I I I I
-· , - !liOATH ,, .,_ . • .. • !WCllffi! ·-,, __ I .- ., '
•' ,,··
_,.---·1··----'· ..
_. ,••' -- ••°T"'•·
•i'lii
.. -.. -.
,·' _,.--·:··- ..
f ~i::f\;::Ii~II!l) t\~ /~-) ··--., ______ l~I.ITlt ------------
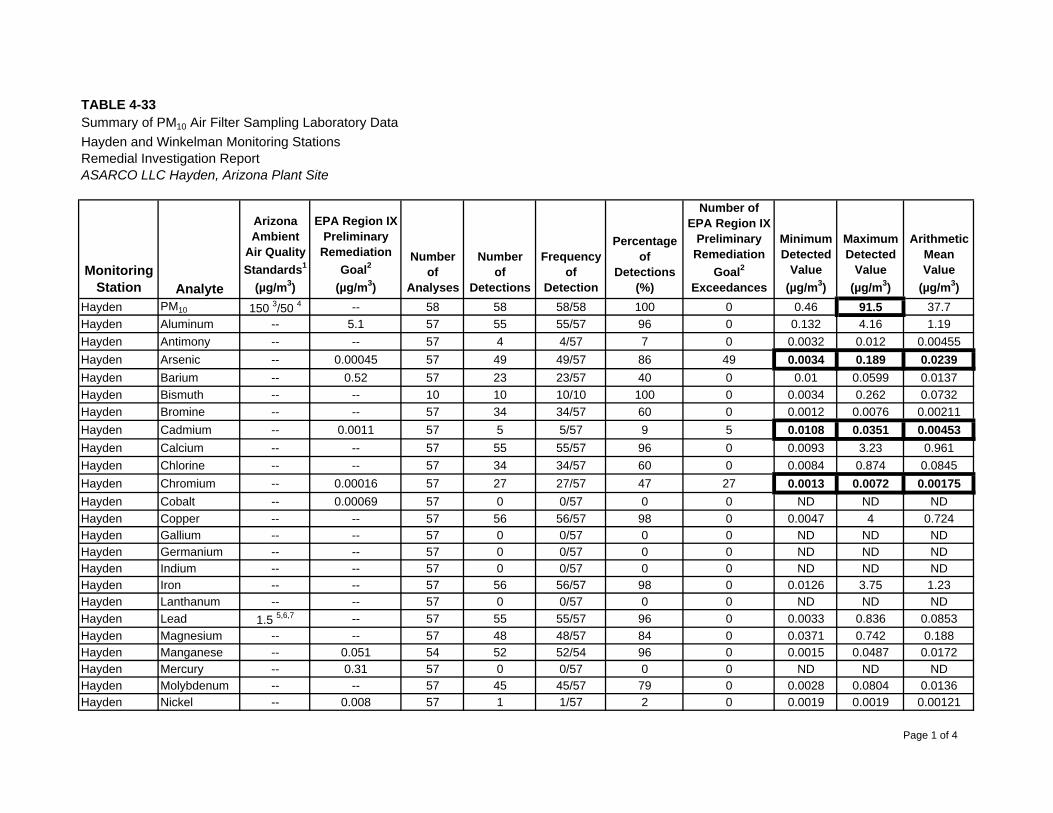
TABLE 4-33Summary of PM10 Air Filter Sampling Laboratory DataHayden and Winkelman Monitoring StationsRemedial Investigation ReportASARCO LLC Hayden, Arizona Plant Site
MonitoringStation Analyte
ArizonaAmbient
Air QualityStandards1
(µg/m3)
EPA Region IXPreliminary
RemediationGoal2
(µg/m3)
Numberof
Analyses
Numberof
Detections
Frequencyof
Detection
Percentageof
Detections(%)
Number ofEPA Region IX
PreliminaryRemediation
Goal2
Exceedances
MinimumDetected
Value(µg/m3)
MaximumDetected
Value(µg/m3)
ArithmeticMeanValue
(µg/m3)Hayden PM10 150 3/50 4 -- 58 58 58/58 100 0 0.46 91.5 37.7Hayden Aluminum -- 5.1 57 55 55/57 96 0 0.132 4.16 1.19Hayden Antimony -- -- 57 4 4/57 7 0 0.0032 0.012 0.00455Hayden Arsenic -- 0.00045 57 49 49/57 86 49 0.0034 0.189 0.0239Hayden Barium -- 0.52 57 23 23/57 40 0 0.01 0.0599 0.0137Hayden Bismuth -- -- 10 10 10/10 100 0 0.0034 0.262 0.0732Hayden Bromine -- -- 57 34 34/57 60 0 0.0012 0.0076 0.00211Hayden Cadmium -- 0.0011 57 5 5/57 9 5 0.0108 0.0351 0.00453Hayden Calcium -- -- 57 55 55/57 96 0 0.0093 3.23 0.961Hayden Chlorine -- -- 57 34 34/57 60 0 0.0084 0.874 0.0845Hayden Chromium -- 0.00016 57 27 27/57 47 27 0.0013 0.0072 0.00175Hayden Cobalt -- 0.00069 57 0 0/57 0 0 ND ND NDHayden Copper -- -- 57 56 56/57 98 0 0.0047 4 0.724Hayden Gallium -- -- 57 0 0/57 0 0 ND ND NDHayden Germanium -- -- 57 0 0/57 0 0 ND ND NDHayden Indium -- -- 57 0 0/57 0 0 ND ND NDHayden Iron -- -- 57 56 56/57 98 0 0.0126 3.75 1.23Hayden Lanthanum -- -- 57 0 0/57 0 0 ND ND NDHayden Lead 1.5 5,6,7 -- 57 55 55/57 96 0 0.0033 0.836 0.0853Hayden Magnesium -- -- 57 48 48/57 84 0 0.0371 0.742 0.188Hayden Manganese -- 0.051 54 52 52/54 96 0 0.0015 0.0487 0.0172Hayden Mercury -- 0.31 57 0 0/57 0 0 ND ND NDHayden Molybdenum -- -- 57 45 45/57 79 0 0.0028 0.0804 0.0136Hayden Nickel -- 0.008 57 1 1/57 2 0 0.0019 0.0019 0.00121
Page 1 of 4
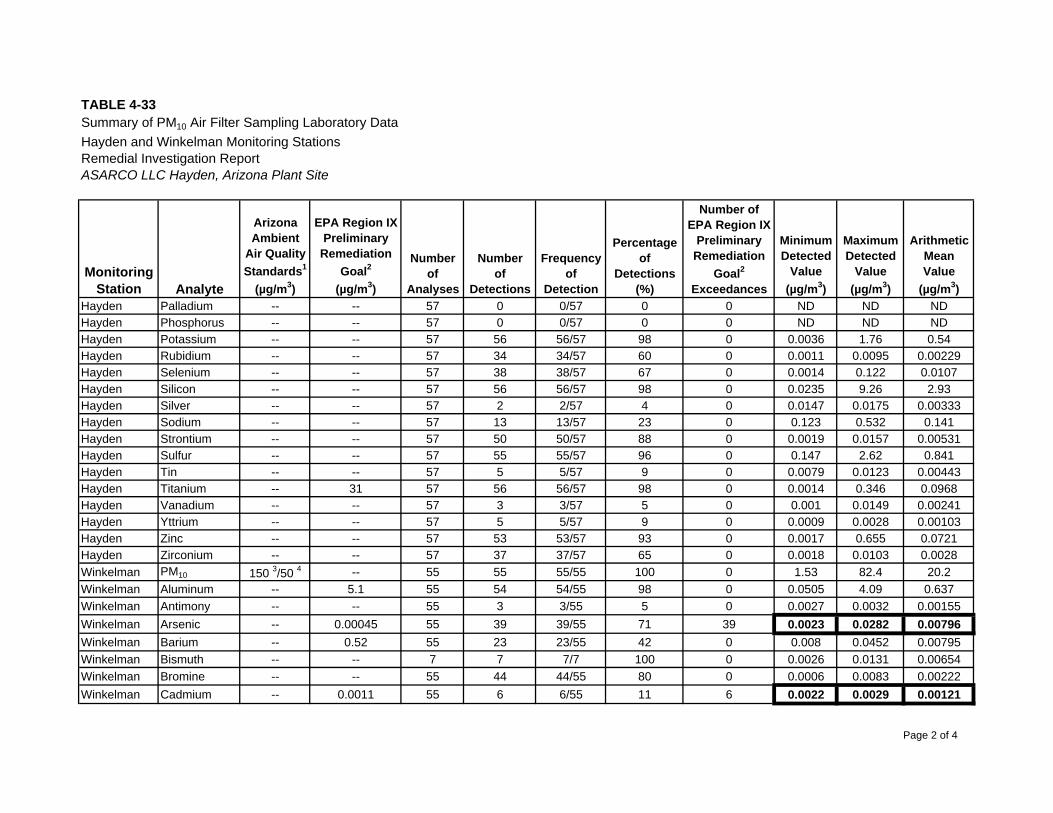
TABLE 4-33Summary of PM10 Air Filter Sampling Laboratory DataHayden and Winkelman Monitoring StationsRemedial Investigation ReportASARCO LLC Hayden, Arizona Plant Site
MonitoringStation Analyte
ArizonaAmbient
Air QualityStandards1
(µg/m3)
EPA Region IXPreliminary
RemediationGoal2
(µg/m3)
Numberof
Analyses
Numberof
Detections
Frequencyof
Detection
Percentageof
Detections(%)
Number ofEPA Region IX
PreliminaryRemediation
Goal2
Exceedances
MinimumDetected
Value(µg/m3)
MaximumDetected
Value(µg/m3)
ArithmeticMeanValue
(µg/m3)Hayden Palladium -- -- 57 0 0/57 0 0 ND ND NDHayden Phosphorus -- -- 57 0 0/57 0 0 ND ND NDHayden Potassium -- -- 57 56 56/57 98 0 0.0036 1.76 0.54Hayden Rubidium -- -- 57 34 34/57 60 0 0.0011 0.0095 0.00229Hayden Selenium -- -- 57 38 38/57 67 0 0.0014 0.122 0.0107Hayden Silicon -- -- 57 56 56/57 98 0 0.0235 9.26 2.93Hayden Silver -- -- 57 2 2/57 4 0 0.0147 0.0175 0.00333Hayden Sodium -- -- 57 13 13/57 23 0 0.123 0.532 0.141Hayden Strontium -- -- 57 50 50/57 88 0 0.0019 0.0157 0.00531Hayden Sulfur -- -- 57 55 55/57 96 0 0.147 2.62 0.841Hayden Tin -- -- 57 5 5/57 9 0 0.0079 0.0123 0.00443Hayden Titanium -- 31 57 56 56/57 98 0 0.0014 0.346 0.0968Hayden Vanadium -- -- 57 3 3/57 5 0 0.001 0.0149 0.00241Hayden Yttrium -- -- 57 5 5/57 9 0 0.0009 0.0028 0.00103Hayden Zinc -- -- 57 53 53/57 93 0 0.0017 0.655 0.0721Hayden Zirconium -- -- 57 37 37/57 65 0 0.0018 0.0103 0.0028Winkelman PM10 150 3/50 4 -- 55 55 55/55 100 0 1.53 82.4 20.2Winkelman Aluminum -- 5.1 55 54 54/55 98 0 0.0505 4.09 0.637Winkelman Antimony -- -- 55 3 3/55 5 0 0.0027 0.0032 0.00155Winkelman Arsenic -- 0.00045 55 39 39/55 71 39 0.0023 0.0282 0.00796Winkelman Barium -- 0.52 55 23 23/55 42 0 0.008 0.0452 0.00795Winkelman Bismuth -- -- 7 7 7/7 100 0 0.0026 0.0131 0.00654Winkelman Bromine -- -- 55 44 44/55 80 0 0.0006 0.0083 0.00222Winkelman Cadmium -- 0.0011 55 6 6/55 11 6 0.0022 0.0029 0.00121
Page 2 of 4
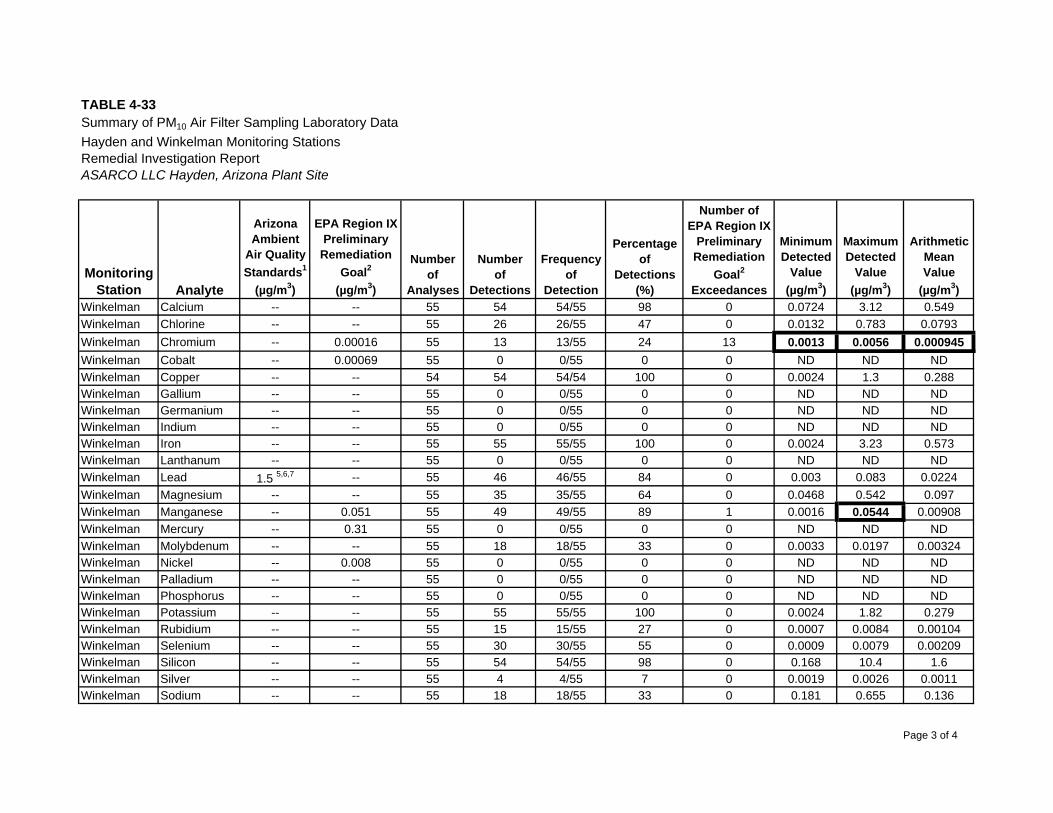
TABLE 4-33Summary of PM10 Air Filter Sampling Laboratory DataHayden and Winkelman Monitoring StationsRemedial Investigation ReportASARCO LLC Hayden, Arizona Plant Site
MonitoringStation Analyte
ArizonaAmbient
Air QualityStandards1
(µg/m3)
EPA Region IXPreliminary
RemediationGoal2
(µg/m3)
Numberof
Analyses
Numberof
Detections
Frequencyof
Detection
Percentageof
Detections(%)
Number ofEPA Region IX
PreliminaryRemediation
Goal2
Exceedances
MinimumDetected
Value(µg/m3)
MaximumDetected
Value(µg/m3)
ArithmeticMeanValue
(µg/m3)Winkelman Calcium -- -- 55 54 54/55 98 0 0.0724 3.12 0.549Winkelman Chlorine -- -- 55 26 26/55 47 0 0.0132 0.783 0.0793Winkelman Chromium -- 0.00016 55 13 13/55 24 13 0.0013 0.0056 0.000945Winkelman Cobalt -- 0.00069 55 0 0/55 0 0 ND ND NDWinkelman Copper -- -- 54 54 54/54 100 0 0.0024 1.3 0.288Winkelman Gallium -- -- 55 0 0/55 0 0 ND ND NDWinkelman Germanium -- -- 55 0 0/55 0 0 ND ND NDWinkelman Indium -- -- 55 0 0/55 0 0 ND ND NDWinkelman Iron -- -- 55 55 55/55 100 0 0.0024 3.23 0.573Winkelman Lanthanum -- -- 55 0 0/55 0 0 ND ND NDWinkelman Lead 1.5 5,6,7 -- 55 46 46/55 84 0 0.003 0.083 0.0224Winkelman Magnesium -- -- 55 35 35/55 64 0 0.0468 0.542 0.097Winkelman Manganese -- 0.051 55 49 49/55 89 1 0.0016 0.0544 0.00908Winkelman Mercury -- 0.31 55 0 0/55 0 0 ND ND NDWinkelman Molybdenum -- -- 55 18 18/55 33 0 0.0033 0.0197 0.00324Winkelman Nickel -- 0.008 55 0 0/55 0 0 ND ND NDWinkelman Palladium -- -- 55 0 0/55 0 0 ND ND NDWinkelman Phosphorus -- -- 55 0 0/55 0 0 ND ND NDWinkelman Potassium -- -- 55 55 55/55 100 0 0.0024 1.82 0.279Winkelman Rubidium -- -- 55 15 15/55 27 0 0.0007 0.0084 0.00104Winkelman Selenium -- -- 55 30 30/55 55 0 0.0009 0.0079 0.00209Winkelman Silicon -- -- 55 54 54/55 98 0 0.168 10.4 1.6Winkelman Silver -- -- 55 4 4/55 7 0 0.0019 0.0026 0.0011Winkelman Sodium -- -- 55 18 18/55 33 0 0.181 0.655 0.136
Page 3 of 4
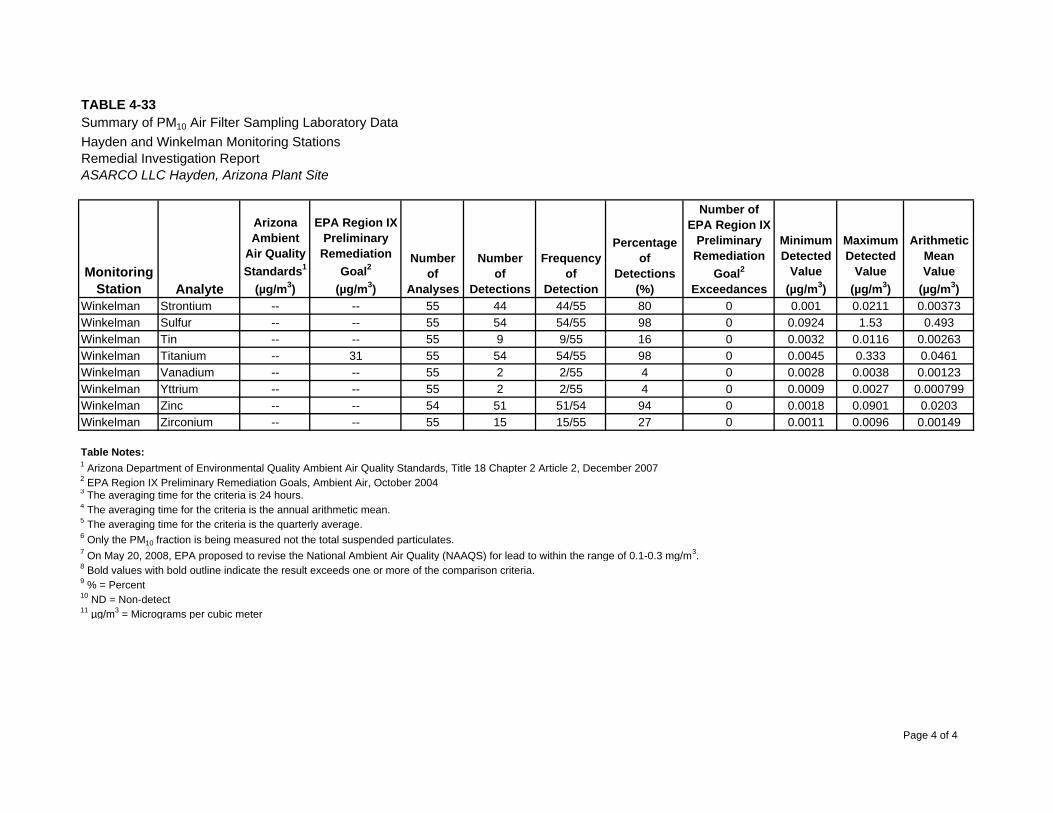
TABLE 4-33Summary of PM10 Air Filter Sampling Laboratory DataHayden and Winkelman Monitoring StationsRemedial Investigation ReportASARCO LLC Hayden, Arizona Plant Site
MonitoringStation Analyte
ArizonaAmbient
Air QualityStandards1
(µg/m3)
EPA Region IXPreliminary
RemediationGoal2
(µg/m3)
Numberof
Analyses
Numberof
Detections
Frequencyof
Detection
Percentageof
Detections(%)
Number ofEPA Region IX
PreliminaryRemediation
Goal2
Exceedances
MinimumDetected
Value(µg/m3)
MaximumDetected
Value(µg/m3)
ArithmeticMeanValue
(µg/m3)Winkelman Strontium -- -- 55 44 44/55 80 0 0.001 0.0211 0.00373Winkelman Sulfur -- -- 55 54 54/55 98 0 0.0924 1.53 0.493Winkelman Tin -- -- 55 9 9/55 16 0 0.0032 0.0116 0.00263Winkelman Titanium -- 31 55 54 54/55 98 0 0.0045 0.333 0.0461Winkelman Vanadium -- -- 55 2 2/55 4 0 0.0028 0.0038 0.00123Winkelman Yttrium -- -- 55 2 2/55 4 0 0.0009 0.0027 0.000799Winkelman Zinc -- -- 54 51 51/54 94 0 0.0018 0.0901 0.0203Winkelman Zirconium -- -- 55 15 15/55 27 0 0.0011 0.0096 0.00149
Table Notes:1 Arizona Department of Environmental Quality Ambient Air Quality Standards, Title 18 Chapter 2 Article 2, December 20072 EPA Region IX Preliminary Remediation Goals, Ambient Air, October 20043 The averaging time for the criteria is 24 hours.4 The averaging time for the criteria is the annual arithmetic mean.5 The averaging time for the criteria is the quarterly average.6 Only the PM10 fraction is being measured not the total suspended particulates.7 On May 20, 2008, EPA proposed to revise the National Ambient Air Quality (NAAQS) for lead to within the range of 0.1-0.3 mg/m3.8 Bold values with bold outline indicate the result exceeds one or more of the comparison criteria.9 % = Percent10 ND = Non-detect11 µg/m3 = Micrograms per cubic meter
Page 4 of 4
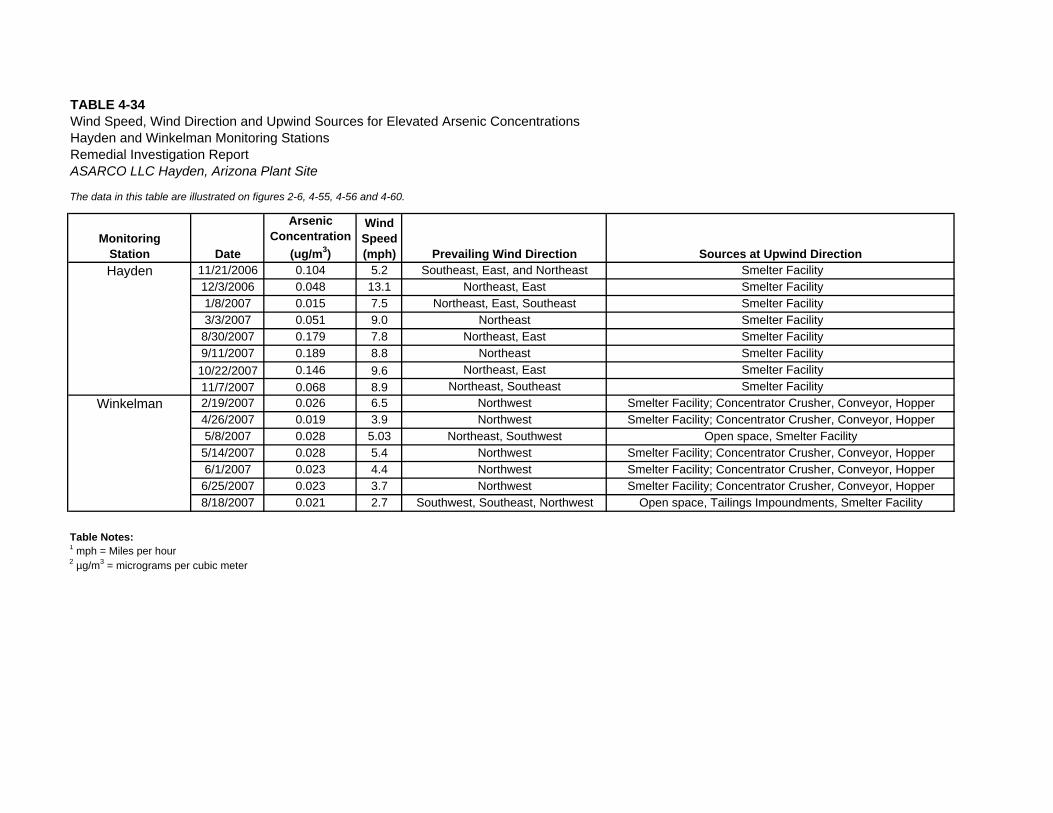
TABLE 4-34Wind Speed, Wind Direction and Upwind Sources for Elevated Arsenic ConcentrationsHayden and Winkelman Monitoring StationsRemedial Investigation ReportASARCO LLC Hayden, Arizona Plant Site
The data in this table are illustrated on figures 2-6, 4-55, 4-56 and 4-60.
MonitoringStation Date
Arsenic Concentration
(ug/m3)
WindSpeed(mph) Prevailing Wind Direction Sources at Upwind Direction
11/21/2006 0.104 5.2 Southeast, East, and Northeast Smelter Facility12/3/2006 0.048 13.1 Northeast, East Smelter Facility1/8/2007 0.015 7.5 Northeast, East, Southeast Smelter Facility3/3/2007 0.051 9.0 Northeast Smelter Facility
8/30/2007 0.179 7.8 Northeast, East Smelter Facility9/11/2007 0.189 8.8 Northeast Smelter Facility10/22/2007 0.146 9.6 Northeast, East Smelter Facility11/7/2007 0.068 8.9 Northeast, Southeast Smelter Facility2/19/2007 0.026 6.5 Northwest Smelter Facility; Concentrator Crusher, Conveyor, Hopper4/26/2007 0.019 3.9 Northwest Smelter Facility; Concentrator Crusher, Conveyor, Hopper5/8/2007 0.028 5.03 Northeast, Southwest Open space, Smelter Facility
5/14/2007 0.028 5.4 Northwest Smelter Facility; Concentrator Crusher, Conveyor, Hopper6/1/2007 0.023 4.4 Northwest Smelter Facility; Concentrator Crusher, Conveyor, Hopper
6/25/2007 0.023 3.7 Northwest Smelter Facility; Concentrator Crusher, Conveyor, Hopper8/18/2007 0.021 2.7 Southwest, Southeast, Northwest Open space, Tailings Impoundments, Smelter Facility
Table Notes:1 mph = Miles per hour2 µg/m3 = micrograms per cubic meter
Hayden
Winkelman
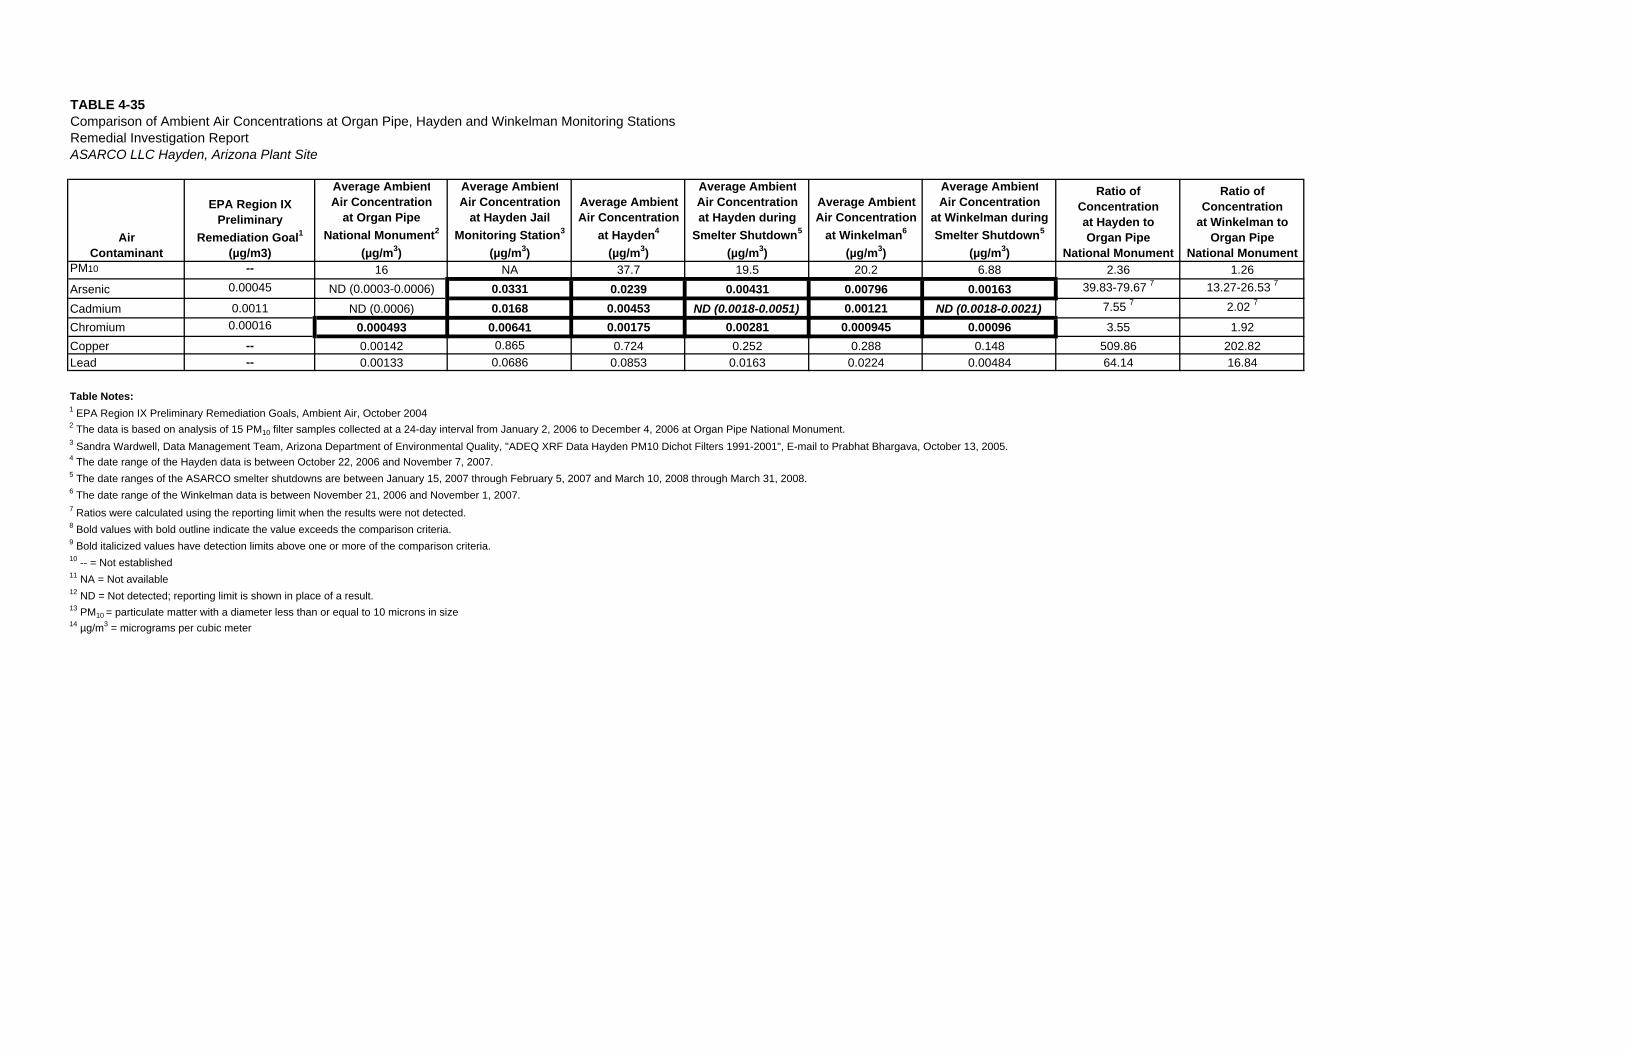
TABLE 4-35Comparison of Ambient Air Concentrations at Organ Pipe, Hayden and Winkelman Monitoring StationsRemedial Investigation ReportASARCO LLC Hayden, Arizona Plant Site
AirContaminant
EPA Region IXPreliminary
Remediation Goal1
(µg/m3)
Average AmbientAir Concentration
at Organ PipeNational Monument2
(µg/m3)
Average AmbientAir Concentration
at Hayden JailMonitoring Station3
(µg/m3)
Average AmbientAir Concentration
at Hayden4
(µg/m3)
Average AmbientAir Concentrationat Hayden during
Smelter Shutdown5
(µg/m3)
Average AmbientAir Concentration
at Winkelman6
(µg/m3)
Average AmbientAir Concentration
at Winkelman duringSmelter Shutdown5
(µg/m3)
Ratio of Concentrationat Hayden toOrgan Pipe
National Monument
Ratio of Concentration
at Winkelman toOrgan Pipe
National MonumentPM10 -- 16 NA 37.7 19.5 20.2 6.88 2.36 1.26Arsenic 0.00045 ND (0.0003-0.0006) 0.0331 0.0239 0.00431 0.00796 0.00163 39.83-79.67 7 13.27-26.53 7
Cadmium 0.0011 ND (0.0006) 0.0168 0.00453 ND (0.0018-0.0051) 0.00121 ND (0.0018-0.0021) 7.55 7 2.02 7
Chromium 0.00016 0.000493 0.00641 0.00175 0.00281 0.000945 0.00096 3.55 1.92Copper -- 0.00142 0.865 0.724 0.252 0.288 0.148 509.86 202.82Lead -- 0.00133 0.0686 0.0853 0.0163 0.0224 0.00484 64.14 16.84
Table Notes:1 EPA Region IX Preliminary Remediation Goals, Ambient Air, October 20042 The data is based on analysis of 15 PM10 filter samples collected at a 24-day interval from January 2, 2006 to December 4, 2006 at Organ Pipe National Monument.3 Sandra Wardwell, Data Management Team, Arizona Department of Environmental Quality, "ADEQ XRF Data Hayden PM10 Dichot Filters 1991-2001", E-mail to Prabhat Bhargava, October 13, 2005.4 The date range of the Hayden data is between October 22, 2006 and November 7, 2007.5 The date ranges of the ASARCO smelter shutdowns are between January 15, 2007 through February 5, 2007 and March 10, 2008 through March 31, 2008.6 The date range of the Winkelman data is between November 21, 2006 and November 1, 2007.7 Ratios were calculated using the reporting limit when the results were not detected.8 Bold values with bold outline indicate the value exceeds the comparison criteria.9 Bold italicized values have detection limits above one or more of the comparison criteria.10 -- = Not established11 NA = Not available12 ND = Not detected; reporting limit is shown in place of a result.13 PM10 = particulate matter with a diameter less than or equal to 10 microns in size14 µg/m3 = micrograms per cubic meter
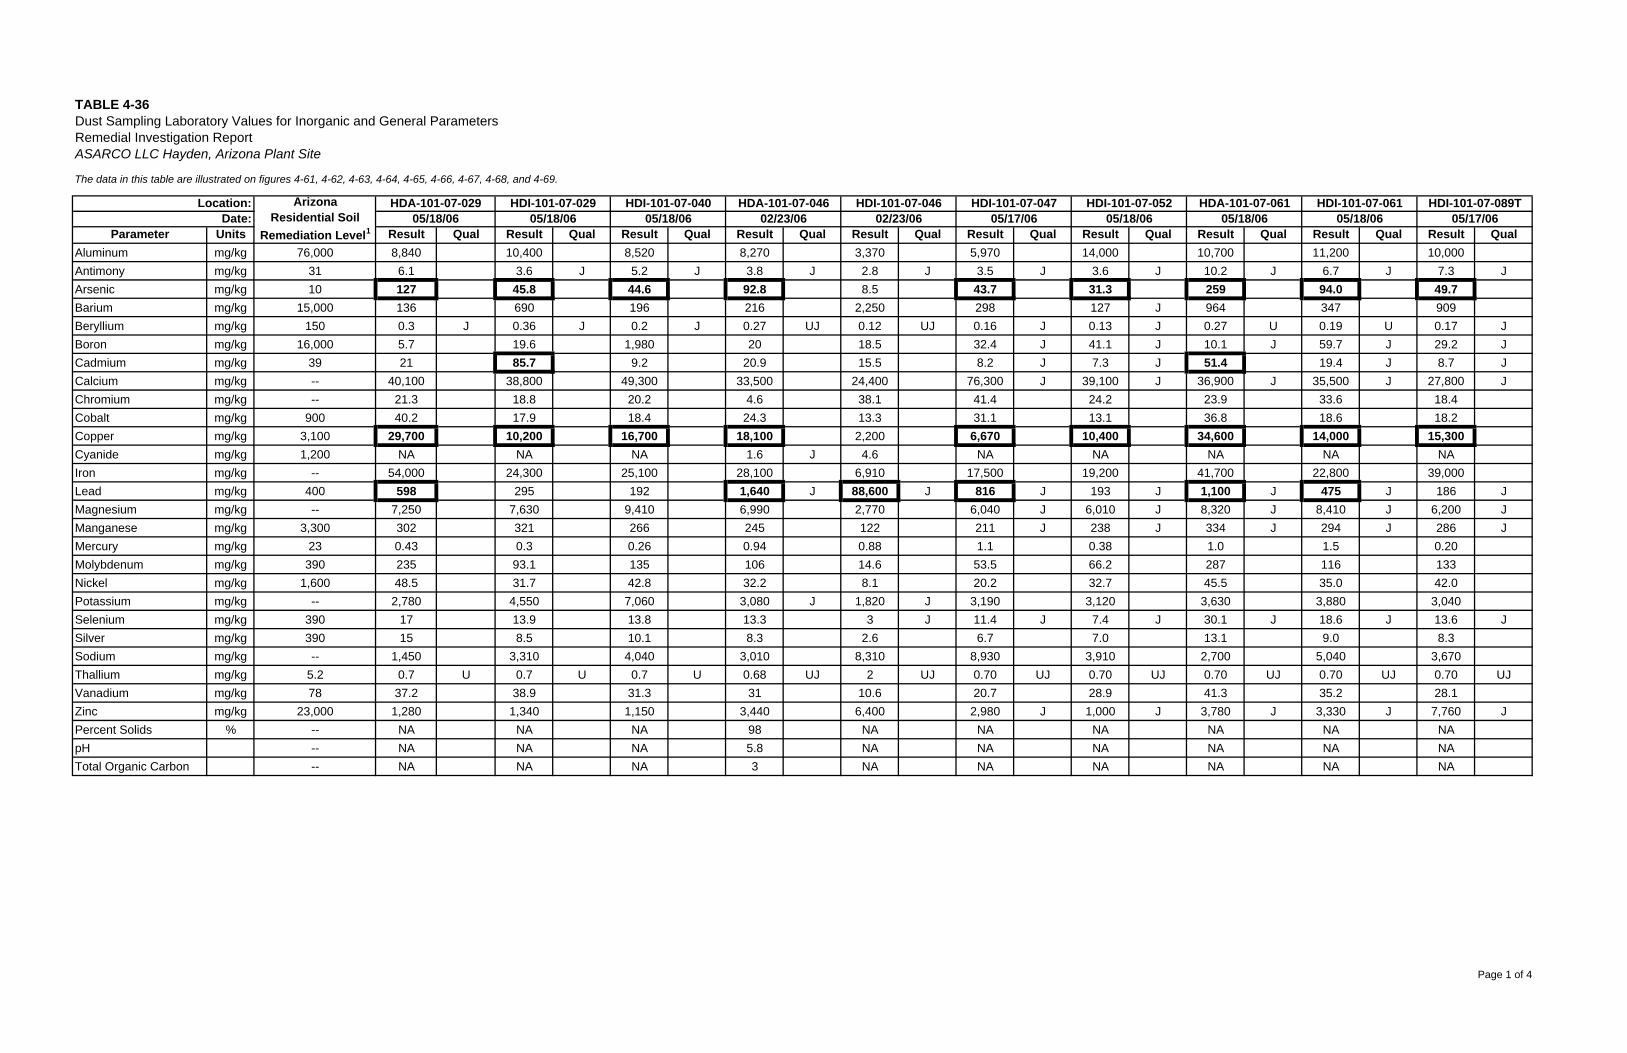
TABLE 4-36Dust Sampling Laboratory Values for Inorganic and General ParametersRemedial Investigation ReportASARCO LLC Hayden, Arizona Plant Site
The data in this table are illustrated on figures 4-61, 4-62, 4-63, 4-64, 4-65, 4-66, 4-67, 4-68, and 4-69.
Parameter Units Result Qual Result Qual Result Qual Result Qual Result Qual Result Qual Result Qual Result Qual Result Qual Result QualAluminum mg/kg 76,000 8,840 10,400 8,520 8,270 3,370 5,970 14,000 10,700 11,200 10,000Antimony mg/kg 31 6.1 3.6 J 5.2 J 3.8 J 2.8 J 3.5 J 3.6 J 10.2 J 6.7 J 7.3 JArsenic mg/kg 10 127 45.8 44.6 92.8 8.5 43.7 31.3 259 94.0 49.7Barium mg/kg 15,000 136 690 196 216 2,250 298 127 J 964 347 909Beryllium mg/kg 150 0.3 J 0.36 J 0.2 J 0.27 UJ 0.12 UJ 0.16 J 0.13 J 0.27 U 0.19 U 0.17 JBoron mg/kg 16,000 5.7 19.6 1,980 20 18.5 32.4 J 41.1 J 10.1 J 59.7 J 29.2 JCadmium mg/kg 39 21 85.7 9.2 20.9 15.5 8.2 J 7.3 J 51.4 19.4 J 8.7 JCalcium mg/kg -- 40,100 38,800 49,300 33,500 24,400 76,300 J 39,100 J 36,900 J 35,500 J 27,800 JChromium mg/kg -- 21.3 18.8 20.2 4.6 38.1 41.4 24.2 23.9 33.6 18.4Cobalt mg/kg 900 40.2 17.9 18.4 24.3 13.3 31.1 13.1 36.8 18.6 18.2Copper mg/kg 3,100 29,700 10,200 16,700 18,100 2,200 6,670 10,400 34,600 14,000 15,300Cyanide mg/kg 1,200 NA NA NA 1.6 J 4.6 NA NA NA NA NAIron mg/kg -- 54,000 24,300 25,100 28,100 6,910 17,500 19,200 41,700 22,800 39,000Lead mg/kg 400 598 295 192 1,640 J 88,600 J 816 J 193 J 1,100 J 475 J 186 JMagnesium mg/kg -- 7,250 7,630 9,410 6,990 2,770 6,040 J 6,010 J 8,320 J 8,410 J 6,200 JManganese mg/kg 3,300 302 321 266 245 122 211 J 238 J 334 J 294 J 286 JMercury mg/kg 23 0.43 0.3 0.26 0.94 0.88 1.1 0.38 1.0 1.5 0.20Molybdenum mg/kg 390 235 93.1 135 106 14.6 53.5 66.2 287 116 133Nickel mg/kg 1,600 48.5 31.7 42.8 32.2 8.1 20.2 32.7 45.5 35.0 42.0Potassium mg/kg -- 2,780 4,550 7,060 3,080 J 1,820 J 3,190 3,120 3,630 3,880 3,040Selenium mg/kg 390 17 13.9 13.8 13.3 3 J 11.4 J 7.4 J 30.1 J 18.6 J 13.6 JSilver mg/kg 390 15 8.5 10.1 8.3 2.6 6.7 7.0 13.1 9.0 8.3Sodium mg/kg -- 1,450 3,310 4,040 3,010 8,310 8,930 3,910 2,700 5,040 3,670Thallium mg/kg 5.2 0.7 U 0.7 U 0.7 U 0.68 UJ 2 UJ 0.70 UJ 0.70 UJ 0.70 UJ 0.70 UJ 0.70 UJVanadium mg/kg 78 37.2 38.9 31.3 31 10.6 20.7 28.9 41.3 35.2 28.1Zinc mg/kg 23,000 1,280 1,340 1,150 3,440 6,400 2,980 J 1,000 J 3,780 J 3,330 J 7,760 JPercent Solids % -- NA NA NA 98 NA NA NA NA NA NApH -- NA NA NA 5.8 NA NA NA NA NA NATotal Organic Carbon -- NA NA NA 3 NA NA NA NA NA NA
Date:Location: Arizona
Residential SoilRemediation Level1
HDA-101-07-04602/23/06
HDA-101-07-02905/18/06
HDI-101-07-02905/18/06
HDI-101-07-04002/23/06
HDI-101-07-04705/17/06
HDI-101-07-05205/18/06
HDI-101-07-046 HDI-101-07-089T05/17/0605/18/06
HDA-101-07-061 HDI-101-07-06105/18/06 05/18/06
Page 1 of 4
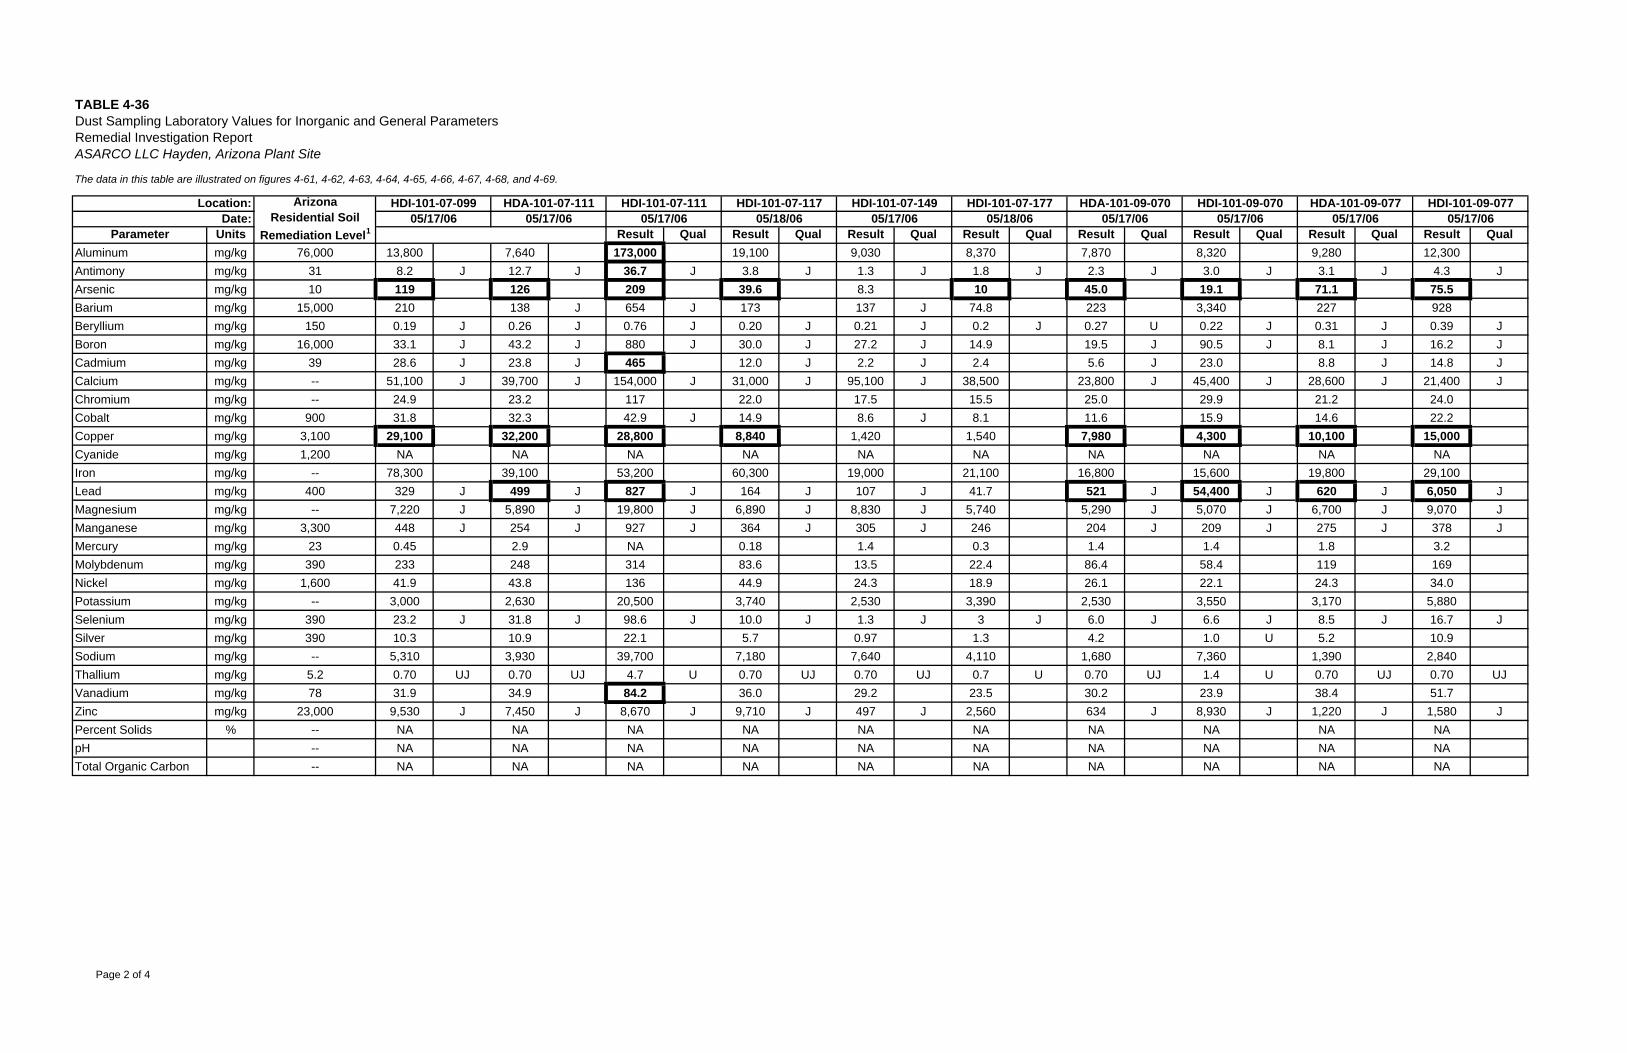
TABLE 4-36Dust Sampling Laboratory Values for Inorganic and General ParametersRemedial Investigation ReportASARCO LLC Hayden, Arizona Plant Site
The data in this table are illustrated on figures 4-61, 4-62, 4-63, 4-64, 4-65, 4-66, 4-67, 4-68, and 4-69.
Parameter Units Result Qual Result Qual Result Qual Result Qual Result Qual Result Qual Result Qual Result QualAluminum mg/kg 76,000 13,800 7,640 173,000 19,100 9,030 8,370 7,870 8,320 9,280 12,300Antimony mg/kg 31 8.2 J 12.7 J 36.7 J 3.8 J 1.3 J 1.8 J 2.3 J 3.0 J 3.1 J 4.3 JArsenic mg/kg 10 119 126 209 39.6 8.3 10 45.0 19.1 71.1 75.5Barium mg/kg 15,000 210 138 J 654 J 173 137 J 74.8 223 3,340 227 928Beryllium mg/kg 150 0.19 J 0.26 J 0.76 J 0.20 J 0.21 J 0.2 J 0.27 U 0.22 J 0.31 J 0.39 JBoron mg/kg 16,000 33.1 J 43.2 J 880 J 30.0 J 27.2 J 14.9 19.5 J 90.5 J 8.1 J 16.2 JCadmium mg/kg 39 28.6 J 23.8 J 465 12.0 J 2.2 J 2.4 5.6 J 23.0 8.8 J 14.8 JCalcium mg/kg -- 51,100 J 39,700 J 154,000 J 31,000 J 95,100 J 38,500 23,800 J 45,400 J 28,600 J 21,400 JChromium mg/kg -- 24.9 23.2 117 22.0 17.5 15.5 25.0 29.9 21.2 24.0Cobalt mg/kg 900 31.8 32.3 42.9 J 14.9 8.6 J 8.1 11.6 15.9 14.6 22.2Copper mg/kg 3,100 29,100 32,200 28,800 8,840 1,420 1,540 7,980 4,300 10,100 15,000Cyanide mg/kg 1,200 NA NA NA NA NA NA NA NA NA NAIron mg/kg -- 78,300 39,100 53,200 60,300 19,000 21,100 16,800 15,600 19,800 29,100Lead mg/kg 400 329 J 499 J 827 J 164 J 107 J 41.7 521 J 54,400 J 620 J 6,050 JMagnesium mg/kg -- 7,220 J 5,890 J 19,800 J 6,890 J 8,830 J 5,740 5,290 J 5,070 J 6,700 J 9,070 JManganese mg/kg 3,300 448 J 254 J 927 J 364 J 305 J 246 204 J 209 J 275 J 378 JMercury mg/kg 23 0.45 2.9 NA 0.18 1.4 0.3 1.4 1.4 1.8 3.2Molybdenum mg/kg 390 233 248 314 83.6 13.5 22.4 86.4 58.4 119 169Nickel mg/kg 1,600 41.9 43.8 136 44.9 24.3 18.9 26.1 22.1 24.3 34.0Potassium mg/kg -- 3,000 2,630 20,500 3,740 2,530 3,390 2,530 3,550 3,170 5,880Selenium mg/kg 390 23.2 J 31.8 J 98.6 J 10.0 J 1.3 J 3 J 6.0 J 6.6 J 8.5 J 16.7 JSilver mg/kg 390 10.3 10.9 22.1 5.7 0.97 1.3 4.2 1.0 U 5.2 10.9Sodium mg/kg -- 5,310 3,930 39,700 7,180 7,640 4,110 1,680 7,360 1,390 2,840Thallium mg/kg 5.2 0.70 UJ 0.70 UJ 4.7 U 0.70 UJ 0.70 UJ 0.7 U 0.70 UJ 1.4 U 0.70 UJ 0.70 UJVanadium mg/kg 78 31.9 34.9 84.2 36.0 29.2 23.5 30.2 23.9 38.4 51.7Zinc mg/kg 23,000 9,530 J 7,450 J 8,670 J 9,710 J 497 J 2,560 634 J 8,930 J 1,220 J 1,580 JPercent Solids % -- NA NA NA NA NA NA NA NA NA NApH -- NA NA NA NA NA NA NA NA NA NATotal Organic Carbon -- NA NA NA NA NA NA NA NA NA NA
Location: ArizonaResidential Soil
Remediation Level1Date:
HDI-101-07-14905/17/06
HDI-101-07-17705/18/06
HDA-101-09-07005/17/06
HDI-101-07-11705/18/06
HDI-101-07-11105/17/06 05/17/06
HDI-101-07-099 HDA-101-07-11105/17/06
HDI-101-09-07005/17/06
HDA-101-09-07705/17/06
HDI-101-09-07705/17/06
Page 2 of 4
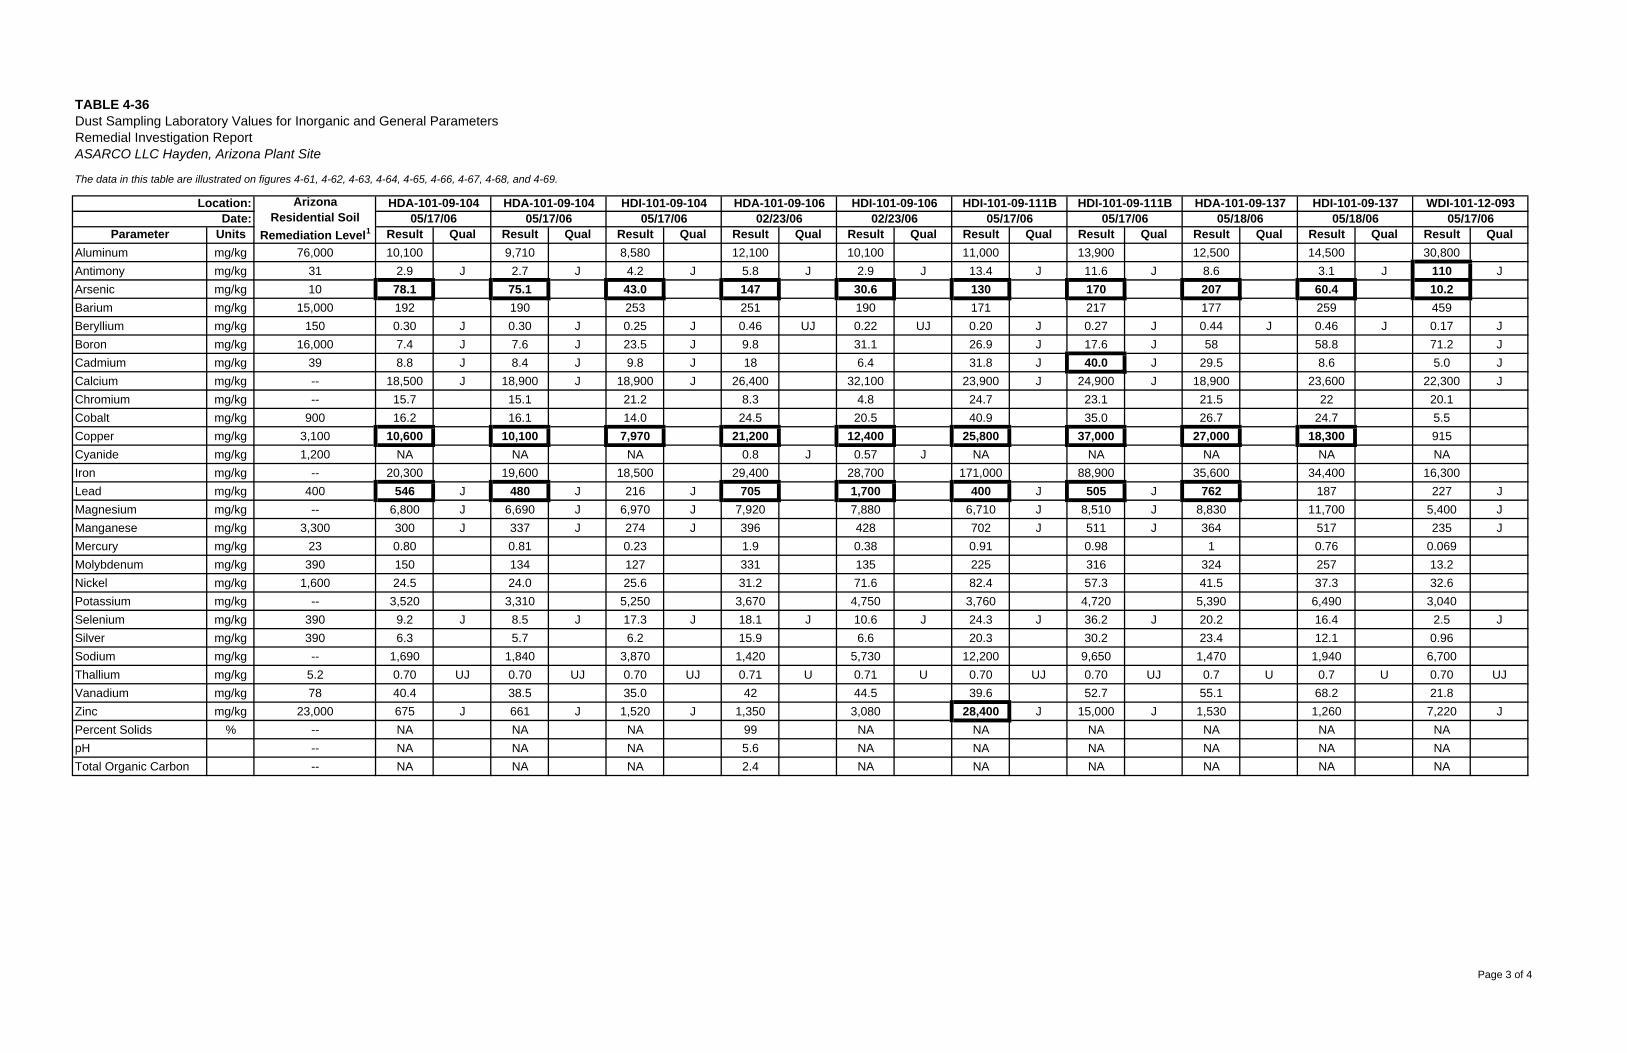
TABLE 4-36Dust Sampling Laboratory Values for Inorganic and General ParametersRemedial Investigation ReportASARCO LLC Hayden, Arizona Plant Site
The data in this table are illustrated on figures 4-61, 4-62, 4-63, 4-64, 4-65, 4-66, 4-67, 4-68, and 4-69.
Parameter Units Result Qual Result Qual Result Qual Result Qual Result Qual Result Qual Result Qual Result Qual Result Qual Result QualAluminum mg/kg 76,000 10,100 9,710 8,580 12,100 10,100 11,000 13,900 12,500 14,500 30,800Antimony mg/kg 31 2.9 J 2.7 J 4.2 J 5.8 J 2.9 J 13.4 J 11.6 J 8.6 3.1 J 110 JArsenic mg/kg 10 78.1 75.1 43.0 147 30.6 130 170 207 60.4 10.2Barium mg/kg 15,000 192 190 253 251 190 171 217 177 259 459Beryllium mg/kg 150 0.30 J 0.30 J 0.25 J 0.46 UJ 0.22 UJ 0.20 J 0.27 J 0.44 J 0.46 J 0.17 JBoron mg/kg 16,000 7.4 J 7.6 J 23.5 J 9.8 31.1 26.9 J 17.6 J 58 58.8 71.2 JCadmium mg/kg 39 8.8 J 8.4 J 9.8 J 18 6.4 31.8 J 40.0 J 29.5 8.6 5.0 JCalcium mg/kg -- 18,500 J 18,900 J 18,900 J 26,400 32,100 23,900 J 24,900 J 18,900 23,600 22,300 JChromium mg/kg -- 15.7 15.1 21.2 8.3 4.8 24.7 23.1 21.5 22 20.1Cobalt mg/kg 900 16.2 16.1 14.0 24.5 20.5 40.9 35.0 26.7 24.7 5.5Copper mg/kg 3,100 10,600 10,100 7,970 21,200 12,400 25,800 37,000 27,000 18,300 915Cyanide mg/kg 1,200 NA NA NA 0.8 J 0.57 J NA NA NA NA NAIron mg/kg -- 20,300 19,600 18,500 29,400 28,700 171,000 88,900 35,600 34,400 16,300Lead mg/kg 400 546 J 480 J 216 J 705 1,700 400 J 505 J 762 187 227 JMagnesium mg/kg -- 6,800 J 6,690 J 6,970 J 7,920 7,880 6,710 J 8,510 J 8,830 11,700 5,400 JManganese mg/kg 3,300 300 J 337 J 274 J 396 428 702 J 511 J 364 517 235 JMercury mg/kg 23 0.80 0.81 0.23 1.9 0.38 0.91 0.98 1 0.76 0.069Molybdenum mg/kg 390 150 134 127 331 135 225 316 324 257 13.2Nickel mg/kg 1,600 24.5 24.0 25.6 31.2 71.6 82.4 57.3 41.5 37.3 32.6Potassium mg/kg -- 3,520 3,310 5,250 3,670 4,750 3,760 4,720 5,390 6,490 3,040Selenium mg/kg 390 9.2 J 8.5 J 17.3 J 18.1 J 10.6 J 24.3 J 36.2 J 20.2 16.4 2.5 JSilver mg/kg 390 6.3 5.7 6.2 15.9 6.6 20.3 30.2 23.4 12.1 0.96Sodium mg/kg -- 1,690 1,840 3,870 1,420 5,730 12,200 9,650 1,470 1,940 6,700Thallium mg/kg 5.2 0.70 UJ 0.70 UJ 0.70 UJ 0.71 U 0.71 U 0.70 UJ 0.70 UJ 0.7 U 0.7 U 0.70 UJVanadium mg/kg 78 40.4 38.5 35.0 42 44.5 39.6 52.7 55.1 68.2 21.8Zinc mg/kg 23,000 675 J 661 J 1,520 J 1,350 3,080 28,400 J 15,000 J 1,530 1,260 7,220 JPercent Solids % -- NA NA NA 99 NA NA NA NA NA NApH -- NA NA NA 5.6 NA NA NA NA NA NATotal Organic Carbon -- NA NA NA 2.4 NA NA NA NA NA NA
Location:Date:
HDA-101-09-10405/17/06
ArizonaResidential Soil
Remediation Level1
HDA-101-09-10405/17/06
HDI-101-09-10405/17/06
HDA-101-09-10602/23/06 02/23/06 05/17/06
HDI-101-09-106 HDI-101-09-111B HDI-101-09-111B05/17/06
HDA-101-09-13705/18/06
HDI-101-09-137 WDI-101-12-09305/18/06 05/17/06
Page 3 of 4
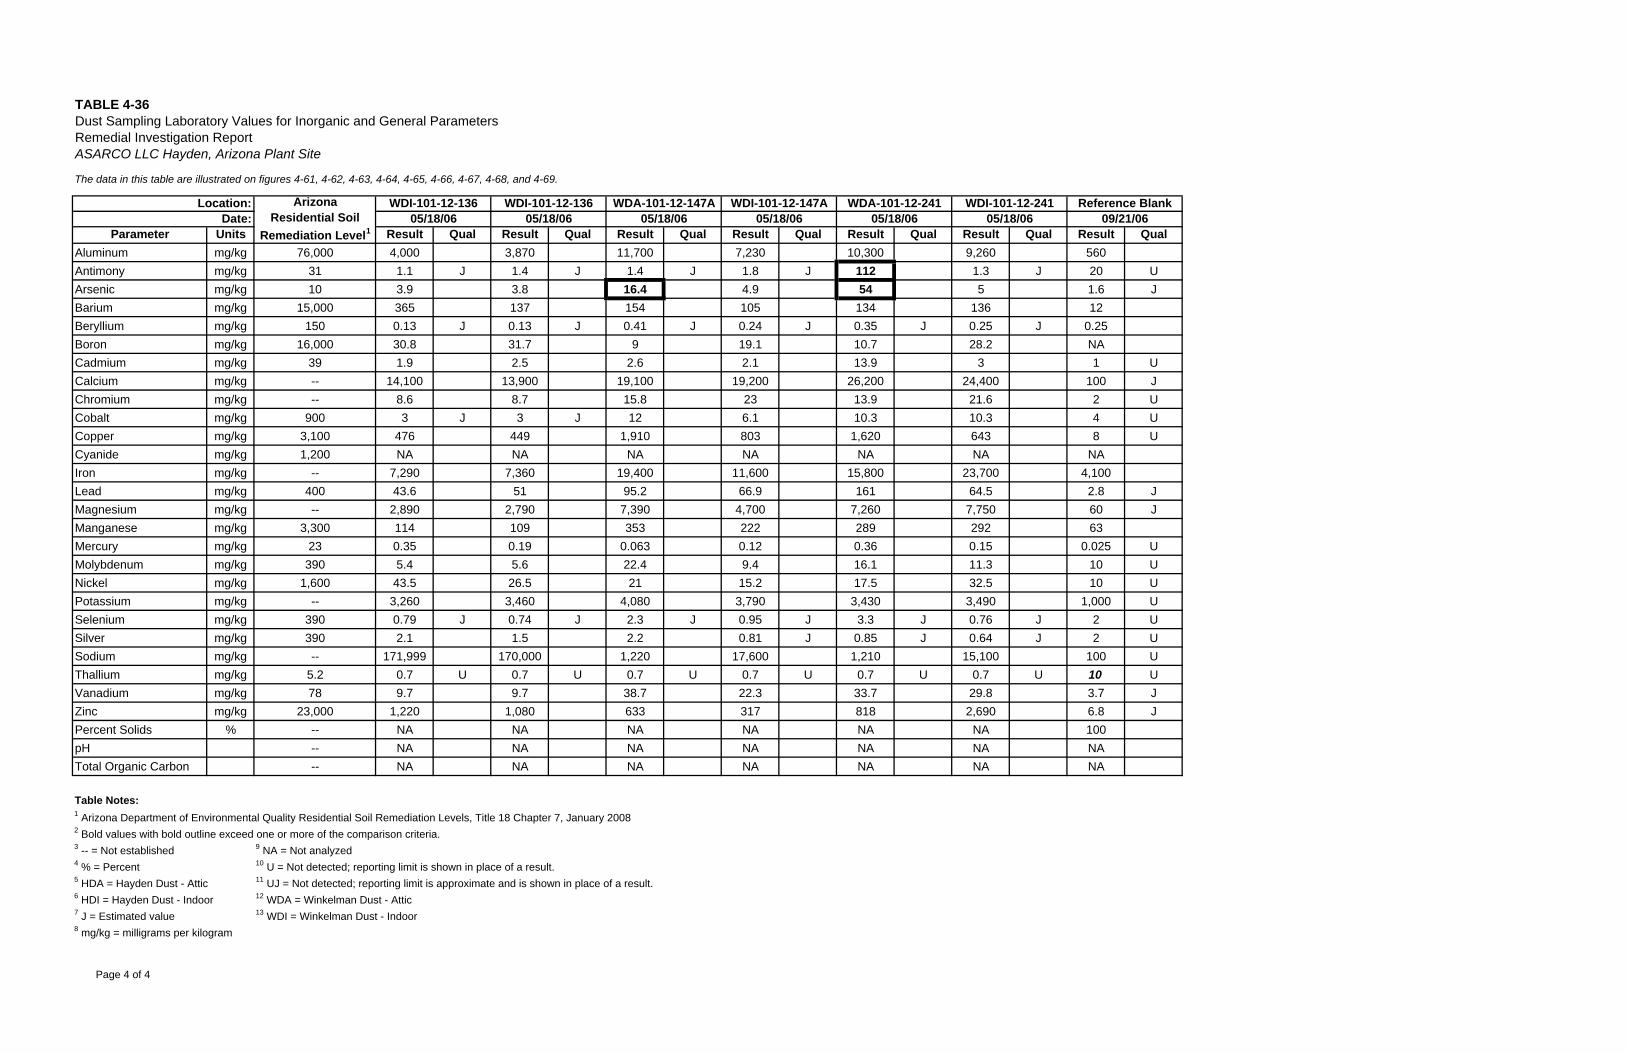
TABLE 4-36Dust Sampling Laboratory Values for Inorganic and General ParametersRemedial Investigation ReportASARCO LLC Hayden, Arizona Plant Site
The data in this table are illustrated on figures 4-61, 4-62, 4-63, 4-64, 4-65, 4-66, 4-67, 4-68, and 4-69.
Parameter Units Result Qual Result Qual Result Qual Result Qual Result Qual Result Qual Result QualAluminum mg/kg 76,000 4,000 3,870 11,700 7,230 10,300 9,260 560Antimony mg/kg 31 1.1 J 1.4 J 1.4 J 1.8 J 112 1.3 J 20 UArsenic mg/kg 10 3.9 3.8 16.4 4.9 54 5 1.6 JBarium mg/kg 15,000 365 137 154 105 134 136 12Beryllium mg/kg 150 0.13 J 0.13 J 0.41 J 0.24 J 0.35 J 0.25 J 0.25Boron mg/kg 16,000 30.8 31.7 9 19.1 10.7 28.2 NACadmium mg/kg 39 1.9 2.5 2.6 2.1 13.9 3 1 UCalcium mg/kg -- 14,100 13,900 19,100 19,200 26,200 24,400 100 JChromium mg/kg -- 8.6 8.7 15.8 23 13.9 21.6 2 UCobalt mg/kg 900 3 J 3 J 12 6.1 10.3 10.3 4 UCopper mg/kg 3,100 476 449 1,910 803 1,620 643 8 UCyanide mg/kg 1,200 NA NA NA NA NA NA NAIron mg/kg -- 7,290 7,360 19,400 11,600 15,800 23,700 4,100Lead mg/kg 400 43.6 51 95.2 66.9 161 64.5 2.8 JMagnesium mg/kg -- 2,890 2,790 7,390 4,700 7,260 7,750 60 JManganese mg/kg 3,300 114 109 353 222 289 292 63Mercury mg/kg 23 0.35 0.19 0.063 0.12 0.36 0.15 0.025 UMolybdenum mg/kg 390 5.4 5.6 22.4 9.4 16.1 11.3 10 UNickel mg/kg 1,600 43.5 26.5 21 15.2 17.5 32.5 10 UPotassium mg/kg -- 3,260 3,460 4,080 3,790 3,430 3,490 1,000 USelenium mg/kg 390 0.79 J 0.74 J 2.3 J 0.95 J 3.3 J 0.76 J 2 USilver mg/kg 390 2.1 1.5 2.2 0.81 J 0.85 J 0.64 J 2 USodium mg/kg -- 171,999 170,000 1,220 17,600 1,210 15,100 100 UThallium mg/kg 5.2 0.7 U 0.7 U 0.7 U 0.7 U 0.7 U 0.7 U 10 UVanadium mg/kg 78 9.7 9.7 38.7 22.3 33.7 29.8 3.7 JZinc mg/kg 23,000 1,220 1,080 633 317 818 2,690 6.8 JPercent Solids % -- NA NA NA NA NA NA 100pH -- NA NA NA NA NA NA NATotal Organic Carbon -- NA NA NA NA NA NA NA
Table Notes:1 Arizona Department of Environmental Quality Residential Soil Remediation Levels, Title 18 Chapter 7, January 20082 Bold values with bold outline exceed one or more of the comparison criteria.3 -- = Not established 9 NA = Not analyzed4 % = Percent 10 U = Not detected; reporting limit is shown in place of a result.5 HDA = Hayden Dust - Attic 11 UJ = Not detected; reporting limit is approximate and is shown in place of a result.6 HDI = Hayden Dust - Indoor 12 WDA = Winkelman Dust - Attic7 J = Estimated value 13 WDI = Winkelman Dust - Indoor8 mg/kg = milligrams per kilogram
WDI-101-12-13605/18/06
WDI-101-12-13605/18/06 09/21/0605/18/06
Reference BlankWDI-101-12-241WDA-101-12-24105/18/06
WDI-101-12-147A05/18/06
WDA-101-12-147A05/18/06
Location: ArizonaResidential Soil
Remediation Level1Date:
Page 4 of 4

TABLE 4-37Comparison of Indoor Dust, Attic Dust, Surface Soil Statistics and Entry Way Soil Sample Arsenic ResultsRemedial Investigation ReportASARCO LLC Hayden, Arizona Plant Site
The data in this table are illustrated on figures 4-61, 4-62, 4-63, and 4-67.
Surface SoilStatistics
Result Qual Result Qual 95% UCL SubArea Result Qual SubArea Result Qual SubArea Result Qual
101-07-029 mg/kg 127 45.8 51.9 B 46.1 J- NA NA E 40 J-101-07-040 mg/kg NA 44.6 54.5 H 22 J- NA NA C 29.8 J-101-07-046 mg/kg 92.8 8.5 20.3 I 10.6 J- NA NA NA NA101-07-047 mg/kg NA 43.7 42.3 A 41.1 J- NA NA I 42.1101-07-052 mg/kg NA 31.3 36.6 C 13.8 J- NA NA NA NA101-07-061 mg/kg 259 94 27.6 C 14.4 J- NA NA NA NA101-07-089T mg/kg NA 49.7 540 E 32.4 NA NA NA NA101-07-099 mg/kg NA 119 58 G 91.9 J- NA NA NA NA101-07-111 mg/kg 126 209 15.3 C 7.6 J- NA NA NA NA101-07-117 mg/kg NA 39.6 36 E 16.9 J- NA NA B 41.2 J-101-07-149 mg/kg NA 8.3 20.8 D 18.2 J- B 33.6 J- NA NA101-07-177 mg/kg NA 10 NA NA NA NA NA NA NA101-09-070 mg/kg 45 19.1 25.9 C 19.1 NA NA H 20.1 J-101-09-077 mg/kg 71.1 75.5 45.7 E 38.4 J- NA NA NA NA101-09-104 mg/kg 78.1 43 42.9 G 23.6 J- NA NA E 53.4 J-101-09-106 mg/kg 147 30.6 52.4 G 37.3 J- NA NA NA NA101-09-111B mg/kg NA 170 60.5 E 34 J- NA NA F 79.9 J-101-09-137 mg/kg 207 60.4 30.8 NA NA NA NA NA NA
101-12-093 mg/kg NA 10.2 7.43 G 7.4 J- NA NA NA NA101-12-136 mg/kg NA 3.9 4.97 G 4.5 J- NA NA NA NA101-12-147A mg/kg 16.4 4.9 6.08 B 3.3 J- NA NA NA NA101-12-241 mg/kg 54 5 4.83 C 2.9 I 6.3 J- NA NA
Table Notes:1 The maximum concentration between field duplicates and primary samples was used.2 J- = Estimated value, may be biased low3 mg/kg = milligrams per kilogram4 NA = Not analyzed5 = 1 to 10 mg/kg6 = 10.1 to 25.9 mg/kg7 = 26 to 47.9 mg/kg8 = Greater than 48 mg/kg
AtticFront Entry Way
Soil SampleAdditional Front Entry
Way Soil SampleAdditional Side/Back
Entry Way Sample
Hayden
Winkelman
Parcel UnitsIndoor
Page 1 of 1
-- --- -- -- -
-
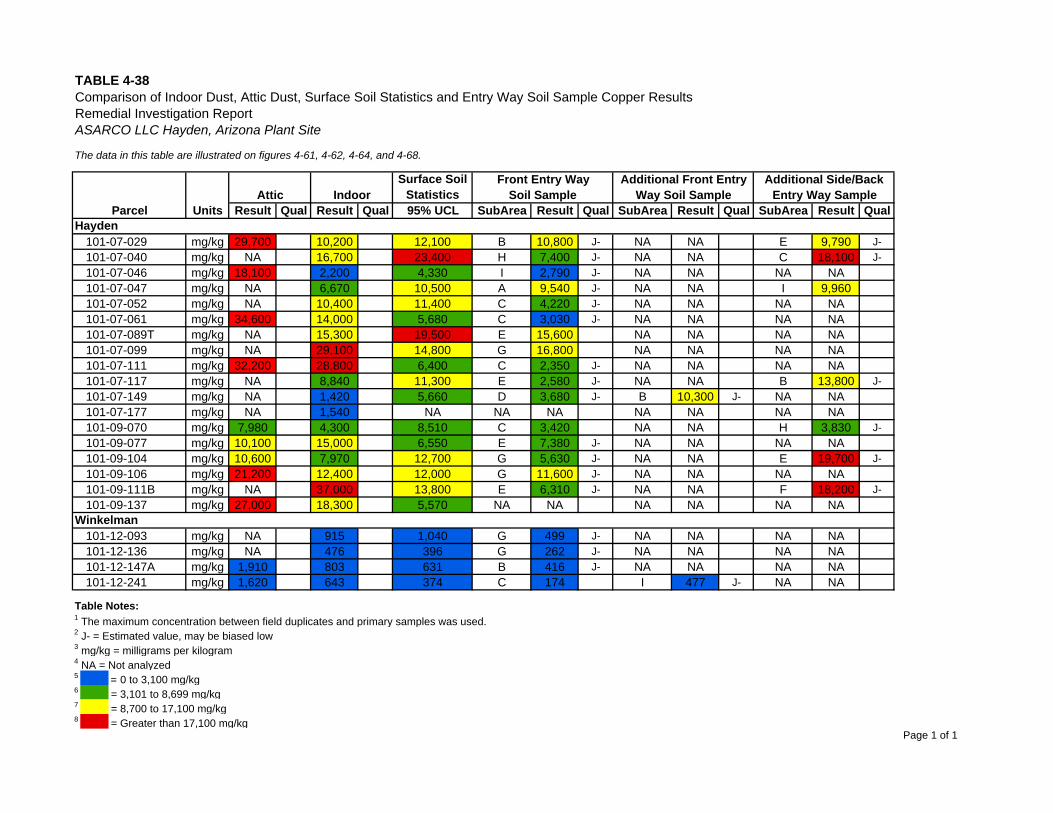
TABLE 4-38Comparison of Indoor Dust, Attic Dust, Surface Soil Statistics and Entry Way Soil Sample Copper ResultsRemedial Investigation ReportASARCO LLC Hayden, Arizona Plant Site
The data in this table are illustrated on figures 4-61, 4-62, 4-64, and 4-68.
Surface SoilStatistics
Result Qual Result Qual 95% UCL SubArea Result Qual SubArea Result Qual SubArea Result Qual
101-07-029 mg/kg 29,700 10,200 12,100 B 10,800 J- NA NA E 9,790 J-101-07-040 mg/kg NA 16,700 23,400 H 7,400 J- NA NA C 18,100 J-101-07-046 mg/kg 18,100 2,200 4,330 I 2,790 J- NA NA NA NA101-07-047 mg/kg NA 6,670 10,500 A 9,540 J- NA NA I 9,960101-07-052 mg/kg NA 10,400 11,400 C 4,220 J- NA NA NA NA101-07-061 mg/kg 34,600 14,000 5,680 C 3,030 J- NA NA NA NA101-07-089T mg/kg NA 15,300 19,500 E 15,600 NA NA NA NA101-07-099 mg/kg NA 29,100 14,800 G 16,800 NA NA NA NA101-07-111 mg/kg 32,200 28,800 6,400 C 2,350 J- NA NA NA NA101-07-117 mg/kg NA 8,840 11,300 E 2,580 J- NA NA B 13,800 J-101-07-149 mg/kg NA 1,420 5,660 D 3,680 J- B 10,300 J- NA NA101-07-177 mg/kg NA 1,540 NA NA NA NA NA NA NA101-09-070 mg/kg 7,980 4,300 8,510 C 3,420 NA NA H 3,830 J-101-09-077 mg/kg 10,100 15,000 6,550 E 7,380 J- NA NA NA NA101-09-104 mg/kg 10,600 7,970 12,700 G 5,630 J- NA NA E 19,700 J-101-09-106 mg/kg 21,200 12,400 12,000 G 11,600 J- NA NA NA NA101-09-111B mg/kg NA 37,000 13,800 E 6,310 J- NA NA F 18,200 J-101-09-137 mg/kg 27,000 18,300 5,570 NA NA NA NA NA NA
101-12-093 mg/kg NA 915 1,040 G 499 J- NA NA NA NA101-12-136 mg/kg NA 476 396 G 262 J- NA NA NA NA101-12-147A mg/kg 1,910 803 631 B 416 J- NA NA NA NA101-12-241 mg/kg 1,620 643 374 C 174 I 477 J- NA NA
Table Notes:1 The maximum concentration between field duplicates and primary samples was used.2 J- = Estimated value, may be biased low3 mg/kg = milligrams per kilogram4 NA = Not analyzed5 = 0 to 3,100 mg/kg6 = 3,101 to 8,699 mg/kg7 = 8,700 to 17,100 mg/kg8 = Greater than 17,100 mg/kg
AtticFront Entry Way
Soil SampleAdditional Front Entry
Way Soil SampleAdditional Side/Back
Entry Way Sample
Hayden
Winkelman
Parcel UnitsIndoor
Page 1 of 1
-- --- -- -- -
-
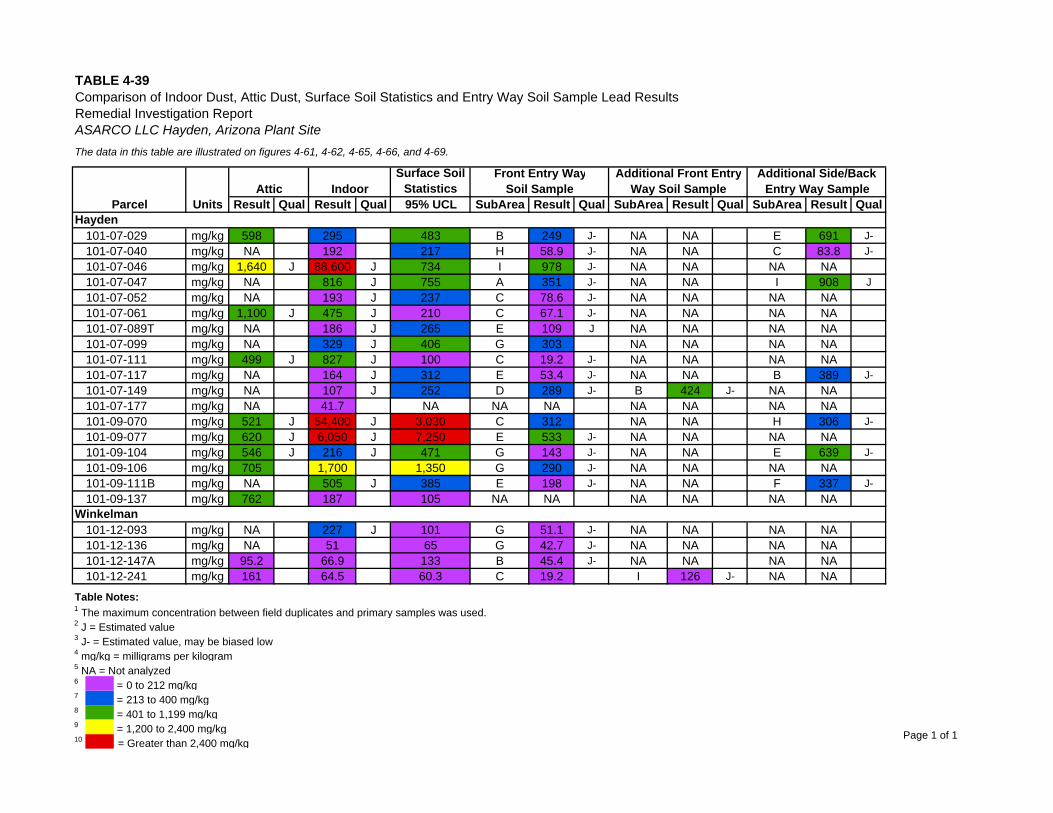
TABLE 4-39Comparison of Indoor Dust, Attic Dust, Surface Soil Statistics and Entry Way Soil Sample Lead ResultsRemedial Investigation ReportASARCO LLC Hayden, Arizona Plant SiteThe data in this table are illustrated on figures 4-61, 4-62, 4-65, 4-66, and 4-69.
Surface SoilStatistics
Result Qual Result Qual 95% UCL SubArea Result Qual SubArea Result Qual SubArea Result Qual
101-07-029 mg/kg 598 295 483 B 249 J- NA NA E 691 J-101-07-040 mg/kg NA 192 217 H 58.9 J- NA NA C 83.8 J-101-07-046 mg/kg 1,640 J 88,600 J 734 I 978 J- NA NA NA NA101-07-047 mg/kg NA 816 J 755 A 351 J- NA NA I 908 J101-07-052 mg/kg NA 193 J 237 C 78.6 J- NA NA NA NA101-07-061 mg/kg 1,100 J 475 J 210 C 67.1 J- NA NA NA NA101-07-089T mg/kg NA 186 J 265 E 109 J NA NA NA NA101-07-099 mg/kg NA 329 J 406 G 303 NA NA NA NA101-07-111 mg/kg 499 J 827 J 100 C 19.2 J- NA NA NA NA101-07-117 mg/kg NA 164 J 312 E 53.4 J- NA NA B 389 J-101-07-149 mg/kg NA 107 J 252 D 289 J- B 424 J- NA NA101-07-177 mg/kg NA 41.7 NA NA NA NA NA NA NA101-09-070 mg/kg 521 J 54,400 J 3,030 C 312 NA NA H 306 J-101-09-077 mg/kg 620 J 6,050 J 7,250 E 533 J- NA NA NA NA101-09-104 mg/kg 546 J 216 J 471 G 143 J- NA NA E 639 J-101-09-106 mg/kg 705 1,700 1,350 G 290 J- NA NA NA NA101-09-111B mg/kg NA 505 J 385 E 198 J- NA NA F 337 J-101-09-137 mg/kg 762 187 105 NA NA NA NA NA NA
101-12-093 mg/kg NA 227 J 101 G 51.1 J- NA NA NA NA101-12-136 mg/kg NA 51 65 G 42.7 J- NA NA NA NA101-12-147A mg/kg 95.2 66.9 133 B 45.4 J- NA NA NA NA101-12-241 mg/kg 161 64.5 60.3 C 19.2 I 126 J- NA NA
Table Notes:1 The maximum concentration between field duplicates and primary samples was used.2 J = Estimated value3 J- = Estimated value, may be biased low4 mg/kg = milligrams per kilogram5 NA = Not analyzed6 = 0 to 212 mg/kg7 = 213 to 400 mg/kg8 = 401 to 1,199 mg/kg9 = 1,200 to 2,400 mg/kg10 = Greater than 2,400 mg/kg
Hayden
Winkelman
AtticParcel Units
IndoorFront Entry Way
Soil SampleAdditional Front Entry
Way Soil SampleAdditional Side/Back
Entry Way Sample
Page 1 of 1
-- --- -- -- -
-
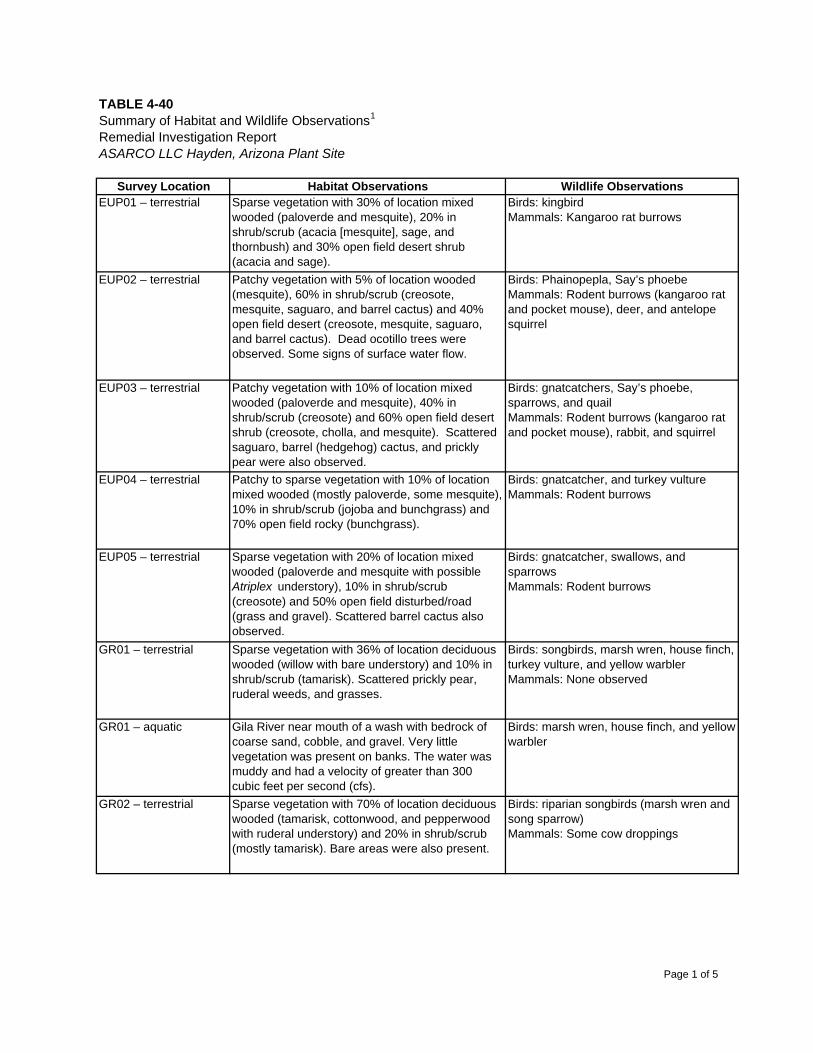
TABLE 4-40
Survey Location Habitat Observations Wildlife ObservationsEUP01 – terrestrial Sparse vegetation with 30% of location mixed
wooded (paloverde and mesquite), 20% in shrub/scrub (acacia [mesquite], sage, and thornbush) and 30% open field desert shrub (acacia and sage).
Birds: kingbirdMammals: Kangaroo rat burrows
EUP02 – terrestrial Patchy vegetation with 5% of location wooded (mesquite), 60% in shrub/scrub (creosote, mesquite, saguaro, and barrel cactus) and 40% open field desert (creosote, mesquite, saguaro, and barrel cactus). Dead ocotillo trees were observed. Some signs of surface water flow.
Birds: Phainopepla, Say’s phoebeMammals: Rodent burrows (kangaroo rat and pocket mouse), deer, and antelope squirrel
EUP03 – terrestrial Patchy vegetation with 10% of location mixed wooded (paloverde and mesquite), 40% in shrub/scrub (creosote) and 60% open field desert shrub (creosote, cholla, and mesquite). Scattered saguaro, barrel (hedgehog) cactus, and prickly pear were also observed.
Birds: gnatcatchers, Say’s phoebe, sparrows, and quailMammals: Rodent burrows (kangaroo rat and pocket mouse), rabbit, and squirrel
EUP04 – terrestrial Patchy to sparse vegetation with 10% of location mixed wooded (mostly paloverde, some mesquite), 10% in shrub/scrub (jojoba and bunchgrass) and 70% open field rocky (bunchgrass).
Birds: gnatcatcher, and turkey vultureMammals: Rodent burrows
EUP05 – terrestrial Sparse vegetation with 20% of location mixed wooded (paloverde and mesquite with possible Atriplex understory), 10% in shrub/scrub (creosote) and 50% open field disturbed/road (grass and gravel). Scattered barrel cactus also observed.
Birds: gnatcatcher, swallows, and sparrowsMammals: Rodent burrows
GR01 – terrestrial Sparse vegetation with 36% of location deciduous wooded (willow with bare understory) and 10% in shrub/scrub (tamarisk). Scattered prickly pear, ruderal weeds, and grasses.
Birds: songbirds, marsh wren, house finch, turkey vulture, and yellow warblerMammals: None observed
GR01 – aquatic Gila River near mouth of a wash with bedrock of coarse sand, cobble, and gravel. Very little vegetation was present on banks. The water was muddy and had a velocity of greater than 300 cubic feet per second (cfs).
Birds: marsh wren, house finch, and yellow warbler
GR02 – terrestrial Sparse vegetation with 70% of location deciduous wooded (tamarisk, cottonwood, and pepperwood with ruderal understory) and 20% in shrub/scrub (mostly tamarisk). Bare areas were also present.
Birds: riparian songbirds (marsh wren and song sparrow)Mammals: Some cow droppings
Summary of Habitat and Wildlife Observations1
ASARCO LLC Hayden, Arizona Plant SiteRemedial Investigation Report
Page 1 of 5
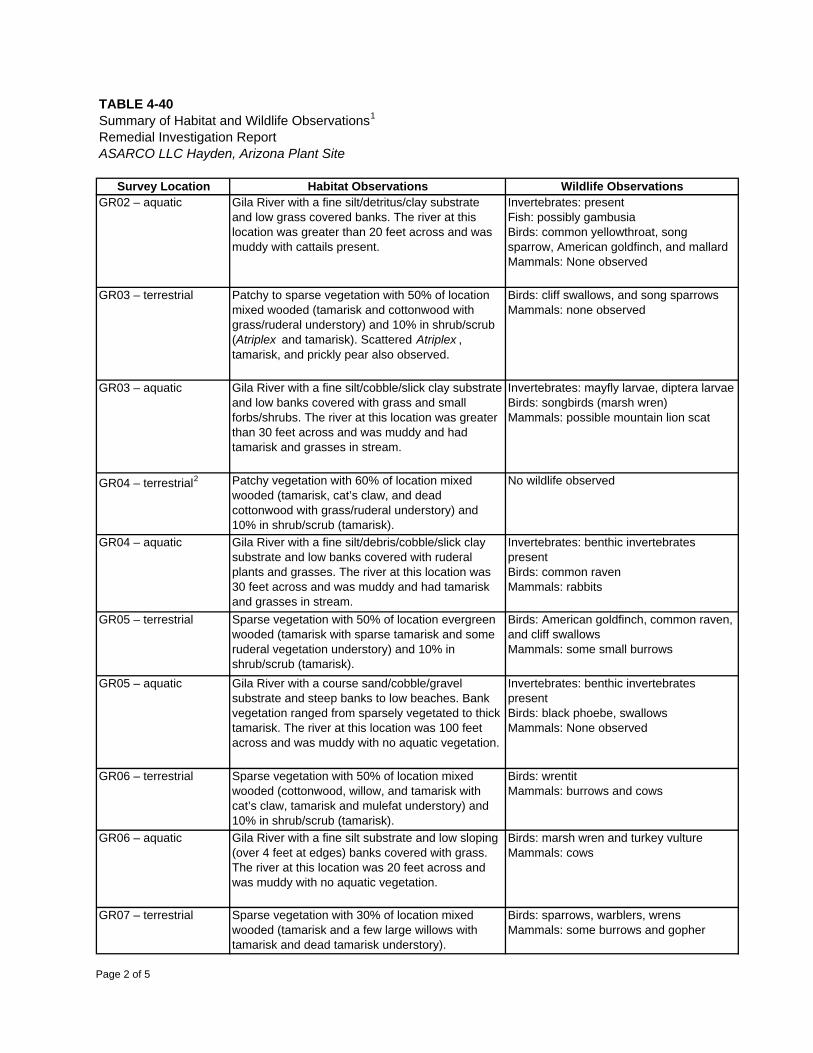
TABLE 4-40
Survey Location Habitat Observations Wildlife Observations
Summary of Habitat and Wildlife Observations1
ASARCO LLC Hayden, Arizona Plant SiteRemedial Investigation Report
GR02 – aquatic Gila River with a fine silt/detritus/clay substrate and low grass covered banks. The river at this location was greater than 20 feet across and was muddy with cattails present.
Invertebrates: presentFish: possibly gambusiaBirds: common yellowthroat, song sparrow, American goldfinch, and mallardMammals: None observed
GR03 – terrestrial Patchy to sparse vegetation with 50% of location mixed wooded (tamarisk and cottonwood with grass/ruderal understory) and 10% in shrub/scrub (Atriplex and tamarisk). Scattered Atriplex , tamarisk, and prickly pear also observed.
Birds: cliff swallows, and song sparrowsMammals: none observed
GR03 – aquatic Gila River with a fine silt/cobble/slick clay substrate and low banks covered with grass and small forbs/shrubs. The river at this location was greater than 30 feet across and was muddy and had tamarisk and grasses in stream.
Invertebrates: mayfly larvae, diptera larvaeBirds: songbirds (marsh wren)Mammals: possible mountain lion scat
GR04 – terrestrial2 Patchy vegetation with 60% of location mixed wooded (tamarisk, cat’s claw, and dead cottonwood with grass/ruderal understory) and 10% in shrub/scrub (tamarisk).
No wildlife observed
GR04 – aquatic Gila River with a fine silt/debris/cobble/slick clay substrate and low banks covered with ruderal plants and grasses. The river at this location was 30 feet across and was muddy and had tamarisk and grasses in stream.
Invertebrates: benthic invertebrates presentBirds: common ravenMammals: rabbits
GR05 – terrestrial Sparse vegetation with 50% of location evergreen wooded (tamarisk with sparse tamarisk and some ruderal vegetation understory) and 10% in shrub/scrub (tamarisk).
Birds: American goldfinch, common raven, and cliff swallowsMammals: some small burrows
GR05 – aquatic Gila River with a course sand/cobble/gravel substrate and steep banks to low beaches. Bank vegetation ranged from sparsely vegetated to thick tamarisk. The river at this location was 100 feet across and was muddy with no aquatic vegetation.
Invertebrates: benthic invertebrates presentBirds: black phoebe, swallowsMammals: None observed
GR06 – terrestrial Sparse vegetation with 50% of location mixed wooded (cottonwood, willow, and tamarisk with cat’s claw, tamarisk and mulefat understory) and 10% in shrub/scrub (tamarisk).
Birds: wrentitMammals: burrows and cows
GR06 – aquatic Gila River with a fine silt substrate and low sloping (over 4 feet at edges) banks covered with grass. The river at this location was 20 feet across and was muddy with no aquatic vegetation.
Birds: marsh wren and turkey vultureMammals: cows
GR07 – terrestrial Sparse vegetation with 30% of location mixed wooded (tamarisk and a few large willows with tamarisk and dead tamarisk understory).
Birds: sparrows, warblers, wrensMammals: some burrows and gopher
Page 2 of 5
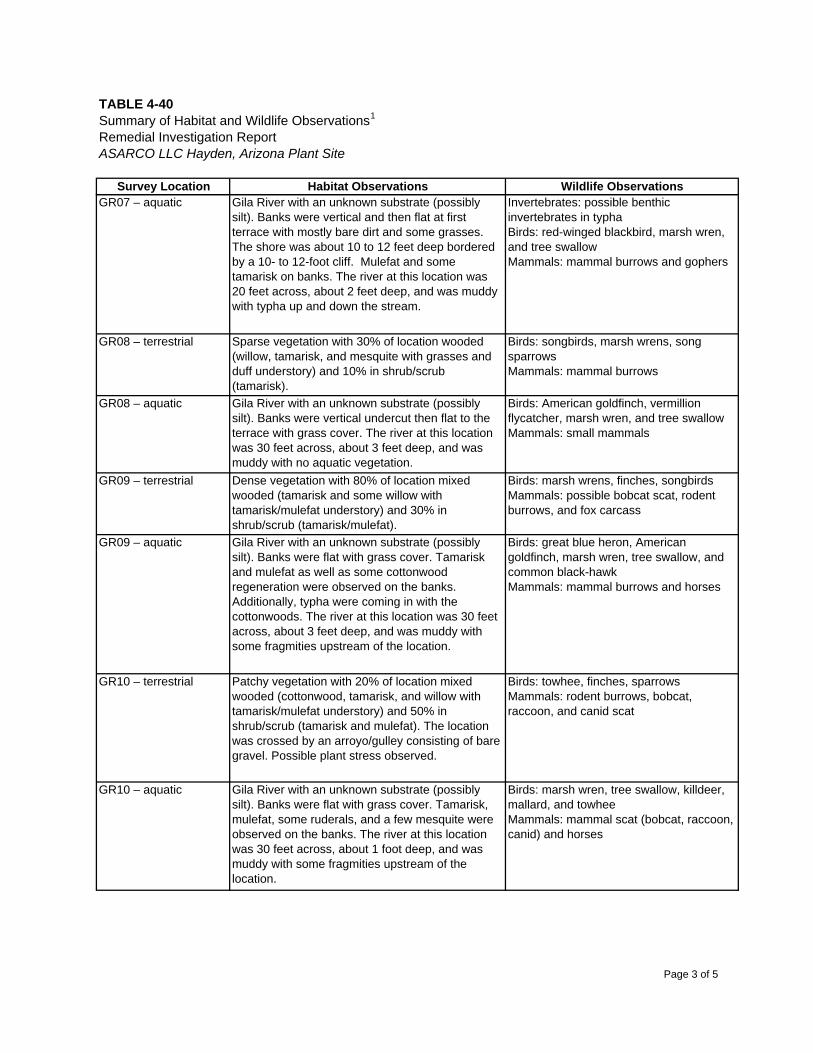
TABLE 4-40
Survey Location Habitat Observations Wildlife Observations
Summary of Habitat and Wildlife Observations1
ASARCO LLC Hayden, Arizona Plant SiteRemedial Investigation Report
GR07 – aquatic Gila River with an unknown substrate (possibly silt). Banks were vertical and then flat at first terrace with mostly bare dirt and some grasses. The shore was about 10 to 12 feet deep bordered by a 10- to 12-foot cliff. Mulefat and some tamarisk on banks. The river at this location was 20 feet across, about 2 feet deep, and was muddy with typha up and down the stream.
Invertebrates: possible benthic invertebrates in typhaBirds: red-winged blackbird, marsh wren, and tree swallowMammals: mammal burrows and gophers
GR08 – terrestrial Sparse vegetation with 30% of location wooded (willow, tamarisk, and mesquite with grasses and duff understory) and 10% in shrub/scrub (tamarisk).
Birds: songbirds, marsh wrens, song sparrowsMammals: mammal burrows
GR08 – aquatic Gila River with an unknown substrate (possibly silt). Banks were vertical undercut then flat to the terrace with grass cover. The river at this location was 30 feet across, about 3 feet deep, and was muddy with no aquatic vegetation.
Birds: American goldfinch, vermillion flycatcher, marsh wren, and tree swallowMammals: small mammals
GR09 – terrestrial Dense vegetation with 80% of location mixed wooded (tamarisk and some willow with tamarisk/mulefat understory) and 30% in shrub/scrub (tamarisk/mulefat).
Birds: marsh wrens, finches, songbirdsMammals: possible bobcat scat, rodent burrows, and fox carcass
GR09 – aquatic Gila River with an unknown substrate (possibly silt). Banks were flat with grass cover. Tamarisk and mulefat as well as some cottonwood regeneration were observed on the banks. Additionally, typha were coming in with the cottonwoods. The river at this location was 30 feet across, about 3 feet deep, and was muddy with some fragmities upstream of the location.
Birds: great blue heron, American goldfinch, marsh wren, tree swallow, and common black-hawkMammals: mammal burrows and horses
GR10 – terrestrial Patchy vegetation with 20% of location mixed wooded (cottonwood, tamarisk, and willow with tamarisk/mulefat understory) and 50% in shrub/scrub (tamarisk and mulefat). The location was crossed by an arroyo/gulley consisting of bare gravel. Possible plant stress observed.
Birds: towhee, finches, sparrowsMammals: rodent burrows, bobcat, raccoon, and canid scat
GR10 – aquatic Gila River with an unknown substrate (possibly silt). Banks were flat with grass cover. Tamarisk, mulefat, some ruderals, and a few mesquite were observed on the banks. The river at this location was 30 feet across, about 1 foot deep, and was muddy with some fragmities upstream of the location.
Birds: marsh wren, tree swallow, killdeer, mallard, and towheeMammals: mammal scat (bobcat, raccoon, canid) and horses
Page 3 of 5
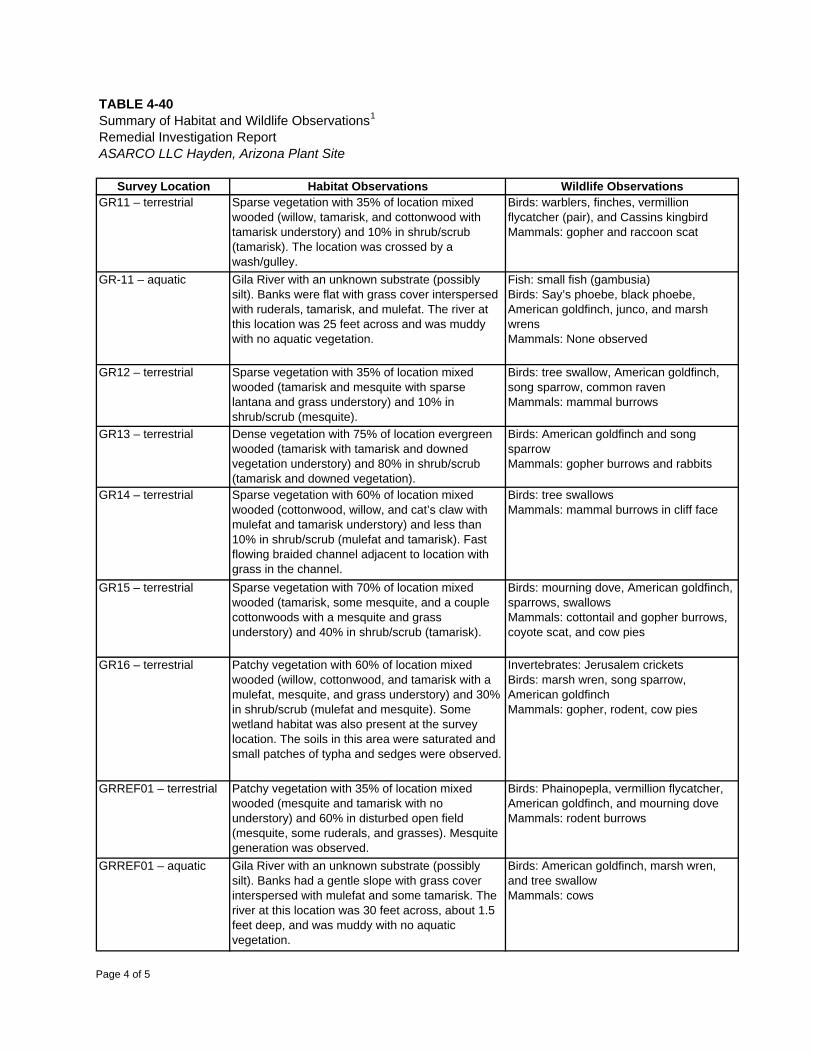
TABLE 4-40
Survey Location Habitat Observations Wildlife Observations
Summary of Habitat and Wildlife Observations1
ASARCO LLC Hayden, Arizona Plant SiteRemedial Investigation Report
GR11 – terrestrial Sparse vegetation with 35% of location mixed wooded (willow, tamarisk, and cottonwood with tamarisk understory) and 10% in shrub/scrub (tamarisk). The location was crossed by a wash/gulley.
Birds: warblers, finches, vermillion flycatcher (pair), and Cassins kingbirdMammals: gopher and raccoon scat
GR-11 – aquatic Gila River with an unknown substrate (possibly silt). Banks were flat with grass cover interspersed with ruderals, tamarisk, and mulefat. The river at this location was 25 feet across and was muddy with no aquatic vegetation.
Fish: small fish (gambusia)Birds: Say’s phoebe, black phoebe, American goldfinch, junco, and marsh wrensMammals: None observed
GR12 – terrestrial Sparse vegetation with 35% of location mixed wooded (tamarisk and mesquite with sparse lantana and grass understory) and 10% in shrub/scrub (mesquite).
Birds: tree swallow, American goldfinch, song sparrow, common ravenMammals: mammal burrows
GR13 – terrestrial Dense vegetation with 75% of location evergreen wooded (tamarisk with tamarisk and downed vegetation understory) and 80% in shrub/scrub (tamarisk and downed vegetation).
Birds: American goldfinch and song sparrowMammals: gopher burrows and rabbits
GR14 – terrestrial Sparse vegetation with 60% of location mixed wooded (cottonwood, willow, and cat’s claw with mulefat and tamarisk understory) and less than 10% in shrub/scrub (mulefat and tamarisk). Fast flowing braided channel adjacent to location with grass in the channel.
Birds: tree swallowsMammals: mammal burrows in cliff face
GR15 – terrestrial Sparse vegetation with 70% of location mixed wooded (tamarisk, some mesquite, and a couple cottonwoods with a mesquite and grass understory) and 40% in shrub/scrub (tamarisk).
Birds: mourning dove, American goldfinch, sparrows, swallowsMammals: cottontail and gopher burrows, coyote scat, and cow pies
GR16 – terrestrial Patchy vegetation with 60% of location mixed wooded (willow, cottonwood, and tamarisk with a mulefat, mesquite, and grass understory) and 30% in shrub/scrub (mulefat and mesquite). Some wetland habitat was also present at the survey location. The soils in this area were saturated and small patches of typha and sedges were observed.
Invertebrates: Jerusalem cricketsBirds: marsh wren, song sparrow, American goldfinchMammals: gopher, rodent, cow pies
GRREF01 – terrestrial Patchy vegetation with 35% of location mixed wooded (mesquite and tamarisk with no understory) and 60% in disturbed open field (mesquite, some ruderals, and grasses). Mesquite generation was observed.
Birds: Phainopepla, vermillion flycatcher, American goldfinch, and mourning doveMammals: rodent burrows
GRREF01 – aquatic Gila River with an unknown substrate (possibly silt). Banks had a gentle slope with grass cover interspersed with mulefat and some tamarisk. The river at this location was 30 feet across, about 1.5 feet deep, and was muddy with no aquatic vegetation.
Birds: American goldfinch, marsh wren, and tree swallowMammals: cows
Page 4 of 5
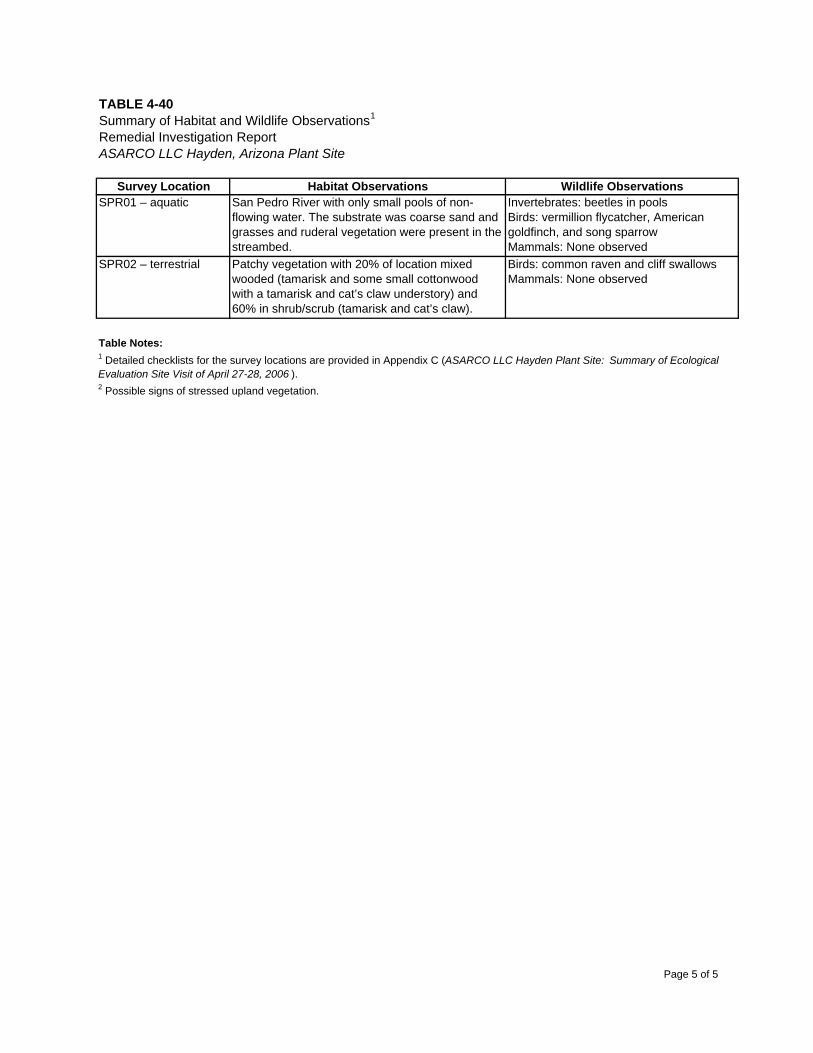
TABLE 4-40
Survey Location Habitat Observations Wildlife Observations
Summary of Habitat and Wildlife Observations1
ASARCO LLC Hayden, Arizona Plant SiteRemedial Investigation Report
SPR01 – aquatic San Pedro River with only small pools of non-flowing water. The substrate was coarse sand and grasses and ruderal vegetation were present in the streambed.
Invertebrates: beetles in poolsBirds: vermillion flycatcher, American goldfinch, and song sparrowMammals: None observed
SPR02 – terrestrial Patchy vegetation with 20% of location mixed wooded (tamarisk and some small cottonwood with a tamarisk and cat’s claw understory) and 60% in shrub/scrub (tamarisk and cat’s claw).
Birds: common raven and cliff swallowsMammals: None observed
Table Notes:
2 Possible signs of stressed upland vegetation.
1 Detailed checklists for the survey locations are provided in Appendix C (ASARCO LLC Hayden Plant Site: Summary of Ecological Evaluation Site Visit of April 27-28, 2006 ).
Page 5 of 5
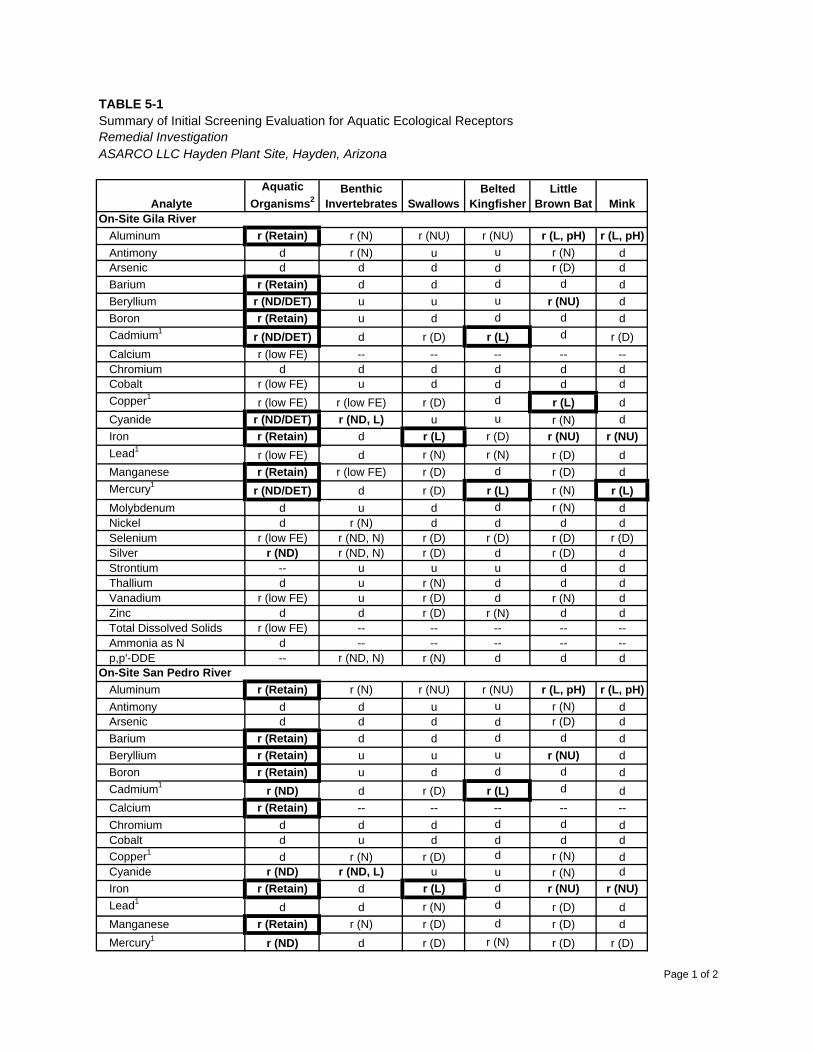
TABLE 5-1Summary of Initial Screening Evaluation for Aquatic Ecological ReceptorsRemedial InvestigationASARCO LLC Hayden Plant Site, Hayden, Arizona
AnalyteAquatic
Organisms2Benthic
Invertebrates SwallowsBelted
KingfisherLittle
Brown Bat Mink
Aluminum r (Retain) r (N) r (NU) r (NU) r (L, pH) r (L, pH)Antimony d r (N) u u r (N) dArsenic d d d d r (D) dBarium r (Retain) d d d d dBeryllium r (ND/DET) u u u r (NU) dBoron r (Retain) u d d d dCadmium1 r (ND/DET) d r (D) r (L) d r (D)Calcium r (low FE) -- -- -- -- --Chromium d d d d d dCobalt r (low FE) u d d d dCopper1 r (low FE) r (low FE) r (D) d r (L) dCyanide r (ND/DET) r (ND, L) u u r (N) dIron r (Retain) d r (L) r (D) r (NU) r (NU)Lead1 r (low FE) d r (N) r (N) r (D) dManganese r (Retain) r (low FE) r (D) d r (D) dMercury1 r (ND/DET) d r (D) r (L) r (N) r (L)Molybdenum d u d d r (N) dNickel d r (N) d d d dSelenium r (low FE) r (ND, N) r (D) r (D) r (D) r (D)Silver r (ND) r (ND, N) r (D) d r (D) dStrontium -- u u u d dThallium d u r (N) d d dVanadium r (low FE) u r (D) d r (N) dZinc d d r (D) r (N) d dTotal Dissolved Solids r (low FE) -- -- -- -- --Ammonia as N d -- -- -- -- --p,p'-DDE -- r (ND, N) r (N) d d d
Aluminum r (Retain) r (N) r (NU) r (NU) r (L, pH) r (L, pH)Antimony d d u u r (N) dArsenic d d d d r (D) dBarium r (Retain) d d d d dBeryllium r (Retain) u u u r (NU) dBoron r (Retain) u d d d dCadmium1 r (ND) d r (D) r (L) d dCalcium r (Retain) -- -- -- -- --Chromium d d d d d dCobalt d u d d d dCopper1 d r (N) r (D) d r (N) dCyanide r (ND) r (ND, L) u u r (N) dIron r (Retain) d r (L) d r (NU) r (NU)Lead1 d d r (N) d r (D) dManganese r (Retain) r (N) r (D) d r (D) dMercury1 r (ND) d r (D) r (N) r (D) r (D)
On-Site Gila River
On-Site San Pedro River
Page 1 of 2
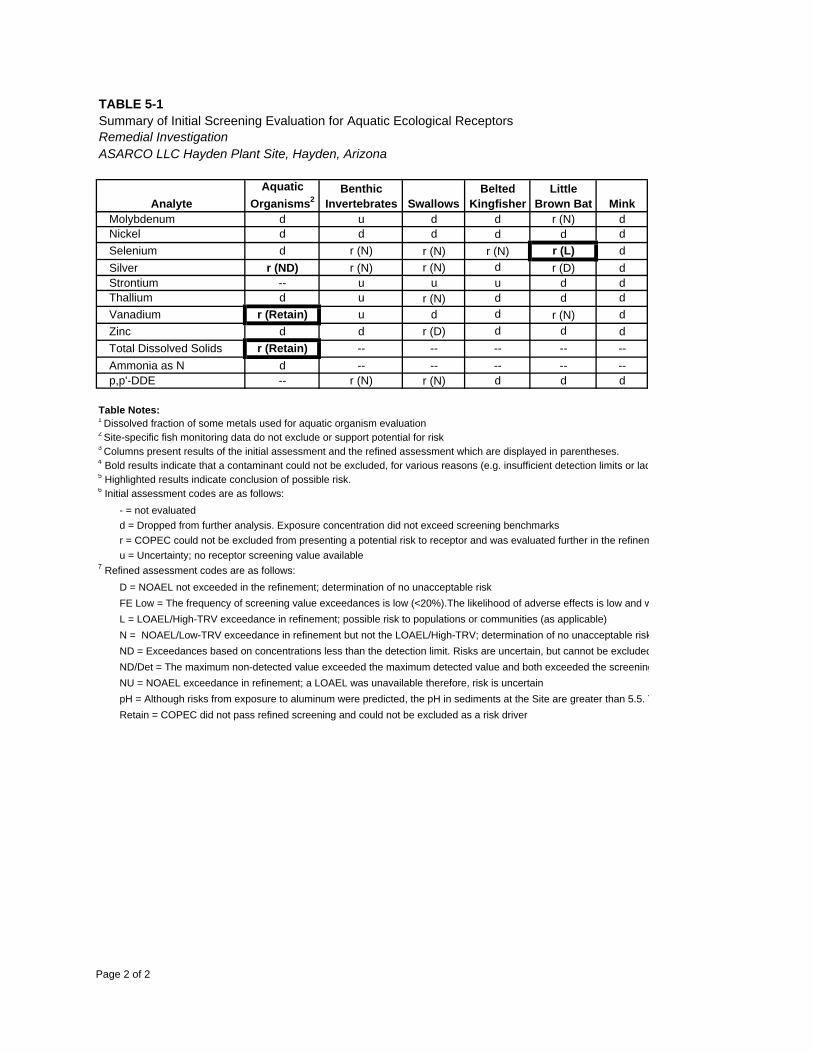
TABLE 5-1Summary of Initial Screening Evaluation for Aquatic Ecological ReceptorsRemedial InvestigationASARCO LLC Hayden Plant Site, Hayden, Arizona
AnalyteAquatic
Organisms2Benthic
Invertebrates SwallowsBelted
KingfisherLittle
Brown Bat MinkMolybdenum d u d d r (N) dNickel d d d d d dSelenium d r (N) r (N) r (N) r (L) dSilver r (ND) r (N) r (N) d r (D) dStrontium -- u u u d dThallium d u r (N) d d dVanadium r (Retain) u d d r (N) dZinc d d r (D) d d dTotal Dissolved Solids r (Retain) -- -- -- -- --Ammonia as N d -- -- -- -- --p,p'-DDE -- r (N) r (N) d d d
Table Notes:1 Dissolved fraction of some metals used for aquatic organism evaluation2 Site-specific fish monitoring data do not exclude or support potential for risk3 Columns present results of the initial assessment and the refined assessment which are displayed in parentheses.4 Bold results indicate that a contaminant could not be excluded, for various reasons (e.g. insufficient detection limits or lac5 Highlighted results indicate conclusion of possible risk.6 Initial assessment codes are as follows:
- = not evaluatedd = Dropped from further analysis. Exposure concentration did not exceed screening benchmarksr = COPEC could not be excluded from presenting a potential risk to receptor and was evaluated further in the refinemu = Uncertainty; no receptor screening value available
7 Refined assessment codes are as follows:D = NOAEL not exceeded in the refinement; determination of no unacceptable riskFE Low = The frequency of screening value exceedances is low (<20%).The likelihood of adverse effects is low and wL = LOAEL/High-TRV exceedance in refinement; possible risk to populations or communities (as applicable)N = NOAEL/Low-TRV exceedance in refinement but not the LOAEL/High-TRV; determination of no unacceptable riskND = Exceedances based on concentrations less than the detection limit. Risks are uncertain, but cannot be excludedND/Det = The maximum non-detected value exceeded the maximum detected value and both exceeded the screeningNU = NOAEL exceedance in refinement; a LOAEL was unavailable therefore, risk is uncertainpH = Although risks from exposure to aluminum were predicted, the pH in sediments at the Site are greater than 5.5. TRetain = COPEC did not pass refined screening and could not be excluded as a risk driver
Page 2 of 2
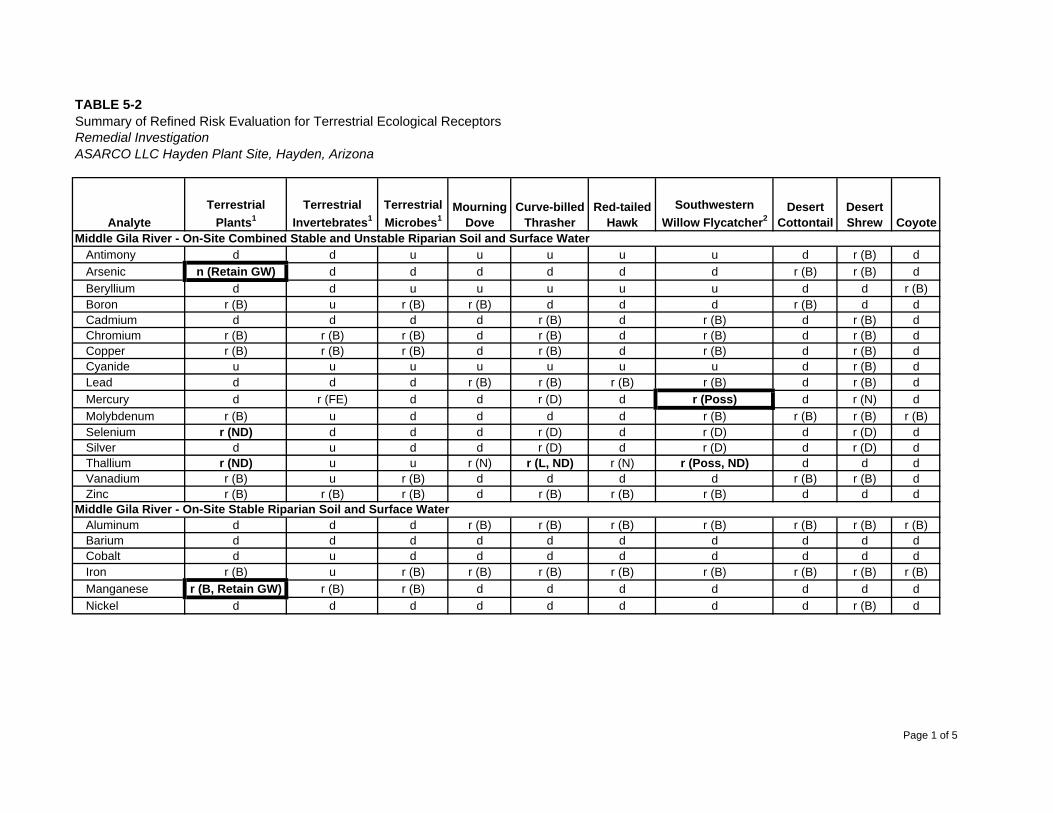
TABLE 5-2Summary of Refined Risk Evaluation for Terrestrial Ecological ReceptorsRemedial InvestigationASARCO LLC Hayden Plant Site, Hayden, Arizona
AnalyteTerrestrial
Plants1Terrestrial
Invertebrates1Terrestrial Microbes1
MourningDove
Curve-billed Thrasher
Red-tailed Hawk
Southwestern Willow Flycatcher2
Desert Cottontail
Desert Shrew Coyote
Antimony d d u u u u u d r (B) dArsenic n (Retain GW) d d d d d d r (B) r (B) dBeryllium d d u u u u u d d r (B)Boron r (B) u r (B) r (B) d d d r (B) d dCadmium d d d d r (B) d r (B) d r (B) dChromium r (B) r (B) r (B) d r (B) d r (B) d r (B) dCopper r (B) r (B) r (B) d r (B) d r (B) d r (B) dCyanide u u u u u u u d r (B) dLead d d d r (B) r (B) r (B) r (B) d r (B) dMercury d r (FE) d d r (D) d r (Poss) d r (N) dMolybdenum r (B) u d d d d r (B) r (B) r (B) r (B)Selenium r (ND) d d d r (D) d r (D) d r (D) dSilver d u d d r (D) d r (D) d r (D) dThallium r (ND) u u r (N) r (L, ND) r (N) r (Poss, ND) d d dVanadium r (B) u r (B) d d d d r (B) r (B) dZinc r (B) r (B) r (B) d r (B) r (B) r (B) d d d
Aluminum d d d r (B) r (B) r (B) r (B) r (B) r (B) r (B)Barium d d d d d d d d d dCobalt d u d d d d d d d dIron r (B) u r (B) r (B) r (B) r (B) r (B) r (B) r (B) r (B)Manganese r (B, Retain GW) r (B) r (B) d d d d d d dNickel d d d d d d d d r (B) d
Middle Gila River - On-Site Combined Stable and Unstable Riparian Soil and Surface Water
Middle Gila River - On-Site Stable Riparian Soil and Surface Water
Page 1 of 5
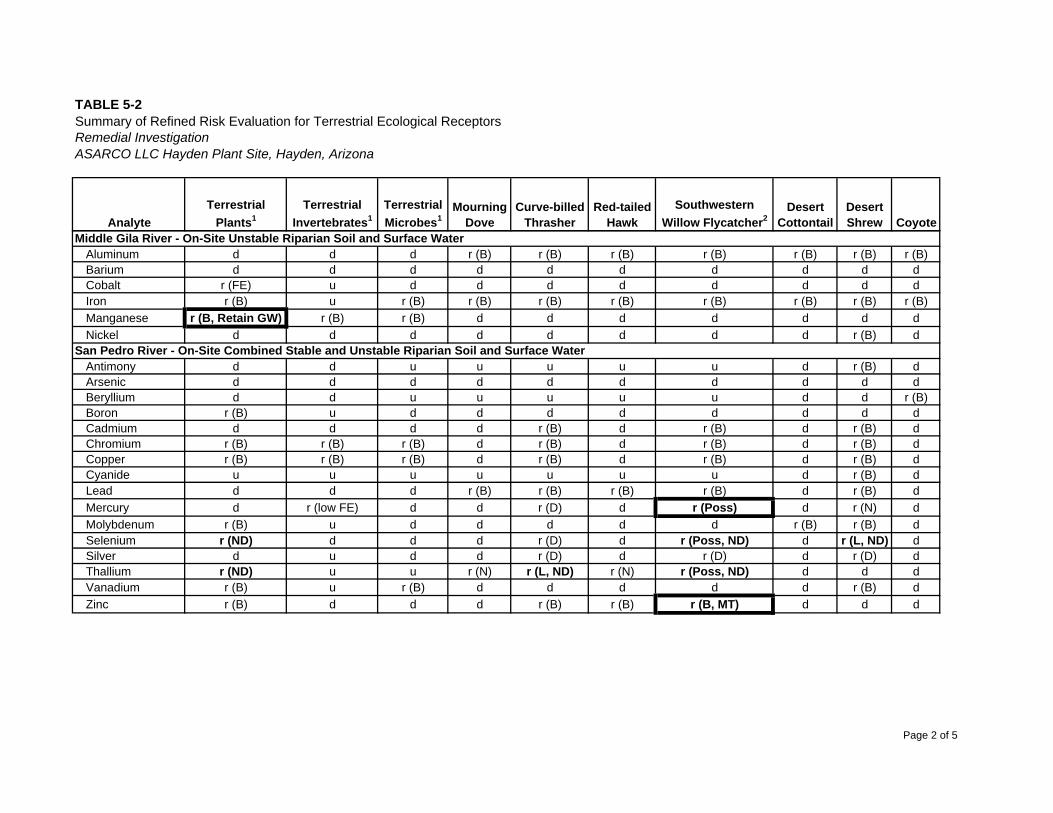
TABLE 5-2Summary of Refined Risk Evaluation for Terrestrial Ecological ReceptorsRemedial InvestigationASARCO LLC Hayden Plant Site, Hayden, Arizona
AnalyteTerrestrial
Plants1Terrestrial
Invertebrates1Terrestrial Microbes1
MourningDove
Curve-billed Thrasher
Red-tailed Hawk
Southwestern Willow Flycatcher2
Desert Cottontail
Desert Shrew Coyote
Aluminum d d d r (B) r (B) r (B) r (B) r (B) r (B) r (B)Barium d d d d d d d d d dCobalt r (FE) u d d d d d d d dIron r (B) u r (B) r (B) r (B) r (B) r (B) r (B) r (B) r (B)Manganese r (B, Retain GW) r (B) r (B) d d d d d d dNickel d d d d d d d d r (B) d
Antimony d d u u u u u d r (B) dArsenic d d d d d d d d d dBeryllium d d u u u u u d d r (B)Boron r (B) u d d d d d d d dCadmium d d d d r (B) d r (B) d r (B) dChromium r (B) r (B) r (B) d r (B) d r (B) d r (B) dCopper r (B) r (B) r (B) d r (B) d r (B) d r (B) dCyanide u u u u u u u d r (B) dLead d d d r (B) r (B) r (B) r (B) d r (B) dMercury d r (low FE) d d r (D) d r (Poss) d r (N) dMolybdenum r (B) u d d d d d r (B) r (B) dSelenium r (ND) d d d r (D) d r (Poss, ND) d r (L, ND) dSilver d u d d r (D) d r (D) d r (D) dThallium r (ND) u u r (N) r (L, ND) r (N) r (Poss, ND) d d dVanadium r (B) u r (B) d d d d d r (B) dZinc r (B) d d d r (B) r (B) r (B, MT) d d d
Middle Gila River - On-Site Unstable Riparian Soil and Surface Water
San Pedro River - On-Site Combined Stable and Unstable Riparian Soil and Surface Water
Page 2 of 5
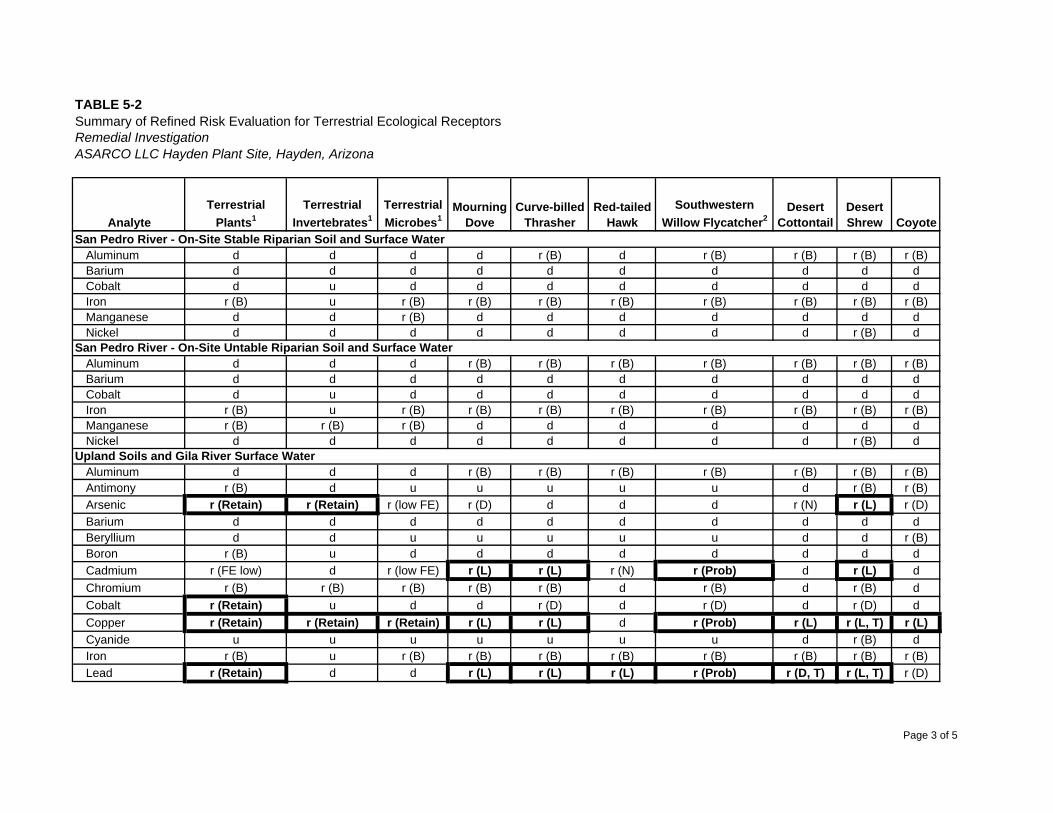
TABLE 5-2Summary of Refined Risk Evaluation for Terrestrial Ecological ReceptorsRemedial InvestigationASARCO LLC Hayden Plant Site, Hayden, Arizona
AnalyteTerrestrial
Plants1Terrestrial
Invertebrates1Terrestrial Microbes1
MourningDove
Curve-billed Thrasher
Red-tailed Hawk
Southwestern Willow Flycatcher2
Desert Cottontail
Desert Shrew Coyote
Aluminum d d d d r (B) d r (B) r (B) r (B) r (B)Barium d d d d d d d d d dCobalt d u d d d d d d d dIron r (B) u r (B) r (B) r (B) r (B) r (B) r (B) r (B) r (B)Manganese d d r (B) d d d d d d dNickel d d d d d d d d r (B) d
Aluminum d d d r (B) r (B) r (B) r (B) r (B) r (B) r (B)Barium d d d d d d d d d dCobalt d u d d d d d d d dIron r (B) u r (B) r (B) r (B) r (B) r (B) r (B) r (B) r (B)Manganese r (B) r (B) r (B) d d d d d d dNickel d d d d d d d d r (B) d
Aluminum d d d r (B) r (B) r (B) r (B) r (B) r (B) r (B)Antimony r (B) d u u u u u d r (B) r (B)Arsenic r (Retain) r (Retain) r (low FE) r (D) d d d r (N) r (L) r (D)Barium d d d d d d d d d dBeryllium d d u u u u u d d r (B)Boron r (B) u d d d d d d d dCadmium r (FE low) d r (low FE) r (L) r (L) r (N) r (Prob) d r (L) dChromium r (B) r (B) r (B) r (B) r (B) d r (B) d r (B) dCobalt r (Retain) u d d r (D) d r (D) d r (D) dCopper r (Retain) r (Retain) r (Retain) r (L) r (L) d r (Prob) r (L) r (L, T) r (L)Cyanide u u u u u u u d r (B) dIron r (B) u r (B) r (B) r (B) r (B) r (B) r (B) r (B) r (B)Lead r (Retain) d d r (L) r (L) r (L) r (Prob) r (D, T) r (L, T) r (D)
San Pedro River - On-Site Stable Riparian Soil and Surface Water
San Pedro River - On-Site Untable Riparian Soil and Surface Water
Upland Soils and Gila River Surface Water
Page 3 of 5
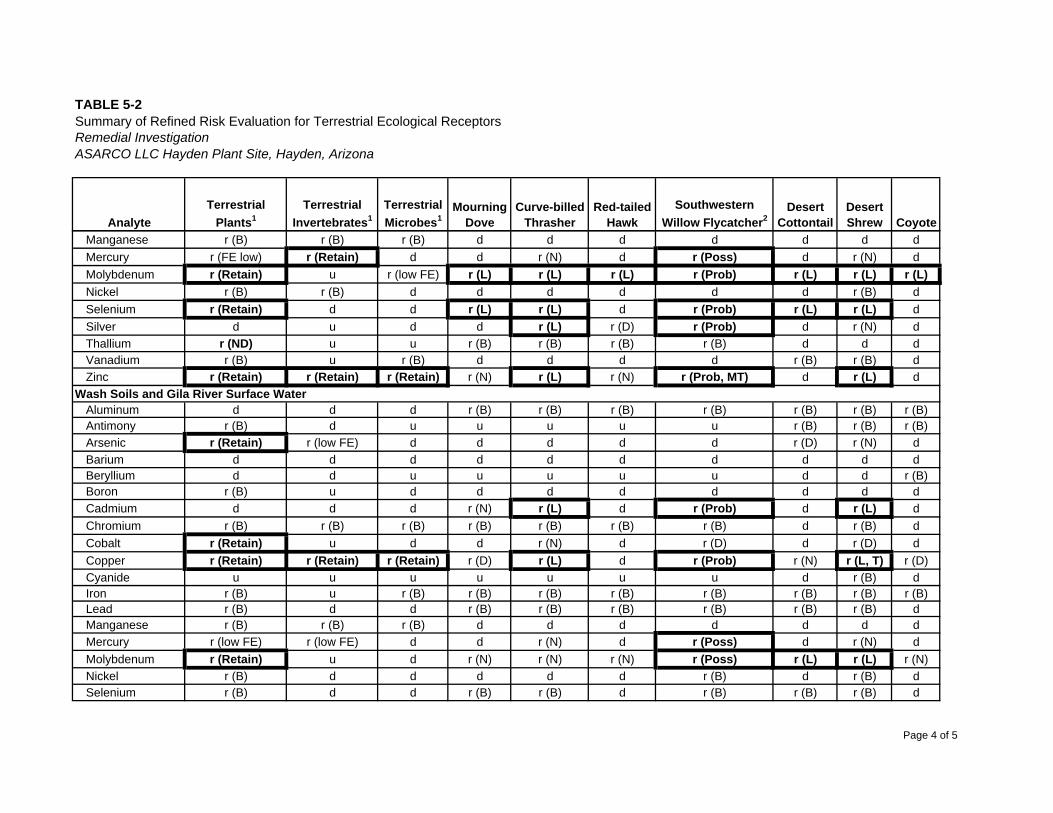
TABLE 5-2Summary of Refined Risk Evaluation for Terrestrial Ecological ReceptorsRemedial InvestigationASARCO LLC Hayden Plant Site, Hayden, Arizona
AnalyteTerrestrial
Plants1Terrestrial
Invertebrates1Terrestrial Microbes1
MourningDove
Curve-billed Thrasher
Red-tailed Hawk
Southwestern Willow Flycatcher2
Desert Cottontail
Desert Shrew Coyote
Manganese r (B) r (B) r (B) d d d d d d dMercury r (FE low) r (Retain) d d r (N) d r (Poss) d r (N) dMolybdenum r (Retain) u r (low FE) r (L) r (L) r (L) r (Prob) r (L) r (L) r (L)Nickel r (B) r (B) d d d d d d r (B) dSelenium r (Retain) d d r (L) r (L) d r (Prob) r (L) r (L) dSilver d u d d r (L) r (D) r (Prob) d r (N) dThallium r (ND) u u r (B) r (B) r (B) r (B) d d dVanadium r (B) u r (B) d d d d r (B) r (B) dZinc r (Retain) r (Retain) r (Retain) r (N) r (L) r (N) r (Prob, MT) d r (L) d
Aluminum d d d r (B) r (B) r (B) r (B) r (B) r (B) r (B)Antimony r (B) d u u u u u r (B) r (B) r (B)Arsenic r (Retain) r (low FE) d d d d d r (D) r (N) dBarium d d d d d d d d d dBeryllium d d u u u u u d d r (B)Boron r (B) u d d d d d d d dCadmium d d d r (N) r (L) d r (Prob) d r (L) dChromium r (B) r (B) r (B) r (B) r (B) r (B) r (B) d r (B) dCobalt r (Retain) u d d r (N) d r (D) d r (D) dCopper r (Retain) r (Retain) r (Retain) r (D) r (L) d r (Prob) r (N) r (L, T) r (D)Cyanide u u u u u u u d r (B) dIron r (B) u r (B) r (B) r (B) r (B) r (B) r (B) r (B) r (B)Lead r (B) d d r (B) r (B) r (B) r (B) r (B) r (B) dManganese r (B) r (B) r (B) d d d d d d dMercury r (low FE) r (low FE) d d r (N) d r (Poss) d r (N) dMolybdenum r (Retain) u d r (N) r (N) r (N) r (Poss) r (L) r (L) r (N)Nickel r (B) d d d d d r (B) d r (B) dSelenium r (B) d d r (B) r (B) d r (B) r (B) r (B) d
Wash Soils and Gila River Surface Water
Page 4 of 5
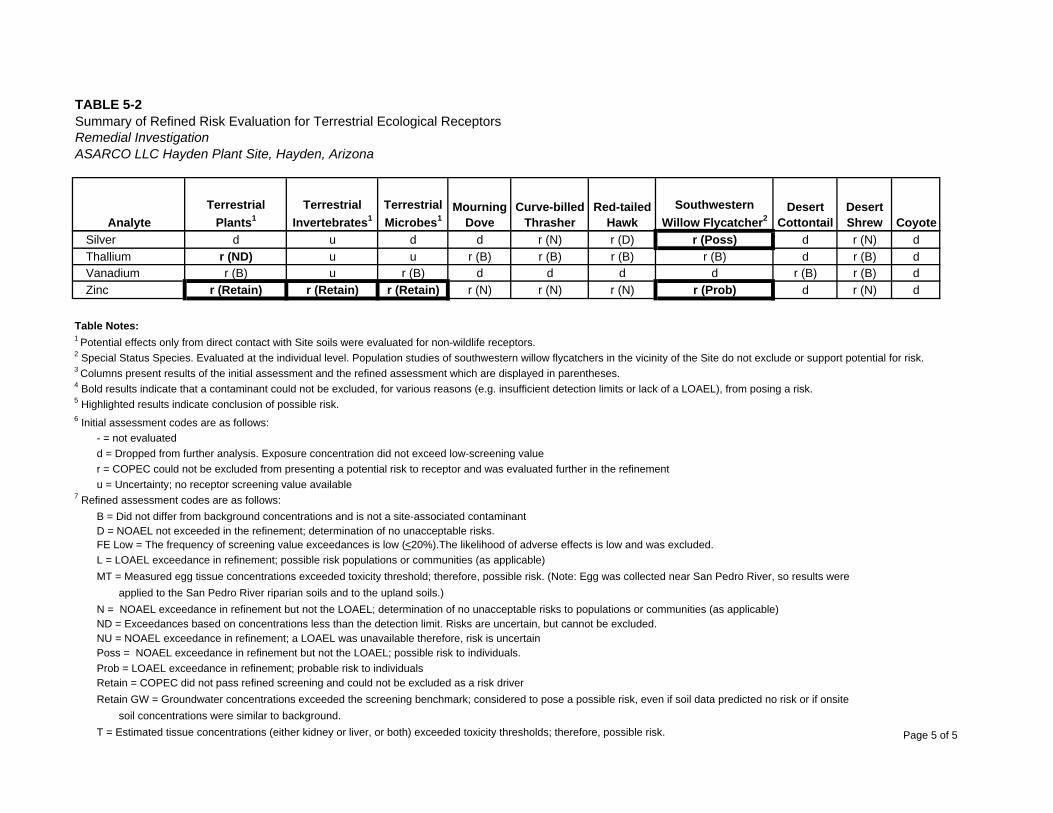
TABLE 5-2Summary of Refined Risk Evaluation for Terrestrial Ecological ReceptorsRemedial InvestigationASARCO LLC Hayden Plant Site, Hayden, Arizona
AnalyteTerrestrial
Plants1Terrestrial
Invertebrates1Terrestrial Microbes1
MourningDove
Curve-billed Thrasher
Red-tailed Hawk
Southwestern Willow Flycatcher2
Desert Cottontail
Desert Shrew Coyote
Silver d u d d r (N) r (D) r (Poss) d r (N) dThallium r (ND) u u r (B) r (B) r (B) r (B) d r (B) dVanadium r (B) u r (B) d d d d r (B) r (B) dZinc r (Retain) r (Retain) r (Retain) r (N) r (N) r (N) r (Prob) d r (N) d
Table Notes:1 Potential effects only from direct contact with Site soils were evaluated for non-wildlife receptors.2 Special Status Species. Evaluated at the individual level. Population studies of southwestern willow flycatchers in the vicinity of the Site do not exclude or support potential for risk.3 Columns present results of the initial assessment and the refined assessment which are displayed in parentheses.4 Bold results indicate that a contaminant could not be excluded, for various reasons (e.g. insufficient detection limits or lack of a LOAEL), from posing a risk.5 Highlighted results indicate conclusion of possible risk.6 Initial assessment codes are as follows:
- = not evaluatedd = Dropped from further analysis. Exposure concentration did not exceed low-screening valuer = COPEC could not be excluded from presenting a potential risk to receptor and was evaluated further in the refinementu = Uncertainty; no receptor screening value available
7 Refined assessment codes are as follows:B = Did not differ from background concentrations and is not a site-associated contaminantD = NOAEL not exceeded in the refinement; determination of no unacceptable risks.FE Low = The frequency of screening value exceedances is low (<20%).The likelihood of adverse effects is low and was excluded.L = LOAEL exceedance in refinement; possible risk populations or communities (as applicable)
applied to the San Pedro River riparian soils and to the upland soils.)N = NOAEL exceedance in refinement but not the LOAEL; determination of no unacceptable risks to populations or communities (as applicable)ND = Exceedances based on concentrations less than the detection limit. Risks are uncertain, but cannot be excluded.NU = NOAEL exceedance in refinement; a LOAEL was unavailable therefore, risk is uncertainPoss = NOAEL exceedance in refinement but not the LOAEL; possible risk to individuals.Prob = LOAEL exceedance in refinement; probable risk to individualsRetain = COPEC did not pass refined screening and could not be excluded as a risk driverRetain GW = Groundwater concentrations exceeded the screening benchmark; considered to pose a possible risk, even if soil data predicted no risk or if onsite
soil concentrations were similar to background.T = Estimated tissue concentrations (either kidney or liver, or both) exceeded toxicity thresholds; therefore, possible risk.
MT = Measured egg tissue concentrations exceeded toxicity threshold; therefore, possible risk. (Note: Egg was collected near San Pedro River, so results were
Page 5 of 5