remote sensing of environment - malcolm north...
TRANSCRIPT

Remote Sensing of Environment 151 (2014) 89–101
Contents lists available at ScienceDirect
Remote Sensing of Environment
j ourna l homepage: www.e lsev ie r .com/ locate / rse
Assessing fire effects on forest spatial structure using a fusion of Landsatand airborne LiDAR data in Yosemite National Park
Van R. Kane a,⁎, Malcolm P. North b, James A. Lutz c, Derek J. Churchill a, Susan L. Roberts d, Douglas F. Smith e,Robert J. McGaughey f, Jonathan T. Kane a, Matthew L. Brooks g
a School of Environmental and Forest Sciences, University of Washington, Box 352100, Seattle, WA 98195, USAb USDA Forest Service, Pacific Southwest Research Station, 1731 Research Park Dr., Davis, CA 95618, USAc Department of Wildland Resources, Utah State University, 5230 Old Main Hill, Logan, UT, 84322-5230, USAd P.O. Box 2163, Yosemite National Park, CA 95389, USAe Yosemite National Park, P.O. Box 577, Yosemite, CA 95389, USAf USDA Forest Service, Pacific Northwest Research Station, University of Washington, Box 352100, Seattle, WA 98195, USAg U.S. Geological Survey, Western Ecological Research Center, Yosemite Field Station, El Portal, CA 95318, USA
⁎ Corresponding author. Tel.: +1 425 890 7826; fax: +E-mail address: [email protected] (V.R. Kane).
0034-4257/$ – see front matter © 2013 Elsevier Inc. All rihttp://dx.doi.org/10.1016/j.rse.2013.07.041
a b s t r a c t
a r t i c l e i n f oArticle history:Received 11 January 2013Received in revised form 25 June 2013Accepted 1 July 2013Available online 11 October 2013
Keywords:Fire severityForest structureRelativized differenced Normalized Burn Ratio(RdNBR)LiDARGapsTree clumpsSierra NevadaAbies concolorAbies magnificaPinus lambertianaPinus ponderosa
Mosaics of tree clumps and openings are characteristic of forests dominated by frequent, low- and moderate-severity fires. When restoring these fire-suppressed forests, managers often try to reproduce these structuresto increase ecosystem resilience. We examined unburned and burned forest structures for 1937 0.81 ha sampleareas in Yosemite National Park, USA. We estimated severity for fires from 1984 to 2010 using the Landsat-derived Relativized differenced Normalized Burn Ratio (RdNBR) and measured openings and canopy clumps infive height strata using airborne LiDAR data. Because our study area lacked concurrent field data, we identifiedmethods to allow structural analysis using LiDAR data alone. We found three spatial structures, canopy-gap,clump-open, and open, that differed in spatial arrangement and proportion of canopy and openings. As fire sever-ity increased, the total area in canopy decreased while the number of clumps increased, creating a patchwork ofopenings and multistory tree clumps. The presence of openings N0.3 ha, an approximate minimum gap sizeneeded to favor shade-intolerant pine regeneration, increased rapidly with loss of canopy area. The range andvariation of structures for a given fire severity were specific to each forest type. Low- to moderate-severityfires best replicated the historic clump-opening patterns thatwere common in forests with frequent fire regimes.Our results suggest thatmanagers consider the following goals for their forest restoration: 1) reduce total canopycover by breaking up large contiguous areas into variable-sized tree clumps and scattered large individual trees;2) create a range of opening sizes and shapes, including ~50% of the open area in gaps N0.3 ha; 3) create multi-story clumps in addition to single story clumps; 4) retain historic densities of large trees; and 5) vary treatmentsto include canopy-gap, clump-open, and openmosaics across project areas to mimic the range of patterns foundfor each forest type in our study.
© 2013 Elsevier Inc. All rights reserved.
1. Introduction
In frequent-fire pine and mixed-conifer forests in western NorthAmerica (hereafter, dry forests), historic accounts (Dunning, 1923; Show& Kotok, 1924) and studies of forests with active fire regimes (Collins& Stephens, 2010; Collins, Kelly, van Wagtendonk, & Stephens, 2007;Larson & Churchill, 2012; Stephens & Collins, 2004; Stephens & Gill,2005) have emphasized the importance of spatial variability in foreststructure tomaintain ecosystem process and resilience. A recent reviewof studies of stand-level structure found that fire-frequent dry forestswere composed of mosaics of widely-spaced individual trees, treeclumps (two to 20+ trees), and openings (Larson & Churchill,
1 206 543 7295.
ghts reserved.
2012). Historically, these patterns of individual trees, tree clumps,and openings were maintained by fire and insect-driven mortality, andonce established, tended towards self-perpetuation. Openings would actto moderate fire and inhibit bark-beetle dispersal (Finney et al., 2007;Pimont, Dupuy, Linn, & Dupont, 2011; Stephens, Fry, & Franco-Vizcaino,2008) while the fine-scale local variation in canopy height and continuitywould impede crown fires (Beaty & Taylor, 2007; Parisien, Miller, Ager, &Finney, 2010; Pimont et al., 2011; Stephens et al., 2008; Thaxton & Platt,2006). Openings also provided areas for subsequent regeneration,particularly of shade-intolerant, fire-resistant species, creating afine-scale shifting mosaic maintained by frequent fire (Agee,1993; Boyden, Binkley, & Shepperd, 2005; Cooper, 1960; SánchezMeador, Moore, Bakker, & Parysow, 2009).
Today, decades of fire exclusion have altered forest structure andoften led to forests with nearly continuous canopies (Hessburg, Agee,

90 V.R. Kane et al. / Remote Sensing of Environment 151 (2014) 89–101
& Franklin, 2005). Openings, especially large ones that can act as firebreaks and regeneration sites, are less prevalent than theywere a centu-ry ago (Hessburg et al., 2005; Lutz, Larson, Swanson, & Freund, 2012;Scholl & Taylor, 2010). To restore structure, maintain resilience, andmitigate the possibility of large areas of high-severity fire, managersuse mechanical thinning and prescribed and wildland fire across hun-dreds of thousands of hectares of public forests annually (Miller et al.,2012; North, Collins, & Stephens, 2012; Schoennagel & Nelson, 2011).
Researchers and managers need spatially-explicit measurements oftree clumps and openings over large areas to understand the ecologicalrelationships between fire and the spatial structure of forests. Stemmapsof reconstructed pre-Euro-American era forests or active-fire regime siteshave been the primary source of information (e.g., Harrod, McRae, &Hartl, 1999). However, only 22 stem-map studies have been conductedon dry forest reference sites from 1960 to 2011 covering a cumulative294.7 ha (Larson & Churchill, 2012; Lutz et al., 2012). The limited areasuggests that the full diversity of spatial structures on western land-scapes has been under sampled. Most spatially explicit tree maps areof small areas (0.5 to 4 ha) and thus do not inform managers on howpattern varies over spatial extents commonly used in restoration treat-ments (10 to 100 ha), or intact landscapes (N1000 ha). In addition, fewstemmap studies contain height information, and little is known aboutthe vertical structure of tree clumps. Silviculturalmethods are being de-veloped to restore stand-level patterns of tree clumps and openings(Churchill et al., 2013; North & Sherlock, 2012), but these lack highresolution spatial reference information over large scales (Larson &Churchill, 2012).
Airborne Light Detection and Ranging (LiDAR) data can assess foreststructure over large areas (Hudak, Evans, & Stuart Smith, 2009; Lefsky,Cohen, Parker, & Harding, 2002; Reutebuch, Andersen, & McGaughey,2005) including patterns of gaps and tree clumps. LiDAR's strength isthe high resolution (typically several measurements per square meter)and consistent measurement of ground elevation and canopy heightsover large areaswith greater fidelity to structural attributes than possiblewith satellite images (Asner et al., 2011; Hummel, Hudak, Uebler,Falkowski, & Megown, 2011). Researchers have traditionally corre-lated LiDAR canopy measures with extensive ground-based tree mea-surements (e.g., for biomass or cubic volume). However, many forestLiDAR acquisitions lack concurrent field data. Lefsky, Hudak, Cohen,and Acker (2005) and Kane, McGaughey, et al. (2010) laid out thetheoretical basis and provided a practical example (Kane, Bakker et al.,2010) for interpreting relative differences in forest structure usingLiDAR data as a primary data source. Recently, researchers have begunto use LiDAR as a primary data source to study forest canopy structurewithout reference to field data over large areas (Asner et al., 2013; Kaneet al., 2011, 2013; Kellner & Asner, 2009; Whitehurst, Swatantran, Blair,Hofton, & Dubayah, 2013). One of our goals is to identify methods to
Canopy-gap Clump-open
>60% canopy< 40% open
40-60% canopy40-60% open
Fig. 1. Examples of the canopy-gap (canopy clumps dominate area and enclose gaps), clump-opand enclose small canopy clumps). Each example area is 300 m × 300 m (9 ha) and grid li30 m × 30 m areas often are not representative of the context at larger scales such as the 90 m
study openings and tree clumps for acquisitions that lack field data anddemonstrate potential use for ecological analysis. Building on methodsof Kane et al. (2011), we examine spatial structure of unburned standsand stands following fire. We used Landsat images to estimate fire sever-ity across a 26 year period (1984 to 2010).
In this study,we use LiDAR data to examine the effects of different fireseverities on the range of opening and tree clump structures (Fig. 1)found in three unburned and burned forest types (ponderosa pine,white fir-sugar pine, and red fir) common on the Sierra Nevada'swestern slope. While the role of fire in shaping and maintaining dry for-ests with active fire regimes is well documented (Collins & Stephens,2010; Collins et al., 2007; Larson & Churchill, 2012; Stephens & Collins,2004; Stephens&Gill, 2005), the effect of re-introducedfire following de-cades of fire exclusion is less well understood (but see Collins, Everett, &Stephens, 2011; Lydersen & North, 2012; Miller & Safford, 2012).
We used the methods identified for this study to address threequestions related to the spatial structure of forests with increasingfire severity:
1. How do the spatial structures of clumps and openings change withincreasing fire severity for these three forest types?
2. Which model(s) of forest restructuring (thin from below, dispersedmortality of all tree heights, or patchy mortality of all tree heights)best explains changes in structure with increasing fire severity?
3. What are the management implications for forest structuralrestoration?
2. Methods
Wedevelopednewmethods for this study to analyze the spatial struc-tures of tree clumps and openings for different fire severities and foresttypes. We reused the Landsat fire severity measurements and LiDARdata of Kane et al. (2013), who performed complementary analyses fo-cused on changes in canopy profiles with fire, the landscape patterns offire severity in a mixed severity landscape, and a rudimentary spatialstructure analysis that demonstrated the need for this follow on study.In an effort to standardize terminology, our definitions of forest spatialstructure are listed in Table 1.
2.1. Study area: Yosemite National Park
Yosemite National Park (3027 km2) lies in the central Sierra Nevada,California, USA. As a protected area, the forests in Yosemite currentlyexperience no pre- or post-fire logging. A small portion of the land nowwithin park boundaries was logged in the early 20th century, but therehas been limited thinning and development since the finalization of thepark boundaries in 1937. As a result, Yosemite is oneof the best remaining
Open
Height Strata
<2 m Gap/opening
2-8 m Canopy clump
8-16 m Canopy clump
16-32 m Canopy clump
>32 m Canopy clump
<40% canopy>60% open
en (similar area of canopy clumps and openings), and open areas (openings dominate areanes show areas of 30 m × 30 m (0.09 ha). Canopy and gap characteristics of individual
× 90 m (0.81 ha) sample areas used in this study.

Table 1Terminology used in this paper.
Term Definition
Sample area A 90 m × 90 m area used as the basic analysis unit of this studyUnburned An area outside all fire perimeters since 1930Low, moderate,high severity
Estimated categorical fire severity classifications based on theLandsat-derived Relativized differenced Normalized Burn Ratio(RdNBR)
Opening A contiguous area with no canopy N2 m in heightGap Opening entirely enclosed by surrounding canopyCanopy clump A contiguous area with canopy N2 m. Assumed to be composed
of one or more trees with interlocking or adjacent crown ofsimilar height. Clumps were further classified by height strata:2–8 m, 8–16 m, 16–32 m, and N32 m.
Canopy-gap A sample area with canopy N60% of the area; openings typicallywere gaps entirely enclosed by surrounding canopy.
Clump-open A sample area with canopy 40–60% of the area; neither gaps/openings nor canopy clumps dominated.
Open A sample area with gaps/openings N60% of the area; openingsdominated the area and canopy patches typically were entirelyenclosed by surrounding open area.
Patch Landscape ecology term for a continuous area with the sameclassification. In this study, a patch could be a gap, open area, orone of the four canopy clump strata.
LiDAR data extent
Park Boundary
Roads
Lakes
Fig. 2. Location of LiDAR data collection (bold black lines) within Yosemite National Park.Inset shows location of park within the state of California. Supplement Fig. S1 and Fig. S2show higher resolution maps of the study area.
91V.R. Kane et al. / Remote Sensing of Environment 151 (2014) 89–101
natural laboratories to evaluate the effects of fire severity on forest struc-ture with minimal confounding influences.
The western portion of Yosemite possesses a Mediterranean climatewith July mean minimum and maximum temperatures of 2 °C to 13 °Cat higher elevations and 16 °C to 35 °C at lower elevations. Most precip-itation falls as snowwith annual precipitation ranging from 800 mm to1720 mm (Lutz, vanWagtendonk, & Franklin, 2010). The forest vegeta-tion of Yosemite comprises a mosaic of forest types, species, and struc-tural stages (Fites-Kaufman, Rundel, Stephenson, & Weixelman, 2007;Thode, van Wagtendonk, Miller, & Quinn, 2011; van Wagtendonk &Fites-Kaufman, 2006; van Wagtendonk, van Wagtendonk, Meyer, &Painter, 2002). Each forest type, as well as woodlands and shrub fields,exhibits a characteristic fire severity distribution (Thode et al., 2011;van Wagtendonk et al., 2002).
Yosemite experiences multiple wildland fires each year, and since1972many lightning ignited fires have been allowed to burn under pre-scribed conditions (van Wagtendonk & Lutz, 2007). The historic firereturn interval for the forested ecosystems of Yosemite ranges from 4to 187 years, depending on the forest type (Caprio & Lineback, 1997;Caprio & Swetnam, 1995; Collins & Stephens, 2007; van Wagtendonket al., 2002).
2.2. Site selection
Our study area within Yosemite National Park sampled a number offorest types that experienced a diversefire history since 1984 (Fig. 2 andSupplement Figs. 1 and 2). This LiDAR acquisition covered 10,895 haranging in elevation from 1290 m to 2526 m. To minimize the impactof human disturbance, our study area was primarily designated wilder-ness area that had experienced minimal human impacts. We excludedtwo small areas that were harvested in the early 20th century prior totheir incorporation into the park.
Between 1930, when comprehensive park fire records began, andthe date of the LiDAR acquisition (21 July 2010), there were 327 firesin the acquisition area (4.1 fires per year), with 40fires≥40 ha (Supple-ment Table S1). We used only areas that had not burned since 1930(outside all fire perimeters) or burned just once since 1984 (the earliestdate for data from the Landsat Enhanced Thermal Mapper (ETM andETM+)).
We assigned forest types within the study areas based on either the1997 park vegetation map (Keeler-Wolf et al., 2012) or the 1937 vege-tation map (Walker, 2000;Wieslander, 1935). We knew that a number
of previously forested areas that had burned since 1984 had becomeeithermeadowor shrubland. To include these areas in our study,we com-pared cover reported in both the 1937 and 1997maps.We used the 1997vegetation map if the area was forested in 1997. We used the 1937 mapfor areas delineated asmeadow or shrub in 1997 but delineated as forest-ed in 1937 under the assumption thatfire had caused a shift in vegetationtype. We did not include areas that were delineated as meadow or shrubin both 1937 and 1997.
To make meaningful comparisons among forest types, we limitedour analysis to forest types covering N1000 ha within the LiDAR acquisi-tion area. These were ponderosa pine (Pinus ponderosa), white fir-sugarpine (Abies concolor/Pinus lambertiana), and red fir (Abies magnifica) for-ests (Supplement Table S2). Jeffrey pine (Pinus jeffeyi) forests and wood-lands, prevalent within the study area, occurred on rocky outcrops wherethe spatial structure of landscape patches was primarily controlled bythe unburnable area between trees (Kolden, Lutz, Key, Kane, & vanWagtendonk, 2012), and were excluded.
2.3. Estimating fire severity with Landsat data
We used the Yosemite fire atlas assembled by Lutz, Key, Kolden,Kane, and van Wagtendonk (2011), processed by and available fromthe Monitoring Trends in Burn Severity (MTBS) project (Eidenshinket al., 2007). This atlas includes all fires ≥40 ha from 1984 throughJune 2010 prior to the LiDAR acquisition, which comprised 97% of areawithin fire perimeters (Lutz, van Wagtendonk, Thode, et al., 2009).The minimummeasuring unit was a single Landsat pixel (0.09 ha).
We used the Relativized differenced Normalized Burn Ratio, RdNBR,(Miller & Thode, 2007)which is an extension of the differencedNormal-ized Burn Ratio, dNBR (Key & Benson, 2006). These severity measure-ments calculate normalized burn ratios (NBR) from Landsat bands 4(near infrared) and 7 (mid infrared) to stratify estimated fire severity:
NBR ¼ Band4−Band7ð Þ= Band4þ Band7ð Þ: ð1Þ

92 V.R. Kane et al. / Remote Sensing of Environment 151 (2014) 89–101
The dNBR values for each pixel were calculated by subtracting thepost fire NBR from the pre-fire NBR:
dNBR ¼ prefireNBR–postfireNBR: ð2Þ
Miller and Thode (2007) determined that the estimate of fire sever-ity could be enhanced by calibrating severity measurements by remov-ing the biasing of the pre-fire vegetation using the square-root of thepre-fire NBR:
RdNBR ¼ dNBR= SQRT ABS prefireNBR=1000ð Þð Þð Þ: ð3Þ
Higher RdNBR values of these satellite-derived burn indices signify adecrease in photosyntheticmaterials and surfacematerials holdingwaterand an increase in ash, carbon, and soil cover. Miller and Thode (2007)and Miller, Safford, Crimmins, and Thode (2009) demonstrated thatRdNBR produced more accurate classifications of fire severity in SierraNevada forests, particularly for areas with lower pre-fire canopy cover.We classified the satellite-derived RdNBR values into standard burn se-verity classes calibrated with ground composite burn index plots (Key,2006; Key & Benson, 2006; Lutz, van Wagtendonk, Thode, et al., 2009;Miller & Thode, 2007; Miller et al., 2009; Thode et al., 2011).
We classified forest patches outside of all fire perimeters for fires be-tween1930 and July 2010 as ‘unburned.’Weclassified patcheswithinfireperimeters using the five standard MTBS fire severity classes: enhancedgreenness, undifferentiated (no detectable change), low, moderate, andhigh. Miller and Thode (2007) established RdNBR thresholds for eachseverity class (Supplement Table S3) using field plots from the centralSierra Nevada range including plots in Yosemite. We excluded from thisstudy areas with a classified severity of enhanced greenness becausethey were found only in 8.4 ha within the study area. Preliminary analy-sis of the LiDAR data showed that undifferentiated burn severity areasshowed an intermediate level of change between unburned areas andlow-severity burn areas. We chose not to report results from undifferen-tiated severity areas to better focus on the changes between unburnedand among the low- to high-severity continuum.
2.4. LiDAR data collection and processing
Watershed Sciences, Inc. (Corvallis, OR) collected LiDAR using dual-mounted Leica ALS50 Phase II instruments. They collected the data on21 and 22 July 2010 with an average pulse density of 10.9 pulses m−2
and up to four returns per pulse.Watershed Sciences used the TerraScan
LiDAR point cloud
StaCla
h(1
Heigh
Structural ElementsTree clumps/openings
Canopy surface model
Fig. 3. Methods used to identify gaps/openings and canopy patches in different strata—and90 × 90 m canopy surface models produced from the LiDAR point cloud (sample areas). Each 1ings. Analysis was done on patterns of structural elements within each sample area to undersseverity combination was done to reveal landscape patterns.
v.10.009 and TerraModeler v.10.004 software packages (Terrasolid,Helsinki, Finland) to create the 1 m resolution digital terrain models(DTM) from the LiDAR data.We processed the LiDAR return point clouddata to generatemetrics relevant to themeasurement of forest canopiesusing the USDA Forest Service's FUSION software package, beta versionderived from version 3.00 (http://forsys.cfr.washington.edu/fusion.html). Orthographic images (15 cm resolution) were acquired con-currently with the LiDAR data and used for interpretation.
We normalized the height of each LiDAR return to height aboveground by subtracting the elevation of the DTM below each point. Wethen created a canopy surface model using the maximum height ofLiDAR returns within each 1 m grid cell. We classified each grid cell ofthe canopy surface model into the following height strata: b2 m, N2 m,2 to 8 m, 8 to 16 m, 16 to 32 m, and N32 m (Fig. 3), with some additionalanalysis of the strata N48 m. This provided uswith a classified rastermapof the height of the dominant vegetation that could be analyzed as open-ings (b2 m) or as clumps of canopy, and clumps of canopy within eachheight strata. We selected these canopy clump height breaks to identifytree canopies in key phases of regeneration and succession on the contin-uum from early regeneration to large, mature trees.
2.5. Sample area processing
Because of the large number of canopy clumps and openings(many millions) within the study area, we analyzed a sample of non-overlapping 90 m × 90 m areas. This area was large enough to detectcharacteristic canopy clump and opening patterns (Kane et al., 2013;Larson & Churchill, 2012) while small enough to enable a large numberof samples to fit within single forest type-fire severity patches. The sam-ple size alsowas amultiple of the 30 m grain for the forest type and fireseverity data.
We selected samples from all possible 90 m × 90 m areas thatwere entirely classified as one or more of our three target forest types(ponderosa pine, white fir-sugar pine, or red fir).We assigned the foresttype reported for the center of each sample area to the entire samplearea. Preliminary analysis showed that requiring each sample area tohave experienced only one fire severity would have severely limitedthe sample size for moderate- and high-severity fire patches. Therefore,we retained areas that were classified entirely as unburned (outside allfire perimeters) or that were within one fire severity class across thesample area (e.g., undifferentiated and low-severity fire, or moderate-and high-severity fire, but not low- and high-severity fire).We assigned
Landscape - All samples for a forest type-fire
severity combination
nd Sample - ssified 0.81 a raster
m grid cells)
t Strata
<2 m Gap/opening
2-8 m Canopy clump
8-16 m Canopy clump
16-32 m Canopy clump
>32 m Canopy clump
to analyze spatial structure. Individual tree clumps and openings were identified fromm CSM grid cell was classified into a height stratum to identify canopy clumps and open-tand structure within stands. Analysis of all sample areas for a given forest type and fire

93V.R. Kane et al. / Remote Sensing of Environment 151 (2014) 89–101
the fire severity class reported for the center of each sample area to theentire sample area.
For forest type-fire severity combinations with larger areas, we se-lected a randompool of 200 sample areas. For combinationswith smallerareas fromwhich 200 samples could not be drawn, we used all available
Ponderosa pine
Unb
urne
dLo
wM
oder
ate
Hig
h
White fir-s
Fig. 4. Example sample areas (0.81 ha) for each forest type-fire severity combination. Examcombination.
Table 2Number of sample areas by forest type and as unburned or by fire severity. Cumulativearea of studied was 1569 ha in 1937 90 × 90 m sample areas.
Fire severity
Unburned Low Moderate High
Ponderosa pine 186 160 178 102White fir-sugar pine 170 171 186 138Red fir 166 175 186 119
sample areas. We then eliminated any sample area found to be on theedge of the acquisition and therefore had an area b0.81 ha. These criteriaresulted in 1937 sample areas covering a cumulative 1569 ha.
2.6. Forest structure analysis
We identified contiguous areas of the canopy surfacemodel classifiedinto the same stratum as individual patches corresponding to specificopenings or canopy clumps. This resulted in sample areas containingdiscrete patches that could be correlated with tree clumps of differentheights and openings visible in the LiDAR point cloud and canopy surfacemodel (Fig. 4). We measured the cumulative area of each class by patchsize. We analyzed the canopy clump area within each height stratum asthe proportion of total canopy area for its sample area.
We analyzed the spatial pattern of each sample area individuallyusing landscape ecology metrics in the R SDMTools (VanDerWal,
ugar pine Red fir
Height Strata
<2 m Gap/opening
2-8 m Canopy clump
8-16 m Canopy clump
16-32 m Canopy clump
>32 m Canopy clump
ples illustrate common spatial patterns but not the range of variation found for each

94 V.R. Kane et al. / Remote Sensing of Environment 151 (2014) 89–101
Falconi, Januchowski, Shoo, & Storlie, 2012) (http://cran.r-project.org/web/packages/SDMTools/index.html) package and the Fragstatssoftware package (McGarigal & Marks, 1995) (http://www.umass.edu/landeco/research/fragstats/fragstats.html). We calculated areafor each stratum both by patch and by class, and used the aggregationand clumpiness indices to assess the dispersion pattern of clumps andopenings.
For all canopy N2 m, we calculated two canopy measurements foreach height stratum: canopy cover and canopy area. We calculated can-opy cover by dividing the number of returns in each height strata by thenumber of returns in that stratum and all lower strata. We calculatedcanopy area as the proportion of 1 m canopy surface model grid cellsin each height strata divided by the area of each sample area. Canopycover uses the total vertical distribution of returns as an estimate ofthe canopy profile and estimates the presence of canopy at all heightswhether or not there is foliage above a given height. Canopy area mea-sures only the top of canopy foliage in each 1 m grid cell and ignoreslower foliage and thereforemeasures the area of dominant tree clumps.Even when foliage is found at a single narrow height, the two measure-mentsmay produce different values. A single spray of needlesmay causea return to be measured within a 1 m grid cell even though most of thearea of that grid cell would be empty. In this case, canopy cover wouldreport a low value while canopy area would report an area of 1 m2.
3. Results
As fire severity increased, the total area in canopy decreased whilethe number of clumps increased, indicating progressive canopy frag-mentation into smaller clumps (Fig. 5 and Supplement Fig. S3). As can-opy area decreased, the dominant pattern transitioned from a single,nearly continuous clump, to a small number of clumps, and then tomany clumps (Fig. 1). The proportion of area in openings ≥0.3 ha in-creased rapidly with increasing fire severity (Fig. 6) with a correspond-ing decrease in the area of canopy. Once the area in openings was
Fig. 5.Heterogeneity in total opening area and tall-tree (N32 m) patch areas by fire severity andtotal canopy area in tall tree (N32 m) clumps (y axis).Wider point dispersal indicates a greater rfire severity resulted in a greater range of opening area for ponderosa pine andwhite fir-sugar pon the range of sample area proportions in tall tree clumps for either ponderosa pine orwhite firchange in heterogeneity for other canopy strata.
greater than approximately 40% of a sample area, almost all openingarea was in openings ≥0.3 ha. While the absolute area of all canopyand for each canopy stratumdecreasedwith increasing fire, the propor-tion of canopy area for strata N8 m relative to remaining absolutecanopy area was similar to the proportions for unburned sample areas(Fig. 7).
For all canopy N2 m, both canopy cover and canopy area generallydeclined with increasing fire severity (Supplement Table S4). For the 2to 8 m stratum, however, canopy cover showed a steep decline with in-creasing fire severity, but canopy area either increased or decreased at aslower rate at moderate and high severities (Fig. 8).
Asfire severity increased, the total area in canopy decreasedwhile thenumber of clumps increased indicating progressive fragmentation ofremaining canopy into smaller clumps (Fig. 9). Aggregation values mea-sured across all patches in the sample areas (landscape aggregation) hadvalues of 73 to 87%, indicating anoverall tendency towards aggregationofopenings and canopy patches in larger patches rather than dispersal ofsmall patches across the sample areas (Fig. 10). All canopy patches andopenings had inverse aggregation relationships with the former decreas-ingwith increasedfire severity and the latter increasing. The 2 to 8 mand8 to 16 m canopy strata had the lowest aggregation values. The 16 to32 m and N32 m strata had the highest aggregation values in thatorder. Increasingfire severitywas associatedwith little change inmedianaggregation values for the canopy strata, although the range of valuesincreased. The Fragstats CLUMPY index results showed similar patterns(data not shown), indicating that the aggregation patterns were distinctfrom those expected from a random pattern.
4. Discussion
The LiDAR data revealed three spatial structures, canopy-gap, clump-open, and open (Fig. 1) that differed in the proportion of canopy andopening and in spatial arrangement. We found that fire increased openarea and number of tree clumps, but the relationship between fire
forest type with the proportion of the total area in openings (x axis) and the proportion ofange of structural heterogeneity for a givenfire severity-forest type combination. Increasedine forests but resulted in a narrow range for red fir. Increased fire severity had little effect-sugar pine forests but resulted in a narrower range for red fir. Supplemental Fig. S3 shows

Fig. 6. Proportion of openings that are≥0.3 ha (needed for regeneration of tree species requiring high sunlight exposure) plotted against proportion of the total sample area in openings byfireseverity and forest type. The percentage of sample areas where there are no gaps ≥0.3 (‘N 0=’), and the percentage of sample areas where all openings are ≥0.3 ha (‘N 1=’) are shown.
95V.R. Kane et al. / Remote Sensing of Environment 151 (2014) 89–101
severity and forest changewasnot linear. A givenfire severity could resultin a range of spatial structures. In general, unburned forests and high-severity patches had the least variation in spatial structures whilelow- and moderate-severity patches had the greatest variation. Therange of variation for a given fire severity was specific to each foresttype.
Fires ‘thinned from below’ to remove large proportions of cover inthe 2 to 8 m strata, a trend that was partially masked by extensive
Fig. 7. Change in proportion of canopy area by forest type and fire severity. As fire severity incremaining canopy area, the proportion of area in different strata showed little change (b), indicreased for two forest types with increasing fire severity, the method for calculating proportioFig. 8 for changes in the 2 to 8 m canopy stratum.
regeneration. In strata N8 m, however,fire acted in aheterogeneousman-ner, leaving multistory clumps in some places and removing them inothers. The presence of large openings (N0.3 ha) increased rapidly withloss of canopy area indicating that openings were created in an aggregat-ed pattern.
Kane et al. (2013) performed complementary analyses that focusedon fire effects on canopy profiles using the same LiDAR data set as thisstudy. They found clear signs of low- andmoderate-severity fire thinning
reases, the absolute area of canopy cover decreased in all strata (a). However, within thecating that fire left multistory tree clumps. Because the absolute area of 2–8 m canopy in-n of canopy area (b) was calculated using canopy area minus the 2–8 m canopy area. See

Fig. 8. Change in proportion of canopy area and canopy cover by forest type and fire severity in the 2 to 8 m stratum. Canopy cover trends suggest ‘thinning from below’ in this stratum asfire removes smaller trees under larger trees and standalone tree clumps in this stratum. Increases in canopy areawith increasedfire severity suggests establishment of new tree clumps inthis stratum through regeneration. Canopy cover uses the total vertical distribution of returns as an estimate of the canopy profile and estimates the presence of canopy at all heightswhether or not there is foliage above a given height. Canopy area measures only the top of canopy foliage in each 1 m grid cell and ignores lower foliage and therefore measures thearea of top-of-canopy trees within clumps.
96 V.R. Kane et al. / Remote Sensing of Environment 151 (2014) 89–101
from below with resulting canopy profiles transitioning from multiplecanopy layers to single overstory canopies. They found that burnedpatches that showed too little change to be distinguished from unburned(the RdNBR no detectable change fire severity class) or with low severityshowed clear structural differences compared to unburned patches. Thiseffect was unexpected given the previous work characterizing fire sever-ity and correlating it with Landsat measurements (Miller & Thode, 2007;Thode, 2005; Thode et al., 2011).
4.1. Landsat and LiDAR to study forest response to fire
Kane et al. (2013) were the first to use LiDAR data with Landsat-derivedmeasures of fire severity tomeasure the impact of fire on forest
Fig. 9. Fragmentation of canopy clumpswithin sample areas. Asfire severity increased, the totalprogressive fragmentation of remaining canopy into smaller clumps. Each point represents onclump count was calculated by determining the minimum number of clumps within each samplefirst). The percentage of sample areas where all canopy in a single continuous clump (‘N 1=’), u
structure over a large area. That work and this study confirm the utilityof Landsat fire severity estimates to measure fire as an ecological processand the high resolution of LiDAR data to measure the structural changeresulting from that process. The wide variation in spatial structuresfoundwithin low- andmoderate-severity fires shows the value ofmon-itoring actual changes from fire with LiDAR rather than depending onmodels to predict changes.
We were able to use simple LiDARmeasures of top of canopy heightand canopy cover and area to study the complex process of forestrestructuring with increasing fire severity. Our study area, like manyLiDAR forest acquisitions, lacked concurrent field data to use ininterpreting the LiDAR measurements. However, we believe that wehave demonstrated that using simple, well proven LiDARmeasurements
area in canopy (x axis) decreasedwhile the number of clumps (y axis) increased indicatinge sample area. To exclude small clumps that made little contribution to total canopy area,area required to account for 75% of canopy area with clumps added in order of size (largestsually percolated with enclosed gaps, is shown.
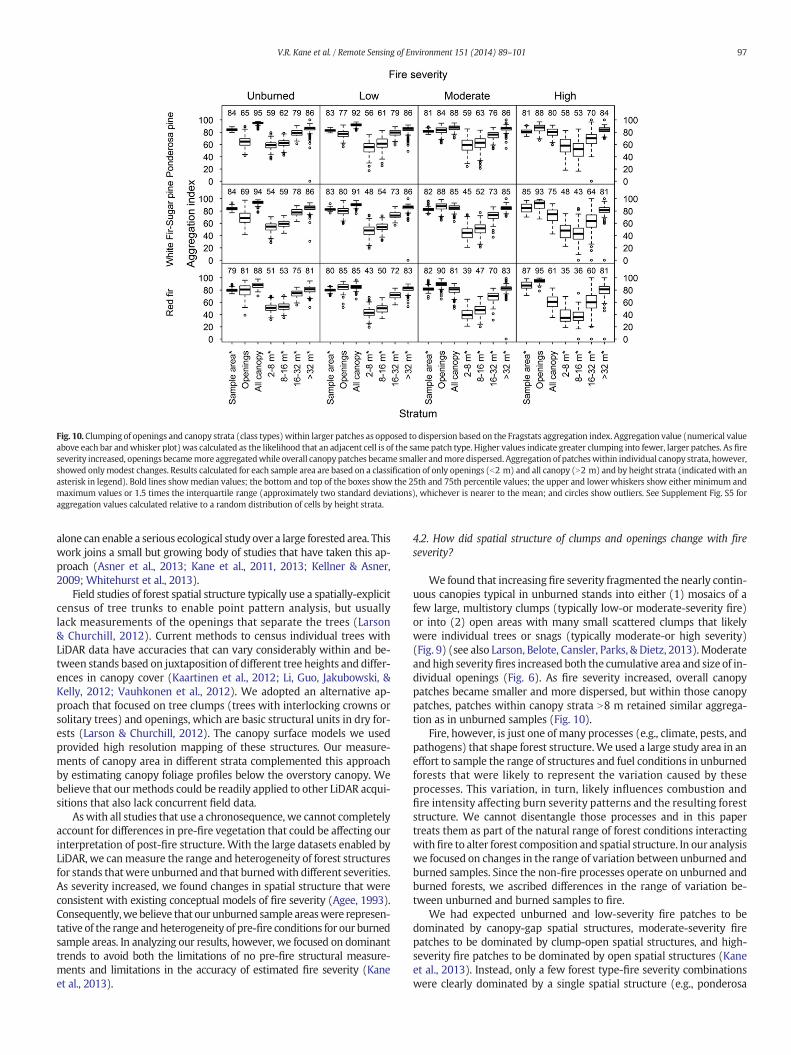
Fig. 10. Clumping of openings and canopy strata (class types)within larger patches as opposed to dispersion based on the Fragstats aggregation index. Aggregation value (numerical valueabove each bar andwhisker plot) was calculated as the likelihood that an adjacent cell is of the same patch type. Higher values indicate greater clumping into fewer, larger patches. As fireseverity increased, openings becamemore aggregatedwhile overall canopy patches became smaller andmore dispersed. Aggregation of patcheswithin individual canopy strata, however,showed onlymodest changes. Results calculated for each sample area are based on a classification of only openings (b2 m) and all canopy (N2 m) and by height strata (indicatedwith anasterisk in legend). Bold lines showmedian values; the bottom and top of the boxes show the 25th and 75th percentile values; the upper and lower whiskers show either minimum andmaximum values or 1.5 times the interquartile range (approximately two standard deviations), whichever is nearer to the mean; and circles show outliers. See Supplement Fig. S5 foraggregation values calculated relative to a random distribution of cells by height strata.
97V.R. Kane et al. / Remote Sensing of Environment 151 (2014) 89–101
alone can enable a serious ecological study over a large forested area. Thiswork joins a small but growing body of studies that have taken this ap-proach (Asner et al., 2013; Kane et al., 2011, 2013; Kellner & Asner,2009; Whitehurst et al., 2013).
Field studies of forest spatial structure typically use a spatially-explicitcensus of tree trunks to enable point pattern analysis, but usuallylack measurements of the openings that separate the trees (Larson& Churchill, 2012). Current methods to census individual trees withLiDAR data have accuracies that can vary considerably within and be-tween stands based on juxtaposition of different tree heights and differ-ences in canopy cover (Kaartinen et al., 2012; Li, Guo, Jakubowski, &Kelly, 2012; Vauhkonen et al., 2012). We adopted an alternative ap-proach that focused on tree clumps (trees with interlocking crowns orsolitary trees) and openings, which are basic structural units in dry for-ests (Larson & Churchill, 2012). The canopy surface models we usedprovided high resolution mapping of these structures. Our measure-ments of canopy area in different strata complemented this approachby estimating canopy foliage profiles below the overstory canopy. Webelieve that ourmethods could be readily applied to other LiDAR acqui-sitions that also lack concurrent field data.
Aswith all studies that use a chronosequence, we cannot completelyaccount for differences in pre-fire vegetation that could be affecting ourinterpretation of post-fire structure. With the large datasets enabled byLiDAR, we canmeasure the range and heterogeneity of forest structuresfor stands thatwere unburned and that burnedwith different severities.As severity increased, we found changes in spatial structure that wereconsistent with existing conceptual models of fire severity (Agee, 1993).Consequently,webelieve that our unburned sample areaswere represen-tative of the range andheterogeneity of pre-fire conditions for our burnedsample areas. In analyzing our results, however, we focused on dominanttrends to avoid both the limitations of no pre-fire structural measure-ments and limitations in the accuracy of estimated fire severity (Kaneet al., 2013).
4.2. How did spatial structure of clumps and openings change with fireseverity?
We found that increasing fire severity fragmented the nearly contin-uous canopies typical in unburned stands into either (1) mosaics of afew large, multistory clumps (typically low-or moderate-severity fire)or into (2) open areas with many small scattered clumps that likelywere individual trees or snags (typically moderate-or high severity)(Fig. 9) (see also Larson, Belote, Cansler, Parks, & Dietz, 2013). Moderateand high severity fires increased both the cumulative area and size of in-dividual openings (Fig. 6). As fire severity increased, overall canopypatches became smaller and more dispersed, but within those canopypatches, patches within canopy strata N8 m retained similar aggrega-tion as in unburned samples (Fig. 10).
Fire, however, is just one of many processes (e.g., climate, pests, andpathogens) that shape forest structure.We used a large study area in aneffort to sample the range of structures and fuel conditions in unburnedforests that were likely to represent the variation caused by theseprocesses. This variation, in turn, likely influences combustion andfire intensity affecting burn severity patterns and the resulting foreststructure. We cannot disentangle those processes and in this papertreats them as part of the natural range of forest conditions interactingwithfire to alter forest composition and spatial structure. In our analysiswe focused on changes in the range of variation between unburned andburned samples. Since the non-fire processes operate on unburned andburned forests, we ascribed differences in the range of variation be-tween unburned and burned samples to fire.
We had expected unburned and low-severity fire patches to bedominated by canopy-gap spatial structures, moderate-severity firepatches to be dominated by clump-open spatial structures, and high-severity fire patches to be dominated by open spatial structures (Kaneet al., 2013). Instead, only a few forest type-fire severity combinationswere clearly dominated by a single spatial structure (e.g., ponderosa

98 V.R. Kane et al. / Remote Sensing of Environment 151 (2014) 89–101
pine and white fir-sugar pine unburned patches (canopy-gap) and redfir high-severity patches (open)). Low- and moderate-severity firesresulted in an increase in the heterogeneity of spatial structures presentcompared to unburned and high-severity fire patches.
The key changes in spatial structure occurred with thresholds oftotal canopy area (Fig. 9). With decreasing canopy area, the spatialstructure transitioned from single large clumps with enclosed openings(N65% canopy area), to two to five larger clumps (45 to 65% canopyarea), then to five to ten smaller clumps (25 to 45% canopy area), andthen to tens of very small clumps (b25% canopy area). These resultsare in contrast to possible alternative patterns. For example, sampleareas with 20% canopy area theoretically could have some areas with asingle large clump, some with two to five clumps, and some with tensof clumps. Instead, sample areas with ~20% canopy area always had atleast five and usually tens of clumps. We observed this relationship be-tween canopy area and clump number across forest types and fire sever-ities. This suggests that canopy area-clumpnumber thresholdsmay resultfrom fire behavior at local scales, a hypothesis worth examining in futurestudies.
We found that the larger canopy clumps in our study areawere com-plexes of smaller clumps in different height strata, resulting in spatiallysegregated multistory clumps that likely indicate multiple tree cohortsgrowing in close proximity. This is evident from visual inspection ofsite data (Figs. 1 and 4) and from the distribution of clump sizes and cu-mulative strata area with no stratum predominating (Fig. 5 and Supple-ment Fig. S3). Clump complexes appear to be the dominant structuralelement for unburned, low, and moderate-fire severity sample areas.They are less apparent for high-severity sample areas where individualtrees and patches of early regeneration are more common. Prior to fireexclusion, the extent to which clumps were predominantly even-agedand single story versusmulti-aged andmultistory is poorly understood.Both have been found in reconstruction studies (Cooper, 1960; SánchezMeador et al., 2009; White, 1985).
Each forest type showed a different rate of changewith increasing fireseverity and range of spatial structures (Fig. 11). Unburned ponderosapine patches were dominated by the canopy-gap structure.With increas-ing fire severity, all three spatial patterns were common, but the openstructure never became dominant evenwith high-severityfire. Converse-ly, unburned red fir patches had all three spatial structures, but increasing
Greater
>>Heter> Homogeneity
Canopy-gapCanoClum
O
Unburned LowPonderosa
Pine
Unburned LowWhite fir-Sugar pine
UnburnedRed fir
Fig. 11.Changes in spatial structure comparing unburned (outside allfire perimeters since 1930) awas consistent across forest types, each forest type was unique in the range of structures found aleach forest type line up with the characteristic canopy and opening structures shown below the
fire severity increased the proportion of the open structure, which be-came strongly dominant with high-severity fire. White fir-sugar pine for-ests showed the widest range of structure types, spanning from canopy-gap for unburned and low severity, to a mixture of the three withmoderate-severity fire, and then to open with high-severity fire. Thesedifferences show that the interaction of fire with forests varies betweenforest types.
The creation of openings N0.3 ha has been amanagement goal to pro-vide locations for the regeneration of shade-intolerant,fire-resilient pinesthat require high light levels. These larger openings are an importantstructure because they provide sufficient understory light to favor pineregeneration (Bigelow, North, & Salk, 2011; York, Heald, Battles, & York,2004) and sustain shrub cover, preferred habitat for several bird(e.g., Greenlaw, 1996; Raphael, Morrison, & Yoderwilliams, 1987)and small mammal species (e.g., Coppeto, Kelt, Van Vuren, Wilson, &Bigelow, 2006; Roberts, van Wagtendonk, Kelt, Miles, & Lutz, 2008).Our data show that openings this size are uncommon when the totalopening area is less than 40%, but common when total opening area isgreater than 40% (Fig. 6). While we did not statistically examine open-ing shapes, our visual inspection of canopies suggests that each of thethree spatial patterns has distinct opening shapes. In canopy-gap stands,openings tend to be more compact and circular; in clump-open stands,openings tend to be more sinuous and amorphous and interspersedwith canopy clumps; and in open stands, openings tend to be a continu-ous open area with scattered enclosed individual trees and tree clumps.
We were surprised by the post-fire decrease in taller trees in theN32 m stratum that was similar to the loss of shorter trees in the 8 to16 and 16 to 32 m strata (this patternwas also found in the N48 m stra-tum; data not shown). Large trees have thicker bark and generally agreater height to their crown base. We assumed that this would implythat the taller trees should be more resistant to low-and moderate-severity fire. Decades of fire suppression exclusion may have createdfuel ladders that carried fire into the crown of the taller trees or allowedlitter and duff to accumulate around the boles of trees with fire subse-quently girdling the trees from long, hot residence times. The patternof loss for the N32 m stratum was greater for ponderosa pine than forthe other two forest types (see Kane et al. (2013) for a discussion of pos-sible explanations for the loss of very tall trees in ponderosa pineforests).
Fire Severity
ogeneity >Homogeneity
Openpy-gapp-openpen
Moderate High
Moderate High
Low Moderate High
nd burned areaswith increasingfire severity.While the direction of changewithfire severityong this general continuum. Forest types are shown above the line. Fire severities shown forarrow for that forest type and fire severity.

99V.R. Kane et al. / Remote Sensing of Environment 151 (2014) 89–101
4.3. Which models of fire behavior best explain structural changes?
We hypothesized that reintroducing fire to forests that had experi-enced decades of fire exclusion might thin from below, remove treesof all heights in a patchy pattern, or remove trees of all heights in a dis-persed pattern. We found evidence for all three patterns, but for differ-ent structures and/or fire severities.
In the 2 to 8 m stratum, the steep loss of canopy cover (total verticalprofile of LiDAR returns as an estimate of the canopy profile) with in-creasing fire severity is evidence that fire removed a considerable pro-portion of the smallest trees and/or lower foliage on taller trees acrossour sample areas. This is consistent with the widespread observationthat fire thins from below by removing smaller trees (Kane et al., 2013;Nesmith, Caprio, Pfaff, McGinnis, & Keeley, 2011). The data suggest thatfire also thinned from below for the 8 to 16 m stratum, but the trendswere not as conclusive. On the other hand, we interpret the increase orslower decline of canopy area (only the top of the canopy foliage ineach 1 mgrid cell, ignoring lower foliage) in the 2 to 8 m stratumwith in-creasingfire severity as evidence of regeneration followingfire, consistentwith several field studies (Moghaddas, York, & Stephens, 2008; Scholl &Taylor, 2006; Zald, Gray, North, & Kern, 2008).
We found strong evidence for fire acting in a patchy, aggregated pat-tern that removed trees of all heights. For each stratum N8 m, the absolutearea of canopy decreasedwith increasing fire severity while the propor-tion of strata within the remaining canopy area showed only smallchanges from the unburned proportions (Table 2). We interpret thisas evidence of fire removing trees of all heights in a patchy patternthat left othermultistory clump complexes intact other than the loss of fo-liage in the 2 to 8 m stratum. Visual inspection of low- and moderate-severity sample areas shows that post-fire canopy clumpswere organizedin multistory clump complexes (Figs. 1 and 4). Similarly, median valuesfor aggregationby canopy clumpstrata showed little changewith increas-ing fire severity (Fig. 10). These two lines of evidence suggest that the in-ternal spatial arrangement of surviving clump complexes changed littlefollowing fire.
We also found that fire could remove trees in all strata in a dispersedpattern. High fire severity tended to produce open areas with canopiesin tens of clumps, many of which represented individual trees or dis-persed regeneration.
4.4. Management implications
The spatial patterns following a single fire in our study area are farmore complex than patterns created by commonly used commercialthinning and fuel reduction treatments, such as basal area or spacing-based prescriptions (Churchill et al., 2013). Similarly, burn intensityand tree mortality are generally kept low in prescribed fire treatments,resulting in only thinning from below and little mortality in mediumand large size classes (Schwilk et al., 2009; Stephens et al., 2009). It isunclear whether currentmechanical restoration treatments that explic-itly seek to restore reference spatial patterns are effective at creating thelevel of variation in vertical and horizontal structure found in our study(Churchill et al., 2013;Waltz, Fule, Covington, &Moore, 2003). The prac-tice of leaving untreated patches with multistory clumps of trees(North, Stine, O'Hara, Zielinski, & Stephens, 2009), typically for wildlifehabitat, is consistent with the presence of multistory clumps post-fire.However, it is not clear that these restoration treatments leave similarproportions in openings. Our results show that a third to half ofareas would need to be in openings to replicate conditions for low-and moderate-severity fire, respectively, in the white fir-sugar pinetype. Periodic monitoring of treatments with pre-treatment and post-treatment LiDAR will be useful to evaluate restoration treatments.
For large tree retention across the landscape, an important manage-ment implication emerges from our study. Patches of high-severity firein red fir and white fir-sugar pine forests reduce the number of clumpscontaining taller and, therefore, presumably larger, trees to numbers
lower than pre-Euro-American conditions. In landscapes where high-severity fire patches are prevalent, large-diameter trees have declined(Lutz, van Wagtendonk and Franklin, 2009). However, in landscapeswhere fire remains low- ormoderate-severity, large-diameter tree den-sity is equivalent to pre-Euro-American conditions (Collins et al., 2011;Scholl & Taylor, 2010). Therefore, avoiding large areas of high-severityfire in these forest types through a combination of prescribed fire orlightning-ignited fires under cooler conditions will help retain largetrees (North et al., 2012). Patches of high-severity fire in ponderosapine forests did not proportionately reduce tall tree density as muchas other forest types we examined. Taller ponderosa pine tree clumpsmay be composed of one to a few individual trees that have experiencedmany fires, or those tree clumps occur in a landscapewithmore naturalbarriers to fire spread (Stephens & Collins, 2004; Taylor, 2010).
Our results and those in Kane et al. (2013) suggest that low- tomoderate-severity fires best replicate the clump-opening patterns thatwere common in dry forests with natural, frequent fire regimes (Larson&Churchill, 2012). Basedonour results,managersmightwant to considerthe following goals for their restorations: 1) reduce total canopy area overproject areas by breaking up large areas of canopy leaving variable-sizedtree clumps and scattered large individual trees; 2) create a range ofopening sizes and shapes, including ~50% of the open area in gapsN0.3 ha; 3) createmultistory clumps (all trees N2 m) in addition to singlestory clumps; 4) retain historic densities of large trees; and 5) vary treat-ments to include canopy-gap, clump-open, and openmosaics across pro-ject areas to mimic the range of patterns found in our study.
Our results also suggest that low- andmoderate-severityfires gener-ally increase heterogeneity, but optimal forest conditions are producedby different severities for specific forest types. In remote areas awayfrom the wildland urban interface, land managers in the Sierra Nevadamight consider letting wildfire in ponderosa pine burn under higherpercentile weather conditions to achieve the higher severity level associ-atedwith the greatest heterogeneity. In contrast,moremoderateweatherconditions may be desirable for wildfire burning in red fir to producelow-severity burn conditions for optimal heterogeneity. Our analysisshows that fire produces highly heterogeneous forest conditions atmultiple scales, challenging managers to significantly vary treatmentsto increase forest complexity and possible resilience.
Acknowledgments
M. Meyer (USDA Forest Service) and two anonymous reviewersprovided valuable comments that improved the paper. We thankYosemite National Park for data and assistance with field logistics.Funding was provided by the National Park Service, Fire and AviationManagement Branch, Fuels and Ecology Program (Interagency Agree-ment F8803100015), and the U.S. Geological Survey Terrestrial, Fresh-water, and Marine Environments Program. Any use of trade, product,or firm names is for descriptive purposes only and does not imply en-dorsement by the US government.
Appendix A. Supplementary data
Supplementary data to this article can be found online at http://dx.doi.org/10.1016/j.rse.2013.07.041.
References
Agee, J. K. (1993). Fire ecology of Pacific Northwest forests. Washington DC: Island Press.Asner, G. P., Hughes, R. F., Mascaro, J., Uowolo, A. L., Knapp, D. E., Jacobson, J., et al. (2011).
High-resolution carbon mapping on the million-hectare Island of Hawaii. Frontiers inEcology and the Environment, 9, 434–439.
Asner, G., Kellner, J., Kennedy-Bowdoin, T., Knapp, D., Anderson, C., & Martin, R. (2013).Forest canopy gap distributions in the Southern Peruvian Amazon. Plos One, 8(4),e60875.
Beaty, R. M., & Taylor, A. H. (2007). Fire disturbance and forest structure in old-growthmixed conifer forests in the northern Sierra Nevada, California. Journal of VegetationScience, 18, 879–890.

100 V.R. Kane et al. / Remote Sensing of Environment 151 (2014) 89–101
Bigelow, S. W., North, M. P., & Salk, C. F. (2011). Using light to predict fuels-reduction andgroup-selection effects on succession in Sierranmixed-conifer forest. Canadian Journal ofForest Research, 41, 2051–2063.
Boyden, S., Binkley, D., & Shepperd, W. (2005). Spatial and temporal patterns in structure,regeneration, and mortality of an old-growth ponderosa pine forest in the ColoradoFront Range. Forest Ecology and Management, 219, 43–55.
Caprio, A., & Lineback, P. (1997). Pre-twentieth century fire history of Sequoia and KingsCanyon national parks: A review and evaluation of our knowledge. In N. G. Sugihara,M.A. Morales, & T. J. Morales (Eds.), Proceedings of the Conference on Fire in CaliforniaEcosystems: Integrating Ecology, Prevention, and Management. Association for FireEcology Miscellaneous Publication, 1. (pp. 180–199). Sacramento, California, USA: As-sociation for Fire Ecology.
Caprio, A.C., & Swetnam, T. W. (1995). Historic fire regimes along an elevational gradienton the west slope of the Sierra Nevada, California. In J. K. Brown, R. W. Mutch, C. W.Spoon, & R. H. Wakimoto (Eds.), Proceedings of the Symposium on Fire in Wildernessand Park Management. USDA Forest Service General Technical Report INT-GTR-320.Ogden, Utah, USA: Intermountain Research Station.
Churchill, D. J., Larson, A. J., Dahlgreen, M. C., Franklin, J. F., Hessburg, P. F., & Lutz, J. A.(2013). Restoring forest resilience: From reference spatial patterns to silviculturalprescriptions and monitoring. Forest Ecology and Management, 291, 442–457.
Collins, B.M., Everett, R. G., & Stephens, S. L. (2011). Impacts of fire exclusion and recentmanaged fire on forest structure in old growth Sierra Nevada mixed-conifer forests.Ecosphere, 2, art51.
Collins, B.M., Kelly, M., vanWagtendonk, J. W., & Stephens, S. L. (2007). Spatial patterns oflarge natural fires in Sierra Nevada wilderness areas. Landscape Ecology, 22, 545–557.
Collins, B.M., & Stephens, S. L. (2007). Managing natural wildfires in Sierra Nevada wilder-ness areas. Frontiers in Ecology and the Environment, 5, 523–527.
Collins, B.M., & Stephens, S. L. (2010). Stand-replacing patches within a ‘mixed severity’fire regime: Quantitative characterization using recent fires in a long-established nat-ural fire area. Landscape Ecology, 25, 927–939.
Cooper, C. F. (1960). Changes in vegetation, structure, and growth of southwestern pineforests since white settlement. Ecological Monographs, 30, 130–164.
Coppeto, S. A., Kelt, D. A., Van Vuren, D. H., Wilson, J. A., & Bigelow, S. (2006). Habitat as-sociations of small mammals at two spatial scales in the northern Sierra Nevada.Journal of Mammalogy, 87, 402–413.
Dunning, D. (1923). Some results of cutting in the Sierra forests of California Bulletin No.1176. Washington D.C.: U.S. Department of Agriculture.
Eidenshink, J., Schwind, B., Brewer, K., Zhu, Z., Quayle, B., & Howard, S. (2007). A projectfor monitoring trends in burn severity. Fire Ecology, 3(1), 3–21.
Finney, M.A., Selia, R. C., McHugh, C. W., Ager, A. A., Bahro, B., & Agee, J. K. (2007). Simulationof long-term landscape-level fuel treatment effects on large wildfires. InternationalJournal of Wildland Fire, 16, 712–727.
Fites-Kaufman, J., Rundel, P., Stephenson, N., & Weixelman, D. A. (2007). Montane andsubalpine vegetation of the Sierra Nevada and Cascade Ranges. In M. Barbour, T.Keeler-Wolf, & A. A. Schoenherr (Eds.), Terrestrial vegetation of California(pp. 456–501). Berkeley, CA, USA: University of California Press.
Greenlaw, J. S. (1996). Spotted towhee (Pipilo maculatus). In A. Poole, & F. Gill (Eds.),The birds of North America, number 263. Washington, D.C.: American Ornitholo-gists' Union.
Harrod, R. J., McRae, B. H., & Hartl, W. E. (1999). Historical stand reconstruction in ponderosapine forests to guide silvicultural prescriptions. Forest Ecology and Management, 114,433–446.
Hessburg, P. F., Agee, J. K., & Franklin, J. F. (2005). Dry forests and wildland fires of the in-land Northwest USA: Contrasting the landscape ecology of the pre-settlement andmodem eras. Forest Ecology and Management, 211, 117–139.
Hudak, A. T., Evans, J. S., & Stuart Smith, A.M. (2009). LiDAR utility for natural resourcemanagers. Remote Sensing, 1, 934–951.
Hummel, S., Hudak, A. T., Uebler, E. H., Falkowski, M. J., & Megown, K. A. (2011). A com-parison of accuracy and cost of LiDAR versus stand exam data for landscape manage-ment on the Malheur National Forest. Journal of Forestry, 109, 267–273.
Kaartinen, H., Hyyppa, J., Yu, X. W., Vastaranta, M., Hyyppa, H., Kukko, A., et al. (2012). Aninternational comparison of individual tree detection and extraction using airbornelaser scanning. Remote Sensing, 4, 950–974.
Kane, V. R., Bakker, J.D., McGaughey, R. J., Lutz, J. A., Gersonde, R. F., & Franklin, J. F. (2010).Examining conifer canopy structural complexity across forest ages and elevationswith LiDAR data. Canadian Journal of Forest Research, 40, 774–787.
Kane, V. R., Gersonde, R. F., Lutz, J. A., McGaughey, R. J., Bakker, J.D., & Franklin, J. F. (2011).Patch dynamics and the development of structural and spatial heterogeneity in PacificNorthwest forests. Canadian Journal of Forest Research, 41, 2276–2291.
Kane, V. R., Lutz, J. A., Roberts, S. L., Smith, D. F., McGaughey, R. J., Povak, N. A., et al. (2013).Landscape-scale effects of fire severity onmixed-conifer and red fir forest structure inYosemite National Park. Forest Ecology and Management, 287, 17–31.
Kane, V. R., McGaughey, R. J., Bakker, J.D., Gersonde, R. F., Lutz, J. A., & Franklin, J. F. (2010).Comparisons between field- and LiDAR-based measures of stand structural complex-ity. Canadian Journal of Forest Research, 40, 761–773.
Keeler-Wolf, T., Moore, P. E., Reyes, E. T., Menke, J. M., Johnson, D. N., & Karavidas, D. L.(2012). Yosemite National Park vegetation classification and mapping project report.Natural Resource Report NPS/YOSE/NRTR-2012/598. Fort Collins, Colorado: National ParkService.
Kellner, J. R., & Asner, G. P. (2009). Convergent structural responses of tropical forests todiverse disturbance regimes. Ecology Letters, 12, 887–897.
Key, C. H. (2006). Ecological and sampling constraints on defining landscape fire severity.Fire Ecology, 2(2), 178–203.
Key, C. H., & Benson, N. C. (2006). Landscape assessment: Groundmeasure of severity, theComposite Burn Index, and remote sensing of severity, the Normalized Burn Ratio. InD. C. Lutes, R. E. Keane, J. F. Caratti, C. H. Key, N. C. Benson, S. Sutherland, & L. J. Gangi
(Eds.), FIREMON: fire effects monitoring and inventory system. Fort Collins, Colorado,USA: Rocky Mountain Research Station.
Kolden, C. A., Lutz, J. A., Key, C. H., Kane, J. T., & van Wagtendonk, J. W. (2012). Mappedversus actual burned area within wildfire perimeters: Characterizing the unburned.Forest Ecology and Management, 286, 38–47.
Larson, A. J., & Churchill, D. (2012). Tree spatial patterns in fire-frequent forests of westernNorth America, including mechanisms of pattern formation and implications for de-signing fuel reduction and restoration treatments. Forest Ecology and Management,267, 74–92.
Larson, A. J., Belote, R. T., Cansler, C. A., Parks, S. A., & Dietz, M. S. (2013). Latent resiliencein ponderosa pine forests: effect of resumed frequent fire. Ecological Applications, 23,1243–1249.
Lefsky, M.A., Cohen, W. B., Parker, G. G., & Harding, D. J. (2002). Lidar remote sensing forecosystem studies. Bioscience, 52, 19–30.
Lefsky, M.A., Hudak, A. T., Cohen, W. B., & Acker, S. A. (2005). Patterns of covariance be-tween forest stand and canopy structure in the Pacific Northwest. Remote Sensing ofEnvironment, 95, 517–531.
Li, W. K., Guo, Q. H., Jakubowski, M. K., & Kelly, M. (2012). A new method for segmentingindividual trees from the Lidar point cloud. Photogrammetric Engineering and RemoteSensing, 78, 75–84.
Lutz, J. A., Key, C. H., Kolden, C. A., Kane, J. T., & van Wagtendonk, J. W. (2011). Fire fre-quency, area burned, and severity: A quantitative approach to defining a normalfire year. Fire Ecology, 7(2), 51–65.
Lutz, J. A., Larson, A. J., Swanson, M. E., & Freund, J. A. (2012). Ecological importance oflarge-diameter trees in a temperate mixed-conifer forest. Plos One, 7.
Lutz, J. A., van Wagtendonk, J. W., & Franklin, J. F. (2009). Twentieth-century decline oflarge-diameter trees in Yosemite National Park, California, USA. Forest Ecology andManagement, 257, 2296–2307.
Lutz, J. A., van Wagtendonk, J. W., & Franklin, J. F. (2010). Climatic water deficit, tree spe-cies ranges, and climate change in Yosemite National Park. Journal of Biogeography,37, 936–950.
Lutz, J. A., van Wagtendonk, J. W., Thode, A. E., Miller, J.D., & Franklin, J. F. (2009). Climate,lightning ignitions, and fire severity in Yosemite National Park, California, USA.International Journal of Wildland Fire, 18, 765–774.
Lydersen, J., & North, M. (2012). Topographic variation in structure of mixed-conifer for-ests under an active-fire regime. Ecosystems, 15, 1134–1146.
McGarigal, K., & Marks, B. J. (1995). FRAGSTATS. Spatial analysis program for quantifyinglandscape structure. Portland, Oregon: USDA Forest Service, Pacific Northwest Re-search Station (http://www.umass.edu/landeco/research/fragstats/fragstats.html)
Miller, J. D., & Safford, H. (2012). Trends in wildfire severity: 1984 to 2010 in the SierraNevada,Modoc Plateau, andSouthernCascades, California, USA. Fire Ecology,8(3), 41–57.
Miller, J.D., Collins, B.M., Lutz, J. A., Stephens, S. L., van Wagtendonk, J. W., & Yasuda, D. A.(2012). Differences in wildfires among ecoregions and land management agencies inthe Sierra Nevada region, California. Ecosphere, 3, 80.
Miller, J.D., Safford, H. D., Crimmins, M., & Thode, A. E. (2009). Quantitative evidence forincreasing forest fire severity in the Sierra Nevada and Southern Cascade Mountains,California and Nevada, USA. Ecosystems, 12, 16–32.
Miller, J.D., & Thode, A. E. (2007). Quantifying burn severity in a heterogeneous landscapewith a relative version of the delta Normalized Burn Ratio (dNBR). Remote Sensing ofEnvironment, 109, 66–80.
Moghaddas, J. J., York, R. A., & Stephens, S. L. (2008). Initial response of conifer and Californiablack oak seedlings following fuel reduction activities in a Sierra Nevada mixed coniferforest. Forest Ecology and Management, 255, 3141–3150.
Nesmith, J. C. B., Caprio, A.C., Pfaff, A. H., McGinnis, T. W., & Keeley, J. E. (2011). A compar-ison of effects from prescribed fires and wildfires managed for resource objectives inSequoia and Kings Canyon National Parks. Forest Ecology and Management, 261,1275–1282.
North, M., Collins, B.M., & Stephens, S. (2012). Using fire to increase the scale, benefits,and future maintenance of fuels treatments. Journal of Forestry, 110, 392–401.
North, M., & Sherlock, J. (2012). Marking and assessing forest heterogeneity. In M. North(Ed.),Managing Sierra Nevada Forests, General Technical Report PSW-GTR-237. Albany,CA: USDA Forest Service, Pacific Southwest Research Station.
North, M., Stine, P., O'Hara, K., Zielinski, W., & Stephens, S. (2009). An ecosystem manage-ment strategy for Sierranmixed-conifer forests. PSW-GTR-220. : U.S.D.A Forest Service.
Parisien, M. -A., Miller, C., Ager, A. A., & Finney, M.A. (2010). Use of artificial landscapes toisolate controls on burn probability. Landscape Ecology, 25, 79–93.
Pimont, F., Dupuy, J. L., Linn, R. R., & Dupont, S. (2011). Impacts of tree canopy structure onwind flows and fire propagation simulated with FIRETEC. Annals of Forest Science, 68,523–530.
Raphael, M. G., Morrison, M. L., & Yoderwilliams, M. P. (1987). Breeding bird populationsduring 25 years of postfire succession in the Sierra-Nevada. Condor, 89, 614–626.
Reutebuch, S. E., Andersen, H. E., & McGaughey, R. J. (2005). Light detection and ranging(LIDAR): An emerging tool for multiple resource inventory. Journal of Forestry, 103,286–292.
Roberts, S. L., van Wagtendonk, J. W., Kelt, D. A., Miles, A. K., & Lutz, J. A. (2008). Modelingthe effects of fire severity and spatial complexity on small mammals in Yosemite Na-tional Park, California. Fire Ecology, 4(2), 83–104.
Sánchez Meador, A. J., Moore, M. M., Bakker, J.D., & Parysow, P. F. (2009). 108 years ofchange in spatial pattern following selective harvest of a Pinus ponderosa stand innorthern Arizona, USA. Journal of Vegetation Science, 20, 79–90.
Schoennagel, T., & Nelson, C. R. (2011). Restoration relevance of recent National Fire Plantreatments in forests of the western United States. Frontiers in Ecology and theEnvironment, 9, 271–277.
Scholl, A. E., & Taylor, A. H. (2006). Regeneration patterns in old-growth red fir-westemwhite pine forests in the northern Sierra Nevada, Lake Tahoe, USA. Forest Ecologyand Management, 235, 143–154.

101V.R. Kane et al. / Remote Sensing of Environment 151 (2014) 89–101
Scholl, A. E., & Taylor, A. H. (2010). Fire regimes, forest change, and self-organization in anold-growthmixed-conifer forest, Yosemite National Park, USA. Ecological Applications,20, 362–380.
Schwilk, D.W., Keeley, J. E., Knapp, E. E., McIver, J., Bailey, J.D., Fettig, C. J., et al. (2009). Thenational fire and fire surrogate study: Effects of fuel reduction methods on forest veg-etation structure and fuels. Ecological Applications, 19, 285–304.
Show, S. B., & Kotok, E. I. (1924). The role of fire in the California pine forests Bulletin No.1294. In U.S.D.o. Agriculture (Ed.), Washington D.C.: U.S. Department of Agriculture.
Stephens, S. L., & Collins, B.M. (2004). Fire regimes of mixed conifer forests in thenorth-central Sierra Nevada at multiple spatial scales. Northwest Science, 78,12–23.
Stephens, S. L., Fry, D. L., & Franco-Vizcaino, E. (2008). Wildfire and spatial patterns in for-ests in northwestern Mexico: The United States wishes it had similar fire problems.Ecology and Society, 13.
Stephens, S. L., & Gill, S. J. (2005). Forest structure and mortality in an old-growth Jeffreypine-mixed conifer forest in north-western Mexico. Forest Ecology and Management,205, 15–28.
Stephens, S. L., Moghaddas, J. J., Edminster, C., Fiedler, C. E., Haase, S., Harrington, M., et al.(2009). Fire treatment effects on vegetation structure, fuels, and potential fire sever-ity in western US forests. Ecological Applications, 19, 305–320.
Taylor, A. H. (2010). Fire disturbance and forest structure in an old-growth Pinusponderosa forest, southern Cascades, USA. Journal of Vegetation Science, 21,561–572.
Thaxton, J. M., & Platt, W. J. (2006). Small-scale fuel variation alters fire intensity andshrub abundance in a pine savanna. Ecology, 87, 1331–1337.
Thode, A. E. (2005). Quantifying the fire regime attributes of severity and spatial complexityusing field and imagery data. Davis, CA: University of California.
Thode, A. E., van Wagtendonk, J. W., Miller, J.D., & Quinn, J. F. (2011). Quantifying the fireregime distributions for severity in Yosemite National Park, California, USA.International Journal of Wildland Fire, 20, 223–239.
van Wagtendonk, J. W., & Fites-Kaufman, J. (2006). Sierra Nevada bioregion. In N. G.Sugihara, J. W. van Wagtendonk, K. E. Shaffer, J. Fites-Kaufman, & A. E. Thode (Eds.),
Fire in California's ecosystems (pp. 264–294). Berkely, CA, USA: University of CaliforniaPress.
van Wagtendonk, J. W., & Lutz, J. A. (2007). Fire regime attributes of wildland fires inYosemite National Park, USA. Fire Ecology, 3(2), 34–52.
van Wagtendonk, J. W., van Wagtendonk, K. A., Meyer, J. B., & Painter, K. (2002). The useof geographic information for fire management in Yosemite National Park. GeorgeWright Forum, 19, 19–39.
VanDerWal, J., Falconi, L., Januchowski, S., Shoo, L., & Storlie, C. (2012). SDMTools: Speciesdistribution modelling tools: Tools for processing data associated with species distri-bution modelling exercises. R package version 1.1-13. http://CRAN.R-project.org/package=SDMTools
Vauhkonen, J., Ene, L., Gupta, S., Heinzel, J., Holmgren, J., Pitkanen, J., et al. (2012). Com-parative testing of single-tree detection algorithms under different types of forest.Forestry, 85, 27–40.
Walker, R. E. (2000). Investigations in vegetation map rectification, and the remotely senseddetection and measurement of natural vegetation changes. Santa Barbara, CA: Universi-ty of California Santa Barbara.
Waltz, A. E. M., Fule, P. Z., Covington, W. W., & Moore, M. M. (2003). Diversity in ponderosapine forest structure following ecological restoration treatments. Forest Science, 49,885–900.
White, A. S. (1985). Presettlement regeneration patterns in a southwestern ponderosapine stand. Ecology, 66, 589–594.
Whitehurst, A., Swatantran, A., Blair, J., Hofton, M., & Dubayah, R. (2013). Characterizationof canopy layering in forested ecosystems using full waveform Lidar. Remote Sensing,5, 2014–2036.
Wieslander, A. E. (1935). A vegetation type map of California. Madrono, 3, 140–144.York, R. A., Heald, R. C., Battles, J. J., & York, J.D. (2004). Group selection management in
conifer forests: Relationships between opening size and tree growth. CanadianJournal of Forest Research, 34, 630–641.
Zald, H. S. J., Gray, A. N., North, M., & Kern, R. A. (2008). Initial tree regeneration responsesto fire and thinning treatments in a Sierra Nevada mixed-conifer forest, USA. ForestEcology and Management, 256, 168–179.