removal of methylene blue from industrial wastewater in ... omar...jamal omar mohamad amarah...
TRANSCRIPT

An-Najah National University
Faculty of Graduate Studies
Removal of Methylene Blue from Industrial
Wastewater in Palestine Using Polysiloxane Surface
Modified with Bipyrazolic Tripodal Receptor
By
Jamal Omar Mohamad Amarah
Supervisor
Prof. Shehdeh Jodeh
This Thesis is Submitted in Partial Fulfillment of the Requirements for
the Degree of Master of Chemistry, Faculty of Graduate Studies, An-
Najah National University, Nablus, Palestine.
2015

II
Removal of Methylene Blue from Industrial
Wastewater in Palestine Using Polysiloxane Surface
Modified with Bipyrazolic Tripodal Receptor
by
Jamal Omar Mohamad Amarah
This Thesis was defended successfully on 31/8/2015 and approved by:
Defense Committee Members Signature
Prof. Shehdeh Jodeh / Supervisor ………………………………..
Dr. Sobhi Samhan / External Examiner ………………………………..
Prof. Mohammed A. Al-Nuri/ Internal Examiner ………………………………..

III
Dedication
Every challenging work needs self-efforts as well as encouragements of
others especially those who are very close to our heart.
To my father, Brother Mohammed and my dear family whose love and
encouragement make me able to get success and honor. My great mother
(Allah mercy her soul) who sacrificed for our sake.
To all of them I dedicate my modest efforts.

IV
Acknowledgements
Beginnings thank Almighty Allah who gave me the ability to
complete this work. I would like to thank my supervisor, Prof. Dr. Shehdeh
Jodeh for all his directing, supporting and advice in my research work.
Also I would like to express my sincere gratitude to Prof.Dr. Ismail Warad
for all his support and his help in performing SEM Analysis of the
Modified Polysiloxane at university of Mysore, India . I am very happy to
extend a warm thank to University of Mysore, one of India’s premier
institutions of higher education. Our thanks go as well to Dr. Smaail Radi
for his sound advice in some aspects of my work and also for Dr. Raed
Alkowni for his help in examining the antibacterial effect of the Modified
Polysiloxanes compound. I would like to appreciate the cooperation of the
Palestinian Central Public Health Laboratory, particularly, Mrs. Tamara for
offering help in making TGA and DSC analysis.
Many thanks to Middle East Desalination Research Center (MEDRC)
who funded my project through the Palestinian Water Authority whom our
thanks go as well to them for their follow up the project.
To all in Chemistry Department at An-Najah National University I
offer my honest gratitude, in particular laboratory technician Mr. Nafiz
Dweikat. To my colleagues, my supporters, and my friends, I offer my
sincere thanks.

V
Removal of Methylene Blue from Industrial Wastewater in
Palestine Using Polysiloxane Surface Modified with
Bipyrazolic Tripodal Receptor
Declaration
The work provided in this thesis, unless otherwise referenced, is the
researcher's own work, and has not been submitted elsewhere for any
other degree or qualification.
Student's name: اسم الطالة: جمال عمر عمارة
Signature: :التوقيع
Date: :التاريخ
VI
Table of contents
No. Content Page
Dedication III
Acknowledgement IV
Declaration V
Table of contents VI
List of tables IX
List of figures X
List of abbreviations XII
Abstract XIV
Chapter One: Introduction 1
1.1 Overview 1
1.2 Objective of this work 6
1.2.1 General objectives 6
1.2.2 Specific objectives 6
1.2.3 Research questions and identified problems 7
Chapter Two: Background and Literature review 8
2.1 Methylene Blue Dye 8
2.1.1 Structure and Properties 8
2.1.2 Uses of Methylene Blue Dye 10
2.1.2.1 Industrial Uses of Methylene Blue Dye 10
2.1.2.2 Medical Uses of Methylene Blue Dye 10
2.1.3 Toxicity of Methylene Blue Dye 11
2.2 Dyes and Methylene Blue Dye in Industrial Effluents 12
2.3 Industrial Wastewater in the Palestinian Territories 14
2.4 Adsorption 16
2.4.1 Adsorption Phenomenon 16
2.4.2 Adsorption Isotherm Models 17

VII
2.4.2.1 Langmuir Adsorption Isotherm 19
2.4.2.2 Freundlich model Isotherm 20
2.4.2.3 Temkin model Isotherm 21
2.4.3 Adsorption Thermodynamics 21
2.4.4 Adsorption kinetics 22
2.4.5 Types of adsorbents 23
2.4.6 Adsorption as an effective method for removing dyes
from wastewater 24
2.5 Polysiloxane and functionalized Polysiloxane 26
2.6 Polysiloxane surface modified with bipyrazolic tripodal
receptor 27
2.7 Methodology of preparing Polysiloxane surface
modified with bipyrazolic tripodal receptor 28
Chapter Three: Experimental Work 31
3.1 Chemicals and Materials 31
3.2 Synthesis of N,N-bis (3,5-Dimethylpyrazol-1-yl
methyl)-3-aminopropyl Polysiloxane (Si-C3H6NPz2) 32
3.3 Characterization of (Si-C3H6NPz2) 33
3.4 Preparation of Methylene Blue solutions 33
3.5 Calibration Curve 33
3.6 Adsorption Experiments 36
3.6.1 Experiment (1) The temperature effect 37
3.6.2 Experiment (2) Effect of pH 37
3.6.3 Experiment (3) Effect of initial concentration of
Methylene Blue dye 37
3.6.4 Experiment (4) Effect of Adsorbent dose 38
3.6.5 Experiment (4) Optimization of contact time 38
3.7 Thermodynamics and Kinetics of Adsorption 38
Chapter Four: Results and Discussion 40
4.1 Modified Polysiloxane (Si-C3H6NPz2) Characterization 40
4.1.1 SEM Analysis of the Modified Polysiloxane 40
4.1.2 FT-IR Characterization 41

VIII
4.1.3 TGA Analysis and Thermal stability 42
4.2 Investigation of adsorption parameters 43
4.2.1 Effect of pH on Methylene Blue dye adsorption 43
4.2.2 Temperature effect on Methylene Blue dye adsorption 45
4.2.3 Effect of Methylene Blue dye concentration 45
4.2.4 Effect of amount of adsorbent 48
4.2.5 Effect of contact time 49
4.3 Adsorption isotherm of Methylene Blue dye 50
4.3.1 Langmuir Adsorption Isotherm 50
4.3.2 Freundlich Adsorption Isotherm 52
4.3.3 Temkin Adsorption Isotherm 53
4.4 Adsorption Thermodynamics 55
4.5 Adsorption Kinetics of Methylene Blue dye 57
4.6 Recovery of Methylene Blue dye and reusability of the
adsorbent 59
4.7 Studying the Antimicrobial Activity of (Si-C3H6NPz2) 60
Conclusions 62
Recommendations 64
References 65
Appendix 75
ب الملخص

IX
List of Tables
No. Table Page
Table 2.1 Physical and chemical properties of Methylene Blue
dye 9
Table 2.2 Dose-related toxicity of Methylene Blue dye 12
Table 4.1
Parameters and correlation coefficient of Langmuir
isotherm model for adsorption of Methylene Blue dye
onto (Si-C3H6NPz2)
51
Table 4.2
Parameters and correlation coefficient of Freundlich
isotherm model for adsorption of Methylene Blue dye
onto (Si-C3H6NPz2).
52
Table 4.3
Temkin isotherm model parameters and correlation
coefficient for adsorption of Methylene Blue dye on
(Si-C3H6NPz2).
53
Table 4.4
Parameters and correlation coefficient of Langmuir,
Freundlich and Temkin for adsorption of Methylene
Blue dye on (Si-C3H6NPz2).
54
Table 4.5 The values of the thermodynamic of Methylene Blue
dye adsorption at various temperatures. 56
Table 4.6
Pseudo first order and pseudo second order kinetic
model parameters for Methylene Blue dye adsorption
onto Si-C3H6NPz2 at 20oC.
59

X
List of Figures
No. Figure Page
Figure 2.1 Molecular structure scheme of the methylene blue. 8
Figure 2.2 A reversible oxidation-reduction system of methylene blue and leucomethylene blue.
9
Figure 2.3 The synthesis route of modified polysiloxane 30 Figure 3.1 The synthesis procedure of (Si-C3H6NPz2) 32
Figure 3.2 A plot representing the absorbance versus wave length for a standard Methylene Blue solution
34
Figure 3.3 A representative plot of the absorbance versus concentration of Methylene Blue solution
35
Figure 3.4 Linear calibration curve of absorbance vs. concentration for Methylene Blue concentrations in the range 5-20 mg/L
35
Figure 4.1 SEM micrographs of the modified Polysiloxane surface (Si-C3H6NPz2)
40
Figure 4.2 FT-IR spectra of (a) 3-aminopropyl-functionalized silica gel (Si-C3H6NH2) (b) and the modified Polysiloxane surface (Si-C3H6NPz2)
41
Figure 4.3a Thermogravimetric curves of 3-aminopropyl-functionalized silica gel (Si-C3H6NH2)
42
Figure 4.3b Thermogravimetric curves of the modified Polysiloxane surface (Si-C3H6NPz2)
43
Figure 4.4 Effect of pH on Methylene Blue dye adsorption. (Co= 20 mg/L, time= 30 min., T=25
OC, adsorbent dose=
0.05 g, sol. Volume= 20 mL) 44
Figure 4.5 Effect of temperature on Methylene Blue dye adsorption. (co= 20 mg/L, time= 30 min, adsorbent dose= 0.1 g, sol. volume= 50 mL)
45
Figure 4.6 Effect of Methylene Blue dye concentration on adsorption. (Temp.= 15
oC, time= 30 min, pH= 11.8,
adsorbent dose= 0.04 g, sol. volume= 20 mL) 46
Figure 4.7 Effect of MB dye conc. on adsorption capacity. (Temp.= 15
oC, time= 30 min, pH= 11.8, adsorbent
dose= 0.04 g, sol. volume= 20 mL) 47
Figure 4.8
Effect of Methylene Blue dye conc. on the Distribution Ratio (Kd). (Temp.= 15
oC, time= 30
min, pH= 11.8, adsorbent dose= 0.04 g, sol. volume= 20 mL)
48

XI
Figure 4.9
Effect of dosage of adsorbent on the removal of Methylene Blue dye. (Temp.= 15
oC, time= 30 min,
pH= 11.42, conc. of Methylene Blue dye= 15 mg/L, sol. volume= 20 mL)
49
Figure 4.10
Effect of contact time to determine the time of maximum adsorption of Methylene Blue dye. (Temp.= 20
oC, pH= 10.7, conc. of Methylene Blue
dye= 15 mg/L, sol. volume= 50 mL, adsorbent dose= 0.2504 g)
50
Figure 4.11 Langmuir plot for Methylene Blue dye adsorption on (Si-C3H6NPz2). (Temp.= 15
oC, pH= 11.8, time= 30
min, sol. volume= 20 mL, adsorbent dose= 0.0413 g) 51
Figure 4.12
Freundlich plot for Methylene Blue dye adsorption on (Si-C3H6NPz2). (Temp.= 15
oC, pH= 11.8, time=
30 min, sol. volume= 20 mL, adsorbent dose= 0.0413 g)
52
Figure 4.13
Temkin plot for Methylene Blue dye adsorption on (Si-C3H6NPz2). (Temp.= 15
oC, pH= 11.8, time= 30
min., sol. volume= 20 mL, adsorbent dose= 0.0413 g)
53
Figure 4.14
A graph of lnKd vs. 1/T for Methylene Blue dye adsorption on (Si-C3H6NPz2). (Temp.= 15
oC, pH=
11.8, time= 30 min., adsorbent dose= 0.0413 g, sol. Volume= 20 mL)
55
Figure 4.15 The suggested interaction between Methylene Blue dye and Modified SiO2 with bipyrazolic tripodal receptor
57
Figure 4.16
Pseudo first order sorption kinetics of Methylene Blue dye on (Si-C3H6NPz2). (Temp.= 20
oC, pH=
10.7, sol. volume= 50 mL, adsorbent dose= 0.2504 g)
58
Figure 4.17
Pseudo second order adsorption kinetics of Methylene Blue dye on (Si-C3H6NPz2). (Temp.= 20
oC, pH= 10.7, sol. volume= 50 mL, adsorbent
dose= 0.2504 g)
59
Figure 4.18
Percentage of Methylene Blue dye removal by the regenerated adsorbent compared with a fresh one at (Temp.= 15
oC, pH= 11.03, sol. volume= 20 mL,
adsorbent dose= 0.1002 g, contact time= 30 min)
60
Figure 4.19 Antimicrobial Activity of Si-C3H6NPz2, all plates were showed negative results for Si-C3H6NPz2 and the formula+Cu.
61

XII
List of Abbreviation
Symbol Abbreviation
A the Temkin isotherm constant (L/g)
A° Angstrom = 1.0 × 10⁻¹⁰
meters
Ao absorbance of methylene blue in the sample solution
before treatment
Abs. Absorbance
Ae Absorbance of methylene blue in the sample solution
after treatment
ARIJ Applied Research Institute Jerusalem
B Dimensionless Temkin constant
b Temkin constant related to heat of sorption (J/mol)
BOD Biological Oxygen Demand
COD Chemical oxygen demand
Co Concentration of methylene blue in the sample solution
before treatment (mg/L)
Ce Concentration of methylene blue in the sample solution
after treatment (mg/L) at equilibrium
Ci Initial concentration of methylene blue in the sample
solution (mg/L)
DMSO Dimethylsulfoxide
DSC Differential scanning calorimetry
Absorptivity (extinction coefficient)
EQA European Quality Assurance
FT-IR Fourier Transform Infrared
G(-)
Gram-negative bacteria
G(+)
Gram-positive bacteria
IQ Intelligence Quotient
K1 The Lagergren’s first order rate constant
K2 The pseudo second order rate constant
Kd The distribution coefficient
KF Freundlich constant which is an approximate indicator
of adsorption capacity of the sorbent (mg/g (L/mg)1/n
)
KL Langmuir isotherm constant (L/mg)

XIII
MAC Minimum alveolar concentration
LD50 Lethal Dose which causes the death of 50% (one half)
of a group of test.
MAO-A Monoamine oxidase A
MAOI Monoamine oxidase inhibitors
MB Methylene Blue
msed Mass of adsorbent dose
n Dimensionless Freundlich constant giving an indication
of how favorable the adsorption process
OPT Occupied Palestinian territories
PCBS Palestinian Central Bureau of Statistics
Qe The amount of MB dye adsorbed per gram of the
adsorbent (mg/g)
Qm Maximum monolayer coverage capacity (mg/g)
Qt Amount of adsorbate per unit mass of adsorbent at time
t (min)
R The gas constant (8.314 J/mol K)
R2 Correlation coefficient (regression coefficient)
RL Dimensionless constant separation factor
SEM Scanning Electron Microscope
Si-C3H6NH2 3-aminopropyl-functionlized silica gel
Si-C3H6NPz2 N,N-bis (3,5-Dimethylpyrazol-1-yl methyl)-3-
aminopropyl Polysiloxane
SPE Solid Phase Extraction
Si(OEt)4 Tetraethoxysilane
SVR Systemic Vascular Resistance
t Time
T The absolute temperature (oK)
TGA Thermal gravimetric analysis
V Volume of solution
∆G° Standard free Gibbs energy
∆H° Standard enthalpy
∆S° Standard entropy

XIV
Removal of Methylene Blue from Industrial Wastewater in Palestine
Using Polysiloxane Surface Modified with Bipyrazolic Tripodal
Receptor
By
Jamal Omar Mohamad Amarah
Supervisor
Prof. Shehdeh Jodeh
Abstract
Different pollutants from industries leach every day to soil and ground
waters without treatment. This will lead to different health problems to
both human beings and animals. The major problem here is to detect the
concentration of one of the pollutants like methylene blue and try to
remove it by adsorption.
The product N,N-bis(3,5-Dimethylpyrazol-1-ylmethyl)-3-aminopropyl
Polysiloxane (Si-C3H6NPz2) was successfully prepared. Fourier Transform
Infrared (FT-IR) results confirmed that the Dimethylpyrazole units have
been immobilized onto the surface of the modified silica gel. Scanning
Electron Microscope (SEM) images of the Modified Polysiloxane surface
showed rough and porous nature, indicating that the materials present good
characteristics to use as an adsorbent. The adsorption experiments were
conducted for a wide range of pH, adsorbent dosage, temperature, initial
concentration and contact time. It was observed that the percentage
removal of Methylene blue (MB) dye decreased with an increase initial
concentration and temperature while it increased with increase in solution
pH, contact time and adsorbent dose. Over 70% removal efficiency of MB

XV
dye was achieved after 180 min, at solution pH around 10 and 20°C
temperature using 0.25 g weight of dose and initial concentration of 15
mg/L of 50 mL MB dye solution.
The sorption of MB dye on the (Si-C3H6NPz2) was optimized under
alkaline conditions and temperatures around room temperature. MB
sorption using (Si-C3H6NPz2) can be described using pseudo second order
and Temkin isotherm model. Based on the results, the (Si-C3H6NPz2) is
able to remove MB rapidly within 15 min with high removal efficiency.
The values amount of MB dye adsorbed per unit mass of (Si-
C3H6NPz2) that obtained by Lagergren pseudo second order model,
Qe(calc.) was in consistent with the experimental value, Qe(exp.) indicates
that the chemisorption might be the rate limiting step where valence forces
are involved via electrons sharing or exchange between the adsorbent and
the adsorbate. Adsorption behavior of Si-C3H6NPz2 is described by Temkin
isotherm, and the results indicate monolayer type exothermic adsorption
process involved in the system.
The Langmuir maximum adsorption capacity Qm is 11.09 mg/g, at
15°C, and pH 11.83 and 0.04 weight of adsorbent dose. The RL value
(0.138 at 15 °C) indicates that the adsorption of MB dye on (Si-C3H6NPz2)
is favorable. From Freundlich isotherm model parameters, value of 1/n =
0.6041 while n=1.66 indicating that the sorption of MB dye on (Si-
C3H6NPz2) is favorable.

XVI
The negative ∆G° values (-17.17 to -17.25 KJ/mol) indicate that the
adsorption is favorable and spontaneous at these temperatures. The
negative value of ∆H° (-16.66 KJ/mol) reflects an exothermic adsorption
and indicates that the adsorption is favored at temperature 15oC. The value
of ∆H° was higher than those corresponding to physical adsorption. This
would suggest that the adsorption process is chemical in nature. The small
positive value of ∆S° (+1.78 J/mol.K) suggests that some structural
changes occur on the adsorbent and the randomness at the solid/liquid
interface in the adsorption system increases during the adsorption process.

1
Chapter One
Introduction
1.1 Overview
Pollution is the process of making land, water, air or other parts of the
environment dirty and unsafe or unsuitable to use. This can be done
through the introduction of pollutants into a natural environment. Toxic
pollution affects more than 200 million people worldwide, according to
Pure Earth, a non-profit environmental organization. In some of the world’s
worst polluted places, babies are born with birth defects, children have lost
30 to 40 IQ points, and life expectancy may be as low as 45 years because
of cancers and other diseases. Water pollution happens when chemicals or
dangerous foreign substances are introduced to water, including chemicals,
sewage, pesticides and fertilizers from agricultural runoff, or metals like
lead or mercury [1].
The need to maintain a cleaner environment for the survival of both
aquatic and terrestrial lives including human beings is very crucial and is a
subject of increasing concern to the environmentalist. Pollution caused by
agents such as heavy metals and dyes are amongst the list which rendered
the environment unwholesome and posed serious health concern to the
populace [2].
Industrial effluents are one of the major causes of environmental
pollution because effluents discharged from dyeing industries are highly

2
colored with a large amount of suspended organic solid. Untreated disposal
of this colored water into the receiving water body either causes damage to
aquatic life or to human beings by mutagenic and carcinogenic effect. As a
matter of fact, the discharge of such effluents is worrying for both
toxicological and environmental reasons. Conventional wastewater
treatment methods for removing dyes including physicochemical, chemical
and biological methods, such as coagulation and flocculation, adsorption,
ozonation, electrochemical techniques, and fungal decolorization. Among
these methods adsorption has gained favor in recent years due to proven
efficiency in the removal of pollutants from effluents to stable forms for the
above treatment methods [3].
Water pollution due to color dyestuff industrial waste becomes a
major concern worldwide. Many industries including leather and textile
industries use dyes extensively in different unit operation. There are more
than 100,000 commercially available dye and more than 7x10⁵ tons per
year are produced annually. Wastewater containing dyes are very difficult
to treat, since the dyes are recalcitrant organic molecules, resistant to
biological degradation and are stable to light. There are different methods
for the removal of textile effluents [4].
Many dyes are widely used in different industries, such as textile,
paper, rubber, plastics, leather, food and pharmaceutical. These industries
release colored wastewater which may present an ecotoxic hazard and
introduce the potential danger of bioaccumulation, which affect the human

3
food chain. Wastewater containing small amounts of dyes can affect the
aquatic life because of its toxicity and resistance to breakdown with time.
Most of the dyes are toxic and carcinogenic, causing allergy, skin irritation.
Chemical, physical and biological methods were used for removing dyes
from wastewater. Adsorption is an effective and low-cost physical and
chemical method for removing dyes from wastewater [5].
The wastewaters discharged from dying processes exhibit high
Biological Oxygen Demand (BOD), high Chemical Oxygen Demand
(COD) are highly colored, hot, alkaline and contain high amounts of
dissolved solids. The disposal of colored wastes such as dyes and pigments
into receiving waters damages the environment, as they are carcinogenic
and toxic to humans and aquatic life. Besides the matters of color, some
dye imparts non-visibility and can be modified biologically to toxic or
carcinogenic compounds. Nowadays concern has increased about the long-
term toxic effect of water bodies containing these dissolved pollutants. The
wastewaters discharge from textile industries includes residual dyes; these
dyes are not bio-degradable therefore they may cause water pollution and
serious threat to the environment. Methylene blue dye is a basic aniline
dye, C16H18N3SCl that forms a deep blue solution when dissolved in water.
Methylene blue is utilized in coloring paper, temporary hair coloring,
dyeing cotton and wools, and coloring of paper stocks. Methylene blue is a
dark green powder or crystalline solid. It is widely used as a stain and has a
number of biological uses. It dissociates in aqueous solution in the same
way that electrolytes dissociate into methylene blue cation and the chloride

4
ion. The removal of methylene blue from any wastewater is of utmost
importance due to the serious environmental damage that can occur as a
result of contact with it, particularly in the case of people [6].
Adsorption is a fundamental process in the physicochemical treatment
of municipal wastewaters, a treatment which can economically meet
today's higher effluent standards and water reuse requirements. Adsorption
is integral to a broad spectrum of physical, biological, and chemical
processes and operations in the environmental field. Purification of gases
by adsorption has played a major role in air pollution control, and
adsorption of dissolved impurities from solution has been widely employed
for water purification. Adsorption is now viewed as a superior method for
wastewater treatment and water reclamation [7].
Recently Solid Phase Extraction (SPE) technique using organic
modified Polysiloxane has become known as a powerful tool for separation
and enrichment of various inorganic and organic analytes. The SPE has
several major advantages that include (i) higher enrichment factor, (ii)
simple operation, (iii) safety with respect to hazardous samples, (iv) high
selectivity, (v) lower cost and less time, (vi) the ability to combine with
different modern detection techniques. Chemically modified Polysiloxane
is one of the most successful adsorbents, because this inorganic polymer
support does not swell or shrink like the organic polymeric resin. The
modified Polysiloxane may be employed in aqueous and organic solvents
media; they present good thermal stability and appropriate accessibility of

5
ions to the adsorbent groups; in addition the organofunctionalized
Polysiloxane exhibits higher sorption capacities than polymeric resins,
because the number of organic molecules immobilized on the support
surface is large, allowing thus more removal of ions from aqueous solution.
These systems can be operated indefinitely without loss of the expensive
organic molecules. Their potential applications are due essentially to the
nature of the grafted ligands. A new silica gel compound modified N,N-
bis(3,5-dimethylpyrazol-1-ylmethyl) amine (Si-C3H6NPz2) will be
synthesized and characterized. The new product exhibits good chemical
and thermal stability [8].
The aim of this study is to remove methylene blue dye from
wastewater, using this new prepared material as an adsorbent for the solid-
phase extraction of MB. The adsorption behaviors of the new surface with
methylene blue dye will be studied. The effect of pH, temperature, and
amount of adsorbent, concentration and the contact time on the adsorption
of MB will be studied. The adsorption capacity will be investigated using
kinetics and pH effects. Equilibrium Isotherm studies will be done by
varying the following three parameters: initial concentration of Methylene
blue dye solution, volume of the dye solution, and adsorbent dose on the
uptake of dye from the solution.

6
1.2 Objectives of this work
1.2.1 General Objectives
1. To remove methylene blue dye from industrial wastewater, using
this new prepared material as an adsorbent for the solid-phase
extraction of MB.
2. To identify the optimal conditions for the adsorption.
1.2.2 Specific objectives
1. To study the adsorption behaviors of the new surface with
methylene blue dye.
2. To determine if (Si-C3H6NPz2) can be used to clean up MB polluted
wastewater.
3. To determine the extent that new silica gel compound modified can
tolerate and adsorb MB.
4. To specify the margin of methylene blue dye that exists in industrial
wastewater in Palestine.
5. To study the effect of pH, temperature, amount of adsorbent,
concentration and contact time on the adsorption of MB.
Beside the major objective of removal methylene blue from industrial
wastewater; other objectives will be like screening the wastewater of other
pollutants and this will give an idea to different ministries in Palestine like
ministries of health, agriculture and water to put some guidelines and
restrictions on those industries.

7
1.2.3 Research question and identified problems
The main questions addressed in this thesis are:
1. Can (Si-C3H6NPz2) be used to clean up MB polluted wastewater?
2. To which extent that (Si-C3H6NPz2) can tolerate and adsorb MB?
3. What are the optimum condition of pH, temperature, amount of
adsorbent, concentration, and contact time for (Si-C3H6NPz2) to
adsorb MB efficiently?

8
Chapter Two
Background and Literature review
2.1 Methylene Blue Dye
2.1.1 Structure and Properties
Methylene Blue is a heterocyclic aromatic compound with molecular
formula C16H18ClN3S as shown in Figure 2.1, with IUPAC name 3,7-
bis(Dimethylamino)-phenothiazin-5-ium chloride. Methylene blue (MB)
is a cationic thiazine dye that is deep blue in the oxidized state while it is
colorless in its reduced form leucomethylene blue [9]. MB and
leucomethylene blue exist as a redox couple in equilibrium and together
form a reversible oxidation-reduction system or electron donor-acceptor
couple as shown in Figure 2.2 [10].
Figure 2.1: Molecular structure scheme of the methylene blue.

9
Figure 2.2: A reversible oxidation-reduction system of methylene blue and
leucomethylene blue.
Chemical and Physical Properties of Methylene Blue is summarized in
Table 2.1 [11].
Table 2.1: Physical and chemical properties of MB dye
Physical and chemical properties Values
Melting temperature 180ºC
Boiling temperature No data (Decomposes)
Solubility in water 35.5 g/L
pH value 3 (10 g/L H2O)
Molecular weight 319.09 g/mol
Color Dark blue-green in oxidized
form, colorless in reduced form
(Leucomethylene blue)
Chemical formula C16H18N3ClS

10
2.1.2 Uses of methylene blue
2.1.2.1 Industrial uses of methylene blue
Various types of dye, various cationic dyes, including methylene blue,
are used in dye, paint production and wool dyeing. Methylene blue is also
used in microbiology, surgery, and diagnostic and as a sensitizer in photo-
oxidation of organic pollutants [12]. Many dyes are widely used in
different industries, such as textile, paper, rubber, plastics, leather, food and
pharmaceutical [5][6].
2.1.2.2 Medical uses of methylene blue
Methylene blue finds its major utilization in toxicology in the
treatment of methemoglobinemia at a dose of 1 to 2 mg/kg intravenously.
Methylene blue has several notable uses in clinical medicine. Examples
include use as a bacteriostatic genitourinary antiseptic, herpes simplex, use
in combination with vitamin C for the management of chronic urolithiasis,
and use as an indicator dye. Methylene blue is also used to increase
vascular tone and myocardial function in patients with septic or
anaphylactic shock. It is as the antidote of choice in the treatment of
symptomatic methemoglobinemia, however, that methylene blue's use is
most prominent in the critical care setting. Methylene blue is a generally
safe drug with dose-related hemolytic effects [13].

11
2.1.3 Toxicity of methylene blue
Methylene blue is a biologically active substance, and if administered
inappropriately, it can lead to a number of health complications, including
gastrointestinal disturbances and dysuria [14]. Large doses of methylene
blue can produce methemoglobinemia, chest pain, dyspnea, restlessness,
apprehension, tremors, a sense of oppression, urinary tract irritation, as
well as a mild hemolysis with moderate hyperbilirubinemia, reticulosis, and
slight anemia [15].
Methylene Blue is an extremely potent monoamine oxidase inhibitor
(MAOI) in vitro and that in human it causes potentially fatal serotonin
toxicity. There have been a number of deaths in humans due to serotonin
toxicity. Various evidences suggest MB helps memory and neuronal
degeneration. It may also have acetylcholinesterase antagonist activity.
Also MB dissolves Tau polymers isolated from Alzheimer disease brains,
and prevents Tau aggregation in cell models in the high nanomolar
concentration range (150 – 580 nM) and also reverses Tau pathology in the
brain. MAO-A inhibition probably occurs at a lower concentration than
Tau inhibition. At > 0.5 – 1 mg per kg intravenously it will be active as an
MAOI [16].
Methylene blue toxicity is nearly always associated with its
administration to patients treated with psychotropic medications,
particularly those affecting central nervous system serotonin levels.
Methylene blue should be administered with caution to these patients. No

12
safe dosage regimen has been established. No recommendations can
currently be made regarding the safety of methylene blue administration if
or when antidepressant medications are discontinued. Methylene blue
toxicity has occurred at a wide range of doses [17]. Dose-related toxicity of
MB is summarized in Table 2.2 [11].
Table 2.2: Dose-related toxicity of MB dye
Animal studies Toxic doses
(mg/kg) Manifestation
Rat 5-50 Neuronal apoptosis, reduced MAC
isoflurane
1250 (LD50)
Mouse 3500
Sheep 40
Dog 10-20 Hypotension, decreased SVR, renal
blood flow, pulmonary hypertension
Human studies Dose
(mg/kg) Toxic manifestations
2-4 Hemolytic anemia,
skin desquamation in infants
7 Nausea, vomiting, abdominal pain,
chest pain, fever, hemolysis
7.5 Hyperpyrexia, confusion
20 Hypotension
80 Bluish discoloration of skin (similar
to cyanosis)
2.2 Dyes and MB dye in industrial effluents
Over 70,000 tons of approximately 10,000 types of dyes and pigments
are produced annually world wide of which about 20 – 30% are wasted in
industrial effluents during the textile dyeing and finishing processes.

13
Methylene blue has long been used as a model for the adsorption of organic
dye from aqueous solution. Methylene blue is one of the most commonly
used thiazine dyes and various adsorbents have been reported for its
removal from aqueous solutions [18].
Dyes are widely use in textile, paper, plastic, food and cosmetic
industries. The wastes coming from these industries can effect on our
atmosphere causing pollution. The level of pollutants even in very low
concentration is highly visible and will affect aquatic life as well as food
web. Many dyes are difficult to degrade. They are generally stable to light,
oxidizing agents and are resistant to aerobic digestion (McKay and
Sweeney, 1980). Hence, pollution due to dyes poses not only a severe
public health concern, but also many serious environmental problems
because of their persistence in nature and non-biodegradable characteristics
[19].
About 15% of the total world production of dyes is lost during the
dyeing process and is released in the textile effluents. The release of those
colored waste waters in the ecosystem is a dramatic source of non-aesthetic
pollution, eutrophication and perturbations in the aquatic life [20].
The discharge of dyes in the environment is worrying for both
toxicological and esthetical reasons. Industries such as textile, leather,
paper, plastics, etc., are some of the sources for dye effluents. It is
estimated that more than 100,000 commercially available dyes with over
7×10⁵ tons of dyestuff produced annually. Although MB is used in some

14
medical treatments, and in dying textile, it can cause eye injury for both
human and animals. On inhalation, it can give rise to short periods of rapid
or difficult breathing while ingestion through the mouth produces a burning
sensation and may cause nausea, vomiting, profuse sweating, diarrhea,
gastritis, mental confusion and methemoglobinemia. Thus, the removal of
MB from industrial effluents has become one of the major environmental
concerns [21].
2.3 Industrial Wastewater in the Palestinian Territories
An essential tool in the management of hazardous waste is an
inventory of national hazardous waste substances. No such inventory exists
in the Occupied Palestinian Territories (OPT), and its absence makes it
difficult to determine what types of waste are being generated, and where
they are being disposed of. OPT has inadequate facilities for sewage and
wastewater treatment and disposal. There are very few estimates of the
amounts of hazardous waste generated in the OPT. In the West Bank, the
amount has been estimated at 2,500 tons per year. The true amount is likely
to be much higher. There are 71 textile-dyeing facilities in the West Bank
producing both printed and dyed fabrics. Effluent from these industries
contains high concentrations of ionic substances, organic color and reactive
dyestuffs. Heavy metals, which are used for fixing colors in the dye, are
also present. Estimates of annual solid and liquid hazardous waste are 290
and 600 tons respectively. Tanneries consume large quantities of scarce
freshwater, and generate and release corresponding amounts of wastewater

15
with significant pollution loads, and sometimes with extreme pH values.
The disposal of wastewater containing untreated tannery effluent presents a
high risk of groundwater pollution, as wastewater infiltrates through the
limestone into the aquifer. The paint manufacturing process involves the
mixing of different agents such as pigments and solvents. A range of
hazardous substances are used in the processes such as ethylbenzene and
similar organic compounds, various acids, metals, acrylates, hazardous
isomers, and alcohols. Estimates of annual solid and liquid hazardous waste
generation are 8 and 201 tons respectively. About 2,500 million m3 of used
mineral oil are released annually in the OPT without any collection systems
or adequate treatment. The mini steel mills in the OPT use a range of
hazardous substances, such as heavy metals, phenol (and its salts), dioxins,
furans, cyanides, and several dangerous halogenated hydrocarbons.
Estimates of annual solid and liquid hazardous waste generation are 1,016
and 1,200 tons respectively. Medical waste covers several categories:
infectious waste, pathological waste, pharmaceutical waste, genotoxic
waste, chemical waste, wastes with high heavy metal content, pressurized
containers, and radioactive waste. In the West Bank, 330 tons of contagious
waste, 65 tons of biological waste and 2 tons of sharp objects are generated
each year. The quantity for Gaza has been estimated at only 0.2 tons. The
low value of this figure is that it refers to amounts that are collected, rather
than total amounts including the waste that enters the domestic waste
stream. Israeli colonies are also reported to release quantities of hazardous
waste without treatment, such as Barqan industrial zone are release 810,000

16
cubic meters of industrial wastewater per year, including hazardous waste
[22][23].
2.4 Adsorption
Adsorption is an important physical phenomenon, which provides
bases for understanding such processes as heterogeneous catalysis,
chromatographic analyses and dyeing of textiles. After the discovery of
adsorption, a large number of scientists have been working either on
adsorption of gases or liquids on different adsorbents. The property
possessed by charcoal of removing coloring matter from solutions has been
reported and many observations have since been made showing that these
finely divided powders are able to take up dyestuff and other substances
from solution [24].
2.4.1 Adsorption phenomenon
Adsorption is a surface phenomenon with common mechanism for
organic and inorganic pollutants removal. When a solution containing
absorbable solute comes into contact with a solid with a highly porous
surface structure, liquid–solid intermolecular forces of attraction cause
some of the solute molecules from the solution to be concentrated or
deposited at the solid surface. The solute retained on the solid surface in
adsorption processes is called adsorbate, whereas, the solid on which it is
retained is called as an adsorbent. This surface accumulation of adsorbate
on adsorbent is called adsorption. This creation of an adsorbed phase

17
having a composition different from that of the bulk fluid phase forms the
basis of separation by adsorption technology [25].
Other definition of adsorption is a mass transfer process by which a
substance is transferred from the liquid phase to the surface of a solid, and
becomes bound by physical and/or chemical interactions. Large surface
area leads to high adsorption capacity and surface reactivity [26].
Adsorption is a consequence of surface energy. In a bulk material, all
the bonding requirements (be they ionic, covalent, or metallic) of the
constituent atoms of the material are filled by other atoms in the material.
However, atoms on the surface of the adsorbent are not wholly surrounded
by other adsorbent atoms and therefore can attract adsorbate. The exact
nature of the bonding depends on the details of the species involved, but
the adsorption process is generally classified as physisorption
(characteristic of weak van der Waals forces) or chemisorption
(characteristic of covalent bonding). It may also occur due to electrostatic
attraction [27].
2.4.2 Adsorption Isotherms Models
The modeled adsorption isotherm is an invaluable non-linear curve
describing the adsorption phenomenon at a constant temperature and pH;
and the mathematical correlation which is depicted by the modeling
analysis is important for operational design and applicable practice of the
adsorption systems [28]. Adsorption isotherm models are described in
many mathematical forms, some of which are based on a simplified

18
physical description of adsorption and desorption, while others are purely
empirical and intended to correlate experimental data [29]. Adsorption
equilibrium is established when an adsorbate containing phase has been
contacted with the adsorbent for sufficient time, with its adsorbate
concentration in the bulk solution is in a dynamic balance with the interface
concentration [30]. Adsorption equilibrium is defined being a state of
dynamic equilibrium, with both adsorption and desorption rates are equal
[31]. The mathematical correlation, which constitutes an important role
towards the modeling analysis, operational design and applicable practice
of the adsorption systems, is usually depicted by graphically expressing the
solid-phase against its residual concentration [32]. The physicochemical
parameters together with the underlying thermodynamic assumptions of an
isotherm provide insight into the adsorption mechanism, surface properties
and the degree of affinity of the adsorbents which are fundamentals in the
characterization of adsorption process [33].
A wide variety of equilibrium isotherm models; Langmuir,
Freundlich, Brunauer–Emmett–Teller, Redlich– Peterson, Dubinin–
Radushkevich, Temkin, Toth, Koble–Corrigan, Sips, Khan, Hill, Flory–
Huggins and Radke–Prausnitz isotherm, have been formulated in terms of
three fundamental approaches [34]. Kinetic consideration is the first
approach to be referred. Hereby, adsorption equilibrium is defined being a
state of dynamic equilibrium, with both adsorption and desorption rates are
equal. Whereas, thermodynamics, being a base of the second approach, can
provide a framework of deriving numerous forms of adsorption isotherm

19
models, and potential theory, as the third approach, usually conveys the
main idea in the generation of characteristic curve. However, an interesting
trend in the isotherm modeling is the derivation in more than one approach,
thus directing to the difference in the physical interpretation of the model
parameters [35].
2.4.2.1 Langmuir Adsorption Isotherm
This describes quantitatively the formation of a monolayer adsorbate
on the outer surface of the adsorbent, and after that no further adsorption
takes place. Thereby, the Langmuir represents the equilibrium distribution
of MB dye between the solid and liquid phases. The Langmuir isotherm is
valid for monolayer adsorption onto a surface containing a finite number of
identical sites. The model assumes uniform energies of adsorption onto the
surface and no transmigration of adsorbate in the plane of the surface.
Based upon these assumptions, Langmuir represented the following
equation [36]-[45]:
(2.1)
Where:
Ce= the concentration of the adsorbate at equilibrium (mg/L)
Qe= the amount of MB dye adsorbed per gram of adsorbent (mg/g)
Qm= Maximum capacity of monolayer coverage (mg/g)
KL= Langmuir isotherm constant (L/mg)

20
The essential characteristics of the Langmuir isotherm can be
expressed in terms of a dimensionless constant separation factor RL that is
given by the following equation [38][41]-[45]:
(2.2)
Where Co is the highest initial concentration of adsorbate (mg/L).
The RL value indicates the shape of the isotherm to be either
unfavorable if (RL> 1), Linear if (RL = 1), favorable if (0 <RL <1), or
irreversible if (RL = 0).
2.4.2.2 Freundlich model Isotherm
The Freundlich isotherm is an empirical equation used to describe
heterogeneous systems. This model is defined by the following equation
[36]-[45]:
(2.3)
The linear form of this equation can be written as [36]-[45]:
(2.4)
KF and n are Freundlich constants. KF is a rough indicator of the
adsorption capacity of the sorbent and n giving an indication of the
favorable way of the adsorption process. The magnitude of the exponent,
1/n, gives an indication of the adsorption favorability. If the value of 1 / n is
less than one this indicates a normal adsorption. If n is between one and
ten, it indicates a favorable sorption process [36][40].

21
As the temperature increases, the constants K and n change to reflect
the empirical observation that the quantity adsorbed rises more slowly and
higher pressures are required to saturate the surface [36].
2.4.2.3 Temkin model Isotherm
This isotherm contains a factor reflecting the adsorbent-adsorbate
interactions and suggested that because of these interactions the heat of
adsorption of all the molecules in the layer decrease linearly with the
coverage [41]. The model is given by the following equation [40][44]:
(2.5)
Where B = RT/b, b is the Temkin constant related to heat of sorption
(J/mol); A is the Temkin isotherm constant (L/g), R the gas constant (8.314
J/mol K) and T the absolute temperature (oK).
2.4.3 Adsorption Thermodynamics
Adsorption thermodynamics were determined using the
thermodynamic equilibrium coefficients obtained at different temperatures
and concentrations in order to verify possible adsorption mechanisms. The
adsorption characteristics of a material can be expressed in terms of
thermodynamic parameters such as ΔG (Gibbs free energy change), which
can be calculated by the following equation [29][42]:
(2.6)
Where Kd is the thermodynamic equilibrium constant (L g-1
).

22
According to thermodynamics, Gibbs free energy ( is the
difference between the adsorption enthalpy (ΔH) and adsorption entropy
(ΔS) multiplied by the temperature. In this way, by applying this concept to
the equation (4.8), ΔH and ΔS can be determined using the Van't Hoff plot
(Figure 4.14), according to equation (4.9) [29][42]:
(2.7)
2.4.4 Adsorption kinetics
The study of the adsorption kinetics is important because it provides
valuable insights into the reaction path and the mechanism of the reactions.
The adsorption rate was followed by the study of the contact time up to 6
hours and compared to theoretical models. Pseudo first-order and second-
order kinetic models were tested in this study where experimental data
obtained for the different contact times were used.
The rate constant for the adsorption of adsorbate from the effluent on
adsorbent is determined using the pseudo first-order equation (Lagergren
equation) [40][43][45]:
(
) (2.8)
Where Qe is the adsorption capacity of the adsorbent at equilibrium
(mg/g), Qt is the amount of dye adsorbed at time t (mg/g) and K1 is the
pseudo first order rate constant (min−1
).
The pseudo second order kinetics can be expressed in a linear form as
integrated second order rate law [38][45][56]:

23
(2.9)
Where K2 is the pseudo second order rate constant (g mg−1
min−1
).
A pseudo second order suggests that this adsorption depends on the
adsorbate and the adsorbent and involves chemisorption process in addition
to physisorption. The chemisorption might be the rate limiting step where
valence forces are involved via electrons sharing or exchange between the
adsorbent and the adsorbate [38][43].
2.4.5 Types of adsorbents
Different types of adsorbents are classified into natural adsorbents and
synthetic adsorbents. Natural adsorbents include charcoal, clays, clay
minerals, zeolites, and ores. These natural materials, in many instances are
relatively cheap, abundant in supply and have significant potential for
modification and ultimately enhancement of their adsorption capabilities.
Synthetic adsorbents are adsorbents prepared from Agricultural products
and wastes, house hold wastes, Industrial wastes, sewage sludge and
polymeric adsorbents. Each adsorbent has its own characteristics such as
porosity, pore structure and nature of its adsorbing surfaces. Many waste
materials used include fruit wastes, coconut shell, scrap tires, bark and
other tannin-rich materials, sawdust, rice husk, petroleum wastes, fertilizer
wastes, fly ash, sugar industry wastes blast furnace slag, chitosan and
seafood processing wastes, seaweed and algae, peat moss, clays, red mud,
zeolites, sediment and soil, ore minerals etc. [25].

24
2.4.6 Adsorption as an effective method for removing dyes from
wastewater
Many treatment methods have been used to remove the dyes from
wastewater. These can be divided into physical, chemical, and biological
methods. Among the various methods, adsorption is an effective separation
process for a wide variety of applications. It is now recognized as an
effective and economical method for the removal of both organic and
inorganic pollutants from wastewaters [46]. Adsorption is a common
technique used for dye removal from aqueous solution, mainly because it is
relatively low in cost, robust, environmentally friendly and simple. A
starting point in the development of an adsorption unit is the choice of an
adsorbent among the various adsorbents [47].
Due to low biodegradation of dyes, a conventional biological
treatment process is not very effective in treating a dyes wastewater. It is
usually treated with either by physical or chemical processes. However,
these processes are very costly and cannot effectively be used to treat the
wide range. The adsorption process is one of the effective methods for
removal dyes from the waste sewage. The process of adsorption has an
advantage over the other methods due to its sludge free clean operation and
completely removed dyes, even from the diluted solution [48]. A synthetic
dye in wastewater cannot be efficiently decolorized by traditional methods.
This is because of the high cost and disposal problems for treating dye
wastewater at large scale industries. Adsorption is a well-known

25
equilibrium separation process for water decontamination applications.
Adsorption has been found to be superior to other techniques for water
reuse in terms of initial cost, flexibility and simplicity of design and ease of
operation [4].
Adsorption is a fundamental process in the physicochemical treatment
of municipal wastewaters, a treatment which can economically meet
today's higher effluent standards and water reuse requirements. Adsorption
is integral to a broad spectrum of physical, biological, and chemical
processes and operations in the environmental field. Purification of gases
by adsorption has played a major role in air pollution control, and
adsorption of dissolved impurities from solution has been widely employed
for water purification. Adsorption is now viewed as a superior method for
wastewater treatment and water reclamation. Applications of adsorption for
chemical processing air pollution control and water treatment are well
known, applications in wastewater treatment and water pollution control
are generally not as well recognized, nor as well understood. The process
has been demonstrated to be widely effective for removing dissolved
organic substances from wastewaters, but it should not be viewed as a
catholicon for waste treatment, nor should its application be made in an
empirical fashion [7].
Recently solid-phase extraction (SPE) technique using organic
modified Polysiloxane has become known as a powerful tool for separation
and enrichment of various inorganic and organic analytes. The SPE has

26
several major advantages that include (i) higher enrichment factor, (ii)
simple operation, (iii) safety with respect to hazardous samples, (iv) high
selectivity, (v) lower cost and less time, (vi) the ability to combine with
different modern detection techniques. Chemically modified Polysiloxane
is one of the most successful adsorbents, because this inorganic polymer
support does not swell or shrink like the organic polymeric resin. The
modified Polysiloxane may be employed in aqueous and organic solvents
media; they present good thermal stability and appropriate accessibility of
ions to the adsorbent groups; in addition the organofunctionalized
Polysiloxane exhibits higher sorption capacities than polymeric resins,
because the number of organic molecules immobilized on the support
surface is large, allowing thus more removal of ions from aqueous solution.
These systems can be operated indefinitely without loss of the expensive
organic molecules. Their potential applications are due essentially to the
nature of the grafted ligands [8].
2.5 Polysiloxane and functionalized Polysiloxane
There is a growing interest in synthesis of inorganic Polysiloxane
supports bearing organofunctionalized groups. Chemisorbents based on
incorporation of chelating ligands at high intensity on to the inorganic
polymeric matrix are of particular interest. There are two common methods
used to prepare these functionalize ligand systems. The first method is the
sol-gel process which involves hydrolysis and condensation of Si(OEt)4
with the appropriate silane coupling agent (RO)3SiX where X represents an

27
organofunctionalized ligand. The second approach is the chemical
modification of the pre-prepared functionalized Polysiloxane. The second
method appears as an interesting alternative mainly on account of
substitution of organofunctionalized groups when appropriate chelating
silane agents are difficult to prepare. The main advantages of these
functionalized inorganic supports are their high thermal, hydrolytic and
mechanical stability in addition to lack of swelling in solvents. These
functionalized systems have been used in many important applications such
as; chemisorption, recovery and separation of metal cations from organic
solvents and aqueous solutions. In addition they were used widely as
stationary phases in chromatography and as heterogeneous catalysts [49].
The most commonly attached chelate ability for this purpose is
devoted for donor atoms, such as oxygen, nitrogen and sulfur which have a
large capability in forming complexes with a series of metal ions, forcing in
some cases, a distinguishable selective extraction property [8].
2.6 Polysiloxane surface modified with bipyrazolic tripodal
receptor
The ability of pyrazole and its derivatives to act as ligands with sp2
hybrid nitrogen donors is evident from the large number of articles, several
of them being reviews. A series of acyclic pyrazole compounds containing
one, two, three or four pyrazole rings were prepared and demonstrated to
extract only bivalent metal cations whereas macrocyclic pyrazolic
compounds are expected to also form stable complexes with alkali metals.
28
The chemistry of the pyrazole compounds bonded to polysiloxane has not
yet been sufficiently developed [8].
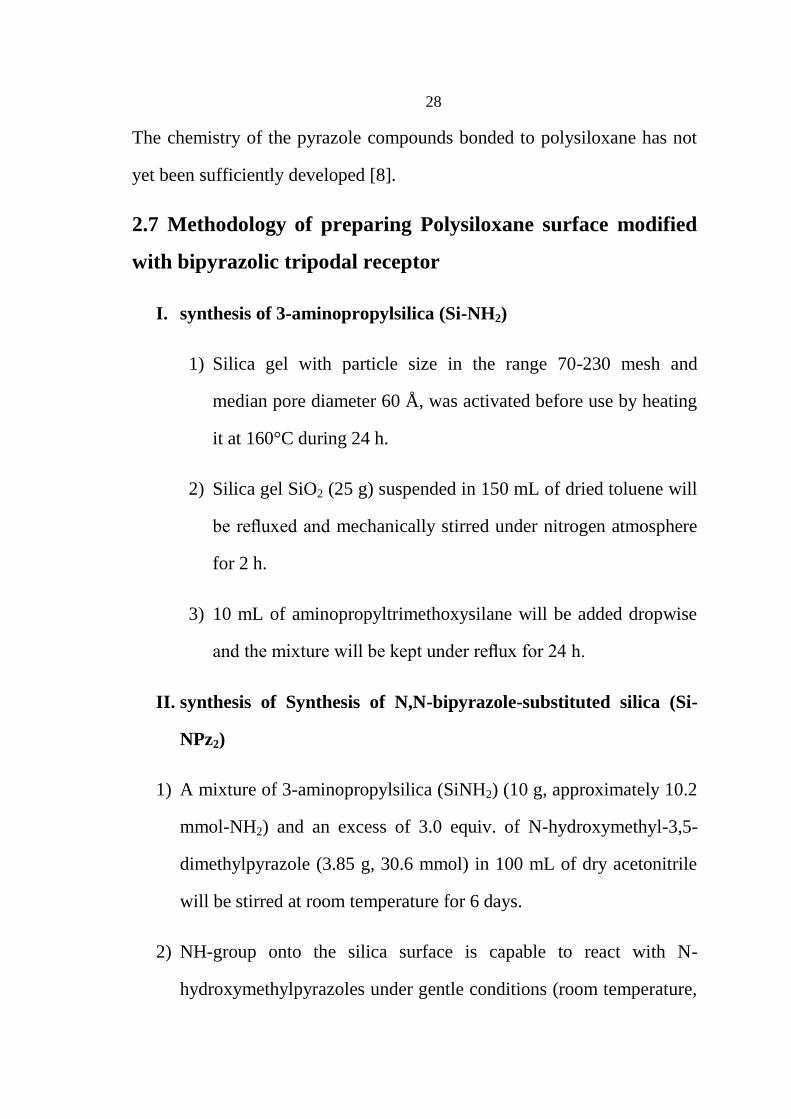
2.7 Methodology of preparing Polysiloxane surface modified
with bipyrazolic tripodal receptor
I. synthesis of 3-aminopropylsilica (Si-NH2)
1) Silica gel with particle size in the range 70-230 mesh and
median pore diameter 60 Å, was activated before use by heating
it at 160°C during 24 h.
2) Silica gel SiO2 (25 g) suspended in 150 mL of dried toluene will
be refluxed and mechanically stirred under nitrogen atmosphere
for 2 h.
3) 10 mL of aminopropyltrimethoxysilane will be added dropwise
and the mixture will be kept under reflux for 24 h.
II. synthesis of Synthesis of N,N-bipyrazole-substituted silica (Si-
NPz2)
1) A mixture of 3-aminopropylsilica (SiNH2) (10 g, approximately 10.2
mmol-NH2) and an excess of 3.0 equiv. of N-hydroxymethyl-3,5-
dimethylpyrazole (3.85 g, 30.6 mmol) in 100 mL of dry acetonitrile
will be stirred at room temperature for 6 days.
2) NH-group onto the silica surface is capable to react with N-
hydroxymethylpyrazoles under gentle conditions (room temperature,

29
atmospheric pressure, 4–7 d), using anhydrous acetonitrile as
solvent.
3) After being filtered, the solid product was transferred to the Soxhlet
extraction apparatus for reflux-extraction in acetonitrile, methanol
and dichloromethane for 12 h respectively.
4) The product Si-NP2 was dried under vacuum at 70°C over 24 h.
NH2-group onto the silica surface is capable to react with 3,5-
Dimethylpyrazole-1-methanol under gentle conditions (room temperature,
atmospheric pressure, 4–7 d), using anhydrous acetonitrile as solvent
(Figure 2.1). The reaction is very slow but selective at room temperature
[8][50].
Figure 2.3: The synthesis route of modified polysiloxane [8].

30
This work is focused on the synthesis, characterization and
applications of a new N,N-bis (3,5-Dimethylpyrazol-1-yl methyl)-3-
aminopropyl Polysiloxane (Si-C3H6NPz2) by the chemical modification of
the pre-prepared functionalized silica gel for quantitative extraction and
elimination of methylene blue (MB) from industrial wastewater. This new
product (Si-C3H6NPz2) can be synthesized by mixing and stirring for 7
days of the pre-prepared functionalized silica gel with an excess of 3,5-
Dimethylpyrazole-1-methanol under mild conditions ( room temperature
and atmospheric pressure) using anhydrous acetonitrile as a solvent.

31
Chapter Three
Experimental Work
3.1 Chemicals and Materials
All solvents and chemicals were of analytical scale and used without
additional purification. 3-aminopropyl-functionalized silica gel (Sigma-
Aldrich, purity ≥ 98.5%) having a particle size between 40-63 µm, extent
of labeling: ~1 mmol/g loading NH2 [59]. The chelating agent 3,5-
Dimethylpyrazole-1-methanol (Sigma-Aldrich, purity ≥ 99%) was used
without purification [60]. Dry acetonitrile was used as a solvent, methanol
and dichloromethane were used for reflux extraction. Analytical grade
Methylene blue Dye was used as adsorbent. Distilled water was used to
prepare stock solution. HNO3 (0.1M) and KOH (0.1M) for pH adjustment
were used.
The required materials and apparatus are: glassware, scale, UV-visible
spectrophotometer (model: UV-1601, SHIMADZU), pH meter (model:
3510, JENWAY), FT-IR Spectrometer (Nicolet iS5, iD3 ATR, Thermo
Scientific), centrifuge (model:1020 DE, Centurion Scientific), Shaking
Water Bath (Daihan Labtech, 20 to 250 rpm Digital Speed Control), TGA
Q50 V20.10 Build 36 instrument with heating rate of 50◦C/min and in N2
gaseous atmosphere, Differential Scanning Calorimeter (DSC) Q200, TA
Instruments, desiccator.

32
3.2 synthesis of N,N-bis(3,5-Dimethylpyrazol-1-yl methyl)-3-
aminopropyl Polysiloxane (Si-C3H6NPz2)
A mixture of 3-aminopropyl-functionalized silica gel (Si-C3H6NH2)
(5 g, approximately 5.1 mmol-NH2) and an excess of 3,5-
Dimethylpyrazole-1-methanol (about 2.0 g, 15.9 mmol) in 50 mL of dry
acetonitrile will be stirred at room temperature for 7 days. NH-group on the
silica surface is adequate for reacting with 3,5-Dimethylpyrazole-1-
methanol under moderate conditions ( atmospheric pressure, room
temperature, 4–7 d), using anhydrous acetonitrile as solvent. After being
filtered, the solid product was washed respectively with several portions of
methanol and dichloromethane. The product N,N-bis(3,5-Dimethylpyrazol-
1-yl methyl)-3-aminopropyl Polysiloxane (Si-C3H6NPz2) was dried in a
desiccator for 2 days then it was dried under vacuum at 70°C for 3 h [8].
The synthesis procedure is shown in Figure 3.1.
Figure 3.1: The synthesis procedure of (Si-C3H6NPz2)

33
3.3 Characterization of (Si-C3H6NPz2)
A SEM study was carried out to provide information about the
physical morphology of Polysiloxane surface modified with bipyrazolic
tripodal receptor. The modified silica gel was corroborated by FTIR
analysis to show that Dimethylpyrazole units have been immobilized onto
the surface of the modified silica gel. Thermal stability of polysiloxane
derivatives (Si-C3H6NH2) and (Si-C3H6NPz2) have been determined by
thermogravimetric analysis (TGA) and Differential scanning calorimetry
(DSC) [8][53].
3.4 Preparation of methylene blue solutions
About 0.5 g of methylene Blue was taken in a 500 mL volumetric
flask and diluted up to the mark by addition of deionized water. Different
concentration; 5, 10, 15, 20, 25, 30, 40 and 50 mg/L were prepared by
dilution [4][6].
3.5 Calibration Curve
The concentration of MB was analyzed by UV-visible
Spectrophotometer (UV-1601 SHIMADZU). A standard MB solution of
1000 mg/L was prepared and absorbance was determined at various
wavelengths to obtain a representative plot of absorbance versus
wavelength (Figure 3.2). The wavelength related to the maximum
absorbance which determined from this plot was 665 nm.
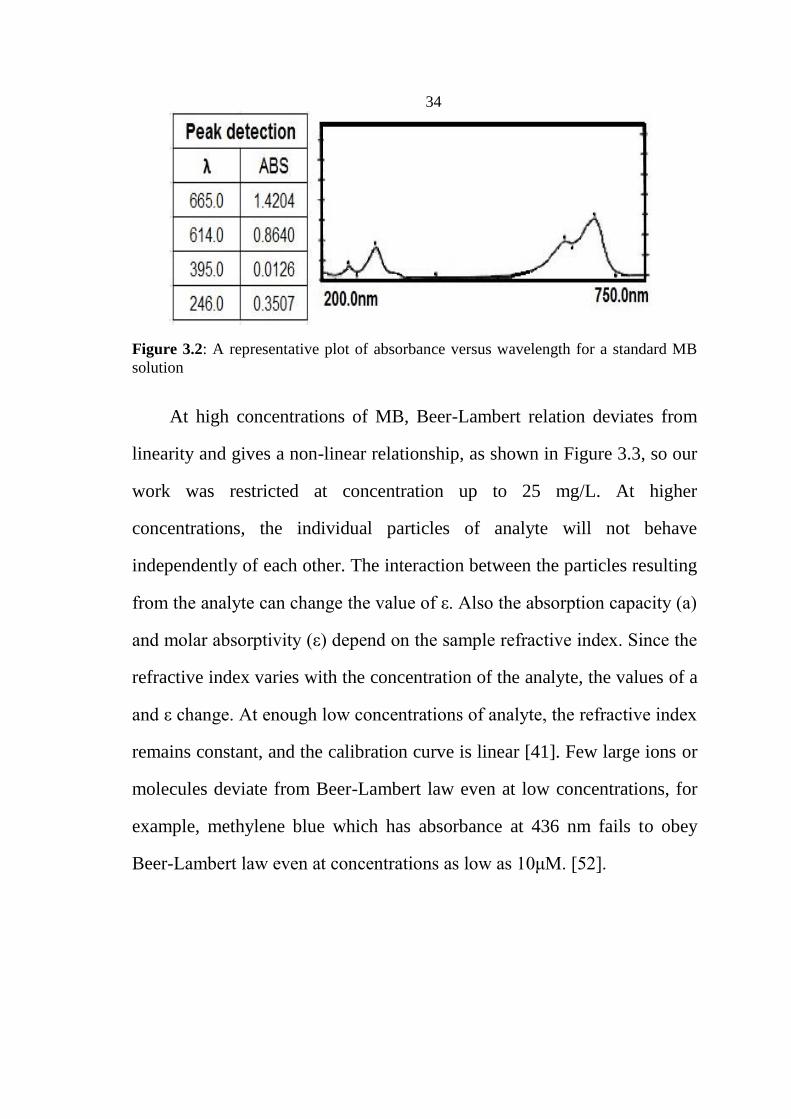
34
Figure 3.2: A representative plot of absorbance versus wavelength for a standard MB
solution
At high concentrations of MB, Beer-Lambert relation deviates from
linearity and gives a non-linear relationship, as shown in Figure 3.3, so our
work was restricted at concentration up to 25 mg/L. At higher
concentrations, the individual particles of analyte will not behave
independently of each other. The interaction between the particles resulting
from the analyte can change the value of ε. Also the absorption capacity (a)
and molar absorptivity (ε) depend on the sample refractive index. Since the
refractive index varies with the concentration of the analyte, the values of a
and ε change. At enough low concentrations of analyte, the refractive index
remains constant, and the calibration curve is linear [41]. Few large ions or
molecules deviate from Beer-Lambert law even at low concentrations, for
example, methylene blue which has absorbance at 436 nm fails to obey
Beer-Lambert law even at concentrations as low as 10μM. [52].

35
Figure 3.3: A representative plot of the absorbance versus concentration of MB
solution.
Linear calibration curve between the absorbance and the concentration
was obtained with MB concentrations in the range 5-20 mg/L (R2 = 0.9998)
as shown in Figure 3.4.
Figure 3.4: Linear calibration curve of absorbance vs. concentration for MB
concentrations in the range 5-20 mg/L

36
3.6 Adsorption Experiments
The maximum absorbance (λmax= 665 nm) as determined from the plot
was used for measuring the absorbance of residual concentration of MB.
The pH of solutions was adjusted using roughly concentrations of 0.1M
HNO3 and 0.1M KOH. By conducting batch mode experimental studies the
efficiency of the adsorbent was evaluated. The adsorption behavior of the
new surface with MB dye was studied. The effect of pH, temperature, dose
of adsorbent, concentration of MB solution and the contact time on the
adsorption of MB dye was studied. The adsorption capacity was
investigated using kinetics and pH effects. Equilibrium isotherm studies
were conducted by varying the following parameters: initial concentration
of MB dye solution, temperature, and adsorbent dose on dye adsorption
from the solution. At the end of time terms, the adsorbent was removed by
centrifuging at 600 rpm and supernatant was analyzed by UV-visible
spectrophotometer for the residual concentration of MB, at 665 nm
wavelength.
The proportion of dye removal (% Removal) is recognized as the ratio
of disparity of the dye concentration before and after adsorption to the
initial concentration of dye in the aqueous solution and was calculated by
the following equation [4][12]:
*
+ (3.1)
Where, Co is the Initial dye concentration (mg/L) in the sample and Ce
is the final dye concentration in the sample solution after treatment.

37
3.6.1 Experiment (1) The temperature effect
For studying the temperature effect on adsorption, 0.10 g adsorbent
samples were added to 50 mL of methylene blue dye solutions with
concentration 20 mg/L at pH 7. Each mixture was placed in Shaking Water
Bath (Daihan Labtech) at desired temperature (the range was 15-55°C) for
30 min. At the end of each time interval, the adsorbent was separated by
centrifuging at 600 rpm and supernatant was tested by UV-visible
spectrophotometer (UV-1601, SHIMADZU) for the residual concentration
of MB, at 665 nm wavelength.
3.6.2 Experiment (2) Effect of pH
Effect of initial pH on adsorption was investigated in the pH range
2.5-12. The pH was adjusted using roughly concentrations of 0.1M HNO3
and 0.1M KOH. 0.05 g adsorbent samples were added to 20 mL of MB dye
solutions with concentration 20 mg/L. The mixtures were placed in
Shaking Water Bath at constant temperature (25°C) for 30 min. At the end
of each time interval, the adsorbent was separated by centrifuging at 600
rpm and supernatant was analyzed by UV-visible spectrophotometer for the
residual concentration of MB, at 665 nm wavelength.
3.6.3 Experiment (3) Effect of initial concentration of MB dye
In order to find out the optimum concentration, 0.041 g of adsorbent
was added to a number of vials contains 20 mL of different concentrations
of MB dye solution (5-25 mg/L), under optimized temperature (15oC) and

38
pH 10 for 30 min. The absorbance of the solution above the solid residue
was measured by UV-spectrophotometer.
3.6.4 Experiment (4) Effect of adsorbent dose
The effect of adsorbent dosage on the adsorption of methylene blue
dye system was studied. In order to find out the optimum adsorbent dose,
0.015, 0.05, 0.10, 0.15 and 0.20 g of adsorbent were added to five vials
contains 20 mL of 15mg/L MB dye solution at pH 11.4 . The mixtures
were placed in Shaking Water Bath at constant temperature (15°C) for 30
min. The absorbance of the solution above the solid residue was measured
by UV-visible for the residual concentration of MB dye.
3.6.5 Experiment (5) Optimization of contact time
The adsorption of MB dye on the adsorbent was studied as a function
of shaking time at 20oC. A sample of 50 mL of dye (15 mg/L) solution at
pH 10.7 was taken in a volumetric flask and shaken with 0.25g of
adsorbent. Aliquots of the clear solution were drawn out by a small slim
pipette at different time intervals until equilibrium was achieved. Each
aliquot was taken and centrifuged for 5 minutes at 600 rpm. The
supernatant was carefully removed by a thin plastic dropper and
absorbance was measured by UV-visible at 665 nm wavelength.
3.7 Thermodynamics and Kinetics of Adsorption
The removal of MB dye was studied by adsorption technique using
the prepared adsorbent (Si-C3H6NPz2). The method was arranged under the

39
optimized case of adsorbent dose, contact time, concentration, temperature
and pH. Using a UV-spectrophotometer, the concentration of dye was
determined before and after adsorption. The data were provided into
Langmuir, Freundlich and Temkin adsorption isotherm equations. The
values of their relevant parameters were determined. Thermodynamic
parameters like free energy (G), enthalpy (H) and entropy (S) of the
systems were calculated by using Van’t Hoff’s plot. Removal proportions
and Kd values for dye systems were calculated at different temperatures
between (15 – 55oC) with intervals of 10
oC.
0.25 g of adsorbent was added to 50 mL of 15 mg/L of MB dye
solution at pH 10.7. The mixture was placed in Shaking Water Bath at
constant temperature (20°C). The rate of adsorption was observed by
studying the contact time up to 6 hours and matched to theoretical models.
Pseudo first-order and second-order kinetic models were examined in this
study using experimental data obtained for different periods of contact
time. Parameters of Pseudo first and second order kinetic models, (K, Qe
and R2) for MB dye adsorption on Si-C3H6NPz2 were determined. The
values of the calculated and experimental Qe were compared.

40
Chapter Four
Results and Discussion
4.1 Modified Polysiloxane (Si-C3H6NPz2) Characterization
4.1.1 SEM Analysis of the Modified Polysiloxane
A SEM study was carried out to provide information about the
physical morphology of Polysiloxane surface modified with bipyrazolic
tripodal receptor. SEM images (Figure 4.1) of the Modified Polysiloxane
surface exhibit coarse and pored nature, showing that the material exhibit
good features for use as an adsorbent.
Figure 4.1: SEM micrographs of the modified Polysiloxane surface (Si-C3H6NPz2)

41
4.1.2 FT-IR Characterization
The new modified silica gel was checked up on by FT-IR analysis. As
presented in Figure 4.2, the sharp band around 1060 cm−1
corresponds to
Si-O-Si anti-symmetric stretching vibrations. Characteristic absorption
band of the 3-aminopropyl-functionlized silica gel (Si-C3H6NH2) for N-H
bond was observed at 1590 cm−1
. On the spectrum of the final product (Si-
C3H6NPz2), it was noticed the disappearance of the absorption band at 1590
cm−1
giving evidence at the reactivity of the primary amine (–NH2) and the
appearance of new characteristic weak bands around 1500 cm−1
and 1600
cm−1
resulted from C=C stretching vibrations in ring and another band
around 1660 cm-1
corresponds to C=N stretching vibration. This confirms
that the Dimethylpyrazole units have been immobilized onto the surface of
the modified silica gel [8].
Figure 4.2: FT-IR spectra of (a) 3-aminopropyl-functionalized silica gel (Si-C3H6NH2)
(b) and the modified Polysiloxane surface (Si-C3H6NPz2)

42
4.1.3 TGA Analysis and Thermal Stability
The thermal stability of polysiloxane derivatives (Si-C3H6NH2), and
(Si-C3H6NPz2) were determined by thermogravimetric analysis.
Thermogravimetric curves indicate the thermal stability of this new
product. The amount broken down in each phase sets the amount of the
grafted compounds. It can be seen in Figure 4.3a, 3-aminopropyl-silica (Si-
C3H6NH2) a weight loss after removal of the physically adsorbed water,
mainly referred to the organic offshoot. The final product (Si-C3H6NPz2)
also exhibited an increase in weight loss attributed to decomposition of the
pyrazolic portion grafted on the surface of silica gel, as shown in Figure
4.3b. The evident increase of the weight loss indicates the break of organic
groups which were grafted on the surface of this silica gel. [8] [50] [53].
Figure 4.3a: Thermogravimetric curves of 3-aminopropyl-functionalized silica gel (Si-
C3H6NH2)

43
Figure 4.3b: Thermogravimetric curves of the modified Polysiloxane surface (Si-
C3H6NPz2)
Figure shows a process of degradation between 150-750°C, which
underlines the high thermal stability for the prepared material [54].
4.2 Investigation of adsorption parameters
4.2.1 Effect of pH on Methylene Blue dye adsorption
The pH of a solution is an important factor that influences the
adsorption capability of the adsorbent, particularly those having functional
groups such as amino groups, which may be protonated or deprotonated
easily to form various surface charges in solutions at varied pH [8][50].
Decrease adsorption of MB dye at low pH is a consequence of the
existence of hydrogen ions which compete with cationic groups on MB for
adsorption spots, thereby blocking the absorption of dye [4]. In addition,

44
under acidic condition (low pH) the basic dye is protonated and the
intensity of the positive charge is localized more on dye molecules causes a
decrease in adsorption [8].
To estimate the pH effect on the adsorption capability of the modified
Polysiloxane surface (Si-C3H6NPz2), the adsorption experiments were done
in solutions with different pH values. Figure 4.4 presents the pH effect on
the uptake of MB dye from its aqueous solution by (Si-C3H6NPz2). Results
demonstrate an increase of MB dye uptake as the pH increased. The uptake
attained its extreme at pH 10. Low absorption capability happens at lower
pH, which may be due to protonation of the ligand nitrogen atoms. At low
pH, the detention of MB dye by the (Si-C3H6NPz2) is not considerable
since the ligand is fully in its protonated state.
Figure 4.4: pH effect on MB dye adsorption. (Co= 20 mg/L, time= 30 min., T=25OC,
adsorbent dose= 0.05 g, sol. Volume= 20 mL)

45
4.2.2 Temperature effect on MB dye adsorption
The effect of temperature on the uptake % of MB dye by (Si-
C3H6NPz2) was studied at (15-55oC) as represented in Figure 4.5. The
figure presents that in general the % removal of MB dye decreases with
increasing the temperature to some extent. Increasing the temperature
above the room temperature has slightly effect on decreasing the adsorption
capability of the new modified surface. The maximum adsorption (78%)
was achieved at 15oC. This indicates that the adsorption of MB dye on (Si-
C3H6NPz2) follows exothermic process.
Figure 4.5: Effect of temperature on MB dye adsorption. ( co= 20 mg/L, time= 30 min.,
adsorbent dose= 0.1 g, sol. Volume= 50 mL)
4.2.3 Effect of MB dye concentration
The effect of initial concentration on the removal efficiency of (Si-
C3H6NPz2) was investigated over wide range of MB dye concentration
keeping other conditions as adsorbent dose, volume of solution and

46
solution pH as constant. The results are presented in Figure 4.6 and Figure
4.7. It can be noticed from these figures that uptake of MB dye was rapid at
lower concentration (5-10 mg/L) and as concentration increase the amount
of MB dye adsorbed was decreased. At lower concentration, the ratio of the
initial number of MB dye molecules to the available surface area is low and
the available sites are high, but at high concentrations of dye, the available
sites are fewer [4] [5]. Proportion removal of MB dye lowered from 80% to
62%. Amount of MB dye adsorbed per unit mass of adsorbent increased
from 1.93 to 7.53 mg/g with increasing MB dye concentration from 5 to 25
mg/L. When all sites are occupied, the adsorption becomes nearly constant
whatsoever concentration of dye is increased. This suggests forming a
monolayer on the modified Polysiloxane surface [4].
Figure 4.6: Effect of MB dye concentration on adsorption. (Temp.= 15oC, time= 30
min., pH= 10, adsorbent dose= 0.04 g, sol. Volume= 20 mL)

47
Figure 4.7: Effect of MB dye conc. on adsorption capacity. (Temp.= 15oC, time= 30
min., pH= 10, adsorbent dose= 0.04 g, sol. Volume= 20 mL)
The distribution coefficient Kd was calculated from equation (4.2)
[5][55]:
(4.1)
Kd term is measured directly in the laboratory. Thus,
(4.2)
Figure 4.8 shows that the distribution ratio (Kd) as a function of
concentrations. The Kd values decrease with the increase in dye
concentration.

48
Figure 4.8: Effect of MB dye conc. On the Distribution Ratio (Kd). (Temp.= 15oC,
time= 30 min., pH= 10, adsorbent dose= 0.04 g, sol. Volume= 20 mL)
4.2.4 Effect of amount of adsorbent
The effect of the dosage of adsorbents on the removal of methylene
blue was studied. Initial concentration of methylene blue solution was
preserved at 15 mg/L, initial volume was 20 mL, pH was around 10 and
temperature was 15oC. The results were represented in Figure 4.9
demonstrates that removal efficiency was greatly increased with increasing
the dose of adsorbent up to 0.1 g. Then removal efficiency did not change
significantly with increasing dose of adsorbent. It shows that removal
efficiency was 78% when the dose was 0.1 g. For 0.15 g, it was 80.5% and
81.8% for 0.2 g. The increment in adsorption effectiveness was a result of
the increased number of adsorption sites [5]. Therefore, removal efficiency
became in equilibrium with the amount of 0.1 g of adsorbent within the
specified parameters.

49
Figure 4.9: Effect of dosage of adsorbent on the removal of MB dye. (Temp.= 15oC,
time= 30 min., pH= 10, conc. of MB dye= 15 mg/L, sol. Volume= 20 mL)
4.2.5 Effect of contact time
To determine the time of maximum adsorption, the adsorption of MB
dye on (Si-C3H6NPz2) was studied as a function of contact time as shown
in Figure 4.10.
The MB dye showed a rapid rate of adsorption for the first 15 minutes
and the adsorption rate becomes almost insignificant after that, because of
use of the adsorption sites. The adsorption capacity rate is high at the
beginning due to large surface area of adsorbent available for adsorption of
methylene blue dye. At the beginning of the adsorption process all reaction
sites are vacant and therefore the degree of removal is high. After the initial
rapid absorption, the absorption rate was very slow almost reaching a
constant value [37] [38].
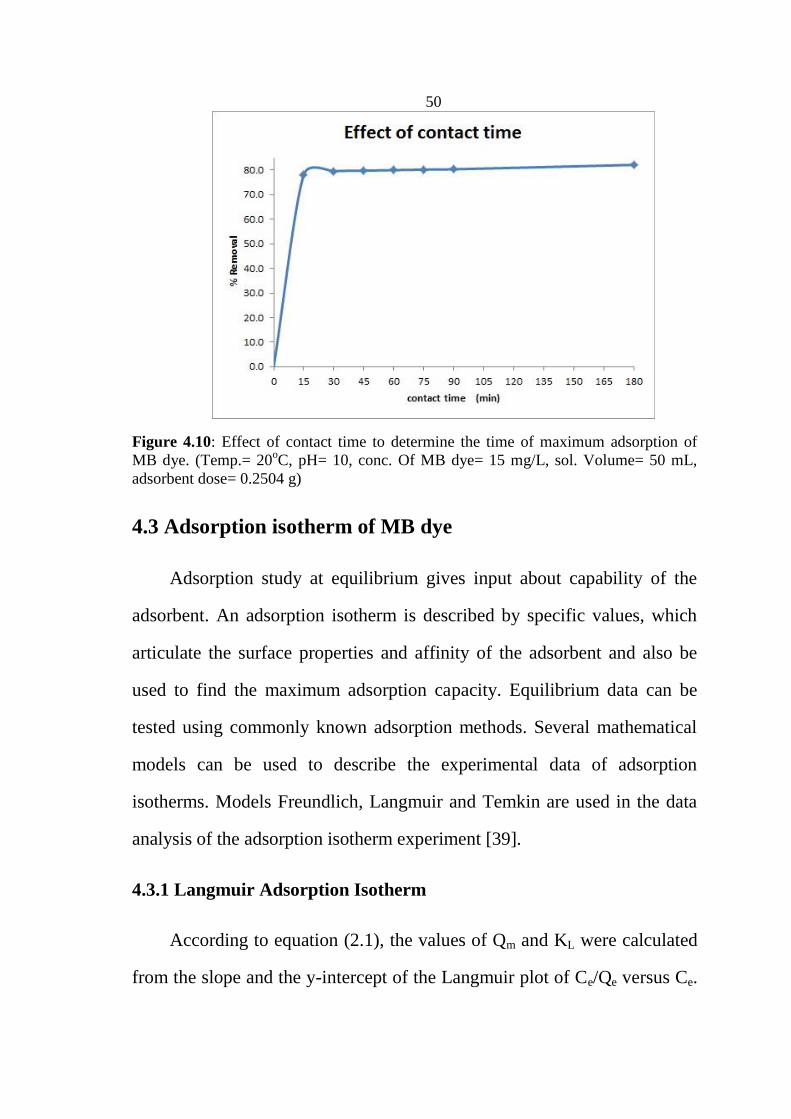
50
Figure 4.10: Effect of contact time to determine the time of maximum adsorption of
MB dye. (Temp.= 20oC, pH= 10, conc. Of MB dye= 15 mg/L, sol. Volume= 50 mL,
adsorbent dose= 0.2504 g)
4.3 Adsorption isotherm of MB dye
Adsorption study at equilibrium gives input about capability of the
adsorbent. An adsorption isotherm is described by specific values, which
articulate the surface properties and affinity of the adsorbent and also be
used to find the maximum adsorption capacity. Equilibrium data can be
tested using commonly known adsorption methods. Several mathematical
models can be used to describe the experimental data of adsorption
isotherms. Models Freundlich, Langmuir and Temkin are used in the data
analysis of the adsorption isotherm experiment [39].
4.3.1 Langmuir Adsorption Isotherm
According to equation (2.1), the values of Qm and KL were calculated
from the slope and the y-intercept of the Langmuir plot of Ce/Qe versus Ce.

51
From Langmuir plots which is shown in Figure 4.11 amount adsorbed for
monolayer formation (Qm), Langmuir adsorption-desorption equilibrium
constant (KL) and regression constant (R2) were determined and values are
shown in Table 4.1.
Figure 4.11: Langmuir plot for MB dye adsorption on (Si-C3H6NPz2). (Temp.= 15oC,
pH= 10, time= 30 min., sol. Volume= 20 mL, adsorbent dose= 0.0413 g)
Table 4.1: Parameters and correlation coefficient of Langmuir
isotherm model for adsorption of MB dye onto (Si-C3H6NPz2).
Langmuir isotherm model parameters
Adsorbate Parameters
Qm (mg/g) KL= (L/mg) RL R2
(Si-C3H6NPz2) 11.09 0.25 0.138 0.9694
The RL value in this investigation was calculated according to
equation (2.2). It was found to be equal 0.138 at 15 ◦C which is between 0
and 1 indicating that the MB dye adsorption on (Si-C3H6NPz2) is favorable
[38] [44].

52
4.3.2 Freundlich Adsorption Isotherm
The constants KF and n were determined by using equation (2.4)
which can be used to make a graph of ln(Qe) vs. ln(Ce) as shown in Figure
4.12:
Figure 4.12: Freundlich plot for MB dye adsorption on (Si-C3H6NPz2). (Temp.= 15oC,
pH= 10, time= 30 min., sol. Volume= 20 mL, adsorbent dose= 0.0413 g)
Freundlich constants KF and n and regression constant (R2) were
determined and values are shown in Table 4.2:
Table 4.2: Parameters and correlation coefficient of Freundlich
isotherm model for adsorption of MB dye onto (Si-C3H6NPz2).
Freundlich isotherm model parameters
Adsorbate
Parameters
1/n n KF= (mg/g
(L/mg)1/n
) R
2
(Si-C3H6NPz2) 0.602 1.66 2.25 0.9307

53
From the data in Table 4.2, that value of 1/n = 0.6041 while n=1.66
indicating that the sorption of MB dye on (Si-C3H6NPz2) is favorable and
the R2 value is 0.9307.
4.3.3 Temkin Adsorption Isotherm
According to equation (2.5) a graph of Qe vs. (ln Ce) can be plotted as
shown in Figure 4.13. The constants A, B and b were calculated. All
parameters and correlation coefficient are listed in Table 4.3.
Figure 4.13: Temkin plot for MB dye adsorption on (Si-C3H6NPz2). (Temp.= 15oC,
pH= 10, time= 30 min., sol. Volume= 20 mL, adsorbent dose= 0.0413 g)
Table 4.3: Temkin isotherm model parameters and correlation
coefficient for adsorption of MB dye on (Si-C3H6NPz2).
Temkin isotherm model parameters
Adsorbate Parameters
A (L/g) b (J/mol) B R2
(Si-C3H6NPz2) 0.1326 6242 0.3838 0.9856

54
The graphically calculated Qm, KL, RL and R2 (Langmuir isotherm),
1/n, n, KF, and R2 (Freundlich isotherm), A, b, B, and R
2 (Temkin
isotherm) are rearranged in Table 4.4.
Table 4.4: Parameters and correlation coefficient of Langmuir,
Freundlich and Temkin for adsorption of MB dye on (Si-C3H6NPz2).
Langmuir isotherm model parameters
Adsorbate
Parameters
Qm (mg/g) KL=
(L/mg)
RL R2
(Si-C3H6NPz2) 11.09 0.25 0.138 0.9694
Freundlich isotherm model parameters
Adsorbate
Parameters
1/n n KF
(mg/g (L/mg)1/n
) R
2
(Si-C3H6NPz2) 0.602 1.66 2.25 0.9307
Temkin isotherm model parameters
Adsorbate
Parameters
A (L/g) b
(J/mol) B R
2
(Si-C3H6NPz2) 0.1326 6242 0.3838 0.9856
Three adsorption isotherm models were examined. The adsorption
data appropriated to Langmuir, Freundlich, and Temkin. From Langmuir
isotherm data in Table 4.4 the value of RL in this investigation was found to
be 0.138 at 15 ◦C indicating that the adsorption of MB dye on (Si-
C3H6NPz2) is favorable and R2 value is 0.9694. From Freundlich isotherm
data in Table 4.4, that value of 1/n = 0.6041 while n=1.66 pointing that the
adsorption of MB dye on (Si-C3H6NPz2) is favorable and the R2 value is

55
0.9307. Larger value of n which means smaller value of 1/n involves
stronger interaction among adsorbent and adsorbate [41][42]. 1 / n between
0 and 1 is a measurement of the adsorption density and heterogeneity of the
surface, which can become more heterogeneous when 1 / n becomes close
to zero [38]. Adsorption data equipped in Langmuir, Freundlich, Temkin
and from which Temkin adsorption model has the greatest value of
regression and therefore the most convenient. This isotherm contains a
factor that includes adsorbent-adsorbate interactions which indicates the
presence of this interaction.
4.4 Adsorption Thermodynamics
ΔH and ΔS can be determined using the Van't Hoff plot (Figure 4.14),
according to equation (4.9):
Figure 4.14: A graph of lnKd vs. 1/T for MB dye adsorption on (Si-C3H6NPz2).
(Temp.= 15oC, pH= 10, time= 30 min., adsorbent dose= 0.0413 g, sol. Volume= 20 mL)
Exothermic

56
H◦ and S
◦ were computed from the slope and y-intercept of a linear
plot for lnKd versus 1/T. The results present that enthalpy of adsorption
H◦ was −16.66 kJ mol
−1 and S
◦ was 1.78 J mol
−1 K
−1. G
◦ was
calculated at different temperatures from the following equation [56]:
(4.1)
The computed thermodynamic values are listed in Table 4.5.
Table 4.5: The values of the thermodynamic of MB dye adsorption at
various temperatures.
Adsorbent H
o
(KJ/mol)
So
(J/mol.K)
Go
(KJ/mol)
288 K 298 K 308 K 318
K 328 K
Si-C3H6NPz2 -16.66 1.78 -17.17 -17.19 -
17.21
-
17.23 -17.25
Negative values of ∆G point that adsorption is spontaneous at these
temperatures. The negative ∆H◦ denotes that this adsorption is an
exothermic process, declaring that this adsorption is promoted at low
temperature. In general enthalpy change value ∆H for physical adsorption
is lower than that of the chemical adsorption. Generally, ∆H for physical
adsorption reaches up to 40 KJ/mol which is much less than that of
chemical adsorption which varies from 40 to 800 KJ / mol. ∆H value was
higher than that corresponding to the physical adsorption. This suggests
that the nature of adsorption is a chemical process which may be provided
as shown in Figure 4.15. The small positive value of ∆S° indicates that
some structural changes take place on the adsorbent and the entropy at the

57
solid / liquid interface in the adsorption system increases through
adsorption process [29].
Figure 4.15: The suggested interaction between MB dye and Modified SiO2 with
bipyrazolic tripodal receptor
4.5 Adsorption kinetics of methylene blue dye
Rate constant for the adsorption of methylene blue from the dyeing
effluent on adsorbent (Si-C3H6NPz2) was specified depending on the
pseudo first-order equation (equation 2.6). A linear graph of log(Qe− Qt )
vs. time as shown in Figure 4.16 was plotted to obtain the pseudo first
order rate constant. If the plot was linear with high correlation coefficient,
this indicated that Lagergren equation is proper to MB dye adsorption on
Si-C3H6NPz2, so the adsorption process is a pseudo first order. The
Lagergren first order rate constant (K1) and Qe specified from this model
are presented in Table 4.6 with the corresponding correlation coefficient.

58
Figure 4.16: Pseudo first order sorption kinetics of MB dye on (Si-C3H6NPz2). (Temp.=
20oC, pH= 10, sol. Volume= 50 mL, adsorbent dose= 0.2504 g)
The calculated Qe value does not match with the experimental Qe
value (Table 4.6). This pointed that the adsorption of MB dye does not
obey the first-order kinetics so that the pseudo first order model is not the
appropriate one [40].
The results confirm that the pseudo second order kinetic model perfect
fit the experimental data with linear regression coefficient which equals
0.9999 (Figure 4.17) [56].
Qe experimental and Qe calculated values for the pseudo second order
model are illustrated in Table 4.6. It can be observed from this table that
there is an agreement between Qe experimental and Qe calculated values for
the pseudo second order model. Also K2 is much greater than K1. Hence,
the pseudo second order model well represented the adsorption kinetics.

59
Figure 4.17: Pseudo second order adsorption kinetics of MB dye on (Si-C3H6NPz2).
(Temp.= 20oC, pH= 10, sol. Volume= 50 mL, adsorbent dose= 0.2504 g)
Table 4.6: Pseudo first order and pseudo second order parameters for
MB dye adsorption onto Si-C3H6NPz2 at 20oC.
Adsorbent Qe (exp)
(mg/g)
Pseudo first order Pseudo second order
K1
(min-1
)
Qe (calc) (mg/g)
R2
K2
(g/mg min)
Qe (calc) (mg/g)
R2
Si-C3H6NPz2 2.53 5.07×10⁻³
0.203 0.9567 406.01×10⁻³
2.46 0.9999
4.6 Recovery and reusability of Si-C3H6NPz2 adsorbent
Recovering MB dye from Si-C3H6NPz2 was carried out at 20 ◦C. The
adsorbent was recovered by filtration, washed with portions of 6N HCl and
then washed with deionized water and allowed to dry at room temperature
for two days. The adsorption capability of regenerated Si-C3H6NPz2 was
tested under similar conditions and compared to the first use. 0.1 g of
regenerated adsorbent was added to a 20 mL of 15 mg/L MB dye solution

60
at pH 10. Comparing the adsorption capacity of the regenerated adsorbent
with a fresh one (Figure 4.18) showed good adsorption capacity and has
good stability and can be used again and again without reducing its
capability [55].
Figure 4.18: Percentage of MB dye removal by the regenerated adsorbent compared
with a fresh one at (Temp.= 15oC, pH= 10, adsorbent dose= 0.1002 g, sol. Volume= 20
mL, contact time= 30 min)
4.7 Studying the Antimicrobial Activity of Si-C3H6NPz2
N,N-bis(3,5-Dimethylpyrazol-1-ylmethyl)-3-aminopropyl
Polysiloxane (Si-C3H6NPz2) and Si-C3H6NPz2 with adsorbed cupper had
been tested for their antimicrobial activity. The compounds were dissolved
with Dimethyl sulfoxide (DMSO) Positive control (using and sensitive
media) especially against pseudomonas aeruginosa, Staphylococcus aurous,
and Escherichia coli. The result was negative; MacConkey Agar media,
Mannitol Salt Agar, and Eosin Methylene Blue Agar were prepared for

61
detection of antimicrobial activity of the isolates Pseudomonas aeruginosa,
Staphylococcus aurous, and Escherichia coli respectively. 10 mg of Si-
C3H6NPz2 were dissolved in 1 ml of 10% Dimethyl sulfoxide (DMSO).
After agar plate was fertilized by staining with bacterial-inoculated wipe
over the whole antiseptic agar surface to ensure an even distribution of
inoculums; wells were made by sterile tips. 100µl of Si-C3H6NPz2 was
added; in one well where the other wells 100µl of DMSO was added and
third well with positive control (some cases an Antibiotic disk was added
as positive control). Then the plates were incubated at 37°C for 16 hrs. All
plates (including the three types of bacteria) were showed negative results
for Si-C3H6NPz2 and the formula+Cu (figure 4.19) [57][58].
Figure 4.19: Antimicrobial Activity of Si-C3H6NPz2, all plates were showed negative
results for Si-C3H6NPz2 and the formula+Cu.

62
Conclusions
In this study, (Si-C3H6NPz2) was applied successfully for the removal
of MB dye from aqueous solution. Depending on the results, (Si-
C3H6NPz2) was able to remove MB rapidly within 15 min with high
removal efficiency at pH around 10, 20oC temperature, 0.25 g weight of
dose and initial concentration of 15 mg/L of 50mL MB dye solution.
Around 80% removal efficiency of MB dye was achieved after 180 min. at
the same condition.
Following conclusions can be made based on experimental data: It
was found that adsorption of methylene blue using (Si-C3H6NPz2) was
explained well by Temkin model. Temkin adsorption model has the highest
value of regression (0.9856) and thus the best fit. This model includes a
factor of adsorbent-adsorbate interactions which points out the existence of
this interaction and the results indicate monolayer type exothermic
adsorption process involved in the system.
The Langmuir maximum adsorption capacity Qm and the RL value
indicate that adsorption of MB dye onto (Si-C3H6NPz2) is favor. Freundlich
model parameters, value of 1/n and n showing that the adsorption of MB
dye onto (Si-C3H6NPz2) is favorable.
The amount of MB dye adsorbed per unit mass of (Si-C3H6NPz2)
obtained by Lagergren pseudo second order model, Qe(calc.) was in
agreement with the experimental value, Qe(exp.) indicates that the
chemisorption may be the rate limiting step where the valence forces are

63
involved by electrons sharing or exchange between the adsorbent and the
adsorbate.
The negative Go values show that the adsorption is favorable and
spontaneous at these temperatures. The negative Ho indicates that the
adsorption is an exothermic process and points out that the adsorption is
preferable at low temperature. ∆H value was higher than those
corresponding to physical adsorption. This would suggest that this
adsorption is a chemical process. Small positive value of ∆S° indicates that
some structural changes take place on the adsorbent and the entropy at the
solid / liquid interface in the adsorption system increases through
adsorption process.
Si-C3H6NPz2 is a good effective adsorbent for the removal of MB dye
from the wastewater. Si-C3H6NPz2 has lower adsorption capacity compared
to many other non-conventional adsorbents. Si-C3H6NPz2 can provide a
convenient way for effective treatment of industrial wastewater polluted
with methylene blue under alkaline, low concentration of MB dye at
temperature around 20oC for removal over 70%.
Suggestions for Future Work:
Further investigation is needed to study the mechanism of removing
methylene blue using this adsorbent.
More study on the economic feasibility of the modified silica gel.
Studying the effect of presence of metal ions in the aqueous medium on
MB dye adsorption.

64
Recommendations:
This new organic–inorganic material can be investigated in various
applications. Among these applications is the biological activity of some
new amine-modified silica gel against some G(+) and G(-) Bacteria.
Another attractive application of such these materials is that may be tested
in solar cells.

65
References
[1] Bradford A., Pollution Facts & Types of Pollution, Live Science
Contributor; 2015 March 10; Available from:
http://www.livescience.com/22728-pollution-facts.html
[2] Rajappa A., Ramesh K., Nandhakumar V., Ramesh H., Sivakumar S.,
Savithri S. 2014 August 27, Thermodynamics and Instrumental
Analysis of Congo Red Dye Adsorption onto Commercial
Activated Carbon, International Journal of Chemistry and
Pharmaceutical Sciences, Vol. 2 (8): 1068-1073
[3] Sivaraj R., Venckatesh R., Gowri, Sangeetha G. 2010, Activated
Carbon Prepared From Eichornia Crassipes As An Adsorbent
For The Removal Of Dyes From Aqueous Solution, International
Journal of Engineering Science and Technology Vol. 2(6): 2418-
2427.
[4] Dargo H., Gabbiye N., Ayalew, A., Sep. 2014, Removal of
Methylene Blue Dye from Textile Wastewater using Activated
Carbon Prepared from Rice Husk, International Journal of
Innovation and Scientific Research, Vol. 9 (2): 317-325.
[5] Shehata A., December 2013, Removal of Methylene Blue Dye from
Aqueous Solutions by Using Treated Animal Bone As A Cheap
Natural Adsorbent, International Journal of Emerging Technology
and Advanced Engineering, Vol. 3, Issue 12: 507-513.
[6] Wong Y., Senan M., Atiqah N., 2013 March 21, Removal of
Methylene Blue and Malachite Green Dye Using Different Form

66
of Coconut Fiber as Absorbent, Journal of Basic & Applied
Sciences, Vol. 9: 172-177.
[7] Ruthven D.M., PRINCIPLES OF ADSORPTION AND
ADSORPTION PROCESSES, USA, John Wiley & sons, 1984,
433 p.
[8] Radi S., Tighadouini S., Toubi Y., Bacquet M., 2010 Sep. 7,
Polysiloxane surface modified with bipyrazolic tripodal receptor
for quantitative lead adsorption, Journal of Hazardous Materials,
185: 494–501.
[9] Miclescu A., Wiklund L. 2010, Methylene blue an old drug with
new indications, Romanian Journal of Anesthesiology and Intensive
Therapy, Vol.17 (1): 35-41.
[10] Tani A., Thomson A., Butt J., 2001 Oct, Methylene blue as an
electrochemical discriminator of single and double stranded
oligonucleotides immobilized on gold substrates, Analyst, 126
(10): 1756-1759.
[11] Miclescu A. 2009, Cerebral Protection in Experimental
Cardiopulmonary Resuscitation - With Special Reference to the
Effects of Methylene Blue, Acta Universitatis Upsaliensis, Digital
Comprehensive Summaries of Uppsala Dissertations from the
Faculty of Medicine 466, 79 p.
[12] Visa M., Bogatu C., Duta A. 2010 June 15, Simultaneous adsorption
of dyes and heavy metals from multicomponent solutions using
fly ash, Vol. 256 (17): 5486–5491.

67
[13] Clifton J., Leikin JB., 2003 August, Methylene Blue, American
Journal of Therapeutics, Vol.10 (4): 289-291.
[14] Carlson J., Re: Students asked if methylene blue put into cookies
as a prank was dangerous, 1999 May 3; Available from:
http://www.madsci.org/posts/archives/1999-05/925860441.Me.r.html
[15] Medsafe, Data sheet: Methylene Blue Solution for Injection, 2010
December; Available from:
www.medsafe.govt.nz/profs/datasheet/m/MethyleneBlueinj.pdf
[16] Gillman K., Methylene Blue and Serotonin Toxicity Syndrome,
2014 December 4; Available from:
http://www.psychotropical.com/methylene-blue
[17] Shopes E., Gerard W., Baughman J. 2013 June, Methylene Blue
Encephalopathy: A Case Report and Review of Published Cases,
AANA Journal, Vol. 81 (3): 216-221.
[18] Renugadevi N., Sangeetha R., Lalitha P. 2011, Kinetics of the
adsorption of methylene blue from an industrial dyeing effluent
onto activated carbon prepared from the fruits of Mimusops
Elengi, Archives of Applied Science Research, 3 (3): 492-498.
[19] Tahir H., Sultan M., Jahanzeb Q., August, 2008, Removal of basic
dye methylene blue by using bioabsorbents Ulva lactuca and
Sargassum, African Journal of Biotechnology, Vol. 7 (15): 2649-
2655.

68
[20] Houas A., Lachheb H., Ksibi M. , Alaloui E., Guillard C., Herrmann
j.M. 2001, Photocatalytic degradation pathway of methylene blue
in water, Applied Catalysis B: Environmental, 31: 145–157.
[21] Abd El-Latif M., Ibrahim A., El-Kady M. 2010, Adsorption
Equilibrium, kinetics and thermodynamics of methylene blue
from aqueous solutions using biopolymer oak sawdust
composite, Journal of American Science ; 6(6): 267-283.
[22] UNEP, Desk Study on the Environment in the Occupied
Palestinian Territories, March 2001, 42-87.
[23] EL-Hamouz A. 2010 October 21, Final Report on The Development
of a National Master Plan for Hazardous Waste Management for
the Palestinian National Authority (PNA), An-Najah National
University, Nablus Palestine, 146 p.
[24] Saeed R., Uddin F., Summer S. 2005, Adsorption of Methylene Blue
on Activated Charcoal, Silica Gel and Silica, Asian J. of Chem. 17
(2): 737-742.
[25] Rashed N., Adsorption Technique for the Removal of Organic
Pollutants from Water and Wastewater, InTech; Organic
Pollutants - Monitoring, Risk and Treatment; 2013; Ch.7: 167-193;
Available from: http://dx.doi.org/10.5772/54048
[26] Worch E., Adsorption Technology in Water Treatment-
Fundamentals, Processes, and Modeling, Germany, Walter de
Gruyter GmbH & Co. KG, 2012, 345 p.

69
[27] Ferraria L., Kaufmann J., Winnefeld F., Plank J. July 2010,
Interaction of cement model systems with superplasticizers
investigated by atomic force microscopy, zeta potential, and
adsorption measurements, J Colloid Interface Sci., Vol. 347 (1):
15–24.
[28] Chen X., 2015 January 22, Modeling of Experimental Adsorption
Isotherm Data, Information, 6: 14-22.
[29] Piccin J., Dotto G., Pinto L. 2011 April/ June, Adsorption Isotherms
and Thermochemical Data of FD&C RED N° 40 Binding by
Chitosan, Brazilian Journal of Chemical Engineering, Vol. 28 (2):
295 – 304.
[30] Ghiaci M., Abbaspur A., Kia R., Seyedeyn-Azad F. 2004,
Equilibrium isotherm studies for the sorption of benzene,
toluene, and phenol onto organo-zeolites and as-synthesized
MCM-41, Separation and Purification Technology J., Vol. 40 (3):
217–229.
[31] Langmuir I., 1916 The constitution and fundamental properties of
solids and liquids, J. Am. Chem. Soc., Vol. 38 (11): 2221–2295.
[32] Ncibi M., 2008 May 1, Applicability of some statistical tools to
predict optimum adsorption isotherm after linear and non-linear
regression analysis, Journal of Hazardous Materials, Vol. 153 (1-2):
207–212.

70
[33] Adejo S., Ekwenchi M., 2014 Jan., Proposing a new empirical
adsorption isotherm known as Adejo-Ekwenchi isotherm, Journal
of Applied Chemistry, Vol. 6 (5): 66-71.
[34] Malek A., Farooq S., 1996 Nov., Comparison of isotherm models
for hydrocarbon adsorption on activated carbon, AIChE J., Vol.
42 (11): 3191–3201.
[35] Foo K., Hameed B., 2009 Sep. 7, Insights into the modeling of
adsorption isotherm systems, Chemical Engineering J., 156: 2–10.
[36] Dada A., Olalekan A., Olatunya A., DADA O., 2012 Nov. – Dec,
Langmuir, Freundlich, Temkin and Dubinin – Radushkevich
Isotherms Studies of Equilibrium Sorption of Zn2+
Unto
Phosphoric Acid Modified Rice Husk, IOSR Journal of Applied
Chemistry, Vol. 3 (1): 38-45.
[37] Shaibu S., Adekola F., Adegoke H., Ayanda O., 2014 June 12, A
Comparative Study of the Adsorption of Methylene Blue onto
Synthesized Nanoscale Zero-Valent Iron-Bamboo and
Manganese-Bamboo Composites, Materials, 7: 4493-4507.
[38] Kamal H., 2014, Removal of Methylene Blue from aqueous
solutions using composite hydrogel prepared by gamma
irradiation, Journal of American Science; 10 (4): 125-133.
[39] Rahimi M, Vadi M., 2014 May 19, Langmuir, Freundlich and
Temkin Adsorption Isotherms of Propranolol on Multi-Wall
Carbon Nanotube, Journal of Modern Drug Discovery and Drug
Delivery Research; 1-3.

71
[40] Hameed B., Mahmoud D., Ahmad A., 2008 Feb., Equilibrium
modeling and kinetic studies on the adsorption of basic dye by a
low-cost adsorbent: Coconut (Cocos nucifera) bunch waste,
Journal of Hazardous Materials; 158 (1): 65–72.
[41] Umoren S., Etim U., Israel A. 2013, Adsorption of methylene blue
from industrial effluent using poly (vinyl alcohol), J. Mater.
Environ. Sci. 4 (1): 75-86.
[42] Shahryari Z., Goharrizi A. , Azadi M., 2010 March, Experimental
study of methylene blue adsorption from aqueous solutions onto
carbon nano tubes, International Journal of Water Resources and
Environmental Engineering: Vol.2 (2): 016-028.
[43] Patil S., Renukdas S., Patel N., 2011, Removal of methylene blue, a
basic dye from aqueous solutions by adsorption using teak tree (
Tectona grandis) bark powder, International Journal of
Environmental Sciences; Vol. 1 (5): 711-726.
[44] Abd El-Latif M., Ibrahim A., El-Kady M., 2010 Adsorption
Equilibrium, kinetics and thermodynamics of methylene blue
from aqueous solutions using biopolymer oak sawdust
composite, Journal of American Science; 6 (6): 267-283.
[45] Joseph J.,Xavier N., 2013, Equilibrium and kinetic studies of
Methylene blue onto activated carbon prepared form Crescentia
cujete fruit shell, Nature and Science J; 11 (4): 53-58.
[46] Ho Y., Malarvizhi R., Sulochana N., 2009, Equilibrium Isotherm
Studies of Methylene Blue Adsorption onto Activated Carbon

72
Prepared from Delonix regia Pods, Journal of Environmental
Protection Science; Vol. 3: 111 – 116.
[47] El Boujaady H., Mourabet M., Bennani-Ziatni M., Taitai A., 2013
Oct. 23, Adsorption/desorption of Direct Yellow 28 on apatitic
phosphate: Mechanism, kinetic and thermodynamic studies,
Journal of the Association of Arab Universities for Basic and
Applied Sciences; 16: 64–73.
[48] Kanawade S., Gaikwad R., 2011 October, Removal of Methylene
Blue from Effluent by Using Activated Carbon and Water
Hyacinth as Adsorbent, International Journal of Chemical
Engineering and Applications; Vol. 2 (5): 318-319.
[49] El-Ashgar N., Saadeh S., 2006, Preparation of Immobilized-
Polysiloxane Salicylaldehyde Propylimine and Its Application, J.
Al-Aqsa Unv., 10 (S.E): 153-161.
[50] Radi S., Toubi Y., Tighadouini S., Bacquet M., 2013 November,
Solid-phase extraction of Hg(II), Zn(II) and Cd(II) from water
using silica gel modified with bipyrazolic tripodal receptor,
Indian Journal of Chemical Technology, Vol. 20: 423-428.
[51] D. Harvey , MODERN ANALYTICAL CHEMISTRY, McGraw-
Hill, 1st ed., 2000, 798 p.
[52] Mehta A., 2012 May 14, Ultraviolet-Visible (UV-Vis) Spectroscopy
– Limitations and Deviations of Beer-Lambert Law, Analytical
Chemistry Notes, available from: http://pharmaxchange.info/press

73
[53] Radi S., Basbas N., Tighadouini S., Bacquet M., 2014, New
Polysiloxane Surfaces Modified with ortho-, meta- or para-
Nitrophenyl Receptors for Copper Adsorption, Journal of Surface
Engineered Materials and Advanced Technology; 4: 21-28.
[54] Radi S., Tighadouini S., Bacquet M., Degoutin S., Cazier F.,
Zaghrioui M., Mabkhot Y., 2014, Organically Modified Silica with
Pyrazole-3-carbaldehyde as a New Sorbent for Solid-Liquid
Extraction of Heavy Metals, Molecules; 19: 247-262.
[55] Anagho S., Ketcha J., Kammegne A., Ndi J., Ndifor-Angwafor N.,
Tchuifon D., 2013, Equilibrium, kinetic and thermodynamic
studies of phosphoric acid adsorption onto activated carbon,
Pelagia Research Library, Der Chemica Sinica; 4 (3): 58-68
[56] Abramian L., El-Rassy H., 2009, Adsorption kinetics and
thermodynamics of azo-dye Orange II onto highly porous titania
aerogel, Chemical Engineering Journal; 150: 403–410.
[57] Venton DL, Gudipati E., 1995 July 19, Entrapment of enzymes
using organo-functionalized polysiloxane copolymers, Biochimica
et Biophysica Acta (BBA) - Protein Structure and Molecular
Enzymology; Vol. 1250 (2): 117–125
[58] Jasim H., Muslim A., AL-Sa'adi W., 2014, Studying the Biological
Activity of Some Oxazepine Derivatives Against Some G(+)
and
G(-)
Bacteria, Ibn Al-Haitham Jour. For Pure & Appl. Sci.; Vol. 27
(3): 333-338.

74
[59] Sigma-Aldrich, Product Specification, product number: 331457, USA
available from: www.sigmaaldrich.com
[60] Sigma-Aldrich, Product Specification, product number: 364258, USA
available from: www.sigmaaldrich.com

75
Appendix
A.1: SEM micrographs for the Modified Polysiloxane

76
A.2: SEM micrographs for the Modified Polysiloxane with Methylene blue
A.3: Thermogravimetric curves of 3-aminopropyl-functionalized silica gel
(Si-C3H6NH2)

77

78
A.4: Thermogravimetric curves of the modified Polysiloxane surface (Si-
C3H6NPz2)

79
A.5: FT-IR spectra of 3-aminopropyl-functionalized silica gel (Si-
C3H6NH2)

80
A.6: FT-IR spectra of the modified Polysiloxane surface (Si-C3H6NPz2)

81
A.7: FT-IR spectra of (a) 3-aminopropyl-functionalized silica gel (Si-
C3H6NH2) (b) and the modified Polysiloxane surface (Si-C3H6NPz2)

82
A.7: Data Tables of Experiments

83

84

5102

ب
(Si-C3H6NPz2)
FT-IR
Dimethylpyrazole
(SEM)

ج
9559
;559
<55<5
(Si-
C3H6NPz2)LagergrenQe
6.8:Qe6.97
Temkin(R2= 0.99)
QmLangmuir55.5=
59155.<5058
RL5.57<(Si-
C3H6NPz2)(1/n=0.6)
Freundlich
∆G°
∆H°
∆H°
∆S°
(Si-C3H6NPz2)