ren ren company ipo analysis
DESCRIPTION
RenRen (RENN) IPO & Company Analysis Indepth report on the RenRen China Internet Social Network company & its IPO. TABLE OF CONTENTS Foreword 3 Executive Summary 4 IPO Details 5 Renren User Base & Internet Demographics in China 5 Financials 8 Sources of Revenue 10 Plans for Proceeds from IPO 11 Early Investors 11 Risk Factors 12 Management 13 Current Competition in China 14 Comparison to Facebook 22 Recent IPO Analysis 23 Investment Strategy for Renren 26TRANSCRIPT

PRESENTS
COMPANY IPO ANALYSIS
May 4, 2011
By Kenny Hong, CFA

2
TABLE OF CONTENTS
Foreword 3
Executive Summary 4
IPO Details 5
Renren User Base & Internet Demographics in China 5
Financials 8
Sources of Revenue 10
Plans for Proceeds from IPO 11
Early Investors 11
Risk Factors 12
Management 13
Current Competition in China 14
Comparison to Facebook 22
Recent IPO Analysis 23
Investment Strategy for Renren 26

3
FOREWORD
“China Internet IPO”, “Social Network“, and “Facebook” are the hottest buzz words of 2011.
Renren includes all 3 of those elements and will be one of the first social network websites
going IPO with Linkedin, Facebook, and Kaixin001 following after. Renren is a China Internet
Social Network company designed to look like the Facebook of China and is going IPO on
Wednesday, May 3, 2011. China has 457 million Internet users at the end of 2010 and is
estimated to grow to over 700 million by 2014. Renren has 114 million registered users. The
wave of hot IPOs has evolved from US Tech. firms in the 1990s to the US Internet IPOs in the
2000s to the China Internet IPOs in the 2005-2010 to the Global Social Media + China Internet
Social Media in 2011. As an early adopter and user of various Internet Social Networks, I have
experience the evolution of sites such as Friendster, Myspace, Facebook, Linkedin, and now the
China Websites and Social Networks such as Renren as I am currently based in Shanghai, China.
The recent China Internet IPOs from Dec. 2010 such as Dang Dang (Dang), Yokou (Yoku), and
Qihoo (QIHU) have been successful for institutional investors, 45% to 366% return from IPO
price to May 3rd
while the return for investors after the open IPO price has been mixed from -
5% to 121%. More data are provided in the following report. The information from this
research report has been taken from the Renren prospectus and various reputable sources in
English and Chinese as well. We hope this report will better help you in your investment
decision, business decision, or academic interests by providing you with an overview of Renren
as a company and the social network in China as well.
Kenny Hong, CFA
Vice President, Investment Advisory
4
EXECUTIVE SUMMARY
▪ Price per share: $12-14 (increase from previous $9-11)
▪ 114 million registered users (February 2011)
o Aggregate 2.9 billion photos, 249 million blogs, 20.8 billion comments/reviews
▪ 58.2% of Chinese internet users below the age of 30
▪ Users in China spent 7.8% of their online time on social networking sites compared to
13.9% globally and 11.6% in the United States (April 2010)
▪ YoY revenue growth was 239% from 2008-2009
▪ YoY revenue growth declined to 64% in 2009-2010
▪ Company has no debt and over $136M in cash on balance sheet
▪ Revenue breakdown
▪ Renren potentially has large upside from increasing its product offerings and
monetization its services
▪ Risk factors include intellectual property, user base, innovation, technology, reputation,
and regulation
▪ Management has strong engineering, tech start-up and consulting backgrounds
▪ Competitors include Kaixin001, Weibo, Pengyou, and Facebook

5
IPO DETAILS
▪ RenRen expected IPO date: May 4, 2011.
▪ RenRen ticker symbol: NYSE:RENN
▪ Price per share: $12-14 (increase from previous $9-11)
o Raising up to $743.1 million
o 15.93% to 18.59% of the company will be floating
▪ Shares offered
o ADSs by Renren: 42,898,711
o ADSs by current shareholders: 10,201,289
o Total ADSs offered: 53,100,000
o ADSs to Class A ratio: 3ADSs to 1 Class A share
▪ Private Placements
o Third-party investors affiliated with Alibaba Group, China Media Capital, and
CITTIC Securities to purchase an aggregate USD 10 million worth of Class A
shares at IPO price with respect to the ADSs to Class A ratio
RENREN USER BASE & INTERNET DEMOGRAPHICS IN CHINA ▪ Renren User Base
○ 114 million registered users (February 2011)
○ 31 million active users
o Aggregate 2.9 billion photos, 249 million blogs, 20.8 billion comments/reviews
33 million
83 million
110 million
117 million as of
March 2011
0
20
40
60
80
100
120
140
December 1, 2008 December 1, 2009 December 1, 2010
Axi
s T
itle
Cumulative total activated users (in
millions)
6
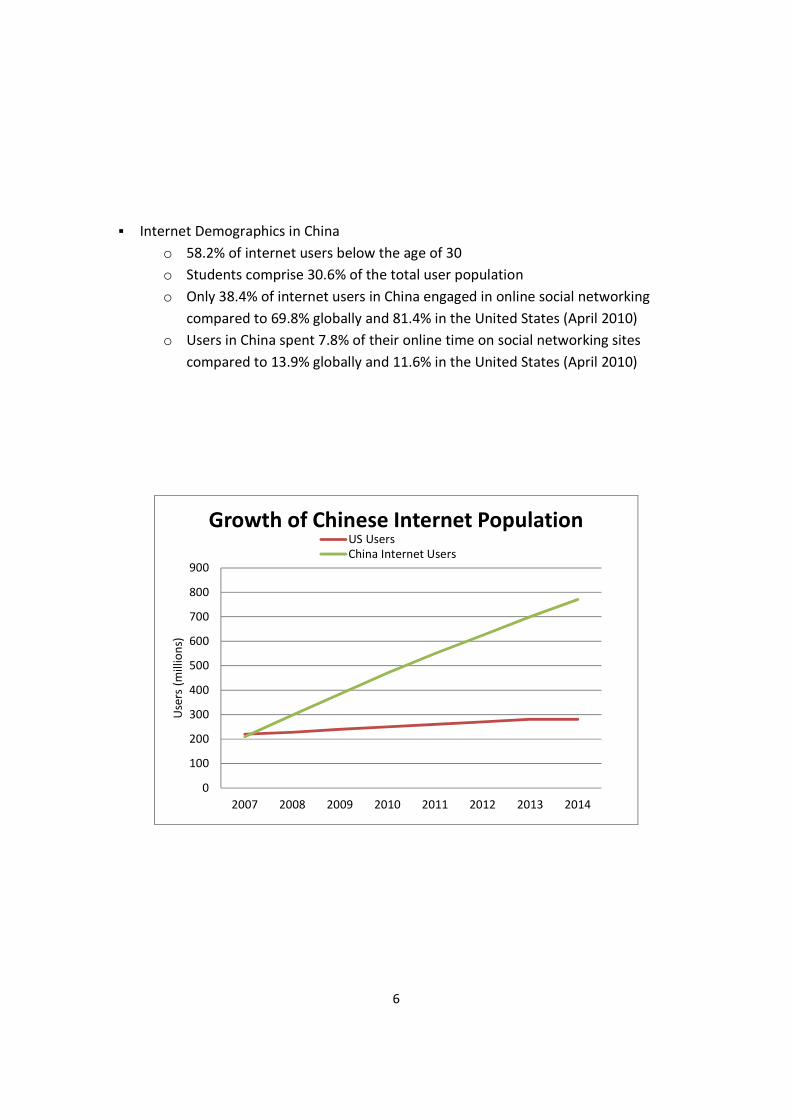
▪ Internet Demographics in China
o 58.2% of internet users below the age of 30
o Students comprise 30.6% of the total user population
o Only 38.4% of internet users in China engaged in online social networking
compared to 69.8% globally and 81.4% in the United States (April 2010)
o Users in China spent 7.8% of their online time on social networking sites
compared to 13.9% globally and 11.6% in the United States (April 2010)
0
100
200
300
400
500
600
700
800
900
2007 2008 2009 2010 2011 2012 2013 2014
Use
rs (
mill
ion
s)
Growth of Chinese Internet PopulationUS Users
China Internet Users

7
Number of End Users in China by Media Interface
0
100
200
300
400
500
600
700
800
900
2007 2008 2009 2010 2011 2012 2013 2014
Axi
s T
itle
RenRen's Potential Growth
China
Internet
Users

8
Share of Advertising Spending by Medium in China
2009 2012E
FINANCIALS ▪ YoY revenue growth was 239% from 2008-2009
▪ YoY revenue growth declined to just 64% in 2009-2010
▪ Revenue forecast for the coming years maintains a growth rate between 50-60%
▪ Loss from operations in 2008 and 2009 but moved to positive numbers in 2010
▪ Majority of loss recorded in the past 2 years has been caused by change in fair value of
warrants issued to investors
▪ Company has no debt and over $136M in cash on balance sheet
$13.8
$46.7
$76.5
$122.5
$183.7
$0.0
$50.0
$100.0
$150.0
$200.0
2008 2009 2010 2011(E) 2012(E)
Renren Revenue & Growth ($USD
Mln)
2008
2009
2010
2011(E)
2012(E)

9
▪ Revenue multiplier is common method used to determine relative price of a company
▪ Renren is nearly twice as expensive as Facebook
Renren Facebook
Value $5.1 Bln $70 Bln
2010 Revenue $77 Mln $2.0 Bln
2010 Revenue Multiple 67.1x 35.0
▪ Renren average revenue per user of $0.65
▪ Facebook averages $4.00 per user
▪ Potentially Renren has large upside from increasing its product offerings and
monetization its services
Renren Facebook
Revenue $77 Mln $2.0 Bln
Number of Users 117 Mln 500 Mln
Revenue per User $0.65 $4.00
▪ No plans to pay any cash dividends in the foreseeable future
▪ Will retain future earnings to operate and expand our business
2008 2009 2010
Net Revenue $13.8 $46.7 $76.5
Gain from Opeations ($8.0) ($2.7) $7.6
Net Income $49.3 ($70.1) ($64.2)
($100.0)
($75.0)
($50.0)
($25.0)
$0.0
$25.0
$50.0
$75.0
$100.0
in m
illi
on
s o
f U
S$
RenRen Revenue & Net Income 08-10
Net Revenue
Gain from Opeations
Net Income
10
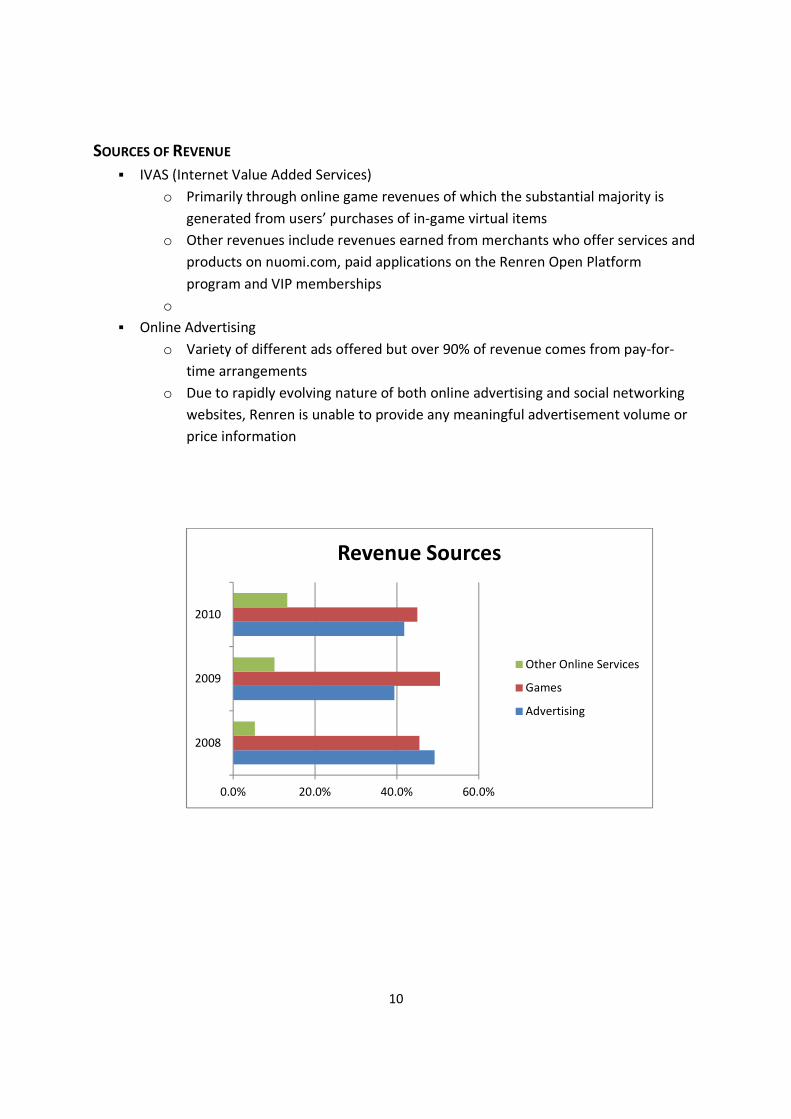
SOURCES OF REVENUE
▪ IVAS (Internet Value Added Services)
o Primarily through online game revenues of which the substantial majority is
generated from users’ purchases of in-game virtual items
o Other revenues include revenues earned from merchants who offer services and
products on nuomi.com, paid applications on the Renren Open Platform
program and VIP memberships
o
▪ Online Advertising
o Variety of different ads offered but over 90% of revenue comes from pay-for-
time arrangements
o Due to rapidly evolving nature of both online advertising and social networking
websites, Renren is unable to provide any meaningful advertisement volume or
price information
0.0% 20.0% 40.0% 60.0%
2008
2009
2010
Revenue Sources
Other Online Services
Games
Advertising

11
PLANS FOR PROCEEDS FROM IPO
▪ Renren plans on using the proceeds of the IPO in three manners
o $180M for investing in technology and research and development activities
o $180M for expanding sales and marketing activities
o Remainder of the proceeds will be used for general corporate purposes including
acquisitions and investments
EARLY INVESTORS
▪ Investors - Series D
o Softbank Corporation
� April 2008 purchased 35% for $430 million
� Aggregate of 10,071,763 series D preferred shares at USD 9.93 per share
� Has warrants to purchase 30,215,288 series D preferred shares
o Joho Capital and SBI Investment Company
� April 2008 purchased 3,133,438 series D preferred shares for USD 30
million
▪ Investors - Ordinary Shares
o Joseph Chan
� Economic ownership 22.8%
� Voting power 55.9%
▪ Underwriters of offering
o Morgan Stanley, Deutsche Bank, Credit Suisse, Bank of America Merrill Lynch,
Jefferies, Pacific Crest, and Oppenheimer

12
RISK FACTORS
� User Base, Innovation, Technology, and Reputation
o Maintain and increase user base
o Maintain innovative services and applications
o Expand into new services, new demographics, whilst keeping up with technology
o New fast-growing company in uncertain industry with heavy reliance on
advertising and third-party services
o Spammers, malicious content, collection of personal data may affect reputation,
removal of content due to PRC regulations
� Intellectual Property
o Conflict with US companies that already have patents such as Facebook
o Copying other companies or being copied
▪ Regulation
o PRC censorship issues and business license
o Conforming to US GAAP
� Transparent and reliable financial information
o Leasehold interests may be faulty
Renren’s most imminent risk factors are lawsuits and competition, due to the saturation of the
Chinese social networking market. Renren will have to maintain a competitive advantage while
minimizing problems arising from intellectual property, regulatory or other issues.
After their IPO in the US, Renren may be under closer scrutiny by investors, who require reliable
and transparent financial information. Renren must also avoid using content that is
0.0% 10.0% 20.0% 30.0% 40.0% 50.0% 60.0% 70.0% 80.0% 90.0% 100.0%
CEO Joseph Chan
SB Pan Pacific
Pre-IPO and Private Placement Investor…
Public Investors Holding Class A Shares
CEO Joseph ChanSB Pan Pacific
Pre-IPO and Private
Placement Investor
Holding Class A
Ordinary Shares
Public Investors
Holding Class A Shares
Ownership 22.8%34.2%29.6%13.4%
Voting Power 55.9%33.5%7.3%3.3%
Ownership and Voting Rights

13
questionably similar to competitors (e.g. Facebook), while expanding into new markets. Privacy
and anti-spam anti-malware will also become an issue.
MANAGEMENT
▪ Strong engineering, tech start-up and consulting backgrounds
▪ Previously worked at Google, Yahoo, Alibaba, and other tech companies
▪ Chairman & CEO: Joseph Chen, 41
o Founder of ChinaRen.com (first-gen SNS), SVP of Sohu.com
o MIT Masters in Engineering and Stanford MBA
▪ Director: Katsumasa Niki, 43
o Group manager of Softbank Corp Finance Department, director of several
Softbank subsidiaries
o Kobe University Bachelor of Economics and Chuo Grad School MBA
▪ Director: Matthew Nimetz, 71
o COO of General Atlantic (venture capital firm), corporate and international
attorney for over 30 years
o Harvard Law School and Oxford University Rhodes Scholar
▪ COO: James Jian Liu, 38
o Founder and CEO of UUMe.com, BCG China management consultant
o Shanghai Jiao Tong BS Computer Science and Stanford MBA
▪ CFO: Hui Huang, 38
o CFO of Cathay Industrial Biotech from 2003-2007, Associate in Goldman Sachs
Asia Principal Investments, BCG Associate
o Wharton MBA
▪ Chief Marketing Officer: Alvin Chiang, 40
o VP of Alibaba, VP Sales of NetEase, Yahoo
▪ SVP Games: Chuan He, 31
o Ph.D. in Computer Science from Tsinghua
▪ VP of Nuomi.com: Derek Boyang Shen, 37
o Google Head of China Development, Strategic Partner Development, Engineer
o UCLA Masters in Computer Science

14
CURRENT COMPETITION IN CHINA
April 14th
, 2010, China’s Top 4 in Comparison

15
� RenRen
○ Design and business model are copied from Facebook.
○ Users: The majority of users are students, although RenRen strives to retain those
users after graduation. In the fall of 2009, it launched a massive advertising
campaign—both traditional and digital—urging Chinese to reconnect with old
friends and classmates. The emphasis is on connecting with real-life friends online,
just as on Facebook. As RenRen grows, it is encroaching on the turf of its rivals: teens
(Qzone), white-collars (Kaixin001), and lower-tier cities (51.com).
○ User Interface: The user interface is nearly identical to Facebook (though it has not
copied Facebook’s latest redesign). It has a few unique features, such as a
“footprint” of who last visited your page and recently added game mechanics or
‘funware’ so that users can reach ‘higher levels’ for interacting on the site. It also
allows custom skins, though the majority of users stay with the basic theme.
○ Platform: The application programming interface is open to 3rd parties, but revenue
share is a capped at 56%. It boasts about 250 applications (almost all games) and is
China’s most popular open platform. Foreign game developers are just starting to
test the approval process, with FooMojo, RockYou, and PopCap leading the way.
Access for foreign developers is certain to be a hot topic at the upcoming 2010 China
Social Games Summit.
○ Games: RenRen has the most and best games, in large part due to its open platform.
But RenRen also develops games in-house, leading to concerns that RenRen will
favor its own games over those of outside developers. Other networks often copy
the most popular games on RenRen.
○ Financing: Softbank purchased 35% of RenRen for $430 million, valuing the company
at $1.2 billion. The company intends to hold an initial public offering as soon as
2011.
○ RenRen’s parent company is Oak Pacific Interactive, which also owns Mop, a smaller
Chinese social network, forum, and humor site.
○ Revenues: Annual revenue was over 100 million RMB ($15 million) in 2009,
according to one source from the company. The primary revenue channel is
advertising (brands, games, and e-commerce).
○ Analysis: RenRen is the most popular, most open, and best-financed social network
in China. Its management team is also the smartest and fastest-moving. It is actively
developing advertising, gaming, and e-commerce revenues. Its user growth is
impressive, in large part due to its aggressive marketing campaigns. The August 2009
name switch from Xiaonei (inside-campus) to RenRen (people’s web) signaled its
ambition to become China’s dominant popular social network. By comparison,
China’s other social networks are asleep at the wheel.
16
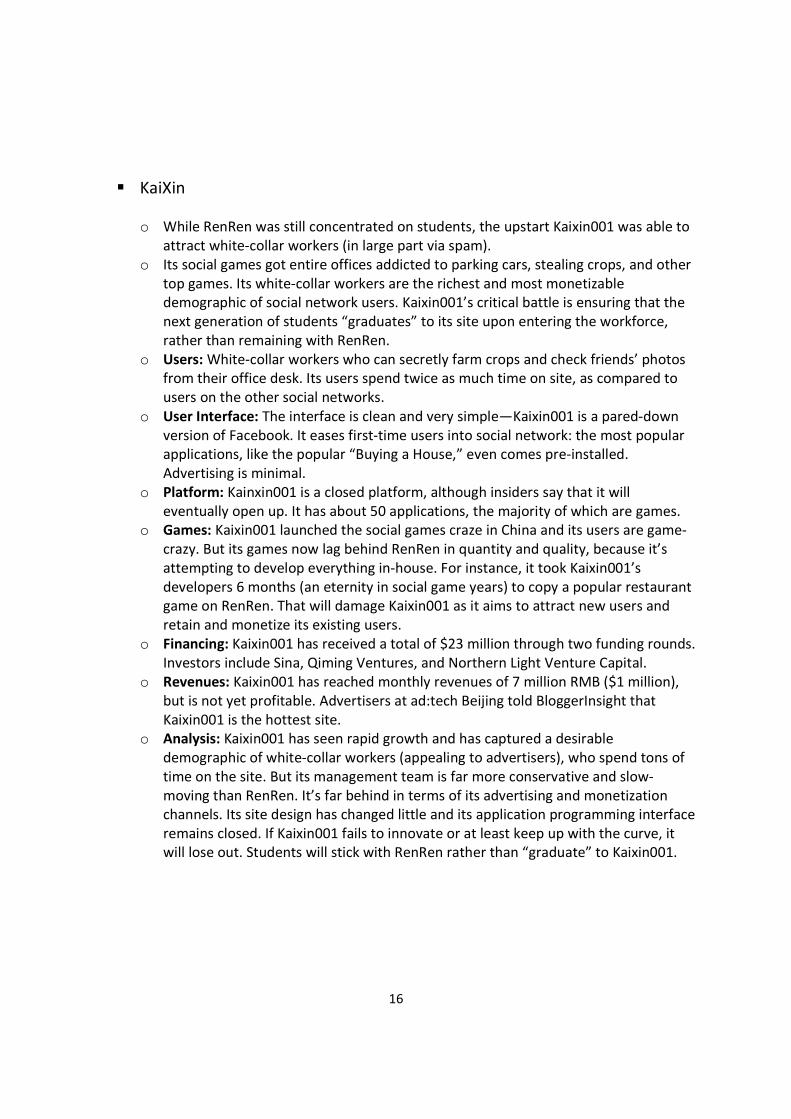
� KaiXin
o While RenRen was still concentrated on students, the upstart Kaixin001 was able to
attract white-collar workers (in large part via spam).
o Its social games got entire offices addicted to parking cars, stealing crops, and other
top games. Its white-collar workers are the richest and most monetizable
demographic of social network users. Kaixin001’s critical battle is ensuring that the
next generation of students “graduates” to its site upon entering the workforce,
rather than remaining with RenRen.
o Users: White-collar workers who can secretly farm crops and check friends’ photos
from their office desk. Its users spend twice as much time on site, as compared to
users on the other social networks.
o User Interface: The interface is clean and very simple—Kaixin001 is a pared-down
version of Facebook. It eases first-time users into social network: the most popular
applications, like the popular “Buying a House,” even comes pre-installed.
Advertising is minimal.
o Platform: Kainxin001 is a closed platform, although insiders say that it will
eventually open up. It has about 50 applications, the majority of which are games.
o Games: Kaixin001 launched the social games craze in China and its users are game-
crazy. But its games now lag behind RenRen in quantity and quality, because it’s
attempting to develop everything in-house. For instance, it took Kaixin001’s
developers 6 months (an eternity in social game years) to copy a popular restaurant
game on RenRen. That will damage Kaixin001 as it aims to attract new users and
retain and monetize its existing users.
o Financing: Kaixin001 has received a total of $23 million through two funding rounds.
Investors include Sina, Qiming Ventures, and Northern Light Venture Capital.
o Revenues: Kaixin001 has reached monthly revenues of 7 million RMB ($1 million),
but is not yet profitable. Advertisers at ad:tech Beijing told BloggerInsight that
Kaixin001 is the hottest site.
o Analysis: Kaixin001 has seen rapid growth and has captured a desirable
demographic of white-collar workers (appealing to advertisers), who spend tons of
time on the site. But its management team is far more conservative and slow-
moving than RenRen. It’s far behind in terms of its advertising and monetization
channels. Its site design has changed little and its application programming interface
remains closed. If Kaixin001 fails to innovate or at least keep up with the curve, it
will lose out. Students will stick with RenRen rather than “graduate” to Kaixin001.

17
� QZone
○ Qzone draws traffic from QQ Messenger, which boasts 523 million active users and
is also owned by Tencent. Qzone targets teens, rural, and casual users and claims a
whopping 388 million active users, a highly suspect number. Tencent’s internet
services, QQ Messenger, QQ Show, QQ Games, QQ Pet, and Qzone, do connect a
huge number of Chinese people. But the classification of Qzone as a social network
is questionable. It has tons of dormant, skeleton profiles that are pulled from QQ
Messenger. In that regard, it’s similar to MSN Spaces, which also has a ton of
“users,” but low value and retention rates. Qzone users often use nicknames or
aliases rather than real-life names. Given Tencent’s awesome advantages and
synergies in social networks, Tencent’s forays into “real-identity” social networking
should be seen as a squandered opportunity.
○ Users: Teens and rural users. Qzone is attempting to funnel its older users towards
its other social network, Xiaoyou (classmates), with limited success. It already failed
with an earlier attempt called QQ Campus.
○ User Interface: Qzone is a lousy website: it’s ugly, unintuitive, and buggy. The site is
very basic (for a social network), but not in a user-friendly way (like Kaixin001).
○ Platform: Qzone is a closed platform, though it is experimenting with licensing. It
has about 50 applications (mainly games). Benjamin Joffe, Tencent expert and CEO
of internet market research firm +8*, comments: “Applications are all copies or
licenses or bought from social gaming companies, generally with terrible revenue
share or poor valuation. Why? Because Tencent is a closed network and because
they can. Problem is: operating social games is not the same as instant messaging or
massive multi-player online games and there is a learning curve – even for Tencent.”
○ Games: Although Qzone should have a natural advantage (Tencent also owns QQ
Games), the games, like much else on the site, are of low quality. Qzone develops in-
house copies of popular games, but it lags way behind and prohibits users from
adding games without paying at certain times. Perhaps Qzone’s comparatively
young and rural users are so naïve that they pay Qzone when they can play the
same—or better—games for free on the other networks. But it’s doubtful that this is
a successful business strategy in the long run.
○ Financing: Tencent, Qzone’s parent company, is massively profitable and can
employ incredible resources should it so desire.
○ Revenues: No public figures are released. There is a lack of advertising and quality
games, so virtually all revenues must come from Qzone “Yellow Diamond”
memberships. It is difficult to estimate that revenue stream, but it’s hard to imagine
that too many Chinese users will stay loyal to Qzone in the long-run if they continue
to offer lousy services.
○ Analysis: Tencent with Qzone is like Microsoft with Windows Vista: a near-
monopolist (in instant messaging) that can thrive despite a terrible product and lack
of vision. Tencent is still massively profitable: 2009 revenues were $1.8 billion, about

18
three times Facebook’s estimated revenues. It’s unclear how much of that is
attributable to the Qzone social network though. Benjamin Joffe comments,
“Tencent is definitely not the best in terms of products or innovation – similar to
Zynga in that sense – but their ability to deliver a “good enough” mass market
service and integrating it within their ecosystem is impressive.” It holds the teen
demographic, but poor site design and management have cost it ground against its
competitors. Qzone is shut out of the market for older students and white-collar
workers, and RenRen is now encroaching on its core demographic of teens. Qzone
could still turn things around though, as its parent company Tencent is an 800-
pound gorilla in the Chinese internet.
� 51.Com
○ 51.com was an early favorite with significant backing, but is now struggling. Growth
has slowed and it has the lowest traffic rankings of the top four. In early January, the
site was briefly blocked for “objectionable” content, so management is trying to
clean itself of lewd users and content (it’s rumored to be a platform for the world’s
oldest profession). Its Chief Strategy Officer recently resigned, citing illness. 51.com
is a borderline mass-market contender at best. Urban and educated demographics
have all turned to its competitors. It’s now in the precarious position of defending its
core user base in lower tier cities.
○ Users: Users from lower tier cities.
○ User Interface: 51.com is a simple social network. It’s far more functional than
elegant. Several popular applications are pre-installed and the skins are
customizable.
○ Platform: 51.com offers an open platform. It has attracted about 50 applications
(mostly games). It is expected to offer more favorable revenue share terms than
RenRen.
○ Games: The games on 51.com are decent, though not as numerous or high-quality
as on RenRen. 51.com also develops its own games in-house: it’s investing $15
million in a gaming portal, in an attempt to reduce its reliance on advertising and
value-added services. It will also soon connect into the gaming platform from Giant
Interactive, one of its investors.
○ Financing: Giant Interactive, a publicly-listed Chinese massive multiplayer online
gaming company, invested $51 million for a 25% stake. Earlier backers include
venture capital firms Sequoia Capital, SIG, Redpoint Ventures, and Intel Capital. In
early 2007 there was premature talk of an IPO in 2010, but nothing has been heard
since.
○ Revenues: 51.com claims to have turned a profit in 2009, with advertising revenues
of about 200 million RMB ($29 million). Its open platform generated roughly 12
million RMB ($1.8 million) in revenues.
○ Analysis: 51.com was likely doomed to the mass-market by its rural roots. Its lower
tier cities approach initially allowed for quick user growth, but the site now has a
low-brow reputation and is scorned by more sophisticated netizens. RenRen’s

19
approach of starting with the elite students at China’s top universities, BeiDa and
Tsinghua, and then spreading outward (copied from Facebook), appears to have
been far more successful. Second tier social networks worldwide are falling to
Facebook. Will China’s more “sophisticated” networks push into 51.com’s territory?
BloggerInsight is inclined to think so. 51.com’s stagnation in user growth relative to
other networks is not a good sign; spreading outward from elite users has been
successful for social networks worldwide and for RenRen in China too. There are
certainly differing opinions though. Beijing-based internet guru Kaiser Kuo told
BloggerInsight, “I wouldn’t write them off at all: They’ve got a real hold in sub-
secondary cities and with their tie-up to a major game company (Giant Interactive),
they’ve got plenty of cash, and as far as I know, loads of traffic. It’s also been
cleaned up quite a bit within the last year, from what I’ve heard.” 51.com may or
may not hold its ground in lower tier cities. But one thing’s for certain: 51.com
stands little chance in China’s top-tier cities.
Current China’s Top 6 Social Networking Sites in Comparison
Renren Kaixin001 QQ Community 51. com Pengyou Weibo
URL www.renren.com
www.kaixin001.c
om
www.qq.com
www.51.com
www.pengyou.c
om
www.sina.com.c
n
Type Real-name SNS Real-name SNS Nickname SNS Real-name
SNS
Real-name
SNS
Microblog
Registered
Users 170 million
iResearch
iUserTracker)
95 million
(iResearch
iUserTracker)
481 million
(Tencent claims
these as
“actives” under
an extremely
broad,
undefined
definition)
1/8 million 131 million
(Tencent claims
these as
“actives” under
an extremely
broad,
undefined
definition)
120 million
Active
Users 95 million 40 million 190 million 40 million 80 million 65 million
User
Demograp
hics
Students,
white-collars
White-collars Teens Lesser-tier
cities, rural
users
Students,
white collars
White-collars
Alexa #15 #28 #2 #72 #26 #3

20
Rank
Traffic (for
China)
Alexa
Rank
Traffic
(globally)
#90 #155 #10 #419 #179 #13
Alexa
Rank
Pageviews
/User
(average
3months)
10.03 16.96 9.06 11.79 4.74 10.08
China
Rank #10 #19 #2 #127 #27 #3
Reports from Renren regarding its user base and market share

21
Top left: At the end of 2010, Renren held 36% market share in real-name China SNS
(excludes Qzone), leading its next closest competitor, Tencent Pengyou by 13.5%, and far
ahead of Kaixin001.
Top right: Renren also claims the highest user loyalty, meaning 70% of users are unlikely
to shut down their Renren accounts to join another SNS service.
Bottom: Future user usage frequency, 60% of users stated that they will spend same of
time in Renren as they are now, 15.9% vote they will spend more time, 20.2% vote for less
time, and 3.7% unsure.
*Note that these pictures are data from CNNIC: According to CNNIC’s latest Chinese SNS
users’ report, Renren has dominated the whole SNS market with its 39% market share and most
stable user foundation (user loyalty as high as 69.6%). However, the report has excluded Qzone
which may have a bigger market share and higher user loyalty when combined with Tencent
Pengyou.
▪ Kaixin001 and Weibo (Sina)
o Sued Renren for unfair competition
� Renren released Kaixin.com a copy of Kaixin001
o Weibo growing at 10 million users per month while Renren is only growing at 2
million users per month
o Kaixin001 planning to issue IPO one month after Renren
� Pengyou (Tencent)
○ Tencent’s latest entry into the real-name social networking space has many
users. However, whether the social graph is strong is still uncertain.

22
COMPARISON TO FACEBOOK
▪ Revenue multiplier is common method used to determine relative price of a company
▪ Renren is nearly twice as expensive as Facebook
Renren Facebook
Value $5.1 Bln $70 Bln
2010 Revenue $77 Mln $2.0 Bln
2010 Revenue Multiple 67.1x 35.0
▪ Renren average revenue per user of $0.65
▪ Facebook averages $4.00 per user
▪ Potentially Renren has large upside from increasing its product offerings and
monetization its services
Renren Facebook
Revenue $77 Mln $2.0 Bln
Number of Users 117 Mln 500 Mln
23
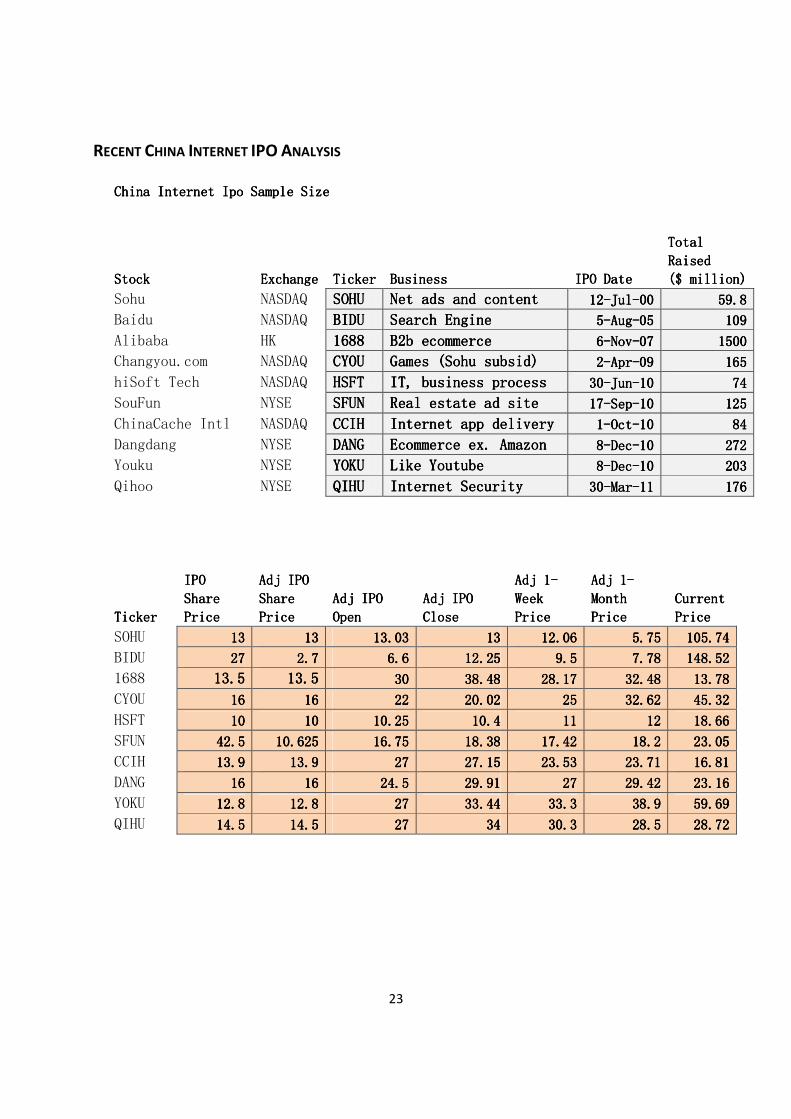
RECENT CHINA INTERNET IPO ANALYSIS
China Internet Ipo Sample SizeChina Internet Ipo Sample SizeChina Internet Ipo Sample SizeChina Internet Ipo Sample Size
StockStockStockStock ExchangeExchangeExchangeExchange TickerTickerTickerTicker BusinessBusinessBusinessBusiness IPO DateIPO DateIPO DateIPO Date
Total Total Total Total
RaisedRaisedRaisedRaised
($ million)($ million)($ million)($ million)
Sohu NASDAQ SOHUSOHUSOHUSOHU Net ads and contentNet ads and contentNet ads and contentNet ads and content 12121212----JulJulJulJul----00000000 59.859.859.859.8
Baidu NASDAQ BIDUBIDUBIDUBIDU Search EngineSearch EngineSearch EngineSearch Engine 5555----AugAugAugAug----05050505 109109109109
Alibaba HK 1688168816881688 B2b ecommerceB2b ecommerceB2b ecommerceB2b ecommerce 6666----NovNovNovNov----07070707 1500150015001500
Changyou.com NASDAQ CYOUCYOUCYOUCYOU Games (Sohu subsid)Games (Sohu subsid)Games (Sohu subsid)Games (Sohu subsid) 2222----AprAprAprApr----09090909 165165165165
hiSoft Tech NASDAQ HSFTHSFTHSFTHSFT IT, IT, IT, IT, business processbusiness processbusiness processbusiness process 30303030----JunJunJunJun----10101010 74747474
SouFun NYSE SFUNSFUNSFUNSFUN Real estate ad siteReal estate ad siteReal estate ad siteReal estate ad site 17171717----SepSepSepSep----10101010 125125125125
ChinaCache Intl NASDAQ CCIHCCIHCCIHCCIH Internet app deliveryInternet app deliveryInternet app deliveryInternet app delivery 1111----OctOctOctOct----10101010 84848484
Dangdang NYSE DANGDANGDANGDANG Ecommerce ex. AmazonEcommerce ex. AmazonEcommerce ex. AmazonEcommerce ex. Amazon 8888----DecDecDecDec----10101010 272272272272
Youku NYSE YOKUYOKUYOKUYOKU Like YoutubeLike YoutubeLike YoutubeLike Youtube 8888----DecDecDecDec----10101010 203203203203
Qihoo NYSE QIHUQIHUQIHUQIHU Internet SecurityInternet SecurityInternet SecurityInternet Security 30303030----MarMarMarMar----11111111 176176176176
TickerTickerTickerTicker
IPO IPO IPO IPO
ShareShareShareShare
PricePricePricePrice
Adj IPO Adj IPO Adj IPO Adj IPO
Share Share Share Share
PricePricePricePrice
Adj IPOAdj IPOAdj IPOAdj IPO
OpenOpenOpenOpen
Adj IPOAdj IPOAdj IPOAdj IPO
CloseCloseCloseClose
Adj 1Adj 1Adj 1Adj 1----
WeekWeekWeekWeek
PricePricePricePrice
Adj 1Adj 1Adj 1Adj 1----
MonthMonthMonthMonth
PricePricePricePrice
CurrentCurrentCurrentCurrent
PricePricePricePrice
SOHU 13131313 13131313 13.0313.0313.0313.03 13131313 12.0612.0612.0612.06 5.755.755.755.75 105.74105.74105.74105.74
BIDU 27272727 2.72.72.72.7 6.66.66.66.6 12.2512.2512.2512.25 9.59.59.59.5 7.787.787.787.78 148.52148.52148.52148.52
1688 13.513.513.513.5 13.513.513.513.5 30303030 38.4838.4838.4838.48 28.1728.1728.1728.17 32.4832.4832.4832.48 13.7813.7813.7813.78
CYOU 16161616 16161616 22222222 20.0220.0220.0220.02 25252525 32.6232.6232.6232.62 45.3245.3245.3245.32
HSFT 10101010 10101010 10.2510.2510.2510.25 10.410.410.410.4 11111111 12121212 18.6618.6618.6618.66
SFUN 42.542.542.542.5 10.62510.62510.62510.625 16.7516.7516.7516.75 18.3818.3818.3818.38 17.4217.4217.4217.42 18.218.218.218.2 23.0523.0523.0523.05
CCIH 13.913.913.913.9 13.913.913.913.9 27272727 27.1527.1527.1527.15 23.5323.5323.5323.53 23.7123.7123.7123.71 16.8116.8116.8116.81
DANG 16161616 16161616 24.524.524.524.5 29.9129.9129.9129.91 27272727 29.4229.4229.4229.42 23.1623.1623.1623.16
YOKU 12.812.812.812.8 12.812.812.812.8 27272727 33.4433.4433.4433.44 33.333.333.333.3 38.938.938.938.9 59.6959.6959.6959.69
QIHU 14.514.514.514.5 14.514.514.514.5 27272727 34343434 30.330.330.330.3 28.528.528.528.5 28.7228.7228.7228.72

24
Using IPO Offering PriceUsing IPO Offering PriceUsing IPO Offering PriceUsing IPO Offering Price
TickerTickerTickerTicker
Open vs Open vs Open vs Open vs
IPOIPOIPOIPO
OfferingOfferingOfferingOffering
First First First First
Day IPO Day IPO Day IPO Day IPO
PricePricePricePrice
ReturnReturnReturnReturn
1111----WeekWeekWeekWeek
ReturnReturnReturnReturn
1111----MonthMonthMonthMonth
ReturnReturnReturnReturn
TotalTotalTotalTotal
ReturnReturnReturnReturn
SOHU 0.23%0.23%0.23%0.23% 0.00%0.00%0.00%0.00% ----7.23%7.23%7.23%7.23% ----55.77%55.77%55.77%55.77% 713.38%713.38%713.38%713.38%
BIDU 144.44%144.44%144.44%144.44% 353.70%353.70%353.70%353.70% 251.85%251.85%251.85%251.85% 188.15%188.15%188.15%188.15% 5400.74%5400.74%5400.74%5400.74%
1688 122.22%122.22%122.22%122.22% 185.04%185.04%185.04%185.04% 108.67%108.67%108.67%108.67% 140.59%140.59%140.59%140.59% 2.07%2.07%2.07%2.07%
CYOU 37.50%37.50%37.50%37.50% 25.13%25.13%25.13%25.13% 56.25%56.25%56.25%56.25% 103.88%103.88%103.88%103.88% 183.25%183.25%183.25%183.25%
HSFT 2.50%2.50%2.50%2.50% 4.00%4.00%4.00%4.00% 10.00%10.00%10.00%10.00% 20.00%20.00%20.00%20.00% 86.60%86.60%86.60%86.60%
SFUN 57.65%57.65%57.65%57.65% 72.99%72.99%72.99%72.99% 63.95%63.95%63.95%63.95% 71.29%71.29%71.29%71.29% 116.94%116.94%116.94%116.94%
CCIH 94.24%94.24%94.24%94.24% 95.32%95.32%95.32%95.32% 69.28%69.28%69.28%69.28% 70.58%70.58%70.58%70.58% 20.94%20.94%20.94%20.94%
DANG 53.13%53.13%53.13%53.13% 86.94%86.94%86.94%86.94% 68.75%68.75%68.75%68.75% 83.88%83.88%83.88%83.88% 44.75%44.75%44.75%44.75%
YOKU 110.94%110.94%110.94%110.94% 161.25%161.25%161.25%161.25% 160.16%160.16%160.16%160.16% 203.91%203.91%203.91%203.91% 366.33%366.33%366.33%366.33%
QIHU 86.21%86.21%86.21%86.21% 134.48%134.48%134.48%134.48% 108.97%108.97%108.97%108.97% 96.55%96.55%96.55%96.55% 98.07%98.07%98.07%98.07%
70.91% 111.88% 89.06% 92.30% 703.31%
Using First Day Adj OpenUsing First Day Adj OpenUsing First Day Adj OpenUsing First Day Adj Open
TickerTickerTickerTicker
First First First First
DayDayDayDay
ReturnReturnReturnReturn
1111----WeekWeekWeekWeek
ReturnReturnReturnReturn
1111----MonthMonthMonthMonth
ReturnReturnReturnReturn
TotalTotalTotalTotal
ReturnReturnReturnReturn
SOHU ----0.23%0.23%0.23%0.23% ----7.44%7.44%7.44%7.44% ----55.87%55.87%55.87%55.87% 711.51%711.51%711.51%711.51%
BIDU 85.61%85.61%85.61%85.61% 43.94%43.94%43.94%43.94% 17.88%17.88%17.88%17.88% 2150.30%2150.30%2150.30%2150.30%
1688 28.27%28.27%28.27%28.27% ----6.10%6.10%6.10%6.10% 8.27%8.27%8.27%8.27% ----54.07%54.07%54.07%54.07%
CYOU ----9.00%9.00%9.00%9.00% 13.64%13.64%13.64%13.64% 48.27%48.27%48.27%48.27% 106.00%106.00%106.00%106.00%
HSFT 1.46%1.46%1.46%1.46% 7.32%7.32%7.32%7.32% 17.07%17.07%17.07%17.07% 82.05%82.05%82.05%82.05%
SFUN 9.73%9.73%9.73%9.73% 4.00%4.00%4.00%4.00% 8.66%8.66%8.66%8.66% 37.61%37.61%37.61%37.61%
CCIH 0.56%0.56%0.56%0.56% ----12.85%12.85%12.85%12.85% ----12.19%12.19%12.19%12.19% ----37.74%37.74%37.74%37.74%
DANG 22.08%22.08%22.08%22.08% 10.20%10.20%10.20%10.20% 20.08%20.08%20.08%20.08% ----5.47%5.47%5.47%5.47%
YOKU 23.85%23.85%23.85%23.85% 23.33%23.33%23.33%23.33% 44.07%44.07%44.07%44.07% 121.07%121.07%121.07%121.07%
QIHU 25.93%25.93%25.93%25.93% 12.22%12.22%12.22%12.22% 5.56%5.56%5.56%5.56% 6.37%6.37%6.37%6.37%
18.83% 8.83% 10.18% 311.76%

25
Using Using Using Using First Day Adj CloseFirst Day Adj CloseFirst Day Adj CloseFirst Day Adj Close
TickerTickerTickerTicker
1111----WeekWeekWeekWeek
ReturnReturnReturnReturn
1111----MonthMonthMonthMonth
ReturnReturnReturnReturn
TotalTotalTotalTotal
ReturnReturnReturnReturn
SOHU -7.23% -55.77% 713.38%
BIDU -22.45% -36.49% 1112.41%
1688 -26.79% -15.59% -64.19%
CYOU 24.88% 62.94% 126.37%
HSFT 5.77% 15.38% 79.42%
SFUN -5.22% -0.98% 25.41%
CCIH -13.33% -12.67% -38.08%
DANG -9.73% -1.64% -22.57%
YOKU -0.42% 16.33% 78.50%
QIHU -10.88% -16.18% -15.53%
Average: -6.54% -4.47% 199.51%
0
20
40
60
80
100
120
140
160
Adj IPO
Share Price
Adj IPO
Open
Adj IPO
Close
Adj 1-Week
Price
Adj 1-Month
Price
Current
Price
Pri
ce (
$/s
ha
re)
Day (Graph Not Scaled to Time Period)
China Tech IPO Price Trends
Sohu
Baidu
Alibaba
Changyou.com
hiSoft Tech
SouFun
ChinaCache Intl
Dangdang
Youku
Qihoo
26
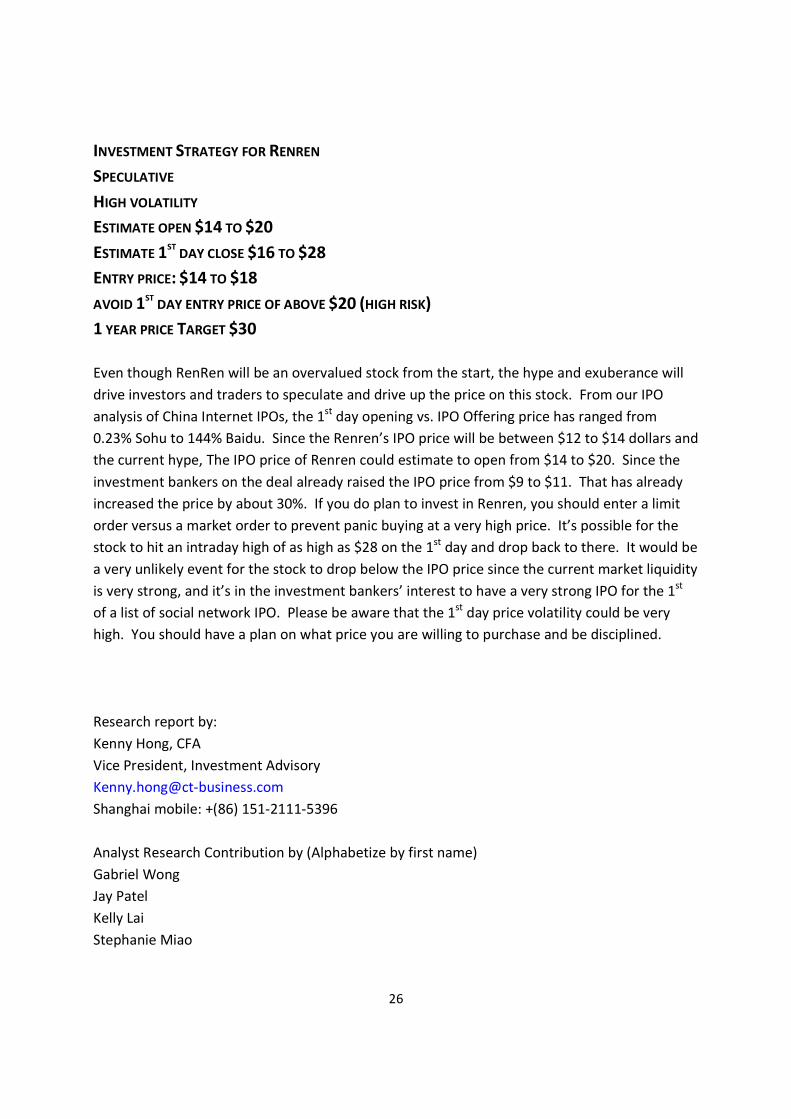
INVESTMENT STRATEGY FOR RENREN
SPECULATIVE
HIGH VOLATILITY
ESTIMATE OPEN $14 TO $20
ESTIMATE 1ST
DAY CLOSE $16 TO $28
ENTRY PRICE: $14 TO $18
AVOID 1ST DAY ENTRY PRICE OF ABOVE $20 (HIGH RISK)
1 YEAR PRICE TARGET $30
Even though RenRen will be an overvalued stock from the start, the hype and exuberance will
drive investors and traders to speculate and drive up the price on this stock. From our IPO
analysis of China Internet IPOs, the 1st
day opening vs. IPO Offering price has ranged from
0.23% Sohu to 144% Baidu. Since the Renren’s IPO price will be between $12 to $14 dollars and
the current hype, The IPO price of Renren could estimate to open from $14 to $20. Since the
investment bankers on the deal already raised the IPO price from $9 to $11. That has already
increased the price by about 30%. If you do plan to invest in Renren, you should enter a limit
order versus a market order to prevent panic buying at a very high price. It’s possible for the
stock to hit an intraday high of as high as $28 on the 1st day and drop back to there. It would be
a very unlikely event for the stock to drop below the IPO price since the current market liquidity
is very strong, and it’s in the investment bankers’ interest to have a very strong IPO for the 1st
of a list of social network IPO. Please be aware that the 1st
day price volatility could be very
high. You should have a plan on what price you are willing to purchase and be disciplined.
Research report by:
Kenny Hong, CFA
Vice President, Investment Advisory
Shanghai mobile: +(86) 151-2111-5396
Analyst Research Contribution by (Alphabetize by first name)
Gabriel Wong
Jay Patel
Kelly Lai
Stephanie Miao
27
General: Additional information is available upon request. Information has been obtained from
sources believed to be reliable but CT Business Solutions Ltd. or its affiliates and/or subsidiaries
do not warrant its completeness or accuracy except with respect to any disclosures relative to
and/or its affiliates and the analyst’s involvement with the issuer that is the subject of the
research. All pricing is as of the close of market for the securities discussed, unless otherwise
stated. Opinions and estimates constitute our judgment as of the date of this material and are
subject to change without notice. Past performance is not indicative of future results. This
material is not intended as an offer or solicitation for the purchase or sale of any financial
instrument. The opinions and recommendations herein do not take into account individual client
circumstances, objectives, or needs and are not intended as recommendations of particular
securities, financial instruments or strategies to particular clients. The recipient of this report
must make its own independent decisions regarding any securities or financial instruments
mentioned herein. CT Business Solutions Ltd. distributes in the U.S. research published by non-
U.S. affiliates and accepts responsibility for its contents. Periodic updates may be provided on
companies/industries based on company specific developments or announcements, market
conditions or any other publicly available information. Clients should contact analysts and
execute transactions through a subsidiary or affiliate in their home jurisdiction unless governing
law permits otherwise.
Copyright 2011 CT Business Solutions Ltd. All rights reserved. This report or any portion hereof may not be reprinted,
sold or redistributed without the written consent of CT Business Solutions Ltd.#$J&