renewable and sustainable energy reviews · combined heat and power (chp) technologies merely...
TRANSCRIPT

An overview of biogas production and utilization at full-scalewastewater treatment plants (WWTPs) in the United States:Challenges and opportunities towards energy-neutral WWTPs
Yanwen Shen, Jessica L. Linville, Meltem Urgun-Demirtas n, Marianne M. Mintz,Seth W. SnyderArgonne National Laboratory, Energy Systems Division, 9700 S Cass Avenue, Lemont, IL 60439, USA
a r t i c l e i n f o
Article history:Received 7 November 2014Received in revised form25 March 2015Accepted 23 April 2015Available online 27 May 2015
Keywords:BiogasSludgeWastewater treatment plantEnergy self-sufficiencyCo-digestionRenewable fuelRenewable identification numbers (RINs)
a b s t r a c t
Recently the United States Environmental Protection Agency qualified biogas from landfills andanaerobic digesters as a cellulosic transportation biofuel under the expanded Renewable Fuel Standard(RFS2). Biogas is a renewable fuel that can generate Renewable Identification Number credits for theproducer. The wastewater industry may not be able to keep pace with this opportunity. Less than 10% ofWWTPs in the US have currently produced biogas for beneficial use. Supporting growth of the biogasindustry requires implementation of new practices and policies. In this review, the barriers, gaps, andchallenges in deploying biogas production technology are identified. Issues are classified as economic,technical, social or regulatory issues. Some of the critical challenges to the economics of digesteroperations are the slow rate of biogas generation, the low energy content of the biogas, and the costs toupgrade the biogas.
Currently there is little biogas utilization at US WWTPs. Most biogas is flared while some is used foronsite process heat and power production. Case studies of co-digestion of biosolids with organic wastesat field-scale show the use of co-digestion could overcome significant economic challenges includinghigher methane yield, more efficient digester volume utilization and reduced biosolids production.These findings could provide guidance in retrofitting existing facilities or in designing new biogasproduction and utilization systems. The RFS2 ruling increases market certainty, hence reduces risk. Theevaluation of applications of co-digestion at WWTP scales ranging from 1 million gallons per day (MGD)to 375 MGD determined its potential feasibility for different types of digester operation, organic wasteand loading rate as well as effectiveness of providing energy self-sufficiency at the WWTPs. This workcould improve economics of anaerobic digestion at WWTPs, enabling viable and sustainable biogasindustry and offsetting costs for wastewater management.
& 2015 Elsevier Ltd. All rights reserved.
Contents
1. Overview of WWTPs and sludge treatment in the US. . . . . . . . . . . . . . . . . . . . . . . . . . . . . . . . . . . . . . . . . . . . . . . . . . . . . . . . . . . . . . . . . . . . . . . 3472. Biogas production and utilization at US WWTPs . . . . . . . . . . . . . . . . . . . . . . . . . . . . . . . . . . . . . . . . . . . . . . . . . . . . . . . . . . . . . . . . . . . . . . . . . . . 347
2.1. Potential of biogas production . . . . . . . . . . . . . . . . . . . . . . . . . . . . . . . . . . . . . . . . . . . . . . . . . . . . . . . . . . . . . . . . . . . . . . . . . . . . . . . . . . . 3472.2. Biogas utilization with CHP technologies . . . . . . . . . . . . . . . . . . . . . . . . . . . . . . . . . . . . . . . . . . . . . . . . . . . . . . . . . . . . . . . . . . . . . . . . . . . 347
3. Barriers for AD application at US WWTPs . . . . . . . . . . . . . . . . . . . . . . . . . . . . . . . . . . . . . . . . . . . . . . . . . . . . . . . . . . . . . . . . . . . . . . . . . . . . . . . . 3504. Strategies to overcome barriers . . . . . . . . . . . . . . . . . . . . . . . . . . . . . . . . . . . . . . . . . . . . . . . . . . . . . . . . . . . . . . . . . . . . . . . . . . . . . . . . . . . . . . . . 351
Contents lists available at ScienceDirect
journal homepage: www.elsevier.com/locate/rser
Renewable and Sustainable Energy Reviews
http://dx.doi.org/10.1016/j.rser.2015.04.1291364-0321/& 2015 Elsevier Ltd. All rights reserved.
Abbreviations: AD, anaerobic digestion; AG-MTM, acid-methane mesophilic–thermophilic–mesophilic process; AWWTP, advanced wastewater treatment plant; CHP,combined heat and power; COD, chemical oxygen demand; CSTR, continuous stirred tank reactor; FOG, fats, oil and grease; GHG, greenhouse gas; GPD, gallons per day; HRT,hydraulic retention time; HSW, high-strength waste; IC, internal combustion; MBTU, million British thermal unit; MGD, million gallons per day (1 MGD¼3785 m3/day);MGY, million gallons per year; N/A, not available; OFMSW, organic fraction of municipal solid waste; PFR, plug flow reactor; PS, primary sludge; PSA, pressure swingadsorption; RFS2, the new renewable fuel standard; RIN, renewable identification numbers; scfm, standard cubic feet per minute; THP, thermal hydrolysis process; TS, totalsolids; VS, volatile solids; WAS, waste activated sludge; WWTP, wastewater treatment plant; WWTW, wastewater treatment work
n Corresponding author.E-mail address: [email protected] (M. Urgun-Demirtas).
Renewable and Sustainable Energy Reviews 50 (2015) 346–362

4.1. Co-digestion of sludge with organic wastes . . . . . . . . . . . . . . . . . . . . . . . . . . . . . . . . . . . . . . . . . . . . . . . . . . . . . . . . . . . . . . . . . . . . . . . . . 3514.1.1. Overview . . . . . . . . . . . . . . . . . . . . . . . . . . . . . . . . . . . . . . . . . . . . . . . . . . . . . . . . . . . . . . . . . . . . . . . . . . . . . . . . . . . . . . . . . . . . . 3514.1.2. Case studies . . . . . . . . . . . . . . . . . . . . . . . . . . . . . . . . . . . . . . . . . . . . . . . . . . . . . . . . . . . . . . . . . . . . . . . . . . . . . . . . . . . . . . . . . . . 355
4.2. Sludge pretreatment . . . . . . . . . . . . . . . . . . . . . . . . . . . . . . . . . . . . . . . . . . . . . . . . . . . . . . . . . . . . . . . . . . . . . . . . . . . . . . . . . . . . . . . . . . . 3574.2.1. Overview . . . . . . . . . . . . . . . . . . . . . . . . . . . . . . . . . . . . . . . . . . . . . . . . . . . . . . . . . . . . . . . . . . . . . . . . . . . . . . . . . . . . . . . . . . . . . 3574.2.2. Case studies . . . . . . . . . . . . . . . . . . . . . . . . . . . . . . . . . . . . . . . . . . . . . . . . . . . . . . . . . . . . . . . . . . . . . . . . . . . . . . . . . . . . . . . . . . . 358
4.3. Process optimization . . . . . . . . . . . . . . . . . . . . . . . . . . . . . . . . . . . . . . . . . . . . . . . . . . . . . . . . . . . . . . . . . . . . . . . . . . . . . . . . . . . . . . . . . . . 3594.3.1. Overview . . . . . . . . . . . . . . . . . . . . . . . . . . . . . . . . . . . . . . . . . . . . . . . . . . . . . . . . . . . . . . . . . . . . . . . . . . . . . . . . . . . . . . . . . . . . . 3594.3.2. Case studies . . . . . . . . . . . . . . . . . . . . . . . . . . . . . . . . . . . . . . . . . . . . . . . . . . . . . . . . . . . . . . . . . . . . . . . . . . . . . . . . . . . . . . . . . . . 359
5. Conclusions . . . . . . . . . . . . . . . . . . . . . . . . . . . . . . . . . . . . . . . . . . . . . . . . . . . . . . . . . . . . . . . . . . . . . . . . . . . . . . . . . . . . . . . . . . . . . . . . . . . . . . . . 359Acknowledgement. . . . . . . . . . . . . . . . . . . . . . . . . . . . . . . . . . . . . . . . . . . . . . . . . . . . . . . . . . . . . . . . . . . . . . . . . . . . . . . . . . . . . . . . . . . . . . . . . . . . . . . 360References . . . . . . . . . . . . . . . . . . . . . . . . . . . . . . . . . . . . . . . . . . . . . . . . . . . . . . . . . . . . . . . . . . . . . . . . . . . . . . . . . . . . . . . . . . . . . . . . . . . . . . . . . . . . . 360
1. Overview of WWTPs and sludge treatment in the US
There are 14,780 municipal wastewater treatment facilities inoperation in the United States as of October 2014, treating anaverage wastewater flow of 32,345 million gallons per day (MGD,1 MGD¼3785 m3/day) [1]. Municipal wastewater treatmentaccounts for 3–4% of entire nation’s electrical demand, equivalentto 30.2 billion kW h per year [2,3], adding over 21 million metrictons of greenhouse gas (GHG) emission annually [4]. Electric powerconsumption is the highest cost for operation of WWTPs, repre-senting over 30% of the total operation and maintenance cost [5,6]and up to 80% of the GHG emission at WWTPs [7].
Sewage sludge, the byproduct of the wastewater treatmentprocess, requires treatment prior to final disposal, and sludgetreatment accounts for as much as 30% of a WWTP’s operating costs[8]. Sewage sludge can also be stabilized into biosolids. Biosolids arenutrient- and energy-rich materials, which can be utilized for landapplication as a fertilizer substitute and/or soil conditioner for carbonsequestration [9] as well as a feedstock for renewable energyproduction. At US WWTPs, approximately 6.5 million metric ton(dry weight) of sewage sludge are generated annually, and thisvolume increases with growing population [8]. Anaerobic digestion(AD) is a common technology for sludge treatment at US WWTPs.The US Environmental Protection Agency (USEPA) reports that 1484WWTPs digest sludge to produce biogas [10]. About 48% of the totalwastewater flow in the US is treated with AD [11]. A typical biogascomposition of digested sludge is methane (CH4, 50–70%) and carbondioxide (CO2, 30–50%). However, less than 10% of those plants utilizebiogas for heating and/or electricity generation to reduce the cost ofenergy consumption [10]. Most WWTPs with AD but withoutcombined heat and power (CHP) technologies merely combustbiogas in boilers and/or flare biogas. Wastewater treatment was the8th largest anthropogenic source of CH4 emissions (12.8 million
metric tons of CO2 equivalent) in the US in 2012 [12]. CH4 as a GHGhas more than 20–200 times the radiative forcing per gram of CO2
depending on evaluation emission time horizon [13].Biogas production can be the main source of GHG emission
fromWWTPs when it is not managed properly. Therefore, efficientbiogas production and utilization at WWTPs can significantlyreduce the carbon footprint for WWTPs.
2. Biogas production and utilization at US WWTPs
2.1. Potential of biogas production
If captured and managed efficiently, sludge generated at WWTPscould yield substantial energy in the form of biogas, potentiallyturning WWTP into a net energy producer rather than a consumer[14]. Table 1 shows the overall potential of WWTP sludge-derivedbiogas production in the US, based on different feedstock resourceinvestigations.
AD of sludge is not only important to maximize the energyproduction, but also to minimize the overall treatment costs atWWTPs. Table 2 summarizes the benefits of biogas production fromsewage sludge. Utilization of biogas for power and fuel as naturalgas has many environmental benefits since it can be substituted forfossil fuels to produce electricity and vehicle fuel, reducing thecarbon footprint of WWTP operations.
2.2. Biogas utilization with CHP technologies
Water Environment Federation (WEF) released their phase1 database (⟨http://www.wrrfdata.org/biogas/biogasdata.php⟩)providing information about US WWTPs operating AD systemsand biogas utilization. Greater than 90% of the 1241 plants in the
Table 1Summary of reported data on energy content of biosolids generated from WWTPs in the US.
Resource Basis Thermalenergy(MMBtu/year)
Electricpower (kW h/year)
Total energypotential (MMBtu/year)
Reference(s)
40 billion gallons of wastewater per day 1 MGD wastewater equates 26 kW of electriccapacity and 2.4 MMBtu/day of thermal energy
3.52�107 9.11�109 6.65�107 [10,23]
6.5 million dry tons of biosolids per year Sludge energy content¼8000 Btu/dry lb 4.59�107 1.01�1010 9.86�107 [8,10]CHP electric efficiency¼30%CHP thermal efficiency¼40%
WWTPs with average flow rate41 MGD (CHPavailable in 133 WWTPs, feasible for additional1351 sites)
Available: 2.04�107 5.17�109 3.81�107 [10]190 MW Electric power18,000 MMBtu/day Thermal energyPotential:400 MW Electric power38,000 MMBtu/day Thermal energy
Y. Shen et al. / Renewable and Sustainable Energy Reviews 50 (2015) 346–362 347

database operate their AD systems at mesophilic temperatures; 40plants operate digesters at thermophilic temperatures, while 34plants operate them at both temperature ranges. 1054 plantsutilize biogas beneficially for energy displacement and production
including heating digester, heating on-site building, power gen-eration, powering on-site machinery and pipeline injection. Thereare 270 plants producing electric power and 74 of them exportpower to the grid. These power-generating plants use single or
Table 2Benefits of biomethane production and utilization as transportation fuel.
Economics Energy Environmental
� Turns waste liabilities into new profit centers� Adds value to negative value feedstocks� Reduces operating/energy costs� Reduces water consumption� Reduces reliance on energy imports� Creation of green jobs� Potential revenue from green energy and carbon
credits� Potential revenue from sales of digested sludge
(liquid and solids)
� Net energy-producing process� Generates high-quality renewable fuel� Produces surplus energy as electricity and
heat at WWTPs� Reduces reliance on energy imports
� Reduces GHG (CH4, CO, and CO2) ammonia andparticulate emissions
� Captures nutrients for reuse & reduces use of inorganicfertilizers
� Promotes carbon sequestration� Increases beneficial reuse of recycled water� Reduced groundwater and surface water contamination
potential� Reduce disposed waste volume and weight of solid waste
to be landfilled
Fig. 1. Summary of anaerobic digester operation and biogas utilization at WWTPs in the US (A) AD system operating temperature; (B) Biogas utilization; (C) CHPtechnologies for energy generation from biogas utilization.
Y. Shen et al. / Renewable and Sustainable Energy Reviews 50 (2015) 346–362348

multiple CHP technologies as follows: internal combustion (IC)engines, microturbines, gas combustion turbines and fuel cells.Fig. 1 summarized the above key findings.
The 1241 WWTPs were classified into 4 categories based onaverage flow rates: plants with average flow rate of 100–1000MGD, 10–100 MGD, 1–10 MGD and less than 1 MGD. For each flow
Fig. 2. WWTPs in the US with average flow ranging from 100 to 1000 MGD (A) Biogas utilization; (B) CHP technologies for energy generation from biogas utilization.
Fig. 3. WWTPs in the US with average flow ranging from 10 to 100 MGD (A) Biogas utilization; (B) CHP technologies for energy generation from biogas utilization.
Fig. 4. WWTPs in the US with average flow ranging from 1 to 10 MGD (A) Biogas utilization; (B) CHP technologies for energy generation from biogas utilization.
Y. Shen et al. / Renewable and Sustainable Energy Reviews 50 (2015) 346–362 349

rate category, biogas utilization has been classified as flared only(no utilization), unknown utilization or utilized with and withoutpipeline injection. Biogas CHP technologies are further categorizedas IC engine, gas combustion turbine, microturbine, fuel cell, andversatile facilities with and without power export.
There are 29 WWTPs with average flow rate of 100–1000 MGDwith AD systems (Fig. 2). A total of 26 of the plants utilize biogas,with 3 of them injecting upgraded biogas into natural gas pipeline.The 3 plants with biogas pipeline injection are all located inCalifornia. There are 13 plants (45% of WWTPs in this category)that generate electricity; among them, 4 plants generate electricityfrom IC engine, 1 from fuel cell, 1 from turbine, and the remaining7 plants generate electricity from various technologies (Fig. 2B).There are 6 plants export electric power to grid, accounting for 21%of the WWTPs in this category.
There are 276 WWTPs with average flow rate of 10–100 MGDwith AD systems (Fig. 3), including 13 plants only flaring biogaswithout any other utilization, 2 plants with no utilization and 23plants with unknown utilization (Fig. 3A). The remaining 238 plants(86% of the WWTPs in this category) utilize the biogas, with 12 outof them injecting upgraded biogas into pipeline. There are 123plants that generate power, accounting for 45% of all the WWTPs inthis category (Fig. 3B). Among the 123 plants, 74 plants generateelectricity from IC engine, 4 from fuel cell, 6 from microturbine,2 from turbine and the remaining 37 generate electricity fromvarious technologies. There are 32 plants supply the electricity tothe grid, accounting for 12% of all the WWTPs in this category.
The majority (56%) of WWTPs (690 plants) have an averageflow rate ranging from 1 to 10 MGD with AD system operation onthis scale (Fig. 4). There are 505 plants utilizing biogas, with 10 ofthose plants injecting upgraded biogas into pipeline, while 87plants only flare the biogas (Fig. 4A). Totally 125 plants generatepower, accounting for 18% of all the WWTPs in this category(Fig. 4B). Among them, 68 plants generate power from IC engines,23 from microturbines and remaining 34 use other technologies.There are 30 plants (4% of WWTPs in this category) supply powerto the grid. The smallest plant supplying power to the grid hasdesign flow of only 2.3 MGD, located in Coos Bay, Oregon.
Although it was suggested that wastewater influent flow rate of5 MGD or greater are required to produce biogas in quantitiessufficient for economically feasible CHP facilities [10], there are 96WWTPs with average flow rate of less than 1 MGD reporting AD
operation (Fig. 5). A total of 55 plants utilize biogas, while 15 plantsonly flare it (Fig. 5A). None of the plants injects biogas into pipeline,probably due to the economic scale of operations. Most of the WWTPs(75) in this category do not have power generation capabilities, while5 plants generate power using IC engines and 1 plant located inDextar, MI even supplies electricity to the grid (Fig. 5B).
3. Barriers for AD application at US WWTPs
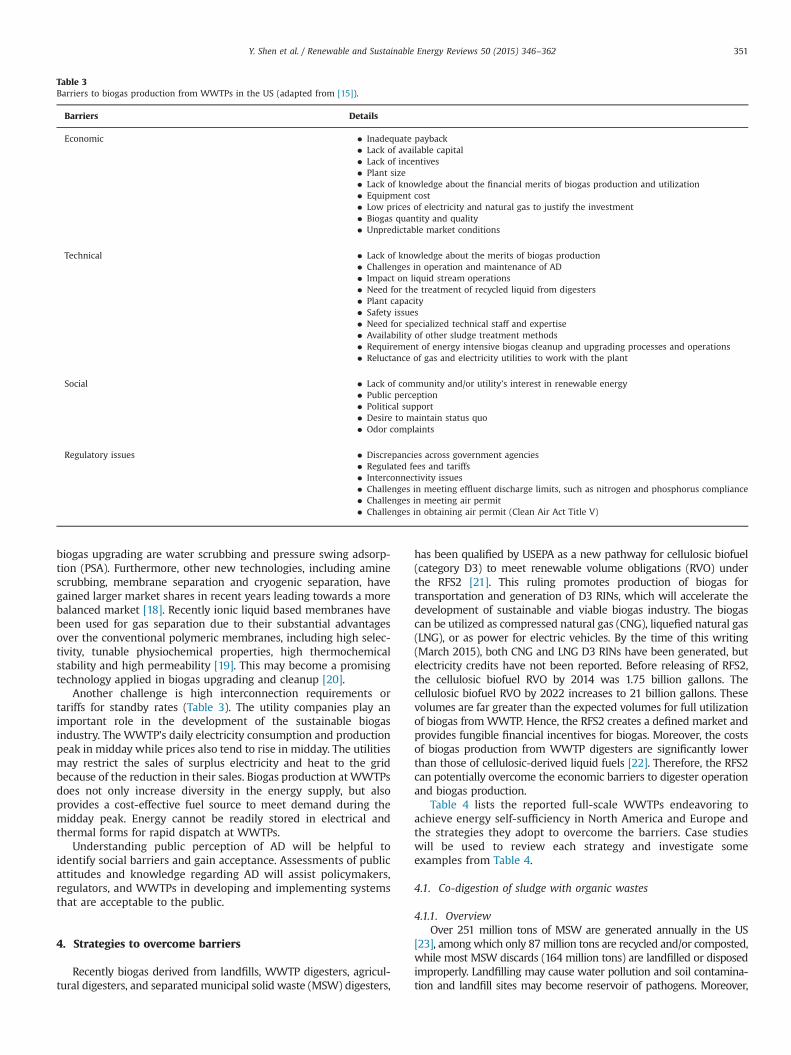
Before the USEPA ruling on qualifying biogas as a cellulosicbiofuel under RFS2, it was difficult to economically produce andutilize biogas from WWTPs. Less than 10% of WWTPs with ADutilize biogas for heating and/or power generation. In this section,the barriers to biogas production and utilization at WWTPs will besummarized [15], with aspects associated with economic, techni-cal, social and regulatory issues (Table 3).
One technical barrier is associated with costly biogas cleanupand upgrading (Table 3). Biogas contains CO2 and other contami-nants, which must be removed prior to utilization in manyapplications, for example, CHP technology, natural gas pipelineinjection and biogas-derived vehicle fuel [16]. Technology selec-tion for contaminants removal and biogas upgrading depends onthe gas composition, gas quality specifications, and grid injectionstandards. Gas quality specifications depend on both its countryand end point utilization [17]. Most European countries have theirown gas grid specs for biomethane standards. For example,Sweden requires methane content of biomethane no less than97% for gas grid injection [17]. In the US, California adopted newstandards of pipeline-quality biomethane in January 2014, whichrequires the minimum heating value of 950–970 BTU/scfm (i.e.35.4–36.2 MJ/m3, or average 93% methane content). Some primarynatural gas provider companies establish standards even morestrict than California and some European countries. For example,SoCalGas (Southern California Gas Company) has its Rule 30,requiring a minimum heating value of 990 BTU/scfm (i.e.36.9 MJ/m3, or 96% methane content). Furthermore, biomethanestandards also have specs for other parameters, including CO2,oxygen, water, hydrogen sulfide, ammonia and hydrocarbons [17].
Several biogas upgrading technologies are commercially avail-able and some state-of-the-art technologies are under developmentat pilot-scale. The technologies dominating the current market of
Fig. 5. WWTPs in the US with average flow less than 1 MGD (A) Biogas utilization; (B) CHP technologies for energy generation from biogas utilization.
Y. Shen et al. / Renewable and Sustainable Energy Reviews 50 (2015) 346–362350
biogas upgrading are water scrubbing and pressure swing adsorp-tion (PSA). Furthermore, other new technologies, including aminescrubbing, membrane separation and cryogenic separation, havegained larger market shares in recent years leading towards a morebalanced market [18]. Recently ionic liquid based membranes havebeen used for gas separation due to their substantial advantagesover the conventional polymeric membranes, including high selec-tivity, tunable physiochemical properties, high thermochemicalstability and high permeability [19]. This may become a promisingtechnology applied in biogas upgrading and cleanup [20].
Another challenge is high interconnection requirements ortariffs for standby rates (Table 3). The utility companies play animportant role in the development of the sustainable biogasindustry. The WWTP’s daily electricity consumption and productionpeak in midday while prices also tend to rise in midday. The utilitiesmay restrict the sales of surplus electricity and heat to the gridbecause of the reduction in their sales. Biogas production at WWTPsdoes not only increase diversity in the energy supply, but alsoprovides a cost-effective fuel source to meet demand during themidday peak. Energy cannot be readily stored in electrical andthermal forms for rapid dispatch at WWTPs.
Understanding public perception of AD will be helpful toidentify social barriers and gain acceptance. Assessments of publicattitudes and knowledge regarding AD will assist policymakers,regulators, and WWTPs in developing and implementing systemsthat are acceptable to the public.
4. Strategies to overcome barriers
Recently biogas derived from landfills, WWTP digesters, agricul-tural digesters, and separated municipal solid waste (MSW) digesters,
has been qualified by USEPA as a new pathway for cellulosic biofuel(category D3) to meet renewable volume obligations (RVO) underthe RFS2 [21]. This ruling promotes production of biogas fortransportation and generation of D3 RINs, which will accelerate thedevelopment of sustainable and viable biogas industry. The biogascan be utilized as compressed natural gas (CNG), liquefied natural gas(LNG), or as power for electric vehicles. By the time of this writing(March 2015), both CNG and LNG D3 RINs have been generated, butelectricity credits have not been reported. Before releasing of RFS2,the cellulosic biofuel RVO by 2014 was 1.75 billion gallons. Thecellulosic biofuel RVO by 2022 increases to 21 billion gallons. Thesevolumes are far greater than the expected volumes for full utilizationof biogas from WWTP. Hence, the RFS2 creates a defined market andprovides fungible financial incentives for biogas. Moreover, the costsof biogas production from WWTP digesters are significantly lowerthan those of cellulosic-derived liquid fuels [22]. Therefore, the RFS2can potentially overcome the economic barriers to digester operationand biogas production.
Table 4 lists the reported full-scale WWTPs endeavoring toachieve energy self-sufficiency in North America and Europe andthe strategies they adopt to overcome the barriers. Case studieswill be used to review each strategy and investigate someexamples from Table 4.
4.1. Co-digestion of sludge with organic wastes
4.1.1. OverviewOver 251 million tons of MSW are generated annually in the US
[23], amongwhich only 87million tons are recycled and/or composted,while most MSW discards (164 million tons) are landfilled or disposedimproperly. Landfilling may cause water pollution and soil contamina-tion and landfill sites may become reservoir of pathogens. Moreover,
Table 3Barriers to biogas production from WWTPs in the US (adapted from [15]).
Barriers Details
Economic � Inadequate payback� Lack of available capital� Lack of incentives� Plant size� Lack of knowledge about the financial merits of biogas production and utilization� Equipment cost� Low prices of electricity and natural gas to justify the investment� Biogas quantity and quality� Unpredictable market conditions
Technical � Lack of knowledge about the merits of biogas production� Challenges in operation and maintenance of AD� Impact on liquid stream operations� Need for the treatment of recycled liquid from digesters� Plant capacity� Safety issues� Need for specialized technical staff and expertise� Availability of other sludge treatment methods� Requirement of energy intensive biogas cleanup and upgrading processes and operations� Reluctance of gas and electricity utilities to work with the plant
Social � Lack of community and/or utility’s interest in renewable energy� Public perception� Political support� Desire to maintain status quo� Odor complaints
Regulatory issues � Discrepancies across government agencies� Regulated fees and tariffs� Interconnectivity issues� Challenges in meeting effluent discharge limits, such as nitrogen and phosphorus compliance� Challenges in meeting air permit� Challenges in obtaining air permit (Clean Air Act Title V)
Y. Shen et al. / Renewable and Sustainable Energy Reviews 50 (2015) 346–362 351

Table 4Energy self-sufficiency of full-scale WWTP with AD of sewage sludge and co-digestion of organic waste in North America (US and Canada) and Europe.
Plant Location Flowrate
Feedstock (Loading rate) Digestercapacity
Digesteroperation
Biogas cleanup/upgradingtechnology
Annualbiogasproduction
Biogas utilization (CHPtechnology)
Energy self-sufficiency
Reference(s)
Average flow rateo5 MGDMillbrae WPCP CA, US 2
MGDWAS (28,000)þFOG (3000)¼31,000GPD
2�1900 m3 Mesophilic N/A N/A 1 MBTU [g] Boiler 68% [77]HRT 38–58 d Microturbine
Essex Junction WWTP VT, US 2MGD
SludgeþFOGþHSW (brewery andoily waste)
2�1350 m3 Two-Stage PSA-water stripper 1.7 GW h 2�20 kW Microturbine 38% [15]MesophilicHRT 25–30 d
Grevesmuhlen WWTP Germany 4MGD
PS (10%)þWAS (60%)þGreaseskimming sludge (30%)¼1840 t TS/yr
2�1000 m3 Mesophilic N/A 1.95 GW h 210 kW IC Engine 100% [78]HRT 17.5 d 1.7 GW h/year Electricity Sale420%
Wolfgangsee-Ischl WWTP Austria 5MGD
Mixed PSþWAS N/A Two-Stage PSA 3.0 GW h High-efficiency (34%)Cogenerator
100% [60,61]Sale 10%
Mesophilic 1 GW h ElectricityHRT 80 d
Velenje WWTP Slovenia 5MGD
SludgeþOrganic waste (1.01 COD kg/m3/d)¼1100 t/yr
2�1000 m3 Mesophilic N/A 2.8 MW h 365 MW h/year Electricity N/A [79]HRT 20 d 1645 MW h/year Heat
Treviso WWTP Italy 5MGD
WASþOFMSW 2000 m3 Mesophilic N/A 1.5 GW h N/A N/A [80,81](1 t OFMSW per 10 m3 WAS) HRT 22 d
Average Flow Rateo50 MGDStrass im Zillertal WWTP Austria 6
MGDMixed BNR WASþTrapgreaseþCrude glycerolþFood waste
N/A Mesophilic N/A 10 GW h High-efficiency (38%)Cogenerator
100% [59,82]Sale 20%
Watsonville WWTP CA, US 7MGD
WAS (83,333)þFOG (4500)¼88,000GPD
2�5700 m3 Mesophilic N/A N/A 600 kW Cogenerator N/A [77,83]
Boden WWTP Sweden 10MGD
Sludge (24,000)þFood waste(1200)¼25,200 GPD
1300 m3 Thermophilic PSA 5.5 GW h 3.5 GW h/yr Plant heating N/A [84]1.6 GW h/yr City heatingnetwork distribution
HRT 14–16 d 400 MW h Excess biogasupgraded to vehicle fuel
Viareggio WWTP Italy 10MGD
SludgeþOFMSW (1.21 kg VS /m3/d) 1st: 3000 m3 Mesophilic N/A 2.2 GW h N/A N/A [80]¼ 350 t/d 2nd: 1500 m3 HRT 20 d
Gloversville–JohnstownJoint WWTP
NY, US 11MGD
SludgeþHSW (yogurt/cheese wheywastewater)
1st: 5700 m3 Two-Stage Activated carbon 28 GW h 6.6oonline4 o/online4GW h/yearElectricity
100% [85]Mesophilic
2nd: 4900 m3 HRT 15 d 9.0 GW h/year HeatSheboygan RegionalWWTP
WI, US 11MGD
SludgeþFOGþHSW (dairy waste) 3 Primary Mesophilic CondensationþActivatedcarbon
32 GW h 700 kW Microturbine 100% [15,86,87]6 GW h/year Electricity
1 Secondary 20 GBTU/year HeatGresham WWTP OR, US 13
MGDSludge (60,000)þFOG (9000)¼69,000 GPD
2�3800 m3 Mesophilic N/A 17.2 GW h 2�400 kW Cogenerators 100% [74,88]5 GW h/year Electricity
HRT 18 d 10.7 GW h/year HeatDouglas L. Smith MiddleBasin WWTP
KS, US 15MGD
Sludge (6700 t/yr)þFOG (3.23 MGY) 4�2000 m3 Mesophilic N/A 35 GW h 2�1.06 MW IC Engine 50% [43,89–91]5.4 GW h/year Electricity
South Bayside SystemAuthority Redwood CityWWTP
CA, US 18MGD
WAS (250,000)þFOG (3500)¼253,500 GPD
3�5700 m3 Mesophilic N/A N/A N/A N/A [77]
Baden–Baden WWTP Germany 20MGD
PS (15.9 MGD)þWAS (5.3 MGD)þMunicipal biowaste (8.8 MGD)
Hydrolyzer:474 m3
Hydrolysis: N/A 28.3 GW h N/A N/A [55]42 1C, HRT23 h
Digester: Digestion¼ 30 MGD 2�3000 m3 37 1C, HRT
14 hRiverside Water QualityControl Plant (WQCP)
CA, US 30MGD
PS (40,000)þWAS (30,000)þFOG(20,000)¼90,000 lb VS/d
N/A Mesophilic Iron spongeþrotary lobeblowersþgaschillingþactivated carbonvessels
N/A 2.5 MW Cogenerator N/A [92]1.2 MW Fuel cell
Y.Shenet
al./Renew
ableand
SustainableEnergy
Review
s50
(2015)346
–362352

F. Wayne Hill WRC WWTP,Gwinnett County
GA, US 33MGD
Sludge (204,000)þFOG/HSW(23,250)¼227,250 GPD
5�3800 m3 Mesophilic Iron spongeþactivatedcarbon
46.2 GW h 2.15 MW Cogenerator 50% [15,45,93]Egg-shaped HRT 15 d 13 GW h/year Electricity
South-Cross Bayou WRF,Pinellas County
FL, US 33MGD
SludgeþFOG (2000–6000 dry lb/yr) N/A Mesophilic N/A N/A 1.4 MW Cogenerator N/A [15,94,95]
South Columbus WRF GA, US 35MGD
SludgeþFOG 1 CSTR CSTR-Hydrolysis:
PSA: 40 GW h 2�1.75 MW IC Engine 40% [7,46,57,96,97]
53 1C, HRT6 d
2�67 m3 PFR PFR-Hydrolysis:53 1C, HRT30 min
2�4500 m3
DigestersDigestion:37 1C, HRT 15 d Iron spongeþrotary lobe
blowersþgaschillingþactivated carbonvessels
11 GW h/year Electricity
Prague Central WWTP CzechRepublic
42MGD
Mixed PSþWAS 12�4800 m3 2-Stage N/A 115 GW h 3�1 MWe [15]þ2�1.2 MWeCogenerators
94% [62,63,98]Thermophilic
(70 t VS/yr) HRT 25 d 37.6 GW h/year ElectricityInland Empire UtilitiesAgency (IEUA) RegionalPlant No. 1, Ontario
CA, US 44MGD
SludgeþDairy manure/Food waste(80/20)¼1.53–3.10 kg VS/m3/d
N/A 3-Stage AG-MTM
PSA-water stripper 60 GW h 2.8 MW Fuel cell þ 80% [99,100]
1st Stage: 4.2 MBTU Heat recoverysystem37 1C, HRT
3 d2nd Stage:55 1C, HRT10 d3rd Stage:37 1C, HRT15 d
Average Flow Rateo100 MGDDes Moines MWRAWWTP
IA, US 59MGD
SludgeþFOGþHSW ¼ 0.5 MGD 6�10,000 m3 Mesophilic PSA 90 GW h 73 GW h/year Electricity 75% [15,43]42 GW h/year Sale Cargill
HRT 33 d 9 GW h/year HeatZürich Werdhölzli WWTP Switzer-
land67MGD
Sludge (18,000)þFOG (5000)¼23,000 t TS/yr
4�7250 m3 Mesophilic N/A 41.4 GW h High-efficiency Cogenerator 100% [101,102]
East Bay Municipal UtilityDistrict WWTP, Oakland
CA, US 70MGD
SludgeþFOG/Food waste/HSW 12�7500 m3 Mesophilic Activated carbon 90 GW h 3�2.1 MW ICEnginesþ4.6 MW Turbine¼11 MW
100% [103,104]
HRT 18 d 55 GW h/year Electricity(10 GW h/year Sale)
Sale 20%
Gryaab WWTP Sweden 92MGD
Sludge (430,000)þFOG (5000)þHSW (4000)¼439,000 t/yr
2�11,400 m3 Mesophilic Amine absorption (COOAPTM
Process)60 GW h Biogas sold to Goteborg
Energi Co. for upgradingN/A [105]
Csepel WWTP Hungary 93MGD
Mixed PSþWAS from BNR Process Thermophilic: 1st Stage: N/A 95 GW h 39 GW h/year Electricity 65% [54]55 1C, HRT 12 d 20 GW h/year HeatExelysTM
Hydrolysis:17,000 m3 165 1C, HRT
30 minMesophilic: 2nd Stage:
(85 t TS/yr) 6300 m3 37 1C, HRT15 d
Average Flow Rateo500 MGDVillage Creek WRF, FortWorth
TX, US 110MGD
SludgeþFOGþHSW (food processingwaste, glycerin/organics acids frombiodiesel facility)
14�4500 m3 Mesophilic N/A 62 GW h 2�5.2 MW Turbines 75% [106–109]2 Steam-Turbines
Annacis Island WWTP,Vancouver
Canada 130MGD
Sludge (0.69)þFOG (0.07)¼0.76MGD
4�12,000 m3 Thermophilic N/A 132 GW h IC Engines 50% [83,110,111]
Y.Shenet
al./Renew
ableand
SustainableEnergy
Review
s50
(2015)346
–362353

landfills were the 3rd largest source of anthropogenic CH4 GHG emi-ssions (103 million metric tons CO2 equivalent) in the US in 2012 [12].
AD is a better practice than landfilling for MSW management,attributing to high solid destruction efficiency (up to 90%) withbiogas production, much smaller site space and reduced GHGemissions.
Sewage sludge is usually characterized by its low digestibility;therefore, performance of AD systems might be limited with sucha single feedstock. Co-digestion of sludge with other organicwastes has received increasing attention in recent years, asWWTPs will potentially benefit from this practice in terms ofvarious aspects described as follows.
First, co-digestion increases digester gas production. The improve-ment in methane yield resulting from co-digestion of sludge andorganic waste has been widely reported [24–27]. Biogas production atnew European co-digestion plants ranges from 2.5 to 4.0 m3 biogas/day/m3 digester tankage, whereas biogas production at the USWWTPs sludge only digesters ranges from 0.9 to 1.1 m3 biogas/day/m3 digester tankage [28]. Sewage sludge as a single feedstock ischaracterized by low C:N ratio (less than 10) and relatively lowanaerobic biodegradability. Addition of carbon-rich co-digestion mate-rial can potentially improve the overall C:N ratio of feedstock towardsthe ideal range (20–30) for optimum AD performance [29,30].Furthermore, hydrolysis has been recognized as the rate-limiting stepin sludge AD process [31,32]. Organic waste rich in easily biodegrad-able matters such as carbohydrates and lipids can accelerate hydrolysisto provide more soluble substrates for subsequent acidogenic andmethanogenic processes. The attractive co-digestion feedstock includefats, oil and grease (FOG), food waste and scrap, organic fraction ofmunicipal solid waste (OFMSW), food/beverage processing waste (e.g.brewery waste, dairy product wastewater streams), energy crops,agricultural residues, livestock manure, biofuel by-products (e.g.corn-ethanol stillage, crude glycerol, spent microalgae) and other highstrength waste (HSW). Fig. 6 presents biogas yield and specificbiomethane potential of various organic wastes as co-digestion feed-stock. It should be noted that sewage sludge has a methane potentialranging from 240 to 340 L CH4 per kg volatile solids (VS) loaded [28].Hence, co-digestion of sludge with such organic waste will promotethe overall AD performance for biogas production. Moreover, co-digestion allows higher organic loading rate of AD process, which willmaximize cost-effective use of AD tankage for more biogas productionper unit volume of digester tank.
Second, co-digestion will generate extra revenue for WWTPswith a tipping fee charge. For example, the tipping fee of foodwaste varies from $50 to $170 per ton in the US [33]. Economics isone of the most important driving forces for integration of co-digestion facilities at WWTPs. Revenue streams have to be greaterthan expenses by large margin to make a positive business case.
Third, co-digestion with enhanced AD performance will lead toan integrated waste-to-energy process with mixed feedstockssourced locally. This practice is advantageous over separate ADor individual processing of each waste stream at different loca-tions, because it provides more efficient use of the digester and thegas upgrading facility. However, the implementation of co-digestion into WWTPs faces significant site-specific and infra-structural hurdles to overcome. Several technical and engineeringconcerns associated with co-digestion occurring at WWTP diges-ters have been reviewed elsewhere [27,34–36]. The key concernsare summarized as follows:
� Need for facility upgrading/retrofitting at existing WWTPs: Instal-lation and/or upgrades may include receiving station, storagetank, pipelines, pumps, mixers and biogas upgrade equipmentand CHP facility; design criteria should be made to preventprocess failure, such as pipeline clogging and insufficientmixing, and to enlarge digester volumeTa
ble
4(con
tinu
ed)
Plant
Loca
tion
Flow
rate
Feed
stock
(Load
ingrate)
Digester
capac
ity
Digester
operation
Bioga
sclea
nup/upgr
ading
tech
nology
Annual
bioga
spro
duction
Bioga
sutiliza
tion(CHP
tech
nology
)En
ergy
self-
suffi
cien
cyReferen
ce(s)
PointLo
maW
WTP
CA,U
S17
5MGD
Mixed
PSþWAS(1
MGD)
8�13
,600m
3Mesop
hilic
HRT30
dPS
A19
3GW
h2�2.25
MW
ICEn
gines
100%
[46,11
2,113]
34.3
GW
h/yea
rElectricity
53.5
GW
h/yea
rHea
tEx
cess
biog
asupgrad
edan
dsold
topow
eroff-site
4.5MW
fuel
cells
Dav
yhulm
eW
WTW,
Man
chester
Englan
d20
0MGD
Mixed
PSþWAS
2�75
00m
3Cam
biTM
Hyd
rolysis:
N/A
238GW
h12
MWeIC
Engines
96%
[114
–116]
1651C,H
RT
20min
Digestion
:87
.6GW
h/yea
rElectricity
(91,000tTS
/yr)
401C,H
RT
18–19
dJointW
ater
Pollu
tion
Con
trol
Plan
t,Carson
CA,U
S30
0MGD
Sludge
(91%
)þFo
odwaste
(9%)¼
4.84
MGD
24�14
,200m
3Mesop
hilic
HRT20
dVen
turiscrubb
ersþ
coalescing
filter
þco
olingco
ils48
4GW
h3�10
MW
Turbines
97%
[117
,118
]17
5GW
h/yea
rElectricity
Upgrad
edbiog
asinjection
toCNG
fuelingfacility
(300,000GGE)
BluePlainsAW
WTP
,W
ashington
DC
DC,U
S37
5MGD
Mixed
PSþWAS
4�14
,200m
3Cam
biTM
Hyd
rolysis:
N/A
360GW
h3�4.6MW
Turbines
33%
[52,76
]
1651C,H
RT
20min
103GW
h/yea
rElectricity
Y. Shen et al. / Renewable and Sustainable Energy Reviews 50 (2015) 346–362354

� Design of new WWTPs in the future: Co-digestion should beadded into the design criteria for design of new WWTPconstructions in the future
� Digestion instability: High variability of co-digestion feedstockcharacteristics (variations in composition and volume) maycause process instability such as pH fluctuation due to rapidaccumulation of volatile fatty acids (VFAs) in the digester. Thismay be alleviated by adopting a staged-AD process to separatehydrolysis/acidogenesis and methanogensis for enhanced pro-cess stability and methane production. Several US WWTPs havebeen reported implementing this technology [37] and some ofthem are presented in Table 4.
� Digestion inhibition: Depending on composition of co-digestionfeedstock, inhibitory substances may be generated during ADprocess, including ammonia (due to protein-rich organicwaste), long-chain fatty acids generated from lipid-rich waste,such as FOG and food waste, and heavy metals (high concen-tration found in OFMSW).
� Digester overloading: Co-digestion feedstocks such as FOG and foodwaste lead to high organic loading of digester resulting from theirhigh volatile solids (VS) and chemical oxygen demand (COD),which may cause foaming issues and process upsets [38–40].
Co-digestion has been a common practice for many EuropeanWWTPs. Although it was estimated that 216 WWTPs in the USreceive organic waste for co-digestion with sewage sludge [11],little information can be found in literature. Table 4 also presents
the detailed information of 19 full-scale WWTPs incorporating co-digestion projects in the US.
4.1.2. Case studiesEast Bay Municipal Utility District (EBMUD) wastewater facility
with an average flow rate of 70 MGD is located in Oakland, CA, andbecame the first energy-neutral WWTP in North America in 2012[41]. Various waste streams including FOG, food waste and winerywaste are collected off-site and then transported to the wasteprocessing facility with a capacity of 120 t/day. The pretreatedmixed waste pulp is fed into EBMUD’s thermophilic digesters forco-digestion with sewage sludge, boosting the biogas productionby almost 70%. EBMUD installed a 4.6 MW jet engine-sized turbinein 2012, which expanded the total capacity of its power generationstation to more than 11 MW, enough to handle the current biogasproduction rate of 38,000 m3/day. The biogas from the digesters isfirst subjected to moisture removal in the chilling unit and thenpasses through a series of activated-carbon canisters for siloxaneremoval. With the co-digestion project and upgraded CHP facility,EBMUD is producing electricity to meet 126% of the WWTP’selectric power demand, while the surplus electricity is supplied tothe grid. During fiscal year 2012–2013, EBMUD generated $2million in revenue from FOG/food waste co-digestion [42].
Des Moines Metropolitan Wastewater Reclamation Authority(MWRA) WWTP treats an average flow rate of 59 MGD of waste-water from metropolitan Des Moines, IA area [15]. The WWTP hasadvanced secondary treatment facility for enhanced nitrogen
0 200 400 600 800 1000 1200
0 200 400 600 800 1000 1200
Corn stover
Raw glycerol
Oat hull
Dairy manure
Swine manure
Poultry manure
Food waste
Sweet sorghum
Alfalfa silage
Molasses
Grass silage
Brewery waste
Potato pulp
Corn silage
Sugar beet
Cereal grains
Rapeseed cake
Bakery waste
OFMSW
Corn thin stillage
Fats, oil & grease
Biogas yield (m3 gas/ton wet mass)
Specific biomethane potential (L CH4/kg VS)
Biogas yield
Specific methane yield
Fig. 6. Biogas yield and specific biomethane potential of various feedstocks (Data source [119–121]).
Y. Shen et al. / Renewable and Sustainable Energy Reviews 50 (2015) 346–362 355

removal. The city of Des Moines metro area has adopted the FOGordinance mandated by the EPA since 2006, which requires eachmunicipality to install a FOG control program to prevent sanitarysewer blockage and overflows. All food service establishmentsmust have grease removal devices maintained by a certified greasehauler once they reach 25% of the design capacity. This was thekey driving force for the plant to initiate their Bioenergy MasterPlan in 2007 for co-digesting FOG and HSW (whey, food proces-sing waste, biodiesel production waste and waste from dissolvedair flotation of biodegradable packing plant) with municipalsludge. The plant receives 26 million gallons (98,421 m3) of FOGand HSW per year, averaging approximately 500,000 gallon(1893 m3) weekly. The mixed feedstock generally consists of 42%of FOG and HSW and the remaining primary and secondary sludge[43]. Since 2008, MWRA has maintained a joint partnership withCargill, whose oilseed processing facility is adjacent to the WWTP,to sell excess biogas to Cargill through a delivery system betweenthe two sites. Nowadays the plant sells 40–50% of biogas to Cargill,generating $460,000 to $800,000 in annual revenue. The digestercomplex, gas distribution system and CHP facility were upgradedin 2010 to accommodate the increased organic loading rate and togenerate energy from biogas more efficiently. The submerged fixedcovers and internal draft tube mixers have been selected aseffective strategies for better control and easier removal of foam.MWRA also installed two 1.5 MW cogeneration units to expandthe power generation capacity from 1.8 MW (3�600 kW ICengines) to 4.8 MW. This came along with a PSA unit for biogascleanup and upgrading. MWRA recently proposed to operate abiogas-based compressed natural gas (CNG) fueling station toutilize biogas in excess of 160,000 ft3/day (4531 m3/day) insteadof flaring biogas [44].
F. Wayne Hill Water Resource Center (WRC) is one of the threeWWTPs operated by Gwinnett County Department of WaterResources, treating 33 MGD of wastewater from northeast metropo-litan Atlanta, GA [15]. TheWRC started to co-digest FOG with sludge in2012. Four FOG receiving stations have up to 75,000 gallon (284 m3)daily receiving capacity. FOG and on-site sludge together with thesludge from Yellow River Water Reclamation Facility are digested infive 1-MG egg-shaped digesters, where FOG and mixed sludge arecombined at volume ratio of 1:10 (Table 4). With FOG co-digestion,biogas production was increased from 425m3/h to approximately595 m3/h. Prior to its utilization at the CHP facility, biogas is purifiedby using refrigerant drying for moisture removal, iron sponge for H2Sremoval and activated carbon based scrubber for siloxane removal.The biogas is utilized for boiler heating and subsequently upgraded topower a 2.15MW IC engine. The power generation from the biogasCHP facility (�13 GW h/year) can supply approximately 50% of theplant’s demand. FOG co-digestion and upgraded CHP systems canoffer a simple payback period of 4 to 9 years [45].
South Columbus Water Resource Facility (WRF), with an averageflow rate of 35 MGD, employs a novel CBFT3 (Columbus BiosolidsFlow-Through Thermophilic Treatment) process (Fig. 7) consisting of athermophilic continuous stirred tank reactor (CSTR) with mean cellresidence time of 6 days, two thermophilic plug-flow reactors (PFRs)operated in series with batch contact time of 30 min and twomesophilic CSTRs operated in parallel with HRT of 15 days each [46].It should be noted that such a two-staged configuration was devel-oped to separate hydrolysis/acidogenesis and methanogenesis for theAD process, in such a way the process stability and methaneproductivity can be enhanced [47]. This new process can also produceClass A biosolids for increased pathogen reduction. A 12,000-gallonreceiving tank was installed in 2011 to initiate FOG co-digestion. With
Fig. 7. South Columbus WRF: schematic of CBFT3 process conducting FOG co-digestion with sludge (adapted from [7]).
Y. Shen et al. / Renewable and Sustainable Energy Reviews 50 (2015) 346–362356
the CBFT3 process coupled with co-digestion project, the biogasproduction rate is increased to 422 scfm (717m3/h), which isenhanced by 25 to 50% compared to sludge-only digestion. The planthas two 1.75MW cogenerators with 38% gross electrical efficiency,generating 1.38 MW net electricity which provides 40% of the plant’spower demand. Moreover, the CBFT3 process, FOG co-digestion andCHP operation will lead to a net GHG emission reduction of 9600mtCO2 equivalent per year. The payback period of CHP facility isestimated to be less than 10 years [46].
4.2. Sludge pretreatment
4.2.1. OverviewIt has been widely accepted that pretreatment methods, such as
thermal hydrolysis, mechanical disintegration and high-performancepulse technique, have the potential to double the biodegradability ofsewage sludge and hence increase biogas production as well asbiosolids’ dewaterability [48–50]. Some technologies that have beenapplied successfully to full-scale WWTPs in US and Europe will be
Gravity Thickeners DAF Tank
BlendTank
Pre-Dewatering
Cambi TM
THPAnaerobicDigestion
FinalDewatering
Stabilization
Sludge(TS 16.5%)
Lime
Dewatering Class B Biosolids
Class A Biosolids
Biogas CHP Facility
Biogas
ElectricitySteam
Fig. 8. Blue Plains AWTP (A) schematic of the new Biosolids Management Plan (to be online in 2015, adapted from [76]). (For interpretation of the references to color in thisfigure legend, the reader is referred to the web version of this article.)
Electricity (bought)52.4 MWh/d
Wastewater350,000 m3/d
TreatmentScreens
Sand & grit removalPrimary settling
BNRSettling
Thickening
Raw sludge3.545 ton TS/h
TS 6%MesophilicDigestion
6300 m3
HRT = 15 days
CHP12048 kW
Biogas12048 kW
Electricity90 kW
Heat1347 kW
Heat production2257 kW
Sludge114.3 ton/d
TS 32%
Electricity33 kW
Electricity110 kW
Electricity158.6 MWh/d
Electricity3420 kW
Electricity production106.2 MWh/d
ThermophilicDigestion17000 m3
HRT = 12 days
CentrifugeCentrifuge
Thermal Hydrolysis
165 °C30 min
Electricity40 kW
Electricity40 kW
Heat1867 kW
Fig. 9. Csepel WWTP: ExleyTM-DLD process and flow of wastewater, sludge, thermal and electrical power (based on data reported in [54]).
Y. Shen et al. / Renewable and Sustainable Energy Reviews 50 (2015) 346–362 357

reviewed briefly, including CambiTM (thermal hydrolysis), ExelysTM-DLD (thermal hydrolysis) and BTAs Process (hydromechanicalscrew-mill).
4.2.2. Case studiesBlue Plains Advanced Wastewater Treatment Plant (AWTP),
operated by District of Columbia Water and Sewer Authority (DCWater), is the largest plant of this kind in the world, averaging 370MGD (Table 4), which provides advanced nutrient removal (i.e.nitrification and denitrification, multi-media filtration and chlor-ination/dechlorination) [51]. The plant used to generate Class Bbiosolids for land application by 100% lime-stabilizing and dewa-tering sludge (primary, secondary and nitrification/denitrification).Currently DC Water is implementing their new Biosolids Manage-ment Program (Fig. 8) that includes four CambiTM thermal hydro-lysis process (THP) trains (6 reactors each train) for sludgepretreatment, four 3.75 MG (14,200 m3) mesophilic anaerobicdigesters for biogas production and three 4.6 MW gas turbinesfor power generation and heat recovery [52]. In each THP train,pre-dewatered raw sludge (TS �16.5%) is preheated in the pulpertank to 97 1C for homogenization for 1.5 h and then treated in THPreactors at 165 1C and 6 bar for 20 min. The pressurized sludge issubsequently transported to the flash tank, where cell destructionoccurs resulting from pressure drop. The sludge temperature isdecreased to approximately 102 1C by flashing steam back to thepulper tank. THP generates hydrolyzed sludge (TS 8–12%) withlower viscosity allowing mixing at higher solids concentration andmore readily biodegradable materials for subsequent AD process,which results in remarkably higher biogas production compared toconventional digestion. Biogas will be utilized to fuel the CHPfacility to generate 11.8 MW of power and supply steam for THPsimultaneously, which will not only offset 33% of the powerconsumption but also reduce the plant’s GHG emissions by 40%.The THP-pretreated sludge can be fed to digesters at higherorganic loading rates with reduced digester volume, which furtherenhances the economy of the project [53]. This process will alsogenerate pathogen-free Class A biosolids for soil amendment. BluePlains AWWTP will be the first facility in North America thatadopts full-scale THP technology for sludge pretreatment prior to
AD. This practice will potentially reduce the plant’s carbonfootprint by approximately 60,000 mt of CO2 equivalent annually,resulting from biogas-based energy generation, elimination of limefor sludge stabilization and reduced truck use for biosolidsdisposal and transportation [52].
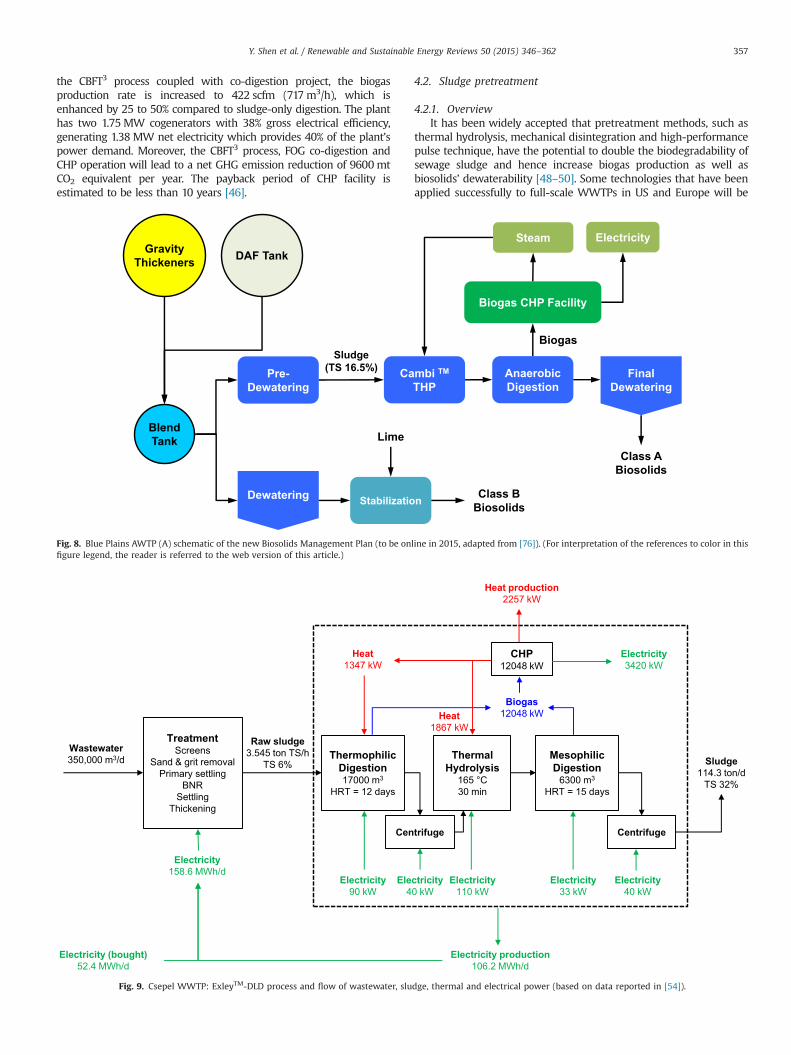
Csepel WWTP is an AWTP located in Budapest, Hungary withbiological nutrient removal (BNR) process, treating an average flowof 350,000 m3/day (93 MGD) [54]. Previously primary sludge mixedwith BNR sludge were first pasteurized at 70 1C for 30 min andsubsequently subjected to thermophilic digestion with 12-day HRT.With this configuration, electricity production (78.1 MW h/day)from a biogas fueled CHP facility could only offset 49% of the powerdemand. It should be noted that a significant proportion of the rawsludge fed into digesters is activated sludge from BNR units, whichhas a very low biogas potential. An ExelysTM thermal hydrolysissystem and a second digester (6300 m3) operated at mesophilictemperature were recently incorporated in the plant, forming aunique ExelysTM-DLD (Digestion–Lysis–Digestion) configuration topromote biogas production and power generation (Fig. 9). The maindifference between ExelysTM and CambiTM processes is that Exe-lysTM can handle sludge with Z25% TS, while the latter has a designbasis of 16.5% TS. However, ExelysTM process does not have a recyclesteam system and therefore it is more energy-intensive. The newbiosolids management design (Fig. 9) can potentially increase theelectricity production to 106.2 MW h/day, improving the powerself-sufficiency to 65% [54].
Baden–Baden WWTP is one of the very first co-digestion plantsin Germany, which has been carrying out municipal biowaste/sewage sludge co-digestion since 1993 [55]. Prior to digestion,municipal biowaste and sewage sludge are first subjected to aBTAs hydromechanical pretreatment process consisting of a screwmill, a pulper, a hydrocyclone and a buffer tank [56]. The plantwould need to upgrade the existing digesters to a two-stage ADprocess consisting of a hydrolysis reactor (473 m3, HRT 23 h) andtwo digesters (each 3000 m3, overall HRT 14.3 days) to accom-modate the increased organic loading rate (sewage sludge at220.5 m3/day, municipal biowaste at 82.7 m3/day and food waste8.8 m3/day) (Fig. 10). All these rehabilitations will improve thebiodegradability of feedstock by 18.5%, reduce the total HRT by25%, and enhance biogas production by 12.8% [55].
Reception Screw Mill Pulper
BTA Hydromechanical Pretreatment
Disposal Composting
Hydrolysis Digesters
Baden-Baden Anaerobic Digestion
Solids
Sewage Sludge(220.5 m3/day)
Solid-Liquid Separation
Municipal Biowaste(82.7 m3/day)
Food Waste(8.8 m3/day)
Biogas CHP Facility
Electricity Heat Biomethane
Solids
Solids
Fig. 10. Baden–Baden WWTP: schematic of solid pretreatment process (BTAs Process), two-stage AD system (hydrolysis reactor and digesters) and biogas utilization system(based on data from [55]).
Y. Shen et al. / Renewable and Sustainable Energy Reviews 50 (2015) 346–362358
4.3. Process optimization
4.3.1. OverviewMunicipal wastewater contains 10 times as much energy as is
required for treatment to meet the effluent discharge standards[57,58]. However, there are many challenges to recover thatenergy for utilization in wastewater treatment. Among variousunits at a typical WWTP, aeration consumes the most energy used(54.1%), followed by AD (14.3%) and wastewater pumping (14.2%)[7]. Therefore, it is important for the WWTPs to reduce the energydemand of these processes towards energy self-efficiency, viausing energy-efficient equipment and configuration optimization.Some examples of energy-neutral and net-energy-positiveWWTPs will be briefly discussed as below, while detailed informa-tion can be found elsewhere [59–63].
4.3.2. Case studiesStrass WWTP in Austria is a net-energy-positive plant with an
average flow rate of 6 MGD (Table 4). It has a two-stage activatedsludge process consisting of a high-loaded A-stage (HRT 30 min;SRT 12–18 h) for COD removal and a low-rate B-stage (SRT �10days) for BNR. Over the past two decades, the plant has adoptedseveral strategies for process optimization to achieve 100% energyself-sufficiency. First, the DEMONs process was implemented in2004 for sidestream deammonification [64] in a single-sludgesuspended-growth sequencing sludge reactor (SBR) system(500 m3, capacity 300 kg N/day), which was operated under 8-hcycle. This deammonification process based on anaerobic ammo-nia oxidation (i.e. anammox) can reduce energy demand foraeration by 63% [65,66], compared to conventional nitrification/denitrification configuration. In order to prevent rapid nitrite(NO2
�) accumulation (which inhibits deammonification) and sec-ondary aerobic nitrification (NO2
� to NO3� , catalyzed by nitrite
oxidizing bacteria (NOB), which compete with anammox bacteriafor available nitrite substrate) simultaneously, intermittent aera-tion is controlled by both dissolved oxygen concentration (0.06–0.3 mg/L) and pH level. Partial nitrification (NH4
þ to NO2�)
decreases pH, while anammox increases pH. The successfulDEMONs operation relies on a tight pH bandwidth (0.01 unit)for aeration control [67]. With the implementation of DEMONs
process, energy demand for sidestream BNR was reduced by 44%,from 350 kW h/day to 196 kW h/day; furthermore, the higherproportion of A-stage sludge fed into digesters increased themethane content of biogas from 59% to 62%. Second, ultra-high-efficiency aeration strips were installed to replace the conven-tional fine-bubble diffusers [59]. Third, cogeneration unit wasupgraded for biogas utilization with electrical efficiency boostedfrom 33% to 38% [59]. The DEMONs deammonification technologywas expanded towards mainstream application at Strass WWTP in2011 [68]. A hydrocyclone system was installed to separateammonia oxidizing bacteria and anammox bacteria due to slowergrowth rate of the latter organisms. This biomass selectionstrategy successfully enables enrichment of anammox granulesin the mainstream and wash-out of NOB flocs to maintain theprocess stability [66,69].
Mainstream deammonification is a promising process to drive aparadigm shift in wastewater treatment industry towards energy-neutral or even net-energy-positive WWTP with BNR in the future,as it could not only provide substantial reduction in energydemand for aeration (by 63%), sludge generation (by 80%), organiccarbon requirement (by nearly 100%) and need for additionalalkalinity (by nearly 100%) [66], but also enhance biogas produc-tion by 25% [65]. The first full-scale anammox-based deammoni-fication process in the US went online in 2012 for sidestreamnitrogen removal at Hampton Roads Sanitation District (HRSD)’s
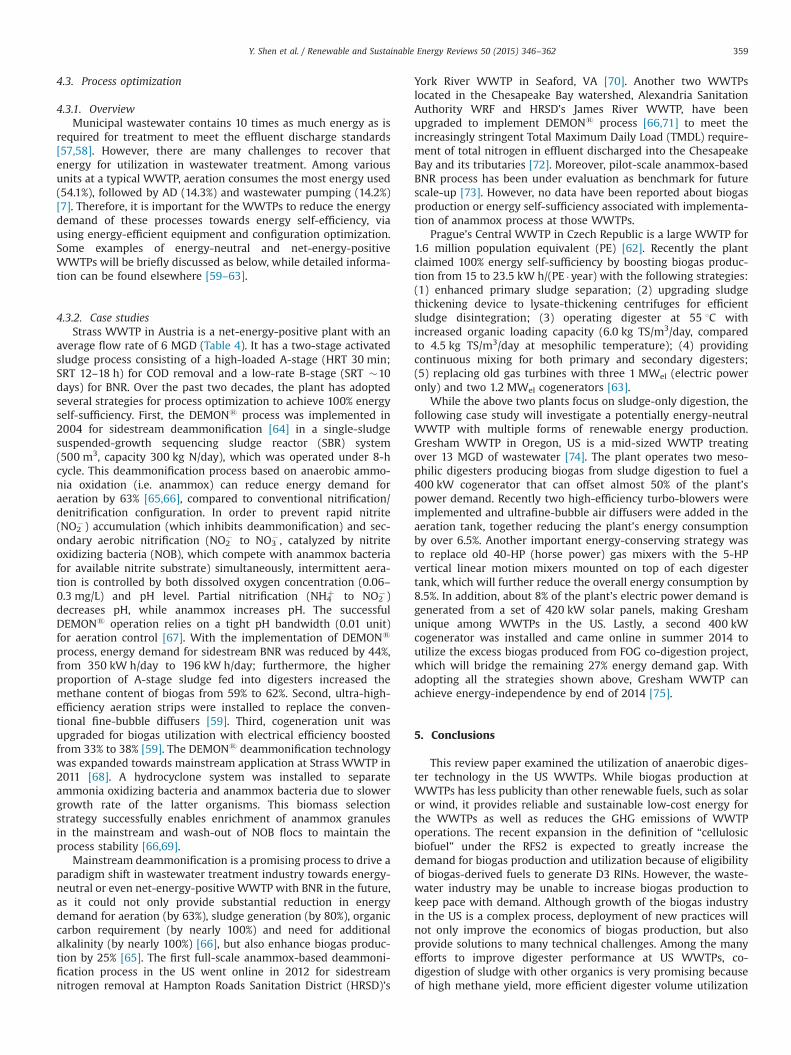
York River WWTP in Seaford, VA [70]. Another two WWTPslocated in the Chesapeake Bay watershed, Alexandria SanitationAuthority WRF and HRSD’s James River WWTP, have beenupgraded to implement DEMONs process [66,71] to meet theincreasingly stringent Total Maximum Daily Load (TMDL) require-ment of total nitrogen in effluent discharged into the ChesapeakeBay and its tributaries [72]. Moreover, pilot-scale anammox-basedBNR process has been under evaluation as benchmark for futurescale-up [73]. However, no data have been reported about biogasproduction or energy self-sufficiency associated with implementa-tion of anammox process at those WWTPs.
Prague’s Central WWTP in Czech Republic is a large WWTP for1.6 million population equivalent (PE) [62]. Recently the plantclaimed 100% energy self-sufficiency by boosting biogas produc-tion from 15 to 23.5 kW h/(PE � year) with the following strategies:(1) enhanced primary sludge separation; (2) upgrading sludgethickening device to lysate-thickening centrifuges for efficientsludge disintegration; (3) operating digester at 55 1C withincreased organic loading capacity (6.0 kg TS/m3/day, comparedto 4.5 kg TS/m3/day at mesophilic temperature); (4) providingcontinuous mixing for both primary and secondary digesters;(5) replacing old gas turbines with three 1 MWel (electric poweronly) and two 1.2 MWel cogenerators [63].
While the above two plants focus on sludge-only digestion, thefollowing case study will investigate a potentially energy-neutralWWTP with multiple forms of renewable energy production.Gresham WWTP in Oregon, US is a mid-sized WWTP treatingover 13 MGD of wastewater [74]. The plant operates two meso-philic digesters producing biogas from sludge digestion to fuel a400 kW cogenerator that can offset almost 50% of the plant’spower demand. Recently two high-efficiency turbo-blowers wereimplemented and ultrafine-bubble air diffusers were added in theaeration tank, together reducing the plant’s energy consumptionby over 6.5%. Another important energy-conserving strategy wasto replace old 40-HP (horse power) gas mixers with the 5-HPvertical linear motion mixers mounted on top of each digestertank, which will further reduce the overall energy consumption by8.5%. In addition, about 8% of the plant’s electric power demand isgenerated from a set of 420 kW solar panels, making Greshamunique among WWTPs in the US. Lastly, a second 400 kWcogenerator was installed and came online in summer 2014 toutilize the excess biogas produced from FOG co-digestion project,which will bridge the remaining 27% energy demand gap. Withadopting all the strategies shown above, Gresham WWTP canachieve energy-independence by end of 2014 [75].
5. Conclusions
This review paper examined the utilization of anaerobic diges-ter technology in the US WWTPs. While biogas production atWWTPs has less publicity than other renewable fuels, such as solaror wind, it provides reliable and sustainable low-cost energy forthe WWTPs as well as reduces the GHG emissions of WWTPoperations. The recent expansion in the definition of “cellulosicbiofuel” under the RFS2 is expected to greatly increase thedemand for biogas production and utilization because of eligibilityof biogas-derived fuels to generate D3 RINs. However, the waste-water industry may be unable to increase biogas production tokeep pace with demand. Although growth of the biogas industryin the US is a complex process, deployment of new practices willnot only improve the economics of biogas production, but alsoprovide solutions to many technical challenges. Among the manyefforts to improve digester performance at US WWTPs, co-digestion of sludge with other organics is very promising becauseof high methane yield, more efficient digester volume utilization
Y. Shen et al. / Renewable and Sustainable Energy Reviews 50 (2015) 346–362 359

and less biosolids production. Development of new strategies isimportant to maintain energy self-sufficiency at WWTPs. This ishelpful not only for developing a viable and sustainable biogasindustry, but also for providing valuable insight to state and localregulators and community officials and other stakeholders.
Acknowledgement
This work was funded by the Bioenergy Technologies Office,Office of Energy Efficiency and Renewable Energy in the U.S.Department of Energy. The submitted manuscript has been cre-ated by UChicago Argonne, LLC, Operator of Argonne NationalLaboratory (“Argonne”). Argonne, a US Department of EnergyOffice of Science laboratory, is operated under contract no. DE-AC02-06CH11357. The US Government retains for itself, and othersacting on its behalf, a paid-up nonexclusive, irrevocable worldwidelicense in said article to reproduce, prepare derivative works,distribute copies to the public, and perform publicly and displaypublicly, by or on behalf of the government. The funding source forthe work reported here did not have a role in study design, datacollection, analysis, data interpretation, writing, or in the decisionto publish.
References
[1] USEPA. Clean Watersheds Needs Survey 2008—report to congress. Washing-ton, DC: US Environmental Protection Agency; 2010.
[2] EPRI. WRF. electricity use and management in the municipal water supplyand wastewater industries. Palo Alto, CA: Electric Power Research Institute,Water Research Foundation; 2013.
[3] Copeland C. Energy-water Nexus: the water sector’s energy use. Washington,DC: Congressional Research Service; 2014.
[4] USEPA. Greenhouse gas equivalencies calculator. Washington, DC: ⟨http://www.epa.gov/cleanenergy/energy-resources/calculator.html⟩.
[5] USEPA. Ensuring a sustainable future: an energy management guidebook forwastewater and water utilities. Washington, DC: US Environmental Protec-tion Agency; 2008.
[6] USEPA. Evaluation of energy conservation measures for wastewater treat-ment facilities. Washington, DC: US Environmental Protection Agency; 2010.
[7] WERF. Energy efficiency in wastewater treatment in North America: acompendium of best practices and case studies of novel approaches. In:Crawford G, Sandino J, editors. Alexandria, VA: Water Environment ResearchFoundation; 2010.
[8] WERF. State of science report: energy and resource recovery from sludge. In:Kalogo Y, Monteith H, editors. Alexandria, VA: Water Environment ResearchFoundation; 2008.
[9] Møller J, Boldrin A, Christensen TH. Anaerobic digestion and digestate use:accounting of greenhouse gases and global warming contribution. WasteManage Res 2009;27:813–24.
[10] USEPA. Opportunities for combined heat and power at wastewater treatmentfacilities: market analysis and lessons from the field. Washington DC: UnitedStates Environmental Protection Agency; 2011.
[11] WEF. Biogas production and use at water resource recovery facilities in theUnited States. Alexandria, VA: Water Environment Federation; 2013.
[12] USEPA. Inventory of U.S. greenhouse gas emissions and sinks: 1990–2012.Washington, DC: US Environmental Protection Agency; 2014.
[13] Edwards MR, Trancik JE. Climate impacts of energy technologies depend onemissions timing. Nat Clim Change 2014;4:347–52.
[14] McCarty PL, Bae J, Kim J. Domestic wastewater treatment as a net energyproducer—can this be achieved? Environ Sci Technol 2011;45:7100–6.
[15] Willis J, Stone L, Durden K, Beecher N, Hemenway C, Greenwood R. Barriersto biogas use for renewable energy. Alexandria, VA: Water EnvironmentResearch Foundation; 2012.
[16] Persson M, Jonsson O, Wellinger A. Biogas upgrading to vehicle fuelstandards and grid injection. Paris, France: International Energy Agency(IEA) Bioenergy; 2007.
[17] Petersson A, Wellinger A. Biogas upgrading technologies—developments andinnovations. Paris, France: International Energy Agency (IEA) Bioenergy;2009.
[18] Bauer F, Persson T, Hulteberg C, Tamm D. Biogas upgrading—technologyoverview, comparison and perspectives for the future. Biofuels, BioprodBiorefin 2013;7:499–511.
[19] Uchytil P, Schauer J, Petrychkovych R, Setnickova K, Suen SY. Ionic liquidmembranes for carbon dioxide–methane separation. J Membr Sci2011;383:262–71.
[20] Bakonyi P, Nemestóthy N, Bélafi-Bakó K. Biohydrogen purification bymembranes: an overview on the operational conditions affecting the
performance of non-porous, polymeric and ionic liquid based gas separationmembranes. Int J Hydrogen Energy 2013;38:9673–87.
[21] USEPA. RFS renewable identification number (RIN) quality assurance pro-gram. Washington, DC: United States Environmental Protection Agency;2014 Final Rule. 40 CFR Part 80.
[22] Brown TR, Brown RC. Techno-economics of advanced biofuels pathways. RSCAdv 2013;3:5758.
[23] USDA, USEPA, USDOE. Biogas opportunities roadmap: voluntary actions toreduce methane emissions and increase energy independence, WashingtonDC; 2014.
[24] Edelmann W, Engeli H, Gradenecker M. Co-digestion of organic solid wasteand sludge from sewage treatment. Water Sci Technol 2000;41:213–21.
[25] Mata-Alvarez J, Llabres SMP. Anaerobic digestion of organic solid wastes. Anoverview of research achievements and perspectives. Bioresour Technol2000;74:3–16.
[26] Mata-Alvarez J, Dosta J, Mace S, Astals S. Codigestion of solid wastes: areview of its uses and perspectives including modeling. Crit Rev Biotechnol2011;31:99–111.
[27] Mata-Alvarez J, Dosta J, Romero-Guiza MS, Fonoll X, Peces M, Astals S. Acritical review on anaerobic co-digestion achievements between 2010 and2013. Renewable Sustainable Energy Rev 2014;36:412–27.
[28] Schafer P, Muller C, Willis J. Improving the performance and economics ofco-digestion and energy production. October 5–9. 86th Annual WaterEnvironment Federation technical exhibition and conference, 2013. Chicago,IL: Water Environment Foundation; 2013. p. 793–803.
[29] Chen Y, Cheng JJ, Creamer KS. Inhibition of anaerobic digestion process: areview. Bioresour Technol 2008;99:4044–64.
[30] Rajagopal R, Masse DI, Singh G. A critical review on inhibition of anaerobicdigestion process by excess ammonia. Bioresour Technol 2013;143:632–41.
[31] Dohányos M, Zábranská J, Kutil J, Jeníček P. Improvement of anaerobicdigestion of sludge. Water Sci Technol 2004;49:89–96.
[32] Mottet A, François E, Latrille E, Steyer JP, Déléris S, Vedrenne F, et al.Estimating anaerobic biodegradability indicators for waste activated sludge.Chem Eng J 2010;160:488–96.
[33] Parry D. Improving economics of codigestion. BioCycle. Emmaus, PA: The JGPress Inc; 2013. p. 48–9.
[34] Bond T, Brouckaert CJ, Foxon KM, Buckley CA. A critical review of experi-mental and predicted methane generation from anaerobic codigestion.Water Sci Technol 2012;65:183–9.
[35] Long JH, Aziz TN, de los Reyes F, DucosteJJ. III L. Anaerobic co-digestion of fat,oil, and grease (FOG): a review of gas production and process limitations.Process Saf Environ 2012;90:231–45.
[36] Zhang C, Su H, Baeyens J, Tan T. Reviewing the anaerobic digestion of foodwaste for biogas production. Renewable Sustainable Energy Rev2014;38:383–92.
[37] USEPA. Biosolids technology fact sheet: multi-stage anaerobic digestion.Washington DC: United States Environmental Protection Agency; 2006.
[38] Chapman T, Krugel S. Rapid volume expansion—an investigation intodigester overflows and safety. Proceedings of the Water EnvironmentFederation, Sacramento, CA, 2011. Water Environment Federation; 2011. p.1016–1040.
[39] Ganidi N, Tyrrel S, Cartmell E. Anaerobic digestion foaming causes—a review.Bioresour Technol 2009;100:5546–54.
[40] Kougias PG, Boe K, Kristensen S OT, Angelidaki LA. I. Anaerobic digestionfoaming in full-scale biogas plants: a survey on causes and solutions. ajournal of the International Association on Water Pollution Research. WaterSci Technol 2014;69:889–95.
[41] EBMUD. East Bay Municipal utility district’s wastewater treatment plant:wastewater and energy (⟨https://www.ebmud.com/water-and-wastewater/environment/wastewater-energy⟩); 2013.
[42] Horenstein BK. East Bay municipal utility district sustainability/energycommittee staff report. Oakland, CA: Food Waste Update; 2013. p. 2013 July23.
[43] Gabel D. Codigestion case studies: enhancing energy recovery from sludge.In: Metro wastewater reclamation district pwo seminar, Denver, CO; May 23,2012.
[44] MWRA. Request for proposal: services to design, build, finance, own andoperate a biogas-based compressed natural gas fueling station. Des Moines,IA: Des Moines Metropolitan Wastewater Reclamation Authority; 2013.
[45] Forbes RH. Increasing combined heat and power from anaerobic digestion byadding fats, oil, and grease and high-strength wastes to digesters. In: 12thAnnual spring conference of the North Carolina AWWA-WEA, April 14–16,2013. Wilmington, NC;2013.
[46] Wiser JR, Schettler JW, Willis JL. Evaluation of combined heat and powertechnologies for wastewater treatment facilities. Atlanta, GA: Brown andCaldwell; 2012.
[47] Demirel B, Yenigun O. Two-phase anaerobic digestion processes: a review. JChem Technol Biotechnol 2002;77:743–55.
[48] Kepp U, Machenbach I, Weisz N, Solheim OE. Enhanced stabilisation ofsewage sluge through thermal hydrolysis—three years of experience withfull scale plant. Water Sci Technol 2000;42:89–96.
[49] Morgan-Sagastume F, Pratt S, Karlsson A, Cirne D, Lant P, Werker A.Production of volatile fatty acids by fermentation of waste activated sludgepre-treated in full-scale thermal hydrolysis plants. Bioresour Technol2011;102:3089–97.
Y. Shen et al. / Renewable and Sustainable Energy Reviews 50 (2015) 346–362360
[50] Tyagi VK, Lo S-L. Application of physico-chemical pretreatment methods toenhance sludge disintegration and subsequent anaerobic digestion: an up todate review. Rev Environ Sci Biotechnol 2011;10:215–42.
[51] Newman G, Schafer P, Jacobson E, Low E, Chapman T, Kharker S. The thermalhydrolysis link to anaerobic digestion: the heart of the DC Water biosolidsprogram. In: 86th Annual Water Environment Federation technical exhibi-tion and conference, Chicago, IL, October 5–9, 2013, Water EnvironmentFederation; 2013. p. 2687–2705.
[52] Parry D, Loomis P. DC Water biosolids and energy process. Blue Plainsadvanced wastewater treatment plant. In: 18th European biosolids & organicresources conference, Manchester, UK, November 18–20, 2013; 2013.
[53] Suzuki R, Murthy S, Mah J, Wett B, Novak J, Higgins M, et al. Maximizing gasproducction at Blue Plains AWTP for high-loaded digestion process. In: 86thAnnual Water Environment Federation technical exhibition and conference,Chicago, IL, October 5–9, 2013, Water Environment Federation; 2013. p.2661–8.
[54] Gurieff N, Bruus J, Nielsen B, Nawawi-Lansade D, Cantegril M. Moving towardan energy neutral WWTP—the positive impact of ExelysTM continuousthermal hydrolysis in achieving this goal. Water Pract Technol 2012;7:034.
[55] Blank A, Hoffmann E. Upgrading of a co-digestion plant by implementationof a hydrolysis stage. the journal of the International Solid Wastes and PublicCleansing Association, ISWA. Waste Manage Res 2011;29:1145–52.
[56] BTA-International BTA. International references plants: Baden–Baden (Ger-many). Pfaffenhofen, Germany: BTA International GmbH; 2010.
[57] WERF. Energy production and efficiency research—the roadmap to net-zeroenergy. Alexandria, VA: Water Environment Research Foundation; 2011.
[58] USDOE. The water-energy nexus: challenges and opportunities. Washington,DC: US Department of Energy; 2014.
[59] Crawford GV. Best practices for sustainable wastewater treatment: initialcase study incorporating European experience and evaluation tool concept.Alexandria, VA: Water Environment Research Foundation; 2010.
[60] Nowak O, Keil S, Fimml C. Examples of energy self-sufficient municipalnutrient removal plants. Water Sci Technol 2011;64:1–6.
[61] Nowak O, Enderle P, Varbanov P. Ways to optimize the energy balance ofmunicipal wastewater systems: lessons learned from Austrian applications. JClean Prod 2015;88:125–31.
[62] Jenicek P, Bartacek J, Kutil J, Zabranska J, Dohanyos M. Potentials and limitsof anaerobic digestion of sewage sludge: energy self-sufficient municipalwastewater treatment plant? Water Sci Technol 2012;66:1277–81.
[63] Jenicek P, Kutil J, Benes O, Todt V, Zabranska J, Dohanyos M. Energy self-sufficient sewage wastewater treatment plants: is optimized anaerobicsludge digestion the key? Water Sci Technol 2013;68:1739–44.
[64] Wett B. Solved upscaling problems for implementing deammonification ofrejection water. Water Sci Technol 2006;53:121–8.
[65] Siegrist H, Salzgeber D, Eugster J, Joss A. Anammox brings WWTP closer toenergy autarky due to increased biogas production and reduced aerationenergy for N-removal. Water Sci Technol 2008;57:383–8.
[66] Lackner S, Gilbert EM, Vlaeminck SE, Joss A, Horn H, van Loosdrecht MC. Full-scale partial nitritation/anammox experiences—an application survey. WaterRes 2014;55:292–303.
[67] Wett B. Development and implementation of a robust deammonificationprocess. Water Sci Technol 2007;56:81–8.
[68] Wett B, Omari A, Podmirseg SM, Han M, Akintayo O, Gomez Brandon M, et al.Going for mainstream deammonification from bench to full scale formaximized resource efficiency. Water Sci Technol 2013;68:283–9.
[69] Wett B, Hell M, Nyhuis G, Puempel T, Takacs I, Murthy S. Syntrophy ofaerobic and anaerobic ammonia oxidisers. Water Sci Technol2010;61:1915–22.
[70] Nifong A, Nelson A, Johnson C, Bott CB. Performance of a full-scale side-stream DEMONs deammonification installation. 86th Annual Water Envir-onment Federation technical exhibition and conference. Chicago, IL: WaterEnvironment Federation; 2013. p. 2013 October 5–9.
[71] Daigger GT. Implementation of a full-scale anammox-based facility to treatan anaerobic digestion sidestream at the Alexandria sanitation authoritywater resource facility. Water Pract Technol 2011;6:1–2.
[72] USEPA. Chesapeake Bay TMDL—a commitment to clean water. Washington,DC: US Environmental Protection Agency; 2010. ⟨http://www.epa.gov/chesapeakebaytmdl/⟩.
[73] Stinson B, Murthy S, Bott C, Wett B, Bailey W, Al-Omari A, et al. Roadmap toenergy and chemical optimization through the use of mainstream deammo-nification at enhanced nutrient removal facilities. In: 86th Annual WaterEnvironment Federation technical exhibition and conference, Chicago, IL,October 5–9, 2013, Water Environment Federation; 2013.
[74] USDOE-Oregon. Bioenergy optimization assessment at wastewater treatmentplants. Portland, OR: Oregon Department of Energy; 2012.
[75] Eckley P, Johnston A, Nacrelli M, Hauck L. City of Gresham wastewaterservices. Clean Water From Clean Energy; 2013. ⟨https://www.youtube.com/watch?v=IGcqIpab_zA&feature=youtu.be⟩.
[76] Loomis P. Biosolids and energy process development at the Blue PlainsAWTP. In: 99th NJWEA annual conference, Atlantic City, NJ, May 12–16, 2014,Water Environment Association; 2014.
[77] Rosefield K. Resource recovery: biogas potential in the co-digestion ofseptage and grease trap residue. In: NAWT fifth annual waste treatmentsymposium, Washington, PA, Sep 15–16, 2010; 2010.
[78] Schwarzenbeck N, Pfeiffer W, Bomball E. Can a wastewater treatment plantbe a powerplant? A case study Water Sci Technol 2008;57:1555–61.
[79] Zupancic GD, Uranjek-Zevart N, Ros M. Full-scale anaerobic co-digestion oforganic waste and municipal sludge. Biomass Bioenergy 2008;32:162–7.
[80] Bolzonella D, Battistoni P, Cecchi F. Anaerobic codigestion of waste activatedsludge and OFMSW: the experiences of Viareggio and Treviso plants (Italy).Water Sci Technol 2006;53:203–11.
[81] Cavinato C, Bolzonella D, Pavan P, Fatone F, Cecchi F. Mesophilic andthermophilic anaerobic co-digestion of waste activated sludge and sourcesorted biowaste in pilot- and full-scale reactors. Renewable Energy2013;55:260–5.
[82] Wett B, Buchauer K, Fimml C. Energy self-sufficiency as a feasible concept forwastewater treatment systems. In: Proceedings of IWA leading edge tech-nology conference, Singapore, Asian Water; 2007. p. 21–4.
[83] Moen G. Co-digestion facilities—grease acceptance at WWTPs. In: APWA-WA2012 spring conference, Marysville, WA, April 3–6, 2012; 2012.
[84] Held J, Mathiasson A, Nylander A. Biogas from manure and waste products—Swedish case studies. Stockholm, Sweden: Swedish Gas Centre; Swedish GasAssociation; Swedish Biogas Association; 2008.
[85] Ostapczuk RE, Bassette PC, Dassanayake C, Smith JE, Bevington G. Achievingzero net energy utilization at municipal WWTPs: the Gloversville–Johns-town Joint WWTP experience. In: Proceedings of the Water EnvironmentFederation; 2011. p. 1191–200.
[86] Doerr D. ACEEE case study—Sheboygan, WI: energy efficiency in wastewatertreatment plant, Washington DC (⟨http://aceee.org/sector/local-policy/case-studies/sheboygan-wastewater-treatment-plant⟩-); 2011.
[87] Thieszen S. Sheboygan’s journey to sustainability. In: Wisconsin state energyoffice half-day seminar: turning waste to cash in Wisconsin, September 26,2013, Madison, WI2013; 2013.
[88] Proctor P. Achieving energy independence at the Gresham wastewatertreatment plant. PA. WaterWorld. West Chester; 2011. p. S02.
[89] Gabel D, Pekarek S, Nolkemper D, Kalis M. Sustainability incorporated intothe solids handling improvements of the Douglas L. Smith Middle Basinwastewater treatment plant. In: Proceedings of the Water EnvironmentFederation, Orlando, FL: Water Environment Federation; October 10–14,2009. p. 527–40.
[90] Gabel D, Nolkemper D, Pekarek S, Chamberlain K. Right-sizing a cogenera-tion system for a middle sized wastewater treatment plant. In: Proceedingsof the Water Environment Federation, New Orleans, LA: Water EnvironmentFederation, October 2–6, 2010; 2010. p. 7453–62.
[91] Gabel D, Nolkemper D, Pekarek S, Kalis M. Startup of the green, sustainablecodigestion project for Johnson County, KS. In: Proceedings of the WaterEnvironment Federation, Los Angeles, CA: Water Environment Federation,October 15–19, 2011; 2011. p. 984–95.
[92] Moss LH. The case for co-digestion: lessons learned from successful pro-grams. In: TACWA 2013 meeting, San Antonio, TX, January 25, 2013; 2013.
[93] Forbes RH. Key considerations for increasing combined heat and power(CHP) from anaerobic digestion by adding fats, oil & grease (FOG) and high-strength wastes (HSW) to digesters. In: 85th Annual Water EnvironmentFederation technical exhibition and conference, New Orleans, LA, Sep 29–Oct3, 2012; 2012.
[94] Kabouris J, Forbes R, Shea T, Engelmann M, Delaney J. Biogas cogenerationsystem sizing and payback based on weekly patterns of anaerobic digestionand biosolids dryer operation. Florida Water Resour J 2012:40–6 June.
[95] Willis J, Marshall S, Cassady G, Bosso T. Biosolids- and yard-waste-to-energyfeasibility study in St. Petersburg, FL. In: WEF residuals and biosolidsspeciality conference, March 25–28, 2012. Raleigh, NC: Brown and Caldwell;2012.
[96] Schuler P, Willis J, Shaw R. Class A high-rate anaerobic digestion coupledwith green power generation. In: NC AWWA-WEA 89th annual conference,Charlotte, NC: Brown and Caldwell; November 15–18, 2009.
[97] Greer D. Energy efficiency and biogas generation at wastewater plants:anaerobic digestion systems are being upgraded to accept food waste andFOG to boost energy generation. BioCycle. Emmaus, PA: The JG Press Inc;2012. p. 37–40.
[98] Zabranska J, Dohanyos M, Josef K, Jenicek P. Intensification of anaerobicdigestion towards the energy self-sufficiency of municipal wastewatertreatment. Water 2009;21(11):25.
[99] IEUA. Inland Empire Utilities Agency—regional water recycling plant no.1 process. Ontario, CA ⟨http://www.ieua.org/facilities/rp1.html⟩.
[100] Marseilles J. Resources and energy management at IEUA’s regional waterrecycling plant no. 1. In: SCAP energy management committee meeting,Ontario, CA, February 28, 2013; 2013.
[101] Joss A, Cyprien C, Burger S, Blunschi M, Zuleeg S, Siegrist H. Sludge liquidtreatment with combined nitritation/anammox. In: Neptune and Innowatchend user conference: innovative and sustainable technologies for urban andindustrial wastewater treatment, Ghent, Belgium, January 27, 2010; 2010.
[102] Cao Y-S. Mass flow and energy efficiency of municipal wastewater treatmentplants. In: Cao Y-S, editor. London, UK: IWA Publishing; 2011.
[103] Williams DR. Renewable energy at EBMUD. In: 2012 CASA mid-year con-ference, Palm Desert, CA, January 18–20, 2012; 2012.
[104] Boranyak S. Wastewater plant turns food into electricity. Civil engineering.Reston, VA: American Society of Civil Engineers; 2012. p. A2.
[105] Astrom A, Gunther E, Lumley D, van der Salm K, Pettersson S-O, Mattsson A.Gryaab wastewater treatment plant fact sheet 2013, Goteborg, Sweden(⟨http://www.gryaab.se/admin/bildbank/uploads/Dokument/Broschyrer/Allmanbroschyr_eng_klar.pdf⟩); 2014.
Y. Shen et al. / Renewable and Sustainable Energy Reviews 50 (2015) 346–362 361

[106] Cavagnaro PV, Cronberg AT, Bush A. Steam powered energy conservation atFort Worth’s Village Creek WRF. In: Michigan WEA 2013 annual conference,Boyne Falls, MI: Michigan Water Environment Association; 2013.
[107] Stover EL. Biogas: an environmental and alternative energy solution. Societyof Texas Environmental Professionals. STEP Fort Worth chapter. TX: FortWorth; 2013. p. 2013 June 28.
[108] Fichera S. The quest for energy independence: city of Fort Worth VillageCreek Water Reclamation Facility. In: WEAT biosolids and odor and corrosionconference and expo, San Marcos, TX Water Environment Association ofTexas, July 31–August 1, 2013; 2013.
[109] Ripley LE. Codigestion in Texas: overview & case study. In: TACWA meeting,Forth Worth, TX: Texas Association of Clean Water Agencies, March 28, 2014;2014.
[110] Metro-Vancover. The Annacis Island co-digestion facility: advancing waste toenergy technology in Canada. Vancover, Canada: Canadian Consulting Engi-neering; 2012.
[111] Kurtar B, Frain PS. Annacis Island wastewater treatment plant co-digestionfacility: concept to completion. Watermark. Vancouver, BC, Canada: CraigKelman & Associates; 2012.
[112] Greer D. Directed biogas to power fuel cells: a change in California’s PublicUtility Commission rule to allow injection of purified biomethane intonatural gas pipelines opened the door for on-site power projects in SanDiego. BioCycle. Emmaus, PA: The JG Press Inc; 2011. p. 47–50.
[113] Mazanec FJ. Point Loma wastewater treatment plant (PLWTP). Californiaenergy commission staff workshop on challenges to procuring biomethane in
California. Sacramento, CA: California Energy Commission; 2013. p. 2013 May31.
[114] Barber B, Lancaster R, Kleiven H. Thermal hydrolysis: the missing ingredientfor better biosolids?. WaterWorld, West Chester, PA; 2012. p. A4.
[115] Belshaw D, Edgington RM, Jolly M. Commissioning of United Utilities thermalhydrolysis digestion plant at Davyhulme waste water treatment works. In:18th European biosolids and organic resources conference, Manchester, UK;November 18–20, 2013.
[116] Jolly M, Belshaw D, Telfer J. The biochemical relationships in anaerobicdigestion after thermal hydrolysis at Davyhulme. In: 18th European biosolidsand organic resources conference, Manchester, UK, November 18–20, 2013;2013.
[117] JWPCP. JWPCP compressed natural gas fueling facility. ⟨http://wwwlacsdorg/wastewater/wwfacilities/jwpcp/compressed_natural_gas_fueling_facilityasp⟩.
[118] Czerniak D. Food waste anaerobic digestion demonstration program at thejoint water pollution control plant. SCAP energy management committee.Carson, CA: Southern California Alliance of Publicly Owned Treatment Works;2014. p. 2014 February 27.
[119] FNR. Basisdaten biogas Deutschland. Gülzow Germany: Fachagentur Nach-wachsende Rohstoffe; 2005.
[120] FNR. Guide to biogas: from production to use. Eschborn, Germany: Facha-gentur Nachwachsende Rohstoffe; 2012.
[121] Moody LB, Burns RT, Bishop G, Sell ST, Spajic R. Using biochemical methanepotential assays to aid in co-substrate selection for co-digestion. Appl EngAgric 2011;27:433–9.
Y. Shen et al. / Renewable and Sustainable Energy Reviews 50 (2015) 346–362362