renewable electricity futures: challenges and ... - energy
TRANSCRIPT

Renewable Electricity Futures:Challenges and Opportunities
Solar Program ReviewMay 24, 2010
Sam BaldwinChief Technology Officer
Office of Energy Efficiency and Renewable EnergyU.S. Department of Energy

2
Challenges• Economy—economic development and growth; energy costs• Security—foreign energy dependence, reliability, stability• Environment—local (particulates), regional (acid rain), global (GHGs)
Can EE & RE meet these Challenges?• Buildings and Industrial Efficiency• Transportation Efficiency and Renewable Fuels• Renewable Electricity
Speed and Scale

3
Nations that HAVE oil(% of Global Reserves)
Saudi Arabia 26%Iraq 11Kuwait 10Iran 9UAE 8Venezuela 6Russia 5Mexico 3Libya 3China 3Nigeria 2U.S. 2
Nations that NEED oil(% of Global Consumption)
U.S. 24. %China 8.6Japan 5.9Russia 3.4India 3.1Germany 2.9Canada 2.8Brazil 2.6S. Korea 2.6Mexico 2.4France 2.3Italy 2.0
Total 85 MM Bbl/daySource: EIA International Energy Annual
The Oil Problem
4
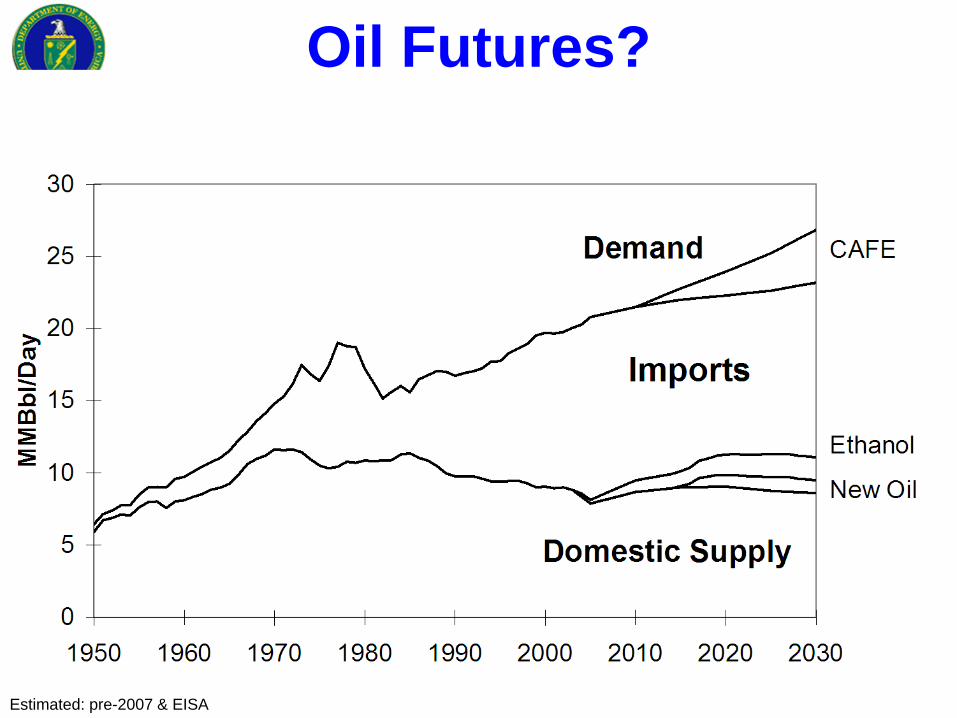
Oil Futures?
Estimated: pre-2007 & EISA

Global Liquid Fuel Demand (MB/d)
5
Source: EIA International Energy Annual

6
Impacts of Oil Dependence• Trade Deficit: Oil ~57% of $677B
trade deficit, 2008• Foreign Policy Impacts
– Strategic competition for access to oil– Oil money supports undesirable regimes – Oil money finds its way to terrorist
organizations
• Vulnerabilities– to system failures: tanker spills; pipeline
corrosion; well blowouts; …– to natural disasters: Katrina; …– to political upheaval: Nigeria; … – to terrorist acts: Yemen; Saudi Arabia; …
• Economic Development– Developing country growth stunted by
high oil prices; increases instability Source: Center for American Progress, April 27, 2010

7
Conventional Oil
International Energy Agency, 2008• Across 798 of world’s largest oil
fields, average production decline of 6.7%/year.
• Of 798 fields, 580 had passed peak.• To meet growth & replace
exhausted resources, will have to add 64 MB/d by 2030, or 6X Saudi Arabia.
• Sources: (Figure 1) Fredrik Robelius, Uppsala Universitet; (Figure 2) Association for the Study of Peak Oil; (Figure 3) David Greene, ORNL.
Discovery of Giant Oil Fields by Decade

8
Oil Sources
• Constraints– Cost; Energy – Water– Atmosphere
• Resources – Oil: Infill wells, Flooding, EOR– Oil Shale: U.S.—Over 1.2
trillion Bbls-equiv. in highest-grade deposits
– Tar Sands: Canadian Athabasca Tar Sands—1.7 T Bbls-equivalent; Venezuelan Orinoco Tar Sands (Heavy Oil)—1.8 T Bbls-equiv.
– Coal: Coal Liquefaction—(4 Bbls/ton)
IEA, World Energy Outlook 2008

9
Potential Impacts of GHG Emissions• Temperature Increases• Precipitation Changes• Glacier & Sea-Ice Loss• Water Availability• Wildfire Increases • Ecological Zone Shifts• Extinctions• Agricultural Zone Shifts• Agricultural Productivity• Ocean Acidification• Ocean Oxygen Levels• Sea Level Rise• Human Health Impacts• Feedback Effects
U.S.: 5.9 GT CO2/yr energy-relatedWorld: 28.3 GT CO2/yr
Hoegh-Guldberg, et al, Science, V.318, pp.1737, 14 Dec. 2007
10
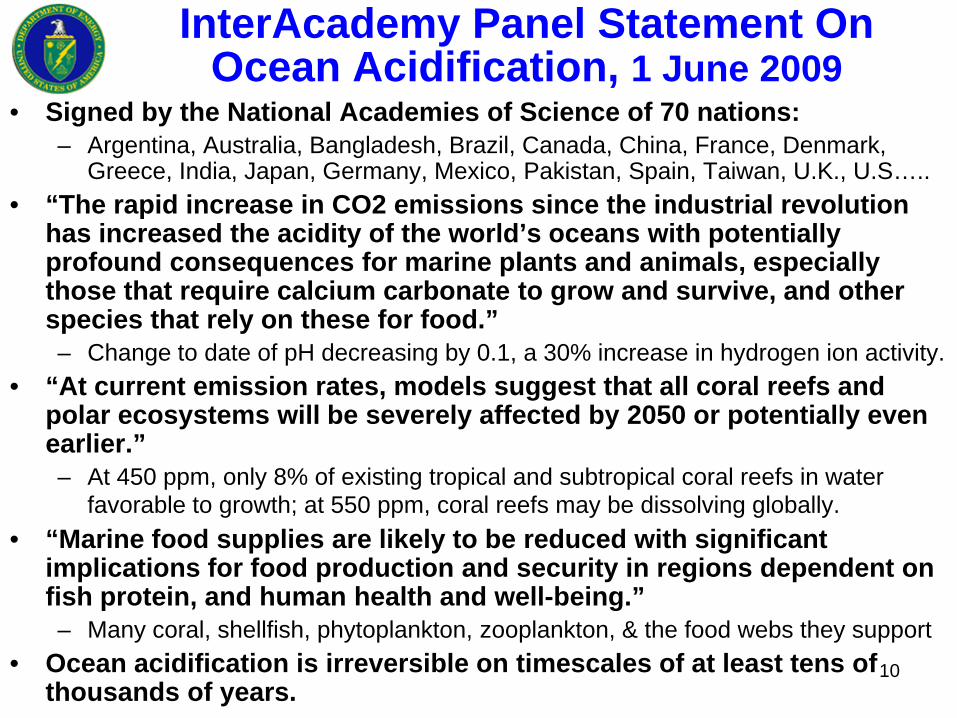
InterAcademy Panel Statement OnOcean Acidification, 1 June 2009
• Signed by the National Academies of Science of 70 nations:– Argentina, Australia, Bangladesh, Brazil, Canada, China, France, Denmark,
Greece, India, Japan, Germany, Mexico, Pakistan, Spain, Taiwan, U.K., U.S…..• “The rapid increase in CO2 emissions since the industrial revolution
has increased the acidity of the world’s oceans with potentially profound consequences for marine plants and animals, especially those that require calcium carbonate to grow and survive, and other species that rely on these for food.”– Change to date of pH decreasing by 0.1, a 30% increase in hydrogen ion activity.
• “At current emission rates, models suggest that all coral reefs and polar ecosystems will be severely affected by 2050 or potentially even earlier.”– At 450 ppm, only 8% of existing tropical and subtropical coral reefs in water
favorable to growth; at 550 ppm, coral reefs may be dissolving globally.• “Marine food supplies are likely to be reduced with significant
implications for food production and security in regions dependent on fish protein, and human health and well-being.”– Many coral, shellfish, phytoplankton, zooplankton, & the food webs they support
• Ocean acidification is irreversible on timescales of at least tens of thousands of years.
11
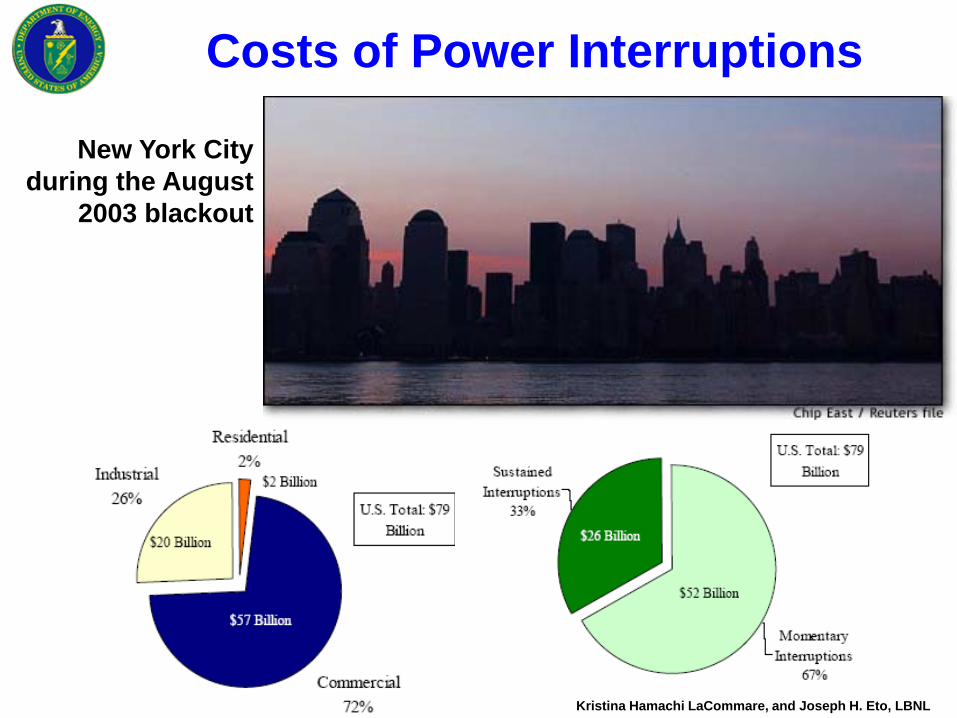
New York City during the August
2003 blackout
Kristina Hamachi LaCommare, and Joseph H. Eto, LBNL
Costs of Power Interruptions

12
Scale of the Challenge• Increase fuel economy of 2 billion cars from 30 to 60 mpg.• Cut carbon emissions from buildings by one-fourth by 2050—on top of
projected improvements.• With today’s coal power output doubled, operate it at 60% instead of 40%
efficiency (compared with 32% today).• Introduce Carbon Capture and Storage at 800 GW of coal-fired power.• Install 1 million 2-MW wind
turbines.• Install 3000 GW-peak of Solar
power. • Apply conservation tillage to
all cropland (10X today).• Install 700 GW of nuclear
power.Source: S. Pacala and R. Socolow, “Stabilization Wedges: Solving the Climate Problem for the Next 50 Years with Current Technology”, Science 13 August 2004, pp.968-972.

13
Time Constants• Political consensus building ~ 3-30+ years• Technical R&D ~10+ • Production model ~ 4+ • Financial ~ 2++ • Market penetration ~10++ • Capital stock turnover
– Cars ~ 15 – Appliances ~ 10-20– Industrial Equipment ~ 10-30/40+– Power plants ~ 40+ – Buildings ~ 80 – Urban form ~100’s
• Lifetime of Greenhouse Gases ~10’s-1000’s• Reversal of Land Use Change ~100’s• Reversal of Extinctions Never
• Time available for significant action Must Act Now!

14
How Can We Meet These Challenges?• Extending Current Options
– Fossil/CCS– Nuclear
• Efficiency– Buildings– Industry– Smart Grid and End-Use Equipment
• Transportation– Biomass– Plug-In Hybrids/Smart Charging Stations– Hydrogen
• Renewable Energy & Energy Storage– Geothermal– Hydropower– Ocean Energy– Solar Photovoltaics / Smart Grid / Battery Storage– Solar Thermal / Thermal Storage / Natural Gas Hybrids– Wind / Compressed Air Energy Storage / Natural Gas
• Transmission Infrastructure– Smart Grid
HOW FAR?HOW FAST? HOW WELL?
AT WHAT COST?BEST PATHWAYS?

15
Energy Efficiency: 1970-2007
Efficiency; StructuralChange:Total 106.8
New SupplyGas 1.8QRE 2.8Nucl 8.2Oil 10.3Coal 10.5Total 33.8

16
Site Electricity Consumption
Source: Building Technology Program Core Databook, August 2003. http://buildingsdatabook.eren.doe.gov/frame.asp?p=tableview.asp&TableID=509&t=xls
Buildings Energy Use
Total Primary Energy (all fuels)
2700 B kWh(2007)
39 Quads(2007)
17
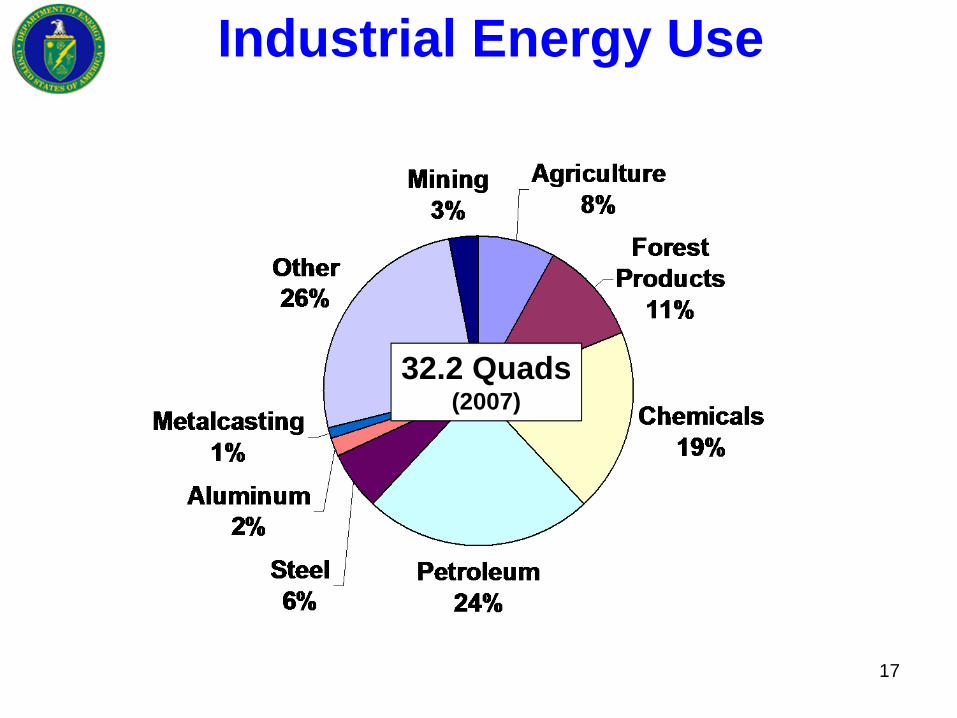
Industrial Energy Use
32.2 Quads(2007)

18
Transport Energy Use
28.8 Quads96.6% petroleum
(2007)

19
Can We Meet the Oil Challenge?
Estimated: EIA 2007 Projections

20
Renewable Electricity SystemsPhotovoltaics
Concentrating Solar Power (CSP)
Smart Grid
Distributed Generation
Plug-in Hybrids
c-Si Cu(In,Ga)Se2
500x
Wind

21
Grid Integration• Assess potential effects of large-scale
Wind/Solar deployment on grid operations and reliability:
- Behavior of solar/wind systems and impacts on existing grid
- Effects on central generation maintenance and operation costs, including peaking power plants
• Engage with utilities to mitigate barriers to technology adoption
- Prevent grid impacts from becoming basis for market barriers, e.g. caps on net metering and denied interconnections to “preserve” grid
- Provide utilities with needed simulations, controls, and field demos
• Develop technologies for integration:- Smart Grid/Dispatch.
• Barriers: Variable output; Low capacity factor; Located on weak circuits; Lack of utility experience; Economics of transmission work against wind/solar.
ISSUES-Geographic Diversity -Storage-Resource Forecasting -Load Shifting-Ramp Times -2-Way Power Flow-Islanding -Stability-System Interactions -Dynamic Models-Communications, Control, Data Management

Incremental direct cost to society(Siting: Land Use of 2-5% of 15 M acres)(Siting: Wildlife & Habitat, Visual Impacts)
$43 billion50 cents/month/
household
Reduction in emissions of greenhouse gases and avoided carbon regulation costs
(Avoid Acids, Ash, Heavy Metals (Hg), Particulates, etc)
825 million tons of CO2$50 to $145 billion
Reduction in water consumption8% through 2030
17% in 2030
Jobs supported and other economic benefits
500,000 total with 150,000 direct jobs
$2 billion in local annual revenues
Reduction in nationwide natural gas use and likely savings for all gas consumers
11%$86-214 billion
20% Wind: Costs & Benefits
Sources: DOE, 2008 and Hand et al., 2008 Note: All dollar values are in NPV

Eastern Wind Integration & Transmission Study Consolidation of Balancing Authorities
• Long distance high capacity transmission can assist smaller balancing areas with wind integration and contributes to system robustness.
• Substantial benefits of geographic diversity and pooling of load and generating resources
Source: EWITS Study; Dave Corbus, NREL

Western Wind & Solar Integration Study
24

RE Futures:Project Goals
Electric Sector Carbon Mitigation Options
• Explore technical, economic, and social feasibility associated with high RE generation – up to 80% Renewable Electricity generation in 2050 in the continental US.
• Not a comprehensive carbon policy analysis, and not a value judgment as to whether this future should be sought
• Analysis must recognize that a wide range of high renewable electricity futures are possible; the “best” pathway may not be known in advance -- uncertainties abound! Implication: Analyze an analytically tractable but broad array of scenarios to help characterize and bound the challenges and implications for meeting aggressive RE targets
• Describe implications of large-scale renewable technology deployment, including:
o Resource potential and geographic distribution
o RE technology development pathwayso Economic costs and secondary impacts as
well as benefitso Electric system operation and expansion
challenges.
Renewables are one carbon mitigation pathway – ultimately all technologies have important role.
25

26
RE Futures Project Structure
Project LeadNREL/MIT
Economics& Policy
DOE – EERE/OE
SteeringCommittee
Renewable GenerationTechnology Teams- Biopower- Geothermal- Hydropower- Ocean- Solar- Wind
Electric SystemTeams- End-Use Electricity- System Operation- Infrastructure
Expansion- Flexible Resources
Supporting Analysis
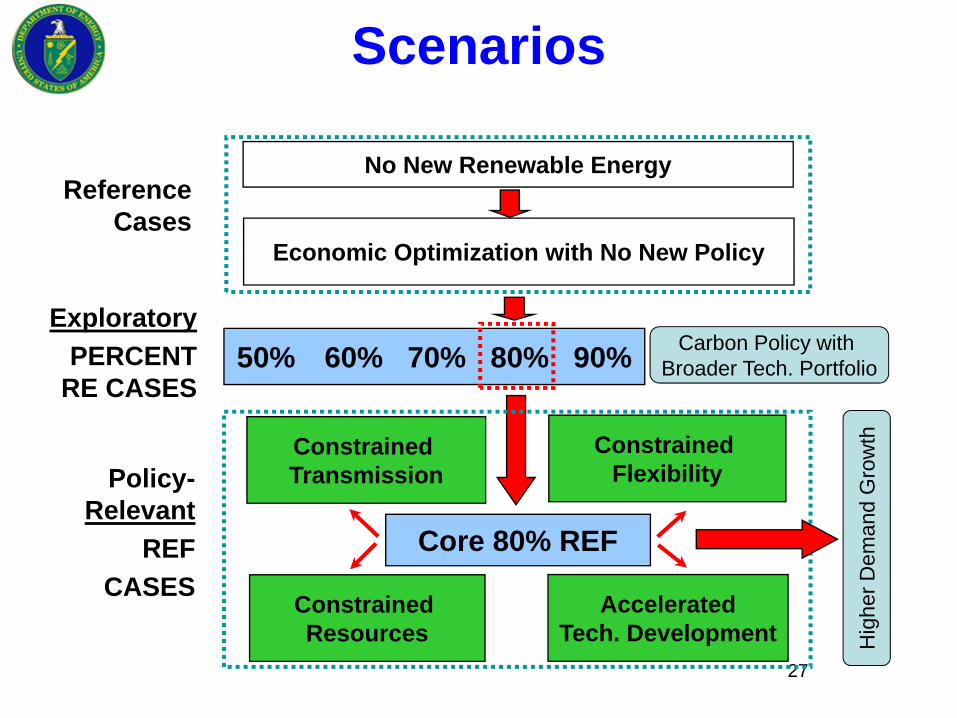
Scenarios
27
Reference Cases
50% 60% 70% 80% 90%
No New Renewable Energy
Economic Optimization with No New Policy
ExploratoryPERCENT
RE CASES
Policy-Relevant
REFCASES
Constrained Transmission
AcceleratedTech. Development
Constrained Flexibility
Constrained Resources
Core 80% REF
Carbon Policy with Broader Tech. Portfolio
Hig
her D
eman
d G
row
th
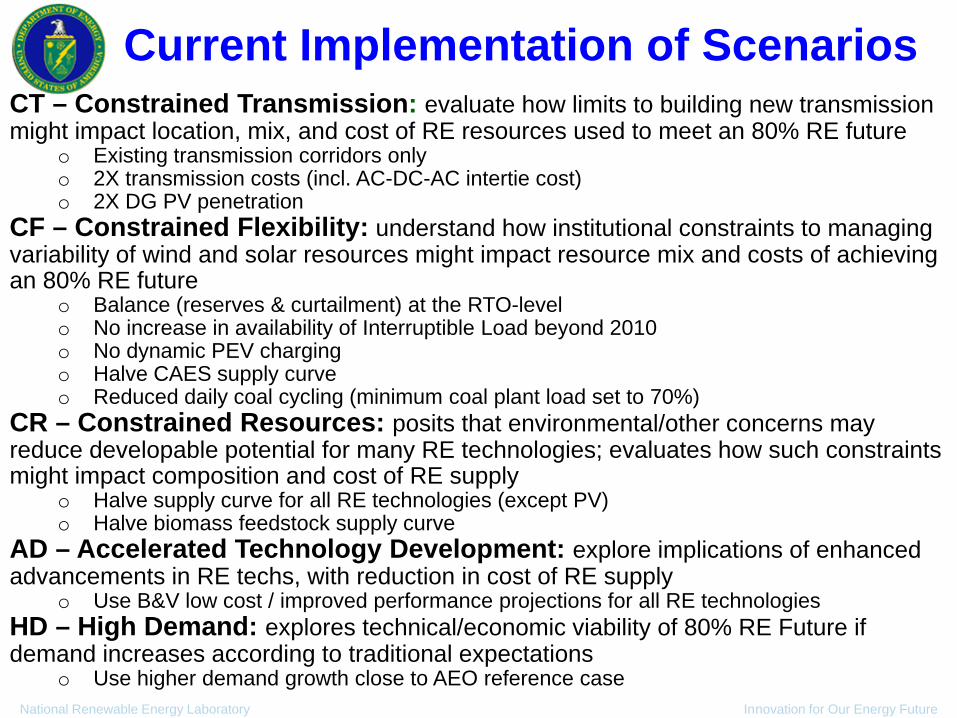
Current Implementation of Scenarios
National Renewable Energy Laboratory Innovation for Our Energy Future28
CT – Constrained Transmission: evaluate how limits to building new transmission might impact location, mix, and cost of RE resources used to meet an 80% RE future
o Existing transmission corridors onlyo 2X transmission costs (incl. AC-DC-AC intertie cost)o 2X DG PV penetration
CF – Constrained Flexibility: understand how institutional constraints to managing variability of wind and solar resources might impact resource mix and costs of achieving an 80% RE future
o Balance (reserves & curtailment) at the RTO-levelo No increase in availability of Interruptible Load beyond 2010o No dynamic PEV chargingo Halve CAES supply curveo Reduced daily coal cycling (minimum coal plant load set to 70%)
CR – Constrained Resources: posits that environmental/other concerns may reduce developable potential for many RE technologies; evaluates how such constraints might impact composition and cost of RE supply
o Halve supply curve for all RE technologies (except PV)o Halve biomass feedstock supply curve
AD – Accelerated Technology Development: explore implications of enhanced advancements in RE techs, with reduction in cost of RE supply
o Use B&V low cost / improved performance projections for all RE technologiesHD – High Demand: explores technical/economic viability of 80% RE Future if demand increases according to traditional expectations
o Use higher demand growth close to AEO reference case

29
ReEDS Model• 356 regions in Continental U.S.• Linear program cost minimization:
23 two-year periods from 2006-2050.• All major power technologies–hydro,
gas CT, gas CC, 4 coal (w/wo CCS), gas/oil steam, nuclear, wind, CSP, biopower (woCCS), geothermal, 3 storage technologies.
• 17 time slices in each year: 4 daily x 4 seasons (+one super-peak).
• Input future electric demands and fuel prices by region.
• Simple elasticities provide demandand fossil fuel price response.
• 6 levels of regions – RE supply, power control areas, RTOs, states, NERC areas, Interconnection areas.
• Existing/new transmission lines.• State-level incentives.• Stochastic treatment of resources.• Does not yet directly include PV or
distributed benefits; PV a placeholder• Policy: 80% emissions reduction
from 2005 by 2050.Source: Walter Short, NREL

30
Base Case Generation
Source: Walter Short, NREL
Renewables

31
Carbon Cap: Generation
Source: Walter Short, NREL
Renewables

32
Carbon Cap: Electricity Prices
Source: Walter Short, NREL
Price targets for PV systems, not including distributed benefits.

GridView• Commercial Production cost model by ABB• Used by ISOs, utilities, others for planning…• 11,000 Generators; 85,000 Transmission
lines; 34,000 Buses w load; 65,000 nodes; 136 transmission zones
• Simulates 8760 hours/year: power flow, dispatch, transmission congestion, unservedload; etc.
National dispatch stack (peak) National dispatch stack (offpeak)

GridView hourly power flows
Peak hour (July 17, 15:00 PST)
Off-peak hour (April 30, 1:00 PST)
Source: Greg Brinkman, NREL

Hours of congestion
Source: Greg Brinkman, NREL

36maps courtesy of Anthony Lopez NREL

System Loss and Frequency ExcursionEnergy Must Be Re-Balanced Quickly by Adding Generation or Shedding Load
59.90
59.92
59.94
59.96
59.98
60.00
60.02
60.04
5:50 6:00 6:10 6:20 6:30
TIME (pm)
FREQ
UENC
Y (H
z)
2600-MWGeneration
Lost AGC RESPONSE
GOVERNOR RESPONSE
Source: Provided by NREL
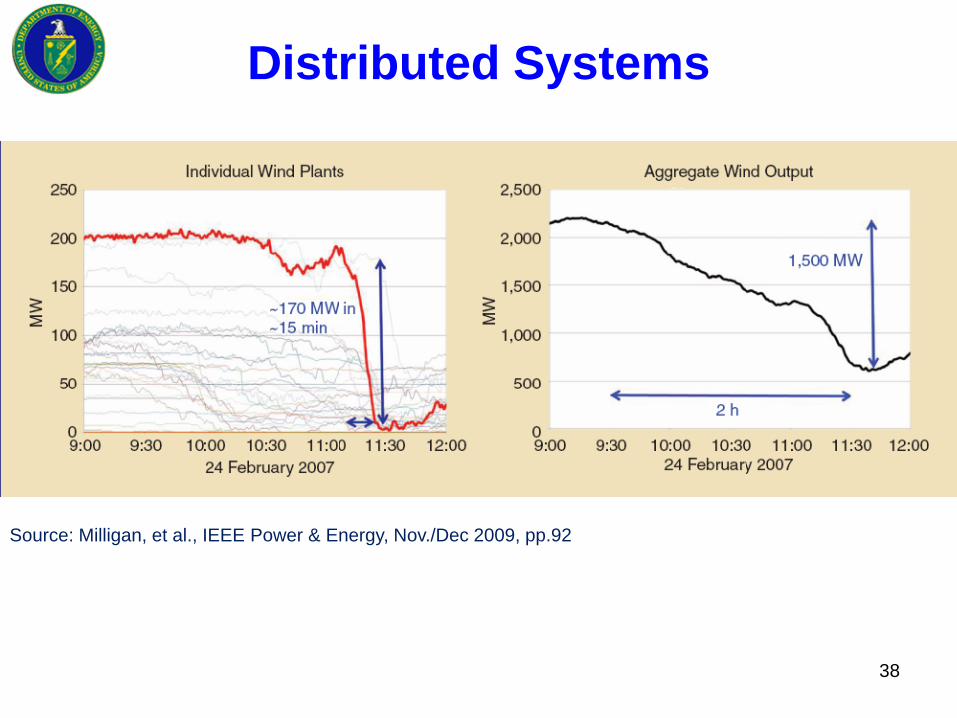
Distributed Systems
38
Source: Milligan, et al., IEEE Power & Energy, Nov./Dec 2009, pp.92

Frequency Response
39
Source: NERC

40
“For everywhere we look, there is work to be done. The state of our economy calls for action: bold and swift. And we will act not only to create new jobs but to lay a new foundation for growth... We will restore science to its rightful place... We will harness the sun and the winds and the soil to fuel our cars and run our factories. All this we can do. All this we will do.”
President Obama 1/20/09
Clean Energy to Secure America’s Future
“We have a choice. We can remain the world's leading importer of oil, or we can become the world's leading exporter of clean energy. We can hand over the jobs of the future to our competitors, or we can confront what they have already recognized as the great opportunity of our time: the nation that leads the world in creating new sources of clean energy will be the nation that leads the 21st century global economy. That's the nation I want America to be." – President Obama, Nellis Air Force Base, Nevada, 5/27/09

41
For more information
http://www.eere.energy.gov