renewable energy auctions: driving falling prices … asia regional workshop/9 session ii... ·...
TRANSCRIPT
5/11/2017 1
RENEWABLE ENERGY AUCTIONS:
DRIVING FALLING PRICES
Allen Eisendrath
Global Climate Change Office
Director
USAID/Washington
Presented @IRENA Regional Workshop
on RE in Central Asia, 26 – 27 April 2017
Oa
xa
ca
, M
exic
o (
En
el w
ind
fa
rm)
5/11/2017 2
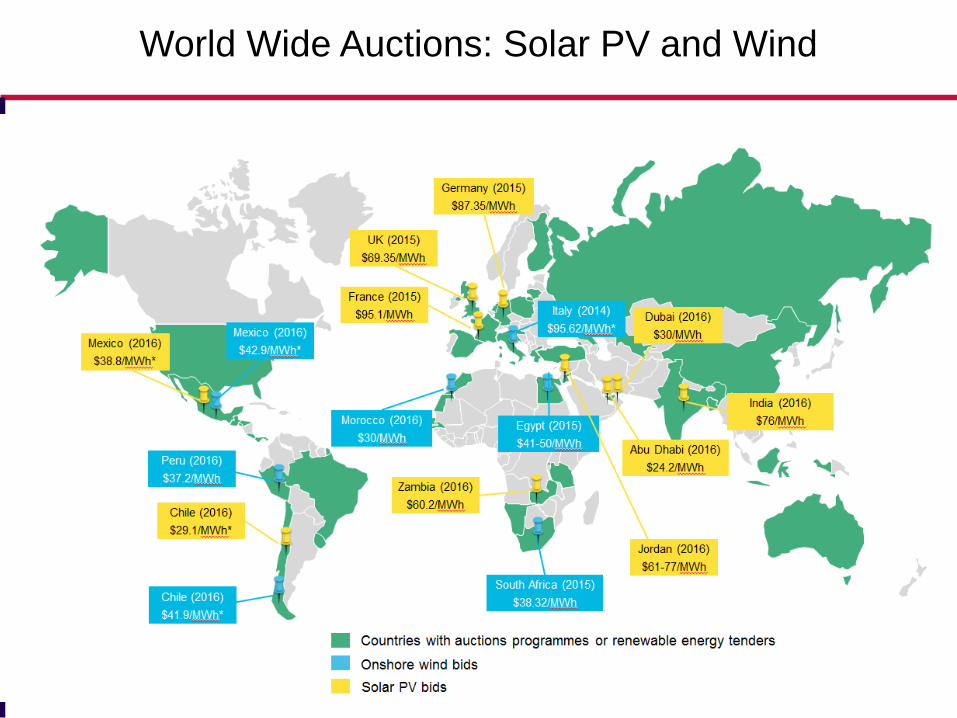
World Wide Auctions: Solar PV and Wind
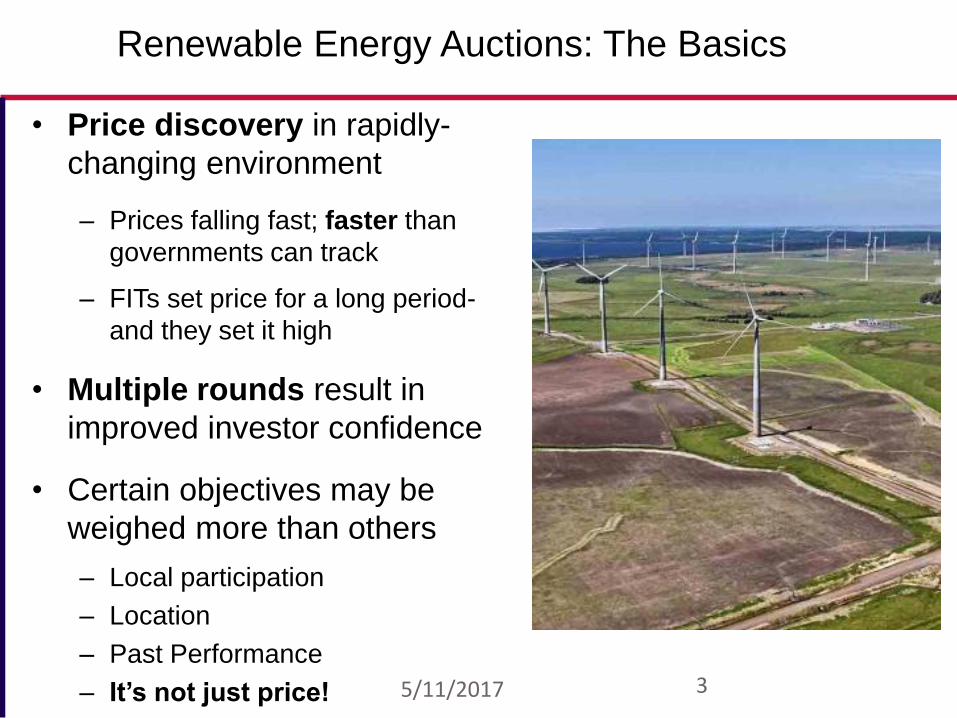
• Price discovery in rapidly-
changing environment
– Prices falling fast; faster than
governments can track
– FITs set price for a long period-
and they set it high
• Multiple rounds result in
improved investor confidence
• Certain objectives may be
weighed more than others
– Local participation
– Location
– Past Performance
– It’s not just price! 5/11/2017 3
Renewable Energy Auctions: The Basics
5/11/2017 4
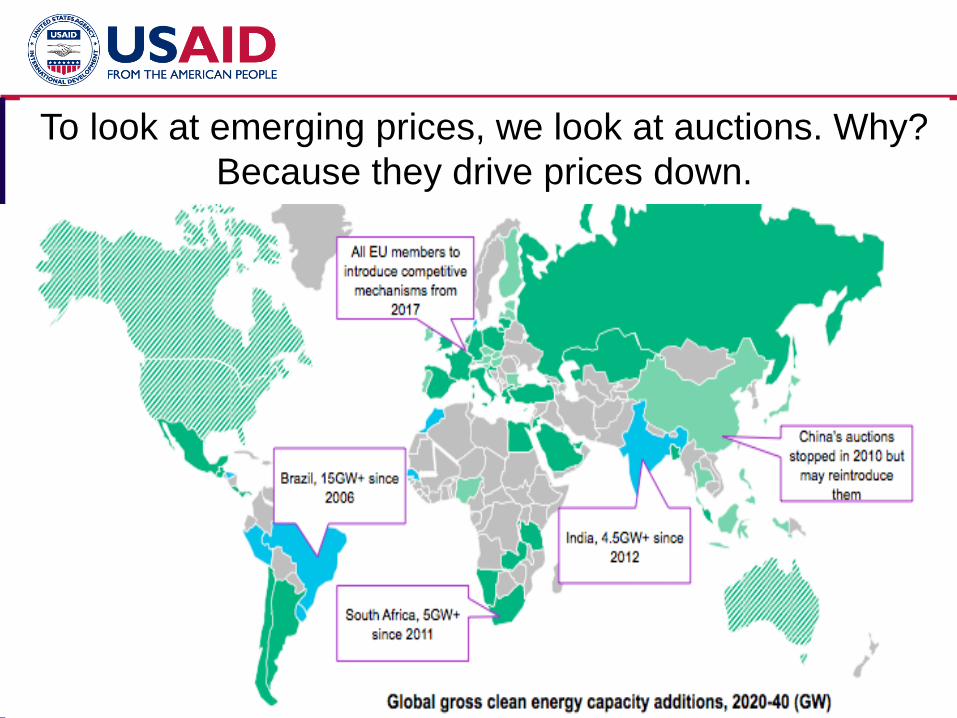
To look at emerging prices, we look at auctions. Why?
Because they drive prices down.
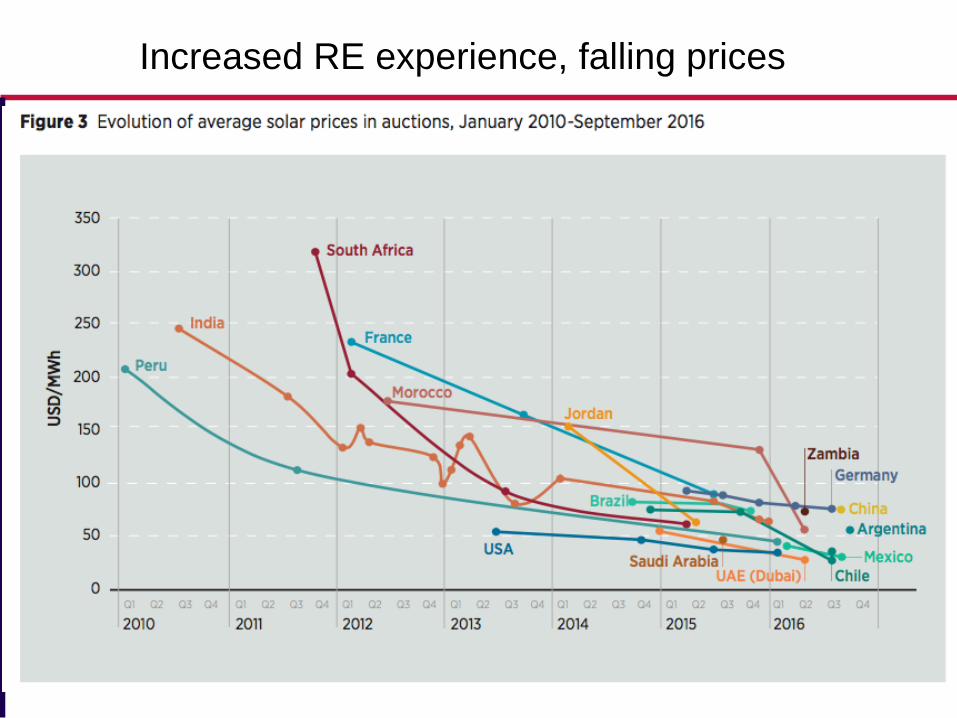
Increased RE experience, falling prices

5/11/2017 6
BENDING THE COST CURVE FOR RE
3.03.53.73.83.94.14.44.85.05.86.06.16.16.46.56.56.66.96.97.57.77.87.98.18.58.78.88.98.99.29.4
11.211.4
14.5
18.0
0.0
2.0
4.0
6.0
8.0
10.0
12.0
14.0
16.0
18.0
20.0U
AE
Du
bai
80
0 M
W P
has
e II
I of
Al…
Mex
ico
1.1
GW
Au
ctio
n I
Mar
ch 2
01
6**
*
USA
Cal
ifo
rnia
26
MW
Wils
on
a So
lar…
USA
Tex
as 1
18
MW
Eas
t P
eco
s So
lar
&…
USA
Nev
ada
10
0 M
W F
irst
So
lar
Pla
ya…
USA
Ber
kele
y La
b A
nn
ual
PV
Stu
dy…
Spai
n/P
ort
uga
l En
des
a So
lar
Iber
ian
…
Per
u 1
44
MW
Au
ctio
n I
20
16
Sau
di A
rab
ia 5
0 M
W A
uct
ion
20
15
Spai
n/P
ort
uga
l En
des
a So
lar
Iber
ian
…
Zam
bia
IFC
Sca
ling
Sola
r 2
x50
MW
R1
…
Jord
an 4
x50
MW
PV
Au
ctio
n 2
01
5
Sou
th A
fric
a R
EIP
PP
81
3 M
W B
W4
20
15
Ind
ia R
ajas
than
42
0 M
W P
V A
uct
ion
20
16
Ch
ile A
uct
ion
20
15
Ind
ia M
ahar
ash
tra
50
0 M
W P
V A
uct
ion
…
Ind
ia A
nd
hra
Pra
des
h 4
00
MW
PV
…
Ind
ia K
arn
atak
a 9
10
MW
PV
Au
ctio
n…
Ind
ia T
elan
gan
a 3
50
MW
PV
Au
ctio
n…
Ind
ia J
har
khan
d 1
.2 G
W P
V A
uct
ion
20
16
Ger
man
y 1
28
MW
Pilo
t P
V A
uct
ion
IV…
Fran
ce S
ola
r P
V A
uct
ion
(C
RE
III)
20
15
Ind
ia H
arya
na
15
0 M
W P
V A
uct
ion
20
15
Ind
ia T
elan
gan
a 2
GW
PV
Au
ctio
n 2
01
5
Jam
aica
33
MW
PV
20
16
Ind
ia U
ttar
akh
and
17
1 M
W P
V A
uct
ion
…
Bra
zil A
4 9
29
MW
PV
Au
ctio
n N
ov.
20
15
Ger
man
y 2
04
MW
Pilo
t P
V A
uct
ion
III…
Mau
riti
us
Sola
r P
V A
uct
ion
10
-15
MW
…
Bra
zil A
3 8
34
MW
PV
Au
ctio
n A
ug.
20
15
Ger
man
y 1
50
MW
Pilo
t P
V A
uct
ion
II…
Vie
tnam
FIT
(U
nd
er R
evie
w)
Pak
ista
n F
IT (
No
rth
ern
- 2
0 -
50
MW
)
Ind
on
esia
FIT
(Ja
va)
Ph
ilip
pin
es S
ola
r FI
T
US$
c/kW
h
Utility-scale Solar PV Auctions/FITs, 2015-2016
.
Feed in Tariffs

• Mexico Second Round: 2.69 cents/kWh
– Lowest worldwide PV price
• Chile: 2.91 cents/kWh
• United Arab Emirates: 2.99 cents/kWh
• El Salvador: (1/11/17): 4.95 cents/kWh
7
Global Low PV Prices
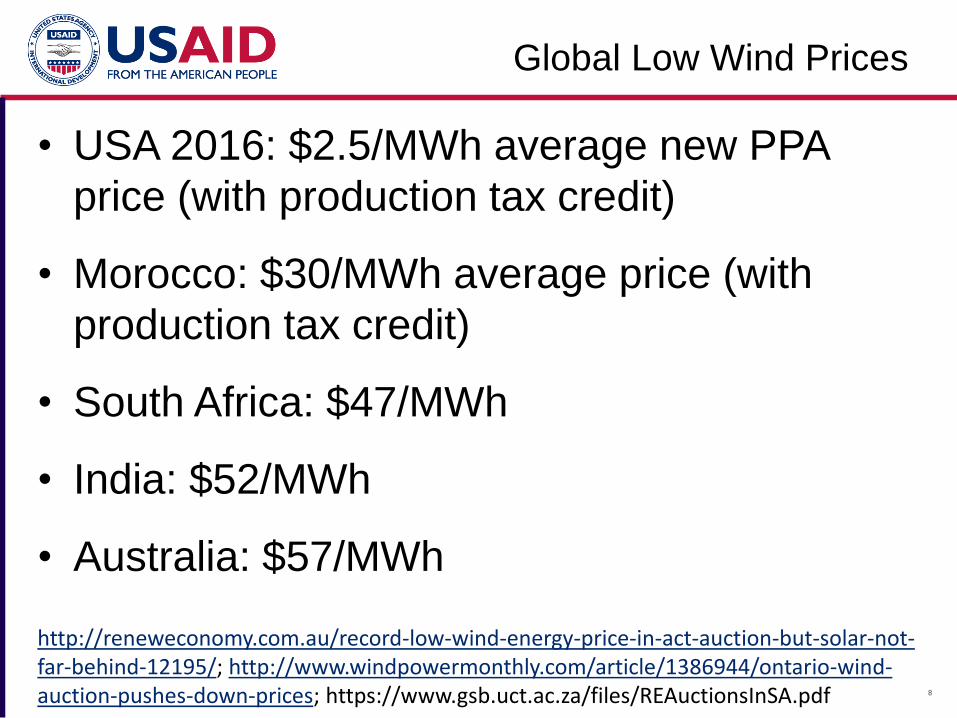
• USA 2016: $2.5/MWh average new PPA
price (with production tax credit)
• Morocco: $30/MWh average price (with
production tax credit)
• South Africa: $47/MWh
• India: $52/MWh
• Australia: $57/MWh
8
Global Low Wind Prices
http://reneweconomy.com.au/record-low-wind-energy-price-in-act-auction-but-solar-not-far-behind-12195/; http://www.windpowermonthly.com/article/1386944/ontario-wind-auction-pushes-down-prices; https://www.gsb.uct.ac.za/files/REAuctionsInSA.pdf
5/11/2017 9
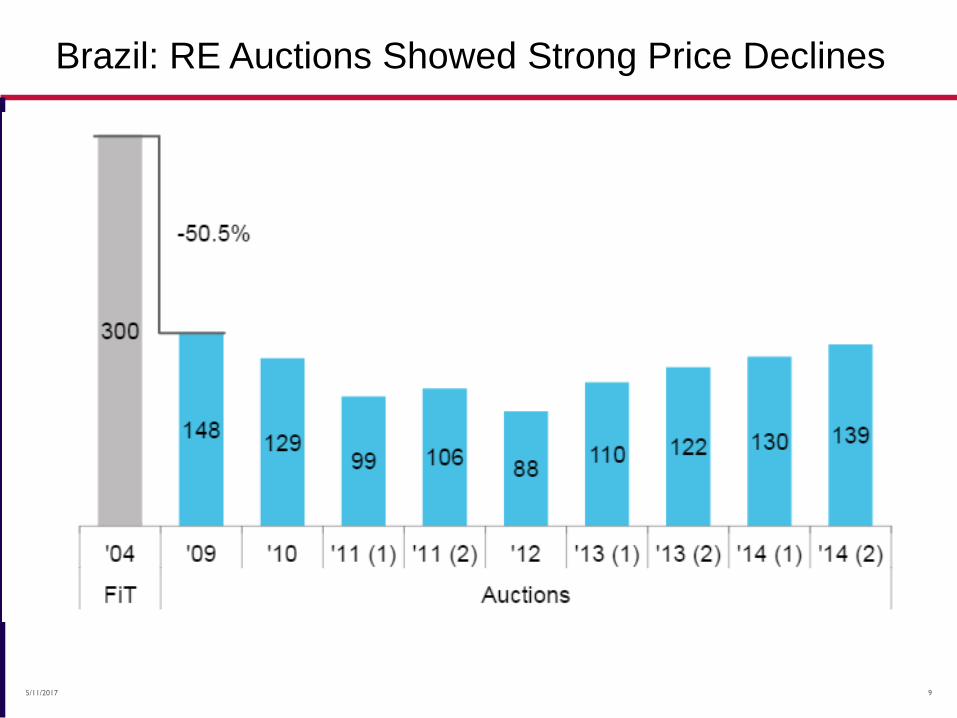
Brazil: RE Auctions Showed Strong Price Declines
5/11/2017 10
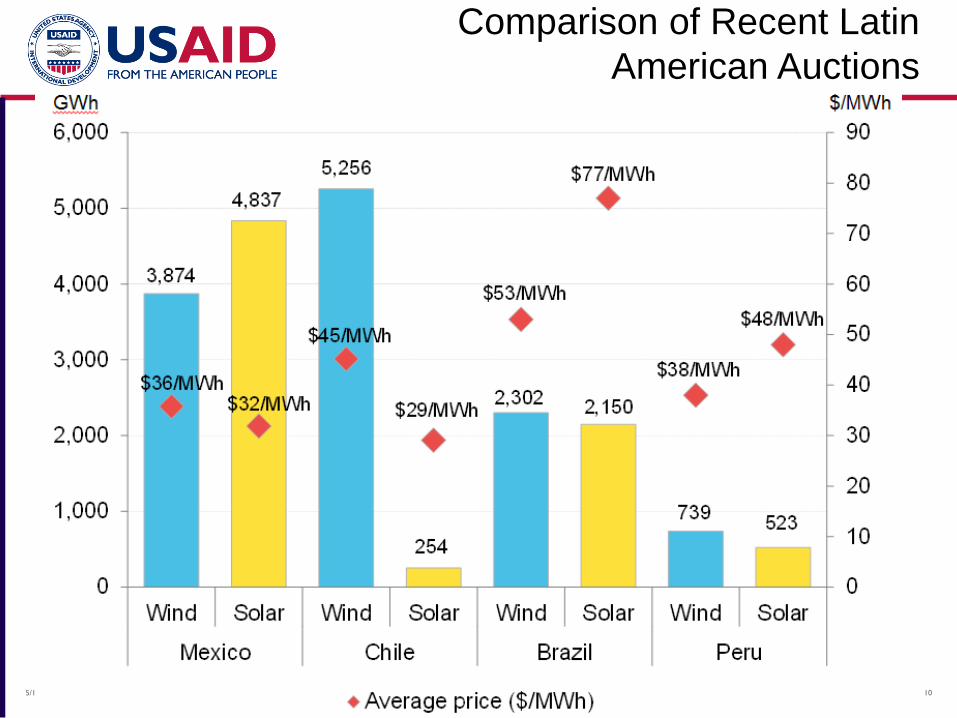
Comparison of Recent Latin
American Auctions
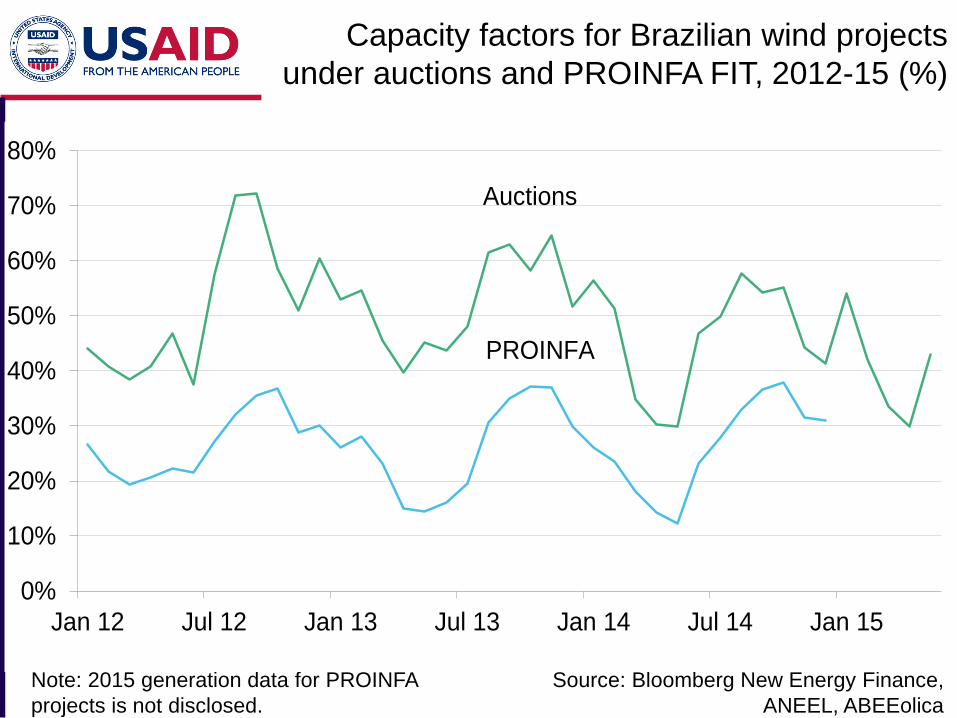
Note: 2015 generation data for PROINFA
projects is not disclosed.
Source: Bloomberg New Energy Finance,
ANEEL, ABEEolica
Capacity factors for Brazilian wind projects
under auctions and PROINFA FIT, 2012-15 (%)
0%
10%
20%
30%
40%
50%
60%
70%
80%
Jan 12 Jul 12 Jan 13 Jul 13 Jan 14 Jul 14 Jan 15
Auctions
PROINFA
0
1
2
3
4
5
6
7
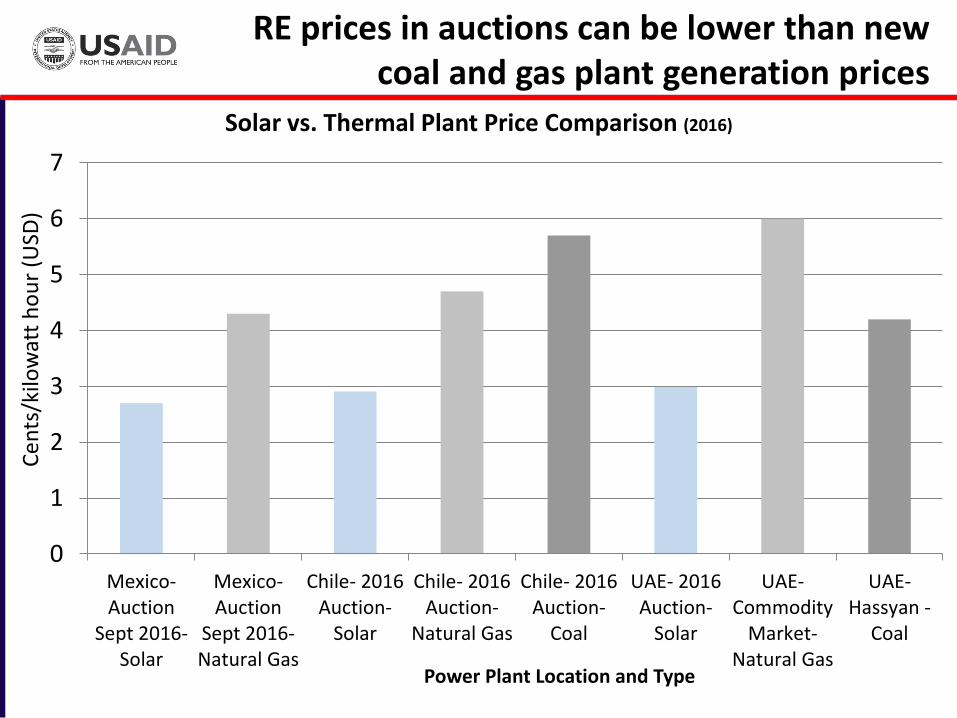
Mexico-Auction
Sept 2016-Solar
Mexico-Auction
Sept 2016-Natural Gas
Chile- 2016Auction-
Solar
Chile- 2016Auction-
Natural Gas
Chile- 2016Auction-
Coal
UAE- 2016Auction-
Solar
UAE-Commodity
Market-Natural Gas
UAE-Hassyan -
Coal
Ce
nts
/kilo
wat
t h
ou
r (U
SD)
Power Plant Location and Type
Solar vs. Thermal Plant Price Comparison (2016)
RE prices in auctions can be lower than new coal and gas plant generation prices
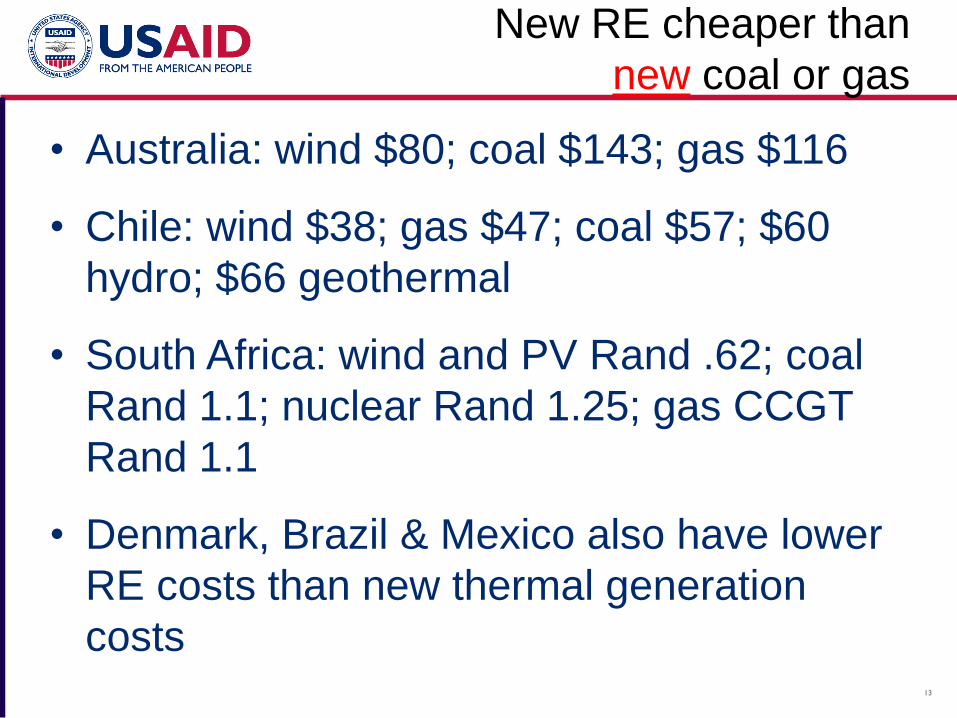
• Australia: wind $80; coal $143; gas $116
• Chile: wind $38; gas $47; coal $57; $60
hydro; $66 geothermal
• South Africa: wind and PV Rand .62; coal
Rand 1.1; nuclear Rand 1.25; gas CCGT
Rand 1.1
• Denmark, Brazil & Mexico also have lower
RE costs than new thermal generation
costs13
New RE cheaper than
new coal or gas
14
Patterns of Price Decline
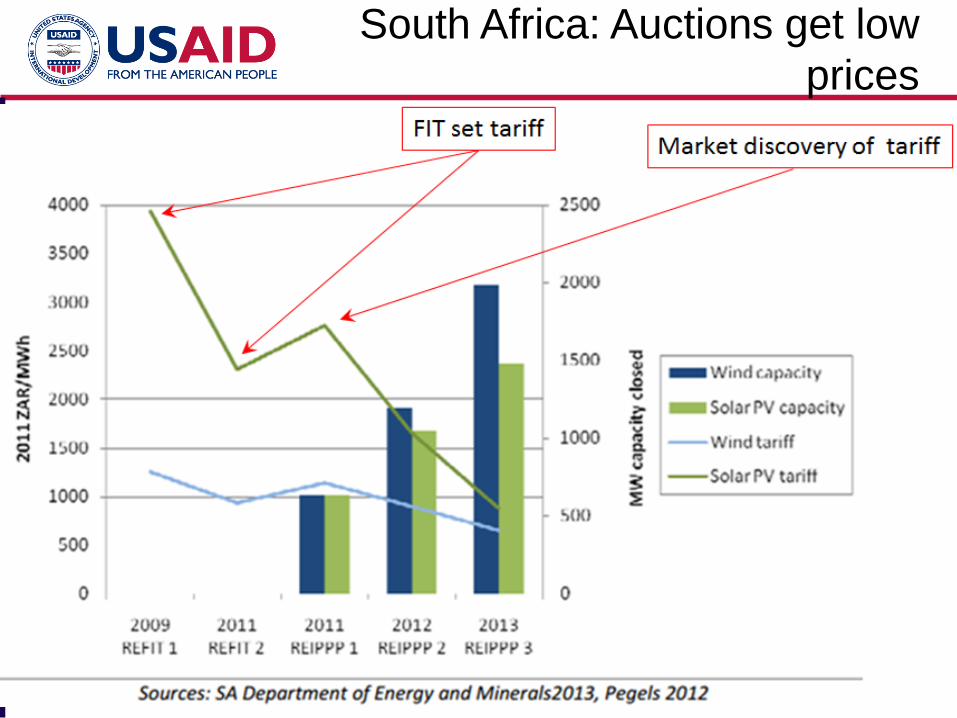
South Africa: Auctions get low
prices
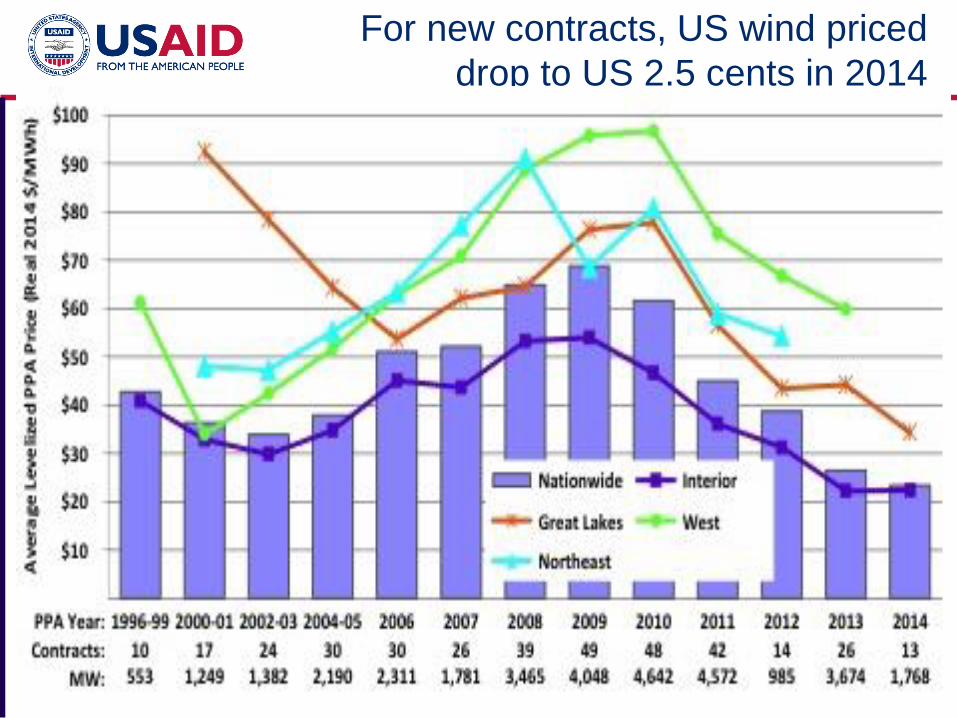
For new contracts, US wind priced
drop to US 2.5 cents in 2014
16
5/11/2017 17
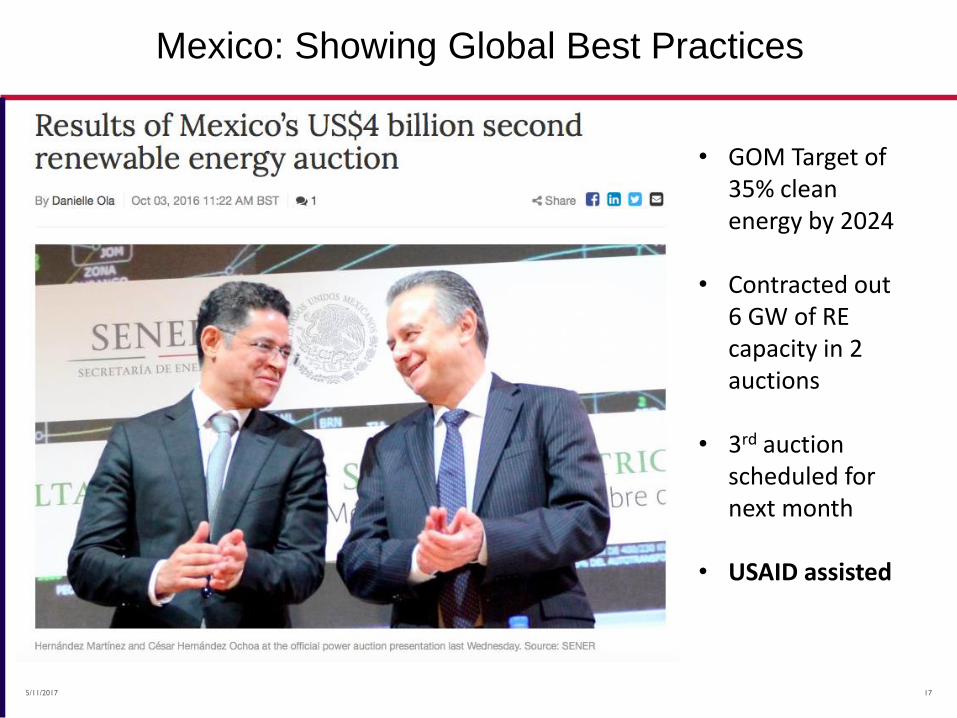
Mexico: Showing Global Best Practices
• GOM Target of 35% clean energy by 2024
• Contracted out 6 GW of RE capacity in 2 auctions
• 3rd auction scheduled for next month
• USAID assisted
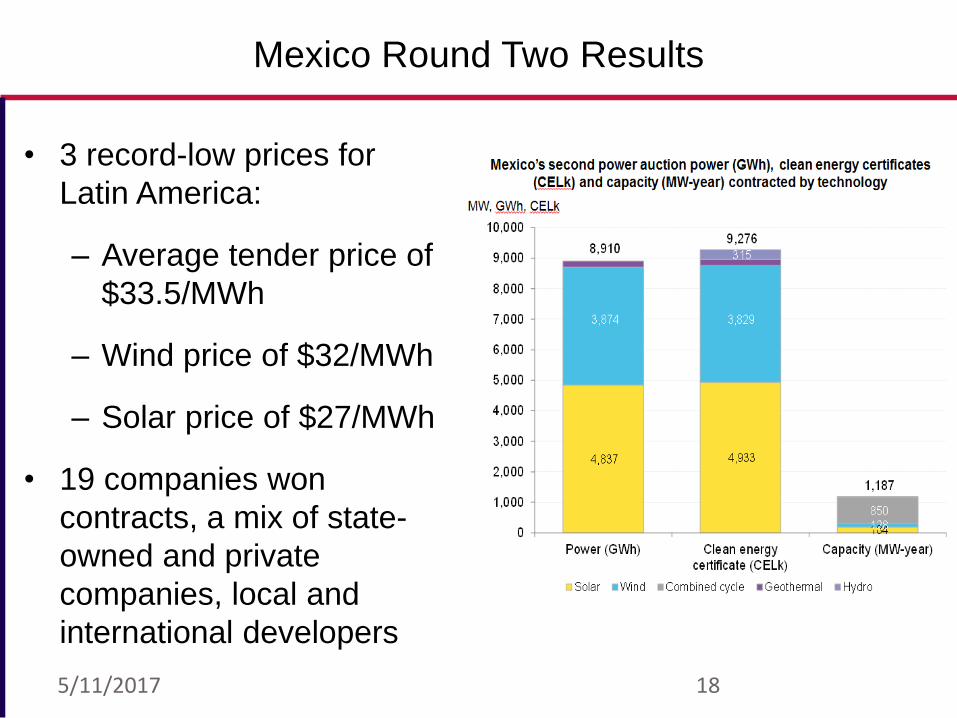
• 3 record-low prices for
Latin America:
– Average tender price of
$33.5/MWh
– Wind price of $32/MWh
– Solar price of $27/MWh
• 19 companies won
contracts, a mix of state-
owned and private
companies, local and
international developers
5/11/2017 18
Mexico Round Two Results
5/11/2017 19
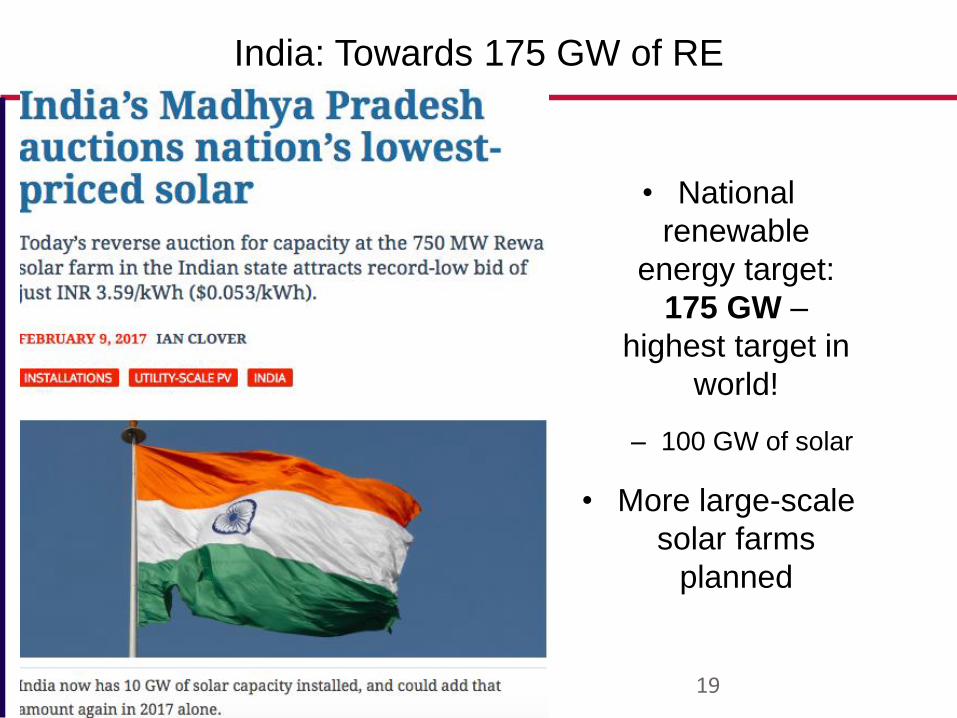
India: Towards 175 GW of RE
• National
renewable
energy target:
175 GW –
highest target in
world!
– 100 GW of solar
• More large-scale
solar farms
planned
20
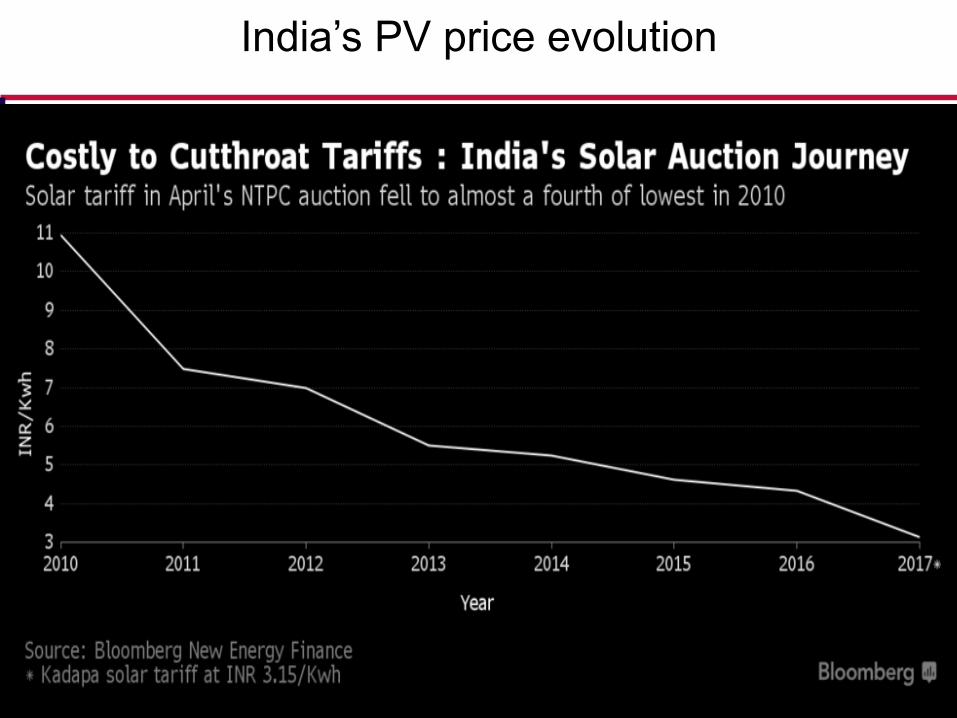
India’s PV price evolution
5/11/2017 21
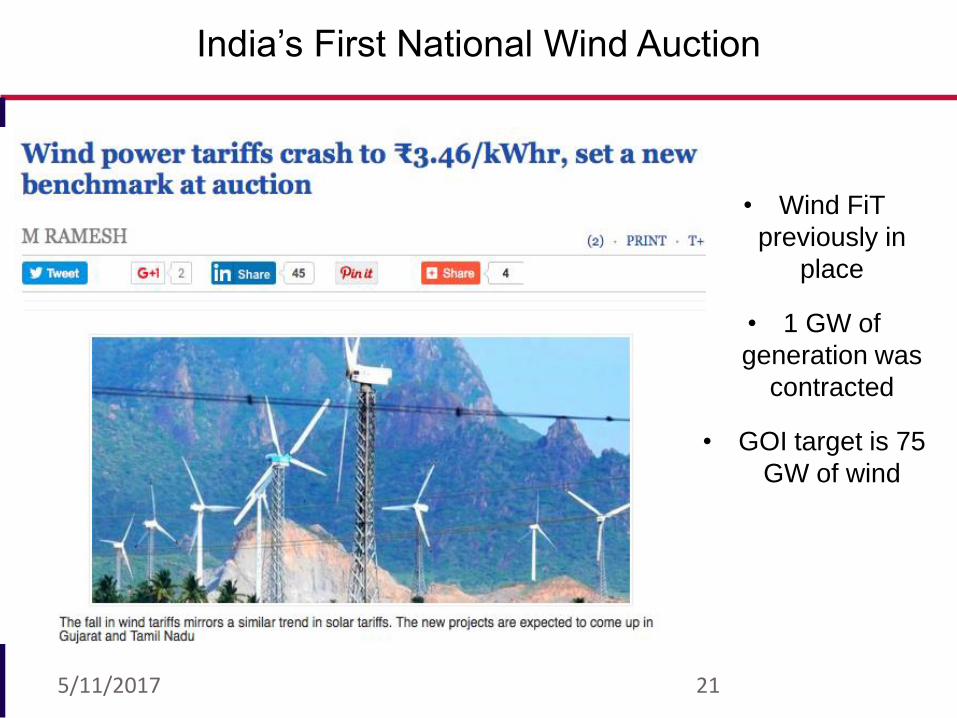
India’s First National Wind Auction
• Wind FiT
previously in
place
• 1 GW of
generation was
contracted
• GOI target is 75
GW of wind
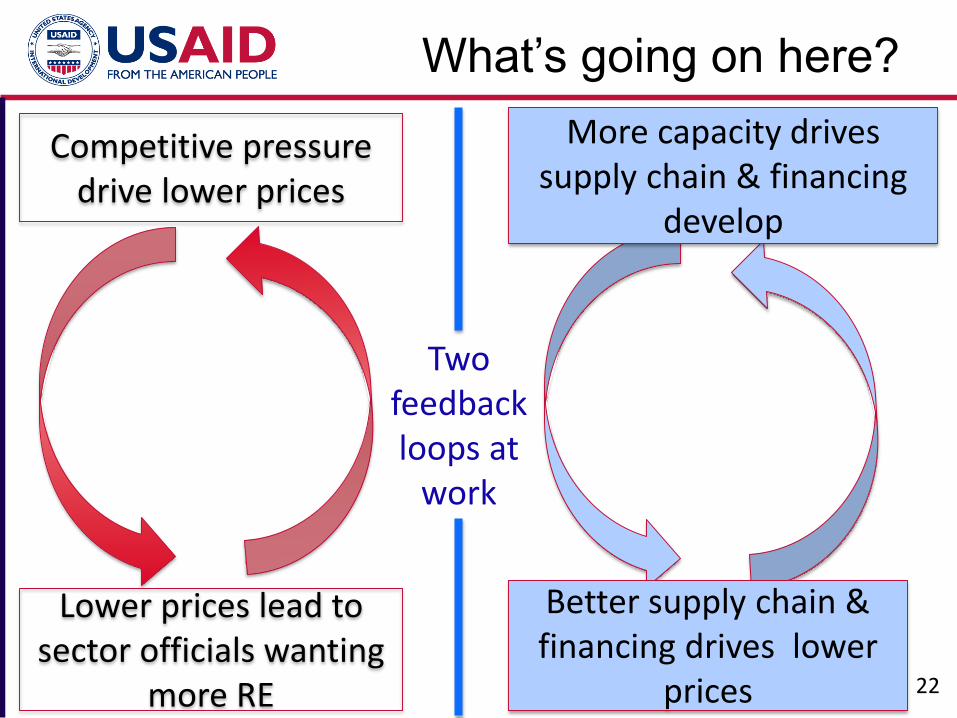
What’s going on here?
22
Competitive pressure drive lower prices
More capacity drives supply chain & financing
develop
Lower prices lead to sector officials wanting
more RE
Better supply chain & financing drives lower
prices
Two feedback loops at
work
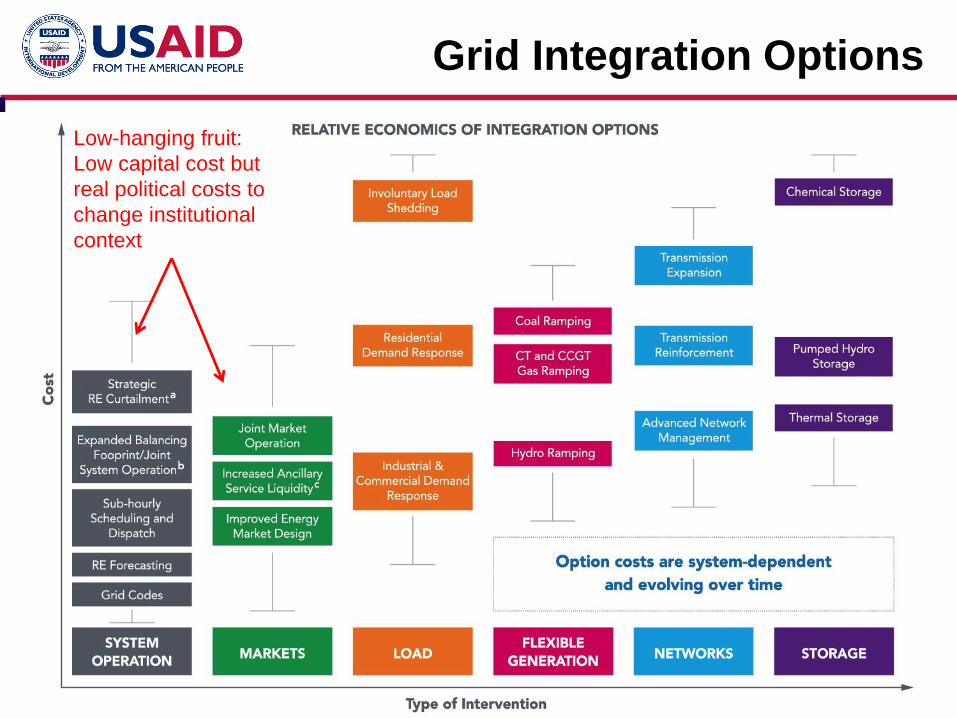
Grid Integration Options
Low-hanging fruit:
Low capital cost but
real political costs to
change institutional
context
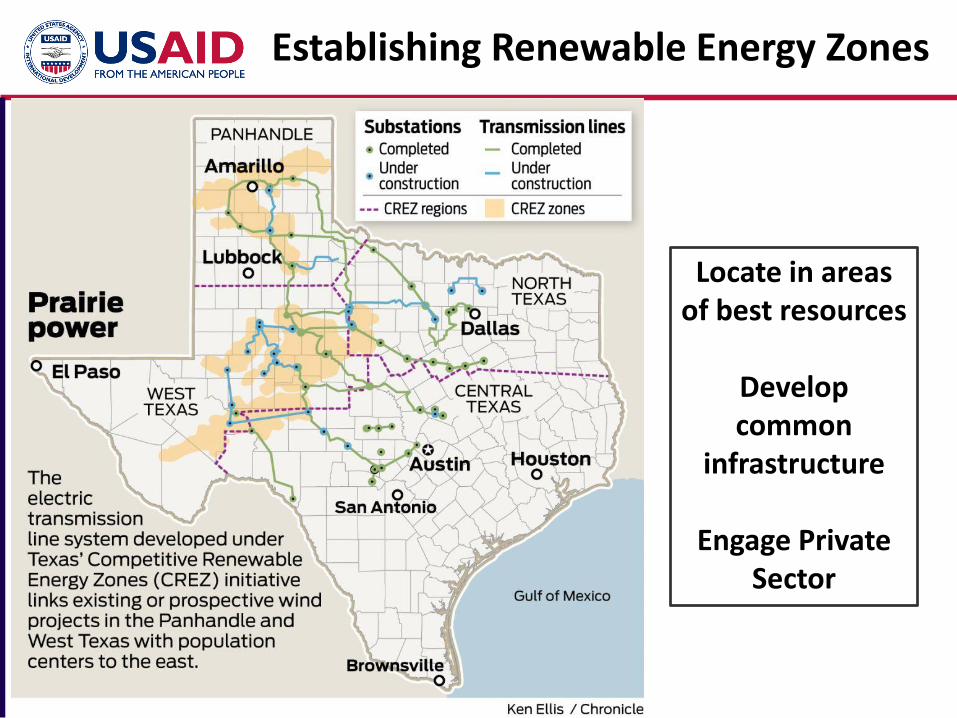
Locate in areas of best resources
Develop common
infrastructure
Engage Private Sector
Establishing Renewable Energy Zones
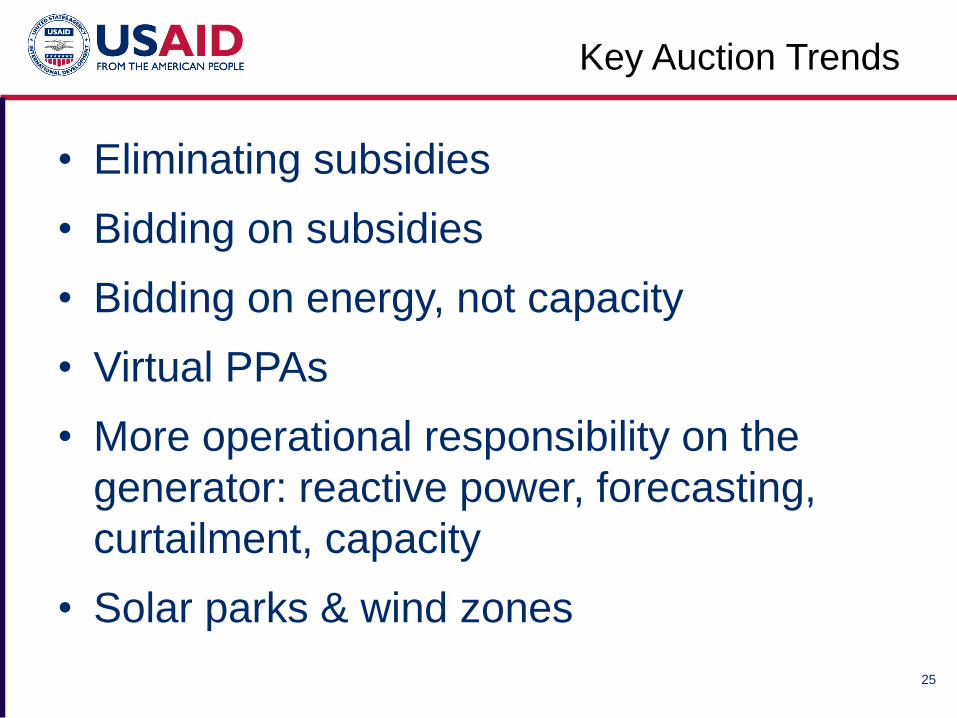
Key Auction Trends
• Eliminating subsidies
• Bidding on subsidies
• Bidding on energy, not capacity
• Virtual PPAs
• More operational responsibility on the
generator: reactive power, forecasting,
curtailment, capacity
• Solar parks & wind zones
25
26
Renewable Energy Auctions
Allen EisendrathGlobal Climate Change Office Director
USAID