renewable energy builds a more reliable and resilient ... · what is wind’s net impact on...
TRANSCRIPT

1
Renewable Energy Builds a More Reliable and Resilient Electricity Mix
American Wind Energy Association I www.awea.org
Michael Goggin May 2017
2
Executive Summary Some of the most common questions
about renewable energy focus on how
wind and solar can be reliably integrated
into the power system. Many people are
unaware of technological advances that allow
wind and solar to provide grid reliability services
as well as or better than conventional power
plants. The following report answers 14 of the
most frequently asked questions with lessons
learned from grid operators’ experiences reliably
integrating large amounts of renewable energy.
Concise answers to these questions are provided
here in the executive summary, while citations
and explanations of the supporting data and
analysis for those answers can be found by using
the following hyperlinks to the relevant sections
of the full report below.
1. How much wind energy are grid
operators integrating now?
U.S. wind energy provides enough electricity to
power the equivalent of over 25 million homes.
Iowa and South Dakota reliably produced more
than 30% of their electricity from wind last year,
and a total of nine states are above 15%. At
times, wind has supplied more than 60% of the
electricity on the main utility system in Colorado,
and more than 50% of the main Texas power
system and the Southwest Power Pool system.
These power systems have seen electric
reliability increase.
2. How much more renewable energy can
we reliably integrate?
While U.S. and European grid operators have
already reliably integrated large amounts of
wind energy, studies indicate that we can go far
higher. Studies examining obtaining 50% or
more of our electricity from wind and solar have
found no major obstacles to doing so. Ten years
ago some utilities and grid operators were
concerned about reaching 5% wind; the
technology advances and lessons learned that
have allowed that to be exceeded over the last
decade are likely to continue in the future.
3. Don’t we need baseload?
Instead of using the term “baseload,” it is more
accurate to talk about the three main services
the grid needs to operate reliably: energy,
capacity, and flexibility. Energy is the production
of electricity, capacity is the ability to produce
power during periods of high demand, and
flexibility is the ability to change output to keep
supply and demand in balance. Cost-effectively
obtaining all three services requires a division of
labor among a diverse mix of energy sources, as
no resource excels at providing all three. For
example, coal and nuclear plants typically do not
provide significant flexibility, and other
resources can provide energy and capacity at
lower cost. Wind energy fits well into this mix as
a low-cost source of energy, though it also
provides some capacity and can provide
flexibility when it is economic to do so.
4. What happens when the wind doesn’t
blow?
Other plants provide energy at those times, in
the same way that all power plants back up all
other power plants. Portfolio diversity is the key,
as no resource is available 100% of the time. All
power plants have reduced output at times, and
grid operators plan for wind’s contribution using
the same tools they use to evaluate the
contributions of other resources. Adding wind
power never increases the need for power plant
capacity, but rather reduces it. During a number
of events wind has demonstrated its contribution
to a more diverse and resilient energy portfolio
by stepping in when other resources failed
unexpectedly.
5. Why are coal and nuclear plants facing
economic challenges?
Cheap natural gas, not renewable energy, is the
primary factor undermining the competitiveness
of coal and nuclear plants. Wind and the
production tax credit (PTC) are compatible with
well-functioning electricity markets. Wind’s
impact on other generators is market-driven and
the same as that of any low-cost generator, and
small compared to other factors.
3
6. Can renewables provide the reliability
services provided by conventional
generation?
Yes. As wind energy has grown to provide a
larger share of our electricity mix, renewable
energy technology has matured so that modern
wind and solar plants are able to provide the
same grid reliability services as conventional
generators, including voltage and reactive
power control, frequency and inertial response,
active power control, and voltage and frequency
ride-through. In some cases the reliability
services provided by renewables exceed those
of conventional generators, while in other cases
conventional generators can provide those
services more economically than wind
generators, but wind generators can provide
those services if it becomes economic to do so.
7. What about the variability of
renewable energy?
Variability and uncertainty are nothing new for
grid operators, as they have always dealt with
large and unexpected fluctuations in electricity
supply and demand by changing the output of
power plants. Most changes in wind output are
canceled out by other offsetting changes in
electricity supply and demand, and any
remaining variability is accommodated using the
same flexible reserves that grid operators have
always used. In fact, because changes in wind
output occur gradually and can be forecasted,
they are less costly for grid operators to
accommodate than the abrupt failures of large
conventional power plants. Contrary to most
people’s intuitive experience that winds are
variable and electricity demand and supply is
stable, the opposite is actually true at the grid
operator scale.
8. How much does it cost to integrate
renewable energy?
Grid operator data show that increasing the use
of existing flexible resources to accommodate
wind and solar amounts costs only pennies on a
typical electric bill. In fact, the cost of
accommodating the unexpected failures of large
conventional power plants is far higher.
9. Don’t grid operators need to add
backup to integrate wind?
No. One of main reasons why an integrated
power system was first built more than 100 years
ago was so all power plants could back up all
other power plants. Because most sources of
variability cancel each other out, having a
dedicated backup source for each would be
highly inefficient and counterproductive.
10. What steps help accommodate higher
levels of renewable energy?
Market-based grid operating reforms and
transmission upgrades are by far the lowest
hanging fruit for making the power system more
efficient by using more of the flexibility that
already exists on the power system. These grid
operating reforms provide major net benefits to
consumers and improve reliability even without
renewable energy on the power system, so they
should be implemented anyway.
11. Isn’t energy storage necessary to
integrate wind?
No, but it can be helpful. Very large amounts of
wind energy can be reliably integrated at low
cost without a need for energy storage. Energy
storage provides a variety of services and is
therefore best viewed as a system resource and
not a resource for renewable energy. Energy
storage is typically a more expensive source of
flexibility than grid operating reforms that allow
greater use of the flexibility that already exists
on the power system.
12. Why is some wind power curtailed?
How does time of production affect the
value of wind energy?
In some areas the growth of wind energy has
outpaced the addition of transmission. At times
this has required reducing, or curtailing, the
output of wind plants until new transmission is
added. However, as long-needed grid upgrades
are completed, wind curtailment is being
virtually eliminated, as are occurrences of
negative electricity prices. Wind energy always
has high economic value, particularly once the

4
environmental and public health costs of fossil
fuel generation are taken into account.
13. What has been Europe’s experience
with renewable energy?
European nations have demonstrated that wind
energy can reliably provide a large share of our
electricity, with Ireland, Spain, and Portugal
obtaining around 20% of their electricity from
wind on an annual basis, Germany at 25% from
wind and solar, and Denmark at nearly 35%
wind. Carbon emissions have fallen drastically in
all of these countries, while electric reliability has
been maintained at world-leading levels and in
many cases improved.
14. What is wind’s net impact on
emissions?
Wind energy greatly reduces emissions of
carbon dioxide and other pollutants after all
impacts on other power plants are taken into
account.
As should be apparent from the extensive
evidence provided in the full text below, this
report seeks to distill tens of thousands of pages
of analysis by grid operators and other experts
into a more digestible document. Additional
technical support for the points made in this
document can be found in a similar 2009 FAQ
authored by some of the world’s leading
renewable integration experts in the journal of
the Institute of Electrical and Electronics
Engineers (IEEE).1
1http://www.consultkirby.com/files/Wind_Myths_Debu
nked_IEEE_2009.pdf

5
1. How much wind energy are grid operators integrating now?
U.S. wind energy reliably provides enough electricity to power the equivalent of over 25
million homes. Iowa and South Dakota produced more than 30% of their electricity from wind in 2016,
and Kansas and Oklahoma exceeded 25%. The main Texas power system (ERCOT) obtained 15% of its
electricity from wind last year, the Southwest Power Pool (SPP) is approaching 20%, and both are reliably
adding more.2 Nationwide, wind is only 5.5% of generation, indicating many regions have significant room
to grow.
2 https://www.xcelenergy.com/staticfiles/xe-responsive/Admin/Managed%20Documents%20&%20PDFs/CO-2017-Renewable-Energy-Plan-Fact-Sheet.pdf, http://www.ercot.com/content/wcm/lists/89476/ERCOT2016D_E.xlsx, https://marketplace.spp.org/web/guest/generation-mix-rolling-365

6
At certain times, wind output levels have gone even higher. The map below shows instantaneous wind
generation records and the record percent of demand or generation from wind. At times, wind has
supplied around two-thirds of the electricity on the main utility system in Colorado, and over 50% in
ERCOT and SPP, all without any reliability problems.
Wind energy output records by region

7
These power systems have maintained or improved electric reliability as they have added large amounts of
wind energy. For example, ERCOT, which has most wind capacity of any U.S. power system, has seen its
electric reliability scores increase dramatically as it has added wind energy. The following chart shows the
increase in ERCOT’s CPS1 score, which is a widely-used reliability metric that measures how electricity
supply and demand are kept in balance. While many factors affect reliability and CPS1 scores, adding
large amounts of wind energy clearly has not degraded electric reliability in Texas.3
Researchers at the University of Texas at Austin compiled the following chart from ERCOT data, showing
that the growth of wind energy has also not caused a significant increase in the need for the frequency
regulation reserves that are used to keep electricity supply and demand in balance.4 Many other U.S. grid
operators have found the same result, as discussed in Chapter 8 below.
3http://www.ercot.com/content/wcm/key_documents_lists/27311/ERCOT_Monthly_Operational_Overview_201702.pdf 4http://theconversation.com/are-solar-and-wind-really-killing-coal-nuclear-and-grid-reliability-76741
8
2. How much more renewable energy can we reliably
integrate?
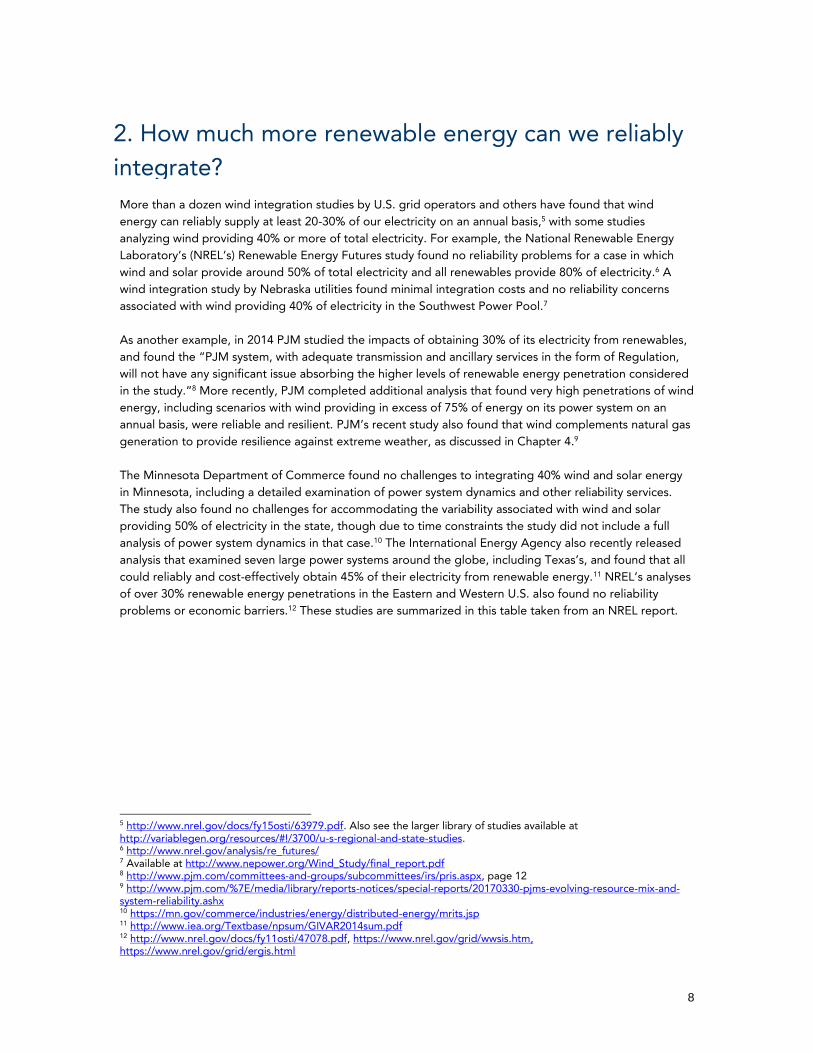
More than a dozen wind integration studies by U.S. grid operators and others have found that wind
energy can reliably supply at least 20-30% of our electricity on an annual basis,5 with some studies
analyzing wind providing 40% or more of total electricity. For example, the National Renewable Energy
Laboratory’s (NREL’s) Renewable Energy Futures study found no reliability problems for a case in which
wind and solar provide around 50% of total electricity and all renewables provide 80% of electricity.6 A
wind integration study by Nebraska utilities found minimal integration costs and no reliability concerns
associated with wind providing 40% of electricity in the Southwest Power Pool.7
As another example, in 2014 PJM studied the impacts of obtaining 30% of its electricity from renewables,
and found the “PJM system, with adequate transmission and ancillary services in the form of Regulation,
will not have any significant issue absorbing the higher levels of renewable energy penetration considered
in the study.”8 More recently, PJM completed additional analysis that found very high penetrations of wind
energy, including scenarios with wind providing in excess of 75% of energy on its power system on an
annual basis, were reliable and resilient. PJM’s recent study also found that wind complements natural gas
generation to provide resilience against extreme weather, as discussed in Chapter 4.9
The Minnesota Department of Commerce found no challenges to integrating 40% wind and solar energy
in Minnesota, including a detailed examination of power system dynamics and other reliability services.
The study also found no challenges for accommodating the variability associated with wind and solar
providing 50% of electricity in the state, though due to time constraints the study did not include a full
analysis of power system dynamics in that case.10 The International Energy Agency also recently released
analysis that examined seven large power systems around the globe, including Texas’s, and found that all
could reliably and cost-effectively obtain 45% of their electricity from renewable energy.11 NREL’s analyses
of over 30% renewable energy penetrations in the Eastern and Western U.S. also found no reliability
problems or economic barriers.12 These studies are summarized in this table taken from an NREL report.
5 http://www.nrel.gov/docs/fy15osti/63979.pdf. Also see the larger library of studies available at http://variablegen.org/resources/#!/3700/u-s-regional-and-state-studies. 6 http://www.nrel.gov/analysis/re_futures/ 7 Available at http://www.nepower.org/Wind_Study/final_report.pdf 8 http://www.pjm.com/committees-and-groups/subcommittees/irs/pris.aspx, page 12 9 http://www.pjm.com/%7E/media/library/reports-notices/special-reports/20170330-pjms-evolving-resource-mix-and-system-reliability.ashx 10 https://mn.gov/commerce/industries/energy/distributed-energy/mrits.jsp 11 http://www.iea.org/Textbase/npsum/GIVAR2014sum.pdf 12 http://www.nrel.gov/docs/fy11osti/47078.pdf, https://www.nrel.gov/grid/wwsis.htm, https://www.nrel.gov/grid/ergis.html

9
It is reasonable to ask whether these forward-looking studies accurately reflect grid operating realities.
Fortunately, the Texas grid operator has answered that question, and in that case found its study actually
overestimated the increase in reserve needs that would be caused by wind. In 2013, ERCOT used its real-
world grid operating data to validate the results of a 2008 study it had conducted to estimate the impact
of higher levels of wind use.13 The results shown in the report’s graphs are summarized in the following
table.
Increase in regulation reserve need per 1,000 MW of wind capacity
2008 study 2012 actual data
Morning 6.6 3.7 Mid-Day 2.4 3 Evening 10.2 1.7
Night 1.2 1.1
Simple Average 5.1 2.4
Returning to the question of how high can renewable penetration levels go, that is ultimately a question of
economics, not reliability. As the use of renewable energy increases, grid operators will simply increase
operating reserve levels to ensure that reliability will be maintained to meet reliability standards. As
explained below, the incremental cost of these operating reserves is incredibly small, and actually smaller
than the integration cost for conventional generation. Moreover, as discussed in the answer to Question
13http://www.ercot.com/content/meetings/qmwg/keydocs/2013/1007/GEStudyAnalysis_ERCOTInternalReport.pdf

10
10 below, cost-effective grid operating reforms can provide large amounts of additional flexibility that will
enable even higher levels of renewable use.
It is possible that grid operating challenges could emerge at extremely high levels of renewable use,
beyond the levels examined in all wind integration studies to date. However, it should be noted that
challenges experienced as a power system approaches 100% wind and solar energy have little bearing on
the path forward for U.S. grid operators. While some states are pursuing policies to obtain a very large
share of their electricity from renewable energy, those targets are achievable because those states are part
of large interstate power systems. No interstate power system is pursuing 100% wind and solar energy,
making criticism of the challenges in approaching 100% renewable energy an attack on a strawman
argument.
Updating the grid and its operating procedures and holding higher levels of operating reserves will also
help address any challenges associated with obtaining the majority of electricity from wind and solar
energy, as explained in Chapter 10. The U.S. generation mix is currently evolving towards more flexible
resources, which will help address many of those challenges as well. By the time extremely high levels of
renewable energy use are reached in the U.S., there will likely also have been technological advances in
areas such as demand response, energy storage, electrification of dispatchable demand in the
transportation and heating sectors, and even unforeseeable changes that will likely help address these
challenges.
It is worth noting that as recently as a decade ago, some utilities and grid operators were concerned about
integrating levels of wind that have already been greatly exceeded. With greater operational experience
and improvements in technology and operating practices like wind energy forecasting, those concerns
have been addressed. This provides reason to be optimistic that improvements in grid operating practices
and technology will continue to make the integration of wind energy even easier.
As Bruce Rew, the VP of operations for the Southwest Power Pool, recently explained, “Ten years ago we
thought hitting even a 25 percent wind-penetration level would be extremely challenging, and any more
than that would pose serious threats to reliability. Now we have the ability to reliably manage greater than
50 percent. It’s not even our ceiling. We continue to study even higher levels of renewable, variable
generation as part of our plans to maintain a reliable and economic grid of the future…With a footprint as
broad as ours, even if the wind stops blowing in the upper Great Plains, we can deploy resources waiting
in the Midwest and Southwest to make up any sudden deficits."14
Or as the International Energy Agency has noted, “Variability is not just some new phenomenon in grid
management. What we found is that renewable energy is not fundamentally different. The criticisms of
renewables often neglect the complementarities between different technologies and the way they can
balance each other out if spread over certain regions and energy types.
“Grid operators are constantly working to balance available supply with demand – it’s what they do. There
are always natural variations that cause spikes in demand, reductions in supply or create disturbances in
frequency and voltage. Once you see there are a variety of ways to properly manage that variability, you
start whittling away at the argument that you always need storage or a megawatt of natural gas backup for
every megawatt of renewable energy.”15
14 https://www.spp.org/about-us/newsroom/spp-sets-north-american-record-for-wind-power/ 15 http://thinkprogress.org/climate/2011/06/15/245880/top-5-coolest-ways-companies-are-integrating-renewable-energy-into-the-grid/

11
3. Don’t we need baseload power?
Instead of using the term “baseload,” it is more accurate to talk about the three main services the grid
needs to operate reliably: energy, capacity, and flexibility.16 Cost-effectively obtaining all three services
requires a division of labor among a diverse mix of energy sources, as few resources can economically
provide all three. For example, baseload resources typically do not provide flexibility, and there can be
lower-cost ways of obtaining the energy and capacity provided by baseload. Wind energy primarily adds
value to an energy portfolio as a low-cost and non-polluting source of energy, though it also provides
some capacity and can provide flexibility when it is economic to do so. Electricity markets efficiently and
economically meet power system needs by selecting the resources that are best suited to provide each
service through a division of labor.
Reliable and cost-effective operation of the electric grid primarily requires a mixture of three types of
services: energy (electricity or MWh), capacity (ability to generate electricity at a certain point in time or
MW), and flexibility (a change in MW over some period of time, i.e. the ability to "turn up" or "turn down"
electricity generation as needed in response to the aggregate fluctuations of all electricity supply and
demand on the power system).
The following table conceptually describes the typical ability of different types of power plants to provide
the attributes of energy, capacity, and flexibility. A power plant may specialize in providing one or two of
these power system needs, but no power plant excels at economically providing all three.
Because of these differing capabilities, it is important to have a diversity of generation resources on the
power system. The most efficient strategy is generally for resources to provide the services they can
provide at low cost, and not to use one type of resource to provide all services.
The power system’s current trend towards a greater use of renewable energy, gas generation, and
demand response appears to be a cost-effective way to meet all three power system needs. Renewable
energy is an ideal source of low-cost energy, while gas generation and demand response provide capacity
and flexibility at low cost. This division of labor is not new, as explained below.
Nuclear and coal plants, conventionally thought of as “baseload” plants, are remarkably similar to wind
plants in that they are primarily energy resources. Like wind, their fuel costs and operating costs are very
low. In fact, some grid operators have referred to wind energy as “the new baseload.”17
16https://www.energy.gov/sites/prod/files/2017/01/f34/Maintaining%20Reliability%20in%20the%20Modern%20Power%20System.pdf 17 https://morningconsult.com/opinions/paradigm-shift-wind-energy-can-new-baseload/

12
Nuclear and coal plants are capable of providing capacity at a level close to their maximum output. Even
so, no power plant can be counted on to reliably provide capacity at its maximum output, as all plants
experience mechanical, electrical, or other failures from time to time and must go offline with little notice,
as discussed in the next section. For example, nuclear power plants in the Southeastern U.S. have been
forced to shut down, some for periods of several weeks, because drought and summertime heat waves
raised the temperature of the water in the rivers they rely on for cooling their steam generators. Instances
of extreme cold have also forced all types of power plants offline across many regions of the country
simultaneously.
Almost all nuclear plants in the U.S. provide no flexibility, and the flexibility provided by some coal plants
can be limited. A primary factor is the same reason why most wind plants are not used to provide
flexibility: because these resources can provide low cost energy, it typically does not make economic sense
for them to forgo energy production so they can provide flexibility.
Without a diverse portfolio, the inflexibility of coal and nuclear plants can present a reliability challenge
and is exacerbating the economic challenges of baseload plants that have been undercut by cheap gas
generation and are now operating mid-merit.18
Electricity supply and demand has always fluctuated, so grid operators have learned to use a division of
labor that uses the most flexible resources for flexibility while other resources provide little to no flexibility.
All sources of electricity supply and demand are physically aggregated on the power system, with many
sources of variability canceling each other out, as explained in Chapter 7. As a result, the aggregate
amount of variability that grid operators must accommodate, and the contribution of renewable resources
to that variability, is typically quite small. Thus, concern expressed by some that wind plants are not
typically operated in a dispatchable way is unfounded. Many types of power plants, including most
baseload power plants, are not operated in a dispatchable way today, yet power system reliability is
maintained. Like baseload resources, wind can be operated dispatchably, it is just not typically economic
to do so.
The terms “intermittent” and “non-dispatchable” more aptly refer to resources like nuclear and coal
plants, rather than the renewable resources those terms are commonly but incorrectly used to criticize.
Renewable resources are not intermittent as their output changes gradually and predictably, as explained
in Chapter 7 below, while large conventional power plants fail instantaneously, taking out 100% of their
output without warning. Renewable plants can be and are dispatched to maintain balance in power system
supply and demand, as discussed in Chapter 6 below, while many inflexible nuclear and coal plants are
truly “non-dispatchable.”
A power system with only baseload resources would not be reliable or cost-effective. Moreover, other
resources can provide all of the services that are currently provided by baseload generators, in many cases
at lower cost than the baseload generators. Baseload resources are not, by themselves, either necessary or
sufficient to provide all of the services the power system needs.
Natural gas power plants, particularly combustion turbines, are generally the opposite of nuclear and coal
plants, providing significant amounts of flexibility and capacity but typically less energy.19 This is not
18 Joe Bowring of Monitoring Analytics made this point at a PJM meeting on April 19, 2017. http://pjm.com/committees-and-groups/stakeholder-meetings/symposiums-forums/grid-2020-focus-on-resilience-part-1-fuel-mix-diversity-and-security.aspx 19 http://www.eia.gov/electricity/monthly/epm_table_grapher.cfm?t=epmt_6_07_a

13
because natural gas plants are incapable of generating large amounts of energy, but rather due to the fact
that gas power plants typically have higher operating costs because natural gas is generally more
expensive than coal.
However, gas plants, particularly combustion turbine (CT) plants, do excel at providing low-cost capacity
and at rapidly changing their output. Combined-cycle (CC) natural gas plants are more efficient and thus
have lower operating costs than combustion turbine plants, but the tradeoff is that they are generally less
flexible. Gas combustion turbines excel at providing capacity at low cost, with a plant’s capacity value
typically many times higher than its average capacity factor.
Hydroelectric plants are capable of being used for energy, capacity, or flexibility, but there are tradeoffs
between these that limit any one dam from providing significant amounts of all three during the same
period of time. For example, an increase in the dam’s energy and capacity by running at full output
decreases its flexibility as it cannot increase output on command, and vice versa. In addition, there are also
tradeoffs between energy and capacity, because using up the water stored behind the dam to provide
energy limits the ability to provide capacity at a later time.
As the table illustrates, wind excels at providing energy, as its fuel source is free. Wind does provide some
capacity and can provide flexibility, although it is typically not the most economic choice if one is primarily
seeking to obtain larger amounts of those services.
Renewables do provide valuable amounts of firm capacity for meeting system needs, and this can be
accounted for using the same statistical tools planners use for other resources, as discussed in the next
chapter.20 Wind typically provides capacity in a ratio of about one unit of capacity for every two units of
average energy output,21 though a wind plant’s exact amount of capacity varies depending on a number of
site-specific factors. Wind plants can also rapidly and precisely reduce their output on command, giving
them excellent flexibility for reducing supply, and once their output has been reduced they can rapidly
increase it. Flexibility to increase power supply is much more costly for wind plants than other types of
power plants, as doing so requires holding the plant below its potential output, sacrificing a significant
amount of energy that could have been produced for free. However, in certain circumstances in can be
economic to do so, and the speed and accuracy of response is higher than almost any other resource.22
Our current power system successfully balances the need for energy, capacity, and flexibility. However, the
need to reduce harmful impacts from fossil fuel use and diversify our energy mix is driving changes in our
energy mix. Because emissions and fuel use are a product of the amount of energy produced, these are
not capacity or flexibility challenges, but rather energy challenges. Wind energy, being predominantly an
energy resource, is ideally suited to help solve these challenges.
Of course, the grid will continue to need capacity and flexibility. As explained above, wind energy can
provide these resources to some extent, although not as well as other types of power plants. Fortunately,
natural gas power plants can provide capacity and flexibility at very low cost. Building more natural gas
plants or keeping existing fossil-fired power plants around does not significantly harm efforts to reduce
fossil fuel use, as power plants that are being used to provide capacity and flexibility only run during the
20 http://www.nrel.gov/docs/fy08osti/43433.pdf 21 As discussed in the following chapter, a typical wind plant’s average energy output, or capacity factor, is 30-50% of
the nameplate rating, while a typical capacity value (how much of the wind plant’s capacity can be counted on for
meeting peak electric demand) is 15-25% of the nameplate rating. 22 http://iiesi.org/assets/pdfs/ieee-power-energy-mag-2015.pdf

14
small number of hours per year when those services are needed. Demand response, in which electricity
consumers reduce or delay non-essential electricity use in response to price signals, can also be used to
provide capacity and flexibility at very low cost. Plug-in electric vehicles also have significant potential to
serve as sources of flexibility.
Discussions of what power system resources are needed should be focused on the specific services the
power system needs and finding the optimal generation mix for obtaining those services at the lowest cost
and fuel price risk to consumers.
15
4. What happens when the wind doesn’t blow?
Other plants provide energy at those times, in the same way that all power plants always back up all other
power plants in case they experience an outage. Portfolio diversity is the key to a reliable power system,
as no resource is available 100% of the time and all power plants are dependent on all others to back them
up. Grid operators have always built more than enough power plant capacity to meet electricity demand,
so that a “reserve margin,” or cushion is available in case some power plants are not available.
Adding wind power never increases the need for power plants, but rather reduces it. No new capacity is
needed to integrate wind, as wind’s contribution to meeting system capacity needs is always positive.23 A
power system’s capacity need is a total system need driven by peak demand, and the need for capacity
never increases and always decreases as wind power is added to the system.
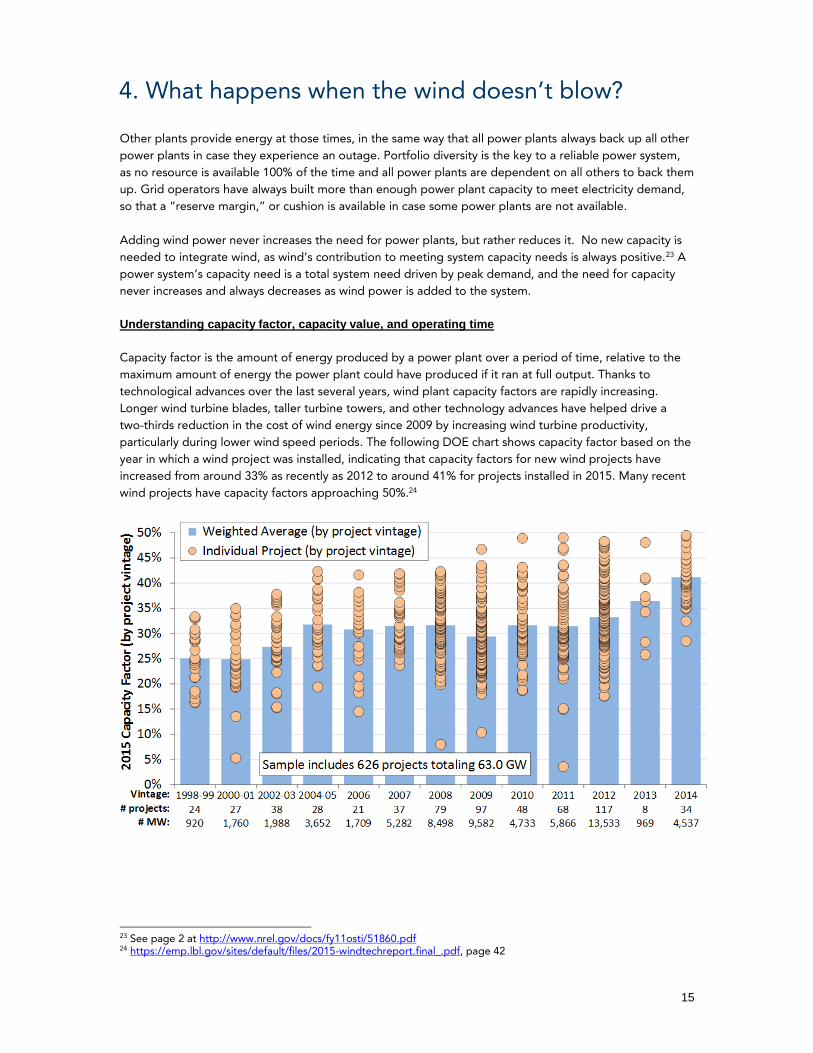
Understanding capacity factor, capacity value, and operating time
Capacity factor is the amount of energy produced by a power plant over a period of time, relative to the
maximum amount of energy the power plant could have produced if it ran at full output. Thanks to
technological advances over the last several years, wind plant capacity factors are rapidly increasing.
Longer wind turbine blades, taller turbine towers, and other technology advances have helped drive a
two-thirds reduction in the cost of wind energy since 2009 by increasing wind turbine productivity,
particularly during lower wind speed periods. The following DOE chart shows capacity factor based on the
year in which a wind project was installed, indicating that capacity factors for new wind projects have
increased from around 33% as recently as 2012 to around 41% for projects installed in 2015. Many recent
wind projects have capacity factors approaching 50%.24
23 See page 2 at http://www.nrel.gov/docs/fy11osti/51860.pdf 24 https://emp.lbl.gov/sites/default/files/2015-windtechreport.final_.pdf, page 42
16
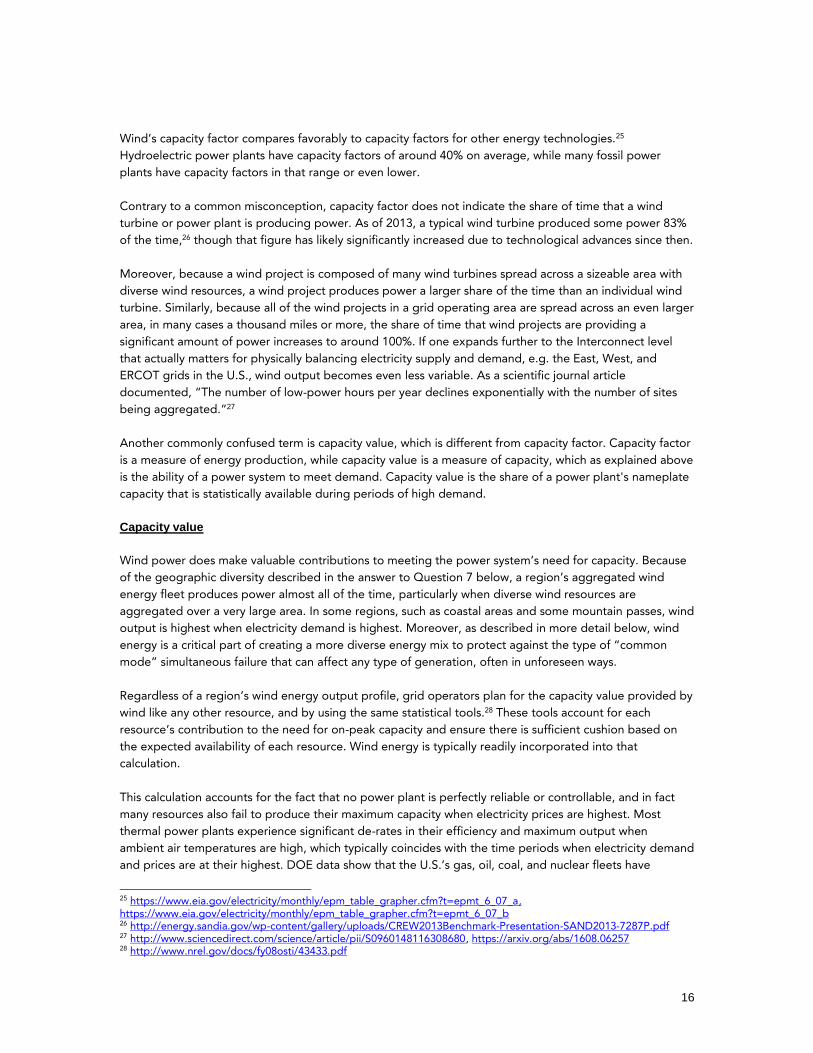
Wind’s capacity factor compares favorably to capacity factors for other energy technologies.25
Hydroelectric power plants have capacity factors of around 40% on average, while many fossil power
plants have capacity factors in that range or even lower.
Contrary to a common misconception, capacity factor does not indicate the share of time that a wind
turbine or power plant is producing power. As of 2013, a typical wind turbine produced some power 83%
of the time,26 though that figure has likely significantly increased due to technological advances since then.
Moreover, because a wind project is composed of many wind turbines spread across a sizeable area with
diverse wind resources, a wind project produces power a larger share of the time than an individual wind
turbine. Similarly, because all of the wind projects in a grid operating area are spread across an even larger
area, in many cases a thousand miles or more, the share of time that wind projects are providing a
significant amount of power increases to around 100%. If one expands further to the Interconnect level
that actually matters for physically balancing electricity supply and demand, e.g. the East, West, and
ERCOT grids in the U.S., wind output becomes even less variable. As a scientific journal article
documented, “The number of low-power hours per year declines exponentially with the number of sites
being aggregated.”27
Another commonly confused term is capacity value, which is different from capacity factor. Capacity factor
is a measure of energy production, while capacity value is a measure of capacity, which as explained above
is the ability of a power system to meet demand. Capacity value is the share of a power plant's nameplate
capacity that is statistically available during periods of high demand.
Capacity value
Wind power does make valuable contributions to meeting the power system’s need for capacity. Because
of the geographic diversity described in the answer to Question 7 below, a region’s aggregated wind
energy fleet produces power almost all of the time, particularly when diverse wind resources are
aggregated over a very large area. In some regions, such as coastal areas and some mountain passes, wind
output is highest when electricity demand is highest. Moreover, as described in more detail below, wind
energy is a critical part of creating a more diverse energy mix to protect against the type of “common
mode” simultaneous failure that can affect any type of generation, often in unforeseen ways.
Regardless of a region’s wind energy output profile, grid operators plan for the capacity value provided by
wind like any other resource, and by using the same statistical tools.28 These tools account for each
resource’s contribution to the need for on-peak capacity and ensure there is sufficient cushion based on
the expected availability of each resource. Wind energy is typically readily incorporated into that
calculation.
This calculation accounts for the fact that no power plant is perfectly reliable or controllable, and in fact
many resources also fail to produce their maximum capacity when electricity prices are highest. Most
thermal power plants experience significant de-rates in their efficiency and maximum output when
ambient air temperatures are high, which typically coincides with the time periods when electricity demand
and prices are at their highest. DOE data show that the U.S.’s gas, oil, coal, and nuclear fleets have
25 https://www.eia.gov/electricity/monthly/epm_table_grapher.cfm?t=epmt_6_07_a, https://www.eia.gov/electricity/monthly/epm_table_grapher.cfm?t=epmt_6_07_b 26 http://energy.sandia.gov/wp-content/gallery/uploads/CREW2013Benchmark-Presentation-SAND2013-7287P.pdf 27 http://www.sciencedirect.com/science/article/pii/S0960148116308680, https://arxiv.org/abs/1608.06257 28 http://www.nrel.gov/docs/fy08osti/43433.pdf

17
“summer capacities” that are 87%, 89%, 92%, and 95% respectively of their nameplate capacities. In
addition, all power plants occasionally experience forced outages that unexpectedly take them offline, and
these outages tend to happen with higher frequency during weather extremes that drive high electricity
demand. As discussed below, a prime example is the unexpected failure of more than 20% of PJM’s
conventional power plants during extreme cold and electricity demand in January 2014.29
As explained in the next section, grid operators only need a certain amount of flexibility to operate the
power system, so it is not necessary for all resources to be operated in a “dispatchable” manner so that
their output can be changed to accommodate changes in electricity supply and demand. Wind plants can
be operated dispatchably if necessary, but it is not typically economic to do so as other resources can
provide that dispatchability at lower cost. This situation is very similar to that of “baseload” conventional
resources: because both types of resources can provide low cost energy, it typically does not make
economic sense for them to forgo energy production so they can provide flexibility.
It should also be noted that most U.S. power systems currently have a surplus of capacity. This surplus of
capacity has primarily been driven by downward revisions in load growth forecasts and the addition of gas
capacity for the primary purpose of producing low-cost energy. The following chart from NERC’s most
recent reliability assessment shows that all regions are expected to have sufficient capacity through 2021,
with many regions including PJM experiencing double-digit surpluses above their reserve margin needs.
This capacity surplus is reflected by low prices in capacity markets that indicate capacity is not currently
needed or valuable. MISO’s most recent capacity market auction resulted in a clearing price of $1.50/MW-
day, down from $72.50/MW-day just last year. PJM capacity market prices are also low and expected to
continue declining, and PJM has stated that it has studied all announced power plant retirements and
found that they do not pose a reliability concern.30
For any power systems that do not have surplus capacity, additional capacity can be obtained at relatively
low cost through demand response and energy efficiency, the 45+ GW of new gas generation that is
29 http://www.pjm.com/~/media/library/reports-notices/weather-related/20140113-pjm-response-to-data-request-for-january%202014-weather-events.ashx 30 http://www.pjm.com/~/media/markets-ops/rpm/rpm-auction-info/2019-2020-base-residual-auction-report.ashx

18
already being built,31 or even retaining some existing generating capacity. Retaining capacity is often an
attractive option, as doing so only incurs a plant’s ongoing fixed costs and does not significantly affect
emissions because emissions are a product of energy production, not maintaining capacity. Going forward,
energy storage may also emerge as an economic option for providing capacity as well as other ancillary
services.
The lower value of capacity relative to energy is confirmed by a method the Department of Energy's
Energy Information Administration (EIA) has developed to quantify the value provided by different types of
power plants, accounting for differing levels of dispatchability (ability to change generation output),
capacity value (ability to meet peak electricity demand), integration costs, and time of energy
production. EIA’s calculation found that there is only a 10 percent difference, or a difference of about
$5/MWh, between the value provided by a wind plant and a more dispatchable gas plant.32
Most critically, EIA’s calculation shows that wind energy has an average economic value that is much
higher than the current cost of wind energy, indicating wind energy provides net benefits for consumers.
Of course, this calculation ignores the many other benefits that wind energy provides relative to other
energy sources, such as wind plants’ lack of fuel price risk, air emissions, water consumption and
withdrawals, and other factors.
Technology advances increasing renewable capacity factors are also increasing capacity value and
reducing variability
As discussed above, today's wind turbines are far more productive than those of just a few years ago. This
has reduced costs by improving capacity factors. However, new analysis shows that these advances have
had the additional benefits of reducing output variability and increasing wind's capacity value by
increasing output during low wind speed periods.33 Solar is experiencing similar increases in value due to
higher capacity factors from higher loading ratios on inverters and the use of tracking systems.
In ERCOT and SPP, which have seen the largest deployment of new wind turbines over the last several
years, these advanced turbine designs appear to have noticeably increased wind's contributions during
peak demand periods. For the peak demand periods in SPP in 2016, wind generation in the lowest 1
percent of wind output hours increased by a factor of three compared to the lowest output hours in 2013,
even though installed capacity increased by only a factor of 1.5. In ERCOT, the independent market
monitor noted that there was never less than 3,500 MW of wind available at any point during June 2016,
and ERCOT's director of operations noted that wind was generally providing in the range of 4,000 to
5,000 MW during the highest load periods.34
Renewable energy improves power system diversity
Renewables and gas generation are increasing the diversity of our energy mix, as shown in the following
chart of DOE data. Wind works well with other resources to build a balanced, resilient energy mix.
31 www.nerc.com/pa/RAPA/ra/Reliability Assessments DL/2014LTRA_ERATTA.pdf, page 18 32 https://www.eia.gov/outlooks/aeo/pdf/electricity_generation.pdf, page 10 33 http://neon-energie.de/Hirth-Mueller-2016-System-Friendly-Wind-Power.pdf, http://www.mjbradley.com/sites/default/files/Powering_Into_the_Future.pdf 34 https://www.rtoinsider.com/ercot-board-of-directors-reliability-must-run-30306/

19
The output patterns of wind and solar make them highly complementary resources. The diurnal and
seasonal patterns of wind and solar output are almost perfectly complementary: wind output is typically
highest at night and during winter, spring, and fall, while solar output is highest during the summer.
Weather patterns tend to cause wind and solar to have complementary output profiles as well - wind
output is typically lowest when a high pressure system is present, but solar output tends to be high as high
pressure systems are typically marked by cloudless days.
Renewables are also complementary with natural gas generation.35 Each resource has key attributes that
can symbiotically address potential concerns about the other technology’s reliability and price stability, as
shown in the table below. Natural gas prices are uncertain and variable over the long-term, while wind
energy enjoys perfect price stability because its fuel price is always zero. On the other hand, wind output is
more variable and uncertain over the grid operating timeframe, while the output of natural gas power
plants is highly flexible and dispatchable. Together, wind and gas provide an energy portfolio that better
meets the needs of consumers than either resource could provide individually. This finding was confirmed
by PJM's recent analysis, which found that portfolios with large amounts of wind and gas generation were
reliable and resilient to extreme weather, while many portfolios that did not include significant amounts of
wind failed the resiliency test.36
Positive Attributes Needs
Wind Stable price, high output during
winter heating season
Flexible capacity for easiest
integration
Gas Provides a low-cost source of
capacity and flexibility
Hedge against fuel price volatility
and gas supply and delivery
constraints during heating season
35 For more discussion, see http://awea.files.cms-plus.com/WEF_Wind%20Gas%20White%20Paper_031914.pdf 36 http://www.pjm.com/~/media/library/reports-notices/special-reports/20170330-pjms-evolving-resource-mix-and-system-reliability.ashx

20
Renewables are resilient to extreme weather
Given recent events in which many conventional power plants of the same type experienced unexpected
simultaneous “common mode” failures, portfolio diversity and resilience is also becoming an increasingly
important consideration. PJM’s recent analysis of power system reliability included testing the resilience of
future energy mixes to extreme events like the 2014 polar vortex. As discussed below, Wind performed
quite well during the polar vortex event, while many conventional power plants failed due to the cold
weather.37
Only around one-third of the reliable energy portfolios PJM analyzed passed the resiliency test.38
Portfolios with a large amount of wind energy tended to be more resilient because, as PJM noted, wind
energy possesses the unique benefit that “unavailability rates for wind are likely to decrease” under a
polar vortex event. Said another way, wind energy output tends to be above average when extreme
weather causes output from nearly all other energy sources to fall below expectations. That type of
negative correlation with the availability of other energy sources is the key to using portfolio diversity to
make the power system more resilient.
Interestingly, PJM’s results show wind energy complementing gas generation to contribute to resilience in
a way that is comparable to the contributions of coal and nuclear power plants. PJM found wind energy
played a large role in almost all of the scenarios that maintained resilience while retiring many coal and
nuclear power plants.
The need for PJM’s study to analyze resilience in addition to reliability highlights the fact that traditional
reliability planning measures do not fully capture the risk of many generators being taken offline
simultaneously by a single event. Almost all power system planning is based on the invalid assumption that
conventional power plant failures are random events, with no correlation between the failure of one
conventional power plant and another. As real-world reliability events like the polar vortex have shown,
that assumption overstates the reliability of conventional resources by ignoring the risk that many of them
will be forced offline simultaneously by correlated, common mode failures. However, wind and solar
resources are held to a higher standard, as the impact of weather and other correlated events on their
output profile is taken into account in analyses of their capacity value.
The portfolio diversity benefits of wind energy were particularly pronounced during the polar vortex event
as unexpected generator failures and fuel price spikes caused electricity prices to soar as many regions
faced record winter demand. Wind energy continued to produce at or above expectations with no
exposure to fuel price increases. The consumer savings from stably-priced wind generation totaled at least
$1 billion over two days in PJM alone, and wind helped to avert potentially severe reliability problems.39
During another cold snap in early January 2015, wind energy similarly provided record amounts of power
to grid operators in the Central and Eastern U.S. as they faced high demand due to extreme cold.40 These
events illustrate how wind plays a critical role in protecting consumers and reliability by diversifying our
energy mix:
37http://www.nerc.com/pa/rrm/January%202014%20Polar%20Vortex%20Review/Polar_Vortex_Review_29_Sept_2014_Final.pdf 38 http://www.pjm.com/~/media/library/reports-notices/special-reports/20170330-pjms-evolving-resource-mix-and-system-reliability.ashx 39 http://awea.files.cms-plus.com/AWEA%20Cold%20Snap%20Report%20Final%20-%20January%202015.pdf 40 http://www.utilitydive.com/news/wind-generation-hits-records-mitigates-price-spikes-during-cold-snap/351057/

21
Early on January 6, 2014, the Nebraska Public Power District met record winter electricity
demand with wind providing about 13% of its electricity. The utility explained that “Nebraskans
benefit from NPPD’s diverse portfolio of generating resources. Using a combination of fuels
means we deliver electricity using the lowest cost resources while maintaining high reliability for
our customers.” The utility also noted that “NPPD did not operate its natural gas generation
because the fuel costs were up more than 300 percent over typical prices.”41
On January 7, 2014, wind output was very high when the New York grid operator faced record
winter demand.42
On January 22 and 23, 2014, PJM electricity and natural gas prices skyrocketed to 10-50 times
normal due to extreme cold. Wind output was above 3,000 MW, saving consumers millions.43
As “a shortage of natural gas triggered by extreme cold weather” affected California on February
6, 2014, wind energy provided the state with around 2,000 MW at the time of peak demand, with
wind output above 2,500 MW for most of the rest of the evening.44 The state grid operator noted
that this wind output allowed it to avoid calling an energy emergency alert.45
NERC’s Polar Vortex Review identified fuel deliverability issues, natural gas pipeline outages, gas service
interruptions, and frozen electricity and gas equipment as key factors for generator unavailability during
the vortex, which threatened system reliability in multiple regions.46 While wind turbines did occasionally
experience outages due to the cold weather, the vast majority of the generators that failed to perform
were conventional power plants.
The story was the same in February 2011, when ERCOT noted wind energy’s role in keeping the lights on
when a cold snap caused many conventional power plants to fail.47 Notable examples of wind improving
reliability by increasing the diversity of the energy mix have also occurred in other countries.48
The portfolio diversity benefits of renewable energy can also be seen in how wind and solar helped to
cost-effectively maintain electric reliability during the California drought, making up for the vast majority of
the 1/3 decline in hydroelectric output.49
While the drought imposed major costs on the state’s agriculture and Californians in general, the drought
also posed challenges for electric reliability because various parts of the electricity system are dependent
on water. The California grid operator expected 1,370 MW to 1,669 MW (18-22 percent) of the state’s
7,666 MW of hydroelectric power plants to be unavailable to provide energy to meet peak system
demands during the summer of 2014.50 Moreover, the grid operator noted that 1,150 MW of the state’s
thermal power plants were at risk of having cooling water supply curtailments that summer.
41 http://www.nppd.com/2014/nebraska-customers-set-time-winter-peak-nppd/ 42 http://www.nyiso.com/public/webdocs/media_room/press_releases/2014/NYISO%20-%20Frigid%20Temperatures%20from%20Polar%20Vortex%20Drive%20Record%20Winter%20Demand%20-%2001_09_14%20-%20FINAL.pdf 43 http://www.pjm.com/markets-and-operations/ops-analysis.aspx 44 http://www.caiso.com/Documents/ISOissuesStatewideFlexAlert.pdf 45 SNL Energy article, Christine Cordner, “CAISO: Wind, demand response helped avoid February emergency alert,” March 21, 2014 46http://www.nerc.com/pa/rrm/January%202014%20Polar%20Vortex%20Review/Polar_Vortex_Review_29_Sept_2014_Final.pdf 47 Available at: http://www.texastribune.org/2011/02/04/an-interview-with-the-ceo-of-the-texas-grid/ 48 http://www.pjm.com/~/media/library/reports-notices/special-reports/20170330-pjms-evolving-resource-mix-and-
system-reliability.ashx, http://thinkprogress.org/climate/2014/08/12/3470140/wind-power-nuclear/ 49 https://www.eia.gov/electricity/data/browser/ 50 http://www.caiso.com/Documents/2014SummerAssessment.pdf
22
Renewable energy helped with this challenge in two direct ways. One of wind energy’s most overlooked
benefits is that it requires virtually no water to produce electricity, while almost all other electricity sources
evaporate tremendous amounts of water. In 2008, the nation’s thermal power plants consumed 1 to 2
trillion gallons of water.51 By displacing generation from these conventional power plants, U.S. wind
energy currently saves around 87 billion gallons of water per year, the equivalent of 266 gallons per
person or 657 billion bottles of water.52
In addition to directly offsetting freshwater consumption at thermal power plants, wind energy helps
combat the impacts of drought by allowing grid operators to save hydroelectric energy (in the form of
water behind dams) until they need it to meet grid reliability needs. A MWh of wind energy almost always
displaces a MWh that would have been produced by a fossil-fired power plant, though sometimes grid
operators use wind energy to store additional water behind dams where it can be used later to displace
fossil fuel generation. While a number of complex factors affect how dams use their water resources, the
abundant supply of renewable energy likely alleviated pressure on the operators’ need to use water to
produce electricity, helping them maintain reservoir levels so they could continue producing power and
providing grid reliability services. In addition, in most regions the variability of the wind energy resource
from year-to-year is much lower than that of the hydroelectric resource, so adding wind energy improves
the reliability and resilience of the electricity system, particularly in regions that obtain a large share of
their electricity from hydropower.
On-site fuel supply
On-site fuel supply is not a silver bullet for reliability, as all energy sources are vulnerable to interruptions.
If on-site fuel is deemed valuable, gas generators can be converted to dual-fuel capability or firm gas
transportation. New resources like demand response and energy storage are also immune to most of
these challenges.
In addition to the polar vortex event, PJM’s report discusses other weather events and other common
mode failures that have affected many power plants, including those with on-site fuel. Examples include
droughts that have limited fossil and nuclear power plants’ access to cooling water. Droughts and
sustained high temperatures in various parts of the U.S. have forced fossil and nuclear plants to operate at
reduced output or even go offline, while the recent drought in California greatly reduced the state’s
hydroelectric output.53 These high temperature and drought events also typically coincide with the periods
of highest electricity demand. Wind energy and solar photovoltaics continued to generate as expected
during these events, as they require no water to operate.
As also noted above, thermal generators are frequently de-rated and lose efficiency during heat waves,
due to the physical principle that the power produced by a thermal power plant decreases as the
temperature difference between the combustion side of the turbine and the outside temperature
decreases.
Fueled resources also face challenges of fuel delivery. Most notable are disruptions to gas supply and
delivery during periods of extreme cold and high demand, but coal plants are also vulnerable. For
example, several years ago many coal power plants in the Midwest were nearly forced offline when rail
shipments of coal were unable to get through because of railroad infrastructure congestion primarily
51 http://www.ucsusa.org/assets/documents/clean_energy/ew3/ew3-freshwater-use-by-us-power-plants.pdf 52 http://www.awea.org/wind-and-water 53 http://www.transmissionhub.com/articles/2012/01/ercot-drought-could-cause-problems-with-power-grid-in-2013.html, http://www.climatecentral.org/blogs/heat-and-drought-pose-risks-for-nuclear-power-plants,

23
caused by a spike in oil shipments via rail from the Bakken shale area. For power plants that receive coal
by barge, constraints can also come into play during periods of drought. Coal piles at power plants can
also freeze during cold and wet conditions.

24
5. Why are coal and nuclear plants facing economic
challenges?
Energy company regulatory filings and public statements,54 government data,55 and other experts56 agree
that low natural gas prices and flat electricity demand, and not policies to promote renewable energy, are the
main challenge facing coal and nuclear generators.
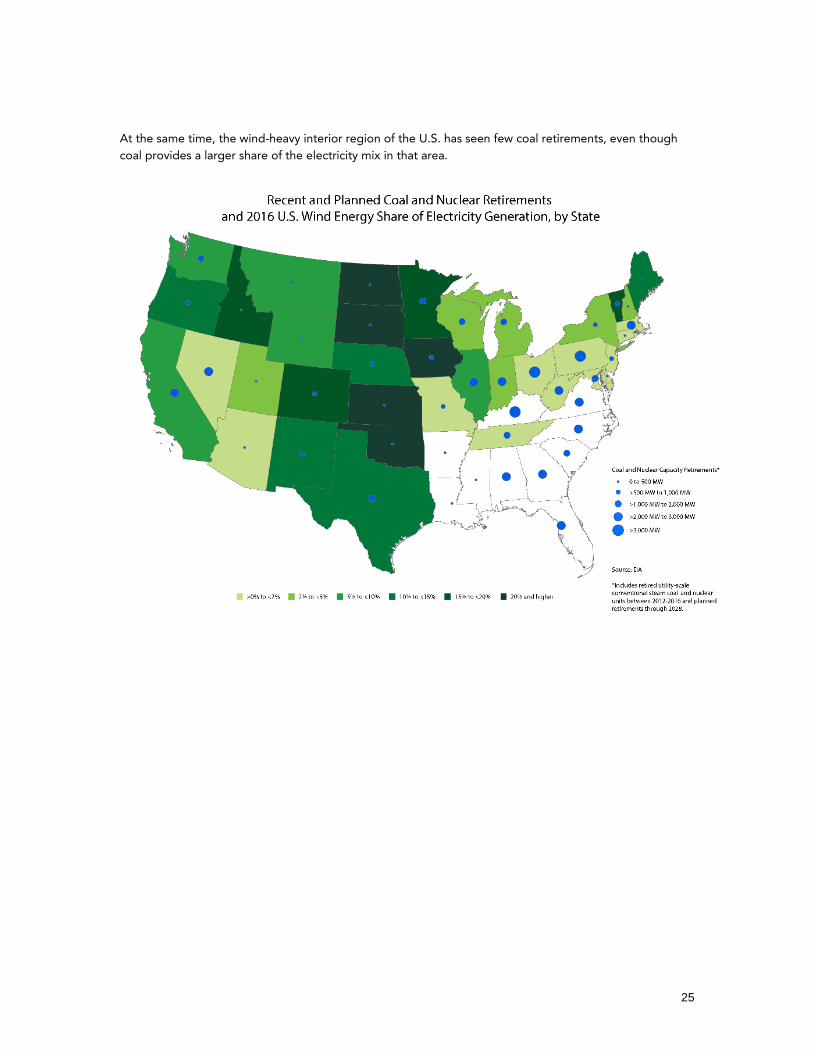
Some of the clearest evidence that renewable energy is not the main factor driving other energy sources’
market woes can be seen just by looking at where coal and nuclear power plants are retiring. Most retiring
coal and nuclear plants are in areas that have little to no renewable generation, as shown below.
54 For example, see “The decision by the utility owners of [Navajo Generating Station] is based on the rapidly changing
economics of the energy industry, which has seen natural gas prices sink to record lows and become a viable long-term
and economical alternative to coal power.” http://www.srpnet.com/newsroom/releases/021317.aspx
"Gas prices by far have the most dominant effect on the unregulated power sector in the US," Moody's said in a March
31, 2017, report. "Low natural gas prices have devastated most of the US merchant power sector because gas-fired
power plants often serve as the marginal plant during times of peak power demand," Moody's said. "Lower natural gas
prices have effectively driven down wholesale power prices for all generators, regardless of whether they are using
natural gas, coal, nuclear power or renewable resources to generate their electricity."
https://www.snl.com/web/client?auth=inherit#news/article?id=36007486&KeyProductLinkType=0&cdid=A-36007486-
11568 55 https://www.eia.gov/todayinenergy/detail.php?id=31172 56http://theconversation.com/are-solar-and-wind-really-killing-coal-nuclear-and-grid-reliability-76741,http://energypolicy.columbia.edu/sites/default/files/energy/Center%20on%20Global%20Energy%20Policy%20Can%20Coal%20Make%20a%20Comeback%20April%202017.pdf
25
At the same time, the wind-heavy interior region of the U.S. has seen few coal retirements, even though
coal provides a larger share of the electricity mix in that area.

26
Rather, the primary factor driving power plant retirements appears to be low-cost shale gas production
undercutting relatively high cost Appalachian and Illinois Basin coal in the Eastern U.S., as shown below. In
the regions shaded red in the map, the fuel cost of producing electricity from natural gas is significantly lower
than the fuel cost of coal power plants, explaining why utilities in those regions are moving from coal to
natural gas generation.57
Plotting the price of coal fuel against the price of gas fuel by state in the first chart below shows that,
unsurprisingly, the states where coal is uneconomic relative to gas have seen the most coal retirements.58
As shown in the second chart, most renewable-heavy states have below average coal retirements, while
most low renewable-use states have above average coal retirements, contradicting the claim that
renewables are a primary factor causing coal plant retirements.59
57 EIA AEO 2017 regional electric sector fuel prices for 2016, EIA coal retirement data 58 EIA 2015 coal and gas electric sector delivered price data, multiplied by EIA national average heat rates. Only states for which both coal and gas price data are available are shown. 59 2016 EIA generation data used for renewable penetration.

27

28
Wind has a relatively small impact on the economics of other power plants because wind energy rarely sets
the electricity market price. Fossil resources almost always set the market clearing price across wholesale
electricity markets, while wind almost never does. Market-wide in MISO in 2015, wind set electricity prices
only 1% of the time, versus natural gas power plants 76% and coal power plants 23% of the time.60 In PJM
in 2016, wind setting the market-wide clearing price only changed prices by $0.05/MWh, or 0.2% (1/500th)
of total prices, versus 45% for coal and 27% for natural gas.61
As a result, the price of fossil fuels has a direct impact on electricity prices, while wind does not.62
Importantly, this also means that renewable incentives like the production tax credit (PTC) are not directly
factored into electricity market prices, while subsidies for fossil generators that do set the market price are
factored into wholesale prices. Thus, fossil subsidies tend to have a far larger impact on electricity market
prices.
It is true that adding any low-cost source of energy to the power system reduces the price of electricity by
pushing the supply curve out.63 Pushing the supply curve out in this way is a market-based outcome that
occurs for any low-cost form of energy, whether nuclear, hydropower, or even coal, and is beneficial for
consumers. In fact, utilities, large corporations, and others routinely explain that they buy wind energy
precisely because it allows them to diversify their energy portfolio with a low-cost, stably-priced source of
energy.
Regardless of whether wind or solar plants receive tax credits or not, they have the same impact on prices
because they are always dispatched first due to their zero fuel cost. Removing incentives for renewable
generation would not have a significant direct impact on power prices. As discussed further in Chapter 12,
occasionally wind or solar do set market clearing prices, but that is typically due to localized transmission
constraints on remote parts of the grid where there are typically few, if any, other generators, so there is
little to no impact on the economics of other resources.
Negative electricity prices are rare, and many instances are not caused by wind energy.64 Nuclear,
hydroelectric, and coal power plants cause many instances of negative prices, mostly because the
inflexibility of these generators prevents them from reducing their output during periods of low electricity
demand. Some coal plants offer electricity at negative prices because they face economic penalties if they
do not take the minimum amount of coal required under coal delivery contracts.65
Wind energy and the renewable PTC are compatible with well-functioning electric power markets. The
myth that policies to promote wind have a significant impact on other generation was dismissed as a
“distraction” by former Federal Energy Regulatory Commission Commissioner Norris, based on evidence
that AWEA put forward in a March 2014 report that he called “compelling.”66 That report explained that
wind’s impact is market-driven, comparable to that of any low-cost generation, and small compared to
60https://www.misoenergy.org/Library/Repository/Report/IMM/2015%20State%20of%20the%20Market%20Analytical%20Appendix.pdf, page A-6 61 http://www.monitoringanalytics.com/reports/PJM_State_of_the_Market/2016/2016-som-pjm-volume2.pdf, page 161 62 http://theconversation.com/are-solar-and-wind-really-killing-coal-nuclear-and-grid-reliability-76741 63 The impact on additional low-cost energy supply on electricity market prices is currently small because many gas generators are competitive with coal generators due to low natural gas prices, flattening the supply curve. 64 In the ERCOT North zone in the second half of 2016, prices were negative only 0.7% of the time. 99% of those negative prices were negative by only a few dollars, indicating they were not set by PTC wind projects. http://mis.ercot.com/misapp/GetReports.do?reportTypeId=13061&reportTitle=Historical%20RTM%20Load%20Zone%20and%20Hub%20Prices&showHTMLView=&mimicKey 65 For more details, see http://www.aweablog.org/negative-prices-still-rare-mostly-caused-by-other-energy-sources/ 66 http://ferc.gov/media/statements-speeches/norris/2014/05-15-14-norris.asp; AWEA’s report and follow-up analysis is available at http://www.aweablog.org/blog/post/ferc-commissioner-exelon-attacks-on-ptc-a-distraction
29
other factors. Moreover, any effect of negative pricing on other generation has been virtually eliminated
by new transmission, and that will continue to be the case if workable policies to pro-actively plan and pay
for transmission are implemented.
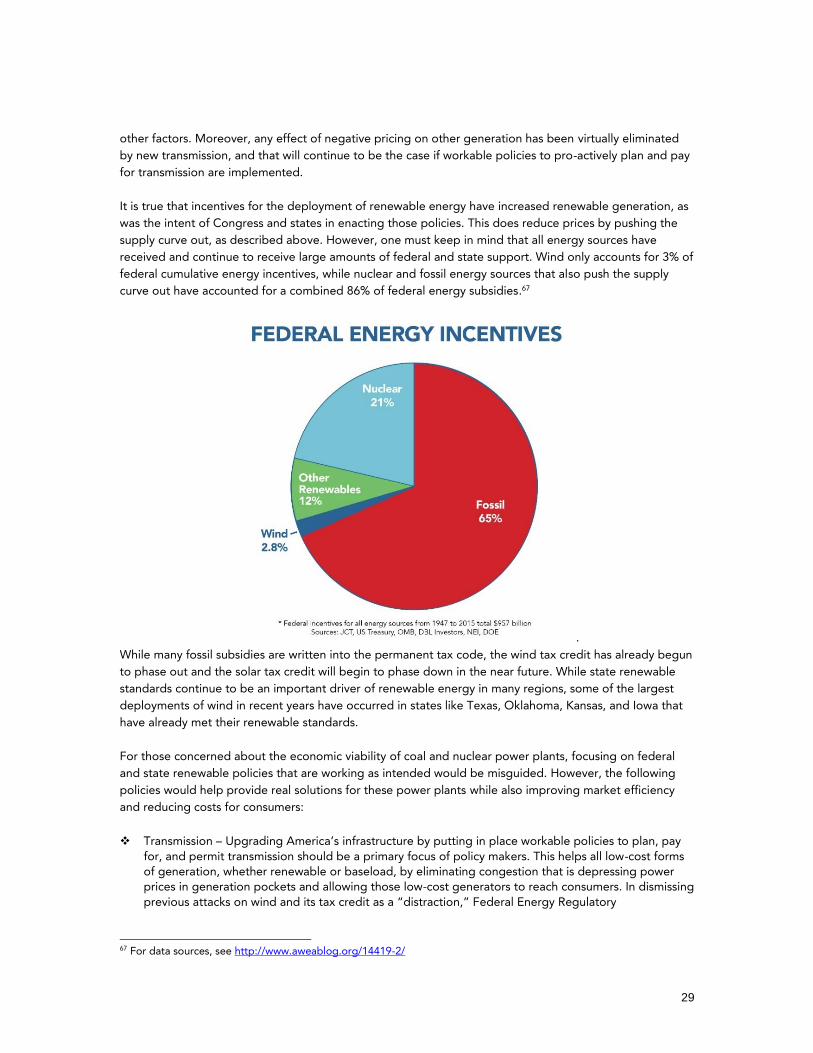
It is true that incentives for the deployment of renewable energy have increased renewable generation, as
was the intent of Congress and states in enacting those policies. This does reduce prices by pushing the
supply curve out, as described above. However, one must keep in mind that all energy sources have
received and continue to receive large amounts of federal and state support. Wind only accounts for 3% of
federal cumulative energy incentives, while nuclear and fossil energy sources that also push the supply
curve out have accounted for a combined 86% of federal energy subsidies.67
.
While many fossil subsidies are written into the permanent tax code, the wind tax credit has already begun
to phase out and the solar tax credit will begin to phase down in the near future. While state renewable
standards continue to be an important driver of renewable energy in many regions, some of the largest
deployments of wind in recent years have occurred in states like Texas, Oklahoma, Kansas, and Iowa that
have already met their renewable standards.
For those concerned about the economic viability of coal and nuclear power plants, focusing on federal
and state renewable policies that are working as intended would be misguided. However, the following
policies would help provide real solutions for these power plants while also improving market efficiency
and reducing costs for consumers:
Transmission – Upgrading America’s infrastructure by putting in place workable policies to plan, pay
for, and permit transmission should be a primary focus of policy makers. This helps all low-cost forms
of generation, whether renewable or baseload, by eliminating congestion that is depressing power
prices in generation pockets and allowing those low-cost generators to reach consumers. In dismissing
previous attacks on wind and its tax credit as a “distraction,” Federal Energy Regulatory
67 For data sources, see http://www.aweablog.org/14419-2/

30
Commissioner John Norris explained that “Transmission development is the better, and more
proactive, solution.”68
Markets – Better use of the existing grid through more efficient dispatch and the expansion of
markets will lower costs and more fairly allow all resources to compete.
Market design – Uplift costs and other costs associated with producing electricity should be brought
into the energy markets, which will raise prices and fully compensate resources. Further, seams issues
related to pricing and transacting between ISOs must be addressed. Markets must become more
precise in their procurement and compensation of reliability and ancillary services, and barriers to entry must be removed. Wind and other non-traditional resources can provide these services but
getting the market rules right is critical.
68 https://ferc.gov/media/statements-speeches/norris/2014/05-15-14-norris.asp

31
6. What about the reliability services provided by
conventional generation?
As wind energy has grown to provide a larger share of our electricity mix, wind turbine technology has
matured so that modern wind and solar plants are able to provide grid reliability services as well as or
better than conventional generators. Grid reliability services include various “ancillary services” that are
necessary for the efficient and reliable operation of the power system, such as voltage and reactive power
regulation and the ability to ride-through and respond to grid disturbances.
Wind and solar plants meet the same or higher reliability services standards as conventional power plants.
The wind industry has pushed for more stringent standards as it understands that for the industry to
continue its long-term growth, wind plants must contribute to power system reliability. In 2005 the wind
industry supported the introduction of a stringent requirement for wind plants to ride-through voltage and
frequency disturbances.69 This standard is more stringent than the standard that applies to conventional
power plants, and many conventional power plants cannot meet the standard that applies to wind. Last
year AWEA supported the more stringent reactive power requirements in FERC Order 827, and did not
oppose requiring wind plants to have primary frequency response capability in a recent FERC
rulemaking.70
Wind turbines and solar plants have power electronics and output controls that enable fast and accurate
voltage and frequency control, in many cases an order of magnitude faster than conventional power
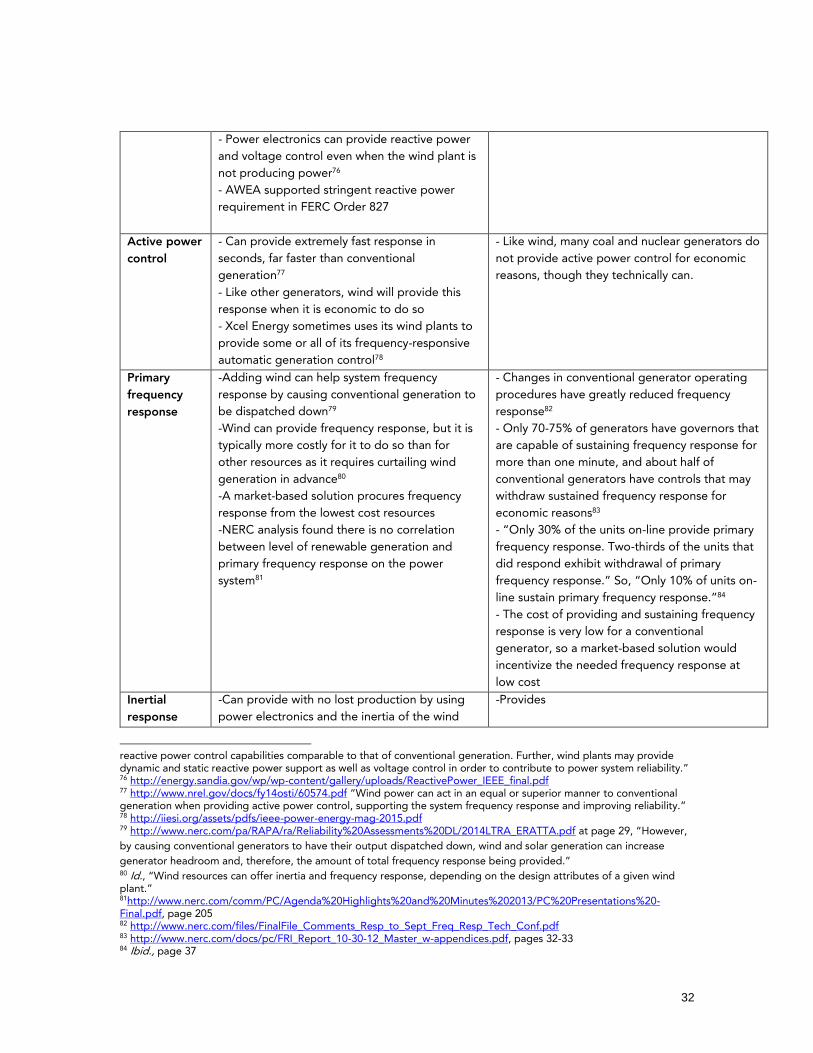
plants.71 As the North American Electric Reliability Corporation (NERC) has stated, “Modern wind turbine
generators can meet equivalent technical performance requirements provided by conventional generation
technologies with proper control strategies, system design, and implementation.”72 Regarding reliability
concerns, NERC has noted that “This issue does not exist for utility-scale wind energy, which offers ride-
through capabilities and other essential reliability services.”73 Detailed analyses show that essential
reliability services will be maintained at high renewable levels in both the Eastern and Western
Interconnections.74 Wind plants can provide frequency response, inertial response, active power control,
voltage and frequency ride-through, voltage and reactive power control, and other grid reliability needs:
Reliability
service
Wind Conventional generation
Ride-through - Excellent voltage and frequency ride-through
per FERC Order 661A requirements
- Power electronics electrically separate wind
turbine generators from grid disturbances,
providing them with much greater ability to
remain online through disturbances
- Many cannot match wind’s capabilities or meet
Order 661A ride-through requirements
Reactive and
voltage
control
- Wind turbine power electronics provide
reactive and voltage control equivalent to that
of conventional generators75
- Provides
69 https://www.ferc.gov/EventCalendar/Files/20051212171744-RM05-4-001.pdf 70 https://www.ferc.gov/whats-new/comm-meet/2016/061616/E-1.pdf, https://www.ferc.gov/whats-new/comm-meet/2016/111716/E-3.pdf 71 https://www.caiso.com/Documents/UsingRenewablesToOperateLow-CarbonGrid.pdf, http://www.nrel.gov/docs/fy14osti/60574.pdf 72 http://www.nerc.com/files/ivgtf_report_041609.pdf, page 22 73 http://www.nerc.com/pa/RAPA/ra/Reliability%20Assessments%20DL/2014LTRA_ERATTA.pdf at 15 74 http://www.nrel.gov/docs/fy15osti/62906.pdf, http://www.nrel.gov/docs/fy13osti/58077.pdf 75 http://www.nerc.com/files/ivgtf_report_041609.pdf, page 22, “As variable resources, such as wind power facilities, constitute a larger proportion of the total generation on a system, these resources may provide voltage regulation and
32
- Power electronics can provide reactive power
and voltage control even when the wind plant is
not producing power76
- AWEA supported stringent reactive power
requirement in FERC Order 827
Active power
control
- Can provide extremely fast response in
seconds, far faster than conventional
generation77
- Like other generators, wind will provide this
response when it is economic to do so
- Xcel Energy sometimes uses its wind plants to
provide some or all of its frequency-responsive
automatic generation control78
- Like wind, many coal and nuclear generators do
not provide active power control for economic
reasons, though they technically can.
Primary
frequency
response
-Adding wind can help system frequency
response by causing conventional generation to
be dispatched down79
-Wind can provide frequency response, but it is
typically more costly for it to do so than for
other resources as it requires curtailing wind
generation in advance80
-A market-based solution procures frequency
response from the lowest cost resources
-NERC analysis found there is no correlation
between level of renewable generation and
primary frequency response on the power
system81
- Changes in conventional generator operating
procedures have greatly reduced frequency
response82
- Only 70-75% of generators have governors that
are capable of sustaining frequency response for
more than one minute, and about half of
conventional generators have controls that may
withdraw sustained frequency response for
economic reasons83
- “Only 30% of the units on-line provide primary
frequency response. Two-thirds of the units that
did respond exhibit withdrawal of primary
frequency response.” So, “Only 10% of units on-
line sustain primary frequency response.”84
- The cost of providing and sustaining frequency
response is very low for a conventional
generator, so a market-based solution would
incentivize the needed frequency response at
low cost
Inertial
response
-Can provide with no lost production by using
power electronics and the inertia of the wind
-Provides
reactive power control capabilities comparable to that of conventional generation. Further, wind plants may provide dynamic and static reactive power support as well as voltage control in order to contribute to power system reliability.” 76 http://energy.sandia.gov/wp/wp-content/gallery/uploads/ReactivePower_IEEE_final.pdf 77 http://www.nrel.gov/docs/fy14osti/60574.pdf “Wind power can act in an equal or superior manner to conventional generation when providing active power control, supporting the system frequency response and improving reliability.” 78 http://iiesi.org/assets/pdfs/ieee-power-energy-mag-2015.pdf 79 http://www.nerc.com/pa/RAPA/ra/Reliability%20Assessments%20DL/2014LTRA_ERATTA.pdf at page 29, “However,
by causing conventional generators to have their output dispatched down, wind and solar generation can increase
generator headroom and, therefore, the amount of total frequency response being provided.” 80 Id., “Wind resources can offer inertia and frequency response, depending on the design attributes of a given wind plant.” 81http://www.nerc.com/comm/PC/Agenda%20Highlights%20and%20Minutes%202013/PC%20Presentations%20-Final.pdf, page 205 82 http://www.nerc.com/files/FinalFile_Comments_Resp_to_Sept_Freq_Resp_Tech_Conf.pdf 83 http://www.nerc.com/docs/pc/FRI_Report_10-30-12_Master_w-appendices.pdf, pages 32-33 84 Ibid., page 37
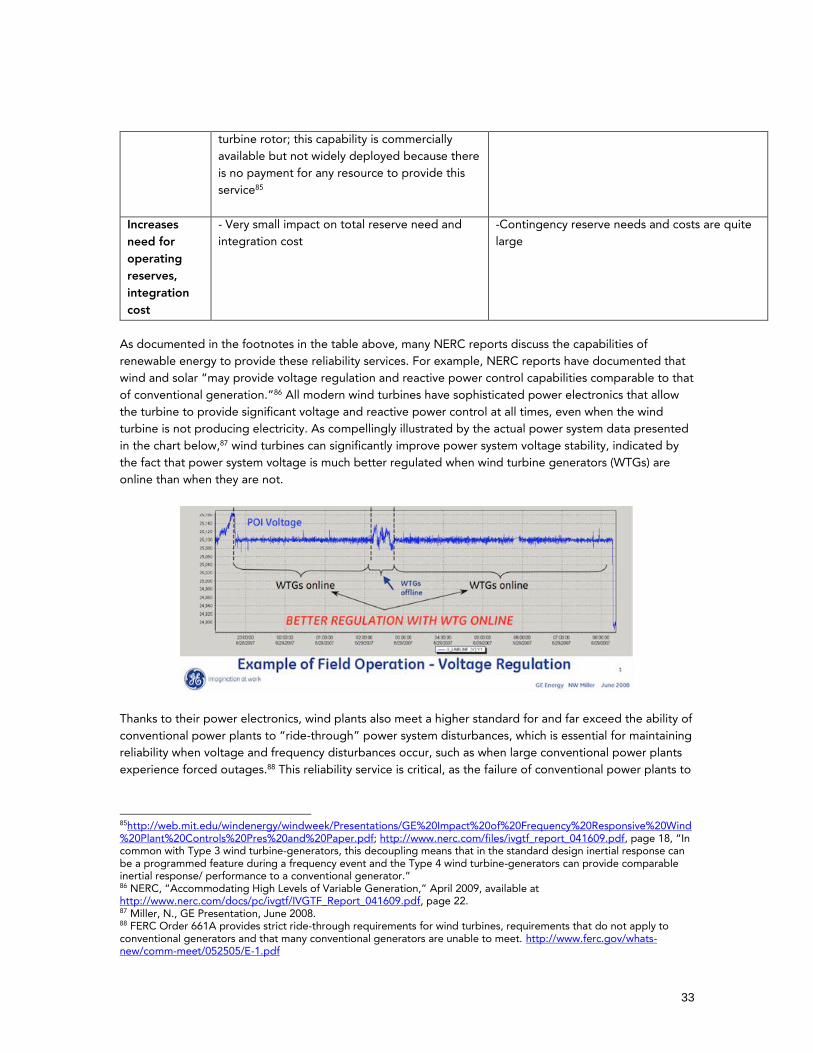
33
turbine rotor; this capability is commercially
available but not widely deployed because there
is no payment for any resource to provide this
service85
Increases
need for
operating
reserves,
integration
cost
- Very small impact on total reserve need and
integration cost
-Contingency reserve needs and costs are quite
large
As documented in the footnotes in the table above, many NERC reports discuss the capabilities of
renewable energy to provide these reliability services. For example, NERC reports have documented that
wind and solar “may provide voltage regulation and reactive power control capabilities comparable to that
of conventional generation.”86 All modern wind turbines have sophisticated power electronics that allow
the turbine to provide significant voltage and reactive power control at all times, even when the wind
turbine is not producing electricity. As compellingly illustrated by the actual power system data presented
in the chart below,87 wind turbines can significantly improve power system voltage stability, indicated by
the fact that power system voltage is much better regulated when wind turbine generators (WTGs) are
online than when they are not.
Thanks to their power electronics, wind plants also meet a higher standard for and far exceed the ability of
conventional power plants to “ride-through” power system disturbances, which is essential for maintaining
reliability when voltage and frequency disturbances occur, such as when large conventional power plants
experience forced outages.88 This reliability service is critical, as the failure of conventional power plants to
85http://web.mit.edu/windenergy/windweek/Presentations/GE%20Impact%20of%20Frequency%20Responsive%20Wind%20Plant%20Controls%20Pres%20and%20Paper.pdf; http://www.nerc.com/files/ivgtf_report_041609.pdf, page 18, “In common with Type 3 wind turbine-generators, this decoupling means that in the standard design inertial response can be a programmed feature during a frequency event and the Type 4 wind turbine-generators can provide comparable inertial response/ performance to a conventional generator.” 86 NERC, “Accommodating High Levels of Variable Generation,” April 2009, available at http://www.nerc.com/docs/pc/ivgtf/IVGTF_Report_041609.pdf, page 22. 87 Miller, N., GE Presentation, June 2008. 88 FERC Order 661A provides strict ride-through requirements for wind turbines, requirements that do not apply to conventional generators and that many conventional generators are unable to meet. http://www.ferc.gov/whats-new/comm-meet/052505/E-1.pdf

34
ride-through grid disturbances has played at least a contributing role in several recent blackouts and
reliability events.89
Regarding inertia and system stability, analysis by WECC in 2013 found that in a scenario with very high
renewable penetration across the West, “the system results did not identify any adverse impacts due to
the lower system inertia or differently stressed paths due to the higher penetration of variable generation
resources.” Analysis conducted for the California grid operator identified no major concerns for frequency
response in a transition to a high renewable future, finding that “[n]one of the credible conditions
examined, even cases with significantly high levels of wind and solar generation (up to 50% penetration in
California), resulted in under-frequency load shedding (ULFS) or other stability problems.”90 Adding wind
generation can increase total power system frequency response by causing conventional power plants to
have their output reduced, which provides them with more range to increase their output and provide
frequency response.91
Balancing the power system with wind and solar
New techniques employing wind and solar plants’ sophisticated controls and power electronics enable
renewable plants themselves to provide fast-acting frequency regulation. NREL and the California grid
operator recently examined how solar plants can provide dispatchability and other reliability services.92
Another NREL report found that “wind power can act in an equal or superior manner to conventional
generation when providing active power control, supporting the system frequency response and
improving reliability.”93 There is the opportunity cost of lost production from using wind and solar plants in
this way, though in some hours it can be the most cost-effective source of flexibility on the power system.
NREL’s report documented how major utilities like Xcel Energy are using this capability of wind plants in
some hours to provide some or all of the frequency response and regulation needed to maintain power
system reliability, which has enabled Xcel’s Colorado power system to at times reliably obtain more than
60 percent of its electricity from wind energy. The following chart shows that the total imbalance of
electricity supply and demand, or Area Control Error (ACE), is tightly controlled when wind plants provide
frequency regulation on Xcel’s power system.94
89 https://www.rtoinsider.com/pjm-utility-dc-area-outage-14217/ 90 Available at http://www.caiso.com/Documents/Report-FrequencyResponseStudy.pdf 91http://web.mit.edu/windenergy/windweek/Presentations/GE%20Impact%20of%20Frequency%20Responsive%20Wind%20Plant%20Controls%20Pres%20and%20Paper.pdf 92 https://www.caiso.com/Documents/UsingRenewablesToOperateLow-CarbonGrid.pdf 93 Available at http://www.nrel.gov/docs/fy14osti/60574.pdf 94 http://iiesi.org/assets/pdfs/ieee-power-energy-mag-2015.pdf
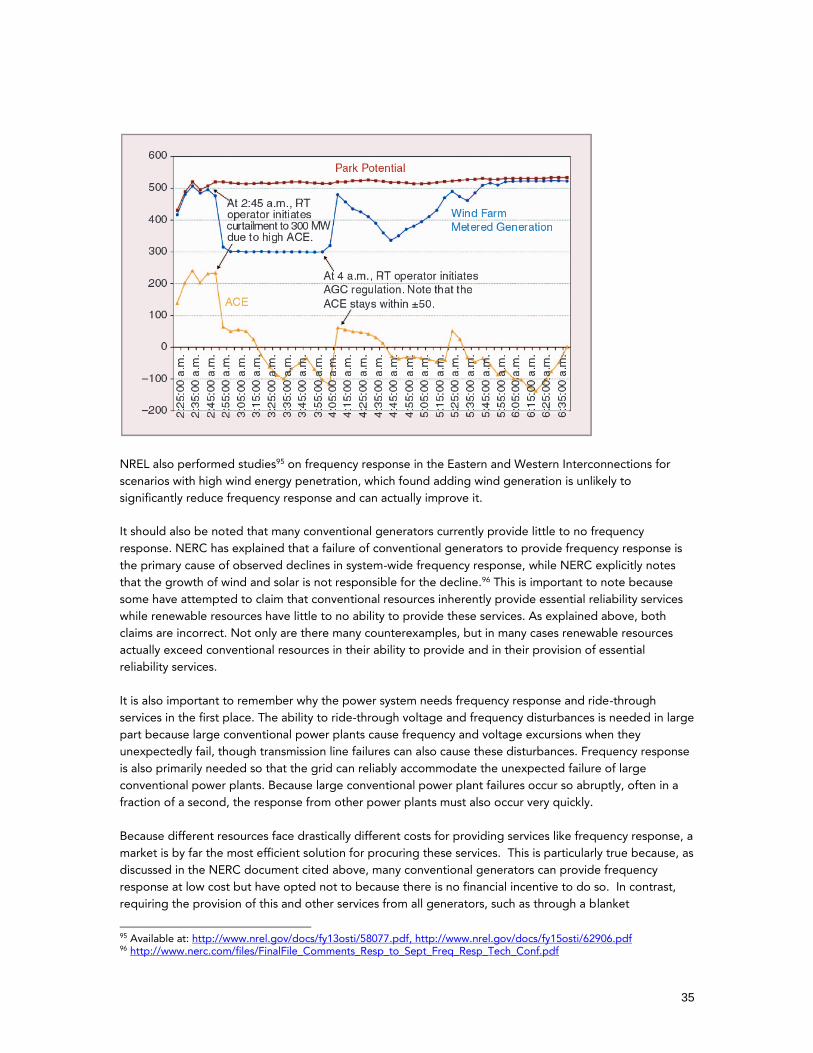
35
NREL also performed studies95 on frequency response in the Eastern and Western Interconnections for
scenarios with high wind energy penetration, which found adding wind generation is unlikely to
significantly reduce frequency response and can actually improve it.
It should also be noted that many conventional generators currently provide little to no frequency
response. NERC has explained that a failure of conventional generators to provide frequency response is
the primary cause of observed declines in system-wide frequency response, while NERC explicitly notes
that the growth of wind and solar is not responsible for the decline.96 This is important to note because
some have attempted to claim that conventional resources inherently provide essential reliability services
while renewable resources have little to no ability to provide these services. As explained above, both
claims are incorrect. Not only are there many counterexamples, but in many cases renewable resources
actually exceed conventional resources in their ability to provide and in their provision of essential
reliability services.
It is also important to remember why the power system needs frequency response and ride-through
services in the first place. The ability to ride-through voltage and frequency disturbances is needed in large
part because large conventional power plants cause frequency and voltage excursions when they
unexpectedly fail, though transmission line failures can also cause these disturbances. Frequency response
is also primarily needed so that the grid can reliably accommodate the unexpected failure of large
conventional power plants. Because large conventional power plant failures occur so abruptly, often in a
fraction of a second, the response from other power plants must also occur very quickly.
Because different resources face drastically different costs for providing services like frequency response, a
market is by far the most efficient solution for procuring these services. This is particularly true because, as
discussed in the NERC document cited above, many conventional generators can provide frequency
response at low cost but have opted not to because there is no financial incentive to do so. In contrast,
requiring the provision of this and other services from all generators, such as through a blanket
95 Available at: http://www.nrel.gov/docs/fy13osti/58077.pdf, http://www.nrel.gov/docs/fy15osti/62906.pdf 96 http://www.nerc.com/files/FinalFile_Comments_Resp_to_Sept_Freq_Resp_Tech_Conf.pdf

36
requirement written into interconnection standards, would unnecessarily impose major costs by requiring
resources that cannot cost-effectively provide these services to do so.
Markets would also appropriately incentivize resources that can cost-effectively provide these services to
do so. For example, technology that allows wind turbines to provide inertial response is commercially
available, but purchasers are not asking for them because there is no financial incentive for providing these
services. Similarly, while under most conditions it may not be cost-effective for wind generators to provide
frequency regulation and response, markets send the appropriate price signal and ensure that the least-
cost resources are selected to provide these services.

37
7. What about the variability of renewable energy?
Variability and uncertainty are nothing new for grid operators, as they have always dealt
with large and unexpected fluctuations in electricity supply and demand. Since the days of
Thomas Edison, grid operators have had to constantly accommodate variability in electricity demand and
supply by increasing and decreasing the output of flexible generators – power plants like hydroelectric
dams or natural gas plants that can change their level of generation. Thus, the water kept behind a dam or
the natural gas held in a pipeline may be thought of as a form of energy storage, with operators using this
energy when it is needed and "storing" it when it is not. For a video illustrating the balancing act of
electricity supply and demand, see: https://www.youtube.com/watch?v=gSiCRZcJnfE.
Grid variability and uncertainty
Electricity demand fluctuates unpredictably in response to factory equipment coming on and offline,
residential users turning electric appliances on, and changes in weather as people turn on air conditioners
and heaters. The chart below illustrates how power system frequency in Texas fluctuated during the 2017
Super Bowl, with declines in frequency occurring during breaks in the game, presumably because demand
spiked as people used appliances.97
Grid operators have always kept large quantities of fast-acting generation in reserve to respond to
fluctuations in demand as well as the instantaneous and unpredictable failures of large conventional power
plants, a challenge and cost that is far greater than accommodating any incremental variability added by
the gradual and predictable changes in the aggregate output of renewable energy. Grid operators use
these same flexible resources to accommodate any incremental variability introduced by renewable energy
that is not canceled out by other changes in electricity supply or demand.
Over the last century, grid operators moved to larger interstate power systems so that changes like an
increase in electricity demand caused by a factory coming online would be offset by decreases in
electricity demand occurring elsewhere, or an unexpected outage at a power plant could be compensated
for by a power plant several states away. The grid remains reliable even though it takes power from many
sources that vary over time, just like the Mississippi River takes water from many varying tributaries yet
keeps a steady flow into the Gulf of Mexico.
This diversity benefit provides even greater value for wind energy because a region’s wind plants are
experiencing different weather at any one point in time. Just as a customer in Washington DC turning on
their air conditioner is canceled out by a customer in Chicago turning theirs off, output changes at one
97 Email, M. Grady, University of Texas at Austin

38
wind plant are often offset by an opposite change at another wind plant. Furthermore, most output
changes for the total wind fleet are canceled out by other changes in electricity supply and demand,
mostly by random fluctuations in electricity demand.
Because wind turbines are spread across a large area, it typically takes many hours for a weather event to
affect a large share of a region’s wind output. Changes in total wind energy output occur very slowly, even
though the winds may change fairly rapidly at any one location. The diversity of wind energy output can be
seen in this real-time map of wind speeds: http://hint.fm/wind/. NREL’s Renewable Energy Futures study,
which examined a future in which nearly 50% of electricity is reliably provided by wind and solar, also
shows the value of this diversity. For a sample of the study’s modeling of hourly electricity supply at nearly
50% wind and solar energy, see: https://www.youtube.com/watch?v=fQl7PS243Dg NREL has recently
completed more detailed analysis examining high wind and solar penetrations in the Eastern U.S.; videos
of their work are available here: https://www.nrel.gov/grid/ergis.html
A key part of the solution is that weather forecasting makes changes in wind energy output predictable,
unlike the abrupt outages at conventional power plants that can take 1,000 MW or more offline
instantaneously. Wind energy forecasting greatly reduces uncertainty about what wind energy output will
be over the next day or more. The use of weather forecasting to reduce uncertainty is also nothing new for
grid operators, as grid operators already use weather forecasting to predict how electricity demand will be
driven by consumers running their air conditioners or heaters.
Thus, contrary to most people’s intuitive experience that winds are highly variable and electricity demand
and supply is fairly stable, the opposite is actually true at the grid operator level. Data from the PJM
independent grid operator illustrate this fact. The largest hourly changes in electricity demand are typically
about 10 times larger than the largest hourly changes in wind energy output, even though PJM has over
7,000 MW of wind energy on its system.98
A tremendous amount of flexibility has been built into the power system to accommodate these large and
abrupt swings in electricity supply and demand. Demand for electricity can vary by a factor of three or
more depending on the time of day and year, which nationwide translates into hundreds of gigawatts of
flexibility that are already built into the power system. Because of this existing flexibility, there is almost
never a need to build new power plants to accommodate any incremental increase in variability caused by
adding renewable energy. Any increase in the need for operating reserves is met by simply making greater
use of existing flexible resources.
Grid operators accommodate variability using different types of “operating reserves,” which are provided
by flexible resources. As described in more detail under Question 8 below, “regulating reserves” are the
fast-acting reserves for accommodating moment-to-moment variability in electricity supply and demand.
Grid operators also use fast-acting “contingency reserves” to accommodate unexpected and abrupt
failures of large conventional generators. These fast-acting reserves are typically provided by operating
power plants changing their level of output.
Slower-acting reserves can be provided by a much larger group of resources, often including power plants
that are offline but can start up on short notice. These “non-spinning” reserves typically cost far less than
the fast-acting reserves provided by operating power plants. This is important because it means that the
gradual and predictable changes in wind output are much less costly to accommodate than the
98 http://www.pjm.com/markets-and-operations/ops-analysis.aspx, http://www.pjm.com/markets-and-operations/energy/real-time/loadhryr.aspx

39
instantaneous and unpredictable outages that occur at large conventional power plants, which require grid
operators to hold expensive fast-acting reserves 24/7/365.
Wind variability and uncertainty
Several charts derived from wind integration studies and actual grid operating experience help illustrate
the variability and uncertainty of wind energy and how they interact with other sources of variability and
uncertainty. The first chart shows that as the distance between two wind plants increases, it becomes more
likely that their output is not changing in the same direction.99 This makes sense, because few weather
systems are large enough and aligned in such a way that they could affect more than a small number of
wind plants simultaneously. As a result, it becomes likely that changes in their output will offset each other.
Importantly, the chart shows that for the 5-minute timeframe covered by the fast-acting and most
expensive regulating reserves, even a dozen or so miles between two wind plants is enough to make it
likely that changes in one wind plant’s output will cancel out changes in the other plant’s output. This
offsetting impact, combined with the fact that electricity demand contributes far more total variability at
the 5-minute timescale than wind, explains why wind generation only minimally contributes to the need for
fast-acting regulating reserves.
Because wind plant output changes are not correlated across large areas,
these output changes cancel each other out
99 https://www.ieawind.org/annex_XXV/PDF/Final%20Report%20Task%2025%202008/T2493.pdf, page 25
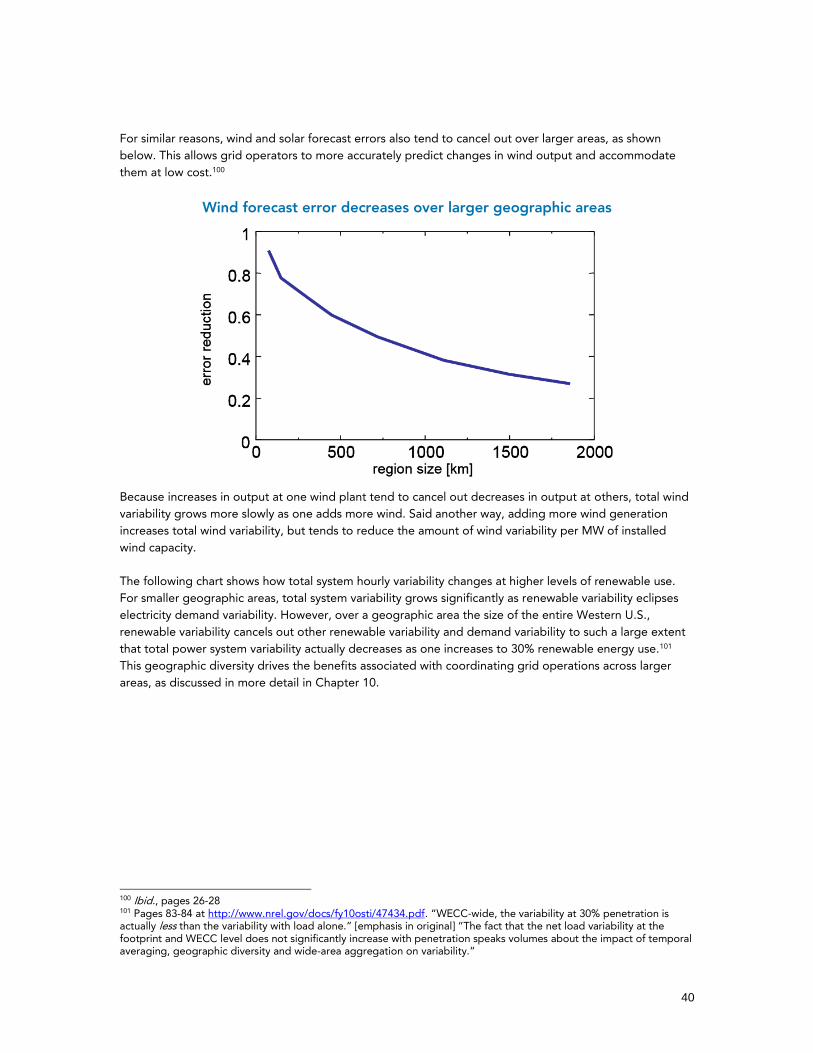
40
For similar reasons, wind and solar forecast errors also tend to cancel out over larger areas, as shown
below. This allows grid operators to more accurately predict changes in wind output and accommodate
them at low cost.100
Wind forecast error decreases over larger geographic areas
Because increases in output at one wind plant tend to cancel out decreases in output at others, total wind
variability grows more slowly as one adds more wind. Said another way, adding more wind generation
increases total wind variability, but tends to reduce the amount of wind variability per MW of installed
wind capacity.
The following chart shows how total system hourly variability changes at higher levels of renewable use.
For smaller geographic areas, total system variability grows significantly as renewable variability eclipses
electricity demand variability. However, over a geographic area the size of the entire Western U.S.,
renewable variability cancels out other renewable variability and demand variability to such a large extent
that total power system variability actually decreases as one increases to 30% renewable energy use.101
This geographic diversity drives the benefits associated with coordinating grid operations across larger
areas, as discussed in more detail in Chapter 10.
100 Ibid., pages 26-28 101 Pages 83-84 at http://www.nrel.gov/docs/fy10osti/47434.pdf. “WECC‐wide, the variability at 30% penetration is actually less than the variability with load alone.” [emphasis in original] “The fact that the net load variability at the footprint and WECC level does not significantly increase with penetration speaks volumes about the impact of temporal averaging, geographic diversity and wide-area aggregation on variability.”

41
Change in total power system variability
based on renewable use level and size of geographic area
Dozens of grid operator studies and years of real-world operating experience confirm that wind energy
only slightly adds to total power system variability, and that most changes in wind energy output are
canceled out by opposite changes in electricity supply and demand.102 Because demand is a far larger
contributor to total fast variability, changes in wind output on the minute-to-minute are typically canceled
out and have minimal impact on total system fast variability.
Variability in wind and solar does not need to be managed on a stand-alone basis. Rather, the grid
operator is only concerned about managing the combined variability of all sources of supply and demand.
This greatly reduces the cost and challenge of accommodating variability, as the total variability is less than
the sum of its parts. As an analogy, it would be highly inefficient and counterproductive to have a battery
or power plant accommodating changes in the electricity demand at your house as you turn appliances on
and off, as nearly all of those changes are canceled out by other changes on the aggregate grid, whether
caused by your neighbor or someone 500 miles away turning their TV off as you turn yours on.
The table below shows that the regulating reserve need for wind is much smaller than the contingency
reserve need for conventional generation. The results are consistent, and surprising. For example, the
ERCOT (Texas) and MISO (Upper Midwest) grid operators each reliably accommodate more than 10,000
MW of wind energy on their power systems. These significant levels of wind penetration are being
accomplished with limited amount of reserves, with ERCOT finding that amount of wind is reliably
accommodated with less than 50 MW of additional fast-acting reserves.103 ERCOT has also noted that it
has been able to integrate renewable energy with a “minimal increase” in operating reserves.104 Similarly,
102 https://www.uvig.org/resources/ 103 http://www.wspp.org/filestorage/panel_1_maggio_ercot 104http://www.ercot.com/content/committees/other/fast/keydocs/2014/ERCOT_AS_Concept_Paper_Version_1.1_as_of_11-01-13_1445_black.doc , page 8
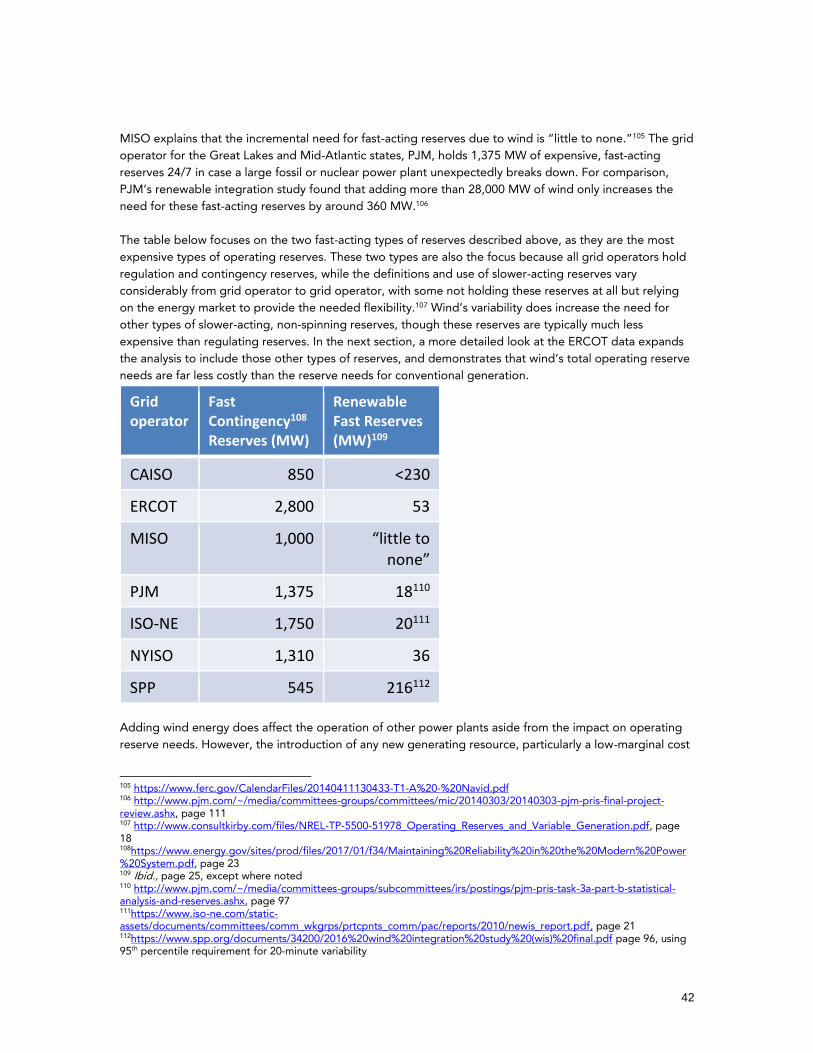
42
MISO explains that the incremental need for fast-acting reserves due to wind is “little to none.”105 The grid
operator for the Great Lakes and Mid-Atlantic states, PJM, holds 1,375 MW of expensive, fast-acting
reserves 24/7 in case a large fossil or nuclear power plant unexpectedly breaks down. For comparison,
PJM’s renewable integration study found that adding more than 28,000 MW of wind only increases the
need for these fast-acting reserves by around 360 MW.106
The table below focuses on the two fast-acting types of reserves described above, as they are the most
expensive types of operating reserves. These two types are also the focus because all grid operators hold
regulation and contingency reserves, while the definitions and use of slower-acting reserves vary
considerably from grid operator to grid operator, with some not holding these reserves at all but relying
on the energy market to provide the needed flexibility.107 Wind’s variability does increase the need for
other types of slower-acting, non-spinning reserves, though these reserves are typically much less
expensive than regulating reserves. In the next section, a more detailed look at the ERCOT data expands
the analysis to include those other types of reserves, and demonstrates that wind’s total operating reserve
needs are far less costly than the reserve needs for conventional generation.
Grid operator
Fast Contingency108 Reserves (MW)
Renewable Fast Reserves (MW)109
CAISO 850 <230
ERCOT 2,800 53
MISO 1,000 “little to none”
PJM 1,375 18110
ISO-NE 1,750 20111
NYISO 1,310 36
SPP 545 216112
Adding wind energy does affect the operation of other power plants aside from the impact on operating
reserve needs. However, the introduction of any new generating resource, particularly a low-marginal cost
105 https://www.ferc.gov/CalendarFiles/20140411130433-T1-A%20-%20Navid.pdf 106 http://www.pjm.com/~/media/committees-groups/committees/mic/20140303/20140303-pjm-pris-final-project-review.ashx, page 111 107 http://www.consultkirby.com/files/NREL-TP-5500-51978_Operating_Reserves_and_Variable_Generation.pdf, page 18 108https://www.energy.gov/sites/prod/files/2017/01/f34/Maintaining%20Reliability%20in%20the%20Modern%20Power%20System.pdf, page 23 109 Ibid., page 25, except where noted 110 http://www.pjm.com/~/media/committees-groups/subcommittees/irs/postings/pjm-pris-task-3a-part-b-statistical-analysis-and-reserves.ashx, page 97 111https://www.iso-ne.com/static-assets/documents/committees/comm_wkgrps/prtcpnts_comm/pac/reports/2010/newis_report.pdf, page 21 112https://www.spp.org/documents/34200/2016%20wind%20integration%20study%20(wis)%20final.pdf page 96, using 95th percentile requirement for 20-minute variability

43
resource like wind energy, similarly affects the operations of other resources. Moreover, much of this
impact is the intentional benefit that wind generation should displace more expensive and polluting forms
of energy, and it is difficult if not impossible to disentangle that impact from wind’s other impacts on those
generators.113 A further complicating factor is that each grid operator uses different methods for
accommodating slower sources of variability and uncertainty, with some using the energy market to
provide the flexibility and others using reserve products. As a result, this paper does not attempt to
address those issues beyond what has already been discussed by others.114
Returning to the operating reserve table above, a powerful yet under-appreciated mathematical principle
explains why wind variability contributes little to total power system variability. Two sources of
uncorrelated variability cancel each other out such that the total variability is much less than the sum of the
parts. Fortuitously, wind variability and electricity demand variability are uncorrelated at sub-hourly
timescales. Mathematically, total variability is the square root of the sum of the squares of the individual
variabilities, or sqrt(x2+y2). As an example, if the variability of electricity demand is 10 MW and the
variability of wind generation is 5 MW, the total variability is not 15 MW, but rather sqrt(100+25) = 11.18
MW. So in this example, adding 5 MW of wind variability only increased total system variability by 1.18
MW, with the other roughly 4 MW of variability canceled out by counteracting demand variability.
The efficiency with which grid operators manage wind variability by aggregating it with all other sources of
variability was concisely summed up by an analyst for the International Energy Agency:
“Variability is not just some new phenomenon in grid management. What we found is that renewable
energy is not fundamentally different. The criticisms of renewables often neglect the complementarities
between different technologies and the way they can balance each other out if spread over certain regions
and energy types.
“Grid operators are constantly working to balance available supply with demand – it’s what they do. There
are always natural variations that cause spikes in demand, reductions in supply or create disturbances in
frequency and voltage. Once you see there are a variety of ways to properly manage that variability, you
start whittling away at the argument that you always need storage or a megawatt of natural gas backup for
every megawatt of renewable energy.”115
113 http://www.nrel.gov/docs/fy11osti/51860.pdf, pages 6-11 114 Id. 115 http://thinkprogress.org/climate/2011/06/15/245880/top-5-coolest-ways-companies-are-integrating-renewable-energy-into-the-grid/
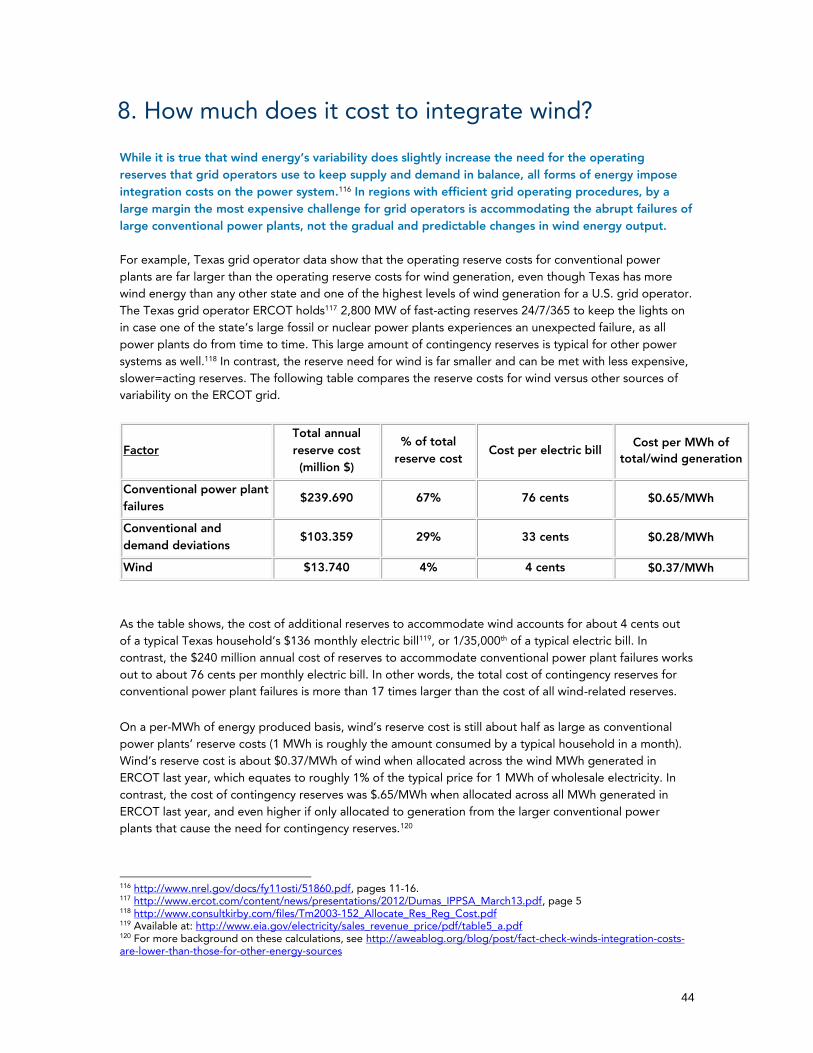
44
8. How much does it cost to integrate wind?
While it is true that wind energy’s variability does slightly increase the need for the operating
reserves that grid operators use to keep supply and demand in balance, all forms of energy impose
integration costs on the power system.116 In regions with efficient grid operating procedures, by a
large margin the most expensive challenge for grid operators is accommodating the abrupt failures of
large conventional power plants, not the gradual and predictable changes in wind energy output.
For example, Texas grid operator data show that the operating reserve costs for conventional power
plants are far larger than the operating reserve costs for wind generation, even though Texas has more
wind energy than any other state and one of the highest levels of wind generation for a U.S. grid operator.
The Texas grid operator ERCOT holds117 2,800 MW of fast-acting reserves 24/7/365 to keep the lights on
in case one of the state’s large fossil or nuclear power plants experiences an unexpected failure, as all
power plants do from time to time. This large amount of contingency reserves is typical for other power
systems as well.118 In contrast, the reserve need for wind is far smaller and can be met with less expensive,
slower=acting reserves. The following table compares the reserve costs for wind versus other sources of
variability on the ERCOT grid.
As the table shows, the cost of additional reserves to accommodate wind accounts for about 4 cents out
of a typical Texas household’s $136 monthly electric bill119, or 1/35,000th of a typical electric bill. In
contrast, the $240 million annual cost of reserves to accommodate conventional power plant failures works
out to about 76 cents per monthly electric bill. In other words, the total cost of contingency reserves for
conventional power plant failures is more than 17 times larger than the cost of all wind-related reserves.
On a per-MWh of energy produced basis, wind’s reserve cost is still about half as large as conventional
power plants’ reserve costs (1 MWh is roughly the amount consumed by a typical household in a month).
Wind’s reserve cost is about $0.37/MWh of wind when allocated across the wind MWh generated in
ERCOT last year, which equates to roughly 1% of the typical price for 1 MWh of wholesale electricity. In
contrast, the cost of contingency reserves was $.65/MWh when allocated across all MWh generated in
ERCOT last year, and even higher if only allocated to generation from the larger conventional power
plants that cause the need for contingency reserves.120
116 http://www.nrel.gov/docs/fy11osti/51860.pdf, pages 11-16. 117 http://www.ercot.com/content/news/presentations/2012/Dumas_IPPSA_March13.pdf, page 5 118 http://www.consultkirby.com/files/Tm2003-152_Allocate_Res_Reg_Cost.pdf 119 Available at: http://www.eia.gov/electricity/sales_revenue_price/pdf/table5_a.pdf 120 For more background on these calculations, see http://aweablog.org/blog/post/fact-check-winds-integration-costs-are-lower-than-those-for-other-energy-sources
Factor
Total annual
reserve cost
(million $)
% of total
reserve cost Cost per electric bill
Cost per MWh of
total/wind generation
Conventional power plant
failures $239.690 67% 76 cents $0.65/MWh
Conventional and
demand deviations $103.359 29% 33 cents $0.28/MWh
Wind $13.740 4% 4 cents $0.37/MWh

45
The table above is directly calculated from the following ERCOT data. The first three rows in the following
table list ERCOT data121 on the incremental amount of reserves it holds to accommodate various sources
of variability, while the fourth row lists the average cost of those reserves in 2013, also calculated from
ERCOT data.122 The last three rows use this data to calculate the total reserve cost for each source of
variability.
The 2- to 3-fold cost premium for faster-acting regulation and responsive reserves versus slower-acting
non-spinning reserves is an important driver of the difference in total cost for wind versus conventional.
Slower-acting reserves can be provided by a much larger pool of resources, often including power plants
that are offline but can start up on short notice. These “non-spinning” reserves typically incur far less cost
to provide operating reserves than operating power plants, as reflected in the reserve prices shown in the
table above. In other regions the cost difference can be even more pronounced, with fast-acting reserves
sometimes dozens of times more expensive than slower-acting reserves.123
Moreover, recent analysis by NREL indicates that higher levels of renewable energy may actually decrease
the total cost of operating reserves, even though the quantity of operating reserves has increased. Adding
renewable generation displaces the output of the most expensive power plants that are currently
121 Available at: http://www.wspp.org/filestorage/panel_1_maggio_ercot 122 Data available at http://mis.ercot.com/misapp/GetReports.do?reportTypeId=13091&reportTitle=Historical%20DAM%20Clearing%20Prices%20for%20Capacity&showHTMLView=&mimicKey 123 http://www.consultkirby.com/files/Ancillary_Services_-_Technical_And_Commercial_Insights_EXT_.pdf, page 30
Regulation down
(fast-acting
reduction in electric
supply)
Regulation up
(fast-acting
increase in electric
supply)
Responsive
reserves
(contingency
reserves)
Non-spinning
reserves
(slower-acting
reserves)
Contingency reserves for
conventional power plant
failures (MW)
2,800
Incremental reserves for wind
(MW) 14 42 328
Electricity demand variability
and deviations at conventional
power plants (MW)
476 508 1,474
Average cost of reserve
($/MW) $4.89 $8.57 $9.77 $3.47
Annual reserve cost for
conventional power plant
failures (million $)
$239.690
Annual reserve cost for wind
(million $) $0.585 $3.159 $9.996
Annual reserve cost for
electricity demand variability
and supply deviations at
conventional power plants
(million $)
$20.372 $38.126 $44.860
46
operating, freeing those generators up to provide reserves and therefore driving down the cost of
reserves.124 As a result, in NREL’s analysis of the Colorado and Wyoming power system, total operating
reserve costs actually fell from $32.3 million at a 25% renewable penetration to $31.2 million at a 35%
renewable penetration, even though the quantity of operating reserves increased.
It is also important to keep in mind that all operating reserve costs are a very small component of the total
costs reflected in the average ratepayer’s electric bill. For example, total regulation reserve costs account
for 0.2% of total PJM wholesale market costs, or about $0.11/MWh.125 PJM’s renewable integration study
found that the current amount of renewable generation on its power system increased the need for
regulation reserves from 1,204 MW to 1,222 MW.126 Thus, the incremental regulation reserves needed due
to renewable energy accounted for less than 1.5% of 0.2% of total wholesale market costs, or about 2
cents per year for a household that consumes 1 MWh per month. While this calculation does not include
slower-acting and less expensive types of operating reserves, it still indicates the very small magnitude of
wind-related reserve costs. MISO data show an even lower total cost for operating reserves than PJM.127
In short, wind-related reserve costs are a small subset of a small subset of the average ratepayer’s electric
bill. It is not surprising that the total wind reserve cost was calculated at 4 cents per month for the average
Texas customer, even with more than 10,000 MW of wind generation on the main Texas power system.
As addressed later in the answer to Question 10, renewable integration costs may appear to be higher in
parts of the country with less efficient grid operating practices, particularly in the Western U.S. However,
because these costs would likely be reduced to the levels described above if efficient operating practices
were in place, those higher costs should be attributed to the obsolete operating practices that are in
place, not renewable generation.
Finally, it should be noted that integration costs for conventional power plants are not assigned to
conventional power plant owners, but are rather paid by electricity customers. Wind farm owners can be
and are charged for integration costs, while the integration costs for conventional power plants are
socialized across consumers’ electric bills. As a result, false claims that renewable integration costs will
impose a significant burden on customers add insult to injury because conventional generators’ far larger
integration costs are the ones that are always paid by ratepayers.
Impact of low-cost generation on other generators
Some have also argued that adding low-cost wind energy to the power system can affect the way in which
other power plants are operated. However, it is important to keep in mind that adding any type of low-
marginal-cost generation, whether from coal, nuclear, hydro, or other renewable resources, will affect how
more expensive power plants are operated. This is the normal and efficient outcome of electricity markets
using the least-cost resources first. As NREL has noted, “Baseload plants can also increase the costs of
operating other generators. … adding a nuclear plant (or any lower cost baseload generation) forces coal
to cycle and also displaces both the combined cycle and combustion turbine-based generation.”128
124 http://www.nrel.gov/docs/fy13osti/58491.pdf, page 31 125 http://www.monitoringanalytics.com/reports/PJM_State_of_the_Market/2016/2016-som-pjm-volume1.pdf, page 16 126 PJM study results, slide 111, available at: http://www.pjm.com/~/media/committees-groups/subcommittees/irs/postings/pjm-pris-final-project-review.ashx 127https://www.misoenergy.org/Library/Repository/Report/IMM/2015%20State%20of%20the%20Market%20Report.pdf 128 http://www.nrel.gov/docs/fy11osti/51860.pdf, page 13
47
9. Don’t grid operators need to add backup to integrate
wind?
No. One of main reasons grid operators built an integrated power system is so that all power plants can
back up all other power plants. As explained under Questions 4 and 7 above, the variability and
uncertainty that affect all sources of electricity supply and demand are largely canceled out by other
sources of variability and uncertainty. As a result, having a dedicated backup source for each source of
variability would be highly inefficient and counterproductive, as counteracting that resource’s variability
would often increase total power system variability. As an analogy, it would be highly inefficient and
counterproductive to have a dedicated resource at your house accommodating all fluctuations in your
electricity demand, such as a battery or small dispatchable power plant, as nearly all of those changes are
canceled out anyway by other changes on the aggregate grid.129 Unfortunately, as NREL has noted,130 the
misconception that renewable resources must be paired with dispatchable resources has been used as the
flawed assumption for many studies.131
Moreover, any total power system variability and uncertainty is most efficiently accommodated by the
large pool of flexible resources available on the power system. Like any generation resource, wind works
best as part of a mix of other resources on the power system. As explained above, a major challenge and
expense faced by grid operators is how to keep the lights on when individual power plants break down, as
all power plants do from time to time. The challenge is particularly great for failures at large fossil and
nuclear power plants, which because of their size can take offline in a fraction of a second enough
electricity to supply a large city.
Over the last century, power grid operators have perfected tools for combining hundreds of power plants
that are each individually unreliable into a power system that is very reliable. By using most power plants
to “back up” all other power plants, grid operators ensure that the lights stay on when even the largest
power plant on the grid breaks down. This process works so well that most people are not aware that it
occurs, even though the expense of maintaining that backup 24/7 for the unpredictable failure of
conventional power plants is quite large, as explained under the answer to Question 8 above.
Grid operators typically make a distinction between operating reserves, which were addressed in this
answer and the preceding answer, and “planning reserves,” which were discussed in more detail in
Chapter 4. The primary distinction is that grid operators think about planning reserves on a years-ahead
basis when they are deciding what power plants to build, while they think about operating reserves on a
day-ahead to real-time basis when they are deciding what power plants to operate. Planning reserves are
essentially the cushion of extra power plant capacity that grid operators build so that they will have
enough power plants even if some of those power plants are not available on a particular day. For both
operating reserves and planning reserves, the answer is that wind can be reliably added at low cost, as the
power plant capacity and flexibility that is needed already exists on the power system.
129 Discussion of pairing dedicated storage or a dedicated “backup” power plant with a particular resource, or combining several resources to create a virtual power plant or a microgrid, often falls into this trap. The power system was built to realize the diversity benefits of having all resources backed up by all other resources and all sources of variability canceling each other out, so dis-aggregating the grid would be a step backwards. 130 http://www.nrel.gov/docs/fy11osti/51860.pdf, page 27 131 Examples of studies that are flawed because they have relied on this incorrect pairing assumption include http://pubs.acs.org/doi/full/10.1021/es801437t and http://instituteforenergyresearch.org/wp-content/uploads/2016/07/IER_LCOE_2016-2.pdf; That claim was debunked here http://www.aweablog.org/koch-groups-try-debunked-wind-attack-for-a-fourth-time/.

48
10. What can help accommodate higher levels of wind?
Grid operating reforms and transmission upgrades are by far the lowest hanging fruit for making the
power system more flexible and efficient. Bulk power system grid operating reforms and transmission
upgrades that facilitate the integration of renewable energy also provide major net benefits to consumers
and improve reliability even in the absence of wind energy, so they can be implemented at negative cost.
Transmission expansion is a key solution for reliably and cost-effectively integrating large amounts of
renewable energy. SPP,132 MISO,133 and other grid operators have released studies showing that
transmission more than pays for itself by providing consumers with access to lower cost electricity and
improving the efficiency and competitiveness of power markets by allowing inter-regional trade.
Transmission facilitates the integration of renewables by providing access to the best renewable sites as
well as allowing power to be moved from region to region in response to fluctuations in electricity supply
and demand. Modeling analysis in the journal Nature Climate Change demonstrated that a major benefit
of transmission is capturing the geographic diversity in wind and solar output due to the fact that “the
average variability of weather decreases as size increases; if wind or solar power are not available in a small
area, they are more likely to be available somewhere in a larger area.” As a result, the study notes
“paradoxically, the variability of the weather can provide the answer to its perceived problems.”134
Turning to grid operating reforms, reports by NREL135 and the Western Governors Association136 provide
an overview of that can cost-effectively improve power system flexibility and efficiency, including:
Better coordinating regional grid operations, such as through RTOs/ISOs or shared markets like an Energy Imbalance Market137 (EIM)
Consolidation or better coordination among grid operators
Faster generation scheduling and dispatch intervals
Better integrating wind energy forecasting into grid operations
Establishment of ancillary services markets that incentivize flexible resources such as demand response and flexible generation
One of the most beneficial solutions is an Energy Imbalance Market, or EIM. An Energy Imbalance Market
is a voluntary market that allows utilities and other grid operators to “net out” changes in electricity supply
and demand with their neighbors. This is typically much more cost-effective than each individual grid
operating managing all variability on its own without regard for what its neighbors are doing.
For example, under current operating practices in much of the Western U.S., one utility may be ramping
up its gas power plants to accommodate an unexpected increase in electricity demand, while a
neighboring utility is ramping its gas power plants down to accommodate an increase in wind generation.
A far more efficient solution would be for the utilities to allow the increasing wind generation to meet the
increasing electricity demand and not change the output of their gas power plants. As described above,
this diversity benefit is one of the fundamental reasons why large interstate power systems were built in
the first place.
132 http://www.spp.org/documents/35297/the%20value%20of%20transmission%20report.pdf 133https://www.misoenergy.org/Library/Repository/Study/Candidate%20MVP%20Analysis/MTEP14%20MVP%20Triennial%20Review%20Report.pdf 134 http://www.nature.com/nclimate/journal/vaop/ncurrent/full/nclimate2921.html 135 Available at: http://www.nrel.gov/docs/fy09osti/46273.pdf, http://www.nrel.gov/docs/fy13osti/60451.pdf 136 Available at: http://www.westgov.org/component/docman/doc_download/1610-meeting-renewable-energy-targets-in-the-west-at-least-cost-the-integration-challenge-full-report?Itemid 137 https://www.caiso.com/Documents/EnergyImbalanceMarketFAQs.pdf

49
An EIM also reduces another major inefficiency in current power system operations in the Western U.S.
Currently, most power plants are told to produce at a constant level of output for an hour, which requires
the use of expensive operating reserves to accommodate intra-hour changes in electricity supply and
demand. In much of the rest of the U.S., grid operators allow generators to change their output levels at
intervals of 5 minutes and with lead times of 10 minutes or less, rather than hourly. This allows generators
to use their inherent flexibility to respond to changes in electricity supply and demand based on the
incentives provided in the energy market. Instead of holding enough expensive operating reserves to
handle the worst case of supply and demand variability that could occur over the course of that hour, this
variability is accommodated at virtually no cost through the energy market. An additional benefit is that
the less than 10 minute lead time for updating generator output levels allows for a far more accurate
forecast of electricity demand and supply than is possible an hour or more ahead.
As shown in the chart below, coordinating grid operations over a larger area and allowing faster and more
frequent updates to generation dispatch greatly reduces the need for operating reserves.
Many studies have documented the sizeable net benefits of grid operating reforms like an EIM. In
particular, these studies have examined potential grid operating reforms in the Western U.S., where hourly
generator dispatch is still the norm and there has been significant discussion about the opportunity to
move to an EIM. The EIM model is based on the successful use of an EIM in the Southwest Power Pool
region. The California grid operator and the large interstate utility PacifiCorp launched an EIM in the fall of
2014, which has already provided $175 million in savings since its inception.138
Grid operating reforms like an EIM are by far the lowest hanging fruit for making the power system more
flexible, and in fact they can be done at a negative cost to consumers. NREL calculated that an EIM would
138 https://www.caiso.com/Documents/ISO-EIMBenefitsReportQ1_2017.pdf
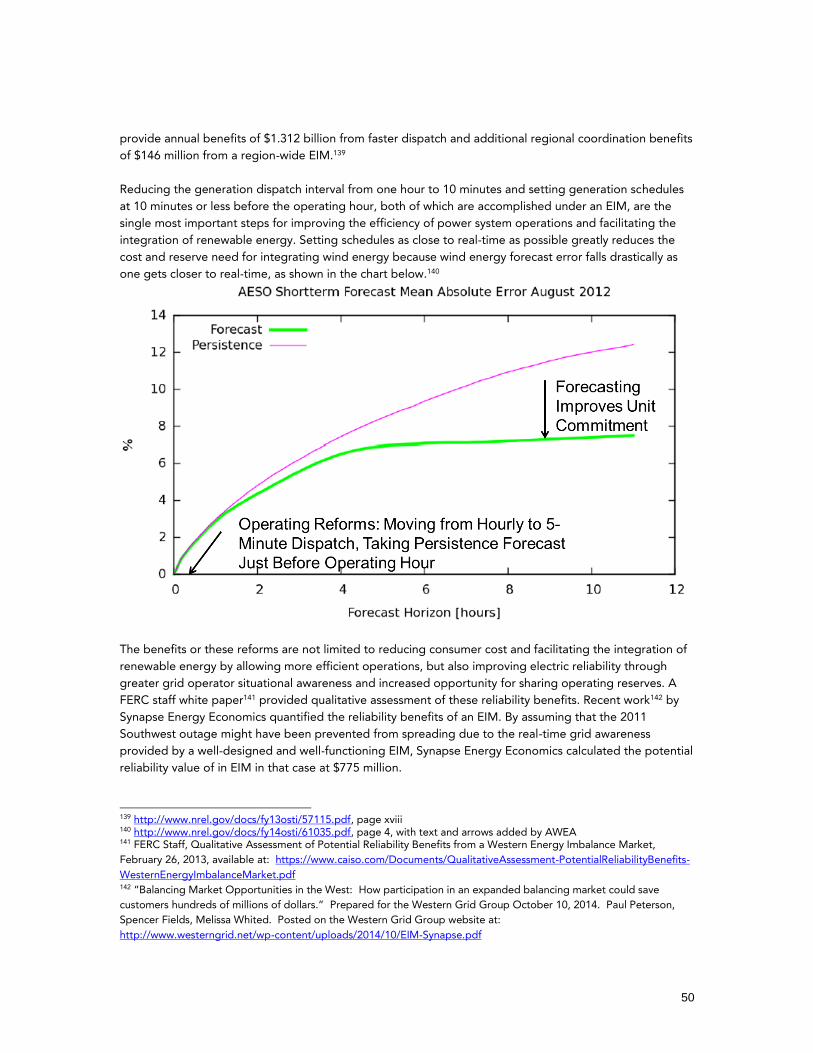
50
provide annual benefits of $1.312 billion from faster dispatch and additional regional coordination benefits
of $146 million from a region-wide EIM.139
Reducing the generation dispatch interval from one hour to 10 minutes and setting generation schedules
at 10 minutes or less before the operating hour, both of which are accomplished under an EIM, are the
single most important steps for improving the efficiency of power system operations and facilitating the
integration of renewable energy. Setting schedules as close to real-time as possible greatly reduces the
cost and reserve need for integrating wind energy because wind energy forecast error falls drastically as
one gets closer to real-time, as shown in the chart below.140
The benefits or these reforms are not limited to reducing consumer cost and facilitating the integration of
renewable energy by allowing more efficient operations, but also improving electric reliability through
greater grid operator situational awareness and increased opportunity for sharing operating reserves. A
FERC staff white paper141 provided qualitative assessment of these reliability benefits. Recent work142 by
Synapse Energy Economics quantified the reliability benefits of an EIM. By assuming that the 2011
Southwest outage might have been prevented from spreading due to the real-time grid awareness
provided by a well-designed and well-functioning EIM, Synapse Energy Economics calculated the potential
reliability value of in EIM in that case at $775 million.
139 http://www.nrel.gov/docs/fy13osti/57115.pdf, page xviii 140 http://www.nrel.gov/docs/fy14osti/61035.pdf, page 4, with text and arrows added by AWEA 141 FERC Staff, Qualitative Assessment of Potential Reliability Benefits from a Western Energy Imbalance Market,
February 26, 2013, available at: https://www.caiso.com/Documents/QualitativeAssessment-PotentialReliabilityBenefits-
WesternEnergyImbalanceMarket.pdf 142 “Balancing Market Opportunities in the West: How participation in an expanded balancing market could save
customers hundreds of millions of dollars.” Prepared for the Western Grid Group October 10, 2014. Paul Peterson,
Spencer Fields, Melissa Whited. Posted on the Western Grid Group website at:
http://www.westerngrid.net/wp-content/uploads/2014/10/EIM-Synapse.pdf
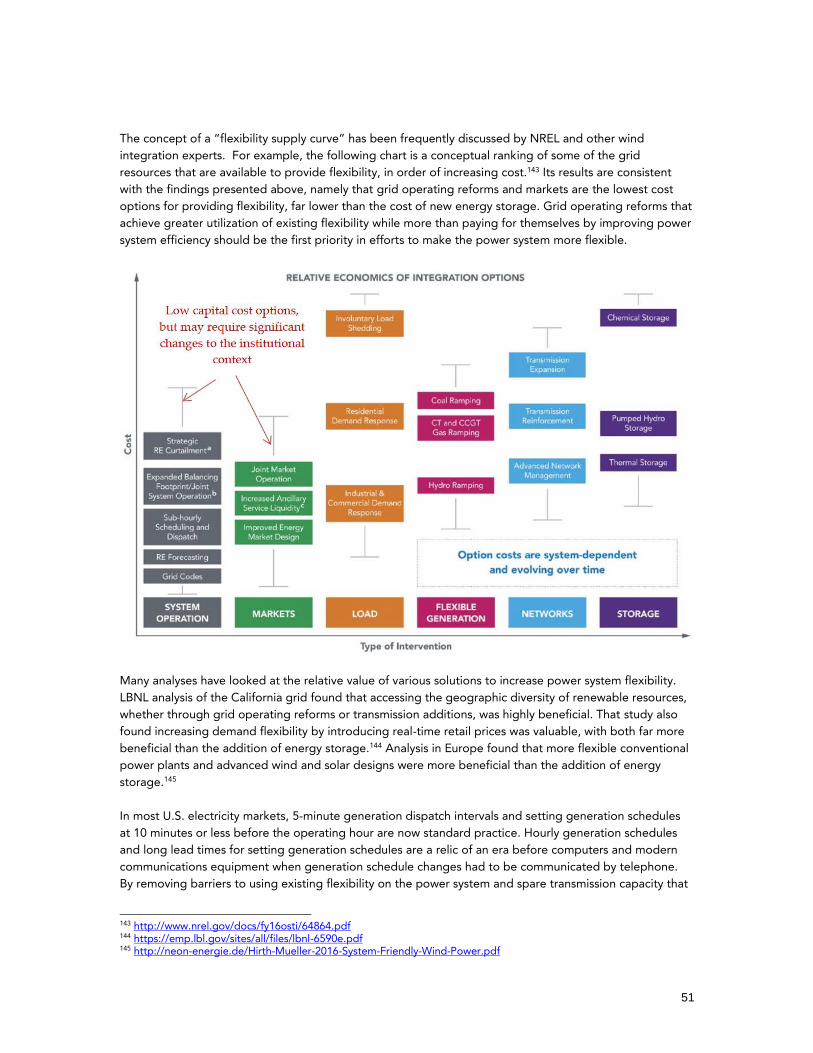
51
The concept of a “flexibility supply curve” has been frequently discussed by NREL and other wind
integration experts. For example, the following chart is a conceptual ranking of some of the grid
resources that are available to provide flexibility, in order of increasing cost.143 Its results are consistent
with the findings presented above, namely that grid operating reforms and markets are the lowest cost
options for providing flexibility, far lower than the cost of new energy storage. Grid operating reforms that
achieve greater utilization of existing flexibility while more than paying for themselves by improving power
system efficiency should be the first priority in efforts to make the power system more flexible.
Many analyses have looked at the relative value of various solutions to increase power system flexibility.
LBNL analysis of the California grid found that accessing the geographic diversity of renewable resources,
whether through grid operating reforms or transmission additions, was highly beneficial. That study also
found increasing demand flexibility by introducing real-time retail prices was valuable, with both far more
beneficial than the addition of energy storage.144 Analysis in Europe found that more flexible conventional
power plants and advanced wind and solar designs were more beneficial than the addition of energy
storage.145
In most U.S. electricity markets, 5-minute generation dispatch intervals and setting generation schedules
at 10 minutes or less before the operating hour are now standard practice. Hourly generation schedules
and long lead times for setting generation schedules are a relic of an era before computers and modern
communications equipment when generation schedule changes had to be communicated by telephone.
By removing barriers to using existing flexibility on the power system and spare transmission capacity that
143 http://www.nrel.gov/docs/fy16osti/64864.pdf 144 https://emp.lbl.gov/sites/all/files/lbnl-6590e.pdf 145 http://neon-energie.de/Hirth-Mueller-2016-System-Friendly-Wind-Power.pdf
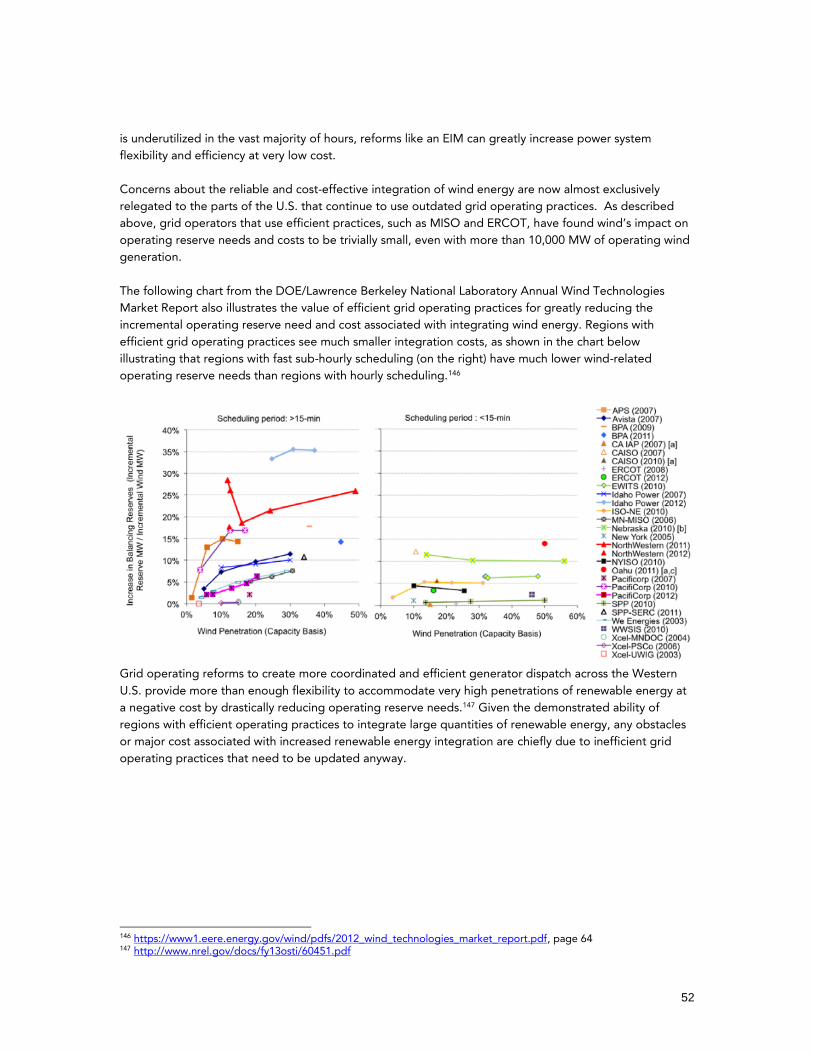
52
is underutilized in the vast majority of hours, reforms like an EIM can greatly increase power system
flexibility and efficiency at very low cost.
Concerns about the reliable and cost-effective integration of wind energy are now almost exclusively
relegated to the parts of the U.S. that continue to use outdated grid operating practices. As described
above, grid operators that use efficient practices, such as MISO and ERCOT, have found wind’s impact on
operating reserve needs and costs to be trivially small, even with more than 10,000 MW of operating wind
generation.
The following chart from the DOE/Lawrence Berkeley National Laboratory Annual Wind Technologies
Market Report also illustrates the value of efficient grid operating practices for greatly reducing the
incremental operating reserve need and cost associated with integrating wind energy. Regions with
efficient grid operating practices see much smaller integration costs, as shown in the chart below
illustrating that regions with fast sub-hourly scheduling (on the right) have much lower wind-related
operating reserve needs than regions with hourly scheduling.146
Grid operating reforms to create more coordinated and efficient generator dispatch across the Western
U.S. provide more than enough flexibility to accommodate very high penetrations of renewable energy at
a negative cost by drastically reducing operating reserve needs.147 Given the demonstrated ability of
regions with efficient operating practices to integrate large quantities of renewable energy, any obstacles
or major cost associated with increased renewable energy integration are chiefly due to inefficient grid
operating practices that need to be updated anyway.
146 https://www1.eere.energy.gov/wind/pdfs/2012_wind_technologies_market_report.pdf, page 64 147 http://www.nrel.gov/docs/fy13osti/60451.pdf

53
11. Isn’t energy storage necessary to integrate wind?
No. Some of the most common questions about wind power involve the role of energy storage in
integrating wind power with the electric grid. It is important to understand that very large amounts of
wind energy can be reliably integrated at low cost without a need for energy storage, and that energy
storage provides a variety of services and is therefore best viewed as a power system resource and not a
resource for wind energy or any other individual resource. Moreover, as explained by the flexibility supply
curve discussed in Chapter 10 above, energy storage is typically a more expensive source of flexibility than
grid operating reforms that allow greater use of the flexibility that already exists on the power system
today.
The reality is that, while several small-scale energy storage projects have been added in recent years, the
U.S. has been able to add more than 80,000 MW of wind power to the grid without adding significant
amounts of large-scale energy storage. Similarly, European countries like Denmark, Spain, Ireland, and
Germany have successfully integrated very large amounts of wind energy without having to install new
energy storage resources. In the U.S., numerous peer-reviewed studies have concluded that wind energy
can provide 30% or more of our electricity without any need for energy storage.
The key to doing so lies in using the sources of flexibility that are already present on the electric grid. As
discussed earlier, grid operators constantly accommodate variability in electricity demand and supply by
increasing and decreasing the output of flexible generators and other sources of flexibility. A tremendous
amount of flexibility has been built into the power system to accommodate large and abrupt swings in
electricity supply and demand. Because these power plants and other sources of flexibility have already
been built, it is almost always much cheaper to use this flexibility than to build new sources of flexibility
like energy storage facilities.
While continuing advances in energy storage technology can make it more economically competitive as a
source of grid flexibility, and improving the performance and reducing the cost of battery storage remains
critical for enabling greater electrification of the transportation sector, it is important to remember that
resources like wind energy can already be cost-effectively and reliably integrated with the electric grid
without energy storage.
The high cost of energy storage relative to other sources of flexibility, including those on the existing
power system, is the chief reason why it is not more widely used today. In addition, many types of energy
storage are poorly suited to help accommodate the specific type of variability that wind energy adds to
the electric grid. As explained in the answer to Question 7 above, wind energy output shows very little
variability over the minute-to-minute timeframe, with significant changes in output only tending to occur
over time periods of 30 minutes or more. Fortunately, it is much cheaper to provide flexibility over these
longer time periods using existing resources; as illustrated in the ERCOT data provided earlier, slower-
acting reserves can be obtained at a fraction of the cost of faster-acting reserves. Some energy storage
technologies, such as flywheels and advanced batteries, can be cost-effective for accommodating demand
variability on the second-to-second time frame, but such technologies provide little to no value for wind
integration.148
There are also fundamental limits to most energy storage technologies for providing the services needed
at very high penetrations of renewable energy, such as those in excess of 50% annual penetration by
energy. As illustrated below, no energy storage technologies in current widespread use are of sufficient
scale to move dozens or even hundreds of GWh of energy hours or even days in time.149 Pumped
148 See, for example, https://emp.lbl.gov/sites/all/files/lbnl-6590e.pdf 149 http://www.autoblog.com/2014/11/14/bibendum-2014-itm-power-make-free-hydrogen/

54
hydroelectric storage, with its ability to store large amounts of energy for long durations, is the only
energy storage technology that is currently available that comes close to providing this type of service.
As discussed in the answer to Question 9, some people incorrectly assume that wind output must be
“paired” or “firmed,” i.e. have its variability leveled out, by storage or another resource to make it
valuable to electric utilities or system operators. In reality, there is no need for individual power plants to
provide constant power output; this is a good thing, as all power plants experience unexpected outages
fairly frequently. As previously discussed, significant variability is already present on the electric grid due to
changes in electricity demand and supply as consumers turn appliances on and off and power plants
unexpectedly go out of service. Many changes in wind output actually cancel out opposite changes in
electricity demand or supply. Therefore, attempting to “firm” wind can actually add to the total variability
on the electric grid. Instead, it makes more sense for energy storage to be viewed as a system resource
that can help even out the aggregate variability of all generators and all demand on the electric grid, and
not used as a dedicated resource for a single generator or load. As a result, a wind plant is seldom the
optimal location for deploying energy storage.
In certain rare situations, it could make sense to site energy storage near a wind plant. If a constraint on
the transmission grid prevents a wind plant or group of wind plants from selling their full output on a
consistent basis, it could be economical to store electricity that would otherwise have been curtailed.
However, this type of application is a short-term fix; building out the transmission grid is typically the more
optimal long-term solution to a transmission constraint.
In addition, it is important to keep in mind that while energy storage can be an economically attractive
option in certain niche applications, such as small island power systems, this does not indicate that energy
storage is an economic option on large mainland power systems. Small island power systems, due to
geography and fuel mix, often lack low-cost sources of flexibility such as an ability to exchange power with
neighboring grid operators. In contrast, mainland U.S. power systems can far more cost-effectively
55
manage variability from all sources by using transmission to exchange power with a neighboring power
system or access flexible resources.
While energy storage is not needed to integrate wind energy with the electric grid and is often not cost-
effective, in some cases having certain types of energy storage on the grid can modestly reduce the cost
of integrating wind. However, in some other cases, energy storage has been found to provide negative
value for the integration of wind energy, even if the energy storage was provided at no cost.150 Regardless,
given the low cost of using existing flexibility to integrate wind energy, and grid operating reforms that
enable far greater use of existing flexibility at negative cost, energy storage technologies should not be
viewed as an essential tool for the integration of renewable energy.
The only form of energy storage that is currently operational on a large scale in the U.S. is pumped
hydroelectric storage, with around 22 GW of installed capacity. In an illustration of that fact that storage is
best viewed as a system resource, much of this storage was built to provide flexibility to help
accommodate the significant increase in nuclear generation that occurred during the 1960’s, 70’s, and
80’s. Just as it is typically not economic for wind plants to increase their output in response to grid
demands, all U.S. nuclear plants and many coal plants tend to provide little to no flexibility.
Thus, all inflexible generators benefit when other sources of flexibility, including energy storage, can
relieve them of having to accommodate changes in electricity supply and demand. In fact, studies in the
Netherlands151 and Ireland152 found that coal plants were the primary beneficiaries of energy storage.
Energy storage allowed coal power plants to run more at night, with this low-cost energy being stored and
used to displace more expensive natural gas generation during the day, interestingly causing a net
increase in electric sector carbon dioxide emissions in those cases. In the U.S., DOE data show that
pumped hydro storage use declined drastically in 2012 and 2013 when abnormally low gas prices created
an incentive for coal plants to begin cycling their output, reducing the need for storage to provide the
flexibility that it had previously been uneconomic for coal plants to provide.153
While energy storage technologies may currently have difficulty competing economically with conventional
sources of flexibility – especially for accommodating the more gradual variability most relevant for wind
integration – continuing advances in energy storage technology can make energy storage more
competitive as a provider of grid flexibility. For example, there is significant potential for the batteries of
plug-in vehicles to be used as energy storage for the grid, particularly by simply altering the rate of
charging of these batteries and therefore avoiding any cycling-related impacts to battery life, because the
expense of those batteries would largely be covered by the fuel savings they provide to the vehicle owner.
While the potential of such technologies is exciting, it is important to remember that resources like wind
energy can already be cost-effectively and reliably integrated with the electric grid without energy
storage.
150 https://emp.lbl.gov/sites/all/files/lbnl-6590e.pdf 151http://ieeexplore.ieee.org/xpl/login.jsp?tp=&arnumber=4463799&url=http%3A%2F%2Fieeexplore.ieee.org%2Fxpls%2Fabs_all.jsp%3Farnumber%3D4463799 152 http://econpapers.repec.org/article/eeeenepol/v_3a39_3ay_3a2011_3ai_3a4_3ap_3a1965-1974.htm 153https://www.eia.gov/electricity/data/browser/#/topic/0?agg=2,0,1&fuel=01&geo=g&sec=g&linechart=ELEC.GEN.HPS-US-99.A&columnchart=ELEC.GEN.HPS-US-99.A&map=ELEC.GEN.HPS-US-99.A&freq=A&ctype=linechart<ype=pin&rtype=s&pin=&rse=0&maptype=0
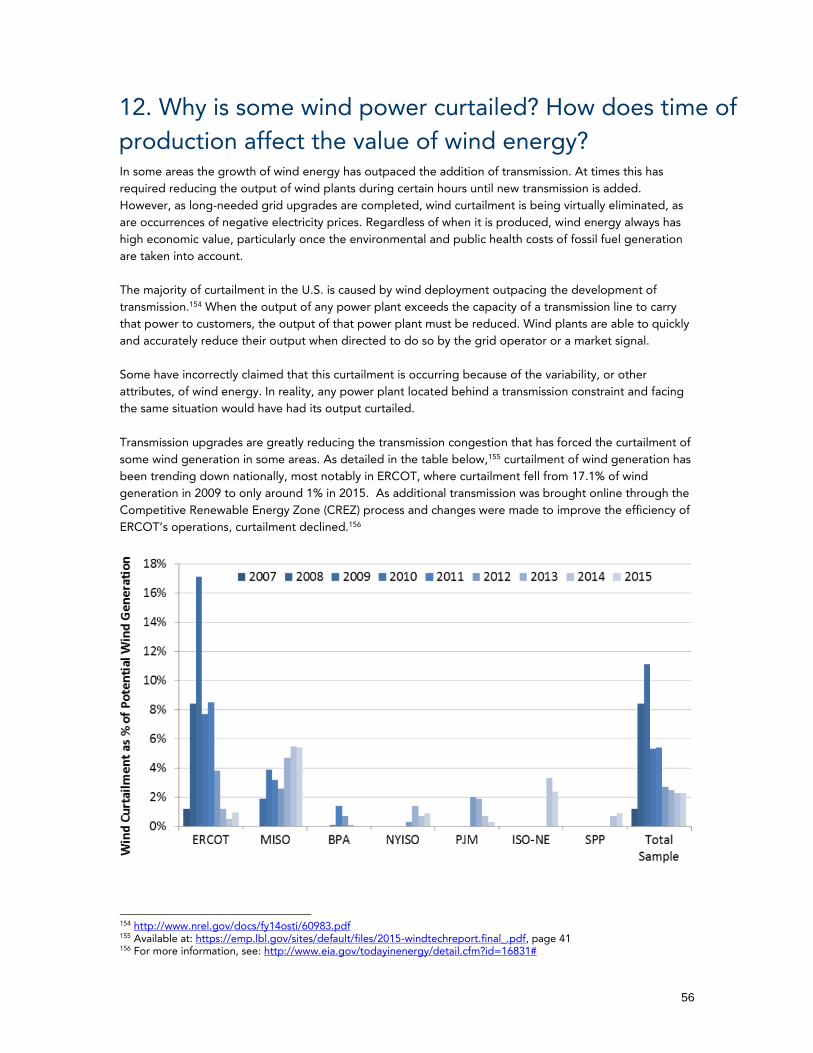
56
12. Why is some wind power curtailed? How does time of
production affect the value of wind energy?
In some areas the growth of wind energy has outpaced the addition of transmission. At times this has
required reducing the output of wind plants during certain hours until new transmission is added.
However, as long-needed grid upgrades are completed, wind curtailment is being virtually eliminated, as
are occurrences of negative electricity prices. Regardless of when it is produced, wind energy always has
high economic value, particularly once the environmental and public health costs of fossil fuel generation
are taken into account.
The majority of curtailment in the U.S. is caused by wind deployment outpacing the development of
transmission.154 When the output of any power plant exceeds the capacity of a transmission line to carry
that power to customers, the output of that power plant must be reduced. Wind plants are able to quickly
and accurately reduce their output when directed to do so by the grid operator or a market signal.
Some have incorrectly claimed that this curtailment is occurring because of the variability, or other
attributes, of wind energy. In reality, any power plant located behind a transmission constraint and facing
the same situation would have had its output curtailed.
Transmission upgrades are greatly reducing the transmission congestion that has forced the curtailment of
some wind generation in some areas. As detailed in the table below,155 curtailment of wind generation has
been trending down nationally, most notably in ERCOT, where curtailment fell from 17.1% of wind
generation in 2009 to only around 1% in 2015. As additional transmission was brought online through the
Competitive Renewable Energy Zone (CREZ) process and changes were made to improve the efficiency of
ERCOT’s operations, curtailment declined.156
154 http://www.nrel.gov/docs/fy14osti/60983.pdf 155 Available at: https://emp.lbl.gov/sites/default/files/2015-windtechreport.final_.pdf, page 41 156 For more information, see: http://www.eia.gov/todayinenergy/detail.cfm?id=16831#
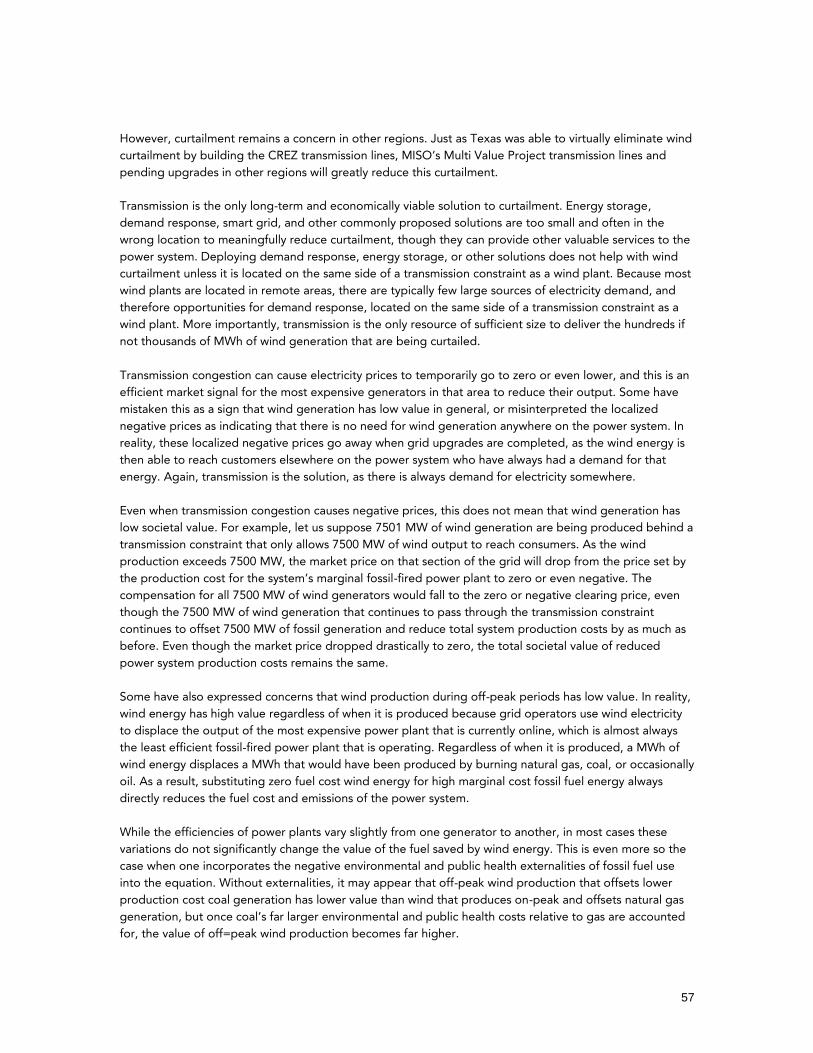
57
However, curtailment remains a concern in other regions. Just as Texas was able to virtually eliminate wind
curtailment by building the CREZ transmission lines, MISO’s Multi Value Project transmission lines and
pending upgrades in other regions will greatly reduce this curtailment.
Transmission is the only long-term and economically viable solution to curtailment. Energy storage,
demand response, smart grid, and other commonly proposed solutions are too small and often in the
wrong location to meaningfully reduce curtailment, though they can provide other valuable services to the
power system. Deploying demand response, energy storage, or other solutions does not help with wind
curtailment unless it is located on the same side of a transmission constraint as a wind plant. Because most
wind plants are located in remote areas, there are typically few large sources of electricity demand, and
therefore opportunities for demand response, located on the same side of a transmission constraint as a
wind plant. More importantly, transmission is the only resource of sufficient size to deliver the hundreds if
not thousands of MWh of wind generation that are being curtailed.
Transmission congestion can cause electricity prices to temporarily go to zero or even lower, and this is an
efficient market signal for the most expensive generators in that area to reduce their output. Some have
mistaken this as a sign that wind generation has low value in general, or misinterpreted the localized
negative prices as indicating that there is no need for wind generation anywhere on the power system. In
reality, these localized negative prices go away when grid upgrades are completed, as the wind energy is
then able to reach customers elsewhere on the power system who have always had a demand for that
energy. Again, transmission is the solution, as there is always demand for electricity somewhere.
Even when transmission congestion causes negative prices, this does not mean that wind generation has
low societal value. For example, let us suppose 7501 MW of wind generation are being produced behind a
transmission constraint that only allows 7500 MW of wind output to reach consumers. As the wind
production exceeds 7500 MW, the market price on that section of the grid will drop from the price set by
the production cost for the system’s marginal fossil-fired power plant to zero or even negative. The
compensation for all 7500 MW of wind generators would fall to the zero or negative clearing price, even
though the 7500 MW of wind generation that continues to pass through the transmission constraint
continues to offset 7500 MW of fossil generation and reduce total system production costs by as much as
before. Even though the market price dropped drastically to zero, the total societal value of reduced
power system production costs remains the same.
Some have also expressed concerns that wind production during off-peak periods has low value. In reality,
wind energy has high value regardless of when it is produced because grid operators use wind electricity
to displace the output of the most expensive power plant that is currently online, which is almost always
the least efficient fossil-fired power plant that is operating. Regardless of when it is produced, a MWh of
wind energy displaces a MWh that would have been produced by burning natural gas, coal, or occasionally
oil. As a result, substituting zero fuel cost wind energy for high marginal cost fossil fuel energy always
directly reduces the fuel cost and emissions of the power system.
While the efficiencies of power plants vary slightly from one generator to another, in most cases these
variations do not significantly change the value of the fuel saved by wind energy. This is even more so the
case when one incorporates the negative environmental and public health externalities of fossil fuel use
into the equation. Without externalities, it may appear that off-peak wind production that offsets lower
production cost coal generation has lower value than wind that produces on-peak and offsets natural gas
generation, but once coal’s far larger environmental and public health costs relative to gas are accounted
for, the value of off=peak wind production becomes far higher.
58
13. What has been Europe’s experience with renewable
energy? European nations have demonstrated that wind energy can reliably provide an even larger share of generation, with Ireland, Spain, and Portugal obtaining 24-30% of their electricity from wind on an annual basis, and Denmark at nearly 40%.157
Wind energy leaders Denmark, Ireland, Spain, Germany, and the Netherlands all have some of the most
reliable power systems in the world, and they have seen their reliability improve significantly as they have
increased their use of wind energy.158 Germany’s power system is the most reliable in Europe, and it has
grown even more reliable as Germany has greatly increased its use of renewable energy in recent years.159
The chart below confirms that Denmark and Germany power systems are 10 times more reliable than the
U.S. power system.160
This is not to claim that renewables are the primary cause of the high reliability in these countries, as the
most important factor in preventing customer outages is the resilience of the low-voltage distribution
system for preventing localized outages. However, the data clearly does not support the claim that
increasing use of wind energy has harmed European electric reliability, particularly the dubious claim that
localized reliability problems have been caused by wind energy.161
157 https://emp.lbl.gov/sites/default/files/2015-windtechreport.final_.pdf, page 7 158 http://cleantechnica.com/2012/09/12/german-grid-reaches-record-reliability-in-2011-thanks-to-renewables/ 159 http://spectrum.ieee.org/energywise/energy/the-smarter-grid/germanys-superstable-solarsoaked-grid 160 https://www.linkedin.com/pulse/response-rick-perry-regarding-renewables-grid-stability-daniel-shugar 161 For an example of the false claims being made about European reliability, see http://instituteforenergyresearch.org/analysis/germanys-green-energy-destabilizing-electric-grids/

59
These countries’ carbon emissions have also drastically decreased as they have ramped up their use of
renewable energy over the last decade, disproving the myth162 that European expansion of renewable
energy has not delivered the expected emissions reductions. Others have also comprehensively rebutted
these myths about reliability and emissions reductions.163
As shown in the table below, there is a very strong relationship between greater use of wind energy and a
reduction in the carbon intensity of a country’s electric sector, with Europe’s wind energy leaders
significantly outperforming the average reduction in electric sector emissions intensity for European OECD
countries. Germany’s carbon emissions would have fallen even further had it not drastically reduced its use
of nuclear generation at the same time for unrelated reasons following the events at the Fukushima
reactor in Japan.164
Country 2002 wind
%
2012 wind
%
2002-2012
decrease in
electric sector
emissions/MWh
Denmark 12.41% 33.42% 41.35%
Portugal 0.79% 22.01% 30.62%
Spain 3.81% 16.63% 30.14%
Ireland 1.54% 14.53% 28.08%
Germany 2.70% 8.05% 12.78%
OECD
Europe 1.09% 5.73% 12.49%
162 http://instituteforenergyresearch.org/analysis/germanys-renewable-energy-transition-misses-carbon-reduction-goals/ 163 See, for example, https://www.rmi.org/news/debunking-renewables-disinformation-campaign, http://blog.rmi.org/separating_fact_from_fiction_in_accounts_of_germanys_renewables_revolution, https://twitter.com/EvaStegen/status/821371069097451521 164 https://www.agora-energiewende.de/fileadmin/Projekte/2017/Jahresauswertung_2016/Die_Energiewende_im_Stromsektor_2016_EN.pdf

60
Europe’s expansion of renewable energy has also significantly improved its energy independence by
reducing its dependence on natural gas imported from Russia. Providing Germany’s wind generation in
2012 with gas generation would have required around 370 BCF of gas, 38% of Germany’s total gas
imports from Russia. Total Europe wind production would have required 2 TCF of gas to replace that
energy, 67% of the gas shipped through Ukraine and 35% of total Russian exports to Europe.165
Reliably and cost-effectively integrating large amounts of renewable energy will be even easier in the U.S.,
as American renewable resources are more diverse and produce more energy more consistently. The U.S.
power system is larger and more flexible than that in most of Europe, with abundant hydroelectric
resources, flexible gas generation, and more weather-driven electricity demand variability that, as
explained above, cancels out much of the variability of renewable energy. In contrast, Ireland is essentially
an electrical island with minimal transmission ties and an inflexible generation fleet, and Spain and
Portugal have similarly succeeded with minimal transmission ties to neighbors.
165 IEA and EIA data

61
14. What is wind’s net impact on emissions?
Wind energy greatly reduces emissions of carbon dioxide and other pollutants. Analysis using an EPA tool
demonstrates that wind energy reduced carbon dioxide emissions by 159 million Metric tons in 2016,166
and those savings continue to grow as more wind energy is installed. Wind energy also greatly reduces
emissions of sulfur dioxide, nitrogen oxides, mercury, and other air pollutants, as well as reducing water
usage and other environmental impacts of fossil fuel use.
Some have sought, without evidence, to undermine the large environmental benefits of wind energy by
propagating the myth that wind’s pollution reductions are smaller than expected because of impacts on
the efficiency of fossil-fired power plants due to cycling.167 The reality is that because renewable variability
is a small contributor to total power system variability, renewable variability has a small impact on the
cycling of conventional generation.
An NREL analysis examined the impact of cycling on wind’s emissions savings based on real-world hourly
emissions data collected at all power plants in the Western U.S., and the results conclusively show cycling
has a “negligible” impact on wind’s emissions savings.168 NREL’s study found that with wind and solar
providing 33 percent of the electricity on the Western U.S. power system, one MWh of wind energy would
save more than 1190 pounds of carbon pollution on average, with those savings reduced by only 0.2
percent, or 2.4 pounds, as a result of increased cycling of fossil-fired power plants.169 Grid operator
analysis in the United Kingdom also concludes that the impact of wind generation on reserve needs is very
small, and that variability reduces wind’s emissions benefits by less than 1/10th of 1 percent, or 0.1
percent.170
The PJM renewable integration study found similar results, with total emissions being reduced at the
expected proportional rate as wind generation levels increased.171 Moreover, total generator cycling costs
actually decreased in the high renewable energy case in PJM’s analysis.172 NREL has also confirmed that
the addition of any low-cost generation will increase the cycling of other generators.173
A related myth is that retaining or building new capacity to provide needed flexibility will mitigate the
pollution reduction benefits of wind energy. This claim fails to understand that retaining or building
generating capacity has a negligible impact on emissions as emissions are tied to energy, not capacity.
Building more natural gas plants or keeping existing fossil-fired power plants around does not significantly
impair efforts to reduce emissions, as power plants that are being used to provide capacity and flexibility
only run during the small number of hours per year when those services are needed. Moreover, any MWh
produced by that plant will directly displace MWh that would have come from another fossil-fired power
plant, so there is essentially zero impact on total emissions.
166 AWEA Annual Report 2016; http://awea.files.cms-plus.com/FileDownloads/pdfs/AWEA_Clean_Air_Benefits_WhitePaper%20Final.pdf 167 For example, see http://www.wsj.com/articles/SB10001424052748703792704575366700528078676 168 http://www.nrel.gov/docs/fy13osti/57874.pdf 169 Available at https://www.nrel.gov/grid/wwsis.html 170 http://www.gizmag.com/uk-national-grid-wind-data/28046/ 171 http://www.pjm.com/~/media/committees-groups/subcommittees/irs/postings/pjm-pris-final-project-review.ashx 172 Page 33 at http://www.pjm.com/~/media/committees-groups/subcommittees/irs/postings/pris-executive-summary.ashx shows total cycling costs are $870 million in the base case and $500 million in the renewable case. 173 http://www.nrel.gov/docs/fy11osti/51860.pdf
62
Generating capacity itself causes no fuel use or emissions. Generating capacity, rather than actual
dispatched energy, is what is primarily needed for providing operating reserves, particularly the slower-
acting reserves that do noticeably increase in need at high renewable penetrations. The act of holding
these reserves involves either keeping an operating power plant slightly below its maximum output or
simply having a non-operating but quick-starting power plant sitting idle in case it is needed, neither of
which causes a significant increase in fuel use or emissions, as confirmed by NREL’s analysis. Even when
these reserves are called upon, the quantity of generation and therefore emissions involved is minimal,
and regardless this generation directly displaces generation that would have come from another fossil-
fired power plant.
A final permutation of this myth is that increased levels of wind will cause generation to shift from more
efficient gas combined cycle plants to more flexible but less efficient gas combustion turbines. This claim is
refuted by all wind integration studies to date, which have found greatly reduced generation from gas
combustion turbines at higher wind penetrations. For example, PJM’s renewable integration study174
shows Simple Cycle Gas Turbine (SCGT) generation significantly decreasing as the use of renewable
energy increases. A California renewable integration study175 shows gas turbine generation declining as
renewable generation increases. This conclusion was also reached in the Minnesota Department of
Commerce wind integration study.176 Finally, the New England Wind Integration Study177 also shows gas
turbine generation declining as wind generation increases.
174 http://www.pjm.com/~/media/committees-groups/subcommittees/irs/postings/pjm-pris-final-project-review.ashx, at slide 55 175 http://www.energy.ca.gov/2007publications/CEC-500-2007-081/CEC-500-2007-081-APB.PDF, page 98 176https://mn.gov/commerce/industries/energy/distributed-energy/mrits.jsp 177 https://www.iso-ne.com/static-assets/documents/committees/comm_wkgrps/prtcpnts_comm/pac/reports/2010/newis_report.pdf, at page 213