renewable energy on small islands - gdrc · renewable energy on small islands – second edition...
TRANSCRIPT
Renewable Energyon Small IslandsSecond editionaugust 2000
Sponsored by:
Renewable Energy on Small IslandsSecond Edition
Author: Thomas Lynge Jensen, Forum for Energy and Development (FED)
Layout: GrafiCO/Ole Jensen, +45 35 36 29 43
Cover photos: Upper left: A 55 kW wind turbine of the Danish island of Aeroe.Photo provided by Aeroe Energy and EnvironmentalOffice.
Middle left: Solar water heaters on the Danish island of Aeroe.Photo provided by Aeroe Energy and EnvironmentalOffice.
Upper right: Photovoltaic installation on Marie Galante Island,Guadeloupe, French West Indies. Photo provided byADEME Guadeloupe.
Middle right: Waiah hydropower plant on Hawaii-island. Photo providedby Energy, Resource & Technology Division, State ofHawaii, USA
Lower right: Four 60 kW VERGNET wind turbines on Marie GalanteIsland, Guadeloupe, French West Indies. Photo provided byADEME Guadeloupe.
Printing: Vesterkopi
Printing cover; Green Graphic
No. printed: 200
ISBN: 87-90502-03-5
Copyright (c) 2000 by Forum for Energy and Development (FED)
Feel free to use the information in the report, but please state the source.
Renewable Energy on Small Islands – Second Edition August 2000 Table of Contents
Table of Contents
Foreword and Acknowledgements by the Author i
Introduction iii
Executive Summary v
1. The North Atlantic Ocean
Azores (Portugal) 1
Canary Island (Spain) 5
Cape Verde 9
Faeroe Islands (Denmark) 11
Madeira (Portugal) 13
Pellworm (Germany) 17
St. Pierre and Miquelon (France) 19
2. The South Atlantic Ocean
Ascension Island (UK) 21
St. Helena Island (UK) 23
3. The Baltic Sea
Aeroe (Denmark) 25
Gotland (Sweden) 31
Samsoe (Denmark) 35
4. The Mediterranean Sea
Corsica (France) 39
Crete (Greece) 41
Cyprus 43
Minorca (Spain) 47
5. The Indian Ocean
Mauritius 49
Reunion (France) 55
Renewable Energy on Small Islands – Second Edition August 2000 Table of Contents
7. The North Pacific Ocean
Hawaii (USA) 57
San Clemente Island (USA) 63
St. Paul Island (USA) 65
8. The South Pacific Ocean
Fiji 67
Isle of Pines (France) 73
King Island (Australia) 75
Kiribati 77
Thursday Island (Australia) 85
Rurutu Island (France) 89
Samoa 91
9. The Carribean Sea
Barbados 93
Curacau (The Netherlands) 97
Dominica 99
Guadeloupe (France) 103
Saint Lucia 107
Saint Vincent and the Grenadines 111
10. References 113
Appendix 1: Overview of Islands in the First Edition that are not Included in theSecond Edition
117
Renewable Energy on Small Islands – Second Edition August 2000 Foreword and Acknowledgements by the Author
i
Foreword andAcknowledgementsby the authorMr. Thomas Lynge Jensen,Forum for Energy andDevelopment (FED),Denmark
First Edition
The first edition of Renewable Energy onSmall Islands was published in April 1998 andwas financed by the Danish Council forSustainable Energy.1 The background for thereport was the decision by the DanishGovernment to establish an official RenewableEnergy Island (REI) – i.e. an island that willbecome 100% self-sufficient from renewableenergy sources. In November 1997 Samsoewas selected – among 5 candidates – tobecome the official Danish REI.
The overall objective of the overview ofrenewable energy on small islands was toprepare for future global co-operation andnetworking among REI’s.
Second Edition
Since the first edition much more and adequateinformation has been available (e.g. due to twomajor conferences) and major initiatives havebeen announced (e.g. the announcement of twoRenewable Energy Island Nations). Thereforeis a second edition needed.
This second edition includes new cases and up-dated information on cases from first edition.In relation to some of the cases from firstedition it has not been possible to obtain up-dated information. These cases are summarisedin appendix 1 to this second edition.
This second edition is financed as part of theproject Global Conference on RenewableEnergy Islands. The conference was held onthe Danish Island of Aeore the 15-16September 1999 and was financed by theEuropean Commission (SYNERGY-programme), the Danish Energy Agency, the
1 The report can still be downloaded in PDF-format from the homepage ofForum for Energy and Development (FED):http://www.energiudvikling.dk/projects.php3
Danish Council for Sustainable Energy andForum for Energy and Development (FED).2
Acknowledgements
Forum for Energy and Development (FED)wish to express a sincere appreciation to themany people who have provided informationto this overview.
FED especially wishes to thank Ms. VickyArgyraki, Manager, European Islands Energyand Environment Network (ISLENET),Brussels, Belgium, Ms. Despina I.Alatopoulou, Chemical Engineer, Centre forRenewable Energy Sources (C.R.E.S), Greeceand the French wind turbine manufactureVERGNET S.A. for providing much and veryuseful information.
The Report is Available on the Internet andby e-mail
This report can be downloaded in PDF-formaton the Internet at the homepage of Forum forEnergy and Development (FED):
http://www.energiudvikling.dk/projects.php3
or forwarded by e-mail as an PDF-attachmentby request to Forum for Energy andDevelopment on the following address:
Forum for Energy and Development (FED)Blegdamsvej 4B, 1st Floor2200 Copenhagen NDenmark
Fax: +45 35 24 77 17E-mail: [email protected]
2 The proceedings can be downloaded in PDF-format at the homepage ofForum for Energy and Development (FED) :http://www.energiudvikling.dk/projects.php3

Renewable Energy on Small Islands – Second Edition August 2000 Foreword and Acknowledgements by the Author
ii
Renewable Energy on Small Islands – Second Edition August 2000 Introduction
iii
Introduction
Objectives
The overall objectives of this overview are to:
► document that renewable energy is afeasible option on islands in regard toenvironment, technology, organisation,economics etc.
► facilitate global co-operation andnetworking among Renewable Energy Islands,i.e. islands that have decided to become 100%self-sufficient from renewable energy sources
Scope of the Report
The report is a global overview of renewableenergy utilisation and initiatives on smallislands.
The report includes descriptions of:
► already implemented and still functioningrenewable energy projects; and
► current and future plans for renewableenergy developments on small islands.
More specific the overview will - wherepossible - include a description of the islandsin regard to; size; population; energyconsumption; energy supply in regard totechnology, organisation, financing, andeducation; current and future plans forrenewable energy developments; and relevantcontact information.
The scope of the report is descriptive incontent, but the Executive Summary doesinclude some more evaluative and normativeelements.
Terminology
An island is “a land mass smaller than acontinent that is surrounded by water”.1 Theterm “island” in this report do not coversubmerged areas, land areas cut off on two ormore sides by water (such as an peninsula), orareas land-tied by dam or bridge.
A Renewable Energy Island (REI) is anisland that is 100% self-sufficient fromrenewable energy sources, including transport.
1 Wordnet 1.6 (www.cogsci.princeton.edu/~wn)
A small island have in this report beendelimited to an island that is the size or smallerthan 10,000 km2 i.e. the size of the island ofHawaii.
Methodology
This report is primarily a desk study based onalready available information. A minor part ofthe information contained in this report isbased on questionnaires and personalcommunications.
Most of the island presentations are “piecedtogether” by using several different references.This means that a specific reference utilised ata given paragraph/moment is not made explicit– this would be too cumbersome. The onlyexception is when tables are presented – thenreferences are made explicit. Referencesutilised are mentioned in the end of each of theisland presentations and orderedalphabetically. Detailed information about thereferences can be obtained in chapter 10.References.
To keep the information as accurate as possiblein most cases direct transcript of thereferences has been used. We hope that theauthors of the different references can acceptthis procedure.
Precautions
There are some precautions that are importantto keep in mind when reading this report orusing some of the information:
► Even though the perspective of this report isglobal it does of course not imply that thefindings are exhaustive - it only means that thereport includes cases from all over the world.The report does not pretend to have includedall the existing small islands with utilisation orpresent or future initiatives in regard torenewable energy.
► Renewable energy utilisation and initiativeshave been delimited to modern renewableenergy technologies. E.g. islands that havetheir energy needs covered from moretraditional renewable energy technologies suchas burning of biomass for cooking are notmentioned in this report.
► There is a big diversity regarding howdetailed the presented information is. This isdue to the fact that a great number of differentsources and references have been used.
Renewable Energy on Small Islands – Second Edition August 2000 Introduction
iv
► Some data are not up-to-date. As a guidingprinciple it has been chosen to use informationdating back from 1995 and onward.
► Neither Forum for Energy andDevelopment (FED), nor the EuropeanCommission or the Danish Energy Agency, donot make any warranty, expressed or implied,with respect to the information contained inthis report or assumes any liabilities withrespect to the use of this information.
► The European Commission or the DanishEnergy Agency do not necessarily share theviews expressed in the Executive Summary.
Structure of the Report
The following are the main categories forordering and presenting the islands2:
► The North Atlantic Ocean► The South Atlantic Ocean► The Baltic Sea► The Mediterranean Sea► The Indian Ocean► The North Pacific Ocean► The South Pacific Ocean► The Caribbean Sea
The islands are ordered alphabetically in eachof these categories.
2 This categorisation of the oceans and seas of the world are off course notcomplete – e.g. the North Sea is included as part of the North Atlantic Ocean.The reason is to obtain clarity.
Renewable Energy on Small Islands – Second Edition August 2000 Executive Summary
Forum for Energy and Development (FED)
v
Executive Summary
Introduction
The last few years has shown an increasedfocus of renewable energy on islands. A fewexamples: in 1997, Samsoe was announced theofficial Danish Renewable Energy Island(REI); in 1999, the first Global Conference onRenewable Energy Islands took place; in 1999,the Global Secretariat on Renewable EnergyIslands was established and in 2000, twonations in the Caribbean - St. Lucia andDominica - announced their intentions ofbecoming renewable energy nations.
However in nearby all of the islands aroundthe world the potential for renewable energy isnot yet tapped. For the majority of islandsexpensive and environmentally problematicfossil fuels are still the only energy sourcesutilised.
One of the reasons for the under-exploitationof renewable energy is lack of knowledge andawareness. Lack of knowledge and awarenessabout the few islands around the world thattoday actually have substantial utilisation andexperiences in regard to renewable energy, thevery big potential of renewable energyresources on islands, the maturation ofrenewable energy technologies, theircompetitiveness especially in island context,organisational models for planning,implementation, ownership, financing etc.
Consequently one of the objectives of thisoverview is to document that renewable energyon islands is a feasible option in regard toenvironment, technology, organisation,economics etc.
The other main objective is to facilitate globalco-operation and networking amongRenewable Energy Islands. More networkingand joint co-operation among islands with astrong ambition in regard to renewable energymay significantly strengthen the role of islandsas global forerunners for renewable energy.
Main Findings
Based on tables 1-6 presented in the end of thissection (pp. viii-xii) the following can beconcluded regarding the islands in theoverview:
Around the world a few islands already havetaken the decision to become a RenewableEnergy Island (REI) in the short or mediumterm.
Samsoe (Denmark), Pellworm (Germany),Aeroe (Denmark), Gotland (Sweden), ElHierro (Spain), Dominica and St. Lucia havean explicit target of becoming 100% self-sufficient from renewable energy sources.
Around the world a few islands already havesome of the characteristics of a RenewableEnergy Island (REI)
La Desirade (France), Fiji, Samsoe (Denmark),Pellworm (Germany) and Reunion (France) arecurrently producing more than 50% of theirelectricity from renewable energy sources
21% of the islands in the overview that areutilising renewables for electricity generationare producing between 25-50% of theirelectricity from renewable energy sources.
Nearly 70% of the islands in the overview thatare utilising renewables for electricitygeneration are producing between 0.7-25% oftheir electricity from renewable energysources.
A few islands are using solar water heaters ona very large scale (Barbados and Cyprus).
Islands with very big utilisation of renewableenergy for electricity production are mainlyutilising hydropower.
In the overview more than 50% of the islandswith more than 25% of the electricitygenerated from renewable energy resource areutilising hydropower.
Of the islands producing more than 25% of theelectricity from wind power all are (but one)connected by sea cable to another electricitygrid.
Renewable Energy on Small Islands – Second Edition August 2000 Executive Summary
Forum for Energy and Development (FED)
vi
Wind power is by far the most utilisedrenewable energy resource utilised forelectricity production.
Over 50% of the islands in the overview thathave utilised renewables for electricitygeneration have used wind power.
Over 25% and nearly 10% of the islands in theoverview utilising renewables for electricitygeneration have utilised hydropower andbiomass respectively.
Most islands are situated in the North AtlanticOcean.
Just over 40% of the islands in the overviewthat have utilised renewables are situated in theNorth Atlantic Ocean.
Around 12-14% of the islands in the overviewthat have utilised renewables is situated in theNorth Pacific Ocean, South Pacific Ocean andCaribbean Sea respectively.
By far the majority of islands are non-sovereign.
Nearly 75% of the islands in the overview thathave utilised renewables are connectedformally to a country from the developedworld.
Only 25% of the islands in the overview thathave utilised renewables are politicallyindependent islands - they are all developingcountries.
Why Islands are Important for thePromotion of Renewable Energy World-wide
On a global scale islands are relatively smallconsidering size, population, energyconsumption, emission of greenhouses gassesetc. But why then are islands important when itcomes to the promotion of renewable energyworld-wide? Why can islands in particular beglobal front-runners and show-cases forrenewable energy technologies and show theway to a sustainable energy future? There areseveral interrelated answers.
High Visibility:
Islands are land areas surrounded by water.This means they are well-defined entities notonly speaking of geography, but also in terms
of energy production, population, economyand so forth. Thus, islands can become highlyvisible laboratories for renewable energytechnology, organisation, and financing. REI’sare a very useful way to make future energy-systems visible and concrete.
Need for Demonstration of Renewable Energyin an Integrated and Organised Form:
If decision-makers world-wide should beinspired to aim at a broader use of renewableenergy as part of a sustainable development, itis necessary to demonstrate renewable energyin a large-scale, integrated and organised form,and placed in a well-defined area - i.e. a REI.
Large Scale Utilisation of Renewable EnergyPossible on Islands
A dramatic shift to renewable energy on alarge scale on continents/mainlands isunrealistic in the short and medium term inregard to technology, financing andorganisation. However it would be of highinterest to demonstrate the possibilities ofsmaller communities to base their entireenergy supply on renewable energy sources.Islands can cheaper, faster, and easier reach ahigher share of renewable energy in its energybalance than a much bigger mainland. Thevery smallness of the islands – that often isseen as a disadvantage – is in this contextactually an advantage.
More Progressive Attitudes towardsRenewable Energy:
Many islands have positive attitudes towardsthe utilisation of renewable energy also on thepolitical level.
One reason being the threat from globalwarming. Even though islands contribute onlynegligible to global emission of greenhousegasses, many islands around the world areamong the immediate victims of climatechange and instability caused by fossil fuelconsumption in industrialised countries.Islands thus have a strong interest in changingenergy patterns for instance by demonstratingnew sustainable ways of satisfying energyneeds.
Another reason for the more progressiveattitude found on islands is the near totalabsence of fossil fuel resources on islands. Inmany mainland countries, developing as wellas industrialised, one major barrier forpromotion of renewable energy resources is
Renewable Energy on Small Islands – Second Edition August 2000 Executive Summary
Forum for Energy and Development (FED)
vii
the presence of an economic and political elitethat has very strong interests in the utilisationof the countries fossil fuels resources either forexport or domestic purposes. Most islands’main resources are the ocean, the populationand the geography for tourism. Next to nonehave fossil fuel resources.
Competitive Advantage:
Most small islands around the world today aredependent on imported fossil fuels for theirenergy needs, especially for transport andelectricity production. Because of the smallsize and isolated location of many islands,infrastructure costs such as energy are up tillthree to four times higher than on themainland. The high price for fossil fuelscombined with the limited demand increasesthe unit cost of production for conventionalpower production. This creates a competitivesituation for renewable energy technologies onislands. Furthermore, most of the islands areendowed with good renewable resources,primarily sun and the wind.
Experiences Applied in non-island Areas:
Experiences gathered on islands can be used,not only on islands, but in principleeverywhere. REI’s can serve as demonstrationprojects for mainland local communities, notonly in developed countries, but also indeveloping countries. There are about 2.5billion people living outside a national grid indeveloping countries. These people also needelectricity services and experiences from REI’sare highly relevant in this context.
Furthermore, through concentrated effortssome small island states can serve asdemonstration nations. Despite their size smallisland states could set an example to theworld’s nations.
Conclusion
Today nearly all islands in the world are totallydependent on expensive and environmentallyproblematic fossil fuels for their energy needs.
But islands have a unique potential forrenewable energy - a competitive economicsituation for renewable energy technologies,good renewable energy resources, positiveattitude towards renewable energy, highlyvisible laboratories for technology,organisational methods and financing andserve as demonstration projects and nations.
At the same time globally there is a need todemonstrate renewable energy in a large-scale,integrated and organised form. This is notpossibly on mainland and continents in theshort and medium term for economically,technically and organisational reasons.Therefore islands are very important andinteresting when it comes to the promotion ofrenewable energy world-wide.
Today a very few islands already have some ofthe characteristics of a Renewable EnergyIsland and thereby use renewables extensively.Some islands have utilised renewable energyon a big scale. Some islands have set targets ofbecoming a Renewable Energy Island in theshort or medium term and St. Lucia andDominica have declared their intentions tobecome the first Renewable Energy Nations.All of the mature renewable energytechnologies have been utilised for electricityproduction on islands. Small islands as well asbig islands in regard to area, population andpower system have utilised renewables andislands in all regions and climates are utilisingrenewables. Islands in the developing as wellas developed world have experiences withrenewable energy. Consequently, there is goodpotential for future co-operation, exchange andnetworking among islands – both betweenislands that are very far on the path ofconverting their energy systems intosustainable energy systems and betweenislands that have just started.
Renewable Energy on Small Islands – Second Edition August 2000 Executive Summary
Forum for Energy and Development (FED)
viii
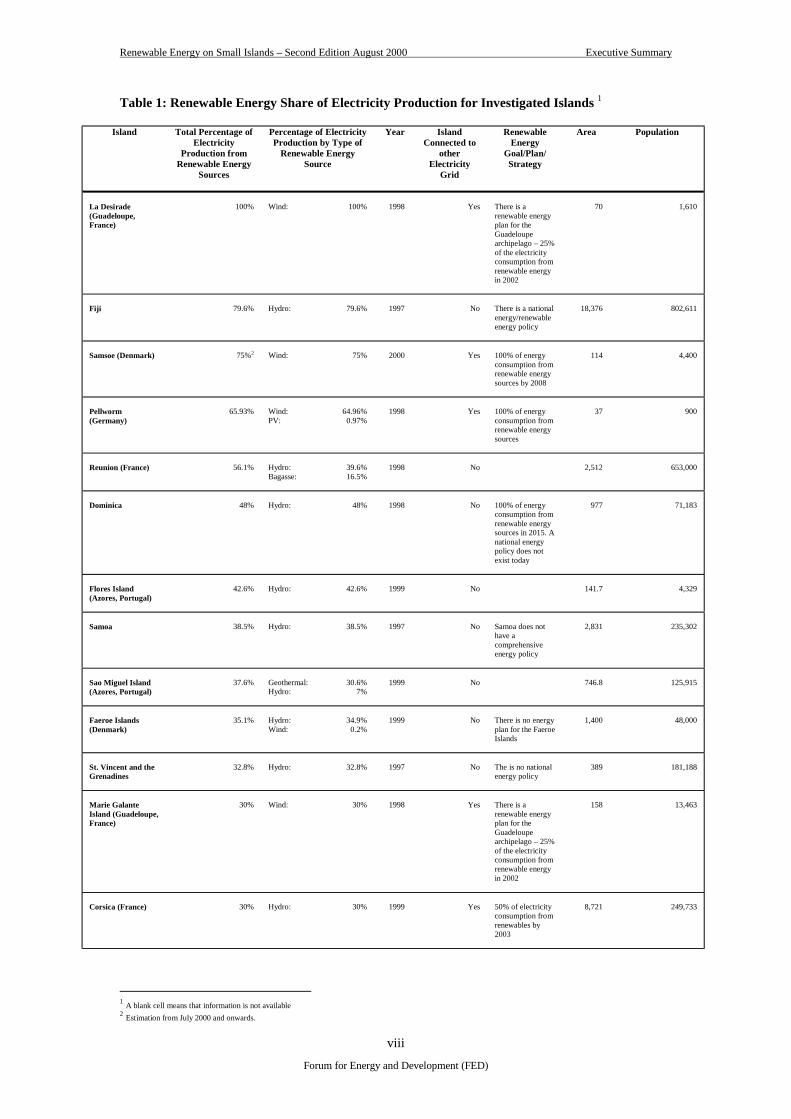
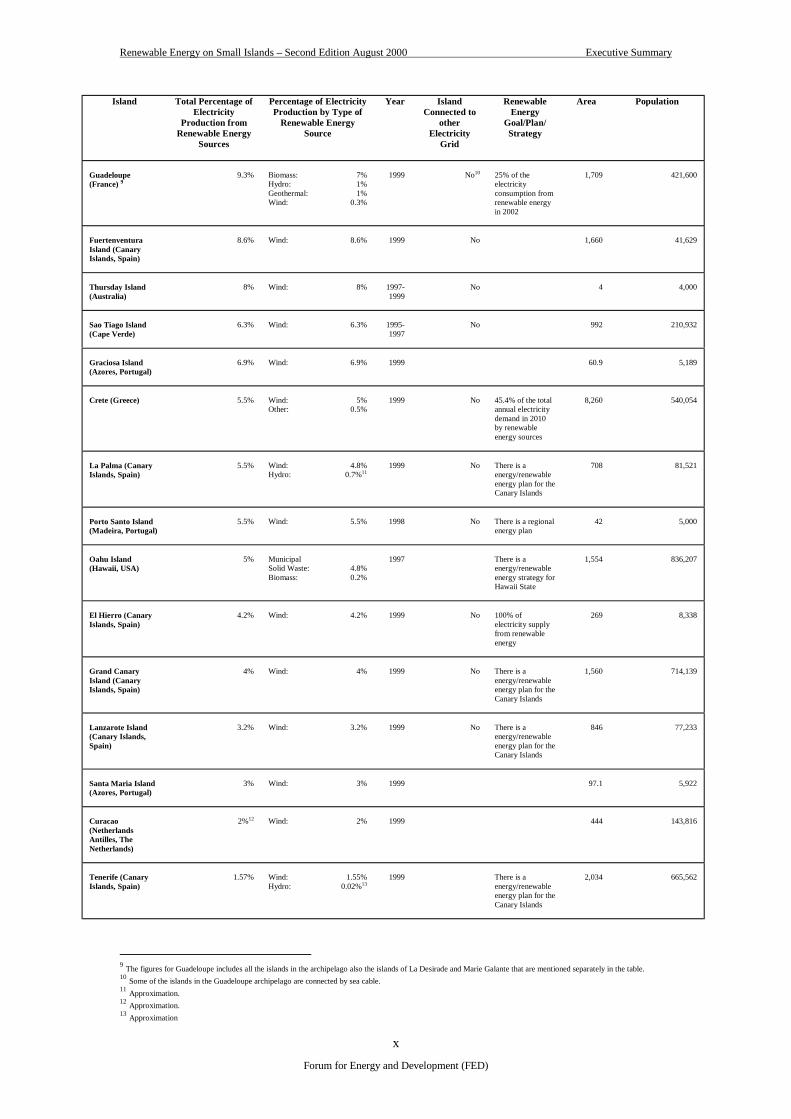
Table 1: Renewable Energy Share of Electricity Production for Investigated Islands 1
Island Total Percentage ofElectricity
Production fromRenewable Energy
Sources
Percentage of ElectricityProduction by Type of
Renewable EnergySource
Year IslandConnected to
otherElectricity
Grid
RenewableEnergy
Goal/Plan/Strategy
Area Population
La Desirade(Guadeloupe,France)
100% Wind: 100% 1998 Yes There is arenewable energyplan for theGuadeloupearchipelago – 25%of the electricityconsumption fromrenewable energyin 2002
70 1,610
Fiji 79.6% Hydro: 79.6% 1997 No There is a nationalenergy/renewableenergy policy
18,376 802,611
Samsoe (Denmark) 75%2 Wind: 75% 2000 Yes 100% of energyconsumption fromrenewable energysources by 2008
114 4,400
Pellworm(Germany)
65.93% Wind:PV:
64.96%0.97%
1998 Yes 100% of energyconsumption fromrenewable energysources
37 900
Reunion (France) 56.1% Hydro:Bagasse:
39.6%16.5%
1998 No 2,512 653,000
Dominica 48% Hydro: 48% 1998 No 100% of energyconsumption fromrenewable energysources in 2015. Anational energypolicy does notexist today
977 71,183
Flores Island(Azores, Portugal)
42.6% Hydro: 42.6% 1999 No 141.7 4,329
Samoa 38.5% Hydro: 38.5% 1997 No Samoa does nothave acomprehensiveenergy policy
2,831 235,302
Sao Miguel Island(Azores, Portugal)
37.6% Geothermal:Hydro:
30.6%7%
1999 No 746.8 125,915
Faeroe Islands(Denmark)
35.1% Hydro:Wind:
34.9%0.2%
1999 No There is no energyplan for the FaeroeIslands
1,400 48,000
St. Vincent and theGrenadines
32.8% Hydro: 32.8% 1997 No The is no nationalenergy policy
389 181,188
Marie GalanteIsland (Guadeloupe,France)
30% Wind: 30% 1998 Yes There is arenewable energyplan for theGuadeloupearchipelago – 25%of the electricityconsumption fromrenewable energyin 2002
158 13,463
Corsica (France) 30% Hydro: 30% 1999 Yes 50% of electricityconsumption fromrenewables by2003
8,721 249,733
1 A blank cell means that information is not available2 Estimation from July 2000 and onwards.
Renewable Energy on Small Islands – Second Edition August 2000 Executive Summary
Forum for Energy and Development (FED)
ix
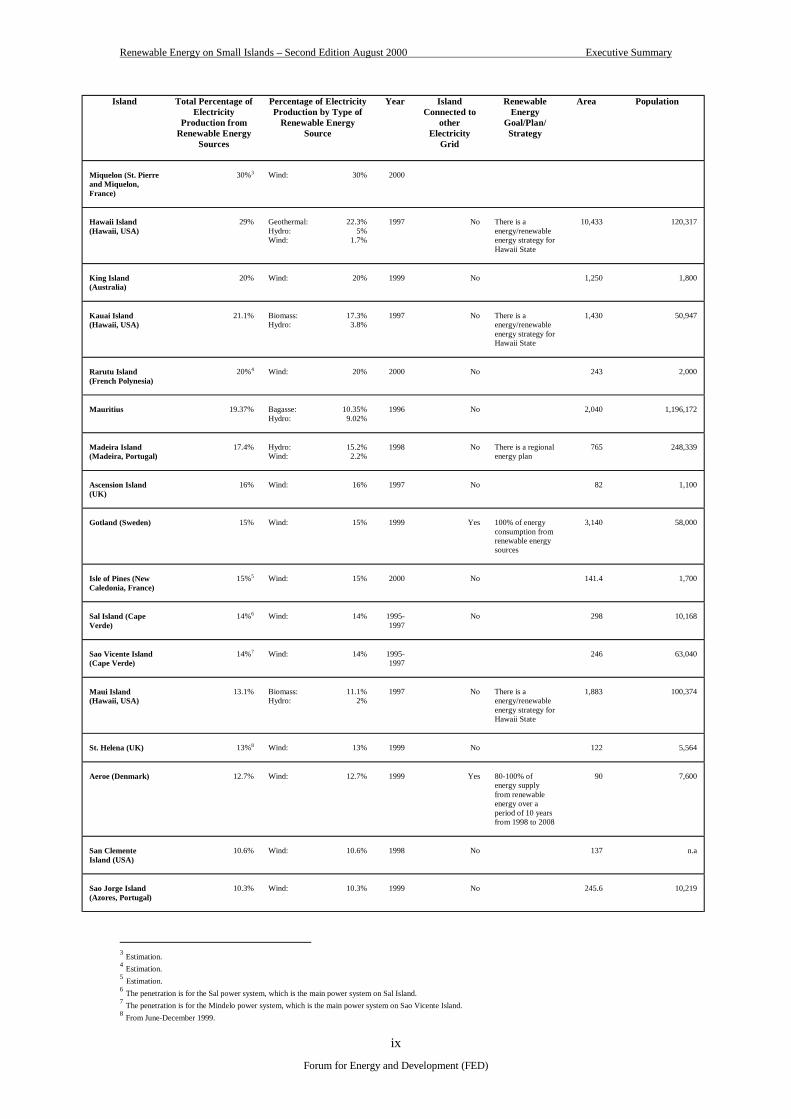
Island Total Percentage ofElectricity
Production fromRenewable Energy
Sources
Percentage of ElectricityProduction by Type of
Renewable EnergySource
Year IslandConnected to
otherElectricity
Grid
RenewableEnergy
Goal/Plan/Strategy
Area Population
Miquelon (St. Pierreand Miquelon,France)
30%3 Wind: 30% 2000
Hawaii Island(Hawaii, USA)
29% Geothermal:Hydro:Wind:
22.3%5%
1.7%
1997 No There is aenergy/renewableenergy strategy forHawaii State
10,433 120,317
King Island(Australia)
20% Wind: 20% 1999 No 1,250 1,800
Kauai Island(Hawaii, USA)
21.1% Biomass:Hydro:
17.3%3.8%
1997 No There is aenergy/renewableenergy strategy forHawaii State
1,430 50,947
Rarutu Island(French Polynesia)
20%4 Wind: 20% 2000 No 243 2,000
Mauritius 19.37% Bagasse:Hydro:
10.35%9.02%
1996 No 2,040 1,196,172
Madeira Island(Madeira, Portugal)
17.4% Hydro:Wind:
15.2%2.2%
1998 No There is a regionalenergy plan
765 248,339
Ascension Island(UK)
16% Wind: 16% 1997 No 82 1,100
Gotland (Sweden) 15% Wind: 15% 1999 Yes 100% of energyconsumption fromrenewable energysources
3,140 58,000
Isle of Pines (NewCaledonia, France)
15%5 Wind: 15% 2000 No 141.4 1,700
Sal Island (CapeVerde)
14%6 Wind: 14% 1995-1997
No 298 10,168
Sao Vicente Island(Cape Verde)
14%7 Wind: 14% 1995-1997
246 63,040
Maui Island(Hawaii, USA)
13.1% Biomass:Hydro:
11.1%2%
1997 No There is aenergy/renewableenergy strategy forHawaii State
1,883 100,374
St. Helena (UK) 13%8 Wind: 13% 1999 No 122 5,564
Aeroe (Denmark) 12.7% Wind: 12.7% 1999 Yes 80-100% ofenergy supplyfrom renewableenergy over aperiod of 10 yearsfrom 1998 to 2008
90 7,600
San ClementeIsland (USA)
10.6% Wind: 10.6% 1998 No 137 n.a
Sao Jorge Island(Azores, Portugal)
10.3% Wind: 10.3% 1999 No 245.6 10,219
3 Estimation.4 Estimation.5 Estimation.6 The penetration is for the Sal power system, which is the main power system on Sal Island.7 The penetration is for the Mindelo power system, which is the main power system on Sao Vicente Island.8 From June-December 1999.
Renewable Energy on Small Islands – Second Edition August 2000 Executive Summary
Forum for Energy and Development (FED)
x
Island Total Percentage ofElectricity
Production fromRenewable Energy
Sources
Percentage of ElectricityProduction by Type of
Renewable EnergySource
Year IslandConnected to
otherElectricity
Grid
RenewableEnergy
Goal/Plan/Strategy
Area Population
Guadeloupe(France) 9
9.3% Biomass:Hydro:Geothermal:Wind:
7%1%1%
0.3%
1999 No10 25% of theelectricityconsumption fromrenewable energyin 2002
1,709 421,600
FuertenventuraIsland (CanaryIslands, Spain)
8.6% Wind: 8.6% 1999 No 1,660 41,629
Thursday Island(Australia)
8% Wind: 8% 1997-1999
No 4 4,000
Sao Tiago Island(Cape Verde)
6.3% Wind: 6.3% 1995-1997
No 992 210,932
Graciosa Island(Azores, Portugal)
6.9% Wind: 6.9% 1999 60.9 5,189
Crete (Greece) 5.5% Wind:Other:
5%0.5%
1999 No 45.4% of the totalannual electricitydemand in 2010by renewableenergy sources
8,260 540,054
La Palma (CanaryIslands, Spain)
5.5% Wind:Hydro:
4.8%0.7%11
1999 No There is aenergy/renewableenergy plan for theCanary Islands
708 81,521
Porto Santo Island(Madeira, Portugal)
5.5% Wind: 5.5% 1998 No There is a regionalenergy plan
42 5,000
Oahu Island(Hawaii, USA)
5% MunicipalSolid Waste:Biomass:
4.8%0.2%
1997 There is aenergy/renewableenergy strategy forHawaii State
1,554 836,207
El Hierro (CanaryIslands, Spain)
4.2% Wind: 4.2% 1999 No 100% ofelectricity supplyfrom renewableenergy
269 8,338
Grand CanaryIsland (CanaryIslands, Spain)
4% Wind: 4% 1999 No There is aenergy/renewableenergy plan for theCanary Islands
1,560 714,139
Lanzarote Island(Canary Islands,Spain)
3.2% Wind: 3.2% 1999 No There is aenergy/renewableenergy plan for theCanary Islands
846 77,233
Santa Maria Island(Azores, Portugal)
3% Wind: 3% 1999 97.1 5,922
Curacao(NetherlandsAntilles, TheNetherlands)
2%12 Wind: 2% 1999 444 143,816
Tenerife (CanaryIslands, Spain)
1.57% Wind:Hydro:
1.55%0.02%13
1999 There is aenergy/renewableenergy plan for theCanary Islands
2,034 665,562
9 The figures for Guadeloupe includes all the islands in the archipelago also the islands of La Desirade and Marie Galante that are mentioned separately in the table.10 Some of the islands in the Guadeloupe archipelago are connected by sea cable.11 Approximation.12 Approximation.13 Approximation
Renewable Energy on Small Islands – Second Edition August 2000 Executive Summary
Forum for Energy and Development (FED)
xi
Island Total Percentage ofElectricity
Production fromRenewable Energy
Sources
Percentage of ElectricityProduction by Type of
Renewable EnergySource
Year IslandConnected to
otherElectricity
Grid
RenewableEnergy
Goal/Plan/Strategy
Area Population
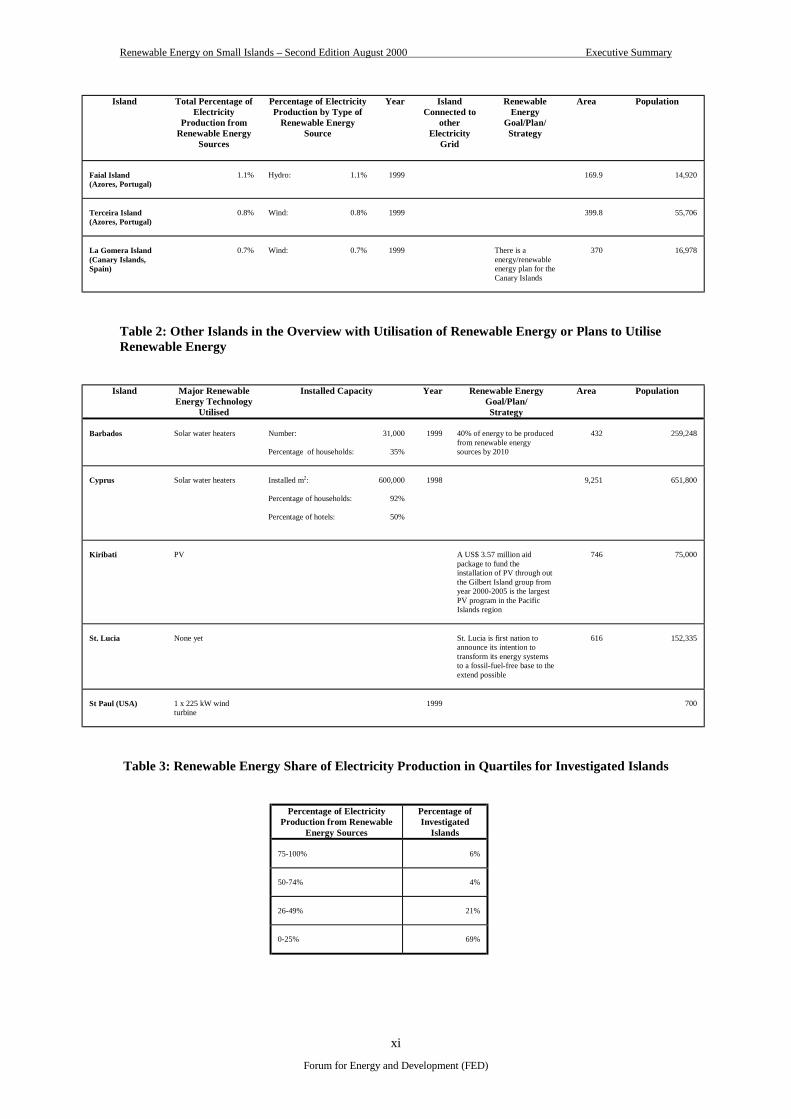
Faial Island(Azores, Portugal)
1.1% Hydro: 1.1% 1999 169.9 14,920
Terceira Island(Azores, Portugal)
0.8% Wind: 0.8% 1999 399.8 55,706
La Gomera Island(Canary Islands,Spain)
0.7% Wind: 0.7% 1999 There is aenergy/renewableenergy plan for theCanary Islands
370 16,978
Table 2: Other Islands in the Overview with Utilisation of Renewable Energy or Plans to UtiliseRenewable Energy
Island Major RenewableEnergy Technology
Utilised
Installed Capacity Year Renewable EnergyGoal/Plan/Strategy
Area Population
Barbados Solar water heaters Number:
Percentage of households:
31,000
35%
1999 40% of energy to be producedfrom renewable energysources by 2010
432 259,248
Cyprus Solar water heaters Installed m2:
Percentage of households:
Percentage of hotels:
600,000
92%
50%
1998 9,251 651,800
Kiribati PV A US$ 3.57 million aidpackage to fund theinstallation of PV through outthe Gilbert Island group fromyear 2000-2005 is the largestPV program in the PacificIslands region
746 75,000
St. Lucia None yet St. Lucia is first nation toannounce its intention totransform its energy systemsto a fossil-fuel-free base to theextend possible
616 152,335
St Paul (USA) 1 x 225 kW windturbine
1999 700
Table 3: Renewable Energy Share of Electricity Production in Quartiles for Investigated Islands
Percentage of ElectricityProduction from Renewable
Energy Sources
Percentage ofInvestigated
Islands
75-100% 6%
50-74% 4%
26-49% 21%
0-25% 69%
Renewable Energy on Small Islands – Second Edition August 2000 Executive Summary
Forum for Energy and Development (FED)
xii
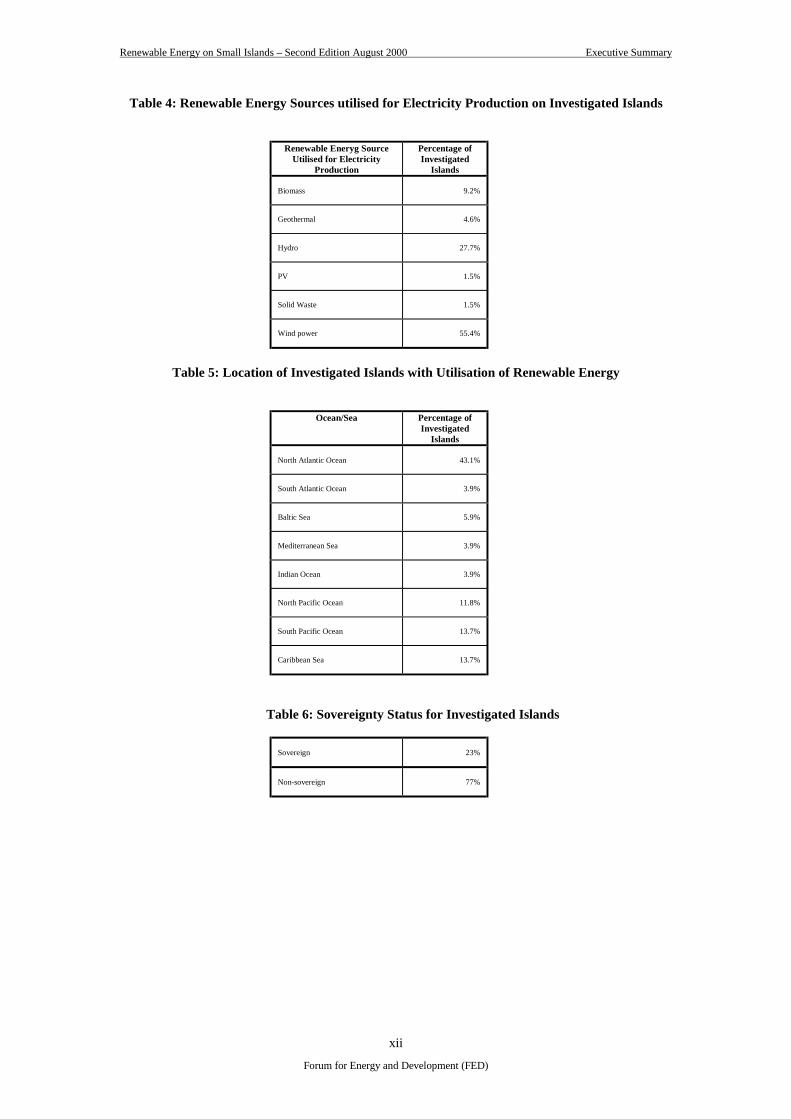
Table 4: Renewable Energy Sources utilised for Electricity Production on Investigated Islands
Renewable Eneryg SourceUtilised for Electricity
Production
Percentage ofInvestigated
Islands
Biomass 9.2%
Geothermal 4.6%
Hydro 27.7%
PV 1.5%
Solid Waste 1.5%
Wind power 55.4%
Table 5: Location of Investigated Islands with Utilisation of Renewable Energy
Ocean/Sea Percentage ofInvestigated
Islands
North Atlantic Ocean 43.1%
South Atlantic Ocean 3.9%
Baltic Sea 5.9%
Mediterranean Sea 3.9%
Indian Ocean 3.9%
North Pacific Ocean 11.8%
South Pacific Ocean 13.7%
Caribbean Sea 13.7%
Table 6: Sovereignty Status for Investigated Islands
Sovereign 23%
Non-sovereign 77%
Renewable Energy on Small Islands – Second Edition August 2000 The North Atlantic Ocean
1
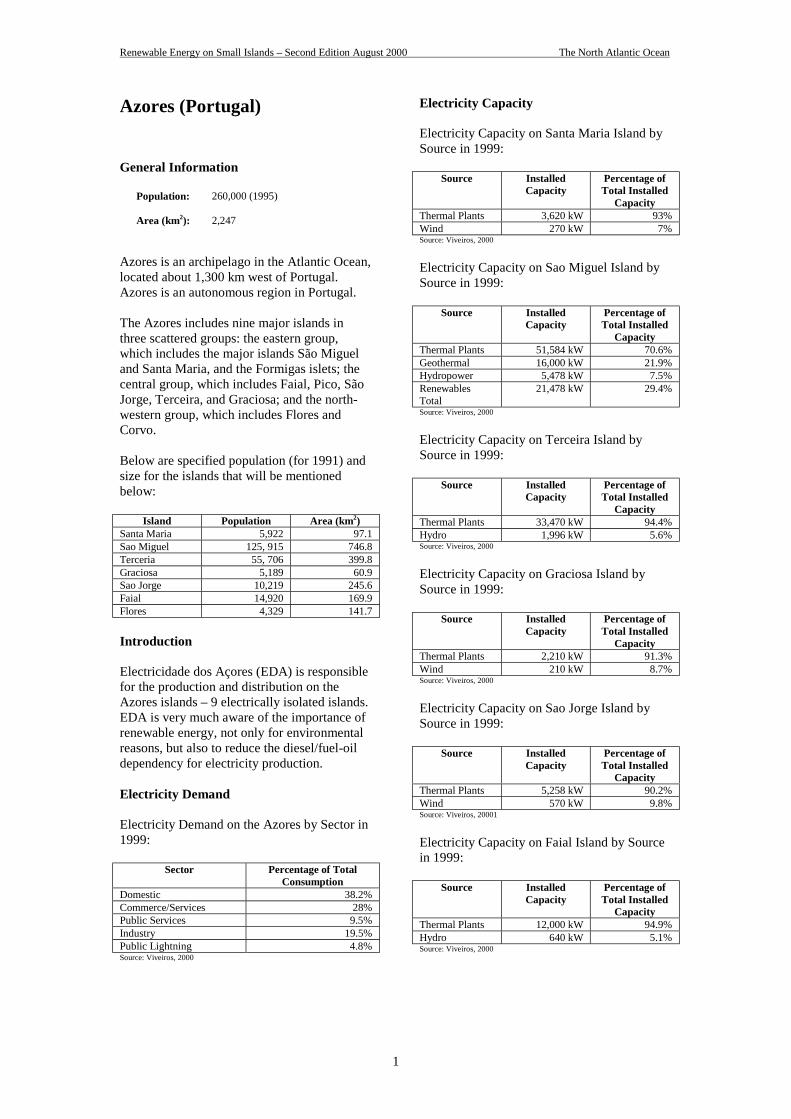
Azores (Portugal)
General Information
Population: 260,000 (1995)
Area (km2): 2,247
Azores is an archipelago in the Atlantic Ocean,located about 1,300 km west of Portugal.Azores is an autonomous region in Portugal.
The Azores includes nine major islands inthree scattered groups: the eastern group,which includes the major islands São Migueland Santa Maria, and the Formigas islets; thecentral group, which includes Faial, Pico, SãoJorge, Terceira, and Graciosa; and the north-western group, which includes Flores andCorvo.
Below are specified population (for 1991) andsize for the islands that will be mentionedbelow:
Island Population Area (km2)Santa Maria 5,922 97.1Sao Miguel 125, 915 746.8Terceria 55, 706 399.8Graciosa 5,189 60.9Sao Jorge 10,219 245.6Faial 14,920 169.9Flores 4,329 141.7
Introduction
Electricidade dos Açores (EDA) is responsiblefor the production and distribution on theAzores islands – 9 electrically isolated islands.EDA is very much aware of the importance ofrenewable energy, not only for environmentalreasons, but also to reduce the diesel/fuel-oildependency for electricity production.
Electricity Demand
Electricity Demand on the Azores by Sector in1999:
Sector Percentage of TotalConsumption
Domestic 38.2%Commerce/Services 28%Public Services 9.5%Industry 19.5%Public Lightning 4.8%Source: Viveiros, 2000
Electricity Capacity
Electricity Capacity on Santa Maria Island bySource in 1999:
Source InstalledCapacity
Percentage ofTotal Installed
CapacityThermal Plants 3,620 kW 93%Wind 270 kW 7%Source: Viveiros, 2000
Electricity Capacity on Sao Miguel Island bySource in 1999:
Source InstalledCapacity
Percentage ofTotal Installed
CapacityThermal Plants 51,584 kW 70.6%Geothermal 16,000 kW 21.9%Hydropower 5,478 kW 7.5%RenewablesTotal
21,478 kW 29.4%
Source: Viveiros, 2000
Electricity Capacity on Terceira Island bySource in 1999:
Source InstalledCapacity
Percentage ofTotal Installed
CapacityThermal Plants 33,470 kW 94.4%Hydro 1,996 kW 5.6%Source: Viveiros, 2000
Electricity Capacity on Graciosa Island bySource in 1999:
Source InstalledCapacity
Percentage ofTotal Installed
CapacityThermal Plants 2,210 kW 91.3%Wind 210 kW 8.7%Source: Viveiros, 2000
Electricity Capacity on Sao Jorge Island bySource in 1999:
Source InstalledCapacity
Percentage ofTotal Installed
CapacityThermal Plants 5,258 kW 90.2%Wind 570 kW 9.8%Source: Viveiros, 20001
Electricity Capacity on Faial Island by Sourcein 1999:
Source InstalledCapacity
Percentage ofTotal Installed
CapacityThermal Plants 12,000 kW 94.9%Hydro 640 kW 5.1%Source: Viveiros, 2000
Renewable Energy on Small Islands – Second Edition August 2000 The North Atlantic Ocean
2
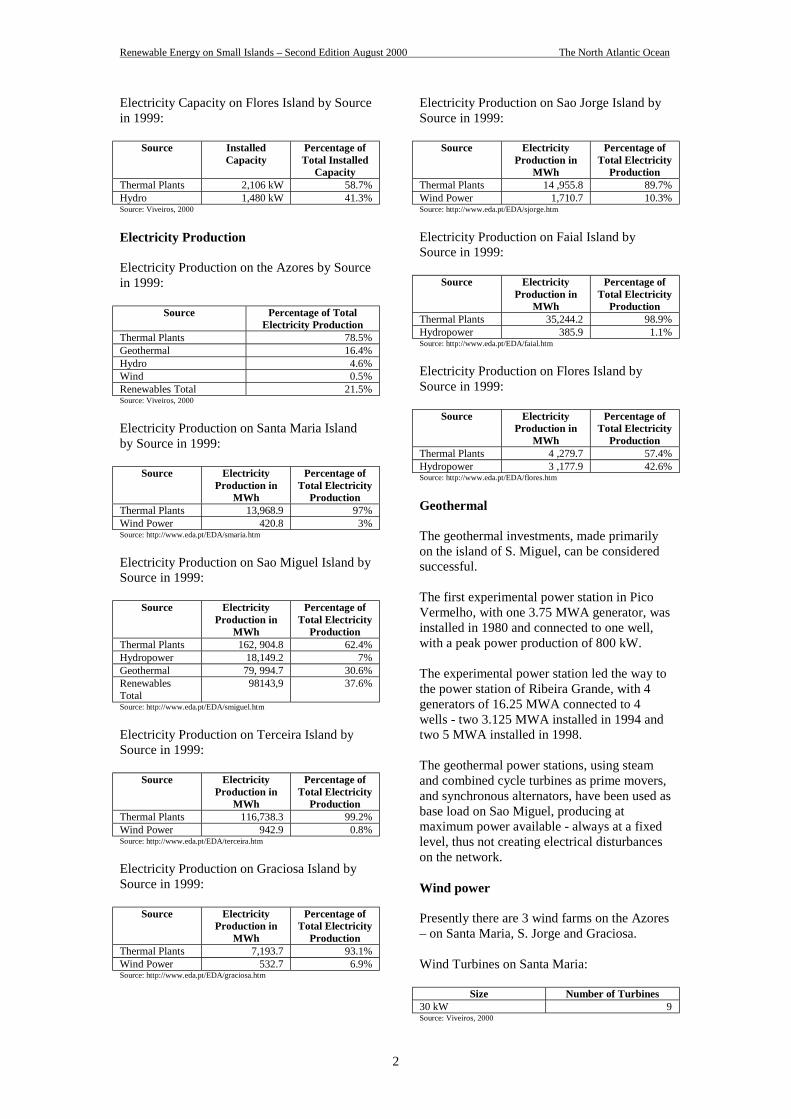
Electricity Capacity on Flores Island by Sourcein 1999:
Source InstalledCapacity
Percentage ofTotal Installed
CapacityThermal Plants 2,106 kW 58.7%Hydro 1,480 kW 41.3%Source: Viveiros, 2000
Electricity Production
Electricity Production on the Azores by Sourcein 1999:
Source Percentage of TotalElectricity Production
Thermal Plants 78.5%Geothermal 16.4%Hydro 4.6%Wind 0.5%Renewables Total 21.5%Source: Viveiros, 2000
Electricity Production on Santa Maria Islandby Source in 1999:
Source ElectricityProduction in
MWh
Percentage ofTotal Electricity
ProductionThermal Plants 13,968.9 97%Wind Power 420.8 3%Source: http://www.eda.pt/EDA/smaria.htm
Electricity Production on Sao Miguel Island bySource in 1999:
Source ElectricityProduction in
MWh
Percentage ofTotal Electricity
ProductionThermal Plants 162, 904.8 62.4%Hydropower 18,149.2 7%Geothermal 79, 994.7 30.6%RenewablesTotal
98143,9 37.6%
Source: http://www.eda.pt/EDA/smiguel.htm
Electricity Production on Terceira Island bySource in 1999:
Source ElectricityProduction in
MWh
Percentage ofTotal Electricity
ProductionThermal Plants 116,738.3 99.2%Wind Power 942.9 0.8%Source: http://www.eda.pt/EDA/terceira.htm
Electricity Production on Graciosa Island bySource in 1999:
Source ElectricityProduction in
MWh
Percentage ofTotal Electricity
ProductionThermal Plants 7,193.7 93.1%Wind Power 532.7 6.9%Source: http://www.eda.pt/EDA/graciosa.htm
Electricity Production on Sao Jorge Island bySource in 1999:
Source ElectricityProduction in
MWh
Percentage ofTotal Electricity
ProductionThermal Plants 14 ,955.8 89.7%Wind Power 1,710.7 10.3%Source: http://www.eda.pt/EDA/sjorge.htm
Electricity Production on Faial Island bySource in 1999:
Source ElectricityProduction in
MWh
Percentage ofTotal Electricity
ProductionThermal Plants 35,244.2 98.9%Hydropower 385.9 1.1%Source: http://www.eda.pt/EDA/faial.htm
Electricity Production on Flores Island bySource in 1999:
Source ElectricityProduction in
MWh
Percentage ofTotal Electricity
ProductionThermal Plants 4 ,279.7 57.4%Hydropower 3 ,177.9 42.6%Source: http://www.eda.pt/EDA/flores.htm
Geothermal
The geothermal investments, made primarilyon the island of S. Miguel, can be consideredsuccessful.
The first experimental power station in PicoVermelho, with one 3.75 MWA generator, wasinstalled in 1980 and connected to one well,with a peak power production of 800 kW.
The experimental power station led the way tothe power station of Ribeira Grande, with 4generators of 16.25 MWA connected to 4wells - two 3.125 MWA installed in 1994 andtwo 5 MWA installed in 1998.
The geothermal power stations, using steamand combined cycle turbines as prime movers,and synchronous alternators, have been used asbase load on Sao Miguel, producing atmaximum power available - always at a fixedlevel, thus not creating electrical disturbanceson the network.
Wind power
Presently there are 3 wind farms on the Azores– on Santa Maria, S. Jorge and Graciosa.
Wind Turbines on Santa Maria:
Size Number of Turbines30 kW 9Source: Viveiros, 2000
Renewable Energy on Small Islands – Second Edition August 2000 The North Atlantic Ocean
3
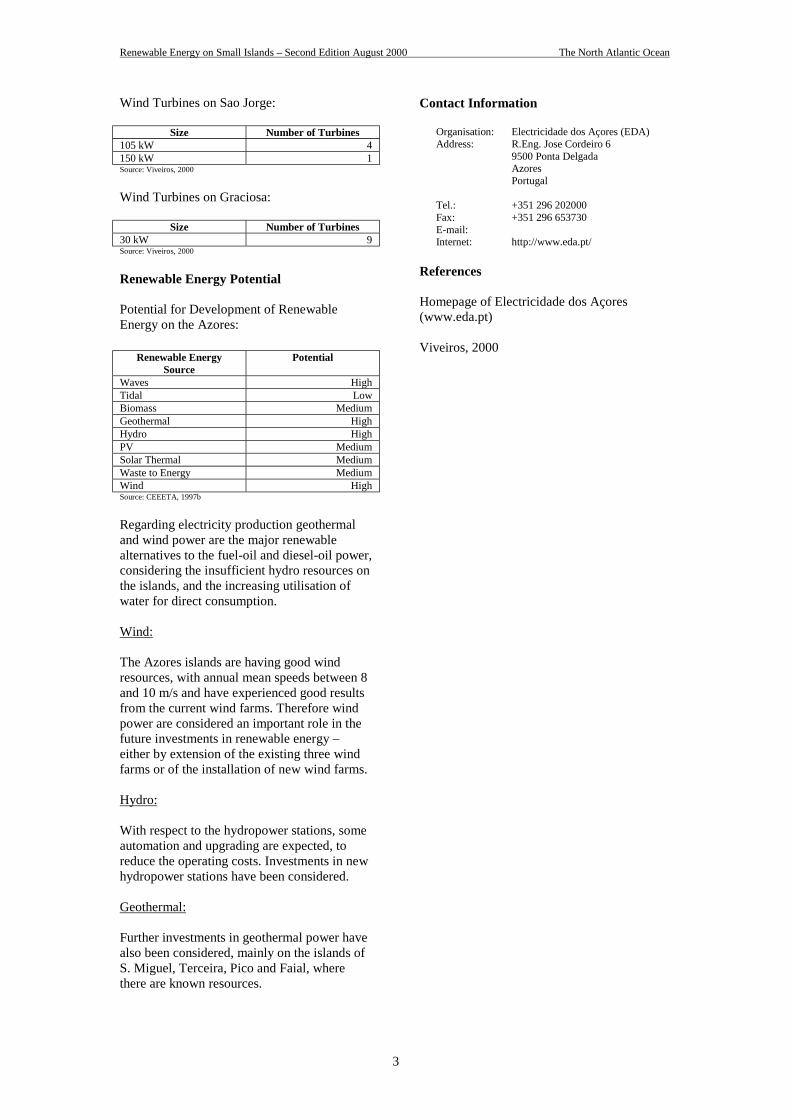
Wind Turbines on Sao Jorge:
Size Number of Turbines105 kW 4150 kW 1Source: Viveiros, 2000
Wind Turbines on Graciosa:
Size Number of Turbines30 kW 9Source: Viveiros, 2000
Renewable Energy Potential
Potential for Development of RenewableEnergy on the Azores:
Renewable EnergySource
Potential
Waves HighTidal LowBiomass MediumGeothermal HighHydro HighPV MediumSolar Thermal MediumWaste to Energy MediumWind HighSource: CEEETA, 1997b
Regarding electricity production geothermaland wind power are the major renewablealternatives to the fuel-oil and diesel-oil power,considering the insufficient hydro resources onthe islands, and the increasing utilisation ofwater for direct consumption.
Wind:
The Azores islands are having good windresources, with annual mean speeds between 8and 10 m/s and have experienced good resultsfrom the current wind farms. Therefore windpower are considered an important role in thefuture investments in renewable energy –either by extension of the existing three windfarms or of the installation of new wind farms.
Hydro:
With respect to the hydropower stations, someautomation and upgrading are expected, toreduce the operating costs. Investments in newhydropower stations have been considered.
Geothermal:
Further investments in geothermal power havealso been considered, mainly on the islands ofS. Miguel, Terceira, Pico and Faial, wherethere are known resources.
Contact Information
Organisation: Electricidade dos Açores (EDA)Address: R.Eng. Jose Cordeiro 6
9500 Ponta DelgadaAzoresPortugal
Tel.: +351 296 202000Fax: +351 296 653730E-mail:Internet: http://www.eda.pt/
References
Homepage of Electricidade dos Açores(www.eda.pt)
Viveiros, 2000

Renewable Energy on Small Islands – Second Edition August 2000 The North Atlantic Ocean
4
Renewable Energy on Small Islands – Second Edition August 2000 The North Atlantic Ocean
5
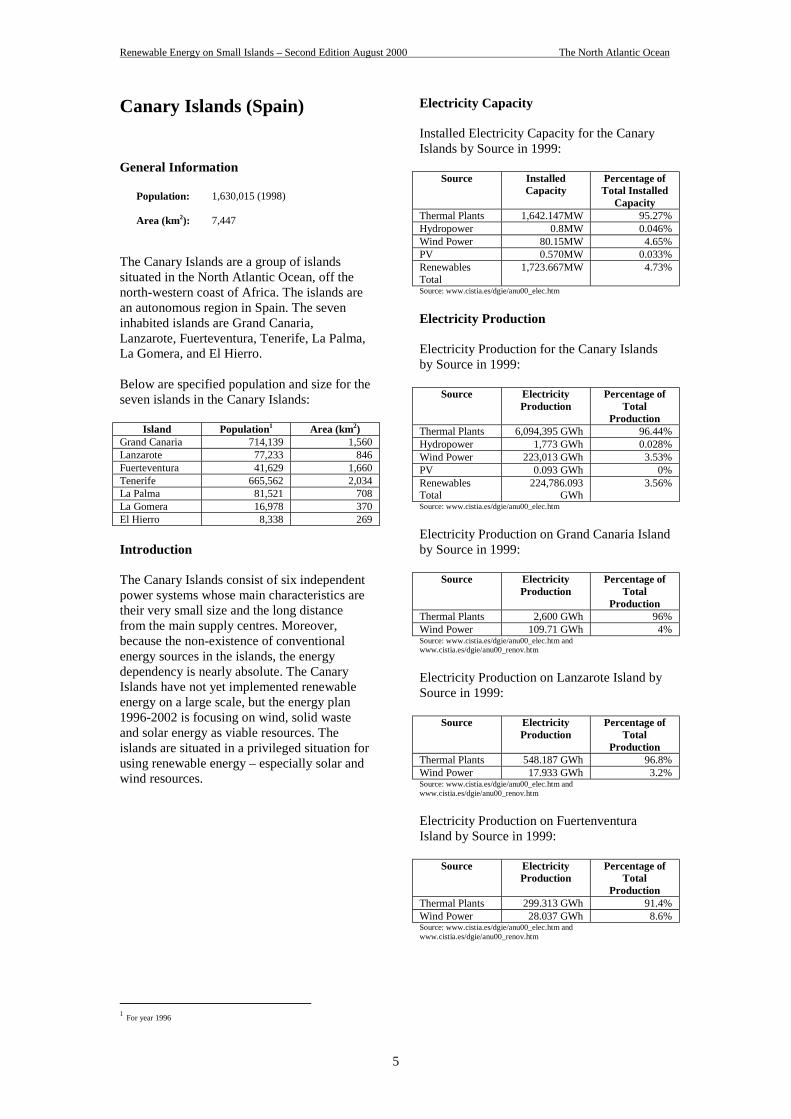
Canary Islands (Spain)
General Information
Population: 1,630,015 (1998)
Area (km2): 7,447
The Canary Islands are a group of islandssituated in the North Atlantic Ocean, off thenorth-western coast of Africa. The islands arean autonomous region in Spain. The seveninhabited islands are Grand Canaria,Lanzarote, Fuerteventura, Tenerife, La Palma,La Gomera, and El Hierro.
Below are specified population and size for theseven islands in the Canary Islands:
Island Population1 Area (km2)Grand Canaria 714,139 1,560Lanzarote 77,233 846Fuerteventura 41,629 1,660Tenerife 665,562 2,034La Palma 81,521 708La Gomera 16,978 370El Hierro 8,338 269
Introduction
The Canary Islands consist of six independentpower systems whose main characteristics aretheir very small size and the long distancefrom the main supply centres. Moreover,because the non-existence of conventionalenergy sources in the islands, the energydependency is nearly absolute. The CanaryIslands have not yet implemented renewableenergy on a large scale, but the energy plan1996-2002 is focusing on wind, solid wasteand solar energy as viable resources. Theislands are situated in a privileged situation forusing renewable energy – especially solar andwind resources.
1 For year 1996
Electricity Capacity
Installed Electricity Capacity for the CanaryIslands by Source in 1999:
Source InstalledCapacity
Percentage ofTotal Installed
CapacityThermal Plants 1,642.147MW 95.27%Hydropower 0.8MW 0.046%Wind Power 80.15MW 4.65%PV 0.570MW 0.033%RenewablesTotal
1,723.667MW 4.73%
Source: www.cistia.es/dgie/anu00_elec.htm
Electricity Production
Electricity Production for the Canary Islandsby Source in 1999:
Source ElectricityProduction
Percentage ofTotal
ProductionThermal Plants 6,094,395 GWh 96.44%Hydropower 1,773 GWh 0.028%Wind Power 223,013 GWh 3.53%PV 0.093 GWh 0%RenewablesTotal
224,786.093GWh
3.56%
Source: www.cistia.es/dgie/anu00_elec.htm
Electricity Production on Grand Canaria Islandby Source in 1999:
Source ElectricityProduction
Percentage ofTotal
ProductionThermal Plants 2,600 GWh 96%Wind Power 109.71 GWh 4%Source: www.cistia.es/dgie/anu00_elec.htm andwww.cistia.es/dgie/anu00_renov.htm
Electricity Production on Lanzarote Island bySource in 1999:
Source ElectricityProduction
Percentage ofTotal
ProductionThermal Plants 548.187 GWh 96.8%Wind Power 17.933 GWh 3.2%Source: www.cistia.es/dgie/anu00_elec.htm andwww.cistia.es/dgie/anu00_renov.htm
Electricity Production on FuertenventuraIsland by Source in 1999:
Source ElectricityProduction
Percentage ofTotal
ProductionThermal Plants 299.313 GWh 91.4%Wind Power 28.037 GWh 8.6%Source: www.cistia.es/dgie/anu00_elec.htm andwww.cistia.es/dgie/anu00_renov.htm
Renewable Energy on Small Islands – Second Edition August 2000 The North Atlantic Ocean
6
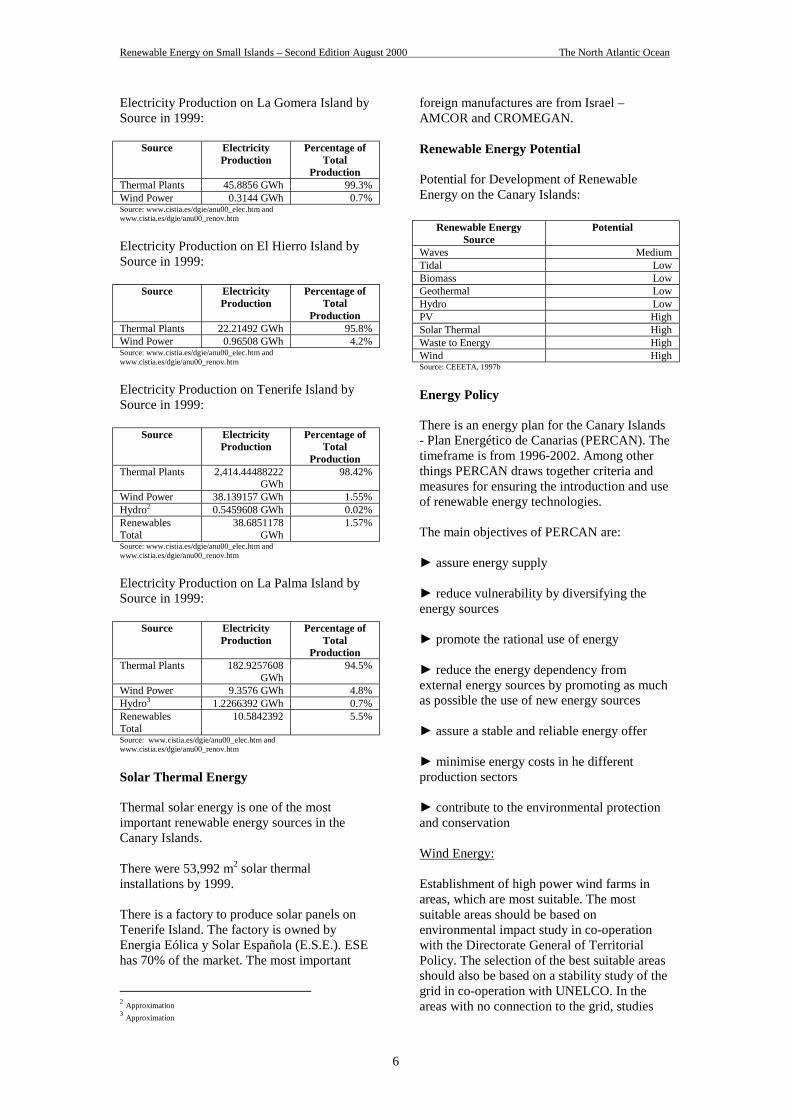
Electricity Production on La Gomera Island bySource in 1999:
Source ElectricityProduction
Percentage ofTotal
ProductionThermal Plants 45.8856 GWh 99.3%Wind Power 0.3144 GWh 0.7%Source: www.cistia.es/dgie/anu00_elec.htm andwww.cistia.es/dgie/anu00_renov.htm
Electricity Production on El Hierro Island bySource in 1999:
Source ElectricityProduction
Percentage ofTotal
ProductionThermal Plants 22.21492 GWh 95.8%Wind Power 0.96508 GWh 4.2%Source: www.cistia.es/dgie/anu00_elec.htm andwww.cistia.es/dgie/anu00_renov.htm
Electricity Production on Tenerife Island bySource in 1999:
Source ElectricityProduction
Percentage ofTotal
ProductionThermal Plants 2,414.44488222
GWh98.42%
Wind Power 38.139157 GWh 1.55%Hydro2 0.5459608 GWh 0.02%RenewablesTotal
38.6851178GWh
1.57%
Source: www.cistia.es/dgie/anu00_elec.htm andwww.cistia.es/dgie/anu00_renov.htm
Electricity Production on La Palma Island bySource in 1999:
Source ElectricityProduction
Percentage ofTotal
ProductionThermal Plants 182.9257608
GWh94.5%
Wind Power 9.3576 GWh 4.8%Hydro3 1.2266392 GWh 0.7%RenewablesTotal
10.5842392 5.5%
Source: www.cistia.es/dgie/anu00_elec.htm andwww.cistia.es/dgie/anu00_renov.htm
Solar Thermal Energy
Thermal solar energy is one of the mostimportant renewable energy sources in theCanary Islands.
There were 53,992 m2 solar thermalinstallations by 1999.
There is a factory to produce solar panels onTenerife Island. The factory is owned byEnergia Eólica y Solar Española (E.S.E.). ESEhas 70% of the market. The most important
2 Approximation3 Approximation
foreign manufactures are from Israel –AMCOR and CROMEGAN.
Renewable Energy Potential
Potential for Development of RenewableEnergy on the Canary Islands:
Renewable EnergySource
Potential
Waves MediumTidal LowBiomass LowGeothermal LowHydro LowPV HighSolar Thermal HighWaste to Energy HighWind HighSource: CEEETA, 1997b
Energy Policy
There is an energy plan for the Canary Islands- Plan Energético de Canarias (PERCAN). Thetimeframe is from 1996-2002. Among otherthings PERCAN draws together criteria andmeasures for ensuring the introduction and useof renewable energy technologies.
The main objectives of PERCAN are:
► assure energy supply
► reduce vulnerability by diversifying theenergy sources
► promote the rational use of energy
► reduce the energy dependency fromexternal energy sources by promoting as muchas possible the use of new energy sources
► assure a stable and reliable energy offer
► minimise energy costs in he differentproduction sectors
► contribute to the environmental protectionand conservation
Wind Energy:
Establishment of high power wind farms inareas, which are most suitable. The mostsuitable areas should be based onenvironmental impact study in co-operationwith the Directorate General of TerritorialPolicy. The selection of the best suitable areasshould also be based on a stability study of thegrid in co-operation with UNELCO. In theareas with no connection to the grid, studies
Renewable Energy on Small Islands – Second Edition August 2000 The North Atlantic Ocean
7
should be carried out regarding thepossibilities of using wind turbines as waterpumps. These studies should be carried out inco-operation with the Directorate General ofPublic Works, Housing and Water. Finally,demonstration projects should be planned.
Mini-hydro and Geothermal Energy:
A study should be carried out in co-operationwith the Directorate General of Public Works,Housing and Water about the possibilities andpotentials of mini-hydro and geothermalexploration.
Solid Waste Energy:
Solid waste as a energy resource should bepromoted among the companies who arehandling the waste and disposal of waste.Besides that, PERCAN should participate inthe framework of future planning concerningan efficient use of solid waste.
Thermal Solar Energy:
The installation of 36,000 m2 of solar panels ina period of 6 years. In order to achieve thisobjective the PERCAN includes the followingmeasures:
► set up an operator agent to start theprogramme
► a system of financing installations
► officially approved collectors, installationsmade by an accredited enterprise, maintenanceguarantee etc.
► promotion actions – demonstrations inpublic establishments, promotion in the hotelsector, press and radio dissemination,particular incentives to local entities, privatepotential user etc.
PV:
Realisation of studies, the purpose of which isto determine the potential for PV in rural areas.These studies should mainly be focussed onapplications isolated from the grid.
Biomass Energy:
Feasibility studies, experiences, pilot anddemonstration projects should be carried outconcerning the use of energy crops in theproduction of, for example, bio-fuels as well asutilisation of forest and farming waste.
Full Supply for El Hierro Island by meansof Renewable Energies
El Hierro is the smallest and most western ofthe Canary Islands. It has a population around8,000 and the island is approximately 270 km2.
Background:
The island Government of El Hierro adoptedthe Sustainable Development Programme inNovember 1999. The objective of theprogramme is to use a broad series of projects- in accordance with the guidelines laid downby the Rio Summit - to strike a balancebetween human development and conservationof the nature on the island.
The programme covers areas like agriculture,transport, tourism, industry, energy, water,agriculture, livestock etc. Thus, clean andsustainable energy production on the island is afundamental part of the broad strategy.
Objective:
The objective is 100% supply of electricityproduction on El Hierro from renewableenergy sources.
Existing Power System:
Electricity is produced at a conventional powersystem with a rated capacity of 8,280 kW andtwo wind turbines with a rated capacity of 280kW.
In 1999 wind power produced 4.2% of thegenerated electricity.
Average electricity consumption on the islandis around 2,000 kW, with peaks in the summerwhen there are more visitors on the island ofup to 4,000 kW.
Proposed Power System:
The unpredictable nature of wind, fluctuationsin the wind, periods of calm wind and the needfor stability in an electricity grid subject tovariable demand makes it technically difficultto match energy demand and supply with windpower if it does not have a storage system.
Therefore is it proposed to make a system withthe following components:
► a 10 MW wind farm consisting of 20turbines
Renewable Energy on Small Islands – Second Edition August 2000 The North Atlantic Ocean
8
► a water pumping system
► a water storage reservoir sited at an altitudeof 700m and with a total capacity of 500,000m3. The water reserves would cover an 8 dayperiod of calm winds
► a return loop and turbine connected to anelectric generator
All these elements would be necessary if thewater used comes from the sea.
If fresh water is chosen for the system, thefollowing components would also benecessary:
► a water reservoir down at sea level, thesame size as the upper one
► a sea water desalination plant
How the Proposed System would Work:
The wind turbines would pump water up fromsea level, or from the sea, to the reservoir at700 m, where a potential energy reservoirwould be created. The water would be pipeddown from the reservoir to a turbine andgenerator, and the flow would be regulatedaccording to energy demand from the grid.
If fresh water were used, a desalination plantwould be necessary. The advantages of usingfresh water would be a reduction in the level ofcorrosion in system components, and thepossibility of using the water produced fordomestic use and irrigation.
Contact Information
Organisation: Directorate General for Industry andEnergyGovernment of the Canary Islands
Address: C/ Cebrián, nº 3, Planta 1ª 35071 Las PalmasGran CanariaCanary IslandsSpain
Tel.: +34 928 45 20 80Fax: +34 928 45 20 70E-mail: [email protected]: http://www.cistia.es/dgie/
Organisation: Institute of Technology andRenewable Energies (ITER)
Address: Parque EólicoE-38611 San IsidroTenerifeCanary IslandsSpain
Tel.: +34 922 391 000Fax: +34 922 391 001
E-mail: [email protected]: http://www.iter.rcanaria.es/
References
CEETA, 1997b
Gonzalez, 1998
Gulias, 1999
Homepage of the Directorate General forIndustry and Energy, Government of theCanary Islands (http://www.cistia.es/dgie/)
Morales, 1999
Torres, 1998
Renewable Energy on Small Islands – Second Edition August 2000 The North Atlantic Ocean
9
Cape Verde
General Information
Population: 411,487 (2000 estimate)
Area (km2): 4,033
The archipelago of Cape Verde is situated inthe North Atlantic, 445 km off the westerncoast of Africa.
The archipelago consists of ten islands and fiveislets, which are divided into windward andleeward groups. The windward, or Barlavento,group on the north includes Santo Antão, SãoVicente, São Nicolau, Santa Luzia, Sal, andBoa Vista; the leeward, or Sotavento, group onthe south includes São Tiago, Brava, Fogo, andMaio.
Below are mentioned population and area forthe islands that will be specified regardingwind power in this section:
Island Population1 Area (km2)Sal 10,168 298Sao Vicente 63,040 246Sao Tiago 210,932 992
Introduction
The energy sector in Cape Verde ischaracterised by a high dependency onimported oil products. Due to its geographicallocation, the country cannot access the mainenergy networks and is forced to import oilderivatives. In 1996, the import of oil productscovered more than 70% of all available energysources. A great amount of the imported fuel isre-exported to supply marine and airtransportation. Another source of energy forCape Verde is biomass, particularly in the ruralareas. Biomass represents 37.4% of the totalconsumption of energy and is generally used tocook. Kerosene is also largely used forcooking in rural areas while butane gas ispreferred in urban areas.
The Power Sector
The electricity sector is quite decentralisedeven though the state owned power utilityElectra controls the production and distributionin the main population centres. There are 40electric grids in the entire country and only 4
1 2000 estimate.
belong to Electra – the rest is administered bymunicipalities. Here Town Councils areresponsible for both distribution andproduction.
Only 43% of the population have access to theelectricity network, and in the rural areas thisnumber does not exceed 14%. The almostcomplete lack of power transmission networkshas led to the proliferation of small powerplants, aimed at fulfilling the electricityrequirements of rural populations. In 1997 SanTiago had 19 power plants, Santo Anrao had 8,Boa Vista 6, Fogo 5, not to mention smallhousehold operated diesel groups (1 to 5KVA).
Wind Power
Cape Verde’s wind energy resources from thetrade-winds provides a strong north-easternflow for most of the year. Since the early1980s projects have documented the technicaland economical feasibility of today’s windenergy technology for Cape Verde.
Three Grid Connected Wind Farms:
Three wind farms with a total capacity of 2.4MW were installed in the main power systemsof Cape Verde in 1994. The turbines are eight300 kW Nordtank turbines.
Operation Statistics for Wind Farms at Sal (SalIsland), Mindelo (Sao Vicente Island) andPraia (Sao Tiago Island) Power Systems for1995-1997:
Sal(SalIsland)
Mindelo(SaoVicenteIsland)
Praia(SaoTiagoIsland)
Available DieselCapacity (MW)
4 11 12
Diesel Fuel Type Gas oil Heavyfuel
Gas oil
Installed WindTurbine Capacity(kW)
600 900 900
Avg. Wind Speed atHubheight (m/s)
7.4 10.4 7.8
Annual Wind EnergyProduction (MWh)
1440 4390 2500
Annual Power SystemLoad (MWh)
10120 32800 39870
Avg. Wind EnergyProduction (%)
14 14 6.3
Average WindTurbine CapacityFactor (%)
27 56 31
Annual Diesel FuelSavings (t)
340 970 615
Source: Hansen, 1998
Renewable Energy on Small Islands – Second Edition August 2000 The North Atlantic Ocean
10
The wind farms have established the technicalviability of this technology, and built technicalcapability in Electra for system operation andmonitoring. The projects have demonstratedthat there is considerable additional potentialfor cost reduction in the wind generation andscope for substantially increased penetrationinto the networks.
The penetration levels have been achievedwithout any special wind farm controllerexpect for the standard wind turbinecontrollers in each machine. Wind farm controlactions have been manual, exercised by thediesel power plant operators.
The total technical availability has been high(92-98%).
The turbines were jointly financed by theCapeverdean government and Denmark’sdevelopment agency Danida.
Extension of Existing Wind Farms
Modelling has shown that a further expansionof the three wind farms installed in the mainpower systems of Cape Verde is technicallypossible and economically attractive.
The World Bank has approved a US$ 22.2million in funding to Cape Verde for the CapeVerde Energy and Water Sector andDevelopment Project.
The project includes US$ 3.7 million for windpower development. This component wouldfinance the extension of the existing gridconnected wind farms on Sal, Sao Vicente, andSao Tiago with a total increase of up to 7.8MW. The planned 7.8 MW will almost triplethe installed wind capacity in Cape Verde tonearly 11 MW. The new projects could lead toa penetration of up to 1/3 in the island’s grids.
The wind farms would be constructed after theprivatisation of Electra.
Contact Information
Organisation: Empresa Pública Electricidade eÁgua (ELECTRA)
Address:
Tel.: +238 31-4448Fax: +238 31-5316E-mail:Internet:
References
CEEETA, 1997a
Davidson, 1999b
Hansen, 1998
Information provided by Instituto SuperiorTécnico, Portugal
Windpower Monthly, 1999
Worldbank, 1999
Renewable Energy on Small Islands – Second Edition August 2000 The North Atlantic Ocean
11
Faeroe Islands (Denmark)
General Information
Population: 48,000 (1994 estimate)
Area (km2): 1,400
The Faeroe Islands are located in the AtlanticOcean, almost midway between Norway,Iceland and Scotland. The Faeroe Islands arepart of the kingdom of Denmark. There are 18main islands separated by narrow sounds andfiords and a few small, uninhabited islands.
The Energy Sector – Introduction
Household heating and the fishing fleetconsume the major share of gas and diesel oil,while most of the fuel oil is used to produceelectricity.
The dominant form of space heating istraditional oil stoves. Electric heating isscarcely used at all, due to the relatively highpower prices. Surplus heat from the thermalplants is not utilised, with the exception ofheating at the power stations themselves.District heating is available in Thorshavn toonly a limited area. The area is supplied withsurplus heat from the local waste incinerationsystem, and supplies approximately 250houses.
There have been discussions on expanding thedistrict heating system to a far larger part ofThorshavn during recent years. But as this isnot financially viable under the currentcircumstances, it would not be possible for thedistrict heating company to carry out thisproject alone at present.
Electricity consumption fell from 1989 to1995, but has since risen slowly. Thefluctuation in consumption is mainly due to theeconomic decline and the fall in populationuntil 1995, followed by growth in both theeconomy and the population.
Slightly less than 90% of the inhabitants aresupplied by an integrated electricity net, whileSuderoe Island, with just under 5,000residents, and five small islands withpopulations totalling approximately 150, allhave their own island power stations.A very large percentage of electricity isproduced at hydroelectric plants as can be seenin the table below.
Electricity Capacity
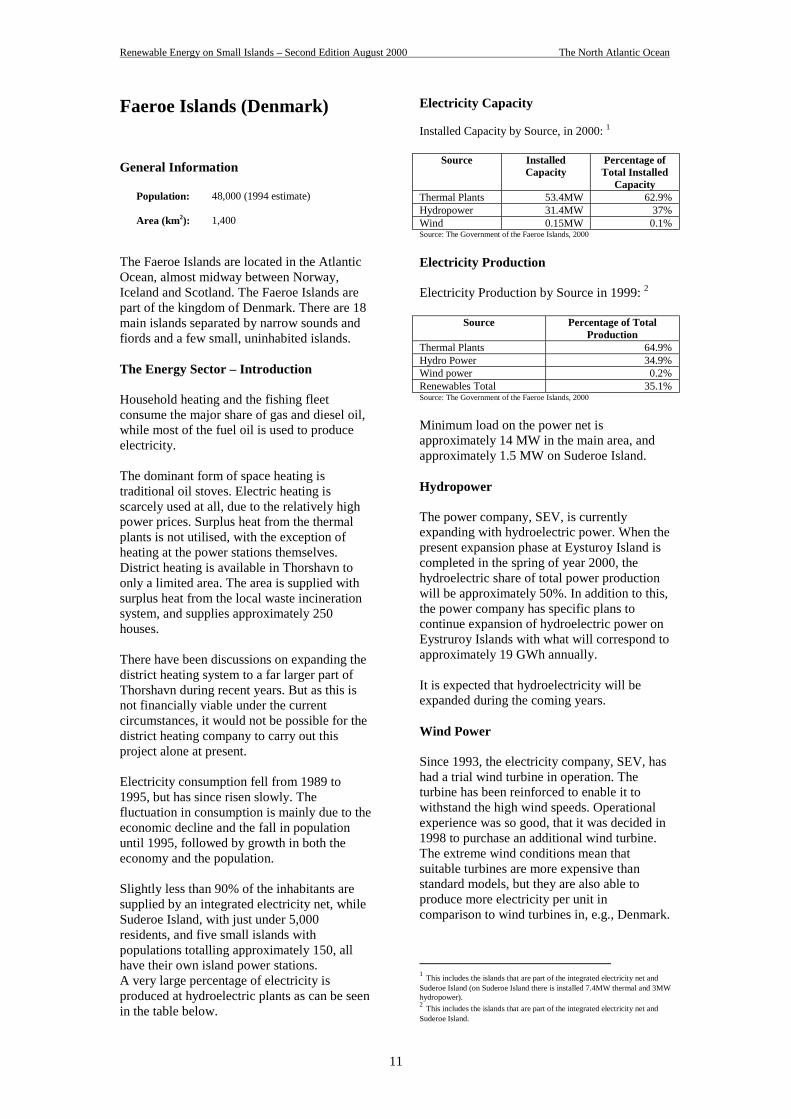
Installed Capacity by Source, in 2000: 1
Source InstalledCapacity
Percentage ofTotal Installed
CapacityThermal Plants 53.4MW 62.9%Hydropower 31.4MW 37%Wind 0.15MW 0.1%Source: The Government of the Faeroe Islands, 2000
Electricity Production
Electricity Production by Source in 1999: 2
Source Percentage of TotalProduction
Thermal Plants 64.9%Hydro Power 34.9%Wind power 0.2%Renewables Total 35.1%Source: The Government of the Faeroe Islands, 2000
Minimum load on the power net isapproximately 14 MW in the main area, andapproximately 1.5 MW on Suderoe Island.
Hydropower
The power company, SEV, is currentlyexpanding with hydroelectric power. When thepresent expansion phase at Eysturoy Island iscompleted in the spring of year 2000, thehydroelectric share of total power productionwill be approximately 50%. In addition to this,the power company has specific plans tocontinue expansion of hydroelectric power onEystruroy Islands with what will correspond toapproximately 19 GWh annually.
It is expected that hydroelectricity will beexpanded during the coming years.
Wind Power
Since 1993, the electricity company, SEV, hashad a trial wind turbine in operation. Theturbine has been reinforced to enable it towithstand the high wind speeds. Operationalexperience was so good, that it was decided in1998 to purchase an additional wind turbine.The extreme wind conditions mean thatsuitable turbines are more expensive thanstandard models, but they are also able toproduce more electricity per unit incomparison to wind turbines in, e.g., Denmark.
1 This includes the islands that are part of the integrated electricity net andSuderoe Island (on Suderoe Island there is installed 7.4MW thermal and 3MWhydropower).2 This includes the islands that are part of the integrated electricity net andSuderoe Island.
Renewable Energy on Small Islands – Second Edition August 2000 The North Atlantic Ocean
12
Energy Policy
There is no general energy plan for the FaeroeIslands.
Contact Information
Organisation: S.E.V.Address: Landavegur 92
P.O. 319FO-110 TorshavnThe Faeroe Islands
Tel.: +298 31 13 66Fax: +298 31 03 66E-mail: [email protected]:
References
Information provided by the Government ofthe Faeroe Islands
Klima 2012, 2000
Renewable Energy on Small Islands – Second Edition August 2000 The North Atlantic Ocean
13
Madeira (Portugal)
General Information
Population: 260,000 (1998)
Area (km2): 797
Madeira Islands is an archipelago in theAtlantic Ocean, located about 1,100 km south-west of Portugal. Madeira Islands are anautonomous region in Portugal.
The Madeiras consist of two inhabited islands,Madeira and Porto Santo, and two uninhabitedisland groups, the Desertas and the Selvagens.
Island Size PopulationMadeira Island 765 248,339Porto SantoIsland
42 5,000
Introduction
Due to its geographic location and because ithas no fossil energy resources, the Region ofMadeira is heavily dependent on outsideresources. Furthermore, because of therelatively small dimension of the energysystem, the main energy alternatives topetroleum, such as nuclear energy, gas andcoal, are not feasible. Local resources such asbiomass (firewood), hydro, wind and solarrepresented 8% of the primary energy sourcesin 1998.
Electricity Demand
Electricity Demand for Madeira Island bySector in 1998:
Sector Demand inGWh
Percentage ofTotal Demand
Industry 50.13 11%Public Services 39.83 9%Public Lightning 36.87 8%Commerce andServices
166.14 37%
Residential andAgricultural
162.6 35%
Source: AREAM, 2000
Electricity Demand for Porto Santo Island bySector in 1998:
Sector Demand inGWh
Percentage ofTotal Demand
Industry 2.26 16%Public Services 3.06 21%Public Lightning 1.09 8%Commerce andServices
3.47 24%
Residential andAgricultural
4.47 31%
Source: AREAM, 2000
The growth of demand for electricity in the1990's was very high, mainly due to theresidential and tertiary sectors. The electricitydemand increased from 261.30 GWh in 1990to 467.92 GWh in 1998. This is an increase of75%, which corresponds to an average growthof 7.5% per year.
Primary Energy Sources
Primary Energy Sources for the MadeiraIslands by Source in 1998:
Source Percentage of PrimaryEnergy Sources
Oil 92%Renewables 8%Source: AREAM, 2000
Electricity Capacity
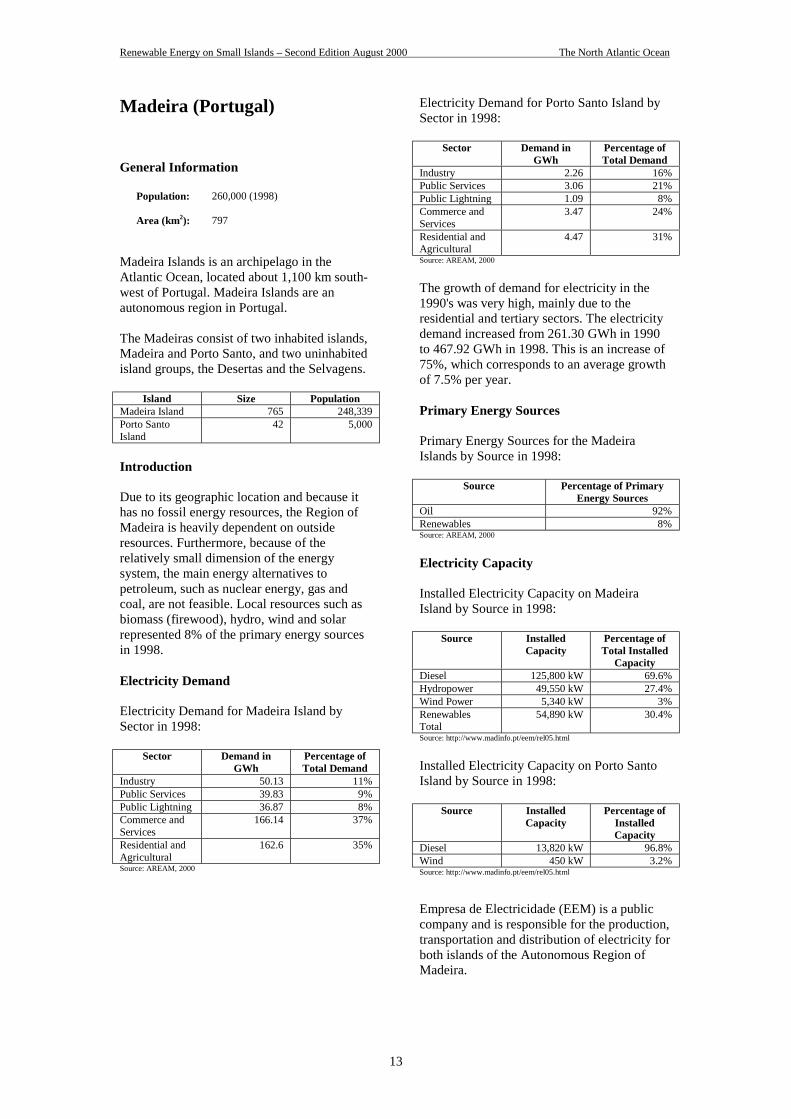
Installed Electricity Capacity on MadeiraIsland by Source in 1998:
Source InstalledCapacity
Percentage ofTotal Installed
CapacityDiesel 125,800 kW 69.6%Hydropower 49,550 kW 27.4%Wind Power 5,340 kW 3%RenewablesTotal
54,890 kW 30.4%
Source: http://www.madinfo.pt/eem/rel05.html
Installed Electricity Capacity on Porto SantoIsland by Source in 1998:
Source InstalledCapacity
Percentage ofInstalledCapacity
Diesel 13,820 kW 96.8%Wind 450 kW 3.2%Source: http://www.madinfo.pt/eem/rel05.html
Empresa de Electricidade (EEM) is a publiccompany and is responsible for the production,transportation and distribution of electricity forboth islands of the Autonomous Region ofMadeira.
Renewable Energy on Small Islands – Second Edition August 2000 The North Atlantic Ocean
14
Electricity Production
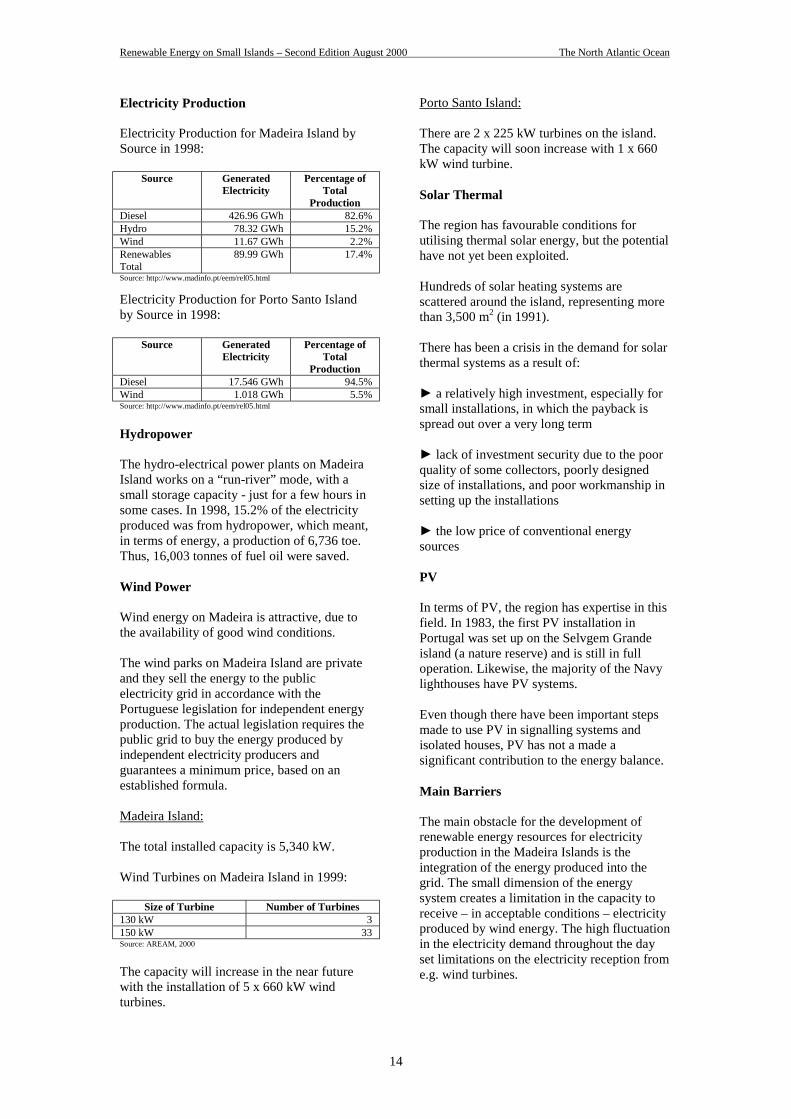
Electricity Production for Madeira Island bySource in 1998:
Source GeneratedElectricity
Percentage ofTotal
ProductionDiesel 426.96 GWh 82.6%Hydro 78.32 GWh 15.2%Wind 11.67 GWh 2.2%RenewablesTotal
89.99 GWh 17.4%
Source: http://www.madinfo.pt/eem/rel05.html
Electricity Production for Porto Santo Islandby Source in 1998:
Source GeneratedElectricity
Percentage ofTotal
ProductionDiesel 17.546 GWh 94.5%Wind 1.018 GWh 5.5%Source: http://www.madinfo.pt/eem/rel05.html
Hydropower
The hydro-electrical power plants on MadeiraIsland works on a “run-river” mode, with asmall storage capacity - just for a few hours insome cases. In 1998, 15.2% of the electricityproduced was from hydropower, which meant,in terms of energy, a production of 6,736 toe.Thus, 16,003 tonnes of fuel oil were saved.
Wind Power
Wind energy on Madeira is attractive, due tothe availability of good wind conditions.
The wind parks on Madeira Island are privateand they sell the energy to the publicelectricity grid in accordance with thePortuguese legislation for independent energyproduction. The actual legislation requires thepublic grid to buy the energy produced byindependent electricity producers andguarantees a minimum price, based on anestablished formula.
Madeira Island:
The total installed capacity is 5,340 kW.
Wind Turbines on Madeira Island in 1999:
Size of Turbine Number of Turbines130 kW 3150 kW 33Source: AREAM, 2000
The capacity will increase in the near futurewith the installation of 5 x 660 kW windturbines.
Porto Santo Island:
There are 2 x 225 kW turbines on the island.The capacity will soon increase with 1 x 660kW wind turbine.
Solar Thermal
The region has favourable conditions forutilising thermal solar energy, but the potentialhave not yet been exploited.
Hundreds of solar heating systems arescattered around the island, representing morethan 3,500 m2 (in 1991).
There has been a crisis in the demand for solarthermal systems as a result of:
► a relatively high investment, especially forsmall installations, in which the payback isspread out over a very long term
► lack of investment security due to the poorquality of some collectors, poorly designedsize of installations, and poor workmanship insetting up the installations
► the low price of conventional energysources
PV
In terms of PV, the region has expertise in thisfield. In 1983, the first PV installation inPortugal was set up on the Selvgem Grandeisland (a nature reserve) and is still in fulloperation. Likewise, the majority of the Navylighthouses have PV systems.
Even though there have been important stepsmade to use PV in signalling systems andisolated houses, PV has not a made asignificant contribution to the energy balance.
Main Barriers
The main obstacle for the development ofrenewable energy resources for electricityproduction in the Madeira Islands is theintegration of the energy produced into thegrid. The small dimension of the energysystem creates a limitation in the capacity toreceive – in acceptable conditions – electricityproduced by wind energy. The high fluctuationin the electricity demand throughout the dayset limitations on the electricity reception frome.g. wind turbines.
Renewable Energy on Small Islands – Second Edition August 2000 The North Atlantic Ocean
15
On the other hand, it is common amongstelectricity producers who use conventionalenergy resources, that they sometimes havedifficulties in accepting new initiatives. Thesedifficulties often appear as fear in relation tothe introduction of new technologies, thebehaviour of which is sometimes unknown.
In connection with solar energy, the mainbarrier is the weak acceptance due to the highcosts and sometimes poor quality of equipmentand installation.
Renewable Energy Potential
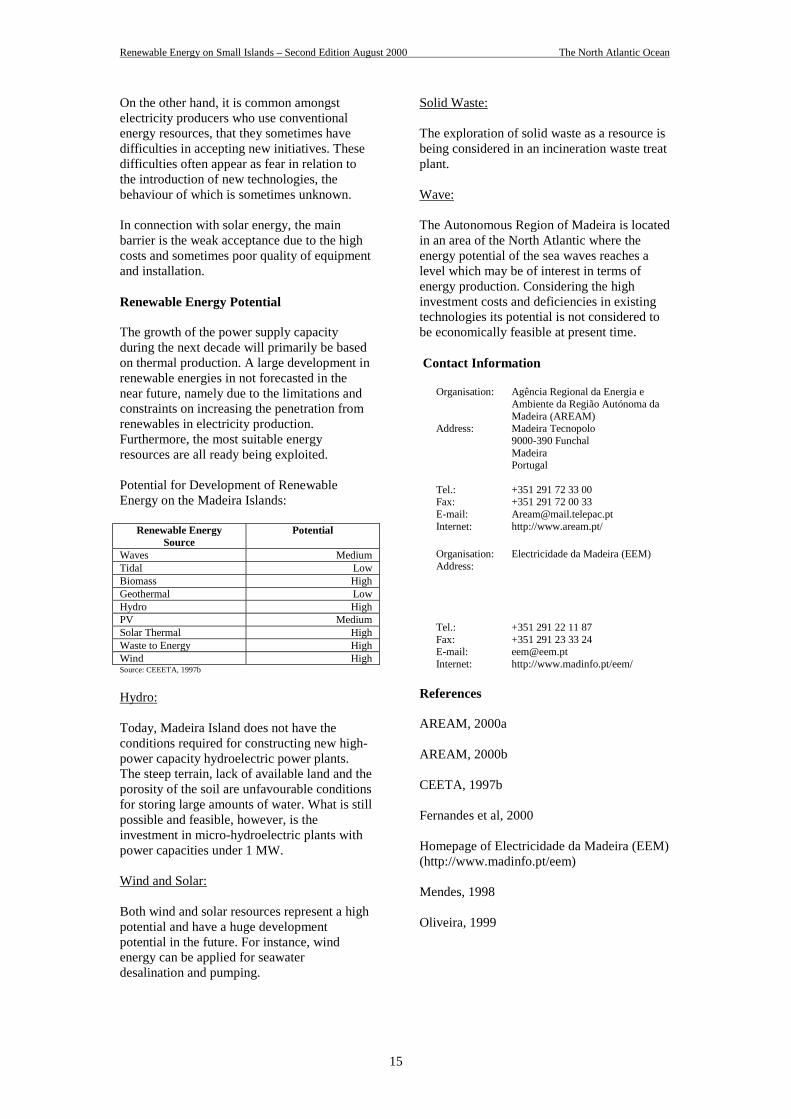
The growth of the power supply capacityduring the next decade will primarily be basedon thermal production. A large development inrenewable energies in not forecasted in thenear future, namely due to the limitations andconstraints on increasing the penetration fromrenewables in electricity production.Furthermore, the most suitable energyresources are all ready being exploited.
Potential for Development of RenewableEnergy on the Madeira Islands:
Renewable EnergySource
Potential
Waves MediumTidal LowBiomass HighGeothermal LowHydro HighPV MediumSolar Thermal HighWaste to Energy HighWind HighSource: CEEETA, 1997b
Hydro:
Today, Madeira Island does not have theconditions required for constructing new high-power capacity hydroelectric power plants.The steep terrain, lack of available land and theporosity of the soil are unfavourable conditionsfor storing large amounts of water. What is stillpossible and feasible, however, is theinvestment in micro-hydroelectric plants withpower capacities under 1 MW.
Wind and Solar:
Both wind and solar resources represent a highpotential and have a huge developmentpotential in the future. For instance, windenergy can be applied for seawaterdesalination and pumping.
Solid Waste:
The exploration of solid waste as a resource isbeing considered in an incineration waste treatplant.
Wave:
The Autonomous Region of Madeira is locatedin an area of the North Atlantic where theenergy potential of the sea waves reaches alevel which may be of interest in terms ofenergy production. Considering the highinvestment costs and deficiencies in existingtechnologies its potential is not considered tobe economically feasible at present time.
Contact Information
Organisation: Agência Regional da Energia eAmbiente da Região Autónoma daMadeira (AREAM)
Address: Madeira Tecnopolo9000-390 FunchalMadeiraPortugal
Tel.: +351 291 72 33 00Fax: +351 291 72 00 33E-mail: [email protected]: http://www.aream.pt/
Organisation: Electricidade da Madeira (EEM)Address:
Tel.: +351 291 22 11 87Fax: +351 291 23 33 24E-mail: [email protected]: http://www.madinfo.pt/eem/
References
AREAM, 2000a
AREAM, 2000b
CEETA, 1997b
Fernandes et al, 2000
Homepage of Electricidade da Madeira (EEM)(http://www.madinfo.pt/eem)
Mendes, 1998
Oliveira, 1999

Renewable Energy on Small Islands – Second Edition August 2000 The North Atlantic Ocean
16
Renewable Energy on Small Islands – Second Edition August 2000 The North Atlantic Ocean
17
Pellworm (Germany)
General Information
Population: 900
Area (km2): 37
Electricity Capacity
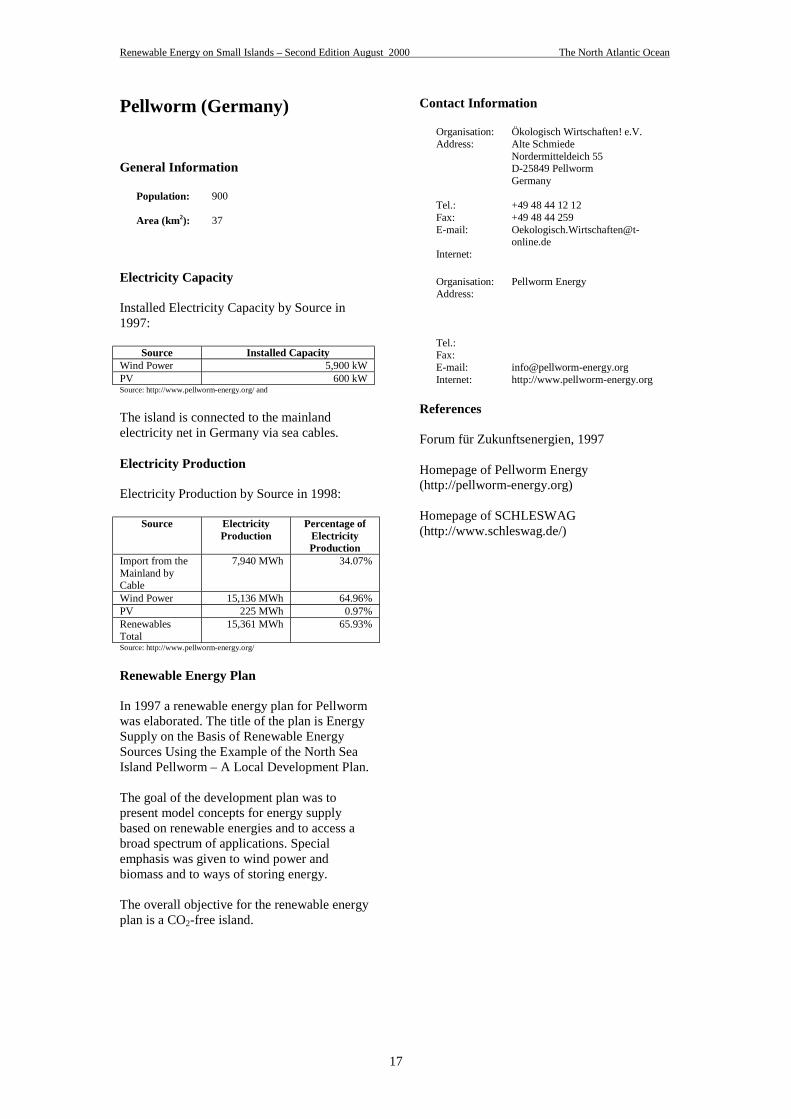
Installed Electricity Capacity by Source in1997:
Source Installed CapacityWind Power 5,900 kWPV 600 kWSource: http://www.pellworm-energy.org/ and
The island is connected to the mainlandelectricity net in Germany via sea cables.
Electricity Production
Electricity Production by Source in 1998:
Source ElectricityProduction
Percentage ofElectricityProduction
Import from theMainland byCable
7,940 MWh 34.07%
Wind Power 15,136 MWh 64.96%PV 225 MWh 0.97%RenewablesTotal
15,361 MWh 65.93%
Source: http://www.pellworm-energy.org/
Renewable Energy Plan
In 1997 a renewable energy plan for Pellwormwas elaborated. The title of the plan is EnergySupply on the Basis of Renewable EnergySources Using the Example of the North SeaIsland Pellworm – A Local Development Plan.
The goal of the development plan was topresent model concepts for energy supplybased on renewable energies and to access abroad spectrum of applications. Specialemphasis was given to wind power andbiomass and to ways of storing energy.
The overall objective for the renewable energyplan is a CO2-free island.
Contact Information
Organisation: Ökologisch Wirtschaften! e.V.Address: Alte Schmiede
Nordermitteldeich 55D-25849 PellwormGermany
Tel.: +49 48 44 12 12Fax: +49 48 44 259E-mail: Oekologisch.Wirtschaften@t-
online.deInternet:
Organisation: Pellworm EnergyAddress:
Tel.:Fax:E-mail: [email protected]: http://www.pellworm-energy.org
References
Forum für Zukunftsenergien, 1997
Homepage of Pellworm Energy(http://pellworm-energy.org)
Homepage of SCHLESWAG(http://www.schleswag.de/)

Renewable Energy on Small Islands – Second Edition August 2000 The North Atlantic Ocean
18
Renewable Energy on Small Islands – Second Edition August 2000 The North Atlantic Ocean
19
St. Pierre and Miquelon(France)
General Information
Population: 6,300
Area (km2): 242
Saint-Pierre and Miquelon is a territory ofFrance situated in the North Atlantic Oceansouth of the coast of Newfoundland, Canada.The main islands are Saint-Pierre, Miquelon,and Langladem (the latter two connected bythe low, sandy Isthmus of Langlade).
Installed Electricity Capacity
26,8 MW diesel plants installed (1999).
Electricity Production
38 GWh delivered to the grid (1999).
Wind Power
The archipelago is a windy place and isseeking to exploit this as part of three projects:a Wind House, a Wind Farm on Miquelon anda wind farm on St. Pierre.
Wind House:
The first one is based on the “Wind House”, acombination of museum and Europeanscientific and technical centre, which willprovide visitors with information and scientificexplanations about the wind, how to observe itand how to exploit it.
Miquelon Wind Farm:
The project is described later in this section.
St. Pierre Wind Farm:
A 1.8 MW wind farm is planned for St. Pierre.
Miquelon Wind Farm
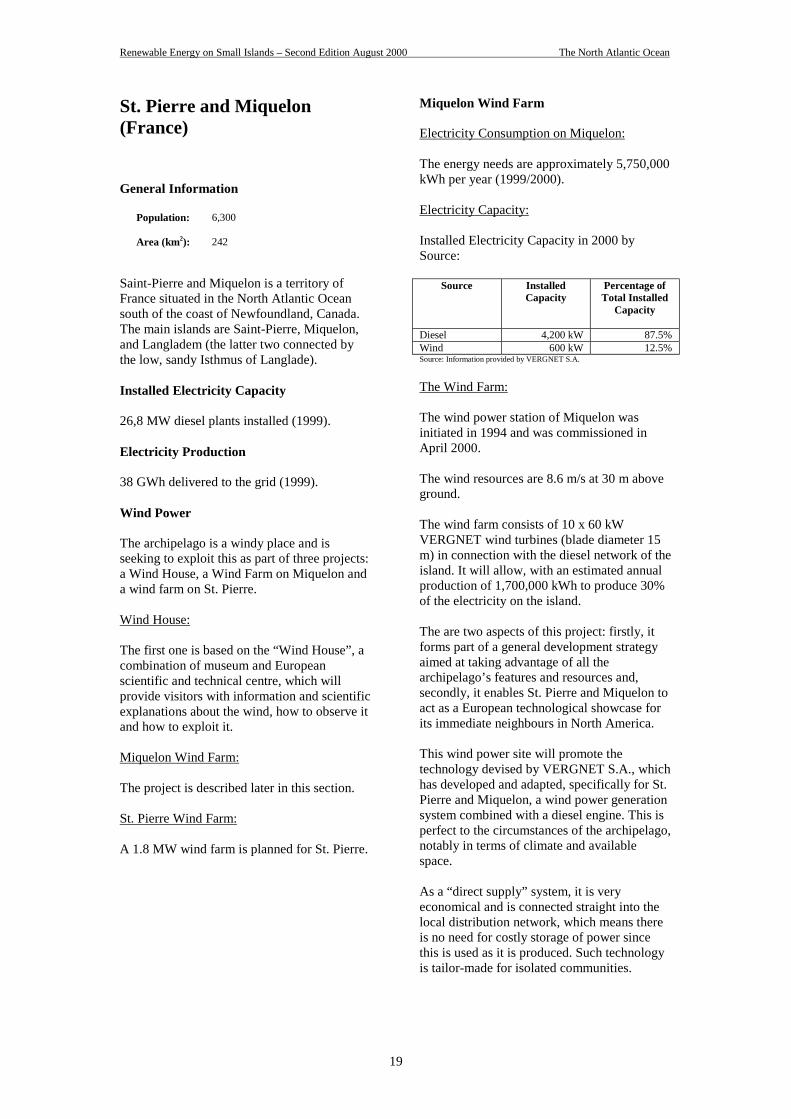
Electricity Consumption on Miquelon:
The energy needs are approximately 5,750,000kWh per year (1999/2000).
Electricity Capacity:
Installed Electricity Capacity in 2000 bySource:
Source InstalledCapacity
Percentage ofTotal Installed
Capacity
Diesel 4,200 kW 87.5%Wind 600 kW 12.5%Source: Information provided by VERGNET S.A.
The Wind Farm:
The wind power station of Miquelon wasinitiated in 1994 and was commissioned inApril 2000.
The wind resources are 8.6 m/s at 30 m aboveground.
The wind farm consists of 10 x 60 kWVERGNET wind turbines (blade diameter 15m) in connection with the diesel network of theisland. It will allow, with an estimated annualproduction of 1,700,000 kWh to produce 30%of the electricity on the island.
The are two aspects of this project: firstly, itforms part of a general development strategyaimed at taking advantage of all thearchipelago’s features and resources and,secondly, it enables St. Pierre and Miquelon toact as a European technological showcase forits immediate neighbours in North America.
This wind power site will promote thetechnology devised by VERGNET S.A., whichhas developed and adapted, specifically for St.Pierre and Miquelon, a wind power generationsystem combined with a diesel engine. This isperfect to the circumstances of the archipelago,notably in terms of climate and availablespace.
As a “direct supply” system, it is veryeconomical and is connected straight into thelocal distribution network, which means thereis no need for costly storage of power sincethis is used as it is produced. Such technologyis tailor-made for isolated communities.
Renewable Energy on Small Islands – Second Edition August 2000 The North Atlantic Ocean
20
Contact Information
Organisation: VERGNET S.A.Address: 6, rue Henri Dunant
45140 IngréFrance
Tel.: +33 2 38 22 75 00Fax: +33 2 38 22 75 22E-mail: [email protected]: Www.vergnet.fr
References
The Courier, 1999
Correspondence with VERGNET S.A.
Donizeau, 2000
Homepage of VERGNET S.A.(www.vergnet.fr)
Renewable Energy on Small Islands – Second Edition August 2000 The South Atlantic Ocean
21
Ascension Island (U.K.)
General Information:
Population: 1,100
Area (km2): 82
Ascension Island is located in the SouthAtlantic Ocean, 7 degrees south of the equatorand midway between the African and SouthAmerican continents.
Ascension Island is an overseas territory,which forms part of a single territorialgrouping under the sovereignty of the BritishCrown.
The island is home to an U.S. Air Forcesatellite-tracking station.
Electricity Production
Electricity Production by Source, in 1997:
Source Percentage of TotalElectricity Production
Thermal Plants 84%Wind Power 16%Source: Information provided Alpha Wind Energy
U.S. Air Force Wind Farm
The first wind farm in the U.S. Department ofDefence is located on Ascension Island.
Project Summary:
Installation of four wind turbines in parallel toan existing diesel and desalination plant allowsthe US Air Force to offset the consumption ofapproximately 1 million litres of diesel fuelannually at their Ascension Island Air andSpace Launch support base.
Wind Speeds:
Annual average wind speeds are 7-8 m/s with atypical trade-wind distribution.
Engineering Data:
► The island has a prime power diesel plant.
► Island load is from 2.2-2.4 MW.
► Two 1,900 kW diesel generators operate inparallel with the wind farm.
► Waste engine heat desalination system.
► Wind farm supplements diesels.
Wind Farm Configuration:
The wind farm consists of 4 units of MiconM700-225/40 kW wind turbines each with29.8 metre rotor diameters and 30 metre towerheights. Additionally an indoor switchgear wasinstalled on the turbine site and a remoteSCADA system located in the control room ofthe power plant.
Project Concerns:
► Site approval was required. Involving theIsland Administrator early was very important
► Environmental concerns were bird strikesand electromagnetic interference. Both haveproved groundless.
► High corrosion.
► Wind vs. generator penetration ratio.
Construction Challenges:
► Remote shipping – 5000 miles from port.
► Restricted shipping schedules.
► Pier restrictions.
► Limited crane availability and reach.
► Limited island access.
Project Highlights:
The island’s extremely remote and isolatedlocation posed several logistical andenvironmental challenges, including offloadingon lighters in the open sea off the island andpre-fabricated foundation systems. Despitethese challenges, the project wascommissioned within budget and 6 monthsahead of schedule.
Wind Farm Performance:
► Average wind power output is 370 kW.
► 41% capacity factor.
► Power production is on track.
► Micon M700-225kW working flawlessly.
Renewable Energy on Small Islands – Second Edition August 2000 The South Atlantic Ocean
22
► Corrosion free.
► As of March 2000, the wind turbines haveoperated with an average availability wellabove 99%.
► As of March 2000 10.5 millions kWhs havebeen produced since commissioning in lateSeptember of 1996.
► NOx and CO2 reduced.
Lessons Learned:
► Perform resource assessment.
► Mandatory job walk essential.
► Partner with the teams.
► Performance based specifications.
► Conquer corrosion control.
► Establish maintenance contract.
► Plan and model loads.
Contact Information
Organisation: Idaho National Engineering andEnvironmental Laboratory (INEEL)
Address: P.O. Box 1625Idaho Falls, ID 83415-3810USA
Tel.: +1 208 526-0441Fax: +1 208 526-0876E-mail: [email protected]: www.inel.gov
Organisation: Alpha Wind EnergyAtt. Jan Olesen
Address: Hedemoellevej 358850 BjerringbroDenmark
Tel.: +45 9678 0044Fax: +45 8668 5179E-mail: [email protected]:
References
Seifert, 1997
Information from Alpha Wind Energy
Renewable Energy on Small Islands – Second Edition August 2000 The South Atlantic Ocean
23
St. Helena (U.K.)
General Information
Population: 5,564 (1988)
Area (km2): 122
Saint Helena is located in the South AtlanticOcean, about 1,930 km west of Africa. Theisland is part of the British dependency SaintHelena, which also includes Ascension Islandand the island of Tristan da Cunha.
Electricity Capacity
Installed Electricity Capacity by Source in2000:
Source InstalledCapacity
Percentage ofTotal Installed
CapacityDiesel 2,712kW 91.9%Wind 240kW 8.1%Source: Energy Division St. Helena, 2000
The diesel power station is located at RupertsValley. There are five Mirrlees Engines withBrush Alternators.
Grid
Electricity is distributed around the island at11,000 volts. The supply to consumers is230/240 volts A.C 50 Hz single phase and 415volts A.C 50 Hz three phase.
The Deadwood Plain Wind Farm
Three 80kW Lagerwey wind turbines on 18metre towers were erected in June 1999 atDeadwood Plain. The contractors were TaylorWoodrow Construction Limited, England.
Background:
The project is part of a package of measures tosafeguard the existing diesel generatedsuppliers, improve system efficiency andincorporate an element of renewable energy.
Feasibility Study:
A study of the feasibility of wind turbinepower generation was carried out in 1994. Itconcluded that wind power was technicallyappropriate and economically and financiallyviable.
Wind Regime:
St. Helena has an indigenous wind regime ofalmost constant force and magnitude which iswell suited for wind powered generation.
There was wind measurement at theDeadwood Plain between December 1991 andNovember 1992. The mean wind speed at 30.4metres height for the year was 10.26metres/second, which was scaled by a factor toproduce a mean of 9.6 m/s to correspond withthe predicted long-term mean.
Production:
For the first six months of operation, the windturbines have produced 13% of the total unitsgenerated.
From December 1999 to end of March 2000,wind speeds have varied from 3.5 to 15 m/s.
The wind turbines are connected to 315 KVATransformer, which in turn is connected to thegrid 11,000 volts.
Organisation:
The wind turbines are financed with aid fromthe British Department for InternationalDevelopment.
The wind turbines are owned by the St. HelenaGovernment.
Operation and maintenance is theresponsibility of the Energy Division.
Contact Information
Organisation: Energy DivisionPublic Works and ServicesDepartment
Address: The CastleJamestownSt. Helena (U.K.)
Tel.: +290 2490Fax: +290 2323E-mail: [email protected]:
Organisation: Taylor Woodrow ConstructionLimited
Address: Taywood House345 Ruslip RoadSouthallMiddlesex, UB1 2QXUK
Tel.: +44 181 578 2366Fax: +44 181 575 4641E-mail: [email protected]

Renewable Energy on Small Islands – Second Edition August 2000 The South Atlantic Ocean
24
Internet: Http://www.twc.co.uk/
References
Information provided by Energy Division onSt. Helena
Renewable Energy on Small Islands – Second Edition August 2000 The Baltic Sea
25
Aeroe (Denmark)
General Information
Population: 7,600
Area (km2): 90
Aeroe is situated in the southern part ofDenmark.
Introduction
In 1997/1998 the Danish island of Aeroe tookpart in a competition to become the officialDanish Renewable Energy Island (REI).
Aeroe was not chosen, but continues to worktowards the goal of 80-100% supply ofrenewable energy plus energy savings duringthe period from 1998 to 2008.
Electricity Production
Electricity Production by Source in 1999:
Source Percentage of TotalProduction
Import by Cables 87.3%Wind power 12.7%Source: Aeroe Energy and Environmental Office, 2000
Wind Turbines
All the 22 wind turbines are connected to thegrid and are selling the production to the localutility company. The total sale in 1999 was4,550 MWh.
Most of the turbines are smaller ones erected atthe beginning of the ´80es. Wind conditionsare very good, and production has been veryprofitable for the owners. Running andmaintenance of the turbines has generally beenwithout problems.
The wind turbines are:
► 11 x 55 kW wind park owned in apartnership between private investors(households) and businesses. Shares can besold and bought among the islanders. Localcraftsmen have a part-time job maintaining theturbines. A board among the owners isresponsible for the operation.
► 1 x 75 kW and 2 x 200 kW owned byAeroeskoebing District Heating.
► 1 x 400 kW owned by SH an electricitycompany on the mainland.
7 turbines from 55 kW to 100 kW owned bysmall partnerships.
The Energy Plan for 1998-2008
Objectives:
The overall objective is to convert the energysupply on Aeroe to 80-100% renewable energyover a period of 10 years from 1998 to 2008.
The immediate objectives are:
► Reduction of CO2 and other pollutantsgenerated by production of electricity and heat,and through a sustainable local production ofenergy
► Maintain, if not increase the competencewith regard to energy in the local businesscommunity
► Through a certain degree of self-sufficiencycreating new jobs
► To “green” existing jobs within the energysupply sector
► To create a monetary abundance as thepayment for the energy supply remains incirculation on the island
► To establish a supply of energy which is atthe forefront of the development
► To contribute in maintaining/increasing thepopulation on the island by participating in thedevelopment of “the green island”
► To maintain and hopefully increase thenumber of energy related tourists
Technical goals:
► Wind Power:
Erection of 10-12 MW wind power
► District heating:
Town ActivityMarstal Thermal solar heating, 9,000 m2 are
established
Conversion to renewable energy for theremaining production is beinginvestigated. For instance thermal solarheating: 75,000 m3 seasonal storageand a total of 40,000 m2 solar heating
Renewable Energy on Small Islands – Second Edition August 2000 The Baltic Sea
26
or 4 MW of biomass
Aeroeskoebing Biomass: extension from the current1.6MW to 2.5MW
Thermal solar heating: 5,000 m2 areestablished
Rise Biomass: 600 kW
Thermal solar heating: 4,000 m2 andseasonal storage
Soeby Biomass: 2 MW
Thermal solar heating: 2,250 m2
► Individual Means of Heating:
Solar collectors and biomass boilers forapproximately 1,500 detached properties.
► Energy Savings
The Electricity Sector
Aeroe Elforsyning A.m.b.a is main gridoperator.
The electricity consumption is on an average36 million kWh per year.
After changes in consumer-habits, streamliningof the apparatus, use of electrical vehicles andby increasing the use of heat pumps, it isexpected that the consumption can be reducedto 31 million kWh annually during a period of10 years.
The planning for erection of new wind turbineshas been initiated by the Renewable EnergyOrganisation of Aeroe. It is the plan to coverthe electricity consumption completely byrenewable energy on an annually basis. At themoment the work is concentrated on erecting5-6 new wind turbines each of 2 MW. Theturbines are expected to produce 29-34 millionkWh.
More than half of the existing turbines will bedemolished with the erection of the newturbines, the rest will be phased out.
The municipality in Aeroeskoebing hasapproved the project. Other authorityproceedings have been initiated.
In addition there is the possibility of CHP atMarstal District Heating, plus demonstrationprojects with solar cells and further savings.
Responsible for the erection of the newwindturbines: "Aeroe Vindmøllelaug"(entrepreneurs).
Marstal District Heating Company A.m.b.a
In 1998 the production was 27,216 MWh.Thermal solar heating covers 13% of theproduction. Today the plant is the world’slargest thermal solar heating system supplyingdistrict heating. It enjoys widespread attention,and has been invited to EXPO 2000 as one ofthe 5 most interesting developments at themoment.
In connection with the plant is a test site, anearth pipe storage complete with heat pump.The remaining production takes place in wasteoil boilers. The company is exploring thepossibilities of exchanging the oil with:
1) CHP from a biomass boiler
2) heat production from a biomass boiler or
3) extension of the thermal solar heatingplant in conjunction with 1) or 2).
Marstal District Heating extended its pipelineto the village Graesvaenge in 1999. There is aplan ready for an extension to the villageOmmel. The extension will commence whenthe necessary finances are available.
Aeroeskoebing District Heating CompanyA.m.b.a
A yearly production of 13,000 MWh.Aeroeskoebing District Heating covers 18% ofits sale through thermal solar heating. 75% isderived from a straw boiler and the remaining7% is obtained from oil boilers. In the year2000 it is planned to install a wood pelletboiler to replace the oil.
Rise District Heating Company A.m.b.a
Rise District Heating is a "bare field project"starting up. The initiative originates fromAeroeskoebing Municipality and RenewableEnergy Organisation of Aeroe. The plant isgoing to supply the villages St. Rise andDunkaer with heat. Expected start ofconstruction: August 2000, ready to deliverheat in 2000/2001. The production is budgetedto 3,400 MWh per year. 50% of the energyproduction comes from thermal solar heatingand 50% from a wood pellet boiler. Heatstorage in a steel tank forms part of the plant.
Renewable Energy on Small Islands – Second Edition August 2000 The Baltic Sea
27
District heating in Soeby
A scheme for a "bare field project" based on awood chip boiler combined with thermal solarheating has been prepared. The initiativeoriginates from Renewable EnergyOrganisation of Aeroe. A connection campaignwas run in 1999, the response was, althoughpositive, not sufficient for a start up. A re-launch of the project will take place towardsthe end of year 2000. Production is budgeted to6,400 MWh per year.
Neighbour Heating Plants and Plans forHeating of the Rural Districts
The Danish Energy Agency´s Data Office isworking on a geographical analysis ofpotential "bare field" neighbour heating plantson Aeroe. Heating plans and new initiatives forneighbour heating projects are to be based onthis analysis. Planning will take place in2000/2001.
Supply of Heat to Individually HeatedProperties
From 2001 “Aeroe Elforsyning” (AeroeElectricity Utility) wants to offer delivery ofheat to this type of property on similar terms asthose available to district heating consumers.This will be a new type of service: the plant isfinanced and maintained by Aeroe Elforsyningand the heating bill is paid in monthlyinstalments. Solar collectors will be on offer incombination with a biomass boiler. Theindividual consumer will still have thepossibility of owning his/her heating plant.
Energy-savings
At the moment work is concentrated on raisingfinancial support for a project whichpresuppose a 20% reduction in electricityconsumption after 3 years, and after 10 years afurther 30% reduction. These savings will beobtained through a change in consumer-habitsand the use of the best technology available. Itis hoped that this project will be ready to rollin 2001. Electricity-savings throughconversion of electrically heated properties toother sources of heating have started and willcontinue.
Other Projects
► An analysis of the flow and amount ofwaste products on the island is near itsconclusion. The analysis also evaluates the
possibility of waste used in the heat and powerproduction.
► A continuous evaluation of the financialpossibilities, through the use of PV in thesupply of energy, will take place.
► A continuos evaluation of the use ofhydrogen storage/fuel cells in the supply ofenergy and the transport sector will take place.
► A continuos evaluation of technical andfinancial possibilities through adaptation ofelectric cars and other forms ofenvironmentally protective types of transportin the traffic pattern, will take place.
► Information about the complete project isan important part of the work
► Co-operation is an important element in thecomplete project. Steps have been taken to joinforces with other Danish islands, and steps willbe taken to co-operate with foreign projects ofthe same type during 2000. Renewable EnergyOrganisation of Aeroe is a member ofISLENET.
Who Introduced Renewable Energy onAeroe?
"No to nuclear power" movement and oilcrises in the 70'es were reasons for a greenwave in Denmark. The wave found Aeroe inthe beginning of the 80'es where a group of so-called ordinary people were the initiators of thelocal renewable energy projects: It was asmith, a farmer, a couple of teachers, a bankmanager and so on. This group was laterorganised as members of the board in theAeroe Energy Office, a society with more than200 members from the island supporting thework.
The 80'es were the period of the pioneers:Solar collectors were build in the garages,local smiths tried to start a windmillproduction.
3 of the turbines on the island originate fromthis production.
The windmill park was opened in 1984, for ashort time the biggest park in Denmark.
The pioneer-period culminated on Aeroe withthe erection of Aeroeskoebing Energy Plant in1989, a test and demonstration plant wheresome of the elements were straw boiler, solarabsorbers, heat pump and fluegascondensors.
Renewable Energy on Small Islands – Second Edition August 2000 The Baltic Sea
28
The Energy Plant sold the production toAeroeskoebing District Heating Company.The legislation that made the renewable energyinitiatives possible was the Energy Plan 81from the Danish Energy Ministry, where Aeroe- among other rural areas in Denmark - wasselected for the development with renewableenergy as the natural gas pipe lines would notpass by.
As the consumers traditionally own the energyplants and distribution nets it was necessary tohave a broad acceptance among the islandersbefore investing in new technologies. Publicopposition was prevented through a highinformation level.
The first years of the 90'es were a quiet periodafter the bankruptcy of Aeroeskoebing EnergyPlant due to falling oil-prices. It was not aperiod where new spectacular projects sawdaylight.
In 1994 Marstal District Heating took over therole as initiators of new projects. Theyconstructed a 75m2 thermal solar heating testplant. The information gained was sointeresting that it resulted in a decision to builda full-scale thermal solar heating plant in 1996.Aeroeskoebing District Heating followed theexample in 1998.
Beside the more striking projects, the 90'eswere signified by a growing acceptance ofrenewable energy among the islanders. Thiswas made possible by the Danish EnergyAgency who supported the information work:Aeroe Energy and Environment Officeinformed the consumers of individually heatedhouses and arranged education among the localinstallers of small scale equipment. Moreboilers and solar heating systems wereinstalled. In 1997 the Renewable EnergyOrganisation on Aeroe (the RE-Organisation)was formed as a result of the RenewableEnergy Island initiative of the DanishGovernment. The RE-Organisation consists ofthe mayors of Marstal Municipality andAeroeskoebing Municipality, representativesfor the boards of management for AeroeElectricity Supply, Aeroe Farmers Association,Aeroe Energy and Environment Office as wellas the operational managers from MarstalDistrict Heating and Aeroeskoebing DistrictHeating.
The RE-Organisation is a forum where newenergy initiatives see daylight, and where theinitiatives are co-ordinated.
Barriers
The barriers in the 80'es were among others:
► New and unproven technologies
► Lack of knowledge among consumers andauthorities
► Approvals from the authorities wereextremely delayed
Some barriers in the beginning of the 90'es:
► A decline in activities due to the bankruptcyof the "flagship" - the Aeroeskoebing EnergyPlant
► Lack of local organisation on a politicallevel
► Resistance towards erection of more andbigger wind turbines among the effectedresidents and a group of local politicians
Some Barriers of the late 90'es:
► Lack of organisation concerning theimplementation of renewable energy inindividual heated houses
► Lack of local biomass for district heating orCHP
► Producing biomass for energy is noteconomically attractive for the farmers
► Production of energy-crops in short rotationis prohibited in coastal areas
► Complicated and long-drawn-outadministration for coastal areas concerningerection of wind turbines and (in one case)district heating on solar
► Although the islanders are positive towardsrenewable energy, there is still inertia whenthey are asked to act even though there areonly benefits
► The local economy is vulnerable tomistakes
► Lack of possibility for financing energysavings for the poorest
Organisation
The Renewable Energy Organisation of Aeroewas established in 1997 as an activating forum
Renewable Energy on Small Islands – Second Edition August 2000 The Baltic Sea
29
to support the conversion of the energyproduction on Aeroe to renewable energy. TheRenewable Energy Organisation of Aeroe isto:
► act as an inspirator and catalyst with regardto new RE initiatives
► act as a sparring partner and maintainer ofRE-projects in progress
► co-ordinate renewable energy activities onthe island
At the moment Renewable EnergyOrganisation of Aeroe is in the process ofestablishing itself as an independent institutionunder the same name. The objectives andmembers of the independent institution areidentical to the present set-up. The neworganisation will honour agreement enteredinto by the former organisation.
The following municipalities and organisationsare represented in Renewable EnergyOrganisation of Aeroe:
► Marstal municipality, the mayor - chairmanof Renewable Energy Organisation of Aeroe► Aeroeskoebing municipality, the mayor -vice-chairman of Renewable EnergyOrganisation of Aeroe► Marstal municipality, the chief executive► Aeroeskoebing municipality, the chiefexecutive► Marstal District Heating Company, themanager► Aeroeskoebing District Heating Company,the manager► Aeroe Electricity Supply, the chairman► Aeroe Farmers Association, a member ofthe board► Aeroe Energy and Environment Office, thechairman
It is possible to include other partners in theorganisation.
The Renewable Energy Organisation of Aeroehas employed a co-ordinator. The employmentis supported financially by the Danish EnergyAgency and The Green Job Pool.
New projects:
At the beginning of a new project a workingparty is set up consisting of representativesfrom the consumers, consultants, andrepresentatives from the Renewable EnergyOrganisation of Aeroe. When the project
approaches its implementation a board withconsumer representatives is established to takecharge of administration and implementation.
Established companies such as district heatingcompanies and electricity distribution areresponsible for their own projects.
Contact Information
Organisation: Aeroe Energy and EnvironmentalOffice
Address: Vestergade 645970 AeroeskoebingDenmark
Tel.: +45 6252 1587Fax: +45 6252 2731E-mail: [email protected]: http://www.aeroe-ve.dk
References
Information provided by Aeroe Energy andEnvironmental Office
Seidelin, 1999

Renewable Energy on Small Islands – Second Edition August 2000 The Baltic Sea
30
Renewable Energy on Small Islands – Second Edition August 2000 The Baltic Sea
31
Gotland (Sweden)
General Information
Population: 58,000
Area (km2): 3,140
Gotland is the largest island in the Baltic Seaand located south-east off the mainland ofSweden.
Introduction
A few years ago Gotland was dependent on theSwedish mainland for its energy supply, whichat that time was very unstable. A step awayfrom dependence was taken when the largesttown on the island introduced a district heatingsystem. This system has used many differentkinds of energy sources, of which most ofthem were renewable. Later there were district-heating systems in three other towns, whichwere all based upon renewable energyresources. Next to this was a group of windpower enthusiasts who got the idea ofinstalling wind turbines on the base of sellingshares in wind turbines as a financing method.By doing this they could raise the necessaryinvestment capital and at the same timeincrease public awareness and interest inrenewable energy. Today there are more than130 turbines installed on the island.
Energy Demand
Energy Demand by Sector in 1998:
Sector Demand inGWh
Percentage ofTotal Demand
Transport 950 21.5%Industry 2,100 47.5%Agriculture 200 4.5%Public Sector 200 4.5%Buildings 975 22%Source: Gotlands Kommun, 2000
Energy Supply
Energy Supply by Source in 1998:
Source EnergySupply in
GWh
Percentage ofTotal Energy
SupplyCoal 1,695 38.3%Petroleum 1,365 30.8%Imported Electricity1 875 19.8%LPG 80 1.8%Bio-energy 256 5.8%Wind power 62 1.4%Heat pumps 56 1.3%Waste heat 25 0.6%Biogass 11 0.2%Renewanbles Total2 19.2%Source: Gotland Energy Agency, 2000
Wind Power
The development of wind power on Gotlandbegan in the late 1980’s. Through theestablishment of wind energy co-operatives thewidespread ownership of wind turbines hasexpanded. Today more that 2,000 householdson Gotland own shares in wind turbinesthrough local wind energy co-operatives.
The municipality has taken an active role inthe promotion of wind power and hasdeveloped a plan for wind energy exploitationfor the southern half of Gotland. The amountof electricity generated by wind power isexpected to at least double within the next 5years. Due to the shortage of sites on the islandthere are plans to build more wind farms in thesea. The largest currently being planned is an80MW installation to be located off Gotland’ssouth-east cost.
At the beginning of year 2000 there were over130 wind turbines installed on the island.
Some of the Wind Parks on Gotland:
Wind Park Number ofWind
Turbines
Capacity ofTurbines
TotalCapacity
Näsudden 80 500kW 40MWBockstigenOffshoreWind Farm
5 500kW 2.5MW
Smöjen 10 2x500kW4x 660kW4 x1.5MW
9.64MW
Storugns 6 660kW 3.96MWSource: Energy and Environment Projects on Gotland, 2000
Total energy production from wind power onGotland is around 130 GWh. In 1999
1 50% of the 875 GWh electricity imported via undersea cable from theSwedish mainland is based on renewables.2 This figure includes the renewable energy electricity imported from theSwedish mainland.
Renewable Energy on Small Islands – Second Edition August 2000 The Baltic Sea
32
electricity by wind power corresponded toapproximately 15% of the island’sconsumption.
Biomass
The use of district heating plants is alreadywell developed on the island with districtheating systems in the communities of Hemse,Slite, Klintehamn and Visby. These heatingplants are fuelled up to 90% by renewableenergy sources.
Bio-fuelled District Heating Plant in Visby:
The World Heritage City of Visby consists ofmany unique buildings and mediaeval ruinsthat are build from limestone. These structuresare particular sensitive to air pollution – causedto a large extent by the emissions from oil-fired heating boilers. Due in part to a desire toprotect these valuable buildings from furtherdecay a district heating system has been inoperating in Visby for the last 20 years.Around 95% of the energy supplied to thedistrict heating network comes from renewablesources. This cleaner and CO2 neutral energycomes in various forms, the largestcontribution being from wood chips – a by-product of local saw mills. The use of oil forheating has been reduced by 75% and sulphurdischarge from oil burning furnaces has beenreduced by 95% since 1980.
Biogas from the town’s landfill site andwastewater treatment plant is also used toproduce heat for the network. In addition tothis a 10MW heat pump is used to extract“free” heat from the sea. Altogether district-heating covers more than 75% of the city’sheating needs – helping to keep the air freefrom pollution to the benefit of Visby’sinhabitants and their culture heritage.
Biogas Demonstration Plant:
A biogas demonstration plant is underconstruction at Lövsta agricultural college toassess the possibilities for biogas use andproduction with farming. The manure will beused to produce methane gas that will provideheating for the college buildings – therebyreducing the need to use fuel oil.
Solar Energy
Solar energy is largely under-utilised todayapart from a small number of projects usingpool heating and domestic hot water systems.
Due to the fact that Gotland has the most sunhours in Sweden and a large summerpopulation from tourism the potential fromusing PV and solar thermal installations inbuildings is great.
The municipality and university are developinga demonstration project to use solar energy topower a seawater based cooling system for thenew public library and university buildings inVisby. This system could have widespreadapplications in other buildings in Visby ifproved viable.
Alternative Vehicle Fuels
Planning and the development of infrastructurethat can reduce the need for vehicles are animportant element in the municipality’sstrategy for reducing CO2 emissions.
The municipality has been investigating thepossibilities to replace fossil fuels in thetransport sector on Gotland. Biogas, ethanol,electricity and rape-seed oil are some of theareas currently under evaluation.
To set a good example and as part of it’scommitment to phase out fossil fuel use, thelocal authorities on Gotland have acquiredaround 60 vehicles that can be fuelled withrape seed oil. In the towns of Visby, Hemseand Slite there are now also commercial rapeseed oil filling stations for public use. Otherorganisations on the island which have chosento use rape seed oil driven vehicles as part oftheir environmental programmes includeSkogsvårdstyrelsen and the Hessela collective.These organisations have their own pumps andstock their own rape seed oil.
Investigations are under way into theestablishment of a bio-ethanol productionfactory at Roma where the existing plant thatpreviously produced sugar from sugar beet isnow being closed down. Should this proveviable then the municipality will increase itsuse of bio-ethanol in the transport sector.Exporting bio-ethanol will help to compensatesome of the island’s fossil fuel consumptionthat cannot be replaced by renewable energysources.
Renewable Energy on Small Islands – Second Edition August 2000 The Baltic Sea
33
Biogas has been considered for use in publictransport and in agriculture.
Recycled Energy
Reducing energy consumption through energyefficiency measures is an essential element indeveloping a sustainable energy system. Re-using excess heat from industrial processes isone way that the overall energy demand on theisland can be reduced.
One of Europe’s largest cement factories islocated on Gotland in the town of Slite. Thecompany Cementa is responsible for over 1/3of the energy consumption on the island.Excess heat is already being used to supply thedistrict heating system in Slite.
In 1999 Cementa were awarded a grant fromthe Swedish Ministry for the Environment foran installation for converting excess industrialheat into electricity. With the help ofVattenfall, the state owned electricitycompany, action has been taken to reduce thefactory’s impact on the environment. Aninstallation to generate electricity using steamcreated from waste heat will be commissionedin year 2000. Using the surplus productionheat will provide an estimated 50GWh/year –25% of the factory’s energy demand. Inaddition to this excess waste heat is alsosupplied to nearby greenhouses where itincreases productivity and reduces the need touse fossil fuel.
Policy
Eco-programme for Gotland:
In October 1996 the Municipality Council ofGotland passed the Eco-programme forGotland which identifies the municipalitiesgoal that the island should become a Zero-Emission Zone and that Gotland is to becomean ecologically sustainable society within thecourse of a generation.
Regarding energy the following are specified:
► Gotlandic dependence upon fossil carbonresources shall decrease to a level compatiblewith long term climate stability. Fossil fuelsshall be replaced with renewable energy
► Gotlandic renewable energy shall bedeveloped until it suffices for all the necessaryfunctions of society
► Society shall be organised in such a waythat the need for transport energy supply beminimised. The Gotlandic renewable energyshall suffice for all necessary transports ofpeople and goods on the islands as well as toand from the island
► Buildings shall be designed in such a waythat the need for energy supply for heat andlight be minimised. The Gotlandic renewableenergy shall suffice for all household needs
► Equipment shall be selected so as tominimise the need for energy supply fortechnical purposes. The Gotlandic renewableenergy shall suffice for all necessaryoperations of tools, machinery and productionprocesses.
The overall aim to develop an ecologicallysustainable society has been reflected in manyof the municipalities other plans anddocuments such as Vision Gotland 2010, theAgenda 21 plans, the regional developmentprogramme and Energy 2005 - themunicipality’s energy plan.
Energy 2005:
Energy 2005 was approved by the municipalityin October 1999. Energy plans are required bylaw for municipalities in Sweden. Thecombination of renewable energy withmeasures that increase the efficiency withnatural resources are uses is a central part ofGotland’s strategy for realising a sustainablesociety.
Below are mentioned some of the elements inEnergy 2005:
► 40% of the island’s total energy needs to besupplied by renewable energy sources andrecycled energy sources by year 2005
► reduce the use of fossil fuels
► increase the use of renewable energy
► expand the district heating networks
► district heating shall be at least 90% bio-fuelled
► increase wind power installations up to120MW by 2005
► reduce the amount of electricity
Renewable Energy on Small Islands – Second Edition August 2000 The Baltic Sea
34
These plans have been approved by a majorityof elected representatives and were developedin consultation with local actors and thepopulation at large.
Contact Information
Organisation: Gotlands Energy AgencyGotland Municipality
Address: Hallfose62023 RomaklosterGotlandSweden
Tel.: +46 498 38380Fax: +46 498 38300E-mail: [email protected]:
References
Energy and Environment Projects on Gotland,2000
Information provided by Gotland EnergyAgency
Johansson, 1998
Gotlands Kommun, 2000
Renewable Energy on Small Islands – Second Edition August 2000 The Baltic Sea
35
Samsoe (Denmark)
General Information
Population: 4,300
Area (km2): 114
The Official Danish Renewable EnergyIsland (REI) – Introduction
In the Danish governments energy action planEnergy 21 from 1996 it was decided that aDanish island as a demonstration projectshould become a Renewable Energy Island(REI), e.g. an island self sufficient fromrenewable energy sources, includingtransportation, within 10 years. The overallobjective is to reveal technical possibilities forconverting an entire community to renewableenergy only, and to cast light on theorganisational and financial prerequisites for aconversion of this type.
The target groups for the demonstration projectare local communities not only in Denmarkand the European Union, but also globally. InNovember 1997 the island of Samsoe wasselected among five candidates to be theofficial Danish REI.
Objectives of the Official Danish REI
► that the island’s heating and electricityneeds be met solely by renewable energysources in the course of a ten-year period
► make the transport sector more efficient,thus reducing fossil fuel energy consumptionin this sector. The various possibilities for apartial transition to renewable energy sourcesin the transport sector will also be explored
► use the Samsoe project’s demonstration andinformation activities to promote the use ofrenewable energy not only in the rest ofDenmark, but also abroad. Samsoe, asDenmark’s official Renewable Energy Island,will thus demonstrate not only Danishrenewable energy technology, but also Danishenergy planning and management.
► the energy island project has the explicitobjective to create an appreciable number ofnew jobs. The ten-year period of transition to100% renewable energy in the heating andelectricity sectors will on average create 40
work-years of construction work, as well as 40permanent new jobs in the renewable energysector. The potential for new jobs in theservice trades due to energy island tourists andguests in the important spring and fall seasonshave not been examined.
The Energy Plan for 1998-2008
Power Supply:
On Samsoe there has through the years been apower production from small wind turbines. Inthe year 2000 the establishment of 11 new 1MW wind turbines will take place: 3 in thetown of Tanderup, 3 in Permelille and 5 inBrundby Mark.
Then 75% of the power consumption isproduced by wind turbines. The remaining25% will be produced from biogass andcombined heat and power plants. This willhappen in 2004.
Heating:
In the future 60% of the homes will be heatedfrom district heating plants. The remaining40% of homes will install individual solarheating-, wood pills-, and heat pump systems.
District Heating:
Today 90% of the homes in the town ofTranebjerg are connected to a straw-baseddistrict heating plant.
The new district heating system will beestablished in the following villages and by theenergy sources mentioned:
Town Energy SourceNordby/Maarup Woodchips and solar
heatingBallen/Brundby Connected to the district
heating plant in TranebjergKolby Kaas/Kolby Heat surplus from the
ferriesBesser area BiogasSource: Samsoe Energy Company, 2000
Onsbjerg and the other villages are not yetdecided.
Neighbouring District Heating:
Small villages can use district heating on asmall scale, where local farmers – apart fromtheir own demands – can supply theneighbours with heat from straw-, biogas- orother biomass plants.
Renewable Energy on Small Islands – Second Edition August 2000 The Baltic Sea
36
The Transport Sector:
It is a difficult task to convert the transportsector to renewable energy. The first thing tobe done is the installation of 10 offshore windturbines to produce the same amount of energyfor transportation as consumed at the moment.
In the long term the electricity from the windturbines can be used for electricity cars andhydrogen vehicles.
Offshore Wind Turbines:
The 10 offshore wind turbines each with acapacity of 2.5 MW will be erected at PaludansFlak about four kilometres south of Samsoe.
Examination by divers will take place duringthe year 2000, and the installation of theturbines in the year 2002.
Status for the Renewable Energy IslandProject by August 2000
► 3 wind turbines of 1 MW each and 8 windof 1 MW each were commissioned in Marchand July/August 2000 respectively
► a great part of the municipal buildings havehad installed electric saving equipment
► there has been installed heat savingequipment in approximately 15% of thedwellings owned by retired persons
► there has been installed approximately 50solar water heaters
► there has been installed approximately 50heat-pumps and wood-pellet boilers
► they are in a detailed planning process,which will result in two new district heatingsystems in 2001-2002 for four of the largervillages on the island - one system based onstraw and the other system based on 2,500 m2
solar heating and a combined biomass boilingsystem
► they are in in-depth discussions withconsumers representatives from five smallervillages whether there shall be establisheddistrict- or neighbour heating in theirrespective villages
► they are in phase-2 investigation concerningthe off-shore wind farm – it is planned toinstall 10 x 2.5 MW in 2002
► the municipality have leased 4 electric cars
► a lot of delegations, TV and journalist hasvisited the island (from Japan, USA, England,Italy, Belgium, Germany, Sweden, Norway…)
Wind Power
Onshore:
In 1996, Samsoe had 8 wind turbines with atotal capacity of 376 kW and annual windpenetration was 6%.
By August 2000 11 x 1MW Bonus windturbines were commissioned and penetrationhas increased to a minimum of 75% of the totalelectricity consumption.1 Two of the windturbines are owned co-operatively, nine areprivately owned.
Offshore:
Offshore wind energy will be installed by a 25MW wind farm - 10 turbines x 2.5 MW - at theSouth of Samsoe. Thus, by an underwater sea-cable, making Samsoe a net exporter ofelectricity to the mainland of Denmark.
The first planning phase began in the autumnof 1998. Specialists from consultant firms,RISOE and ARKE conducted this preliminarystudy. Samsoe Energy Company co-ordinatedthe project. The study emphasised theimportance of public support from the localpopulation, their officials and regionalauthorities. Widespread public support may bethe deciding factor that will make thisambitious undertaking possible. The EnergyCompany followed up and applied for furtherpermits, and the Danish Energy Agencyconducted another study in the fall of 1999, ahearing of all regional and national parties thatcould have potential interests in the outcome ofsuch a decision. This round of talks reducedthe three potential sites to one sole site, an areasouth of the island. The windmills will beerected in 2002 if all goes well.
Barriers
► economical investments related to thechange to renewables is often a barrier – this iswhy consumers need financial support to somerenewable energy systems. Approximately40% of the 4,300 inhabitants on Samsoe areretired persons, and for o lot of them it is abarrier to make “long term” investments
1 75% penetration is guaranteed by the wind turbine manufacture Bonus, butprobably 100% penetration will be provided.
Renewable Energy on Small Islands – Second Edition August 2000 The Baltic Sea
37
► as an island with a unique nature it can be aproblem to install some renewable energytechnologies – they have experienced and arestill experiencing planning problems becauseof the County and owners of summer cottages(people that live outside the island).
Organisation
Samsoe Energy Company:
Samsoe Energy Company was established toimplement Samsoe as an REI. Thisorganisation was created from the philosophythat all activities related to the REI-projectshould be controlled by the local community –by authorities, business, farmers and NGO’s.This company consists of representatives fromSamsoe Municipality, the CommercialCouncil, the Farmers’ Association and theEnergy and Environmental Office. SamsoeEnergy Company has set up a secretariat to co-ordinate the future projects and activities.
Samsoe Energy and Environmental Office:
The NGO most involved in the process isSamsoe Energy and Environmental Office(SEEO). An energy and environmental officeis a local non-governmental association, whichprovides free, impartial information andguidance on energy conservation andutilisation of renewable energy sources. At thesame time the energy offices initiate manyenergy and environment activities in their localareas. Today there are 21 energy andenvironment offices in Denmark. 18 of theseare subsidised by the Danish Energy Agencyfor their educational work on energy and forhelping people applying for subsidies ondifferent renewable energy sources from theState. Most of the offices employ one or moreenergy advisers, who are responsible for thedaily work.
Contact Information
Organisation: Samsoe Energy CompanyAddress: Soetofte 24
8305 SamsoeDenmark
Tel.: +45 8659 3211Fax: +45 8659 2311E-mail: [email protected]: http://www.samso.net/firma/ve/uk/in
dex.htm
Organisation: Samsoe Energy and EnvironmentalOffice (SEEO)
Address: Soetofte 298305 SamsoeDenmark
Tel.: +45 8659 2322Fax: +45 8659 2311E-mail: [email protected]: Http://home.worldonline.dk/~sherma
n/
References
Homepage of Samsoe Energy Company(http://www.samso.net/firma/ve/uk/index.htm)
Information provided by Samsoe Energy andEnvironmental Office (SEEO)
Information provided by Samsoe EnergyCompany
Johnsen, 1998
Johnsen & Hermansen, 1999
Samsoe Energy Company, 2000
Samsoe Energy and Environmental Office,2000

Renewable Energy on Small Islands – Second Edition August 2000 The Baltic Sea
38
Renewable Energy on Small Islands – Second Edition August 2000 The Mediterranean Sea
39
Corsica (France)
General Information
Population: 249,737 (1990)
Area (km2): 8,721
Corsica is a department of France and theisland is situated in the Mediterranean SeaSoutheast of France.
Electricity Capacity
Installed Electricity Capacity in 1999 bySource:
Source InstalledCapacity
Percentage ofTotal InstalledCapacity
Thermal Plants1 357 MW 73%Hydro Power 132 MW 27%Source: Torre, et al, 1999
An electric cable connects Italy to the island ofSardinia via Corsica. The Corsican electricgrid has the authorisation to take 50 MW fromthe cable.
Electricity Production
Electricity Production in 1999 by Source:
Source Percentage of Total ProductionThermal Plants 2 70%Hydro Power 30%Source: Ferrari, 2000
During summer, thermal plants provide almostthe total electricity production.
Energy Plan
Due to the success with the utilisation ofrenewable energy sources on Corsica, theCorsican local authorities, the FrenchElectricity Board (EDF), and the FrenchEnvironment and Energy Agency (ADEME)have decided to launch a 3 year developmentplan in order to reach 50% of electricityconsumption from renewable energy.
The aim of this plan is threefold: to promote anincrease in production of renewables for thegrid, reduce the costs to consumers by moreemphasis on the use of local energy sourcesand efficient appliances, and to decrease CO2
1 Including 50 MW of import from Italy2 Including import from Italy
emissions. If all goes according to the plan, thedemand will decrease for the two oil centralpower stations (Bastia and Ajaccio).
According to this plan, by 2003, 52 MW ofwind power (by the Eole 2005 programme)and 15 MW of hydro-electricity will beinstalled.
The technical potential of wind energy inCorsica has been identified to 433 MW. Theeconomical potential is estimated at the levelof 100 MW. In the frame of the Eole 2005programme, 11 projects have been approvedfor a total of 52 MW.
Together these new installations shouldproduce 200 GWh/year for the Corsican grid.The purchase tariff will be secured by EDF forwind electricity for a 10 year period (between0.053 and 0.061 Euros), the hydro electricitywill receive 0.3 Euro cents more than thenormal price (0.02 FF). The group is alsoconsidering the potential for small-scale hydrogeneration, as the potential is under exploited -only 6% of hydro electricity is supplied bysmall installations.
In order to reduce peak consumption in winter,mainly due to electric heating and lightning,energy efficiency will be encouraged in thecommercial and domestic sectors. An attemptwill be made to educate people about energyuse in order to reduce peak energy demand inwinter. 494 MW of power is used during onlyone third of the year. Advertising will beorganised, to promote solar water-heaters,wood heating, low consumption lightning andefficient domestic appliances.
Local authorities, the energy agency ADEMEand EDF will invest 30.5 million EURO, and itis expected, according to ADEME’s analysis,without counting the energy benefits, that thiswill result in supplementary economic activityof 183 million EURO in 5 years and thecreation of more than 500 new jobs.
These plans will be in addition to subsidies,which already exist for solar thermal: 600EURO for a household to install a solar water-heater and a subsidy of 60% for companies toinstall solar water heaters. Hospitals,campsites, hotels and restaurants are the mainbeneficiaries of this subsidy.
Renewable Energy on Small Islands – Second Edition August 2000 The Mediterranean Sea
40
Contact Information
Organisation: ADEME CorseAddress: 8, rue Sainte-Claire
BP 314 2182Ajaccio cedexCorse
Tel.: +33 4 95 51 77 00Fax: +33 4 95 51 26 23E-mail: [email protected]:
References
Bal et al, 1999
Ferrari, 2000
Torre et al, 1999
EuroRex (www.eurorex.com)
Renewable Energy on Small Islands – Second Edition August 2000 The Mediterranean Sea
41
Crete (Greece)
General Information
Population: 540,054 (1991)
Area (km2): 8,260
Crete is situated in the south-east of theMediterranean Sea. Crete constitutes a regionin Greece.
Introduction
Crete is an ideal area for the development ofrenewable energy sources due to theavailability of a rich and largely under-exploited renewable energy potential, the highinvestment interest and the positive attitude ofthe public towards renewable energyexploitation.
Crete faces a chronic energy problem causedby the high rates in energy and power demandand the reluctance of the population to acceptthe installation of new thermal power stations.
Electricity Demand
Total demand in 1999 was 1,921 GWh.
Electricity Demand by Sector in 1999:
Sector Percentage of TotalDemand
Domestic 38.16%Industrial 9.22%Tourist & CommercialSector
39.69%
Agriculture 4.18%Street Lightning 1.45%Public Sector 7.30%Source: Regional Energy Agency of Crete
Electricity Capacity
Installed Electricity Capacity by Source in1999:
Source InstalledCapacity
Percentage ofInstalledCapacity
Thermal Plants 514.4 MW 89.9%Wind 57.8 MW 10.1%Source: Regional Energy Agency of Crete
Electricity Production
Electricity Production by Source in 1999:
Source ElectricityProduction
Percentage ofTotal
ProductionThermal Plants 1,820 GWh 94.5%Wind 96 GWh 5%OtherRenewables
9 GWh 0.5%
TotalRenewables
105 5.5%
Source: Regional Energy Agency of Crete
Solar Thermal
More and more households and hotels installsolar systems for water heating. It is estimatedthat 35,000 systems have been installed onCrete.
Renewable Energy Potential
Potential for Development of RenewableEnergy on the Crete:
Renewable EnergySource
Potential
Waves MediumTidal LowBiomass MediumGeothermal LowHydro LowPV HighSolar Thermal HighWaste to Energy MediumWind HighSource: CEEETA, 1997b
Energy Policy
The Region of Crete has since 1994 adopted anenergy policy, which gives a particularemphasis on the utilisation of renewableenergy sources.
In the framework of this policy, it has set thegoal to make Crete “a privileged field inEurope for large scale applications ofrenewable energy sources”.
The policy not only faces the shortage ofelectricity power in Crete, but also introducesintensive measures for renewable energysources and rational use of energy, as well asthe introduction of new energy technologies inthe energy system.
Renewable Energy on Small Islands – Second Edition August 2000 The Mediterranean Sea
42
Implementation Plan for the Large ScaleDevelopment of Renewable Energy Sourcesin Crete
Objective:
► 39.4% of the total annual electricity demandin 2005 by renewable energy sources
► 45.4% of the total annual electricity demandin 2010 by renewable energy sources
Timeframe:
Year 1998 to 2010.
Focus:
► suggest actions concerning each renewableenergy technology
► estimates their impact in the energy system
► verify their economic feasibility
The main focus for the implementation plan isthe exploitation of renewable energy sourcesfor electricity production since the majorproblem in Crete’s energy system is theinability of the existing electrical system tomeet the increasing demand.
Electricity Production:
Year 2000 2005 2010Thermal Plants 469 MW 546 MW 584 MWWind Farms 89.3 MW 200 MW 250 MWBiomass Units 20 MW 40 MW 60 MWSmall Hydro 0.6 MW 6 MW 6 MWPV Installations 0.2 MW 2 MW 4 MWPumped-storage 0 MW 125 MW 125 MWTotal RenewableEnergyPenetration
19% 39% 45%
Source: Zervos, 1999
Solar Hot Water Systems:
Intensive use of solar water systems at thedomestic and tourist sectors:
► 85,000 m2 installed total in 2000
► 365,000 m2 installed total in 2005
► 500,000 m2 installed total in 2010
Energy-Saving Measures:
► Replacement of incandescent bulbs at theresidential sector residential sector and instreet-lightning
► Passive and hybrid systems for cooling atdwellings, hotels and bungalows
Contact Information
Organisation: Regional Energy Agency of Crete(REAC)
Address: Kountourioti Square71202 HeraklionCreteGreece
Tel.: +3081 224854Fax: +3081 220138E-mail: [email protected]: http://www.crete-region.gr/
References
CEEETA, 1997b
Information provided by Regional EnergyAgency of Crete
Zervos et al, 1999
Renewable Energy on Small Islands – Second Edition August 2000 The Mediterranean Sea
43
Cyprus
General Information
Population: 651, 800 (1997)
Area (km2): 9,251
The island of Cyprus is situated in the easternMediterranean.
Primary Energy Sources
Primary Energy Sources in 1997:
Source Percentage of PrimaryEnergy
Oil Products 90%Coal 6%Solar 4%Source: Kassinis, 1999
Cyprus does not have any indigenous fossil-fuel resources. It is almost totally dependent onimported energy products, mainly crude oiland refined products. Solar energy is the onlyindigenous source of energy in Cyprus. Thecontribution of solar energy to the energybalance of the country is about 4%.
The burden of the costs of energy imports onthe economy of Cyprus is considerable.Imports of energy in 1997 amounted to 134.3million C£, which corresponds to 61% of thecountry’s total domestic exports and 9.1% ofthe country’s total imports for homeconsumption.
Solar Water Heaters
Solar energy is utilised extensively byhouseholds and hotels for the production of hotwater. Indeed, Cyprus is a leading country ininstalled solar collectors per capita - 0.86 m² ofsolar collector per capita. Solar energy is alsoused in non-thermal applications.
Progress:
Solar water heaters were first fabricated andinstalled in 1960. Since then a remarkableexpansion in the utilisation of solar waterheaters has taken place rendering the countryamong the leaders on the basis of total numberof solar water heaters in use per person.
Progress was slow, during the first years, onaccount of the defects in design, which led tolow efficiency, high cost and operational
difficulties (e.g. leakage). With engineeringdevelopments and rationalisation ofproduction, the defects were eliminated to alarge extent and the cost kept at constant level,witnessing an impressive increase inproduction.
Today, there are about ten major and twentymanufacturers of solar water heaters in Cyprus,employing about 300 people and producingabout 35.000 m² of solar collectors annually.
The estimated penetration of solar waterheating systems in the different categories ofbuildings as on 1.1.1999 was for houses 92%and for hotels 50%.
The estimated current area of solar collector inworking order in Cyprus is 600.000 m2, andthe annual solar thermal energy production is336,000 MWh/year.
As a result of the extensive use of solar heaters4% of total CO2 emissions are avoided(285.600 tones CO2/year).
Technology:
The majority of solar domestic hot waterheaters, put up on individual houses are of thethermosyphon type. Two solar collectors, witha total glazed area of 3 square meters, areconnected in series to a hot water tank, placedat a height, just above the top of collectors.Since the city water supply is not continuous, acold water storage tank is located above thehot water storage tank. The hot water tank isalso fitted with an auxiliary electric 3 kWheater, which can be operated manually orautomatically. The solar collectors areinvariably of the flat plate type glazing.
Economics of solar heating in Cyprus:
The average daily solar radiation falling on acollector installed at an angle of 35° to thehorizontal in Cyprus is 5.4 kWh per squaremeter. From test carried out at the AppliedEnergy Center of Cyprus the annual savingsper square meter of installed collector area inCyprus are 550 kWh.
The extra total cost required to install a solarwater heating system on a house is around US$600. The payback period depends on the priceof fuel displaced; in the domestic sector it iselectricity where as in the other sectors it isfuel oil. In accordance with 1998 prices thepayback period of a typical solar system,
Renewable Energy on Small Islands – Second Edition August 2000 The Mediterranean Sea
44
displacing electricity is estimated to be aboutfour years.
Reasons for widespread use of solar energy inCyprus:
A number of factors have contributed to thewide scale use of solar energy in Cyprus. Themost important factor, contributing to thisphenomenon is the enterprising industry. Theindustry identified correctly the primeapplication of solar water heaters and boostedthe improvement of technology and promotionof product with vigour. Hot water is a primaryneed and solar water heaters can meet the needeconomically with an investment, which mostCypriot house owners can make, with out anysignificant inconvenience.
The sunny climate has tended to make solarheating more competitive. In hotels themaximum demand in summer matches verywell with the flux of solar radiation whichmakes water heating systems more efficientand economic.
The government through the Applied EnergyCenter of the Ministry of Commerce, Industryand Tourism has helped the promotion of solarenergy by:
► Providing technical support, consisting oftesting of collectors, advice to industry forimprovement of products and to consumers forefficient utilisation. The provision of technicalsupport to industry proved to be very critical atthe initial stages, but even now, the provisionof technical support is necessary because mostlocal solar water heater firms on account oftheir size cannot support research activities.
► Making the material used for fabrication ofsolar water heaters duty free.
► Providing technical support for thepreparation of relevant standards.
► Making the installation of solar waterheaters compulsory on state-built housing.
The government has given no subsidies and thegrowth of solar energy industry is inconformity with natural laws of economicsand, hence, reasonably stable.
The main lesson to be learnt from Cyprus isthat nothing succeeds like the exploitation of aproperly identified application of solar energy,in this case solar water heating, by an
enterprising industry, backed up by a co-operating government.
PV
Photovoltaic cells are in systematic use by theCyprus Telecommunication Authority and theCyprus Broadcasting Corporation to powertelecommunication receivers and transmittersin remote areas.
Energy Policy
The main objectives of the Cyprus energypolicy are the following:
• Securing energy supply• Meeting energy demand• Mitigation of energy consumption impacts
on the environment• Harmonisation of the island energy sector
with the Acquis-Communautaire• Energy conservation and development of
renewable energy
Securing Energy Supply:
► Increase capacity of local refinery from 0.8millions MT/year to 1.3
► Study the possibilities of applyingdiversification of primary energy sources forelectricity production (coal and LNG).
Meeting Demand:
► Increase the installed capacity from 660MW to 900 MW by the year 2000.
► Increase of storage capacity of petroleumproducts (possible locations to accommodate anew depot were identified).
Grant Schemes and Programme:
► Grant schemes – incentives for thepromotion of biogas. The Governmentsubsides up to 66% of the total investment.
► EAC purchases electricity generated byalternatives energy sources at the same price itsells to the domestic consumers.
► A grant scheme for the utilisation in thehotel industry was recently prepared.
► A grant scheme for energy conservation(installations of systems and equipment) wasrecently prepared.
Renewable Energy on Small Islands – Second Edition August 2000 The Mediterranean Sea
45
Applied Energy Centre:
► Advise Government on energy mattersregarding rational use of energy anddevelopment of renewables.
► Carry out energy studies.
Future Plans and Programmes
► Grant scheme – incentives for thepromotion of solar energy in the hotel industry(thermal and photovoltaic applications) –subsidisation up to 50% of the totalinvestment.
► Grant scheme – incentives for theimprovement of the aesthetic view of existingsolar systems in the domestic sector.
► Introduction of standards: durability testsfor solar systems and components.
► Introduction of standards relating to PVcells; efficiency, durability, etc.
► Utilisation of solar energy for electricityproduction.
► Utilisation for solar energy for cooling andheating buildings.
► Future co-operation with all countries andorganisations interested in solar energy.
It is important to note that the ElectricityAuthority of Cyprus is now committed topurchasing electricity produced fromrenewable energy sources at relatively highprices in order to boost the development ofthese sources.
Contact Information
Organisation: Applied Energy CentreAddress: Andreas Araouzos, 6
1421 NicosiaCyprus
Tel.: +357 2 305797Fax: +357 2 305159E-mail: [email protected]:
References
Kassinis, 1999
Information provided by Applied EnergyCenter

Renewable Energy on Small Islands – Second Edition August 2000 The Mediterranean Sea
46
Renewable Energy on Small Islands – Second Edition August 2000 The Mediterranean Sea
47
Minorca (Balearic Islands,Spain)
General Information
Population: 65,000
Area (km2): 720
Minorca Island is part of the Balearic Islands(Mallorca, Minorca, Ibiza, and Formentera)and situated in the eastern part of theMediterranean Sea.
Renewable Energy Plan
Introduction:
In 1993 UNESCO declared Minorca as aBiosphere reserve. With this declarationMinorca was converted into an internationalreference for sustainable development.
This led to the formation of a SustainableDevelopment Plan, which also included arenewable energy plan.
One of the most important aspects of the planis given by the present energy situation – avery low renewable energy penetration. Lessthan 1% of primary energy is from renewables.
The perspective for the plan is the maximumpenetration of renewable energy and the mainfocus is on solar and wind energy.
Objectives:
► identification of the energy economypotential and the sources of renewableresources to mobilise
► identification of the economic and technicalpotential
► forecast of the degree of mobilisation andthe interest of the actors concerned
► identification of political priorities forrenewables in the context of island sustainabledevelopment
Wind Power:
It is possible when grid stability is taken intoaccount to install 9 MW of wind turbines. Theplan includes wind measurement, and viability
and environmental impact studies of sites forwind turbines.
Solar Thermal:
Thermal solar energy has a large potential ofapproximately 12 MWh per year, on the basisof an installed panel surface of 15,100 m2.
The medium term objective is about 8,000 m2
of solar panels.
Actions include:
► special training for thermal solar systeminstallers
► information and training for designers,architects and the building sector
► making demonstration projects, whichexemplify solar concepts in new publicbuildings
► campaigns towards the hotel sector aimingto use solar energy
Solar Photovoltaic:
There is at present a research programmeinvolving a 42 kW PV panel, but the currenthigh cost limits the possibilities of gridconnection. This is not the case if the PV is ona small scale, where the quality of servicespredominate the cost – this could be inprotected areas, traditional applications for therural areas and for communication.
Passive Solar:
► training and information on the traditionalsolutions and on new solutions aimed towardsdesigners
► preparation of a catalogue of accessiblesolutions
Energy Savings and Energy Efficiency:
Energy savings and energy efficiency areadditional objectives.
The municipal’s public lightning system hasbeen chosen as object of analysis and proposalregarding energy saving, taking into accountthat public lightning represents 6% of totalelectricity demand.
Renewable Energy on Small Islands – Second Edition August 2000 The Mediterranean Sea
48
Major Sector and Actors:
Town Councils and Consell Insular:
The public sector is where the first steps aretaken; integrate thermal solar applications intothe principal public buildings, PV installationsat monuments and tourist centres in naturalareas, and passive solar design for new publicconstructions.
Tourism Sector:
To launch a campaign aiming to install 8,000m2 of solar panels in the island’s touristbuildings.
Organisation:
The Consell Insular de Minorca is the principalactor for promotion and implementation of thePlan. The management of the plan should bethe responsibility of an organisation created bythe Consell Insular de Minorca. This bodyshould promote renewable energy with thesupport from the international organisationsinvolved, the International Scientific Councilfor Island Development (INSULA) and theUnited Nations Educational, Scientific, andCultural Organization (UNESCO).
The objectives of this managementorganisation are to:
► create co-operation between public andprivate actors
► identify the possibilities and potentials indifferent sectors
► assist with technical assistance
► identify additional financial resources
► co-ordinate promotion and campaignsregarding the possibilities and prospects ofrenewable energy
Renewable Energy Potential
Potential for Development of RenewableEnergy for the Balearic Islands:
Renewable EnergySource
Potential
Waves LowTidal LowBiomass LowGeothermal LowHydro LowPV LowSolar Thermal HighWaste to Energy MediumWind LowSource: CEEETA, 1997b
Contact Information
Organisation: International Scientific Council forIsland Development (INSULA)C/o United Nations Educational,Scientific, and Cultural Organization(UNESCO)
Address: 1, rue de Miollis75015 ParisFrance
Tel.: +33 1 45684056Fax: +33 1 45685804E-mail: [email protected]: www.insula.org
Organisation: Consell Insular de MenorcaAddress: Camí d’es Castell no 28
07702 MaoMinorcaBalearic IslandsSpain
Tel.: +34 971 353100Fax: +34 971 366199E-mail:Internet: http://www.caib.es/
References
CEETA, 1997b
Juaenda & Marin, 1999
Marin, 1998
Renewable Energy on Small Islands – Second Edition August 2000 The Indian Ocean
49
Mauritius
General Information
Population: 1,196,172 (2000 estimate)
Area (km2): 2,040
Mauritius is situated in the South West of theIndian Ocean, east of Madagascar.
The country includes the island of Mauritius,with an area of 1,865 km2; the island ofRodrigues with an area of 104 km2 to the east;the Agalega Islands to the north; and theCargados Carajos Shoals to the north-east,which have a combined area of 71 km2.
Introduction
In Mauritius, imported petroleum productsaccount for about 90% of the total primaryenergy input. This figure has remainedvirtually constant for the past decade. Thesugar industry, which consumes more than halfof the island’s energy requirement, is self-sufficient energy-wise, using bagasse, a by-product of sugar-processing, for all its energyrequirements. Hydropower and solar waterheaters are also utilised on a big scale.
Electricity Sector
The Central Electricity Board (CEB) is aGovernment para-statal organisation under theaegis of the Ministry of Public Utilities, and isresponsible for the generation, transmissionand distribution of electrical energy inMauritius and its dependency RodriguesIsland.
The country is electrified to 100%, and thedomestic sector represents 90% of the totalnumber of consumers accounting for about38% of the total CEB’s revenue. Theremaining sectors are Commercial (8% oftotal) accounting for 32% revenue, andIndustrial (2% of total) contributing thebalance of 30% to revenue.
The economic development in Mauritius overthe past decade has led to sustained rapidgrowth in electricity demand. Over this period,CEB has undertaken substantial investment tocope with an average increase of about 10 percent per year in both power and energydemand. It is anticipated that in the decadeahead, the corresponding figures, though
decoupled with G.D.P will continue to increaseat an average rate of about 7 per cent, hencethe further requirement of substantial financialresources. To cope with such a situation,generation from private companies is presentlystrongly encouraged, the more so that it shouldallow an enhanced production of electricalenergy from bagasse a residue of sugar canemilling and a reliable source of renewableenergy. Privatisation of the Power Sector isalready advocated in certain quarters, but itsimpact on subsequent tariff levels withpossible adverse incidence from the macroeconomic standpoint, is an object of concern inother quarters.
The history of electrical power generation inMauritius dates back to the early years of thecentury, when hydropower started to beharnessed. During the first half of the century,some three hydro power stations of capacitiesranging from a few hundred kilowatts to sevenmegawatts were progressively commissioned,as electrification progressed in the main urbanareas of the country.
In the early fifties, diesel generating sets werefirst introduced for electricity generation at St.Louis, close to the capital Port Louis and by1958, that Power Station had a total installedcapacity of about 14 megawatts with eightmedium speed generating units. Thereafter, in1962, a new thermal power station wascommissioned at Fort Victoria, within some1.6 kms from St. Louis and comprising two 6.2MW slow speed diesel generating units.
At about the same time, three further hydropower stations were commissioned island widewith capacities ranging from one to four MW.The two last hydro power stations werecommissioned in 1971 at Ferney (2 x 5 MW)and in 1984 at Champagne (2 x 15 MW). It istoday considered that with a total installedhydro capacity of some 60 MW, all theeconomically feasible hydropower projectshave been completed. The correspondingaverage energy yield from hydropower is ofthe order of 100 GWh annually correspondingto seven per cent of total generation in 1998.
In the thermal power stations, furtherdevelopment took place at Fort Victoria from1973 to 1978 with the installation of eightmedium speed units of some 5.5 MW each,and the Power Station was further extended in1989, again with the installation of two 9.8MW medium speed units. At St. Louis PowerStation, six 12 MW units were progressivelyinstalled from 1978 to 1981.
Renewable Energy on Small Islands – Second Edition August 2000 The Indian Ocean
50
A first peak load power station with a 25 MWgas turbine unit was commissioned in late1987 at Nicolay and subsequently, two furtherunits of 25 MW and 35 MW respectively wereadded in late 1991 and early 1995. Those unitsoperate also as emergency units and providereliable back up to hydro peaking capacityduring dry years, whilst ensuring to-day a lossof load expectation (LOLE) of the order of 26hours annually.
The last base load Power Station wascommissioned in 1992 at Fort George nearPort Louis where 2 x 24 MW and 2 x 29 MWslow speed diesel units are now in operationand 1 x 29 MW unit on order. This PowerStation will cater for 50% of total electricalenergy requirement of the country in year2000.
A feasibility study for new base load powerrequirement over period 2005-2020 ispresently being carried out to determine thebest development scenario, whilst taking alsointo consideration new environmentalregulations enforced in Mauritius’s legislationsince 1991. The competitors for this futuredevelopment appear to be conventional coaltechnology, combined cycle gas turbinetechnology and slow speed diesel units similarto those already installed at Fort George.
Electricity Capacity
Installed Electricity Capacity by Source in1999:
Source InstalledCapacity
Percentage ofTotal Installed
CapacityThermal 288.5 MW 60.1%Hydro 59.4 MW 12.4%Bagass 132.4 MW 27.5%RenewablesTotal
191.8 MW 39.9%
Source: http://ncb.intnet.mu/putil/ceb/sector.htm
Electricity Production
Electricity Production by Source in 1996:
Source Percentage of TotalProduction
Thermal Plants 80.63%Hydro 9.02%Bagass 10.35%Renewables Total 19.37%Source: Saddul, 1999
Renewable Energy from Bagasse
Private energy generation from Sugar Factorieswith export of surplus energy from bagasse to
CEB grid started as early back as 1957 whenenergy supply contracts were signed betweenCEB and two Sugar Estates. On account of theintermittent nature of supply, and the fact thatsuch energy derived from bagasse wasavailable during the crop season only (July toDecember), CEB had to continue in itsinvestment programme independently,irrespective of installed capacity on sugarestates, and remuneration of energy from thoseprivate suppliers was consequently not veryattractive. However, the contracts wereperiodically reviewed and in 1982, the firstcontract for the supply of electrical energy onfirm power basis all year round was signedwith the biggest sugar factory of the island(Flacq United Estates Limited – F.U.E.L.).That Sugar Company installed a 22 MWcondensing turbine associated with a dual fuelboiler designed to burn coal as a replacementof bagasse in the inter crop season. The PowerStation was commissioned in 1985, and sincethen produced and average of some 90 GWh tothe CEB grid annually, with about 50% energyexport derived from bagasse. A new 18 MWturbo alternator associated with consendingturbine and coal/bagasse fired boiler wascommissioned in late 1998 to bring totalenergy export to grid to some 170 GWh.
The next significant step forward was initiatedin 1991 through the Bagasse EnergyDevelopment Programme (B.E.D.P.). Afterprotracted debates involving the Government,the CEB and the Sugar Industry not less thannine different Power Purchase Agreementswere signed in the period 1996 to 1997between the Sugar Industry promoters and theCEB for period of 15 to 20 years. The PPA’swere pertinent to three bagasse cum coal FirmPower Projects to operate some 8,000 hoursper year, and five “continuous power” projectsdesigned to operate on bagasse during the cropseason only, i.e. about 2,500 hours/year.
In relative terms, nearly 20% of total nationalelectrical energy will be derived from bagassein year 2000, with a natural decline thereafterassociated with a saturation of the bagassepotential of the country. In absolute terms thebagasse energy will have increased fourfold inthe period 1994 to year 2000 with prospects ofgoing significantly beyond the expectations ofthe B.E.D.P. in the medium term.
Today, electrical energy generation inMauritius is dependent on imported diesel fueland kerosene for about 75% of totalgeneration, and on account of the presenteconomic activity, the need is felt for desirable
Renewable Energy on Small Islands – Second Edition August 2000 The Indian Ocean
51
diversity in the primary energy sources, hencethe declared policy of the Government ofMauritius to encourage coal/bagasse powergeneration to fully optimise the use ofavailable bagasse as a renewable source ofenergy. A first 2 x 35 MW power station isexpected to come into operation in early year2000 at Belle Vue in the centre north of theisland.
The other factors which have favoured theemergence of the Sugar Industry basedIndependent Power Producers and thedevelopment of bagasse based energy are asfollows:
► The economic and strategic interest of thecountry to optimise it’s indigenous renewableenergy potential in a situation whereby some90% of primary energy needs are imported.
► The clear policy of the successiveGovernments to give their full support to theSugar Industry, on account of its position asthe best net foreign currency earner in acontext of more severe internationalcompetition coupled with a need to makenecessary investment to upgrade obsoleteequipment and machinery for an enhancementof efficiency;
► The rapid growth in power and energydemand corresponding to a yearly averageincrease of nine and ten percent respectivelyregistered over a period of 12 consecutiveyears, starting from 1986;
► The need to replace ageing generatingplants in the CEB diesel based power stationsof Fort Victoria and St. Louis which havereached the end of their normal service life.
► The financial incidence of the considerableinvestment made by the public sector in acontext where electrical energy tariffs weredeclining in real terms, thus adverselyaffecting profitability and financial equilibriumdangerously.
► The emergence of a new attitude in respectof environment impacts of new generatingplant and more particularly emission of gasesassociated with the “greenhouse effect”leading to Government commitment ininternational forum to force mitigatingmeasures upon the concerned sectors.
► The development of new technology withenhanced possibilities of energy conversionand energy use.
► The favorable impacts on grid interfacingwith regard to diversified geographic locationof generating plant island wide and spinningreserve response associated with conventionalboiler technology.
Renewable Energy from Hydropower
Electricity generation in Mauritius started withthe harnessing of hydropower as early back as1904 and this has been the main source ofelectrical energy to the population until theearly fifties, when diesel generators wereintroduced.
The size and topography of the island allowsfor only modest storage capacity, with theresult that in spite of an average rainfall of 2 mover the territory, the average annual energyderived from the hydro sector is only of 100GWh.
Rainfall is seasonal with 70% of precipitationusually being experienced from December toApril. The growth of the population and theeconomic development of the country dictatethat irrigation for agriculture together withdomestic and industrial needs are prioritycandidates for water use. Thus hydroelectricity generation is today being essentiallyconsidered as peaking and emergencycapacity, except during relatively short highrainy periods.
The present installed capacity of about 60 MWcomprises hydro turbines in the range of 1 to15 MW unit rating installed over the period1945 to 1984 at nine different locations. Thelatest power station commissioned in 1984 isof particular strategic interest for the quality ofsupply to the network on account of its featureto generate some 30 MW within only 120seconds from order to start.
It is considered today that virtually all of theavailable water resources for hydro powerhave been harnessed.
Other Renewable Energy Sources
Solar Water Heaters:
Some 20,000 solar water heaters have beeninstalled. This represents an 8% penetration ofthe household market.
Solar water heaters are used in many coastalhotels for hot showers. This is, however, on thedecline as the technology has failed. Hotels arenow having to recourse to gas boilers.
Renewable Energy on Small Islands – Second Edition August 2000 The Indian Ocean
52
PV:
From a purely experimental point of view, aPV powered irrigation system is being tested inone of the river mouths where intensivecultivation is practised. A contract has beenawarded in 1998 for a pilot project on thedevelopment, supply and installation of a PVsystem for street lightning and lightning ofGovernment Building to promote thedevelopment of renewable energy sources onmainland Mauritius and Rodrigous Island. Thepilot project will consist of the supply andinstallation of a total of 125 solar poweredstreets lightning units (to be installed inMauritius, Rodrigues and Agalega Islands)together with the installation of a grid PVsystem on the New Government Centrebuilding in the capital city of Port Louis.
Rodrigues Island is the best site where small-scale PV systems could replace the use ofdiesel generators. The University of Mauritiusproposes to study the use of PV on Rodriguesisland, paying careful attention to the water-pumping applications, problems with salt-intrusion to wells etc., and the generalhydrology of Rodrigues, as well as the morestraight forward technical aspects of PV water-pumping systems – e.g. size of array, type ofpumps, economics of delivered water, andintegration with existing diesel generatingsystems.
In Agalega Islands (population 300), PVelectricity is provided to some 40 households.The project is funded by UNDP-GEF/SGP(Global Environment Facility/Small GrantProjects). A PV based Survival Centre for foodstorage and desalinisation is being set up.
Wind Power:
As part of the Government of Mauritius plan todiversify it’s of alternative energy sources, theMauritius Meteorological Office (MMO)initiated a programme in the early 1980’s toevaluate the wind energy potential ofMauritius.
The survey for Mauritius has shown a majorpotential for exploiting wind energy at varioussites. However, the wind energy programmeneeds to consider its exploitation in relation tothe energy resources and capital investmentcosts. The case for exploiting wind energy ismuch clearer for Rodrigues Island, whereelectricity generation by other means is lessuniversally available.
It is the policy of the government to promotethe use of wind. Taking into considerationtechnological advancements in the field ofwind energy, and the favourable wind regimeas assessed by a study financed by UNDP in1985, it has been agreed to encourage thedevelopment of wind farms in Mauritius andRodrigues on a Build, Operate and Own(BBO) scheme by providing a proper pricingpolicy.
So far, all projects related to wind energy intoelectrical energy with a view to feeding thepresent grid have lamentably failed in bothMauritius and Rodrigues. Efforts formdifferent agencies and organisations (UN,German Development Bank, Australian TradeCommission) in the setting up of small windfarms on the island have been commendable,but all have been damaged by cyclonic winds,corroded and finally dismantled. Lack ofavailable funds, lack of appropriate technologyand training and of regional co-operation aresome of the discouraging factors.
The Government has sent out a request forexpression of interest for the development of 5MW wind farm on the main island ofMauritius.
Wave Energy:
In Mauritius, the Mauritius Wave EnergyProject was conceived in 1958 focusing on thepossibility of converting wave energy intoelectricity at Riambel, in the south ofMauritius. However, progress has beenminimal.
Several problems associated with the waveproject have been identified:
► proper siting of the turbines
► permeability and strength of the reef
► ecological impacts of the wave-ramp on thereef and coastal areas (salt water infusion)
► the effect of seasonal variation on theelectricity output.
Renewable Energy Project Priorities
► maximise the use of bagasse
► setting up wind farms in Mauritius and atCanne Paul in Rodrigues
Renewable Energy on Small Islands – Second Edition August 2000 The Indian Ocean
53
► use solar heaters and PV for hotels andgovernment buildings
► use low energy street lights
Contact Information
Organisation: Central Electricity BoardMinistry of Public Utilities
Address: Level 10, Air Mauritius CentrePresident John Kennedy StreetPort LouisMauritius
Tel.: +230 675 7958Fax: +230 208 6497E-mail:Internet: http://ncb.intnet.mu/putil/ceb/index.h
tm
References
Hebrad, 1999
Saddul, 1999
DBSA & ISES, 1999
Homepage of Central Electricity Board,Ministry of Public Utilities(http://ncb.intnet.mu/putil/ceb/index.htm)

Renewable Energy on Small Islands – Second Edition August 2000 The Indian Ocean
54
Renewable Energy on Small Islands – Second Edition August 2000 The Indian Ocean
55
Reunion (France)
General Information
Population: 653,000 (1995 estimate)
Area (km2): 2,512
Reunion is located in the Indian Ocean south-east of Madagascar. The island is an overseasdepartment and administrative region ofFrance.
Electricity Capacity:
Installed Electricity Capacity by Source in1998:
Source InstalledCapacity
Percentage ofTotal Installed
CapacityThermal Plants 192.5MW 44%Hydro 126.6MW 29%Bagasse/Coal 118MW 27%Source: IEDOM, 1999
Electricity Production
Electricity Production by Source in 1998:
Source Percentage of TotalProduction
Thermal Plants 43.9%Bagasse 16.5%Hydro 39.6%Renewables Total 56.1%Source: ADEME Reunion, 1999
Renewable Energy from Bagasse
There are two co-generation plants, Louis-Rouge and Le Gol, on the islands. They run onbagasse during the sugar season, and asconventional coal plants during the rest of theyear. Producing 2 millions tons of sugar cane ayear, the island has access to 640,000 tons ofbargasse, the equivalent of 120,000 tons ofheavy fuel.
The cost per kWh produced is perfectlycompetitive for an Overseas Department.
Bouis-Rouge plant was commissioned inAugust 1992 and has achieved excellent resultshence it was decided to build a second plantnear La Gol sugar mill. This plant wascommissioned in the last quarter of 1995.
The Bois-Rouge Concept:
In order maximise the use of bargasse, a newtype of power station was designed and built inBois-Rouge. It was based on the application ofthe following principles:
► the power station build next to the sugarmill in order to minimise the transportation ofbargasse
► the power station supplies process steam tothe sugar mill and exports electricity to thegrid
► the plant boilers generate efficiently (90%thermal efficiency) high characteristic steam(80 bars, 520oC)
► in order not to storage large quantities ofbargasse, the power station burns all of thebargasse as it is produced by the sugar mill
► when bagasse is not available (mainlyduring the inter crop season which last sixmonths) a second fuel is used, and the powerstation is operated as a conventional plantproducing electricity for the grid
► the impact of the power station onto theenvironment would have to be minimal (inparticular as far as emissions are concerned)
The Bouis-Rouge Power Station is made onthe following equipment:
► two boilers producing each 130 tons ofsteam can burn either bagasse or coalexclusively as well as any combination of thetwo fuels. Switching from one fuel to the othercan be done on line automatically. The boilersare of the two drum multipass spreader-stokertype, with a two-stage super heater. Bagassefiring equipment is made on bagasse feedersthat allow bagasse extraction and feedregulation from feed chutes. Coal feedersinclude slat conveyors and projecting drumslocated at the bottom of the coal chutes
► fuel gas cleaning equipment made of twodistinct dedusting systems: one mechanicaldeduster designed to collect large particleswhich will be re-injected into the furnace, thesecond stage consisting of an electrostaticprecipitator
► bagasse handling system which includes anindoor storage capacity of 1,000 tons needed toaccommodate the different operating rates ofthe sugar mill and the power station, a set of
Renewable Energy on Small Islands – Second Edition August 2000 The Indian Ocean
56
conveyor belts and slat conveyors whosefunction is to carry an even quantity of bagasseto the boiler house
► coal handling facility including truckweighting, unloading, screening, grinding, twostorage silos and a set of conveyor belts
► two turbo-generator sets of a capacity of 30MWe each, consisting of two steam turbineeach comprising a high pressure body and alow pressure body and a steam extractionsystem, two generators and two condensers
► two cooling system towers aimed at coolingdown the condensers, the lube oil plant and thegenerators
► ash handling system
► two water demineralisation units
Bois Rouge and Le Gol Results:
The main challenges faced by the engineersand the operators were:
► the size of the plants (circa 60 MWe each)compared with the overall size of the islandgrid (260 MW)
► the necessity to switch automatically fromon fuel to the other
► the necessity to meet at the same time thedemand from the gird and the demand from thesugar mill which could vary in totally differentdirections
Renewable Energy from Hydropower
Hydropower is produced at Riviere de l’Est,Takamaka I & II, Bras de la Plaine andLangevin power stations.
Though the hydro potential is practicallytapped, there are still a number of potentialsites, where micro power stations can beinstalled.
Solar Water Heaters
Approximately 10,000 units are in operation.Through the “Abonnez vous au Soil”campaign, some 1,500 solar heater areinstalled every year.
EDF and ADEME have set up a structure toencourage households to purchase a solarheater by providing various “save energy”
incentives. One of them is the provision of asoft loan of 5.5% interest rate. The campaignaims at sensitising the public on theircontribution towards solving environmentalproblems such as climate change, acid rain etc.
Other Renewable Energy Sources
Geothermal:
20MW could be installed when the demandcurrently met by bagasse-coal plants need theinstallation of supplementary productionmeans (2006). Two deep exploration boreholeswere drilled in 1985 at the Grand Brûlé andSalazie sites. Although non-productive, theseboreholes and associated studies have shownthat potential exists for discovering exploitablehigh-temperature resources, especially atSalazie. It should be noted that in Hawaii, sixboreholes were put down before a resource of385○C was found at 2,100 depth.
Contact Information
Organisation: ADEME ReunionAddress: 97, rue de la République
97400 Saint-DenisReunion
Tel.: +262 21 10 00Fax: +262 21 12 60E-mail: [email protected]:
Organisation: Association RESOEnergie Renouvelables
Address: 18, Route de Sainte Francois97400 Saint DennisReunion
Tel.: +262 67 36 27Fax: +262 30 28 94E-mail:Internet: http://www.guetali.fr/reso-energie-
renouvelable/contacts.htm
References
ADEME Reunion, 1999
ADEME Reunion, 1998
Bal et al, 1999
EDF, 1998
Saddul, 1999
Renewable Energy on Small Islands – Second Edition August 2000 The North Pacific Ocean
57
Hawaii (USA)
General Information
Population: 1,193,001 (1998)
Area (km2): 16,729
State of Hawaii is the only island state and thesouthernmost state in the United States. Hawaiiconsists of eight Hawaiian Islands and a fewother geographically unrelated islets locatednear the centre of the northern Pacific Ocean.
Below are specified population and size for themajor six islands in Hawaii State:
Island Population1 Area (km2)Hawaii 120,317 10,433Kauai 50,947 1,430Lanai 2,426 364Maui 100,374 1,883Molokai 6,717 673Oahu 836,207 1,554
Introduction
Hawaii, as is typical for many island areas inthe Pacific Region, finds itself in a paradoxicalenergy situation. In spite of a wealth ofrenewable energy resources and a two-decadeold supportive state policy, the state continuesto rely on imported petroleum and coal foralmost ninety percent of its energy needs.Faced with dwindling financial resources,Hawaii has had to opportunistically leverageits assets to generate investments in developingrenewable energy resources, includingresearch, development and demonstrationprojects to introduce new technologies, andcommercialisation of promising technologies.
The primary components of the state energystrategy are to promote the use of energyefficiency and renewable energy in place ofimported fossil fuels.
The Energy, Resources and TechnologyDivision of the Hawaii Department ofBusiness, Economic Development andTourism, is responsible to ensure thereliability, security, and economy of energysupply, all in an environmentally responsiblemanner.
1 For year 1990.
Hawaii’s Energy Profile
Twenty-five years have passed since theoriginal oil crisis, and the need for Hawaii todiversify is energy resources and developrenewable energy has never been as great. In1974 the state derived ninety percent of itstotal energy needs from oil. Importedpetroleum supplied gasoline, diesel, jet fueland electricity demand.
For decades the energy supply in Hawaii hasbeen much less diversified than that of theUnited States as a whole. In 1997, 88% ofHawaii's total energy came from oil, 4.5%from biomass and municipal waste, 5.7% fromcoal, and 1.8% from other sources. Bycomparison in 1997, the nation relied onpetroleum for only 37% of its energy, whilenatural gas supplied 22%, coal provided 22%,and nuclear power generated 7%.Hydroelectricity and other sources provided12% of the nation's energy.
Hawaii's residents paid almost $2.2 billion(US) for energy in 1995, or 6.6% of the GrossState Product. On a per capita basis, energybills are fairly low - forty-second in the US for1995 - largely because of limited drivingdistances and the absence of heating and airconditioning in homes, but proportionatelymore is paid for the energy used. Overall, stateenergy prices were the fifth highest in thecountry in 1995.
By far the most oil-dependent of the 50 states,Hawaii imported 29% of its crude petroleumfrom Alaska in 1997 and the remainder fromthe Asia-Pacific region, primarily Indonesia.Oil exports from both areas are projected todecrease significantly by the year 2000, andthus reliance on other sources will increase. Inrecent years, use of oil for electrical powergeneration has dropped. About one-third of thetotal energy consumed state-wide is used forelectricity. Through 1991 oil-fired generationfuelled about 90% of electrical powergeneration, but by 1997 the share had fallen to75 percent, despite strong growth in demand.
On Oahu, two oil refineries produce the bulkof refined products used in the state. Therefinery is driven largely by thedisproportionate demand for jet fuel, given thestate's reliance on air transportation as itseconomic lifeline to the rest of the world.
The state's Public Utilities Commissionrequires all energy utilities to developintegrated resource plans in an effort to
Renewable Energy on Small Islands – Second Edition August 2000 The North Pacific Ocean
58
balance traditional "supply-side" resourcessuch as new power plants, with "demand-sidemanagement" measures, includingconservation and the shifting of power loadsfrom peak-use periods to times of lowerdemand. The commission has also mandatedthat supply-side plans include alternativeenergy resources and address the social,cultural, and environmental impacts of variousenergy options. The state and localgovernments also participate in this process,along with private citizens.
The island’s electric grids in Hawaii are notinterconnected by submarine transmissioncable, so market size; economies of scale ofgeneration, transmission and distribution; andsystem reliability are critical issues forelectricity delivery.
Electricity Capacity
Below are specified the installed electricitycapacity for each of the 4 islands in HawaiiState with utilisation of renewables forelectricity generation.
Kauai Island
Installed Electricity Capacity on Kauai Islandin 1999, by Source:
Source InstalledCapacity
Percentage ofInstalledCapacity
Thermal Plants 95.3MW 70.2%Biomass 36.5MW 26.9%Hydro 4MW 2.9%RenewablesTotal
40.5MW 29.8%
Source: Kaya, 1999b
Oahu Island
Installed Electricity Capacity on Oahu Islandin 1999 by Source:
Source InstalledCapacity
Percentage ofInstalledCapacity
Thermal Plants 1725.2MW 95.8%Biomass 12.5MW 0.7%Municipal SolidWaste
63.8MW 3.5%
RenewablesTotal
76.3MW 4.2%
Source: Kaya, 1999b
Maui Island
Installed Electricity Capacity on Maui Islandin 1999 by Source:
Source InstalledCapacity
Percentage ofInstalledCapacity
Thermal Plants 188.1MW 74.4%Hydro 6.4MW 2.5%Biomass 58.3MW 23%PV 0.02MW 0.008%RenewablesTotal
64.72MW 25.508%
Source: Kaya, 1999b
Hawaii Island
Installed Electricity Capacity on Hawaii Islandin 1999 by Source:
Source InstalledCapacity
Percentage ofInstalledCapacity
Thermal Plants 181.2MW 76.5%Hydro 14.727MW 6.2%PV 0.09MW 0.04%Wind 10.93MW 4.6%Geothermal 30MW 12.7%RenewablesTotal
55.747MW 23.54%
Source: Kaya, 1999b
Electricity Production
State of Hawaii
One objective for the State of Hawaii is theincreasing use of indigenous energy supplies.During the period 1990-1997, overallrenewable energy use for electricity generationdid not increase, but the shares of the variousresources changed, principally due to thedecline in wind generation and sugar industryelectricity. Other renewables, especiallygeothermal and municipal solid waste, largelyfilled the void.
Electricity Production for State of Hawaii bySource, in 1997:
Source Percentage of TotalProduction
Thermal Plants 92.7%Biomass 1%Geothermal 2.3%Hydro 0.7%Municipal Solid Waste 3.2%Wind 0.1%Renewables Total 7.3%Source: Hawaii Energy Strategy 2000

Renewable Energy on Small Islands – Second Edition August 2000 The North Pacific Ocean
59
Below are specified the electricity productionfor each of the 4 islands in Hawaii State withutilisation of renewables for electricitygeneration.
Kauai Island
Electricity Production on Kauai Island in 1997by Source:
Source GeneratedElectricity
(Million kWh)
Percentage ofTotal
ProductionThermal Plants 351 78.9%Biomass 77 17.3%Hydro 17 3.8%RenewablesTotal
94 21.1%
Source: http://www.state.hi.us/dbedt/ert/data/97kwhislsrc.html
Oahu Island:
Electricity Production on Oahu Island in 1997by Source:
Source GeneratedElectricity
(Million kWh)
Percentage ofTotal
ProductionThermal Plants 7,299 95%Biomass 15 0.2%Municipal SolidWaste
371 4.8%
RenewablesTotal
386 5%
Source: http://www.state.hi.us/dbedt/ert/data/97kwhislsrc.html
Maui Island:
Electricity Production on Maui Island in 1997by Source:
Source GeneratedElectricity
(Million kWh)
Percentage ofTotal
ProductionThermal Plants 1,042 86.9%Biomass 133 11.1%Hydro 24 2%RenewablesTotal
157 13.1%
Source: http://www.state.hi.us/dbedt/ert/data/97kwhislsrc.html
Hawaii Island:
Electricity Production on Hawaii Island in1997 by Source:
Source GeneratedElectricity
(Million kWh)
Percentage ofTotal
ProductionThermal Plants 731 71.1%Geothermal 229 22.3%Wind 17 1.7%Hydro 51 5%RenewablesTotal
297 29%
Source: http://www.state.hi.us/dbedt/ert/data/97kwhislsrc.html
Sources of Renewable Energy
Hawaii's policymakers remains committed tofurther the utilisation of the state's renewableenergy resources. It is estimated that in 1997renewable resources displaced 3.2 millionbarrels of oil and reduced carbon dioxideemissions by nearly 1.7 million tons. Somerenewable sources, such as biomass,geothermal, hydroelectricity, wind,photovoltaics and solar thermal for waterheating are already cost effective in Hawaii.Over time, electricity produced frombioresidues from the sugar industry hasdeclined with the closure of many plantations,but there have been gains in the use ofgeothermal, hydroelectric, and solar energyresources.
Biomass:
Historically, the largest local energy source hasbeen biomass, which in 1980 provided 13% ofthe state's electricity. By 1997 that share hadshrunk to 5.9%, and about 60 percent of thispower production came from the combustionof municipal solid waste at Oahu's H-POWERplant, which began operating in 1989. Thisdecline in biomass-fuelled energy productionresulted from the dwindling of the primary fuelsupply, bagasse, as sugarcane acreagedecreased during the 1970s and 1980s.
Biomass remains a critically importantresource, since it can serve both as a fuel forelectricity generation and as a feedstock forliquid and gaseous fuels. The development ofnew production technologies that could makebiofuels competitive in Hawaii has sparked aresurgence of interest in ethanol and methanolfuels. Other projects that could boost biomassuse include the construction of a demonstrationbagasse gasifier on Maui and state-wideresearch, into species of grasses and treessuitable for biomass plantations.
Geothermal:
The second most significant renewable sourceof electricity in the state is geothermal energy.Exploration into this resource began in the1960s on the flank of Kilauea volcano. In 1976a 6,450 feet deep (1,966 m) well wascompleted and flashed, and a demonstrationgeothermal power plant was constructed at thesite in Puna, on Hawaii Island, with supportfrom both public and private sector agencies.Operating from 1982 to 1989, the 2.5megawatt facility proved the commercialviability of the geothermal resource, which at
Renewable Energy on Small Islands – Second Edition August 2000 The North Pacific Ocean
60
676 degrees F (358 deg C) ranked among thehottest in the world.
Some 24,000 acres (9,800 ha) of land onHawaii and Maui are now designated as"subzones" where geothermal development isauthorised. Currently there is only onecommercial geothermal power plant - the 25megawatt Puna Geothermal Venture facility,which contributed roughly 22 percent of theelectricity used on Hawaii Island in 1997.State monitoring of air quality surrounding thegeothermal plant site is ongoing, and researchcontinues on geologic history, groundwaterchemistry, seismic events, and geothermalreservoir development potential.
In 1989 the state pursued ambitious plans toconnect the major islands with a submarinecable to supply the main load centre on Oahuwith geothermal energy from Hawaii. Theproject eventually proved to be uneconomicaland was complicated with politicalcontroversy. The current use and furtherdevelopment of this resource remainscontroversial, given the concerns raised bysome members of the community over safety,the health effects of geothermal emissions,Native Hawaiian rights, and land use conflicts.
Hydro:
Hydroelectricity is among the oldest electricityresources in the Islands with some plantsdating back to the late 1800s. Hydroelectricplants in Hawaii use no dams; they arerun-of-the-river installations and, as such, areintermittent electricity providers like wind andsolar plants. State-wide there are 15 hydrofacilities with capacities of 0.2 megawatt orgreater. Most are owned and operated by sugarcompanies. The only utility-owned hydroplants are on Hawaii Island, as is the newestand largest plant, a 12-megawatt systemoperated since 1993 by the Wailuku RiverHydroelectric Company.
Wind:
Hawaii also has excellent wind resources.Wind power plants with capacities of severalmegawatts each were installed at Kahuku onOahu and at Kahua Ranch, Lalamilo, andSouth Point on Hawaii Island. The Kahukudevelopment included the world's largest windturbine at the time, with a generating capacityof 3.2 megawatts. Hawaii was among theleaders in the US, with the first commercialwind farms. However, first generation windturbine technology was utilised, and equipment
failures and high maintenance costs haveaffected the commercial success of windpower. Some machines, for instance at theKahuku and Kahua sites, have since beenremoved from service, while repairs andrenovations have temporarily reduced theoutput of others. Modern, state-of-the-art windturbines including recent designs fromDenmark and other European manufacturerscould provide electricity less expensively thanthe models previously installed. At present,permits and contract negotiations are underwayfor two new 10 megawatt wind turbineinstallations on Maui and Hawaii.
Solar Water Heaters:
The most common renewable energytechnology in Hawaii, and one most residentscan utilise, is solar water heating. With morethan 60,000 household systems installed,Hawaii boasts the highest per capita use ofsolar water heating in the nation. Thesesystems provide approximately 3,122 billionbtu of heat energy annually and contributemore energy than any other renewable energyresource state-wide except for biomass andsolid waste. Most systems were installed in thelate 1970s and early 1980s, encouraged bygenerous federal tax credits. When thesecredits expired, installations declined rapidlyfrom several thousand per year to a fewhundred per year state-wide. In 1989, the stateincreased its own tax credit to 35%; since thattime installations have averaged over 1,000systems a year. More recently, the state hasinitiated partnered private sector investmentprogram for solar water heaters, through rebateincentives offered by the utility demand-sidemanagement programs. With the tax creditsand utility rebates of up to $800 per solar waterheater, the initial cost of these systems isreduced by 50 percent, and the number ofsystems installed per year has increased tobetween 4,000 and 5,000.
PV:
Another popular solar option, especially forresidences in rural areas not served by theelectric utility grid on Hawaii Island, isphotovoltaics. There are also a number ofgrid-connected systems on residences, andseveral large grid-connected facilities on Mauiand Hawaii Island that were installed asdemonstration units. Within the last two years,the Mauna Lani Resort Hotel on Hawaii hasinstalled two-100 kW roof-mountedphotovoltaic systems to reduce their peakdemand for electricity and showcase this
Renewable Energy on Small Islands – Second Edition August 2000 The North Pacific Ocean
61
environmentally benign technology in anappeal to the environmentally conscioustraveller. Photovoltaic modules are commonlyused in Hawaii by various agencies foremergency highway telephones, remoteseismic-monitoring equipment, andnavigational beacons. Hawaiian ElectricCompany has recently initiated a green pricingprogram for their customers who can sign upto pay extra to install photovoltaic systems onparticipating high school rooftops as part of anenvironmental education initiative.
Ocean Thermal Energy Conversion (OTEC):
The world's premier research site for thedevelopment of ocean thermal energyconversion (OTEC) technologies is at theNatural Energy Laboratory of HawaiiAuthority facility at Keahole Point on HawaiiIsland. OTEC utilises the temperaturedifferences, which can range up to 40 deg F(22 deg C), between water pumped in from thewarm ocean surface and the cold depths (2,000feet [610 m] or greater) to generate electricity.The deep, cold water is also rich in nutrientsand nearly pathogen-free, making it valuablefor a broad range of aquaculture andagriculture enterprises. The cold water issuitable for chilled-water air conditioningsystems as well.
Closed-cycle OTEC was first demonstrated inHawaii by the Mini-OTEC barge that had agross electrical output of 52 kilowatts.Experimentation continued through the 1980s,and ground was broken in 1993 at KeaholePoint for a new plant to test improvedcomponents. An experimental open-cycleOTEC plant, rated at 210 kilowatts grossoutput, began intermittent operation in 1994.Open-cycle OTEC can produce desalinatedwater as well as electricity. The state iscurrently pursuing commercial OTEC at thislocation.
Barriers and Lessons Learned
The main factors affecting the commercialintroduction of renewable energy technologiesin Hawaii include the following:
► economic competitiveness,
► deregulation and restructuring of the energyindustry,
► and environmental quality and sitingcontroversies affecting project permits.
Given the current business climate, renewableenergy projects developed by privateinvestment capital must compete with utilityprojects. Contracts must be secured from theregulated monopoly utility, who is required topay the project developer the utility's avoidedcost for the energy and any capacity credit ondeferred utility plant construction. Thisnegotiation process has proven to be arduousand time consuming, and adds to thecomplexity of developing any renewableenergy project. Since avoided cost ofelectricity in Hawaii is linked to the cost of oil,the primary fuel, projects tend to beuneconomical when oil prices are low as inrecent years.
Hawaii, like many other states in the US andother countries world-wide, is consideringintroduction of more competition in theelectric industry. The state's Public UtilitiesCommission has initiated a process toinvestigate deregulation of the industry,recognising that competition may serve toreduce the relative high costs for electricity inHawaii. If competition is successfullyintroduced, unbundling will permitcompetition on the supply side, and all sourcebidding for generation resources will bepossible. The state believes that societalbenefits including renewable energy andenergy efficiency can be preserved in aderegulated environment. A properlyrestructured industry can lead to more efficientallocation of resources, such as widespread useof real time pricing to send proper signals tomarket. However, the incumbent utilities,fearful of erosion of their markets, havevigorously opposed the introduction ofcompetition except in very limited applicationsfor new generation resources, and then only ifthey control the bidding process.
Perhaps the greatest impediment experiencedwithin the state is the overall concern for thepreservation of environmental quality andlifestyle. Hawaii's citizens can be very activein opposing new development largely becauseof an overwhelming conservation andpreservation ethic within the state. Thisattitude is understandable, recognising that thebeauty of the island environment is quitefragile, and is what draws visitors to the stateand keeps residents there. Public opposition tonew development is not limited to renewableenergy projects, compatible land use concernshave stymied the development of conventionalenergy projects and other public facilities suchas transportation systems, waste managementprojects, and prisons.
Renewable Energy on Small Islands – Second Edition August 2000 The North Pacific Ocean
62
Funding for new technology demonstrationand research and development has been harderto obtain, especially because of the state'scurrent economic slowdown. Hawaii has hadto rely on outside assistance to addresspressing issues on its energy agenda. Activelyseeking partnerships for technical assistanceand funding from both the private sector andfederal government has proven to be aneffective means to leverage limited stateresources. With renewable energytechnologies in general and solar energy inparticular, notable successes have beenachieved in forming joint venture partnershipsto stimulate private sector investment for thePacific region that serve as a model for otherregional programs.
Despite the difficulties and controversies, thestate remains committed to its long-term goalof reducing reliance on imported fossil fuel.The commercial deployment of renewableenergy technologies especially benefiting theisland environment is a lynchpin of thestrategy to achieve that goal.
Energy Policy
Hawaii State has a very comprehensive anddetailed energy and renewable energy strategy– Hawaii Energy Strategy 2000.2 This strategyalso incorporates the Hawaii Climate ActionProgram.
Below are a very short description of overallobjectives and some of the policies.
The State energy policy objectives are:
1. Dependable, efficient, and economicalstate-wide energy systems capable ofsupporting the needs of the people
2. Increased energy self-sufficiency wherethe ratio of indigenous to imported energyuse is increased
3. Greater security in the face of threats toHawaii’s energy supplies and systems
To achieve the energy objectives it is amongother things the policy of Hawaii State to:
► ensure the provision of adequate,reasonably priced, and dependable energyservices to accommodate demand
2 The strategy Hawaii Energy Strategy 2000 (323 pages in total) can bedownloaded at the homepage of Energy, Resources, and Technology Division:http://mano.icsd.hawaii.gov/dbedt/ert/hes2000/index.html
► support research and development as well aas promote the use of renewable energy
The specific objectives of the Hawaii EnergyStrategy 2000 are among others to:
1. Increase diversification of fuels and thesources of these fuels
2. Increase energy efficiency andconservation
3. Increase the use of indigenous renewableenergy resources
4. Reduce greenhouse gas emission fromenergy supply and use
Contact Information
Organisation: Energy, Resource and TechnologyDivisionDepartment of Business, EconomicDevelopment and Tourism
Address: P. O. Box 2359Honolulu, HI 96804USA
Tel.: +1 (808) 587-3807Fax: +1 (808) 586-2536E-mail:Internet: http://www.state.hi.us/dbedt/ert/ert_h
mpg.html
References
Hawaii Energy Strategy 2000
Homepage of Energy, Resource andTechnology Division, State of Hawaii(http://www.state.hi.us/dbedt/ert/ert_hmpg.html)
Kaya, 1999a
Kaya, 1999b
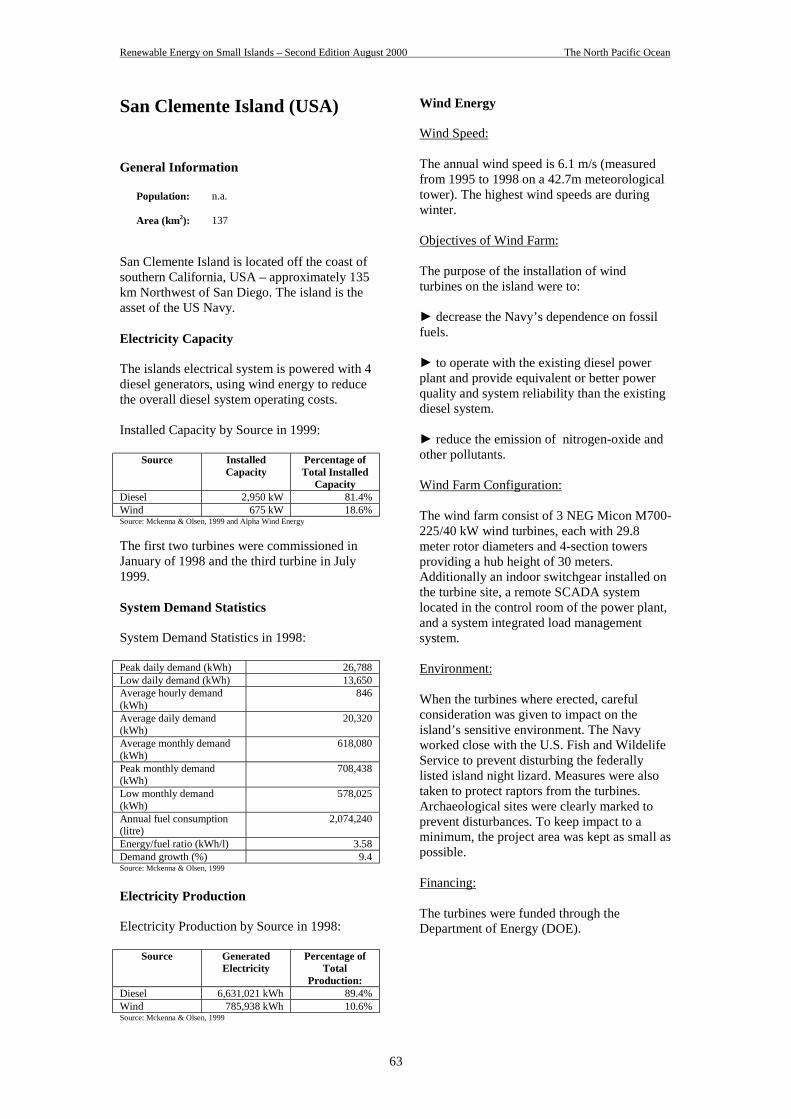
Renewable Energy on Small Islands – Second Edition August 2000 The North Pacific Ocean
63
San Clemente Island (USA)
General Information
Population: n.a.
Area (km2): 137
San Clemente Island is located off the coast ofsouthern California, USA – approximately 135km Northwest of San Diego. The island is theasset of the US Navy.
Electricity Capacity
The islands electrical system is powered with 4diesel generators, using wind energy to reducethe overall diesel system operating costs.
Installed Capacity by Source in 1999:
Source InstalledCapacity
Percentage ofTotal Installed
CapacityDiesel 2,950 kW 81.4%Wind 675 kW 18.6%Source: Mckenna & Olsen, 1999 and Alpha Wind Energy
The first two turbines were commissioned inJanuary of 1998 and the third turbine in July1999.
System Demand Statistics
System Demand Statistics in 1998:
Peak daily demand (kWh) 26,788Low daily demand (kWh) 13,650Average hourly demand(kWh)
846
Average daily demand(kWh)
20,320
Average monthly demand(kWh)
618,080
Peak monthly demand(kWh)
708,438
Low monthly demand(kWh)
578,025
Annual fuel consumption(litre)
2,074,240
Energy/fuel ratio (kWh/l) 3.58Demand growth (%) 9.4Source: Mckenna & Olsen, 1999
Electricity Production
Electricity Production by Source in 1998:
Source GeneratedElectricity
Percentage ofTotal
Production:Diesel 6,631,021 kWh 89.4%Wind 785,938 kWh 10.6%Source: Mckenna & Olsen, 1999
Wind Energy
Wind Speed:
The annual wind speed is 6.1 m/s (measuredfrom 1995 to 1998 on a 42.7m meteorologicaltower). The highest wind speeds are duringwinter.
Objectives of Wind Farm:
The purpose of the installation of windturbines on the island were to:
► decrease the Navy’s dependence on fossilfuels.
► to operate with the existing diesel powerplant and provide equivalent or better powerquality and system reliability than the existingdiesel system.
► reduce the emission of nitrogen-oxide andother pollutants.
Wind Farm Configuration:
The wind farm consist of 3 NEG Micon M700-225/40 kW wind turbines, each with 29.8meter rotor diameters and 4-section towersproviding a hub height of 30 meters.Additionally an indoor switchgear installed onthe turbine site, a remote SCADA systemlocated in the control room of the power plant,and a system integrated load managementsystem.
Environment:
When the turbines where erected, carefulconsideration was given to impact on theisland’s sensitive environment. The Navyworked close with the U.S. Fish and WildelifeService to prevent disturbing the federallylisted island night lizard. Measures were alsotaken to protect raptors from the turbines.Archaeological sites were clearly marked toprevent disturbances. To keep impact to aminimum, the project area was kept as small aspossible.
Financing:
The turbines were funded through theDepartment of Energy (DOE).
Renewable Energy on Small Islands – Second Edition August 2000 The North Pacific Ocean
64
Performance:
The wind farm maintains an averageavailability in excess of 98% and meets windpenetration up to 75%.
Economics:
Using two 225 kW turbines, the wind energycosts of energy of US$0.142/kWh helps reducethe wind-diesel hybrid system costs of energyfrom the baseline US$0.476/kWh toUS$0.461/kWh. This reduces system costs ofenergy by 3.2%. The payback period is 6.5years, the internal rate of return 14.4%.
Project Highlights:
The island presented several logistical andtechnical challenges due to the need for bargetransportation of materials and constructionequipment to and from the island and therequirement for a system integrated loadmanagement system. Despite these challenges,the project was commissioned within budgetand ahead of schedule.
Future Expansion:
The long term objectives of the U.S. Navy forSan Clemente Island (SCI) are to install about8 MW of wind capacity and to develop apumped-hydroelectric storage system, usingthe ocean as the lower reservoir.
There has also been proposed to make aseawater desalination plant for the island usingwind turbines. If funded, two additional windturbines and the desalination plant will makeSan Clemente Island fresh water independent.Currently, the island’s fresh water supply isbarged from San Diego at the rate of nearly14.5 millions gallons per year. The potentialannual savings from a wind-powereddesalination system could be nearlyUS$478,000 per year. In addition, bygenerating their own fresh water, islandmanagers could reduce the number of tripsmade by diesel-powered tugs.
Contact Information
Organisation: National Renewable EnergyLaboratory (NREL)
Address: 1617 Cole BoulevardGoldenColorado 80401-3393USA
Tel.:Fax:E-mail:Internet: www.nrel.gov
Organisation: Alpha Wind EnergyAtt. Jan Olesen
Address: Hedemoellevej 358850 BjerringbroDenmark
Tel.: +45 9678 0044Fax: +45 8668 5179E-mail: [email protected]:
References
Mckenna, & Olsen, 1999
Information provided by Alpha Wind Energy
News Release from Naval FacilitiesEngineering Service Center
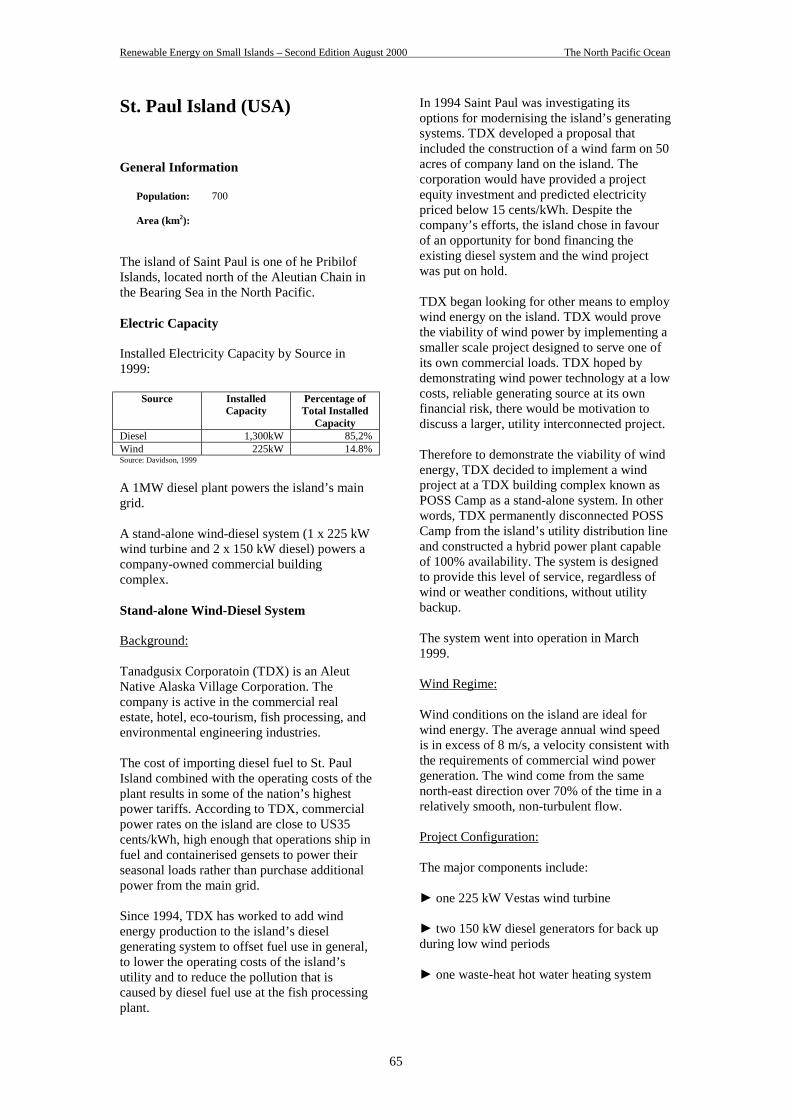
Renewable Energy on Small Islands – Second Edition August 2000 The North Pacific Ocean
65
St. Paul Island (USA)
General Information
Population: 700
Area (km2):
The island of Saint Paul is one of he PribilofIslands, located north of the Aleutian Chain inthe Bearing Sea in the North Pacific.
Electric Capacity
Installed Electricity Capacity by Source in1999:
Source InstalledCapacity
Percentage ofTotal Installed
CapacityDiesel 1,300kW 85,2%Wind 225kW 14.8%Source: Davidson, 1999
A 1MW diesel plant powers the island’s maingrid.
A stand-alone wind-diesel system (1 x 225 kWwind turbine and 2 x 150 kW diesel) powers acompany-owned commercial buildingcomplex.
Stand-alone Wind-Diesel System
Background:
Tanadgusix Corporatoin (TDX) is an AleutNative Alaska Village Corporation. Thecompany is active in the commercial realestate, hotel, eco-tourism, fish processing, andenvironmental engineering industries.
The cost of importing diesel fuel to St. PaulIsland combined with the operating costs of theplant results in some of the nation’s highestpower tariffs. According to TDX, commercialpower rates on the island are close to US35cents/kWh, high enough that operations ship infuel and containerised gensets to power theirseasonal loads rather than purchase additionalpower from the main grid.
Since 1994, TDX has worked to add windenergy production to the island’s dieselgenerating system to offset fuel use in general,to lower the operating costs of the island’sutility and to reduce the pollution that iscaused by diesel fuel use at the fish processingplant.
In 1994 Saint Paul was investigating itsoptions for modernising the island’s generatingsystems. TDX developed a proposal thatincluded the construction of a wind farm on 50acres of company land on the island. Thecorporation would have provided a projectequity investment and predicted electricitypriced below 15 cents/kWh. Despite thecompany’s efforts, the island chose in favourof an opportunity for bond financing theexisting diesel system and the wind projectwas put on hold.
TDX began looking for other means to employwind energy on the island. TDX would provethe viability of wind power by implementing asmaller scale project designed to serve one ofits own commercial loads. TDX hoped bydemonstrating wind power technology at a lowcosts, reliable generating source at its ownfinancial risk, there would be motivation todiscuss a larger, utility interconnected project.
Therefore to demonstrate the viability of windenergy, TDX decided to implement a windproject at a TDX building complex known asPOSS Camp as a stand-alone system. In otherwords, TDX permanently disconnected POSSCamp from the island’s utility distribution lineand constructed a hybrid power plant capableof 100% availability. The system is designedto provide this level of service, regardless ofwind or weather conditions, without utilitybackup.
The system went into operation in March1999.
Wind Regime:
Wind conditions on the island are ideal forwind energy. The average annual wind speedis in excess of 8 m/s, a velocity consistent withthe requirements of commercial wind powergeneration. The wind come from the samenorth-east direction over 70% of the time in arelatively smooth, non-turbulent flow.
Project Configuration:
The major components include:
► one 225 kW Vestas wind turbine
► two 150 kW diesel generators for back upduring low wind periods
► one waste-heat hot water heating system
Renewable Energy on Small Islands – Second Edition August 2000 The North Pacific Ocean
66
The waste heat driven hot water heatingsystem is constantly charged by excess windpower and/or engine heat recovery. By usingthe system’s dump load for hot water-basedspace heat, TDX could significantly reduce itsannual 30,000 gallon, US$50,000 purchase ofdiesel heating fuel.
By dumping the often erratic fluctuations ofthe wind turbine’s power output during highwind periods the system achieves its requiredcontinuos power quality. Application of thesecond diesel engine generator set achieves therequired redundancy and reliability.
Organisation:
The approximately US$ 1 million powerstation was financed 100% by TDX.
TDX Power:
TDX has created a subsidiary, TDX Power.TDX Power’s business plan will be to develop,finance, own & operate wind farm, hybrid andbiomass projects in appropriate Alaskancommunities.
Contact Information
Organisation: TDX Power, Inc.Address: 1500 West 33rd Avenue
AnchorageAlaska 99503USA
Tel.: +1 (907)278-2312Fax: +1 (907)278-2316E-mail: [email protected]:
Organisation: Northern Power SystemsAtt. Leslie Cockburn
Address: One North Wind RoadP.O. Box 999Waitsfield, VT 05673-0999USA
Tel.: +1 802-496-2955Fax: +1 802-496-2953E-mail: [email protected]: Http://www.northernpower.com/
References
Davidson, 1999
The Window, 1999
News from Tanadguix Corporation, 1998
Wind Energy Weekly, 1998
Renewable Energy on Small Islands – Second Edition August 2000 The South Pacific Ocean
67
Fiji
General Information
Population: 823,376 (2000 estimate)
Area (km2): 18,376
Fiji is situated in the southern Pacific Ocean,located approximately 3,100 km north-east ofSydney, Australia, and approximately 5,000km south-west of Honolulu, Hawaii.
Fiji consists of more than 800 islands andislets. About 100 of the islands are inhabited.
The two largest islands, Viti Levu and VanuaLevu, comprise more than 85 percent of thetotal area.
Below are specified population and size for thetwo largest islands:
Island Pollution1 Size (km2)Viti Levu 340,561 10,429Vanua Levu 129,154 5,556
Introduction
Fiji has always relied on imported petroleumproducts for all its transportation needs as wellas for electricity generation and industrial uses.But since 1983, the major island, Viti Levu,has been provided with electricity from ahydropower station.
Energy for domestic cooking and heating hasbeen dominated by biomass, which has alsoprovided energy to the sugar mills in Fijithrough bagass. Biomass also provides energyfor commercial, industrial and agricultural use.
The major energy sources are biomass,hydropower and petroleum products.
Electricity Capacity
Installed Electricity Capacity on Viti LevuIsland by Source in 1999:2
Source InstalledCapacity
Percentage ofInstalledCapacity
Diesel 60 MW 44%Hydro 76 MW 56%Source: Narayan, 1999
1 1986.2 As of August 1999.
Installed Electricity Capacity on Vanua LevuIsland in 1999:3
Source InstalledCapacity
Percentage ofInstalledCapacity
Diesel 1.04 MW 56.5%Hydro 0.8 MW 43.5%Source: Narayan, 1999
The responsibility for electricity generation,transmission and distribution in Fiji is vestedwith the Fiji Electricity Authority (FEA). FEAis a government owned organisation.
Electricity Production
Electricity Production on Fiji by Source in1997:
Source ElectricityProduction
(billion kWh)
Percentage ofTotal
ProductionThermal Plants 0.110 20.4%Hydro 0.430 79.6%Source: http://www.eia.doe.gov/emeu/world/country/cntry_FJ.html
Renewable Energy Development Program
It has always been in the interest of the FijiDepartment of Energy (DOE) to promote theuse of renewable energy resources and exploitthese resources to provide high quality energy.In 1996, the Fiji Government announcedenergy as a priority in its development plans.This not only boosted the role of the DOE butalso enhanced its Renewable EnergyDevelopment Program (REDP).
The primary objective of the REDP is toresearch into the various indigenous renewableenergy resources and assess its technical andeconomical viability for development. This isin the perception of reducing the use ofimported and expensive non-renewable fuels.However, prior to development of anyrenewable resource, DOE considers itimportant to have a collection of the relevantdata for analysis. This allows technical andeconomical assessment to be carried outeffectively.
A significant percentage of Fiji’s ruralpopulation is without electricity and do nothave access to the national electricity grid.This made it necessary for DOE to develop theREDP to research into the viability of therenewable resources for electricity supply.Although there are a wide range of localrenewable resources, those of current concern
3 As of August 1999.
Renewable Energy on Small Islands – Second Edition August 2000 The South Pacific Ocean
68
to DOE include solar, hydro, wind, biomassand geothermal.
The Renewable Energy Development Programhas enabled the DOE to explore and exploit itsindigenous renewable resources. The programhas also enabled the study of the varioustechnologies available in the market andexploring their viability in the environment.The success of some of the pilot projects haslead to incorporating in the renewable energypolicy the resource and technology as anoption for electricity generation. The not sosuccessful pilot projects has prompted DOE tofurther investigate into the technology optionsavailable to utilise the renewable resource inthe most efficient manner.
The DOE intends to continue its REDP withthe intention of offering new sources of energyand technology to the country and furtherreduce the reliance on importing costly non-renewable fuels.
Solar Program
Fiji has considerable sunshine and it can beutilised to generate electricity at low operatingand maintenance costs and beingenvironmentally friendly make it an attractiveoption for electricity supply. As a result thereis an increase in regional research anddemonstration of PV projects and DOE hasplaced PV as a rural electrification option in itsRural Electrification Policy.
The DOE has in the past installed various PVdemonstration and trial projects includingwater pumps, video and television. Thesuccess rate of performance for most of thesesolar applications, in particular the waterpumps, was poor. These systems were poorlymaintained and as a result are not operating.However, the trial projects for the solar videoand TV has proven successful in the ruralareas.
The provision of basic lighting has been themain focus of the solar energy programme.Solar lighting projects consisted of the supplyof 2-11W lights and 1-7W night-light. Thishad proven to be sufficient in the past.However, in 1996 a rural survey was carriedout on a village with an existing solar system,which identified a demand for a bigger systemthat could allow for the use of electricalappliances.
The most recent major PV project has been thePhotovoltaic Electrification of Naroi, which is
a F$ 1 million dollar French governmentfunded project in Fiji's Lau Group of Islands.The village of Naroi on the island of Moala inthe Lau Group is electrified using renewable,non-polluting solar generators. The DOEprovided locally sourced materials, includingtreated wood poles and transport of theequipment to Moala. Approximately 170households have been equipped with highefficiency, solar powered lighting systems andprepayment meters. The solar generators usedfor Naroi have an estimated life span of overtwenty years with battery replacement requiredevery eight to ten years.
Hydro
Fiji Islands group is well endowed with watersystems both large and small scale. Thesewater systems are fed by heavy rainfall, due tothe mountainous topography of Fiji's volcanicislands.
The introduction of the hydro programmefocussed on the following objectives:
► to assess all potential mini/micro, hydrosites throughout Fiji and determine theirfeasibility
► to rank all potential sites within Fiji whichwould facilitate a more detailed examinationand subsequent development.
► to ascertain the viability of the sites thathave been identified above.
► to prepare a pre-feasibility study report foridentified sites, which have undergone thelong-term monitoring programme and hasproved viable in terms of the hydrology of thesite.
From provisional ranking, the long termmonitoring of at least two years is undertakento determine the consistency of the availabledata.
Hydropower has received general recognitionin Fiji and given the importance for ruralelectrification and the availability of potentialhydro sites around the country, hydropower isalso incorporated into the renewable energypolicy (1993) as an electrification option.There are 7 micro hydro projects in operationin Fiji. The size of these projects range from 3kW to 100 kW.
The most recent hydro project is Muana Hydroscheme. This project was funded by the
Renewable Energy on Small Islands – Second Edition August 2000 The South Pacific Ocean
69
Korean Government, through the KoreaInternational Corporation Agency (KOICA),from a grant of $US 200,000 with local costsmet by the Government of Fiji.
The project is for three villages in the NorthernCoast of Vanua Levu. The three villages haveapproximately 136 households with apopulation of approximately 600. The threevillages also host a primary school, a healthcenter, groceries shops, community halls etc.The project design capacity is 30kW.
Biomass
Fiji has considerable biomass resources -forests, coconut husk, bagasse, sawmill waste,rice wastes to name a few, which can be usedas fuel for industrial processing as well as forsteam co-generation plants in rural areas.
Bagasse:
Fiji Sugar Cooperation (FSC) has historicallybeen using bagasse as fuel in the steam co-generation plants in all of their mills atLautoka, Rakiraki, Ba and Labasa. FSCgenerates significant amount of electricity inthese mills for their use and the surplus is soldto FEA.
Bagasse is derived from the processing ofsugar cane and the four FSC sugar mills crushan average of 3.64 million tonnes of caneannually.
Wood:
An Energy survey conducted by DOE revealedthat wood contributed 18% of Fiji's energysupply in the period 1988 - 1992 andapproximately three-quarters of the woodsupply is consumed by the household sectorfor cooking.
Wood supply for household use is largelyinformal. Most rural homes collect their ownwood. In areas deprived of forest and fuelwood supplies, wood is obtained from vendorsand saw millers.
Wood is also used in the industrial sector forraising steam. A pine wood sawmill atLautoka is perhaps the single largest producerand user of waste wood. Production of timberand chips at Drasa from plantation pinesresults in 30,000 tonnes of fuel quality biomasswaste produced annually. The sawmill usesapproximately half of this wood waste forcogenerating electricity (3 MW) and steam.
The remainder of the wood waste isaccumulating adjacent to the factory. Effortsare continuing to find a suitable use for thisenergy resource.
Institutional Wood Stoves:
In the early nineties, the DOE carried out aresearch on smokeless and efficient woodstoves. As a result a more comprehensivedesign on woodstoves is currently being usedin Fiji. The Foundation of the People of theSouth Pacific (FSP), a non-governmentalorganisation is playing the leading role in theconstruction and dissemination of institutionalwood stoves to boarding schools throughoutthe country. However, the DOE has continuedin assisting FSP on the construction of thestoves. Currently, attempts are under way todisseminate the knowledge on institutionalwood stove construction to other Pacific IslandCountries.
Municipal Waste:
Disposal of municipal waste is an increasingproblem for all urban areas. Fiji's major urbanareas produce waste in large quantities andenergy generation from this resource, speciallywaste incineration, is an option DOE see worthevaluating.
To determine the volume of waste entering thedump each day DOE installed a weighbridge atthe Lami dump in 1995. Sufficient data hasbeen collected over a period of two years.In January 1997, to determine the compositionof the waste entering the dump DOE engagedthe services of the University of the SouthPacific Chemistry Department (USPCD). Thisproject included the sampling and seperationof the waste entering the dump and analysingthe samples.
Steam Plants:
In 1987 a steam co-generation plant wasinstalled in Navakawau village in Taveuniwhich provided electricity for householdlighting and heat for copra and kava (yagona)drying. The plant included a combined 10kWelectricity generator and a copra drying plantusing steam generated from biomass.
Currently the steam plant is in urgent need ofoverhaul and repairs. There are also plans torelocate this plant as the current village has notmaintained the steam plant properly andsupply of fuel has been low.
Renewable Energy on Small Islands – Second Edition August 2000 The South Pacific Ocean
70
Another steam cogeneration plant is installedin a private estate in Wainiyaku, Taveuni. Theestate owners privately own the plant.
Biogas Digesters:
In 1996, DOE, in collaboration with Ministryof Agriculture, embarked on a pilot Biogasproject programme in Fiji. So far DOE hassuccessfully installed 15.8m3 biogas digestersat two piggery farms and one diary farm. Thebiogas is used as a fuel for domestic cookingand heating water at the dairy farm.
Wind
In Fiji wind technology has been utilised in avery small scale and until recently, the windsof Fiji have not to-date been the subject of anysystematic assessment for determination oftheir potential to generate electricity.
In 1991 DOE began installing wind monitoringstations in order to determine the wind regimein the country. The collection of data wasnecessary to determine and identify the viablesites for potential installation of wind farms tobe connected to the national grid as asupplementary source of energy.
An important feature of this program has beenthe dissemination of data collected anddiscussions with interested wind farmdevelopers. The dissemination of data has ledto the presentation of proposals byIndependent Power Producers (IPP) towardsthe utilisation of this renewable resource.
A total of five wind monitoring stations existaround Fiji with three located along thesouthern coast of Viti Levu while two havebeen installed in Vanua Levu. Raw hourly datahave recorded wind speeds ranging from lightto strong winds (2 - 15m/s).
Wind and solar radiation data has beencollected for two years at NabouwaluGovernment station till July, 1997. In 1997,DOE in conjunction with Pacific InternationalCenter for High Technology Research(PICHTR) installed a small hybrid powersystem in Nabouwalu Government Station inVanua Levu.
A financial aid of F$ 800,000 was provided bythe Ministry of Foreign Affairs of Japan(MOFA) to PICHTR for the purchase of thehardware and equipment for this project. Thelocal costs totaling approximately F$ 180,000for civil and road works, construction of power
house, purchase of transformers, electricalcables and accessories was met by DOE.
The hybrid system consists of 8 x 6.7kW windturbines, 40 kW solar system and 2 x 100kWstand-by diesel generators. The NabouwaluGovernment Station includes a Governmenthospital, Post Office, Provincial Councilbuilding, Agriculture and FisheriesDepartment, Public Works Department depotand its staff quarters, Police station and its staffquarters and three shops, and otherGovernment Departments, altogether totallingapproximately 100 consumers.
The Nabouwalu Village Hybrid Power Systemhas been optimised to produce 60% of theelectricity from renewable energy resources(wind and solar) and the balance with dieselgenerators.
Geothermal
The DOE is involved in the investigation ofthe extent of Fiji's geothermal resources forfuture energy planning and supply purposes inVanua Levu. The objectives of the geothermalprogramme are to determine:
• whether exploitable geothermal fieldsexist in Savusavu or Labasa,
• the cost of exploiting these fields forelectricity generation/process heat onVanua Levu,
• the comparative cost per mega-watt-hourof geothermal electricity generation withother generating options on Vanua Levuand,
• to promote the development of thegeothermal resource by invitingBOO/BOOT schemes.
Fiji's geothermal resources have the potentialto be developed to supplement Fiji's presentlypredominant Hydro Electric Power (HEP).This could only be made possible once thetechnical and economic viability of geothermalresource is assessed and proven. Geothermal isparticularly important for Vanua Levu wherethe prospects for a significant sized HEPpotential is severely limited.
Surface study results have indicated that theSavusavu prospect, which has reservoirtemperature near 250C, can provide heat toenable the generation of approximately 25MW of electricity. The Labasa prospect'sreservoir temperature is close to 130C and canprovide process heat.
Renewable Energy on Small Islands – Second Edition August 2000 The South Pacific Ocean
71
To date, all geophysical surveys have beencompleted and the next stage will be deepdrilling to verify the theoretical findings andthe subsequent development of the resource.
Wave Energy
The wave power generation data collectionprogramme began in Fiji in 1990. A report onthe data collected was prepared. In 1999, DOEin collaboration with South Pacific AppliedGeoscience Commission (SOPAC) planned tocarry out additional work on ocean and waveenergy in Fiji.
Currently, SOPAC is discussing withNorwegian Agency for InternationalDevelopment (NORAD) the possibilities ofanalysing the cost/benefit of generatingelectricity from sea waves as compared to thetraditional option of generating electricityusing diesel fuel. A detailed project proposalwill then be prepared for submission toNORAD in 1999.
Meanwhile, following DOE submissions for awave energy project, Fiji Mission to the UnitedNations has secured funds for a 5 kW waveproject in Fiji through the Trust Fund on Newand Renewable Sources of Energy of theUnited Nations. DOE is currently liasing withthe consultants (Ocean Power Technologies,USA) for the implementation of this project.
Overview of Renewable Energy Potential
Renewable Energy Resource Potential on Fiji:
Source PotentialSolar Good ResourceWind Good ResourceBiomass Excellent ResourceHydro Excellent ResourceGeothermal Excellent ResourceOTEC Good ResourceWave Good ResourceSource: Ellis & Fifita, 1999
Policy
There is a national renewable energy policyfrom 1993.
The Fiji Government via its Department ofEnergy promotes, through energy policies, theuse of indigenous renewable energy resourcesand the efficient use of energy. Its aim is toreduce the level of dependency of Fiji onimported petroleum products and to reduce thecountry's energy costs.
On the energy demand side, the measuresmainly involve energy management andconservation of energy which consumersthemselves may adopt to improve theefficiency of the energy systems they use.
Contact Information
Organisation: Department of EnergyMinistry of Works and Energy
Address: Private Mail BagSamabulaFiji
Tel.: +679 386677Fax: +679 386301E-mail:Internet:
References
Ellis & Fifita, 1999
Homepage of US Energy InformationAdministration (http://www.eia.doe.gov)
Narayan, 1999
Prasad, 1999

Renewable Energy on Small Islands – Second Edition August 2000 The South Pacific Ocean
72
Renewable Energy on Small Islands – Second Edition August 2000 The South Pacific Ocean
73
Isle of Pines (New Caledonia,France)
General Information
Population: 1,700
Area (km2): 141.4
New Caledonia and its Dependencies - the Isleof Pines, the Loyalty Islands, the ChesterfieldIslands, and the Huon Islands - is a overseasterritory of France, and situated in the south-western Pacific Ocean, east of Australia.
Isle of Pines is located approximately 50 kmSouth East of the capital Nouma on the mainisland of New Caledonia.
Electricity Capacity
Installed Electricity Capacity by Source in2000:
Source InstalledCapacity
Percentage ofTotal Installed
CapacityDiesel 1,500kW 90.4%Wind 160kW 9.6%Source: VERGNET S.A. 2000
Load is from 350 kW average to 500 kW peak.
Wind Farm
A wind farm consisting of 3 x 60kWVERGNET wind turbines was commissionedin September 1999.
VERGNET supplied a turnkey wind farmconnected to the diesel grid with distanceoperating.
The hybrid wind/diesel power system waselaborated to cope with the increasing demandon the island, particular since the opening of aresort.
A computer system monitors the turbines andrelays information to the diesel plant enablingthe power supply to switch automaticallybetween the two separate systems.
The diesel plant, which operates permanently,allows continuos energy supply and maintainstension and frequency.
To start production, the turbine blades need aminimum of 5 m/s wind. The turbines stop if
the wind exceeds 35 m/s. If a cyclone or atropical depression approaches, the turbinescan be pulled down to the ground.
Main issue is that there is no crane on theisland so the VERGNET’s “self-erecting”turbines were utilised.
Wind Speed:
Wind monitoring was made in 1996-97. Thewind speed is 7.5 m/s on the site.
Estimated Production:
The annual wind output is guaranteed byVERGNET for five years at a minimumof 335,000 kWh/year , which is approximately15% of the consumption on the island.
At its maximum output, the power generatedby the turbines is capable of providing morethan 25% of the power requirements for theisland’s 1,700 inhabitants and its hotels.
Organisation:
The ownership is private – Société Neo-Caledonienne d`Energie (ENERCAL) – is theowner.
Operation and maintenance is locally byENERCAL and SOCOMETRA (VERGNET’slocal partner).
Economics:
A period of three to five years has beenestimated before determining the actualeconomic benefits. In the meantimeENERCAL is satisfied with the savings on fueltransportation costs and the turbines’ relativelow maintenance requirements, which aresufficient for the project to go ahead.
Costs:
The total costs of the wind farm wereapproximately US$550,000.
Future Projects in New Caledonia:
In New Caledonia, VERGNET S.A. carries outstudies on two islands regarding possible windgeneration:
► on Lifou Island – part of the Loyalty Islands– for a wind-diesel plant with 900 kW windcapacity
Renewable Energy on Small Islands – Second Edition August 2000 The South Pacific Ocean
74
► on Ouen Island for a autonomous villagewind power system with 30 kW capacity
The two studies are made on behalf ofElectricite et Eau de Caledonie (EEC) – thesecond electricity utility on New Caledonia.
Contact Information
Organisation: VERGNET S.A.Address: 6, rue Henri Dunant
45140 IngréFrance
Tel.: +33 2 38 22 75 00Fax: +33 2 38 22 75 22E-mail: [email protected]: www.vergnet.fr
References
Information provided by VERGNET S.A.
Pacific Power, 1999
Renewable Energy on Small Islands – Second Edition August 2000 The South Pacific Ocean
75
King Island (Australia)
General Information
Population: 1,800
Area (km2): 1,250
King Island is located 85 km off the north-westtip of the Tasmanian mainland.
Electricity Capacity
Installed Electricity Capacity by Source in1997:
Source InstalledCapacity
Percentage ofInstalledCapacity
Diesel 4,800kW 86.5%Wind 750kW 13.5%Source: Hydro-Electric Corporation, 1997
Varying demands result in operating loadsranging from night-time minimum of 850 kWto a daytime maximum of 2,700 kW.
The island is not connected to other electricitygrids.
Electricity Production
Electricity Production by Source in 1999:
Source Percentage of TotalProduction
Diesel 80%Wind 20%Source: http://www.hydro.com.au/windpower/index.htm
Huxley Hill Wind Farm
A 750 kW grid connected wind farm,consisting of 3 x 250 kW Nordex Balke-Dürwind turbines, was commissioned in February1998.
Background:
The Hydro-Electric Corporation (HEC) studiedwave, wind, hydro and pumped storage optionsfor supplementing the existing dieselgenerators. Wind power was found to beclearly the most favourable option.
The project will give HEC an opportunity toreview wind technology and its application inremote island-diesel power systems andpossible future large mainland Tasmania windfarms.
The wind farm take advantage of the RoaringForties, the prevailing westerly wind that circlethe earth’s high southern latitudes.
Site:
Several different locations were studied onKing Island, but the best site was determinedto be the crest of Huxley Hill. There, the axlesof the turbine blades, sitting on top of their 30metre tall towers, are about 130 metres abovesea level where the average annual wind speedis measured at 9.2 m/s.
Technology:
The three wind turbines demonstrate how windand thermal generation technology can be usedtogether efficiently.
Advance control systems manage both thewind farm and the diesel-powered thermalstation to ensure the assets are used tomaximise the benefits to the environment andminimise the use of diesel while providingreliable, high quality electricity. HEC ismonitoring the control systems to see whetheror not performance can be improved further.
Dump Load:
A dump load is connected to the low voltagepart of the wind farm feeder. The dump loadconsist of four heating elements (35 kW, 70kW, 140 kW and 280 kW) mounted in acabinet, cooled by fans. The dump load can becontrolled in steps of 35 kW from 0 to 525kW.
Environmental Benefits:
Emission of carbon dioxide has been reducedby up to 2,000 tons a year on the pre-1998figures.
The HEC saves hundreds of thousands AU$each year in diesel costs for the island’sthermal power station.
Organisation:
The turbines is funded by the Hydro-ElectricCorporation out of the organisation’s electrictariff income.
Hydro-Electric Corporation owns the turbines– ownership is thereby public since Hydro-Electric is owned by State Government.
Renewable Energy on Small Islands – Second Edition August 2000 The South Pacific Ocean
76
Regarding operation and maintenance acontract is made with a private firm for thefirst three years of operation.
Policy
There is not an overall strategy for renewableenergy development on King Island, but HEChas a renewable electricity and electricityefficiency strategy.
Contact Information
Organisation: Hydro-Electric CorporationAtt. Rob Stewart
Address: GPO Box 355DHobartTasmania, 7001Australia
Tel.: +61 3 6230 5272Fax: +61 3 6230 5266E-mail: [email protected]: http://www.hydro.com.au/windpower
/index.htm
Organisation: Sterling WindAddress: 385 Bay Street
Port MelbourneVictoriaAustralia 3207
Tel.: +61 3 9646 5955Fax: +61 3 9646 5360E-mail: [email protected]: http://www.wind.com.au/
References
Homepage of Hydro-Electric Corporation(www.hydro.com.au)
Homepage of Sterling Wind(www.wind.com.au)
Information provided by Hydro-ElectricCorporation
Renewable Energy on Small Islands – Second Edition August 2000 The South Pacific Ocean
77
Kiribati
General Information
Population: 75,000
Area (km2): 746
Kiribati is situated in the central Pacific Ocean,about 4,000 km south-west of Hawaii. Theislands extend about 3,900 km from east towest and from north to south they extend about2,100 km (straddling the equator).
The country consists of 33 islands of which 17are inhabited. Kiritimati (also called ChristmasIsland), one of the Line Islands, occupies 609km2 and it thus accounts for the majority of thecountry's land area.
Kiribati is sub-divided into three main groups:
1) the Gilbert group: a chain of 17 atollsspread over 680 kilometres in the westwhich includes Tarawa, the seat ofGovernment
2) the Phoenix group: a cluster of 8 atollslying about halfway between the Gilbertand Line groups
3) the Line group: a chain of 8 atolls spreadover 2,000 kilometres, located some 3,000kilometres east of the Gilbert group. Itincludes Kiritimati Island
Introduction – Largest PV Program in thePacific Islands Region
In end of 1999 the European Union (EU)approved a US$ 3.57 million aid package tofund the installation of photovoltaic (PV)throughout the Gilbert Islands group. Theproject will be the largest PV program in thePacific Islands Region.
The project will start in 2000 and end in 2005.
Background:
The background for this decision is anevaluation of 250 PV systems for ruralhouseholds in the outer islands installed andmaintained by a solar utility. These PVsystems were funded by the EU Lomé PVFollow-up Programme in 1995.
The evaluation found that after 4½ years 95%of the installations was still functioning.
Objectives of the Project:
The overall objectives of the project is to:
improve living standards on outer islands andreduce migration to the main island
The project purpose is to:
provide a sustainable source of electricity forrural households and community centres
Breakdown of Type of Activity:
Activity Percentage of TotalProject Costs
Construction/Infrastructure 3%Supplies ofequipment/Inputs
64%
Technical assistance, incl.studies
21%
Training 6%Other 6%Source: DG Development, 1999
Why Solar Energy for RuralElectrification?
Alternatives Sources of Energy for the RuralAreas:
Kiribati had been relying heavily on importedenergy and will continue to do so in the yearsahead. At this time the choices for powergeneration is limited to two sources: solar andfossil fuel powered generator.
In spite of the abundance of solar energy inKiribati, its use on the present state ofdevelopment is limited to certain areas. Fossilfuel generation will continue to be the mainbase of power generation for Kiribatiespecially to support energy demand of SouthTarawa where the average peak demand is at1,998 kilowatts. To use solar energy in itspresent development state as substitute to meetthe energy demand on South Tarawa will notbe a practical option. However, there ispotential for the use of the solar PV system inthe rural areas where the average demand ofhousehold is less than 1 kilowatt.
The application of PV solar system in Kiribatiis mainly concentrated on social activitiesrather than in support of direct commercialeconomic developments. The initial area ofconcentration of the PV Solar system has beenfor the provision of efficient electric lightingservices in the rural areas of Kiribati. Recently
Renewable Energy on Small Islands – Second Edition August 2000 The South Pacific Ocean
78
the need has expanded to the connection ofradios, cassette players etc. The changes areunderstandable given that Kiribati can notdistance or shield it self from developmentsgoing on around it. Energy demand willincrease as the people are exposed to theseinfluences.
Environmental Issues:
With the fragile land and the enclosed reef,there is concern that energy production willhave negative effects on the environment. Thepossibility of fuel and lubricating oil spillscontaminating both the ground water and thereef is a concern together with the noise andthe green house gases emitted from the dieselengines. The disposal and recycling of used oiland lead from batteries are majorenvironmental concerns in Kiribati. At thistime, the used oil returned to the Kiribati OilCompany from the public utility company(PUB) and other major users are send back toMobil in Fiji for recycling.
In the case of solar PV system, the onlyenvironmental concern is the disposal andrecycling of used batteries. However, GNB abattery manufacturer in New Zealand hasindicated its willingness to recycle usedbatteries. Therefore, from an environmentalpoint of view, solar energy for electricityproduction for rural household electricityneeds has many advantages over otheralternative sources of energy.
Cost Issues of Solar PV System:
Looking at the current electricity demand ofthe rural Kiribati citizens, the solar PV systemat present offers the most economical systemto provide the level of power desired.The cost advantages of using the solar PVsystem is that:
(a) it does not require construction of aninterconnecting grid;
(b) having little potential for environmentaldamage (provided a means for recyclingfailed batteries is included);
(c) requiring a predictable one-time capitalinvestment with low operating andmaintenance costs;
(d) finally being modular the systems can bespecifically sized to fit the needs ofindividual households.
Although not directly related to costs, otheradvantages of PV over diesel for rural Kiribatiinclude the continuous availability of powerrather than a few hours per day which is allthat can be afforded with a diesel system toreduce its high operational cost. The fact thateach solar PV system is independent meansthat the failure of one system has no effect onany other while the failure of a component in adiesel system often leads to a loss of power tomany if not all customers.
PV Electrification of Rural Areas
The Solar Energy Company:
The Solar Energy Company (SEC) wasestablished in 1984 by the Foundation for thePeoples of the South Pacific (FSP), an U.S.based NGO, using USAID funding. It wasorganised as a private, limited corporation witha responsibility of selling out solar products toprivate individuals as well as Government andnon-government organisations. Its originalcharter was to act as a retail outlet for solarproducts and to provide technical assistance, ifneeded, for the installation and maintenance ofsolar systems. The company’s main incomecomes from the sales of solar products toprivate individuals as well as Government andnon-government organisations. The sale ofsolar products was not promising to thecompany and therefore it became necessary toexpand the Solar Energy Company activity toinclude the electrification of the outer islands.
Past Experiences:
Solar and diesel/benzene powered generatorswere the only sources of power commonlyused in Kiribati. In the early 1970s dieselgenerators were very popular in the rural areaof Kiribati. Its use was mainly for lighting andbecause of this the generators were only runfor a couple of hours every night. The use ofsolar PV systems started between the 1970sand 1980s and used mainly for cassette player,FM/AM and CB radios and lighting.
Solar PV system was new at that time and itsuse was not widely known. In this connectionthe Energy Planning Unit (EPU) of theMinistry of Works & Energy was assignedwith the responsibility of providing technicalassistance to the company and the promotionof the use of solar PV systems through aidfunded projects. Within this understanding theSEC confined its activity to the sales of solarproducts while the EPU, acting as the co-ordinator of energy activities in Kiribati,
Renewable Energy on Small Islands – Second Edition August 2000 The South Pacific Ocean
79
promote the use of solar PV system in thecountry by identifying projects that utilisedsolar energy and let the SEC implement them.Consequently, the EPU considered it mostappropriate to improve the technical capabilityof the SEC together with island counciltechnicians/mechanics.
In an effort to improve the SEC technicalcapabilities in maintaining and installing solarPV systems, the company was invited to takepart in training courses conducted by SouthPacific Institute for Renewable Energy(SPIRE) in Tahiti. To further improvereliability and to increase people’s awarenesson the rural areas on the use of solar PVsystems, training courses were held on Tarawain 1986 and 1988 for the rural area population.The objective of the course was to train peoplein the rural area on maintaining and installingsolar PV systems, together with SECtechnicians. In doing this, two participantsfrom each of the island in the Gilbert groupwere invited to attend the courses. Therequirement for the participants were that oneof them should be a mechanic or technicianemployed by the island council and the otherfrom the private sector. The rationale beingthat the island council worker will beresponsible for maintaining government solarpowered projects while the other participantattend to requests from private users of solarPV systems. With this in place, it was hopedthat the reliability and acceptance of solar PVsystems in the rural areas would improve.Despite these attempts the popularity of solarsystem declined as many people considered itunreliable and did not last long.
In an attempt to determine the reasons for thedeclining in sales and to provide data on howto proceed with further PV implementation, theSEC through the EPU requested the ForumSecretariat Energy Division (FSED) in 1990 tofund a country wide survey of rural PV systemusers. The purpose of this survey was todetermine the cause of failure and non-acceptance of the Solar PV Systems. Theemphasis on the survey was put on systemssold by the SEC to private individuals. Thesurvey was carried out in all villages of therural areas of the Gilbert Group, where the PVusers could be found.
From the survey, it was found that 270 solarsystems have been installed in the rural area.Of the 270 PV systems, about 90% were onlymarginally operational or not in use at all. Itwas also found that the main problems were:
► About 100% of the systems wereundersized and had not been properlymaintained apart from the replacement ofdefective components. Battery life was shorterthan anticipated. Most components were nevercleaned and had been damaged by insects andrust.
► 50% of the systems had been installedwithout a controller thus shortening batterylife. The controller in a small system is arequired to prevent overuse of the battery.
► 48% of the installations had serious wiringdeficiencies, usually in the form of twistedconnections or wires that were too long fortheir size thus resulting in high voltage drop.
► 43% of the systems had replaced theoriginal deep discharge batteries withautomobile batteries having inadequatecapacity and a short life expectancy.
► 16% of the systems received minimumcharging because of poor orientation of panels.
► 13% of the systems were placed in locationswhere panels were shaded most of the time.
► Many users had replaced the original highefficiency fluorescent lights with automobileheadlights or taillights when the fluorescenttube failed, making the system consume morepower than originally designed to. Othersadded CB radios and other appliances as wellas using the systems for longer hours makingthe system under sized.
In the light of the above people werediscouraged to purchase a solar PV systems, asthey had known it to be unreliable andexpensive. It was concluded that the concept ofselling out solar PV system without anytechnical back up service was not a practicalapproach. Not only that but it was also foundthat the majority of the people using solar cannot afford to purchase the right parts andtherefore they tend to use parts they can get ateither minimum cost or at no cost at all.
The New Challenges to the RuralElectrification Concepts
The Utility Concepts
Following the survey it was clear that thepresent approach was not a success in theelectrification of the rural areas and as such analternative means needed to be identified tofurther improve the solar-based rural
Renewable Energy on Small Islands – Second Edition August 2000 The South Pacific Ocean
80
electrification in Kiribati. In this regard,assistance was sought from SPIRE to advicethe Kiribati Government on ways of rectifyingthe situation. SPIRE was requested herebecause it has successfully electrified someislands of French Polynesia using solar PVsystems. The result of the study was arecommendation to promote a service-orientedapproach based on a utility concept. Thisrequires a back up service and users charged afee for the use of the system with the systemowned by the company looking after the ruralelectrification program. The SEC was therebyselected to shoulder this responsibility since itwas the only Government owned companydealing with solar.
To introduce the utility concept, it wasrecommended that:
► The system should be owned andmaintained by the SEC. Appliances and housewiring after the battery are owned andmaintained by the user.
► To set up rural electrification district withnot less than fifty households. The districtshould be of a sufficient size to allow properservicing of the systems by a single SECemployee who would be designated as a fieldtechnician. It was considered that a single fieldtechnician could properly maintain up to 125systems where this was based as the maximumsize of a district. If more than 125 systemscould be installed in a village, it would be splitinto two districts provided the household in thesecond district is not less than 50.
► Users to sign a contract in which theyshould agree to pay an installation fee of $50.The user further agree not to tamper with anyof the utility owned equipment, to maintain thepanel area free of shade, to pay the monthlyfee and to use the system in accordance withpublished guidelines. This includes therequirement for the user not to attach anyappliances to the system without priorapproval of the utility. In return, the utilitywould keep the electricity supply insatisfactory conditions, replacing all failedparts, with the exception of the lights, at noadded cost to the user.
► To establish a monthly fee based on the costof operation and maintenance. This iscalculated as the sum of the costs of batteryreplacement after an estimated life span of 4-5years (according to the type of battery and itsservice requirements), the cost of replacing thecontroller at the end of its useful life and the
utility operating cost. The monthly fee rangefrom US$ 7 for basic lighting to over US$ 40per month for a full system with capacity tooperate a refrigerator and video as well aslights.
► The field technician who lives in or near thedistrict to visit each installation once a monthand at any other time as and when required tocheck the equipment and to collect the monthlyfee.
► A Senior Technician from headquarters inTarawa office to visit each district twice a yearand audit the field technician's performance.Additionally, a senior technician would beavailable on call to assist field technicians introubleshooting and repairs, which are beyondthe level of the field technician's capability.
► To establish a user's committee within eachdistrict consisting of five to seven members.The committee would be the bridge betweenthe utility and the users related to complaintsand requests from users to the utilitymanagement, and to communicate utilitymatters to the users. The committee would alsoarbitrate in the case of proposed disconnectionon the failure of the user within the district topay the monthly fee.
The recommendations were accepted and SECagreed that future solar lighting projects wereto be designed and implemented according tothe recommendations.
The Pilot Project Funded by Government ofJapan:
In 1988 JICA committed itself to fund theelectrification of the island council station onNonouti using solar PV systems. JICA waslooking at a centralised solar PV system toimplement on this island. After two to threeyears the project was finally approved with thesite changed from Nonouti to North Tarawa.The delay in approving the project providedthe time to study the existing system toinfluence the change on the design of theproject from a centralised system to a stand-alone system using the utility concept.
The project involves the provision of 55 solarsystems for homes and 1 for the maneaba(community hall). North Tarawa was chosen asthe site of the project because of its closeproximity to South Tarawa where SECheadquarters and EPU are located making themonitoring easier to carry out. The project wascompleted in 1992 and monitored directly by
Renewable Energy on Small Islands – Second Edition August 2000 The South Pacific Ocean
81
JICA for one year. The results were veryfavourable since surveys showed that themajority of the customers were satisfied withthe systems. The collection of the monthly feeswas prompt and the maintenance work wascarried out on time and also as and whenrequired. At the end of the project period in1994, both JICA and the EPU reported that thesolar utility concept was working well and thatthe concept was ready for larger scaleimplementation.
Expansion of the Program Funded by theEuropean Union:
With the success of the JICA ruralelectrification project using the utility concept,the Government of Kiribati approved theexpansion of the program to remaining islandsin the Gilbert group using the European Union(EU) funding assistance under Lome II PVFollow Up program. The EU funded projectinvolved the provision of 250 solar homesystems. In distributing the 250 systems, 100units were added to the JICA project on NorthTarawa, in an attempt to fill at least part of theadded demand generated by the JICA project.The remaining 150 systems were equallydivided between Marakei, in the northernGilbert group, and Nonouti in the southernGilbert group.
The EU systems were installed in 1994 andfollow up inspections by the EU were made in1995. The follow-up inspections concurredwith the results of the JICA project in that:
(a) installations were all functioning well;
(b) customer satisfaction was high; and
(c) technical maintenance was being properlycarried out.
Rural Solar Electrification Impacts on theRural People
It is now more than five years after thecommissioning of the projects funded by JICAand the EU and the systems are still working.Of the 55 systems installed by JICA in 1992,only 5 batteries have failed. In the case of theEU project installed in 1994, only one batteryhad been replaced. Light bulbs and lightfixtures were the main items, which havefailed, but the necessary spare parts are kept instock to provide instant replacement whenneeded. These items have to be ordered fromabroad. The controllers were manufacturedlocally by the SEC using the design developed
by S.P.I.R.E. since it has proven to be reliable.The success of JICA and EU projects havechanged the public perception towards PVsystems and this was proved by the sales ofsolar products to private individuals whichhave increased since then.
As a result of the project, the rural populationhas come to realise the conveniences and thebenefits they can get from using a solar PVsystem at an affordable price. According to asurvey which was carried out a few years ago,it was the women who benefited a lot from thisprogram as they can now do extra works in thenight such as weaving, sewing, familygathering and even the cooking at night. Inaddition school children can do their studyand/or homework at night and much more. Inthe past the women had to make sure theyfinished their work before dark and unfinishedhousework was left to the next day, but nowthey can leave certain tasks to be done at night.Guttering of fish is no longer a problem for ahousewife at night when the husband comesback from fishing in the evening. The sociallife has also been improved as the light hasenabled church groups and private individualsto get together for meetings and other socialgatherings at night. In the past it was verydifficult to convene a meeting at night-timebecause of lighting problem but with solarlights in place, this is no longer a problem.
Witnessing the benefits the existing users areenjoying from having the PV solar lightsystem, those who do not have the system haveindicated their willingness to join the program.Islands not yet covered in the program haveaired their need for a PV solar lighting system.
Apart from the support to social activities invillages, the PV system are not cost effectiveto address the energy demand of economicactivities that are adaptable to the villages tosupport the island's economy. In mosteconomic activities currently undertaken in therural area such as the Fish Ice Plants to supportlocal fishermen to market their catch, andSmall Scale Cottage Industries like the SoapFactory, fossil fuel generators are more costeffective than solar in its present designcapability.
Support to the Rural ElectrificationProgram
In spite of the high demand of the solar-basedsystem from the rural area, the program hasbeen unable to provide more systems from thefees collected. This is due to the fact that the
Renewable Energy on Small Islands – Second Edition August 2000 The South Pacific Ocean
82
revenue obtained from the existing systems isonly sufficient to cover the operational andreplacement costs. For the SEC to self financethis expansion, it will need to raise its monthlyfee. Any inclination to raise the monthly feewould be financially expensive to the ruralhousehold. SEC to self-finance the expansionof the solar PV systems on the rural areas willbe at a snail pace. Given the limited financialoptions to support further expansions to therural area the Government supports the SECexpansion activity through souring externaldonors to fund further expansion of theexisting system at a larger scale.
In 1999 the Government, as the onlyshareholder of the company, approved thechange in the company's name to RuralElectrification Utility Company. This is toreflect the company's objective of electrifyingthe rural area using not only solar energy butother sources of energy as well which areproven to be cost effective. In this connection,the company prior to electrifying the rural areawill need to identify the most cost-effectivetechnology to implement.
The Lessons Learnt
From what Kiribati has learned through theimplementation of the solar PV powered ruralelectrification project, the following factorsneed to be considered in order for the utilityconcept to be successful:
a) The number of households must becarefully determined such that viability ofthe project is maintained. In the Kiribaticase, the number of system should not beless than 50.
b) A back up service should be provided sothat the systems are properly maintained.Therefore a site technician should berecruited to reduce the cost of maintainingthe systems. In the Kiribati case, a singlefield technician could properly maintainup to 125 systems.
c) The level of income of the households inthe targeted area must be determined toensure that they can afford the fee to beimposed. In the Kiribati case, a fee of $15a month is affordable by the majority ofpopulation in the rural area.
d) The connection of additional applianceslike refrigerators and video set, apart fromlights and radios, must be carefully
evaluated such that the resultant fee is stillaffordable by the user.
e) The minimum number of systems that willallow the maintenance and operation ofthe program to go ahead without anyfinancial difficulty must be targeted withina short period of time. The preferredtiming will be prior to the replacement ofmajor components such as a battery. InKiribati case, at least 1000 systems aretargeted as this is the number that willallow SEC to maintain the systemswithout financial support fromGovernment.
f) As with any other project, the capability ofthe staff who is to maintain the system isvery important and therefore training isthe most important element. In Kiribaticase, site technicians have been trainedfrom time to time. In 1999 the training oftechnicians was carried out on Abemama,one of the outer island, where theyinstalled a lighting system for the maneaba(community halls) in all villages on thisisland.
Conclusion & Recommendations
From the electrification programs which havebeen carried out by the Solar EnergyCompany, it can be concluded that to electrifythe rural area of Kiribati, where incomegenerating activities are limited and energydemand is low the PV solar system using theutility concept is the best approach. A monthlyfee of $15, is at this time, affordable for themajority of the rural population. However,only those who can afford a fee of more than$15 a month must be allowed the connectionof additional appliances. To address the energydemand of higher economic activities in therural area the PV system in its present designstage from Kiribati experience is not costeffective and alternative source is required topromote the activity.
In addition the PV solar system program willcontinue to rely on external funding assistancefor its expansion until at least 1500 systemshave been installed. The purchasing ofadditional appliances to be connected must bethe responsibility of the user, however, it isimportant that additional appliances are limitedto a level that will yield a fee of not more thanthe level affordable by the user, in the ruralarea.
Renewable Energy on Small Islands – Second Edition August 2000 The South Pacific Ocean
83
The sustainability approach to ruralelectrification through solar energy based onthe utility concept to address social andminimal economic activities could prove apositive model for other countries and withminor modifications to fit local conditions andculture for the system to work.
Overview of Renewable Energy Potential onKiribati
Renewable Energy Resource Potential onKiribati:
Source PotentialSolar Excellent resourceWind Unlikely to be an
exploitable resourceBiomass Some resourceHydro NoneGeothermal NoneOTEC Good resourceWave Definite potential but
extent unknownSource: Ellis & Fifita, 1999
Kiribati has no river, so hydropower system atany scale is not possible. Wind energy in theGilbert group is not practical due to low andnon-persistent wind speed; however, there is apossibility that Kiritimati may have a windpotential. In this connection, a windmonitoring system to determine the viability ofwind speed on the island will be installed.Wave, tidal and ocean thermal energyconversions are other sources but at this pointin time, the technologies are not yetcommercially used. Biomass in the form ofcoconut residues and hardwood has beenconsidered potential energy sources for therural area in terms of cooking only. However,biomass use for power generation is notencouraging as the supply is insufficient andits environmental effect would be disastrous tothe islands. Solar energy is an abundant sourceof energy readily available in Kiribati.
Contact Information
Organisation: Rural Electrification UtilityCompany(former Solar Energy CompanyLimited)
Address: P.O. BOX 493BetioTarawaKiribati
Tel.: +686 26058Fax: +686 26210E-mail: [email protected]:
Organisation: Ministry of Works and EnergyAddress: P.O. Box 498
BetioTarawaKiribati
Tel.: +686 24192Fax: +686 26172E-mail: works&[email protected]:
References
DG Development, 1999
Ellis & Fifita, 1999
Gillett & Wilkins, 1999
Ngalu, 1999
Pacific Islands Report, 1999

Renewable Energy on Small Islands – Second Edition August 2000 The South Pacific Ocean
84
Renewable Energy on Small Islands – Second Edition August 2000 The South Pacific Ocean
85
Thursday Island (Australia)
General Information
Population: 4,000
Area (km2): 4
Thursday Island is located in the Torres Strait,which separates the most north-eastern point ofAustralia, Cape York Peninsula, from PapuaNew Guinea.
Electricity Capacity
Installed Electricity Capacity by Source in1997:
Source InstalledCapacity
Percentage ofTotal Installed
CapacityDiesel 6,400kW 93.4%Wind 450kW 6.6%Source: www.fnqeb.com.au/environment/renewables/ti_project.html 1
In 1999 the Thursday Island system’smaximum and minimum demands were3.3MW and 1.3MW. These demands haveincreased from the time of construction of thewind turbines in 1997 when a maximumdemand of 2.6MW and a minimum demand of1MW were being experienced.
Electricity Production
Electricity Production by Source from 1997-1999:2
Source Percentage of TotalProduction
Diesel 92%Wind 8%Source: Morrow, 1999
Cost of Electricity
The diesel generators at Thursday currentlyconsume over 5 million litres of dieselannually. This equates to around AU$3.5million with diesel around 70 cents/litredelivered to the site. The costs of electricityproduction at Thursday Island is approximately30c/kWh with fuel representing approximately75% of this cost.
1 This homepage is not operational anymore – please visit www.ergon.com.auinstead2 From August 1997 to June 1999
Thursday Island Wind Project
A 2 x 225 kW wind farm in association withthe diesel generating plant was commissionedin August 1997.
The wind generators were established with theaim of reducing the use of diesel fuel andcutting back the emission of greenhouse gases.
Wind Regime:
From the wind data measured on Far NorthQueensland Electricity Corporation’s(FNQEB)3 ridge from 1989 to 1995, the annualaverage wind speed on Thursday Island, at30m above ground, is around 7.5 m/s.
There is definite “windy season” betweenApril and October when the Trade Winds blowfrom mainly SSE direction. Average monthlywind speeds during these months range from6.8 to 10.6 m/s. Maximum wind gusts of 16.8m/s were measured during these months.
During the summer months, winds are muchlower and blow from all directions between Eand WNW. Average wind speeds fromNovember though March are from 2 to 5 m/s.maximum wind gusts of 16 m/s have also beenmeasured during this period.
Environment Impact Assessment:
An Environmental Impact Assessment (EIA)was carried out, reporting on the impact of thewind turbines on the local flora and fauna,archaeological artefacts and the islandcommunity. The results of these studies wereused to scope the project. Avian issues werehighlighted including flight paths of migratorybirds and a resident barking owl. These wereconsidered in the positioning of the turbines.
Main Barriers for the Project:
The main obstacle for the wind project wascommunity acceptance. Noise and aestheticsdominated issues raised during the publicconsulting state of the project.
Technology:
The wind turbine generators are Vestas V29-225kW machines connected to the powerstation bus via a dedicated feeder.
3 Now ERGON Energy
Renewable Energy on Small Islands – Second Edition August 2000 The South Pacific Ocean
86
The turbine blades are made of fibreglassreinforced polyester, and are fixed on tubularsteel towers at a height of 30 metres. Theblades have a rotor diameter of 29 metres, androtate up to 40.5 rpm maximum. The turbinesstart up in wind of 3.5 m/s and cut out at windspeeds of 25 m/s. Optimum performance isachieved with wind speeds of 14 m/s.
The turbines are positioned on Milman Hill,roughly one kilometre from the power station.Wind generation is at 690V, which is thenstepped up to the grid voltage at 6.6kV througha padmount transformer on the site. Theturbines operate in parallel with the existinggenerating plant with the station automatics setso that all wind energy is used.
Vestas’ Graphic Control System (VGCS) isused to control the turbines and interface themto the power station automatics. This systemhas the ability to limit the level of wind energypenetration into the system, if required, byvarying the turbine blade pitch. This minimisesor eliminates undesirable impacts offluctuating wind energy on electricity supplyand the other generating plant. The“conventional” rule of thumb suggests that themaximum penetration into island systemswithout energy storage should be 30%.Experiences in other places suggest that thisfigure can safely be higher in some systems.
Organisation:
The AU$2.5 million project was financed byFNQEB, which is a State Government ownedcorporation.
The turbines are owned by FNQEB.
FNQEB local staff operates and maintains thewind turbines.
Production:
During the first 12 months of operation, thewind generators produced over 1.68GWh ofenergy. This compares favourably to the1.44GWh predicted at the time of constructionand is principally due to the better thanexpected wind resources for this period.Having experienced a 15.5% energy growthrate on Thursday Island for the same 12months, this energy production equates to only9.2% of the island’s energy needs; less than the10% predicted. The capacity factor at the endof the first 12 months was 42.5%. Savings indiesel fuel have been calculated at over428,000 litres (or around AU$300,000) – this
equates a reduction of almost 1,200 tonnes inCO2 emissions. Availability of the two turbinesover the first year of operation averaged 99.3%During 22 months of operation, production hastotalled 2.82GWh. Energy growth on theisland has been equivalent to an annualincrease of 14.2%. Wind energy has accountedfor 8% of total production to June 1999 and thetotal diesel savings are calculated of 688,000litres.
Maintenance Issues:
A number of maintenance issues have beenexperienced during the first year of operation:
► continuous outages in April 1998 caused byhigh gear temperatures on one of the turbineswere remedied with a change in thetemperature parameter settings
► small rust spots have been identified mainlyon the south-east side of the tower. The rustspots are being analysed to determine the fulleffect on the life of the tower. The atmosphereon Thursday Island is highly corrosive withsalt and sand laden winds in addition to highhumidity
Lessons Learned:
► timely public information is essential toobtain and keep support of residents
► micro-siting should be a process separate tothe installation contract being completedbefore the contract specification is completed
► medium to large scale wind penetration isfinancially viable where diesel generating costsare high
Future Plans:
Thursday Island has FNQEB’s (now ERGONEnergy) prime focus for alternative sources ofenergy. The island’s limited geographical areahas a large impact on the viability of manyrenewable energy sources. More wind ispossible with maybe two more land sitesbefore looking to offshore applications. Oceancurrents in the area have been studied and ifany development in this area becomecommercially available, this is also a viableoption.
Renewable Energy on Small Islands – Second Edition August 2000 The South Pacific Ocean
87
Contact Information
Organisation: ERGON EnergyAtt. Fiona Morrow
Address: 109 Lake StreetCairns Qld 4870Australia
Tel.: +61 7 4050 2873Fax: +61 7 4050 2702E-mail: [email protected]: http://www.ergon.com.au/
References
Far North Queensland Electricity Corporation(FNQEB) old homepage (www.fnqeb.com.au)
Information provided by Far North QueenslandElectricity Corporation (FNQEB)
Morrow, 1999

Renewable Energy on Small Islands – Second Edition August 2000 The South Pacific Ocean
88
Renewable Energy on Small Islands – Second Edition August 2000 The South Pacific Ocean
89
Rarutu Island (FrenchPolynesia, France)
General Information
Population: 2,000
Area (km2): 24.3
Rurutu Island is located approximately 572 kmsouth of the main island of Tahiti, FrenchPolynesia. French Polynesia is an overseasterritory of France and located in the SouthPacific Ocean, about 3,000 km south of Hawaiiand halfway between New Zealand to the westand South America to the east.
Electricity Capacity
Installed Electricity Capacity by Source in1999:
Source InstalledCapacity
Percentage ofTotal Installed
CapacityDiesel 1,000kW 92.6%Wind 80kW 7.4%Source: VERGNET S.A, 2000
Load from 250 kW average to 400 kW peak.
Wind Farm
A wind farm of 2 x 40 kW wind turbines wascommissioned in September 1999.
Studies started in 1995 (WASP) and windmonitoring in 1996-97 – average wind speed is7.5 m/s on the site.
VERGNET supplied a turnkey wind farmconnected on the diesel grid with distanceoperating - the site is approximately 4 km fromthe diesel plant.
Main issue is that there is no crane on theisland so the VERGNET’s “self-erecting”turbines were utilised.
Production:
The annual wind output is guaranteed byVERGNET for five years at a minimum of220,000 kWh/year, which are approximately20% of the consumption.
Organisation:
The ownership is private - Electricite de Tahiti
The operation and maintenance is locally byElectra. Electra is owned by Electricite deTahiti.
Future Wind Projects in French Polynesia:
Studies have been carried out by VERGNET toinstall a 3 x 60 kW wind farm for the sameoperator in Tubuai Island approximately 180km from Rurutu Island.
Contact Information
Organisation: VERGNET S.A.Address: 6, rue Henri Dunant
45140 IngréFrance
Tel.: +33 2 38 22 75 00Fax: +33 2 38 22 75 22E-mail: [email protected]: www.vergnet.fr
References
Information provided by VERGNET S.A.

Renewable Energy on Small Islands – Second Edition August 2000 The South Pacific Ocean
90
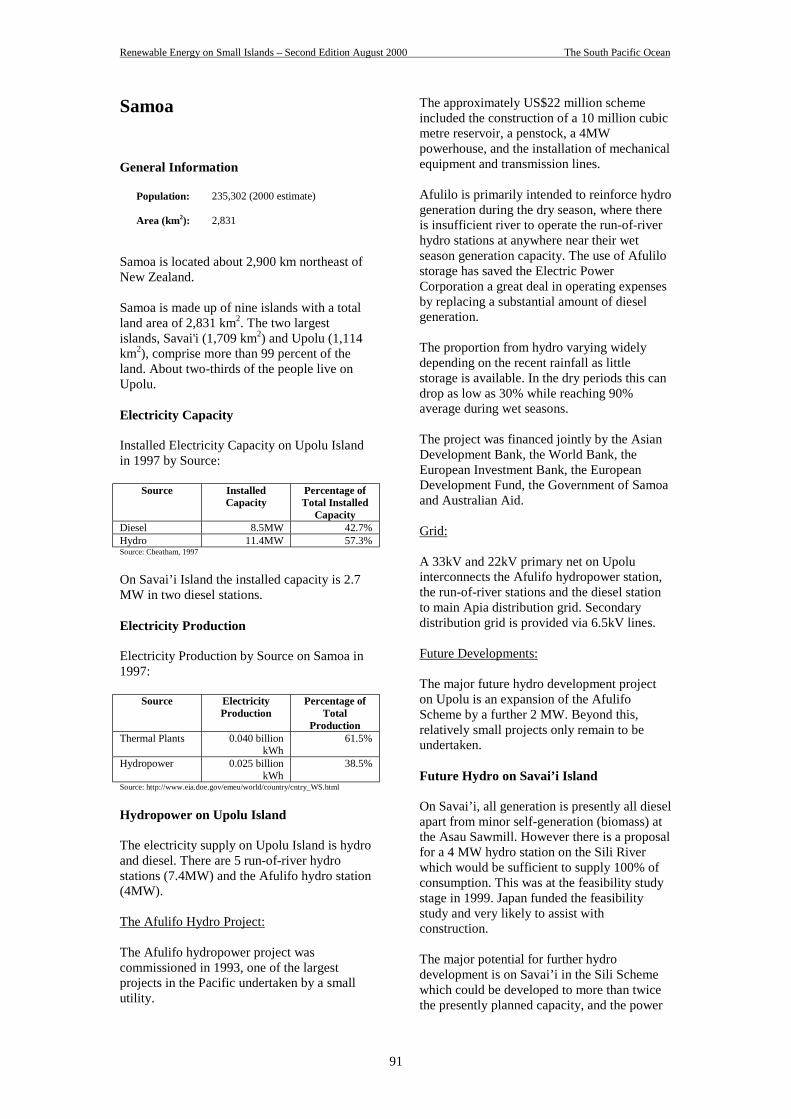
Renewable Energy on Small Islands – Second Edition August 2000 The South Pacific Ocean
91
Samoa
General Information
Population: 235,302 (2000 estimate)
Area (km2): 2,831
Samoa is located about 2,900 km northeast ofNew Zealand.
Samoa is made up of nine islands with a totalland area of 2,831 km2. The two largestislands, Savai'i (1,709 km2) and Upolu (1,114km2), comprise more than 99 percent of theland. About two-thirds of the people live onUpolu.
Electricity Capacity
Installed Electricity Capacity on Upolu Islandin 1997 by Source:
Source InstalledCapacity
Percentage ofTotal Installed
CapacityDiesel 8.5MW 42.7%Hydro 11.4MW 57.3%Source: Cheatham, 1997
On Savai’i Island the installed capacity is 2.7MW in two diesel stations.
Electricity Production
Electricity Production by Source on Samoa in1997:
Source ElectricityProduction
Percentage ofTotal
ProductionThermal Plants 0.040 billion
kWh61.5%
Hydropower 0.025 billionkWh
38.5%
Source: http://www.eia.doe.gov/emeu/world/country/cntry_WS.html
Hydropower on Upolu Island
The electricity supply on Upolu Island is hydroand diesel. There are 5 run-of-river hydrostations (7.4MW) and the Afulifo hydro station(4MW).
The Afulifo Hydro Project:
The Afulifo hydropower project wascommissioned in 1993, one of the largestprojects in the Pacific undertaken by a smallutility.
The approximately US$22 million schemeincluded the construction of a 10 million cubicmetre reservoir, a penstock, a 4MWpowerhouse, and the installation of mechanicalequipment and transmission lines.
Afulilo is primarily intended to reinforce hydrogeneration during the dry season, where thereis insufficient river to operate the run-of-riverhydro stations at anywhere near their wetseason generation capacity. The use of Afulilostorage has saved the Electric PowerCorporation a great deal in operating expensesby replacing a substantial amount of dieselgeneration.
The proportion from hydro varying widelydepending on the recent rainfall as littlestorage is available. In the dry periods this candrop as low as 30% while reaching 90%average during wet seasons.
The project was financed jointly by the AsianDevelopment Bank, the World Bank, theEuropean Investment Bank, the EuropeanDevelopment Fund, the Government of Samoaand Australian Aid.
Grid:
A 33kV and 22kV primary net on Upoluinterconnects the Afulifo hydropower station,the run-of-river stations and the diesel stationto main Apia distribution grid. Secondarydistribution grid is provided via 6.5kV lines.
Future Developments:
The major future hydro development projecton Upolu is an expansion of the AfulifoScheme by a further 2 MW. Beyond this,relatively small projects only remain to beundertaken.
Future Hydro on Savai’i Island
On Savai’i, all generation is presently all dieselapart from minor self-generation (biomass) atthe Asau Sawmill. However there is a proposalfor a 4 MW hydro station on the Sili Riverwhich would be sufficient to supply 100% ofconsumption. This was at the feasibility studystage in 1999. Japan funded the feasibilitystudy and very likely to assist withconstruction.
The major potential for further hydrodevelopment is on Savai’i in the Sili Schemewhich could be developed to more than twicethe presently planned capacity, and the power
Renewable Energy on Small Islands – Second Edition August 2000 The South Pacific Ocean
92
brought to Upolu Island by an undersea cable.However, the landowners are unlikely to agreeon this.
Grid:
The distribution systems at Savai’i Island are22kV and 6.6kV. Delivery voltage to allconsumers is at 415/240V.
Other Renewable Energy Sources
PV:
The potential for PV systems is restricted sincegood electrification distribution systems arenow extensive in both the two major islands.The areas without access to power are nowrestricted to two small islands plus some inlandareas in each of the major islands. Even theseareas have been further reduced by progressiveextension of distribution systems and may befurther limited by a project to link the larger ofthe two smaller islands to Upolu be anundersea cable. There was a PV project someyears ago targeting the two smaller islands.However, this project was cancelled, possiblywhen the Electric Power Corporation decidedit was interested in the undersea cable project.
Biomass:
Biomass has been used in the past forelectricity generation at the steam power plantat the Asau Sawmill in Savai’i. While the plantis still operational, the mill has now beenprivatised and does not appear to be exportingsignificant electricity to the grid. A number ofyears ago a proposal for a wood-fired powerstation on Upolu was abandoned and thisconcept is no longer regarded as viable.
Solid Waste:
Some time ago there was a proposal to burnsolid waste for energy. However, the volumesof solid waste were found to be insufficient. Itwas proposed that coal be brought in fromIndonesia to supplement the waste. However,this was not accepted by the Samoangovernment.
Overview of Renewable Energy Potential onSamoa
Renewable Energy Resource Potential onSamoa:
Source PotentialSolar Good resourceWind Good resourceBiomass Good resourceHydro Good resourceGeothermal Good resourceSource: Ellis & Fifita, 1999
Policy
At present Samoa does not have anycomprehensive policy in place althoughprogress towards comprehensive policy wasdeveloped with SOPAC assistance.
Contact Information
Organisation: Treasury DepartmentAddress: Private Mail Bag
ApiaSamoa
Tel.: +685 34333Fax: +685 21312E-mail:Internet:
References
Cheatham, 1997
Ellis & Fifita, 1999
Homepage of US Energy InformationAdministration (www.eia.doe.gov)
Nation, 1997
Van de Velde, 1996
Renewable Energy on Small Islands – Second Edition August 2000 The Caribbean Sea
93
Barbados
General Information
Population: 259,248 (2000 estimate)
Area (km2): 432
Barbados is the most easterly of the CaribbeanIslands. It lies 435km Northeast of Venezuelaand 402km to the Northeast of Trinidad andTobago.
Introduction
The Barbados Government has over the yearsbeen committed to developing a sustainableeconomy. The country relies on imported fuelfor almost all of its energy production. Thesustainability of the economy has beenenhanced by the production of crude oillocally, use of renewable energy sources andenergy conservation techniques. All projects inthis area are aimed at enabling Barbados tobecome more independent and self reliant incatering for its energy needs.
Renewable Energy Utilisation and Potential
Solar Energy:
Barbados has continued to actively developsolar technologies, the Government ofBarbados realises that these technologies willplay a vital role in developing a sustainableenergy sector.
The solar water heating industry iscomfortably the largest solar industry inBarbados. It has significantly grown since thistechnology entered the mainstream in 1974.The industry benefited under the FiscalIncentive Act of 1974, which allowed the solarwater heating businesses to benefit fromimport preferences and tax holidays.
In addition, the placing of a 30% consumptiontax on electric water heaters helped to makethese systems competitive.
There are at present three solar water heatingcompanies in Barbados, Aqua Sol, SolarDynamics and Sun Power. There was in 1999approximately 31,000 solar water heatersinstalled on the island. This represents morethan one third of households in Barbados. Thewater heaters have allowed Barbadians to savea combined total of more than $3.0 million per
year. As a further incentive to customers, theGovernment allowed all solar water heatersinstalled costs to be deductible from personalincome tax.
Recent advances in the technology haveproduced larger tanks of capacities of up to8,000 gallons, which are widely used in thehotel sector. Other advances have led togreater durability and longevity of tanks aswell as more resistance to calcification.
Solar Dynamics have already started topenetrate into the Caribbean market.
Barbados has also been involved in promotingsolar energy for many other purposes. Othermajor applications include solar drying, solardistillation and solar photovoltaic productionof electricity.
Solar drying techniques have been used inBarbados since 1969. The dryers are used forremoving moisture from a variety ofagricultural crops. In 1976 the first large-scaledryer was produced. This dryer, who has a1600-kg capacity, was used for drying sugarcane.
Since 1990 solar drying facilities have beenused to dry many different crops which includesweet potatoes, eddoes, yams and othervegetables.
The University of the West Indies (UWI),Cave Hill established a solar drying project in1995 under the supervision of Prof. The Hon.Oliver Headley and Mr. William Hinds. Theyhave recently developed the Artisanal Dryer,which has been exported in the Caribbeanregion.
The Government of Barbados has also recentlybeen involved, along with the UWI, in the useof solar energy for the distillation of water. Atpresent distilled water used in the sciencelaboratories at U.W.I., Cave Hill is obtainedfrom solar stills. The Government has enteredinto a joint project with U.W.I. to constructtwelve solar stills to be used in secondaryschools.
Within the last three years the Government ofBarbados has been in the process of pursuingthe development of other solar photovoltaictechnology. The U.W.I. and Barbados Light &Power Company have been instrumental inproviding technical assistance.
Renewable Energy on Small Islands – Second Edition August 2000 The Caribbean Sea
94
There are a number of pilot projects, which arenow being undertaken. The U.W.I. has usedphotovoltaic panels to power a solar ice-making machine. This is a 2kW stand-alonesystem. It is expected that this technology willbe produced commercially for fishermen whohave a large need for ice in order to preservefish.
The Government has also been involved withthe programme to provide photovoltaics for thelighting of Harrison Cave, which is one of thepremier tourist attractions of Barbados. The17.8 kW system will be tied to the utility grid.A similar type of the system is also beingdeveloped by the Barbados Light & PowerCompany.
Schools’ Solar Photovoltaic Project
The Government of Barbados recognises thatsolar photovoltaics will become a significantprovider of electrical energy. The Ministryintends to focus on this technology in the1999-2000 academic year. Already thegroundwork has been prepared for this. TheU.W.I. will be instrumental in making sure thatthese programmes come to fruition. TheMinistry of Education has also been involvedin this programme and recognises its benefits.
The main project, which has been proposed forinternational funding, is the Edutech 2000Photovoltaic Project. This project which willcost approximately $450,000 US will lead tothe assembly of a solar photovoltaic systemwhich will be grid connected.
The system will be used to provide electricityfor the entire school.
Funding has not been readily forthcoming forthis project. The Division has decided toimplement small projects of a demonstrationtype. A 2 kW system will be installed at asecondary school in the next academic year.
Wind Energy:
During the 1980’s a number of studies wereundertaken to determine the wind resources invarious sections of the island. It wasdetermined that the north and south-easternsections of the island were best suited todevelopment in the areas of wind. A windturbine was constructed in 1986 with acapacity of 250 kW in the parish of St. Lucywhich is to the north of the island.
However, faulty technical design andinsufficient maintenance, led to theabandonment of the project in 1990.
In 1998 the British company RenewableEnergy Systems Ltd. in conjunction with theGovernment of Barbados commenced a windfarm feasibility study. Continuous wind energydata has been collected at a site in St. Lucy andthe results so far seem to suggest that windfarm development is viable.
If the project proceeds, a 6-MW wind farmwill be constructed on the site and the energyproduce will be fed to the utility grid.
An agreement between the developers andBarbados Light & Power (utility company)will have to be reached on the terms of thepurchase of power.
Other Technologies:
There have been many technologies inrenewable energy, which have also beeninvestigated and/or implemented in Barbados.At the moment the renewable energy sourcethat produces the largest fraction of totalenergy is bagasse which is used in the sugarcan industry. All of the energy used in thefactories is provided from this source.Any excess is sold to the Barbados Light andPower at the avoided fuel cost.
In addition small projects using biogas fromdairy farms have been undertaken.
The University of the West Indies is currentlyinvestigating Ocean Thermal EnergyConversion (OTEC). The technology will usethe temperature difference between the bottomof the ocean and that at its surface to providethe energy to power a generator. It is atechnology, which has much scope for islands,which are volcanic in their geology. Thistechnology is still to be demonstrated on alarge scale.
Tidal energy is also a renewable source, whichhas been investigated with a view todevelopment.
Solar Water Heating Industry
The Solar Water Heating Industry started in1974.The high cost of electricity, foresight ofentrepreneurs, the high availability of SolarEnergy and fiscal incentives all played a partin fueling the solar water heating industry.
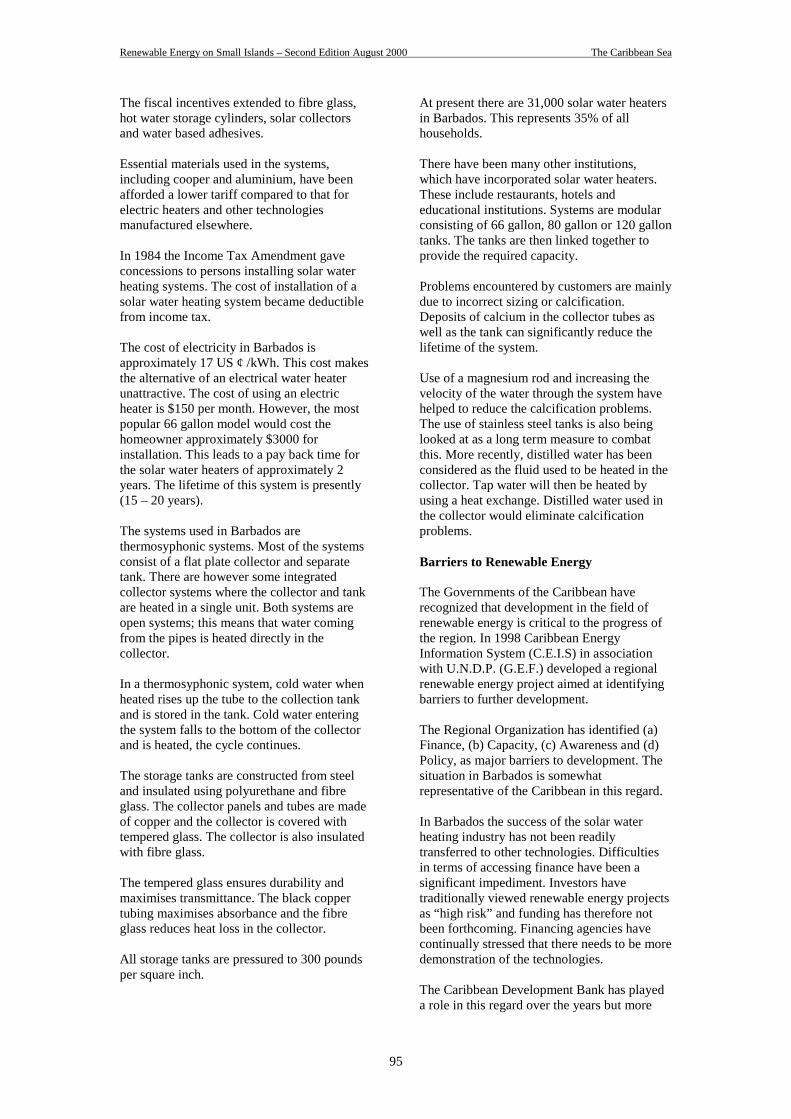
Renewable Energy on Small Islands – Second Edition August 2000 The Caribbean Sea
95
The fiscal incentives extended to fibre glass,hot water storage cylinders, solar collectorsand water based adhesives.
Essential materials used in the systems,including cooper and aluminium, have beenafforded a lower tariff compared to that forelectric heaters and other technologiesmanufactured elsewhere.
In 1984 the Income Tax Amendment gaveconcessions to persons installing solar waterheating systems. The cost of installation of asolar water heating system became deductiblefrom income tax.
The cost of electricity in Barbados isapproximately 17 US ¢ /kWh. This cost makesthe alternative of an electrical water heaterunattractive. The cost of using an electricheater is $150 per month. However, the mostpopular 66 gallon model would cost thehomeowner approximately $3000 forinstallation. This leads to a pay back time forthe solar water heaters of approximately 2years. The lifetime of this system is presently(15 – 20 years).
The systems used in Barbados arethermosyphonic systems. Most of the systemsconsist of a flat plate collector and separatetank. There are however some integratedcollector systems where the collector and tankare heated in a single unit. Both systems areopen systems; this means that water comingfrom the pipes is heated directly in thecollector.
In a thermosyphonic system, cold water whenheated rises up the tube to the collection tankand is stored in the tank. Cold water enteringthe system falls to the bottom of the collectorand is heated, the cycle continues.
The storage tanks are constructed from steeland insulated using polyurethane and fibreglass. The collector panels and tubes are madeof copper and the collector is covered withtempered glass. The collector is also insulatedwith fibre glass.
The tempered glass ensures durability andmaximises transmittance. The black coppertubing maximises absorbance and the fibreglass reduces heat loss in the collector.
All storage tanks are pressured to 300 poundsper square inch.
At present there are 31,000 solar water heatersin Barbados. This represents 35% of allhouseholds.
There have been many other institutions,which have incorporated solar water heaters.These include restaurants, hotels andeducational institutions. Systems are modularconsisting of 66 gallon, 80 gallon or 120 gallontanks. The tanks are then linked together toprovide the required capacity.
Problems encountered by customers are mainlydue to incorrect sizing or calcification.Deposits of calcium in the collector tubes aswell as the tank can significantly reduce thelifetime of the system.
Use of a magnesium rod and increasing thevelocity of the water through the system havehelped to reduce the calcification problems.The use of stainless steel tanks is also beinglooked at as a long term measure to combatthis. More recently, distilled water has beenconsidered as the fluid used to be heated in thecollector. Tap water will then be heated byusing a heat exchange. Distilled water used inthe collector would eliminate calcificationproblems.
Barriers to Renewable Energy
The Governments of the Caribbean haverecognized that development in the field ofrenewable energy is critical to the progress ofthe region. In 1998 Caribbean EnergyInformation System (C.E.I.S) in associationwith U.N.D.P. (G.E.F.) developed a regionalrenewable energy project aimed at identifyingbarriers to further development.
The Regional Organization has identified (a)Finance, (b) Capacity, (c) Awareness and (d)Policy, as major barriers to development. Thesituation in Barbados is somewhatrepresentative of the Caribbean in this regard.
In Barbados the success of the solar waterheating industry has not been readilytransferred to other technologies. Difficultiesin terms of accessing finance have been asignificant impediment. Investors havetraditionally viewed renewable energy projectsas “high risk” and funding has therefore notbeen forthcoming. Financing agencies havecontinually stressed that there needs to be moredemonstration of the technologies.
The Caribbean Development Bank has playeda role in this regard over the years but more
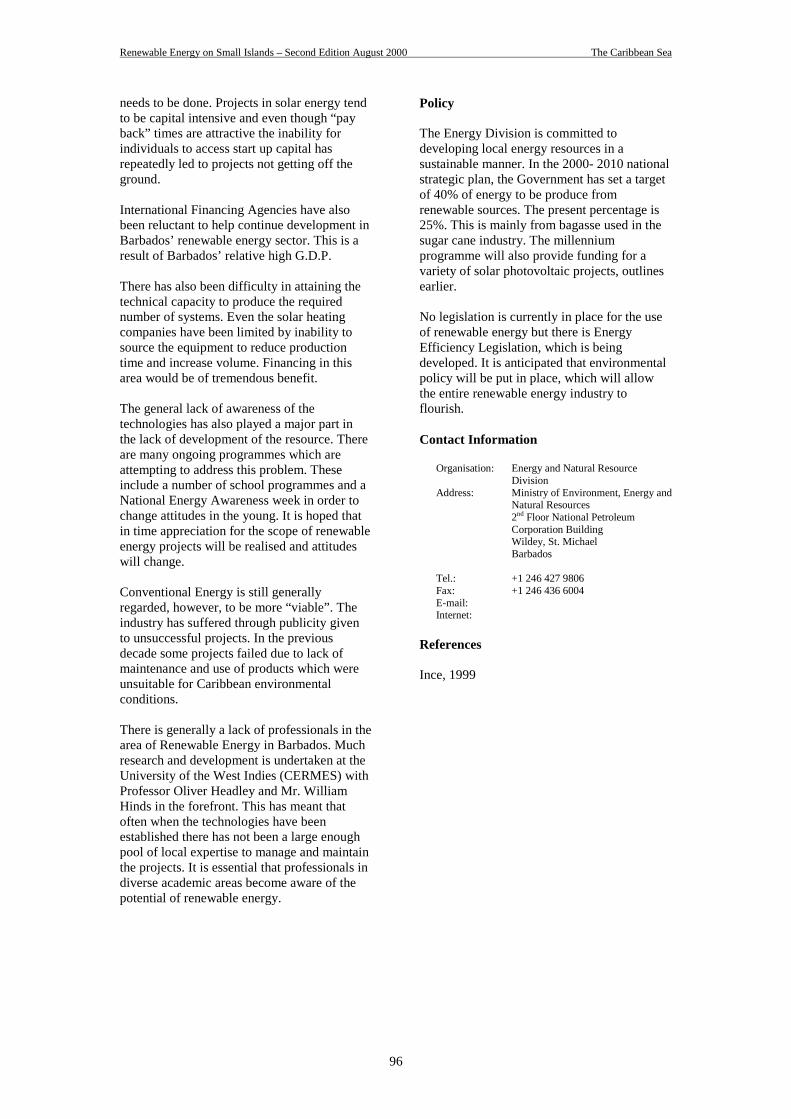
Renewable Energy on Small Islands – Second Edition August 2000 The Caribbean Sea
96
needs to be done. Projects in solar energy tendto be capital intensive and even though “payback” times are attractive the inability forindividuals to access start up capital hasrepeatedly led to projects not getting off theground.
International Financing Agencies have alsobeen reluctant to help continue development inBarbados’ renewable energy sector. This is aresult of Barbados’ relative high G.D.P.
There has also been difficulty in attaining thetechnical capacity to produce the requirednumber of systems. Even the solar heatingcompanies have been limited by inability tosource the equipment to reduce productiontime and increase volume. Financing in thisarea would be of tremendous benefit.
The general lack of awareness of thetechnologies has also played a major part inthe lack of development of the resource. Thereare many ongoing programmes which areattempting to address this problem. Theseinclude a number of school programmes and aNational Energy Awareness week in order tochange attitudes in the young. It is hoped thatin time appreciation for the scope of renewableenergy projects will be realised and attitudeswill change.
Conventional Energy is still generallyregarded, however, to be more “viable”. Theindustry has suffered through publicity givento unsuccessful projects. In the previousdecade some projects failed due to lack ofmaintenance and use of products which wereunsuitable for Caribbean environmentalconditions.
There is generally a lack of professionals in thearea of Renewable Energy in Barbados. Muchresearch and development is undertaken at theUniversity of the West Indies (CERMES) withProfessor Oliver Headley and Mr. WilliamHinds in the forefront. This has meant thatoften when the technologies have beenestablished there has not been a large enoughpool of local expertise to manage and maintainthe projects. It is essential that professionals indiverse academic areas become aware of thepotential of renewable energy.
Policy
The Energy Division is committed todeveloping local energy resources in asustainable manner. In the 2000- 2010 nationalstrategic plan, the Government has set a targetof 40% of energy to be produce fromrenewable sources. The present percentage is25%. This is mainly from bagasse used in thesugar cane industry. The millenniumprogramme will also provide funding for avariety of solar photovoltaic projects, outlinesearlier.
No legislation is currently in place for the useof renewable energy but there is EnergyEfficiency Legislation, which is beingdeveloped. It is anticipated that environmentalpolicy will be put in place, which will allowthe entire renewable energy industry toflourish.
Contact Information
Organisation: Energy and Natural ResourceDivision
Address: Ministry of Environment, Energy andNatural Resources2nd Floor National PetroleumCorporation BuildingWildey, St. MichaelBarbados
Tel.: +1 246 427 9806Fax: +1 246 436 6004E-mail:Internet:
References
Ince, 1999
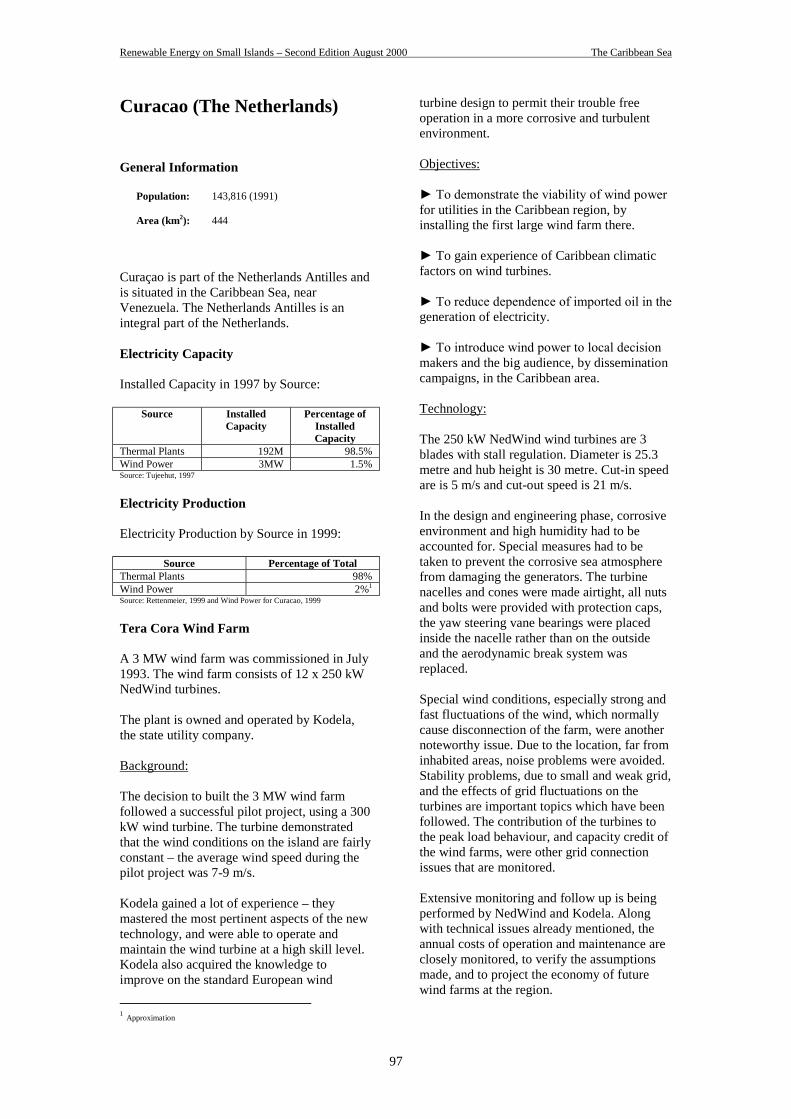
Renewable Energy on Small Islands – Second Edition August 2000 The Caribbean Sea
97
Curacao (The Netherlands)
General Information
Population: 143,816 (1991)
Area (km2): 444
Curaçao is part of the Netherlands Antilles andis situated in the Caribbean Sea, nearVenezuela. The Netherlands Antilles is anintegral part of the Netherlands.
Electricity Capacity
Installed Capacity in 1997 by Source:
Source InstalledCapacity
Percentage ofInstalledCapacity
Thermal Plants 192M 98.5%Wind Power 3MW 1.5%Source: Tujeehut, 1997
Electricity Production
Electricity Production by Source in 1999:
Source Percentage of TotalThermal Plants 98%Wind Power 2%1
Source: Rettenmeier, 1999 and Wind Power for Curacao, 1999
Tera Cora Wind Farm
A 3 MW wind farm was commissioned in July1993. The wind farm consists of 12 x 250 kWNedWind turbines.
The plant is owned and operated by Kodela,the state utility company.
Background:
The decision to built the 3 MW wind farmfollowed a successful pilot project, using a 300kW wind turbine. The turbine demonstratedthat the wind conditions on the island are fairlyconstant – the average wind speed during thepilot project was 7-9 m/s.
Kodela gained a lot of experience – theymastered the most pertinent aspects of the newtechnology, and were able to operate andmaintain the wind turbine at a high skill level.Kodela also acquired the knowledge toimprove on the standard European wind
1 Approximation
turbine design to permit their trouble freeoperation in a more corrosive and turbulentenvironment.
Objectives:
► To demonstrate the viability of wind powerfor utilities in the Caribbean region, byinstalling the first large wind farm there.
► To gain experience of Caribbean climaticfactors on wind turbines.
► To reduce dependence of imported oil in thegeneration of electricity.
► To introduce wind power to local decisionmakers and the big audience, by disseminationcampaigns, in the Caribbean area.
Technology:
The 250 kW NedWind wind turbines are 3blades with stall regulation. Diameter is 25.3metre and hub height is 30 metre. Cut-in speedare is 5 m/s and cut-out speed is 21 m/s.
In the design and engineering phase, corrosiveenvironment and high humidity had to beaccounted for. Special measures had to betaken to prevent the corrosive sea atmospherefrom damaging the generators. The turbinenacelles and cones were made airtight, all nutsand bolts were provided with protection caps,the yaw steering vane bearings were placedinside the nacelle rather than on the outsideand the aerodynamic break system wasreplaced.
Special wind conditions, especially strong andfast fluctuations of the wind, which normallycause disconnection of the farm, were anothernoteworthy issue. Due to the location, far frominhabited areas, noise problems were avoided.Stability problems, due to small and weak grid,and the effects of grid fluctuations on theturbines are important topics which have beenfollowed. The contribution of the turbines tothe peak load behaviour, and capacity credit ofthe wind farms, were other grid connectionissues that are monitored.
Extensive monitoring and follow up is beingperformed by NedWind and Kodela. Alongwith technical issues already mentioned, theannual costs of operation and maintenance areclosely monitored, to verify the assumptionsmade, and to project the economy of futurewind farms at the region.
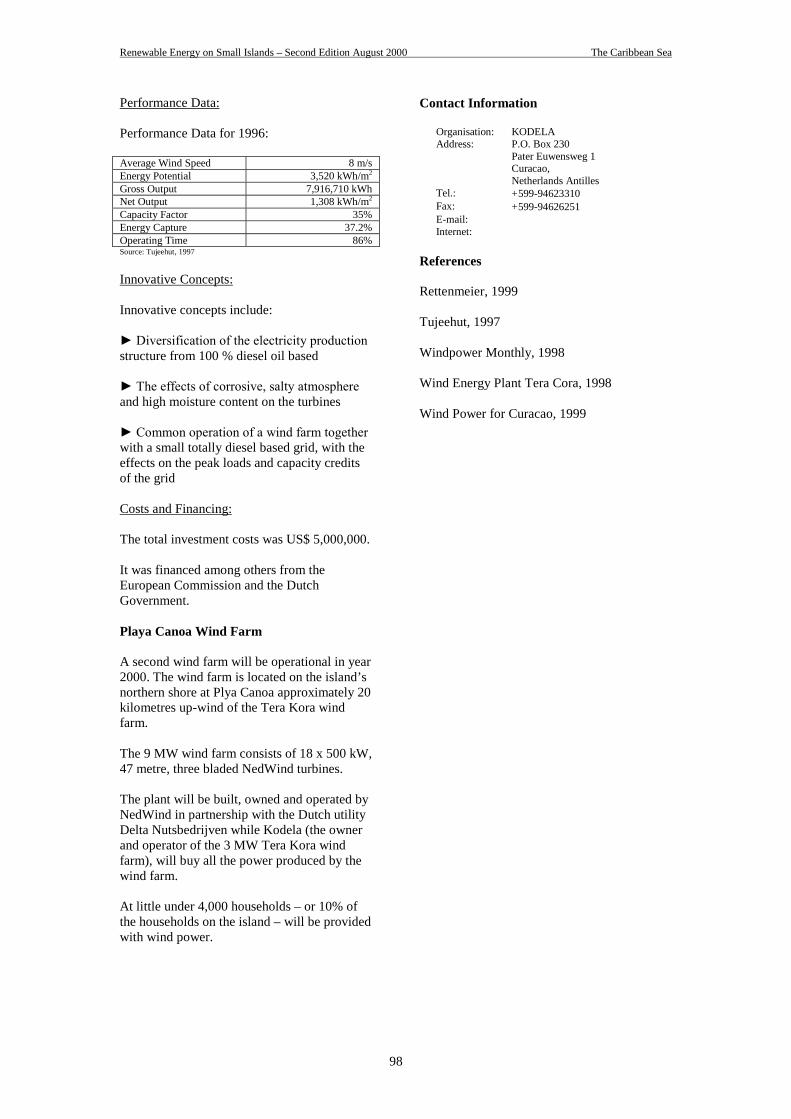
Renewable Energy on Small Islands – Second Edition August 2000 The Caribbean Sea
98
Performance Data:
Performance Data for 1996:
Average Wind Speed 8 m/sEnergy Potential 3,520 kWh/m2
Gross Output 7,916,710 kWhNet Output 1,308 kWh/m2
Capacity Factor 35%Energy Capture 37.2%Operating Time 86%Source: Tujeehut, 1997
Innovative Concepts:
Innovative concepts include:
► Diversification of the electricity productionstructure from 100 % diesel oil based
► The effects of corrosive, salty atmosphereand high moisture content on the turbines
► Common operation of a wind farm togetherwith a small totally diesel based grid, with theeffects on the peak loads and capacity creditsof the grid
Costs and Financing:
The total investment costs was US$ 5,000,000.
It was financed among others from theEuropean Commission and the DutchGovernment.
Playa Canoa Wind Farm
A second wind farm will be operational in year2000. The wind farm is located on the island’snorthern shore at Plya Canoa approximately 20kilometres up-wind of the Tera Kora windfarm.
The 9 MW wind farm consists of 18 x 500 kW,47 metre, three bladed NedWind turbines.
The plant will be built, owned and operated byNedWind in partnership with the Dutch utilityDelta Nutsbedrijven while Kodela (the ownerand operator of the 3 MW Tera Kora windfarm), will buy all the power produced by thewind farm.
At little under 4,000 households – or 10% ofthe households on the island – will be providedwith wind power.
Contact Information
Organisation: KODELAAddress: P.O. Box 230
Pater Euwensweg 1Curacao,Netherlands Antilles
Tel.: +599-94623310Fax: +599-94626251E-mail:Internet:
References
Rettenmeier, 1999
Tujeehut, 1997
Windpower Monthly, 1998
Wind Energy Plant Tera Cora, 1998
Wind Power for Curacao, 1999
Renewable Energy on Small Islands – Second Edition August 2000 The Caribbean Sea
99
Dominica
General Information
Population: 71,183
Area (km2): 977
Dominica is situated between the Frenchislands of Guadeloupe to the north andMartinique in the south.
Energy Sector
Dominica has no known reserves of crude oiland depends in totality on imports, fromTrinidad and Tobago and other oil producingand/or refining countries in the Caribbean andother regions, of gasoline, kerosene, diesel oiland liquefied petroleum gas (LPG). Gasolineand diesel are primarily used in thetransportation sector whereas kerosene andLPG are used in the domestic sector forcooking etc. With LPG being used in the urbancentres.
The electricity company in Dominica whichoperates the national grid is a privatemonopoly owned by the CommonwealthDevelopment Corporation (CDC). They holdthe sole exclusive licence for the generation,transmission distribution and sale of electricityin the Commonwealth of Dominica.
Electricity Consumption
Electricity Consumption by Sector in 1994:
Sector Consumption inkWh
Percentage ofTotal
ConsumptionDomestic Sector 22,166,000 52.3%CommercialSector
12,119,000 28.6%
Industrial Sector 2,446,000 5.8%Street Lightning 4,913,000 11.6%GeneralLightning
699,000 1.7%
Source: Vital, 1999
At the end of 1994 there were 18,812Domestic consumers, 1,514 Commercialconsumers, 52 Industrial consumers, 172 Streetlighting consumers and 977 General lightingconsumers connected to the national grid.
Electricity Capacity
Installed Electricity Capacity in 1998 bySource:
Source InstalledCapacity
Percentage ofTotal Installed
CapacityThermal Plants 11.1 MW 59.4%Hydro Power 7.6 MW 40.6%Source: CREDP, 2000
There is a new power station underconstruction with 2 x 4 MW diesel generators.It will be commissioned in the middle of 2001.A further expansion of this station to 8 MW isenvisaged in 2003.
Electricity Production
Electricity Production by Source in 1998:
Source GeneratedElectricity
Percentage ofTotal
ProductionThermal Plants 75.8 GWh 52%Hydro Power 70 GWh 48%Source: CREDP, 2000
Policy
A national energy policy does not exist, andthere is also no written or otherwise articulatedrenewable energy policy or statement. There isalso no national development plan in place ofwhich energy planning could become a part.No national energy planning process is in placeeither, although it was suggested in 1991 in theCountry Environmental Profile Study toestablish either an Energy Unit or an EnergyPolicy and Development Board/Committeeacting as an inter-agency co-ordinating entityfor long term planning. Energy issues arehandled by the Ministry of Communications,Works and Housing.
Experience with Renewable Energy
Hydropower:
Hydropower provided approximately 48% oftotal electricity generation in 1998. Thisproportion tending to decrease in the last 5years due to increasing diesel capacity. Theload factor of the electricity plant has been 40-50% in the last five years, reflecting theconsiderable decreases in dry periods.
Dominica with its mountains of up to 1432 m(4700 ft) above sea level, heavy rain fall, verythick rain forest and large number of streamsand rivers flowing both east and west into theAtlantic ocean and Caribbean sea respectively,
Renewable Energy on Small Islands – Second Edition August 2000 The Caribbean Sea
100
possesses considerable potential for thedevelopment of run-of-the-river hydroelectricpower schemes. Except for a few, the riversare very comparable in size. They generallyfollow a direct path to the sea and there arelimited cases of amalgamation of streams toform larger rivers with significant catchments.The Roseau river basin has in fact beenpartially developed and hydroelectric power ispresently being generated at three power plantsat Laudat, Trafalgar and Padu. All existinghydropower stations are essentially run-of-the-river schemes in conjunction with smalldamns/reservoirs. They are all owned andoperated by the CDC.
Several studies have been commissioned in thepast to identify the island's hydroelectricresources. All studies were in agreement thatthere are substantial hydroelectric resources onthe island. A number of other basins in thesouthern half of the island possess hydropotential. According to one study, apart fromthe existing 6,500 KW of capacity establishedin the upper Roseau River Basin, a further15,680 KW of hydro-electric power can beexploited from other river basins.
Geothermal Energy:
A U.N.D.P. evaluation of Dominica's NaturalResources in 1969 concluded that the chancesfor finding economic quantities of naturalsteam for power generation in Dominica areexcellent; recent volcanism and the geologicalstructure associated with the volcanoes suggestthe presence of a large, shallow heat source;the chemistry of the hot springs indicates thepossibility of producing steam without anassociated liquid phase; it may be the cheapestsource of power in the Caribbean region.
US Geological Survey's "Resource Appraisalof Dominica, 1978 concluded: Natural depositsof copper, pumice, limestone and clays may besufficient to justify long-term industrialdevelopment; a very good potential forgeothermal power exists on the island; a studyof the comparative costs of development ofhydroelectric power vs. Geothermal power isneeded.
French "Geothermal Studies in Dominica, May1980” one Dominican geothermal well canprobably produce 5 to 10 MW. This is muchstronger than in Guadeloupe where three (3)wells are needed to produce 6 MW;Dominica's Soufriere and Wotton Wavenfields could produce 50 to 100 MW each; TheBoiling Lake could produce much more. It is
estimated that the first large reservoir is at adepth of 400 metres to 800 metres with afeeder zone at about 800m to 1400 metresbelow ground level. The magma temperaturesat these depths has been estimated at 200degrees C to 300 degrees C. In addition, it isbelieved that a deep heat source (900 degreesC) exists at a depth of 6 to 10 kilometres. Athorough geothermal measurement program,with exploratory drillings, and a 5 MW pilotplant are needed to define and prove out theresource.
In Nov 1981, an analysis of Dominica'sGeothermal Energy Potential was done inwhich a Dominican Geothermal Program wasproposed to run over the period 1982 to 2018at a total cost of over $365 Million involvingthree 100 MW Electric power geothermalplants.
It is believed that when the geothermal fieldsare fully developed in Dominica, electricpower generation of up to 300 MW would bepossible.
However to date no exploratory or other workhas been done in this area in Dominica and theprogram has not been implemented. This isprimarily because of the high capital costinvolved, sufficient hydro power resources,and for reasons of an inadequate market.
Biogas:
In August 1983 an agreement on TechnicalCooperation was signed between the Govt. ofthe Federal Republic of Germany and theCaribbean Development Bank (C.D.B.) on theexecution of a biogas program in theframework of the Regional Energy Action Plan(REAP). The program was aimed at a self-sustaining dissemination of the biogastechnology in CDB member countries.Dominica was one of the countries to benefitunder this program.
In Dominica's economy, agriculture plays avital role and livestock rearing is common. Asmost of the country's livestock is reared onsmall farms (0.44 ha) the largest potentialgroups were mainly small farmers. Organicback-yard gardening is common in certainareas. The use of slurry (bio-fertilizer)therefore exists.
Two demonstration units were constructed todemonstrate the technical feasibility of thebiogas technology and a one week workshopwas conducted. Another 3 demonstration units
Renewable Energy on Small Islands – Second Edition August 2000 The Caribbean Sea
101
were later constructed. A biogass committeewas formed whose role was to providesupervision, technical assistance, monitoringand evaluation activities. A fund was also setup to provide interest-free loans to smallfarmers with limited financial potential toprocure materials for constructing biogassunits.
Up till 1988 a total of 14 biogass units werebeen constructed and two were underconstruction.
The "technology transfer" phase of the projectended in December 1988, and evidently therehas been no further dissemination of thetechnology since. Only a couple (if any)additional units have been built to date. Theinterest-free fund no longer exists and thetechnology never propagated as intended. Infact the program never really continued andonly a fraction of the original 14 units are nowfunctional.
The reasons for the failure of the project arestill unclear, but amongst the contendingreasons are:
a) The sizes of farms in Dominica aregenerally too small for the technology togenerate a significant financial benefit tothe farmer and the other benefits did notseem to generate enough of an incentive
b) The small farmers generally could notafford the capital cost (albeit not too large)involved
c) The local organisations entrusted withmanagement of the program did not do agood job.
Other Sources of Renewable Energy:
Other alternative energies such as wind orsolar energy have never been taken into seriousconsideration, because of sufficient Hydro-power resources.
Solar Energy:
Due to Dominica's geographical position(about 15 degrees North Latitude) there issubstantial potential for solar energy. The solarenergy resources of a typical Caribbean islandare considerable, the sun providing about 6KWh of energy every day for every squaremeter of land area.
There is one company on the island thatmanufactures and sells solar water heaters.Many recently built homes now have solarwater heaters install, but there is no formal ororganised promotion of the technology on theisland.
Wind Power:
Since Dominica is hit by the northeast "tradewinds" and has high mountains for any windpower installation, there is also great potentialfor this energy source. There are wind speedsof over nine meters per second. However,nothing has been formally done regarding theharnessing of wind power in Dominica.
Main Barriers
The main barrier is the lack of energy policy.An energy policy should encourage theexploitation of the country’s renewable energypotential by the electricity sector and byprivate entrepreneurs. Without establishing anenergy policy with attractive incentives thatencourages the electricity company to userenewables, specially hydropower, increasedlarge-scale use of renewables will be difficult.
The general lack of awareness of the country’sconsiderable renewable energy potential,mainly hydropower, and possibly some windpower, is a serious barrier.
Renewable Energy Island Nation
Dominica has signalled its intention to becometotally free from its dependence upon fossilfuel imports by 2015.
Contact Information
Organisation: Dominica Electricity Services Ltd.Address: P.O. Box 1593, 18 Castle Street,
RoseauDominica
Tel.: +1 767-448-2681Fax: +1 767-448-5397E-mail:Internet:
Organisation: Electrical DivisionMinistry of Communication, Worksand Housing
Address: Government HeadquartersRoseauDominica
Tel.: +1 761-448-2401Fax: +1 761-448-4807E-mail:Internet:

Renewable Energy on Small Islands – Second Edition August 2000 The Caribbean Sea
102
References
CREDP, 2000
Vital, 1999
SIDSnet (www.sidsnet.org)
Renewable Energy on Small Islands – Second Edition August 2000 The Caribbean Sea
103
Guadeloupe (France)
General Information
Population: 421,600
Area (km2): 1,709
Guadeloupe is a group of islands in the FrenchWest Indies, off the north-western coast ofSouth America, in the eastern Caribbean Sea.Guadeloupe is an overseas department ofFrance.
The two principal islands - separated by theSalée River, a narrow arm of the CaribbeanSea - are Basse-Terre on the west and Grande-Terre on the east. Nearby island dependenciesare Marie-Galante, La Désirade, and LesSaintes; the other dependencies, Saint-Barthélemy and Saint Martin, are located about250 km to the north-west.
Introduction
France’s island territories and especiallyGuadeloupe plays an important part in therenewable industry. These territories areconsidered an integrated part of France, but forgeographical reasons they cannot be connectedto the grid. The French Electricity Board(EDF) has always been keen to installrenewable energy sources in these places,where they are considered to be an alternativeto diesel generation. These places have proveda valuable training ground for the Frenchrenewable industry.
Electricity Capacity
Installed Electricity Capacity in 1999 bySource:
Source InstalledCapacity
Percentage ofTotal InstalledCapacity
Diesel 407.08 MW 84.25%Biomass 64 MW 13.25%Hydro 7 MW 1.45%Geothermal 4.8 MW 0.99%Wind 0.3 MW 0.06%RenewablesTotal
76.1 MW 15.7%
Source: Donizeau, 2000
Electricity Production
Electricity Production in 1999 by Source:
Source Percentage of TotalGenerated Electricity
Thermal Plants 91%Biomass 7%Hydro 1%Geothermal 1%Wind 0.3%Renewables Total 9.3%Source: Donizeau, 2000
Hydro Power
Electricity from hydropower is produced byfive small plants installed in the rivers of Basse-Terre. Annual rainfall over the Soufrièrevolcano is 10 m. Power varies from 200 to4,400 kW. Production has reached 20GWh in1996. Different projects actually beingconsidered could bring about a supplementarypotential of 20GWh per year up to 2002.
Solar Heaters
Around 12,000 houses have received solarheaters. This has saved 30 GWh or 7,680 fueltons (metric) and the production of 19,200 ofCO2. There is expected to be installed 1,000solar heaters per year.
Solar water heaters have benefited fromparticularly competitive prices and servicessince the beginning of 1996. Since then,customers have been able to sign supplycontracts of energy. This contract signed withSociété pour le Développment de l’EnergieSolaire (SDES) guaranties hot water to thecustomers over a period of ten years, againstan initial down payment of about 15% of thetotal investment followed be reasonable six-months instalments.
A specialised company (D’Locho) is in chargeof the maintenance of the solar water heatersand covers hurricane risk. This service is madepossible because of the reliability of theequipment, the quality of the work provided by4 local suppliers (Ets Blandin, GuadeloupeSolaire, Solaira and Solar Edwards), andregistered solar water heaters fitters.
A premium of about 20% of the totalinvestment is granted by the French State, theEuropean Commission, La RégionGuadeloupe, EDF Guadeloupe, and ADEMEto help the sale through contact. The waterheaters are subsidised according to theirproductivity. Compared to a classical
Renewable Energy on Small Islands – Second Edition August 2000 The Caribbean Sea
104
installation, the premium is doubled forcollective installations.
In order to encourage the development of solarenergy in the tertiary sector, hospitals, schools,etc. feasibility studies for school installationbenefit from 80% financing for the total cost ofthe study.
PV
Photovoltaic energy concerns mainlyelectricity production for houses not linkedwith EDF network. In 1998 the number offamily installations was approximately 1,200.PV is the power source for 40 health centres inGualdeloupe (sponsored by the THERMIE-programme under the European Commission),for lighthouses, buoys and markers, and forremote telecommunication equipment. Thetarget for year 2000 is to reach 1,500 families.
Biomass
A 2 x 32 MWe bagasse plant wascommissioned in 1999 near the town of LeMoule. It is of the same type as the twobagass-plants on Reunion (please see thesection The Indian Ocean for a detaileddescription of these plants).
Geothermal Power
A 5 MW pilot geothermal plant wasconstructed and commissioned in 1986 byEDF.
Located on the Basse-Terre island, theBouillante geothermal plant is the only high-temperature geothermal plant in France. A340-meter well at the foot of the Soufrierevolcano provides steam (20%) and 160o water(80%). In 1996, after several years ofexperimenting, the plant was connected to theelectricity network.
An availability rate of around 90% over thefirst years makes this plant highly promising.A minimum of 20 MW can probably beinstalled at the Bouillante site, i.e. 12% of theisland’s peak demand, 15% in produced energy(base operation), and exploration of a furthersite seems foreseeable.
Wind Power
The are installed wind farms on Grande-Terre(one of the two main islands) and on thedependencies Marie Galante and La Desirade.
Petit Canal Wind Farm on Grande-Terre:
The first wind farm installed on the mainisland of Guadeloupe is located at Petit Canal,a cliff top on the eastern coast of Grande Terre,facing trade winds.
40 VERGNET SA wind generators, each 60kW rated, build up a wind farm of 2.4 MW.
Marketed yearly wind production is 6.6 GWh.
Petir Canal wind farm was commissioned atthe beginning of 1999.
Wind Power on La Desirade Island:
The island of La Desirade is situated 10 kmeast of the island of Grande-Terre. The islandis 70 km2 and has a population of 1,610(1990).
The first wind farm on La Desirade Island wasmade of 12 x 13 kW rated wind generators. Ithas been modified to a 500 kW rated windfarm by replacement of 13 kW by 25 kW ratedpower wind generators and by bringing thenumber of machines from 12 to 20.
The production of the wind farm is first used tofeed La Desirade grid and secondly excesscurrent is transferred to La Guadeloupethrough the submarine cable.
The marketed yearly production of this newwind farm is 2 GWh. The production startedon 1996. In 1998 was 100% of the electricityconsumption on the island from wind power.
A second wind farm will be constructed on LaDesirade island. It will be located at Plateau deLa Montagne, a location in the northeast of theisland.
40 VERGNET SA wind generators, each 60kW rated, build up a wind farm of 2.4 MW.Marketed yearly wind production is 8 GWh.
Plateau de La Montagne wind farm will becommissioned at the end of 2000
Wind Power on Marie Galante Island:
The island of Marie Galante is situated 30 kmsouth-east of the two main islands Grande-Terre and Basse-Terre. The island is 158 km2
and has a population of 13,463.
Renewable Energy on Small Islands – Second Edition August 2000 The Caribbean Sea
105
The first wind farm installed on the island ofMarie Galant is located at Petite Place, a hilltop on the eastern coast of the island.
25 VERGNET SA wind generators, each 60kW rated, build up a wind farm of 1,5 MW.Marketed yearly wind production is 4 GWh. In1998 the wind farm provided 30% of theelectricity production on the island.
Petite Place wind farm was commissioned atthe beginning of 1998.
EDF GDF Guadeloupe was interested in thisproject because they have experienced bigtrouble in 1997 when the only sub marinecable connecting Marie Galante to LaGuadeloupe failed.
The formerly installed diesel power plantswhich were supposed to be maintained asstandby plants failed to face the increaseddemand as well as to simply run. EDF GDFGuadeloupe had to build up a crash programconsisting of rented mobile diesel power plantand to pay kWh at maximum rate during repairof the sub marine cable.
From this time EDF GDF Guadeloupe isinterested in scattered wind farms in remoteislands connected by sub marine cables. Theexistence of wind farms lightens the burden forlocal diesel power plants when failure in submarine connection appears.
A second wind farm is under construction onMarie Galante Island. It is located at MorneConstant, a location north of Petite Place.
25 VERGNET SA wind generators, each 60kW rated, build up a wind farm of 1.5 MW.
Marketed yearly wind production is 4.5 GWh.
Morne Constant wind will be commissioned inyear 2000.
Energy Plans
The regional Power Region Guadeloupe andthe regional bureau of the national Ministry ofEnvironment and Energy, Agency del’Environment et de la Matrise de l’Energie(ADEME), have built a energy programme for2002. At this time 25% of the consumedelectricity in the Region will be extracted fromrenewable energy sources.
Contact Information
Organisation: VERGNET S.A.Address: 6, rue Henri Dunant
45140 IngréFrance
Tel.: +33 2 38 22 75 00Fax: +33 2 38 22 75 22E-mail: [email protected]: Www.vergnet.fr
Organisation: ADEME GuadeloupeAddress: Immeuble Café Center
Rue Ferdinand Forest97122 Baie – MahaultGuadeluope
Tel.: +590 267805Fax: +590 268715E-mail: [email protected]:
Organisation: EDF GuadeloupeAddress:
Tel.:Fax:E-mail: egs-guadelou-cellule-mde-
[email protected]: http://www.edf.fr/guadeloupe/aindex.
htm
References
Bal et al., 1999
Correspondence with ADEME-Guadeloupe
Correspondence with VERGNET S.A.
Donizeau, 2000
EDF, 1998
Homepage of EDF Guadeloupe(www.edf.fr/guadeloupe/aindex.htm)
Noel, 1999
Wind Power Monthly, 2000

Renewable Energy on Small Islands – Second Edition August 2000 The Caribbean Sea
106
Renewable Energy on Small Islands – Second Edition August 2000 The Caribbean Sea
107
St. Lucia
General Information
Population: 152,335 (1998 estimate)
Area (km2): 616
St. Lucia is located in the south-easternCaribbean Sea, between Martinique on thenorth and Saint Vincent on the south.
Renewable Energy Island Nation
At a press conference in November 1999 at theFifth Conference of the Parties (COP5) of theUnited Nations Framework Convention onClimate Change (UNFCCC), St. Lucia becamethe first nation to announce its intention totransform its energy systems to a fossil-fuel-free base to the extend possible, and become asustainable energy demonstration country forthe rest of the world.
The US based organisations Climate Instituteand Counterpart International are assisting theMinistry of Finance and Planning of theGovernment of St. Lucia in developing theSustainable Energy Demonstration CountryProject. This is to facilitate St. Lucia becomingindependent of importing fossil fuel andtransform its energy base to systems based onrenewable and energy efficient systems.
At the request from the St. LucianGovernment, working with the Island Statesstakeholders and a team of internationalexperts, the Climate Institute intends todevelop a comprehensive Sustainable EnergyPlan for St. Lucia. The plan shall also quantifythe greenhouse gas offsets as a result of theimplementation of the plan and identify waysto benefit from trading of carbon credits andutilising other international incentives that maybe made available.
The project will result in an action plan withidentification of project opportunities andfinancing schemes. The project will alsoidentify and implement policy reforms,capacity building and awareness activities. TheSustainable Energy Plan for St. Lucia will beintegrated within the National developmentplanning process and use energytransformation measures as a tool forsustainable development. It is expected that bythe end of the year 2000, considerable progress
would have been made and a success storypresented at the COP6 Meeting at Hague inNovember, 2000.
The Sustainable Energy DemonstrationCountry Project will demonstrate that:
► With the necessary technology andpolitical will, nations can achieve energy self-sufficiency, leapfrogging the current fossil fueltechnologies.
► Energy can be used as a tool for sustainabledevelopment and by comprehensive energyplanning, nations can reap the economic andenvironmental benefits of green energypolicies and actions.
► Dramatic reductions in fossil fuel use arepossible and the small island states are takingthe lead in greening their energy systems andmeaningfully participating in the internationalefforts to bring down the GHG emissions.
The overall intention is to pursue all maturerenewable energy technologies with the viewof “greening” the island’s energy mix. In thisregard renewable energy technologies willassist in the following:
► diversification in the national energy mix
► reduction of fuel import bills
► reduce reliance of imports
► help insulate the country from futureupheavals in the world market
► promote technological advancement
► help meet Greenhouse gas emissionreductions under the UNFCCC
► demonstrate national commitment to theobjectives of the UNFCCC and the KyotoProtocol
Implementation:
The planning and implementation process willhave the following stages:
Step 1: Negotiation with the GovernmentEnergy Ministry, and the utility to an agreedprogram protocol.
Step 2: Assemble a project team, includingisland states stakeholders, potential investors,funders and experts.
Renewable Energy on Small Islands – Second Edition August 2000 The Caribbean Sea
108
Step 3: Start working to develop the"Sustainable Energy Plan" with the localstakeholders that would be based on currentenergy needs and projections, and wouldinclude the capacity building and publicawareness components.
Step 4: Conduct necessary resourceassessments, feasibility studies and technologyassessments to identify project opportunitiesand facilitate transfer of appropriatetechnologies. Also, some projects will be fasttracked during the planning period to facilitatepublic understanding.
Step 5: Agree on the "Sustainable EnergyPlan" and arrange financial packages to fundthe various components of the Plan with thehelp of private sector, donors and internationalfunding mechanisms. Establish linkages withother regional activities
Step 6: Begin to execute the plan anddemonstrate project as a learning tool for othersmall island states and other developingcountries.
Existing Energy Situation
Energy demand in St. Lucia, like most of thesmall island states in the Caribbean is met bythe importation of refined petroleum productssuch as petroleum, diesel and kerosene. Thedependence on imported energy, coupled witha disproportionately high rate of increase inenergy consumption has serious implicationsfor the island's security of energy supply andbalance of payments position.
All generating capacity in St. Lucia is diesel-powered. The local utility companyLUCELEC is a privately owned company withshares owned by the Government and otherentities. Regulatory reforms were enacted in1994 in which the Public Utilities Commissionwas abolished and a regulatory regime wasestablished whereby LUCELEC is allowed afixed minimum rate of return. LUCELECcurrently has approximately 66 MW ofinstalled capacity, all diesel fired to met a peakdemand of about 44 MW. Currently theresidential customers are getting electricity asa cost of US $0.16/KWh and commercial andindustrial customers at a rate of $0.20/KWh
Over the past ten years, the utility hasexperienced annual growth rates in both salesand demand averaging approximately 10%.LUCELEC recently installed 30 MW of newdiesel based generating capacity and with the
growing demand from the Tourism Industry, itis expected that 31 MW of additional capacitywill be needed over the next eight years.
St. Lucia imports about 95,000 Tons of oilequivalent (TOE), at a cost of some US$25million or 20% of the island's total exportearnings. About 30% of this is used forelectricity generation. The total electricitygenerated in St. Lucia is about 200,000 kWh.
About 90% of households have access toelectricity. There are some 40,000 residentialand 5,000 commercial and industrialcustomers. Annual sales are about 150 GWhper year.
The Ministry of Finance and Planning is thegovernment ministry responsible for thedevelopment of energy policy, programs andprojects while the Ministry ofCommunications, Works and Public Utilitiesoversees the operations of LUCELEC
Renewable Energy Resources andExperiences
Solar energy:
St. Lucia is blessed with an abundant amountof sunlight. However, only a limited use ofsolar applications can be found. The high costof heating water using electricity is causing anincreasing number of domestic andcommercial consumers to switch to solar waterheating. Government has encouraged thisthrough the removal of both duty andconsumption tax on solar heating units and oncomponents used in their manufacture. Manyof these heaters are seen on newer buildingsand mainly in the city of Castries andsurrounding areas. It is expected that thewaiver of consumption tax and import duty onall renewable technologies will further increasethe use of solar and other renewabletechnologies.
There is a need to determine: What levels ofincentives are economically justified? Andwhat exactly are the economic benefits of solarwater heating?
Although most of the population (90-95%) hasaccess to electricity, there is a large rural areaand some communities that are far from theelectric grid. Solar electricity for waterpumping, lighting and other uses can play auseful role in these areas.
Renewable Energy on Small Islands – Second Edition August 2000 The Caribbean Sea
109
Photovoltaic (PV) lighting systems have beeninstalled on four storm shelters with Italian/UNTrust Fund assistance as a demonstration ofrenewable technologies. About 70 additionalstorm shelters that are either not connected tothe grid or would lose electricity in the eventof a storm are in need of this emergencyassistance. Most of these shelters are located inschools and churches.
The greatest potential for crop drying bysunlight is for the drying of ginger and otherspices such as clove, nutmeg, cinnamon, chive,thyme and peppers. Solar energy is also usedfor drying cocoa beans and coconuts by openexposure to the sun. There are a number oflocally built solar dryers - wire baskets orcabinet dryers, but their use is on the decline.There is a need for the development of cheapand durable dryers.
Incentives are also necessary to encouragesmall businesses to produce dried fruitespecially for the tourism market, which wouldcreate a market for these dryers.
Wind Energy:
Studies in St. Lucia suggest that areas ofmoderately high speed exists on the islandespecially on the exposed locations on thewindward coat of the island, and in particularat the northern and southern extremities, wherethe prevailing wind flow has been divertedaround the central mountain range.
The Government of Saint Lucia and the SaintLucia Windpower JV, a joint venture companyformed by Probyn Company of Toronto,Canada and York Windpower of Montreal,Canada has completed an assessment of windpotential near the Eastern Coast of the island.Based on the results of this one-yearcontinuous wind resource assessment, thegovernment has submitted a proposal toconstruct a 13.5 MW wind farm to the localutility.
The local utility LUCELEC has expressedinterest in purchasing power from wind,provided that the cost of power is belowexisting variable costs (i.e. the fuel cost ofgeneration), and that no investment by theutility is required.
The introduction of this renewable energysource will likely require developmentalsupport.
Geothermal Energy:
Geothermal energy may be St. Lucia'sprincipal renewable energy resource. Severalexploration programs have been carried outduring the last two decades, funded by U.S.and European companies and the UnitedNations. The drilling explorations haveconfirmed the presence of a geothermalresource capable of supplying electricity to thenational grid. However, no adequatedetermination of feasibility is currentlyavailable.
Advantage is being taken of improvements ingeothermal technology to conduct areassessment of the potential resource, whichshould be completed by October 1999.
Biomass:
St. Lucia is mainly an agricultural country.There are many forms of biomass usedincluding charcoal, firewood and agriculturalproducts such as coconut shells. In 1996, itwas estimated that 8,276 tonnes of biomasswere consumed.
20% of the land in St. Lucia is uncultivatedmarginal land or scrublands suitable only forforests. According to a study conducted by theUniversity of the West Indies, there is apotential to supply a fuel demand of up to24,000 families or nearly 144,000 people.Proper management and technical assistance isneeded to develop pilot schemes.
Concerns over deforestation associated withthe consumption of charcoal and firewood hasseen a decline in the promotion of this sourceof energy.
In an effort to promote the sustainableexploitation of forest covers, government hasestablished a few "fuel farms" planted with fastgrowing leucaena trees, which are harvestedunder controlled conditions.
Contact Information
Organisation: Ministry of Financing and PlanningAddress: P.O. Box 709
CastriesSt. Lucia
Tel.: +758 4518746Fax: +758 4522506E-mail:Internet:
Renewable Energy on Small Islands – Second Edition August 2000 The Caribbean Sea
110
Organisation: Climate InstituteAtt. Nasir Khattak
Address: 333 1/2 Pennsylvannia AveS.E., Washington, D.C.USA
Tel.: +1 202-547-0104Fax: +1 202-547-0111E-mail: [email protected]: www.climate.org
References:
CREDP, 2000
Climate Institute, 2000
Corbin, 1999
SIDSnet (www.sidsnet.org)
Renewable Energy on Small Islands – Second Edition August 2000 The Caribbean Sea
111
St. Vincent and the Grenadines
General Information
Population: 181,188 (2000 estimate)
Area (km2): 389
Saint Vincent and the Grenadines lies south ofSaint Lucia and north of Grenada. The largestof the Grenadines include Bequia, Canouan,Mustique, Mayreau, and Union. The total areais 389 km2, of which the island of SaintVincent constitutes 344 km2.
Electricity Capacity
Installed Electricity Capacity by Source in1998:
Source InstalledCapacity
Percentage ofTotal InstalledCapacity
Thermal Plants 18 MW 76.3%Hydro Power 5.6 MW 23.7%Source: CREDP, 2000
Electricity Production
Electricity Production by Source in 1997:
Source Percentage of Total ProductionThermal Plants 67.2%Hydro Power 32.8%Source: www.eia.doe.gov/emeu/world/country/cntry_VC.html
Hydropower
St. Vincent is an island blessed with highrainfall in the interior mountain slopes, and is acurrent user of hydropower. Two plants are inoperation, the South River and the CumberlandRiver power stations. The South River turbineis to be upgraded, but there will not be anylarge increase in yield.
Renewable Energy Potential
There has been interest in wind energy and PVon the Grenadines Islands for some time,though not in a systematic way.
Solar Water Heaters:
There is a limited use of solar water heaters.Solar water heaters are offered by majorappliance dealers, but their costs make themunattractive when compared with electricshower heads. There has never been anyattempt at local manufacture, no doubt because
of the perception of unfavourable economics.None the less, the potential for solar waterheating is good, due to the high electricitytariff. However, it is not likely to winwidespread acceptance unless it is part of anational campaign to use renewable energies.
PV:
PV are used on boats and navigational aids, aswell as use in radio repeater stations. However,even for supplying the remote islands, the useof this technology has not spread. Duty freeconcessions are available, but they have to beapplied for on a case by case basis, making itan expensive and time consuming process toimport the panels.
Wind Power:
Historically, the Government did show someinterest in wind power, especially for theGrenadine Islands. Though the wind speeds aremore than adequate, it has been difficult to getany project going, even in the Grenadines.
Biomass:
Apart from past use of bagasse in the now shutdown sugar factory, and the use of charcoal inthe interior farms and small settlements,biomass is not used in the country.
Biogas:
Biogas has been effectively used in St. Vincentby farmers in the high mountains to providefuel for domestic use and for the fertiliser by-product. However, its use is not widespread.
Geothermal Power:
There is an active volcano on St. Vincent, andthe Government has been approached byAmerican financiers interested in exploitingthis possible resource. However, theGovernment was unhappy about thecontractual details and did not pursue thematter. It remains a distant possibility.
Summary Regarding Potential:
There is a low level of awareness of thepotential of renewable energy. The renewableenergy in greatest use is hydropower, and thishas been so for such a long time that it isalmost considered a conventional source. Windpower is capable of contributing to the nationaldemand, and some additional hydropowercould be developed if oil prices rise to a level
Renewable Energy on Small Islands – Second Edition August 2000 The Caribbean Sea
112
which makes development of additionalsources economic. Wind and solar (thermaland PV) could be useful in the GrenadinesIslands if the systems are properly designed.
The Caribbean islands, and St. Vincent inparticular, may lose an opportunity if they donot develop wind farms while turbines in the5-600 kW range are still available, as thecurrent trend is to larger machine sizes. Usingmore of smaller machines will result in a moreuniform output of power form the windfarm(s). The use of very large machines maybe unfeasible in some small islands.
Policy
There is no specific national energy policy. Inthe national strategic plan, energy is notmentioned as an issue.
Main Barriers
The main issue is the absence of a nationalenergy policy, which might guide energyinvestments in St. Vincent and the Grenadines.The next issue of importance is that privatepower producers should be allowed to connectto the grid.
Contact Information
Organisation: St. Vincent Electricity Services Ltd.Address: P.O. Box 856
KingstownSt. Vincent
Tel.: +1 784-456-1701Fax: +1 784-456-2436E-mail:Internet:
Organisation: Ministry of Communications andWorks
Address: Halifax StreetKingstownSt. Vincent
Tel.: +1 784-456-1111Fax: +1 784-456-2168E-mail:Internet:
References
CREDP, 2000
Homepage of US Energy InformationAdministration (www.eia.doe.gov)
Renewable Energy on Small Islands – Second Edition August 2000 References
113
References
ADEME Reunion, Energy Profile 1997, 1998
ADEME Reunion, Situation Energetique 1998 DE L ILE DE LA REUNION, 1999
AREAM (Agência Regional da Energia e Ambiente da Região Autónoma da Madeira); RegionalEnergy Resources in Madeira, Paper presented at the 2nd Interparliamentary Meeting on RenewableEnergy Sources in the EU, Madeira, 12-13th of May, 2000a
AREAM (Agência Regional da Energia e Ambiente da Região Autónoma da Madeira); RegionalEnergy Resources in Madeira, Power Point presentation at the 2nd Interparliamentary Meeting onRenewable Energy Sources in the EU, Madeira, 12-13th of May, 2000b
Bal, J. L. et al; The Development of Renewable Energy Sources for Electricity Generation: theExample of the French Overseas Department and Corsica, Proceedings, Island Solar Summit, pp. 119-124, 1999
CREDP (Caribbean Renewable Energy Development Project), Volume II: Country Reports; Project-Consult for Caribbean Energy Information System (CEIS), 2000
CEEETA (Centro de Estudos em Economia da Energia dos Transportes e do Ambiente); Potentials ofEuropean Solar Thermal Energy Technologies in Cabo Verde – Guide of Investment Opportunities inCabo Verde, 1997a
CEEETA (Centro de Estudos em Economia da Energia dos Transportes e do Ambiente); Promotion ofEnergy Efficient Technologies Matching with Islands and Ultra-Peripheral Regions Specificities,1997b
Cheatham, Christopher; Samoan Power is on the Move, Pacific Power, Volume 5, Number 2, pp. 14-17, 1997
Climate Institute; Sustainable Energy Demonstration Country Project – St. Lucia, Draft, July 2000
Corbin, Christopher; St. Lucia, Proceedings from the Global Conference on Renewable EnergyIslands, Forum for Energy and Development (FED), pp. 175-178, 1999
Courier, The; Europe in the North Atlantic, no. 176, pp. 15-16, July-August, 1999
Davidson, Ros; Island Aid for More Wind, Windpower Monthly, April, pp. 34, 1999a
Davidson, Ros; Alaska Boom for Remote Applications, Windpower Monthly, volume 15, no. 7, July,pp. 38-39, 1999b
DBSA & ISES; Assessing the Integrated Regional Potential for the Widespread Introduction andApplication of Appropriate Renewable Energy Technologies within SADC, 1999
DG Development; Kiribati – Solar Energy for the Outer Islands, Project identification sheet, EuropeanCommission, 1999
Donizeau, D.; Present Situation in the European Islands – French Overseas Areas, Paper presented atthe workshop Dissemination of the Advanced Control Technologies and SCADA Systems for theIsolated Power Networks with Increased use of Renewable Energies, Corsica, March 2000
EDA (Electricidade dos Azores), Relatório e Contas 1998, 1999
EDF (Electricité de France); EDF and Renewable Energies, 1998
Renewable Energy on Small Islands – Second Edition August 2000 References
114
Fernandes, Mário Jardim et al; The use of Renewable Energies at Madeira Island for ElectricalPower Production, Paper presented at the workshop Dissemination of the Advanced ControlTechnologies and SCADA Systems for the Isolated Power Networks with Increased use of RenewableEnergies, Corsica, March 2000
Ellis, Maurry & Solomone Fifita; Greenhouse Gas Mitigation in the PICCAP Countries, Prepared forSouth Pacific Regional Environment Programme (SPREP), 1999
Energy and Environment Projects on Gotland; Gotland’s Energy Agency, 2000
Fernandes, Mário Jardim et al; The use of Renewable Energies at Madeira Island for ElectricalPower Production, paper presented at the workshop Dissemination of the Advanced ControlTechnologies and SCADA Systems for the Isolated Power Networks with Increased use of RenewableEnergies, Corsica, March 2000
Ferrari, Laurent; Welcome Address, paper presented at the workshop Dissemination of the AdvancedControl Technologies and SCADA Systems for the Isolated Power Networks with Increased use ofRenewable Energies, Corsica, March 2000
Forum für Zukunftsenergien; Energy Supply on the Basis of Renewable Energy Sources Using theExample of the North Sea Island Pellworm, 1997
Gillett, Bill & Wilkins, Gill; Solar so Good – An EC-funded Solar Utility Succeeds in Kiribati, TheCourier, no. 177, pp. 5-7, October-November 1999
Gonzalez, Sinda Hernandez; Canary Islands – The Strategies, Renewable Energy Islands in Europe,Proceedings from the European Seminar on Renewable Energy Islands, Energy Centre Denmark, pp.23-24, 1998
Gotlands Kommun; Renewable Energy Sources for Europe – The Campaign for Take-off.Application to the 100 Renewable Communities Programme, Preliminary Draft, 2000
Gulias, Antonio Lopez; Renewable Energy Sources in the Canary Islands, Proceedings, Island SolarSummit, pp. 93-98, 1999
Hansen, Jens Carsten; High Penetration of Wind Energy in the Cape Verde Islands, RenewableEnergy Islands in Europe, Proceedings from the European Seminar on Renewable Energy Islands,Energy Centre Denmark, pp. 32-35, 1998
Hawaii Energy Strategy 2000, State of Hawaii, Department of Business, Economic Development andTourism, Energy, Resources and Technology Division, January 2000
Hebrad, Louis Gerard; Mauritius Country Presentation, Proceedings from the Global Conference onRenewable Energy Islands, Forum for Energy and Development (FED), pp. 35-40, 1999
Ince, David; Development of Solar Water Heating and other Renewable Energy Technologies inBarbados, Proceedings from the Global Conference on Renewable Energy Islands, Forum for Energyand Development (FED), pp. 29-34, 1999
IEDOM (Institut d'Emission des Départements d'Outre-Mer), La Reunion en 1998, 1999
Johansson, Ulf; Renewable Energy and the Impact on Local Economy on Gotland, pp. 18-20,Renewable Energy Islands in Europe, Proceedings from the European Seminar on Renewable EnergyIslands, Energy Centre Denmark, 1998
Johnsen, Aage; Samsoe – The Danish Renewable Energy Island, Renewable Energy Islands inEurope, Proceedings from the European Seminar on Renewable Energy Islands, pp. 15-17, 1998
Renewable Energy on Small Islands – Second Edition August 2000 References
115
Johnsen, Aage & Soeren Hermansen; Samsoe, Denmark’s Renewable Energy Island – Goals, Statusand Examples, Proceedings from the Global Conference on Renewable Energy Islands, Forum forEnergy and Development (FED), pp. 77-78, 1999
Juaneda, Antoni & Cipriano Marin; Renewable Energy Plan of the Minorca Island, Proceedings,Island Solar Summit, pp. 115-118, 1999
Kassinis, Solon; Utilization of Solar Energy - The Case of Cyprus, Proceedings, Island Solar Summit,pp. 187-190, 1999
Kaya, Maurice; The Status of Renewable Energy Development in the Hawaiian Islands, USA,Proceedings from the Global Conference on Renewable Energy Islands, Forum for Energy andDevelopment (FED), pp. 45-49, 1999a
Kaya, Maurice; The Status of Renewable Energy Development in the Hawaiian Islands, USA, PowerPoint presentation at the Global Conference on Renewable Energy Islands, 15-16th September 1999,1999b
Klima 2012; Status og Perspektiver for Dansk Klimapolitik, Miljø- og Energiministeriet, marts 2000
Marin, Cipriano; Renewable Energy Plan for the Island of Minorca, Proceedings from the EuropeanSeminar on Renewable Energy Islands, Energy Centre Denmark, pp. 47-48, 1998
McKenna, Ed & Timothy L. Olsen; Performance and Economics of a Wind-Diesel Hybrid EnergySystem: Naval Air Landing Field, San Clemente Island, California, National Renewable EnergyLaboratory (NREL), 1999
Mendes, Jose Melim; Renewable Energy on Madeira, Renewable Energy Islands in Europe,Proceedings from the European Seminar on Renewable Energy Islands, Energy Centre Denmark, pp.21-22, 1998
Morales, Javier; Fully Supply for El Hierro by means of Renewable Enegies, Proceedings, IslandSolar Summit, pp. 125-127, 1999
Mirrow, Fiona; Thursday Island Wind Project – The First Year of Operation, Paper presented by Mr.Glenn Walden at the 1999 Australian Wind Energy Conference, 1999
Narayan, Prinesh; Fiji Department of Energy – Renewable Energy Program, Proceedings from theGlobal Conference on Renewable Energy Islands, Forum for Energy and Development (FED), pp. 131-135, 1999
Nation, Mike; A New Cap for Afulilo, Pacific Power, Volume 5, Number 2, pp. 18-19, 1999
Ngalu, Francis; Electrification of Rural Areas using Solar PV System – The Kiribati Experience,Proceedings from the Global Conference on Renewable Energy Islands, Forum for Energy andDevelopment (FED), pp. 141-147, 1999
News from Tanadgusix Corporation; Tanadgusix Corporation Installs Wind Power Project on SaintPaul Island, November 24, 1998
Oliveira, Filipe; Insular Context of Renewable Energies – The Madeira Case, Proceedings, IslandSolar Summit, pp. 151-152, 1999
Pacific Islands Report; European Union to Fund multi-Million Dollar Kiribati Solar Energy Project,July 23rd, 1999
Pacific Power; ENERCAL Moves into New Power System, Volume 7, Number 3, pp. 19, 1999
Prasad, S. B.; Energy Resources and Consumption in Fiji – An Overview, The South Pacific Journalof Natural Sciences, special volume, vol., 17, pp. 19-23, 1999
Renewable Energy on Small Islands – Second Edition August 2000 References
116
Rettenmeier, Christine; Islands in the Doldrums, New Energy, no. 2, pp. 44, 1999
Samsoe Energy and Environmental Office; Samsoe – Denmark’s Renewable Energy Island, 2000
Samsoe Energy Company; Annual Report 1999, Homepage of Samsoe Energy Company(http://www.samso.net/firma/ve/uk/index.htm), 2000
Saddul, Prem; Using Renewable Sources in the Mascarene Islands: Problems, Policy and Challenges,Proceedings, Island Solar Summit, pp. 79-86, 1999
Seidelin, Ide; Renewable Energy on Aeroe, Denmark, Proceedings from the Global Conference onRenewable Energy Islands, Forum for Energy and Development (FED), pp. 55-58, 1999
Seifert, Gary; Ascension Island Wind-Diesel System – Saving Fuel and Reducing Pollution,Presentation at WINDPOWER 1997
Tujeehut, Ir. K.; Wind Energy Development in Curacao, Paper presented at Carilec EngineersConference, 1997
Torre, M. C. et al; Integration Limit of Wind Turbines Generator in an Islander Electrical Grid CaseStudy of Corsica, 1999 European Wind Energy Conference, Proceedings, pp. 923-926, 1999
Torres, Honorato Lopez; Full Supply for El Hierro by Means of Renewable Energies, RenewableEnergy Islands in Europe, Proceedings from the European Seminar on Renewable Energy Islands,Energy Centre Denmark, pp. 25-26, 1998
Van de Velde, Myfanwy; Western Samoa-EU Cooperation Focus on Utilities, Courier, No. 159, pp.43-44, 1996
Viveiros, Duarte Manuel; Renewable Energies and SCADA Systems in Electricidade Azores EDAS.A., Pourtugal, paper presented at the workshop Dissemination of the Advanced Control Technologiesand SCADA Systems for the Isolated Power Networks with Increased use of Renewable Energies,Corsica, March 2000
Vital, Sylvester; Renewable Energy – Commonwealth of Dominica, Proceedings from the GlobalConference on Renewable Energy Islands, Forum for Energy and Development (FED), pp. 127-130,1999
Window, The; The World’s First Wind-Diesel Project, Vestas, pp. 13, July 1999
Wind Energy Plant Tera Cora; Technical Sheet of THERMIE Project Renewables – Wind Power(RWI-7), CORDIS Database (http://www.cordis.lu/opet/fiches/rwe-7.htm)
Wind Energy Weekly; Alaskan Company Using Village Power Concepts to Prove Wind’s Viability,Vol. 17, #829, 28 December 1998
Windpower for Curacao; CADDET database (http://www.caddet ee.org/register/datare/CCR02142.htm), 1999
Windpower Monthly, September, pp. 17, 1998
Windpower Monthly, August, pp. 16, 1999
Worldbank; Cape Verde Energy and Water Sector Reform and Development Project (CVPE40990),1999
Zervos, Arthouros et al; Implementation Plan for the Large Scale Development of Renewable EnergySources in Crete, Renewable Energy Sources in the Canary Islands, Proceedings, Island Solar Summit,pp. 99-106, 1999
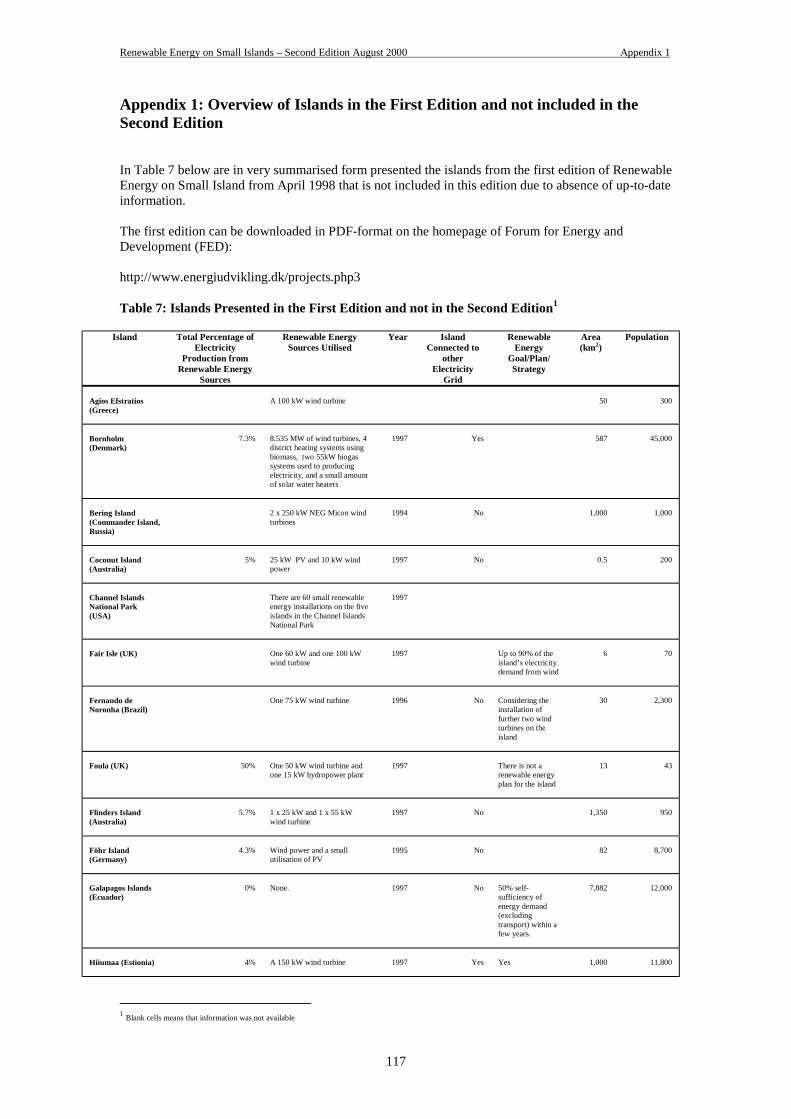
Renewable Energy on Small Islands – Second Edition August 2000 Appendix 1
117
Appendix 1: Overview of Islands in the First Edition and not included in theSecond Edition
In Table 7 below are in very summarised form presented the islands from the first edition of RenewableEnergy on Small Island from April 1998 that is not included in this edition due to absence of up-to-dateinformation.
The first edition can be downloaded in PDF-format on the homepage of Forum for Energy andDevelopment (FED):
http://www.energiudvikling.dk/projects.php3
Table 7: Islands Presented in the First Edition and not in the Second Edition1
Island Total Percentage ofElectricity
Production fromRenewable Energy
Sources
Renewable EnergySources Utilised
Year IslandConnected to
otherElectricity
Grid
RenewableEnergy
Goal/Plan/Strategy
Area(km2)
Population
Agios Efstratios(Greece)
A 100 kW wind turbine 50 300
Bornholm(Denmark)
7.3% 8.535 MW of wind turbines, 4district heating systems usingbiomass, two 55kW biogassystems used to producingelectricity, and a small amountof solar water heaters
1997 Yes 587 45,000
Bering Island(Commander Island,Russia)
2 x 250 kW NEG Micon windturbines
1994 No 1,000 1,000
Coconut Island(Australia)
5% 25 kW PV and 10 kW windpower
1997 No 0.5 200
Channel IslandsNational Park(USA)
There are 60 small renewableenergy installations on the fiveislands in the Channel IslandsNational Park
1997
Fair Isle (UK) One 60 kW and one 100 kWwind turbine
1997 Up to 90% of theisland’s electricitydemand from wind
6 70
Fernando deNoronha (Brazil)
One 75 kW wind turbine 1996 No Considering theinstallation offurther two windturbines on theisland
30 2,300
Foula (UK) 50% One 50 kW wind turbine andone 15 kW hydropower plant
1997 There is not arenewable energyplan for the island
13 43
Flinders Island(Australia)
5.7% 1 x 25 kW and 1 x 55 kWwind turbine
1997 No 1,350 950
Föhr Island(Germany)
4.3% Wind power and a smallutilisation of PV
1995 No 82 8,700
Galapagos Islands(Ecuador)
0% None. 1997 No 50% self-sufficiency ofenergy demand(excludingtransport) within afew years.
7,882 12,000
Hiiumaa (Estionia) 4% A 150 kW wind turbine 1997 Yes Yes 1,000 11,800
1 Blank cells means that information was not available
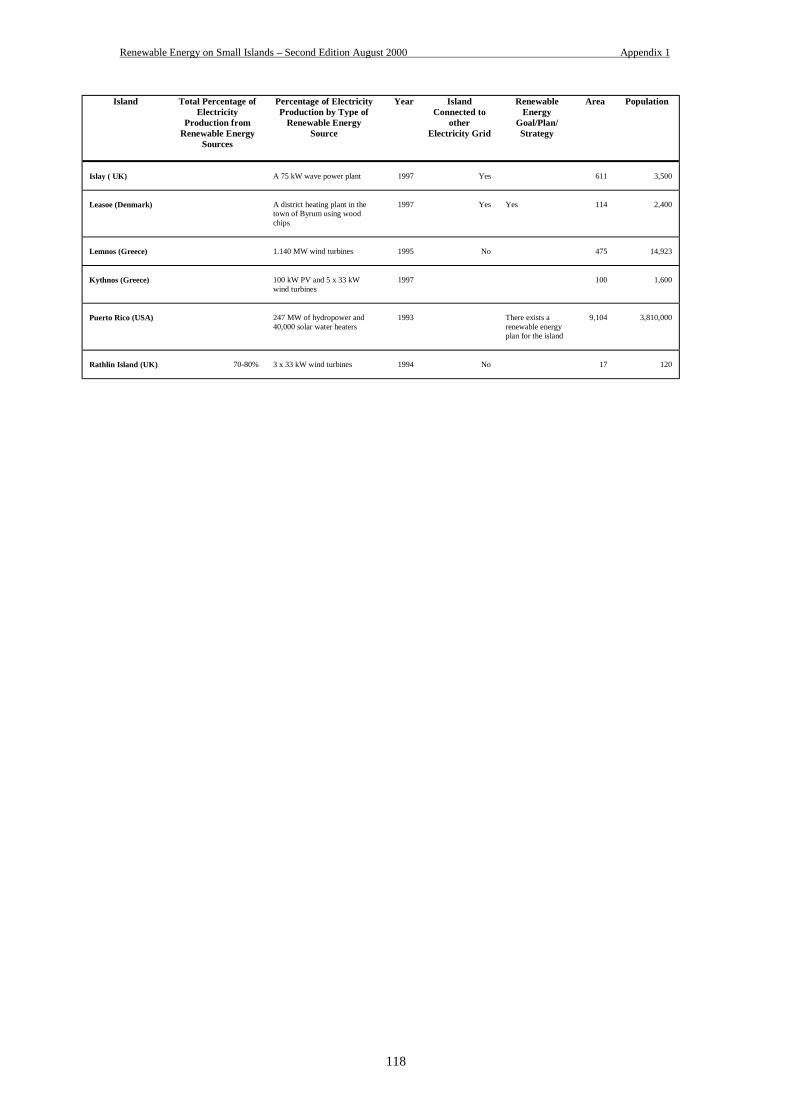
Renewable Energy on Small Islands – Second Edition August 2000 Appendix 1
118
Island Total Percentage ofElectricity
Production fromRenewable Energy
Sources
Percentage of ElectricityProduction by Type of
Renewable EnergySource
Year IslandConnected to
otherElectricity Grid
RenewableEnergy
Goal/Plan/Strategy
Area Population
Islay ( UK) A 75 kW wave power plant 1997 Yes 611 3,500
Leasoe (Denmark) A district heating plant in thetown of Byrum using woodchips
1997 Yes Yes 114 2,400
Lemnos (Greece) 1.140 MW wind turbines 1995 No 475 14,923
Kythnos (Greece) 100 kW PV and 5 x 33 kWwind turbines
1997 100 1,600
Puerto Rico (USA) 247 MW of hydropower and40,000 solar water heaters
1993 There exists arenewable energyplan for the island
9,104 3,810,000
Rathlin Island (UK) 70-80% 3 x 33 kW wind turbines 1994 No 17 120
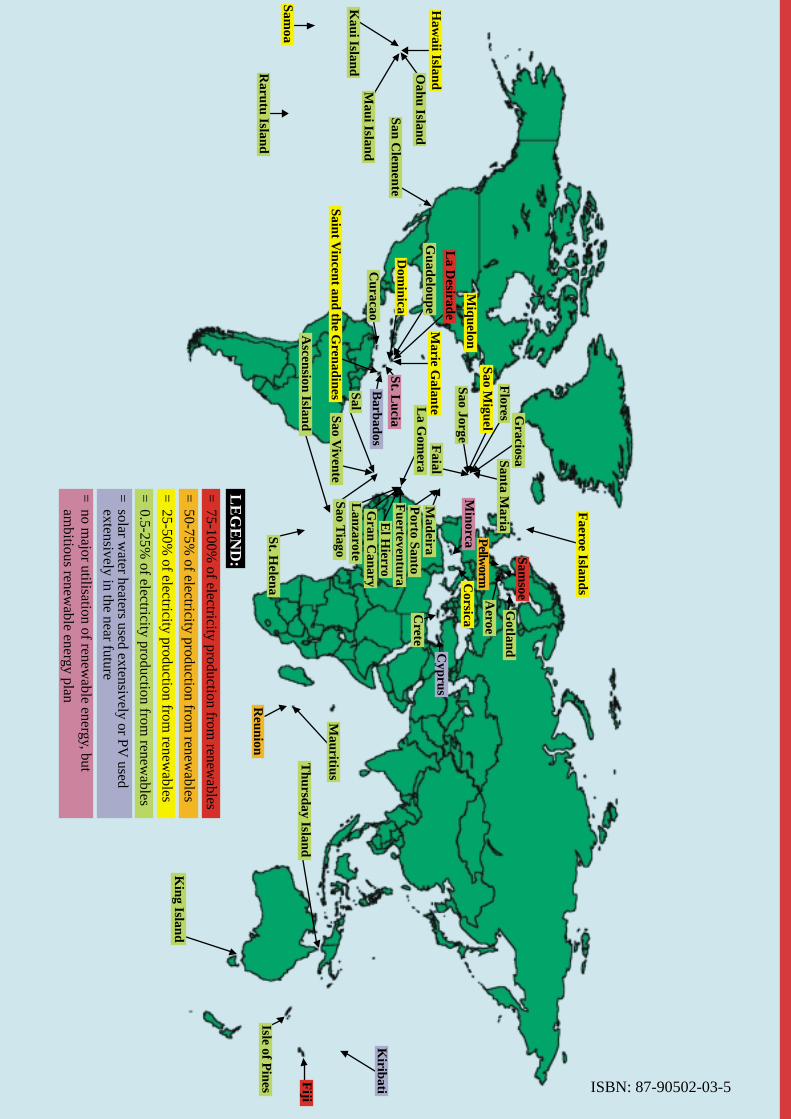
LE
GE
ND
:
=75-100%
of electricity production from renew
ables
=50-75%
of electricity production from renew
ables
=25-50%
of electricity production from renew
ables
=0.5-25%
of electricity production from renew
ables
=solar w
ater heaters used extensively or PV used
extensively in the near future
=no m
ajor utilisation of renewable energy, but
ambitious renew
able energy plan
Miquelon
Maui Island
Oahu Island
Haw
aii Island
Kaui Island
Samoa
Rarutu Island
San Clem
enteB
arbadosSt. L
ucia
Marie G
alante
Curacao
Dom
inica
Guadeloupe
La D
esirade
Sao Vivente
Sal
Saint Vincent and the G
renadines
Lanzarote
El H
ierroF
uerteventura
La G
omera
Porto Santo
Madeira
Sao Miguel
GraciosaSanta M
aria
Sao Jorge
Faial
Flores
Minorca
Corsica
Pellworm
Gotland
SamsoeA
eroe
Cyprus
Crete
St. Helena
Gran C
anary
Sao Tiago
Ascension Island
Reunion
Mauritius
Thursday Island
King Island
Isle of Pines F
iji
Kiribati
Faeroe Islands
ISBN: 87-90502-03-5