renewable energy: resources, technology, economics and policies
TRANSCRIPT

1
55thth Capacity Building Programme for Capacity Building Programme for Officers of Electricity Regulatory CommissionsOfficers of Electricity Regulatory Commissions
18 18 –– 19 Oct., 2012, IIT Kanpur &19 Oct., 2012, IIT Kanpur &21 21 –– 23 Oct., 2012, Bangkok23 Oct., 2012, Bangkok
Renewable Energy: Resources, Renewable Energy: Resources, Technology, Economics and PoliciesTechnology, Economics and Policies
Anoop SinghAnoop SinghAssociate Prof.Associate Prof.
Dept of Industrial and Management Dept of Industrial and Management EnggEngg..IIT KanpurIIT Kanpur
Electricity Consumption and Electricity Consumption and Economic GrowthEconomic Growth
Sweden14000
16000
OECD
Australia
Germany
Japan
Korea
Russian Federation
Saudi Arabia
Swede
United States
6000
8000
10000
12000
14000
Ele
ctri
city
m
pti
on p
er c
apit
a(k
Wh
)
World
Asia Latin AmericaAfrica
Argentina
Bangladesh
BrazilPeople's Rep. of China
IndiaIndonesia
Malaysia
United Kingdom
0
2000
4000
6000
0 5000 10000 15000 20000 25000 30000 35000 40000
Con
su
Per Capita GDP (USD PPP)
2
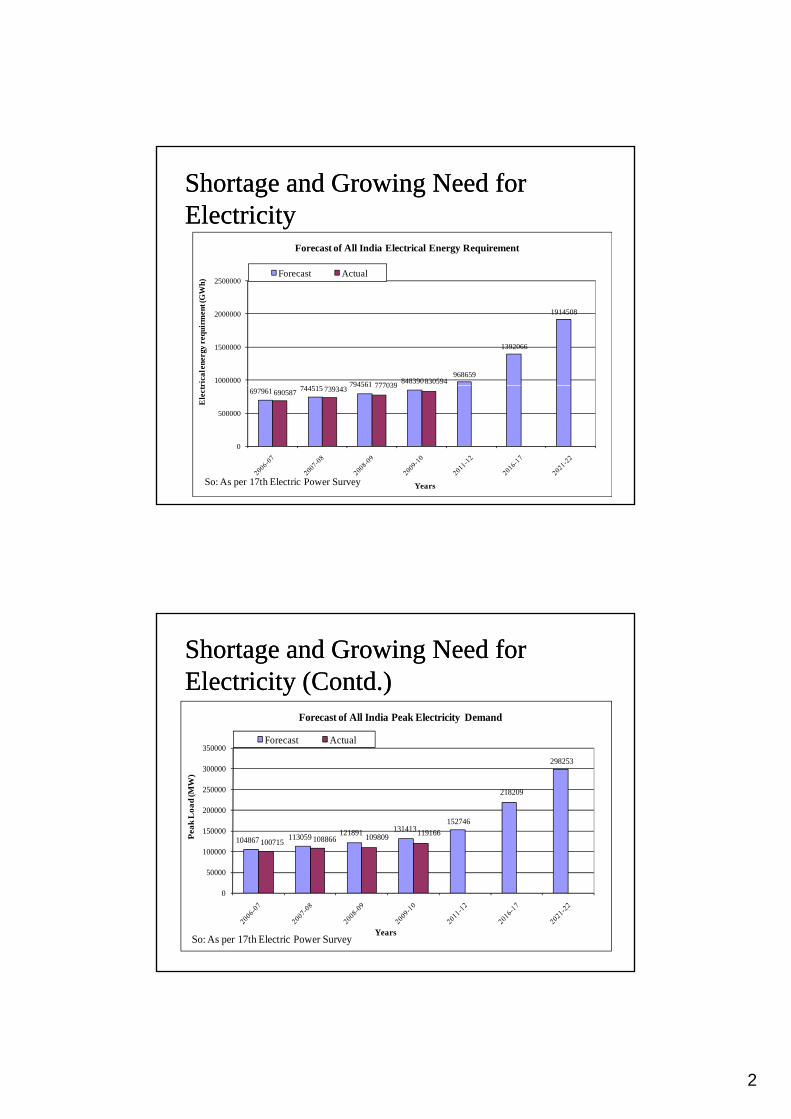
Shortage and Growing Need for Shortage and Growing Need for ElectricityElectricity
Forecast of All India Electrical Energy Requirement
794561 848390968659
1392066
1914508
777039 8305941000000
1500000
2000000
2500000
rica
l ene
rgy
requ
irm
ent (
GW
h)
Forecast Actual
697961 744515 794561690587 739343 777039
0
500000
Ele
ctr
YearsSo: As per 17th Electric Power Survey
Shortage and Growing Need for Shortage and Growing Need for Electricity (Contd.)Electricity (Contd.)
Forecast of All India Peak Electricity Demand
104867 113059 121891 131413152746
218209
298253
100715 108866 109809 119166
100000
150000
200000
250000
300000
350000
Pea
k L
oa
d (M
W)
Forecast Actual
0
50000
100000
YearsSo: As per 17th Electric Power Survey

3
India’s Energy ResourcesIndia’s Energy Resources
India’s Energy ResourcesIndia’s Energy Resources

4
Oil Oil -- Reserves to production ratios in Reserves to production ratios in 2008 (Source: WEC SER)2008 (Source: WEC SER)
Domestic Consumption and Domestic Consumption and Production of Crude OilProduction of Crude Oil

5
Top ten hard coal producers and Top ten hard coal producers and importers importers –– 2008 (So: IEA)2008 (So: IEA)
Projections for Total Primary Projections for Total Primary Commercial Energy RequirementsCommercial Energy Requirements
•• TPCES 1 TPCES 1 -- Falling EnergyFalling Energy--GDP GDP elasticitieselasticities
•• TPCES 2 TPCES 2 –– Constant EnergyConstant Energy--GDP GDP elasticitieselasticities
Almost four times growth!

6
Projections for Electricity DemandProjections for Electricity DemandPolicy and Regulatory
Regime to attract investmentinvestment
Demand Scenario for Petroleum Demand Scenario for Petroleum ProductsProducts
7
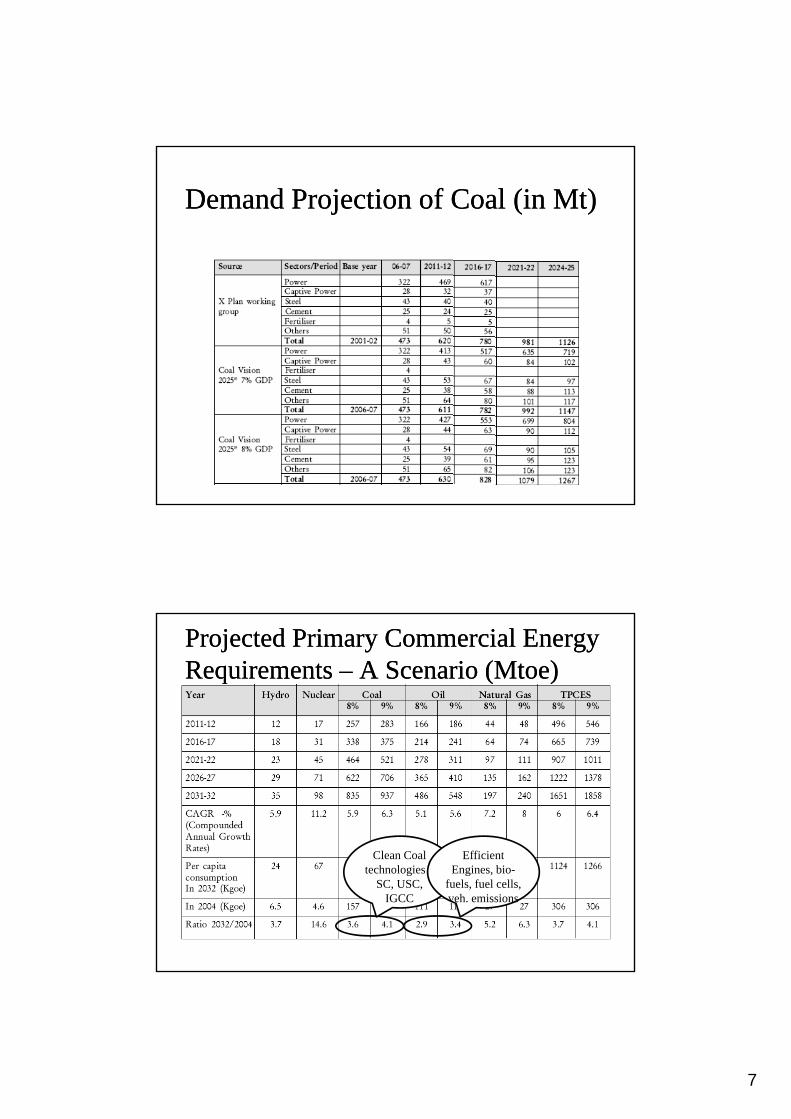
Demand Projection of Coal (in Mt)Demand Projection of Coal (in Mt)
Projected Primary Commercial Energy Projected Primary Commercial Energy Requirements Requirements –– A Scenario (A Scenario (MtoeMtoe))
Cl C l Effi i tClean Coal technologies –
SC, USC, IGCC
Efficient Engines, bio-
fuels, fuel cells, veh. emissions
8
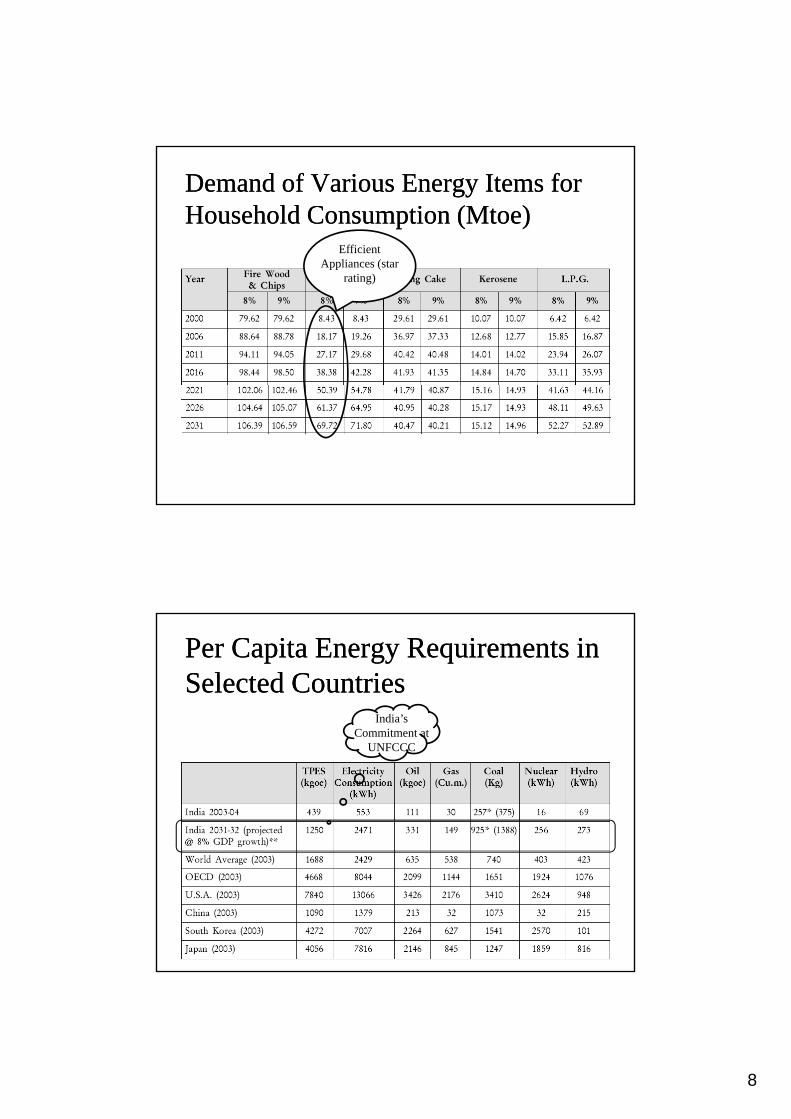
Demand of Various Energy Items for Demand of Various Energy Items for Household Consumption (Household Consumption (MtoeMtoe))
Efficient Appliances (starAppliances (star
rating)
Per Capita Energy Requirements in Per Capita Energy Requirements in Selected CountriesSelected Countries
India’s Commitment atCommitment at
UNFCCC
9
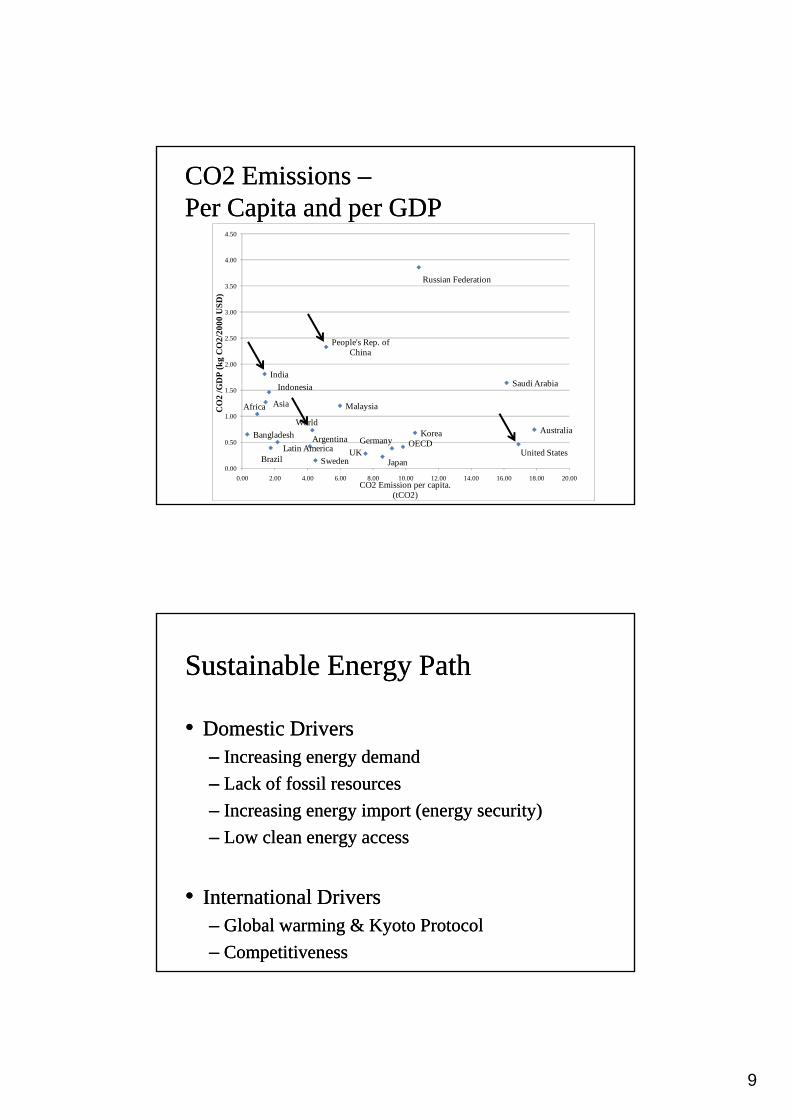
CO2 Emissions CO2 Emissions ––Per Capita and per GDPPer Capita and per GDP
4.00
4.50
People's Rep. of China
India
I d i
Russian Federation
Saudi Arabia
2.00
2.50
3.00
3.50
GD
P(k
g C
O2/
2000
US
D)
World
OECD
Asia
Latin America
Africa
ArgentinaAustraliaBangladesh
Brazil
Germany
Indonesia
Japan
Korea
Malaysia
Saudi Arabia
SwedenUK United States
0.00
0.50
1.00
1.50
0.00 2.00 4.00 6.00 8.00 10.00 12.00 14.00 16.00 18.00 20.00
CO
2/G
CO2 Emission per capita.(tCO2)
Sustainable Energy PathSustainable Energy Path
•• Domestic DriversDomestic DriversDomestic DriversDomestic Drivers–– Increasing energy demandIncreasing energy demand
–– Lack of fossil resources Lack of fossil resources
–– Increasing energy import (energy security)Increasing energy import (energy security)
–– Low clean energy accessLow clean energy access
•• International DriversInternational Drivers–– Global warming & Kyoto ProtocolGlobal warming & Kyoto Protocol
–– CompetitivenessCompetitiveness

10
Sustainable Energy Policy OptionsSustainable Energy Policy Options
•• Stimulate Green InvestmentStimulate Green InvestmentStimulate Green InvestmentStimulate Green Investment–– FiTFiT, RPO, REC, RPO, REC
•• Address Distortions in Energy PricingAddress Distortions in Energy Pricing–– Encourage energy conservationEncourage energy conservation
•• Address Environmental ExternalitiesAddress Environmental ExternalitiesChi h i h fl h SC h lChi h i h fl h SC h l–– Chimney height, fly ash use, SC technologyChimney height, fly ash use, SC technology
•• Enhance Energy EfficiencyEnhance Energy Efficiency–– Star Labeling, PAT SchemeStar Labeling, PAT Scheme

11
Renewable Energy Resources Renewable Energy Resources ––Technological ChallengesTechnological Challenges
•• Increasing PV efficiencyIncreasing PV efficiencyIncreasing PV efficiencyIncreasing PV efficiency
•• Cost effective power electronicsCost effective power electronics
•• Energy Storage Energy Storage –– Fuel CellsFuel Cells
•• High capacity offshore windHigh capacity offshore wind
•• Grid IntegrationGrid Integration•• Grid IntegrationGrid Integration
•• Generation ForecastingGeneration Forecasting
•• (New Business Models (New Business Models –– ReplicabilityReplicability, , Scalability Challenges)Scalability Challenges)
Share of Share of RenewablesRenewables in Electricity Gen.in Electricity Gen.
So: IEA (2010), World Energy Outlook 2010

12
Role of Policy and RegulationRole of Policy and Regulation
Policy Policy –– Low Carbon GrowthLow Carbon Growth
•• Renewable EnergyRenewable EnergyRenewable EnergyRenewable Energy–– Electricity Act Electricity Act –– Renewable Purchase ObligationRenewable Purchase Obligation
–– Renewable Energy Certificates (REC)Renewable Energy Certificates (REC)
•• Energy EfficiencyEnergy Efficiency–– Energy Efficiency StandardsEnergy Efficiency Standards
–– Appliance RatingAppliance Rating
•• National Action Plan for Climate ChangeNational Action Plan for Climate Change–– JN National Solar MissionJN National Solar Mission

13
Wind Energy Map of India
Untapped Wind Potential!Untapped Wind Potential!
•• Hub HeightHub HeightHub HeightHub Height
•• OffOff--shareshare
•• Vertical AxisVertical Axis
•• LBNL Study projects India’sLBNL Study projects India’s onshoreonshore windwind•• LBNL Study projects India s LBNL Study projects India s onshoreonshore wind wind potential to be 2,006,000 MW (3,121,000 potential to be 2,006,000 MW (3,121,000 MW) at 80 m (120 m) hub height!!!MW) at 80 m (120 m) hub height!!!

14
So: Phadke et al. (2012), LBNL
Capacity and Electricity Generation from Capacity and Electricity Generation from Renewable Energy Sources (2008Renewable Energy Sources (2008--09)09)

15
Solar Solar Resources in Resources in I diI diIndiaIndia
Challenge for Harnessing Renewable Challenge for Harnessing Renewable EnergyEnergy
•• ResourcesResourcesResourcesResources
•• TechnologyTechnology
•• FinancingFinancing
•• Policy & RegulationPolicy & Regulation

16
NREL/JapanEnergy
Multijunction ConcentratorsThree-junction (2-terminal, monolithic)Two-junction (2-terminal, monolithic)
Crystalline Si Cells
Spectrolab
Spectrolab
32
36
PV Cell Efficiency (So: LBNL)PV Cell Efficiency (So: LBNL)Ef
ficie
ncy
(%)
BoeingARCO
NREL
Euro-CIS
NREL/Spectrolab
NRELNREL
Energy
Spire
No. CarolinaState University
Crystalline Si CellsSingle crystal
Multicrystalline
Thin Film TechnologiesCu(In,Ga)Se2
CdTeAmorphous Si:H (stabilized)
Emerging PVDye cells
Organic cells(various technologies)
Varian
UNSW
UNSW
ARCO
UNSWUNSW
UNSWSpire Stanford
Westing-house
UNSWGeorgia Tech
Georgia Tech SharpNREL
NREL
UniversitySo. Florida
NREL
NREL
NRELCu(In,Ga)Se2
14x concentration
NREL
16
20
24
28
32
Universityof Maine
Boeing
Boeing
Boeing
BoeingARCOBoeing
200019951990198519801975
RCA
Solarex
Masushita
MonosolarKodak
Kodak
AMETEK
Photon Energy
United Solar
United Solar
RCA
RCARCA
RCARCA
RCA
Solarex
12
8
4
0
University ofLausanne
University ofLausanne
Siemens
2005
Kodak UCSBCambridge
Groningen
University LinzBerkeley
Princeton
UniversityLinz
How to make RE story a success?How to make RE story a success?
•• We have technology butWe have technology butWe have technology, but We have technology, but –– Resources are limited (land, Resources are limited (land, envenv. clearances) . clearances)
and hence to harness)and hence to harness)
–– It is expensive (….costs are coming down)It is expensive (….costs are coming down)
–– It is difficult to get investors to put moneyIt is difficult to get investors to put moneyIt is difficult to get investors to put money It is difficult to get investors to put money into itinto it

17
Need some Carrots (and small sticks)Need some Carrots (and small sticks)
CarrotsCarrots
•• SubsidiesSubsidies
•• FeedFeed--in Tariffsin Tariffs
•• Tax BreaksTax Breaks
S i k !S i k !Sticks!Sticks!
•• Obligation to buy electricity generated Obligation to buy electricity generated from renewable energy resources, from renewable energy resources, Renewable Portfolio ObligationRenewable Portfolio Obligation (RPO)(RPO)
Electricity Act 2003 and Policy Electricity Act 2003 and Policy Framework for Renewable EnergyFramework for Renewable Energy
•• State Electricity Regulatory Commissions (SERCs) State Electricity Regulatory Commissions (SERCs) to to specify a percentage of the total consumption of electricityspecify a percentage of the total consumption of electricityspecify a percentage of the total consumption of electricityspecify a percentage of the total consumption of electricityin the area of a distribution licensee, for purchase of in the area of a distribution licensee, for purchase of electricity from coelectricity from co--generation and renewable energy generation and renewable energy sources (renewable portfolio obligation) (Sec. 81 (1) (e)).sources (renewable portfolio obligation) (Sec. 81 (1) (e)).
•• SERCs to promote coSERCs to promote co--generation and generation of generation and generation of electricity through renewable sources of energy by electricity through renewable sources of energy by providing suitable measures forproviding suitable measures for connectivity with the gridconnectivity with the gridproviding suitable measures for providing suitable measures for connectivity with the grid connectivity with the grid and sale of electricity to any personsand sale of electricity to any persons (Sec. 81 (1) (e)).(Sec. 81 (1) (e)).
•• Terms and conditions for the Terms and conditions for the determination of tariffdetermination of tariff to be to be prescribed by the SERCs to promote coprescribed by the SERCs to promote co--generation and generation and generation of electricity from renewable sources of energy. generation of electricity from renewable sources of energy. (Sec. 61 (h))(Sec. 61 (h))

18
Electricity Act 2003 and Policy Framework Electricity Act 2003 and Policy Framework for Renewable Energy (Contd.)for Renewable Energy (Contd.)
•• National Electricity Policy to be formulated by the National Electricity Policy to be formulated by the central government, in consultation with the statecentral government, in consultation with the statecentral government, in consultation with the state central government, in consultation with the state governments for development of the power system governments for development of the power system based on based on optimal utilization of resources including optimal utilization of resources including renewable sources of energyrenewable sources of energy. (Sec. 3 (1)). (Sec. 3 (1))
•• Central Government to prepare a national policy, in Central Government to prepare a national policy, in l i i h h S Gl i i h h S Gconsultation with the State Governments, consultation with the State Governments,
permitting stand alone systemspermitting stand alone systems (including those (including those based on renewable sources of energy and other based on renewable sources of energy and other nonnon--conventional sources of energy) for rural areas. conventional sources of energy) for rural areas. (Sec. 4) (Sec. 4)
RPO and its Compliance Across RPO and its Compliance Across States (in %)States (in %)
States
RPO Targets RPO Performance
2007-082008-
092009-
10 2010-11 2011-12 2007-08 2008-092009-
10A dhAndhraPradesh#$ 5 5 5 5 5 4.41 3.95 4.06Bihar@ 4 5 6 NADelhi 1 1 1 1 --- --- ---Gujarat 1 2 2 2.07 NA 2.55Haryana 3 5 10 10 10 NA 0.01 5.7
Karnataka 7-10 7-10 7-10 9.83 10.80 11.04Madhya Prad. 10 10 10 10 0.08 0.07 0.06Maharashtra$ 4 5 6 3 35 3 36 4 25Maharashtra$ 4 5 6 3.35 3.36 4.25Orissa 3 3 4 0 0 1.26Punjab 1 1 2 3 4 0.69 0.74 1.49Rajasthan$ 4.88 6.25 7.45 8.50 9.75 2.57 4.90 3.23Tamil Nadu 10 10 11.65 12.08 13.79Uttaranchal 5 5 8 9 10 1.4 1.7 2.18Uttar Pradesh 7.5 7.5 7.5 1.26 2.98 2.97
West Bengal 0.95-3.8 2-4.8 4-6.8 7-8.3 10 NA 0-0.37 0-0.34

19
Discontinuity in prices in the demand Discontinuity in prices in the demand functionfunction
Feed-in-Tariff and Shortfall in RPO Compliance
Wind Energy Tariff Across StatesWind Energy Tariff Across States
4.3Av. Tariff for Wind Energy
37)
4) esh (3.97)
3.5)
.65)
gal (4)
4.08)3.3
3.5
3.7
3.9
4.1
(Rs. / kWh)
Andhra Prad. (3.3
Gujarat (3.37)
Karnataka (3.4
Kerala (3.14)
Madhya Prade
Maharsthra (3
Rajasthan
(3.
TN (2.9) West Beng
Haryana (4
2.5
2.7
2.9
3.1
1 2 3 4 5 6 7 8 9 10
(

20
ChallengesChallenges
•• Economic Efficiency of existing policiesEconomic Efficiency of existing policiesEconomic Efficiency of existing policies Economic Efficiency of existing policies
•• States have different resource endowments and States have different resource endowments and some have very limited ones (e.g. Delhi)some have very limited ones (e.g. Delhi)
•• How to How to incentiviseincentivise renewable resources in renewable resources in remote areas not connected with grid?remote areas not connected with grid?gg
Jawaharlal Nehru National Solar Jawaharlal Nehru National Solar Mission (JNNSM)Mission (JNNSM)
•• One of the 8 national missions under the National One of the 8 national missions under the National Action Plan on Climate Change (NAPCC), which Action Plan on Climate Change (NAPCC), which was launched on June 30, 2008.was launched on June 30, 2008.
•• About 5,000 trillion kWh per year solar energy is About 5,000 trillion kWh per year solar energy is incident over India’s land area. In most parts, solar incident over India’s land area. In most parts, solar incidence ranges 4incidence ranges 4--7 kWh per 7 kWh per sq.msq.m per day.per day.
•• NAPCCNAPCC National level target for RE Purchase mayNational level target for RE Purchase may•• NAPCC NAPCC -- National level target for RE Purchase may National level target for RE Purchase may be set at 5% of total grid purchase for FY 2010. This be set at 5% of total grid purchase for FY 2010. This could be increased by 1% each year for the next 10 could be increased by 1% each year for the next 10 years.years.

21
JNNSM RoadmapJNNSM Roadmap
National Mission on Enhanced Energy National Mission on Enhanced Energy Efficiency (NMEEE)Efficiency (NMEEE)
Mission Goals Mission Goals –– (by 2014(by 2014--15)15)( y( y ))•• Annual fuel savings in excess of 23 million toeAnnual fuel savings in excess of 23 million toe•• Cumulative avoided electricity capacity addition of Cumulative avoided electricity capacity addition of
19,000 MW19,000 MW•• CO2 emission mitigation of 98 million tons per yearCO2 emission mitigation of 98 million tons per year
MarketMarket--based approaches to unlock energy efficiency based approaches to unlock energy efficiency opportunities, estimated to be about Rs. 74,000 opportunities, estimated to be about Rs. 74,000 crorescrores..

22
NMEEE NMEEE -- MandateMandate
•• Perform Achieve and Trade (PAT) Perform Achieve and Trade (PAT) -- A market based A market based ( )( )mechanism to enhance cost effectiveness of improvements in mechanism to enhance cost effectiveness of improvements in energy efficiency in energyenergy efficiency in energy--intensive large industries and intensive large industries and facilities, Tradable certificates of energy savings. facilities, Tradable certificates of energy savings.
•• Market Transformation for Energy Efficiency Market Transformation for Energy Efficiency -- Energy Energy efficient appliances in designated sectorsefficient appliances in designated sectors
•• Energy Efficiency Financing PlatformEnergy Efficiency Financing Platform -- Creation ofCreation ofEnergy Efficiency Financing Platform Energy Efficiency Financing Platform Creation of Creation of mechanisms to help finance demand side management mechanisms to help finance demand side management programmesprogrammes in all sectors.in all sectors.
•• Framework for Energy Efficient Economic Development Framework for Energy Efficient Economic Development --Developing fiscal instruments to promote energy efficiency.Developing fiscal instruments to promote energy efficiency.
What influences economics of What influences economics of Renewable Energy SourcesRenewable Energy Sources
•• High capital costHigh capital costHigh capital costHigh capital cost
•• Low capacity Low capacity utilisationutilisation
•• Weather risk (instead of fuel risk)Weather risk (instead of fuel risk)
•• Evolving technologyEvolving technology
•• Grid integrationGrid integration•• Grid integrationGrid integration
•• Increasing land prices and land squattingIncreasing land prices and land squatting

23
Road AheadRoad Ahead
•• Energy EfficiencyEnergy Efficiency –– Low hanging fruit and noLow hanging fruit and noEnergy Efficiency Energy Efficiency Low hanging fruit and no Low hanging fruit and no regret optionregret option
•• Renewable Energy Renewable Energy –– Road to Energy security Road to Energy security but some technical challengesbut some technical challenges
•• Policy and Regulatory Environment need to Policy and Regulatory Environment need to y g yy g yprovide incentive for adoption of clean and provide incentive for adoption of clean and efficient technology in the energy sector.efficient technology in the energy sector.
Thank YouThank You
www.iitk.ac.in/ime/anoopswww.iitk.ac.in/ime/anoops
[email protected]@iitk.ac.in
24
Courses, Workshops and ConferencesCourses, Workshops and Conferences
•• Short Term Course “Challenges and Implementation Short Term Course “Challenges and Implementation g pg pIssues post Electricity Act 2003: Regulatory, Policy & Issues post Electricity Act 2003: Regulatory, Policy & Technical Solutions”, 10Technical Solutions”, 10--14 April, 200414 April, 2004
•• International Conference on “Power Market International Conference on “Power Market Development in India: Reflections from International Development in India: Reflections from International Experience” 19Experience” 19--21 April 200521 April 2005Experience , 19Experience , 19 21 April, 2005 21 April, 2005
•• National Workshop on “Project Financing for Energy National Workshop on “Project Financing for Energy and Infrastructure Sector”, April 19and Infrastructure Sector”, April 19--22, 2007 22, 2007
Courses, Workshops and Conferences Courses, Workshops and Conferences (contd.)(contd.)
•• 22ndnd National Workshop on “Project Financing for Energy National Workshop on “Project Financing for Energy p j g gyp j g gyand Infrastructure Sector”, April 24and Infrastructure Sector”, April 24--27, 200827, 2008
•• Capacity Building Capacity Building ProgrammeProgramme for Officers of Electricity for Officers of Electricity Regulatory Commissions, 30th June Regulatory Commissions, 30th June -- 5th July, 20085th July, 2008
•• 2nd Capacity Building Programme for Officers of 2nd Capacity Building Programme for Officers of Electricity Regulatory Commissions, 3Electricity Regulatory Commissions, 3--8 August, 20098 August, 2009
•• 33rdrd Capacity Building Programme for Officers of Capacity Building Programme for Officers of Electricity Regulatory Commissions, 23Electricity Regulatory Commissions, 23--28 August, 201028 August, 2010
•• 44thth Capacity Building Programme for Officers of Capacity Building Programme for Officers of Electricity Regulatory Commissions, 18Electricity Regulatory Commissions, 18--23 July, 201123 July, 2011
•• Energy Conclave 2010, 8Energy Conclave 2010, 8--15 Jan. 201015 Jan. 2010