repairingthedamage fromhazardousabandonedoil& gas wells
TRANSCRIPT

A Federal Plan to Grow Jobs in the Ohio River Valley and Beyond
Repairing the Damagefrom Hazardous Abandoned Oil & Gas Wells:
Ted Boettner | April 2021

2
The Ohio River Valley Institute is an independent, nonprofit research and communications center—a think tank—founded in 2020. We equip the region’s residents and decision-makers with the policy research and practical tools they need to advance long-term solutions to some of Appalachia’s most significant challenges. Our work includes in-depth research, commentary, and analysis, delivered online, by email, and in-person to policy champions, emerging leaders, and a range of community partners.
Visit us at www.ohiorivervalleyinstitute.org or @O_R_V_I.
About the Ohio River Valley Institute

3
Ted Boettner is a senior researcher at the Ohio River Valley Institute (ORVI) where he works on a range of policy issues, including energy, sustainable economic development, and fiscal policy. Prior to joining ORVI, Ted was the co-founding director of the West Virginia Center on Budget and Policy where he authored dozens of publications on state and local policy issues, including the annual State of Working West Virginia. Ted has taught political science at West Virginia University and was a primary member of the U.S. Extractive Industries Initiative at the U.S. Department of Interior.
The author is deeply appreciative of Ted Auch and Matt Kelso at the FracTracker Alliance for providing their invaluable expertise to help map and identify unplugged and abandoned oil and gas wells in West Virginia, Kentucky, Pennsylvania, and Ohio. The author would also like to thank several other people who made this report possible. This includes researcher Eric Dixon, Joanne Kilgour (Ohio River Valley Institute), Jeremey Richardson (Union of Concerned Scientists), Erin Savage (Appalachian Voices), Perry Bryant (WV Climate Alliance), Mary Kang (McGill University), Mary Townsend-Small (University of Cincinnati), Brain Prest (Resources of the Future), Daniel Raimi (Resources for the Future), Dana Kuhnline (Reimagine Appalachia), Jacqui Bonomo (Penn Future), Seth Pelepko (Pennsylvania Department of Environmental Protection), Shannon Williams (Kentucky Energy and Environment Cabinet), Gene Chini (Ohio Department of Natural Resources), Jason Harmon (West Virginia Department of Environmental Protection), Dave McMahon (Mountain State Justice), Brook Lenker (FracTracker), Megan Milliken Biven, Paul Burke, Tony Ingraffea (Cornell University) and Nadia Steinzor(Earthworks). This report represents the research and views of the author and the Ohio River Valley Institute.
About the Author Acknowledgements

4
5. Key Terms
6. Overview and Key Findings
11. Section One: Abandoned and Orphan Wells in the United States and Ohio River Valley States
15. Section Two: Problems with Abandoned and Orphan Wells
24. Section Three: Plugging Wells in the United States and Ohio River Valley States
29. Section Four: Growing Jobs and Curbing Harmful Greenhouse Gas Emissions from a Large-Scale Investment in Plugging Wells
37. Section Five: Program Structure and Federal Proposals
47. Conclusion
48. Appendix A: Congressional District Data by Ohio River Valley States
49. Appendix B: Congressional District Methodology
56. Appendix C: Methodology for Estimating Potential Revenues from Equivalent Abandoned Mine Land (AML) Reclamation Fee on Natural Gas and Crude Oil Production
58. Endnotes
Table of Contents

5
Abandoned Well: A well that has been taken out of production that is either plugged, unplugged, or improperly plugged, including inactive, shut-in, dormant, idle or temporarily abandoned (EPA 2020). While modern abandoned wells are usually assumed to be “plugged and abandoned,” wells that pre-date modern regulation are often assumed to be “unplugged” or inadequately plugged.
Orphan Well: A subset of abandoned oil and gas wells for which no owner exists to undertake the plugging and restoration of the well site. It is usually assumed orphan wells are “unplugged” or not plugged to modern standards.
Legacy Well: A well that has been drilled and abandoned historically, and for which there is no current responsible party. Often used interchangeably with abandoned well or orphan well.
Stripper Well or Marginal Well: A well nearing the end of its economically useful life. Stripper wells are generally defined as producing less than 15 barrels of oil or 60,000 cubic feet of gas per day.
Idle Well: Any well that has not produced oil or natural gas or has not been used in injection for a set time period, usually a period of six months to two years.
Plugging and Abandonment (P&A): When an oil and gas well reaches the end of its useful life or becomes a dry hole, it undergoes a regulatory process called “plug and abandonment” or P&A. P&A usually consists of plugging the well to close it permanently, but different regulatory bodies have their own requirements for P&A operations.
Well Site Restoration: This usually includes the reclamation and remediation of an oil or gas well site to its original state before drilling occurred. Remediation includes cleaning up any contamination, while reclamation can include revegetating a site, restoring disturbed surface areas, and removing production equipment and debris.
Key Terms

6
After more than a century of oil and gas drilling, unplugged or improperly plugged abandoned oil and gas wells are causing extensive environmental damage and imposing health and safety risks because they are leaching pollutants into the air and water. Some of these abandoned wells are leaking large amounts of harmful methane into the atmosphere, which is a powerful greenhouse gas that contributes to climate change, as well as volatile organic compounds (VOCs) that damage local air quality, and both of which can – under certain circumstances - pose serious public safety concerns. Leaks from abandoned wells, such as oil, brine and drilling byproducts, have also been linked to the contamination of groundwater supplies and soil, which can undermine drinking water, agriculture activity and property values. There have also been a number of dangerous explosions due to leaking gas or methane from wells.
Over the last several years there has been growing attention at the state and federal level to address the problems associated with millions of abandoned and orphaned oil and gas wells across the nation. There is also great concern about the large share of low-producing wells that could be abandoned relatively soon, as well as the cost of plugging high volume hydraulic fracturing wells.
How many abandoned oil and gas wells that need to be cleaned up? No one knows for sure. The Interstate Oil & Gas Compact Commission’s (IOGCC) periodic survey of idle and orphan wells estimates in 2018 that there were 56,600 documented unplugged orphan wells, and up to 746,000 additional undocumented orphan wells, nationwide. The U.S. Environmental Protection Agency (EPA) estimates there are 2.1 million unplugged onshore abandoned wells. A recent report by Carbon Tracker estimates that there over 2.6 million unplugged onshore wells in the United States that are at risk of being orphaned with a total closure cost between $78 billion and $280 billion.
While states allocate additional funds to plug abandoned and orphaned wells and conduct site restoration and remediation, the scale and cost of the problem is likely greater than they can afford, and it could take decades to plug and restore these well sites. Complicating matters, it is impossible to determine the owners of many of the wells because they predate modern regulation, so there is no way to recoup funds to pay for the restoration and plugging costs. As more oil and gas companies declare bankruptcy, it could make it harder for states to recover the cost of cleaning up well sites. In fact, a recent survey of seven large oil and gas producing states found that the total financial assurance
Overview and Key Findings

7
coverage (bonds) for all wells at risk of being orphaned in those states would cover just one to six percent of the costs to plug them. There have been several federal proposals in 2020 to deal with the abandoned and orphan well crisis, including bills in congress and proposals by researchers.
The purpose of this report is to examine the potential benefits of a large-scale federal program to plug abandoned oil and gas wells in the Ohio River Valley states of Kentucky, Ohio, Pennsylvania, and West Virginia. The report unfolds in five parts. First, it explores the estimated number of onshore abandoned and orphan oil and gas wells in the nation and the four-state region. Section Two discusses the problems associated with unplugged wells, including unfunded liabilities, greenhouse gas emissions, health and safety hazards, and problems with plugging. Section Three looks at the cost of plugging abandoned wells and the factors behind those costs in order to estimate the level of investment needed to plug abandoned wells in the four-state region. The fourth section looks at how a large-scale abandoned well cleanup program could boost employment in the region and reduce harmful greenhouse gases that are contributing to climate change. Lastly, the report reviews federal proposals to address abandoned and orphan oil and gas wells and proposes ways to fund a large-scale abandoned well
federal program and makes recommendations.
As we shall see, the four states of the mid and upper Ohio River Valley region make up a large portion of the nation’s abandoned wells – one-third – and one in five wells that are in production today. The region would not only disproportionately benefit from a large-scale well plugging program, but it would also greatly benefit from more local jobs and income, especially since many of these rural areas have been economically stressed for decades.
Below are the Key Findings from the report:
• Based on the best available date, there are an estimated 538,000 unplugged abandoned oil and wells in the four states that make up the mid and upper Ohio River Valley region, along with another 177,000 low-producing wells in the region. There could be hundreds of thousands of additional unplugged abandoned wells in the region. Nationally, the number of unplugged abandoned oil and gas wells ranges from 2.1 million to 2.3 million.

8
• Unplugged abandoned oil and gas wells pose significant health, safety, and environmental problems, including hazardous waste that contaminates water supplies, greenhouse gases that contribute to climate change, lower property values, and in some cases explosions. There are also significant unfunded liabilities associated with unplugged abandoned oil and gas wells. For example, the bonding requirement for a single well vertical well in the four states is just 7.6% of the plugging cost, on average.
• The cost to plug wells varies by state and is determined by a number of factors, including contract size, geology, the depth of the well, and surrounding terrain. The cost to plug wells in the four states ranges from $6,500 to at least $87,500. The estimated cost to plug the 538,000 abandoned wells identified in the region is approximately $25 billion but could be as high as $34 billion.
• In 2018, only 2,372 orphan wells were plugged in the United States. At this pace it would take over about 895 years to plug the estimated 2.1 million unplugged abandoned and orphan wells, not including the nearly one million wells that are still in production today and others that may be drilled in the future.
• A federal program to plug and restore the estimated 538,000 unplugged abandoned oil and gas wells in the Ohio River Valley states of West Virginia, Kentucky, Ohio, and Pennsylvania could create about 15,151 jobs per year over 20 years or 303,000 job-years at a total cost of $25 billion This annual amount is nearly equivalent to the decline in upstream oil and gas jobs in the region from 2014 to 2019.
• The estimated methane emissions from 538,000 unplugged abandoned oil and gas wells in the Ohio River Valley region is 71,000 metric tons or 1.8 million metric tons of carbon dioxide equivalent (CO2e). This is the equivalent to the greenhouse gas emissions produced from 383,000 passenger vehicles driven or about 2 million pounds of coal burned in one year.
• A federal program to plug the estimated 538,000 wells in the four Ohio River Valley states would cost an estimated $349 per ton of carbon dioxide equivalent (CO2e) that the program would prevent from entering the atmosphere, which is higher than the estimated social cost of carbon (SCC) in 2020 but is likely cost-effective given the additional savings, related job impacts, and ecosystem benefits.
9
• Over the short-term, Congress should appropriate funds to states and tribes to address abandoned and orphan wells issues, including giving the jurisdictions the capacity to grow their well inventories, establish best practices, hire more field inspectors, and boost jobs. Over the long run, a large-scale federal program is needed to address the billions in clean-up costs that will grow over time.
• To pay for a large-scale federal well plugging and reclamation program, the federal government could scale back or eliminate the estimated $11 billion in annual federal oil and gas subsides or place a small fee per unit fee on crude oil and natural gas production similar to the fee on coal production from the Abandoned Mine Land (AML) program that pays for pre-1977 coal mine reclamation. Such a fee could raise about $3.7 billion per year and be distributed to states and tribes through a formula.
• A federal program should also create a national inventory system of wells based on a risk assessment and a monitoring system, along with investing in research and development, developing best practices, increase funds for staffing and administration and job training and safety. To ensure the jobs created are good paying jobs with benefits that benefit a diverse workforce, there would also need to be prevailing wage requirement and/or local hiring provisions to federal allocations and an intentional effort made to hire women, people of color, and others who are often left out of such programs in these industries.

Section One:
10
Over the last 150 years, more than 10 million oil and gas wells have been drilled in the United States.1 The mid and upper Ohio River Valley region – including Ohio, West Virginia, Kentucky, and Pennsylvania –was the birthplace of the American oil industry with the first oil drilled in Titusville, Pennsylvania in 1859.2 For most of that time, it was a largely unregulated industry with few well permitting or plugging requirements.
The number of abandoned wells in the four-state region is estimated to account for approximately one in three of the nation’s estimated four million abandoned wells.3 Approximately 20 percent or 192,700 of the 996,000 producing oil and gas wells in the United States in 2019 were located in Ohio, West Virginia, Kentucky, and Pennsylvania. 4
Oil and Gas Well Classifications
Oil and gas wells fall into two broad categories. There is active or producing wells and inactive or nonproducing wells. Active wells include low or minimally producing conventional wells called stripper or marginal wells. In general, these wells produce less than 15 barrels of oil or 60,000 cubic feet of gas per day. All other active wells are
vertical and horizontal wells, which make up the largest share of oil and natural gas production.
Inactive wells are defined and classified differently by states and federal agencies, industry, and scholars but are generally determined by plugging status and well type. In this paper, all inactive wells are referred to as abandoned oil and gas wells. Abandoned wells include plugged and unplugged wells. Wells that have been properly plugged to prevent migration of gas or fluids are referred to as “plugged and abandoned”.
Unplugged abandoned wells include temporarily suspended or abandoned, dormant, shut-in, idle or orphaned wells. Temporarily suspended and idle wells are unplugged wells that have not produced oil or gas for a set period of time – usually six months to two years –that can eventually be brought back into production. Orphan wells, on the other hand, have no recent production or responsible owner to undertake plugging and well site restoration. State agencies and others characterize orphan wells as either documented - orphaned wells with a known location – and undocumented wells that are estimates derived from historical records, but their precise location
Abandoned and Orphan Wells in the United States and Ohio River Valley States

11
may be unknown. These wells are presumed to be unplugged or not plugged to modern standards.
Estimated Abandoned Oil and Gas Wells in the U.S. and Ohio River Valley States
A recent survey by the Interstate Oil and Gas Compact Commission (IOGCC), an organization representing 31 states and seven associated states, reported 56,600 documented orphaned wells as of 2018.5 The IOGCC also found that there were an additional 211,000 to 746,000 undocumented orphan wells, with Pennsylvania making up between 100,000 and 560,000 of these orphan wells, respectively. Altogether, the four Ohio River Valley states comprise half (27,525 or 49%) of IOGCC reported documented orphan wells and between 71 percent (149,100) and 82 percent (609,100) of undocumented orphan wells.
In addition to orphaned wells, the IOGCC reported that states had 194,400 approved idle wells in 2018, with 27,525 of those in the four-state Ohio River Valley region. Idle wells are not in use for production, injection or other purposes and operators sometimes “cap” the well instead of plugging the well since the cost of plugging the well may be prohibitive or there is potential for future extraction when oil and gas prices rise making it profitable to do so. Many of these idle wells are at
risk of becoming orphan in the future.
The reported number of orphaned wells by the IOGCC may substantially underestimate the number of orphan wells. The U.S. Environmental Protection Agency estimates that there are 3.2 million abandoned wells in the United States that reported zero oil and gas production in the previous year.6 This includes idle, suspended, idle and orphan wells.
The EPA estimates that two-thirds, or 2.1 million, of abandoned oil and gas wells were unplugged in 2018, including 1.7 million oil wells and 382,000 gas wells. According to an analysis of historical drilling records by the EPA in 2018 approximately 672,200 wells were drilled in Pennsylvania, Ohio, Kentucky, and West Virginia from 1871 to 1973.7In 1975, there were approximately 133,300 active oil and gas wells in these four states. Subtracting these active wells from the total drilled well by 1973 would mean there is an estimated 539,000 abandoned wells in the four-state region in 1975. This estimate doesn’t include hundreds of thousands of wells not captured by the historical records.
A 2020 study by James Williams, Amara Regehr, and Mary Kang estimate that there are 4 million abandoned wells in the United States. Of this amount, approximately 1.75 million are plugged and 2.3

12
Figure 1: Estimated Onshore Plugged and Unplugged Abandoned Oil and Gas Wells in the U.S.
1,750,89243% 1,083,804
34%
2,296,91657%
2,126,70966%
Williams et al. (2020) EPA (2020)
Plugged Wells Unplugged Wells
4,047,808
3,210,513
Source: U.S. Environmental Protections Agency, “Inventory of U.S. Greenhouse Gas Emissions and Sinks: 1990-2018,” Washington, DC, 2020 and James, P. Williams, Amara Regehr, and Mary Kang, “Methane Emissions from Abandoned Oil and Gas Wells in Canada and the United States,” Environmental Science & Technology, 55 (1), 563-570
million are unplugged (Figure 1).8 Similar to the EPA definition of abandoned wells, this includes wells classified as “inactive”, “suspended”, “idle”, and “orphaned”. This study estimated that 1.3 million or one-third of the 4 million abandoned wells in the United States were in the four Ohio River Valley States (Figure 2). This includes approximately 115,000 abandoned wells in Kentucky, 183,000 in Ohio, 410,000 in West Virginia and 610,000 in Pennsylvania. Assuming this same share of these wells are unplugged as the national estimates, it would mean there is 748,000 unplugged abandoned wells in the four states.
A recent analysis of oil and gas well databases in each of the four states from Ted Auch and Matt Kelso of FracTrackerreveals that there are an estimated 346,208 unplugged abandoned oil and gas wells, including 75,821 in West Virginia, 158,679 in Ohio, 103,311 in Kentucky, and 8,397 inPennsylvania (Figure 3). The estimate for Pennsylvania is artificially low because the state does not have a large inventory of oil and gas wells mapped in the state. However, the Pennsylvania Department of Environmental Protection (DEP) estimates that between 100,000 and 560,000 abandoned oil and gas wells exist in the state.
Repairing the Damage from Abandoned Oil and Gas Wells: A Federal Plan to Grow Jobs in the Ohio River Valley and Beyond | Ted Boettner

13
Repairing the Damage from Abandoned Oil and Gas Wells: A Federal Plan to Grow Jobs in the Ohio River Valley and Beyond | Ted Boettner
Figure 2: Estimated Abandoned Oil & Gas Wells in Ohio River Valley States
Source: James, P. Williams, Amara Regehr, and Mary Kang, “Methane Emissions from Abandoned Oil and Gas Wells in Canada and the United States,” Environmental Science & Technology, 55 (1), 563-570 (Supporting Material) and Ted Auch and Matt Kelso, FracTracker, 2021 (see appendix). *The Pennsylvania DEP estimate of 200,000 orphan (legacy) wells is shown.
114,643
183,090
410,000
610,000
1,317,733
103,311
158,679
75,821
200,000
537,811
0 200,000 400,000 600,000 800,000 1,000,000 1,200,000 1,400,000
KY
OH
WV
PA*
Total
Unplugged Abandoned Oil and Gas Wells (Auch and Kelso) Abandoned Oil & Gas Wells (William et al.)

14
Figure 3: Map of Unplugged and Abandoned Oil & Gas Wells in Ohio, Kentucky, and West Virginia by Congressional District
Repairing the Damage from Abandoned Oil and Gas Wells: A Federal Plan to Grow Jobs in the Ohio River Valley and Beyond | Ted Boettner
Source: Ted Auch and Matt Kelso, FracTracker Alliance, 2021 (see appendix)
The Pennsylvania DEP uses an estimate of 200,000 wells in the state when calculating the plugging cost liability to the state. Using the 200,000 well estimate for Pennsylvania in lieu of the Auchand Kelso estimate in the PA DEP database, shows the total estimate for unplugged abandoned oil and gas wells in the four states to be 537,811 (Figure 2).

Section Two:
15
Unplugged abandoned oil and gas wells can pose serious health, safety, and environmental risks, most of which are shifted onto the public and not internalized by the industry. Unlike some active wells, unplugged and poorly plugged abandoned and orphaned wells are not under systematic monitoring or control and the location of every well is not known. Many of these wells are leaking harmful greenhouse gases. While many states and other jurisdictions (in general) require that non-producing oil and gas wells be plugged and the well sites restored, some operators may not do this, especially if they are declaring bankruptcy, the bonding requirements represent just a fraction of the restoration and plugging costs, or a well is no longer economically viable because of low energy prices and its cheaper to let the well idle. The well plugs themselves are also problematic.
Inadequate Bonding Coverage and Orphan Well Liability Risk
Usually before a company can drill an oil or gas well, it must set aside funds to plug and restore a well site after production ceases. These funds – usually cash or bonds (surety or performance bonds) – are a debt-like legal obligation or an “asset retirement obligation” (ARO) that is supposed to provide a financial incentive for drillers to properly
reclaim a well site. This financial assurance is also supposed to help ensure that the jurisdiction where it is located, such as a state or tribal reservation, can deal with any liabilities associated with the abandoned well if the company goes bankrupt or dissolves.
According to the Carbon Tracker Initiative, total bonding coverage –the amount of money oil and gas companies are required to obtain to cover the closing or plugging costs of wells – on unplugged wells is a tiny fraction of what is needed to actually close the wells.1 In an analysis of 12 states Carbon Tracker found the total bond coverage for an estimated 1.1 million wells was just $1.4 billion while the total estimated cost to plug these wells was $123 billion – or about 1.1 percent of what is needed to plug the wells. For West Virginia, Pennsylvania, and Ohio the bonding coverage ratio was just 0.2 percent (Table 1). This is based on an average plugging cost of about $108,000 per well. Using a more conservative plugging cost of $30,000 per well, the total estimated liability was still less than 1 percent of the value of existing bonds. Overall, Carbon Tracker estimates that plugging the estimated 2.6 million onshore documented unplugged wells will cost $280 billion.2
Problems with Abandoned and Orphan Wells

16
Table 1: Carbon Tracker Data on Orphan Liability Risk in West Virginia, Pennsylvania, and Ohio
Carbon Tracker Unplugged Wells (Orphan Liability Risk) in WV, PA, and OH(excludes 1.2 million undocumented onshore wells in EPA U.S. estimates)
Producing Stripper Injection (other) TA Zombie Total
Wells
Cost @$30k
($B)
CTI Estimate
($B)
CTI Bonding Estimate
($MM)
Bonding Ratio (%)
WV 3,163 55,823 42,003 951 304 100,444 $3.0 $7.6 $28.7 1%/0.4%
PA 9,971 70,042 49,050 8,422 13,817 151,302 $4.5 $12.2 $47.2 1%/0.4%
OH 2,617 38,511 93,014 8,494 28,766 171,402 $5.1 $12.5 $22.4 0.4%/0.2%
TOTAL 15,751 164,376 184,067 17,867 42,887 423,148 $12.7 billion $32.2 billion $98.3 million 0.8%/0.3%
Category Description
Producing Unplugged wells with a Last Production (LP) date within the past two years and average daily oil and gas production equal to or greater than 15 barrels of oil or 90 Mcf of natural gas.
Stripper Unplugged wells with a LP date within the past two years and average daily oil and gas production less than 15 barrels of oil or 90 Mcf of natural gas.
Injection+ other
Unplugged injection wells and other unplugged wells with no reported oil and gas production, including wells classified as disposal, dry hole, monitor, observation, other, storage, and water.
TA (LP>24<60) Unplugged temporarily abandoned (TA) wells with a LP date more than two years but less than 5 years ago.
Zombie (LP>60) Unplugged wells with a LP date more than five years ago.
Source: Carbon Tracker Asset Retirement Obligation Portal

17
Table 1 looks at the estimated 423,148 documented unplugged wells in West Virginia, Ohio, and Pennsylvania compiled by Carbon Tracker that are at risk of becoming orphaned in the near future. Most of the wells at risk of being orphaned in the three states are low producing stripper wells and injection wells. The estimated cost to plug and restore the documented wells in all three states could range from $12.7 billion to $32.2 billion. This doesn’t include thousands of other undocumented wells in three states. Carbon Tracker did not include Kentucky in its analysis.
The central reason for the large unfunded liabilities in states is the use of “blanket bonds” and other well securities that inadequately cover the plugging cost of wells. For example, in Pennsylvania, a blanket bond that covers an unlimited number of conventional wells is just $25,000, less than it costs to plug just one well. A single well bond is just $2,500 on conventional wells in Pennsylvania. A recent analysis by researchers at the University of Pittsburgh found that bonding “requirements for conventional wells have been–and continue to be–a fraction of reclamation costs as evidenced by our analysis of state well plugging contracts.”3 The analysis also found that the bonding requirement on a single shale well - $10,000 – is only 11% of the total reclamation (plugging and wellsite restoration) costs for a typical shalewell in Pennsylvania.
Figure 5 on the following page compares the amount of financial assurance or bonding requirements for the four Ohio River Valley states to the typical plugging cost for abandoned oil and gas wells in each state. It includes the minimum requirement for single vertical well bonds and the minimum bonding requirements for blanket bonds that cover multiple wells. On average, the bonding requirement for a single horizontal well in each state is just 7.6% of the plugging cost. For example, in Ohio the minimum bonding requirement for a single vertical well is just $5,000 while the typical plugging cost exceeds $87,500. This means it would be a lot cheaper for some oil and gas operators to forfeit their bonds than to actually plug these wells since they represent only a small percent of the estimated liability.
The large unfunded asset retirement obligations of oil and gas operators is also compounded by an enormous slew of bankruptcies and negative cash flow over the decade. For example, a recent analysis by the Institute for Energy Economics and Financial Analysis (IEEFA) found that since 2010 the top 30 North American shale-focused oil and gas producers had negative cash flows totaling $158 billion since 2010. This means they spent $158 billion more on drilling and capital expenses than they generated by selling gas and oil. According to IEEFA, “these companies also collectively owe nearly $90 billion in long-term debt, despite bankruptcies that have erased billions of

18
Figure 5: Bonding Requirements and Plugging Costs in Ohio River Valley States
Source: Carbon Idle and Orphan Oil and Gas Wells: State and Provincial Regulatory Strategies, Interstate Oil and Gas Compact Commission, March 2020 and Ho, J et al., “Plugging the Gaps in Inactive Well Policy,” Resources forthe Future, May 2016., and author calculations of state plugging costs. Note: See section three of this report for estimated state plugging costs in each state.
$0
$10,000
$20,000
$30,000
$40,000
$50,000
$60,000
$70,000
$80,000
$90,000
$100,000
Ohio West Virginia Pennsylvania Kentucky
Single Well Bond Amount (Vertical Well) Multiple Well Bonding Requirement (Blanket Bonds) Estimated Well Plugging Cost

19
dollars of liabilities from some companies’ balance sheets.”4 The poor financial health of oil and gas operators, along with downward pressure on production from the adoption of clean energy, could make it harder for these companies pay for the closing costs are their wells.
Greenhouse Gas (Methane) Emissions
Recent studies have found that improperly plugged or unplugged orphaned or abandoned oil and gas wells can leak and emit dangerous pollutants into the air and water, including methane, which at high enough levels can cause explosions.5 This leakage is often caused by a loss of well integrity in the casing or plug that allow fluids or gases to escape.
Methane, which is a potent but short-lived greenhouse gas, has 86 times the global warming potential (GWP) of carbon dioxide per ton over a 20-year period and 34 times the GWP over a 100-year period, according to the Intergovernmental Panel on Climate Change (IPCC).6Global warming potential or GWP is the heat trapping capability by any greenhouse gas in the atmosphere relative to that of carbon dioxide and is used to allow comparisons of the global warming effects of different gases, such as methane. GWP values are expressed over years, usually 20 or 100 years, and are used to convert different
various greenhouse gases into comparable carbon dioxide equivalents (CO2e). New York state has made a GWP of 86 for methane part of its latest energy transition law. The EPA, on the other hand, still uses a 100-year methane GWP of 25 to determine carbon dioxide equivalents – an approach that results in far lower estimates of the methane that is being released.
The EPA estimates that methane emissions from abandoned oil and gas wells in 2018 were the equivalent of 7 million metric tons of CO2equivalents, based on a global warming potential of 25 over a 100-year period.7 This is the equivalent of 17.4 million miles driven by an average passenger vehicle or 16.3 million barrels of oil consumed, according to the EPA.8 The EPA estimates that 99.7% of methane emissions from abandoned oil and gas wells were from unplugged wells, while just 0.3% came from plugged wells.9 However, a 2021 study from scholars at McGill University (Canada) found that the EPA underestimates the total methane emissions from abandoned wells by 20%.10
One recent study by scholars at Princeton University and McGill University found that abandoned wells in Pennsylvania accounted for five to eight percent of annual human-caused methane emissions state-wide or between 40,000 to 70,000 metric tons of methane per year, with the bulk of emissions coming from a small number (13%) of
20
high-emitting wells.11 A 2019 study by Stuart Riddick and others found similar results in West Virginia, showing that a large share of the methane emissions came from a few large emitting unplugged wells spread out over topographically complex areas.12 A 2016 study that examined 138 abandoned wells in Ohio, Colorado, Wyoming, and Utah found that over 40 percent of unplugged wells leaked methane, accounting for 2 to 4% of total methane emissions from oil and gas activity.13
Low producing or marginal “stripper” oil and gas wells – those producing less than 15 barrels of oil per day equivalent – are also a large source of methane emissions and make up a significant portion of producing oil and gas wells. Wells in this class are also at highest risk of becoming abandoned, as the cost of maintaining them outpaces their profitability. A 2020 study by scholars at the University of Cincinnati found that marginal wells in the United States were responsible for 11% of total annual methane from oil and gas production in the EPA greenhouse gas inventory despite producing just 0.4% of gas and 0.2% of oil in the US.14 The above research implies that mitigation efforts should focus on targeting the small share of large emitting abandoned wells and active marginal wells.
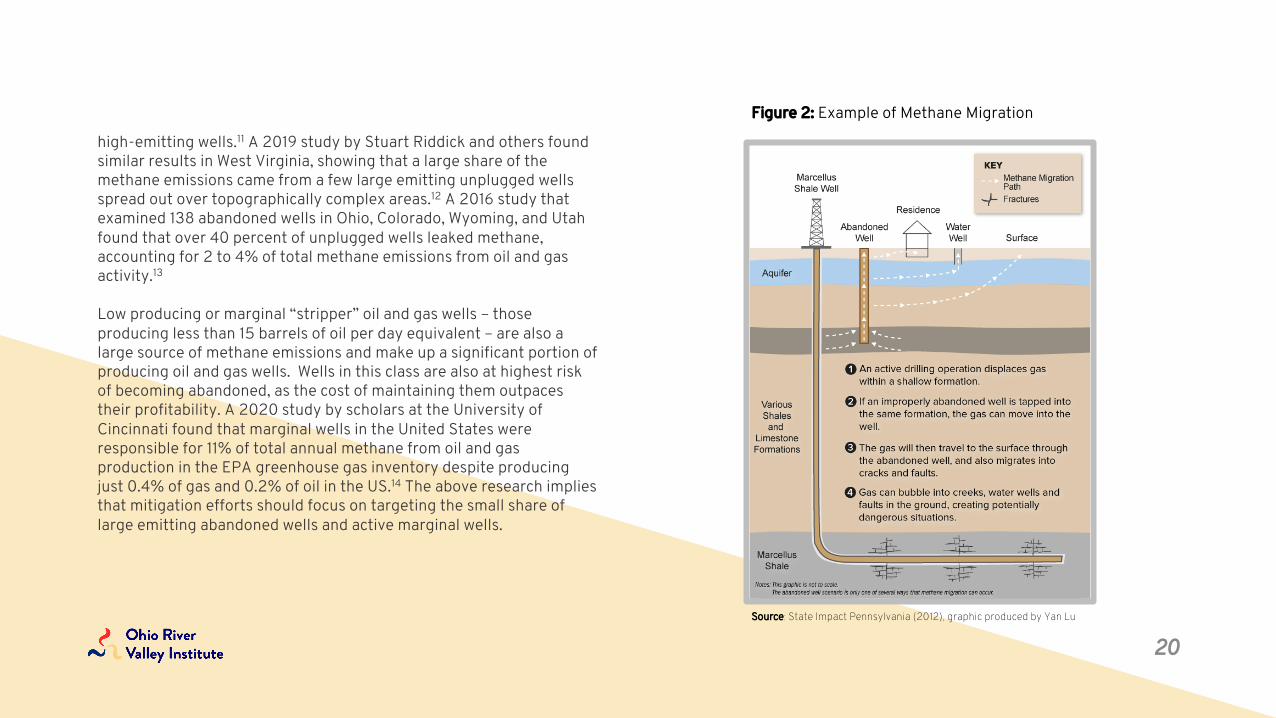
Figure 2: Example of Methane Migration
Source: State Impact Pennsylvania (2012), graphic produced by Yan Lu

21
Health and Safety Hazards / Lower Property Values
Abandoned oil and gas wells can also leak other dangerous chemicals, such as benzene, a carcinogen linked to leukemia and low birth weights, and other volatile organic compounds (VOCs) that seep into surrounding soil and contaminate ground water supplies and surface water. Leaching from abandoned wells into groundwater is often caused by old leaking casings or cement that allow oil, gas, and brine to seep into freshwater aquifers, while surface water contamination is sometimes the product of spills and waste or fluids that rise up the well and onto the surface (see Figure 2).15 A recent study in Pennsylvania found that leaking wells tend to have more casing left in the ground than non-leaking wells.16 A 2011 report by the Groundwater Protection Council found 41 incidents of groundwater contamination in Ohio caused by leakage from orphan wells.17 The risks associated with abandoned, orphan, and improperly plugged wells can also be compounded by acid mine drainage or coal mine influenced water in areas where coal and oil and gas operations have occurred in close proximity.
Abandoned wells that are unplugged or improperly plugged can also cause significant safety and health problems if they intersect with hydraulic fracturing operations.18 In some cases, when a new shale well
is drilled in the same vicinity as an unplugged abandoned well methane from the shale well can migrate into the abandoned well and reach the surface, water wells, and residences (See Figure 2). One documented case of methane migration occurred in Tioga County, Pennsylvania when drilling for shale gas led to a “30-foot geyser of gas and water spraying out of the ground for more than a week.” Nearby landowners had to be temporarily evacuated during efforts to bring it under control.19 Another similar case in Dayton, Pennsylvania led to the evacuation of an elementary school and two houses when the methane got within eight feet from one house before the well was brought under control.
Aside from water and air pollution, unplugged abandoned oil and gas wells can also cause safety concerns, especially if they are under or close to someone’s home.20 In one infamous example, migrating gas from an unplugged gas well caused a house to explode in McKean County, Pennsylvania.21
Abandoned wells may also affect house prices and economic development where houses, schools, and shopping centers encroach onto old oil and gas fields. A 2020 study by Mariya Shappo at the University of Illinois that explored the effect of old abandoned wells on housing prices in Pennsylvania found that they reduce house prices by

22
an average of 11% or $15,000 and have a larger negative effect than producing oil and gas wells.22 This study also found that proper well restoration can reverse these negative effects and that the benefits of proper well plugging are larger than the costs.
Another recent study by scholars at the University of Pittsburgh that explored unplugged wells in Washington County, Pennsylvania found that they can reduce real estate investment and lower the tax base in a county.23 The study found that “the typical unplugged well leads nearby properties to have a market value 12% less than properties near plugged wells. By limiting the tax base, unplugged wells in one school district reduce annual revenues by at least $112 per student.”
Plugging Problems
The typical lifespan of a plugged well is largely unknown. However, it is generally understood that wells plugged before 1950 – which make up the vast majority of orphan and legacy wells – are considered unplugged or not plugged to modern standards.24 Prior to the 1950s, wells were either not plugged at all or plugged with very little cement. In some instances, wells were plugged with wood, brush, rocks, or paper and linen sacks. In Pennsylvania, a regulation passed in 1921 stipulated that abandoned wells be plugged with “well seasoned, round
wooden plugs.”25 After 1952, when the American Petroleum Institute standardized plugging procedures and cement composition for wells, the cement plugs were more commonly adopted. Before 1952, the cement plugs used were often contaminated with mud and failed to harden into effective seals to protect against leaks.
For the most part, the basic technologies for plugging and abandoning wells (P&A) have not changed significantly since the 1970s. Cement is still the primary plugging material used to plug wells. The problem with cement is that it can shrink and crack and cause leaks into adjacent zones and the atmosphere.26 The cement used by various plugging methods can also get contaminated by drilling fluid. Research by Mercy Achang and others in 2020 concluded that the “next-generation P&A is likely to use new materials” and that innovations and advancements will be critical “to achieve permanent P&A in the future.”
According to a 2011 report by the National Petroleum Council, “little actual research has been done on the materials and procedures for plugging oil and gas wells.” The National Petroleum Council finds that “lack of progress in P&A practices is attributable to absence of a long-term vision, and inattention to corresponding research, that recognizes the benefits of P&A to oil and gas development projects.”27 The report

23
finds that “most wells are plugged at the lowest cost possible” because they are an “afterthought” that provides “no return on investment” for oil and gas companies. While states have different regulations regarding plugging and abandonment, there is no uniform or gold standard. Investment into modernizing P&A standards, materials, and processes are warranted to ensure that the plug life is as long as possible. Today, it appears, it is not one and done.

Section Three:
24
When an oil or gas well reaches the end of its useful life, it typically undergoes a process called “plug and abandonment” or P&A for short. This includes plugging the well, restoring or reclaiming the well site, and remediation of contaminated areas. Some aspects of well site restoration are supposed to occur after a well is drilled, completed, and out of production. This includes removal of industrial waste and drilling equipment (tank, separators, etc.), restoration of disturbed land, implementation of storage water management and prevention of erosion and sedimentation. In general, well plugging often consists of pumping cement into a well - usually at the top and bottom - and adding a cement (or gel) plug to cap the well to isolate zones that produce oil and natural gas to prevent leaks to groundwater and at the surface. However, well plugging and reclamation standards vary by jurisdiction.
At the federal level, regulations on well site reclamation are sparse on the technical requirements for plugging.1 Regulations from the National Park Service (NPS) enumerate that wells must be plugged to “prevent a pathway of migration for fluids along any portion of the bore…and leave the surface in a clean and safe condition that will not impede surface reclamation or pose a hazard to human health and safety.”2
In addition, NPS regulations for the exploration and development of non-federal oil and gas rights located within park boundaries require removal of aboveground structures, equipment, roads no longer needed for future operations, man-made debris that resulted from operations, and contaminating substances; and the restoration of the natural contour of the land, replacement of the natural soils needed for vegetation and reestablishment of native vegetative communities.3
The laws and regulations governing well plugging and site reclamation standards at the state level vary by jurisdiction as well. In Ohio, for example, new rules governing well plugging took effect in 2020 that added a requirement for operators to develop a detailed written plugging plan and updated the manner in which a well may be plugged and what precautions, standards, and procedures operators may or may not follow.4 The new Ohio rules reference widely adopted and commonly recognized scientific standards in the oil and gas industry for plugging wells.5 In Pennsylvania, the law states that the general rule is that a well be plugged “in the manner prescribed by regulation of the department to stop vertical flow of fluids or gas within the well bore” and additional provisions address well site restoration.6Uniformity in regulatory requirements for restoration and plugging
Cost of Plugging Wells in the United States and Ohio River Valley States

25
standards across states could aid in more cost-effective plugging and restoration, as well as better ensure the technical integrity and longevity of the investments.7
Factors Determining Well Plugging Costs
The costs associated with plugging and well site restoration can vary dramatically, depending on a number of factors, from a few thousand dollars to more than one million dollars. For example, if the integrity of the well casings is poor or the wellbore has collapsed, then it will have to be redrilled, increasing the costs and length of time to plug the well. Costs for plugging wells also increase depending on the depth; the deeper the well the more expensive it is to plug. Other factors include the extent of surface contamination that needs to be remediated and whether tanks and equipment need to be removed. There are also variations in how much plugging companies charge based on market competition.
The terrain surrounding a well (site location) is also a factor. Plugging often requires very heavy drilling equipment (rigs), sometimes requiring the building of roads to reach wells or navigating difficult site conditions. The cost dramatically increases if a well has contaminated groundwater or if it is located near homes or buildings. Plugging costs
for conventional and unconventional wells can also differ due to the relative complexity of the well construction.
Another important factor in cost is availability of contractors and the number of wells included in a contract. The cost of well site restoration usually decreases with the number of wells included in a contract. Well plugging services are usually willing to make lower bids to obtain larger contracts because they can benefit from the economies of scale. One recent study of well plugging contracts in Pennsylvania found that the average well reclamation costs per foot for large contracts is one-third of the cost of small contracts.8
Plugging Costs in Ohio River Valley States
According to a recent survey by the Interstate Oil and Gas Compact Commission of its 30 member states, the average plugging cost per orphan well was $18,940 for 2,377 wells in 23 states in 2018. The average restoration cost per orphan well for 1,554 sites was $5,078 for eight states in 2018.9 The total average cost per well for plugging and restoration was $24,018.
A closer look at average well plugging costs reveals that plugging and restoration costs can vary wildly by state, especially considering the

26
small number of wells and sites included in the survey. For example, in 2018, according to the Interstate Oil and Gas Compact Commission survey, West Virginia did not plug any wells, but did restore three well sites at an average cost of $26,535, while Pennsylvania plugged just 6 wells at an average cost of $79,606 per well. The average plugging cost in Ohio was $58,824 for 51 wells, while in Kentucky the average plugging costs were just $3,667 for nine wells. The average plugging costs in Ohio, Pennsylvania and West Virginia are higher than the national average of 23 states included in the Interstate Oil and Gas Compact Commission survey mentioned above. A recent analysis by Daniel Raimi with Resources for the Future found that the median cost to plug a well and remediate the surface was $48,000 based on approximately 3,300 wells in various states.10
To determine the average plugging costs (which often include well site restoration costs) for the four Ohio River valley states it is imperative to look at a large sample size for each state. Figure 7 below shows average and median plugging costs for the four states based on data from state agencies that includes thousands of wells. At the low-end, the plugging costs in Pennsylvania are $33,000 per well, $54,011 for West Virginia, $6,500 for Kentucky and $87,508 for Ohio. At the high-end, the average plugging cost is $36,535 in Pennsylvania, $115,949 in West Virginia, and $111,499 in Ohio. The plugging cost for Kentucky is
$6,500 in both scenarios, based on an estimate from the state of Kentucky. However, Diversified Gas & Oil estimates that they will spend $28,400 per well in Kentucky plugging wells.11
As discussed earlier, the cost of plugging wells can also decrease based on contract size. Therefore, if a state or another entity were to scale up a program to plug wells there is a good chance that the average plugging costs could decline. Plugging costs could also decline over time as states tend to address the worst abandoned wells and then move onto less problematic wells over time.

27
Figure 7: Estimated Plugging Costs in Ohio River Valley States
Source: WV Dept. of Environmental Protection, Ohio Department of Natural Resources, Kentucky Division of Oil and Gas, Pennsylvania Department of Environmental Protection, Interstate Oil and Gas Compact Commission, and Kang et al. “Identification and Characterization of High Methane-Emitting Abandoned Oil and Gas Wells,” Proceedings National Academy of Science USA, Vol.113:13636-13641, November 14, 2016 (supporting information).
$0 $20,000 $40,000 $60,000 $80,000 $100,000 $120,000 $140,000
KYDOG (mean): KY
Kang et al. 2016 (median): PA
IOGCC (mean): US
PADEP (mean): PA
WVDEP (median): WV
Kang et al. 2016 (mean): PA
WVDEP (mean): WV
OHDNR (median):OH
OHDNR (mean):OH
WVDEP (last five years):WV

28
Figure 8 shows the estimated cost to plug the 537,811 abandoned oil and gas wells in the four states using the low- and high-end state plugging cost based on the data in Figure 7. The costs range from $25 billion to $34 billion, based on an average per well plugging cost of $47,000 and $64,000, respectively. It is important to recognize that the number of unplugged abandoned wells included here is likely a conservative estimate. As section one illustrated, there could be more than a million unplugged or improperly plugged abandoned and orphan oil and gas wells in the four states.
Figure 8: Estimated Cost to Plug Abandoned Oil and Gas Wells in Ohio River Valley States (expressed in billions)
$4.10 $6.60
$13.90
$0.67
$25.27
$8.80 $7.30
$17.70
$0.67
$34.47
West Virginia Pennsylvania Ohio Kentucky Total
Low High
Note: Authors’ calculations of low and high plugging costs multiplied by number of wells in each state. West Virginia (low = $54,011, high = $115,949), Pennsylvania (low = $33,000, high = $36,535), Ohio (low = $87,508, high = $111,499), and Kentucky (low and high = $6,500). Number of wells used for each state: West Virginia, 75,821; Pennsylvania, 200,000; Ohio, 158,679; and Kentucky 103,311.

Section Four:
29
The benefits of a large-scale federal investment to plug and restore abandoned oil and gas wells in the Ohio River Valley region would be enormous. First, it would create thousands of new jobs in the oil and gas and construction industry, which has suffered tremendously over the last several years. These jobs would most likely be in distressed counties, where unemployment is high and incomes are low, and that often lack the fiscal resources to provide a strong foundation for economic prosperity.
The other major benefit from plugging wells is that it could reduce methane leaking from the wells that contribute to greenhouse gas emissions. In addition to reducing methane emissions, plugging wells could also reduce emissions from volatile organic compounds (VOCs) that can harm air quality and pose risks to human health. Proper plugging and site restoration can also enhance public safety, protect ground and surface water, and help improve property values and investment.
Growing Jobs and Curbing Harmful Greenhouse Gas Emissions from a Large-Scale Investment in Plugging Wells
The Need for Boosting Jobs in the Region
The Ohio River valley has a long history of oil and gas drilling that dates back to the mid-1800s during the oil rush. The Appalachian Basin, which encompasses Western Pennsylvania, Ohio, Kentucky, and West Virginia, was the leading oil-producing region in the United States through the early 1900s. This helps explain the large share of orphan and abandoned wells in the region compared to the rest of the nation. However, by the mid-20th century the region played a much smaller role in oil and gas production. From 1967 to 2009, the four Ohio River valley states made up less than three percent of total gas production and less than one percent of oil production in the nation.1 However, since the onset of shale drilling in Appalachia in 2010, the states of Ohio, West Virginia, and Pennsylvania now make up nearly 29% of natural gas production in the nation.

30
Figure 9: Ohio River Valley States Lost 12,770 Upstream Oil and Gas Jobs from 2014 to 2019
Source: U.S. Bureau of Labor Statistics (QCEW), NAICS Codes 211 and 213. Note: In 2019, oil and gas related support activities made up approximately 92.7% of “support activities for mining” in ORV states.
0
5,000
10,000
15,000
20,000
25,000
30,000
35,000
40,000
45,000
50,000
Oil and gas extraction Support activities for mining

31
Figure 9, on the previous page, looks at employment levels in the “upstream” part of the oil and gas industry, which includes extraction of hydrocarbons and support activities for operations and exploration. While employment in upstream oil and gas industries initially increased because of a rush to develop the rich mineral deposits in the Marcellus and Utica shales, employment has declined by nearly 13,000 or by 27% over the last five years in the region. In fact, total upstream oil and gas industry employment is at roughly the same level as it was right before the shale boom in the Ohio River Valley states.
Since the COVID-19 pandemic, employment in the oil and gas industry has fallen even further. Total employment in upstream oil and gas industries in the four states was 34,754 in the 3rd quarter of 2019, but a year later it dropped to 23,879 in the 3rd quarter of 2020 – a loss of 10,875 jobs. Total wages in upstream oil and gas industries have also declined. From 2014 to 2019, total annual wages dropped from $3.8 billion to $2.7 billion in the region, a decline of $1.1 billion (2019 dollars).
Before the COVID-19 pandemic, the oil and gas industry in Appalachia was already facing significant economic headwinds, including a collapse in capital spending, negative free cash flows (expenditures > revenues), increased debt, a slew of bankruptcies, and the selling off of
billions of shale gas assets in Appalachia by major oil and gas producers like Chevron and Shell.2 It is unlikely that employment levels will return back to their levels reached in 2014 given the financial health of the industry and as policymakers continue to make progress toward decarbonization.
Over the next decade, projections from state labor agencies in Ohio, Pennsylvania, and West Virginia show that oil and gas employment will grow by an annual rate of less than 1 percent, or by 2,900 jobs.3 A recent analysis also found that overall job growth in the region will be mostly concentrated in low-wage occupations, with 60% of new job growth paying below a living wage.4
On top of the decline in upstream oil and gas employment, the region has long suffered from the deindustrialization that began in the late 1970s and continues into the present. Many of the rural counties in the region where natural resource extraction has taken place have never recovered from the collapsing coal, steel, chemical, and glass industries that populated the area.5

32
Job Creation in Ohio River Valley States from Abandoned Oil and Gas Wells Plugging Program
As highlighted above, there has been a sharp contraction in upstream oil and gas employment in the region. According to industry experts, “there is a clear match between the skills of unemployed oil and gas workers and the requirements needed to plug orphaned and other abandoned wells properly.”6 This means there should be a supply of skilled unemployed workers able to fill demand if a large-scale federal investment in abandoned and orphan well clean-up was in place. However, any program to invest billions of dollars into plugging and restoring abandoned and orphaned wells should also include investments in training a skilled workforce to allow other workers to have jobs within the industry, especially women and people of color who are often left out of such efforts. For example, in 2020, only 15% of upstream oil and gas workers were women and just 6% were Black.7
The number of workers it takes to plug a well varies considerably across states. An examination by Resources for the Future (RFF) that looked at labor requirements in three states – including Pennsylvania –found that on average “plugging ten wells requires 2.4 person-years of work.” An examination of a single-well contract in West Virginia provided similar results, showing that plugging one well takes
approximately 465 labor hours or 2.2 person years of work for 10 wells (assuming a 2,000-hour work year).8 The Center for American Progress estimates that expenditures of $2 billion to plug and restore 57,000 would create 14,000 to 24,000 jobs at a cost of $142,900 and $83,300, respectively.9
According to an industry trade group calculator used by the Pennsylvania Department of Environmental Protection (DEP), every $25 million invested in plugging oil and gas wells creates approximately 300 annual jobs, or about $83,333 per job.10 The average annual compensation per job is estimated at $58,024, according to the calculator. While the estimates from Resources for the Future provide a good cross-section of estimates by various jurisdictions, they rely on a cost per well basis that can distort job creation estimates where there is a wide variation in well plugging costs. For example, the typical cost to plug a well in Kentucky is just $6,500 compared $87,500 in Ohio, which is 13.5 times as expensive.
Using the estimate provided by the Pennsylvania DEP, plugging the 538,000 unplugged abandoned oil and gas wells in the four-state region would yield 303,000 job-years. If expenditures for well plugging were allocated over a 20-year period, this would be about 15,151 jobs per year in the four states. This figure is slightly above the 12,770 oil

33
and gas jobs that have been lost over the last five years in the region. Figure 10 shows the estimated number of annual jobs per state over 20 years. It does not include indirect jobs, induced effects, or administration jobs, which would further stimulate the economy and grow more in the four states or the region.
Methane Reduction from Plugging Wells
While some plugged wells emit methane, unplugged wells emit at far higher levels. As discussed earlier, the EPA estimates that unplugged abandoned wells produce about 170 times the methane as plugged abandoned wells on average. The amount of methane leaking from unplugged abandoned oil and gas wells varies from studies. The EPA estimates that the average methane (CH4) emissions per well is approximately 0.13 metric tons annually. Studies that have looked at Appalachian states, including Ohio, West Virginia, and Pennsylvania, have found varying results. The results range from 0.02 metric tons to 0.27 metric tons of methane annually, according to six recent peer reviewed studies.11
Figure 10: Estimated Job Years for Plugging 538,000 Wells in Ohio River Valley States
Source: Authors’ analysis of Pennsylvania Department of Environmental Protection data
403
2,4573,960
8,331
15,151
Kentucky West Virginia Pennsylvania Ohio Total

34
Figure 11: Estimates of Methane Emissions from Unplugged Abandoned Wells in Ohio River Valley States
Source: U.S. EPA (2020) and other studies (see endnotes)
0 20,000 40,000 60,000 80,000 100,000 120,000 140,000 160,000
Saint-Vincent et al. (2020) (PA)
Riddick et al. (2019) (WV)
EPA (2020)
Kang et al.(2016)
Townsend-Small et al. (2016) (OH)
Pekney et al. (2018) (PA)
Kang et al. (2016) (PA, noncoal areas)
(metric tons methane)

35
Figure 11, on the previous page, looks at the total emissions for the estimated 538,000 unplugged wells for the four states in the mid and upper Ohio River Valley region based on several estimates. The annual methane emissions range from about 10,800 metric tons to 145,200 based on the seven estimates. Using the EPA estimates of 0.13 metric tons of methane annually shows that the unplugged abandoned wells in the four states may emit nearly 71,000 metrics tons of methane annually. Using the estimated number of unplugged abandoned and orphaned wells in each state, this amounts to about 10,000 metric tons of methane in West Virginia, 21,000 in Ohio, 26,000 in Pennsylvania, and 14,000 in Kentucky.
To put 71,000 metric tons of methane in context, it is equivalent to about 1.8 million metric tons of carbon dioxide or CO2 equivalent (CO2e), according to the EPA’s Greenhouse Gas Equivalencies Calculator.12 The EPA uses a 100-year methane global warming potential (GWP) of 25 in its calculator. According to EPA estimates, 1.8 million metric tons of carbon dioxide (CO2e) is the equivalent of greenhouse gas emissions from 383,000 passenger vehicles driven or 4.4 million miles driven.13 The CO2 emissions from 71,000 metric tons of methane is equivalent to about 200 million gallons of gasoline consumed, about 2 million pounds of coal burned or what it takes a typical coal-fired power plant to burn for six-months, according to the EPA.
Cost-Benefit of Plugging Abandoned Wells
If there is a program to plug the estimated 538,000 wells in these four states one key tool to evaluate the costs and benefits of such a program is the social cost of carbon (SCC), which is an attempt to monetize the damages associated with emitting one extra ton of greenhouse gas or carbon dioxide equivalent CO2e. The social cost of carbon is used by policymakers and other stakeholders to put a price tag on a ton of emitted CO2 that takes into consideration future damages associated with climate change, such as mortality and health effects, reductions in labor productivity and agriculture production, and property damage from flooding and hurricanes. For example, if the social cost of carbon is $75 per ton in 2030 then any investment below this amount could be justified on a cost-benefit basis.
In February of 2021, the Interagency Working Group on Social Cost of Greenhouse Gases (IWG) released interim estimates to update the social cost of carbon, methane, and nitrous oxide.14 According to the Inter Agency Working Group, the social cost of carbon ranges from $14 to $152 per ton in 2020, with a central value of $51 using a 3% discount rate and $76 using a 2.5% discount rate. The social cost of methane (SCM) ranges from $670 to $3,900 per ton in 2020, with a central value of $1,500 using a 3% discount rate and $2,000 using a

36
2.5% discount rate. By 2050, the social cost of carbon rises to $116 per ton and the social cost of methane rises to $3,800 using a 2.5% discount rate. These estimates are likely on the lower end.
A 2017 study found the social cost of methane to be over $4,800 per ton in 2015 dollars, four times higher than the IWG estimate, when including air quality, health/ecosystem, and fossil methane impacts.15More recently, Nobel Laureate Joseph Stiglitz and Lord Nicholas Stern found that the social cost of carbon should be at least $100 per metric ton instead of $51.16 Further, there is no scientific consensus about the correct way to discount for the social cost of carbon. Many scholars claim that the underpinnings of the model leave much to be desired, like the use of a 3% discount rate which many deem as too high.17
As discussed above, the estimated 538,000 unplugged abandoned wells in the four Ohio River Valley states emit about 71,000 metric tons of methane per year and will cost an estimated $25.3 billion to plug and restore. Using a 2.5% discount rate and assuming the wells are plugged over a 20-year period and the plugs last roughly 100 years, this equates to about 2.6 million metric tons of methane over 100 years, assuming the wells emit at a constant rate. Based on these figures, the abatement costs are around $9,800 per metric ton of methane.
Using the above estimates and the 2021 IWG estimates for the social cost of methane in 2020, this would equate to roughly $349 per ton of carbon dioxide equivalent (CO2-e) using a global warming potential of 34 over a 100-year period. This assumes that an estimated 72.3 million tons of carbon dioxide equivalent are mitigated over 100 years.
Using a 20-year global warming potential of 86, which emphasizes gases like methane that have a shorter lifetime, the estimated cost is $141 per ton of carbon dioxide equivalent (CO2-e). If the well plugs only last 50 years, the cost of mitigation would rise significantly, perhaps double. If the methane emissions end up being higher and well plugging costs lower, it would lower the per ton cost significantly.
This all being said, the estimated $349 per ton of CO2e is on the higher end of the IWG 2021 estimate for the social cost of carbon. However, it is important to consider other positive benefits such as employment, groundwater protection, improved air quality and health and safety, and the impact on the ecosystem. For example, a 2021 study found that plugging and restoring the land near an estimated 430,000 non-producing wells in the United States would cost about $7 billion but provide $21 billion in benefits from increased agriculture sales and carbon sequestration from reforestation.18

Section Five:
37
Over the last year, there have been several federal proposals to address problems associated with orphaned oil and gas wells and provide a “green stimulus” to states. At the same time, there has also been a proposal to create a large-scale federal program and structure to deal with not only the millions of abandoned and orphaned oil and gas wells but all oil and gas well liabilities and issues.
While providing additional funding to states and tribes to address orphan and abandoned wells is important and critical, it does not solve the billions in legacy costs that have accumulated from abandoned oil and gas wells over the last 150 years let alone wells that are currently at risk of being orphaned or drilled in the future. This will require a long-term solution that ensures the industry pays for most, if not all, of the clean-up costs and monitoring needed to address these problems.
Federal Proposals to Clean Up Orphan Wells
As part of its “Build Back Better Recovery Plan,” the Biden administration has proposed to “create more than a quarter million [prevailing-wage] jobs…to plug the millions of abandoned oil and gas wells that pose an ongoing threat to the health and safety of our
communities.”1 While President Biden appears to be proposing a large program to address these hazardous wells, there has yet to be corresponding legislation introduced or any more detail provided on how this would be carried out. However, in 2020, there were several proposals to address orphan wells on federal lands and to provide grants to states and tribes. Those bills included the Moving Forward Act (H.R.2)2, the Plugging Orphan Wells and Environmental Restorations (POWER) Act3, and the Oil and Gas Bonding Reform and Orphaned Well Remediation Act4.
Each of the bills includes an orphan well remediation program for oil and gas wells located on federal lands and a grant program for states and tribes with orphan wells located on state, tribal and private lands. Table 1 below provides a summary of the provisions related to states and tribes for each bill, including funding amounts, how the funds will be distributed, eligibility, and use of the funds. While all three bills create a grant program for states and tribes to remediate, reclaim, and close orphan wells, the Oil and Gas Bonding Reform and Orphan Well Remediation Act creates a new orphan well remediation program for federal lands that includes new federal bonding and financial assurance requirements, “uniform standards” for reclamation,
Program Structure and Federal Proposals

38
regulations for inactive wells, and a centralized database relating to wells on federal land. In contrast, the POWER Act simply appropriates money for orphan well clean-up on federal lands while creating a new grant program within the U.S. Department of Interior to address orphan wells on state and tribal lands.
While the Oil and Gas Bonding Reform and Orphaned Well Remediation Act modernizes bonding requirements, establishes new standards for inactive wells and clean-up, and improves accountability for wells on federal land, it does not mandate that states and tribes do the same nor does it provide enough funds to adequately address the orphan well liability in those states, let alone other abandoned wells or active wells. Moreover, the three proposals include a short-term amount of funding ranging from $2 billion to $3 billion over five or ten years. The scale of the problem in state and tribe areas – where the vast majority of orphan and abandoned wells are located – is much larger.

39
assurance requirements, “uniform standards” for reclamation, regulations for inactive wells, and a centralized database relating to wells on federal land. In contrast, the POWER Act simply appropriates money for orphan well clean-up on federal lands while creating a new grant program within the U.S. Department of Interior to address orphan wells on state and tribal lands.
While the Oil and Gas Bonding Reform and Orphaned Well Remediation Act modernizes bonding requirements, establishes new standards for inactive wells and clean-up, and improves accountability for wells on federal land, it does not mandate that states and tribes do the same nor does it provide enough funds to adequately address the orphan well liability in those states, let alone other abandoned wells or active wells. Moreover, the three proposals include a short-term amount of funding ranging from $2 billion to $3 billion over five or ten years. The scale of the problem in state and tribe areas – where the vast majority of orphan and abandoned wells are located – is much larger.
Moving Forward Act of 2020 (H.R.2) Plugging Orphan Wells and Environmental Restoration (POWER) Act of 2020 (HB 8332)
Oil and Gas Bonding Reform and Orphaned Well Remediation Act 2020
(S.4642)
Total Allocation $2 billion (5-year total) $2.25 billion (5-year total) $3 billion (10-year total)
Federal Allocation $250 million (12.5%) $250 million (11.1%) $750 million (25%)
State/Tribe Allocation $1.75 billion (87.5%) $2 billion (88.8%) $2.25 Billion (75%)
State/Tribe Funding Formula or Distribution
Based on documented/undocumented wells and amount of oil/gas actives in last 10 years
Priority given to States and Tribes with orphan well programs; funding formula takes into account number of orphaned wells,
amount of gas/oil activity in previous 10 years and number of oil/gas sector jobs lost since March 1, 2020.
Uses existing and updated inventories of orphaned well sites based on those posing
greatest adverse impacts for first two years; for following years the formula uses inventories and
whether states/tribes have bonding equal to remediation costs.
State/Tribe Eligibility
Prioritized list of wells, well sites, and affected areas; description of activities; reclamation costs; estimated
health/safety/environmental benefits; number of jobs; administration costs; and public disclosure; priority given to
jurisdictions that have orphan well programs and that require companies to have financial assurance equal to full cost of well
closure and land remediation.
Prioritized list of wells and well sties for clean-up; description of activities to be carried out, including risk factors, cost, estimated
jobs created or saved, administration costs, and public disclosure. Same as formula
Use of FundsReclaiming, remediating, and closing orphan wells, well pads,
access roads and restoring native species habitat; identify, rank, and characterize undocumented orphan wells; 10% of
administration;
Remediating, reclaiming, and closing orphan well and well sites; ranking of abandoned and orphan wells by risk factors; identification
of undocumented orphan wells; make efforts to determine responsible party associated with orphan well and well sites to get reimbursement for expenditures; 10% for administration; making
use of funds public.
Remediating, reclaiming, and closing orphan well and well sites; ranking of abandoned and orphan wells by risk factors; provide public accounting of
costs and to determine responsible party associated with orphan well and well sites to get
reimbursement for expenditures.
OtherTechnical assistance provided on financial assurance, ranking well
sites, training programs on best practices for remediation and funding for state mitigation efforts on a cost-shared basis.
Technical assistance provided on financial assurance, ranking well sites, training programs on best practices for remediation and
funding for state mitigation efforts on a cost-shared basis. Also includes immunity from civil lability for well plugging companies.
Unused funds to States and Tribes goes to federal orphan well program.
Table 1: 2020 Federal Orphan Well Legislation Relating to States/Tribes
Source: Congress.gov, 116th Congress (2019-2020), S.4642, H.R.2, and HB

40
Orphan Well Costs Far Exceed Proposed Federal Allocations
According to the Interstate Oil and Gas Compact Commission, states are plugging and restoring only a tiny fraction of estimated orphan and abandoned wells that need addressed.5 In 2018, states spent $52.9 million plugging 2,377 wells and restoring 1,554 well sites. Meanwhile, there is 56,600 documented orphan wells along with an estimated 211,000 to 746,000 undocumented orphan wells in the states. Using an average plugging and restoration cost of $30,000 per well means it would cost an estimated $24.1 billion to clean-up these well sites. Using the EPA figure of 2.1 million unplugged onshore abandoned wells –which includes some inactive, idle, and suspended wells - raises the cost to $64.8 billion.
At the current rate of plugging 2,377 wells per year, it would take states 338 years to plug the estimated 802,541 documented and undocumented orphan wells identified by the Interstate Oil and Gas Compact Commission. It would take 895 years based on the number of unplugged abandoned wells using the EPA estimate of 2.1 million wells. According to Carbon Tracker, there are 3.8 million unplugged onshore wells in United States, including 1.2 million unplugged abandoned wells and 2.6 million wells that are at risk to be orphaned. If states were to inherit this lability, it would take them 1,600 years to plug these wells
at the current rate.
As discussed previously, Carbon Tracker estimates the total cost to close 2.6 million unplugged onshore wells at risk of being orphaned to be between $78 billion to $280 billion. These projections do not account for the estimated 1.2 million undocumented unplugged onshore wells included in the aforementioned EPA estimates. These figures also partially exclude the number of wells that could become abandoned if the United States achieves net-zero carbon emissions by 2050. According to projections from Princeton’s Net-Zero America project, meeting net-zero emissions by 2050 will “require the earlier than planned closure of an estimated 0.5 million gas wells during the first decade of transition, requiring $25 billion for plugging and abandoning wells in addition to other remediation costs.”6
It is clear from the well data that has been accumulated that financial risks and costs to states, tribes, and the federal government is two-fold. On the one hand, there are at least two million orphan wells that are unplugged or not plugged to modern standards and do not have a responsible owner to pay for clean-up costs. Most of these wells were abandoned before states had orphan well programs (mid-1970s) and would likely need to be re-plugged and cleaned up.

41
Repairing the Damage from Abandoned Oil and Gas Wells: A Federal Plan to Grow Jobs in the Ohio River Valley and Beyond | Ted Boettner
Figure 12: States Spending a Tiny Fraction of What Is Needed to Plug and Restore Orphan Oil and Gas Wells
Source: IOGCC (2020) and EPA (2020)Note: Plugging costs are estimated at $30,000 per well
$63.8 billion
$24.1 billion
$2.25 billion
$52.9 million
Cost to plug 2.1 unplugged abandoned wells (EPA)
Cost to plug 802,000 orphan wells (IOGCC)
Proposed federal funds for plugging wells (S.4642)
State plugging/restoration expenditures (2018)
42
On the other hand, there is a second wave of wells that are mostly comprised of wells drilled after the 1950s that are either orphan wells, low-producing or stripper wells, recently idled or suspended wells, and active vertical or horizontal wells that are at risk of being the next generation of orphan wells. There will likely be wells drilled in the future and additional decarbonization rules in place, which could increase the number of wells at risk of becoming unplugged orphan wells.
Long-Term Solutions to Addressing Present and Future Orphan Wells
Tackling the twin issues of current orphan wells and wells that are at risk of being orphaned will require a federal structure and program. While states allocate funds to plug and restore orphaned wells, it is clear that at current rates it will likely take hundreds of years. Moreover, states have failed to require the adequate amount of bonding needed to cover plugging and restoration costs. Today, the industry has every incentive to forfeit the small amount of current bonds in place since they represent just a tiny fraction of the cost to plug and restore these well sites. A federal system that ensures oil and gas operators pay for the clean-up of wells would also level the playing field and ensure states are not engaged in a race to the bottom.
Another reason to have a federal program and structure in place is that abandoned wells will need to be monitored indefinitely. As discussed earlier, well plugging has a lifespan of between 50 and 100 years, sometimes just 10 years depending on the conditions and year when it was plugged. So, it is not one plug and you’re done. It will take large investments in well plugging technology, new uniform best practices, and the use of new materials to adequately ensure that wells stay closed for a longer period of time.
One long-term federal solution is the Abandoned Well Act of 2021 proposed by researcher Megan Millen Biven.7 The proposal would establish a new executive-level agency, the Abandoned Well Administration (AWA), to directly employ displaced oil and gas workers to identify and safely decommission the millions of oil and gas wells and related infrastructure across the nation, and oversee and manage a national monitoring system and safety response program. The AWA would be funded by a tax on all oil and gas wells, scaling back or eliminating tax subsidies on the oil and gas industry, and a new capital gains tax on oil and gas activities. The proposal also includes ending federal oil and gas leasing and establishing national bonding permits.

43
Using Abandoned Mine Land Program as a Guide
Another approach for how to structure a federal orphaned and abandoned well program could be to use the Abandoned Mine Land (AML) Reclamation Program as a guide. The AML program was created in 1977 under the Surface Mining Control and Reclamation Act (SMCRA) with the explicit goal of addressing the legacy costs associated with thousands of coal mines that were left abandoned across the country prior to 1977.8 Located within the U.S. Department of Interior, the Office of Surface Mining Reclamation and Enforcement (OSMRE) administers the AML program in Washington, DC with three regional offices to protect citizens and reclaim and restore land and water degraded by mining operations before 1977.
The AML program is funded by a per ton fee on coal production. Between 1978 and 2007, the fee was 35 cents per ton on surface coal mine production, 15 cents on underground coal mining, and 10 cents per ton on lignite.9 Today, those fees are 28 cents, 12 cents, and 8 cents per ton, respectively. In 1978, the average price of coal in the United States was $23.50 and the effective AML fee rate was 25 cents per ton or 1.08% of production value.10 For surface coal, the effective fee rate was 1.57% in 1979. In 2019, the average per ton fee was just 21 cents per ton while the effective fee rate was 0.60%.
The AML program has reclaimed over $6.5 billion worth of AML problems on over 800,000 acres of damaged land and water across the nation. Distributions of AML funds are based on a formula that is based on coal production and the amount of fees paid into the fund, which are determined by a complex formula that is mostly based on a state or tribe’s coal production instead of the documented problems that need to be addressed.11 The distributions of funds and grants to states and tribes has changed since the inception of the program.
OSMRE maintains an updated electronic Abandoned Mine Land Inventory System (e-AMLIS) that ranks AML problems on a priority scale from 1 to 3, with some exceptions. Priority 1 AML problems are catalogued as protection from “extreme danger of adverse effects of coal mining practices” to public health, safety, and property, while priority 2 are for protection from “adverse effects” of public health and safety, and priority 3 are for the “restoration of land and water resources” degraded by effects of coal mining practices pre-1977. The e-AMLIS breaks down into three cost categories, including unfunded costs (pre-construction estimates), pre-approved construction costs, and the amount of completed construction and reclamation.
While using the AML program as a guide and a precedent is helpful, the program has been dramatically underfunded. For example, the AML

44
program has only reclaimed about one-quarter of Abandoned Mine Lands after more than 40 years. This is partly due to the fee structure being too low, as the fees have been reduced over time and never updated to take into account inflation. Because of the inadequate amount of funding, the AML inventory is incomplete and inaccurate, and doesn’t provide a true scope of the updated location, human and environmental risks, and estimated cost of liabilities. Another issue is that the AML funding distribution formula is not tied to need but based partly on current and historic coal production.
The accumulation of thousands of abandoned coal mines and billions in clean-up costs occurred over a 200-year period because there was no federal system in place to reclaim the damage caused by coal mining. This is now happening with the millions of unplugged or improperly plugged orphan and abandoned oil and gas wells that are spread across the country. Moreover, there is likely to be a new generation of stripper wells, injection wells, temporarily idled wells, and unconventional wells that are near the end of their producing life that could become orphan wells in the future.
Establishing a federal abandoned well program similar to the AML program – but with adequate funding tied directly to need – would provide a structure to address the safety, health, and environmental
costs associated with abandoned and orphan oil and gas wells. For illustrative purposes, Figure 13 on the following page shows the potential revenue from an orphan and abandoned well fee placed on the production of natural gas and crude oil production similar to the effective AML fee rate in 1979 of 1.08% or production value. The graph shows two scenarios. The first is based on projected production and prices of natural gas and crude oil from 2022 to 2050 from the U.S. Energy Information Administration’s 2021 Annual Energy Outlook.12The second scenario is based on projected production data from a scenario of deep decarbonization from Princeton’s University’s Net-Zero America based on achieving zero emissions by 2050.13 The deep carbonization scenario includes natural gas and crude oil exports and incorporates price data from the Energy Information Administration (EIA). Both use an effective fee rate of 1.08% of production value.
The estimated revenue in the first scenario, which is based on EIA projected production, is $3.7 billion in 2022 and peaks at $6.5 billion in 2045. From 2022 to 2050, total revenue is estimated at $166 billion. The estimated annual revenue for scenario two, which is based on one of the paths of deep decarbonization developed by Net-Zero America, is $3.5 billion in 2020 and peaks at $5.5 billion in 2035. Total revenue over the period is estimated at $132 billion. These funds could be deposited in an Abandoned Oil and Gas Well Trust Fund similar to the

45
placement of fees from coal production into the Abandoned Mine Land Trust Fund.
While it is difficult to estimate projected revenues from an abandoned well fee into the future – given the high uncertainties of what policy decisions or innovations will impact future production – these revenue estimates are for illustrative purposes. Any proposal to attach a fee onto natural gas and oil production should be commensurate with a detailed accounting of estimated costs for plugging, reclamation, remediation, and environmental damage.
A production fee is by no means the only way to ensure that companies pay for the clean-up costs associated with orphan and abandoned wells. For example, the oil and gas industry receives an estimated $11 billion per year in tax and spending subsidies.14 Scaling back or eliminating the subsidies could open up space for annual federal outlays to an abandoned well plugging and restoration fund. Another idea would be to implement an environmental excise tax on current oil and gas operators similar to taxes created to establish the Superfund trust that paid for cleanup of uncontrolled hazardous waste sites.15 In 1993, the tax on domestic and imported crude oil was 9.7 cents per barrel and raised $539 million in tax revenues. A similar tax of 9.7 cents per barrel in 2020 could raise an estimated $680 million.16
Recommendations
There are a number of things to consider in designing a short-term and long-term solution to cleaning up the millions of onshore orphan and abandoned oil and gas wells. It is clear that states are not well positioned to pay for the clean-up costs for orphan wells let alone the ones that will likely become orphan in the not-so-distance future. This is especially true for the four states that make up the mid and upper Ohio River Valley region that contain a large portion of the unplugged abandoned oil and gas wells. The current bonding funds and requirements in most states are inadequate and it is unclear whether reform measures are taken in states the companies themselves have the financial health to pay the costs of plugging and abandonment.
Over the near term, the need for a $2 billion “green stimulus” similar to the POWER Act that combines job growth with methane emission reductions would greatly benefit states and tribes, especially places hardest hit by the decline in oil and gas employment. These funds could also help provide state orphan well programs develop a more robust inventory system of orphan and abandoned wells that could inform the structure of a large-scale federal program and the potential costs to plug and restore orphan and abandoned wells. This could alsohelp states develop a priority ranking of wells to be plugged based on a

46
risk assessment process and scoring system and to develop “shovel ready” projects. Funds could also go toward a youth-employment program – such as a revived Civilian Conservation Corps – to identify new orphan wells and take methane readings of wells.
Any proposal to send federal funds to states and tribes should consider prevailing wage provisions (Davis-Bacon), local hiring agreements, apprenticeship standards and intentional efforts to recruit women and people of color who are often left out of such projects. This could include funding for job training and safety and efforts to create federally recognized apprenticeship programs. There should also be an adequate amount of funds dedicated to administration and inspection staff. For example, West Virginia has just 14 oil and gas field inspectors while Kentucky has only 15, despite having nearly 200,000 unplugged abandoned wells.17
Investments in research and development and new technologies should also be considered in federal proposals. This could include the development of new materials and procedures for plugging oil and gas wells that could greatly improve plugging and abandonment operations and technology and help establish best practices and uniform standards, which could lower costs over the long run. Further, additional investments in innovative monitoring technologies
(e.g., drones with optical gas imaging cameras) to locate and measure methane emissions and leaks associated with natural gas wells could reduce greenhouse gases, reduce safety hazards, and help orphan well programs prioritize wells to plug.18
Over the long-term, there is a clear need for a federal program and structure similar in concept to the AML program to ensure the oil and gas industry pays for well plugging and restoration costs for orphan and legacy wells and other wells that could become wards of the states. This will require annual funding that far exceeds the allocations in current federal legislation. The program could be a federal-state partnership like the AML program, or be an entirely federal program similar to the proposed Abandoned Well Act.

Conclusion
47
Over the last 150 years, the accumulation of millions of orphaned and abandoned wells poses a serious threat to public safety and the environment and states are at great risk of being on the hook for billions in cleanup costs. At the same time, there is an extraordinary opportunity to develop pathways to address these issues and, in the process, create thousands of good jobs. This is especially true for the four states that make up the mid and upper Ohio River Valley region that contain a large portion of the unplugged abandoned oil and gas wells. A large federal program has the potential to create over 15,000 jobs per year over two decades that can provide significant social and economic benefits to distressed communities along with efforts to reduce greenhouse gases that are contributing to climate change. If significant federal action is not taken, the next generation of orphan wells could pose even greater challenges in the future.

State Congressional District Representative Estimated Unplugged Abandoned Oil and Gas Wells Job-Years Jobs Per-Year
(20-year period)CO2 Reduction (metric tons,
over 100 years)Outlay
(cost in millions)
Ohio 1 Steve Chabot 18 19 0.9 2,420 $1.6Ohio 7 Bob Gibbs 26,395 27,717 1,385.9 3,548,544 $2,310Ohio 2 Brad Wenstrup 255 268 13.4 34,282 $22.3Ohio 14 David Joyce 9,481 9,956 497.8 1,274,626 $830Ohio 6 Bill Johnson 54,071 56,780 2,839.0 7,269,305 $4,732Ohio 3 Joyce Beatty 23 24 1.2 3,092 $2.0Ohio 10 Michael Turner 48 50 2.5 6,453 $4.2Ohio 4 Jim Jordan 10,545 11,073 553.7 1,417,670 $923Ohio 5 Robert Latta 10,310 10,827 541.3 1,386,076 $902Ohio 16 Anthony Gonzalez 8,985 9,435 471.8 1,207,943 $786Ohio 13 Tim Ryan 5,717 6,003 300.2 768,593 $500Ohio 15 Steve Stivers 20,577 21,608 1,080.4 2,766,372 $1,801Ohio 11 Marcia Fudge 948 995 49.8 127,449 $83Ohio 9 Marcy Kaptur 849 892 44.6 114,140 $74.3Ohio 8 Warren Davidson 311 327 16.3 41,811 $27Ohio 12 Troy Balderson 10,146 10,654 532.7 1,364,028 $888
Kentucky 2 Brett Guthrie 16,442 1,282 64.1 2,210,462 $107Kentucky 6 Garland "Andy" Barr 3,777 295 14.7 507,780 $24.6Kentucky 1 James Comer 37,366 2,915 145.7 5,023,485 $243Kentucky 3 John Yarmuth 38 3 0.1 5,109 $0Kentucky 5 Harold "Hal" Rogers 44,792 3,494 174.7 6,021,836 $291Kentucky 4 Thomas Massie 896 70 3.5 120,458 $5.8
West Virginia 1 David McKinley 35,444 22,972 1,148.6 4,765,091 $1,914West Virginia 3 Carol Miller 15,587 10,102 505.1 2,095,516 $842West Virginia 2 Alex Mooney 24,790 16,067 803.4 3,332,768 $1,339Pennsylvania ALL 200,000 79,200 3,960.0 26,888,000 $6,600
Appendix A:
48
Congressional District Data by Ohio River Valley States
Table 1A: Estimated Wells, Jobs, Job-Years, CO2 Reduction, and Costs by Congressional District
Source: Analysis from Ohio River Valley Institute and FracTracker

Appendix B:
49
All state specific data below with known Latitude and Longitude were assigned a congressional district based on their location resulting in the data analyzed – and associated maps – presented in Section One.
Table 1: Summary of State-Specific Well Data
Ohio Methodology
We accessed the Ohio Oil and Gas Well locator CSV file produced by the Ohio Department of Natural Resources (https://ohiodnr.gov/wps/portal/gov/odnr/discover-and-learn/safety-conservation/about-odnr/oil-gas/oil-gas-resources/well-locator) which includes location and well information for 238,216 oil and gas wells across the state. The projection used for this data is North American Datum (NAD 83). The earliest wells in this data with known completion dates are Trenton Limestone oil wells completed between January 1885 and December 1898. However, only 79,537 of these wells have plugging dates associated with them, leaving 158,679 wells unaccounted for1 and the latter are the data we used for this analysis with respect to potential plugging costs/opportunities throughout Central Appalachian congressional districts (Figure 1A).
Congressional District Methodology
State Unplugged Producing Gas
Oil NGLs Unique Producing APIs
or Permit Numbers
Ohio 158,679 36,776 22,559 --- 43,232
Kentucky 103,312 8,880 5,605 --- 13,996
West Va. 75,821 55,674 8,817 1,232 57,253

50
Figure 1A: Producing Conventional and Unconventional Oil and Gas Wells Across Ohio (1985-2020)
Figure 2A: Unplugged and Plugged Wells throughout Ohio as of the Third Quarter of 2020 with Darker Areas Being Those Regions of the State Where Plugged and Unplugged Wells Most Overlap

51
The earliest documented plugged wells were two Trenton Limestone oil and gas wells plugged in November of 1890 in Auglaize County. Ohio’s highwater mark for plugging was the span between 1985 and 2000 when nearly 16,000 wells were plugged amounting to 29% of all plugged wells (Figure 3A). Unfortunately, the rate at which Ohio has been plugging wells has been declining at a rate of 5% per year since the 1990s.
Ohio Plugging Rate of Decline (% Per Year) = -115.1x + 233,980 (R2 = 0.967)
Kentucky Methodology
We accessed the Oil and Gas Well Shapefile produced by the Kentucky Geological Survey at the University of Kentucky (http://www.uky.edu/KGS/emsweb/data/ogwells.htm) which includes location and well information for 157,977 oil and gas wells across the state. The projection used for this data is either North American Datum (NAD 83) or North American Datum 27 (NAD 27). The earliest well in this data with a known completion date is an oil well completed in December of 1818 in McCreary County, and the most recent wells include nearly a dozen oil wells drilled around the 2019-2020 new year in Lawrence, McLean, Adair, Henderson, Breckinridge, and Clinton Counties. However, only 54,665 of these wells have plugging dates
Figure 3A: Five Year and Cumulative Number of Plugged Wells in Ohio from 1890 to 2020
0
5,000
10,000
15,000
20,000
25,000
30,000
35,000
40,000
45,000
50,000
55,000
60,000
0
500
1,000
1,500
2,000
2,500
3,000
3,500
4,000
4,500
5,000
5,500
Cum
ulative Num
ber of Plugged Wells
Num
ber
of P
lugg
ed W
ells
Per
5 Y
ear
Inte
rval
Five Year Interval
5 Year Plugging Number
Cumulative Number of Plugged Wells

52
associated with them, leaving 103,312 wells unaccounted for and the latter are the data we used for this analysis with respect to potential plugging costs/opportunities throughout Central Appalachian congressional districts (Figure 4A).
The earliest documented plugged well in Kentucky was a Dry & Abandoned well plugged in March of 1801 in Dundee County. Yet, the next plugging operations did not resume until more than a century later when 81 wells were plugged between 1904 and 1930. Kentucky’s highwater mark for plugging was the span between 1980 and 1995 when nearly 23,000 wells were plugged amounting to 41% of all plugged wells (Figure 5A). Unfortunately, the rate at which Kentucky has been plugging wells has been declining more steeply than Ohio at a rate of 13% per year since the early 1990s.
Kentucky Plugging Rate of Decline (% Per Year since the early 90s) = -170.5x + 345,828 (R2 = 0.914)
The rate of change has accelerated since before the 2008 Financial Crisis with plugging declining by 17% per year since 2005.
Kentucky Plugging Rate of Decline (% Per Year since 2006) = -225.7x + 457,231 (R2 = 0.987)
Figure 4A: Unplugged and Plugged Wells in Kentucky (Q3 2020) with Darker Areas Being Those Regions of the State Where Plugged and Unplugged Wells Most Overlap

53
Figure 5A: Five Year and Cumulative Number of Plugged Wells in Kentucky from 1900 to 2002
West Virginia Methodology
We accessed the West Virginia Well Location Data Geodatabase maintained by West Virginia Department of Environmental Protection (https://dep.wv.gov/oil-and-gas/databaseinfo/pages/default.aspx) which includes location and well information for 147,794 oil and gas wells across the state. The West Virginia DEP uses the Universal Transverse Mercator projection system for their data and the state sits within the UTM Grid #17 which we used to project all well data. The earliest wells in this data were a group of nearly two dozen vertical and Underground Injection Control wells issued on the first of the year in 1900 with eight of these wells still active. However, only 71,973 of these wells have been plugged, leaving 75,821 wells unplugged and the latter are the data we used for this analysis with respect to potential plugging costs/opportunities throughout Central Appalachian congressional districts (Figure 6A).
0
5,000
10,000
15,000
20,000
25,000
30,000
35,000
40,000
45,000
50,000
55,000
0
500
1,000
1,500
2,000
2,500
3,000
3,500
4,000
4,500
5,000
5,500
6,000
6,500
7,000
7,500
8,000
8,500
9,000
9,500
10,000
Cum
ulative Num
ber of Plugged Wells
Num
ber
of P
lugg
ed W
ells
Per
5 Y
ear
Inte
rval
Five Year Interval
5 Year Plugging Number
Cumulative Number of Plugged Wells

54
It should be noted that nearly 4,000 of these unplugged wells are currently – or were producing unconventional gas or oil – as of 2019, the most recent year we have documented production on a per well basis (Figure 7A).
Figure 4A: Unplugged and Plugged Wells in West Virginia (Q3 2020) with Darker Areas Being Those Regions of the State Where Plugged and Unplugged Wells Most Overlap

55
Figure 7A: Marcellus and Utica Shale Gas Production in Pennsylvania, West Virginia, and Ohio

Appendix C:
56
The estimated projected revenues from a 1979 AML equivalent fee on natural gas and oil production included in this report were derived from several sources. This includes projected natural gas and crude oil production and price data from the U.S. Energy Information Administration (EIA) Annual Energy Outlook of 2021 (Reference Case), projected natural gas and oil production data from Princeton University’s Net-Zero America E+ decarbonization pathways scenario, coal production and price date from EIA’s Annual Coal Report of 2019 and EIA’s Annual Energy Review 2011, and the current and historical AML per ton fee rate from the Office of Surface Mining Reclamation and Enforcement (OSMRE).
To estimate the effective AML fee rate on coal production required estimating the total production value of various types of coal that are subject to the fee. The EIA’s Annual Coal Report 2019 provides disaggregated coal production and price (dollars per short ton) by mining method (surface and underground) and coal rank (bituminous, subbituminous, anthracite, and lignite) from 1979 to 2019. For 2019, all surface production is assumed to be from subbituminous, anthracite, or lignite coal. For 1979, approximately 90% of anthracite coal produced is surface production based on data from the EIA’s 2011
Methodology for Estimating Potential Revenues from Equivalent Abandoned Mine Land (AML) Reclamation Fee on Natural Gas and Crude Oil Production
Annual Energy Review. Aside from 10% of anthracite produced underground in 1979, all other underground production is assumed to be bituminous coal. All subbituminous and lignite coal production is assumed to be from surface production in 1979, and the remaining bituminous coal not assigned to underground production is assigned to surface production. The estimates are provided from both 2019 and 1979 in Table 1 below.

57
Table 1: Estimated Coal Production Value, AML Fee Revenues, and AML Effective Fee Rates
Source: ORVI analysis, EIA annual coal dat, and OSMRE fee rates
Coal Price (nominal dollars
per short ton)
Tonnage (in thousands)
Production Value (in millions) AML Per Ton Fees Effective AML Fee
Rates
Estimated AML Fee Revenues
(in millions)
2019
Underground $58.68 267,373 $15,690 $0.12 0.20% $32
Surface $22.47 438,936 $9,863 $0.28 1.25% $123
Lignite $19.86 53,192 $1,056 $0.08 0.40% $4
2019 Total $35.03 759,501 $26,609 $0.21 0.60% $159
1979
Underground $27.33 320,891 $8,770 $0.15 0.55% $48
Surface $22.29 417,698 $9,310 $0.35 1.57% $146
Lignite $6.48 42,545 $276 $0.10 1.54% $4
1979 Total $23.50 781,134 $18,356 $0.25 1.08% $199

Endnotes
58
Section One
1. R.W. Hammack et al.,”Methods for Finding Legacy Wells in Large Areas,” National Energy Technology Lab, Pittsburgh, PA, June 16, 2016, retrieved from https://www.netl.doe.gov/projects/files/MethodsforFindingLegacyWellsinLargeAreas_061616%c2%a0.pdf2. “First American Oil Well,” Aoghs.org, August 24, 202, retrieved from https://www.aoghs.org/petroleum-pioneers/american-oil-history/3. James P. Williams et al.,”Methane Emissions from Abandoned Oil and Gas Wells in Canada and the United States,” Environmental Science and Technology, Vol.55 (1), December 15, 2020, retrieved from https://pubs.acs.org/doi/10.1021/acs.est.0c042654. “The Distribution of U.S. Oil and Natural Gas Wells by Production Rate,” U.S. Energy Information Administration, December 2020, retrieved from https://www.eia.gov/petroleum/wells/pdf/full_report.pdf5. “Idle and Orphan Oil and Gas Wells: State and Provincial Regulatory Strategies,” Interstate Oil and Gas Compact Commission, 2019, retrieved from https://iogcc.ok.gov/sites/g/files/gmc836/f/2020_03_04_updated_idle_and_orphan_oil_and_gas_wells_report_0.pdf6. U.S. Environmental Protection Agency, “Inventory of U.S. Greenhouse Gas Emissions and Sinks: 1990-2018,” Washington, DC., 2020, retrieved from https://www.epa.gov/ghgemissions/inventory-us-greenhouse-gas-emissions-and-sinks-1990-20187. U.S. Environmental Protection Agency, “Inventory of U.S. Greenhouse Gas Emissions and Sinks 1990-2016: Abandoned Oil and Gas Wells,” April 2018, retrieved from https://www.epa.gov/sites/production/files/2018-04/documents/ghgemissions_abandoned_wells.pdf8. Williams et al (2020) 9. See Abandoned and Orphan Oil and Gas Wells and the Well Plugging Program, Pennsylvania Department of Environmental Protection, retrieved from http://www.depgreenport.state.pa.us/elibrary/PDFProvider.ashx?action=PDFStream&docID=1419023&chksum=&revision=0&docName=ABANDONED+AND+ORPHAN+OIL+AND+GAS+WELLS+AND+THE+WELL+PLUGGING+PROGRAM&nativeExt=pdf&PromptToSave=False&Size=411528&ViewerMode=2&overlay=0
10. Seth Pelepko, “Abandoned and Orphan Oil and Gas Wells in Pennsylvania,” Pennsylvania Department of Environmental Protection, CCAC, October 27,2020, retrieved from https://files.dep.state.pa.us/Energy/Office%20of%20Energy%20and%20Technology/OETDPortalFiles/Climate%20Change%20Advisory%20Committee/2020/10-27-20/Presentation_Abandoned%20Wells_Pelepko_20201027.pdf
Section Two1. Carbon Tracker Initiative, Asset Retirement Obligation (ARO) Portal, uploaded from https://carbontracker.org/tools-and-insights/aro-portal/2. Robert Schuwerk and Greg Rogers, “Billion Dollar Orphans: Why Millions of oil and gas wells could become wards of the state,” Carbon Tracker Initiative, retrieved from https://carbontracker.org/reports/billion-dollar-orphans/3. Jeremy Weber, “The Boom, the Bust, and the Cost of the Cleanup: Abandoned Oil and Gas Wells in Pennsylvania and Implications for Shale Gas Governance,” United States Association for Energy Economics, Working Paper No. 18-358, September 18, 2018, retrieved from https://papers.ssrn.com/sol3/papers.cfm?abstract_id=32456204. Clark Williams-Derry et al., “In a Tumultous 2020, Shale Firms Slashed Capex To Generate Cash,” Institute for Energy Economics and Financial Analysis, March 2021, retrieved from http://ieefa.org/wp-content/uploads/2021/03/Shale-Producers-Spilled-2-Billion-in-Red-Ink-Last-Year_March-2021.pdf5. Matt Kelso, “Problems with Abandoned and Orphans Wells,” Fractracker Alliance, June 3, 2011, retrieved from https://www.fractracker.org/2011/06/problems-with-abandoned-and-orphaned-wells/6. Mary Kang et al.,”Reducing methane emissions from abandoned oil and gas wells: Strategies and costs,” Energy Policy, Vol.132, September 2019, retrieved from https://www.sciencedirect.com/science/article/abs/pii/S0301421519303490?via%3Dihub and see Anthropogenic and Natural Radiative Forcing (Chapter 8, Table 8.7), retrieved from http://www.climatechange2013.org/images/report/WG1AR5_Chapter08_FINAL.pdf7. U.S. Environmental Protection Agency, “Inventory of U.S. Greenhouse Gas Emissions and Sinks: 1990-2018,” Washington, DC., 2020, retrieved from https://www.epa.gov/ghgemissions/inventory-us-greenhouse-gas-emissions-and-sinks-1990-2018

59
8. See EPA calculator, retrieved from https://www.epa.gov/energy/greenhouse-gas-equivalencies-calculator9. Ibid. 10. James P. Williams et al.,” Methane Emissions from Abandoned Oil and Gas Wells in Canada and United States,” Environmental Science Technology, Vol.55 (1), retrieved from https://pubs.acs.org/doi/10.1021/acs.est.0c0426511 Kang et al. (2019)12. Stuart Riddick et al., “Measuring Methane Emissions from Abandoned and Active Oil and Gas Wells in West Virginia,” Science of The Total Environment, Vol.651, Part 2, February 2019, retrieved from https://www.sciencedirect.com/science/article/abs/pii/S0048969718339561?via%3Dihub13. Amy Townsend-Small et al, ”Emissions of coalbed and natural gas methane from abandoned oil and gas wells in the United States,” Geophysical Research Letters, Vol.43 (4), February 20, 2016, retrieved from https://agupubs.onlinelibrary.wiley.com/doi/abs/10.1002/2015GL067623 14. Jacob A. Deighton et al.,”Measurements show that marginal wells are disproportionate source of methane relative to production,” Journal of the Air & Waste Management Association, Vol.20 (10), August 2020, retrieved from https://www.tandfonline.com/doi/abs/10.1080/10962247.2020.1808115?journalCode=uawm2015. American Geosciences Institute (E. Allison and B. Mandler), “Abandoned Wells,” Petroleum and the Environment, Part 7, 2018, retrieved from https://www.americangeosciences.org/geoscience-currents/abandoned-wells16. Seth Pelepko,”Abandoned and Orphan Oil and Gas Wells in Pennsylvania,” Pennsylvania Bureau of Oil and Gas Planning and Program Management, presentation CCAC, October 27, 2020, retrieved from http://files.dep.state.pa.us/Energy/Office%20of%20Energy%20and%20Technology/OETDPortalFiles/Climate%20Change%20Advisory%20Committee/2020/10-27-20/Presentation_Abandoned%20Wells_Pelepko_20201027.pdf17. Ground Water Protection Council, retrieved from http://www.gwpc.org/sites/default/files/State%20Oil%20%26%20Gas%20Agency%20Groundwater%20Investigations.pdf18. https://stateimpact.npr.org/pennsylvania/2012/10/09/perilous-pathways-how-drilling-near-an-abandoned-well-produced-a-methane-geyser/19. Ibid20. Abandoned oil wells hidden under thousands of local properties,” WPXi-TV, November 20, 2018, retrieved from https://www.wpxi.com/news/top-stories/abandoned-oil-wells-hidden-under-thousands-of-local-properties/875732284/
21. Marcie Schellhammer,” Victim of house explosion files lawsuit,” The Bradford Era, June 18, 2013, retrieved from http://www.bradfordera.com/news/victim-of-house-explosion-files-lawsuit/article_fed27cbe-d7be-11e2-ac81-0019bb2963f4.html22. Mariya Shappo,” The Long-Term Consequences of Oil and Gas Extraction: Evidence from the Housing Market,” Working Paper November 1, 2020, retrieved from ,https://static1.squarespace.com/static/5be3321b4611a0ea4f46c49a/t/5f9f09deff6048551e5bc648/1604258300356/JMP_Shappo.pdf23. Max Harleman et al.”Environmental Hazards and Local Investment: A Half-Century of Evidence from Abandoned Oil and Gas Wells,” USAEE Working Paper No.20-470, September 15, 2020, retrieved from https://papers.ssrn.com/sol3/papers.cfm?abstract_id=369209824. S. Taku Ide et al., “CO2 leakage through existing wells: current technology and regulations,” retrieved from https://sequestration.mit.edu/pdf/GHGT8_Ide.pdf25. Robert M. Dilmore et al.,,”Spatial and Temporal Characteristics of Historical Oil and Gas Wells in Pennsylvania: Implications for New Shale Gas Resources,” Environmental Science & Technology, August 12, 2015, retrieved from https://pubs.acs.org/doi/10.1021/acs.est.5b0082026. Mercy Achang et al.,”A Review of Past, Present, and Future Technologies for Permanent Plugging and Abandonment of Wellbores and Restoration of Subsurface Geological Barriers,” Environmental Engineering Science, Vol.37 (6), June 2020, retrieved from https://www.liebertpub.com/doi/10.1089/ees.2019.0333#B2927. “Paper #2-25: Plugging and Abandonment of Oil and Gas Wells,” National Petroleum Council(Prepared by the Technology Subgroups of the Operations & Environment Task Group), September 15, 2011, retrieved from https://www.npc.org/Prudent_Development-Topic_Papers/2-25_Well_Plugging_and_Abandonment_Paper.pdf
Section Three1. See 36 CFR Chapter 1, Part 9, Subpart B (https://www.law.cornell.edu/cfr/text/36/part-9/subpart-B), 36 CFR Chapter II, Part 228, Subpart E (https://www.law.cornell.edu/cfr/text/36/part-228/subpart-E), and 43 CFR § 3162.3-4 (https://www.law.cornell.edu/cfr/text/43/3162.3-4) 2. See 36 CFR § 9.118(c)(5).3. See 36 CFR 9B (https://www.law.cornell.edu/cfr/text/36/part-9/subpart-B) 4. See https://codes.ohio.gov/ohio-administrative-code/chapter-1501:9-115. See https://codes.ohio.gov/ohio-administrative-code/chapter-1501:9-12

60
6. See 58 Pa. C.S. § 3220 https://www.legis.state.pa.us/WU01/LI/LI/CT/HTM/58/00.032.020.000..HTMand 25 Pa. Code § 78a.65 https://www.law.cornell.edu/regulations/pennsylvania/25-Pa-Code-SS-78a-657. Connor D. Hicks, “Plugging Problems: How States in the Ohio River Basin Can Address Orphan Oil and Gas Wells,” Kentucky Journal of Equine, Agriculture, and Natural Resources Law, Vol.3, January 7, 2021, retrieved from https://papers.ssrn.com/sol3/papers.cfm?abstract_id=37354938. Jeremy Weber, “The Boom, the Bust, and the Cost of the Cleanup: Abandoned Oil and Gas Wells in Pennsylvania and Implications for Shale Gas Governance,” United States Association for Energy Economics, Working Paper No. 18-358, September 18, 2018, retrieved from https://papers.ssrn.com/sol3/papers.cfm?abstract_id=32456209.https://iogcc.ok.gov/sites/g/files/gmc836/f/2020_03_04_updated_idle_and_orphan_oil_and_gas_wells_report_0.pdf10. Daniel Raimi, “Plugging Orphaned Oil and Gas Wells: What We Know and Need to Know,” Resources for the Future, February 25, 2021, retrieved from https://www.resources.org/archives/plugging-orphaned-oil-and-gas-wells-what-we-know-and-need-to-know/11. Diversified Gas & Oil, Investor Presentation, June 2019, retrieved from https://d1io3yog0oux5.cloudfront.net/_28d9d5529099b5877b9e19aa9798c2da/dgoc/db/557/4323/pdf/DGO+-+Investor+Presentation+-+June+2019_vFinal_updated+slide+13.pdf
Section Four1. Energy Information Administration (EIA), Natural Gas and Crude Oil Production, retrieved from https://www.eia.gov/dnav/pet/pet_crd_crpdn_adc_mbbl_a.htm and https://www.eia.gov/dnav/ng/ng_prod_sum_a_EPG0_FGO_mmcf_a.htm2. http://ieefa.org/wp-content/uploads/2020/12/Appalachian-Frackers-Spill-Red-Ink-in-Q3-Despite-Drastic-CapEx-Cuts_December-2020.pdf3. Data from on Ohio, Pennsylvania, and West Virginia workforce and labor market information projections, retrieved from http://lmi.workforcewv.org/LTprojections/LTIndustryProjections.html & https://ohiolmi.com/portals/206/proj/ohio/Ohio_Job_Outlook_2016-2026.pdf & https://www.workstats.dli.pa.gov/Documents/Projections/Industrial/PA/PA_LTIP.pdf4. Ted Boettner, “Low-Wage Jobs Are the Future in the Ohio River Valley without Policy Change,” Ohio River Valley Institute, November 5, 2020, retrieved from https://ohiorivervalleyinstitute.org/low-wage-jobs-are-the-future-in-ohio-river-valley-without-policy-change/
5. See Ronald Eller, Uneven Ground: Appalachia since 1945, The University Press of Kentucky, July 2003. 6. Daniel Raimi et al., “Green Stimulus for Oil and Gas Workers: Considering A Major Federal Effort to Plug Orphaned and Abandoned Wells,” Columbia SIPA and Resources for the Future, July 2020, retrieved from https://www.energypolicy.columbia.edu/sites/default/files/file-uploads/OrphanWells_CGEP-Report_071620.pdf7. U.S. Bureau of Labor Statistics, Labor Statistics from the Current Population Survey, household data annual averages, Table 18: Employed persons by detailed industry, sex, race, and Hispanic or Latino ethnicity, 2020 https://www.bls.gov/cps/cpsaat18.htm8. Author’s analysis of a WV DEP contract invoice provided on January 8, 2021. 9. Kate Kelly and Jenny Rowland-Shea, “How Congress Can Help Energy States Weather the Oil Bust During the Coronavirus Pandemic,” Center for American Progress, April 29, 2020, retrieved from https://www.americanprogress.org/issues/green/reports/2020/04/29/484158/congress-can-help-energy-states-weather-oil-bust-coronavirus-pandemic/10. Correspondence with Seth Pelepko, Bureau of Oil & Gas Planning & Program Management, Pennsylvania DEP, February 25, 2021. 11. Stuart Riddick et al., “Measuring Methane Emissions from Abandoned and Active Oil and Gas Wells in West Virginia,” Science of The Total Environment, Vol.651, Part 2, February 2019, retrieved from https://www.sciencedirect.com/science/article/abs/pii/S0048969718339561?via%3Dihub and Mary Kang et al, ”Identification and Characterization of High Methane-emitting Abandoned Oil and Gas Wells,“ Proceedings of the National Academy of Sciences, Vol.113 (48), November 2016, retrieved from https://www.pnas.org/content/113/48/13636 and Amy Townsend-Small et al, ”Emissions of coalbed and natural gas methane from abandoned oil and gas wells in the United States,” Geophysical Research Letters, Vol.43 (4), February 20, 2016, retrieved from https://agupubs.onlinelibrary.wiley.com/doi/abs/10.1002/2015GL067623 and Patricia M.B. Saint-Vincent et al, ”Historic and Modern Approaches for the Discovery of Abandoned Wells for Methane Emissions Mitigation in Oil Creek State Park, Pennsylvania,” Environmental Management, January 2021, retrieved from https://link.springer.com/article/10.1007%2Fs00267-020-01420-3 and Natalie J. Pekney et al, ”Measurement of methane emissions from abandoned oil and gas wells in Hillman State Park, Pennsylvania,” Carbon Management, Vol.9 (2), March 23, 2018, retrieved from https://www.tandfonline.com/doi/full/10.1080/17583004.2018.144364212. See U.S. Environmental Protection Agency, Greenhouse Gas Equivalencies Calculator https://www.epa.gov/energy/greenhouse-gas-equivalencies-calculator13. Ibid

61
14. “Techincal Support Document: Social Cost of Carbon, Methane, and Nitrous Oxide, Interim Estimates under Executive Order 13990,” Interagency Working Group on Social Cost of Greenhouse Gases, United States Government, February 2021, retrieved from https://www.whitehouse.gov/wp-content/uploads/2021/02/TechnicalSupportDocument_SocialCostofCarbonMethaneNitrousOxide.pdf15. D.Shindell et al, “A climate policy pathway for near – and long-term benefits,” Science, May 5, 2017, retrieved from https://science.sciencemag.org/content/356/6337/49316. Eric Roston and Will Wade, “Top Economists Warn U.S. Against Underestimating Climate Damage,” Bloomberg, February 15, 2021, retrieved from https://www.bloomberg.com/news/articles/2021-02-15/top-economists-warn-u-s-against-underestimating-climate-damage?sref=xg7v21Jp17. Tamma Carleton and Michael Greenstone, “Updating the United States Government’s Social Cost of Carbon,” University of Chicago, Becker Friedman Institute for Working Economics Working Paper, January 14, 2021, retrieved from https://papers.ssrn.com/sol3/papers.cfm?abstract_id=376425518. William Haden Chomphosy et al, ”Ecosystem services benefits from restoration of non-producing US oil and gas lands,” Nature Sustainability, March 8, 2021, retrieved from https://papers.ssrn.com/sol3/papers.cfm?abstract_id=3764255
Section Five
1. “Remarks by President Biden Before Signing Executive Actions on Tackling Climate Change, Creating Jobs, and Restoring Scientific Integrity,” White House, January 27, 2021. Accessed here: https://www.whitehouse.gov/briefing-room/speeches-remarks/2021/01/27/remarks-by-president-biden-before-signing-executive-actions-on-tackling-climate-change-creating-jobs-and-restoring-scientific-integrity/2. Moving Forward Act of 2020 (HR 2), retrieved from https://www.congress.gov/116/bills/hr2/BILLS-116hr2rds.pdf3. Plugging Orphan Wells and Environmental Restoration (POWER) Act of 2020 (HB 8332), retrieved from https://www.congress.gov/116/bills/hr8332/BILLS-116hr8332ih.pdf4. Oil and Gas Bonding Reform and Orphaned Well Remediation Act of 2020 (S.4642), retrieved from https://www.congress.gov/116/bills/s4642/BILLS-116s4642is.pdf5. “Idle and Orphan Oil and Gas Wells: State and Provincial Regulatory Strategies,” Interstate Oil and Gas Compact Commission, March 2020 Update, Retrieved from https://iogcc.ok.gov/sites/g/files/gmc836/f/2020_03_04_updated_idle_and_orphan_oil_and_gas_wells_report_0.pdf
6. Erin Mayfield and Chris Greig, “Princeton’s Net-Zero study Annex: Fossil Fuels Transitions (Draft)”, Andlinger Center for Energy and the Environment, Princeton University, December 21, 2020. Retrieved from https://www.dropbox.com/sh/j1rmqf6dxpi0n1v/AABczMjYPd809EDJRwBRYgmia/Princeton%20NZA%20Annexes?dl=0&subfolder_nav_tracking=17. Abandoned Well Act of 2020, retrieved from https://images.currentaffairs.org/2021/01/AWA-Report-1.pdf8. Retrieved from https://www.osmre.gov/programs/AML.shtm and https://www.osmre.gov/lrg/docs/SMCRA.pdf9. https://www.govinfo.gov/content/pkg/USCODE-2011-title30/pdf/USCODE-2011-title30-chap25-subchapIV-sec1232.pdf10. See methodology section 11. Eric L. Dixon and Kendall Bilbrey, “Abandoned Mine Land Program: A Policy Analysis for Central Appalachia and the Nation,”Appalachian Citizens’ Law Center and The Alliance for Appalachia, July 8, 2015, retrieved from https://aclc.org/wp-content/uploads/2020/08/aml-policy-paper.pdf12. U.S. Energy Administration, Annual Energy Outlook 2021, (Table 13 and Table 14), February 3, 2021. Retrieved from https://www.eia.gov/outlooks/aeo/tables_ref.php13. https://environmenthalfcentury.princeton.edu/sites/g/files/toruqf331/files/2020-12/Princeton_NZA_Interim_Report_15_Dec_2020_FINAL.pdf14. Janet Redman and Kelly Trout, “Dirty Energy Dominance: Dependent on Denial, Oil Change International, October 2007, retrieved from http://priceofoil.org/content/uploads/2017/10/OCI_US-Fossil-Fuel-Subs-2015-16_Final_Oct2017.pdf15. Tim Donaghy, “Remediation of Orphan Oil & Gas Wells in COVID-19 Stimulus,” Greenpeace Briefing, April 28, 2020, retrieved from https://www.greenpeace.org/usa/research/policy-briefing-remediation-of-orphan-oil-gas-wells-in-covid-19-stimulus/16. See “Economic Impacts of Superfund Taxes,” Industrial Economic, Incorporated, February 1994, retrieved from https://www.epa.gov/sites/production/files/2018-02/documents/ee-0096_1-2_acc.pdfand U.S. Energy Information Administration, Crude Oil and Products, U.S. Imports by Country of Origin and Crude Oil Production, retrieved from https://www.eia.gov/petroleum/data.php#crude (Note: Total crude oil production was 4.1 billion barrels and total imported oil was 2.9 billion barrels in the United States in 2020. Multiplying these figures by 9.7 cents yields $680.6 million) 17. See Hoppy Kercheval, “WV Office of Oil and Gas Short on Inspectors,” Metro News, February 5, 2021, retrieved from https://wvmetronews.com/2021/02/05/wv-office-of-oil-and-gas-short-on-inspectors/and see Kentucky Division of Oil and Gas Inspector Information Assignments, retrieved from https://eec.ky.gov/Natural-Resources/Oil-and-Gas/Documents/DOG%20Inspector%20County%20Assignment%20(1-02-19).pdf18. See the Advanced Research Projects Agency – Energy’s Methane Observation Networks with Innovative Technology to Obtain Reductions (MONITOR) program and projects, retrieved from https://arpa-e.energy.gov/technologies/programs/monitor

62
17. See Hoppy Kercheval, “WV Office of Oil and Gas Short on Inspectors,” Metro News, February 5, 2021, retrieved from https://wvmetronews.com/2021/02/05/wv-office-of-oil-and-gas-short-on-inspectors/and see Kentucky Division of Oil and Gas Inspector Information Assignments, retrieved from https://eec.ky.gov/Natural-Resources/Oil-and-Gas/Documents/DOG%20Inspector%20County%20Assignment%20(1-02-19).pdf18. See the Advanced Research Projects Agency – Energy’s Methane Observation Networks with Innovative Technology to Obtain Reductions (MONITOR) program and projects, retrieved from https://arpa-e.energy.gov/technologies/programs/monitor

63

64www.ohiorivervalleyinstitute.org