repeated sprint ability: a dissertation submitted to the
TRANSCRIPT

Repeated Sprint Ability: The Influence of Aerobic Capacity on Energy Pathway Response and Fatigue of Hockey
Players
A DISSERTATION SUBMITTED TO THE FACULTY OF THE GRADUATE SCHOOL OF THE UNIVERSITY OF MINNESOTA BY
Benjamin James Peterson
IN PARTIAL FULFILLMENT OF THE REQUIREMENTS FOR THE DEGREE OF
DOCTOR OF PHILOSOPHY
Eric Snyder, PhD
May 2014

© Benjamin James Peterson

i
Table of Contents
LIST OF TABLES………………………………………………………………………iii
LIST OF FIGURES……………………………………………………………………..iv
CHAPTER 1: Introduction……………………………………………………………….1
CHAPTER 2: Literature Review…………………………………………………………5
2.1 Defining Key Concepts………………………………………………………..5
a. Repeated Sprint Ability Parameters…………………………………….5
b. Energy Pathway………………………………………………………...6
c. Field-based Team Sports………………………………………………..7
2.2 The Energetic Pathways of Brief Maximal Work……………………………..8
a. Adenosine Triphosphate………………………………………………...8
b. Phosphocreatine………………………………………………………...8
c. Glycogenolysis………………………………………..………………...9
d. Oxidative….…………………………………………………..………...9
2.3 The Physiology of Repeated Sprint Ability………………………………….10
a. Phosphocreatine Pathway……………………………………………...11
b. Glycolytic Pathway……………………………………………………13
c. Oxidative Pathway…………………………………………………….16
2.4 Mechanisms of Fatigue………………………………………………………17
a. Phosphocreatine Availability………………………………………….18
b. Glycogen Availability…………………………………………………23
c. Acidosis………………………………………………………………..26

ii
d. Inorganic Phosphate Accumulation…………………………………...30
2.5 The Influence of Oxygen Availability on Repeated Sprint Ability………….35
a. On-transient Oxygen Uptake Kinetics………………………………...37
b. Phosphocreatine Recovery Kinetics…………………………………..42
c. Inorganic Phosphate Kinetics………………………………………….45
2.6 Conclusions…………………………………………………………………..46
CHAPTER 3: Aerobic Capacity is Associated with Improved Repeated Shift
Performance in Hockey…………………………………………………………………..48
CHAPTER 4: Division I Hockey Players Generate More Power than Division III Players
During On- and Off-ice Performance Tests…………………..………………………….69
CHAPTER 5: Off-Ice Anaerobic Power is Not a Good Predictor of On-ice Repeated
Shift Performance in Hockey Players................................................................................87
CHAPTER 6: References……………………………………………………………...104
CHAPTER 7: Appendices……………………………………………………………..133
7.1 Informed Consent…………………………………………………………...133
7.2 Preparticipation Screening Questionnaire…………………………………..137
iii
List of Tables
CHAPTER 3
Table 1: Demographic, anthropometric, body composition, and aerobic capacity
characteristics of the subjects…………………………………………………………….58
Table 2: On-Ice Repeated Shift Test results for the subjects……………………………58
CHAPTER 4
Table 1: Physical characteristics of the subjects, stratified by division of play…………79
Table 2: Off-ice performance characteristics of subjects, when stratified by division of
play……………………………………………………………………………………….80
Table 3: On-ice performance characteristics of subjects, when stratified by division of
play.....................................................................................................................................81
CHAPTER 5
Table 1: Demographic, anthropometric, and body composition characteristics of the
subjects…………………………………………………………………………………...97
Table 2: On-ice performance characteristics, as well as off-ice characteristics for
anaerobic power of the subjects……………………………...…………………………..98

iv
List of Figures
CHAPTER 3
Figure 1: The on-ice repeated shift test…………………………………………………56
Figure 2: The relationship between VO2peak and Fatigue (percentage decrement score)
during the on-ice repeated shift test; broken down into (A) Gate One Fatigue, (B) Gate
Two Fatigue, and (C) Total Course Fatigue……………………………………………..60
Figure 3: The relationship between Final Stage Completed during the aerobic capacity
test on the skating treadmill and Fatigue (percentage decrement score) during the on-ice
repeated shift test; broken down into (A) Gate One Fatigue, (B) Gate Two Fatigue, and
(C) Total Course Fatigue………………………………………………………………...62
CHAPTER 5
Figure 1: On-ice repeated shift test………………………………………..…………….95

1
CHAPTER 1: Introduction
Sport specific training has been shown to improve performance in team sport
athletes (Castagna et al., 2008; Girard, Mendez-Villanueava, & Bishop, 2011). An
important factor for success in repeated sprint sports is a player’s ability to produce
power; the player that is quicker to the ball or faster off the line will often beat their
opponent, giving them an advantage. Competitions for these sports, however, take place
over the period of several hours and are divided into quarters, halves, or periods; each of
these consisting of numerous maximal-work bouts interspersed with relatively short
recovery periods (Montgomery, 2000). The ability to repeatedly produce high power
outputs throughout a competition gives a competitive edge to a player over his/her
opponent and is an important fitness component in repeated sprint sports (Glaister, 2005).
This ability has come to be known as repeated-sprint ability (RSA).
In the repeated sprint sports of rugby and soccer, a higher VO2peak has been shown
to correlate with improved RSA, ranging from r = -0.50 to -0.83 (Bishop & Edge, 2006;
Tomlin & Wenger, 2001). This relationship is further supported by research showing that
a state of hypoxia can impair RSA in athletes (Balsom, Ekblom, & Sjodin, 2004;
Quistorff, Johansen, & Sahlin, 1992). In addition, creating a hyperoxic environment
appears to improve RSA through increased aerobic adenosine triphosphate (ATP)
contribution and phosphocreatine (PCr) resynthesis rate (Balsom et al., 2004). This
evidence suggests that aerobic capacity and improved oxygen utilization may affect RSA
by 1) increasing the rate of the fast and slow phase of PCr resynthesis (McMahon &
Jenkins, 2002), 2) enhancing the clearance rate of metabolites created by PCr breakdown

2
and glycogenolysis (Bishop & Spencer, 2004), 3) improving oxygen (VO2) kinetics
(Dupont, Millet, Guinhouya, & Berthoin, 2005), and 4) increasing aerobic energy
contribution during maximal sprint bouts (Tomlin & Wenger, 2001).
Disagreement exists regarding the strength of this association, as there is research
to refute these findings. Numerous researchers have failed to find a significant
association between VO2peak and RSA in rugby and soccer athletes (Aziz, Chia, & Teh,
2000; Bishop & Spencer, 2004; Carey, Drake, Pliego, & Raymond, 2007; Wadley &
Rossignol, 1998), but it is not clear what role sample size (n < 15) played in calculating
these statistics. The discrepancy in the research would advocate for additional studies to
be conducted to better understand the possible relationship between aerobic capacity and
RSA.
While there is research specific to the relationship between aerobic capacity and
RSA in field-based team sports (e.g., rugby and soccer) there is very little published on
the sport of ice hockey. To date, this researcher is aware of only one study to have tested
this relationship, which found no significant correlation between the variables (Carey et
al., 2007). A deficiency of the current research is the mode with which researchers test
the VO2peak of hockey players, which typically uses a modified Bruce protocol on a
motor-driven treadmill (Carey et al., 2007). A recent study by Durocher et al. (2010)
found that there was no correlation between the on-ice and off-ice VO2peak values in
collegiate hockey players. The researchers concluded that off-ice VO2peak was not an
adequate predictor of on-ice VO2peak and suggested that hockey players must be tested in
a sport-specific manner to garner reliable results. Taking the findings of Durocher et al.

3
(2010) into account, it is possible that the lack of a correlation in the current research
could be due to poor testing protocol selection.
In addition, the majority of RSA tests employ protocols that only utilize straight
ahead running or skating (Carey et al., 2007; Gaitanos et al., 1993). This can be
problematic when interpreting direct correlations to performance, as athletes move in a
360° plane of motion during competition (Girard, Mendez-Villanueva, & Bishop, 2011).
A study by Spencer et al. (2008) found that athletes completing a course with multiple
changes in direction placed a greater energy demand on their metabolic systems when
compared to straight ahead running covering the same distance (Reilly, 1996). This
would indicate that RSA tests employing only straight ahead running do not simulate the
stress placed on an athlete during competition. Consequently, there is a need for a study
to look at the role aerobic capacity plays on RSA in hockey players, using a protocol that
accounts for both the task-specificity of skating and the movement patterns performed in
competition.
This series of studies aim to eliminate the shortfalls of the current research by
addressing a current, population-specific void in ice hockey literature. The first study,
“Aerobic Capacity is Associated with Improved Repeated Shift Performance in Hockey,”
establishes a foundation for future RSA research to build on by 1) accounting for task-
specificity by obtaining players’ VO2peak on a skating treadmill using a graded exercise
test; and 2) evaluate RSA using an on-ice test, developed to mimic the motor patterns
typically performed by hockey players during competition. The second study, “Division I
Hockey Players Generate More Power than Division III Players During On- and Off-ice

4
Performance Tests,” establishes baseline, normative data for hockey players for both on-
and off-ice performance tests; stratified by level of play. Finally, the third study, “Off-Ice
Anaerobic Power is Not a Good Predictor of On-ice Repeated Shift Performance in
Hockey Players,” challenges both the scientific and sporting community to re-evaluate
the emphasis placed on anaerobic power during off-ice player testing. The results of these
studies could have important implications for the training and evaluation methods used
by scientists, coaches, and players to prepare for the competitive season.
The purpose of this thesis will be to investigate the relationship between aerobic
capacity (VO2peak) and RSA in Division-I, Division-III, and Junior level hockey players,
while accounting for stride efficiency on sprint decrement. It is hypothesized that hockey
players with a higher aerobic capacity (VO2peak) will exhibit less fatigue during an on-ice
repeated shift test than those with lower values.

5
CHAPTER 2: Literature Review
2.1 Defining Key Concepts
2.1a Repeated Sprint Ability
Fatigue is defined throughout the literature as a decline in maximal sprinting speed
(increased time in sprint running) or a decrease in peak power or total work (cycling)
(Gastin, 2001; Bishop et al., 2011; Glaister, 2008; Spencer et al., 2005; Glaister, 2005).
To accurately evaluate fatigue the word “sprint” must be clearly defined. Unfortunately
this term has been used with a great deal of latitude when addressing repeated sprint
ability (RSA). Research has been published evaluating RSA with experimental protocols
consisting of 30-second maximal work bouts, interspersed with up to four minutes of
recovery (Bogdanis, Nevill, & Boobis, 1995; Bogdanis et al., 1996). Alternatively,
research has been published evaluating RSA with protocols consisting of 4-second work
bouts interspersed with 20-seconds of passive recovery (Rampinini et al., 2009). The
current accepted definition of a true ‘sprint,’ in the sense of RSA, has been defined in the
research as a maximal work bout lasting ≤10 seconds (Girard, Mendez-Villanueva &
Bishop, 2011). This time frame has been established as it is the approximate duration that
PCr and glycogenolysis can support a maximal ATP turnover rate of approximately 14
mmol/kg/dm (Gaitanos, Boobis, & Brooks, 1993). After that point, the energy system can
no longer sustain its peak ATP turnover rate, thereby voiding the work being performed
as a true maximal sprint.
A researcher and/or coach must also know the duration of the sprint bouts specific
to their sport of interest to make direct inferences to training. Further analysis of the
6
literature shows work-to-rest ratios in field-based team sports can range from 1:3 to 1:30
(Reilly & Thomas, 1976; Spencer et al., 2004; McLellan, Lovell, & Gass, 2011) As a
result, further definition of the term is required to outline the rest intervals associated
with RSA. Girard et al. (2011) advocates that repeated sprints should be further
delineated into two categories; intermittent-sprints and repeated sprint exercise (RSE).
Intermittent-sprints are defined as sprints performed with a work-to-rest ratio of >1:6, and
up to 1:30. Recovery periods such as these typically will allow for complete, or near
complete, recovery of the muscle, showing little to no fatigue. Repeated sprint exercise,
conversely, is defined as sprints performed with a recovery ratio of <1:6, typically
resulting in performance decrement, or fatigue.
2.1b Energy Pathway
It should be noted that the term “energy pathway” is used instead of “energy
system” when referring to a specific method in which energy is supplied to muscle during
RSE. Current research regarding the metabolic demands of field-based, repeated sprint
sports, are unanimous in its conclusions that they place considerable demands on the
entire energy system of the athlete (Mendez-Villanueava, & Bishop, 2011). The
percentage of the burden being placed on each pathway, however, be it anaerobic or
aerobic, is a topic of considerable debate. There is never one singular energy system
being used at a given time. It should be understood that while physiologists often refer to
these systems as separate entities, they all contribute to RSA ability from its onset to
completion. The human body uses multiple energy pathways that form one energy
system, the goal of which is to meet the energy demands of the activity.

7
A study by Gastin et al. (2001) found that short maximal sprints (<10 seconds)
attained 6% of their energy expenditure from aerobic metabolism. This has led
researchers like Glaister (2005) to view the human body’s energy system as a
progressive, changing metabolic environment that leads to gradual inhibition of specific
energy pathways, leaving others to increase production. Similarly, a study by Gaitanos et
al. (1993) found that anaerobic glycolysis, during RSA tests of 10x6 second bike sprints,
contributed 44% of the total energy during the first maximal sprint, while only
contributing 16% on the final, tenth sprint. Energy pathways do not turn on and off; they
get turned up or down. The largest obstacle in developing RSA is learning the how,
when, and why a pathway might be altered. An understanding of these pathways would
enable programming that could maximize repeated power development.
2.1c Field-based Team Sports
It is important to avoid using the term “anaerobic” when referring to team sports
like football, hockey, and soccer. The term “anaerobic sport” implies a singular form of
energy synthesis and jades the true functional effect of the human metabolic system
during high-intensity activity. To a greater extreme, the term can bias readers and inhibit
their ability to think about the material critically. A contributing factor to the success of
“anaerobic” athletes is their aerobic energy pathway. Sports, in this sense, will be referred
to as “field-based team sports,” thus defining, more correctly, some of the true governing
aspects of these sports.

8
2.2 The Energetic Pathways of Brief Maximal Work
2.2a Adenosine Triphosphate
The energy that fuels muscle comes from the hydrolysis of adenosine triphosphate
(ATP). Human muscle can store approximately 20-25mmol/kg dry muscle (dm) of ATP
at a time (Gaitanos et al., 1993). At peak turnover rate, estimated to be approximately 14
to 15 mmol/kg/dm/sec, ATP stores are sufficient to provide 1-2 seconds of maximal work
before being exhausted (Glaister, 2005). As the intracellular level of ATP decreases, it is
resynthesized via the integrated response of the other metabolic pathways.
2.2b Phosphocreatine
Phosphocreatine (PCr) appears to play the largest role in providing energy during
short, maximal work bouts (e.g., during RSE). It is theorized that the increased
concentration of intracellular ADP, produced from ATP hydrolysis, up-regulates the PCr
pathway (Brooks, Fehey, & Baldwin, 2005; McMahon & Jenkins, 2002).
Phosphocreatine plays a crucial role in RSA by combining with ADP and H⁺, a reaction
catalyzed by creatine kinase, to form ATP and free creatine (Cr) (Brooks et al., 2005).
Research has found intramuscular PCr stores to be approximately 80
mmol/kg/dm, with a maximal turnover rate of 9 mmol/kg/dm/sec (Gerard, Mendez-
Villanueva, and Bishop, 2011). Maximal PCr turnover rate is attained almost instantly at
the start of high-intensity exercise, declining within 1.3 seconds of the onset of exercise
(Maughan, Gleeson, & Greenhaff, 1997). These estimates make the PCr pathway ideal to
buffer high ATP demand during high intensity, short duration activity.

9
2.2c Glycogenolysis
There are two energy substrates broken down by the glycolytic pathway in the
muscle: glucose and glycogen (Brooks et al., 2004). Of the two, muscle glycogen is the
preferred fuel during RSE (Spreit et al., 1987). A normal resting intracellular
concentration of glycogen has been estimated to be approximately 300 mmol/kg/dm
(Gaitanos et al., 1993). Glycogenolysis operates on a feed-forward loop, responding
quickly to intracellular changes in the ATP/ADP+Pi flux (Brooks et al., 2005). The
breakdown of glycogen begins at the onset of maximal exercise, reaching its peak
turnover rate of 6-9 mmol/ATP/kg/dm/sec at approximately 5 seconds (Gastin et al.,
2001; Paroline et al., 1999). When combined, glycogenolysis and PCr can maintain an
ATP turnover rate of 11-14 mmol/ATP/kg/dm/sec for approximately 10 seconds
(Glaister, 2011; Boobis, Williams, & Wootten, 1982). Glycogen should therefore be
considered the main contributor to glycolytic flux during RSE.
2.2d Oxidative
The oxidative pathway is the smallest contributor in terms of direct ATP synthesis
during RSE. This pathway resynthesizes ATP primarily through the oxidation of glucose.
The intracellular storage form for the aerobic pathway is myoglobin (MbO2). The MbO2
content in human skeletal muscle is estimated to be 2 mmol O2/kg/dm (Akeson, Biorck,
& Simon, 1968), with this level rapidly decreasing at the onset of exercise. Research has
shown that at a work rate equal to VO2max, it takes upwards of 20 seconds to desaturate
MbO2 to 50% of its resting level (Mole et al., 1999; Richardson, Noyszewski, Kendrick,
Leigh, & Wagner, 1995). It can therefore be assumed that work rates drastically above

10
VO2peak, like those during RSE, would deplete intracellular O2 stores much more
quickly.
Bangsbo, Krustrup, Gonzalez-Alonso, and Saltin (2001) have estimated the
aerobic pathway contributes, on average, 0.7 mmol ATP/kg/dm/sec during the first 5
seconds of exercise at a work rate equivalent to 120% of VO2peak. Other studies, such as
those by Parolin et al. (1999) have reported similar findings, with the aerobic pathway
contributing approximately 1.3 mmol ATP/kg/dm/sec during the first 6 seconds of a 30-
second Wingate test.
2.3 The Physiology of Repeated Sprint Ability
To meet the high energy demands of RSE, athletes have evolved a complex, yet
well orchestrated set of energy pathways. The overarching goal of these pathways is to
meet the energy demands placed on them by a much larger system − the human body.
The beauty and efficiency within which the energy system of the human body functions
can be elucidated by the fact that ATP concentration will remain relatively stable despite
a more than a 1,000-fold increase in ATP utilization during a single, maximal sprint bout
lasting less than 5 seconds (Baker et al., 2010). Some of that beauty gets lost when
researchers attempt to define energy pathway interaction by confining it with labeling
terms; terms like system, rate limiting, or inhibited. The language that is currently used to
describe fatigue is detrimental to a person’s ability to conceptually think about and
understand the process of flow taking place during the up-regulation of energy flux
within a cell. This stifles true understanding of a dynamic process, one that likely changes
from person to person, by compartmentalizing it into a “one size fits all” model.

11
These terms imply that questions regarding energy system interaction should not be
answered with a “yes or no,” “on or off” response. If science has found anything, it is that
absolute terms such as these should be completely abolished from the language used to
describe energy system interaction; replaced instead with responses of “up,” “down,”
“maybe,” or “not sure.” Metabolic interactions during any mode of repeated sprint
exercise (RSE), regardless of duration or intensity, will show energy contribution from
each of the three energy pathways (Gastin, 2001; Spencer et al., 2005; Baker et al., 2010).
What follows is a summary of the parameters science has discovered regarding energy
pathway interaction and RSE energy flow, expressed by two diagrams that attempt to
combine those parameters to show the dynamic flow of repeated sprint metabolism.
2.3a Phosphocreatine Pathway
Intracellular PCr cannot meet the full demand for ATP during RSE, and begins to
decline shortly after the start of maximal exercise (Maughan, Gleeson, & Greenhaff,
1997). It is estimated that PCr can supply 50% of the total ATP production during a
maximal 6-second sprint (Gaitanos, Williams, & Boobis, 1993). Phosphocreatine stores
have been reported to fall to 35-55% of their resting level after a 6-second sprint
(Gaitanos et al., 1993; Dawson et al., 1997). Longer duration maximal exercise has been
found to further deplete PCr stores in muscle. After two 30-second bouts of maximal
cycling, interspersed with 3.8 minutes of recovery, Bogdanis et al. (1996) found
intracellular PCr levels had been depleted to 16.9% and 15.4% of their resting values,
respectively.
While the total energy production from PCr decreases during RSE, the relative

12
percentage of PCr contribution to total energy production appears to stay constant, or
increase slightly (Nevill et al, 1997; Yoshida, 2002). During a repeated sprint protocol
consisting of six 10-second sprints, Holmyard et al. (1988) found the relative percentage
of energy produced from PCr increased, from 46% to 49% on the tenth sprint when
compared to the first sprint. In addition, a study by Gaitanos et al. (1993) found PCr to
contribute 49% of the total ATP produced during the initial 6-second bike sprint of a
RSA protocol, with it contributing 80% of the total ATP used during the final, tenth
sprint. This is not to say that total energy output increased by over 30%, but rather that
the relative total energy contribution from the PCr pathway increased (McMahon &
Jenkins, 2002). This implies PCr is a robust, fatigue resistant energy source when
recovery time is below the optimal amount to return the cell to a homeostatic
environment.
Studies have shown PCr resynthesis to follow a biphasic pattern of recovery after
intense muscular activity (Baker et al., 2010; Gaesser & Brooks, 1984; McCann, Mole, &
Canton, 1988; Bogdanis et al., 1995; Nevill et al., 1997; Harris et al., 1976). The slow
phase of PCr recovery is likely affected by the pH of the muscle (McCann, Mole, &
Canton, 1988; Harris et al., 1976; Sahlin et al., 1979). As the intracellular pH drops, the
associated rise in H⁺ appears to effect creatine kinase equilibrium. Sahlin et al. (1975)
found that there was a significant correlation (p < 0.01) between muscle pH and creatine
kinase equilibrium, with that correlation becoming stronger as the muscle became more
acidic. The slow phase of recovery appears to have a half time of approximately >170
seconds (Harris et al., 1976), with some studies showing up to 15 to 25 minutes for full

13
recovery (Baker et al., 1993).
The fast phase of PCr recovery appears unaffected by the pH of the muscle, with
several studies reporting high rates of PCr resynthesis when intracellular pH is low, or
continuing to fall (Takahashi et al., 1995; Cooke, Peterson, & Quinney, 1997). Instead, it
appears that the fast phase is dependent on O2 availability (McMahon & Jenkins, 2002).
Harris et al. (1976) was the first to establish this link by occluding blood flow to the thigh
using a pneumatic cuff during both dynamic and isometric exercise to fatigue. During a
6-minute recovery period, the cuff would either keep the muscle completely occluded or
be deflated slightly to allow a level of ischemia. The results found that PCr resynthesis
was completely abolished during occlusion and drastically suppressed when ischemic.
Other studies are in accord with the results of Harris et al. (1976), finding the fast phase
of PCr synthesis to be dependent on O2 availability (Sahlin et al., 1979; Quistorff,
Johansen, & Sahlin, 1992; Taylor et al., 1983). The recovery rate of the fast phase of PCr
appears to have a half time of approximately 21 seconds (Harris et al., 1976).
2.3b Glycolytic Pathway
Glycogen is broken down quickly during RSE by phosphorylase a (glycogen
phosphorylase) (Kjaer et al., 1986). Activation of this enzyme is initiated by one of two
mechanisms: 1) hormone-mediated response or 2) contractile/metabolite response
(Brooks et al., 2005). The hormone-mediated response, while an efficient pathway,
operates on a feedback loop and has been calculated to be too slow to account for the
observed glycolytic flux during short, maximal exercise (Paronlin et al., 1999). The
contraction/metabolite-mediated response is quicker to respond to the energy demands of

14
RSE and accepted by researchers as the most likely signaling pathway of glycogenolysis
(Westerblad & Allen, 2002; Gaitanos et al., 1993; Brooks et al., 2005).
The up-regulation of glycogenolysis likely comes from a rise in intracellular Pᵢ, a
substrate required in the conversion of phosphorylase a and a by-product of ATP
synthesis (Jost & Rickenberg, 1971). Research by Crowther et al. (2002) found that
glycolytic flux was activated at approximately the same Pi and ADP concentrations
during repeated bouts of maximal exercise in subjects. Further argument adding weight to
the importance of the muscle contraction to the up-regulation of glycogenolysis comes
from studies that found no significant increase in glycolytic flux despite a direct injection
of epinephrine into the muscle (Crowther et al., 2002; Brooks et al., 2005).
The relative contribution from glycogenolysis begins to fall rapidly after it reaches
its peak turnover rate. This reduction in flux, however, does not appear to be the result of
insufficient substrate. Gaitanos et al. (1993) found that total energy contribution from
glycolysis fell from 44.1% during an initial 6-second sprint to 16.1% on the tenth sprint
during a 10-bout RSA testing protocol despite only finding a 37% decrease in pre-test
glycogen levels. From these findings, it can be inferred that the amount of muscle
glycogen in a muscle, when within normal levels, is not the rate-limiting factor in
glycogenolysis.
The rate of recovery for glycolysis is slow, estimated to have a half time of
approximately nine minutes, following a mono-exponential pattern of recovery that is
much slower than that of PCr (Glaister, 2005). The results of Gaitanos et al. (1993)
previously outlined point to a set point of maximal glycolytic usage; the decrease is likely
15
caused by other intracellular factors acting to limit the continued production of ATP from
glycogenolysis. Many researchers have proposed that glycogenolysis is its own limiting
factor during RSE (Ren, Broberg, Sahlin, & Hultman, 1990; Bangsbo, Graham, Kiens, &
Saltin, 1992; Crowther et al., 2002). The breakdown of glycogen builds metabolic waste
in the muscle (H+) causing a fall in intracellular pH, which has been found to inhibit the
two main rate limiting enzymes of glycogenolysis; phosphorylase a and
phosphofructokinase (PFK) (Parolin et al., 1999).
It has been argued by some that, much like its effects on PCr resynthesis and
creatine kinase, a high aerobic metabolism will speed up lactate clearance during
recovery, raising the pH of the muscle more quickly, thus reducing the inhibitory effects
of H+ on the rate limiting enzymes of glycogenolysis: phosphorylase a, hexokinase and
PFK (Spriet et al., 1987; Brooks et al., 2005; Crowther et al., 2002).
2.3c Oxidative Pathway
The oxidative pathway is slow to respond to RSE (Bassett & Howley, 2000).
Research has found that oxidative metabolism contributes approximately 3-8% of total
energy during a 6-second sprint (McGawley & Bishop, 2008; Spencer et al., 2005). That
percentage, however, appears to increase when subsequent sprints are performed with
minimal recovery, or the total length of the sprint is increased. Kavanagh and Jacobs
(1988) calculated that aerobic metabolism accounted for 16 to 18.5% of total energy used
during a 30-second Wingate test. A study by Bogdanis et al. (1996) found that oxidative
metabolism contributed 29% of total energy used during a 30-second Wingate, increasing
to 44% of total energy when a second Wingate was performed 4 minutes later. This

16
implies that the oxidative pathway, while slow to respond, plays a critical role in
supplying ATP during maximal exercise.
The immediate need for oxygen during RSE is met by oxygen binding myoglobin
(MbO2) within the muscle cell. The MbO2 content in human skeletal muscle is estimated
to be 2 mmol O2/kg/dm (Akeson, Biorck, & Simon, 1968), with this level rapidly
decreasing at the onset of exercise. Research has shown that at a work rate equal to
VO2peak, it takes upwards of 20 seconds to desaturate MbO2 to 50% of its resting (Mole,
Chung, & Tran, 1999; Richardson, Noyszewski, & Kendrick, 1995). This would imply
that there is sufficient oxygen within the cell to maintain maximal oxidative metabolism
for one maximal sprint bout.
During RSE, however, due to the variable nature of sport and O2 demand, MbO2
cannot continually meet oxygen demand. To explain how the oxidative pathway attempts
to do this, researchers developed a term to describe the dynamic changes that take place
within an athlete’s oxidative pathway during exercise: O2 kinetics (Raminini et al., 2009).
Oxygen kinetics describes the transition of a person’s oxidative system from rest to
exercise. This transition and its effect on O2 kinetics can vary greatly based on the
intensity and duration of exercise. For example, when exercise is performed at a intensity
below an athlete’s lactate threshold (50-70% VO2max), VO2 increases quickly to a steady
state level to meet demand. If an athlete works out at a higher intensity (100% VO2max),
there is a shift seen in the O2 kinetics after a few minutes to a slow component; this
change either delays the attainment of a steady state or pushes VO2 to its maximum
(Gastin, 2001). In either case, the combined effect of an athlete’s maximum cardiac

17
output (Q) and arteriovenous oxygen difference (a-ṼO2 diff) dictates the effectiveness
and speed with which their O2 kinetics meet the demands placed on their system during
RSE.
In addition to a direct increase in ATP contribution during RSE, an increased
oxidative capacity would provide more energy during maximal exercise bouts, reducing
the strain on the PCr and glycolytic pathways. This, in turn, would theoretically reduce
the amount of metabolite accumulated during exercise, reducing the amount needing to
be cleared from the muscle before the next maximal work bout (Dupont, Millet,
Guinhouya, & Berthoin, 2005).
2.4 Mechanisms of Fatigue
Repeated sprint bouts are affected by fatigue. Fatigue, in this sense, is defined as a
decline in peak or mean power over a series of repetitive sprints. The level of fatigue seen
during the work periods of RSE is correlated with the duration of their associated
recovery period (Balsom et al., 1992). This makes sense when compared to what is
known about energy pathway integration and their main function, to return the muscle
cell to homeostasis after maximal work bouts. If the system is given a long time to
recover, it will do so completely. If its recovery is limited, it will be forced to function in
an ever-increasing state of fatigue.
There is no single contributing factor to RSA ability. Research indicates a inverse
correlation between peak power and fatigue (Girard et al., 2011). As athletes’ initial peak
power output (PPO) increases, their successive sprints seem to fatigue more quickly
when compared to athletes with lower PPO’s. This correlation is likely due to muscle

18
recruitment response and excessive metabolite accumulation due to slow fiber type
dependent clearance mechanisms (Mendez-Villanueva, Hamer, and Bishop, 2008).
Different types of muscle fiber have been reported to have “fiber-type-dependent
differences in the usage of high-energy phosphates with greater phosphocreatine
reduction in fast twitch fibers than in slow-twitch fibers (Girard et al., 2011).” Athletes
who produce more power likely recruit more type IIAx muscle fibers. Type IIAx fibers
consume more ATP than type I fibers and have a much lower mitochondrial density,
limiting their ability to oxidatively clear the metabolite byproduct from those reactions.
While there is considerable debate over the specific cause of fatigue and its respective
effects on RSA performance, most researchers agree that fatigue is associated primarily
with one of, or a combination of, four intramuscular conditions: 1) PCr availability; 2)
glycogen availability; 3) inorganic phosphate accumulation; and 4) an increased level of
muscle acidosis.
2.4a Phosphocreatine Availability
It is widely accepted that one of the main fatigue-causing factors in RSA is PCr
availability (Girard et al., 2011). There is a strong parametric correlation between PCr
levels and power production of a muscle during high-intensity exercise (Miller et al.,
1987; McMahon & Jenkins, 2002; Bogdanis et al., 1995; Bogdanis et al., 1996;).
Research has found a similar association between PCr recovery following an initial
maximal work bout and the recovery of peak power in subsequent bouts (McMahon &
Jenkins, 2002; Sahlin & Ren, 1989; Nevill et al., 1996; Bogdanis et al., 1996). Numerous
studies, such as one by Dawson et al. (1997), have shown the resynthesis curve for PCr

19
tracks very closely with the time-course recovery curve for power output. Researchers
found that longer rest periods between maximal 6-second sprint bouts correlated to both
increased PCr resynthesis as well as increased power production in subsequent sprints.
Furthermore, a study by Bogdanis et al. (1995) found strong correlations (r = 0.71-0.86; p
< 0.05) between resynthesis of PCr and the restoration of peak power output and mean
power after 90 seconds of recovery.
Hiroven et al. (1987) looked at the breakdown of PCr and its association with
sprint speed in the 40, 60, 80, and 100m dash. Seven subjects performed two sprints on
two separate testing days, taking muscle biopsies pre- and post-sprint for each trial.
Sufficient time was given between sprint bouts to allow for complete recovery of the
muscle. For analysis, the researchers divided the subjects into two groups: 1) sprinters
who achieved a maximal speed of 10.07 ± 0.13 m/sec and 2) sprinters who achieved a
maximal speed of 9.75 ± 0.10 m/sec. Their findings demonstrated that sprint performance
correlated with the depletion of PCr stores in the muscle. In addition, the researchers
concluded that severe depletion of PCr occurred between 5 to 7 seconds during maximal
sprinting, at which point maximal running speed was seen to decline. The results of
Hiroven et al. (1987) show two findings: 1) sprinters who can better utilize more of their
intracellular PCr stores are faster, more powerful sprinters; and 2) when PCr levels are
significantly depleted there is an associated drop in performance. These results imply that
a diminished rate of PCr resynthesis during RSE could dramatically affect the
performance by increasing the rate of fatigue.
Additional weight to the importance of PCr availability is given by research

20
showing that supplementing with creatine reduces the rate of fatigue between multiple
sprint bouts (Kendall et al., 2009; Kreider, 2003). Creatine in the cytosol of the muscle
cell is rephosphorylated by mitochondrial creatine kinase (CK) to form PCr and
intramitochondrial ADP (Brooks et al., 2005). By increasing the intracellular components
needed to form PCr, researchers theorize it up-regulates the rate of PCr resynthesis
between work bouts.
A study by Yquel et al. (2002) found that ingesting 20g of creatine/day for six days
increased power output by 5% during a RSA protocol, as well as increased PCr
resynthesis during a 10-minute recovery period. Increasing free creatine concentrations
within the muscle has three advantages for field-based team sport athletes performing
RSE: 1) it increases the amount of intracellular PCr available for hydrolysis, thus
increasing intracellular ATP (Soderlund, Balsom, & Ekblom, 1994; Greenhaff et al.,
1993; Balsom, Soderlund, & Ekblom, 1994); 2) creatine acts to buffer pH by utilizing H+
during the creatine kinase reaction (McArdle, Katch, & Katch, 1991); and 3) it acts as a
metabolic buffer, lowering the intracellular level of inorganic phosphate (Pi). Lowering
intracellular Pi has been theorized to limit inhibition of the contraction-coupling of the
muscle and possibly reduce the glycolytic rate by reduced signaling to phosphorylase a
and PFK (Volek & Kraemer, 1996).
Peyrebrune et al. (1998) compared 14 elite level male swimmers in a double blind
procedure. All swimmers performed a single 50-yard sprint and a RSA test, consisting of
8x50-yard intervals with 90 seconds rest between sprints, before and after a 5-day period
of supplementing with either creatine (9g creatine + 4.5g maltodextrin + 4.5g

21
glucose/day) or a placebo (18g glucose). The researchers found no change in single 50-
yard sprint time. During the RSA test, however, the average times increased during each
trial, but overall percent decrement was improved in the experimental group. Although
the percent decrement scores of both groups improved, only those of the creatine
supplement group were significant (control = 12.7 ± 5.7% pre vs. 11.0 ± 5.5% post;
creatine = 15.7 ± 4.3% vs. 10.0 ± 2.5%; p < 0.05). The researchers concluded that 9g of
creatine ingestion per day for 5 days improved repeated-sprint swimming.
The correlation between creatine supplementation and improved RSA is not a
universal finding. Several studies have been published that found no correlation between
creatine supplementation and RSA in athletes. A study by McKenna et al. (1999)
investigated the effects of creatine supplementation on intermittent sprint performance in
fourteen, recreationally active college students. The subjects were split into two groups,
with the experimental group receiving a creatine solution (5g creatine + 5g dextrose/day)
and the control group a placebo (5g dextrose/day) for five days. Both groups performed a
a pre- and post-test, consisting of 5x10-second sprints with 180, 50, and 20 seconds rest
between bouts, respectively. After analysis, the researchers found that there was no
improvement in intermittent sprint performance between groups, and that creatine
supplementation was not correlated with fatigue resistance during RSA.
The discrepancy in these findings can be rationalized by viewing the participants as
“responders” and “non-responders.” It has been reported that PCr concentration varies by
fiber type. Demant and Rhodes (1999) reported that PCr content at rest in type I and type
II fibers was significantly different (p < 0.05) at 73.1 ± 9.5 and 82.7 ± 11.2 mmol/kg/dm,

22
respectively. In addition, type II fibers appear to rely more heavily on PCr for energy
supply during maximal exercise (Gray, Soderlund, & Richardson, 2008). For example,
Karatzaferi et al. (2001) found that 10 seconds of maximal bike sprint decreased the PCr
content in type I, IIa, IIAx, and IIXa by 45, 53, 62, and 59%, respectively. As a result of
these findings, people who have a higher concentration of type II muscle fibers have
come to be known as “responders,” because they respond better to increased levels of
creatine compared to those with higher percentages of type I muscle fiber (Demant &
Rhodes, 1999). Field-based team sport athletes, i.e. those requiring high power outputs
for short periods of time (<60-seconds), have a higher propensity to type II muscle fiber
(Korhonen et al., 2006). With that in mind, when comparing the studies of Peyrebrune et
al. (1998) and McKenna et al. (1999), which tested a sprint-based athletic group and an
untrained population, respectively, one could expect the sprint-based athletic group to
show better results from creatine supplementation.
The theory that increased intracellular creatine could reduce fatigue by mediating
the rate of glycolytic flux and reducing intracellular Pi is still heavily debated among
researchers, with substantial research supporting both sides. Some researchers have found
no difference in blood lactate levels after RSE between experimental and control groups,
pre- and post- test, despite a reduced rate of fatigue in the experimental group
(Peyrebrune et al., 1998; Bosco et al., 1997). These findings imply that though PCr
synthesis is increased, it does not inhibit the rate of glycolytic flux. On the other hand,
researchers have found creatine supplementation decreases the level of intramuscular
lactate, measured after a RSE protocol, implying that it somehow affects the rate of

23
glycolytic flux (Soderlund, Balsom, & Ekblom, 1994; Balsom, Soderlund, & Ekblom,
1994).
One large confounding factor that must be taken into account is the lack of
standardization between these studies in regards to creatine supplementation and RSA
testing parameters. Some studies supplemented with 20g of creatine (Balsom et al.,
1994), whereas others only used 9g (Peyrebrune et al., 1998). One study had rest intervals
of 30 seconds (Soderlund et al., 1993) with another allowing 60 seconds of recovery
(Kendall et al., 2009). Changes in duration and intensity have drastic effects on energy
system integration during RSE. Without more rigid testing guidelines, this brings in to
question the construct validity of these studies. Despite these conflicting reports, the
majority share of the research would support the notion that PCr availability and fatigue
are more than a coincidental finding.
2.4b Glycogen Availability
Unlike PCr, the amount of glycogen stored within a muscle is unlikely to be a
limiting factor in RSA. Studies have found muscle glycogen levels to be a limiting factor
in time to exhaustion during sub-maximal exercise lasting longer than 60 minutes (<80%
VO2peak; Balsom et al., 1999; Hargreaves et al., 1995), however no studies have found
this same trend when exercise was performed at high-intensities (>90% VO2peak)
(Maughan & Poole, 1981; Symons & Jacobs, 1989).
There are exceptions to glycogen storage limiting RSA, such as if extreme
carbohydrate restriction takes place. One study performed an extrapolated calculation
based on its findings of glycolytic rates during an RSA protocol and estimated that an
24
athlete would need a starting intracellular glycogen level of only 75 mmol/kg/dm to see
any substantial performance decrement (Spencer & Katz, 1991); however, this is well
below normal intramuscular glycogen levels, which are typically around 300
mmol/kg/dm (Glaister, 2005). A study by Spencer & Katz (1991) examined the
difference in glycolytic rate based on resting muscle glycogen levels before exercise.
Eight subjects performed two cycling trials at 95% of their VO2peak, the first trial was
performed to fatigue and the second trial was performed for the same duration and
workload as the first trial. Before the first trial, subjects lowered their glycogen stores
through a combination of exercise and dietary restrictions. The second trial was
performed in a supercompensated state, with subjects drastically increasing their muscle
glycogen stores, again by diet and exercise manipulation. The low glycogen (LG) trial
found a decrease from a resting state of 201 ± 31 mmol/gluc/kg/dm to 105 ± 28. The high
glycogen (HG) trial decreased from 583 ± 40 to 460 ± 49. While the starting values were
very different, the calculated rate of glycogenolysis was not significantly different
between groups (LG = 88 ± 17, HG = 106 ± 43 mmol/gluc/kg/dm; p > 0.05) (Spencer et
al., 1991).
Bangsbo et al. (1991) found that glycogen utilization was not related to pre-
exercise intracellular levels. The study found that muscle lactate production (a sign of
glycolytic rate) was similar across all groups, correlating to an average glycogen
depletion of 25.9 ± 0.4 mmol/kg/dm. This suggests a set point based on metabolite
accumulation where glycolytic enzymes are downregulated and decrease the rate of
glycogenolysis, limiting ATP production, and subsequently inducing fatigue (Parolin et

25
al., 1999). From these results researchers have concluded that intracellular glycogen
stores are not a major limiting factor in RSE, except in extreme conditions (Ren et al.,
1990).
With glycogen concentration not likely affecting RSE fatigue, researchers
developed different theories, instead arguing the effects of glycolytic flux on RSE.
Subjects with the highest glycolytic rates during initial sprint performance have been
found to have the greatest drop-off in power output during subsequent sprints during RSE
(Bogdanis et al. 1995; Bishop, Edge, & Goodman, 2004). These studies also found that
the same subjects had a much higher initial peak power output (PPO), average power
output (APO), and final power output (FPO) when compared to subjects with lower
glycolytic rates.
The mechanism that causes the decline in glycolytic rate is unclear. It has been
hypothesized that a rapid depletion of muscle glycogen occurs, limiting the continued
contribution of ATP from glycogenolysis (Hargreaves, McConnell, & Proietto, 1995). A
second hypothesis offered by Parolin et al. (1999) is glycolysis itself is its own limiting
factor; the breakdown of glycogen builds metabolic waste in the muscle (H+) causing a
fall in pH and inhibiting the rate limiting enzymes of glycogenolysis, specifically
phosphorylase a and PFK, which break down glycogen to form ATP.
A study by Gaitanos et al. (1993) examined glycolytic flux in a muscle during a
RSA protocol consisting of ten, 6-second bike sprints with 30 seconds of recovery
between sprints. They found glycogen breakdown to be significantly greater during the
first sprint, with glucose being the main glycolytic substrate used during the final sprint.

26
The authors reported an 11-fold and 8-fold reduction in glycogenolysis and glycolysis,
respectively, from the first to last sprint. During the first sprint, it was calculated that
glycogenolysis provided 44% of the total energy pool, while contributing only 16% on
the final, tenth sprint. This was surprising as they found total glycogen degradation to be
only 37% of its resting level. From these findings, it can be inferred that the amount of
muscle glycogen in a muscle, when within normal levels, is not the rate-limiting factor in
glycogenolysis. While the study shows that the contribution of ATP from glycolytic flux
decreases during RSE and limits total energy production during repeated bouts, this
decrease is likely caused by other intracellular factors acting to limit the continued
production of ATP from glycogenolysis, resulting in fatigue.
2.4c Acidosis
Muscle acidosis has been shown to be significantly correlated to a decrease in
muscle force production (Vaughn-Jones, Eisner & Lederer, 1987; Cady et al., 1989;
DeGroot et al., 1993; Miller et al., 1988). Similar to the findings of the association
between PCr and fatigue, muscle pH has shown a non-parametric correlation to power
output during RSA tests; as pH falls, power output decreases (Dawson et al., 1978). This
association has been solidified through research that has found high levels of acidosis to
have negative effects on both the isometric force production and the standard free energy
release from ATP hydrolysis (Westerblad, Allen, and Lannergren, 2006; Chase &
Kushmerick, 1988; Gote & Nosek, 1989). In addition, high H+ accumulation may inhibit
ATP production from the glycolytic pathway by inhibiting the rate-limiting enzyme PFK
(Girard et al., 2011). Finally, acidosis has been shown to affect the function of creatine

27
kinase, the enzyme associated with PCr synthesis and the slow phase of PCr recovery
(McMahon and Jenkins, 2002).
Studies have found low pH may cause Ca2+ insensitivity in the muscle, leading to a
decline in maximal tension and shortening velocity (Godt & Nosak, 1989; Cook et al.,
1988; Miller et al., 1988). A study by Donaldson et al. (1983) used skinned mammalian
muscle fiber to look at the effects of pH on force production. It found that type I, type IIa,
and type IIx fibers lost 12%, 25%, and 44% of their maximal force capacity as a result of
acidosis (McMahon & Jenkins, 2002). One of the most important steps in the excitation-
contraction coupling cycle of muscle is the binding of Ca2+ to troponin (Brooks et al.,
2005). High H+ concentrations have been theorized to negatively affect this process by
displacing Ca2+ from troponin, resulting in a decreased responsiveness of the muscle
(Stackhouse, Reisman, & Stuart, 2001; Miller et al., 1988; Lannergren & Westerblad,
1990).
Further evidence supporting acidosis to be a fatigue causing factor in RSA are
reports that reducing intracellular levels of H+ improve performance. Studies have shown
regular RSE can improve H+ buffering through lactate removal and the monocarboxylate
transporter (MCT1) pathway, in turn decreasing muscle pH and lowering fatigue. A study
by Thomas et al. (2005) found that several weeks of RSE training led to increased MCT1
expression. There was a significant correlation (p < 0.05) with increased blood lactate
removal ability after a 1-minute all-out test and decreased fatigue as opposed to pre-trial
tests.
Acidosis may also inhibit the slow phase of PCr recovery. A study by Arnold et al.
28
(1984) found that the rate of PCr recovery was dependent on the pH level of the muscle.
In the study, two groups squeezed a rubber bulb of a sphygmomanometer at different
intensities: 100mm Hg for the light exercise group and 500mm Hg for the heavy exercise
group. Each group performed contractions until they were completely fatigued, with the
light group being able to squeeze the bulb for approximately 270 seconds while the heavy
group only lasted for approximately 150 seconds. Analysis found that PCr levels were
depleted to 55.8 ± 8 and 33 ± 4% of resting levels in the light and high exercise groups,
respectively, with a coinciding drop in pH to 6.88 ± 0.02 and 6.23 ± 0.08. While the total
amount of PCr resynthesized during recovery was greater in the heavy exercise group, the
rate of resynthesis over time was lower than that of the light exercise group. This
correlation between PCr resynthesis rate and muscle pH led the researchers to conclude
that PCr recovery, in part, depends on the acidity of the muscle. Other studies have found
similar associations between H+ and PCr recovery (r = 0.71 to 0.92, p < 0.05) (Harris et
al., 1976; Sahlin et al. 1979, Walter et al., 1997).
There is considerable evidence to support an inhibitory effect of H+ on PFK, a rate
limiting enzyme of glycogenolysis (Bishop, Edge, & Goodmann, 2004; Sahlin, Gorski, &
Edstrom, 1990; Peters & Spriet, 1995). As the rate of glycogenolysis increases, there is
an associated drop in pH and an increase in citrate within the muscle cell (Dobson,
Yamamoto, & Hochachka, 1986). Their combined effect has been associated with
downregulating PFK and inhibiting Ca2+ uptake by the sarcoplasmic reticulum (Sahlin,
Tonkonogi, & Soderlund, 1998). In that sense, glycogenolysis would appear to be a self-
regulating pathway; its metabolic byproducts affect both the rate of key enzymes used in

29
the breakdown of glycogen and interfere with the force production ability of the muscle
(McCartney et al., 1986; Metzger & Fitts, 1987; Spriet et al., 1989). While acidosis may
not directly affect the contractile efficiency of the muscle, its affect on PFK appears to
interfere with energy production, and subsequently may cause fatigue during RSE.
The energy available from ATP hydrolysis is variable, depending on several
regulating factors that all change in a state of muscle acidosis: pH, H+, and ADP
concentration (Brooks et al., 2005). The standard free energy of ATP hydrolysis (∆Go) is
-7.3 kcal/mol. Some researchers have estimated that this could drop to -11 kcal/mol in
extreme acidic conditions believed to be attainable by exercising muscle (Brooks et al.,
2005).
Sodium bicarbonate (NaHCO3) has been shown in some studies to reduce the rate
of fatigue in RSE (Lavender & Bird, 1989). A study by Naughton & Cedaro (1991) found
that there was no ergogenic effect in consuming 0.5 g/kg body mass of NaHCO3 in
regards to fatigue during a 10 or 30-second maximal sprint. A study by Bishop et al.
(2004) found that ingestion of 0.3g/kg of bicarbonate (NaHCO3), a component of the
MCT1 shuttle, produced significant (p < 0.05) improvements in total work and power
output in sprints 3, 4, and 5 in a series of six 10-second sprints with 30 seconds of
recovery between bouts. The results of this study would suggest that increased NaHCO3
improves extracellular H+ buffering, reduce muscle acidosis and improve power
development in repeated-sprint bouts.
Despite these findings, several points of contention exist among researchers that
bring their validity and correlation to fatigue into question. First, high power outputs have
30
been seen in sprints where the subject had high levels of H+ accumulation, casting doubt
on acidosis being the major cause of fatigue during RSA (Glaister et al., 2008). The
association between intracellular pH and fatigue is further questioned by the dissociation
seen in research between the recovery curves of the two parameters: force production and
pH. Force output in subsequent contractions recovers more quickly than pH does,
according to several studies (Bodganis et al., 1995; Holmyard et al., 1994). To further
bring into question the effect of low intracellular pH on muscle function, several studies
have documented high force/power outputs while subjects are in extremely acidic
conditions (Hitchcock, 1984; Sahlin & Ren, 1989).
Second, the research originally done on acidosis comes from a study in which
skinned rabbit psoas muscle fibers were examined at temperatures below 15o C (Dawson,
Gadian, & Wilkie, 1978). This low temperature confounded the results by decreasing the
pH to a level that would never been seen in normal human tissue. More recent studies
have re-created these experiments at close to normal body temperatures of 30o C (Pate et
al., 1995; Westerblad, Bruton, & Lannergren, 1997). Their findings show acidosis has
little, if any, effect on the shortening speed or fatigue of muscle.
2.4d Inorganic Phosphate Accumulation
While earlier research focused on acidosis as the main culprit in RSE fatigue,
advances in technology, through P-Magnetic Resonance Spectroscopy (P-MARS), have
led researchers to a new conclusion. Inorganic phosphate (Pᵢ), once thought to be a
harmless byproduct, is now considered to be the leading cause of fatigue during high-
intensity muscular activity (Dalstedt, Katz, & Westerblad, 2001; Duke & Steele, 2000;

31
Kabbara & Allen, 2001). A study by Thompson and Fitts (1992) found that recovery of
peak tetanic force correlated with total Pi in the semitendinosus muscle of frogs.
Increased intracellular levels of Pi have been shown to inhibit the ability of the
sarcoplasmic reticulum to release Ca2+ during high intensity contractions and decrease
force production through the impairment of cross-bridge cycling (Westerblad & Allen,
2002).
Force decline, an associated measure of fatigue, has been shown by some
researchers to be triphasic in nature (Westerblad & Allen, 1991; Steele & Duke, 2003;
Lannergren & Westerblad, 1990). Of all the possible factors that could likely influence
rate of force production, Pi appears to best fit the model. A study by Lanergren and
Westerblad (1990) found that tetanic force in the flexor brevis foot muscle of a mouse did
not decline in an expected, linear fashion. Instead, the researchers found that there was an
initial rapid decline in tetanic tension (phase one), followed by a long period of nearly
constant tension (phase two), with a fast final tension loss (phase three). After testing 26
samples, they found the average tension fell 15.4%, 10%, and 70% during phases one,
two, and three, respectively. In addition, the researchers found that caffeine (15-25 mM)
caused a rapid increase in tetanic force when applied to fibers during phase three,
increasing force output from 29.8 to 82.5% of resting levels. Caffeine’s effect on tension
was much lower in phases one and two. From these results, the researchers concluded
that there are two mechanisms influencing force decline during fatigue: 1) one reacts
quickly to an intracellular rise in Pi, likely influencing the cross-bridge function of the
myofilaments within the muscle and 2) another takes longer to manifest, but has a much

32
larger effect on total fatigue, with the likely cause being Pᵢ’s infiltration of the
sarcoplasmic reticulum (SR) and inhibition of the release of Ca2+ into the cell.
Further support for the Pi fatigue model comes from evidence that populations
tested that lacked the enzyme creatine kinase do not exhibit the usual rise in Pi during
exercise and show no impairment of early force production, Ca2+ sensitivity, or Ca2+
release from the SR (Allen, Kabbara, & Westerblad, 2002; Dahlstedt et al., 2001; Allen
and Weserblad, 2001). A study by Dahlstedt et al. (2001) found that decreasing the rate
of Pi accumulation significantly slowed the rate of fatigue in muscle, measured as a
decline in rate of force production. Researchers used genetically engineered mice, which
had no detectable creatine kinase (CK) in their skeletal muscle, to slow the rate of Pi
accumulation. The prerequisite for accumulation of Pᵢ in the myoplasm is PCr
breakdown, which is facilitated by the intracellular enzyme CK to form creatine and Pi.
Without the presence of CK, the rate of Pi accumulation within the intracellular space
was reduced, showing an associated decline in the rate of fatigue.
Elevated levels of Pi concentration may also inhibit a muscles ability to generate
power by inhibiting SR function. A rise in intracellular phosphate has been associated
with a decline in Ca2+ release from the SR and is widely accepted as one of the leading
causes of fatigue during RSE (Williams & Klung, 1995; Favero, 1999; Favero et al.,
1997; Allen & Westerblad, 2001; Allen, Kabbara, & Westerblad, 2002). Favero et al.
(1995) stated that inhibition of the ryanodine receptors within the SR reduced the release
of Ca2+ by decreasing the single-channel open probability and leading to a decline in
tetanic force production.

33
Current research shows that high intracellular levels of Pi, which have been shown
to occur as a result of a high rate of PCr degradation during RSE, diffuse into the SR and
combine with Ca2+ to form calcium-phosphate (CaPi) (Fryer et al., 1995). This process
has been termed the “calcium phosphate precipitation hypothesis.” It proposes that, as
phosphate in the myoplasm rises, it enters the SR and binds with Ca2+, thus reducing free
Ca2+ within the SR and limiting its release during exercise, causing fatigue (Allen,
Kabbara, & Westerblad, 2002). Support for this hypothesis can be seen in Dutka, Cole,
and Lamb (2005), which found that the total amount of Ca2+ released from the SR was
reduced by 20% when intracellular Pi rose to 30 mM in mechanically skinned
mammalian muscle. In addition, Fryer et al. (1995) looked at mechanically skinned fast
twitch (FT) and slow twitch (ST) fibers of rats to determine the effects of fatigue-like
changes in the concentration Pᵢ on Ca2+ flux of the sarcoplasmic reticulum (SR) and its
resulting effect on the contractile properties of the myofilaments. They found that an
increase in Pᵢ from 0 to 25, and then to 50 mM, after normalizing the results, reduced the
maximal force production in both fiber types by 39 and 48%, respectively.
As was outlined earlier, several studies have found the rate of fatigue within
muscle, as expressed as a decline in force production as a percentage of maximum, to be
triphasic (Westerblad & Allen, 1991; Steele & Duke, 2003; Lannergren & Westerblad,
1990). In all of these studies, researchers found that the addition of caffeine to the muscle
caused a rapid increase in tetanic force during the final, rapid phase of fatigue. It is
widely accepted in the research that caffeine is a stimulant that increases Ca2+ release
from the SR by widening the channel operated by the ryanodine receptor (Steele & Duke,

34
2003). Furthermore, studies have shown that the addition of caffeine to fatiguing muscle
has limited the rate of Ca2+ clearance and force production (Lannergren and Westerblad,
1991; Westerblad and Allen, 1994). When all of the evidence is examined, it points to the
inhibited release of Ca2+ from the SR as being a major contributing factor to the decline
in force production of muscle.
Further, Pᵢ may impair of the cross-bridge mechanism during muscle contraction.
The correlating factors of fatigue during high-intensity exercise as they pertain to the
myofibril component are reduced force production, decreased maximal shortening
velocity, and slowed relaxation (Fitts, 1999; Jones, Ruiter, & Hann, 2006; Allen &
Westerblad, 2001; Cook & Pate, 1985). Resting intracellular Pᵢ levels are estimated to be
approximately 1-5 mM (Kushmerick et al., 1992). These levels can rise to 30-40 mM
during high intensity exercise, possibly affecting all three of the mechanisms controlling
force-generating ability (Cady et al., 1989). One of the original theories regarding muscle
fatigue was that either H+ or Pᵢ somehow affected the coupling of Ca2+ to troponin,
exposing tropomyosin and allowing cross-bridging to take place. This theory is now
largely discredited for both metabolites because the rate of Ca2+ dissociation from
troponin is believed to be too fast to be a limiting factor during muscle contraction
(Allen, Lannergren, & Westerblad, 1995). Researchers now believe it is not the limited
availability of cross-bridge binding sites, but the energy bound state of the cross-bridge
and the cycling rate of the myosin head that are likely causes of fatigue.
The decline in peak force production is explained in the research as a decline in
the force produced per cross-bridge and/or the number of cross-bridges in a high-force

35
state at any given time (Fitts, 2008). High levels of intracellular Pᵢ may lead to a greater
number of cross-bridges in a weakly bound state (ADP + Pᵢ) (Stackhouse, Reisman, &
Binder-Macleod, 2001). In addition, during the muscle cross-bridge cycle, myosin spends
only 5% of the time in a strongly bound state (Sweeney & Houdusse, 2004). It is believed
that the time it takes the cross-bridge cycle to transition from a weakly bound low-force
state, back to a strongly bound high-force state is the key limiter in peak rate of force
development (Fitts, 2008). This concept is known as the rate constant of tension
redevelopment (ktr). The ktr of type II muscle fiber has been estimated to be 7-times faster
when compared to type I. In both cases, the time constant of the cycle appears to be
closely related to Ca2+ sensitivity of the fiber, with some studies showing longer ktᵣ times
with diminished Ca2+ levels (Metzger & Ross, 1990). Some research has suggested that
an increase in Pᵢ may also result in the slower dissociation of actin from myosin during
fatigue, lengthening the time spent in a weakly bound state (Westerblad & Allen, 1993;
Weserblad & Allen, 1994).
2.5 The Influence of Oxygen Availability on Repeated Sprint Ability
One of two stories is often told in physiology textbooks linking oxygen availability
to repeated sprint ability (RSA). The first goes something like this -- the rate of
phosphocreatine (PCr) resynthesis is significantly correlated to power output; PCr
resynthesis is an oxygen dependent reaction; thus aerobic capacity must be related to the
ability to repeat high levels of power output. The second story talks about recovery --
metabolite accumulates during high-intensity exercise; oxygen debt builds; more oxygen
entering the muscle cell clears inhibiting byproducts more quickly; fatigue is mitigated.

36
While several studies have found there to be no correlation between aerobic
capacity (VO2peak) and the ability to recover from high-intensity exercise (Bishop et al.,
2004; Aziz et al., 2000; Cooke et al., 1997; Hoffman, 1997; Wadley & LeRossignol,
1998), the majority support oxygen availability as a crucial component to RSA
(Collander et al., 1988; McMahon & Wenger, 1998; Short & Sedlock, 1998; Tesch &
Wright, 1983; Duponte et al., 2005; Buchheit & Ufland, 2010; Tomlin & Wenger, 2002;
Haseler et al., 1999; Trump et al., 1996; Dupont et al., 2010; DaSilva, Guglielmo, &
Bishop, 2010; Edge et al., 2005). At this time, there is no clear-cut explanation or
hypothesis of how to rationalize the discrepancies of these findings, yet several
explanations have been postulated as possible causes -- a minimal level of aerobic
capacity required to observe effects, lack of standardization and definition of parameters
of RSA tests, and relative homogeneity of subjects (Carey et al., Girard et al., 2011).
Increasing the rate of oxygen delivery during RSE appears to allow for an improved
rate of recovery. Tomlin and Wenger (2002) examined the relationship between VO2peak
and oxygen consumption during high-intensity, intermittent exercise. Subjects for the
study were assigned to either a low aerobic group (LOW, VO2peak = 34.4 ± 2.4) or a
moderate aerobic group (MOD, VO2peak = 47.6 ± 3.8). VO2 of each subject was measured
while they performed 10x6-second maximal sprints with 30 seconds of passive recovery
on a cycle ergometer. The results of the study found that while both groups generated
similar peak power outputs on the first sprint, the MOD group had a significantly smaller
decrement score over the ten sprints than the LOW group (8.8 ± 3.7% compared to 18.0 ±
7.6%; p < 0.02). From these findings, the researchers concluded that the increased

37
aerobic capacity of the MOD group enabled them to resist fatigue during intense
intermittent exercise better than the LOW group.
McMahon and Wenger (2002) came to a similar conclusion after having 20
University level rugby players perform 6x15-second maximal intensity sprints with 90
seconds of active recovery on a cycle ergometer. They found a significant relationship
between VO2peak and percent drop-off in both mean and peak power during bouts five and
six compared with bout one (mean power: r = -0.49, p < 0.03; peak power: r = -0.62, p <
0.002). Gaitanos et al. (1993) found the average decline in power output, between sprint
one and ten in a 10x6-second cycle sprint RSA test, to be 27% when compared to the first
sprint. This modest decline in power output occurred in spite of their finding a 64%
decline in anaerobic ATP production during the final sprint from its resting level. These
findings show that VO2peak plays an important role in both the recovery and maintenance
of peak power over repeated, subsequent bouts of maximal effort exercise.
Other research to examine the oxygen/RSA relationship has found that a high
VO2peak may not be the only factor to ensure optimal RSA (Dupont et al., 2010). Studies
have demonstrated faster O2 kinetics are related to better RSA when compared as a
percent decrement score (% dec) of RSE (Dupont et al., 2010; DaSilva et al., 2010;
Buchheit & Ufland, 2011; Dupont et al., 2005). Based on these results, researchers have
concluded that enhanced O2 kinetics, both on-transient and off-transient, may aid in
replenishing MbO2 stores, quicken the resynthesis of PCr, improve lactate clearance, as
well as speed the removal of H⁺ and Pᵢ (Hogan, Richardson, & Haseler et al., 1999).

38
2.5a On- and Off-transient Oxygen Uptake Kinetics
The term “running economy” is not one commonly used to evaluate or describe an
athlete’s RSA. Running economy, in a general sense, is used as a measure of oxygen
uptake needed to run at a given velocity (Bassett & Howley, 2000). In the world of
endurance training, running economy has been used for decades to help explain some of
the variability that exists between running distance times in athletes with similar VO2peak
values. Conley and Krahenbuhl (1980) compared the 10km race times of 12 elite distance
runners with their VO2peak (average 71.7ml/kg/min) and three steady state running paces
(241, 268, and 295 m/min) which equated to approximately 60, 70, and 80% of their
VO2peak, respectively. The results showed that the relationship between VO2peak and 10km
time was r = 0.12. The correlations between steady state and 10km time were r = 0.83,
0.82, and 0.79 (p < 0.01). These results showed that 65.4% of the variance in race
performance was accounted for by running economy. It stands to argue that a similar
phenomena could occur within team-sport athletes, a “sprinting economy,” that could
help explain the variability found between VO2peak and fatigue during repeated sprint
exercise (RSE).
The impact that O2 kinetics has on RSA has been overlooked due to the general
belief that it is directly associated with VO2peak. Tomlin & Wenger (2002), for example,
found a significant relationship between VO2peak and O2 kinetics during a RSA test (r =
0.78, p < 0.002). Other research, however, has pointed to discrepancies between the two
variables. For example, DaSilva et al. (2010) demonstrated that RSA was more strongly
correlated with O2 kinetics than VO2peak. In the study, 29 national level Brazilian soccer

39
players performed a graded exercise test to exhaustion and a RSA test consisting of
7x34.2-meter sprints interspersed with 25 seconds of active recovery. The results of the
study found negative correlations between the athletes’ percent decrement score (%Dec)
and O2 kinetics (r = -0.49) and VO2peak (r = -0.39). Rampinini et al. (2009) found a
significant correlations between VO2peak and O2 kinetics to high-intensity repeated
exercise, however O2 kinetics explained more of the variability in the model (r = 0.65 vs.
-0.45). While both VO2peak and O2 kinetics in these examples appear to have an effect on
RSA and %Dec, it would appear O2 kinetics is a better predictor of performance.
There is further evidence that oxygen kinetics may be improved independent of
VO2peak (Green, 1997). Research has shown that the human body adapts differently to
high-intensity versus low-intensity stress. A study by Edge, Bishop, Goodman, &
Dawson (2005) compared the effects on repeated sprint ability of HIIT (2-minute
intervals at VO2peak with 1 minute of recovery, starting at four intervals and progressing
to ten) to those of moderate-intensity training (MIT) (70% of VO2peak, starting at 12
minutes and progressing to 30) when matched for total work. Edge and his associates
found that both training groups significantly improved their VO2peak (10-12%, p < 0.05)
and lactic threshold (8-10%, p < 0.05). They also found that only the HIIT group had a
significant increase in total work during the RSA test (13%, p < 0.05), with no significant
improvement seen in the MIT group. While the underlying mechanism is not understood,
the results clearly show that HIIT training somehow enhances O2 kinetics better than
conventional MIT training.
Further weight can be added to this argument from studies performed with patients
40
having metabolic myopathies that directly affect oxidative delivery and transition. For
example, Grassi (2003) points out that subjects with McArdle’s disease show an
enhanced level of O2 delivery, yet have a slower than normal O2 kinetic response to
exercise, a deficiency that would be limited at the muscle level. An improved sprinting
economy could encompass two underlying physiological factors that likely contribute to
variability in RSA literature: 1) O2 on-transient kinetics; and 2) O2 off-transient kinetics;
both via increased or enhanced mitochondrial function (Saunders, Telford, & Hawley,
2004).
In research that has looked at running economy in endurance athletes, trained
subjects appear to reach steady state sooner than untrained subjects (Morgan, Martin, &
Krahenbuhl, 1999; Bassett & Howley, 2000). If this trend, seen at sub-maximal
intensities, holds true during high-intensity exercise, faster VO2 on-transient kinetics
could reduce the metabolic strain on the active tissue by decreasing the oxygen deficit
during sprinting (Hickson, Bomez, & Holloszy, 1978), while off-transient kinetics could
speed up PCr resynthesis (Dupont et al., 2010), re-oxygenate myoglobin (Dupont et al.,
2005), and/or increase the clearance rate of metabolite associated with fatigue (Bailey,
Wilderson, DiMenna, & Jones, 2009). This rate of adjustment in oxidative metabolism
during transitions from rest to maximal exertion could hold large implications for fatigue
during RSE.
A study by Dupont, Millet, Guinhouya, and Berthoin (2005) found that VO2 on-
transient kinetics was significantly correlated to sprint times (r = 0.80, p < 0.01) during a
RSA test consisting of fifteen 40-m sprints interspersed with 25 seconds of active

41
recovery at 50% of their maximal aerobic speed. Other studies have found instances
where athletes were able to reach 90-100% of their VO2peak after only 30 to 60 seconds of
maximal exercise; a feat requiring a fast rate of O2 kinetics (Dupont et al. 2005;
Kavanagh & Jacobs, 1988). A study by McKay, Peterson, and Kowalchuk (2009) looked
at changes in O2 on-transient kinetics during the transition from rest to moderate exercise
after eight weeks of either high intensity interval training (8-12 x 1 min intervals at 120%
maximal O2 uptake interspersed with 1 min recovery) or continuous endurance training
(90-120 min at 65% maximal O2 uptake). The results found O2 uptake time was reduced
by 40% (p < 0.05) in both groups. The researchers concluded that the faster time was a
quicker activation of muscle O2 utilization and local adaptations in muscle blood flow.
A study by Dupont, McCall, Prieur, Millet, and Berthoin (2010) found that a
decrease in %Dec score during a repeated sprint test was correlated to O2 off-transient
kinetic time (r = 0.85; p < .0001). Twelve male soccer players completed a graded
exercise test and a RSA test consisting of seven 30-m sprints alternating with 20 seconds
of active recovery. O2 off-transient kinetics were modeled from two severe-intensity
exercise bouts at 120% of the subject’s maximal aerobic speed (MAS) until exhaustion.
After each bout, subjects would sit in a chair and have their breath-by-breath VO2 data
analyzed for 6 minutes to evaluate recovery and off-transient O2 kinetics. Other research
by Buchheit & Ufland (2011) looked at the O2 off-transient kinetics rate (reoxygenation,
or reoxy rate) of muscle between two 15-second all-out 20-meter shuttle sprints with 15
seconds of passive recovery between bouts. Researchers used a portable near-infrared
spectroscopy (NIRS) apparatus to evaluate changes in tissue oxyhemoglobin,

42
deoxyhemoglobin, and total hemoglobin. The Reoxy rate was found to be significantly
correlated to %Dec ( r = -0.52), leaving researchers to conclude that O2 kinetics play an
important role in RSA.
One thing is certain regarding O2 delivery to the muscle – it is dynamic. A study
by Buchheit, Abbiss, Peiffer, and Laursen (2012) found that both O2 on- and off-transient
kinetics showed significant changes between sprints of an RSA test (6x30 second cycling
sprints interspersed with 2 minutes of passive recovery). They found that muscle
deoxygneation and Reoxy rate increased throughout the sprints (p < 0.001) and were
significantly correlated to time to 90% of VO2peak (r = 0.68, p < 0.05). Further, the test
found that performance on the RSA test was not significantly related to VO2peak (p >
0.05). These results show that repeated sprints elicit greater muscle O2 extraction with
successive repetitions. Further analysis of these findings implies that it could be possible
to have inter-player variability, with certain athletes able to increase their O2 kinetics
earlier during repeated sprints compared to other athletes. This would give them an
advantage by mitigating the onset of fatigue to a later set point compared to their peers.
Despite these findings, it is still too early to state that O2 kinetics accounts for all the
variability seen in RSA research.
2.5b Phosphocreatine Recovery Kinetics
While its direct energy contribution during RSE is heavily debated, most
researchers agree that aerobic metabolism is an important factor in regenerating PCr
during rest periods between sprint bouts. Walter et al. (1997) found that the rate at which
PCr is resynthesized after exercise is related to the oxidative capacity of the muscle.

43
Longer rest bouts equate to more time for O2 to enter the muscle. A study by Blei, Conley
& Kushmerick (1993) showed that PCr resynthesis is dictated by oxygen supplied to the
muscle by electrically stimulating the flexor muscle in the finger and wrist of eight
subjects during normoxic and ischemic conditions. The ischemic condition showed that
after 2 minutes of post-stimulation there had been no net PCr resynthesis in the muscle
compared to the normoxic group. Once oxygen was restored to the muscle, however, PCr
resynthesis recovered at its normal exponential rate, thus linking the importance of
oxygen to PCr resynthesis.
Further research has shown that not only is oxygen essential for PCr recovery, but
that the amount of O2 available also plays a large role in the rate of resynthesis. A study
by Hasler et al. (1999) showed that subjects’ PCr recovery, after 5 minutes of repeated
maximal plantar flexions of the foot, was enhanced by inspiring hyperoxic air and
inhibited when inspiring hypoxic air, when compared to normoxic conditions. Other
studies, such as Quistorff et al. (1992), Sahlin, Harris, & Hultman (1979), and Taylor et
al. (1983) have shown that, during ischemic conditions, the rate of PCr resynthesis is
inhibited when compared to normoxic conditions. These findings, when considered with
the work by Harris et al. (1976), support the theory that the ATP used to rephosphorylate
creatine is derived solely from the aerobic metabolic pathway. The implication is that a
better trained oxidative system would enhance repeated bouts of maximal-effort activity
by increasing the rate of PCr resynthesized during the fast phase of recovery.
There is research that shows recovery modality can affect performance during RSE
by reducing O2 available for PCr recovery, thereby reducing PCr kinetics (Spencer et al.,

44
2008; Castagna et al., 2008; Spencer et al., 2006; Buchheit et al., 2008; Jougla et al.,
2010). Spencer et al. (2008) had two groups of subjects; a moderate (MI) and a low-
intensity (LI) active recovery group perform a RSA test consisting of 6x4-second
maximal sprints with 25 seconds of recovery. Recovery intensity for the MI and LI group
was 35 and 20% VO2peak, respectively. Muscle biopsies of the vastus lateralis were taken
pre- and post- trial to determine ATP, PCr, and lactate content. Compared to passive
recovery controls, there was a significant decline in peak power for both the MI and LI
groups (3.4-6.0% and 3.5-3.7%, respectively; p < 0.05). There were no differences found
in ATP, PCr, and lactate between active recovery trials, however PCr trended
parametrically with recovery intensity. From these results, the researchers concluded that
any low-to-moderate level of muscle activation will inhibit the rate of PCr resynthesis
and increase fatigue during subsequent bouts by limiting O2 availability.
While there is considerable evidence supporting a relationship between oxygen
availability and PCr kinetics, research has shown conflicting results when trying to prove
a direct relationship between the two variables. For example, Cooke et al. (1997) found
no significant correlation between the rate of PCr resynthesis and VO2peak among
individuals grouped in either a high (mean VO2peak 64.4 +- 1.4 mL/kg/min) or low (mean
VO2peak 46.6 +- 1.1 mL/kg/min) relative VO2peak group. Possible confounding factors of
this research line are individual differences in PCr recovery due to genetic predisposition
and muscle fiber variation, as well as small sample sizes seen in most of the experiments.
While muscle fiber distribution between athletic populations may be a confounding factor
when interpreting the effects of endurance training on RSA, some studies have shown

45
improvement with games players. Helgerud at el. (2001) found that 8-weeks of aerobic
interval training for soccer players led to a 20% increase in total distance covered in a
match, a 100% increase in number of sprints per match, as well as an increase in average
work intensity from 82.7 to 85.6% of maximal heart rate.
In addition, the parameters of RSA testing may heavily influence the effects seen
on PCr recovery and the associations made to aerobic capacity, making it hard to find a
clear association. Dupont et al. (2004) reported a significantly shorter time to exhaustion
with active, as opposed to passive, recovery (p < 0.05). Subjects performed 15-second
sprints on a bicycle at 120% of VO2peak, separated by either passive (sitting on the bike)
or active recovery (peddling at 40% VO2peak). The researchers theorized that active
recovery restricted reoxygenation of MbO2, and by association, inhibited PCr resynthesis.
This finding supports that of Buchheit et al. (2008), who found that subjects who
performed active recovery between 6x4-second maximal treadmill sprints resulted in a
significantly higher percent decrement score (%Dec) than those who performed passive
recovery (7.2 ± 3.7% compared to 3.2 ± 1.3%, respectively; p < 0.001). Because there is
no “gold-standard” in RSA testing duration, number of sprints, and recovery times, it is
difficult to rationalize the discrepancies of these investigations. While there is significant
uncertainty as to the weight of the effect, the general consensus of the literature is that
oxygen availability is an important factor in PCr kinetics, and thus resistance to fatigue
during RSE.
2.5c Inorganic Phosphate Kinetics
In addition to improving PCr kinetics, oxygen availability has been shown to

46
influence the rate of Pᵢ accumulation and clearance during RSE (Hogan, Richardson, &
Hasler et al., 1999; Idstrom et al., 1985). These results bring into question the findings of
hypoxia studies and their effects on fatigue, such as Balsom et al. (1994) and Hasler et al.
(1999). While these studies typically conclude that fatigue increases during hypoxic
conditions due to a decreased rate of PCr resynthesis, it is just as likely that fatigue is
manifested through an increase in intracellular Pᵢ.
Unfortunately, there is very little research looking at oxygen availability and Pᵢ
kinetics. Yoshida and Watari (1993) found that off-transient Pᵢ kinetics were significantly
faster in endurance trained athletes than in untrained controls. This implies a higher
aerobic capacity could influence Pᵢ accumulation; however, with so many other variables
likely affecting fatigue, it is unwise to draw any conclusions without further research.
While there is considerable evidence to suggest that a high aerobic capacity may help
mediate the inhibitory effects of an elevated intracellular Pᵢ concentration, at this time the
research is too uncertain to draw inferences.
2.6 Conclusions
Based on the evidence, it would appear that there is no single causative factor of
fatigue limiting the RSA of a field-based sport athlete. Rather, the research points to a
myriad of factors that all seem to feed off of each other, with no single factor by itself
being able to cause substantial fatigue, but the sum of its parts sufficient to cause
significant impairment of the muscle, its contractile efficiency, and energy substrate
supply.
Perhaps the best way to reconcile the complexity of the physiologic integration that

47
takes place during RSE is to look at it through what Edwards (1983) has called, a
“catastrophe theory.” Simply put, it is a modification of the belief that one is only as
strong as its weakest link. This implies that the failure of any one pathway within a larger
system, made up of many adjacent pathways, will place an undue burden on those
adjacent pathways; ultimately causing additional pathways to fail, in succession or
simultaneously, with the eventual outcome being the failure of the entire system.
The current state of the literature regarding RSA, pertaining specifically to the
sport of hockey, has found no relationship between aerobic capacity and performance.
Despite these findings, there is substantial evidence, in testing other sport modalities, to
argue to the contrary. This study aims to eliminate the shortfalls of earlier research by
accounting for task-specificity by testing VO2peak on a skating treadmill and evaluating
RSA using an on-ice test, developed to mimic the motor patterns typically performed by
hockey players during competition.

48
CHAPTER 3: Aerobic Capacity is Associated with Improved Repeated Shift
Performance in Hockey
Ben J. Peterson1, John S. Fitzgerald2, Calvin C. Dietz, Kevin S. Ziegler, Stacy J.
Ingraham1, Sarah E. Baker1, & Eric M. Snyder1
1School of Kinesiology, University of Minnesota, Minneapolis, MN
2Department of Kinesiology and Public Health Education, University of North Dakota,
Grand Forks, ND, USA
ABSTRACT Current research has found conflicting results regarding the relationship between
maximal oxygen uptake (VO2peak) and repeated shift performance (RSP). Specific to
hockey, recent evidence suggests there is no correlation between on-ice and off-ice
VO2peak values in collegiate hockey players. Off-ice VO2peak may not be an adequate
predictor of on-ice performance and should be tested in a sport-specific manner to
achieve transferable results. Purpose: The purpose of this study was to use sport-specific
testing methods to investigate the relationship between aerobic capacity (VO2peak) and
RSP in college hockey players. Methods: Forty-five (range: 18-24) college hockey
players completed a graded exercise test on a skating treadmill to ascertain their VO2peak.
An on-ice repeated shift test was conducted to evaluate each player’s susceptibility to
fatigue. Course times were measured by a wireless timing system and fatigue calculated
as a percent decrement score. First gate, second gate, and total test times were collected
on the course and then used to calculate associated decrement scores. Results: Second
gate decrement was significantly correlated to VO2peak (r = -0.31, p = 0.04). Final stage

49
completed during the graded exercise test was significantly correlated to second gate and
total decrement (r = -0.46, p = 0.001; r = -0.32, p = 0.033). No significant correlation was
found between either first gate or total decrement score and VO2peak (r = -0.11, p = 0.46;
r = -0.17, p = 0.26). Conclusion: On-ice performance is associated with VO2peak. In
addition, stride efficiency plays a large role in predicting on-ice fatigue. This evidence
suggests it may be advantageous for hockey players to include training methods that
improve aerobic capacity and stride efficiency during off-season workouts.
50
1. INTRODUCTION
Sport specific training has been shown to improve performance in repeated sprint
sport athletes (Castagna et al., 2008; Girard, Mendez-Villanueava, & Bishop, 2011). An
important factor for success in repeated sprint sports is a player’s ability to produce
power; the player that is quicker to the ball or faster off the line will often beat their
opponent, giving them an advantage. Competitions for these sports, however, take place
over the period of several hours and are divided into quarters, halves, or periods; each of
these consisting of numerous maximal-work bouts interspersed with relatively short
recovery periods (Montgomery, 2000). The ability to repeatedly produce high power
outputs throughout a competition gives a competitive edge to a player over his/her
opponent and is an important fitness component in repeated sprint sports (Glaister, 2005).
This ability has come to be known as repeated-sprint ability (RSA).
In the repeated sprint sports of rugby and soccer, VO2peak has been shown to
correlate with RSA, ranging from r = -0.50 to -0.83 (Bishop & Edge, 2006; Tomlin &
Wenger, 2001). This relationship is further supported by research showing that a state of
hypoxia can impair RSA in athletes (Balsom, Ekblom, & Sjodin, 2004; Quistorff,
Johansen, & Sahlin, 1992). In addition, creating a hyperoxic environment appears to
improve RSA through increased aerobic adenosine triphosphate (ATP) contribution and
phosphocreatine (PCr) resynthesis rate (Balsom et al., 2004). This evidence suggests that
aerobic capacity and improved oxygen utilization may affect RSA by 1) increasing the
rate of the fast and slow phase of PCr resynthesis (McMahon & Jenkins, 2002), 2)
enhancing the clearance rate of metabolites created by PCr breakdown and

51
glycogenolysis (Bishop & Spencer, 2004), 3) improving oxygen (VO2) kinetics (Dupont,
Millet, Guinhouya, & Berthoin, 2005), and 4) increasing aerobic energy contribution
during maximal sprint bouts (Tomlin & Wenger, 2001).
Disagreement exists regarding the strength of this association, as there is research
to refute these findings. Numerous researchers have failed to find a significant
association (-0.35 < r < -0.46) between VO2peak and RSA in rugby and soccer athletes
(Aziz, Chia, & Teh, 2000; Bishop & Spencer, 2004; Carey, Drake, Pliego, & Raymond,
2007; Wadley & Rossignol, 1998), but it is not clear what role sample size (n < 15)
played in calculating these statistics. The discrepancy in the research would advocate for
additional studies to be conducted to better understand the possible relationship between
aerobic capacity and RSA.
This study aims to address the current limitations specific to ice hockey and RSA in
three ways: 1) address a current population-specific void in ice-hockey RSA research; 2)
account for task-specificity by obtaining players’ VO2peak on a skating treadmill using a
graded exercise test; and 3) evaluate RSA using an on-ice test that mimics the motor
patterns typically performed by ice-hockey players during competition. The results of this
study could have important implications for the training methods used to prepare ice-
hockey players for their competitive season. Therefore, the purpose of this study was to
investigate the relationship between VO2peak and RSA in hockey players. It is
hypothesized that hockey players with a higher aerobic VO2peak will exhibit less fatigue
during an on-ice repeated shift test than those with lower values.

52
2. METHODS
2.1 Participants. All testing procedures were approved by the Institutional Review
Board (IRB) at the University of Minnesota prior to participant recruitment and data
collection. Written, informed consent was obtained from all participants prior to the start
of the study. Participants for this study were male hockey players (ages 18-24) playing
Division I, Division III, or Junior level hockey in the Minneapolis, Minnesota area. All
testing took place at the start of their summer training schedule. Exclusion criteria for the
study included absence from on-ice skating over the previous 30 days due to prior or
current injury and players self-reporting their position of goaltender.
After enrolling in the study, participants were signed up for three testing sessions.
Each session took approximately one hour and was held on the University of Minnesota
campus. All sessions were completed within a ten-day period, ensuring at least two days
rest between sessions. In addition, all testing took place between 7 a.m. and 3 p.m. to
ensure consistency. Participants were told prior to each session to refrain from heavy
exercise 24 hours prior to their testing sessions. All participants were told to eat a light
meal two hours prior to their testing session. In addition, they were asked to refrain from
caffeine, tobacco, and alcohol 12 hours prior to testing. Aside from these guidelines,
participants were asked to maintain a normal diet and exercise regimen during testing.
2.2 Determination of Physical Characteristics. Session One took place in the
Laboratory of Physical Hygiene and Exercise Science (LPHES). It consisted of
anthropometric, vertical jump, Wingate, and grip strength testing. Standing height was
recorded using the Frankfort Plane criterion (Heymsfield, Lohmna, Wang & Going,

53
2010) and weight using a Detecto Mechanical Doctor’s scale (Model #439). Body
composition was assessed via hydrostatic weighing using Exertech Body Densitometry
Systems software (Dresbach, Minnesota). The method is considered to be a valid and
reliable method for measurement of body composition (Heymsfield et al., 2010). The
participants underwater weight was recorded eight times to account for both a learning
effect, as well as to ensure consistency of the measure and accuracy of the reported
weight (Heymsfield et al., 2010). The heaviest duplicated weight was recorded as the
participant’s underwater weight. If the participants were unable to duplicate their first or
second heaviest weight, their third heaviest weight was recorded as the official
underwater weight. Percent body fat was calculated using the Brozak equation
(Heymsfield et al., 2010). Residual lung volume was also calculated (Maud & Foster,
2006).
2.3 Determination of aerobic capacity. Aerobic capacity was assessed on both a
FrappierTM (Acceleration, Minneapolis, MN, n = 30) and The BladeTM (Woodway,
Waukesha, WI, n = 15) skating treadmills to ascertain the VO2peak of each participant.
Breath-by-breath analysis was performed by an Ultima CPXTM (Medgraphics, St. Paul,
MN). The skating treadmill protocol used has been previously validated as a reliable
means for participants to reach volitional exhaustion and accurately measure VO2peak
(Koepp & Janot, 2008). The protocol began with participants skating at a speed of 6.5
miles-per-hour (mph) and a 2% grade. Every minute, the speed of the treadmill was
increased 0.5 mph until a maximal speed of 10 mph was reached; this occurred eight
minutes into the test. Once the participants had reached maximal speed, the grade was

54
increased by 1% every minute until they reached volitional exhaustion. Criteria for
reaching maximal aerobic capacity was determined by achieving two of the three
following criteria: 1) maximal heart rate (220 - age ± 10); 2) RER value > 1.10; and 3)
rate of perceived exertion > 18 (Bassett & Howley).
2.4 On-Ice Repeated Shift Test. Session Three took place at the hockey arena and
consisted of the on-ice repeated shift test. To our knowledge, there is no precedence in
the literature for an on-ice repeated shift test. In addition, it has been shown that off-ice
tests do not predict the on-ice performance of hockey players (Vescovi, Murray, Fiala, &
VanHeest, 2006). To address this shortfall, an on-ice repeated shift test was created for
this study that mimics the intensity, duration, and movement patters performed by a
hockey player during a shift to evaluate the participant’s susceptibility to fatigue during
maximal intensity skating.
To create the test, data was collected from the National Hockey League (NHL)
database concerning the shift length, number of shifts played per period, and rest
intervals between shifts by forwards in the NHL from 2009-2011. It was found the
average shift length by an NHL forward to be 45.5 ± 3.9 seconds, with average shifts
completed per period calculated at 6.8 ± 1.1 (excluding power plays). Other research has
estimated that hockey players spend approximately 50% of their time on the ice in some
form of high-intensity activity (sprinting, striding, skirmishing, etc) (Montgomery, 2000).
When this percentage is applied to the calculated parameters of a hockey shift, then it can
be inferred that a hockey player will spend approximately 22.7 seconds of a shift in a
maximal, or near-maximal, skating state.

55
When the participants arrived at the rink, they were told to change into full gear and
go out on the ice. Participants were instructed to have their skates sharpened to game
specifications prior to testing. When the participants stepped onto the ice, they were told
to go through their typical pre-game warm-up. When the participants said they were
ready, they joined the researchers at the starting line. The participants were told the basic
parameters of the test. In addition, they were told the two goals of the test: 1) skate the
course as fast as possible, and 2) have the lowest drop-off in time from your best course
time as possible.
The participants then watched an instructor glide through the course to understand
its layout. Each participant was then asked to skate the course at 50% of his best effort to
gain familiarization. Upon completion of the familiarization trial, each participant was
asked if he felt comfortable with the course. If he said, “no,” he was instructed to skate
the course one additional time. The participants were given three minutes to rest
following the familiarization trial to ensure they were fully recovered before
commencement of testing.
The test itself consisted of 8-maximal skating bouts, performed in full gear
(including their stick), lasting approximately 22.7 seconds with 90 seconds of passive
recovery between bouts. The course protocol can be seen in Figure 1. Course times were
measured by a TC Speed Trap-II wireless timing system (E38720, Gill Athletics,
Champaign, IL). There were three separate timing gates, used to evaluate first half,
second half, and total fatigue decrement. Fatigue was calculated as a percent decrement
score (% Decrement Score = (100 x (Total Sprint Time ÷ Ideal Sprint Time) – 100)

56
(Glaister, Howatson, Pattison, & McInnes, 2008).
Figure 1: The on-ice repeated shift test consists of 8-maximal skating bouts, with 90 seconds of passive recovery between bouts. The skater starts with their skate at the face-off line; stick behind the laser timer. When given the “start” command, the skater sprints to the blue line, making a hard cut, pushing off their left leg (post leg), and sprinting to the far side of the goalie crease. The skater then makes a hard cut, pushing off their right leg (post leg), and sprints the length of the ice. The skater makes hard crossover steps to their left, going around the circle. After reaching the top of the circle the skater sprints to the base of the right circle, making hard crossover steps to their right. When the skater had completed the turn, they sprinted along the boards through the red line (finish line).
The 90-second recovery time started immediately after the participants crossed the
finish line. Participants were told that during their recovery time they could stand, take a
knee, or lay on the ice; they could not skate around. The participants were informed when
they had 30 seconds and 10 seconds of rest time remaining, with a 5-second count down
to the start. This sequence was completed eight times, with times being recorded after
each sprint bout. Participants were not allowed to drink any sports drinks or mixes during
testing, however water was provided without restriction to the participants.
2.5 Data Analysis. This cross-sectional study is powered for a two-sided test with
57
an effect size of 0.5 and a power of 0.80. The sample size required to show significance
within these parameters was calculated to be n=36 (Hully, Cummings, Browner, Grady,
& Newman, 2007). Mean and standard deviations (SD) were calculated for all variables.
Analysis of VO2peak data was performed by the Breezesuite software package
(Medgraphics, St. Paul, MN). Statistical analysis of the collated data was performed by
SPSS software (IBM, vr. 21.0). Data was analyzed using either a Pearson’s or
Spearman’s correlation test, depending on the distribution of the data. Correlational
coefficients (r) were used to detect associations between the independent and dependent
variable. Multiple regression was used to determine the combined influence of VO2peak
and end stage completed during the graded exercise test on measures of fatigue while
controlling for the use of two skating treadmills. The on-ice repeated shift test had one
participant with a problematic point that was significantly deviated from the mean for all
three timing gates. Because this subject’s data point was not a statistical outlier, this point
was winsorized to one unit above the next highest data point to meet criteria for normal
distribution. For all statistical tests, an alpha level of p < 0.05 was operationally defined
as statistical significance.
3. RESULTS
Forty-five male hockey players participated in this study (Table 1). All participants
met criteria for normalcy in each tested variable. The mean VO2peak for participants was
54.9 ± 4.4 ml/kg/min. Times and decrement scores for first gate, second gate, and total
are described in Table 2. Skate times continued to increase from sprint one to sprint 8,
indicating fatigue, which was the main objective of the course design. No significant

58
correlation was found between either first gate or total decrement score and VO2peak (r =
-0.11, p = 0.46; r = -0.17, p = 0.26; Figure 2). Second gate decrement, however, was
significantly correlated to VO2peak (r = -0.31, p = 0.04; Figure 2), indicating that 9.6% of
the variance in fatigue of the participants can be explained by their aerobic capacity
(VO2peak).
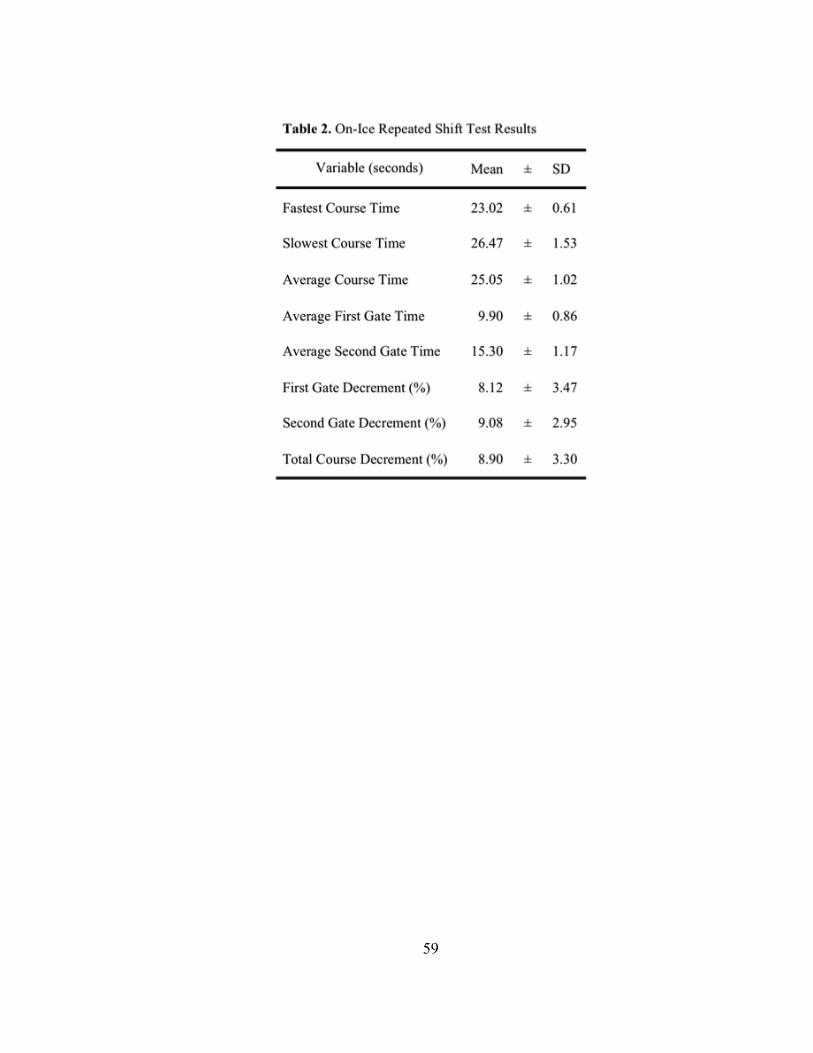
59

60
Figure 2: The relationship between VO2peak and fatigue (percentage decrement score) during the on-ice repeated shift test; broken down into (A) Gate One Fatigue, (B) Gate Two Fatigue, and (C) Total Course Fatigue. *Significant correlation between variables (p < 0.05).

61
Final stage completed during the graded skating treadmill test was significantly
correlated to second gate and total decrement found during the on-ice repeated shift test
when controlled for treadmill type (r = -0.49, p = 0.001; r = -0.32, p = 0.03; Figure 3).
Final stage completed accounted for 21% and 10% of the variance, respectively. These
correlation coefficients indicate that a larger portion of the variance in on-ice fatigue can
be explained by end stage completed than VO2peak. There was no significant correlation
between final stage completed and first gate decrement (r = -0.21, p = 0.17; Figure 3).
Using multiple regression analysis final stage completed and VO2peak, combined,
were significant predictors of second gate fatigue when accounting for the use of two
treadmills (r2 = 28.7, p < 0.05). Independently, final stage completed accounted for
23.0% of the variance (p < 0.05) of gate two fatigue, with an additional 4.2% of the
model being accounted for by VO2peak (p = ns). Final stage completed was also
significantly related to total decrement (r2 = 16.8, p < 0.05), however the addition of
VO2peak did not improve the predictive ability of the model, as indicated by a non-
significant F-value (r2 = 18.8, p = ns).

62
Figure 3: The relationship between Final Stage Completed during the aerobic capacity test on the skating treadmill and Fatigue (percentage decrement score) during the on-ice repeated shift test; broken down into (A) Gate One Fatigue, (B) Gate Two Fatigue, and (C) Total Course Fatigue. *Significant correlation between variables (p < 0.05).

63
4. DISCUSSION
There are two key findings of this study. First, maximal oxygen uptake (VO2peak),
assessed on a skating treadmill, was significantly correlated to fatigue, expressed as a
decrement score, during the second half of a mock hockey shift in competitive college
hockey players. This study is the first to show this significant correlation exists in this
population of athletes. Second, end stage completed during the graded exercise test was
significantly correlated to second gate and total course fatigue, accounting for a greater
portion of the variance than VO2peak, and likely being a better predictor of on-ice
performance than aerobic capacity alone. In addition, the manner in which data was
collected during the on-ice repeated shift test was unique to this study and allowed for a
more thorough understanding of the physical performance and possible energy pathway
contributions of hockey players during competition.
Earlier research has found VO2peak, assessed using running protocols, to be
significantly correlated to RSA in field based team sports (r = -0.50 to -0.83; p < 0.05)
(Bishop & Edge, 2006; McMahon & Jenkings, 2002). These researchers have theorized
that fatigue is associated primarily with one, or a combination of, four intramuscular
conditions; all of which are affected by oxygen availability: 1) diminished rate of PCr
resynthesis; 2) slow the rate of inorganic phosphate accumulation; 3) decreased rate of
glycolytic flux; and 4) increase the level of muscle acidosis. This research would imply
that hockey players with higher maximal oxygen capacities would be better able to
mitigate the effects of these fatigue causing factors and maintain their performance on the
ice better than players with lower levels. Additionally, players that are more efficient

64
skaters would place less strain on their metabolic system while skating, limiting the
accumulation or affect of fatigue causing factors. Simply put, efficient skaters do not
have to work as hard as their inefficient peers and thus perform better on the ice. Despite
ice-hockey having similar energy demands as other team-sports, these associations have
not been found in hockey players.
A recent study found that there was no correlation between on-ice and off-ice
VO2peak values in collegiate hockey players (Durocher, Guisfredi, Leetun, & Carter,
2010). The researchers concluded that running VO2peak was not an adequate predictor of
on-ice VO2peak and suggested that hockey players be tested in a sport-specific manner to
garner reliable results. Taking these findings into account, it is possible that the lack of an
association in the earlier research was due to testing protocol selection and specificity of
task. The present study is the first to compare a sport-specific, skating VO2peak testing
protocol to an RSA test in ice-hockey.
Most RSA tests employ protocols that only utilize linear movement (Gaitanos,
Williams, & Boobis, 1993). This can be problematic when interpreting direct correlations
to performance, as athletes move in a 360° plane of motion during competition (Girard et
al., 2011). Athletes completing a course with multiple changes in direction, when
compared to straight ahead running, covering the same distance, place a greater energy
demand on their metabolic system (Reilly, 1997). This would indicate that RSA tests
employing only linear movement might not adequately simulate the stress placed on an
athlete during competition. The present study addressed this deficiency by creating an on-
ice shift test that mimicked the movement patterns a hockey player would regularly
65
perform during competition.
In addition, the parameters of an RSA test may heavily influence the relationship
between fatigue and VO2peak. The results of an RSA test can vary greatly between studies
due to the fact that there is not a “gold-standard” RSA testing protocol. The rate of
fatigue can be influenced by the number of sprint bouts, the duration of the bouts, or the
recovery period between bouts (Balsom, Seger, Sjodin, & Ekblom, 1992; Buchheit et al.,
2008). The recovery period can further be examined in terms of total time, intensity, and
mode (active or passive); having a significant effect on a studies results (Spencer,
Dawson, Goodman, Dascomb, & Bishop, 2008). Therefore, a primary goal of the present
study was to create an on-ice skating test that mimicked the intensity, skating time,
movement patterns, and recovery that a hockey player would be subject to during a
hockey shift. Each aspect of the course was chosen to require the skater to perform a
movement pattern typically completed during competition; 1) straight ahead sprint; 2)
hard cutting change of direction (rt/lt); 3) short acceleration; 4) long acceleration; and 5)
crossover (rt/lt). These movement parameters were established from conversations with
both NHL and collegiate hockey coaches, as well as from published research (Pearsall,
Turcotte, & Murphy, 2000; Quinney et al., 2008).
Gate two fatigue was significantly correlated to VO2peak. This time point captured
the fatigue rate of each subject during the second half of the course; a time frame of
approximately 10 to 25 seconds of a maximal effort sprint. During this time, the
glycolytic pathway is likely the main contributor to ATP production (Gastin, 2001). One
of the main byproducts of the glycolytic pathway is hydrogen ions (H+); causing an

66
associated drop in intracellular pH (Brooks, Fahey, & Baldwin, 2005; Metzger & Fitts,
1987), which inhibits the rate limiting enzymes of glycogenolysis (phosphorylase a and
phosphofructokinase (PFK)), and is associated with fatigue (Girard et al., 2011;
Westerblad & Allen, 2002). As a result, fatigue could increase in subsequent bouts of
maximal exercise if the muscle is not given sufficient time to clear the H+ from the
intracellular space. The rate of recovery for glycolysis is slow, estimated to have a half
time of approximately nine minutes (Glaister, 2005). With the recovery time between
sprints during the on-ice test being only 90 seconds, it is unlikely that the glycolytic
pathway would be able to return to a homeostatic balance between sprint bouts (Spreit,
Lindinger, McKelvie, Heigenhouser, & Jones, 1989). As a result, hockey players with a
higher VO2peak may be better at buffering H+.
Gate two and total course fatigue were also significantly correlated to end stage
completed during the skating treadmill test. This association implies that skating
mechanics (stride efficiency) are an important aspect of on-ice performance. End stage
completed can be interpreted as a composite measure of a player’s aerobic capacity and
stride efficiency (Pearsall et al., 2000). A player with great stride efficiency but a low
aerobic capacity has the potential to reach the same end stage as a player with poor stride
efficiency and a high aerobic capacity. This is due to the fact that an efficient skater does
not require the same amount of energy output to meet a specific workload. Similar
phenomena have been seen in endurance athletes and the effect of running economy on
marathon times (Saunders, Pyne, Telford, & Hawley, 2004). This may also explain why
VO2peak was not significantly correlated with total course fatigue. VO2peak appears to be

67
confounded by hockey player’s stride efficiency, as a factor of end stage completed, in
that it only accounted for 1.4% of the variance found in total course fatigue. While this
study did not directly measure stride efficiency, our findings of a significant association
between end stage completed and on-ice fatigue argue for future research to look more
closely at this relationship.
Gate one fatigue was not significantly correlated to VO2peak. With an average time
to completion of 9.9 seconds, gate one captured the section of the course most reliant on
ATP production from the PCr energy pathway (Bogdanis, Nevill, Boobis, & Lakomy,
1996). Studies have shown PCr synthesis to follow a biphasic pattern of recovery after
intense muscular activity (Baker, McCormick, & Robergs, 2010). The rate of the fast
phase of PCr recovery appears to have a half time of only 21 seconds, in which 50% of
used PCr is resynthesized (Harris, Edwards, & Hultman, 1976). This appears to be
unaffected by the pH of the muscle and is a very robust, fatigue resistant pathway
(McMahon & Jenkins, 2002). Keeping these facts in mind when examining the
parameters of the on-ice repeated shift test gives a possible, justifiable, explanation as to
why gate one was not significantly correlated to VO2peak. The recovery time between
sprint bouts was over four times longer than PCr requires to recover half of its pre-
exercise level after maximal exercise. With the primary energy system contributing to
gate one performance being given sufficient time to recover, the reductions in PCr during
repeated bouts are not great enough to elicit measurable fatigue in our sample population
of athletes.

68
Total course time was also not significantly correlated to VO2peak, however that
could be a factor of the fatigue resistant nature of the PCr pathway. The significance of
total course time, as it relates to VO2peak, is the sum effect of the energy system taking
place during gates one and two. With the recovery of PCr being robust against fatigue it
is plausible that gate one times skew the results, reducing the net fatigue effect seen in
total sprint time when compared to the athletes VO2peak. It would stand to reason that
using a larger sample size, reducing the recovery time, or lengthening the duration of the
sprint would have reduced the skew of the data by placing less statistical weight on the
fatigue resistant PCr pathway and increase the effect of oxidative contribution to energy
during sprint bouts.
5. CONCLUSIONS
The results of this study indicate that a hockey player’s maximal aerobic capacity is
associated with fatigue during a mock hockey shift, and that end stage completed during
a graded skating treadmill test is a good predictor of on-ice performance. We hypothesize
that this is likely due to the fact that end stage completed takes into account the stride
efficiency of the hockey player, in addition to their aerobic capacity. This evidence
suggests that it may be prudent for hockey players to emphasize training methods that
improve skating efficiency, as well as incorporate VO2peak specific training during off-
season workouts. These findings could be beneficial for coaches as they advocate for
testing hockey players in a sport specific manner, via a skating treadmill or on-ice skating
test, as the best means of evaluating physical performance on the ice.

69
CHAPTER 4: Division I hockey players generate more power than Division III
players during on- and off-ice performance tests
Ben J. Peterson1, John S. Fitzgerald2, Calvin C. Dietz, Kevin S. Ziegler, Stacy J.
Ingraham1, Sarah E. Baker1, & Eric M. Snyder1
1School of Kinesiology, University of Minnesota, Minneapolis, MN
2Department of Kinesiology and Public Health Education, University of North Dakota,
Grand Forks, ND, USA
ABSTRACT
Current research has found anthropometric and physiologic characteristics of
hockey players that are correlated to performance. These characteristics, however, have
never been examined to see if significant differences exist between on- and off-ice
performance markers at different levels of play (e.g., Division I, Elite Junior, and
Division III). The purpose of this study was to examine the differences that may exist
between these characteristics in Division I (24), Elite Junior (10), and Division III hockey
(11) players. Forty-five (age 18-24) male hockey players completed anthropometric, on-
ice, and off-ice tests to ascertain average measures for each division of play. On-ice
testing was conducted in full hockey gear and consisted of acceleration, top speed, and
on-ice repeated shift test (RST). Off-ice tests included vertical jump, Wingate, grip
strength, and a graded exercise test performed on a skating treadmill to ascertain their
VO2peak. Division I players had significantly lower body fat than their Division III peers
(p = 0.004). Division I players also scored significantly better than their Division III

70
counterparts on measures of anaerobic power; vertical jump (p = .001), Wingate peak
power (p = 0.05), grip strength (p = 0.008), top speed (p = .001), and fastest RST course
time (p = .001). There was no significant difference between Division I and Elite Junior
players for any on- or off-ice performance variable. The results of this study indicate that
performance differences between Division I and Division III hockey players appears to
be primarily due to rate of force production.
Key Words: Rate of Force Development, Skating, Anaerobic, Specificity

71
1. INTRODUCTION
Team sports have varying physiologic demands. Soccer, for example, tends to
require its athletes to have a high aerobic capacity, while sports like football place a
emphasis on strength and power (Spencer, Bishop, Dawson, and Goodman, 2005). Teams
with athletes that are better suited to meet their sports demands often outperform their
competition via superior sport-specific athleticism. To that end, the ability to evaluate and
recruit players in possession of these physical qualities becomes imperative for a team’s
success. Anthropometric and physiologic characteristics have been used by coaches in
many team sports to identify and recruit elite players, classify starters verses non-starters,
and stratify athletes by level of play (Fitzgerald et al., 2013; Leone, Lariviere, &
Comtois, 2002; Keogh, 1999, Houston et al.). For example, Rampanini et al. (2009)
found that VO2peak was a physiologic characteristic that differentiated professional from
elite junior soccer players. According to Rampinini, regardless of their skill, an elite
junior player that had a VO2peak below a given threshold would not succeed at the
professional level due to an inadequate ability to perform high levels of aerobic work.
To be effective, decision makers (coaches, general managers, and scouts) need a
quantifiable list of characteristics that have been shown to be associated with aspects of
performance in their respective sport. The creation of a sport-specific physiological
profile would aid coaches in selecting athletes from a much larger pool who have the
physiologic attributes to compete at their respective level, identify athlete strengths and
weaknesses, and allow for the creation of athlete-specific training programs that address
their limitations.
72
Ice-hockey requires a unique set of physiologic qualities to be successful; speed,
power, endurance, and skill (Noonen et al, 2002; Buchheit, Lefebvre, Laursen, &
Ahmaidi, 2011; Potteiger et al., 2010). Previous literature has found on- and off-ice tests
that correlate with performance; including anthropometry, aerobic capacity, power, and
skating ability (Peterson et al., 2014; Fitzgerald et al., 2013; Agre et al., 2000; Potteiger
et al., 2010; Bracko, 2001; Montgomery, 2000; Behm et al., 2005). However, this
research has focused solely on evaluating the National Hockey League (NHL) (Vescovi,
Murray, Fiala, & VanHeest, 2006; Quinney et al., 2008; Pearsall, Turcotte, & Murphy,
2000). Little to no research has investigated differences that may exist at the colligate and
Elite Junior level. This has lead to a void in the literature that prevents coaches at the
collegiate level from making informed, scientifically based decisions regarding the
recruiting training methods employed with their teams.
This study aims to address the current limitations specific to ice-hockey by 1)
evaluating common physiologic performance characteristics of collegiate hockey players
and 2) stratifying these results by division of play to look for differences that may exist
between the Division I, Elite Junior, and Division III level. The results of this study could
have important implications for the training and recruiting practices used by coaches at
different levels of collegiate hockey. It is hypothesized that Division I hockey players
will have higher on- and off-ice performance scores compared to their peers playing at
the Elite Junior or Division III level.

73
2. METHODS
2.1 Experimental Approach to the Problem. Subjects were signed up for three
testing sessions; 1) anthropometric and off-ice performance; 2) aerobic capacity; and 3)
on-ice performance testing. Each session took approximately one hour and was held on
the University of Minnesota campus. All subjects were tested in early June at the start of
their summer training schedules. All three sessions were completed within a ten-day
period, ensuring at least two days rest between sessions. Subjects were told prior to each
session to refrain from heavy exercise for 24 hours prior to their testing sessions. All
subjects were told to eat a light meal two hours prior to testing and to refrain from
caffeine, tobacco, and alcohol 12 hours prior to testing. Aside from these guidelines,
subjects were asked to maintain a normal diet and exercise regimen during testing.
Exclusion criteria for the study included absence from on-ice skating over the previous
30 days due to prior or current injury and players self-reporting their position as
goaltender.
2.2 Subjects. Forty-five male hockey players, ages 18-24 and playing Division I,
Division III, or Elite Junior level hockey in the Minneapolis, Minnesota area volunteered
for this study. All testing procedures were approved by the Institutional Review Board
(IRB) at the University of Minnesota prior to participant recruitment and data collection.
Written, informed consent was obtained from all participants prior to the start of the
study.
2.3 Session One - Anthropometric and Off-ice Performance Testing. Session
one consisted of anthropometric, vertical jump, Wingate, and grip strength testing.

74
Standing height was recorded using the Frankfort Plane criterion (Heymsfield, Lohmna,
Wang & Going, 2010) and weight using a Detecto Mechanical Doctor’s scale (Model
#439). Body composition was assessed via hydrostatic weighing using Exertech Body
Densitometry Systems software (Dresbach, Minnesota). The method is considered to be a
valid and reliable method for measurement of body composition (Heymsfield et al.,
2010). The participants weight was recorded eight times to account for both a learning
effect, as well as to ensure consistency of the measure and accuracy of the reported
weight (Heymsfield et al., 2010). The heaviest duplicated weight was recorded as the
participant’s underwater weight. If the participants were unable to duplicate their first or
second heaviest weight, their third heaviest weight was recorded as the official
underwater weight. Percent body fat was calculated using the Brozak equation
(Heymsfield et al., 2010). Residual lung volume was also estimated (Maud & Foster,
2006).
Vertical jump was tested using a VertecTM Vertical Jump Trainer (Huntington
Beach, CA). Each participant performed a five-minute treadmill warm-up, starting at 5
mph and increasing 0.5 mph per minute to a maximum of 7 mph, before performing the
vertical jump protocol to standardize the measure. The vertical jump protocol consisted
of two submaximal practice jumps to gain familiarization, followed by three to five
maximal jumps, allowing a minimum of 30 seconds of rest between jumps. For each
jump, the participant was instructed to squat to a self-selected depth (approximately 90
degrees) and hold that position for three seconds. The participant was also instructed to
place one arm on their hip with the other above their head in a reaching position. After a

75
3-second count, the instructor would give an audible “jump” command, and the
participant would jump, touching the highest vane possible on the VertecTM Vertical Jump
Trainer. These instructions ensured a standardized jump protocol for each subject, and
help reduce confounding of arm swing during jumping (Ferreira, Schilling, Weiss, Fry, &
Chiu, 2010). Jump height was assessed by counting the highest vane contacted by the
participant. The test was terminated when the participant failed to increase jump height in
two consecutive trials, or after the fifth trial.
The Wingate Anaerobic Test (WAnT), performed on a Monarch cycle ergometer
(Langley, WA), was used to assess lower-body power production. The testing protocol
for the WAnT has been standardized in earlier literature (Maud et al., 2006). After the
seat and bar height were properly adjusted for the participant, they were told warm-up by
lightly pedaling for 30 seconds. During the last five seconds of the warm-up time, the
participant was told to increase their pedal velocity to its maximum and maintain it for
the duration of the test. When the warm-up time expired, a flywheel resistance load
equaling 0.075 kg/kg body weight was applied, with the participant continuing to pedal
maximally for 30 seconds. Participants’ peak (PP) and mean (MP) power were calculated
as the highest average power attained during the first five seconds and full 30 seconds of
the test (Maud et al., 2006). Power values were recorded in watts and normalized for
body weight. The reliability of these measures, PP and MP, have been established as
robust in previous literature (r = .92) when using the 0.075 kg/kg loading parameter
(Patton, Murphy, & Frederick, 1985).
Grip strength was assessed using a Jamar Dynamometer. Grip strength in the
76
participant’s dominant hand was measured in kilograms using the standard testing
protocol outlined by the American Society of Hand Therapists (Innes, 1999). The
participant sat on the edge of a chair, holding the dynamometer with the grip diameter set
at 3.8cm, with his elbow at his side in 90 degrees of flexion. The participant was given
one submaximal attempt to account for a learning affect, followed by a one-minute rest
period. The participant was then instructed to maximally grip the dynamometer for three
seconds. This protocol was repeated two additional times, with the scores from all three
attempts being averaged into a composite score used for data analysis.
2.4 Session Two - Determination of Aerobic Capacity. Aerobic capacity was
assessed on both a FrappierTM (Acceleration, Minneapolis, MN, n = 30) and The BladeTM
(Woodway, Waukesha, WI, n = 15) skating treadmills to ascertain the VO2peak of each
participant. Breath-by-breath analysis was performed by an Ultima CPXTM (Medgraphics,
St. Paul, MN). The skating treadmill protocol used has been previously validated as a
reliable means for participants to reach volitional exhaustion and accurately measure
VO2peak (Koepp & Janot, 2008). The protocol began with participants skating at a speed
of 6.5 miles-per-hour (mph) and a 2% grade. Every minute, the speed of the treadmill
was increased 0.5 mph until a maximal speed of 10 mph was reached; this occurred eight
minutes into the test. Once the participants had reached maximal speed, the grade was
increased by 1% every minute until they reached volitional exhaustion. Criteria for
reaching maximal aerobic capacity was determined by achieving two of the three
following criteria: 1) maximal heart rate (220 - age ± 10); 2) RER value > 1.10; and 3)
rate of perceived exertion > 18 (Bassett & Howley).
77
2.5 Session Three - On-ice Performance Testing. Session three took place at the
hockey arena and consisted of an acceleration, top speed, and on-ice repeated shift test.
All on-ice testing was performed in full gear with skates sharpened to game
specifications. Acceleration was assessed by having the participant sprint, from a
stationary start, blue line to blue line (Distance = 15.24m). Similar protocols have been
implemented in earlier research and the method is considered a valid way to measure
acceleration (Gilenstam, Thorsen, & Henriksson-Larsen, 2011). The participant started
by standing with his front skate directly behind the blue line (starting line), stick in hand.
When the participant felt he was ready, he would accelerate as fast as possible through
the second blue line (finish line). Time was recorded by a TC Speed Trap-II wireless
timing system (E38720, Gill Athletics, Champaign, IL). The photo cells of both timing
gates were placed at waist level of the participant to ensure that the laser timed his body
crossing the line, not his stick. In addition, participants were told to keep their sticks on
the ice to ensure they did not prematurely trip the laser timer. Once the participant
crossed the finish line they coasted back to the starting line and were given two minutes
to recover. The recovery time started when the participant returned to the starting line.
Similar tests have been reported to have test-retest values of r = 0.8 (Bracko, 2001). Each
participant performed two trials, with the fastest time being used for data analysis.
Top speed was assessed after completion of the acceleration test and a two-minute
recovery period. Top speed was measured by the time it took the participant to cover the
distance between blue lines (15.24m) with a skating start (Brako, 2001; Gilenstam et al.,
2011). The participant was instructed to take a lap around the rink, starting at the blue

78
line (start line), increasing their speed as they re-approach the start line. When the
participant reached the start line, they were instructed to be moving as fast as possible,
and to maintain that speed through the finish line. Times were again recorded by a TC
Speed Trap-II wireless timing system (E38720, Gill Athletics, Champaign, IL) with the
photocells placed at waist level. Once the participant crossed the finish line they coasted
back to the starting line and were given two minutes to recover. The recovery time started
when the participant returned to the starting line. This test has been reported to have test-
retest values of r = 0.84 (Bracko, 2001). Each participant performed two trials, with the
fastest time being used for data analysis.
Fatigue resistance was assessed after the top-speed test; again giving the participant
a two minute recovery period. Fatigue was measured as a percent decrement score during
an on-ice repeated shift test (Peterson et al. 2014). Participants were not allowed to drink
any sports drinks or mixes during testing, however water was provided without restriction
to the participants.
2.6 Data Analysis. Statistical analysis of the data was performed using SPSS
software (IBM, vr. 21.0). Mean and standard deviations (SD) were calculated for all
variables. One-way, multivariate analysis (ANOVA) was performed to examine the
relationship between level of play and off-ice, on-ice, and anthropometric characteristics
of the participants. To quantify the strength and direction of the multivariate
relationships, the Tukey method was applied to find means that were significantly
different from each other. Standard error (SE) and alpha values were calculated for each
variable. All participants met criteria for normality in each tested variable. The on-ice

79
repeated shift test had one subject with a problematic point that was significantly
deviated from the mean for all three timing gates. Because this subject’s data point was
not a statistical outlier, this point was winsorized to one unit above the next highest data
point to meet criteria for normal distribution. For all statistical tests, an alpha level of p <
0.05 was operationally defined as statistical significance.
3. RESULTS
Anthropometric characteristics of the forty-five male hockey players (Division I =
24, Junior = 10, Division III = 11) are shown in Table 1. Division I players were
significantly taller, heavier, and had a lower percent body fat than Division III players (p
= 0.01; p = 0.04; and p = 0.004, respectively). Body fat percentage was also significantly
different between Division I and Elite Junior players (p = 0.04), as well as Elite Junior
and Division III players (p = 0.001).
Division I and Elite Junior players had significantly higher values for most
variables compared to Division III players (Table 2). Division I players scored
significantly better in the vertical jump (p = .001), Wingate PP (p = 0.04), grip strength (p
= 0.008), and maximum heart rate (p = 0.04). Junior level players scored significantly
better than Division III players in vertical jump (p = 0.003) and Wingate fatigue index (p
= 0.03).
Division I and Junior players were also significantly better in on-ice performance
variables compared to Division III players (Table 3). Both groups scored significantly
better in top speed (p = .001), fastest course time (p = .001), slowest course time (p =
0.001), and average course time (p = 0.001). Junior players additionally scored

80
significantly better than Division III players in gate two and total course fatigue (p =
0.04, and p = 0.04, respectively).
Table 1. Physical characteristics of the subjects Table 1. Physical characteristics of the subjects Table 1. Physical characteristics of the subjects Table 1. Physical characteristics of the subjects Table 1. Physical characteristics of the subjects Table 1. Physical characteristics of the subjects
VariableDivision of Play
N Mean ± SD
Height (cm)
D I 24 184.92 ± 5.99*
Height (cm) Junior 10 180.70 ± 6.78Height (cm)
D III 11 178.55 ± 3.50
Weight (kg)
D I 86.88 ± 6.69*
Weight (kg) Junior 82.30 ± 5.62Weight (kg)
D III 81.45 ± 4.95
Body Fat (%)
D I 11.46 ± 2.43*⁺
Body Fat (%) Junior 9.40 ± 2.01*Body Fat (%)
D III 14.36 ± 2.29D I = Division One PlayerD I = Division One PlayerD I = Division One PlayerD I = Division One PlayerD I = Division One PlayerD I = Division One PlayerJunior = Junior Level PlayerJunior = Junior Level PlayerJunior = Junior Level PlayerJunior = Junior Level PlayerJunior = Junior Level PlayerJunior = Junior Level PlayerD III = Division Three PlayerD III = Division Three PlayerD III = Division Three PlayerD III = Division Three PlayerD III = Division Three PlayerD III = Division Three Player*Significantly different from Division III (p < 0.05)*Significantly different from Division III (p < 0.05)*Significantly different from Division III (p < 0.05)*Significantly different from Division III (p < 0.05)*Significantly different from Division III (p < 0.05)*Significantly different from Division III (p < 0.05)⁺Significantly different from Junior (p < 0.05)⁺Significantly different from Junior (p < 0.05)⁺Significantly different from Junior (p < 0.05)⁺Significantly different from Junior (p < 0.05)⁺Significantly different from Junior (p < 0.05)⁺Significantly different from Junior (p < 0.05)

81
Table 2. Off-ice performance characteristics Table 2. Off-ice performance characteristics Table 2. Off-ice performance characteristics Table 2. Off-ice performance characteristics Table 2. Off-ice performance characteristics Table 2. Off-ice performance characteristics
VariableDivision of Play
N Mean ± SD
Vertical Jump (in)
D I 24 20.96 ± 2.27*
Vertical Jump (in) Junior 10 21.30 ± 2.79*Vertical Jump (in)
D III 11 17.64 ± 2.20
Wingate - Peak Power (w)
D I 1112.29 ± 121.67*
Wingate - Peak Power (w) Junior 1037.40 ± 132.71Wingate - Peak Power (w)
D III 1024.27 ± 51.24
Wingate - Mean Power (w)
D I 786.08 ± 75.08
Wingate - Mean Power (w) Junior 762.80 ± 79.85Wingate - Mean Power (w)
D III 725.00 ± 79.36
Wingate - Fatigue Index (%)
D I 49.75 ± 7.41
Wingate - Fatigue Index (%) Junior 45.00 ± 6.98*Wingate - Fatigue Index (%)
D III 53.09 ± 5.61
Grip Strength (kg)
D I 66.75 ± 8.37*
Grip Strength (kg) Junior 62.70 ± 10.39Grip Strength (kg)
D III 56.55 ± 8.65
VO2peak (ml/kg/min)
D I 54.92 ± 3.90
VO2peak (ml/kg/min) Junior 57.20 ± 5.35VO2peak (ml/kg/min)
D III 52.82 ± 4.02
Max Heart Rate (b/min)
D I 201.43 ± 9.16*
Max Heart Rate (b/min) Junior 203.50 ± 10.78*Max Heart Rate (b/min)
D III 193.91 ± 7.90VO2peak = Maximal Oxygen ConsumptionVO2peak = Maximal Oxygen ConsumptionVO2peak = Maximal Oxygen ConsumptionVO2peak = Maximal Oxygen ConsumptionVO2peak = Maximal Oxygen ConsumptionVO2peak = Maximal Oxygen ConsumptionD I = Division One PlayerD I = Division One PlayerD I = Division One PlayerD I = Division One PlayerD I = Division One PlayerD I = Division One PlayerJunior = Junior Level PlayerJunior = Junior Level PlayerJunior = Junior Level PlayerJunior = Junior Level PlayerJunior = Junior Level PlayerJunior = Junior Level PlayerD III = Division Three PlayerD III = Division Three PlayerD III = Division Three PlayerD III = Division Three PlayerD III = Division Three PlayerD III = Division Three Player*Significantly different from Division III (p < 0.05)*Significantly different from Division III (p < 0.05)*Significantly different from Division III (p < 0.05)*Significantly different from Division III (p < 0.05)*Significantly different from Division III (p < 0.05)*Significantly different from Division III (p < 0.05)

82
Table 3. On-ice performance characteristics Table 3. On-ice performance characteristics Table 3. On-ice performance characteristics Table 3. On-ice performance characteristics Table 3. On-ice performance characteristics Table 3. On-ice performance characteristics
VariableDivision of Play
N Mean ± SD
Acceleration (sec)
D I 24 2.62 ± 0.10
Acceleration (sec) Junior 10 2.55 ± 0.17Acceleration (sec)
D III 11 2.63 ± 0.12
Top Speed (sec)
D I 1.57 ± 0.06*
Top Speed (sec) Junior 1.56 ± 0.08*Top Speed (sec)
D III 1.66 ± 0.06
Fastest Course Time (sec)
D I 22.82 ± 0.47*
Fastest Course Time (sec) Junior 22.75 ± 0.59*Fastest Course Time (sec)
D III 23.68 ± 0.41
Slowest Course Time (sec)
D I 26.03 ± 1.14*
Slowest Course Time (sec) Junior 25.72 ± 1.00*Slowest Course Time (sec)
D III 28.18 ± 2.02
Average Course Time (sec)
D I 24.75 ± 0.76*
Average Course Time (sec) Junior 24.41 ± 0.54*Average Course Time (sec)
D III 26.30 ± 1.24
Gate One Fatigue (%)
D I 7.80 ± 3.53
Gate One Fatigue (%) Junior 7.71 ± 2.67Gate One Fatigue (%)
D III 9.36 ± 3.99
Gate Two Fatigue (%)
D I 9.25 ± 2.91
Gate Two Fatigue (%) Junior 7.35 ± 2.49*Gate Two Fatigue (%)
D III 10.29 ± 3.03
Total Course Fatigue (%)
D I 8.60 ± 3.08
Total Course Fatigue (%) Junior 7.39 ± 2.33*Total Course Fatigue (%)
D III 10.89 ± 3.75D I = Division One PlayerD I = Division One PlayerD I = Division One PlayerD I = Division One PlayerD I = Division One PlayerD I = Division One PlayerJunior = Junior Level PlayerJunior = Junior Level PlayerJunior = Junior Level PlayerJunior = Junior Level PlayerJunior = Junior Level PlayerJunior = Junior Level PlayerD III = Division Three PlayerD III = Division Three PlayerD III = Division Three PlayerD III = Division Three PlayerD III = Division Three PlayerD III = Division Three Player*Significantly different from Division III (p < 0.05)*Significantly different from Division III (p < 0.05)*Significantly different from Division III (p < 0.05)*Significantly different from Division III (p < 0.05)*Significantly different from Division III (p < 0.05)*Significantly different from Division III (p < 0.05)

83
4. DISCUSSION
The primary aim of this study was to discern differences that exist in
anthropometric and physiologic variables previously shown in the literature to correlate
to the performance of collegiate hockey players. This study had two main findings. First,
there were significant differences in anaerobic power indices between Division I and
Division III players. Division I players had greater vertical jump heights, Wingate PP,
grip strength, top speed, and fastest RST course time. While these differences were
assumed to exist, this study is the first to objectively test and quantify the differences.
Second, there was no significant difference in aerobic capacity between levels of play;
VO2peak, Wingate fatigue index, RST gate one fatigue, RST gate two fatigue, and RST
total course fatigue.
Research has shown an athlete’s muscle fiber distribution can have a dramatic
impact on their ability to produce force (Wilmore, Costill, & Kenney, 2008). Slow twitch
muscle fibers have a high level of aerobic endurance, meaning they are efficient at
producing ATP from oxidative metabolism but poorly suited to generate high levels of
sustained power (Wilmore et al., 2008). Fast twitch fibers rely on anaerobic mechanisms,
mainly PCr metabolism, which allow them to produce high levels of force quickly
(Brooks et al., 2005). Several studies have shown this discrepancy exists in the muscle
fiber distribution within athletes in the same sport (Costill et al., 1976; Fink, Constill, &
Pollock, 1977; Saltin, Henriksson, Nygaard, & Anderson, 1977). For example, while
hockey is generally played by a homogenous group of athletes, performance
discrepancies exist between players of different positions (Montgomery, 2000). A study
84
by Green et al. (1976) found that defensemen skate longer shifts, and at a lower average
velocity, reporting a 61.6% decrease compared to forwards. To deal with the increased
skating time and decreased speed, defensemen may have adapted a higher percentage of
slow switch fibers compared to forwards (Montgomery, 2000).
Discrepancies in fiber distribution would have drastic effects on the rate of force
production of a hockey player. Demant & Rhodes (1999) reported that PCr content at rest
in slow twitch and fast twitch fibers was significantly different (p < 0.05), at 73.1 ± 9.5
and 82.7 ± 11.2 mmol/kg/dm, respectively. In addition, fast twitch fibers appear to rely
more heavily on PCr for energy supply during maximal exercise (Gray, Soderlund, &
Richardson, 2008). Another study, by Karatzaferi et al. (2001), analyzed muscle biopsies
of individuals after 10 seconds of maximal dynamic exercise. The results found that PCr
levels in type I, IIa, IIAx, and IIXa fibers had been depleted to 46, 53, 62, and 59% of
their resting levels, respectively. These findings were supported by Gray, Soderlund, and
Ferguson (2007), who found that fast twitch fibers had a greater decline in PCr content
after a 6-second maximal bike sprint than slow twitch fibers. This discrepancy could be
further increased between players at the Division I and Division III level, resulting in the
significant difference seen in the anaerobic measures of this study.
There was no significant difference between aerobic capacity or rate of fatigue
between the levels of play. This lack of variation could be explained by the homogeneity
of the participants in terms of anthropometric characteristics and training history
(Quinney et al., 2008). In addition, aerobic capacity has been found to be closely tied to
genetics, with heritability accounting for upward of 70% of a person’s VO2peak (Brearley

85
& Zhou, 2001). With such a small portion of the variance in VO2peak coming from a
training effect it is possible that hockey players, as a population, do not have enough
variance in the measure to find significant differences.
The lack of a significant difference in aerobic capacity between levels of play begs
the question, “what differentiates players at these levels?” There are two possible factors
to help answer this question. First, research has demonstrated that team-sport
performance is more strongly correlated with O2 kinetics than VO2peak. Rampinini et al.
(2009) found a significant correlation between both VO2peak and O2 kinetics to high-
intensity repeated exercise; however, O2 kinetics explained more of the variability in the
model (r = 0.65 vs. -0.45). While both VO2peak and O2 kinetics appear to have an effect
on performance, it would appear O2 kinetics is a better predictor of performance. Second,
skating mechanics (stride efficiency) are an important aspect of on-ice performance
(Pearsall et al., 2000). A player with great stride efficiency has the potential to
outperform a player with poor stride efficiency but the same aerobic capacity. This is due
to the fact that an efficient skater does not require the same amount of energy output to
meet a specific workload. Similar phenomena have been seen in endurance athletes and
the effect of running economy on marathon times (Saunders, Pyne, Telford, & Hawley,
2004). While this study did not directly measure O2 kinetics or stride efficiency, future
research should look more closely at these relationships and their differences between
levels of play in collegiate hockey players.

86
5. PRACTICAL APPLICATIONS
The results of this study indicate that Division I hockey players, when compared to
Division III, have a significantly higher rate of force production on tests measuring
anaerobic performance. Significant differences did not exist between any level of play,
however, when comparing scores of aerobic performance. In regards to the first finding,
we hypothesize that this is likely due to muscle fiber distribution differences that exist
between players at these levels. In reference to the second finding, O2 kinetics and stride
efficiency likely contribute to performance discrepancies between levels of play despite
players possessing similar aerobic capacities. This evidence suggests that it may be
prudent for hockey players to emphasize training methods that focus on rate of force
production and skating efficiency. These findings could be beneficial to coaches by
providing normative data of performance markers for different levels of collegiate
hockey. Coaches can use this data to evaluate future players during recruiting and target
the ones that posses the anthropometric and physiologic traits that best fit their system. In
addition, coaches can use these markers to implement training practices with their current
players to maximize performance.

87
CHAPTER 5: Off-Ice Anaerobic Power is Not a Good Predictor of On-Ice Repeated Shift Performance in Hockey Players Ben J. Peterson1, John S. Fitzgerald2, Calvin C. Dietz, Kevin S. Ziegler, Sarah E. Baker1,
& Eric M. Snyder1
1School of Kinesiology, University of Minnesota, Minneapolis, MN
2Department of Kinesiology and Public Health Education, University of North Dakota,
Grand Forks, ND, USA
ABSTRACT
Research indicates that anaerobic power is a significant predictor of acceleration
and top speed for team sport athletes. While these findings have historically been
believed to apply to ice-hockey, recent research has brought their validity into question.
In addition, it is unknown if single bout acceleration and top speed are important
performance markers for ice hockey, given the high intensity, repeated bout nature of the
sport. With game demands emphasizing the ability to repeatedly produce power, current,
single bout anaerobic power tests should be examined to see if they are good predictors
of on-ice performance. Purpose: To evaluate if conventional off-ice anaerobic power
tests are good predictors of on-ice acceleration, top speed, and repeated shift
performance. Methods: Forty-five (age 18-24) hockey players completed
anthropometric, off-ice, and on-ice tests. Anthropometric and off-ice testing included
height, weight, body composition, vertical jump, and Wingate tests. On-ice testing
consisted of acceleration, top speed, and repeated shift tests. Results: On-ice acceleration
and velocity were significantly correlated to vertical jump (VJ) (r = -0.42; p = 0.004; r =

88
-0.58; p = 0.001), Wingate relative peak power (WRPP) (r = -0.32; p = 0.03; r = -0.43; p
= 0.003), and relative mean power (WRMP) (r = -0.34; p = 0.02; r = -0.48; p = .001).
Dissimilarly, none of the off-ice tests were predictors of on-ice repeated shift
performance, as measured by first gate, second gate, or total course fatigue; VJ (r = 0.06;
p = 0.06; r = 0.13; p = 0.71; r = 0.09; p = 0.37), WRPP (r = 0.06; p = 0.71; r = 0.14; p =
0.35; r = 0.36; p = 0.50), or WRMP (r = -0.10; p = 0.92; r = -0.01; p = 0.53; r = -0.01; p =
0.94). Conclusion: While conventional off-ice anaerobic power tests predict single bout,
on-ice acceleration at top speed, they do not predict the repeated shift ability of the
player, and thus are not good markers for performance.

89
1. INTRODUCTION
An important factor of success in team sports is a player’s ability to accelerate. The
player that is quicker to the ball or faster off the line will often beat their opponent;
giving them an advantage. Researchers have identified anaerobic power as a key factor in
predicting team sport athletes’ velocity and acceleration on the field (Pienaar & Coetzee,
2013). Due to the difficulty in quantifying these variables during competition, researchers
have historically relied on laboratory tests to measure anaerobic power. These measures
have included the standing long jump, triple jump, vertical jump, 10-yd sprint, 20-yd
sprint, and Wingate tests (Krause et al., 2012; Farlinger, Kruisselbrink, & Fowels, 2007;
Behm et al., 2005; Mascaro et al., 1992; Watson & Seargent, 1986). While this list
provides a plethora of options for researchers and coaches to test their athletes, these
measures have not been shown to correlate to performance equally across sports (r = 0.71
to 0.10) (Vescovi et al., 2006; Montgomery et al., 2000) As such, each individual sport
requires its own sport-specific research to establish which tests have the highest transferal
rate from the lab to the field.
In the sport of ice hockey, anaerobic power development has typically been
assessed by the vertical jump and 30-second Wingate tests (Behm et al., 2005; Vescovi et
al., 2005; Potteiger, Smith, Maier, & Foster, 2010; Driss & Vandewalle, 2013). Recent
research, however, has brought into question the validity of the Wingate test as a
predictor of on-ice velocity and acceleration (Watson & Sargeant, 1986; Driss &
Vandewalle, 2013). In addition, while previous literature has shown these tests correlate
to on-ice acceleration and velocity, performed as a single bout (Behm et al., 2005;

90
mascara et al., 1992), neither have been evaluated to see if they are predictors of
performance during an on-ice repeated shift test, which more closely mimics the demands
placed on players during competition. This has lead to a void in the literature that
prevents coaches at all levels from making informed, scientifically based decisions
regarding the evaluation and training methods of their players.
This study aims to address the current limitations specific to ice-hockey by 1)
verifying the correlations that have been previously shown to exist in the literature
between off-ice, anaerobic power tests and on-ice acceleration and velocity and 2)
determining if these tests correlate to performance during an on-ice repeated shift test. It
is hypothesized that high anaerobic power outputs in the vertical jump and Wingate tests
will be correlated to both on-ice velocity and acceleration, however they will not play a
significant role in predicting repeated shift ability of players.
2. METHODS
2.1 Experimental Approach to the Problem. Subjects completed two testing sessions;
1) anthropometric and off-ice performance and 2) on-ice performance testing. Each
session took approximately one hour and was held on the University of Minnesota
campus. All subjects were tested in early June, at the start of their summer training
schedules, with both sessions completed within a ten-day period, ensuring at least two
days rest between sessions. Subjects were told prior to each session to refrain from heavy
exercise 24 hours prior to each testing session. All subjects were told to eat a light meal
two hours prior to their testing session. In addition, they were asked to refrain from
caffeine, tobacco, and alcohol 12 hours prior to testing. Aside from these guidelines,

91
subjects were asked to maintain a normal diet and exercise regimen during testing.
Exclusion criteria for the study included absence from on-ice skating over the previous
30 days due to prior or current injury and players self-reporting their position of
goaltender.
2.2 Subjects. Forty-five male hockey players, ages 18-24 and playing Division I,
Division III, or Junior level hockey in the Minneapolis, Minnesota area volunteered for
this study. All testing procedures were approved by the Institutional Review Board (IRB)
at the University of Minnesota prior to participant recruitment and data collection.
Written, informed consent was obtained from all participants prior to the start of the
study.
2.3 Session One - Anthropometric and off-ice performance testing. Standing height
was recorded using the Frankfort Plane criterion (Heymsfield et al., 2010) and weight
using a Detecto Mechanical Doctor’s scale (Model #439). Body composition was
assessed via hydrostatic weighing using Exertech Body Densitometry Systems software
(Dresbach, Minnesota). The method is considered to be a valid and reliable method for
measurement of body composition (Heymsfield et al., 2010). The participants weight was
recorded eight times to account for both a learning effect, as well as to ensure consistency
of the measure and accuracy of the reported weight. Percent body fat was calculated using
the Brozak equation (Heymsfield et al., 2010). Residual lung volume was also estimated
(Maud & Foster, 2006).
Vertical jump was tested using a VertecTM Vertical Jump Trainer (Huntington
Beach, CA). Each participant performed a five-minute treadmill warm-up, starting at 5
92
mph and increasing 0.5 mph per minute to a maximum of 7 mph, before performing the
vertical jump protocol to standardize the measure. The vertical jump protocol consisted
of two submaximal practice jumps to gain familiarization, followed by three to five
maximal jumps, allowing a minimum of 30 seconds of rest between jumps. For each
jump, the participant was instructed to squat to a self-selected depth (approximately 90
degrees) and hold that position for three seconds. The participant was also instructed to
place one arm on their hip with the other above their head in a reaching position. After a
3-second count, the instructor would give an audible “jump” command, and the
participant would jump, touching the highest vane possible on the VertecTM Vertical Jump
Trainer. These instructions ensured a standardized jump protocol for each subject, and
help reduce confounding of arm swing during jumping (Ferreira et al., 2010). Jump
height was assessed by counting the highest vane contacted by the participant. The test
was terminated when the participant failed to increase jump height in two consecutive
trials, or after the fifth trial.
The Wingate Anaerobic Test (WAnT), performed on a Monarch cycle ergometer
(Langley, WA), was used to assess lower-body power production. The testing protocol
for the WAnT has been standardized in earlier literature (Maud & Foster, 2006). After the
seat and bar height were properly adjusted for the participant, they were instructed to
warm-up by lightly pedaling for 30 seconds. During the last five seconds of the warm-up
time, the participant was told to increase their pedal velocity to its maximum and
maintain it for the duration of the test. When the warm-up time expired, a flywheel
resistance load equaling 0.075 kg/kg body weight was applied, with the participant
93
continuing to pedal maximally for 30 seconds. Participants’ peak (PP) and mean (MP)
power were calculated as the highest average power attained during the first five seconds
and full 30 seconds of the test, respectively (Maud & Foster, 2006). Power values were
recorded in watts and normalized for body weight. The reliability of these measures, PP
and MP, have been established as robust in previous literature (r = .92) when using the
0.075 kg/kg loading parameter (Patton et al., 1985).
2.4 Session Two - On-ice performance testing. Session two took place at the hockey
arena and consisted of an acceleration and top speed test. All on-ice testing was
performed in full gear with skates sharpened to game specifications. Acceleration was
assessed by having the participant sprint, from a stationary start, blue line to blue line
(Distance = 15.24m) (Gilenstam et al., 2011). The participant started by standing with his
front skate directly behind the blue line (starting line), stick in hand. When the participant
felt he was ready, he would accelerate as fast as possible through the second blue line
(finish line). Time was recorded by a TC Speed Trap-II wireless timing system (E38720,
Gill Athletics, Champaign, IL). The photocells of both timing gates were placed at waist
level of the participant to ensure that the laser timed his body crossing the line, not his
stick. In addition, participants were told to keep their sticks on the ice to ensure they did
not prematurely trip the laser timer. Once the participant crossed the finish line they
coasted back to the starting line and were given two minutes to recover. The recovery
time started when the participant returned to the starting line. Similar tests have been
reported to have test-retest values of r = 0.8 (Bracko, 2001). Each participant performed
two trials, with the fastest time being used for data analysis.
94
Maximal velocity was assessed after completion of the acceleration test and a two-
minute recovery period. Velocity was measured by the time it took the participant to
cover the distance between blue lines (15.24m) with a skating start (Gilenstam et al.,
2011; Bracko, 2001). The participant was instructed to take a lap around the rink, starting
at the blue line (start line), increasing their speed as they re-approach the start line. When
the participant reached the start line, they were instructed to be moving as fast as
possible, and to maintain their velocity through the finish line. Times were again
recorded by a TC Speed Trap-II wireless timing system with the photocells placed at
waist level. Once the participant crossed the finish line they coasted back to the starting
line and were given two minutes to recover. The recovery time started when the
participant returned to the starting line. This test has been reported to have test-retest
values of r = 0.84 (Gilenstam et al., 2011). Each participant performed two trials, with the
fastest time being used for data analysis.
Repeated shift ability was assessed after the velocity test, again giving the
participant a two-minute recovery period before starting. Fatigue was measured as a
percent decrement score during an on-ice repeated shift test (Peterson et al., 2014).
Before the test began, participants were told the basic parameters of the test. In addition,
they were told the two goals of the test: 1) skate the course as fast as possible, and 2)
have the lowest drop-off in time from the best course time as possible. The participants
then watched an instructor glide through the course to understand its layout. Each
participant was then asked to skate the course at 50% of his best effort to gain
familiarization. Upon completion of the familiarization trial, each participant was asked if

95
he felt comfortable with the course. If he said “no,” he was instructed to skate the course
one additional time. The participants were given three minutes to rest following the
familiarization trial to ensure they were fully recovered before commencement of testing.
The test itself consisted of eight maximal skating bouts, performed in full gear
(including their stick), with 90 seconds of passive recovery between bouts. Course times
were measured by TC Speed Trap-II wireless timing system. There were three separate
timing gates, used to evaluate first half, second half, and total fatigue decrement.
Figure 1: The on-ice repeated shift test consists of 8-maximal skating bouts, with 90 seconds of passive recovery between bouts. The skater starts with their skate at the face-off line; stick behind the laser timer. When given the “start” command, the skater sprints to the blue line, making a hard cut, pushing off their left leg (post leg), and sprinting to the far side of the goalie crease. The skater then makes a hard cut, pushing off their right leg (post leg), and sprints the length of the ice. The skater makes hard crossover steps to their left, going around the circle. After reaching the top of the circle the skater sprints to the base of the right circle, making hard crossover steps to their right. When the skater had completed the turn, they sprinted along the boards through the red line (finish line).
The 90-second recovery time started immediately after the participants crossed
the finish line. Participants were told that during their recovery time they could stand,
take a knee, or lay on the ice; they could not skate around. The participants were

96
informed when they had 30 seconds and 10 seconds of rest time remaining, with a 5-
second countdown to the start. This sequence was completed eight times, with times
being recorded after each sprint bout. Participants were not allowed to drink any sports
drinks or mixes during testing, however water was provided without restriction to the
participants.
2.5 Data Analysis. This study is powered for a two-sided test with an effect size of 0.5
and a power of 0.80. The sample size required to show significance within these
parameters was calculated to be n=36 (Hulley et al., 2007). All participants met criteria
for normalcy in each tested variable. Mean and standard deviations (SD) were calculated
for all variables. Statistical analysis of the collated data was performed by SPSS software
(IBM, vr. 21.0). Data was analyzed using either a Pearson’s or Spearman’s correlation
test, depending on the distribution of the data. Correlational coefficients (r) were used to
detect associations between the independent and dependent variable. For all statistical
tests, an alpha level of p < 0.05 was operationally defined as statistical significance.
3. RESULTS
The mean and standard deviations for the subjects’ physical characteristics, as well
as their on- and off-ice performance scores can be seen in Tables 1 and 2; respectively.
All participants met criteria for normalcy in each tested variable. Similar to previous
research, this study reinforces the use of vertical jump (VJ) and Wingate testing as valid
measures of on-ice acceleration and top speed. VJ was significantly correlated with
acceleration, velocity, and fastest course time (r = -0.42; p = 0.004; r = -0.58; p = 0.001;
r = -0.59; p = 0.001). In addition, Wingate relative peak power (WRPP) (r = -0.32; p =

97
0.03; r = -0.43; p = 0.003; r = -0.33; p = 0.01), and relative mean power (WRMP) (r = -
0.34; p = 0.02; r = -0.48; p = .001; r = -0.38; p = 0.01) were significantly correlated to on-
ice acceleration, velocity and fastest course time, respectively. This suggests that players
capable of producing high power outputs during a single bout possess an advantage over
other skaters in being able to accelerate more quickly and reach higher top end speeds on
the ice.
Conversely, off-ice measures of anaerobic power did not predict on-ice repeated
shift performance, as measured by a fatigue decrement score. VJ was not significantly
correlated with performance when compared to first gate (r = 0.06; p = 0.06), second gate
(r = 0.13; p = 0.71) or total course decrement (r = 0.09; p = 0.37). The data shows a
similar trend when comparing WRPP (r = 0.06; p = 0.71; r = 0.14; p = 0.35; r = 0.36; p =
0.50) and WRMP (r = -0.10; p = 0.92; r = -0.01; p = 0.53; r = -0.01; p = 0.94) to first,
second, and total course decrement. This suggests that power, while apparently
advantageous during single bouts, is not a contributing factor to a player’s ability to
repeatedly perform shifts on the ice.
Table 1. Physical characteristics of the subjects (n = 45)Table 1. Physical characteristics of the subjects (n = 45)Table 1. Physical characteristics of the subjects (n = 45)Table 1. Physical characteristics of the subjects (n = 45)
Variable Mean ± SD
Age (years) 20 ± 2
Height (cm) 181 ± 9
Weight (kg) 84 ± 12
Body Fat (%) 12.5 ± 4

98
4. DISCUSSION
The primary goal of this study was to determine if off-ice, anaerobic power tests
typically used to predict on-ice acceleration and velocity are also good predictors of
repeated shift performance. While this study found that vertical jump and Wingate tests
are good predictors of acceleration and velocity, performed as a single bout with total
recovery, they do not predict a player’s performance during an on-ice repeated shift test.
Fastest course time was significantly correlated to off-ice anaerobic power; however,
these times were recorded on either the first or second bouts during the repeated shift test
and were not correlated to total decrement. This implies that anaerobic power does not
help players maintain their speed or mitigate fatigue during subsequent, high intensity
shift bouts. This study is the first to show that the conventional measures of anaerobic
Table 2. On- and off-ice performance tests (n = 45)Table 2. On- and off-ice performance tests (n = 45)Table 2. On- and off-ice performance tests (n = 45)Table 2. On- and off-ice performance tests (n = 45)
Variable Mean ± SD
Vertical Jump (in) 20.3 ± 2.7
Wingate Peak Power (w) 1074.1 ± 116.9
Wingate Relative Peak Power (w/kg) 12.7 ± 1.1
Wingate Relative Mean Power (w/kg) 9.04 ± 0.6
Wingate Fatigue Index (%) 49.5 ± 7.3
Acceleration (sec) 2.6 ± 0.1
Top Speed (sec) 1.6 ± 0.1
Fastest Course Time (sec) 23.0 ± 0.6
Gate One Fatigue (%) 8.1 ± 3.4
Gate Two Fatigue (%) 9.1 ± 3.0
Total Course Fatigue (%) 8.9 ± 3.3

99
power may not be good measures to discern if hockey players are able to perform at a
high level when stressed under game-like conditions. In addition, this study advocates for
further analysis on the viability and transferability of off-ice tests used to assess the on-
ice performance of hockey players.
Previous research has shown hockey players who generate high levels of anaerobic
power in off-ice laboratory tests exhibit higher acceleration and velocity speeds on the ice
compared to players with lower levels (Twist & Rhodes, 1993; Gamble & Montgomery,
1990; Cox, Rhodes, Thomas, & Quinney, 1981). From these results, it has been assumed
that on-ice acceleration and velocity are important factors contributing to performance.
This has lead coaches and players to believe that these parameters should be the focus of
their off-season training, as well as one of the main criterion for coaches when selecting
players for competitive teams (Cox et al., 1981).
While maximal acceleration and velocity represent a component of on-ice
performance, they do not appear to be as important of a factor during competition as
previously thought (Vescovi et al., 2006; Montgomery, 2000). A hockey shift has been
shown in the research to consist of five to seven high intensity accelerations, each lasting
approximately 2.0 to 3.5 seconds, and interspersed with moderate intensity skating,
frequent turning, gliding, and shooting (Montgomery, 2000). The majority of hockey
research performing maximal acceleration and velocity testing employ protocols that
require a 6 to 7 second maximal bout; much longer than those seen during competition
(Mascaro et al., 1992; Potteiger et al., 2010). In addition, these bouts are separated by
long rest periods, allowing for the full recovery of the player between bouts. Protocols

100
used to test these variables typically employ one of two protocols: 1) the player is given a
“running start” by skating a lap around the rink to build up speed before they reach the
starting line (Behm et al., 2005) or 2) the player skates the length of the ice, from goal
line to goal line as fast as they can (Bracko, 2001). In either case, these tests do not
mimic an event that would occur during competition, nor would a player have that much
time to reach maximal velocity during competition given the go-stop-change-direction
nature of hockey (Pearsall et al., 2000).
Anaerobic power likely predicts how well a player performs during his first shift of
each period. This study, and others, have found that high rates of anaerobic power are
associated with players who accelerating faster and reaching higher velocities than peers
with lower power rates, however this advantage appears to be mitigated as multiple shifts
are performed. Muscle biopsy research has found the main energy substrate contributing
to anaerobic power development to be phoschocreatine (PCr). Studies have shown PCr
synthesis is slow to fully recover after intense muscular activity (Baker et al., 2010).
Complete recovery of PCr after a maximal bout lasting longer than 10 seconds appears to
take upwards of three to five minutes to fully replenish stores to pre-bout levels (Harris et
al., 1976). Keeping these facts in mind when examining the parameters of the on-ice
repeated shift test could explain why players’ performance in this test was not
significantly correlated with off-ice measures of anaerobic power. The recovery time
given between sprint bouts was only 33% of the total time estimated to fully replenish
PCr stores to their pre-exercise level. With the primary energy system contributing to
anaerobic power not being given sufficient time to recover, it is unlikely the athlete

101
would be able to continue to perform at the same level during subsequent bouts.
The lack of a correlation between the laboratory tests and on-ice repeated shift
performance could be the result of the discrepancy in the mechanics of the tasks being
performed. Pearsall et al. (2000) has shown that mechanics are different between skating
and running sports. Hockey is played on a crushable surface (ice) of low friction,
requiring a different mechanical movement pattern to generate force into the surface than
a conventional, ground-based sport (Pearsall et al., 2000). Skating mechanics require a
sinusoidal pattern in which the player displaces a reactive force laterally, compared to
displacing force posteriorly in running sports (Marino, 1977). The biphasic movement
pattern exhibited while skating also requires a different posture and altered activity
patterns of the leg muscles compared to field-based sports (Pearsall, 2000). While
research has found the muscle recruitment patterns in cycling to be similar to those used
in skating, these tests were performed on marathon speed skaters. Speed skaters have
been found to have different posture, mechanics, and physiologic demands than those of
hockey players, and are thus not a good population from which to draw comparisons
(Geisel, 1980; Geisel, 1979).
One possible conclusion from the lack of correlation between off-ice anaerobic
power and the on-ice repeated shift test is that off-ice tests with dissimilar movement
patterns to skating will have a low transference to on-ice performance. This was shown in
a recent study, which found there was no correlation between the on-ice and off-ice
VO2max values in collegiate hockey players (Durocher et al., 2010). They concluded that
off-ice movement modalities are significantly different from skating, altering stride
102
efficiency and motor unit recruitment, and should not be used to predict on-ice
performance. This would imply that hockey players’ need to be tested in a sport-specific
manner to garner reliable and transferable results.
This is an important finding, as the use of the Wingate and vertical jump tests are
prevalent throughout the sport of hockey. Both tests are used by the National Hockey
League (NHL) to assess prospective players during the NHL combine each year, without
any testing done to evaluate repeatable power generation (Vescovi et al., 2006). A study
found that 82% of NHL teams use the Wingate and 43% use vertical jump to measure the
anaerobic power capabilities of their players (Ebben et al., 2004). Many of these coaches
stated that they use this information to make decisions regarding the on-ice performance
capabilities of their players. Given the findings of this study, it could be argued that
coaches are currently making decisions using data that does not encapsulate the
parameters and demands of on-ice performance.
5. PRACTICAL APPLICATIONS
The results of this study indicate that conventional off-ice, anaerobic power tests
are not good predictors of on-ice repeated shift performance. Coaches, scouts, and
general managers should use other sport-specific tests to evaluate this variable in current
or prospective players. We hypothesize this is due to a lack of specificity between
variables, resulting from poor on-ice testing parameters. Despite the lack of a correlation
between these variables, coaches and players should not discredit the importance of
anaerobic power to on-ice performance. Instead, this study advocates for a paradigm
shift, moving away from the belief that maximal anaerobic power is the most important

103
factor to on-ice performance, and instead emphasizing a player’s ability to repeatedly
produce power as a key factor to success.

104
CHAPTER 6: References
Aaserud, R., Bramvik, P., Olsen, S.R., & Jensen, J. (1998). Creatine supplementation
delays onset of fatigue during repeated bouts of sprint running. Scandinavian Journal
of Medicine & Science in Sports, 8, 247-251.
Agre, J.C., Casal, D.C., Leon, A.S., McNally, C., Baxter, T.L., & Serfass, R.C. (1988).
Professional ice hockey players: physiologic, anthropometric, and musculoskeletal
characteristics. Physical Medicine and Rehabilitation, 69 (3), 188-192.
Akeson, A., Biorck, G., & Simon, R. (1968). On the content of myoglobin in human
muscles. Acta Medica Scandinavica, 183, 307-316.
Allen, D., Lannergren, J., & Westerblad, H. (1995). Muscle cell function during
prolonged activity: cellular mechanisms of fatigue. Exercise Physiology, 80, 497-527.
Allen, D., & Westerblad, H. (2001). Topical review: role of phosphate and calcium stores
in muscle fatigue. Journal of Physiology, 536 (3), 657-665.
Allen, D., Kabbara, A., & Westerblad, H. (2002). Muscle fatigue: the role of intracellular
calcium stores. Canadian Journal of Applied Physiology, 27 (1), 83-96.
Arnett, M. (1996). Effects of specificity training on the recovery process during
intermittent activity in ice hockey. Journal of Strength and Conditioning Research,
10 (2), 124-126.
Arnold, D.L., Matthews, P.M., & Radda, G.K. (1984). Metabolic recovery after exercise
and the assessment of mitochondrial function in vivo in human skeletal muscle by
means of 31P-NMR. Magnetic Resonance Medicine, 1 (3), 307-315.
Aziz, A.R., Chia, M., & Teh, K.C. (2000). The relationship between maximal oxygen
105
uptake and repeated sprint performance indices in field hockey and soccer players.
Journal of Sports Medicine and Physiology, 40, 195-200.
Baker, A.J., Kostov, K.G., Miller, R.G., & Weiner, M.W. (1993). Slow force recovery
after long-duration exercise: metabolic and activation factors in muscle fatigue.
Journal of Applied Physiology, 74, 2294-2300.
Baker, J.S., McCormick, M.C., & Robergs, R.A. (2010). Interaction among skeletal
mucle metabolic energy systems during intense exercise. Journal of Nutrition and
Metabolism, doi:10.1155/2010/905612.
Baldwin, K.M., Winder, W.W., Terjung, R.L., & Holloszy, J.O. (1973). Glycolytic
enzymes in different types of skeletal muscle: adaptations to exercise. American
Journal of Physiology, 225, 962-966.
Balsom, P.D., Seger, J.Y., Sjodin, B., & Ekblom, B. (1992). Maximal-intensity
intermittent exercise: effect of recovery duration. International Journal of Sports
Medicine, 13 (7), 528-533.
Balsom, P., Ekblom, B., & Sjodin, B. (1994). Enhanced oxygen availability during high
intensity intermittent exercise decreases anaerobic metabolite concentrations in blood.
Acta Physiologica Scandinavica, 150 (4), 455-456.
Balsom, P.D., Gaitanos, G.C., Ekblom, B., & Sjodin, B. (1994). Reduced oxygen
availability during high intensity intermittent exercise impairs performance. Acta
Physiologica Scandinavica, 152 (3), 279-285.
Balsom, P.D., Gaitanos, G.C., Soderlund, K., Ekblom, B. (1999). High-intensity exercise
and muscle glycogen availability in humans. Acta Physiologica Scandinavica, 165,

106
337-345.
Balsom, P.D., Soderlund, K., & Ekblom, B. (1994). Creatine in humans with special
reference to creatine supplementation. Journal of Sports Medicine, 18, 268-280.
Bangsbo, J., Norregaard, L., & Thorso, F. (1991). Activity profile of competition soccer.
Canadian Journal of Sport Sciences, 16 (2), 110-116.
Bangsbo, J., Graham, T.E., Kiens, B., & Saltin, B. (1992). Elevated muscle glycogen and
anaerobic energy production during exhaustive exercise in man. Journal of
Physiology, 451, 205-227.
Bangsbo, J. (1996). Regulation of muscle glycogenolysis and glycolysis during intense
exercise: in vivo studies using repeated intense exercise. American Journal of
Physiology, 261-275.
Bangsbo, J., Krustrup, P., Gonzales-Alonso, J. & Saltin, B. (2001). ATP production and
efficiency of human skeletal muscle during intense exercise: effect of previous
exercise. American Journal of Physiology, 280 (6), E956-964.
Barbero-Alvarez, J., Coutts, A., Granda, J., Barbero-Alvarez, V., & Castagna, C. (2008).
The validity and reliability of a global positioning satellite system device to assess
speed and repeated sprint ability (RSA) in athletes. Journal of Science and Medicine
in Sport, 13, 232-235.
Barnard, R.J., Edgerton, V.R., Furukawa, T., & Peter, J.B. (1971). Histochemical,
biochemical and contractile properties of red, white and intermediate fibers.
American Journal of Physiology, 220, 410-414.
Bassett, D., & Howley, E. (2000). Limiting factors for maximum oxygen uptake and
107
determinants of endurance performance. Medicine & Science in Sports & Exercise,
32 (1), 70-84.
Bigland-Ritchie, B., Furbush, F., & Woods, J.J. (1986). Fatigue of intermittent
submaximal voluntary contractions: central and peripheral factors. Journal of Applied
Physiology, 61 (2), 421-429.
Billaut, F. & Bassett, F. (2007). Effect of different recovery patterns on repeated-sprint
ability and neuromuscular responses. Journal of Sports Science, 25, 905-913.
Billaut, F. & Smith, K. (2009). Sex alters impact of repeated bouts of sprint exercise on
neuromuscular activity in trained athletes. Applied Physiology, Nutrition, and
Metabolism, 34, 689-699.
Bishop, D., Spencer, M., Duffield, R., & Lawrence, S. (2001). The validity of repeated
sprint ability test. Journal of Science and Medicine in Sport, 4 (1), 19-29.
Bishop, D., Lawrence, S., & Spencer, M. (2003). Predictors of repeated-sprint ability in
elite female hockey players. Journal of Science and Medicine in Sport, 6 (2), 199-
209.
Bishop, D., Edge, J. & Goodman, C. (2004). Muscle buffer capacity and aerobic fitness
are associated with repeated-sprint ability in women. European Journal of Applied
Physiology, 92, 540-547.
Bishop, D., Edge, J., Davis, C., & Goodman, C. (2004). Induced metabolic alkalosis
affects muscle metabolism and repeated-sprint ability. Medicine and Science in
Sports and Exercise, 36 (5), 807-813.
Bishop, D., & Spencer, M. (2004). Determinant of repeated-sprint ability in well-trained

108
team-sport athletes and endurance-trained athletes. Journal of Sports Medicine and
Physical Fitness, 44, 1-7.
Bishop, D., & Claudius, B. (2005). Effects of induced metabolic alkalosis on prolonged
intermittent-sprint performance. Medicine and Science in Sport Exercise, 27, 759-
767.
Bishop, D., & Edge, J. (2006). Determinants of repeated-sprint ability in females matched
for single-sprint performance. European Journal of Applied Physiology, 97, 373-379.
Blei, M.L., Conley, K.E., & Kushmerick, M.J. (1993). Separate measures of ATP
utilization and recovery in human skeletal muscle. Journal of Physiology, 465, 203-
222
Bogdanis, G. C., Nevill, M. E., Boobis, L. H., Lakomy, H.K., & Nevill, A.M. (1995).
Recovery of power output and muscle metabolites following 30 s of maximal sprint
cycling in man. Journal of Physiology, 482 (2), 467-480.
Bogdanis, G. C., Nevill, M. E., Boobis, L. H., & Lakomy, H.K. (1996). Contribution of
phosphocreatine and aerobic metabolism to energy supply during repeated sprint
exercise. Journal of Applied Physiology, 80 (3), 876-884.
Bogdanis, G. C., Nevill, M. E., Lakomy, H.K., & Boobis, L. H. (1998). Power output and
muscle metabolism during and following recovery from 10 and 20 s of maximal
sprint exercise in humans. Acta Physiologica Scandinavica, 163, 261-272.
Boobis, L., Williams, C., & Wootton, S.A. (1982). Human muscle metabolism during
brief maximal exercise. Journal of Physiology, 338, 21-22P.
Bosco, C. Tihanyi, J., Pucspk, J., Kovacs, I., Gobossy, A., & Colli, R. (1997). Effects of

109
oral creatine supplementation on jumping and running performance. International
Journal of Sports Medicine, 18, 369-372.
Brooks, G.A., Fahey, T.D., & Baldwin, K.M. (2005). Exercise Physiology: Human
Bioenergetics and Its Applications. New York: McGraw-Hill Publishing.
Brooks, G.A. (2009). Cell-cell and intracellular lactate shuttles. Journal of Physiology,
587.23, 5591-5600.
Buchheit, M., Cormie, P., Abbis, C., Ahmaidi, S., Nosaka, K., & Laursen, P. (2008).
Muscle deoxygenation during repeated sprint running: effect of active vs. passive
recovery. Physiology and Biochemistry, 30, 418-425.
Buchheit, M., & Ufland, P. (2011). Effect of endurance training on performance and
muscle reoxygenation rate during repeated-sprint running. European Journal of
Applied Physiology, 111, 293-301.
Burr, J., Jamnik, R., Baker, J., Macpherson, A., Gledhill, N., & McGuire, E.J. (2008).
Relationship of physical fitness test results and hockey playing potential in elite-level
ice hockey players. Journal of Strength and Conditioning Research, 22 (5), 1535-
1543.
Cady, E.B., Jones, D.A., Lynn, J., & Newham, D.J. (1989). Changes in force and
intracellular metabolites during fatigue of human skeletal muscle. Journal of
Physiology, 418, 311-325.
Carey, D., Drake, M., Pliego, G., & Raymond, R. (2007). Do hockey players need
aerobic fitness? Relation between vo2max and fatigue during high-intensity
intermittent ice skating. Journal of Strength and Conditioning Research, 21 (3), 963-

110
966.
Castagana, C., Abt, G., Manzi, V., Annino, G., Padua, E., & D’Ottavio, S. (2008). Effect
of recovery mode on repeated sprint ability in young basketball players. Journal of
Strength and Conditioning Research, 22 (3), 923-928.
Chase, P.B., & Kushmerick, M.J. (1988). Effects of pH on contraction of rabbit fast and
slow skeletal muscle fibers. Biophysical Journal, 53 (6), 935-946.
Clark, R.A. (2009). The effect of training status on inter-limb joint stiffness regulation
during repeated maximal sprints. Journal of Science and Medicine in Sport, 12, 406-
410.
Clausen, T., Nielson, O.B., Harrison, A.P., Flatman, J.A., & Overgaard, K. (1998). The
Na+, K+ pump and muscle excitability. Acta Physiologica Scandinavica, 162, 183-
190.
Colliander, E.B., Dudley, G.A., & Tesch, P.A. (1988). Skeletal muscle fiber type
composition and performance during repeated bouts of maximal, concentric
contractions. European Journal of Applied Physiology, 58, 81-86.
Conley, K.E., Ordway, G.A., & Richardson, R.S. (2000). Deciphering the mysteries of
myoglobin in striated muscle. Acta Physiologica Scandinavica, 168, 623-634.
Cooke, R., Franks, K., Luciani, G., & Pate, E. (1988). The inhibition of rabbit skeletal
muscle contraction by hydrogen ions and phosphate. Journal of Physiology, 395, 77-
97.
Cook, S.R., Peterson, S.R., & Quinney, H.A. (1997). The influence of aerobic power on
recovery of skeletal muscle following anaerobic exercise. European Journal of

111
Applied Physiology, 75 (6), 512-9.
Costill, D.L., Coyle, E.F., Fink, W.F., Lesmes, G.R., & Witzmann, F.A. (1979).
Adaptations in skeletal muscle following strength training. Journal of Applied
Physiology, 46 (1), 96-99.
Coutts, A., & Duffield, R. (2008). Validity and reliability of PGS devices for measuring
movement demands of team sports. Journal of Science and Medicine in Sport, 13,
133-135.
Cox, M.H., Miles, D.S., Verde, T.J., & Rhodes, E.C. (1995). Applied Physiology of ice-
hockey. Sports Medicine, 19 (3), 184-201.
Crabtree, B., & Newsholme, E. (1972). The activities of phosphorylase, hexokinase,
phosphofructokinase, lactic dehydrogenase and glycerol 3-phosphate dehydrogenases
in muscle of vertebrates and invertebrates. Biochemical Journal, 126, 49-58.
Crowther, G.J., Carey, M.F., Kemper, W.F., & Conley, K.E. (2002). Control of
glycolysis in contracting skeletal muscle. I. Turning it on. American Journal of
Physiology and Endocrinology, 282, E67-E73.
Crowther, G.J., Carey, M.F., Kemper, W.F., & Conley, K.E. (2002). Control of
glycolysis in contracting skeletal muscle. II. Turning it off. American Journal of
Physiology and Endocrinology, 282, E74-E79.
Dahlstedt, A.J., Katz, A., & Westerblad H. (2001). Role of myoplasmic phosphate in
contractile function of skeletal muscle: studies on creatine kinase-deficient mice.
Journal of Physiology, 533, 379-388.
Dahlstedt, A.J., & Westerblad H. (2001). Inhibition of creatine kinase reduces the

112
fatigue-induced decrease of tetanic Ca2 in mouse skeletal muscle. Journal of
Physiology, 533, 639-649.
DaSilva, J., Guglielmo, L., & Bishop, D. (2010). Relationship between different
measures of aerobic fitness and repeated-sprint ability in elite soccer players. Journal
of Strength and Conditioning Research, 24 (8), 2115-2121.
Dawson, M.J., Gadian, D.G. & Wilkie, D.R. (1978). Muscular fatigue investigated by
phosphorus nuclear magnetic resonance. Nature, 274 (31), 861-866.
Dawson, B., Fitzsimons, M., & Ward, D. (1993). The relationship of repeated sprint
ability to aerobic power and performance measures of anaerobic work capacity and
power. Australian Journal of Science and Medicine in Sport, 25 (4), 88-93.
Dawson, B., Goodman, C., Lawrence, S., Preen, D., Polglaze, T., Fitzsimons, M.,
Fournier, P. (1997). Muscle phosphocreatine repletion following single and repeated
short sprint efforts. Scandinavian Journal of Medicine & Science in Sports, 7 (4),
206-213.
DeGroot, M., Massie, B.M., Boska, M., Gober, J., Miller, R.G., & Weiner, M.W. (1993).
Dissociation of H+ from fatigue in human muscle detected by high time resolution
31P-NMR. Muscle and Nerve, 16 (1), 91-98.
Demant, T.W., & Rhodes, E.C. (1999). Effects of creatine supplementation on exercise
performance. Sports Medicine, 28 (1), 49-60.
Docherty, D., Wenger, H.A., & Neary, P. (1988). Time-motion analysis related to the
physiological demands of rugby. Journal of Human Movement Studies, 14 (6), 269-
277.

113
Donaldson, S.B. (1983). Effect of acidosis on maximal force generation of peeled
mammalian skeletal fibers. Biochemistry of Exercise, Champaign, IL, Human
Kinetics.
Dudley, G. A., Abraham, W. M., & Terjung, R. L. (1982). Influence of exercise intensity
and duration on biochemical adaptations in skeletal muscle. Journal of Applied
Physiology: Respiratory, Environmental and Exercise Physiology, 53 (4), 844-850.
Duke, A.M., & Steele, D.S. (2000). Characteristics of phosphate-induced Ca2+ efflux
from the SR in mechanically skinned rat skeletal muscle fibers. American Journal of
Physiology, 278, C126-C135.
Duke, A.M., & Steele, D.S. (2001). Mechanisms of reduced SR Ca2 release induced by
inorganic phosphate in rat skeletal muscle fibers. American Journal of Physiology,
281, C418-C429.
Dupont, G., Millet, G.P., Guinhouya, C., & Berthoin, S. (2005). Relationship between
oxygen uptake kinetics and performance in repeated running sprints. European
Journal of Applied Physiology, 95, 27-34.
Dupont, G., McCall, A., Prieur, F., Millet, G., & Berthoin, S. (2010). Faster oxygen
uptake kinetics during recovery is related to better repeated sprinting ability.
European Journal of Applied Physiology, 110, 627-634.
Durocher, J., Jensen, D., Arredondo, A., Leetun, D., & Carter, J. (2008). Gender
differences in hockey players during on-ice graded exercise. Journal of Strength and
Conditioning Research, 22 (4), 1327-1331.
Durocher, J., Guisfredi, A., Leetun, D., & Carter, J. (2010). Comparison of on-ice and
114
off-ice graded exercise testing in collegiate hockey players. Applied Physiology,
Nutrition, and Metabolism, 35, 35-39.
Dutka, T.L., Cole, L., & Lamb, G.D. (2005). Calcium phosphate precipitation in the
sarcoplasmic reticulum reduces action potential -mediated Ca2 release in mammalian
skeletal muscle. American Journal of Physiology, 289, C1502-C1512.
Duty, S., Allen, D.G. (1994). The distribution of intracellular calcium concentration in
isolated single fibers of mouse skeletal muscle during fatiguing stimulation.
European Journal of Physiology, 427, 102-109.
Edge, J., Bishop, D., Goodman, C., & Dawson, B. (2005). Effects of high- and moderate-
intensity training on metabolism and repeated sprints. Medicine & Science in Sports
& Exercise, 37 (11), 1975-1982.
Farley, C., Blickhan, R., Saito, J., Taylor, C. (1991). Hopping frequency in humans: a test
of how spring set stride frequency in bouncing gaits. Journal of Applied Physiology,
71, 2127-2132.
Favero, T., Zable, A., Bowman, M.B., Thompson, A., & Abramson, J. (1995). Metabolic
end products inhibit sarcoplasmic reticulum Ca2 release and ryanodine binding.
Journal of Applied Physiology, 78 (5), 1665-1672.
Favero, T., Zable, A., Colter, D., & Abramson, J. (1997). Lactate inhibits Ca2-activated
Ca2-channel activity from skeletal muscle sarcoplasmic reticulum. Journal of Applied
Physiology, 82 (2), 447-452.
Favero, T. (1999). Sarcoplasmic reticulum Ca2 release and muscle fatigue. Journal of
Applied Physiology, 87, 471-483.

115
Fitts, R.H., Booth, F.W., Winder, W.W., & Holloszy, J.O. (1975). Skeletal muscle
respiratory capacity, endurance, and glycogen utilization. American Journal of
Physiology, 228 (4), 1029-1033.
Fitts, R.H., (1994). Cellular mechanisms of muscle fatigue. Physiological Review, 74, 49-
94.
Fitts, R.H. (2008). The cross-bridge cycle and skeletal muscle fatigue. Journal of Applied
Physiology, 104, 551-558.
Fraser, S.F., Li, J.L., Carey, M.F., Wang, X.N., Sangkabutra, T., Sostaric, S., ...
McKenna, M.J. (2002). Fatigue depresses maximal in vitro skeletal muscle NA(+)-
K(+)-ATPase activity in untrained and trained individuals. Journal of Applied
Physiology, 93, 1650-1659.
Friedman, J.E., Dudek, R.W., Whitehead, D.S., Downes, D.L., Frisell, J.F., Caro, J.F., &
Dohm, G.L. (1991). Immunolocalization of glucose transporter GLUT4 within human
skeletal muscle. Diabetes, 40, 150-154.
Fryer, M., Owen, V., Lamb, O., & Stephenson, D. (1995). Effects of creatine phosphate
and Pi on Ca2 movements and tension development in rat skinned skeletal muscle
fibers. Journal of Physiology, 482 (1), 123-140.
Gaesser, G.A., & Brooks, G.A. (1984). Metabolic bases of excess post-exercise oxygen
consumption: a review. Medicine and Science in Sports and Exercise, 16 (1), 29-43.
Gaitanos, G., Nevill, M.E., Brooks, S., & Williams, C. (1991). Repeated bouts of sprint
running after induced alkalosis. Journal of Sports Science, 9 (4), 355-370.
Gaitanos, G., Williams, C., & Boobis, L. (1993). Human muscle metabolism during
116
intermittent maximal exercise. Journal of Applied Physiology, 75 (2), 712-9.
Gastin, P. B. (2001). Energy system interaction and relative contribution during maximal
exercise. Sports Medicine, 31 (10), 725-741.
Gilenstam, K., Thorsen, K., & Henriksson-Larsen, K. (2011). Physiological correlates of
skating performance in women’s and men’s ice hockey. Journal of Strength and
Conditioning Research, 25 (8), 2133-2142.
Girard, O., Mendez-Villanueva, A., & Bishop, D. (2011). Repeated sprint ability - part I.
Sports Medicince, 41(8), 673-694.
Glaister, M. (2005). Multiple sprint work: Physiological responses, mechanisms of
fatigue and the influence of aerobic fitness. Sports Medicine, 35 (9), 757-777.
Glaister, M. (2008). Multiple-sprint work: Methodological, physiological, and
experimental issues. International Journal of Sports Physiology and Performance, 3
(1), 107-112.
Glaister, M., Howatson, G., Pattison, J., & McInnes, G. (2008). The reliability and
validity of fatigue measures during multiple-sprint work: an issue revisited. Journal
of Strength and Conditioning Research, 22 (5), 1597-1601.
Godt, R.E., & Nosek, T.M. (1989). Changes of intracellular milieu with fatigue or
hypoxia depress contraction of skinned rabbit skeletal and cardiac muscle. The
Journal of Physiology, 412, 155-180.
Gray, S., Soderlund, K., & Ferguson, R. (2008). ATP and phosphocreatine utilization in
single human muscle fibers during the development of maximal power output and
elevated muscle temperatures. Journal of Sports Science, 26 (7), 701-707.

117
Green, H.J. (1997). Mechanisms of muscle fatigue in intense exercise. Journal of Sports
Science, 15, 247-256.
Greenhaff, P., Casey, A., Short A., Harris, R., Soderlund, K., & Hultman, E. (1993).
Influence of oral creatine supplementation of muscle torque during repeated bouts of
maximal voluntary exercise in man. Clinical Science, 84, 565-571.
Hamilton, A.L., Nevill, M.E., Brooks, S., & Williams, C. (1991). Physiological responses
to maximal intermittent exercise: differences between endurance-trained runners and
games players. Journal of Sports Science, 9 (4), 371-382.
Hargreaves, M., McConell, G., & Proietto, J. (1995). Influence of muscle glycogen on
glycogenolysis and glucose uptake during exercise in humans. Journal of Applied
Physiology, 78 (1), 288-292.
Harris, R.C., Edwards, R.T., & Hultman, E. (1976). The time course of
phosphorylcreatine resynthesis during recovery of the quadriceps muscle in man.
European Journal of Physiology, 367 (2), 137-142.
Haseler, L., Hogan, M., & Richardson, R. (1999). Skeletal muscle phosphocreatine
recovery in exercise-trained humans is dependent on O2 availability. Journal of
Applied Physiology, 86 (6), 2013-2018.
Haseler, L.J., Hogan, M.C., & Richardson, R.S. (1999). Skeletal muscle phosphocreatine
recovery in exercise-trained humans is dependent on O2 availability. Journal of
Applied Physiology, 86 (6), 2013-8.
Haseler, L.J., Lin, A.P., & Richardson, R.S. (2004). Skeletal muscle oxidative
metabolism in sedentary humans: 31P-MRS assessment of O2 supply and demand

118
limitations. Journal of Applied Physiology, 97, 1077-1081.
Hautier, C.A., Arsac, L.M., Deghdegh, K., Souquet, J., Belli, A., & Lacour J. (2000).
Influence of fatigue on EMG/force ratio and cocontraction in cycling. Medicine and
Science in Sport and Exercise, 32, 839-843.
Helgerud et al. (2007). Aerobic high-intensity intervals improve vo2max more than
moderate training. Medicine & Science in Sport & Exercise, 39 (4), 665-671.
Heymsfield, S.B., Lohmna, T.G, Wang, Z., & Going, S.B. (2005). Human body
composition (2nd edition). Champaign IL: Human Kinetics.
Hirvonen, J., Rehunen, S., Rusko, H., & Harkonen, M. (1987). Breakdown of high-
energy phosphate compounds and lactate accumulation during short supramaximal
exercise. European Journal of Applied Physiology, 56, 253-259.
Hoffman, J.R., Epstein, S., Einbinger, M., & Weinstein, Y. (1999). The influence of
aerobic capacity on anaerobic performance and recovery indices in basketball players.
Journal of Strength and Conditioning Research, 13 (4), 407-411.
Hogan, M.C., Richardson, R.s., & Haseler, L.J. (1999). Human muscle performance and
PCr hydrolysis with varied inspired oxygen fractions: a 31P-MRS study. Journal of
Applied Physiology, 86 (4), 1367-1373.
Holloszy, J.O. (1967). Biochemical adaptations in muscle: effects of exercise on
mitochondrial oxygen uptake and respiratory enzyme activity in skeletal muscle.
Journal of Biological Chemistry, 242, 2278-2282.
Hultman, E. Greenhaff, P.L., Ren, J, & Soderlund, K. (1990). Energy metaoblism and
fatigue during intense muscle contraction. Biochemistry of Exercise, 19, 347-353

119
Idstrom, J.P., Subramanian, V.H., Chance, B., Schersten, T., & Bylund-Fellenius, A.C.
(1985). Oxygen dependence of energy metabolism in contracting and recovering rat
skeletal muscle. American Journal of Physiology, 248 (17), H40-8.
Jacobs, I., Esbjornsson, M., Sylven, C., Holm, I., & Jansson, E. (1987). Sprint training
effects on muscle myoglobin enzymes, fiber types, and blood lactate. Medicine and
Science in Sports and Exercise, 19 (4), 368-374.
Jones, D.A., de Ruiter, C.J., de Haan, A. (2006). Change in contractile properties of
human muscle in relationship to the loss of power and slowing of relaxation seen with
fatigue. Journal of Physiology, 576, 913-922.
Jost, J.P., & Rickenberg, H.V. (1971). Cyclic AMP. Annual Review: Biochemistry, 40,
741.
Jougla, A., Micallef, J., & Mottet, D. (2010). Effects of active vs. passive recovery on
repeated rugby-specific exercises. Journal of Science and Medicine in Sport, 13, 350-
355.
Kabbara, A.A., & Allen, D.G. (2001). The use of fluo-5N to measure sarcoplasmic
reticulum calcium in single muscle fibers of the cane toad. Journal of Physiology,
534, 87-97.
Karatzaferi, C., deHaan, A., vanMechelen, W., & Sargeant, A. (2001). Metabolic changes
in single human muscle fibers during brief maximal exercise. Experimental
Physiology, 86 (3), 411-415.
Kavanagh, M.F., & Jacobs, I. (1988). Breath-by-breath oxygen consumption during
performance of the wingate test. Canadian Journal of Sport Science, 13(1), 91-93.
120
Kendall, K., Smith, A., Graef, J., Fukuda, D., Moon, J., Beck, T., Cramer, J., & Stout, J.
(2009). Effects of four weeks of high-intensity interval training and creatine
supplementation on critical power and anaerobic working capacity in college-aged
men. Journal of Strength and Conditioning Research, 23 (6), 1663-1669.
Kiens, B., Essen-Gustavsson, B., Christensen, N.J., & Saltin, B. (1993). Skeletal muscle
substrate utilization during submaximal exercise in man: effect of endurance training.
Journal of Physiology, 469, 459-478.
Kjaer, M., Farrell, P., Christensen, N., & Galbo, H. (1986). Increase epinephrine response
and inaccurate glucoregulation in exercising athletes. Journal of Applied Physiology,
61, 1693-1700.
Knuth, S., Dave, H., Peters, J., Fitts, R. (2006). Low cell pH depresses peak power in rat
skeletal muscle fibers at both 30C and 15C: implications for muscle fatigue. Journal
of Physiology, 575, 887-899.
Koepp, K., & Janot, J. (2008). A comparison of Vo2max and metabolic variables
between treadmill running and treadmill skating. Journal of Strength and
Conditioning Research, 22 (2), 497-502.
Kreider, R. (2003). Effects of creatine supplementation on performance and training
adaptations. Molecular and Cellular Biochemistry, 244, 89-94.
Kushmerick, M., Moerlands, T. & Wiseman, R. (1992). Mammalian skeletal muscle
fibers distinguished by contents of phosphocreatine, ATP and Pi. Proceedings of the
National Academy of Sciences of the USA, 89, 7521-7525.
Lannergren, J., & Westerblad, H. (1991). Force decline due to fatigue and intracellular

121
acidification in isolated fibers from mouse skeletal muscle. Journal of Physiology,
434, 307-322.
Lavender, G., & Bird, S.R. (1989). Effect of sodium bicarbonate ingestion upon repeated
sprints. British Journal of Sports Medicine, 23 (1), 41-45.
Maughan, R.J., & Poole, D.C. (1981). The effects of glycogen-loading regimen on the
capacity to perform anaerobic exercise. European Journal of Applied Physiology, 46,
211-219.
McArdle, W.D., Katch, F.I., & Katch, V.L. (1991). Exercise physiology: energy,
nutrition and human performance. Philadelphia, P.A.: Lea & Febiger.
MacDougall, D., & Sale, D. (1981). Continuous vs. interval training: a review for the
athlete and the coach. Canadian Journal of Applied Sport Science, 6 (2), 93-97.
MacDougall, J.D., Hicks, A.L., MacDonald, J.R., McKelvie, R.S., Green, H.J., & Smith,
K.M. (1998). Muscle performance and enzymatic adaptations to sprint interval
training. Journal of Applied Physiology, 84 (6), 2138-2142.
Maud, P.J., & Foster, C. (2006). Physiological assessment of human fitness. Champaign,
IL: Human Kinetics.
Maughan, R.J., Gleeson, M., & Freenhaff, P.L. (1997). Biochemistry of Exercise and
Training. Oxford University Press: New York, NY.
McCann, D.J., Mole, P.A., & Caton, J.R. (1995). Phosphocreatine kinetics in humans
during exercise and recovery. Medical Science and Sports Exercise, 27, 378-387.
McCartney, N., Spriet, L., & Heigenhouser, G.F. (1986). Muscle power and metabolism
in maximal intermittent exercise. Journal of Applied Physiology, 60 (4), 1164-1196.

122
McGawley, K., & Bishop, D. (2008). Anaerobic and aerobic contribution to two, 5x6’s
repeated-sprint bouts. International Journal of Sports Science and Coaching, 3, 52.
McKenna, M., Morton, J., Selig, S., & Snow, R. (1999). Creatine supplementation
increases muscle total creatine but not maximal intermittent exercise performance.
Journal of Applied Physiology, 87 (6), 2244-2252.
McLellan, C., Lovell, D., & Gass, G. (2011). Performance analysis of elite rugby league
match play using global positioning systems. Journal of Strength and Conditioning
Research, 25 (6), 1703-1710.
McMahon, S., & Wenger, H. (1998). The relationship between aerobic fitness and both
power output and subsequent recovery during maximal intermittent exercise. Journal
of Scientific Medicine in Sport, 1 (4), 219-227.
McMahon, S., & Jenkins, D. (2002). Factors affecting the rate of phosphocreatine
resynthesis following intense exercise. Sports Medicine, 32 (12), 761-784.
Mendez-Villanueva, A., Hamer, P., & Bishop, D. (2008). Fatigue in repeated-sprint
exercise is related to muscle power factors and reduced neuromuscular activity.
European Journal of Applied Physiology, 103 (4), 411-419.
Metzger, J.M., & Fitts, R.H. (1987). Role of intracellular pH in muscle fatigue. Journal
of Applied Physiology, 62 (4), 1392-1397.
Metzger, J.M., & Moss, R.L. (1990). Calcium-sensitive cross-bridge transitions in
mammalian fast and slow skeletal muscle fibers. Science, 247, 1088-1090.
Miller, R.G., Giannini, D., Milner-Brown, H., Layzer, R., Korestsky, A., Hooper, D., &
Weiner, M. (1987). Effects of fatiguing exercise on high-energy phosphates, force
123
and EMG: evidence for three phases of recovery. Muscle and Nerve, 10 (9), 810-821.
Miller, R.G., Boska, M.D., Moussavi, R.S., Carson, P.J., & Weiner, M.W. (1988). 31P
nuclear magnetic resonance studies of high energy phosphates and pH in human
muscle fatigue: comparison of aerobic and anaerobic exercise. The Journal of
Clinical Investigation, 81 (4), 1190-1196.
Mohr, M., Krustrup, P., Nielsen, J. J., Nybo, L., Rasmussen, M.K., Juel, C., & Bangsbo,
J. (2007). Effect of two different intense training regimens on skeletal muscle ion
transport proteins and fatigue development. American Journal of Physiology.
Regulatory, Integrative and Comparative Physiology, 292 (4), R1594-R1602.
Mole, P.A., Chung, Y., Tran, T.K., Sailasuta, N., Hurd, R., & Jue, T. (1999). Myoglobin
desaturation with exercise intensity in human gastrocnemius muscle. American
Journal of Physiology, 277, R173-80.
Naughton, L., & Cedaro, R. (1992). Sodium citrate ingestion and its effects on maximal
anaerobic exercise of different durations. European Journal of Physiology, 64, 36-41.
Nevill, M.E., Bogdanis, G.C., & Boobis, L.H. (1996). Muscle metabolism and
performance during sprinting. Biochemistry of Exercise, Chapter IX, Champaign, IL,
Human Kinetics.
Nevill, A.M., Jones, D.A., McIntyre, D., Bogdanis, G.C., & Nevill, M.E. (1997). A
model for phosphocreatine resynthesis. Journal of Applied Physiology, 82 (1), 329-
335.
Noonan, B. (2010). Intragame blood-lactate values during ice hockey and their
relationships to commonly used hockey testing protocols. Journal of Strength and
124
Conditioning Research, 24 (9), 2290-2295.
Oliver, J., Armstrong, N., & Williams, C. (2009). Relationship between brief and
prolonged repeated sprint ability. Journal of Science and Medicine in Sport, 12, 238-
243.
Parmeggiani, A., & Bowman, R.H. (1963). Regulation of phosphofructokinase activity
by citrate in normal and diabetic muscle. Biochemical and Biophysical Research
Communications, 12, 4.
Parolin, M.L., Chesley, A., Matsos, M.P., Spriet, L.L., Jones, N.L., & Heigenhauser, G.J.
(1999). Regulation of skeletal muscle glycogen phosphorylase and PDH during
maximal intermittent exercise. American Journal of Physiology, 277, E890-900.
Passonneau, J.V., & Lowry, O.H. (1964). The role of phosphofructokinase in metabolic
regulation. Advances in Enzyme Regulation, 2, 265-174.
Pate, E., Bhimani, M., Franks-Skiba, K., & Cooke, R. (1995). Reduced effect of pH on
skinned rabbit psoas muscle mechanics at high temperatures: implications for fatigue.
Journal of Physiology, 486, 689-694.
Peters, S.J., & Spriet, L.L. (1995). Skeletal muscle phosphofructokinase activity
examined under physiological conditions in vitro. Journal of Applied Physiology, 78
(5), 1853-1858.
Peyrebrune, M.C., Nevill, M.E., Donaldson, F.J., & Cosford, D.J. (1998). The effects of
oral creatine supplementation on performance in single and repeated sprint
swimming. Journal of Sports Sciences, 16, 271-279.
Posetrino, G, S., Dutka, T.L., & Graham, L.D. (2001). L(+)-lactate does not affect twitch

125
and tetanic responses in mechanically skinned mammalian muscle fibers. European
Journal of Physiology, 442, 197-203.
Potteiger, J., Smith, K., Maier, K., & Foster, T. (2010). Relationship between body
composition, leg strength, anaerobic power, and on-ice skating performance in
division I men’s hockey athletes. Journal of Strength and Conditioning Research, 24
(7), 1755-1762.
Quinney, H.A., Dewart, R., Game, A., Snydmiller, G., Warburton, D., & Gordon, B.
(2008). A 26 year physiological description of a national hockey league team. Applied
Physiology, Nutrition, and Metabolism, 33, 753-760.
Quistorff, B., Johansen, L., & Sahlin, K. (1992). Absence of phosphocreatine resynthesis
in human calf muscle during ischemic recovery. Biochemistry Journal, 291, 681-686.
Racinais, S., Connes, P., Bishop, D., Blong, S., & Hue, O. (2005). Morning versus
evening power output and repeated-sprint ability. Chronobiology International, 22,
1029-1039.
Racinais, S., Perrey, S., Denis, R., & Bishop, D. (2010). Maximal power, but not
fatigability, is greater during repeated sprints performed in the afternoon.
Chronobiology International, 27, 855-864.
Rampinini, E., Sassi, A., Morelli, A., Mazzoni, S., Fanchini, & Coutts, A. (2009).
Repeated-sprint ability in professional and amateur soccer players. Applied
Physiology, Nutrition, and Metabolism, 34, 1048-1054.
Ratel, S., Williams, C.A., & Armstrong, N. (2006). Effects of age and recovery duration
on performance during multiple treadmill sprints. International Journal of Sports

126
Medicine, 27, 1-8.
Reilly, T., & Thomas, A. (1976). A motion analysis of work-rate in different positional
roles in professionals football match-play. Journal of Human Movement Studies, 2,
87-97.
Reilly, T. (1997). Energetics of high-intensity exercise (soccer) with particular reference
to fatigue. Journal of Sports Sciences, 15, 257-263.
Ren, J.M., Bropberg, S., Sahlin, K., & Hultman, E. (1990). Influence of reduced glycogen
level on glycogenolysis during short-term stimulation in man. Acta Medica
Scandinavica, 139, 467-474.
Ren, J.M., & Hultman, E. (1990). The regulation of phosphorylase a in human skeletal
muscle. Journal of Applied Physiology, 69, 919-923
Richardson, R.S., Noyszewski, E.A., Kendrick, K.F., Leigh, J.S., & Wagner, P.D. (1995).
Myoglobin O2 desaturation during exercise. Journal of Clinical Investigation, 96 (4),
1916-1926.
Richter, E., Ruderman, N., Gavras, H., Belur, E., & Galbo, H. (1982). Muscle
glycogenolysis during exercise: dual control by epinephrine and contractions.
American Journal of Physiology, 242, E25-E32.
Richter, E., Plough, A., & Galbo, H. (1985). Increased muscle glucose uptake after
exercise. No need for insulin during exercise. Diabetes, 34, 1041-1048.
Sahlin, K., Harris, R., & Hultman, E. (1975). Creatine kinase equilibrium and lactate
content compared with muscle pH in tissue samples obtained after isometric exercise.
Biochemistry Journal, 152 (2), 173-180.

127
Sahlin, K., Harris, R., & Hultman, E. (1979). Resynthesis of creatine phosphate in human
muscle after exercise in relation to intramuscular pH and availability of oxygen.
Scandinavian Journal of Medicine & Science in Sports, 39 (6), 551-558.
Sahlin, K., Ren, J. (1989). Relationship of contraction capacity to metabolic changes
during recovery from a fatiguing contraction. Journal of Applied Physiology, 67 (2),
648-654.
Sahlin, K., Gorski, J., & Edstrom, L. (1990). Influence of ATP turnover and metabolite
changes on IMP formation and glycolysis in rat skeletal muscle. American Journal of
Physiology, 259, C409-C412.
Sahlin, K., Tonkonogi, M., & Soderlund, K. (1998). Energy supply and muscle fatigue in
humans. Scandinavian Physiological Society, 162, 261-266.
Short, K.R., & Sedlock, D.A. (1997). Excess post-exercise oxygen consumption and
recovery rate in trained and untrained subjects. Journal of Applied Physiology, 83 (1),
153-159.
Smith, K.J., & Billaut, F. (2010). Influence of cerebral and muscle oxygenation on
repeated-sprint ability. European Journal of Applied Physiology, 109, 989-999.
Soderlund, K., Balsom, P., & Ekblom, B. (1994). Creatine supplementation and high
intensity exercise: influence on performance and muscle metabolism. Clinical
Science, 87, Supplement 120.
Spencer, M., & Katz, A. (1991). Role of glycogen in control of glycolysis and IMP
formation in human muscle during exercise. American Journal of Physiology -
Endocrinology and Metabolism, 260, E859-E864.

128
Spencer, M., Lawrence, S., Rechichi, C., Bishop, D., Dawson, B., & Goodman, C.
(2004). Time-motion analysis of elite field hockey, with special reference to repeated-
sprint activity. Journal of Sports Science, 22, 843-850.
Spencer, M., Bishop, D., Dawson, B., & Goodman, C. (2005). Physiological and
metabolic responses of repeated-sprint activities: specific to field-based team sports.
Sports Medicine, 35(12), 1025-1044.
Spencer, M., Bishop, D., Dawson, B., Goodman, C., & Duffield, R. (2006). Metabolism
and performance in repeated cycle sprints: active versus passive recovery. Medicine
& Science in Sports and Exercise, 38 (8), 1492-1499.
Spencer, M., Dawson, B., Goodman, C., Dascombe, B., & Bishop, D. (2008).
Performance and metabolism in repeated sprint exercise: effect of recovery intensity.
European Journal of Applied Physiology, 103, 545-552.
Spriet, L.L., Lindinger, M.I., McKelvie, R.S., Heigenhouser, G.J., & Jones, N.L. (1989).
Muscle glycogenolysis and H+ concentration during maximal intermittent cycling.
Journal of Applied Physiology, 66 (1), 8-13.
Spriet, L.L., Soderlund, K., Bergstrom, M., & Hultman, E. (1987). Skeletal muscle
glycogenolysis, glycolysis, and pH during electrical stimulation in men. Journal of
Applied Physiology, 62 (2), 616-621.
Stackhouse, S., Reisman, D., & Binder-Macleod, S. (2012). Challenging the role of pH in
skeletal muscle fatigue. Physical Therapy, 81, 1897-1903.
Stanley, W., Wisneski, J., Gerts, E., Neese, R., & Brooks, G. (1988). Glucose and lactate
interrelations during moderate intensity exercise in man. Metabolism, 37, 850-858.

129
Steely, D.S., & Duke, A.M. (2003). Metabolic factors contributing to altered Ca2
regulation in skeletal muscle fatigue. Scandinavian Physiological Society, 179, 39-48.
Sweeney, H.L., & Houdusse, A. (2004). The motor mechanism of myosin V: insights for
muscle contraction. Philosophical Transactions of Biological Sciences, 359, 1829-
1841.
Symons, J.D., & Jacobs, I. (1989). High-intensity exercise performance is not impaired
by low intramuscular glycogen. Medicine and Science in Sport and Exercise, 21 (5),
550-557.
Takahashi, H., Inaki, M., Fujimoto, K., Katsuata, S., Anno, I., Niitsu, M., & Itai, Y.
(1995). Control of the rate of phosphocreatine resynthesis after exercise in trained and
untrained human quadriceps muscles. European Journal of Applied Physiology, 71
(5), 396-404.
Taylor, D.J., Bore, P., Styles, P., Gadian, D.G., & Radda, G.K. (1983). Bioenergetics of
intact human muscle: a 31P nuclear magnetic resonance study. Molecular Biology
and Medicine, 1 (1), 77-94.
Tesch, P.A., & Wright, J.E. (1983). Recovery form short term intense exercise: its
relation to capillary supply and blood lactate concentration. European Journal of
Applied Physiology, 52, 98-103.
Tesch, P.A., Thorsson, A., & Fujitsuka, N. (1989). Creatine phosphate in fiber types of
skeletal muscle before and after exhaustive exercise. Journal of Applied Physiology,
66, 1756-1759.
Thomas, C., Sirvent, P., Perrety, S., Raynaud, E., & Mercier, J. (2004). Relationships

130
between maximal muscle oxidative capacity and blood lactate removal after
supramaximal exercise and fatigue indexes in humans. Journal of Applied
Physiology, 97, 2132-2138.
Thomas, C., Perrey, S., Lambert, K., Hugon, G., Mornet, D., & Mercier, J. (2005).
Monocarboxylate transporters, blood lactate removal after supramaximal exercise,
and fatigue indexes in humans. Journal of Applied Physiology, 98 (3), 804-809.
Thompson, L.V., & Fitts, R.H. (1992). Muscle fatigue in the frog semitendinosus: role of
the high-energy phosphates and Pi. American Journal of Physiology, 263, C803-
C809.
Tomlin, D.L., & Wenger, H.A. (2001). The relationship between aerobic fitness and
recovery from high intensity intermittent exercise. Journal of Science and Medicine
in Sport, 31 (1), 1-11.
Tomlin, D.L., & Wenger, H.A. (2002). The relationship between aerobic fitness, power
maintenance and oxygen consumption during intense intermittent exercise. Journal of
Science and Medicine in Sport, 5 (3), 194-203.
Trump, M., Heigenhauser, G., Putman, C., & Spriet, L. (1996). Importance of muscle
phosphocreatine during intermittent maximal cycling. Journal of Applied Physiology,
80 (5), 1574-1580.
Vander, A., Sherman, J., & Luciano, D. (1980). Human physiology. New York, New
York: McGraw-Hill Publishing.
Vaughn-Jones, R.D., Eisner, D.A., & Lederer, W.J. (1987). Effects of changes of
intracellular pH on contraction in sheep cardia purkinje fibers. Journal of General

131
Physiology, 89 (6), 1015-1032.
Vescovi, J., Murray, T., Fiala, K., & VanHeest, J. (2006). Off-ice performance and draft
status of elite ice hockey players. International Journal of Sports Physiology and
Performance, 1, 207-221.
Volek, J.S., Kraemer, W.J. (1996). Creatine supplementation: its effect on human
muscular performance and body composition. Journal of Strength and Conditioning
Research, 10 (3), 200-210.
Wadley, G., & Rossignol, P. (1998) The relationship between repeated sprint ability and
the aerobic and anaerobic energy systems. Journal of Science and Medicine in Sport,
1 (2), 100-110.
Walter, G., Vandenborne, K., McCully, K., & Leigh, J. (1997). Noninvasive
measurement of phosphocreatine recovery kinetics in single human muscles.
American Journal of Physiology, 272 (41), C525-534.
Westerblad, H., Lee, J.A., Lannergren, J., & Allen, D.G. (1991). Cellular mechanisms of
fatigue in skeletal muscle. American Journal of Physiology - Cell Physiology, 261,
C195-C209.
Westerblad, H., & Allen, D. (1993). The contribution of Ca2 to the slowing of relaxation
in fatigued single fibers from mouse skeletal muscle. Journal of Physiology, 468,
729-740.
Westerblad, H., & Allen, D. (1994). Relaxation during prolonged tetanic stimulation on
intact, single fibers from mouse skeletal muscle. Journal of Physiology, 480, 31-43.
Westerblad, H., Bruton, J.D., & Lannergren, J. (1997). The effect of intracellular pH on
132
contractile function of intact, single fibers of mouse muscle declines with increasing
temperature. The Journal of Physiology, 500 (1), 193-204.
Westerblad, H., & Allen, D. (2002). Recent advances in the understanding of skeletal
muscle fatigue. Current Opinion in Rheumatolgoy, 14, 648-652.
Westerblad, H., Allen, D., & Lannergren, J. (2002). Muscle fatigue: lactic acid or
inorganic phosphate the major cause? News in Physiological Sciences, 17, 17-21.
Williams, J., & Klug, G.A. (1995). Calcium exchange hypothesis of skeletal muscle
fatigue: a brief review. Muscle and Nerve, 18, 421-434.
Wisbey, B., Montgomergy, P., Pyne, D., & Rattray, B. (2009). Quantifying movement
demands of AFL football using GPS tracking. Journal of Science and Medicine in
Sport, 13, 531-536.
Yoshida, T., & Watari, H. (1993). Metabolic consequences of repeated exercise in long
distance runners. European Journal of Applied Physiology, 67 (3), 261-265.
Yoshida, T. (2002). The rate of phosphocreatine hydrolysis and resynthesis in exercising
muscle in humans using 31P-MRS. Journal of Physiological Anthropology and
Applied Human Science, 21 (5), 247-255.
Yquel, R., Arsac, L., Thiaudiere, E., Canioni, P., & Manier, G. (2002). Effect of creatine
supplementation on phosphocreatine resynthesis, inorganic phosphate accumulation and
pH during intermittent maximal exercise. Journal of Sports Science, 20, 427-437.

133
CHAPTER 7: Appendices
7.1 Informed Consent
129
CHAPTER 7: Appendices 7.1 Informed consent
CONSENT FORM
Vitamin D and Measures Related to Physical Performance Consent Form University of Minnesota
You are invited to participate in a research study assessing vitamin D levels, physical performance, and body composition. You were selected as a possible participant because you are an NCAA Division I or Division III hockey player. We ask that you read this form and ask any questions you may have before agreeing to be in the study. The principal investigator (person in charge) of this study in Stacy Ingraham, Ph.D. The study co-investigators are John Fitzgerald, B.S., and Ben Peterson, M.Ed. The researchers work in the Department of Kinesiology at the University of Minnesota. The study is funded by the Human and Sport Performance Laboratory. Study Purpose The purpose of the study is to determine if vitamin D levels influence physical performance, aerobic capacity, and body composition in hockey players. Study Procedures If you agree to participate in this study, we would ask you to participate in two research visits to the Laboratory of Physiological Hygiene and Exercise Science, located in 27 University Recreation Center on the campus of the University of Minnesota. One of the two visits will also include a skating treadmill exercise test that will be conducted at Mariucci arena on the University of Minnesota campus. Total testing time will be approximately 120 minutes or less per session. The two testing sessions will include the following: Laboratory of Physiological Hygiene and Exercise Science: Session 1 (approximately 120 minutes)
• Standard measurements of height and weight will be taken. • Body composition (fat mass and fat free mass) will be taken using underwater weighing.
You will be asked sit on a chair that is under water. While seated on the chair, the water level will be at approximately shoulder level. You will be asked to take a deep breath and then maximally exhale, and then submerse your head below the water for a brief period.
• Basic background history, physical activity, dietary habits, and sun exposure will be assessed. You will be asked to fill out a brief questionnaire for each topic.
• Jumping ability will be assessed. You will be asked to jump as high as possible using two different jumping techniques.
• Hand grip strength will be assessed. You will be asked to maximally squeeze a gripping device for approximately two seconds.
• Power production while cycling will be measured. You will be asked to pedal as fast as possible on a cycle ergometer (exercise bike) against a resistance for 30 seconds.
• A skating treadmill familiarization session will be preformed after testing. The skating treadmill familiarization session will be performed on a Frappier skating treadmill. This oversized treadmill has a surface that enables you to skate naturally. The familiarization

134
130
session will require you to skate on the treadmill at different speeds and grades that you will experience in the skating treadmill GXT during session 2. The purpose of the familiarization session is to allow you to become comfortable with skating on the treadmill.
Session 2 (approximately 60 minutes)
• Vitamin D levels will be assessed. Your finger will be pricked and a small blood sample will be taken. The amount of blood needed for the test is approximately 13 drops or 1/5 of a teaspoon.
• Aerobic capacity will be assessed during a skating treadmill graded exercise test (GXT). The skating GXT will be performed on a Frappier skating treadmill. This oversized treadmill has a surface that enables you to skate naturally. The exercise intensity (skating speed and treadmill grade) will begin at a low level and will be advanced in stages depending on your fitness level. During the test you will wear a facemask and breathing valve that allows for exhaled air to be analyzed. We may stop the test at any time because of signs of fatigue or changes in your heart rate or symptoms you may experience. It is important for you to realize that you may stop when you wish because of feelings of fatigue or any other discomfort. For your safety, you will be wearing a safety harness that is attached to a steel structure on the celling. If you where to lose your balance while skating, the harness will prevent you from falling.
If you agree to participate in a secondary study, further testing will involve two additional visits to Mariucci and Ridder Arena on the University of Minnesota campus and include the following: Session 3 (approximately 35 minutes)
• At the start of the session, you will complete a 10-minute general warm-up. This includes a 5-minute bike warm-up and a 5-minute dynamic warm-up of the lower extremities. During the dynamic warm-up, each participant will be taken through a series of motions that work to activate and warm-up the muscles that will be used during the testing exercise. The dynamic warm-up will involve 6 low-intensity bodyweight exercises performed in series.
• Lower-body power will be assessed. You will be asked to perform two attempts in a broad jump test. A piece of tape will be laid on the floor, marking where you will place your toes. You will be instructed to jump as far as you can.
• Lower-body strength will be assessed. You will be asked to perform the barbell back squat exercise. You will be asked to perform multiple sets of the exercise, starting with a low weight and gradually progressing to a maximal weight that you can perform while maintaining correct exercise form. The last successful attempt will be recorded as your one repetition maximum (1RM). Your barbell back squat 1RM is the maximal amount of weight that you can lift during this exercise while maintaining correct exercise form. We may stop the test at any time, because of signs of fatigue or changes in your exercise form or symptoms you may experience. It is important for you to realize that you may stop when you wish because of feelings of fatigue or any other discomfort. A National Strength and Conditioning Association certified strength and conditioning specialist (CSCS) will conduct all 1RM testing. In addition, a 3-point person spot will be provided on every maximal attempt for your safety.

135
131
Session 4 (approximately 50 minutes) • You will be required to wear full hockey gear to the rink. Before testing begins, you will
be instructed to go through your normal team, pre-game warm-up to ensure you are loose and prepared for high intensity activity.
• Skating acceleration and speed will be assessed on ice. You will be asked to skate as fast as possible from a standing position to a cone 15 meters away. You will then coast around the perimeter of the ice rink three times, building in speed on the last lap as you re-approach the starting line. You will be instructed to skate as fast as possible and maintain your speed for 15 meters after you reach the starting line. You will be required to wear all of your hockey equipment during the assessment. We may stop the test at any time, because of signs of fatigue or changes in your heart rate or symptoms you may experience. It is important for you to realize that you may stop when you wish because of feelings of fatigue or any other discomfort.
• Repeated sprinting ability will be assessed on-ice. The assessment involves skating around a series of cones as fast as possible for approximately 26 seconds. After a rest period (110 seconds), you will be asked to complete the course again. You will be asked to repeat the course eight times. You will be required to wear all of your hockey equipment during the assessment. We may stop the test at any time, because of signs of fatigue or changes in your heart rate or symptoms you may experience. It is important for you to realize that you may stop when you wish because of feelings of fatigue or any other discomfort.
Risks of Study Participation The study has the following risks. The physical performance testing in this study involves maximal effort. There exists the possibility of certain changes during this testing. These include abnormal blood pressure, fainting, irregular, fast, or slow heart rhythm, and in rare instances, heart attack, stroke, or death. In addition, there is a maximal lower-body strength test if you participate in the secondary study, which will load the spine during a period of maximal exertion. While very rare, the possibility of serious bodily injury can occur in the form of a pulled or strained muscle, disc herniation, sports hernia, or broken bone. Every effort will be made to minimize these risks by evaluation of preliminary information related to your health and fitness and by careful observation during testing. We may stop the test at any time because of signs of fatigue or changes in your heart rate or symptoms you may experience. It is important for you to realize that you may stop when you wish because of feelings of fatigue or any other discomfort. This study involves a capillary blood test in which a small quantity of blood is taken. This procedure involves minimal discomfort. You may experience slight discomfort during the finger prick and you may experience pain, tenderness at the puncture site after the procedure and a small, but possible chance of infection. Every effort will be made to minimize the risks associated with this procedure by properly selecting the puncture site, sterilizing the selected site, and using sterilized equipment. After the procedure is completed, the puncture site will be cleaned and appropriately bandaged. This study also involves underwater weighing. You may not be comfortable maximally exhaling and submerging yourself underwater for a brief period. Every effort will be made to clearly explain the procedure and minimize any anxiety associated with the procedure. Emergency equipment and trained personnel are available to deal with unusual situations that may arise.

136
132
Benefits of Study Participation There may be no direct benefit to you for participating in this study. The benefit to study participation is that you will receive physiological testing results, relevant to your sport, which may allow you to evaluate or modify your current training practices. Study Costs/Compensation You will not be compensated for your participation in this study. You may incur costs due to participation in this study. The cost of travel will vary depending on the distance you live from the Laboratory of Physiological Hygiene and Exercise Science. If you will be traveling by automobile, you will have to pay to park. Parking costs will range from $4 to $9 per visit. You will not be reimbursed for either travel or parking costs associated with participation in the study. Research Related Injury In the event that this research activity results in an injury, treatment will be available, including first aid, emergency treatment and follow-up care as needed. Care for such injuries will be billed in the ordinary manner to you or your insurance company. If you think that you have suffered a research related injury, let the study investigators know right away. Confidentiality The records of this study will be kept private. In any publications or presentations, we will not include any information that will make it possible to identify you as a subject. Your record for the study may, however, be reviewed by research staff and by departments at the University with appropriate regulatory oversight. To these extents, confidentiality is not absolute. Study information will not be recorded in your medical record. Study data will be encrypted according to current University policy for protection of confidentiality. Only the previously stated research personnel will have access to the data. Neither coaches nor anyone else will be granted access to any information unless permission is given by the participant. The data/records will be destroyed after a five year time period. Voluntary Nature of the Study Participation in this study is voluntary. Your decision whether or not to participate in this study will not affect your current or future relations with the University of Minnesota. If you decide to participate, you are free to withdraw at any time without affecting those relationships. Contacts and Questions The researchers conducting this study are Stacy Ingraham, John Fitzgerald, and Ben Peterson. You may ask any questions you have now, or if you have questions later, you are encouraged to contact them at: Stacy Ingraham, PhD University of Minnesota School of Kinesiology (612) 626-0067 John Fitzgerald University of Minnesota School of Kinesiology (612) 210-5599 Advisor: Stacy Ingraham, PhD

137
7.2 Preparticipation Screening Questionnaire
134
7.2 Preparticipation Screening Questionnaire
Regular physical activity is fun and healthy, and increasingly more people are starting to become more active every day. Being more active is very safe for most people. However, some people should check with their doctor before they start becoming more physically active. Please read carefully and check all that apply to you at this time.
AHA/ACSM Health/Fitness Facility Preparticipation Screening Questionnaire
Assess your health needs by marking all true statements. History You have had: ___ A heart attack ___ Heart Surgery ___ Cardiac catheterization ___ Coronary angioplasty (PTCA) ___ Pacemaker/implantable cardiac defibrillator/rhythm disturbance ___ Heart valve disease Other health issues ___ Heart failure ___ You have diabetes ___ Heart transplantation ___ You have asthma or other lung disease ___ Congenital heart disease ___ You have burning or cramping in your lower legs when walking short distances Symptoms ___ You have musculoskeletal problems ___ You experience chest discomfort with exertion. that limit your physical activity ___ You experience unreasonable breathlessness. ___ You have concerns about the safety of ___ You experience dizziness, fainting, blackouts. exercise ___ You take heart medications. ___ You take prescription medication (s) ___ You are pregnant Cardiovascular risk factors ___ You are a man older than 45 years ___ You are a woman older than 55 years, you have had a hysterectomy, or you are postmenopausal ___ You smoke or quit within the previous 6 mo. ___ Your BP is greater than 140/90 ___ You don’t know your BP ___ You take BP medication ___ Your blood cholesterol level is >200 mg/dL ___ You don’t know your cholesterol level ___ You have a close blood relative who had a heart attack before age 55 (father or brother) or age 65 (mother or sister) ___ You are physically inactive (i.e., you get less than 30 min. of physical activity on at least 3 days per week) ___ You are more than 20 pounds overweight ___ None of the above is true Balady et al. (1998). AHA/ACSM Joint Statement. Recommendations for Cardiovascular Screening, Staffing, and Emergency Policies at Health/Fitness Facilities. Medicine & Science in Sports & Exercise, 30(6). (Also in: ACSM’s Guidelines for Exercise Testing and Prescription, 7th Edition, 2005. Lippincott Williams and Wilkins http://www.lww.com) www.acsm-msse.org/pt/pt-core/template-journal/msse/media/0698c.htm
If you marked any of the statements in this section, consult your physician or other appropriate healthcare provider before engaging in exercise. You may need to use a facility with a medically qualified staff.
If you marked two or more of the statements in this section, you should consult your physician or other appropriate healthcare provider before engaging in exercise. You might benefit by using a facility with a professionally qualified exercise staff to guide your exercise program.
You should be able to exercise safely without consulting your physician or other healthcare provider in a self-guided program or almost any facility that meets your exercise program needs.