report - boprc
TRANSCRIPT

REPORT WHAKATANE DISTRICT COUNCIL Debris Flow Control System Awatarariki Stream, Matata
VOLUME 1 OF 2
REPORT
Report prepared for:
WHAKATANE DISTRICT COUNCIL
Report prepared by:
TONKIN & TAYLOR LTD
Distribution:
WHAKATANE DISTRICT COUNCIL 2 copies
TONKIN & TAYLOR LTD (FILE) 1 copy
June 2009
T&T Ref: 22674.802
WHAKATANE DISTRICT COUNCIL Debris Flow Control System Awatarariki Stream, Matata
VOLUME 1 OF 2

Debris Flow Control System Awatarariki Stream, Matata Job no. 22674.802 WHAKATANE DISTRICT COUNCIL June 2009
Table of contents
1 Introduction 1
2 Site Description 2
3 The Nature of Debris Flows 3
4 Design Philosophy 4 4.1 The Requirement for Hazard Management 4 4.2 Magnitude vs. Frequency 4
4.2.1 Frequency 4 4.2.2 Magnitude 4
5 Debris Flow Control System 6 5.1 Available Options 6 5.2 Selected Option 6 5.3 Retained Volume 6 5.4 Fanhead Control 7 5.5 Event Sequence 8 5.6 Summary 8
6 Geotechnical Investigations 10
7 Geology 11 7.1 Basement 11 7.2 Early Pleistocene Sediments 11 7.3 Late Pleistocene Volcanics 11 7.4 Holocene Sediments and Debris Fans 11 7.5 Recent Stream Alluvium 12 7.6 Deposits from the 2005 Debris Flows 12 7.7 Faulting 12
8 Flexible Barrier 13 8.1 Ring Net 13
8.1.1 Configuration 13 8.1.2 Performance 14
8.2 Support Cable and Hangers 14 8.3 Anchorages 14
8.3.1 Ground Anchors 14 8.3.2 Piled Structure 15 8.3.3 Stability 16
9 Spillway and Access Track 17 9.1 General 17 9.2 Spillway Surface 17 9.3 Stability of Cut Slopes 17
9.3.1 Existing Quarry Face 17 9.3.2 Northern Cuts 18
9.4 Stormwater 18
10 SH2 - Rail Bridge 19 10.1 Flow Capacity 19 10.2 Abutment Impacts 19 10.3 Abutment Retention 20
11 Diversion Structures 21 11.1 General 21

Debris Flow Control System Awatarariki Stream, Matata Job no. 22674.802 WHAKATANE DISTRICT COUNCIL June 2009
11.2 Precedence 21 11.3 Modelling of Diversion Options 22
11.3.1 Option 1: No Diversion 22 11.3.2 Option 2: Partial Diversion 22 11.3.3 Option 3: Full Protection 22
11.4 Structure Types 23 11.4.2 Berm Height for Full Diversion 24 11.4.3 Shallow Outlet Channel 24 11.4.4 Flood Wall 25 11.4.5 Berm Compaction 25
11.5 Berm Foundation 25
12 Effect on Existing Infrastructure 26 12.1 Kaokaoroa Street 26 12.2 SH2 Oversize Vehicle Bypass 26 12.3 Stormwater 26
13 Other Design Issues 27 13.1 Design Life 27 13.2 Multiple Events 27 13.3 Seismicity 27 13.4 Alluvium Accumulation 27 13.5 Vandalism 28
14 Construction 29
15 Cost Comparison 30
16 Conclusions and Recommendations 31
17 References 33
18 Applicability 35
Figures
Appendix A: Numerical Modelling Report (T&T, 2009)
Appendix B: May 2009 Investigations
Appendix C: Slope Stability Analyses
Appendix D: Flow Modelling of Diversion Structures
Appendix E: Berm Stability Analyses
Volume 2: Drawings

Debris Flow Control System Awatarariki Stream, Matata Job no. 22674.802 WHAKATANE DISTRICT COUNCIL June 2009
Executive Summary
Whakatane District Council (WDC) is proposing to construct a debris flow control system for the Awatarariki Stream, Matata. The purpose of the system is to mitigate the risk of devastation to Matata when a debris flow event of a similar size to that of 2005 occurs. The design is not based on an event with a specific return period but rather a volume of 250,000m3. However, it is considered that the 2005 event was caused by rainfall with a return period of between 200 years and 500 years.
The primary purpose of the system is to prevent destructive flows from impacting the town. It is not proposed to isolate Matata from all the effects of a debris flow event (such as thin flows of muddy water or silt deposition).
The proposed system consists of a flexible “ring net” suspended across the Awatarariki Stream, supplemented by a spillway and fanhead diversion structures. A number of different debris flow control systems have previously been considered. The process by which the preferred option was selected is described in Tonkin & Taylor Option’s Report (Tonkin & Taylor, 2008).
In the configuration proposed, some 100,000m3 of material would be retained behind the flexible barrier. The majority of the remaining material would be diverted to open ground west of Matata. A further quantity of fine-grained (muddy and sandy) material has been allowed for to pass through or over the open barrier structure and pass down the Awatarariki Stream.
A full flow volume containment system is not considered viable for a number of cultural, environmental, engineering and financial reasons.
Detailed numerical modelling has been undertaken as a means of designing the entire debris flow control system. This has been supplemented by the drilling of two additional geotechnical boreholes and an anchor pull-out test.
The flexible barrier, which will be formed from 1.0m diameter steel wire rings, will be 14m high and supported from an overhead steel cable. The net will not terminate at stream level, but will extend horizontally back upstream for a distance slightly less than the height of its front face. This basal section will be buried within the stream alluvium to a depth of between 0.5m and 1.0m.
The barrier will be located within a narrow steep-sided gorge immediately upstream of where the Awatarariki Stream emerges out from the Matata Escarpment. The ends of the support cable would be secured by a network of grouted multi-strand steel (tendon) anchors.
Material in excess of what can be retained by, or pass through the barrier, will be directed by an excavated channel or spillway. This spillway extends from the southern end of the former quarry down to the SH2-Rail Bridge. After passing through the SH2 underpass, the flow material will be able to disperse across open ground. The location and thickness of the resultant fanhead flows can be controlled through the construction of diversion berms (dykes or bunds).
Three options have been considered with regards to fanhead flow control: 1) No flow diversion, 2) Partial flow diversion and 3) full or complete diversion. The partial diversion option is preferred as it prevents the occurrence of destructive or

Debris Flow Control System Awatarariki Stream, Matata Job no. 22674.802 WHAKATANE DISTRICT COUNCIL June 2009
life threatening flows whilst avoiding the large physical barriers and associated costs required to achieve complete protection of the Clem Elliot area.
The debris flow barrier components will have a minimum design life of 100 years, whereas the earthworks have a design life of well in excess of this. The proposed system is fundamentally low maintenance. Ongoing maintenance requirements for the stream are difficult to estimate. It is likely however to involve the removal of debris that has accumulated behind the barrier as well as the replacement of any damaged steel components.
More frequent maintenance of the barrier to remove significant accumulations of wooden debris may be required, however the frequency of this can only be determined by making annual visits to the site over the first few years of operation.

1
Debris Flow Control System Awatarariki Stream, Matata Job no. 22674.802 WHAKATANE DISTRICT COUNCIL June 2009
1 Introduction
On 18 May 2005, the township of Matata was impacted by several large debris flows as a consequence of intense rainfall within the adjacent hill country. The largest and most destructive of these debris flows were generated within the catchment of the Awatarariki Stream. These debris flows and their associated floodwaters destroyed 10 houses and damaged many more within the immediate vicinity of Awatarariki Stream. Extensive damage also occurred to other parts of Matata as a result of debris flows that originated within the Waitepuru Stream.
Whakatane District Council (WDC) is proposing to construct a flexible “ring net” barrier within the Awatarariki Stream as a means of providing protection to Western Matata in the event of future debris flows. The barrier is accompanied by a spillway and fanhead earthworks.
The purpose of this report is to describe the philosophy behind the proposed debris flow control system, as well as demonstrating that it can achieve its objectives of preventing a destructive flow event such as that which occurred in 2005. As such it presents the fundamental design elements of the debris flow control system. However this report does not present all of the detailed engineering required for either the issuing of building consents or construction.
This report should be read in conjunction with Tonkin & Taylor’s option assessments reports (Tonkin & Taylor, 2005a, b, c, 2006b and 2008).
A report detailing the numerical (RAMMS) modelling used in the design of the debris flow control system (Tonkin & Taylor, 2009a) is attached to this document as Appendix A. The modelling presented in Tonkin & Taylor (2009) was undertaken primarily to derive appropriate flow parameters and to determine appropriate elevations for the barrier and spillway. As such, it only considered a single diversion bund configuration for Clem Elliot Drive area.
Since completion of the modelling report, a number of potential alternative earthworks options have been assessed. Additional RAMMS modelling required to assess these options are presented in Section 11 of this report.
Drawings referred to in the text of this report are contained in Volume 2.

2
Debris Flow Control System Awatarariki Stream, Matata Job no. 22674.802 WHAKATANE DISTRICT COUNCIL June 2009
2 Site Description
The township of Matata is located on a narrow strip of coastal land between Awaateatua Beach and the former sea cliffs of the Matata Escarpment. The coastal strip has formed primarily by coastal sediment transport, alluvial materials carried out beyond the escarpment by the Ohinekoao, Awatarariki and Waitepuru Streams, as well as those materials deposited by the Tarawera and Rangitaiki Rivers1 which formerly flowed to the sea through the present day lagoon.
A general location plan is presented as Drawing No. 22674.802-02.
The Awatarariki Stream is located towards the western end of Matata. Its catchment of is approximately 4.5 km2 in size. At the time of the May 2005 storm, the catchment was vegetated primarily in secondary and regenerating native forest, with some pastoral land on the crests of the southern ridges.
The Awatarariki Stream exits the Matata Escarpment through a steep sided, 25m wide gorge. It then flows across the coastal strip for approximately 550m before discharging into the Western Lagoon, a remnant of the former Tarawera and Rangitaiki Rivers.
Mineral extraction has modified the landscape within the immediate vicinity of the Awatarariki Stream. Immediately to the west of the narrow gorge is a topographic saddle formed by the quarrying of gravels. It is understood that this quarrying operation was operated in the first half of last century. Sand mining is understood to have been undertaken on the coastal strip in front of the Awatarariki Stream between the mid 1960’s and mid 1980’s.
1 Prior to 1914, the Rangitaiki and Tarawera Rivers converged to an outlet located near the present day Awatarariki Stream. The Rangitaiki and Tarawera Rivers were diverted to the sea via channels completed in 1914 and 1917 respectively (Summers et al, 2009). The pre-1917 alignment of the rivers is indicated by present day lagoons and wetlands located between Matata and the fixed coastal dunes.

3
Debris Flow Control System Awatarariki Stream, Matata Job no. 22674.802 WHAKATANE DISTRICT COUNCIL June 2009
3 The Nature of Debris Flows
Debris flows are fast-moving, flow-type landslides composed of a slurry of rock, mud, organic matter and water (Giraud, 2005). Successful mitigation of the debris flow hazard at Matata requires a sound understanding of the nature of debris flows. The following are their key characteristics:
Debris flows are generally initiated on steep slopes or channels, often as debris avalanches above the drainage channel; The trigger for debris flows is usually intense rainfall, although other triggers such as snowmelt also occur in relevant climates; Debris flows typically have higher velocities and a greater destructive power than water flows of a similar size; Initiation generally requires a gradient greater than 25°( VanDine, 1996); Within drainage channels, debris flows are typically erosional. They therefore increase in size with distance as they incorporate underlying rock, soil and vegetation; Transportation and erosion generally require a gradient of greater than 15° (VanDine, 1996); Upon leaving the confinement of the drainage channel, debris flows spread laterally and deposit their entrained sediment. This typically occurs on an existing debris fan or alluvial fan; Deposition commences at the lateral margins of the flow, where velocities are less. This results in the formation of lateral levees. The deposition of levees generally occurs at a gradient of less than 15° ( VanDine, 1996); Widespread deposition on the debris fan usually begins once the gradient is less than approximately 10° (VanDine, 1996); Deposition is not uniform: boulders and cobbles will travel less distance than the finer-grained material; A typical debris flow consists of three phases: precedent flow, main flow and subsequent flow; The precedent flow typically has a relatively low discharge volume and essentially consists of muddy water; The main flow consists of several surges or flow front. This results in significant variations in flow depth with time as the flow fronts pass; The main flow surges have high solid contents, with boulders and cobbles concentrated at the front of the flows; The subsequent flows are more fluid, with a high fines (mud) content but a relative paucity of boulders or cobbles (i.e. hyperconcentrated flows); The behaviour of debris flows is predominantly controlled by the larger entrained particles (Davies, 1990); The front of a debris flow tends to be highly erosive, whereas the tail is non-erosive to depositional (Davies, 1990); and Large debris flows are low frequency events.

4
Debris Flow Control System Awatarariki Stream, Matata Job no. 22674.802 WHAKATANE DISTRICT COUNCIL June 2009
4 Design Philosophy
4.1 The Requirement for Hazard Management The May 2005 debris flows were a significant natural hazard event in the history of Matata. Indeed, debris flow events of this magnitude are rarely reported in the technical literature. Although there are no records of debris flows of even remotely similar size in New Zealand occurring in modern times, the presence of large boulders within the township provides irrefutable evidence that large debris flows have occurred in the past (McSaveney et al, 2005).
Historical records suggest that small debris flows may have occurred at Matata in 1869, 1906, 1939 and 1950 (McSaveney et al, 2005), although the available information about the nature of these flows (e.g. flow vs. flood) is limited at best. Despite this, it is a certainty that debris flows have played an integral part in the formation of the Matata coastal strip during recent geological history. It is also a certainty that debris flows will occur in the future.
4.2 Magnitude vs. Frequency Natural hazards are typically managed through the adoption of a design event, which has a magnitude associated with a specific probability of occurrence (or return period). There are however no design criteria for debris flows in either the New Zealand Building Act (2004) or the Resource Management Act (1991).
4.2.1 Frequency
Although it is typical for flood hazards to be managed using a 100 year design return period, the greater destructive power of debris flows suggests that a return period somewhat greater than 100 years is appropriate. Jakob & Hungr (2005) report that a return period of 500 years has been chosen as the design debris flow in a number of jurisdictions in Canada and the United States, although 150 years applies in Austria.
The database of historic debris flows within the Awatarariki Stream is insufficiently detailed to define a reliable return period for the 2005 event. It has been estimated that the rainfall that triggered the May 2005 debris flow event had a return period of approximately 200 to 500 years (Tonkin & Taylor, 2008). Although debris flow frequencies do not generally coincide with precipitation patterns (Hungr et al, 1984), the very large size of the flows suggests that the return period of the 2005 event is likely to be hundreds of years rather than decades.
A number of authors have attempted to link rainfall intensity to debris flow initiation e.g. Cain (1980). However, given the recognised importance of local topographic, climatic and geological controls on debris flow initiation, there is probably limited applicability of such an approach to the design of the Matata debris flow control system. Even temporal variations in material availability mean that equivalent rainfall events within the same catchment may well have very different results in terms of initiation and flow volume (Singh, 1996).
4.2.2 Magnitude
In a joint assessment, Tonkin & Taylor (2008) and McSaveney (2007) estimated that the Awatarariki Stream delivered some 250,000m3 of material onto the Awatarariki Stream

5
Debris Flow Control System Awatarariki Stream, Matata Job no. 22674.802 WHAKATANE DISTRICT COUNCIL June 2009
fanhead. A review of technical literature indicates that the May 2005 event was a significant event in world terms. The Design Event
As is typical of most localities, there are insufficient debris flow data available for Matata to undertake statistically-based frequency-magnitude analyses in a manner similar to that for floods. In recognition of this, WDC is proposing to construct a debris flow control system that would mitigate the risk of devastation to the community of Matata should an event of similar size to 2005 occur1. It is therefore an event volume of 250,000m3 that forms the design basis of the proposed debris flow control system, not a specific return period.
The primary purpose of the system is to prevent destructive flows from impacting the town. It is not proposed to isolate Matata from all the effects of a debris flow event (such as relatively thin flows of muddy water or silt deposition), although the engineering requirements and costs of such a system are discussed in this report.
The scale of the event requiring control is indicted by views of the 2005 debris flow event presented as Figures 1 and 2.
1 Debris flow control measures are also proposed for the Waitepuru Stream, however these are not addressed in this report.
6
Debris Flow Control System Awatarariki Stream, Matata Job no. 22674.802 WHAKATANE DISTRICT COUNCIL June 2009
5 Debris Flow Control System
5.1 Available Options Debris flow mitigation measures can be effective by:
Preventing flow initiation through landslide control measures such as forestation; Preventing occupation of potentially affected areas; or Physically preventing a flow from reaching a designated area through the construction of control structures (retention or diversion).
It is only the latter type of mitigation that is considered here.
Debris flow control structures fall into the following general categories:
Physical barriers providing either total or partial containment e.g. earth dams, concrete sabo (slit) dams, flexible net, debris racks; Energy dissipation structures e.g. drop structures, flow breakers; Flow volume and erosion control e.g. check dams (solid or flexible net); Flow storage e.g. basins, dams etc; and Flow control e.g. diversion berms (dykes) and walls, drainage channel modification, debris sheds and diversion bridges.
Descriptions of various debris flow mitigation structures can be found in a number of sources, however none give guidelines for design of these structures (Prochaska et al, 2008).
5.2 Selected Option The WDC has adopted a flexible “ring net” barrier as the main component of its debris flow control system for the Awatarariki Stream. The selection process was described in Tonkin & Taylor (2008). The salient points in favour of a flexible barrier over an earth or concrete structure are as follows. The flexible barrier:
Minimises the level of construction disturbance within the Awatarariki Stream; Has a very small environmental footprint compared to a dam; Does not hinder normal to storm level water flows or sediment transport within the stream; Does not affect fish passage; Can be installed without negatively affecting cultural sites above the abutments; Is cost effective for the retained volume compared to a solid dam structure.
5.3 Retained Volume Using the barrier height-retained volume relationship presented in Tonkin & Taylor (2008), full containment of a 250,000m3 event upstream of the escarpment would require a retained debris thickness of approximately 15m. Assuming a 1m freeboard, the barrier would need to be 16m high, with a crest elevation of RL27m.
Full containment is not considered to be a viable option for the following reasons:
7
Debris Flow Control System Awatarariki Stream, Matata Job no. 22674.802 WHAKATANE DISTRICT COUNCIL June 2009
The presence of a topographic low-point or saddle on the left-hand (western) side of the barrier location means that once the retained debris levels exceed approximately RL23m, debris flow material would be able to bypass the barrier before it was full; The thin knoll separating the barrier location from the saddle has effectively no potential as an anchoring point for support cables1; Full containment would require the saddle to be either filled to the same elevation as the barrier, or fitted with its own flexible barrier; and Full containment would generate huge loads in the support cable anchorages.
As a result of these considerations, a partial containment option has been adopted. In this configuration, some 100,000m3 of material would be retained behind the barrier. The majority of the remaining material would be diverted via a spillway to open ground west of Matata. It is estimated that up to 50,000m3 of predominantly fine-grained (muddy and sandy) material could pass through or over the open structure of the barrier, particularly at the start and towards the end of the debris flow event. The Awatarariki Stream has the capacity to convey this volume of material.
Detailed numerical modelling undertaken by Tonkin & Taylor (2009a) has provided the following design parameters:
Height of barrier: 15m ; Maximum debris height: 14m; Freeboard between the debris flow and the crest of the net: 1m; Elevation of barrier crest: RL25m; and Elevation of spillway crest: RL21m.
5.4 Fanhead Control The material passing over the spillway flows through the SH2 underpass beneath the rail bridge to open ground (the fanhead). The thickness and distribution of this flow within the Clem Elliot Drive area depends upon the location and extent of any control structures placed on the fanhead. Three options have been considered (Drawing No. 22674.802-02) :
Option 1: No Control
In this option, no flow control or diversion structures would be placed on the fanhead. This option has been modelled however it is not considered to be an appropriate solution. For this case, there remains the potential for locally thicker and faster flow to cause damage.
Option 2: Partial Control
With this option, a 1.5m high earth berm will be used to slow down the flow that is exiting the spillway. This berm would also assist in diverting the highly fluid materials to open ground in the west. Modelling indicates that some material will overtop the berm. This risk can be managed by raising building platforms in the Clem Elliot Drive and Kaokaoroa Street area to limit the thickness and velocity of
1 The two ends of the supporting cable need to be approximately 5m higher in elevation than the net (i.e. RL32m) in order to keep the loads being transferred to the anchors down to manageable levels.

8
Debris Flow Control System Awatarariki Stream, Matata Job no. 22674.802 WHAKATANE DISTRICT COUNCIL June 2009
flows to non-destructive levels. The elevations of these platforms are RL9m, 8.5m and 6m for platforms 1, 2 and 3 respectively (Drawing No. 22674.802-02). These levels are very approximately 2m above existing ground level. The proposed berm and building platforms utilise all of the material excavated from the spillway;
Option 3: Full Diversion
In this option, a diversion channel and extensive earth berms up to 5.5m in height are used to direct all flow material away from the Clem Elliot Drive area. The presence of the berms however results in Kaokaoroa Street being impassable to traffic, requiring a bridge linking Clem Elliot Drive and Richmond Street. The layout is shown on Drawing No. 22674.802-02. Whilst providing a high level of flow containment and training, this option has significant visual and cost implications.
WDC are proposing that Option 2 (partial diversion) be adopted as this achieves the objectives of preventing destructive flows from reaching the Clem Elliot Drive area without the negative physical, financial and connectivity impacts of Option 3.
The proposed building platform elevations are above those required for flood and coastal inundation risks. Option 2 does not modify the existing flood or coastal inundation hazards not will it affect the current overland flows along Clem Elliot Drive towards the Awatarariki Stream.
5.5 Event Sequence Detailed numerical modelling has considered a number of possible sequences that could occur during the design debris flow event. The modelling also determined the interaction between the flow, the barrier, spillway and diversion berms. Full descriptions of the design event modelling are presented in Appendix A (Tonkin & Taylor, 2009).
It should be noted that the modelling presented in Tonkin & Taylor (2009) was completed prior to the full development of the barrier and berm locations described in this design report. Tonkin & Taylor (2009) established the viability of the numerical modelling method, identified the required flow design parameters, as well as determining the relative levels of the flexible barrier and spillway.
Additional analyses have been performed in order to assess the relative merits of the three fanhead diversion options described above. The results of these additional analyses are presented in Appendix D. The berm locations shown in Tonkin & Taylor (2009) have therefore been superseded.
5.6 Summary The basis of the proposed debris flow control system is as follows:
It is designed to protect Matata from a debris flow event similar in size and nature to that which occurred within the Awatarariki Stream in May 2005; The design event is defined as 250,000m3 delivered to the barrier location. A design return period has not been precisely determined; The system consists of a 15m high flexible barrier constructed within the Awatarariki Stream catchment, accompanied by a spillway and fanhead diversion structures; The barrier would be supported by an overhead cable anchored into slopes on either side of the stream;

9
Debris Flow Control System Awatarariki Stream, Matata Job no. 22674.802 WHAKATANE DISTRICT COUNCIL June 2009
A maximum volume of 100,000m3 of material could be retained upstream of the barrier; Up to 50,000m3 of finer-grained debris material is assumed to pass through the barrier, to be conveyed to the lagoon by the stream channel; Material in excess of that able to be retained or passed by the barrier will be diverted over a spillway; and Three options for controlling the flow once it exits the spillway have been considered. The partial control approach (Option 2) is the preferred option as it achieves the states requirements of the debris flow control system with the least negative impacts.

10
Debris Flow Control System Awatarariki Stream, Matata Job no. 22674.802 WHAKATANE DISTRICT COUNCIL June 2009
6 Geotechnical Investigations
A number of geotechnical investigations have been undertaken within the study area as a direct result of the May 2005 debris flows. These investigations were as follows:
October 2005: Site walkover and 16 test pits (TP1 to TP16) in the Clem Elliot Drive area (Tonkin & Taylor, 2005c); August 2006: “Stage 1” geotechnical investigations consisting of a site walkover and field mapping (Tonkin & Taylor, 2006a). The study area included the Ohinekoao Stream, Awatarariki Stream, Western Lagoon, Waimea Stream and Waitepuru Stream; August to October 2006: “Stage 2” geotechnical investigations consisting of machine boreholes, test pits, cone penetration testing (CPT) and laboratory testing undertaken over the broader Matata area (Tonkin & Taylor, 2006b). The following investigations are of relevance to the Awatarariki Stream debris flow control system:
Awatarariki Stream (Upstream of the Matata Escarpment) o Boreholes BH1 to BH5, Test pits TP8 to TP14 Awatarariki Stream (Downstream of the Matata Escarpment) o CPT4 to CPT14 o TP15 to CPT25
May 2009: Further geotechnical investigation of the proposed Awatarariki Stream flexible barrier and spillway locations (Tonkin & Taylor, 2009b). The work consisted of:
A single vertical cored borehole (BH-N1) drilled within the proposed spillway; A single shallow-dipping (20°) borehole (BH-N2) drilled at the proposed right-hand abutment anchor point; and A single anchor pullout tests undertaken immediately adjacent to BH-N2.
The locations of these investigations are shown on Drawing No 22674.802-04.
Borehole logs and core photographs from the investigations undertaken in May 2009 as part of the flexible barrier design are presented in Appendix B. The details of those investigations undertaken prior to May 2009 are contained within the original reports referenced above and are not presented here.

11
Debris Flow Control System Awatarariki Stream, Matata Job no. 22674.802 WHAKATANE DISTRICT COUNCIL June 2009
7 Geology
The geology of the Matata area reflects its position between the Bay of Plenty coastline to the north and the Okataina Volcanic Centre to the south. It is divisible into two distinct areas: a narrow, low-lying coastal strip of Recent age and rugged hills formed from a diverse range of Pleistocene sediments and pyroclastic deposits. The two geological areas are separated by the Matata Escarpment, a line of former sea cliffs.
A generalised geological map of Matata and its surrounds is presented as Drawing No. 22674.802-05.
7.1 Basement The regional geological basement is Jurassic-aged greywacke. The nearest exposures of greywacke are approximately 10km to the west of Matata. Although the greywacke is not exposed near Matata, gravels derived from it are abundant within younger deposits exposed within the local streams.
7.2 Early Pleistocene Sediments The oldest deposits exposed within the immediate vicinity of Matata are a sequence of sediments deposited in the Early Pleistocene. The oldest of these are 700,000 to 2 million year old greywacke gravel conglomerates and an underlying siltstone of undetermined age. These are overlain by Castlecliffian-aged sediments of the Huka Group (Healy et al, 1974).
The Huka Group sediments consist of extremely weak to weak sandstones, siltstones and gravel conglomerates laid down in an estuarine to shallow marine environment some 300,000 to 700,000 years ago (McSaveney et al, 2005). Interbedded with these materials are rhyolitic airfall layers originating from the Taupo Volcanic Zone. These deposits form the coastal escarpment 5km or so either side of Matata.
The only non-pyroclastic or sedimentary unit in the area is the Manuawahe Andesite, which was erupted approximately 620,000 years ago (McSaveney et al, 2005). It is exposed through younger volcanic cover rocks approximately4km south-west of Matata.
Part of the Early Pleistocene sedimentary sequence is exposed within the former quarry face next to the proposed spillway (Figure 3).
7.3 Late Pleistocene Volcanics Eruptions within the Okataina Volcanic Centre started approximately 280,000 years ago. These eruptions resulted in a wide range of eruptive materials overlying the estuarine and shallow marine sediments. The most significant of these is the Matahina Ignimbrite. Although the Matahina Ignimbrite does not extend into the project site, it is exposed within the upper reaches of the Awatarariki Stream. Boulders of the Matahina Ignimbrite commonly occur within the Awatarariki Stream.
7.4 Holocene Sediments and Debris Fans The coastal strip is formed from a diverse mixture of alluvium, debris fan and coastal deposits, including fixed sand dunes. The sediments were deposited during the Holocene (and continue to do so) following the stabilisation of sea levels approximately 7,000 years ago. The sediments are dominated by sands with some silt, gravels and boulders.

12
Debris Flow Control System Awatarariki Stream, Matata Job no. 22674.802 WHAKATANE DISTRICT COUNCIL June 2009
The stratigraphy reflects the multiple sources of the sediments: coastal sands, sediments transported by the former Tarawera and Rangitaiki Rivers, alluvium and debris materials deposited onto alluvial fans (located at each of the streams exiting the escarpment) as well as material that has fallen directly from the escarpment itself.
7.5 Recent Stream Alluvium Investigations undertaken in the valley floor of the Awatarariki Stream (Tonkin & Taylor, 2006b) indicated that the stream is underlain by up to 8m of loose to medium dense alluvium containing boulders up to 3m in diameter and mixed organic material, including tree trunks. This alluvium typically comprises fine to coarse cobbles with frequent boulders in a sandy silt matrix.
The Matahina Ignimbrite appears to be the predominant source of the boulder deposits that are present in the Awatarariki Stream bed, although weaker siltstone boulders are also present.
7.6 Deposits from the 2005 Debris Flows The May 2005 debris flows deposited a very large quantity of mud, sand, gravel and boulders within the lower reaches of the Awatarariki Stream, as well as a large part of the coastal strip (Figures 1 and 2). The debris had a very high proportion of sand and mud-sized particles compared to boulders. Although the 2005 flows are likely to have been finer-grained than many described within the technical literature, they never the less contained many large boulders, including some several meters in diameter.
An estimated distribution pattern of the debris flow deposits was presented in Tonkin & Taylor (2009a).
Test pits undertaken shortly after the 2005 event (Tonkin & Taylor, 2005c) indicated a debris flow thickness of between 1m and 2m. However, as access difficulties restricted the testing locations to the northern part of Clem Elliot Drive, the debris thickness information obtained is expected to be more representative of the distal deposits. Deposit thicknesses on the upper fanhead are likely to have been closer to 3m or possibly 4m.
Groundwater was typically encountered at a depth of 1m or more below the original ground surface i.e. 2m to 4m above sea level.
7.7 Faulting A NE-SW trending normal fault passes between the proposed barrier and spillway locations. This is shown on Drawing 22674.802-06. This fault dips at approximately 60° and is downthrown on the eastern side by approximately 25m. A cross-section through the barrier location is presented as Drawing No. 22674.802-07.
It is not known whether this fault is active. However given the relatively high level of seismicity in the Matata area, there is a reasonable probability that it is potentially active. The issue of seismic design is addressed in Section 13.
The presence of the fault means that the siltstone and greywacke gravels exposed higher up in the Awatarariki Stream catchment are not exposed at the barrier location. Examination of the escarpment shows that normal faults of this type are common, although with much smaller throws.
13
Debris Flow Control System Awatarariki Stream, Matata Job no. 22674.802 WHAKATANE DISTRICT COUNCIL June 2009
8 Flexible Barrier
The flexible barrier will consist of the following primary elements: ring net, overhead cable, support hangers and ground anchorages. Two design options have been considered for the Awatarariki Stream:
A ring net that is suspended from an overhead cable spanning only the Awatarariki Stream. Topographic and geotechnical limitations mean that the cable would need to be secured on the left-hand abutment by a piled structure. The right-hand end of the cable would be secured by multiple ground anchors; and A ring net that is suspended from an overhead cable spanning both the Awatarariki Stream and the proposed spillway. The overhead cable would be secured by multiple ground anchors at both ends.
Although the length of the overhead support cable varies between the two options, the dimensions of the ring net remain the same.
The layout of the two barrier options is shown on Drawing No. 22674.802-20. Sections through the short and long barriers are presented as Drawing Nos. 22674.802-21 and 22 respectively.
Technical details of the flexible barriers are presented below. At the time of writing, Geobrugg (the barrier suppliers) had completed preliminary analyses of the proposed barrier, however detailed analyses were ongoing. The discussion below is based on the preliminary assessments which are known to be conservative.
8.1 Ring Net
8.1.1 Configuration
The rings are formed from up to 19 hoops of 3mm diameter high strength steel wire. Each ring is intertwined with the two rings located immediately above and and the two rings below. Adjacent rings on the same row are not connected.
The structure of the steel rings is shown in Drawing No. 22674.802-24.
The internal flexibility of the segmented rings helps to absorb the initial high impact loads and to distribute them out across the barrier. This significantly reduces the magnitude of the loads acting at the anchorages.
The net will not terminate at stream level, but will extend horizontally back upstream for a distance slightly less than the height of its front face (approximately 12m to 15m). The basal section of the net is buried within alluvium to a depth of between 0.5m and 1.0m. The weight of this alluvium, supplemented during an event by the weight of the debris flow above it, ensures that the barrier can move forward as required to absorb the energy of the flow, but without deforming excessively or losing contact with the streambed.
The sides of the flexible barrier are not secured to the ground as the performance of the system is dependent upon the net moving forward from its original position. Deformation of the net and debris jamming prevents any significant volume of debris flow material from bypassing the barrier via the sides.
14
Debris Flow Control System Awatarariki Stream, Matata Job no. 22674.802 WHAKATANE DISTRICT COUNCIL June 2009
8.1.2 Performance
Although the 1m ring diameter results in the barrier being comprised predominantly of void, field observations by Geobrugg and the Swiss Federal Institute WSL show that very little material other than the fine-grained, highly fluidised component actually passes through the barrier i.e. the barrier does not act in the same manner as a sieve. This is due primarily to the following three effects: tilting back (upstream) of the barrier upon impact; dewatering of the decelerating debris mass and; particle-particle and particle-ring collisions.
Prior to the main boulder-rich slug or lobe of the debris flow impacting the net, a highly fluidised precedent flow will largely pass through the barrier. Upon impact by the main debris flow lobe, the toe of the barrier moves forward, resulting in the front of the barrier (and its accompanied debris mass) leaning back from its initial vertical state to approximately 40° to 45°. Together with the accompanying loss of supporting pore water pressure, this tilting results in the frontal debris material rapidly reaching its angle of repose and ceasing to move.
Observations made from large “whale net” barriers demonstrate that together, there is little opportunity for rock particles with diameters much smaller than the ring or mesh diameter from passing through (Figure 4). The muddy and sandy material entrained within the water flow will however tend to pass through the barrier.
Flume experiments indicate that the most effective opening size for trapping a debris flow is 1.5 times or less the maximum grain size that is likely to be concentrated at the front part of a debris flow (Mizuyama, 2008). A 1m diameter ring translates to a required maximum grain size of 0.7m. Field examination of the coarse grained material deposited during the 2005 event indicates that this requirement would be met in the design event.
The maximum height of debris deposited behind the barrier will be 14m. This thickness reduces significantly upstream. A new stream level would develop on this surface. There will be no damming of water.
8.2 Support Cable and Hangers The ring net will be supported from an overhead steel cable using 22mm diameter vertical steel hanger ropes attached to each ring forming the top row of the net. The overhead support cable will be formed from a multi-strand, high strength steel cable. The number of strands forming the cable will depend upon final calculated loads.
8.3 Anchorages
8.3.1 Ground Anchors
Both anchorages of the long cable option (Drawing No. 22674.802-22) and the right-hand anchorage of the short cable option (Drawing No. 22674.802-21) will consist of steel cable ground anchors (tendons) grouted into boreholes. The grouting method would provide double corrosion protection for the tendon.
Drawing No. 22674.802-23 presents schematic details of the tendon anchors.
The preliminary estimate of cable loads is put at approximately 15MN for each anchor location. The cable load would be transferred into the ground by a layer of grout between the anchor tendon and the side of the borehole (i.e. skin friction). The total number, length and orientation of the tendons will be determined following the finalisation of cable load

15
Debris Flow Control System Awatarariki Stream, Matata Job no. 22674.802 WHAKATANE DISTRICT COUNCIL June 2009
and following further ground investigations and testing that will be undertaken closer to, or at, the time of construction. Adopting a very low skin friction value of 100kPa1, a borehole diameter of 200mm and a geotechnical strength reduction factor of 0.6, an anchor capacity of 15MN could be achieved by a total bond length of 250m. This could be achieved by say 12 anchors, each with a bond length of 21m, although a number of other permutations is possible.
Proof drilling and anchor load testing would need to be undertaken as part of the detailed design and construction process. The actual number and length of the anchors would be finalised at that point. The heads of the anchors would be fixed to a reinforced concrete anchor block embedded into the front of the slope face. Both the length and orientation of the anchors will be varied in a manner that would prevent a failure cone from developing. These are issues for detailed design.
The installation of the grouted anchors increases the stability of the slope into which they are installed through a process of reinforcement. Indeed, such steel tendons are routinely used to stabilise unstable slopes and excavations. The design process, including a substantial factor of safety on both the assumed loads and the ground strength3, ensures that the strength of the anchoring system is well in excess of the load imposed during filling of the flexible barrier.
An example of the multi-strand anchors and their installation is shown in Figures 9 and 10.
Drilling of the anchor boreholes on the right-hand abutment would require a drilling rig to be lowered down from the terrace above. This technique was used to drill the exploration borehole BH-N2 as well as install the test anchor in May 2009. The left-hand anchor location would be reached from the existing quarry floor using a temporary earth ramp.
8.3.2 Piled Structure
The presence of extremely weak sandstones and loose sand on the left-hand side of the Awatarariki Stream means that the narrow topographic high or knoll present is not suitable for either ground anchorages or a structure requiring significant near-surface lateral support (Figures 5 and 6).
A barrier at this location (i.e. the short cable option) requires a free-standing piled structure capable of transferring the cable loads to a depth below stream levels. This is indicated schematically on Drawing No. 22674.802-21.
Provisional analyses indicate that such a structure could comprise 12 (two rows of 6) 610mm diameter 14mm thick bottom driven steel piles installed to a depth of at least 20m below ground level. This configuration only works, however, if the loading is applied at ground level. A free standing structure, of type shown on Drawing No. 22674.802-21 would need substantially larger and/or comprise more numerous piles.
The cultural, ecological and financial aspects of such a structure and its construction-related disturbance strongly favour the selection of the long cable option. It is this option that is recommended in this report.
1 Design value taken from an anchor pull-out test undertaken in May 2009 at borehole BH-N2 3 The calculations use higher impact loads and much lower ground strengths than investigations actually indicate

16
Debris Flow Control System Awatarariki Stream, Matata Job no. 22674.802 WHAKATANE DISTRICT COUNCIL June 2009
8.3.3 Stability
Some evidence of shallow slope instability within the sedimentary rocks on the right abutment was noted during the recent geotechnical investigations (Figure 7). A survey by a Senior Engineering Geologist from Tonkin & Taylor confirmed that such instability problems are not evident at either of the potential anchorage locations.

17
Debris Flow Control System Awatarariki Stream, Matata Job no. 22674.802 WHAKATANE DISTRICT COUNCIL June 2009
9 Spillway and Access Track
9.1 General The spillway is an excavated channel extending from the southern end of the former quarry down to the SH2-Rail Bridge. The elevation, width and gradient of the spillway have been determined from detailed numerical modelling (Tonkin & Taylor, 2009a).
The configuration of the spillway is shown on Drawing Nos. 22674.802-40 to 42.
The most critical element in the design of the spillway is the point of highest elevation relative to the crest of the flexible barrier. Modelling has determined that the spillway must have a maximum surface elevation equal to the barrier crest minus the thickness of the debris flow through the channel. For a barrier crest of RL25m (as proposed), the spillway can have a maximum elevation of no more than RL21m. A spillway elevation of less than RL21m however would correspondingly reduce the volume of material retained behind the barrier.
A single uniform slope gradient has been adopted between the crest and toe of the spillway in order to promote continued movement of debris flow material away from the spillway entrance. The gradient of the spillway is approximately 12°.
9.2 Spillway Surface It is proposed that the spillway be revegetated following excavation. Ideally this vegetation would consist of relatively low, physically flexible varieties such as flax, as these would offer limited resistance to the passage of debris flow materials. Trees of a substantial size should not be planted, or be allowed to become established in any significant quantities, as they may cause the debris flow to stop on the spillway. Alternatively, such trees may be uprooted and transported to the SH2-Railway underpass, potentially resulting in blockage and damage to the structure.
The spillway surface will not be armoured. Some erosion of the spillway surface may occur during a major debris flow event, however the volume mobilised are anticipated to be insignificant compared to the discharge volume.
9.3 Stability of Cut Slopes Excavation of the spillway will result in significant cut batters being formed, particularly on the western side.
Sections showing these cuts are presented on Drawing No. 22647.802-42.
9.3.1 Existing Quarry Face
The existing western quarry face is sub-vertical to a height of approximately 35m (Figure 3). The majority of this face is formed from weakly cemented gravels with sandy lenses. The upper part of the cliff is not accessible, however it appears to be formed from the very weakly to uncemented sediments and interbedded pyroclastic deposits exposed within the nearby knoll.
Although the materials forming the quarry face are only weakly to very weakly cemented, signs of instability are limited to minor erosion of the batter surface as a result of surface water runoff. This stability, which to date has lasted many decades, reflects the effective absence from the rock mass of medium to high-angled joints.

18
Debris Flow Control System Awatarariki Stream, Matata Job no. 22674.802 WHAKATANE DISTRICT COUNCIL June 2009
Assuming that the existing quarry face has a factor of safety (FoS) of 1.3 under drained conditions (an appropriate assumption given its demonstrated stability), shear strength parameters have been back analysed for the constituent materials. These parameters were subsequently used in the stability assessment of the proposed spillway.
Forward analyses (Appendix C) show that excavation of the spillway does not result in a reduction in the stability of the cutting, as the critical failure surfaces are located in the upper part of the face. These higher elevation failure surfaces remain the most critical whether a spillway is present or not. The analyses have shown that the minimum factor of safety against failure through the spillway excavation is approximately10% greater (i.e. more stable) than the current slope. This shows that the presence of the spillway does not have a negative effect on the stability of the quarry slope.
A 5m to 8m wide bench has been left between the existing and proposed cut slopes for access and the control of surface water runoff. The formation of this bench will require the removal of some rock fall materials that currently lie at the toe of the quarry face.
9.3.2 Northern Cuts
The northern-most part of the spillway will be constructed beyond the cliff faces that delineate of the location of the former sea cliff. It is expected therefore that the geology though which the spillway passes from south to north will change from the Pleistocene sediments exposed in the former quarry face to uncemented debris fan material that has been deposited at the base of the escarpment. Excavations are also expected to encounter a variety of sandy and waste rock materials left behind as a result of the former quarrying operations.
A geological section though the spillway is shown on Drawing No. 22674.802-08).
In recognition that the stability of the spillway cut slopes will likely be lower in these debris fan materials than the Pleistocene gravels, a slope gradient of 1V:1H has been adopted. These cut batters will likely have FoS less than 1.3, but they would be commensurate with the stability of the natural gravel slopes in the area.
9.4 Stormwater Rainwater falling directly into the spillway will be dealt with directly on the slope through shallow surface channelization and vegetation. A grassed berm will direct runoff from the adjacent quarry face from entering the spillway. Only rainwater falling directly on the access track will require control. This runoff will be directed by the cross fall of the track towards a drain located on the inside curve. From here the water would be directed to the existing SH2 stormwater network.
Given the limited quantity of water expected to be carried by this drain, erosion control would likely be limited to judiciously placed rock or geofabric. Final drainage surface selection will depend upon the materials actually encountered in the base of the spillway excavation.

19
Debris Flow Control System Awatarariki Stream, Matata Job no. 22674.802 WHAKATANE DISTRICT COUNCIL June 2009
10 SH2 - Rail Bridge
The toe of the spillway will be located immediately south of the existing SH2-Rail Bridge. The high railway embankment separating the Matata Escarpment from the coastal strip requires the debris flow material moving over the spillway to pass through the SH2 underpass beneath the bridge.
10.1 Flow Capacity Numerical modelling of the design event (Tonkin & Taylor, 2009) indicates the following peak flow parameters for the bridge/underpass location:
Peak flow height: 4.5m; Peak flow velocity: 3m/s1; Estimated peak flow: 275m3/sec; and Minimum freeboard to bottom of bridge beam: 0.9m.
The modelling has indicated that the SH2 underpass is physically large enough to allow passage of that portion of the design debris flow event that passes over the spillway. Despite this, fluid dynamics mean that some debris flow material will travel west along SH2. The RAMMS models indicate that debris could move west along SH2 for 200m, although in reality the debris flow is likely to generate berms parallel to the flow that would tend to limit the extent of lateral debris movement.
The estimated peak flow rate at the SH2-Rail bridge location is approximately 85% of the 325m3/sec peak discharge rate estimated for the 2005 event by Environment Bay of Plenty (EBOP, Tonkin & Taylor, 2008). EBOP estimated a peak flow velocity of 4.5m/s in the Awatarariki Stream for the 2005 event.
These peak flow parameters are those obtained for the worst-case scenario of the debris flow consisting of a one single flow front. Debris flows however typically consist of several flow pulses. Such a multi-front flow would generate lower peak flow heights, in the order of 1.5m to 3m.
10.2 Abutment Impacts During passage of the flow through the underpass, material will strike the bridge abutments and piers. The orientation of the bridge relative to the spillway means that the western abutment is expected to bear the brunt of such impacts. Although there is some potential for the bridge abutments to be struck by a limited quantity of larger material (such as trees) passing over the spillway, the structure has deep foundations and is considered robust enough not to require additional reinforcement or impact protection.
1 A change in gradient, as well as the physical constraints offered by the railway embankment, means that the velocity of the debris flow reduces from approximately 6m/s towards the base of the spillway to 3m/s beneath the bridge.

20
Debris Flow Control System Awatarariki Stream, Matata Job no. 22674.802 WHAKATANE DISTRICT COUNCIL June 2009
10.3 Abutment Retention In flow control Option 3, full diversion of the flow material requires excavation of a shallow diversion channel (see Section 11). This in turn requires the spill-through abutment on the north side of the west abutment to be excavated (Figure 8). As the abutment sheet piling has been installed only on the southern and eastern sides (i.e. those facing SH2) the excavated northern-eastern face will require support in the form of a retaining wall.
It is proposed that a MASSBLOC wall (or similar) be constructed on a shallow hardfill foundation. The back of the wall blocks would be secured with concrete in order to provide strength against debris flow forces.
Ontrack has confirmed that both the sheet pile abutment wall and the bridge piers are deep and therefore will not be impacted by scour, should indeed it take place.

21
Debris Flow Control System Awatarariki Stream, Matata Job no. 22674.802 WHAKATANE DISTRICT COUNCIL June 2009
11 Diversion Structures
11.1 General The control of flow materials delivered to the fanhead requires diversion structures of some form to protect the Clem Elliot subdivision. As described in Section 5.4, three control options have been assessed. These are described below. Output from the RAMMS models is presented in Appendix D.
11.2 Precedence Although the use of diversion berms (dykes) and concrete walls to control debris flows is mentioned in the technical literature, there is very little published information available regarding the design and/or construction methods used. A state-of-the-art compilation of information relating to diversion berms is presented by Prochaska et al (2008). Relevant points are referred to below:
Diversion berms are most effective when located high on alluvial fans; Diversion berm alignments can be straight, curved or a combination of the two; The berm should be high enough to pass the discharge from the design debris flow event with consideration given to superelevation and runup heights and an appropriate freeboard; The freeboard recommended by FERMA is 3ft (0.9m); The top of the berm should be at least 3m wide if it is to be accessed for maintenance. Narrower widths can be used if appropriate; The side slopes of the berm should be sufficiently stable (FoS of 1.3); Side slopes steeper than 1V:1.5H have been used. The steeper the side slope, the less significant the effects of runup; Earthen berms are well suited to withstand impact forces due to their large mass; The upslope face of the berm can be armoured to protect it against debris flow scour; Because debris flows have the capability to transport large boulders, riprap should be grouted or otherwise securely keyed into the berm; and The recommended riprap size for flow depths greater than 2.4m is 1.2m.
An example of a debris flow defence system in New Zealand is the one constructed in the late 1990’s to prevent debris flows within the Glencoe Stream from damaging the Aoraki Mount Cook Village (Skermer et al, 2002).
The system consists of a main berm and two flanking berms. The main berm was constructed from sand, gravel and cobbles excavated from within the immediate vicinity to form a storage basin. The front face was steep (3V:4H or 1V:1.33H) in order to minimise run-up and overtopping caused by superelevation flows. The steep slope is faced with grouted boulders. This dyke is 180m long and up to 5.5m high above existing ground level. The berms were vegetated after construction, although the means of achieving this is not described.
A reinforced concrete wall was constructed at a critical location at the top of the fan to ensure that the material flowing out of the gorge was steered away from the village. The concrete wall was 35m long and up to 9.5m high.

22
Debris Flow Control System Awatarariki Stream, Matata Job no. 22674.802 WHAKATANE DISTRICT COUNCIL June 2009
The Glencoe Stream debris diversion/containment system was designed for a 100,000m3 event.
In the 1970’s, simple granular earth berms 3m to 5m high were constructed by bulldozer on a debris fan above Port Alice, British Columbia (Nasmith and Mercer, 1979).
11.3 Modelling of Diversion Options RAMMS modelling has been undertaken to assess the distribution and thickness of flows crossing the fanhead area for each of the three diversion options described above. The modelling output is presented in Appendix D. The primary outcomes are described below.
The modelling has been undertaken using the same two-flow event that was found to be most critical in net and spillway performance. The first flow represents 33% of the total event volume, whereas the second flow is made up of the remaining two thirds. It has been assumed that 25,000m3 of the initiating event passes through the barrier. As up to 50,000m3 is thought to be able to pass through the barrier, this provides a slightly conservative estimate of peak flow heights.
In all cases, the flow onto the fanhead from the initial smaller flow is minimal. The flow thicknesses described below are from the second larger flow.
11.3.1 Option 1: No Diversion
In this option, no flow control structures are placed on the fanhead beyond the toe of the spillway. RAMMS modelling (Figure D1) shows that there is widespread inundation of the Clem Elliot Drive area to a reasonably uniform height of approximately 0.8m. Post peak flow thicknesses drop to something in the order of 0.2m.
11.3.2 Option 2: Partial Diversion
In this option, the 1.5m high earth berm constructed immediately north of SH2 is able to direct a proportion of the highly fluid material passing through the SH2 underpass out towards open ground to the west. The berm is not high enough however to prevent superelevation and runup flows from overtopping the berm crest.
The peak flows are similar to those estimated for Option 1, however the presence of raised building platforms limits the peak flow depths to 0.2m, 0.2m and 0.45m for platforms 1, 2 and 3 respectively (see Drawing No. 22674.802-02 for the platform locations). The existing houses located north of Clem Elliot Drive experience peak flow heights in the order of 0.5m, although this varies somewhat with topography. All flows thicknesses are less than 1m however.
Option 2 achieves a cut-fill balance with that removed from the spillway. The fill would need to be compacted to a standard suitable for standard foundations (i.e. NZ 3604; NZ 4203).
11.3.3 Option 3: Full Protection
Full protection of the properties in the Clem Elliot Drive area from the design debris flow event requires substantial diversion structures to be constructed from the Awatarariki Stream (Moore’s Bridge), west for distance of 445m.
The layout of the required diversion structures is shown on Drawing No. 22674.802-80.

23
Debris Flow Control System Awatarariki Stream, Matata Job no. 22674.802 WHAKATANE DISTRICT COUNCIL June 2009
Modelling has shown that this configuration will prevent all flows exiting the spillway from entering the Clem Elliot Drive area. Note that the RAMMS model output (Appendix D) appears to indicate that there is some flow over the top of the berm. This is erroneous as the model is not able to replicate the proposed vertical gabion capping which would prevent runup and superelevation overtopping flows.
11.4 Structure Types The debris deflection structures would consist primarily of earth berms, although a short section of reinforced concrete wall will also be required (Option 3 only).
Two earth berm types have been defined: a simple structure constructed entirely of compacted local fill and an armoured variant.
The location of the berm variants is shown on Drawing No. 22674.802-80.
The berms would be constructed from material excavated from the spillway, except for the armour (Option 3 only) which would be sourced from the 2005 debris.
11.4.1.1 Simple Earth Berm
A simple trapezoidal-shaped berm formed from compacted earth materials can be used where the direction and velocity of the debris flow is such that significant erosion of the berm face is not expected to be an issue. In Option 3, it is proposed to construct simple earth berms towards the western and eastern ends of the project.
The berm will have a front face of 1V:1.5H, a back face of 1V:2H and a crest width of 2m. The adoption of a steep front face and a narrow crest has been necessary in order to minimise the footprint and volume of the berm. The use of a steep front face also assists in limiting overtopping (superelevation and runup) flows.
Details of the berm are shown in Drawing No. 22674.802-83. It is expected that the berms would be suitable for planting.
Stability analyses (Appendix E) show that the proposed berms achieve a FoS greater than 1.3. This is achieved through the presence of granular material occurring naturally beneath the berm locations. Any soft and/or organic rich material located beneath the footprint of the berms would need to be removed and replaced with fill of a similar nature to the berm itself.
11.4.1.2 Armoured Earth Berm
The central section of the Option 3 diversion structure network would consist of an armoured earth berm. The structure of this berm is essentially the same as for the simple earth berm, except that the front face is covered in grouted rip-rap.
It would be possible to cover the front of the armoured berm with a growing medium in order for the face to be covered. Skermer et al, 2002 report grouted riprap being successfully vegetated. This covering soil would be considered sacrificial in the event of a debris flow.
Prochaska et al (2008) recommend a rock size of 1.2m for debris flow depths greater than 2.4m. They do not however identify whether this is a minimum size.
The armour could be sourced from debris flow material left after the 2005 event. No assessment has been made as to whether the volume of available material would be sufficient to complete construction. The selected rock should be the more blocky and

24
Debris Flow Control System Awatarariki Stream, Matata Job no. 22674.802 WHAKATANE DISTRICT COUNCIL June 2009
angular of the available material. Given its limited likely use, strict grading is not considered necessary.
Details of the armoured berm are shown in Drawing No. 22674.802-83.
The presence of the armoured front face means that the stability of the berm is at least as high as the simple earth berm.
11.4.2 Berm Height for Full Diversion
Design berm elevations required for full flow diversion (Option 3) have been determined from the results of flow modelling, the results of which are presented in Appendix D.
The peak debris flow thickness generated during the modelling occurs between the SH2-Rail Bridge and the berm that diverts debris material to the west (Figure E2). The narrow diversion corridor and the sharp angle of deflection at this location combine to generate a peak flow depth of 5m. This is in excess of the flow heights that occur upstream of the flexible barrier under full design flow conditions.
Previous modelling has indicated that doubling the width of the discharge channel to approximately 60m can reduce peak flow depths to between 2.5m and 3m. This would allow a corresponding reduction in berm height.
The heights of the berms presented in Drawing No. 22674.802-80 to 82 range from 2m to 5.7m. The majority of this height is above existing ground level, however some is also the result of excavating a shallow outlet channel at the toe of the western berm.
Modelling has shown that the berms cannot exceed an elevation of approximately RL10 (i.e. a height of approximately 4m above the outlet channel), as larger structures would significantly reduce the discharge capacity of the channel and in turn require higher berms. It is therefore proposed to construct the earth berms to a level just above the peak elevation of the debris flows, with a further 1m added by placing gabion wall on the crest of the berm.
This wall would provide some freeboard as well as turning back thin superelevation and runup flows that numerical modelling has shown could overtop the berms. Freeboard above the main flow elevation and the estimated overtopping flows are shown on Figure E3. Also see Appendix D for relevant comments of the limitations of the modelling.
The gabion wall is shown in Drawing No. 22674.802-83. It is proposed that the centre of the gabion baskets be grouted to prevent the passage of water through the wall. All sections of armoured berm will have the gabion crest, whereas only a limited section of the simple earth berm will need to be similarly treated.
11.4.3 Shallow Outlet Channel
In order to maintain flows in the desired direction, a shallow channel would be constructed at the toe of the berm west of the SH2-Rail Bridge. Although it increases the flow carrying capacity of the diversion system slightly, the shallow channel is required primarily to remove local topographic highs that would impede flow. Existing vegetation can be re-established within the outlet channel.
The layout, profile and typical sections of the outlet channel is shown on Drawing Nos.22674.802-70 to 73.

25
Debris Flow Control System Awatarariki Stream, Matata Job no. 22674.802 WHAKATANE DISTRICT COUNCIL June 2009
Current drawings indicate some excavation of an existing landfill. Adoption of Option 3 would actually require either the diversion of the channel away from this area or terminating it earlier so that erosive flows are not directed onto exposed waste.
11.4.4 Flood Wall
A concrete flood wall is required to be constructed along the southern boundary of 100 Arawa Street, which is located on the left bank of Awatrariki Stream. An appropriate structure is a 1.5m high, “T”-shaped cantilevered wall. An earth berm cannot be constructed in this area due to the lack of available space.
Details are presented in Drawing No.22674.802-85.
The western end of the wall would need to be enveloped by the earth berm that crosses Kaokaoroa Street.
11.4.5 Berm Compaction
Construction and compaction requirements for either the small (Option 2) or large (Option 3) debris flow diversion berms should be similar to a road embankment (Santi et al, 2006). The berms will require compaction to ensure strength, however it is not intended that they have permeability parameters of flood protection works as the flows and their entrained water will be short-term events. Compaction will also allow the construction of the steep side slopes proposed which are steeper than would be expected in Flood protection works.
11.5 Berm Foundation The berms are expected to be constructed primarily on alluvial sands and gravels, however some softer or organic materials may be encountered. Prior to construction of the berm the footprint should be examined for the occurrence of such materials by eye as well as proof rolling. If soft cohesive or organic materials are encountered they would need to be removed and replaced with compacted fill of the same type as the berm.

26
Debris Flow Control System Awatarariki Stream, Matata Job no. 22674.802 WHAKATANE DISTRICT COUNCIL June 2009
12 Effect on Existing Infrastructure
12.1 Kaokaoroa Street Neither Option 1 nor Option 2 requires modifications to be made to Kaokaoroa Street.
The diversion berms required for Option 3 extend across Kaokaoroa Street. Even if this 4.5m high berm is in the form of a broad topographic high, Kaokaoroa cannot be reinstated with acceptable geometrics (sight lines etc). Increasing the linear length of the street by reconstructing it towards the east with an “S” curve will reduce the gradient to a minimum of approximately 12%. This compares poorly to the Austroads recommended steepest gradient for a rural road with a 60km/hr speed limit of 6% to 9%.
Complete reconstruction of Kaokaoroa Street would be required, yet it would still ultimately result in a road that is unlikely to meet accepted standards. An alternative to this realignment would be to close Kaokaoroa Street and provide access to Clem Elliot Drive via Richmond Street. This however will require the construction of a bridge across the Awatarariki Stream. Design of this bridge has not been undertaken as part of this study.
12.2 SH2 Oversize Vehicle Bypass A section of pavement currently provides oversized vehicle access around the SH2/Rail Bridge underpass. This road was in-place when the narrow pre-2005 underpass existed. Excavation of the outlet channel (required for Option 3 only) will require a section of this pavement to be removed, and the ground to be excavated.
The outlet channel has been configured to allow continued vehicle passage around the underpass, provided that a suitable pavement is reinstated at the lower level.
12.3 Stormwater Stormwater from the SH2/Rail underpass is currently directed towards the Far West Lagoon via a short section of pipe and an open drainage ditch. Construction of the western diversion berm (both Option 2 and Option 3) will result in this drain being infilled. It is proposed to reinstate this channel as a shallow overland flow path located at the toe of the completed berm.

27
Debris Flow Control System Awatarariki Stream, Matata Job no. 22674.802 WHAKATANE DISTRICT COUNCIL June 2009
13 Other Design Issues
13.1 Design Life The debris flow control system components will have a minimum design life of 100 years.
The anchor tendons will be fabricated from heavy galvanised steel wire ropes. Double grouting of the tendon and anchor head will give a nominal design life of 120 years, although the actual working life is almost unlimited.
The rings and support cables will have SUPERCOATING galvanising treatment. This special coasting has been shown by testing to last at least three times longer than standard galvanising.
The design life is nominally less than the return period of the design event. This will require maintenance to ensure ongoing operation of the system. The structure of the flexible barrier is such that individual parts are readily replaceable.
13.2 Multiple Events The flexible barrier is expected to be used to control a number of debris flows. It is not intended to be used as a one-event control structure. Once a debris flow has occurred, the flexible barrier can be reinstated for use by removing the debris that has accumulated behind it. An access track will be formed within the spillway to enable access by earthmoving equipment to remove the debris to designated placement sites.
An inspection of the barrier after an event would identify any rings or vertical hangers that require replacement. The anchor head assembly would also need inspection. The construction of the barrier makes the replacement of its component parts a relatively minor issue. The barrier would then be placed back into its original (vertical) position using the same technique as when it was originally constructed.
13.3 Seismicity Matata is recognised as an area of significant recent seismic activity. The nominated system of a flexible barrier and earth berms will however not be adversely affected by the seismic accelerations that can be expected during the design life of the structure and beyond. Specific seismic design will therefore not be required unless an above-ground piled structure is required for the left-hand abutment of the barrier.
13.4 Alluvium Accumulation The 1m diameter rings will allow passage of stream alluvium in all but the most significant flood events. Blocking of the lower rings by boulders, or possibly more likely, tree debris, would result in some deposition building up behind the barrier. It is expected that this would have a potential affect on stream water flows, however the effect on storage capacity within the stream would be insignificant.
Maintenance requirements for the stream are difficult to estimate. Based on the history of smaller debris flows within the Awatarariki Stream, significant maintenance is likely to be required approximately every 20 to 25 years. This maintenance is likely to involve the removal of debris from behind the barrier as well as the replacement of any damaged steel components.

28
Debris Flow Control System Awatarariki Stream, Matata Job no. 22674.802 WHAKATANE DISTRICT COUNCIL June 2009
More frequent maintenance of the barrier to remove significant accumulations of wooden debris may be required, however the frequency of this can only be determined by making annual visits to the site over the first few years of operation. The barrier should be inspected after major storm events until a database of performance characteristics can be determined.
Debris built up behind the barrier could be removed by earthmoving equipment using the access track located within the spillway.
13.5 Vandalism The standard method of installing a flexible barrier utilises multiple “D” shackles. The remote location of the Awatarariki Stream means that any “D” shackles used on the barrier would be susceptible to theft or vandalism. It is recommended that such removable items be welded to prevent theft, although this will prolong the time required for some maintenance cycles.
A means of preventing unauthorized persons climbing the barrier has not been addressed in this report.

29
Debris Flow Control System Awatarariki Stream, Matata Job no. 22674.802 WHAKATANE DISTRICT COUNCIL June 2009
14 Construction
Construction of the debris control system would involve the following major sequencing elements:
Modification works to the existing quarry track to provide access for construction equipment; Drilling and installation of the anchorages; Installation of the support cable and hanger ropes; Site fabrication of the ring net; Excavation of a shallow slot within the stream bed into which the horizontal section of the net would be placed; Attaching the ring net to the support cable and laying the base of the net into the shallow slot; Reinstatement of the streambed over the horizontal section of net; Clearing and preparing the footprint of the diversion berms; Collection of riprap from existing stockpiles of rock from the 2005 event (Option 3 only); Excavation of shallow outlet channel (Option 3 only) and replacement overland flow path (Options 2 and 3); Installation of the retaining wall at the western abutment of the railway bridge (Option 3 only); Replace oversize vehicle pavement on realigned route (Option 3 only); Top-down excavation of the spillway and final access track. Excavated material to be used to construct the bunds (Options 2 and 3); Commence revegetation of the spillway (all Options) and outlet channel (Option 3 only); Construct berms; and Vegetate berms.
No permanent excavations will be required other than for the spillway and shallow outlet channel (if needed). No permanent access will be required to either of the anchor points.

30
Debris Flow Control System Awatarariki Stream, Matata Job no. 22674.802 WHAKATANE DISTRICT COUNCIL June 2009
15 Cost Comparison
Cost estimates for the engineering aspects of the project are presented in Table 1. This identifies the primary differences between the three fanhead flow control options.
Table 1: Comparative Cost Assessments
Item Option 1 No Diversion
Option2 Partial Diversion
Option 3 Full Diversion
Flexible Barrier $2,310,000d $2,310,000 $2,310,000
Spillway $200,000 $200,000 $200,000
Diversion Structures $0 $14,500a $512,000b,e
Raised Building Platforms $0 $264,000e $0
Road Bridge $0 $0 $350,000
Shallow Channel $0 $0 $105,000c
Excess cut disposal $125,000 $0 $0
Total $2,635,000 $2,788,500 $3,477,000
Notes: Excludes GST a) Assumes no armour facing b) Approximately half the length is armoured c) Does not include the reinstatement of the over-size vehicle by-pass road d) Initial estimates of anchoring costs have been increased by $200,000 based on the likely need for
additional and/or longer cables as a result of recent drilling. Does not take into account possible effects of exchange rates since price estimates were made.
e) Provides cut-fill balance

31
Debris Flow Control System Awatarariki Stream, Matata Job no. 22674.802 WHAKATANE DISTRICT COUNCIL June 2009
16 Conclusions and Recommendations
Engineering design has been undertaken for a proposed debris flow control system to be constructed in and around the Awatarariki Stream, Matata. The work has included the use of state-of-the-art numerical modelling as well as specific on-site geotechnical investigations and testing.
This design report outlines the philosophy behind the proposed debris flow control system, provides details of its physical elements as well as demonstrating that it can achieve its objectives. As a small number of items have potential alternative arrangements, not all of the detailed engineering designs required for construction are presented here.
The following conclusions and recommendations have been made:
The debris flow control system has been developed around a flexible steel barrier and diversionary earthworks; The system is designed to control an total event volume of 250,000m3; A total of 100,000m3 of debris would be retained at the barrier location. The majority of the remainder would pass the barrier via a diversionary spillway; The proposed Awatarariki Stream barrier consists of a “ring net” system supported by an overhead cable anchored into the slopes above the stream. The net crest is set at RL25m, approximately 15m above stream level; A long cable and short cable option currently exists for the barrier, with the former the preferred option. Selection of either option does not alter the configuration of the net, spillway or diversion structures.; The maximum retained height of debris at the barrier is 14m (RL24m). The height of debris at the net will be controlled by an adjacent spillway; A spillway constructed within a former quarry to the side of the barrier will direct excess debris material under the SH2-Rail bridge out onto the Matata fanhead; Flow material exiting the spillway will cross the Clem Elliot Drive area unless an extensive system of berms is constructed; Berms will be constructed of compacted earth. Some berms constructed a spart of a full diversion option will require a grouted riprap armouring. Thin overtopping flows and practical limitations of berm footprint size would require more than half the length of berm to be capped with a vertical face (gabion wall); Space limitations adjacent to the Awatarariki Stream require the Option 3 earth berms to be replaced by a reinforced concrete floodwall; The spillway and berms will be able to be revegetated. The spillway will include an access track suitable for future maintenance requirements; The steel components fo the system have a minimum design life of 100 years. Parts of the flexible barrier may need replacing or repair during this period. Maintenance clearing of debris from behind the barrier is expected to be required only after highly significant flood events. The system performance would need to be monitored in order to develop an appropriate maintenance programme. It is recommended that:
The longer cable option be adopted for the flexible barrier; and

32
Debris Flow Control System Awatarariki Stream, Matata Job no. 22674.802 WHAKATANE DISTRICT COUNCIL June 2009
At a minimum, a berm be placed immediately north of the SH2-Rail bridge in order to limit the thickness and velocity of flows crossing private properties to the north; and Currently undeveloped properties should have raised building platforms as a means of limiting the thickness of flows crossing them. Appropriate levels are proved in this report.

33
Debris Flow Control System Awatarariki Stream, Matata Job no. 22674.802 WHAKATANE DISTRICT COUNCIL June 2009
17 References
Caine, N., 1980. The rainfall duration-intensity control of shallow landslides and debris flows. Geografisca Annaler 62A(1-2), pp23-27.
Davies, T. R. H., 1990. Debris flow surges – experimental simulation. Journal of Hydrology, 29(1), 18-46.
Giraud, R. E., 2005. Guidelines for the geologic evaluation of debris flow hazards on alluvial fans in Utah. In Landslide Risk Management – Hungr, Fell, Couture & Eberhard (eds).
Healy, J., Schofield, J. C. and Thompson, B. N., 1974. Geological Map of New Zealand, 1:250,000, Sheet 5 – Rotorua. New Zealand Geological Survey.
Hungr, O., Morgan, G.C. and Kellerhals, R., 1984. Quantitative analysis of debris torrent hazards for design of remedial measures. Can. Geotech. J., 21, pp 663-777.
Jakob, M., 2005. A size classification for debris flows. Engineering Geology, 79:151-161.
Jakob, M. and Hungr, O., 2005 (Ed). Debris-flow hazards and related phenomena. Springer.
McSaveney, M., 2007. Matata Debris Flow: Awatarariki Volume. Email to Tonkin & Taylor.
Mizuyama, T, 2008. Structural counter measures for debris flow disasters. International Journal of erosion control engineering, Vol 1, No. 2, pp 38-43.
Nasmith, H. W. and Mercer, A. G., 1979. Design of dykes to protect against debris flows at Port Alice, British Columbia. Canadian Geotechnical Journal Vol 16 1979 pp 748 – 757
O’Leary, A., 2008. Engineering geology and debris flow hazards at Matata. Proceedings of the Australia New Zealand Young Geotechnical Professionals Conference, Wellington.
Prochaska, A. B., Santi, P. M. and Higgins, J. D., 2008. Debris basin and deflection berm design for fire-related debris-flow mitigation. Environmental & Engineering Geoscience, Vol XIV, No. 4, November 2008, pp 297-313.
Santi, P. M., Soule, N. C. and Brock, R. J., 2006. Evaluation of debris flow removal protocol, mitigation methods and development of a field data sheet. Report No. CDOT-2006-16, Colorado Department of Transportation.
Singh, V. P., 1996. Hydrology of Disasters. (ed.)
Skermer, N. A., Rawlings, G. E. and Hurley, A. J., 2002. Debris flow defences at Aoraki Mount Cook Village, New Zealand. Quarterly Journal of Engineering Geology and Hydrogeology, 35, pp 19-24.
Summers, M., Hikuroa, D. and Gravely, D., 2009. Ground penetrating radar as an investigative tool: exploring human modified to natural environments. Frontiers Abroad 2008, Auckland University.
Tonkin & Taylor, 2005a. The Matata debris flows, preliminary infrastructure and planning options report. Report to Whakatane District Council.
Tonkin & Taylor, 2005b. Awatarariki debris fan, rehabilitation options. Report to Whakatane District Council.

34
Debris Flow Control System Awatarariki Stream, Matata Job no. 22674.802 WHAKATANE DISTRICT COUNCIL June 2009
Tonkin & Taylor, 2005c. Report for properties affected by the Awatarariki Stream debris flow, Clem Elliot Drive, Matata. Report to Earthquake Commission.
Tonkin & Taylor, 2006a. Matata Regeneration Works – Stage 1 Geotechnical Investigations. Letter report to Whakatane District Council dated 14 August 2006.
Tonkin & Taylor, 2006b. Proposed Matata debris and flood risk mitigation works – Geotechnical Investigation Report.
Tonkin & Taylor, 2008. Matata Regeneration Project, Awatarariki Stream debris detention. Report to Whakatane District Council dated August 2008.
Tonkin & Taylor, 2009. Debris flow numerical modelling, Awatarariki Stream. Report to Whakatane District Council dated April 2009.
VanDine, D. F., 1996. Debris flow control structures for forest engineering. Res. Br., B.C. Min. For., Victoria, B.C., Work. Pap. 08/1996.


Figure 1: View looking south showing the Awatarariki Stream and coastal area in the
immediate aftermath of the 2005 debris flow event
Figure 2: View looking north-east of the coastal area in the immediate aftermath of
the 2005 debris flow event. Awatarariki Stream can be seen on the lower right.

Figure 3: Early Pleistocene sediments exposed within former quarry workings
Figure 4: Frame from a video illustrating how flexible barriers are able to prevent the passage
of material with diameters much smaller than the available voids

Figure 5: View from stream level of the knoll located on left-hand side of the
Awatarariki Stream
Figure 6: View of the knoll from the former quarry site. This would be the location of any piled cable support structure required for the short cable option.

Figure 7: Recent small-scale instability within a cliff face located approximately 50m
upstream of the proposed right-hand anchor point. View looking upstream
Figure 8: View of the western abutment of the SH2-Rail Bridge showing the spill-through
soil abutment to be removed during excavation of the outlet channel required for Option 3. The traffic barriers would remain in place.

Figure 9: View of the multi-strand cable test anchor being installed
Figure 10: Multi-strand cable test anchor borehole being drilled


REPORT
Report prepared for:
WHAKATANE DISTRICT COUNCIL
Report prepared by:
TONKIN & TAYLOR LTD
Distribution:
WHAKATANE DISTRICT COUNCIL 2 copies
TONKIN & TAYLOR LTD (FILE) 1 copy
May 2009
T&T Ref: 22674.802
WHAKATANE DISTRICT COUNCIL Debris Flow Numerical Modelling Awatarariki Stream, Matata

Debris Flow Numerical Modelling Awatarariki Stream, Matata T&T Ref. 22674.802 Whakatane District Council May 2009
Table of contents
1 Introduction 1
2 Proposed Debris Detention Structure 2 2.1 General 2 2.2 Barrier Height 2 2.3 Spillway 2 2.4 Underpass 3 2.5 Fanhead Diversion Structures 3
3 Modelling Methodology 4 3.1 Basis of Model 4 3.2 Event Initiation 5 3.3 Grid Size 5 3.4 Digital Elevation Model 5
4 Model Calibration 6 4.1 Characteristics of the 2005 Event 6 4.2 Reproducing the 2005 event 6
4.2.1 Parametric Study 7 4.2.2 Parameter Selection 9
4.3 Event Configuration 10
5 Barrier and Spillway Modelling 11 5.1 General 11 5.2 Spillway Gradient 11 5.3 Model Limitations 12 5.4 Results of Barrier and Spillway Analyses 13
6 Additional Analyses 15 6.1 Through-Barrier Flow 15
6.1.1 Flow Height at the Barrier 15 6.1.2 Lower Awatarariki Stream Flow Rates 15
6.2 Non-Design Events 15
7 Retained Volumes 17
8 Fanhead Debris Flow Control 18
9 Conclusions and Recommendations 20
10 References 22
11 Applicability 23
Figures
Appendix A: Parametric Modelling Results
Appendix B: Event Configuration
Appendix C: Forward Analyses
Appendix D: Non-Design Events
Appendix E: Fanhead Flow and Deposition

Debris Flow Numerical Modelling Awatarariki Stream, Matata T&T Ref. 22674.802 WHAKATANE DISTRICT COUNCIL May 2009
Executive Summary
Whakatane District Council is proposing to construct a flexible “ring net” barrier within the Awatarariki Stream, as a means of preventing a debris flow event of a similar size to that which occurred in 2005 from again impacting the township of Matata.
State-of-the-art numerical modelling has been undertaken by Tonkin & Taylor in order to provide assurance that the proposed scheme will achieve the stated objectives of the WDC, as well as to provide information required for detailed design of the scheme. Modelling was undertaken using RAMMS (Rapid Mass Movement) a finite difference code developed by the Swiss Federal Institute, WSL.
The scheme achieves containment of approximately half of the 250,000m3 volume of the design event. The remaining material would be directed onto the coastal strip, and away from the town by means of a spillway and diversion bunds.
The modelling work consisted of two primary phases: calibration of the model with the 2005 event and analysis of the proposed barrier and spillway configuration. A large number of RAMMS analyses were undertaken as part of parametric and subsequent analyses.
Outputs from the analyses indicate that RAMMS is able to recreate the fundamental characteristics of the 2005 event, provided that suitable values are selected for the input parameters. RAMMS is however unable to fully recreate all aspects of the 2005 deposit within a single analysis. In particular, it cannot replicate the deposition of materials of different grain-size at different locations across the Awatarariki fan head.
Modelling results, and in particular peak flow heights, support a hypothesis that the 2005 event probably consisted of more than one flow. Flow velocities are less than expected but still within the range reported for debris flows.
Barrier and spillway modelling was undertaken using three debris flow types, four flow event configurations as well as two spillway elevations (RL21m and RL22m). The spillway designs included “shallow” and “steep” options. The latter is significantly less susceptible to blockage due to the deposition of coarse-grained material.
The proportion of the total flow volume assumed to pass through the barrier does not materially affect either the height of the debris at the barrier or the retained volume. Analyses indicate that the spillway does not become active until the debris flow volume reached approximately 70,000m3. This is tentatively correlated to the 100 year return period event.
Modelling indicates that the retained volume for the design 250,000m3 event is 98,000m3 i.e. 39% of the total. This corresponds more to the theoretical storage capacity of the spillway elevation (RL21m) than the elevation of the debris at the barrier (RL23.7m). The vast majority of the debris flow not retained by the barrier would be directed to the west of the town, with a smaller component flowing back east to the Awatarariki Stream.

Debris Flow Numerical Modelling Awatarariki Stream, Matata T&T Ref. 22674.802 Whakatane District Council May 2009
With the current fanhead bund design, thin flows go up over the top of the bund and onto adjacent private land. Complete containment of the flow by bunds would require the footprint of the bund to encroachment onto the adjacent private land.
It is recommended that:
The spillway should have an entrance elevation of RL21m. It should have a constant gradient of approximately 12o between crest and toe. The crest of barrier should be at RL25m. This would provide a freeboard during the design event of at least 1m Fanhead earth bunds topped by a small vertical structure (concrete or possible gabions) should be used to divert debris flow material that goes over the spillway from encroaching on private land. A shallow channel should be excavated in front of the bund to smooth out topographic irregularities

1
Debris Flow Numerical Modelling Awatarariki Stream, Matata T&T Ref. 22674.802 WHAKATANE DISTRICT COUNCIL May 2009
1 Introduction
On 18 May 2005, the township of Matata was impacted by several large debris flows triggered by intense rainfall within hills located behind the coastal town. The largest and most destructive of these debris flows were generated within the catchment of the Awatarariki Stream.
Whakatane District Council (WDC) is proposing to construct a debris detention structure (DDS) within the Awatarariki Stream as a means of preventing a debris flow event of a similar size to that which occurred in 2005 from again impacting Matata. As a result of a detailed options evaluation process in which Tonkin & Taylor (T&T) assessed a range of potential DDS, WDC has adopted a flexible “ring-net” barrier as its preferred option.
It is proposed to construct the flexible barrier within a narrow gorge located immediately upstream of the Matata escarpment. The barrier would be able retain in the order of 100,000m3 of material. Excluding the material that passes through the barrier during the initial phase of the event, all other debris in excess of the retained volume would be directed, via a spillway, to open ground west of Matata. Earthwork bunds constructed on the upper fanhead would direct this material away from the township.
A location and scheme layout plan is presented as Figure 1.
State-of-the-art numerical modelling has been undertaken by Tonkin & Taylor in order to:
Determine whether numerical modelling is a viable means of assessing the debris flows that can be expected in the future at Matata. Provide assurance that the proposed scheme will achieve the stated objectives of the WDC. Aid detailed design of the barrier and earthworks.
This report presents a detailed review of the debris flow numerical modelling undertaken for the Awatarariki Stream. Detailed engineering design is presented under separate cover.

2
Debris Flow Numerical Modelling Awatarariki Stream, Matata T&T Ref. 22674.802 Whakatane District Council May 2009
2 Proposed Debris Detention Structure
2.1 General The DDS proposed for the Awatarariki Stream consists of a flexible net-like structure formed from interlocking steel rings suspended from an overhead cable. Because of their open structure, flexible barriers allow the passage of normal flows and sediment transport.
It is estimated that the May 2005 debris flow event delivered some 250,000m3 of material onto the Awatarariki Stream fanhead (Tonkin & Taylor, 2008). It is WDC’s position that Matata should not be adversely affected to any significant extent should a debris flow similar in magnitude to the 2005 event occur in the future. It is this criterion, and not a specific event return period, that is governing the design of the DDS.
2.2 Barrier Height Full containment of a 250,000m3 event would, based on the estimated height-volume relationship for the lower stream valley (Figure 2), require a barrier crest elevation of approximately RL26 (assuming the passage of approximately 30,000m3 of finer-grained material through the barrier). Assuming a 1m freeboard, the barrier crest would be RL27m. This corresponds to a barrier some 16m in height.
The presence of a topographic low-point or saddle on the left-hand (western) abutment of the DDS location means however that once the retained debris levels exceed the maximum elevation of the saddle (approximately RL23m), debris flow material should be able to bypass the barrier system. Table 1 indicates that approximately 130,000m3 of debris could be impounded behind a barrier before excess material by-passes it via the saddle.
Unless the saddle is infilled, approximately half of the total mobilised debris flow volume could potentially pass over the saddle and encroach onto the coastal strip and the township. Furthermore, discussions with the barrier supplier Geobrugg have indicated that the most appropriate barrier height for the proposed location is 13m to 14m (i.e. RL24m to 25m).
Full containment is therefore not considered feasible without incurring significant construction effort and cost penalties. The discussions presented in this report therefore refer to a partial containment barrier system only.
2.3 Spillway The saddle is the site of a former gravel quarry. It is in effect, a box-cut with near vertical sides and a flat base. It is the elevation of this saddle which ultimately controls the volume of debris flow material that can be retained by the barrier.
The existing saddle is a slightly undulating terrace with a relatively steep northern face (Figure 3). Ensuring that the spillway has sufficient gradient to keep debris flow material moving during an event is an important consideration for the overall design of the barrier system. This is discussed in more detailed in Section 5.2.
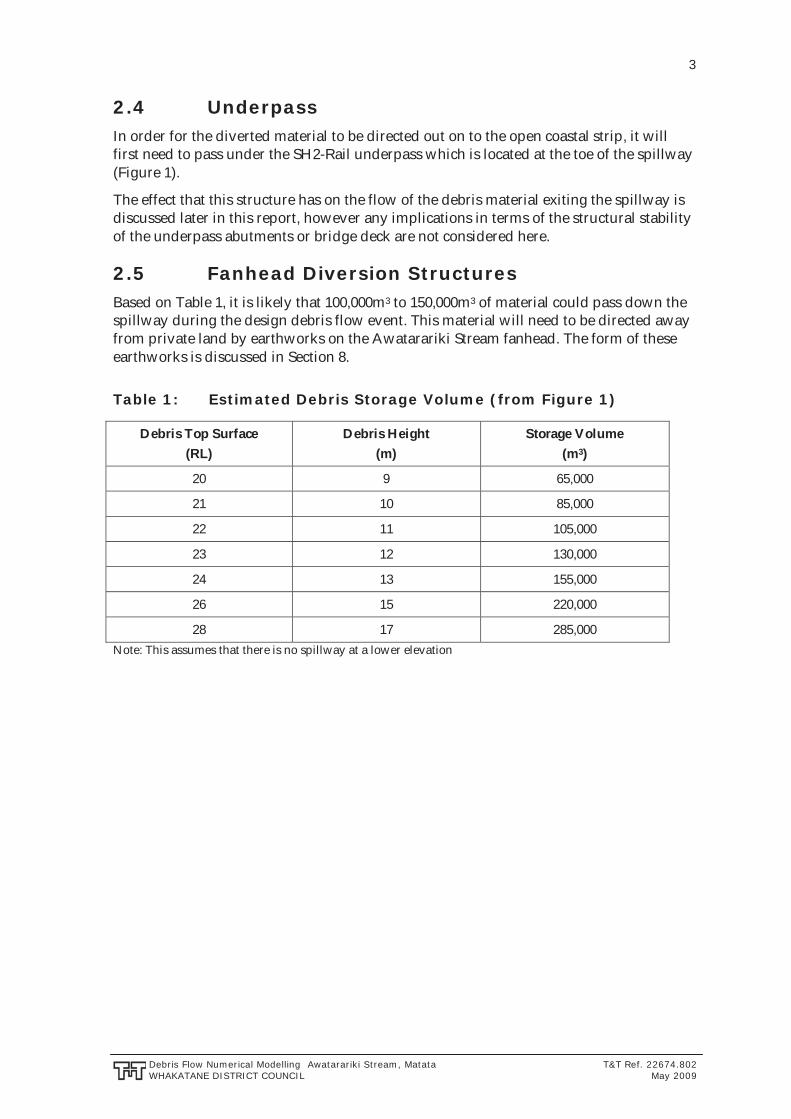
3
Debris Flow Numerical Modelling Awatarariki Stream, Matata T&T Ref. 22674.802 WHAKATANE DISTRICT COUNCIL May 2009
2.4 Underpass In order for the diverted material to be directed out on to the open coastal strip, it will first need to pass under the SH2-Rail underpass which is located at the toe of the spillway (Figure 1).
The effect that this structure has on the flow of the debris material exiting the spillway is discussed later in this report, however any implications in terms of the structural stability of the underpass abutments or bridge deck are not considered here.
2.5 Fanhead Diversion Structures Based on Table 1, it is likely that 100,000m3 to 150,000m3 of material could pass down the spillway during the design debris flow event. This material will need to be directed away from private land by earthworks on the Awatarariki Stream fanhead. The form of these earthworks is discussed in Section 8.
Table 1: Estimated Debris Storage Volume (from Figure 1)
Debris Top Surface (RL)
Debris Height (m)
Storage Volume (m3)
20 9 65,000
21 10 85,000
22 11 105,000
23 12 130,000
24 13 155,000
26 15 220,000
28 17 285,000 Note: This assumes that there is no spillway at a lower elevation

4
Debris Flow Numerical Modelling Awatarariki Stream, Matata T&T Ref. 22674.802 Whakatane District Council May 2009
3 Modelling Methodology
Debris flow numerical modelling has been undertaken using the numerical continuum code RAMMS (Rapid Mass Movement). RAMMS is state-of-the art software currently being developed by WSL, the Swiss Federal Institute for Forestry, Snow and Landscape Research. WSL is a recognised world leader in debris flow research.
3.1 Basis of Model RAMMS models debris flows as a three-dimensional, single-phase Voellmy-fluid whose bulk properties approximate those of the complex real-life flow. This is the equivalent fluid concept. The Voellmy-fluid model assumes a uniform velocity profile and no shear deformation.
The movement or deposition of a debris flow is governed by the balance between driving (gravitational) forces and flow resistance (frictional) forces. In a Voellmy-fluid, frictional resistance (i.e. the “friction slope” Sf) is the sum of a Coulomb-type basal friction (Rb) and internal turbulent flow resistance (Rt):
Sf = Rb + Rt
= (cos .tan ) + (v2/ h)
Where:
down slope angle of terrain (o)
basal friction angle (o), = tan
v = flow velocity(m/s)
viscous resistance factor (m/s2)
h = flow thickness (m)
The numerical solutions are performed in a time or step-wise manner in which the location of the debris flow is advanced incrementally. Such modelling is referred to as being dynamic.
Scheuner (2007) indicates that for natural debris flows, Mu ( , or tan ) varies from approximately 0.01 to 0.17, centred around a value of approximately 0.1 (Figure 4). Xi ( ) varies from approximately 50 to 300m/s2, centred around a value of approximately 100 m/s2.
Flow behaviour is also a function of the lateral pressure coefficient . This represents the longitudinal rigidity of the flow and is equivalent to an earth pressure coefficient. Whereas in a single phase fluid is always equal to 1.0, its equivalent in granular materials (k) varies widely, from 0.2 in the active (ka) case to 5.0 in the passive (kp) case.
Debris flows, being a two-phase fluid, potentially also have a very wide range in values. WSL indicated to the author that a value of 2.5 would be appropriate for the type of debris flows observed in Switzerland. These lambda values are within the theoretical range described by McDougall (2006).

5
Debris Flow Numerical Modelling Awatarariki Stream, Matata T&T Ref. 22674.802 WHAKATANE DISTRICT COUNCIL May 2009
3.2 Event Initiation In RAMMS, the debris flow is initially defined as a “release” area with a given uniform thickness. One or more release areas may be defined, however they are all initiated simultaneously. The potential impact of release area form and location on the resulting debris flow is discussed further in Section 4.2.1.1.
3.3 Grid Size RAMMS allows the user to select the size of the grid on which the calculations are undertaken. The use of a fine grid spacing coupled with a large mesh area can result in computational instability due to memory allocation problems. Numerous analyses indicated that 4m was the smallest grid size that could be used in conjunction with a calculation domain that included both the barrier-spillway area and the coastal strip.
A 4m grid was therefore adopted for the vast majority of analyses. Exclusion of the broader coastal area allowed critical barrier-spillway interactions to be analysed using a 2m grid.
3.4 Digital Elevation Model The digital elevation model (DEM) used to model both the 2005 event and the forward analyses were developed from a combination of LiDAR and published contour data. LiDAR data sets were available from surveys undertaken in 2000 and 2006. The 2000 LiDAR survey covered the coastal strip only, whereas the 2006 survey also included the lower reaches of the Awatarariki Stream.
Topographic data outside of the LiDAR surveys was limited to Land Information New Zealand (LINZ) topography maps. The contours on these plans are at 20m vertical intervals.
Because topographic information upstream of the Matata Escarpment was limited to the 20m contour plans, the 2006 LiDAR data was used in the lower reaches of the Awatarariki Stream for both the 2005 and current DEM. The 2005 DEM therefore incorporates some material deposited during the 2005 debris flow event. This material drapes the pre-event topography and is not considered extensive enough to adversely affect the outcomes of calibration modelling.
The distribution of LiDAR and contour data across the site is shown on Figure 5.
A DEM with a 2m grid was generated from these data using Global Mapper. LiDAR data were manually removed from bridge locations in order to model the debris flow moving beneath these structures.
The 2005 DEM used for calibration studies is presented as Figure 6.

6
Debris Flow Numerical Modelling Awatarariki Stream, Matata T&T Ref. 22674.802 Whakatane District Council May 2009
4 Model Calibration
The aim of model calibration is to reproduce, within the limitations of numerical modelling, the flow and depositional characteristics of the 2005 event. Success would verify the ability of RAMMS to model Matata-type debris flows as well as providing reliable estimates of design parameters for use in barrier and spillway design (i.e. forward analyses).
4.1 Characteristics of the 2005 Event The nature of the 2005 debris flow event and its deposits has been described in a number of previous reports (McSaveney et al, 2005; Tonkin & Taylor, 2005a,b,c; Tonkin & Taylor, 2006; Harris, 2008; Tonkin & Taylor, 2008). The salient points carried forward into the modelling are:
It is estimated by both Tonkin & Taylor and McSaveney (2007) that some 250,000m3 of debris material was deposited on the coastal strip (including the lagoons). The debris flow(s) was formed predominantly from sand and mud-sized materials, with a subordinate gravel and boulder component. The 2005 event is believed to be finer-grained than the majority of debris flows events observed internationally. The debris spread over a wide area of the coastal strip, although the coarser-grained component had a more limited spatial distribution. The debris distribution pattern is shown on Figure 7. Some valley infilling occurred upstream of the constriction in which the barrier is proposed to be constructed (Figure 8). The fanhead deposition occurred in at least two pulses. Eye-witness accounts indicate that the hiatus in deposition at Matata was related directly to the blocking and unblocking of the Awatarariki Stream rail bridge. It is not clear from the available information whether one, two or more debris flow fronts travelled down the Awatarariki Stream, however as multiple flows are a characteristic of debris flow events, it is considered likely that more than one flow did actually occur. Environment Bay of Plenty estimated a flow velocity of 4.7m/s for the debris flow at the time of peak discharge. This was based on superelevation measurements and assumed Mannings parameters. Post-event observations indicated that the debris flow(s) has a typical thickness of approximately 4m, increasing to between 6m and 9m on corners.
4.2 Reproducing the 2005 event The movement and depositional characteristics of the debris flows modelled by RAMMS depend ultimately on the values assigned to the following input parameters:
Location, shape and thickness of the initial release volume. Frictional parameters and . Internal pressure parameter . Flow density . The point of calculation termination.
Unlike the initiating landslide, neither a moving debris flow nor its deposits have clearly definable conditions (such as a factor of safety) that can be used to back analyse unique

7
Debris Flow Numerical Modelling Awatarariki Stream, Matata T&T Ref. 22674.802 WHAKATANE DISTRICT COUNCIL May 2009
values for these input parameters. In order to determine the combination of parameters best able to replicate the 2005 event, as well identifying those parameters that have the greatest impact on debris flow behaviour, 32 separate RAMMS models were generated as part of a parametric study.
4.2.1 Parametric Study
The matrix of variables used in the parametric analyses is presented in Table 2. All modelling was undertaken on the pre-2005 event topography using a release volume that resulted in approximately 250, 000m3 being deposited on the fanhead. The results are discussed below.
Table 2: Parametric Modelling Input Parameters
Variant Values
(m/s2)
(kg/m3)
t
(sec)
Mu 0.01, 0.05, 0.1, 0.15, 0.2, 0.5 100 1.75 1800 3000
Xi 10, 50, 100, 200, 300, 500 0.1 1.75 1800 3000
Lambda 1.0, 1.5, 1.75, 2.0, 2.5, 5.0 0.1 100 1800 3000
Density 1000, 1500, 1800, 2000 0.1 100 1.75 3000
Time 500, 1000, 2000, 3000, 4000, 5000
0.1 100 1.75 1800
4.2.1.1 Release Area – Shape and Thickness
Four release area configurations were modelled, each consisting of a single polygon with a uniform material thickness. Although the location and shape of the four release areas are significantly different, the resulting flows are almost identical (Table A1, Appendix A).
These analyses demonstrate that the configuration of the initiating avalanche or landslide has no meaningful impact on the downstream form of the debris flow, provided that the release area is not located immediately adjacent to the area of analytical interest.
4.2.1.2 Frictional Parameters
A total of 12 models were run: six for the basal friction parameter and six for the turbulent frictional parameter . The values used in the analyses (Table 2) cover the range expected for a range of debris flow types (Scheuner, 2007).
The results of the modelling for and are presented in Tables A2 and A3 respectively. The parametric modelling indicated that:
Debris flow movement and depositional characteristics are sensitive to changes in the value of the basal friction parameter , but are largely unresponsive to variations in the turbulent flow parameter .

8
Debris Flow Numerical Modelling Awatarariki Stream, Matata T&T Ref. 22674.802 Whakatane District Council May 2009
A low of 0.01 results in a debris flow with highly fluid, water-like characteristics. Increasing results in a less-pronounced spread of material on the fanhead, as well as increased deposition upstream of the escarpment; and Values of greater than about 0.15 tend to result in significant in-stream deposition and a more limited fanhead distribution.
4.2.1.3 Pressure Parameter Lambda
Lambda ( ), the “earth” pressure parameter, defines whether a debris flow displays flow characteristics closer to that of water (low values) or soil (high values). It represents the ability of a debris flow to sustain internal shear stresses and resist internal strain i.e. an internal strength. Lambda effectively controls the ability of a flow to spread.
The six parametric models show that as increases (i.e. as the flow becomes less water-like) the resultant deposits are spatially more extensive on the fanhead (Table A4). This apparently paradoxical result indicates that the higher pressure flows tend to “push” adjacent material away, creating a broader, thinner flow. A highly fluid material on the other hand tends to “coalesce” into a less extensive but thicker flow (at least for a given time step). When considering the likely range of values for a soil-water mixture ( = 1.5 to 2.5) the resultant flows are however, not greatly different.
The influence of on debris flow behaviour is of greater significance when considering the interaction between the flexible barrier and the spillway. This is discussed in detailed in Section 5. 4.
4.2.1.4 Flow Density
Measurements of natural debris flows indicate that density ( ) ranges from about 1600 kg/m3 for flows described as watery through to 2000 to 2100 kg/m3 for granular flows (Wendeler et al, 2008). The parametric studies show that the selected density value does not affect the modelling results to any identifiable degree (Table A5).
4.2.1.5 Calculation Termination
Termination of the modelling routine occurs either by reaching a predetermined calculation step (time) limit or by a user-defined percentage of the total mass reaching a particular minimum velocity or flow height. All analyses were undertaken so that calculation termination was determined only calculation time. In the case of the parametric studies, all analyses were terminated at 3,000 seconds. At this point, very limited flow was still evident.
The results of the parametric modelling for time are presented in Table A6.
4.2.1.6 Discussion
Graphical outputs from the parametric studies indicate that RAMMS is able to recreate the fundamental characteristics of the 2005 event, provided that suitable values of and are selected. Interrogation of the RAMMS output further indicates that:
and are the two variables that most significantly affect debris flow movement and depositional characteristics; and Variations in and do not materially affect the results of modelling.

9
Debris Flow Numerical Modelling Awatarariki Stream, Matata T&T Ref. 22674.802 WHAKATANE DISTRICT COUNCIL May 2009
As RAMMS uses a single-phase fluid model, it is unable to fully recreate all aspects of the 2005 deposit within a single analysis. In particular, the models to not replicate the deposition of boulders and cobbles on the upper fan head or the very distal movement of the fine-grained suspended sediment. Adjusting the model to show either of these characteristics simply results in a less accurate overall model.
4.2.2 Parameter Selection
Using the output of the parametric studies, it has been possible to identify a range of potential values for each of the RAMMS input parameters. These are presented in Table 3. These parameters are not independent: more fluid flows will have lower values for each of these parameters, whereas more granular flows would have correspondingly higher values.
Table 3: Assessed Parameter Ranges
Parameter Symbol (unit) Range
Basal friction (-) 0.05 to 0.1
Turbulent friction (m/s2) 50 to 500
Internal pressure (-) 1.75 to 2.50
Density (kg/m3) 1,000 to 2200
Having considered the results of the parametric studies, the best-estimate parameters for the 2005 event are considered to be as follows:
= 1700 kg/m3; = 0.05; = 100 m/s2 and = 1.75
In order to ensure that forward analyses adequately account for potential variations in these parameters, the best-estimate parameters have been bracketed by flows whose properties are either more fluid or more granular. These sets of flow parameters are referred to as Cases 1, 2 and 3 and are defined as follows:
Case 1 (highly fluid flow/water): = 1000 kg/m3; = 0.01; = 100 m/s2; = 1.00
Case 2 (best estimate parameters): = 1700 kg/m3; = 0.05; = 100 m/s2; = 1.75
Case 3 (more granular flow): = 2000 kg/m3; = 0.10; = 100 m/s2; = 2.50
The friction parameters and vary between the three cases on the coastal strip only. Within the confined section of the Awatarariki Stream (i.e. upstream of the Matata Escarpment) a single set of frictional parameters ( = 0.05; = 100) was used to maintain a highly fluid, minimal-deposition flow environment (see Section 4.2.1.2).
Graphical output for the three flow cases, as they simulate the 2005 event, is presented in Table A8. It is clear from these analyses that a water-like flow (Case 1) does not replicate the depositional pattern of the 2005 event, other than for the more distal fraction. The flow and depositional patterns of Cases 2 and 3 are generally quite similar, however it is the former which is considered to best replicate the 2005 event.

10
Debris Flow Numerical Modelling Awatarariki Stream, Matata T&T Ref. 22674.802 Whakatane District Council May 2009
4.3 Event Configuration The parametric analyses were undertaken using a single uniform debris flow. In order to assess whether the occurrence of more than one flow during the 2005 event could affect the back-analysed parameter values, analyses were undertaken for the following event configuration scenarios:
An initial small flow (representing 33% of the total event volume) followed by a second larger flow (representing the remaining 67%). Two flows, each consisting of half the total flow volume. An initial large flow (67%) followed by a second smaller flow (33%).
All models were run using best-estimate (Case 2) parameters and a release volume of approximately 268,000m3. The latter was found to result in a fanhead deposition volume of approximately 250,000m3 i.e. the design event.
Graphical outputs from the analyses are presented in Appendix B for flow Case 1 (Table B1), Case 2 (Table B2) and Case 3 (Table B3).
The results indicate that neither the thickness nor distribution of the final deposits are affected materially by whether the event is modelled as a single or double flow event. The first flows do however tend to exhibit a greater variation in deposit thickness as a result of the underlying topographic irregularities.
The primary difference between a single or two flow event is the peak height that the flow can reach within the constricted section of the stream. The RAMMS modelling indicates peak flow thicknesses in the lower reaches of the Awatarariki Stream at 5m to 6m in the straight section and 10m to 12m on corners. This is approximately 50% greater than indicated by field observations. The RAMMS model also indicates the ramping up of material near the saddle, however this is known not to have occurred.
Assuming that the 2005 event occurred as two flows of equal volume, the flow depths for the straight and corner sections of the stream are 4m and 8m respectively. This agrees with flow depth measurements taken from the sides of the Awatarariki Stream in 2005. The modelling therefore supports the hypothesis that the 2005 event probably consisted of more than one flow.
RAMMS indicates flow front velocities for the two-flow event of 3.0 to 3.5m/s.

11
Debris Flow Numerical Modelling Awatarariki Stream, Matata T&T Ref. 22674.802 WHAKATANE DISTRICT COUNCIL May 2009
5 Barrier and Spillway Modelling
5.1 General Identification of the most appropriate barrier and spillway configuration requires an assessment of a number of variables, including, the elevation of the barrier crest, the elevation of the spillway entrance and the gradient of the spillway.
Barrier and spillway modelling was undertaken using three debris flow types (Cases 1, 2 and 3), one single-flow and three two-flow event configurations as well as two spillway elevations (RL21m and RL22m).
The complete matrix of 24 analyses is shown in Table 4. For reasons of consistency, all analyses have been undertaken assuming no loss of the release material through the barrier. The potential impact that this assumption could have on the results of the barrier design is discussed in Section 6.1.
The accuracy of the analyses was increased by using a 2m grid in the RAMMS models. This was accommodated computationally by eliminating the coastal strip from the calculation domain.
Four different DEM’s were used during the assessment of spillway and fanhead diversion structures. The DEM adopted for the final series of analyses reported here is presented as Figure 9.
Table 4: Forward Modelling Matrix
Spillway Elevation
Flow Properties
Number of Flows
Single 1/3 + 2/3 1/2 + 1/2 2/3 + 1/3
RL21m Case 1 1a 1b 1c 1d
Case 2 2a 2b 2c 2d
Case 3 3a 3b 3c 3d
RL22m Case 1 4a 4b 4c 4d
Case 2 5a 5b 5c 5d
Case 3 6a 6b 6c 6d
5.2 Spillway Gradient The existing saddle is near horizontal, with a moderately steep face extending down to SH2 (Figure 3). Utilisation of this area as a spillway would require, as a minimum, preparation of a smooth surface between the spillway entrance and the steep northern face. With a horizontal distance of approximately 50m between these two points, there is potential for debris flow material to slow down sufficiently for deposition to occur. Partial or complete blockage of the spillway could conceivably result in redirection of the flow back towards the barrier, potentially resulting in overtopping.
Observations made of debris flow events indicate that deposition tends to occur upstream of channel constrictions and on channel gradients less than about 6o (McSaveney et al, 2005). Although the vast majority of the May 2005 debris flow was able to traverse the

12
Debris Flow Numerical Modelling Awatarariki Stream, Matata T&T Ref. 22674.802 Whakatane District Council May 2009
gentle gradient (1o and 2o) of the lower Awatarariki Stream, field observations indicate that deposition still occurred. Aerial photographs of the valley (Figure 8) clearly show the deposition of debris upstream of the constriction near the stream’s exit out of the escarpment.
Two spillway designs have been used in the RAMMS modelling: a “shallow” spillway that retains the general morphology of the current saddle and a “steep” spillway with a constant gradient of approximately 12o between crest and toe (Figure 3).
Using a single flow model, it was found that the two spillway designs generated very different flow velocities near the spillway entrance (Figure 10). The flow velocity for the shallow spillway entrance typically peaked at 1.5 to 2.5 m/s, whereas the peak velocity for the steeper spillway was in the order of 4.5 to 5.5m/s.
Hjulstrom diagrams indicate that transportation of coarse gravels and boulders within a water flow requires a minimum flow velocity of approximately 2m/s. Debris flows however are able to transport coarse-grained particulate material at lower velocities on account of their greater density and viscosity.
Although it is possible that the shallow spillway could maintain sufficient flow velocities to prevent significant deposition from occurring, its gentle gradient and constricted nature does suggest that deposition could occur as flow velocities come off their peak values.
Spillway deposition is most likely to affect a multi-phase event, with the elevation of the spillway surface being raised as a result of deposition during the late stages of the first flow. If the subsequent flow is unable to remobilise this deposited material, the subsequent activation of the spillway may be delayed, possibly resulting in overtopping of the barrier.
5.3 Model Limitations The modelling of a flexible ring net barrier using RAMMS has a number of limitations, including:
RAMMS models the flexible barrier as a solid dam. As no debris material passes through the barrier, analyses need to be undertaken with correspondingly smaller release volumes. Generation of the DEM requires a barrier significantly wider than what would actually be constructed. In the analyses discussed in this report, the flexible barrier has been modelled as a 10m wide structure. As it is only the front face of the barrier that is of significance to the modelling, this additional width has no effect on the modelling results. The generation of the DEM results in a barrier with a front face that dips upstream. Debris striking this face at speed can flow up and over the crest of the barrier, even though the top of the debris flow is lower than the crest of the barrier. These small flows are erroneous and do not represent the actual way in which flexible barriers get overtopped. In the latter stages of an analysis, drainage from the spillway can generate an elevation differential between material in the spillway and at the barrier. This can result in an apparent flow from the barrier back towards the spillway.

13
Debris Flow Numerical Modelling Awatarariki Stream, Matata T&T Ref. 22674.802 WHAKATANE DISTRICT COUNCIL May 2009
RAMMS is unable to replicate the fanhead depositional patterns where the coarse-grained and fine-grained fractions of entrained material are deposited in different areas.
The most significant of these limitations is considered to be the movement of impounded debris from the barrier back towards the spillway as debris flow levels drop in the latter. This effect reflects the highly fluid nature of the debris flow within the confined channel of the Awatarariki Stream.
Whilst such a response would be expected for water (Case 1), it is not considered valid for a debris flow, as any material that reached the flexible barrier would either be deposited there or pass through. Because of this effect, the barrier and spillway performance was assessed using peak rather than final flow heights.
5.4 Results of Barrier and Spillway Analyses Interrogation of the RAMMS output files has enabled the flow characteristics of the barrier and spillway to be assessed in detailed (Table C1, Appendix C). The following key observations have been made:
The spillway commences to work at different flow heights depending upon the density of the flow (Figure 11). The less fluid the flow, the greater is this elevation difference. This reflects the different values adopted for the internal pressure parameter Material continues to build up at the barrier despite the spillway coming into operation. The maximum height of debris at the barrier is approximately equal to the elevation of the peak flow within the spillway. The more fluid a debris flow is, the greater the peak material height at the barrier. This makes Case 2 the most critical in terms of design (ignoring Case 1, which is a water-only model). The presence of debris flow material at the barrier encourages the following material to pass directly over the spillway, even though the former may be at a slightly lower elevation. A two flow event results in marginally higher debris elevations at the barrier compared to a single flow. The greatest barrier debris heights (RL23.5 to RL24m) occur when a small (33%) flow is followed by a large (67%) flow. This is therefore the critical flow configuration when considering the potential for barrier overtopping; and In the design two-flow case, the velocity of the flow is approximately 1.7m/s to 2.2m/s prior to impacting the barrier. A single 250,000m3 flow event has a velocity of approximately 2.5 to 3.0m/s.
The modelling has identified the critical design case as a flow with Case 2 physical properties, occurring as a two flow event (small then large flow). The difference between this and a comparable single flow event is however minor.
The flow velocity predictions generate by RAMMS are significantly less than those reported in the literature:
Wendeler et al (2008) measured the velocity of six debris flow events at Illgraben, Switzerland in 2006. The velocities varied from 1.7 to 4.8m/s, with an average of 3.3m/s.

14
Debris Flow Numerical Modelling Awatarariki Stream, Matata T&T Ref. 22674.802 Whakatane District Council May 2009
Naef et al (2006) present flow trajectory data for the 1976 Kamikamihori Valley (Japan) debris flow event. This indicates flow velocities in the lower reaches of approximately 3 to 4m/s Prochaska et al (2008) indicate flow velocities of between 4 and 8m/s for three debris flows in the USA; Arattanoo and Marchi (2005) report flow velocities of approximately 5m/s and 7m/s for two events in the Moscardo Torrent, Italy.
The very gentle gradient of the Awatarariki Stream would be expected to result in flow velocities that are lower than observed in steeper alpine torrents. However, the flow velocities predicted by RAMMS are somewhat less than expected and therefore should not be used directly in structural design of the barrier without further justification.

15
Debris Flow Numerical Modelling Awatarariki Stream, Matata T&T Ref. 22674.802 WHAKATANE DISTRICT COUNCIL May 2009
6 Additional Analyses
6.1 Through-Barrier Flow The rings of the flexible barrier will pass a certain proportion of a debris flow, particularly at the start of the event when material is still directly striking the rings. The proportion of the total flow that would pass through a barrier is unknown, however it is considered unlikely to exceed 20% of the total flow volume. The amount of material that could pass through the barrier is expected to reduce significantly as the material builds up behind it.
As a means of assessing whether this through-barrier flow could significantly impact the Awatarariki Stream below the barrier location or alter the observations made in Section 5, additional analyses were undertaken. These are discussed below
6.1.1 Flow Height at the Barrier
Output from RAMMS (Figure 12) indicates that the peak elevation of debris at the barrier is RL23.5m for both analyses. If it is conservatively assumed that no material passes through the barrier, then the peak debris elevation at the barrier is slightly higher, at RL24m i.e. the crest of the barrier.
The loss of material through the barrier does not materially affect either the height of the debris at the barrier or the retained volume. It would however increase the time required for the spillway to commence operation as well as reducing the volume of material discharged over the spillway.
6.1.2 Lower Awatarariki Stream Flow Rates
Analyses were run with flow volumes corresponding to 10% and 20% of the design event (i.e. 25,000m3 and 50,000m3 respectively). This was undertaken on a DEM with the barrier removed as a means of assessing the order of magnitude of the peak flow rate that could occur as a result of significant volumes of material passing through the barrier.
Data on peak flow heights and velocities extracted from the RAMMS output files indicate that the peak through-barrier discharge rates (downstream of the Awatarariki rail bridge) are less than the 66 m3/s that has been used for the design of proposed stream modification works (Table 5).
Table 5: Estimated Peak Discharge Rates
Volume (m3)
Proportion of Total Event
(%)
Typical Peak Flow Velocity
(m/s)
Typical Peak Flow Height
(m)
Peak Flow Rate (m3/s)
25,000 10 0.8 1.0 20 50,000 20 1.2 1.5 45
6.2 Non-Design Events A series of analyses were undertaken to assess the performance of the proposed barrier and spillway during a debris flow events of different magnitude to that adopted for design. These events were:

16
Debris Flow Numerical Modelling Awatarariki Stream, Matata T&T Ref. 22674.802 Whakatane District Council May 2009
20,000m3 40,000m3 75,000m3 500,000m3
The smaller-than-design events correspond approximately to return periods of 50, 75 and 100 years respectively, based on the tentative Event-Frequency relationship presented in Tonkin & Taylor (2008). The 500,000m3 flow is considered to be an extreme event with an unknown return period.
In all cases, the release volume was reduced by 10% in order to simulate the loss of material through the open structure of the barrier.
Graphical outputs from these analyses are presented in Table D1, Appendix D. The analyses indicate that:
The spillway is not activated during either the 20,000m3 and 40,000m3 events. Less than 15% of the 75,000m3 flow (tentatively correlated to the 100 year return period event) discharges down the spillway. This material is contained entirely by the proposed fanhead bund system The extreme (500,000m3) event results in debris inundating most of the fanhead to a depth of 1.5m to 2.5m.
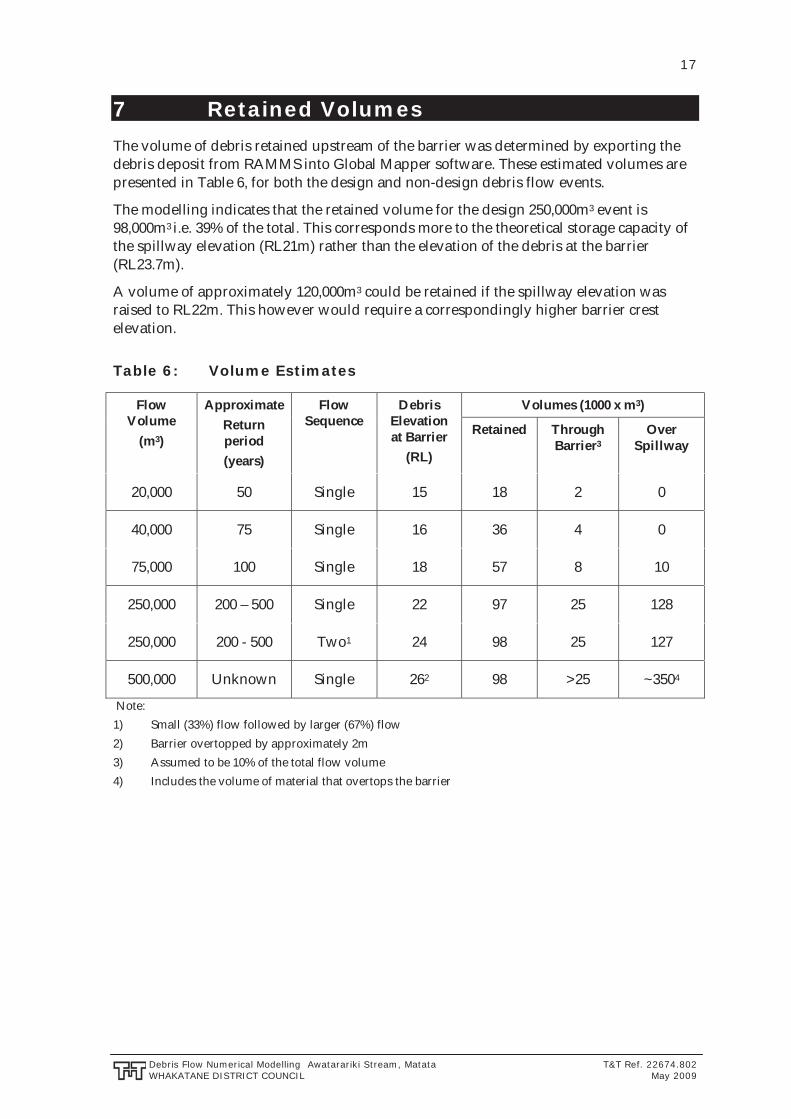
17
Debris Flow Numerical Modelling Awatarariki Stream, Matata T&T Ref. 22674.802 WHAKATANE DISTRICT COUNCIL May 2009
7 Retained Volumes
The volume of debris retained upstream of the barrier was determined by exporting the debris deposit from RAMMS into Global Mapper software. These estimated volumes are presented in Table 6, for both the design and non-design debris flow events.
The modelling indicates that the retained volume for the design 250,000m3 event is 98,000m3 i.e. 39% of the total. This corresponds more to the theoretical storage capacity of the spillway elevation (RL21m) rather than the elevation of the debris at the barrier (RL23.7m).
A volume of approximately 120,000m3 could be retained if the spillway elevation was raised to RL22m. This however would require a correspondingly higher barrier crest elevation.
Table 6: Volume Estimates
Flow Volume
(m3)
Approximate Return period (years)
Flow Sequence
Debris Elevation at Barrier
(RL)
Volumes (1000 x m3)
Retained Through Barrier3
Over Spillway
20,000 50 Single 15 18 2 0
40,000 75 Single 16 36 4 0
75,000 100 Single 18 57 8 10
250,000 200 – 500 Single 22 97 25 128
250,000 200 - 500 Two1 24 98 25 127
500,000 Unknown Single 262 98 >25 ~3504
Note: 1) Small (33%) flow followed by larger (67%) flow 2) Barrier overtopped by approximately 2m 3) Assumed to be 10% of the total flow volume 4) Includes the volume of material that overtops the barrier

18
Debris Flow Numerical Modelling Awatarariki Stream, Matata T&T Ref. 22674.802 Whakatane District Council May 2009
8 Fanhead Debris Flow Control
It is intended that any debris flow material that passes over the spillway will go through the State Highway underpass and be deposited on the fanhead. In order to protect private land from being inundated with this material, it is proposed to construct a berm immediately to the north of the State Highway. A shallow channel would be constructed in front of the berm, primarily to remove topographic irregularities, but also as to promote flow towards the west.
A number of diversion berm and channel configurations have been assessed as part of this study. Although hydraulic efficiency is an important aspect to consider when designing debris flow control structures, ultimately, it has been land ownership issues that have governed the location of the diversion bunds.
The general location of the proposed berm and channel is shown on Figure 13.
The aim of the proposed bund and channel system is to:
Divert as much of the debris flow material exiting the spillway, towards the west; Prevent debris from entering properties north of SH2; Divert any debris flowing east along SH2 back into the Awatarariki Stream.
A series of analyses were undertaken using bunds of varying heights and slope angles. It was found that the carrying capacity of the channel directing material towards the west was significantly reduced with relatively minor increases in crest height. Because of this, the berm has been designed with a relatively steep front face (1.5H:1.0V).
Analyses showed that the bulk of the debris flow could be diverted by this bund and channel system provided that the central section has a height above existing ground level of 4m. Excavation of the channel in front of the berm gives an overall height for the front face of 5.5m. Reducing flow thicknesses allow the bund height to reduce marginally to both the east and west. East of Kaokaoroa Street, the berm reduces in height from 3m to 2m as it approaches the Awatarariki Stream.
Graphic output from a single, Case 2 debris flow is presented in Table E1, Appendix E. It has been assumed that 10% of the total flow volume passes through the barrier. Plans showing the maximum flow heights and flow velocities are presented as Figures 14 and 15 respectively.
Interrogation of the output files indicates that:
The peak flow height beneath the State Highway overpass is 4.5m or less. This represents a minimum clearance beneath the overpass of approximately 0.9m; The majority of the debris flow material is directed to the west, however some flow also occurs towards the east along State Highway 2. This flow eventually reaches the Awatarariki Stream; The flow towards the west has a peak depth of approximately 5m. This occurs between the spillway and the directly opposing bund. The top of this flow is approximately 0.5m below the top of the adjacent bund; The flow thins towards the east, reducing to approximately 1m in the vicinity of the Awatarariki Stream; A relatively thin (0.25 to 0.6m) flow occurs up and over the bund as a result of flow momentum/superelevation; and

19
Debris Flow Numerical Modelling Awatarariki Stream, Matata T&T Ref. 22674.802 WHAKATANE DISTRICT COUNCIL May 2009
The velocity of the flow within the immediate vicinity of the bridge abutments is approximately 3m/s
Preventing overtopping of the bund by the thin superelevation flows would be best achieved by the placement of a small (minimum 1m) vertical wall on the crest of the bund. Simply increasing the bund crest height would be less desirable as it:
Significantly increases the footprint of the berm; Significantly reduces the carrying capacity of the channel (and therefore requiring a further increase in bund height; Requires a higher crest elevation than the vertical wall option, as the later is able to turn back the thin flow.
Details of the proposed diversion structures are presented under separate cover.

20
Debris Flow Numerical Modelling Awatarariki Stream, Matata T&T Ref. 22674.802 Whakatane District Council May 2009
9 Conclusions and Recommendations
Numerical debris flow modelling has been undertaken to assess the effectiveness of a flexible barrier and spillway system in controlling future debris flow events within the Awatarariki Stream. Modelling was undertaken using RAMMS (Rapid Mass Movement), a state-of-the-art code developed by the Swiss Federal Institute WSL.
Following the completion of an extensive series of analyses, the following conclusions have been reached:
RAMMS is a valid means of assessing the movement and depositional patterns of debris flows, provided that the limitations and simplifications implicit in the methodology are taken into account when interpreting the results. Calibration of the 2005 event has allowed appropriate values for the RAMMS input parameters to be determined. The best-estimate parameters have been designated as Case 2. All forward analyses were undertaken with best-estimate parameters, bracketed by more fluid (Case 1) and more granular (Case 3) variants. The peak height of the debris flow at the barrier is controlled by the elevation of the spillway and the thickness of the debris flowing over it. The greatest debris flow height at the barrier occurs when a relatively small debris flow is followed by a larger one, rather than a single flow event, although the differences are relatively minor. For the critical design case (Case 2), the peak debris height at the barrier is approximately RL23.5m to RL24m for a spillway elevation of RL21m. The velocity of debris passing over a shallow-angled spillway is significantly less than for one with a steeper gradient. There is a risk that the shallow spillway option could become non-operational during an event due to deposition of a levee. The velocity of the flow is between 2 to 3m/s. It is considered likely that RAMMS has underestimated the velocity of the flow within the Awatarariki Stream The peak flow capacity of material passing through the flexible barrier is estimated to be less than the design capacity of the modified Awatarariki Stream below the rail bridge. The storage volume is controlled by the elevation of the spillway rather than the elevation of the barrier crest. The storage volume for a spillway at RL21m is approximately 98,000m3. The storage volume for an RL22m spillway is estimated to be 120,000m3. The excess flow material directed over the spillway can be prevented from inundating private land during the design event provided that appropriate diversion bunds are constructed immediately north of the State Highway. Limitations to the modelling of flexible barrier systems with RAMMS include:
The need to model the barrier as dam with an upstream sloping front face (as a by-product of the Digital Elevation Model generation. An inability to show the differential deposition of the entrained material. An inability to model a proportion of the debris flow passing through the open rings of the barrier.

21
Debris Flow Numerical Modelling Awatarariki Stream, Matata T&T Ref. 22674.802 WHAKATANE DISTRICT COUNCIL May 2009
A tendency for debris that has accumulated behind the net to drain back “upstream” (although it is actually flowing from a higher point to a lower point) as flow levels within the spillway drop. This is because the Voellmy rheology does not permit the dewatering and deposition of debris as is seen in nature.
Based on these findings, we recommend the following:
The spillway should have an entrance elevation of RL21m. It should have a constant gradient of approximately 12o between crest and toe. The crest of barrier should be at RL25m. This would provide a freeboard during the design event of at least 1m Fanhead earth bunds topped by a small vertical structure (concrete or possible gabions) should be used to divert debris flow material that goes over the spillway from encroaching on private land. A shallow channel should be excavated in front of the bund to smooth out topographic irregularities

22
Debris Flow Numerical Modelling Awatarariki Stream, Matata T&T Ref. 22674.802 Whakatane District Council May 2009
10 References
Arattano, M. and Marchi, L., 2005. Measurements of debris flow velocity through cross-correlation of instrumentation data. Natural Hazards and Earth System Sciences, Vol 5, pp 137-142.
Harris, N. I., 2008. Evidence to the Environment Court of New Zealand.
McDougall, S., 2006. A new continuum dynamic model for the analysis of extremely rapid landslide motion across complex 3D terrain. PhD thesis, University of British Columbia.
McSaveney, M. J., Beetham, R. D. and Leonard, G. S., 2005. The 18 May 2005 debris flow disaster at Matata: causes and mitigation suggestions. Institute of Geological and Nuclear Sciences. Report to Whakatane District Council.
McSaveney, M. J, 2007. Matata debris: Awatarariki Volume. Email to Tonkin & Taylor dated 29 March.
Nakatani, K., Wada, T., Satofuka, Y. and Mizuyama, T., 2008. Development of “Kanako”, a wide use 1-D and 2-D debris flow simulator equipped with GUI. In, Monitoring Simulation, Prevention and Remediation of Dense and Debris Flows II. WIT Transactions on Engineering Science, Ed. De Wrachien, D., Bebbla, C.A. and Lenzi, M.A., Volume 60 pp49-58.
Naef, D., Rickenmann, D., Rutschmann, P. and McArdell, B.W., 2006. Comparison of flow resistance relations for debris flows using a one-dimensional finite element simulation mode. Natural Hazards Earth Syst. Sci., 6, pp 155-165.
Prochaska, A. B., Santi, P. M., Higgins. J.D. and Cannon, S. H., 2008. A study of methods to estimate debris flow velocity. Landslides, Vol. 5 pp 431-444.
Scheuner, T., 2007. Modellierung von Murgangereingnissen mit RAMMS and Vergleich durch GIS-basiertes Fliessmodell.
Tonkin & Taylor, 2005a. The Matata debris flows, preliminary infrastructure and planning options report. Report to Whakatane District Council.
Tonkin & Taylor, 2005b. Awatarariki debris fan, rehabilitation options. Report to Whakatane District Council.
Tonkin & Taylor, 2005c. Report for properties affected by the Awatarariki Stream debris flow, Clem Elliot Drive, Matata. Report to Earthquake Commission.
Tonkin & Taylor, 2006. Proposed Matata debris and flood risk mitigation works – Geotechnical Investigation Report.
Tonkin & Taylor, 2008. Matata Regeneration Project, Awatarariki Stream debris detention. Report to Whakatane District Council dated August 2008.
Wendeler, C., McArdell, B.W., Volkwein, A., Denk, M. and Groner, E. Debris flow mitigation with flexible ring net barriers – field tests and case studies. In: Monitoring, Simulation, Prevention and Remediation of Debris and Debris Flows II. WIT Transactions on Engineering Sciences Volume 60. Ed. De Wrachien, D., Bebbla, C.A., and Lenzi, M.A., pp23-31.


Figures


Fi
gure
2:
Stor
age
Vol
ume
vs. D
ebris
Ele
vatio
n
Prop
osed
DD
S Lo
catio
n


Fi
gure
4:
Estim
ates
of F
rict
iona
l Par
amet
ers
Mu
and
Xi (S
cheu
ner,
2007
)
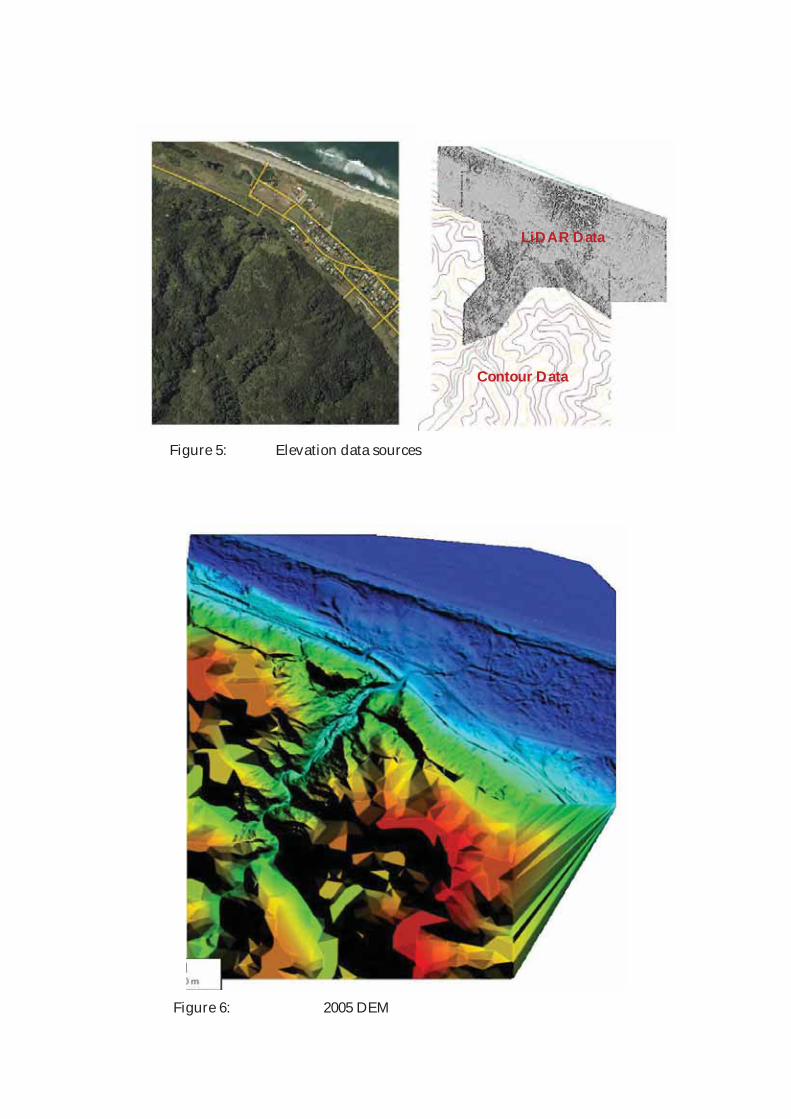
Figure 5: Elevation data sources
Figure 6: 2005 DEM
LiDAR Data
Contour Data


Bef
ore
Afte
r Fi
gure
8:
Aw
atar
arik
i Str
eam
bef
ore
and
afte
r the
200
5 de
bris
flow
eve
nt

Figure 9: DEM used for forward analyses
Steep Spillway Shallow Spillway
Figure 10: Spillway Debris Flow Velocities

Figure 11: Debris elevation at the flexible barrier during the modelling process
17
18
19
20
21
22
23
24
25
0 1 2 3 4
RL (m
)
Spillway RL21 Case 1 Spillway RL21m Case 2 Spillway RL21m Case 3
Spillway RL22m Case 1 Spillway RL22 Case 2 Spillway RL22 Case 3
Event
Event Description
1) Flow elevation at barrier when spillway flow commences 2) Peak flow elevation at barrier 3) Final flow elevation at barrier
Erroneous back-flow

No
Deb
ris
Pass
ing
Thro
ugh
Barr
ier
10
% P
assi
ng T
hrou
gh B
arri
er
20
% P
assi
ng T
hrou
gh B
arri
er
Fi
rst F
low
Fi
rst F
low
Fi
rst F
low
Se
cond
Flo
w
Seco
nd F
low
Se
cond
Flo
w
Figu
re 1
2:
Deb
ris
heig
ht a
t the
bar
rier
loca
tion
for v
ario
us th
roug
h-ba
rrie
r flo
w v
olum
es (C
ase
2)
Not
e th
at th
e se
cond
flow
s in
dica
te m
ovem
ent o
f mat
eria
l aw
ay fr
om th
e ba
rrie
r to
the
spill
way
as
the
elev
atio
n of
deb
ris
in th
e la
tter r
educ
es to
war
ds th
e en
d of
the
even
t
RL23
.5RL
23.5
m
RL23
.5m


Appendix A: Parametric Modelling Results

Table A1: Release Area
Release Area Shape Resultant Flow
Configuration 1
Configuration 2
Configuration 3
Configuration 4
Colour bar range: 0m to 4m

Table A2: Variations in Mu ( )
=0.01 =0.05
=0.1 =0.15
=0.2 =0.5
Colour bar range: 0m to 4m
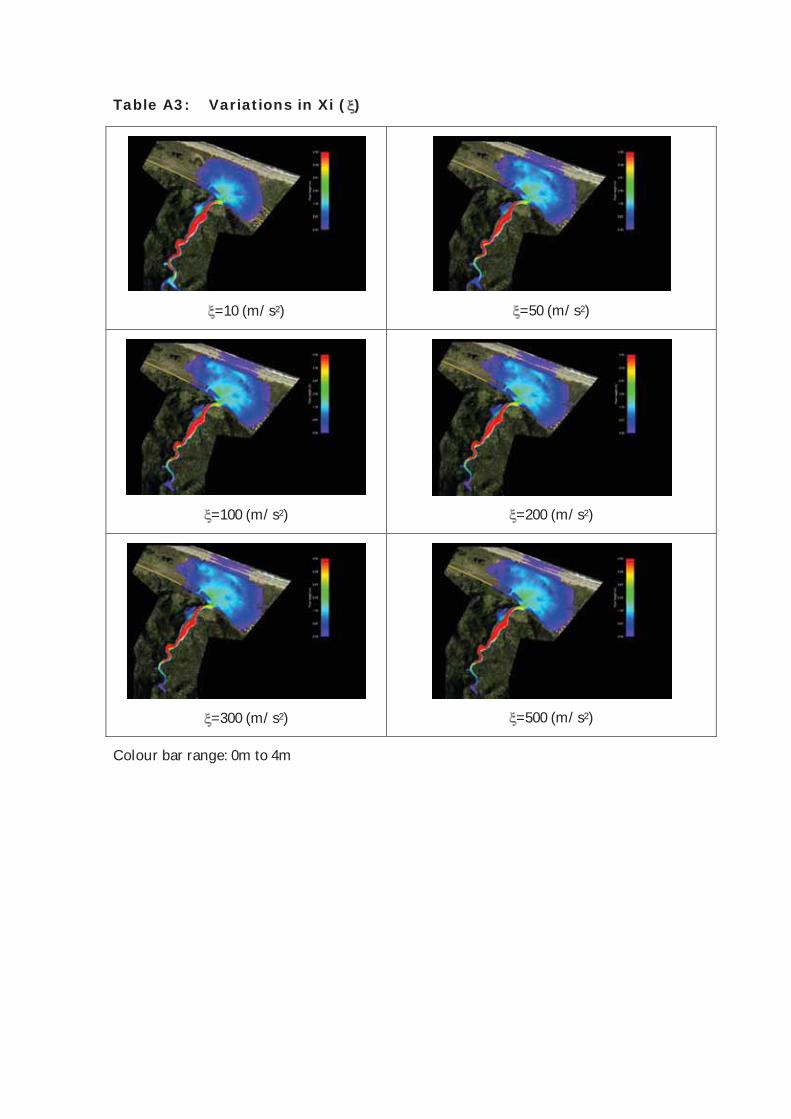
Table A3: Variations in Xi ( )
=10 (m/s2) =50 (m/s2)
=100 (m/s2) =200 (m/s2)
=300 (m/s2) =500 (m/s2)
Colour bar range: 0m to 4m

Table A4: Variations in Lambda ( )
=1.0 =1.5
=1.75 =2.0
=2.5 =5.0
Colour bar range: 0m to 4m
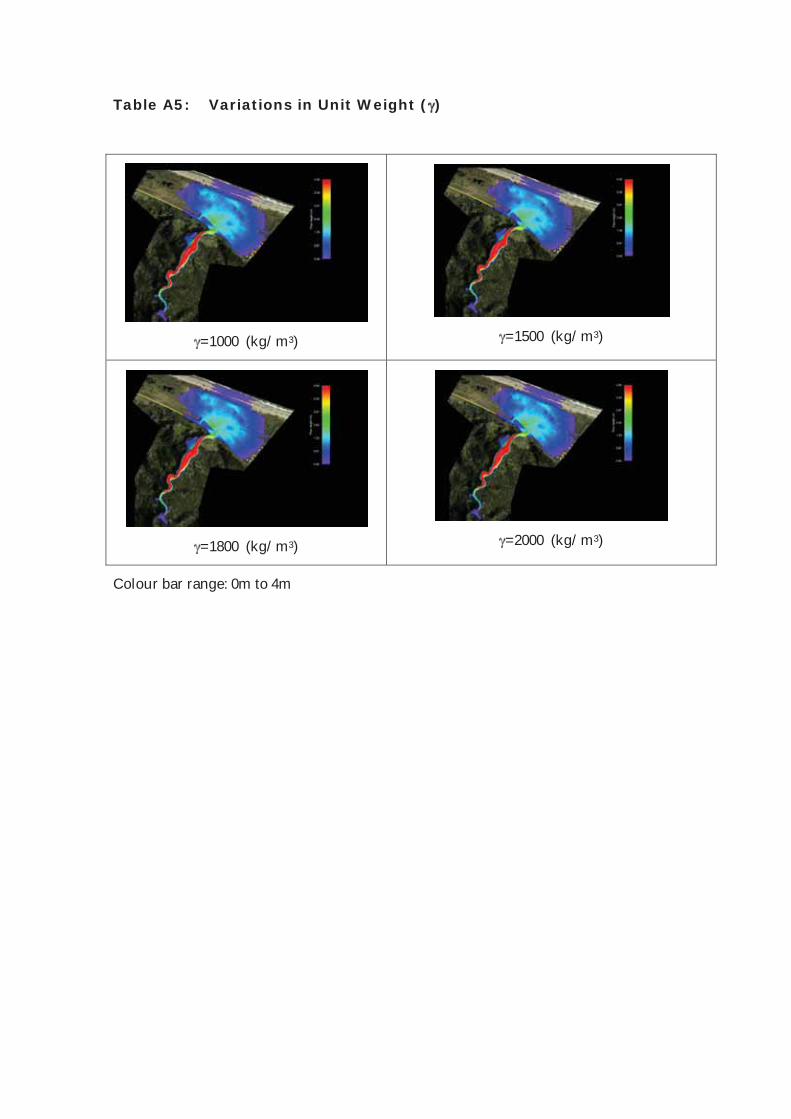
Table A5: Variations in Unit Weight ( )
=1000 (kg/m3) =1500 (kg/m3)
=1800 (kg/m3) =2000 (kg/m3)
Colour bar range: 0m to 4m

Table A6 Variations in Time (t)
t = 500 sec
t=1000 sec
t=2000 sec
t=3000 sec
t=4000 sec
t=5000 sec

Table A7: Flow Cases Used in Forward Analyses
Case 1 – Highly Fluid/Water
Case 2 – Best Estimate Flow
Case 3 – More Granular Flow
Colour bar range: 0m to 3m

Appendix B: Event Configuration

Table B1: Event Configuration, Case 1
Single Flow (100%)
First Flow (33%)
Second Flow (67%)
First Flow (50%)
Second Flow (50%)
First Flow (66%) Second Flow (33%)

Table B2: Event Configuration, Case 2
Single Flow (100%)
First Flow (33%)
Second Flow (67%)
First Flow (50%)
Second Flow (50%)
First Flow (66%)
Second Flow (33%)

Table B3: Event Configuration, Case 3
Single Flow (100%)
First Flow (33%)
Second Flow (67%)
First Flow (50%)
Second Flow (50%)
First Flow (66%)
Second Flow (33%)

Appendix C: Forward Analyses

Tab
le C
1:
Resu
lts
of
Forw
ard
An
aly
ses
Spill
way
El
evat
ion
(m)
Flow
Ty
pe
Flow
C
onfi
g.
Tim
e (s
ec)
Tim
e fo
r pea
k he
ight
at
(sec
) Ba
se
mR
L D
ebri
s H
eigh
t at
Bar
rier
whe
n Sp
illw
ay s
tart
s
Peak
Hei
ght
at B
arri
er
Peak
flow
th
ickn
ess
at
cres
t of
Spill
way
Peak
flow
thic
knes
s at
un
derp
ass
Barr
ier
is F
irst
St
ruck
Spill
way
St
arts
Ba
rrie
r Sp
illw
ay
Cre
st
Und
erpa
ss
(m
) R
L (m
) R
L (m
) R
L St
artin
g R
L ( m
) R
L
21C
ase
1Fi
rst 3
3%23
047
090
011
0023
0011
.09.
320
.310
.221
.20.
321
.36
17
Sec
ond
67%
230
260
450
420
600
20.8
2.2
233.
524
.32
236.
92.
110
.1
Firs
t 50%
200
320
650
710
1350
11.0
9.4
20.4
11.2
22.2
0.7
21.7
61.
47.
4S
econ
d 50
%27
029
050
048
065
021
.31.
422
.72.
623
.91.
623
7.2
1.7
8.9
Firs
t 67%
180
270
550
580
950
11.0
9.8
20.8
12.2
23.2
1.3
22.3
61.
97.
9S
econ
d 33
%16
016
028
025
080
021
.50.
421
.92.
123
.61.
422
.87.
30.
88.
1
Sin
gle
100%
150
210
480
500
650
11.0
10.7
21.7
1324
2.1
23.1
62.
78.
7
21C
ase
2Fi
rst 3
3%24
060
085
010
5012
8011
.07.
118
.18.
319
.30.
521
.56
0.9
6.9
Sec
ond
67%
225
250
500
480
650
18.7
4.2
22.9
523
.72
23.3
6.9
3.1
10
Firs
t 50%
210
370
800
750
1300
11.0
7.5
18.5
9.5
20.5
1.1
22.1
61.
87.
8S
econ
d 50
%26
030
055
055
085
020
.05.
324
.33.
523
.51.
623
7.4
2.5
9.9
Firs
t 67%
190
290
700
750
1060
11.0
8.0
1910
211.
622
.66
2.6
8.6
Sec
ond
33%
315
320
650
650
950
20.0
424
.33.
523
.81.
222
.67.
62
9.6
Sin
gle
100%
160
230
510
450
850
11.0
8.7
19.7
11.3
22.3
2.4
23.4
63.
89.
8
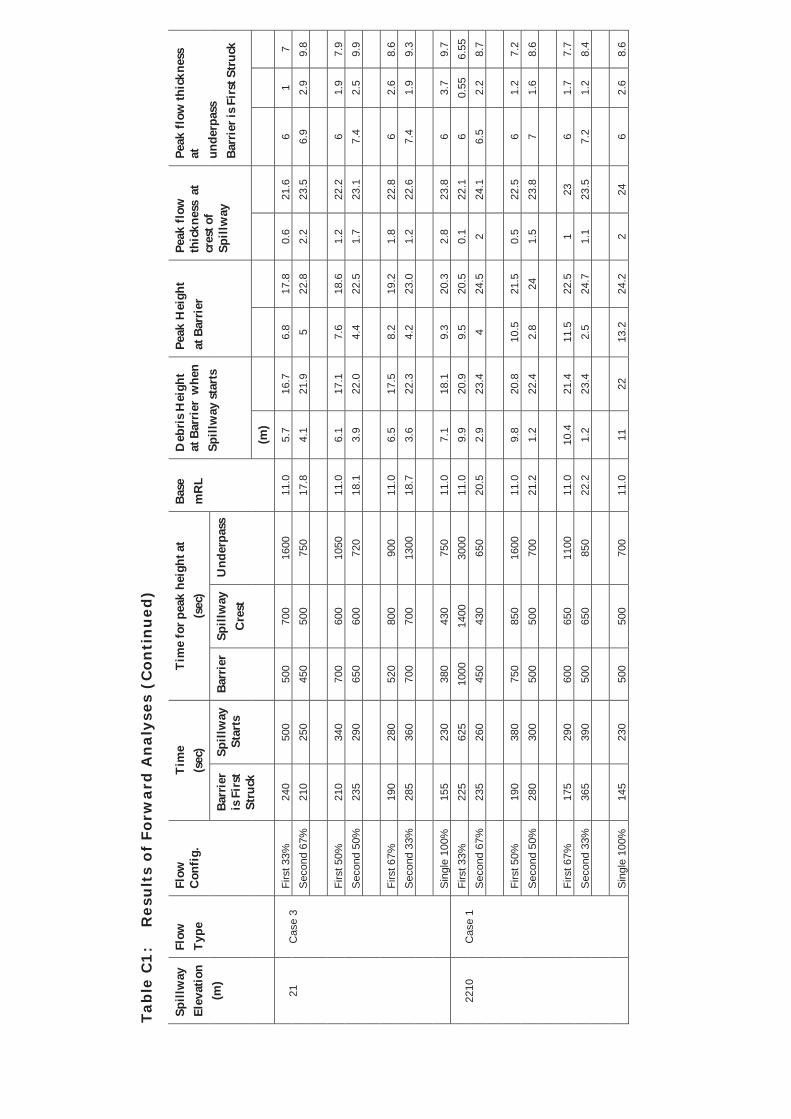
Tab
le C
1:
Resu
lts
of
Forw
ard
An
aly
ses
(Con
tin
ued
)
Spill
way
El
evat
ion
(m)
Flow
Ty
pe
Flow
C
onfi
g.
Tim
e (s
ec)
Tim
e fo
r pea
k he
ight
at
(sec
) Ba
se
mR
L D
ebri
s H
eigh
t at
Bar
rier
whe
n Sp
illw
ay s
tart
s
Peak
Hei
ght
at B
arri
er
Peak
flow
th
ickn
ess
at
cres
t of
Spill
way
Peak
flow
thic
knes
s at
un
derp
ass
Barr
ier i
s Fi
rst S
truc
k Ba
rrie
r is
Fir
st
Stru
ck
Spill
way
St
arts
Ba
rrie
r Sp
illw
ay
Cre
st
Und
erpa
ss
(m
)
21C
ase
3Fi
rst 3
3%24
050
050
070
016
0011
.05.
716
.76.
817
.80.
621
.66
17
Sec
ond
67%
210
250
450
500
750
17.8
4.1
21.9
522
.82.
223
.56.
92.
99.
8
Firs
t 50%
210
340
700
600
1050
11.0
6.1
17.1
7.6
18.6
1.2
22.2
61.
97.
9S
econ
d 50
%23
529
065
060
072
018
.13.
922
.04.
422
.51.
723
.17.
42.
59.
9
Firs
t 67%
190
280
520
800
900
11.0
6.5
17.5
8.2
19.2
1.8
22.8
62.
68.
6S
econ
d 33
%28
536
070
070
013
0018
.73.
622
.34.
223
.01.
222
.67.
41.
99.
3
Sin
gle
100%
155
230
380
430
750
11.0
7.1
18.1
9.3
20.3
2.8
23.8
63.
79.
7
2210
Cas
e 1
Firs
t 33%
225
625
1000
1400
3000
11.0
9.9
20.9
9.5
20.5
0.1
22.1
60.
556.
55S
econ
d 67
%23
526
045
043
065
020
.52.
923
.44
24.5
224
.16.
52.
28.
7
Firs
t 50%
190
380
750
850
1600
11.0
9.8
20.8
10.5
21.5
0.5
22.5
61.
27.
2S
econ
d 50
%28
030
050
050
070
021
.21.
222
.42.
824
1.5
23.8
71.
68.
6
Firs
t 67%
175
290
600
650
1100
11.0
10.4
21.4
11.5
22.5
123
61.
77.
7S
econ
d 33
%36
539
050
065
085
022
.21.
223
.42.
524
.71.
123
.57.
21.
28.
4
Sin
gle
100%
145
230
500
500
700
11.0
1122
13.2
24.2
224
62.
68.
6

Tab
le C
1:
Resu
lts
of
Forw
ard
An
aly
ses
(Con
tin
ued
)
Spill
way
El
evat
ion
(m)
Flow
Ty
pe
Flow
C
onfi
g.
Tim
e (s
ec)
Tim
e fo
r pea
k he
ight
at
(sec
) Ba
se
mR
L D
ebri
s H
eigh
t at
Bar
rier
whe
n Sp
illw
ay s
tart
s
Peak
Hei
ght
at B
arri
er
Peak
flow
th
ickn
ess
at
cres
t of
Spill
way
Peak
flow
thic
knes
s at
un
derp
ass
Barr
ier i
s Fi
rst S
truc
k Ba
rrie
r is
Fir
st
Stru
ck
Spill
way
St
arts
Ba
rrie
r Sp
illw
ay
Cre
st
Und
erpa
ss
(m
)
22C
ase
2Fi
rst 3
3%22
562
010
0014
0030
0011
.07.
818
.88
190.
122
.16
0.55
6.55
Sec
ond
67%
115
140
300
300
650
193.
622
.66
252
24.1
6.5
3.5
10
Firs
t 50%
190
370
800
800
1600
11.0
819
9.5
20.5
0.6
22.6
61.
27.
2S
econ
d 50
%26
031
055
060
085
019
.93.
223
.14.
824
.70.
622
.97
2.5
9.5
Firs
t 67%
185
310
750
700
1250
11.0
8.3
19.3
1021
1.3
23.3
62.
38.
3S
econ
d 33
%31
538
060
065
010
0020
.53.
123
.64.
124
.61.
223
.77.
62
9.6
Sin
gle
100%
155
230
550
500
850
11.0
9.2
20.2
11.7
22.7
2.1
24.1
63.
59.
5
2210
Cas
e 3
Firs
t 33%
250
620
600
1210
1590
11.0
617
7.1
18.1
0.6
22.6
61
7S
econ
d 67
%21
026
050
050
080
018
.14.
322
.45.
123
.22.
124
.36.
92.
99.
8
Firs
t 50%
200
500
700
850
1500
11.0
6.2
17.2
819
0.6
22.6
61.
27.
2S
econ
d 50
%24
030
060
055
070
018
.54.
122
.64.
823
.31.
423
.97.
32.
39.
6
Firs
t 67%
190
310
510
600
950
11.0
6.8
17.8
8.2
19.2
1.8
23.8
62.
38.
3S
econ
d 33
%29
036
065
075
090
018
.73.
622
.33.
822
.51
23.6
7.6
1.8
9.4
Sin
gle
100%
160
240
420
450
800
11.0
7.4
18.4
9.7
20.7
2.5
24.5
63.
59.
5

Appendix D: Non-Design Events

Table D1: Non-Design Events – Deposition
20,000m3
40,000m3

75,000m3
500,000m3

Appendix E: Fanhead Flow and Deposition

Tab
le E
1:
Desi
gn
Deb
ris
Flo
w E
ven
t –
Flo
w S
eq
uen
ce
Step
17
St
ep34
St
ep50
St
ep95
St
ep15
5
St
ep 3
00


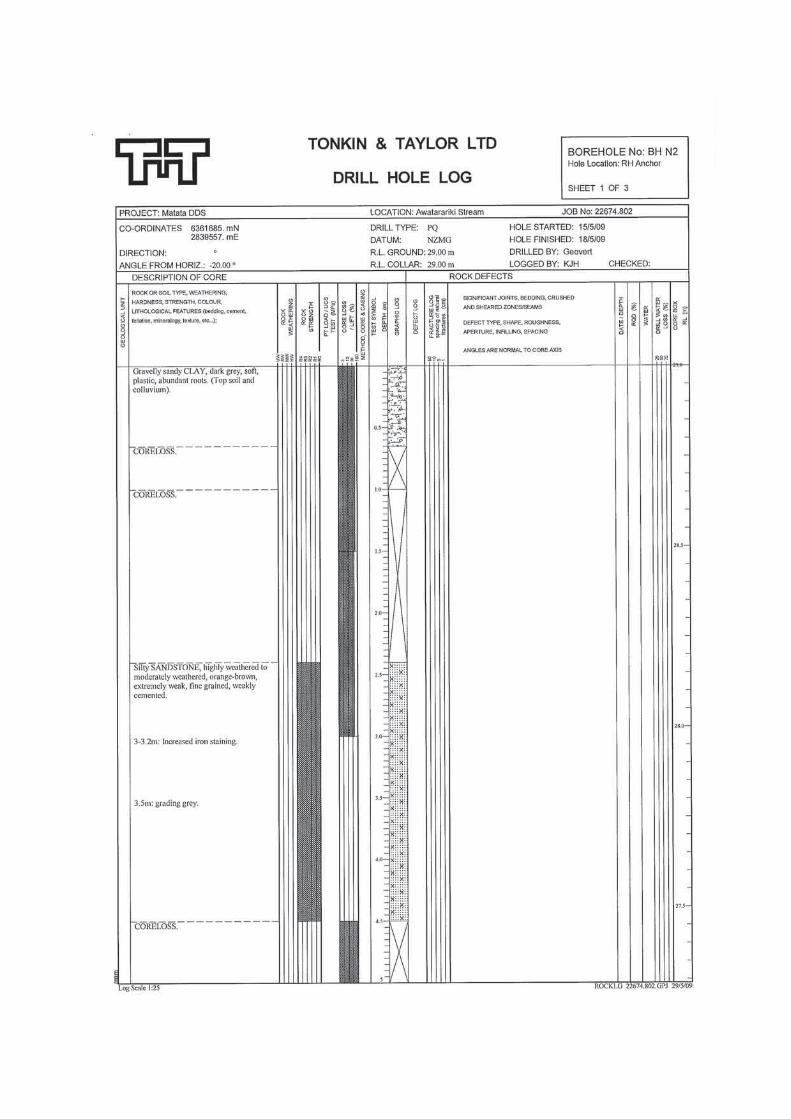


Core Photographs - Borehole BH-N1
Box 1: 0.0m to 6.1m
Box 2: 6.1m to 8.7m
Box 3: 8.7m to 12m

Core Photographs - Borehole BH-N2
Box 1: 0.0m to 4.1m
Box 2: 4.1m to 6.9m
Box 3: 6.9m to 12.0m

Core Photographs - Borehole BH-N2
Box 4: 12.0m to 15.0m


This appendix presents graphical output from the RAMMS modelling of the proposed debris flow control system. The following needs to be noted when assessing this model output for Option 3:
The digital elevation model (DEM) is formed from data points on a 2m grid. This reduces vertical surfaces to a sloping face. The RAMMS terrain therefore cannot represent the vertical gabion walls on top of the berms.
The thin overtopping flows (and subsequent inundation of the Clem Elliot Road area) that appear in the model are a result of the absence of the vertical gabion face. The proposed vertical wall design will eliminate this.
The DEM generation process means that the Awatarariki Stream, particularly near Moore’s Bridge, is represented by a shallow “dish-like” channel. In modelling, this allows some thin flows to cross of the stream and enter properties on the other side. The depth and width of the Awatarariki Stream would actually prevent this from happening. The flow reaching the Awatarariki Steam from SH2 is estimated to be less than 0.5m thick, or less than ¼ of the depth of the stream that it is entering.

Figure D1: Option 1 – No Diversion Berms
Figure D1a: Option 1 - Distribution and Thickness of Debris after the First (small) Flow
Figure D1b: Option 1 - Distribution and Thickness of Debris after Second (large) Flow

Figure D1c: Option 1 - Distribution and Peak Thickness of Debris after Second (large) Flow

Figure D2: Option 2 – Partial Diversion of Flows
Figure D2a: Option 2 - Distribution and Thickness of Debris after the First (small) Flow
Figure D2b: Option 2 - Distribution and Thickness of Debris after Second (large) Flow
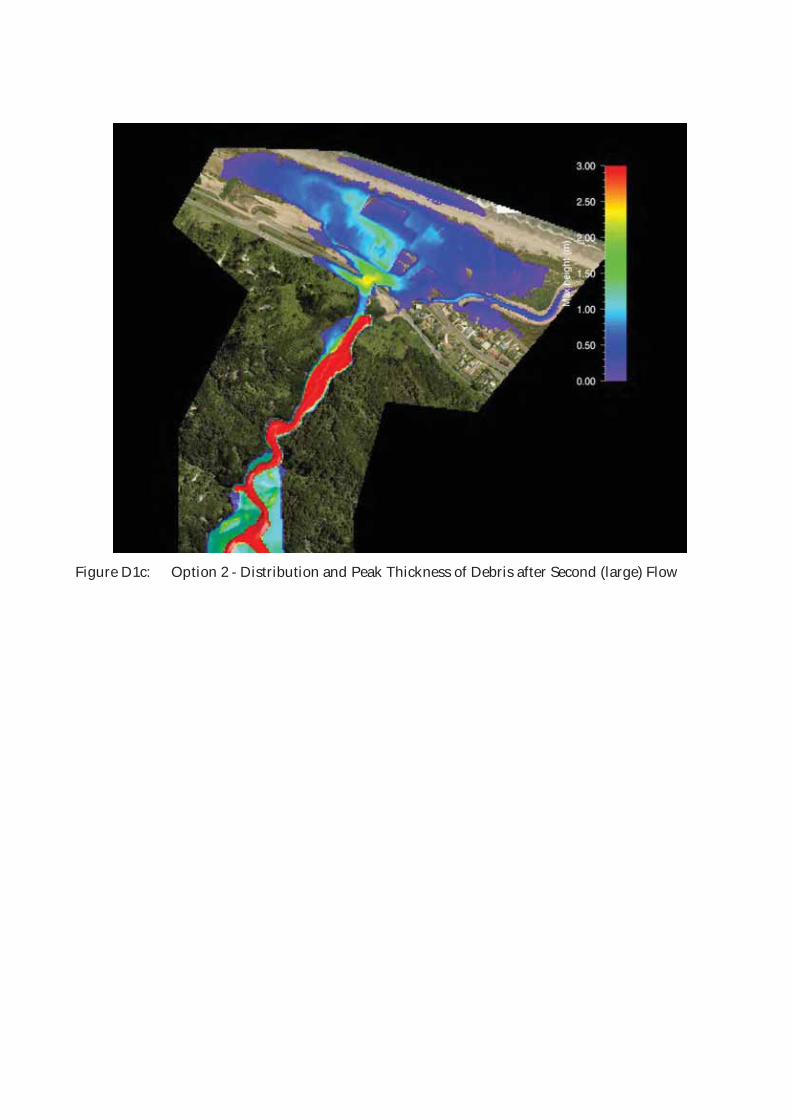
Figure D1c: Option 2 - Distribution and Peak Thickness of Debris after Second (large) Flow

Figure D3: Option 3 – Full Diversion of Flows

Figure D3 (continued): Flow Sequence for Design Event (Option 3)

Figure D3 (continued): Flow Sequence for Design Event (Option 3)
Model erroneously shows a thin flow of debris crossing over the berm (see text for explaination)
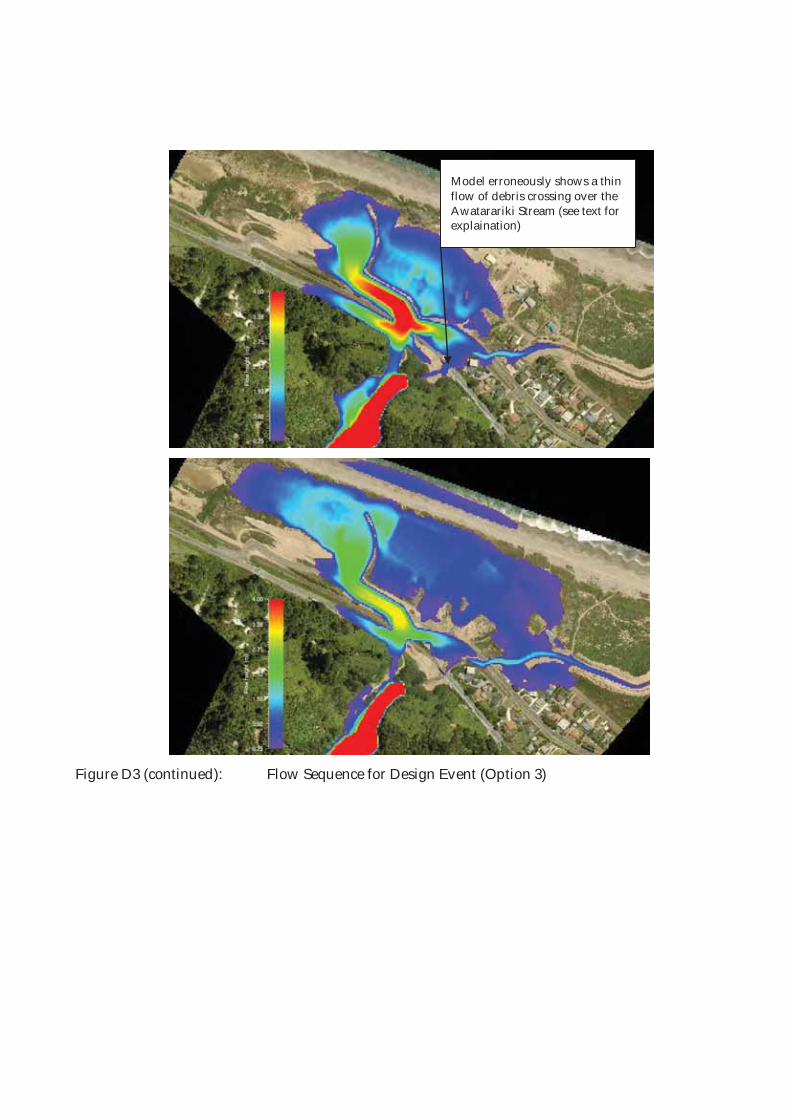
Figure D3 (continued): Flow Sequence for Design Event (Option 3)
Model erroneously shows a thin flow of debris crossing over the Awatarariki Stream (see text for explaination)