report for the 1st quarter 2015 - rhi magnesita
TRANSCRIPT

REPORT FOR THE1st QUaRTER2015

2015 RHI Group
2
1) adjusted for income from the reversal of investment subsidies recognized as liabilities
2) EBIT before impairment and restructuring expenses and result from Chapter 11 proceedings
3) Gearing ratio: net debt / equity
4) EBITDA trailing twelve months
5) Working Capital: inventories + trade receivables + receivables from long-term construction contracts – trade payables – prepayments received
6) Working Capital / (Revenue x 4)
7) Capital employed: property, plant and equipment + goodwill + other intangible assets + working capital
8) Return on average capital employed: (EBIT - taxes) / average capital employed
Quarterly Overview Earnings indicators (in € million) Q1/2015 Q4/2014 Delta Q3/2014 Q2/2014 Q1/2014 Revenue 424.1 466.5 (9.1)% 415.6 436.8 402.3 EBITDA 51.2 51.8 (1.2)% 42.91) 54.71) 50.01) Operating EBIT
2) 34.5 41.8 (17.5)% 28.3 37.7 34.1 EBIT 34.5 11.9 189.9% 25.3 38.5 33.6 Net finance costs (6.8) (10.3) 34.0% (8.7) (6.9) (6.8) Share of profit of joint ventures 2.2 2.5 (12.0)% 1.5 2.2 2.0 Profit before income tax 29.9 4.1 629.3% 18.1 33.8 28.8 Income tax (8.8) (3.2) (175.0)% (9.1) (11.0) (9.0) Profit from continuing operations 21.1 0.9 2,244.4% 9.0 22.8 19.8 EBITDA % 12.1% 11.1% 1.0pp 10.3% 12.5% 12.4% Operating EBIT % 8.1% 9.0% (0.9)pp 6.8% 8.6% 8.5% Profit from continuing operations % 5.0% 0.2% 4.8pp 2.2% 5.2% 4.9% Cash flow indicators (in € million) Q1/2015 Q4/2014 Delta Q3/2014 Q2/2014 Q1/2014 Cash flow from operating activities 21.8 32.3 (32.5)% 27.7 (10.6) 23.0 Cash flow from investing activities (9.4) (40.4) 76.7% (11.3) (4.1) (5.3) Cash flow from financing activities (57.7) 67.9 (185.0)% 4.9 (46.3) (1.9) Free cash flow 12.4 (8.1) 253.1% 16.4 (14.7) 17.7 Balance sheet indicators (in € million) Q1/2015 Q4/2014 Delta Q3/2014 Q2/2014 Q1/2014 Balance sheet total 1,926.4 1,860.5 3.5% 1,778.4 1,714.6 1,759.1 Equity 547.6 493.9 10.9% 506.1 485.4 497.5 Equity ratio (in %) 28.4% 26.5% 1.9pp 28.5% 28.3% 28.3% Net debt 462.2 466.9 (1.0)% 451.2 459.2 408.3 Gearing ratio (in %)3) 84.4% 94.5% (10.1)pp 89.2% 94.6% 82.1% Net debt / EBITDA4) 2.3 2.3 0.0% 2.4 2.3 1.7 Working capital5) 619.7 570.9 8.5% 563.2 542.7 507.5 Working capital %6) 36.5% 30.6% 5.9pp 33.9% 31.1% 31.5% Capital employed7) 1,297.0 1,225.2 5.9% 1,215.8 1,184.6 1,152.6 Return on capital employed (in %)8) 8.2% 2.9% 5.3pp 5.4% 9.4% 8.6% Stock exchange indicators (Vienna) Q1/2015 Q4/2014 Delta Q3/2014 Q2/2014 Q1/2014 Number of shares (million units) 39.819 39.819 0.0% 39.819 39.819 39.819 Closing price (in €) 27.40 18.81 45.7% 21.83 24.59 23.36 Market capitalization (in € million) 1,091 749 45.7% 869 979 930 Earnings per share (in €) 0.52 0.01 5,100.0% 0.22 0.56 0.49 Price-earnings ratio 13.2 470.3 (97.2)% 24.8 11.0 11.9

3
In its “World Economic Outlook” published in April 2015, the International Monetary Fund (IMF) did not change its forecast regarding the global economic growth of 3.5% made in its outlook in January 2015. However, the prospects for the different regions vary greatly. Oil-exporting countries are confronted with challenges due to the sharp decline in oil prices, while consumers in oil-importing countries have more disposable income as a result of the more favorable oil price, which thus acts as a support of the economy. Growth prospects in the emerging markets are viewed more critically due to lower increases in productivity. Consequently, the International Monetary Fund re-duced its forecast for nearly all important emerging economies, with the exception of India, where growth projections were increased by 1.2% to 7.5% for the year 2015. In contrast, the recession in Russia is likely to be more severe than previously assumed. Here, the experts of the IMF now expect the gross domestic product to decline by 3.8% in the current year, after a contraction by 3.0% had been forecast in January 2015. The Brazilian economy is also expected to fall into a recession in the current year, with the economic performance declining by 1.0%. In China, the restructuring of the economy is causing lower growth rates. The plan is to boost domestic consump-tion and to reduce dependence on foreign investments and exports. The Chinese statistical office also considers the economy to be under increasing downward pres-sure after growth of 7.0% in the first quarter of 2015. Despite the weaker outlook, the emerging markets will again account for roughly 70% of the economic growth in the year 2015. According to the International Monetary Fund, the euro area will have to expect weak economic growth in the longer term. Although the region currently benefits from ex-traordinary factors such as the declining oil price and the weak euro related to the bond purchasing program of the European Central Bank, high national debts and the reluctance to invest on the part of companies are dampening growth prospects in the longer term. However, the picture has recently brightened up a little. Lending to com-panies and private households by banks of the euro area increased slightly for the first time in March of this year, after recording year-on-year declines every single month since Mai 2012. The Markit Purchasing Managers Index for industry and services rose to 54 points in March 2015, thus clearly exceeding the 50 point mark, which signals growth. The US economy recorded surprisingly weak growth in the first quarter 2015 at a rate of 0.2% projected for the full year. At the end of 2014, growth had still amounted to 2.2%. While private consumption continued to grow, exports dropped significantly due to the strong US dollar. In addition, the harsh winter burdened economic activi-ties. The imminent turnaround of interest rates in the US should therefore be delayed. Experts expect a first increase in the base rate in the second half of the year 2015, af-ter it has been close to zero percent since the end of the year 2008.
The European stock markets reached record highs as a result of the purchase of gov-ernment and corporate bonds of € 1,140 billion as adopted by the European Central Bank, and of the weak euro, which drives exports. The German lead index DAX, for example, rose from roughly 9,800 points at the end of the year 2014 to more than 12,000 points. The return on ten-year German government bonds fell to less than 0.2% annually in this low-interest environment.
Economic Environment The IMF has left its forecast for global economic growth of 3.5% unchanged.
The euro area currently benefits from special factors such as the declining oil price and the weak euro.
The US economy recorded surprisingly weak growth of 0.2% in the first quarter of 2015.
The European stock markets reached record highs in the current low-interest environment.
2015 RHI Group
4
The RHI Group’s sales volume in the first quarter of 2015 was up 6.5% on the com-parative period of 2014 and amounted to roughly 478,000 tons. This increase is predominantly a result of stepping up the sale of raw dolomite in Italy, which makes a large contribution in terms of volume. In terms of value, however, the contribution is small due to the low revenue per ton. Compared with the strong fourth quarter of 2014, sales volume dropped by 4.8%.
Revenue of the RHI Group, at € 424.1 million in the first quarter of 2015, exceeded the revenue of the comparative period of 2014, at € 402.3 million, but fell short of the fourth quarter of 2014, at € 466.5 million. The increase in revenue compared with the first quarter of 2014 is attributable to improvements in the product mix and currency effects. The operating EBIT amounted to € 34.5 million in the first quarter of 2015, versus € 34.1 million in the comparative period of 2014, but was lower than in the fourth quarter of 2014, at € 41.8 million. While the Steel and Industrial Division signifi-cantly increased their contribution to earnings compared with the first quarter of 2014, the Raw Materials Division recorded a considerable decline due to poor utilization of the raw material plants. The operating EBIT margin, at 8.1% in the first quarter of 2015, was lower than in the comparative period of 2014, at 8.5%, and lower than in the fourth quarter of 2014, at 9.0%.
Equity amounted to € 547.6 million at March 31, 2015, versus € 493.9 million at March 31, 2014. The equity ratio rose from 26.5% at the end of the financial year 2014 to 28.4% at March 31, 2015. Cash and cash equivalents declined from € 151.1 million to € 109.7 million in comparison with December 31, 2014 due to the repayment of non-current financial liabilities. Net debt declined slightly from € 466.9 million to € 462.2 million. The gearing ratio, defined as net financial liabilities divided by equity, fell from 94.5% to 84.4%.
Working Capital, which consists of inventories and trade receivables less trade paya-bles and prepayments received, rose by € 48.8 million compared with the end of the year 2014 and amounted to € 619.7 million at March 31, 2015. This corresponds to 35.6% of the revenue of the past twelve months. While trade accounts receivable and trade accounts payable remained largely constant, inventories increased significantly. This is primarily due to exchange rate effects and higher inventories in North America as demand was weaker than expected.
Net cash flow from operating activities is characterized by an increase in working capi-tal and amounted to € 21.8 million in the past quarter. Net cash flow from investing activities amounted to € (9.4) million. Consequently, free cash flow totaled € 12.4 mil-lion in the first quarter of 2015.
ROACE (Return on Average Capital Employed), which is calculated as EBIT less taxes in relation to the average capital employed (property, plant and equipment, goodwill, other intangible assets and working capital) reached 8.2% in the first quarter of 2015.
The number of employees rose slightly from 8,016 at the end of the year 2014 to 8,079.
Asset, Financial and Earnings Position
The increase in sales vol-ume compared with the first quarter of 2014 results from higher external raw material sales.
The revenue increase com-pared to the first quarter of 2014 is attributable to im-provements in the product mix and currency effects.
The increase in working capital is due to exchange rate effects and higher in-ventories in North America as demand was weaker than expected.
5
1) adjusted for income from the reversal of investment subsidies recognized as liabilities
2) EBIT before impairment losses, restructuring effects and result from the US Chapter 11 proceedings
3) based on external and internal revenue
4) basic and diluted
Segment Reporting
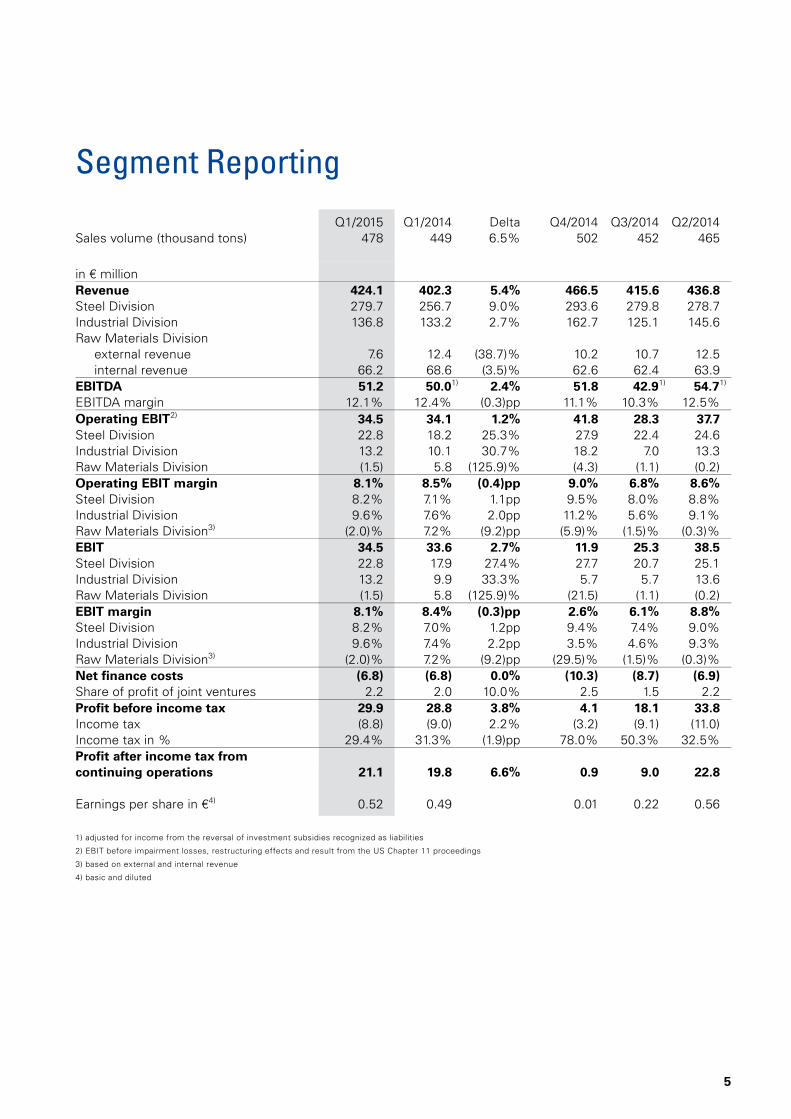
Q1/2015 Q1/2014 Delta Q4/2014 Q3/2014 Q2/2014 Sales volume (thousand tons) 478 449 6.5% 502 452 465
in € million Revenue 424.1 402.3 5.4% 466.5 415.6 436.8 Steel Division 279.7 256.7 9.0% 293.6 279.8 278.7 Industrial Division 136.8 133.2 2.7% 162.7 125.1 145.6 Raw Materials Division
external revenue 7.6 12.4 (38.7)% 10.2 10.7 12.5 internal revenue 66.2 68.6 (3.5)% 62.6 62.4 63.9
EBITDA 51.2 50.01) 2.4% 51.8 42.91) 54.71) EBITDA margin 12.1% 12.4% (0.3)pp 11.1% 10.3% 12.5% Operating EBIT
2) 34.5 34.1 1.2% 41.8 28.3 37.7 Steel Division 22.8 18.2 25.3% 27.9 22.4 24.6 Industrial Division 13.2 10.1 30.7% 18.2 7.0 13.3 Raw Materials Division (1.5) 5.8 (125.9)% (4.3) (1.1) (0.2) Operating EBIT margin 8.1% 8.5% (0.4)pp 9.0% 6.8% 8.6% Steel Division 8.2% 7.1% 1.1pp 9.5% 8.0% 8.8% Industrial Division 9.6% 7.6% 2.0pp 11.2% 5.6% 9.1% Raw Materials Division3) (2.0)% 7.2% (9.2)pp (5.9)% (1.5)% (0.3)% EBIT 34.5 33.6 2.7% 11.9 25.3 38.5 Steel Division 22.8 17.9 27.4% 27.7 20.7 25.1 Industrial Division 13.2 9.9 33.3% 5.7 5.7 13.6 Raw Materials Division (1.5) 5.8 (125.9)% (21.5) (1.1) (0.2) EBIT margin 8.1% 8.4% (0.3)pp 2.6% 6.1% 8.8% Steel Division 8.2% 7.0% 1.2pp 9.4% 7.4% 9.0% Industrial Division 9.6% 7.4% 2.2pp 3.5% 4.6% 9.3% Raw Materials Division3) (2.0)% 7.2% (9.2)pp (29.5)% (1.5)% (0.3)% Net finance costs (6.8) (6.8) 0.0% (10.3) (8.7) (6.9) Share of profit of joint ventures 2.2 2.0 10.0% 2.5 1.5 2.2 Profit before income tax 29.9 28.8 3.8% 4.1 18.1 33.8 Income tax (8.8) (9.0) 2.2% (3.2) (9.1) (11.0) Income tax in % 29.4% 31.3% (1.9)pp 78.0% 50.3% 32.5% Profit after income tax from continuing operations 21.1 19.8 6.6% 0.9 9.0 22.8 Earnings per share in €4) 0.52 0.49 0.01 0.22 0.56
2015 RHI Group
6
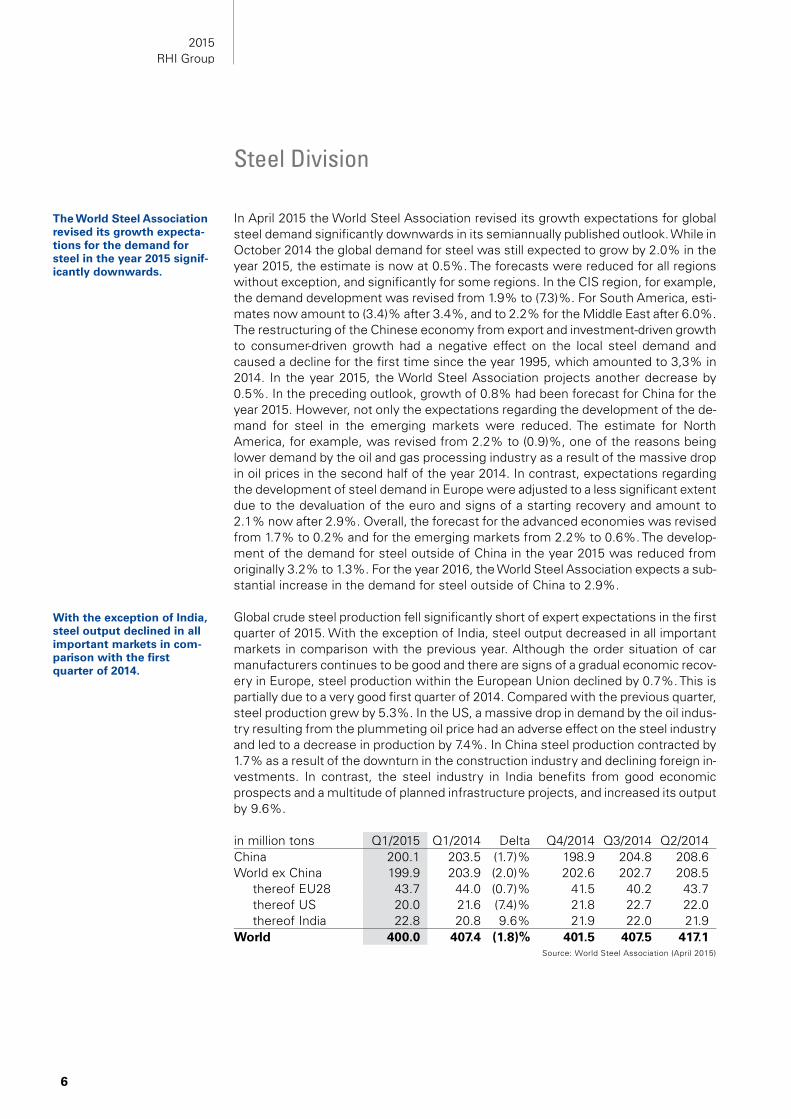
In April 2015 the World Steel Association revised its growth expectations for global steel demand significantly downwards in its semiannually published outlook. While in October 2014 the global demand for steel was still expected to grow by 2.0% in the year 2015, the estimate is now at 0.5%. The forecasts were reduced for all regions without exception, and significantly for some regions. In the CIS region, for example, the demand development was revised from 1.9% to (7.3)%. For South America, esti-mates now amount to (3.4)% after 3.4%, and to 2.2% for the Middle East after 6.0%. The restructuring of the Chinese economy from export and investment-driven growth to consumer-driven growth had a negative effect on the local steel demand and caused a decline for the first time since the year 1995, which amounted to 3,3% in 2014. In the year 2015, the World Steel Association projects another decrease by 0.5%. In the preceding outlook, growth of 0.8% had been forecast for China for the year 2015. However, not only the expectations regarding the development of the de-mand for steel in the emerging markets were reduced. The estimate for North America, for example, was revised from 2.2% to (0.9)%, one of the reasons being lower demand by the oil and gas processing industry as a result of the massive drop in oil prices in the second half of the year 2014. In contrast, expectations regarding the development of steel demand in Europe were adjusted to a less significant extent due to the devaluation of the euro and signs of a starting recovery and amount to 2.1% now after 2.9%. Overall, the forecast for the advanced economies was revised from 1.7% to 0.2% and for the emerging markets from 2.2% to 0.6%. The develop-ment of the demand for steel outside of China in the year 2015 was reduced from originally 3.2% to 1.3%. For the year 2016, the World Steel Association expects a sub-stantial increase in the demand for steel outside of China to 2.9%.
Global crude steel production fell significantly short of expert expectations in the first quarter of 2015. With the exception of India, steel output decreased in all important markets in comparison with the previous year. Although the order situation of car manufacturers continues to be good and there are signs of a gradual economic recov-ery in Europe, steel production within the European Union declined by 0.7%. This is partially due to a very good first quarter of 2014. Compared with the previous quarter, steel production grew by 5.3%. In the US, a massive drop in demand by the oil indus-try resulting from the plummeting oil price had an adverse effect on the steel industry and led to a decrease in production by 7.4%. In China steel production contracted by 1.7% as a result of the downturn in the construction industry and declining foreign in-vestments. In contrast, the steel industry in India benefits from good economic prospects and a multitude of planned infrastructure projects, and increased its output by 9.6%.
Source: World Steel Association (April 2015)
Steel Division
The World Steel Association revised its growth expecta-tions for the demand for steel in the year 2015 signif-icantly downwards.
With the exception of India, steel output declined in all important markets in com-parison with the first quarter of 2014.
in million tons Q1/2015 Q1/2014 Delta Q4/2014 Q3/2014 Q2/2014 China 200.1 203.5 (1.7)% 198.9 204.8 208.6 World ex China 199.9 203.9 (2.0)% 202.6 202.7 208.5
thereof EU28 43.7 44.0 (0.7)% 41.5 40.2 43.7 thereof US 20.0 21.6 (7.4)% 21.8 22.7 22.0 thereof India 22.8 20.8 9.6% 21.9 22.0 21.9
World 400.0 407.4 (1.8)% 401.5 407.5 417.1

7
The Steel Division’s sales volume fell by 2.3% compared with the same period of 2014 and amounted to approximately 298,000 tons in the first quarter of 2015. Weaker demand in Europe, North America and in the Middle East was only partly offset by a significant increase in business in South America and India. However, revenue in-creased by 9.0% due to improvements in the product mix and positive foreign currency effects. Compared with the strong fourth quarter of 2014, sales volume de-creased by 4.2% and revenue by 4.7%.
In the first quarter of 2015, revenue of the Steel Division, at € 279.7 million, exceeded the revenue of the comparative period of 2014, at € 256.7 million, but was lower than revenue of the fourth quarter of 2014, at € 293.6 million. The operating EBIT amounted to € 22.8 million in the first quarter of 2015, versus € 18.2 million in the comparative period 2014, but was lower than in the fourth quarter of 2014, at € 27.9 million. The in-crease on the first quarter of 2014 is primarily attributable to higher profitability in North America as the US dollar strengthened against the euro, as well as in South America and India due to the significant increase in revenue. The operating EBIT mar-gin, at 8.2% in the first quarter of 2015, exceeded that of the comparative period of 2014, at 7.1%, but fell short of the 9.5% in the fourth quarter of 2014.
Revenue in the past five quarters developed as follows:
Europe
In the first quarter of 2015, steel production within the European Union declined by 0.7% compared with the same period of 2014, but was 5.3% percent higher than in the previous quarter. The main driver of demand is still the automotive industry. The number of new cars registrations in the European Union rose for the nineteenth con-secutive month in March 2015 and exceeded 3.5 million in the past quarter. This corresponds to an increase by 8.6% compared with the first quarter of 2014. This in-crease in new registrations was particularly strong in Spain and Italy, at 32.2% and 13.5% respectively. The three largest markets, Germany, Great Britain and France, each also recorded growth of more than 6%.
In late March 2015 the European Commission decided to introduce anti-dumping du-ties on cold-rolled stainless steel sheets of 24.3% to 25.2% for Chinese producers
Revenue of the Steel Divi-sion increased due to improvements in the prod-uct mix and positive currency effects.
Development of revenue
The automotive industry continues to be the main driver of European steel producers.

2015 RHI Group
8
and 10.9% to 12.0% for Taiwanese manufacturers. This material is used in a variety of household appliances, amongst other things.
The region’s contribution to revenue in the first quarter of 2015 declined by roughly 3% compared with the same period of 2014. This is primarily attributable to a weaker business development in Italy as a result of a year-on-year decrease by roughly 10% in steel output. Here, the poor capacity utilization and the liquidity problems resulting from the high debt of many steel producers additionally have an adverse effect on the further business development. While the linings business declined, the flow control business was expanded, especially in the area of slide gate plates.
North America
North American steel producers reduced their output by 6.4% in the first quarter of 2015 compared with the same period of 2014. While demand by the automotive in-dustry continued to be solid, business with the oil and gas industry came to a nearly complete standstill. Due to the falling oil price, many oil companies canceled their ex-pansion plans and drastically reduced their investment programs. Consequently, the number of active oil drilling rigs dropped continuously from an all-time high of roughly 1,600 in October 2014 to only about 700 in April 2015. This is equivalent to the level of the year 2010 and explains the massive drop in demand for pipes, drill heads and oth-er steel equipment for oil production. As the fracking boom was particularly strong in the US in the recent years, the decrease in the US steel production was more signifi-cant, at 7.6%.
The region’s contribution to revenue in the first quarter of 2015 rose by approximately 7% compared with the same period of 2014 and was primarily due to favorable ex-change rate developments. Consequently, the US accounted for the majority of the increase in revenue as the US dollar strengthened significantly against the euro, while revenue in the second important market, Mexico, remained constant. The North American flow control business developed very positively and was expanded by more than 15%. This is attributable to product and service initiatives in steel plants. The business in the tundish segment was thus expanded significantly in the first quarter of this year.
Africa/CIS/Middle East
Steel production in the CIS region declined by 5.9% in the first quarter of 2015 com-pared with the same period of 2014 due to the political tensions in Eastern Ukraine. While steel production in Ukraine plummeted by more than 30%, Russian producers increased their output by 4.5% as their export business grew due to the devaluation of the ruble. Chinese importers are suffering from declining competitiveness as a re-sult of a revaluation of the yuan and are forced to raise prices accordingly. The region’s contribution to revenue rose by roughly 21% due to the positive business develop-ment in Russia.
In Africa, steel production in the past quarter was down 6.8% on the comparative pe-riod of 2014 and reflects the dependence on the two important countries Egypt and South Africa. Taken together, these two countries account for more than 80% of the steel output on the continent. While steel production rose in Egypt, it fell significantly in South Africa due to economic difficulties. The region’s contribution to revenue dropped by some 27% as a result of weak sales in the electric arc furnace and ladle segments.
The falling oil price led to a significant decline in the demand for steel as a result of drastically cut invest-ment programs of many oil production companies.
Russian steel producers in-creased their output by 4.5% as export business grew due to the devaluation of the ruble.

9
Steel production in the Middle East rose by 7.0% in the first quarter of 2015 compared with the same period of 2014 as a result of a significant volume increase in Iran and the United Arab Emirates. The region’s contribution to revenue was up 0.5% com-pared with the first quarter of 2014. While the flow control business grew by approximately 10%, increasing imports from China caused a decline in revenue by roughly 2% in the linings business.
South America
Steel production in South America increased slightly in the first quarter of 2015 and was up 0.2% on the comparative period of 2014. The national economies continue to suffer from low raw material prices, the withdrawal of capital by foreign investors and a lack of growth prospects. Consequently, industrial production in the important Brazil-ian market decreased by more than 5% and reflects the ongoing decline in investment activities in many industries. In addition, a major corruption scandal bur-dens the market environment.
Despite this challenging market environment, the region’s contribution to revenue soared by roughly 96% in the first quarter of 2015. This positive development is at-tributable to the fact that deliveries to Venezuela were resumed after payments were received, and to contracts won in Brazil. Here, the linings business saw a particularly good development in the ladle and degasser segments. The contribution to earnings was improved significantly due to an increase in revenue.
Asia/Pacific
Steel production in the Asia/Pacific region declined in the first quarter of 2015 and was 1.3% lower than in the comparative period of 2014. Of the four largest markets, China, Japan, India and South Korea, only India recorded some growth, which was in turn strong, at 9.4%. It was attributable to the commissioning of new steel production ca-pacities, which were built to cover the growing local demand related to a large number of planned infrastructure projects.
In China, low profitability within the steel industry and high financing costs burdens the liquidity situation of many producers. In addition, declining demand resulting from lower economic growth and reduced investment activities make the market environ-ment more difficult. Many steel producers consequently try to utilize their capacities and generate cash flow by expanding their export business. Experts estimate that steel exports from China will amount to approximately 100 million tons in 2015. This corresponds to more than double the steel output of Germany. Target regions primari-ly include countries in Southeast Asia and the Middle East.
The region’s contribution to revenue increased by roughly 29% in the first quarter of 2015 compared with the same period of 2014 as business in India was expanded fur-ther. This development was additionally supported by the strengthening of the Indian rupee and the Chinese yuan against the euro. The Steel Division’s revenue generated in India in the first quarter of 2015 increased by roughly 36% on the first quarter of 2014 and amounted to roughly € 38 million. Consequently, India clearly represents the most important individual market, ahead of the US.
The region’s contribution to revenue increased signifi-cantly due to resumed deliveries to Venezuela and contracts won in Brazil.
Experts expect steel exports from China of roughly 100 million tons in the year 2015.
2015 RHI Group
10
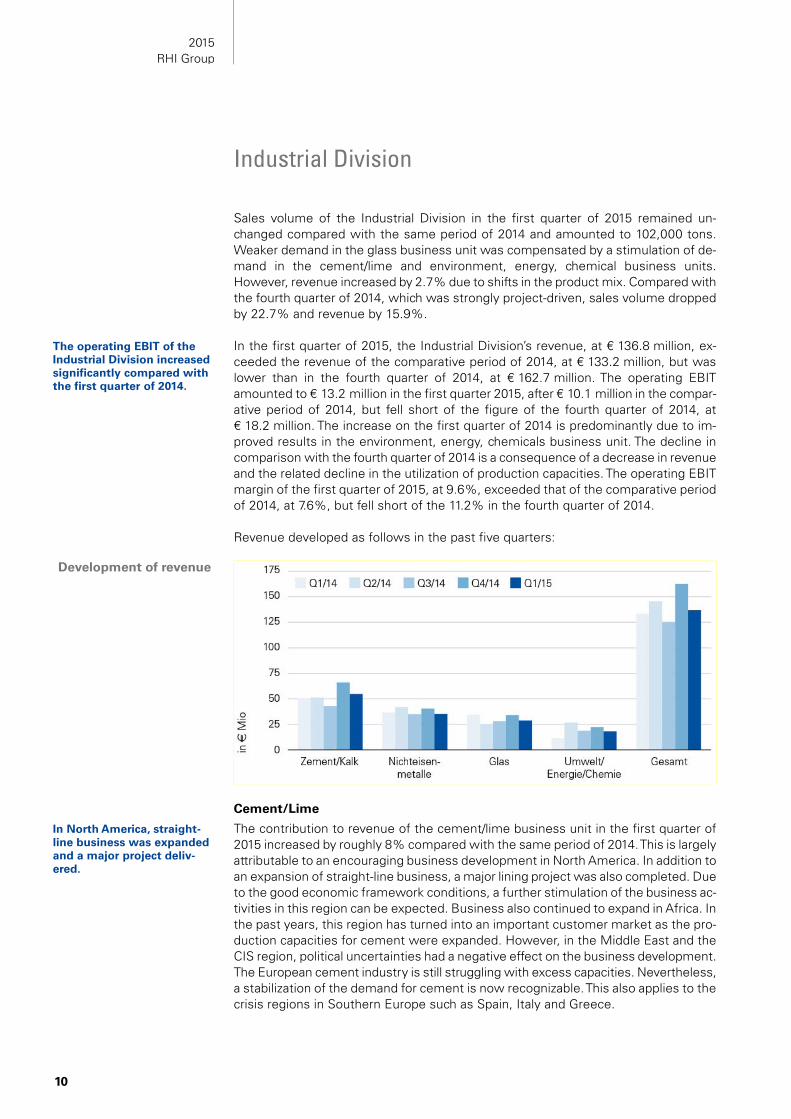
Sales volume of the Industrial Division in the first quarter of 2015 remained un-changed compared with the same period of 2014 and amounted to 102,000 tons. Weaker demand in the glass business unit was compensated by a stimulation of de-mand in the cement/lime and environment, energy, chemical business units. However, revenue increased by 2.7% due to shifts in the product mix. Compared with the fourth quarter of 2014, which was strongly project-driven, sales volume dropped by 22.7% and revenue by 15.9%.
In the first quarter of 2015, the Industrial Division’s revenue, at € 136.8 million, ex-ceeded the revenue of the comparative period of 2014, at € 133.2 million, but was lower than in the fourth quarter of 2014, at € 162.7 million. The operating EBIT amounted to € 13.2 million in the first quarter 2015, after € 10.1 million in the compar-ative period of 2014, but fell short of the figure of the fourth quarter of 2014, at € 18.2 million. The increase on the first quarter of 2014 is predominantly due to im-proved results in the environment, energy, chemicals business unit. The decline in comparison with the fourth quarter of 2014 is a consequence of a decrease in revenue and the related decline in the utilization of production capacities. The operating EBIT margin of the first quarter of 2015, at 9.6%, exceeded that of the comparative period of 2014, at 7.6%, but fell short of the 11.2% in the fourth quarter of 2014.
Revenue developed as follows in the past five quarters:
Cement/Lime
The contribution to revenue of the cement/lime business unit in the first quarter of 2015 increased by roughly 8% compared with the same period of 2014. This is largely attributable to an encouraging business development in North America. In addition to an expansion of straight-line business, a major lining project was also completed. Due to the good economic framework conditions, a further stimulation of the business ac-tivities in this region can be expected. Business also continued to expand in Africa. In the past years, this region has turned into an important customer market as the pro-duction capacities for cement were expanded. However, in the Middle East and the CIS region, political uncertainties had a negative effect on the business development. The European cement industry is still struggling with excess capacities. Nevertheless, a stabilization of the demand for cement is now recognizable. This also applies to the crisis regions in Southern Europe such as Spain, Italy and Greece.
Industrial Division
The operating EBIT of the Industrial Division increased significantly compared with the first quarter of 2014.
Development of revenue
In North America, straight-line business was expanded and a major project deliv-ered.
11
In China, the downturn of the construction industry and falling property prices are burdening local cement producers. As a result, capacities in the world’s largest ce-ment market have been shut down in some regions of the country due to the decline in production. Despite this difficult market climate, RHI was able to increase its reve-nue significantly. The expansion of market share is based on consistent product quality in combination with service packages, which are highly appreciated by the cus-tomers.
In India and Indonesia, new cement production facilities are currently built in order to meet the growing demand, which results from a multitude of infrastructure projects. RHI accounts for this development by building a third tunnel kiln at its site in Venkatapuram, India, thus expanding its production capacity by approximately 50%.
Many national economies in South America are struggling with declining economic growth as a result from falling raw material prices. After production capacities were massively expanded during the boom years, hardly any new plant projects are planned at present. Despite high import duties RHI achieved a good market position in the past year. As in China, customers appreciate the quality or the refractory products and an excellent after sales service.
Nonferrous metals
In the first quarter of 2015 the contribution to revenue of the nonferrous metals busi-ness unit declined by roughly 5% compared with the same period of 2014. This is predominantly due to a weaker ferronickel business in Asia. Despite the decline in revenue, the contribution to earnings was increased because of urgent repairs in the ferrochrome and the titanium oxide segments in the million euro range. In addition, two important projects for key aggregates in the copper sector were delivered in Chi-na, which were offered at high prices because of a special product mix.
Another focus was placed on projects in Russia and Zambia, where material for a ma-jor repair in the nickel sector were delivered on the one hand, and, on the other hand, the remaining spare parts were installed for a copper project realized in the last year. In addition, major deliveries went to Germany, South Africa, Mexico, Sweden and Canada, where regular customers trusted in RHI materials.
The order situation developed very positively, increasing by roughly 20% compared with the end of 2014 and by roughly 40% compared with the first quarter of 2014. These orders include contracts for important major repairs in the nickel segment in Canada, where RHI material is used nearly exclusively. As a result, the capacity utiliza-tion of the plants looks very encouraging until this fall, but has also led to a considerable increase in delivery times. RHI strives to meet customers‘ delivery re-quests as far as possible despite the high capacity utilization.
The prices of copper, aluminum and zinc declined by roughly 4% in the past quarter. In contrast, the nickel price came under stronger pressure and dropped by some 18% to the lowest level in five years. This affects new installation business with mining companies and the relevant kiln manufacturers. However, the important maintenance business is expected to continue to develop positively.
The order level was up some 20% on the end of 2014 and roughly 40% on the end of the first quarter of 2014.

2015 RHI Group
12
Glass
The contribution to revenue of the glass business unit fell by some 16% in the first quarter of 2015 compared with the same period of 2014. This is primarily attributable to a slump in revenue by more than 60% in North America due to a strike at the US plant in Falconer. This strike was only settled in February, leading to delays in deliver-ies. RHI thus expects strong revenues in the second quarter of the current financial year due to the planned deliveries of the delayed projects.
The Middle East and Eastern Europe recorded an encouraging business development, achieving growth rates in the double-digit percentage range. In Europe, a certain stabi-lization of the market environment is noticeable. Repair activities were thus carried out according to plan. The consolidation of the glass industry continued to progress in the past quarter. Further takeovers took place especially in the container glass seg-ment in the US and in Europe.
In China the market environment improved slightly. While the flat glass segment is still characterized by high excess capacities, growing demand for special products such as cover glass is becoming apparent. In this context, a contract of roughly € 6 million was won for a special glass furnace. Capacity utilization also improved for the plant in Podolsk, Russia. Several contracts were concluded here as a result of the devaluation of the ruble.
Environment, energy, chemicals
The contribution to revenue of the environment, energy, chemicals sector in the first quarter of 2015 was up roughly 60% on the comparative period of 2014. This is on the one hand due to a low revenue level in the first quarter of 2014 and, on the other hand, to a very positive development of revenue in India. Here, a record contract was won in the refinery sector and the deliveries have been started.
A particularly positive success is a first-time full-line contract covering the engineer-ing, refractory material and the installation by supervisors for two new pelletizing plants in the Middles East. Another major contract, a complete package for several sulfur recovery plants, was won in India.
The decline of the oil price has led to a significant deterioration in the investment cli-mate in the oil and gas production industry. In the US, the fracking industry is suffering from the low oil price due to the high investments made in the past. This leads to cost pressure and subsequently to a consolidation of the industry. In the year 2014, 130 mergers and takeovers took place, with a transaction volume of more than € 52 billion in the oil and gas production sector in the US. This consolidation trend con-tinued unabated in the past quarter.
The contribution to revenue declined due to a drop by more than 60% in North America related to a strike at the US plant in Falconer.
In India, the delivery of a record contract in the refinery sector was started.
13
The Raw Material Division’s external sales volume reached a new record of approxi-mately 78,000 tons in the first quarter of 2015. The increase by roughly 200% in comparison with the first quarter of 2014 is primarily a result of pushing the sale of raw dolomite in Italy. While these sales contribute a large share to volume, the effect in terms of value is small as the proceeds per ton are low.
In the first quarter of 2015, revenue of the Raw Materials Division, at € 73.8 million, was lower than in the same period of 2014, at € 81.0 million, but exceeded the reve-nue of the fourth quarter of 2014, at € 72.8 million. The decline in revenue on the comparative period of 2014 is primarily attributable to lower external revenue. The op-erating EBIT amounted to € (1.5) million in the first quarter of 2015, versus € 5.8 million in the comparative period of 2014, but exceeded that of the fourth quar-ter of 2014, at € (4.3) million. The decrease on the first quarter of 2014 is the result of lower capacity utilization of the raw material plants. The operating EBIT margin of (2.0)% in the first quarter of 2015 was lower than in the comparative period of 2014, at 7.2%, but higher than in the fourth quarter of 2014, at (5.9)%.
At the site in Porsgrunn, Norway, ongoing optimization projects were continued. The preparations to reduce production volume are proceeding according to plan. The silo capacities have to be adapted accordingly in order to decouple the continuous opera-tion of the preceding caustic magnesia production from the fusion operation, which will then run discontinuously. Moreover, the introduction of new shift systems is planned. The implementation should be completed in the third quarter of 2015 and lead to a significant cost reduction. As of the fourth quarter of 2015, a projected annu-al production volume of approximately 30,000 tons is to be expected.
As industrial production was weaker in the emerging markets due to slower economic growth, the most important refractory raw materials such as sintered and fused mag-nesia, bauxite, andalusite or fused corundum recorded slightly declining prices. Many of these raw materials are traded in US dollar. As the euro weakened against the US dollar, the cost for external purchases of European producers increased accordingly.
The establishment of a mixes facility at the site in Eskisehir, Turkey, with investments totaling roughly € 17 million, is proceeding according to plan. In the past quarter, the construction of the steel structure was started, and the first units were installed. The commissioning of the plant is scheduled for the fourth quarter of 2015, so that full availability of the plant is expected for the beginning of the year 2016.
Raw Materials Division
The sale of raw dolomite was stepped up, producing a large contribution to vol-ume, but little in terms of value.
The implementation of vol-ume reduction at the site in Norway should be complet-ed in the third quarter of 2015 and lead to significant cost reductions.
2015 RHI Group
14
Provided that the macroeconomic environment and exchange rates remain stable, the Management Board of the RHI Group expects an increase in revenue by roughly 3% compared with the previous year and an operating EBIT margin of approximately 9% for the full year 2015.
Due to the current order situation of the Industrial Division, a significant increase in revenue is expected for the second quarter of 2015.
Risk Report
In the first quarter of 2015, the risk management processes and key risks remained essentially unchanged. No risks that are considered to be a threat to the existence of the Group were identified.
Outlook
1
Condensed, unaudited interim consolidated financial statements as of 03/31/2015

2015 RHI Group
2
as of 03/31/2015
Consolidated statement of financial position
in € million 03/31/2015 12/31/2014 ASSETS Non-current assets Property, plant and equipment 559.3 544.2 Goodwill 39.2 36.1 Other intangible assets 78.8 74.0 Investments in joint ventures 20.3 18.3 Other non-current financial assets 42.1 39.6 Other non-current assets 19.9 19.6 Deferred tax assets 136.9 130.1 896.5 861.9 Current assets Inventories 477.3 429.0 Trade and other current receivables 431.3 408.4 Income tax receivables 8.2 6.9 Other current financial assets 3.4 3.2 Cash and cash equivalents 109.7 151.1 1,029.9 998.6 1,926.4 1,860.5 EQUITY AND LIABILITIES Equity Share capital 289.4 289.4 Group reserves 243.9 192.3 Equity attributable to shareholders of RHI AG 533.3 481.7 Non-controlling interests 14.3 12.2 547.6 493.9 Non-current liabilities Non-current financial liabilities 420.7 417.0 Other non-current financial liabilities 1.4 1.3 Deferred tax liabilities 18.1 16.5 Personnel provisions 377.3 355.1 Other non-current provisions 6.0 6.1 Other non-current liabilities 8.6 8.8 832.1 804.8 Current liabilities Current financial liabilities 151.2 201.0 Other current financial liabilities 13.9 0.4 Trade payables and other current liabilities 315.0 296.4 Income tax liabilities 24.7 24.1 Current provisions 41.9 39.9 546.7 561.8 1,926.4 1,860.5

3
from 01/01/2015 to 03/31/2015
1) Explanations regarding adjustments are provided in the notes.
Consolidated statement of profit or loss
in € million 1-3/2015 1-3/20141) Revenue 424.1 402.3 Cost of sales (331.1) (309.7) Gross profit 93.0 92.6 Selling and marketing expenses (27.6) (26.4) General and administrative expenses (33.4) (30.8) Other income 45.5 13.4 Other expenses (43.0) (14.7) Operating EBIT 34.5 34.1 Restructuring costs 0.0 (0.5) EBIT 34.5 33.6 Interest income 0.4 0.3 Interest expenses (5.0) (4.3) Other net financial expenses (2.2) (2.8) Net finance costs (6.8) (6.8) Share of profit of joint ventures 2.2 2.0 Profit before income tax 29.9 28.8 Income tax (8.8) (9.0) Profit after income tax 21.1 19.8
attributable to shareholders of RHI AG 20.7 19.5 attributable to non-controlling interests 0.4 0.3
in € Earnings per share (basic and diluted) 0.52 0.49

2015 RHI Group
4
from 01/01/2015 to 03/31/2015
Consolidated statement of comprehensive income
in € million 1-3/2015 1-3/2014 Profit after income tax 21.1 19.8 Currency translation differences 46.0 (1.0) Market valuation of cash flow hedges
Unrealized results from fair value change (0.1) (0.7) Deferred taxes on unrealized results from fair value change 0.0 0.2 Reclassification reserves to the statement of profit or loss 0.0 (0.1)
Market valuation of available-for-sale financial instruments Unrealized results from fair value change 2.4 0.8 Deferred taxes on unrealized results from fair value change (0.6) (0.2)
Items that will be reclassified subsequently to profit or loss, if necessary 47.7 (1.0)
Remeasurement of defined benefit plans
Remeasurement of defined benefit plans (21.0) (9.3) Deferred taxes on remeasurement of defined benefit plans 5.9 2.5
Items that will not be reclassified to profit or loss (15.1) (6.8) Other comprehensive income after income tax 32.6 (7.8) Total comprehensive income 53.7 12.0
attributable to shareholders of RHI AG 51.6 11.3 attributable to non-controlling interests 2.1 0.7

5
from 01/01/2015 to 03/31/2015
Consolidated statement of cash flows
in € million 1-3/2015 1-3/2014 Profit after income tax 21.1 19.8 Adjustments for
income tax 8.8 9.0 depreciation and amortization charges 16.9 16.6 income from the reversal of investment subsidies (0.2) (0.2) gains from the disposal of property, plant and equipment (0.9) 0.0 interest result 4.6 4.0 share of profit of joint ventures (2.2) (2.0) other non-cash changes 5.1 5.6
Changes in inventories (27.6) (26.7) trade receivables 2.4 (9.8) other receivables and assets (6.4) 1.8 provisions (2.8) (5.8) trade payables (1.2) 4.7 other liabilities 12.4 15.4
Cash flow from operating activities 30.0 32.4 Income tax paid less refunds (8.2) (9.4) Net cash flow from operating activities 21.8 23.0 Investments in property, plant and equipment and intangible assets (11.3) (6.4) Cash inflows from the sale of property, plant and equipment 1.2 0.5 Investments in / cash inflows from non-current receivables (0.2) 0.1 Dividend payments from joint ventures 0.5 0.2 Interest received 0.4 0.3 Net cash flow from investing activities (9.4) (5.3) Repayments of non-current borrowings and loans (51.7) (0.1) Changes in current borrowings (1.7) 2.8 Interest payments (4.3) (4.6) Net cash flow from financing activities (57.7) (1.9) Total cash flow (45.3) 15.8 Change in cash and cash equivalents (45.3) 15.8 Cash and cash equivalents at beginning of year 151.1 112.4 Changes due to currency translation 3.9 (0.9) Cash and cash equivalents at year-end 109.7 127.3 Total interest paid 4.3 5.1 Total interest received 0.4 0.3
2015 RHI Group
6
from 01/01/2015 to 03/31/2015
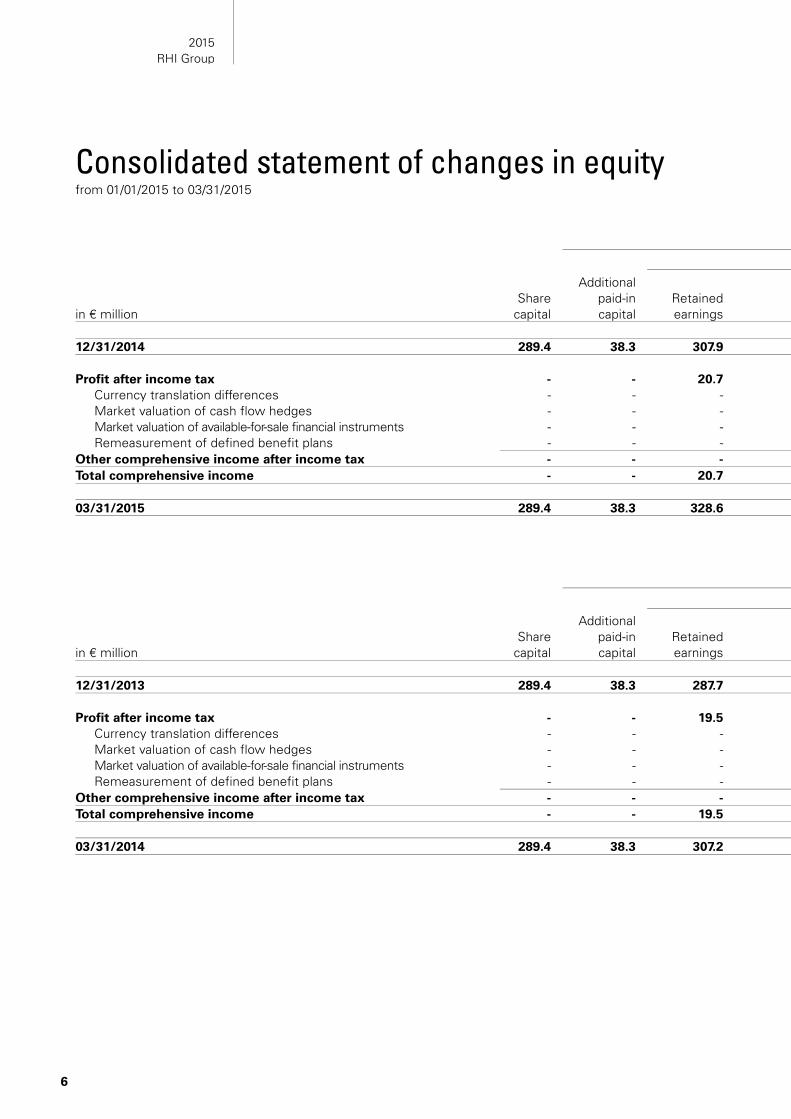
Consolidated statement of changes in equity
in € million Share
capital
Additional paid-in capital
Retained earnings
12/31/2014 289.4 38.3 307.9 Profit after income tax - - 20.7
Currency translation differences - - - Market valuation of cash flow hedges - - - Market valuation of available-for-sale financial instruments - - - Remeasurement of defined benefit plans - - -
Other comprehensive income after income tax - - - Total comprehensive income - - 20.7 03/31/2015 289.4 38.3 328.6
in € million Share
capital
Additional paid-in capital
Retained earnings
12/31/2013 289.4 38.3 287.7 Profit after income tax - - 19.5
Currency translation differences - - - Market valuation of cash flow hedges - - - Market valuation of available-for-sale financial instruments - - - Remeasurement of defined benefit plans - - -
Other comprehensive income after income tax - - - Total comprehensive income - - 19.5 03/31/2014 289.4 38.3 307.2

7
Group reserves
Accumulated other comprehensive income Equity attributable
to shareholders of RHI AG
Non-controlling
interests
Cash flow
hedges
Available-for-sale financial
instruments Defined
benefit plans Currency
translation Total
equity
(1.0) 4.5 (106.1) (51.3) 481.7 12.2 493.9 - - - - 20.7 0.4 21.1 - - - 44.3 44.3 1.7 46.0
(0.1) - - - (0.1) - (0.1) - 1.8 - - 1.8 - 1.8 - - (15.1) - (15.1) - (15.1)
(0.1) 1.8 (15.1) 44.3 30.9 1.7 32.6 (0.1) 1.8 (15.1) 44.3 51.6 2.1 53.7
(1.1) 6.3 (121.2) (7.0) 533.3 14.3 547.6
Group reserves
Accumulated other comprehensive income Equity attributable
to shareholders of RHI AG
Non-controlling
interests
Cash flow
hedges
Available-for-sale financial
instruments Defined
benefit plans Currency
translation Total
equity
0.5 2.0 (70.3) (72.3) 475.3 10.2 485.5 - - - - 19.5 0.3 19.8 - - - (1.4) (1.4) 0.4 (1.0)
(0.6) - - - (0.6) - (0.6) - 0.6 - - 0.6 - 0.6 - - (6.8) - (6.8) - (6.8)
(0.6) 0.6 (6.8) (1.4) (8.2) 0.4 (7.8) (0.6) 0.6 (6.8) (1.4) 11.3 0.7 12.0
(0.1) 2.6 (77.1) (73.7) 486.6 10.9 497.5

2015 RHI Group
8
Principles and methods
The interim financial statements as of 03/31/2015 were prepared in accordance with the requirements of IAS 34 “Interim Financial Reporting” and with the International Financial Reporting Standards (IFRS) as endorsed by the European Union (EU).
The interim consolidated financial statements do not include all information and disclosures required in the annual financial statements and should therefore be read in conjunction with the RHI consolidated financial statements as of 12/31/2014.
Initial application of new financial reporting standards
With the exception of the changes described in the following, the same accounting and measurement principles were used as in the previous year:
Other changes in comparative information
The following changes in presentation were introduced as of 12/31/2014 to enhance the informative value of the RHI consolidated financial statements:
Amortization charges on development costs, which had been included in general and administrative expenses until the third quarter of 2014, were reclassified to cost of sales with retroactive effect as of the fourth quarter of 2014 as this presentation is more appropriate (Adjustment 1).
Foreign exchange results were previously shown as the net amount of foreign exchange gains and losses, either under other income or under other expenses. The net results from foreign exchange contracts were shown as a correcting item to the foreign exchange result. Due to the materiality of the effects, they have no longer been off-set since 12/31/2014 based on the no-netting principle (Adjustment 2).
As a result of the changes in presentation, the consolidated statement of profit or loss changed as follows for the first quarter of 2014:
Audit and review by an auditor
The consolidated interim financial statements as of 03/31/2015 were neither fully audited nor reviewed by an audi-tor.
Selected explanatory notes
Standard Title Publication
(EU endorsement)
Effects on RHI consolidated interim financial statements
New interpretation IFRIC 21 Levies 05/20/2013 (06/13/2014) No effect Amendments of standards Various Annual improvements to IFRSs 2011-2013 Cycle 12/12/2013 (12/18/2014) No effect
1-3/2014 Effect 1-3/2014 1-3/2014
in € million as published Adjustment 1 Adjustment 2 adjusted Cost of sales (309.2) (0.5) - (309.7) Gross profit 93.1 (0.5) - 92.6 General and administrative expenses (31.3) 0.5 - (30.8) Other income 0.5 - 12.9 13.4 Other expenses (1.8) - (12.9) (14.7)

9
Group of consolidated companies
Compared with the reporting date 12/31/2014, the group of consolidated companies was reduced by the fully con-solidated subsidiary Veitsch Radex America Inc., Burlington, Canada, due to a merger with RHI Canada Inc., Burlington, Canada, and now comprises 78 fully consolidated subsidiaries and one joint venture consolidated using the equity method.
Goodwill
Goodwill developed as follows:
Personnel provisions
For interim reports, provisions for pensions and termination payments are determined on the basis of a preview for the entire year prepared by an actuary. If there are significant changes in the actuarial assumptions in the course of the year, a remeasurement of the net debt from employee-related defined benefit obligation is recog-nized.
As of 03/31/2015, a significant reduction in the actuarial interest rate, especially in the euro area, led to an increase in pension and termination benefit obligations amounting to € 21.0 million (03/31/2014: € 9.3 million) and to a re-duction of equity amounting to € 15.1 million (03/31/2014: € 6.8 million) (after deferred taxes).
Financial liabilities In the first quarter of 2015, Schuldscheindarlehen amounting to € 50.0 million were repaid.
Other income and expenses
Net foreign currency effects and the net amount of gains and losses from derivative financial instruments amount to € 1.4 million (1-3/2014: € (1.3) million).
Restructuring costs
The restructuring costs of € 0.5 million recognized in the first quarter of the previous year resulted from the clo-sure of the plant in Duisburg, Germany, and were related to expenses for the social plan.
in € million 01/01/ -
03/31/2015 01/01/ -
12/31/2014 Cost at beginning of period 38.6 36.7 Currency translation 3.6 1.9 Cost at end of period 42.2 38.6 Accumulated impairment at beginning of period (2.5) (2.2) Currency translation (0.5) 0.1 Impairment losses 0.0 (0.4) Accumulated impairment at end of period (3.0) (2.5) Carrying amounts at end of period 39.2 36.1
2015 RHI Group
10
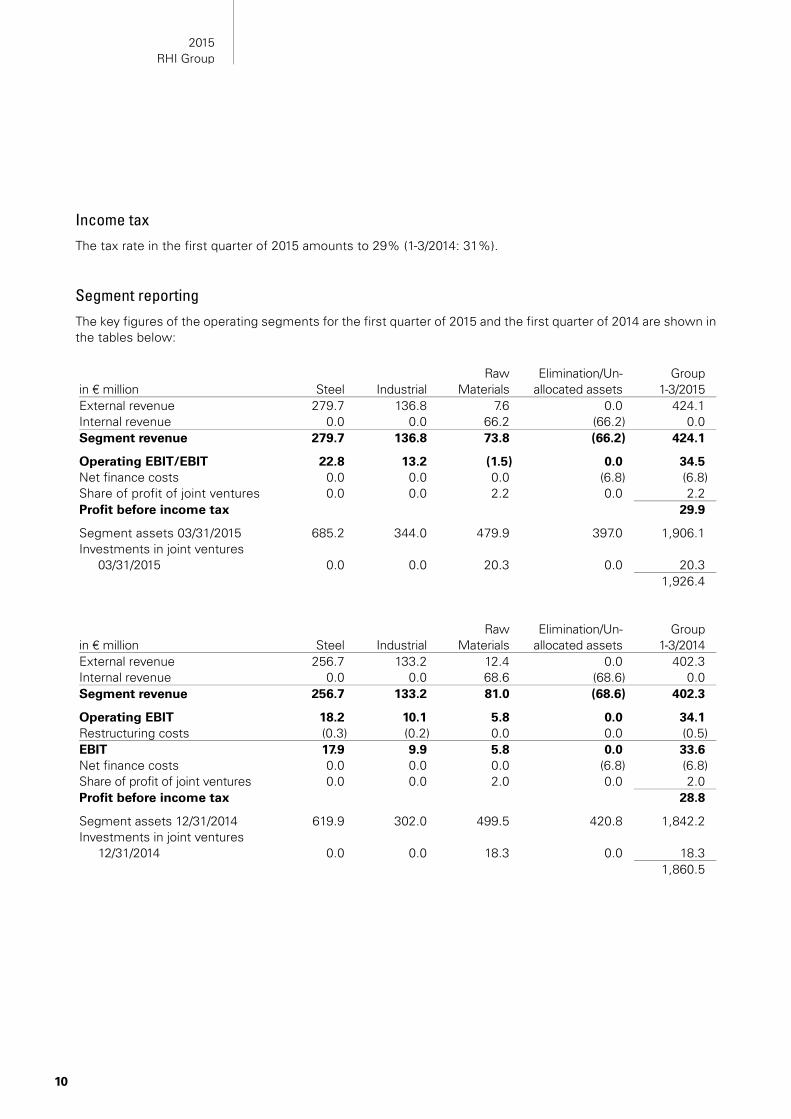
Income tax
The tax rate in the first quarter of 2015 amounts to 29% (1-3/2014: 31%).
Segment reporting
The key figures of the operating segments for the first quarter of 2015 and the first quarter of 2014 are shown in the tables below:
in € million Steel Industrial Raw
Materials Elimination/Un-
allocated assets Group
1-3/2015 External revenue 279.7 136.8 7.6 0.0 424.1 Internal revenue 0.0 0.0 66.2 (66.2) 0.0 Segment revenue 279.7 136.8 73.8 (66.2) 424.1 Operating EBIT/EBIT 22.8 13.2 (1.5) 0.0 34.5 Net finance costs 0.0 0.0 0.0 (6.8) (6.8) Share of profit of joint ventures 0.0 0.0 2.2 0.0 2.2 Profit before income tax 29.9 Segment assets 03/31/2015 685.2 344.0 479.9 397.0 1,906.1 Investments in joint ventures
03/31/2015 0.0 0.0 20.3 0.0 20.3 1,926.4
in € million Steel Industrial Raw
Materials Elimination/Un-
allocated assets Group
1-3/2014 External revenue 256.7 133.2 12.4 0.0 402.3 Internal revenue 0.0 0.0 68.6 (68.6) 0.0 Segment revenue 256.7 133.2 81.0 (68.6) 402.3 Operating EBIT 18.2 10.1 5.8 0.0 34.1 Restructuring costs (0.3) (0.2) 0.0 0.0 (0.5) EBIT 17.9 9.9 5.8 0.0 33.6 Net finance costs 0.0 0.0 0.0 (6.8) (6.8) Share of profit of joint ventures 0.0 0.0 2.0 0.0 2.0 Profit before income tax 28.8 Segment assets 12/31/2014 619.9 302.0 499.5 420.8 1,842.2 Investments in joint ventures
12/31/2014 0.0 0.0 18.3 0.0 18.3 1,860.5

11
Disclosures on financial instruments
The following tables show the carrying amounts and fair values of the financial assets and liabilities by level and measurement category, and the allocation to the measurement levels in accordance with IFRS 13. In addition, the carrying amounts are shown aggregated according to measurement category.
IAS 39 Mea-surement category1) Level
(Amortized) cost
Fair value 03/31/2015
in € million recognized
in profit/loss recognized
in equity Carrying amount
Fair value
Assets Available-for-sale investments FAAC - 0.5 - - 0.5 - Available-for-sale securities AfS 1 - - 36.1 36.1 36.1 Available-for-sale shares AfS 3 - - 2.2 2.2 2.2 Available-for-sale shares FAAC - 1.1 - - 1.1 - Other non-current financial
receivables LaR - 2.2 - - 2.2 - Trade and other current
receivables2) LaR - 345.9 - - 345.9 - Other current financial receivables LaR - 1.8 - - 1.8 - Financial assets held for trading FAHfT 2 - 1.6 - 1.6 1.6 Cash and cash equivalents LaR - 109.7 - - 109.7 - Equity and liabilities Non-current financial liabilities FLAAC 2 420.7 - - 420.7 449.5 Interest derivatives designated as
cash flow hedges - 2 - - 1.4 1.4 1.4 Current financial liabilities FLAAC 2 151.2 - - 151.2 151.5 Financial liabilities held for trading FLHfT 2 - 13.9 - 13.9 13.9 Trade payables and other current
liabilities3) FLAAC - 191.7 - - 191.7 - Aggregated according to measurement category Loans and receivables LaR 459.6 - - 459.6 Available for sale financial
instruments AfS - - 38.3 38.3 Financial assets at cost FAAC 1.6 - - 1.6 Financial assets held for trading FAHfT - 1.6 - 1.6 Financial liabilities measured at
amortized cost FLAAC 763.6 - - 763.6 Financial liabilities held for trading FLHfT - 13.9 - 13.9

2015 RHI Group
12
1) FAAC: Financial assets at cost
AfS: Available for sale financial instruments
LaR: Loans and receivables
FAHfT: Financial assets held for trading
FLAAC: Financial liabilities measured at amortized cost
FLHfT: Financial liabilities held for trading
2) Trade and other current receivables of € 431.3 million (12/31/2014: € 408.4 million) as shown in the statement of financial position also include non-financial assets of € 85.4 million (12/31/2014: € 74.4 million).
3) Trade payables and other current liabilities of € 315.0 million (12/31/2014: € 296.4 million) as shown in the statement of financial position also include non-financial liabilities of € 123.3 million (12/31/2014: € 100.6 million).
IAS 39 Mea-surement category1) Level
(Amortized) cost
Fair value 12/31/2014
in € million recognized
in profit/loss recognized
in equity Carrying amount
Fair value
Assets Available-for-sale investments FAAC - 0.5 - - 0.5 - Available-for-sale securities AfS 1 - - 33.7 33.7 33.7 Available-for-sale shares AfS 3 - - 2.2 2.2 2.2 Available-for-sale shares FAAC - 1.1 - - 1.1 - Other non-current financial
receivables LaR - 2.1 - - 2.1 - Trade and other current
receivables2) LaR - 334.0 - - 334.0 - Other current financial receivables LaR - 1.6 - - 1.6 - Financial assets held for trading FAHfT 2 - 1.6 - 1.6 1.6 Cash and cash equivalents LaR - 151.1 - - 151.1 - Equity and liabilities Non-current financial liabilities FLAAC 2 417.0 - - 417.0 444.0 Interest derivatives designated as
cash flow hedges - 2 - - 1.3 1.3 1.3 Current financial liabilities FLAAC 2 201.0 - - 201.0 201.3 Financial liabilities held for trading FLHfT 2 - 0.4 - 0.4 0.4 Trade payables and other current
liabilities3) FLAAC - 195.8 - - 195.8 - Aggregated according to measurement category Loans and receivables LaR 488.8 - - 488.8 Available for sale financial
instruments AfS - - 35.9 35.9 Financial assets at cost FAAC 1.6 - - 1.6 Financial assets held for trading FAHfT - 1.6 - 1.6 Financial liabilities measured at
amortized cost FLAAC 813.8 - - 813.8 Financial liabilities held for trading FLHfT - 0.4 - 0.4
13
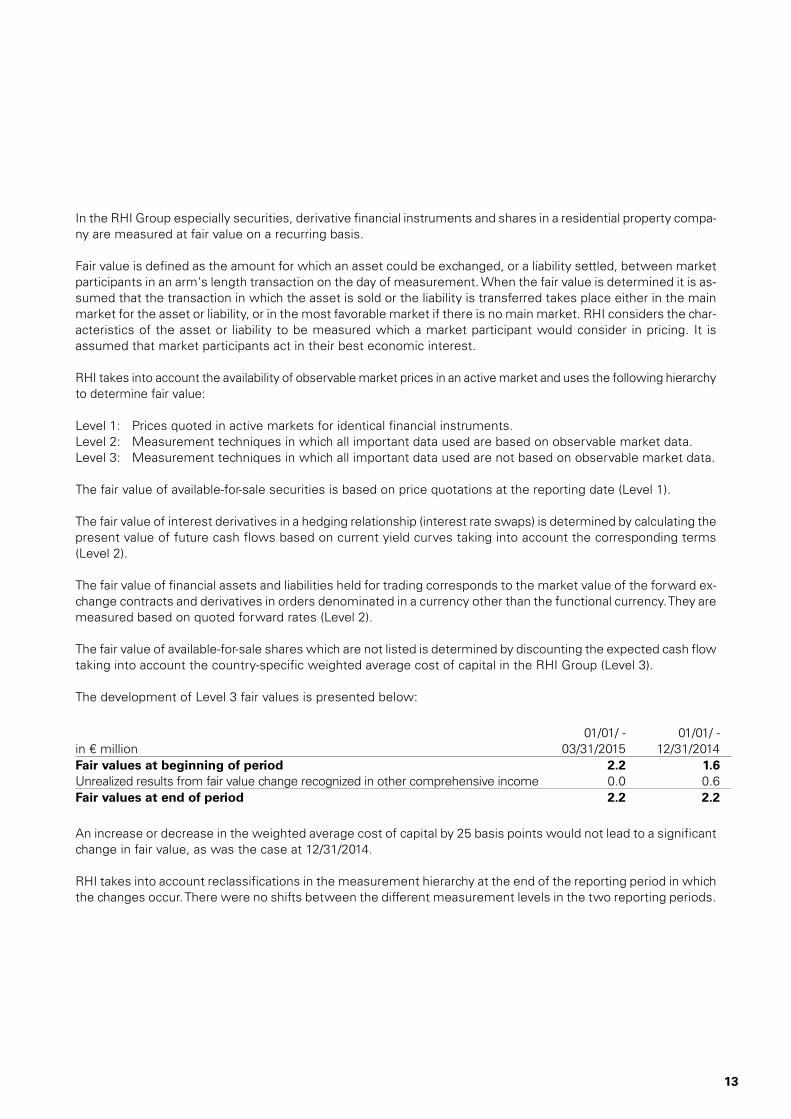
In the RHI Group especially securities, derivative financial instruments and shares in a residential property compa-ny are measured at fair value on a recurring basis.
Fair value is defined as the amount for which an asset could be exchanged, or a liability settled, between market participants in an arm's length transaction on the day of measurement. When the fair value is determined it is as-sumed that the transaction in which the asset is sold or the liability is transferred takes place either in the main market for the asset or liability, or in the most favorable market if there is no main market. RHI considers the char-acteristics of the asset or liability to be measured which a market participant would consider in pricing. It is assumed that market participants act in their best economic interest.
RHI takes into account the availability of observable market prices in an active market and uses the following hierarchy to determine fair value:
The fair value of available-for-sale securities is based on price quotations at the reporting date (Level 1).
The fair value of interest derivatives in a hedging relationship (interest rate swaps) is determined by calculating the present value of future cash flows based on current yield curves taking into account the corresponding terms (Level 2).
The fair value of financial assets and liabilities held for trading corresponds to the market value of the forward ex-change contracts and derivatives in orders denominated in a currency other than the functional currency. They are measured based on quoted forward rates (Level 2).
The fair value of available-for-sale shares which are not listed is determined by discounting the expected cash flow taking into account the country-specific weighted average cost of capital in the RHI Group (Level 3).
The development of Level 3 fair values is presented below:
An increase or decrease in the weighted average cost of capital by 25 basis points would not lead to a significant change in fair value, as was the case at 12/31/2014.
RHI takes into account reclassifications in the measurement hierarchy at the end of the reporting period in which the changes occur. There were no shifts between the different measurement levels in the two reporting periods.
Level 1: Prices quoted in active markets for identical financial instruments. Level 2: Measurement techniques in which all important data used are based on observable market data. Level 3: Measurement techniques in which all important data used are not based on observable market data.
in € million 01/01/ -
03/31/2015 01/01/ -
12/31/2014 Fair values at beginning of period 2.2 1.6 Unrealized results from fair value change recognized in other comprehensive income 0.0 0.6 Fair values at end of period 2.2 2.2

2015 RHI Group
14
Financial liabilities are carried at amortized cost in the statement of financial position. The fair values of the finan-cial liabilities are only shown in the notes. They are calculated as the present value of the discounted future cash flows using yield curves that are currently observable (Level 2).
Available-for-sale investments of € 0.5 million (12/31/2014: € 0.5 million) and available-for-sale shares of € 1.1 million (12/31/2014: € 1.1 million) are equity instruments carried at cost for which there is no quoted price on an active market. It was not possible to derive a fair value based on comparable transactions. These investments and shares are immaterial in comparison with the total position of the Group. The RHI Group intends to liquidate an invest-ment with a carrying amount of € 0.1 million.
The financial receivables roughly correspond to the fair value as no material deviation between the fair value and the carrying amount is assumed due to the amount of the receivables and the credit default risk is accounted for by forming valuation allowances.
The remaining terms of trade and other current receivables and liabilities as well as cash and cash equivalents are predominantly short. Therefore, the carrying amounts of these items approximate fair value at the reporting date.
At the two reporting dates, no contractual netting agreements of financial assets and liabilities were in place.
Related companies The volume of transactions carried out by RHI Group companies with related companies in the first quarter of 2015 is immaterial. The same also applies to accounts receivable from and accounts payable to related companies.
Contingent liabilities There have been no significant changes in contingent liabilities since the previous reporting date.
Seasonal and cyclical influence Explanations regarding seasonal and cyclical influences on the operating activities of the RHI Group can be found in the interim consolidated management report.
Employees In the first quarter of 2015 the average number of employees of the RHI Group weighted by level of employment amounted to 7,973 (1-3/2014: 8,062).
15
Events after the reporting date 03/31/2015 The Annual General Meeting on 05/08/2015 approved the payout of a dividend of € 0.75 per share for the year 2014. Consequently, dividends totaling € 29.9 million will be paid to the shareholders of RHI AG in the second quarter of 2015.
No further events of material importance became known after the reporting date on 03/31/2015.
Vienna, 05/13/2015
Management Board
Franz Struzl CEO
CSO Industrial Division
Barbara Potisk-Eibensteiner CFO
Franz Buxbaum COO
CTO R&D
Reinhold Steiner CSO Steel Division
2015 RHI Group
30
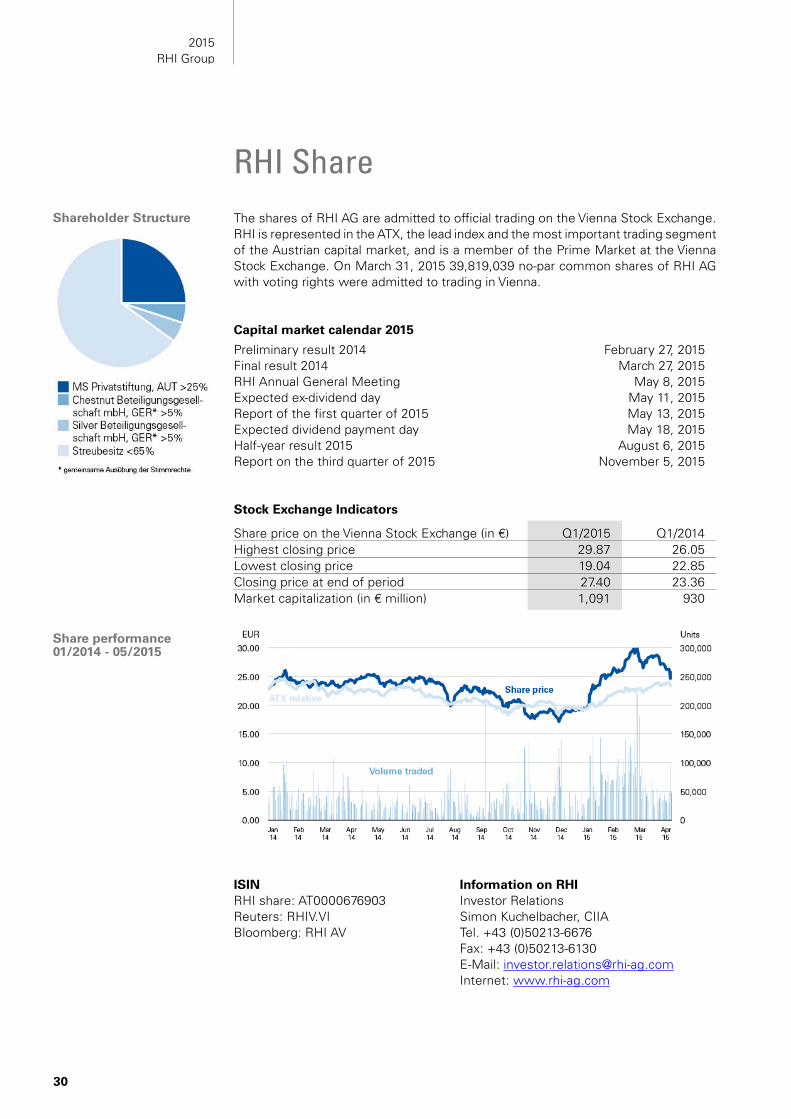
The shares of RHI AG are admitted to official trading on the Vienna Stock Exchange. RHI is represented in the ATX, the lead index and the most important trading segment of the Austrian capital market, and is a member of the Prime Market at the Vienna Stock Exchange. On March 31, 2015 39,819,039 no-par common shares of RHI AG with voting rights were admitted to trading in Vienna. Capital market calendar 2015
Preliminary result 2014 February 27, 2015 Final result 2014 March 27, 2015 RHI Annual General Meeting May 8, 2015 Expected ex-dividend day May 11, 2015 Report of the first quarter of 2015 May 13, 2015 Expected dividend payment day May 18, 2015 Half-year result 2015 August 6, 2015 Report on the third quarter of 2015 November 5, 2015 Stock Exchange Indicators
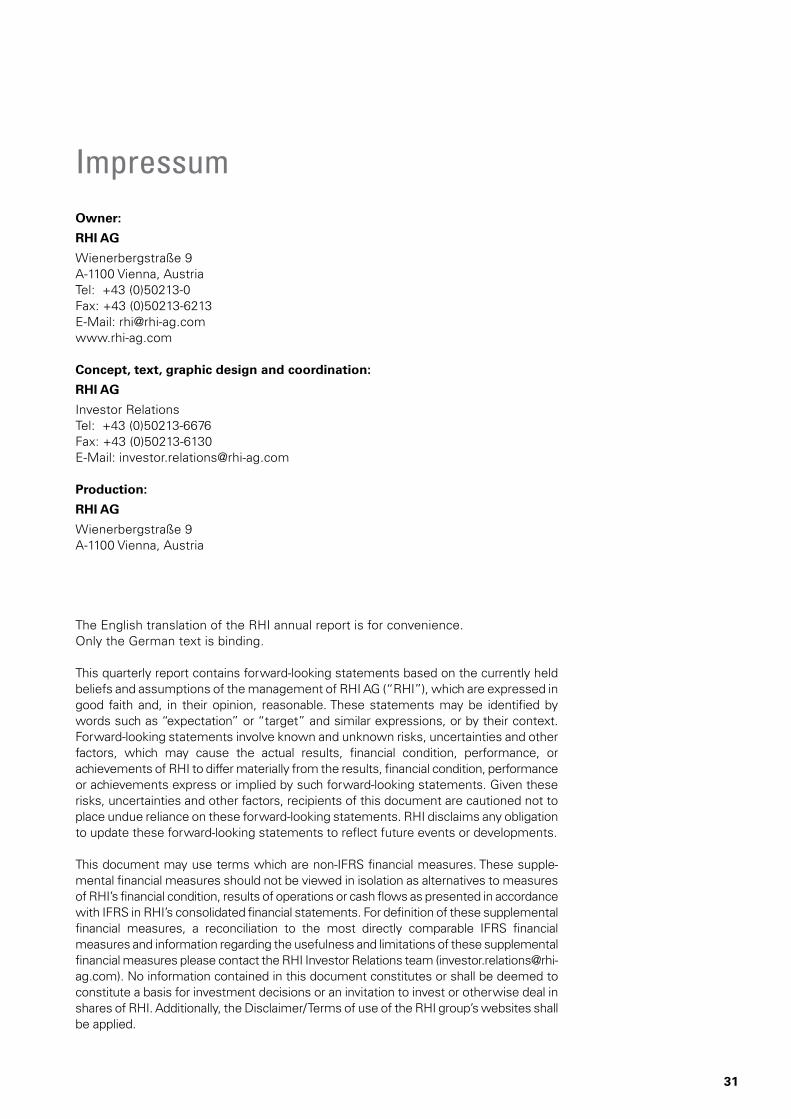
Share price on the Vienna Stock Exchange (in €) Q1/2015 Q1/2014 Highest closing price 29.87 26.05 Lowest closing price 19.04 22.85 Closing price at end of period 27.40 23.36 Market capitalization (in € million) 1,091 930
ISIN Information on RHI RHI share: AT0000676903 Investor Relations Reuters: RHIV.VI Simon Kuchelbacher, CIIA Bloomberg: RHI AV Tel. +43 (0)50213-6676 Fax: +43 (0)50213-6130 E-Mail: [email protected] Internet: www.rhi-ag.com
RHI Share Shareholder Structure
Share performance 01/2014 - 05/2015
31
Owner:
RHI AG
Wienerbergstraße 9 A-1100 Vienna, Austria Tel: +43 (0)50213-0 Fax: +43 (0)50213-6213 E-Mail: [email protected] www.rhi-ag.com
Concept, text, graphic design and coordination:
RHI AG
Investor Relations Tel: +43 (0)50213-6676 Fax: +43 (0)50213-6130 E-Mail: [email protected]
Production:
RHI AG
Wienerbergstraße 9 A-1100 Vienna, Austria
The English translation of the RHI annual report is for convenience. Only the German text is binding.
This quarterly report contains forward-looking statements based on the currently held beliefs and assumptions of the management of RHI AG (“RHI”), which are expressed in good faith and, in their opinion, reasonable. These statements may be identified by words such as “expectation” or “target” and similar expressions, or by their context. Forward-looking statements involve known and unknown risks, uncertainties and other factors, which may cause the actual results, financial condition, performance, or achievements of RHI to differ materially from the results, financial condition, performance or achievements express or implied by such forward-looking statements. Given these risks, uncertainties and other factors, recipients of this document are cautioned not to place undue reliance on these forward-looking statements. RHI disclaims any obligation to update these forward-looking statements to reflect future events or developments.
This document may use terms which are non-IFRS financial measures. These supple-mental financial measures should not be viewed in isolation as alternatives to measures of RHI’s financial condition, results of operations or cash flows as presented in accordance with IFRS in RHI’s consolidated financial statements. For definition of these supplemental financial measures, a reconciliation to the most directly comparable IFRS financial measures and information regarding the usefulness and limitations of these supplemental financial measures please contact the RHI Investor Relations team ([email protected]). No information contained in this document constitutes or shall be deemed to constitute a basis for investment decisions or an invitation to invest or otherwise deal in shares of RHI. Additionally, the Disclaimer/ Terms of use of the RHI group’s websites shall be applied.
Impressum