report for the 2nd quarter 2018 - euroland
TRANSCRIPT

Report for the 2nd quarter 2018
Norwegian Finans Holding ASA

Letter from the CEO
Current quarter
Bank Norwegian is operating in a benign environment. The Nordic region is still experiencing robust
GDP development and favorable employment on an overall level combined with low interest rates.
Regulatory focus on the financial industry has increased lately to ensure sustainable development in
household economies. Bank Norwegian has successfully adapted its historically solid credit vetting and
prudent provision policy to accommodate updated regulations and guidelines.
Second quarter results reflect the favorable backdrop where record high profits of MNOK 484 are
combined with robust growth both in terms of loans and customers. Customer engagement continues
to increase as shown from the app where app logins exceeded 40,000 customers daily and 1 million
monthly. The app was revamped in June to improve sales and interactive communication with our 1.4
million customers.
During the quarter, the mutually beneficial partnership with Norwegian Air Shuttle ASA was extended
by a 10-year agreement. Our focus is still on the attractive Nordic region, with an option to explore
new markets. We launched additional third-party insurance products in addition to the current offering
of products comprising more than 100,000 active policies. Insurance is an area that has not yet been
developed to its full potential and will be further explored.
Two-tier strategy
In addition to favorable macro conditions, we expect continued growth in our core products due to
the strong awareness of- and trust in Bank Norwegian’s brand in all markets. Further, IFRS 9
implementation and improved risk selection tools such as proprietary scorecards throughout our
footprint will optimize pricing and strengthen the competitive position.
Bank Norwegian’s cost-efficient operation and fully digitalized customer journey combined with a
focused selection of own products on the balance sheet enables us to be highly competitive and is
widely considered to be the future model of banking. Going forward we will leverage our customer
insight, trust and engagement to enter lucrative niche markets and provide access to industry-leading
services from third parties in addition to our own products. Bank Norwegian will explore
the attractiveness of account information agent (AISP) and payment agent (PISP) positions in
connection with the implementation of PSD2 regulation by Nordic banks to ensure rapid
implementation of chosen commercial positions.
Bærum, August 14, 2018
-----------------------------------------
Tine Wollebekk, CEO
Report for the 2nd quarter 2018 Norwegian Finans Holding ASA
1

Norwegian Finans Holding ASA Report for the 2nd quarter 2018
Norwegian Finans Holding ASA (NFH) owns 100% of the shares in Bank Norwegian AS. The company does not engage in any other operations. The ownership of Norwegian Finans Holding ASA is divided between institutional and private investors in Norway and abroad, of which Norwegian Air Shuttle ASA is the largest owner with a stake of 16.4% at the end of the 2nd quarter 2018. Norwegian Finans Holding ASA is listed on the Oslo Stock Exchange with the ticker code NOFI.
Bank Norwegian started its operations in November 2007 and offers consumer loans, credit cards and deposit accounts to retail customers distributed through the Internet in the Nordic market. Bank Norwegian offers, in cooperation with the airline Norwegian, a combined credit card and reward card. The bank started operations in Sweden in May 2013. In December 2015 the bank launched operations in Denmark and Finland, where it initially offered consumer loans and deposit accounts. Credit cards were launched in June 2016.
Bank Norwegian is a digital bank that offers simple and competitive products to the retail market. The strategy is based on leading digital solutions, synergies with the airline Norwegian, attractive terms for our customers, cost-effective operations and effective risk selection.
At the end of the 2nd quarter 2018 the NFH Group had a customer base of 1,392,600 customers, which can be broken down into 1,018,300 credit card customers, 187,400 loan customers and 186,900 deposit customers.
Profit and loss as of June 30, 2018 The NFH Group’s comprehensive income amounted to MNOK 893.4 as of June 30, 2018, compared with MNOK 728.4 for the same period in 2017. Net interest income totalled MNOK 2,120.3, net other operating income amounted to MNOK 134.4, while total operating expenses were MNOK 619.9. Provisions for loan losses were MNOK 443.6.
Profit and loss for the 2nd quarter 2018 The NFH Group’s comprehensive income amounted to MNOK 482.8 compared with MNOK 410.6 in the 1st quarter 2018. Annual return on equity in the 2nd quarter was 33.4%, while return on assets was 4.2%.
Net interest income amounted to MNOK 1,091.8, an increase of MNOK 63.3 from the 1st quarter. The increase is mainly explained by loan growth. The net interest margin was 9.4%, compared with 9.5% in the 1st quarter.
Net other operating income amounted to MNOK 94.1 compared with MNOK 40.4 in the 1st quarter. Net commission income increased with MNOK 19.1 to MNOK 73.0 due to network and insurance incentive in addition to increased credit card usage. Net gain on securities and currency amounted to MNOK 21.1, compared with a net loss of MNOK 13.5 in the 1st quarter. The change is due to a gain on currency, compared with a loss in the 1st quarter.
Total operating expenses amounted to MNOK 307.4 compared with MNOK 312.6 in the 1st quarter. Personnel expenses decreased with MNOK 4.1 due to accrual effects. The MNOK 2.1 decrease in administrative expenses is explained by lower spending on digital marketing expenses and non-recurring items in the 1st quarter. Depreciation increased with MNOK 0.2. Other operating expenses increased with MNOK 0.8.
The NFH Group’s write-downs on loans were MNOK 234.7, an increase of MNOK 25.8 from the 1st quarter. Write-downs in the 2nd quarter equalled 2.6% of average gross loans, compared with 2.4% in the 1st quarter. Gross delinquent loans were MNOK 3,785, compared with MNOK 3,160 at the end of the 1st quarter. Delinquent loans accounted for 10.3% of gross loans, compared with 9.0% at the end of the 1st quarter. Gross non-performing loans accounted for 8.1% of gross loans, compared with 7.1% as of 31.3.2018. The level of non-performing loans is developing as expected considering the unseasoned portfolios in Denmark and Finland, and the portfolios in Norway and Sweden are increasing from a low base following the sale of non-performing loan portfolios in 2017.
Balance sheet as of June 30, 2018 Total assets increased with MNOK 2,179 in the quarter and amounted to MNOK 47,551.
Net loans to customers increased MNOK 1,621 and amounted to MNOK 35,435. The loan growth is comparable to the previous quarter, adjusted for currency changes. Consumer loans amounted to MNOK 26,465 and credit card loans amounted to MNOK 10,421.
Customer deposits increased MNOK 1,917 and amounted to MNOK 37,706 at the end of the quarter.
Liquid assets increased MNOK 582 and amounted to MNOK 11,779, equivalent to 24.8% of total assets.
The general meeting in Bank Norwegian AS resolved to distribute a group contribution of MNOK 247.5 in the 2nd quarter to Norwegian Finans Holding ASA.
Total equity amounted to MNOK 6,655, compared with MNOK 6,174 as of 31.3.2018. The total capital ratio was 21.1%, the core capital ratio was 19.6% and the common equity tier 1 ratio was 17.7% as of 30.6.2018.
There has been a limited review of the accounts as of 30.6.2018, and the full result is added to retained earnings.
Outlook for the remaining of the year The economic trends in the Nordic markets where the NFH Group operates are positive. The Norwegian economy shows increasing growth and falling unemployment rate. The Swedish economy is showing a high economic growth. The Danish and Finnish economies show moderate growth and an improved labor market.
The interest rate levels in the countries where the NFH Group is represented are expected to remain low, although higher interest rates are expected going forward. The NFH
Report for the 2nd quarter 2018 Norwegian Finans Holding ASA
2

Group is still expected to benefit from the interest rate level through low funding costs.
The earnings growth is expected to continue through strong loan growth, stable margins, cost control and good credit quality, even though the Nordic market for unsecured credit is impacted by increased competition. Increased competition may lead to higher customer acquisition cost, margin pressure or lower growth. Increased run-off in line with a growing portfolio may affect future loan growth.
The NFH Group has a broad Nordic platform and loan volumes are growing faster outside of Norway. The NFH Group has therefore a diversified risk in relation to the individual markets.
A high deposit to loans ratio and good access to the securities market are expected to maintain the NFH Group’s strong liquidity position.
The investment portfolio has provided a satisfactory return. The portfolio's low risk mandate will remain.
The credit quality of the loan portfolio in Norway shows a stable development and the levels of write-downs are
expected to remain stable going forward.
After the sale of non-performing loan portfolios in Norway and Sweden, the delinquency is expected to gradually increase to a normalized level. The Danish and Finnish loan portfolios show a stable development. Relatively high write-downs in Denmark and Finland are still expected for a period going forward.
Common equity tier 1 ratio was 17.7% at the reporting date and exceeds the current minimum common equity tier 1 ratio requirement of 15.5% with a wide margin. The NFH Group aims to maintain a good margin to the minimum capital adequacy requirements.
The current capital base and internal generation of capital are considered sufficient to ensure the NFH Group's growth ambitions.
As previously announced, July 4th, Norwegian Finans Holding ASA does not expect to pay dividends based on interim financial accounts in 2018. Any dividend based on interim financial accounts must await legal clarification and regulatory dialog.
Bærum, August 14, 2018 Board of directors of Norwegian Finans Holding ASA
_________________ Bjørn Østbø
Chairman of the Board
_________________ John Høsteland Board Member
____________________ Anita Aarnæs
Board Member
_________________ Christine Rødsæther
Board Member
____________________ Gunn Ingemundsen
Board Member
____________________ Rolv-Erik Spilling Board Member
____________________ Tine Wollebekk
CEO
Report for the 2nd quarter 2018 Norwegian Finans Holding ASA
3

Profit and loss account
Norwegian Finans Holding Group
Amounts in NOK 1000 Note Q2 2018 Q2 2017 YTD 2018 YTD 2017 2017
Interest income, amortised cost 1,222,548 992,282 2,369,547 1,904,990 4,077,561
Other interest income 23,863 24,177 48,069 45,518 95,122
Interest expenses 154,602 124,215 297,268 232,561 502,211
Net interest income 10 1,091,808 892,245 2,120,348 1,717,947 3,670,472
Commission and bank services income 11 143,359 93,728 263,198 174,620 399,998
Commission and bank services expenses 11 70,387 50,118 136,379 92,267 211,091
Net change in value on securities and currency 12 21,089 4,612 7,613 10,127 7,458
Net other operating income 94,061 48,222 134,432 92,480 196,365
Total income 1,185,869 940,467 2,254,780 1,810,427 3,866,837
Personnel expenses 17,373 16,351 38,858 35,745 74,957
General administrative expenses 13 264,770 215,419 531,664 431,398 906,286
Ordinary depreciation 12,150 10,861 24,072 22,236 44,477
Other operating expenses 14 13,082 10,835 25,350 22,423 45,484
Total operating expenses before losses 307,374 253,466 619,944 511,803 1,071,204
Provision for loan losses 3, 5, 6 234,707 155,193 443,609 332,417 672,388
Profit before tax 643,788 531,808 1,191,227 966,207 2,123,245
Tax charge 160,967 132,779 297,794 241,387 526,194
Profit after tax 482,822 399,029 893,433 724,820 1,597,050
Earnings per share (kroner) 2.59 2.19 4.79 3.97 8.60
Diluted earning per share (kroner) 2.59 2.19 4.79 3.97 8.60
Comprehensive incomeNorwegian Finans Holding Group
Amounts in NOK 1000 Q2 2018 Q2 2017 YTD 2018 YTD 2017 2017
Profit on ordinary activities after tax 482,822 399,029 893,433 724,820 1,597,050
Change in fair value for assets available for sale - 937 - 3,629 8,176
Tax - -7 - -27 -61
Other comprehensive income - 930 - 3,602 8,115
Comprehensive income for the period 482,822 399,959 893,433 728,421 1,605,165
Report for the 2nd quarter 2018 Norwegian Finans Holding ASA
4

Balance sheetNorwegian Finans Holding Group
Amounts in NOK 1000 Note 30.6.18 30.6.17 31.12.17
Assets
Cash and deposits with the central bank 9, 16 65,975 61,981 65,976
Loans and deposits with credit institutions 9, 16 2,323,345 1,394,852 1,260,947
Loans to customers 4, 7, 16 35,434,748 28,868,053 32,451,553
Certificates and bonds 15 9,389,792 8,185,779 8,859,834
Financial derivatives 15 43,768 946 1,935
Shares and other securities 15, 18 37,476 443 443
Assets available for sale 15, 18 - 28,374 32,922
Intangible assets 114,923 117,965 114,678
Deferred tax asset 11,157 8,318 15,904
Fixed assets 810 1,094 1,000
Receivables 19 128,630 131,124 194,800
Total assets 47,550,624 38,798,929 42,999,992
Liabilities and equity
Loans from credit institutions 85,450 - -
Deposits from customers 16 37,705,983 30,922,923 33,682,275
Debt securities issued 16, 17 1,808,003 2,040,622 2,242,423
Financial derivatives 15 2,494 3,999 52,246
Tax payable 543,078 239,822 525,886
Other liabilities 20 91,355 163,695 158,711
Accrued expenses 21 184,321 101,988 150,216
Subordinated loan 16, 17 474,622 474,721 474,614
Total liabilities 40,895,306 33,947,770 37,286,371
Share capital 186,689 186,619 186,689
Share premium 971,182 966,570 971,182
Paid, not registered capital 5,819 4,683 -
Tier 1 capital 635,000 635,000 635,000
Retained earnings and other reserves 4,856,628 3,058,288 3,920,750
Total equity 22 6,655,318 4,851,159 5,713,621
Total liabilities and equity 47,550,624 38,798,929 42,999,992
_________________
Tine Wollebekk
CEO
Board MemberBoard Member Board Member
Rolv-Erik Spilling
_________________ _________________ _________________
Christine Rødsæther Gunn Ingemundsen
Board Member
Bærum, 14 August, 2018
Board of directors of Norwegian Finans Holding ASA
John Høsteland
_________________ _________________ _________________
Bjørn Østbø Anita Aarnæs
Chairman of the Board Board Member
Report for the 2nd quarter 2018 Norwegian Finans Holding ASA
5

Cash flow statementNorwegian Finans Holding Group
Amounts in NOK 1000 Q2 2018 Q2 2017 2017
Profit / loss after tax 893,433 728,421 1,605,165
Unrealized gains or losses on currency 102,244 10,445 47,565
Depreciations and amortizations 24,072 22,236 44,477
Provision for loan losses 443,609 332,417 672,388
Change in loans to customers -3,372,237 -4,685,149 -8,602,143
Change in deposits from customers 4,023,708 6,499,150 9,258,502
Change in certificates and bonds -529,958 -3,721,577 -4,395,632
Change in assets available for sale, before tax - 3,629 8,176
Change in receivables, deferred tax asset and financial derivatives 31,311 -32,752 -105,003
Change in loans from credit institutions 85,450 - -
Change in shares and other securities -4,112 - -
Change in tax payable, accrued expenses and other liabilities -65,810 -34,810 342,744
Net cash flow from operating activities 1,631,710 -877,990 -1,123,760
Payment for acquisition of intangible assets -24,127 -20,950 -55,381
Payment for acquisition of tangible assets - -1,050 -1,050
Net cash flow from investment activities -24,127 -22,000 -56,431
Paid-in share capital and share premium - 495,787 495,787
Paid, not registered capital 5,819 - -
Issued debt securities - 500,000 1,299,320
Repayment of debt securities -434,413 -283,351 -880,870
Issued subordinated loan - 199,806 199,699
Issued Tier 1 capital - 299,250 299,250
Paid interest Tier 1 capital -14,347 -7,576 -21,858
Net cash flow from financing activities -442,942 1,203,916 1,391,328
Currency effect on cash and cash equivalents -102,244 -10,445 -47,565
Net cash flow for the period 1,062,398 293,482 163,571
Cash and cash equivalents at the start of the period 1,326,922 1,163,351 1,163,351
Cash and cash equivalents at the end of the period 2,389,320 1,456,833 1,326,922
Report for the 2nd quarter 2018 Norwegian Finans Holding ASA
6

Changes in equityNorwegian Finans Holding Group
Amounts in NOK 1000
Balance 31.12.17 186,689 971,182 - 635,000 3,920,750 5,713,621
This period's profit - - - - 893,433 893,433
Items that may be reclassified to profit and loss, after tax - - - - - -
Comprehensive income for the period - - - - 893,433 893,433
Paid interest Tier 1 capital - - - - -14,347 -14,347
Capital increase - - 5,819 - - 5,819
Other changes - - - - 2,226 2,226
Change in write-downs under IFRS 9 - - - - 54,567 54,567
Balance 30.6.18 186,689 971,182 5,819 635,000 4,856,629 6,655,318
Amounts in NOK 1000
Balance 31.12.16 180,105 481,980 - 335,000 2,338,191 3,335,276
This period's profit - - - - 724,820 724,820
Items that may be reclassified to profit and loss, after tax - - - - 3,602 3,602
Comprehensive income for the period - - - - 728,421 728,421
Paid interest Tier 1 capital - - - - -7,575 -7,575
Capital increase 6,515 493,485 4,683 - - 504,682
Share issue expenses - -8,895 - - - -8,895
Issued Tier 1 capital - - - 300,000 -750 299,250
Balance 30.6.17 186,619 966,570 4,683 635,000 3,058,288 4,851,159
Share
capital
Share
premium
Tier 1
capital
Retained
earnings and
other reserves
Total
equity
Paid, not
registered
capital
Report for the 2nd quarter 2018 Norwegian Finans Holding ASA
7

IASB has published the final version of IFRS 9 Financial Instruments , which replaced IAS 39 Financial Instruments – Recognition and Measurement .
IFRS 9 introduced changes to the rules for the classification and measurement of financial instruments, impairment of financial assets and hedge
accounting. The standard is effective for annual reporting periods beginning on 1 January 2018 or later. Earlier application is permitted. The standard
must be applied retrospectively, except for hedge accounting. Restatement of comparative figures is not required. The standard was approved by the EU
in the 4th quarter of 2016.
The rules for classification and measurement of financial assets under IFRS 9 are more principle-based than the rules under IAS 39. Under IFRS 9,
financial assets are assessed based on the entity’s business model and the asset’s cash flows. The NFH Group has made an assessment of the balance
sheet with regards to classification and measurement of financial assets. The NFH Group has reclassified Assets available for sale to Shares and other
securities . The classification and measurement of the NFH Group’s financial liabilities have not been affected by the transition to IFRS 9.
Assets available for sale , which consist of the NFH Group’s ownership interest in Visa Norge FLI, was under IAS 39 classified at fair value through other
comprehensive income (with reclassification). The asset was held for sale, and will after the implementation of IFRS 9 be classified at fair value through
profit and loss. For further details, see note 3.
IFRS 9 requires write-downs on loans to be calculated using different assumptions about future development of credit losses. The NFH Group has made
calculations of losses under IFRS 9 based on a base, upper and lower scenario. The calculations at 31.12.17 show a reduction of write-downs of NOK 55
million after tax compared to write-downs under IAS 39. The decreased in write-downs has been booked as a change in equity as per 1.1.2018, and
increased Loans to customers .
In connection with the introduction of IFRS 9, an amendment to IAS 1, par. 82 (a) was made that applies to accounting periods beginning on or after
January 1, 2018. According to this change, interest income calculated using the effective interest rate method (financial assets measured at amortized
cost or at fair value through comprehensive income) shall be presented separately in the income statement. The NFH Group has classified Cash and
deposits with the central bank , Loans and deposits with credit institutions and Loans to customers at amortized cost. Interest income calculated using the
effective interest method is presented separately in the income statement. Comparative figures are presented accordingly.
Norwegian Finans Holding ASA has received a group contribution of 247,5 million from its subsidiary Bank Norwegian AS in the second quarter.
Notes
Note 1. General accounting principles
The interim report for the second quarter 2018 is prepared according to International Financial Reporting Standards as adopted by the European Union,
hereunder IAS 34 Interim Financial Reporting . The interim report for the second quarter 2018 is prepared according to the Norwegian Ministry of
Finance's regulations on annual accounts, Section 1-6, on the use of IFRS.
IFRS 9 - Financial Instruments
Accounting standards which have been implemented in 2018
Report for the 2nd quarter 2018 Norwegian Finans Holding ASA
8

Note 2. Segments
Profit and loss account Q2 2018 YTD
Amounts in NOK 1000 Norway Sweden Denmark Total
Net interest income 1,026,904 363,658 228,890 500,892 4 2,120,348
Net other operating income 85,865 40,569 11,533 -3,238 -296 134,432
Total income 1,112,769 404,227 240,423 497,654 -292 2,254,780
Total operating expenses before losses 271,579 143,322 77,814 125,576 1,653 619,944
Provision for loan losses 113,233 69,064 95,766 165,546 - 443,609
Profit before tax 727,957 191,840 66,844 206,532 -1,945 1,191,227
Tax charge 181,989 47,960 16,711 51,633 -499 297,794
Profit after tax 545,967 143,880 50,133 154,899 -1,446 893,433
Other comprehensive income - - - - - -
Comprehensive income for the period 545,967 143,880 50,133 154,899 -1,446 893,433
Balance sheet 30.6.18Amounts in NOK 1000 Norway Sweden Denmark Total
Loans to customers 17,854,487 5,705,343 3,524,529 8,350,356 - 35,434,716
Other assets 6,880,984 2,120,460 954,403 1,902,449 257,612 12,115,908
Total assets 24,735,471 7,825,804 4,478,932 10,252,806 257,612 47,550,624
Deposits from customers 18,897,900 5,975,535 3,466,248 9,366,268 - 37,705,951
Other liabilities and equity 5,837,571 1,850,269 1,012,683 886,538 257,612 9,844,673
Total liabilities and equity 24,735,471 7,825,804 4,478,932 10,252,806 257,612 47,550,624
Profit and loss account Q2 2017 YTDAmounts in NOK 1000 Norway Sweden Denmark Total
Net interest income 953,850 321,670 134,878 307,508 41 1,717,947
Net other operating income 62,580 28,937 230 922 -188 92,480
Total income 1,016,430 350,606 135,108 308,430 -147 1,810,427
Total operating expenses before losses 252,282 111,428 68,850 77,645 1,596 511,803
Provision for loan losses 128,084 59,869 66,844 77,621 - 332,417
Profit before tax 636,063 179,309 -586 153,164 -1,743 966,207
Tax charge 159,021 44,827 -145 38,285 -601 241,387
Profit after tax 477,042 134,482 -441 114,879 -1,142 724,820
Other comprehensive income 3,602 - - - - 3,602
Comprehensive income for the period 480,644 134,482 -441 114,879 -1,142 728,421
Balance sheet 30.6.17Amounts in NOK 1000 Norway Sweden Denmark Total
Loans to customers 15,678,158 5,223,041 2,448,201 5,518,653 - 28,868,053
Other assets 7,827,478 867,892 1,010,810 217,065 7,631 9,930,876
Total assets 23,505,637 6,090,933 3,459,011 5,735,717 7,631 38,798,929
Deposits from customers 17,374,054 5,601,487 3,349,468 4,597,914 - 30,922,923
Other liabilities and equity 6,131,583 489,446 109,543 1,137,803 7,631 7,876,006
Total liabilities and equity 23,505,637 6,090,933 3,459,011 5,735,717 7,631 38,798,929
Profit and loss account 2017Amounts in NOK 1000 Norway Sweden Denmark Total
Net interest income 1,947,738 662,788 320,989 738,913 45 3,670,472
Net other operating income 128,393 60,055 3,864 4,414 -362 196,365
Total income 2,076,131 722,843 324,853 743,327 -317 3,866,837
Total operating expenses before losses 508,491 248,391 136,989 174,317 3,016 1,071,204
Provision for loan losses 192,354 147,436 151,982 180,617 - 672,388
Profit before tax 1,375,286 327,017 35,882 388,393 -3,333 2,123,245
Tax charge 336,358 84,575 7,532 98,531 -801 526,194
Profit after tax 1,038,928 242,442 28,350 289,862 -2,532 1,597,050
Other comprehensive income 8,115 - - - - 8,115
Comprehensive income for the period 1,047,043 242,442 28,350 289,862 -2,532 1,605,165
Balance 31.12.17Amounts in NOK 1000 Norway Sweden Denmark Total
Loans to customers 16,561,731 5,718,448 3,121,962 7,049,412 - 32,451,553
Other assets 6,462,719 1,937,559 926,098 1,210,522 11,541 10,548,439
Total assets 23,024,450 7,656,007 4,048,060 8,259,934 11,541 42,999,992
Deposits from customers 17,909,401 5,875,474 3,313,982 6,583,384 - 33,682,241
Other liabilities and equity 5,115,048 1,780,534 734,078 1,676,550 11,541 9,317,751
Total liabilities and equity 23,024,450 7,656,008 4,048,060 8,259,934 11,541 42,999,992
Finland
Finland
The profit and loss and balance sheet presentation for segments are based on internal financial reporting as it is reported to the groups management. The
figures are based on the NFH Group's governance model and accounting principles.
Finland
Finland
Finland
Finland
Other
Other
Other
Other
Other
Other
Report for the 2nd quarter 2018 Norwegian Finans Holding ASA
9

Change in balance sheet items
Financial assets Category Category
Cash and deposits with sentral banks Amortised cost 65,976 Amortised cost 65,976
Loans and deposits with credit institutions Amortised cost 1,260,947 Amortised cost 1,260,947
Loans to customers Amortised cost 32,451,553 Amortised cost 32,524,311
Certificates and bonds Fair value 8,859,834 Fair value 8,859,834
Financial derivatives Fair value 1,935 Fair value 1,935
Shares and other securities Fair value 443 Fair value 33,365
Assets available for sale* Fair value** 32,922 Fair value -
* Will be reclassified to Shares and other securites under IFRS 9.
** Fair value through other comprehensive income.
The tables below show the reclassification of balance sheet items and new expected credit loss.
Loans to customers
Balance 31.12.17 32,451,553 - - -
Change in expected credit loss - - 72,758 -
Balance 1.1.18 - - - 32,524,311
ECL IAS 39 IFRS 9
Balance 31.12.17 1,140,152 - - -
Change in expected credit loss - - -72,758 -
Balance 1.1.18 - - - 1,067,394
Shares and other securities IAS 39 IFRS 9
Balance 31.12.17 443 - - -
Reclassification - 32,922 - -
Balance 1.1.18 - - - 33,365
Assets available for sale IAS 39 IFRS 9
Balance 31.12.17 32,922 - - -
Reclassification - -32,922 - -
Balance 1.1.18 - - - -
IAS 39 IFRS 9
IFRS 9 IAS 39
Book value
31.12.17
Book value
1.1.18
New model
for expected
credit loss
Reclass-
ification
Reclass-
ification
Reclass-
ification
New model
for expected
credit loss
New model
for expected
credit loss
Note 3. IFRS 9
New model
for expected
credit loss
Reclass-
ification
Note 3.1. Change in balance sheet items
Report for the 2nd quarter 2018 Norwegian Finans Holding ASA
10
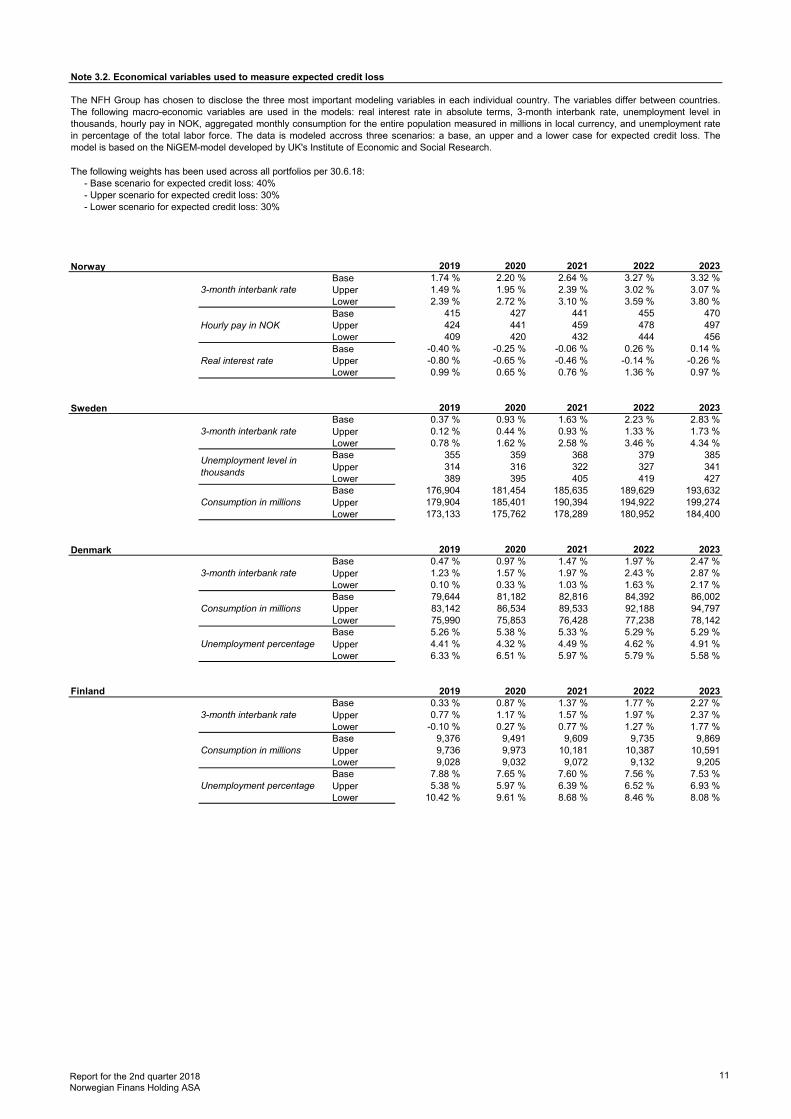
The following weights has been used across all portfolios per 30.6.18:
- Base scenario for expected credit loss: 40%
- Upper scenario for expected credit loss: 30%
- Lower scenario for expected credit loss: 30%
Norway 2019 2020 2021 2022 2023
Base 1.74 % 2.20 % 2.64 % 3.27 % 3.32 %
3-month interbank rate Upper 1.49 % 1.95 % 2.39 % 3.02 % 3.07 %
Lower 2.39 % 2.72 % 3.10 % 3.59 % 3.80 %
Base 415 427 441 455 470
Hourly pay in NOK Upper 424 441 459 478 497
Lower 409 420 432 444 456
Base -0.40 % -0.25 % -0.06 % 0.26 % 0.14 %
Real interest rate Upper -0.80 % -0.65 % -0.46 % -0.14 % -0.26 %
Lower 0.99 % 0.65 % 0.76 % 1.36 % 0.97 %
Sweden 2019 2020 2021 2022 2023
Base 0.37 % 0.93 % 1.63 % 2.23 % 2.83 %
3-month interbank rate Upper 0.12 % 0.44 % 0.93 % 1.33 % 1.73 %
Lower 0.78 % 1.62 % 2.58 % 3.46 % 4.34 %
Base 355 359 368 379 385
Upper 314 316 322 327 341
Lower 389 395 405 419 427
Base 176,904 181,454 185,635 189,629 193,632
Consumption in millions Upper 179,904 185,401 190,394 194,922 199,274
Lower 173,133 175,762 178,289 180,952 184,400
Denmark 2019 2020 2021 2022 2023
Base 0.47 % 0.97 % 1.47 % 1.97 % 2.47 %
3-month interbank rate Upper 1.23 % 1.57 % 1.97 % 2.43 % 2.87 %
Lower 0.10 % 0.33 % 1.03 % 1.63 % 2.17 %
Base 79,644 81,182 82,816 84,392 86,002
Consumption in millions Upper 83,142 86,534 89,533 92,188 94,797
Lower 75,990 75,853 76,428 77,238 78,142
Base 5.26 % 5.38 % 5.33 % 5.29 % 5.29 %
Unemployment percentage Upper 4.41 % 4.32 % 4.49 % 4.62 % 4.91 %
Lower 6.33 % 6.51 % 5.97 % 5.79 % 5.58 %
Finland 2019 2020 2021 2022 2023
Base 0.33 % 0.87 % 1.37 % 1.77 % 2.27 %
3-month interbank rate Upper 0.77 % 1.17 % 1.57 % 1.97 % 2.37 %
Lower -0.10 % 0.27 % 0.77 % 1.27 % 1.77 %
Base 9,376 9,491 9,609 9,735 9,869
Consumption in millions Upper 9,736 9,973 10,181 10,387 10,591
Lower 9,028 9,032 9,072 9,132 9,205
Base 7.88 % 7.65 % 7.60 % 7.56 % 7.53 %
Unemployment percentage Upper 5.38 % 5.97 % 6.39 % 6.52 % 6.93 %
Lower 10.42 % 9.61 % 8.68 % 8.46 % 8.08 %
Note 3.2. Economical variables used to measure expected credit loss
The NFH Group has chosen to disclose the three most important modeling variables in each individual country. The variables differ between countries.
The following macro-economic variables are used in the models: real interest rate in absolute terms, 3-month interbank rate, unemployment level in
thousands, hourly pay in NOK, aggregated monthly consumption for the entire population measured in millions in local currency, and unemployment rate
in percentage of the total labor force. The data is modeled accross three scenarios: a base, an upper and a lower case for expected credit loss. The
model is based on the NiGEM-model developed by UK's Institute of Economic and Social Research.
Unemployment level in
thousands
Report for the 2nd quarter 2018 Norwegian Finans Holding ASA
11

Norway
<=5% 700 % <=2% 900 %
>5%, 10%] 30 % >2% 0 %
>10% 20 %
Sweden
<=20% 30 % <=2% 900 %
>20% 10 % >2%, 5%] 40 %
>5% 0 %
Denmark
<=20% 300 % <=50% 80 %
>20%, 40%] 100 % >50% 0 %
>40% 20 %
Finland
<=20% 200 % <=30% 200 %
>20%, 40%] 100 % >30% 30 %
>40% 40 %
Note 3.3. Significant increase in credit risk
Probability of default (PD) is an experience-based probability that a commitment is in breach for more than 90 days in the next twelve months. The tables
below show the different trigger levels that need to be in place for a commitment to be classified in Stage 2 due to a significant increase in credit risk. A
significant increase in credit risk is assessed on the basis of several criteria, including late payment beyond 30 days after maturity. The most important
factor for the assessment is a comparison between the original probability of default and the probability of default at the reporting date. Each product has
its own threshold values when one considers an increase to be significant. Products with absolute low application PDs therefore lead to high trigger
requirements, as they are relative and come from a low level.
Original
PD
Instalment
loans
Original
PD
Instalment
loans
Original
PD
Credit card
loans
Original
PD
Credit card
loans
Original
PD
Instalment
loans
Original
PD
Credit card
loans
Original
PD
Instalment
loans
Original
PD
Credit card
loans
Report for the 2nd quarter 2018 Norwegian Finans Holding ASA
12

Amounts in NOK 1000 Gross loans Stage 1 Stage 2 Stage 3 Other changes Total
Instalment loans Norway 12,191,971 44,208 33,180 275,253 - 11,839,330
Credit card loans Norway 6,100,898 7,002 6,441 72,265 - 6,015,189
Instalment loans Sweden 3,933,187 45,377 61,695 109,289 - 3,716,825
Credit card loans Sweden 2,054,545 9,134 21,131 35,763 - 1,988,518
Instalment loans Denmark 3,204,290 57,345 24,846 182,255 - 2,939,843
Credit card loans Denmark 667,682 13,067 11,179 58,751 - 584,686
Instalment loans Finland 7,147,493 35,155 64,284 181,010 - 6,867,043
Credit card loans Finland 1,586,060 8,272 24,342 13,064 - 1,540,382
Additional provision Finland* - - - - 57,069 -57,069
Total 36,886,125 219,560 247,097 927,650 57,069 35,434,748
Instalment loans Norway
Loan loss allowance Stage 1 Stage 2 Stage 3
Amounts in NOK 1000 Total
Loan loss allowance as at 31.3.18 44,135 33,445 235,717 313,297
Transfers :
Transfers between Stage 1 and Stage 2 -3,060 14,019 - 10,959
Transfers between Stage 1 and Stage 3 -128 - 120 -8
Transfers between Stage 2 and Stage 1 1,957 -5,820 - -3,863
Transfers between Stage 2 and Stage 3 - -10,991 29,909 18,918
Transfers between Stage 3 and Stage 2 - 935 -7,994 -7,060
Transfers between Stage 3 and Stage 1 10 - -650 -640
New financial assets issued or purchased 3,853 1,553 - 5,406
Financial assets derecognized in the period, including down payments -2,559 38 18,151 15,631
Loan loss allowance as at 30.6.18 44,208 33,180 275,253 352,641
Loan loss provisions and guarantees - - - -
Migration out of one stage is calculated at opening date 31.3.18, while migration into one stage is calculated at the closing date 30.6.18.
Gross loans to customers
Amounts in NOK 1000 Stage 1 Stage 2 Stage 3 Total
Gross loans to customers as at 31.3.18 9,511,647 1,325,287 1,113,643 11,950,577
Transfers :
Transfers between Stage 1 and Stage 2 -581,878 583,685 - 1,807
Transfers between Stage 1 and Stage 3 -21,469 - 21,790 321
Transfers between Stage 2 and Stage 1 366,112 -380,643 - -14,532
Transfers between Stage 2 and Stage 3 - -216,781 217,109 327
Transfers between Stage 3 and Stage 2 - 37,056 -46,784 -9,728
Transfers between Stage 3 and Stage 1 1,937 - -2,938 -1,001
New financial assets issued or purchased 770,428 42,443 - 812,871
Financial assets derecognized in the period, including down payments -435,108 -78,743 -34,822 -548,672
Gross loans to customers as at 30.6.18 9,611,669 1,312,304 1,267,997 12,191,971
12 months
expected
credit loss
Note 4. Loans to customers by customer groups
Loan loss allowance
*The NFH Group is working with implementation of an internal model as Finland, as a temporary solution, is using a standardized model. Working with the
new model in Q2 has created an expectation that the standardized model is believed to underestimate expected credit losses. The additional provision is
not attributed to any product or step. Therefore, provisions for credit losses in Finland includes a management override of MNOK 57 in the second
quarter.
Lifetime
expected
credit loss
Lifetime
expected
credit loss
The loan loss allowance is calculated based on the expected credit loss (ECL) using the 3-stage method as described in note 2.1 of the Annual Report
2017.
Note 5. Change in loan loss allowance
Report for the 2nd quarter 2018 Norwegian Finans Holding ASA
13

Credit card loans Norway
Loan loss allowance
Stage 1 Stage 2 Stage 3
Amounts in NOK 1000 Total
Loan loss allowance as at 31.3.18 6,560 6,479 58,767 71,806
Transfers :
Transfers between Stage 1 and Stage 2 -303 3,280 - 2,976
Transfers between Stage 1 and Stage 3 -18 - 124 106
Transfers between Stage 2 and Stage 1 300 -2,452 - -2,152
Transfers between Stage 2 and Stage 3 - -943 6,696 5,753
Transfers between Stage 3 and Stage 2 - 101 -2,358 -2,257
Transfers between Stage 3 and Stage 1 4 - -594 -589
New financial assets issued or purchased 458 279 - 737
Financial assets derecognized in the period, including down payments 0 -301 9,630 9,329
Loan loss allowance as at 30.6.18 7,002 6,441 72,265 85,709
Loan loss provisions and guarantees - - - -
Migration out of one stage is calculated at opening date 31.3.18, while migration into one stage is calculated at the closing date 30.6.18.
Gross loans to customers
Amounts in NOK 1000 Stage 1 Stage 2 Stage 3 Total
Gross loans to customers as at 31.3.18 4,758,826 531,865 322,610 5,613,301
Transfers :
Transfers between Stage 1 and Stage 2 -238,599 276,697 - 38,098
Transfers between Stage 1 and Stage 3 -11,416 - 11,649 233
Transfers between Stage 2 and Stage 1 193,021 -219,353 - -26,332
Transfers between Stage 2 and Stage 3 - -78,044 78,128 83
Transfers between Stage 3 and Stage 2 - 8,944 -19,895 -10,951
Transfers between Stage 3 and Stage 1 1,137 - -5,990 -4,853
New financial assets issued or purchased 179,824 16,891 - 196,716
Financial assets derecognized in the period, including down payments 310,547 -13,909 -2,035 294,603
Gross loans to customers as at 30.6.18 5,193,340 523,091 384,467 6,100,898
12 months
expected
credit loss
Lifetime
expected
credit loss
Lifetime
expected
credit loss
The loan loss allowance is calculated based on the expected credit loss (ECL) using the 3-stage method as described in note 2.1 of the Annual Report
2017.
Report for the 2nd quarter 2018 Norwegian Finans Holding ASA
14

Instalment loans Sweden
Loan loss allowance Stage 1 Stage 2 Stage 3
Amounts in NOK 1000 Total
Loan loss allowance as at 31.3.18 37,500 90,069 91,554 219,123
Transfers :
Transfers between Stage 1 and Stage 2 -5,813 11,030 - 5,217
Transfers between Stage 1 and Stage 3 -270 - - -270
Transfers between Stage 2 and Stage 1 6,002 -12,148 - -6,145
Transfers between Stage 2 and Stage 3 - -8,890 18,498 9,608
Transfers between Stage 3 and Stage 2 - 2,106 -8,027 -5,921
Transfers between Stage 3 and Stage 1 63 - -415 -353
New financial assets issued or purchased 6,735 972 - 7,707
Financial assets derecognized in the period, including down payments -3,992 -6,199 7,680 -2,511
Other adjustments 5,152 -15,245 0 -10,093
Loan loss allowance as at 30.6.18 45,377 61,695 109,289 216,361
Loan loss provisions and guarantees - - - -
Migration out of one stage is calculated at opening date 31.3.18, while migration into one stage is calculated at the closing date 30.6.18.
Gross loans to customers
Amounts in NOK 1000 Stage 1 Stage 2 Stage 3 Total
Gross loans to customers as at 31.3.18 1,658,112 1,809,166 423,303 3,890,581
Transfers :
Transfers between Stage 1 and Stage 2 -233,219 222,918 - -10,300
Transfers between Stage 1 and Stage 3 -9,477 - 9,687 211
Transfers between Stage 2 and Stage 1 263,960 -269,865 - -5,904
Transfers between Stage 2 and Stage 3 - -117,778 117,097 -681
Transfers between Stage 3 and Stage 2 - 38,990 -44,761 -5,771
Transfers between Stage 3 and Stage 1 2,749 - -3,414 -665
New financial assets issued or purchased 316,463 18,992 - 335,455
Financial assets derecognized in the period, including down payments -142,719 -118,148 -16,528 -277,395
Other adjustments 264,437 -257,369 587 7,655
Gross loans to customers as at 30.6.18 2,120,307 1,326,908 485,972 3,933,187
Other adjustments include the effects of a correction to the macro model unique to instalment loans in Sweden
12 months
expected
credit loss
Lifetime
expected
credit loss
Lifetime
expected
credit loss
The loan loss allowance is calculated based on the expected credit loss (ECL) using the 3-stage method as described in note 2.1 of the Annual Report
2017.
Report for the 2nd quarter 2018 Norwegian Finans Holding ASA
15
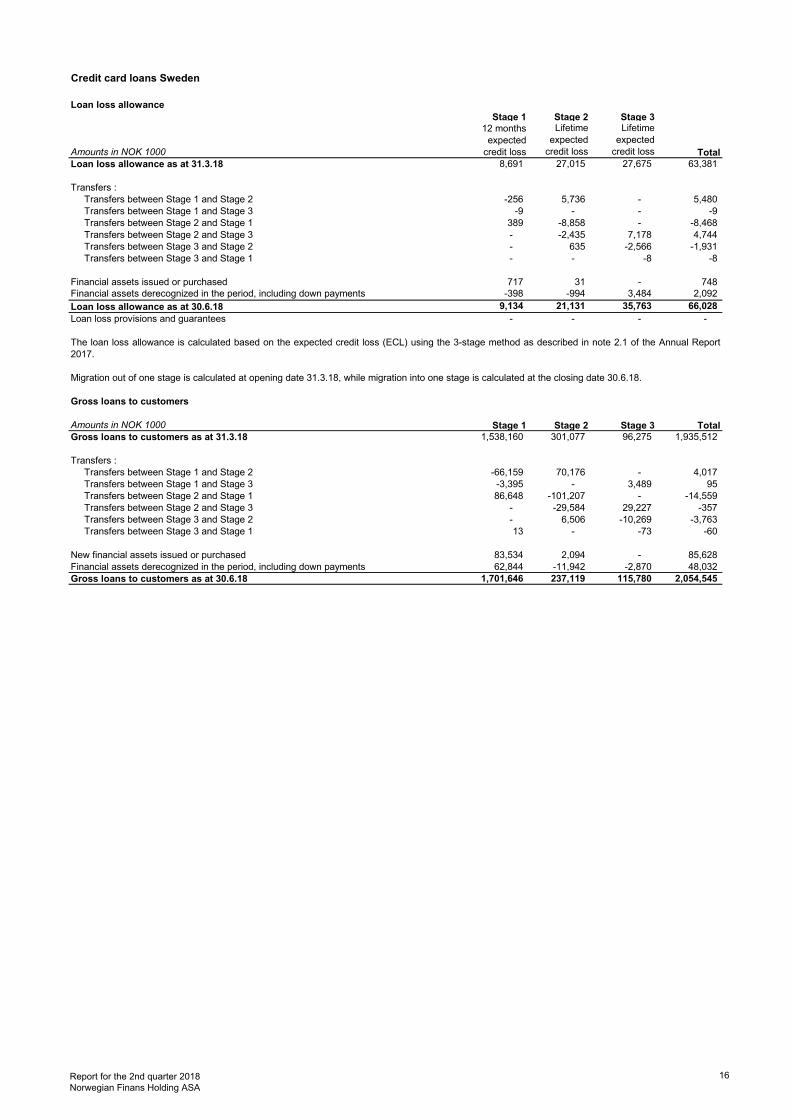
Credit card loans Sweden
Loan loss allowance
Stage 1 Stage 2 Stage 3
Amounts in NOK 1000 Total
Loan loss allowance as at 31.3.18 8,691 27,015 27,675 63,381
Transfers :
Transfers between Stage 1 and Stage 2 -256 5,736 - 5,480
Transfers between Stage 1 and Stage 3 -9 - - -9
Transfers between Stage 2 and Stage 1 389 -8,858 - -8,468
Transfers between Stage 2 and Stage 3 - -2,435 7,178 4,744
Transfers between Stage 3 and Stage 2 - 635 -2,566 -1,931
Transfers between Stage 3 and Stage 1 - - -8 -8
Financial assets issued or purchased 717 31 - 748
Financial assets derecognized in the period, including down payments -398 -994 3,484 2,092
Loan loss allowance as at 30.6.18 9,134 21,131 35,763 66,028
Loan loss provisions and guarantees - - - -
Migration out of one stage is calculated at opening date 31.3.18, while migration into one stage is calculated at the closing date 30.6.18.
Gross loans to customers
Amounts in NOK 1000 Stage 1 Stage 2 Stage 3 Total
Gross loans to customers as at 31.3.18 1,538,160 301,077 96,275 1,935,512
Transfers :
Transfers between Stage 1 and Stage 2 -66,159 70,176 - 4,017
Transfers between Stage 1 and Stage 3 -3,395 - 3,489 95
Transfers between Stage 2 and Stage 1 86,648 -101,207 - -14,559
Transfers between Stage 2 and Stage 3 - -29,584 29,227 -357
Transfers between Stage 3 and Stage 2 - 6,506 -10,269 -3,763
Transfers between Stage 3 and Stage 1 13 - -73 -60
New financial assets issued or purchased 83,534 2,094 - 85,628
Financial assets derecognized in the period, including down payments 62,844 -11,942 -2,870 48,032
Gross loans to customers as at 30.6.18 1,701,646 237,119 115,780 2,054,545
Lifetime
expected
credit loss
12 months
expected
credit loss
The loan loss allowance is calculated based on the expected credit loss (ECL) using the 3-stage method as described in note 2.1 of the Annual Report
2017.
Lifetime
expected
credit loss
Report for the 2nd quarter 2018 Norwegian Finans Holding ASA
16

Instalment loans Denmark
Loan loss allowance Stage 1 Stage 2 Stage 3
Amounts in NOK 1000 Total
Loan loss allowance as at 31.3.18 54,306 34,388 136,947 225,640
Transfers :
Transfers between Stage 1 and Stage 2 -3,082 14,860 - 11,778
Transfers between Stage 1 and Stage 3 -689 - 9,874 9,185
Transfers between Stage 2 and Stage 1 1,435 -5,671 - -4,237
Transfers between Stage 2 and Stage 3 - -19,054 43,269 24,214
Transfers between Stage 3 and Stage 2 - 443 -2,778 -2,335
Transfers between Stage 3 and Stage 1 30 - -302 -272
New financial assets issued or purchased 5,101 967 - 6,068
Financial assets derecognized in the period, including down payments 245 -1,087 -4,754 -5,596
Loan loss allowance as at 30.6.18 57,345 24,846 182,255 264,446
Loan loss provisions and guarantees - - - -
Migration out of one stage is calculated at opening date 31.3.18, while migration into one stage is calculated at the closing date 30.6.18.
Gross loans to customers
Amounts in NOK 1000 Stage 1 Stage 2 Stage 3 Total
Gross loans to customers as at 31.3.18 2,520,494 188,305 256,786 2,965,585
Transfers :
Transfers between Stage 1 and Stage 2 -86,578 89,055 - 2,477
Transfers between Stage 1 and Stage 3 -17,620 - 18,255 635
Transfers between Stage 2 and Stage 1 41,803 -42,884 - -1,081
Transfers between Stage 2 and Stage 3 - -80,382 79,709 -673
Transfers between Stage 3 and Stage 2 - 3,653 -5,413 -1,759
Transfers between Stage 3 and Stage 1 314 - -597 -283
New financial assets issued or purchased 212,511 5,456 - 217,967
Financial assets derecognized in the period, including down payments 38,482 -8,496 -8,564 21,423
Gross loans to customers as at 30.6.18 2,709,406 154,707 340,177 3,204,290
Lifetime
expected
credit loss
Lifetime
expected
credit loss
The loan loss allowance is calculated based on the expected credit loss (ECL) using the 3-stage method as described in note 2.1 of the Annual Report
2017.
12 months
expected
credit loss
Report for the 2nd quarter 2018 Norwegian Finans Holding ASA
17

Credit card loans Denmark
Loan loss allowance
Stage 1 Stage 2 Stage 3
Amounts in NOK 1000 Total
Loan loss allowance as at 31.3.18 14,197 11,427 53,777 79,401
Transfers :
Transfers between Stage 1 and Stage 2 -222 2,653 - 2,431
Transfers between Stage 1 and Stage 3 -43 - 1,607 1,564
Transfers between Stage 2 and Stage 1 98 -1,333 - -1,235
Transfers between Stage 2 and Stage 3 - -2,812 6,473 3,661
Transfers between Stage 3 and Stage 2 - 980 -1,797 -817
Transfers between Stage 3 and Stage 1 - - - -
New financial assets issued or purchased 6,134 214 - 6,349
Financial assets derecognized in the period, including down payments -7,097 50 -1,309 -8,357
Loan loss allowance as at 30.6.18 13,067 11,179 58,751 82,996
Loan loss provisions and guarantees - - - -
Migration out of one stage is calculated at opening date 31.3.18, while migration into one stage is calculated at the closing date 30.6.18.
Gross loans to customers
Amounts in NOK 1000 Stage 1 Stage 2 Stage 3 Total
Gross loans to customers as at 31.3.18 463,465 55,098 132,317 650,880
Transfers :
Transfers between Stage 1 and Stage 2 -22,532 24,519 - 1,987
Transfers between Stage 1 and Stage 3 -3,640 - 3,816 176
Transfers between Stage 2 and Stage 1 12,918 -14,253 - -1,334
Transfers between Stage 2 and Stage 3 - -16,218 16,166 -51
Transfers between Stage 3 and Stage 2 - 1,864 -4,416 -2,552
Transfers between Stage 3 and Stage 1 - - - -
-
New financial assets issued or purchased 12,806 485 - 13,291
Financial assets derecognized in the period, including down payments 12,333 -4,326 -2,723 5,285
Gross loans to customers as at 30.6.18 475,350 47,171 145,161 667,682
Lifetime
expected
credit loss
Lifetime
expected
credit loss
The loan loss allowance is calculated based on the expected credit loss (ECL) using the 3-stage method as described in note 2.1 of the Annual Report
2017.
12 months
expected
credit loss
Report for the 2nd quarter 2018 Norwegian Finans Holding ASA
18

Instalment loans Finland
Loan loss allowance Stage 1 Stage 2 Stage 3
Amounts in NOK 1000 Total
Loan loss allowance as at 31.3.18 34,427 56,757 138,972 230,155
Transfers :
Transfers between Stage 1 and Stage 2 -4,580 31,676 - 27,096
Transfers between Stage 1 and Stage 3 -85 - 372 287
Transfers between Stage 2 and Stage 1 1,536 -8,768 - -7,232
Transfers between Stage 2 and Stage 3 - -18,838 49,432 30,594
Transfers between Stage 3 and Stage 2 - 1,843 -4,085 -2,243
Transfers between Stage 3 and Stage 1 3 - -141 -138
New financial assets issued or purchased 3,949 1,286 - 5,236
Financial assets derecognized in the period, including down payments -95 328 -3,539 -3,306
Loan loss allowance as at 30.6.18 35,155 64,284 181,010 280,449
Loan loss provisions and guarantees - - - -
Migration out of one stage is calculated at opening date 31.3.18, while migration into one stage is calculated at the closing date 30.6.18.
Gross loans to customers
Amounts in NOK 1000 Stage 1 Stage 2 Stage 3 Total
Gross loans to customers as at 31.3.18 4,990,345 957,628 690,933 6,638,906
Transfers :
Transfers between Stage 1 and Stage 2 -531,095 539,514 - 8,419
Transfers between Stage 1 and Stage 3 -1,698 - 1,739 41
Transfers between Stage 2 and Stage 1 184,037 -192,166 - -8,129
Transfers between Stage 2 and Stage 3 - -233,657 234,422 764
Transfers between Stage 3 and Stage 2 - 18,155 -21,912 -3,757
Transfers between Stage 3 and Stage 1 472 - -543 -71
New financial assets issued or purchased 593,514 27,683 - 621,197
Financial assets derecognized in the period, including down payments -60,676 -33,622 -15,579 -109,877
Gross loans to customers as at 30.6.18 5,174,900 1,083,534 889,059 7,147,493
Lifetime
expected
credit loss
Lifetime
expected
credit loss
The loan loss allowance is calculated based on the expected credit loss (ECL) using the 3-stage method as described in note 2.1 of the Annual Report
2017.
12 months
expected
credit loss
Report for the 2nd quarter 2018 Norwegian Finans Holding ASA
19

Credit card loans Finland
Loan loss allowance
Stage 1 Stage 2 Stage 3
Amounts in NOK 1000 Total
Loan loss allowance as at 31.3.18 7,571 22,879 10,212 40,663
Transfers :
Transfers between Stage 1 and Stage 2 -1,268 6,851 - 5,582
Transfers between Stage 1 and Stage 3 -4 - 9 6
Transfers between Stage 2 and Stage 1 440 -3,297 - -2,857
Transfers between Stage 2 and Stage 3 - -1,758 3,762 2,004
Transfers between Stage 3 and Stage 2 - 49 -405 -356
Transfers between Stage 3 and Stage 1 2 - -29 -27
New financial assets issued or purchased 1,581 527 - 2,109
Financial assets derecognized in the period, including down payments -51 -909 -486 -1,446
Loan loss allowance as at 30.6.18 8,272 24,342 13,064 45,678
Loan loss provisions and guarantees - - - -
Migration out of one stage is calculated at opening date 31.3.18, while migration into one stage is calculated at the closing date 30.6.18.
Gross loans to customers
Amounts in NOK 1000 Stage 1 Stage 2 Stage 3 Total
Gross loans to customers as at 31.3.18 744,485 516,481 123,796 1,384,763
Transfers :
Transfers between Stage 1 and Stage 2 -135,874 163,195 - 27,321
Transfers between Stage 1 and Stage 3 -184 - 185 1
Transfers between Stage 2 and Stage 1 52,662 -53,622 - -960
Transfers between Stage 2 and Stage 3 - -40,323 40,004 -319
Transfers between Stage 3 and Stage 2 - 3,351 -5,015 -1,664
Transfers between Stage 3 and Stage 1 117 - -444 -327
New financial assets issued or purchased 68,757 9,116 - 77,873
Financial assets derecognized in the period 116,312 -14,420 -2,520 99,373
Gross loans to customers as at 30.6.18 846,275 583,779 156,006 1,586,060
Lifetime
expected
credit loss
Lifetime
expected
credit loss
The loan loss allowance is calculated based on the expected credit loss (ECL) using the 3-stage method as described in note 2.1 of the Annual Report
2017.
12 months
expected
credit loss
Report for the 2nd quarter 2018 Norwegian Finans Holding ASA
20

Note 6. Loan loss provisions and guarantees
The NFH Group has no guarantees as of 30.6.18.
Amounts in NOK 1000 Q2 2018 Q2 2017 2017
Realized losses in the period 16,404 5,873 16,325
Individual write-downs on loans including gains/losses from sale of NPL portfolios - 81,229 172,838
Write-downs - lifetime expected credit loss (stage 3) 334,150 - -
Net individual write-downs on loans 350,554 87,101 189,163
The period's change in write-downs on groups of loans including gains/losses from sale of NPL portfolios - 245,316 483,226
Write-downs - 12 months expected credit loss (stage 1) 20,657 - -
Write-downs - lifetime expected credit loss (stage 2) 15,083 - -
Other changes 57,315
Write-downs on loans 443,609 332,417 672,388
Note 7. Loans to customers by geographical region
Gross loans by geographical regions
Amounts in NOK 1000 Q2 2018 Q2 2017 2017
Østlandet 9,577,526 8,510,425 8,905,323
Sørlandet 796,735 708,019 749,306
Vestlandet 4,578,488 4,063,685 4,265,918
Trøndelag 1,332,205 1,177,651 1,237,676
Nord-Norge 1,938,657 1,745,978 1,820,883
Not classified 69,259 45,729 59,785
Total Norway 18,292,869 16,251,486 17,038,890
Götaland 2,467,565 2,200,335 2,429,467
Svealand 2,893,067 2,575,446 2,863,260
Norrland 562,122 520,669 567,585
Not classified 64,978 17,919 38,614
Total Sweden 5,987,732 5,314,369 5,898,925
Hovedstaden 1,413,028 948,054 1,227,797
Midtjylland 635,177 420,600 546,088
Nordjylland 285,402 185,754 243,884
Sjælland 805,260 543,299 699,903
Syddanmark 729,888 482,504 625,437
Not classified 3,217 1,445 2,428
Total Denmark 3,871,972 2,581,657 3,345,537
Södra Finland 5,991,834 3,906,503 5,011,778
Västra Finland 959,343 609,600 788,531
Östra Finland 685,635 439,607 566,822
Mellersta Finland 662,740 444,899 561,740
Norra Finland 376,012 249,325 320,244
Not classified 57,989 19,399 59,237
Total Finland 8,733,553 5,669,334 7,308,352
Gross loans to customers 36,886,125 29,816,846 33,591,704
Note 8. Liquidity risk
The Liquidity Coverage Ratio (LCR) is defined as the NHF Group's liquid assets relative to net liquidity output 30 days forward in time in any given stress
situation. At 30.6.18 the liquidity reserve (LCR) on total level for the NHF Group was 225% (compared to 169% per 30.6.17). The NHF Group has
significant positions in Norwegian, Swedish and Danish kroner in addition to Euro. At 30.6.18 the LCR was 345% in Norwegian kroner (compared to 235%
per 30.6.2017), 128% in Swedish kroner (compared to 51% per 30.6.2017), 189% Danish kroner (compared to 114% per 30.6.2017) and 151% in Euro
(compared to 0% per 30.6.2017). The legal requirement for liquidity reserve at total level and for significant currencies is 100% at 30.6.18, except for
Norwegian kroner where the legal requirement is 50%.
The liquidity risk is the risk that the NHF Group is not capable of covering all its financial obligations as they fall due. The liquidity risk is evaluated as low
at the time of this report, since a large portion of the NHF Group's assets consists of easily transferable securities. The asset side is financed by core
deposits from the retail market, debt securities and subordinated capital. The NHF Group manages its liquidity position by short-term cash flow forecasts
and liquidity due date summaries.
Report for the 2nd quarter 2018 Norwegian Finans Holding ASA
21

Note 9. Loans and deposits with credit institutions and central banks
Amounts in NOK 1000 Q2 2018 Q2 2017 2017
Loans and deposits with credit institutions and central banks without agreed maturity or notice period 2,389,320 1,456,833 1,326,922
Loans and deposits with credit institutions and central banks 2,389,320 1,456,833 1,326,922
Specification of currencies
Amounts in NOK 1000 Q2 2018 Q2 2017 2017
NOK 1,160,027 612,004 542,600
SEK 600,409 389,994 444,840
DKK 276,786 261,536 197,700
EUR 352,097 193,298 141,782
Loans and deposits with credit institutions and central banks 2,389,320 1,456,833 1,326,922
Average interest rate 0.20 % 0.44 % 0.22 %
Note 10. Net interest income
Amounts in NOK 1000 Q2 2018 Q2 2017 2017
Interest income from cash and deposits with the central bank 169 149 304
Interest income from loans to and deposits with credit institutions 1,503 1,302 2,705
Interest income from instalment loans 1,761,130 1,460,959 3,102,438
Interest income from overdraft accounts - 79 79
Interest income from credit card loans 605,407 439,855 967,465
Interest income from sales financing 1,338 2,647 4,571
Interest income, amortised cost 2,369,547 1,904,990 4,077,561
Interest and other income from certificates and bonds 46,248 43,672 91,939
Other interest and other interest related income 1,821 1,846 3,183
Other interest income 48,069 45,518 95,122
Interest expense from deposits from credit institutions 479 30 135
Interest expense from deposits from customers 259,023 200,227 433,959
Interest expense on debt securities issued 15,318 17,619 34,346
Interest expense on subordinated loan 9,903 5,889 15,530
Other interest and other interest related expenses 12,545 8,796 18,241
Interest expenses 297,268 232,561 502,211
Net interest income 2,120,348 1,717,947 3,670,472
Note 11. Net other operating income
Amounts in NOK 1000 Q2 2018 Q2 2017 2017
Payment services 169,048 109,857 264,887
Insurance services 67,889 42,304 87,522
Other fees and commission and bank services income 26,262 22,459 47,589
Total commission and bank services income 263,198 174,620 399,998
Payment services 68,727 47,586 110,223
Insurance services 54,200 34,365 78,620
Other fees and commission and bank services expense 13,452 10,316 22,249
Total commission and bank services expenses 136,379 92,267 211,092
Note 12. Net gains on financial instruments
Amounts in NOK 1000 Q2 2018 Q2 2017 2017
Net gains on certificates and bonds -17,794 -946 -17,251
Net gains on FX-forwards 212,515 62,961 -140,821
Net currency effects -191,220 -51,888 165,530
Net gains on shares and other securities 4,112 - -
Total 7,613 10,127 7,458
Note 13. General administrative expenses
Amounts in NOK 1000 Q2 2018 Q2 2017 2017
Sales and marketing 430,824 341,548 730,783
IT operations 37,418 48,286 81,940
External services fees 43,328 22,437 51,995
Other administrative expenses 20,094 19,127 41,568
Total 531,664 431,398 906,286
Average interest rate is calculated as interest amount in percentage of average volume for the current period.
Report for the 2nd quarter 2018 Norwegian Finans Holding ASA
22

Note 14. Other operating expenses
Amounts in NOK 1000 Q2 2018 Q2 2017 2017
Credit information 16,879 14,096 28,190
Auditor 982 1,070 2,364
Rental of premises 1,161 1,110 2,309
Insurance 267 262 517
Machinery, fixtures and transport vehicles 364 193 528
Other operating expenses 5,697 5,693 11,576
Total 25,350 22,423 45,484
Note 15. Financial instruments at fair value
Level 2 Valuation based on observable market data
Level 3 Valuation based on observable market data
Financial instruments at fair value
Amounts in NOK 1000 Level 1 Level 2 Level 3 Total
Certificates and bonds - 9,389,792 - 9,389,792
Financial derivatives - 43,768 - 43,768
Shares and other securities - - 37,476 37,476
Total financial assets at fair value - 9,433,560 37,476 9,471,037
Financial derivatives - 2,494 - 2,494
Total financial liabilities at fair value - 2,494 - 2,494
Amounts in NOK 1000 Level 1 Level 2 Level 3 Total
Certificates and bonds - 8,185,779 - 8,185,779
Financial derivatives - 946 - 946
Shares and other securities - - 443 443
Financial assets available for sale - - 28,374 28,374
Total financial assets at fair value - 8,186,726 28,817 8,215,543
Financial derivatives - 3,999 - 3,999
Total financial liabilities at fair value - 3,999 - 3,999
Amounts in NOK 1000 Level 1 Level 2 Level 3 Total
Certificates and bonds - 8,859,834 - 8,859,834
Financial derivatives - 1,935 - 1,935
Shares and other securities - - 443 443
Financial assets available for sale - - 32,922 32,922
Total financial assets at fair value - 8,861,770 33,365 8,895,135
Financial derivatives - 52,246 - 52,246
Total financial liabilities at fair value - 52,246 - 52,246
Change in instruments classified at level 3
Amounts in NOK 1000 Total
Value 31.12.17 443 32,922 33,365
Additions - - -
Disposals - - -
Settlement - - -
Reclassification IFRS 9 32,922 -32,922 -
Net gain / loss on financial instruments 4,112 - 4,112
Value 30.6.18 37,476 - 37,476
Q2 2018
Financial
assets
available
for sale
Shares
and other
securities
Financial instruments in level 1 are determined based on quoted prices in active markets for identical financial instruments available on the balance sheet
date.
Q2 2018
Q2 2017
2017
Financial instruments in level 2 are determined based on inputs other than quoted prices, but where prices are observable either directly or indirectly.
These include quoted prices in markets that are not active.
Level 1 Valuation based on quoted prices in an active market
Financial instruments at fair value is measured at different levels.
When valuation can not be determined in level 1 or 2, valuation methods based on non-observable market data are used.
Report for the 2nd quarter 2018 Norwegian Finans Holding ASA
23

Amounts in NOK 1000 Total
Value 31.12.17 443 24,745 25,188
Additions - - -
Disposals - - -
Settlement - - -
Reclassification IFRS 9 - - -
Net gain / loss on financial instruments - 3,629 3,629
Value 30.6.18 443 28,374 28,817
Ownership in Visa Norge FLI
Note 16. Fair value of financial instruments at amortized cost
Loans and deposits with central banks and credit institutions and deposits from customers
Loans to customers
Debt securities issued and subordinated loan
Fair value of financial instruments at amortized cost
Amounts in NOK 1000 Book value Fair value Book value Fair value Book value Fair value
Cash and deposits with the central bank 65,975 65,975 61,981 61,981 65,976 65,976
Loans and deposits with credit institutions 2,323,345 2,323,345 1,394,852 1,394,852 1,260,947 1,260,947
Loans to customers 35,434,748 35,434,748 28,868,053 28,868,053 32,451,553 32,451,553
Total financial assets 37,824,067 37,824,067 30,324,885 30,324,885 33,778,475 33,778,475
Deposits from customers 37,705,983 37,705,983 30,922,923 30,922,923 33,682,275 33,682,275
Debt securities issued 1,808,003 1,916,771 2,040,622 2,042,374 2,242,423 2,301,855
Subordinated loan 474,622 477,888 474,721 474,721 474,614 478,360
Total financial liabilities 39,988,608 40,100,642 33,438,266 33,440,018 36,399,313 36,462,490
Financial instruments at amortized cost are valued at originally determined cash flows, adjusted for any impairment losses. Amortized cost will not always
give values that match the market's assessment of the same instruments. This may be due to different perceptions of market conditions, risk and return
requirements.
Fair value is estimated to conform with amortized cost.
Loans to customers are exposed to market competition. This means that the potential added value of the loan portfolio will not be maintained over time.
Further, provisions for loan losses are provided for on an ongoing basis. The fair value of loans to customers is therefore considered to conform to the
amortized cost.
The fair value of debt securities issued and subordinated loan are based on observable market data where available.
Shares in BankID Norge AS
Ownership in Visa Norge FLI is considered to be a financial asset and is classified as Share and other securities . The fair value of the asset is estimated
at NOK 37,0 million as of 30.6.18. The calculation is based on input from Visa Norge.
Q2 2017
Financial
assets
available
for sale
Shares
and other
securities
Q2 2018 Q2 2017 2017
Bank Norwegian AS was at 12.8.14 issued 280 shares in BankID Norge AS based on the bank's share of participation in the BankID association. Value of
shares are estimated at the going rate at the time granted.
Report for the 2nd quarter 2018 Norwegian Finans Holding ASA
24

Note 17. Debt securities issued and subordinated loan
Debt securities issued
Amounts in NOK 1000 Q2 2018 Q2 2017 2017
Bonds, nominal value 1,804,950 2,036,000 2,239,800
Value adjustments and currency effects -933 -93 -1,580
Accrued interest 3,986 4,715 4,203
Total debt securities issued 1,808,003 2,040,622 2,242,423
Change in debt securities issued
Amounts in NOK 1000 Issued
Bonds, nominal value 1,804,950 - -390,000 -44,850 2,239,800
Value adjustments and currency effects -933 - - -647 -1,580
Accrued interest 3,986 - - 217 4,203
Total debt securities issued 1,808,003 - -390,000 -45,280 2,242,423
Amounts in NOK 1000 Issued
Bonds, nominal value 2,036,000 500,000 -284,000 - 1,820,000
Value adjustments and currency effects -93 - - -352 259
Accrued interest 4,715 - - 1,001 3,714
Total debt securities issued 2,040,622 500,000 -284,000 649 1,823,973
Change in subordinated loan
Amounts in NOK 1000 Issued
Subordinated loan, nominal value 475,000 - - - 475,000
Value adjustments -1,237 - - -25 -1,212
Accrued interest 859 - - 33 826
Total subordinated loan 474,622 - - 8 474,614
Amounts in NOK 1000 Issued
Subordinated loan, nominal value 475,000 200,000 - - 275,000
Value adjustments -1,287 - - -706 -581
Accrued interest 1,008 - - 512 496
Total subordinated loan 474,721 200,000 - -194 274,915
Note 18. Financial Assets available for sale
Note 19. Receivables
Amounts in NOK 1000 Q2 2018 Q2 2017 2017
Distribution commissions 92,787 91,660 92,866
Prepaid expenses 21,437 16,575 4,800
Net collateral issued* - - 84,700
Other receivables 14,406 22,889 12,434
Total 128,630 131,124 194,800
Note 20. Other liabilities
Amounts in NOK 1000 Q2 2018 Q2 2017 2017
Payables to suppliers 6,327 39,454 6,545
Value added tax 7,778 8,909 8,412
Social security tax 6,270 3,981 2,467
Tax withholdings 4,253 5,996 2,335
Unsettled items related to certificates and bonds 52,943 103,108 138,135
Other liabilities 13,784 2,247 816
Total 91,355 163,695 158,711
Other
changes and
currency
effects
Overdue /
redeemed
The NFH Group is a member of Visa Norge FLI ("Visa Norge"), being a shareholder of Visa Europe Ltd. On 2 November 2015, an agreement between
Visa Europe Ltd. and Visa Inc. was announced where Visa Inc. acquires all shares in Visa Europe Ltd. This transaction consists of a cash consideration,
convertible preference shares and a deferred cash consideration paid three years after completion of the transaction. The process was finalized in June
2016 and the NFH Group has in this connection received its share of the cash consideration based on the NFH Group's stake in Visa Norge. In 2018, the
NFH Group has reclassified Assets available for sale in accordance with IFRS 9 and changes in fair value are recognized through profit or loss.
Balance
31.12.17
Balance
31.12.17
Balance
31.12.16
Other
changes and
currency
effects
Other
changes and
currency
effects
Balance
30.6.17
Overdue /
redeemed
Balance
30.6.18
Other
changes and
currency
effects
* The NFH Group has not issued any collateral as at 30.6.18. The NHF Group has received NOK 85.45 million in collateral from DNB which is classified
as Loans from credit institutions.
Balance
30.6.18
Overdue /
redeemed
Balance
30.6.17
Overdue /
redeemed
Balance
31.12.16
Report for the 2nd quarter 2018 Norwegian Finans Holding ASA
25

Note 21. Accrued expenses
Amounts in NOK 1000 Q2 2018 Q2 2017 2017
Accrued not due expenses 173,661 91,996 132,331
Bonus 7,700 7,250 12,131
Holiday pay 2,400 2,142 4,566
Board remuneration 128 558 1,146
Accrued fees 431 41 41
Total 184,321 101,988 150,216
Note 22. Capital adequacy
Total capital
Amounts in NOK 1000 Q2 2018 Q2 2017 2017
Share capital 186,752 191,301 186,689
+ Share premium 976,938 966,570 971,182
+ Other reserves 4,856,628 3,058,288 3,920,750
- Deferred tax assets, intangible assets and additional valuation adjustment 135,553 126,283 139,529
Common equity Tier 1 5,884,765 4,089,876 4,939,091
+ Additional Tier 1 capital 635,000 635,000 635,000
Tier 1 capital 6,519,765 4,724,876 5,574,091
+ Tier 2 capital 474,622 474,721 474,614
Total capital 6,994,387 5,199,597 6,048,706
Calculation basis
Credit risk
Covered bonds 204,209 164,988 232,981
+ Institutions 1,266,638 1,048,001 907,574
+ Loans to customers 23,737,598 20,431,418 22,472,413
+ Defaulted loans and other commitments 3,995,221 1,788,143 2,719,400
Operational risk 4,022,891 2,608,276 2,608,276
Total calculation basis 33,226,556 26,040,827 28,940,644
Common equity Tier 1 % 17.71 % 15.71 % 17.07 %
Tier 1 capital % 19.62 % 18.14 % 19.26 %
Total capital % 21.05 % 19.97 % 20.90 %
Note 24. Related parties
Note 25. Subsequent events
Norwegian Finans Holding ASA (org. number 991 281 924) owns 100% of Bank Norwegian AS (org. number 991 455 671).
There is no awareness of other events after the date of the balance sheet that may be of material significance to the accounts.
The NFH Group is sharing premises with Norwegian Air Shuttle ASA. A temporary lease agreement has been signed for Snarøyveien 36, Fornebu. The
temporary lease agreement expires 28 October 2019. A lease agreement for the same address has been established with Akastor and Norwegian
Property respectively, which expires in October 2021 with an option to extend the lease agreement for two additional years. The annual rent totals NOK
2.5 million.
Note 23. Lease agreements
Bank Norwegian AS and Norwegian Air Shuttle ASA have since October 2007 had an agreement regarding the bank's use of the brand name Norwegian,
IP-rights, and co-operation regarding the loyalty program and credit cards. Based on the bank's expansion into Sweden, Denmark and Finland, new
agreements has been renegotiated. All accrued rights remain. The agreements was renegotiated in the second quarter 2018.
Report for the 2nd quarter 2018 Norwegian Finans Holding ASA
26

Quarterly figures
Profit and loss account
Norwegian Finans Holding Group
Amounts in NOK 1000 Q2 2018 Q1 2018 Q4 2017 Q3 2017 Q2 2017
Interest income, amortised cost 1,222,548 1,147,000 1,128,109 1,044,461 992,283
Other interest income 23,863 24,206 24,272 25,331 24,177
Interest expenses 154,602 142,666 137,510 132,140 124,215
Net interest income 1,091,808 1,028,540 1,014,872 937,653 892,245
Commission and bank services income 143,359 119,839 120,963 104,415 93,728
Commission and bank services expenses 70,387 65,992 63,574 55,250 50,118
Net change in value on securities and currency 21,089 -13,476 -3,355 685 4,612
Net other operating income 94,061 40,371 54,034 49,850 48,222
Total income 1,185,869 1,068,911 1,068,906 987,503 940,467
Personnel expenses 17,373 21,485 20,501 18,711 16,351
General administrative expenses 264,770 266,894 245,239 229,649 215,419
Ordinary depreciation 12,150 11,922 11,837 10,403 10,861
Other operating expenses 13,082 12,268 12,053 11,008 10,835
Total operating expenses before losses 307,374 312,570 289,630 269,771 253,466
Provision for loan losses 234,707 208,903 199,109 140,862 155,193
Profit before tax 643,788 547,439 580,168 576,870 531,808
Tax charge 160,967 136,827 140,383 144,424 132,779
Profit after tax 482,822 410,611 439,785 432,446 399,029
Comprehensive incomeNorwegian Finans Holding Group
Amounts in NOK 1000 Q2 2018 Q1 2018 Q4 2017 Q3 2017 Q2 2017
Profit on ordinary activities after tax 482,822 410,611 439,785 432,446 399,029
Change in fair value for assets available for sale - - 3,081 1,466 937
Tax - - -23 -11 -7
Other comprehensive income - - 3,058 1,455 930
Comprehensive income for the period 482,822 410,611 442,843 433,901 399,959
Balance sheetNorwegian Finans Holding Group
Amounts in NOK 1000 30.6.18 31.3.18 31.12.17 30.9.17 30.6.17
Assets
Cash and deposits with the central bank 65,975 65,982 65,976 61,979 61,981
Loans and deposits with credit institutions 2,323,345 1,838,548 1,260,947 1,769,465 1,394,852
Loans to customers 35,434,748 33,813,701 32,451,553 30,135,429 28,868,053
Certificates and bonds 9,389,792 9,292,364 8,859,834 8,365,022 8,185,779
Financial derivatives 43,768 49,364 1,935 3,304 946
Shares and other securities 37,476 33,104 443 443 443
Assets available for sale - - 32,922 29,841 28,374
Intangible assets 114,923 115,836 114,678 115,579 117,965
Deferred tax asset 11,157 18,333 15,904 8,425 8,318
Fixed assets 810 904 1,000 1,071 1,094
Receivables 128,630 143,533 194,800 123,584 131,124
Total assets 47,550,624 45,371,669 42,999,992 40,614,141 38,798,929
Liabilities and equity
Loans from credit institutions 85,450 99,200 - - -
Deposits from customers 37,705,983 35,789,003 33,682,275 31,988,426 30,922,923
Debt securities issued 1,808,003 1,934,592 2,242,423 2,040,270 2,040,622
Financial derivatives 2,494 11,264 52,246 11,265 3,999
Tax payable 543,078 391,742 525,886 382,070 239,822
Other liabilities 91,355 342,312 158,711 285,142 163,695
Accrued expenses 184,321 154,835 150,216 154,636 101,988
Subordinated loan 474,622 474,677 474,614 474,536 474,721
Total liabilities 40,895,306 39,197,625 37,286,371 35,336,346 33,947,770
Share capital 186,689 186,689 186,689 186,689 186,619
Share premium 971,182 971,182 971,182 971,182 966,570
Paid, not registered capital 5,819 - - - -
Tier 1 capital 635,000 635,000 635,000 635,000 639,683
Retained earnings and other reserves 4,856,628 4,381,173 3,920,750 3,484,925 3,058,288
Total equity 6,655,318 6,174,044 5,713,621 5,277,796 4,851,159
Total liabilities and equity 47,550,624 45,371,669 42,999,992 40,614,141 38,798,929
Report for the 2nd quarter 2018 Norwegian Finans Holding ASA
27

Profit and loss accountNorwegian Finans Holding ASA
Amounts in NOK 1000 Q2 2018 Q2 2017 YTD 2018 YTD 2017 2017
Interest income, amortised cost 3 1 4 41 45
Net interest income 3 1 4 41 45
Commission and bank services expenses 214 83 296 188 362
Other income 247,500 - 247,500 - -
Net other operating income 247,286 -83 247,204 -188 -362
Total income 247,289 -83 247,208 -147 -317
Personnel expenses 315 91 559 408 1,004
Other operating expenses 689 705 1,094 1,188 2,012
Total operating expenses before losses 1,004 796 1,653 1,596 3,016
Provision for loan losses - - - -
Profit before tax 246,285 -879 245,555 -1,743 -3,333
Tax charge 59,115 -393 58,933 -601 -833
Profit after tax 187,171 -485 186,622 -1,142 -2,500
Comprehensive incomeNorwegian Finans Holding ASA
Amounts in NOK 1000 Q2 2018 Q2 2017 YTD 2018 YTD 2017 2017
Profit on ordinary activities after tax 187,171 -485 186,622 -1,142 -2,500
Comprehensive income for the period 187,171 -485 186,622 -1,142 -2,500
Balance sheetNorwegian Finans Holding ASA
Amounts in NOK 1000 30.6.18 30.6.17 31.12.17
Assets
Loans and deposits with credit institutions 251,096 2,282 6,794
Ownership interests in group companies 1,150,000 1,150,000 1,150,000
Deferred tax asset - 4,547 7,003
Receivables 6,516 5,485 -
Total assets 1,407,612 1,162,313 1,163,797
Liabilities and equity
Tax payable 51,930 - -
Other liabilities 65 - 22
Accrued expenses 572 575 1,171
Total liabilities 52,567 575 1,193
Share capital 186,689 186,619 186,689
Share premium 971,182 966,570 971,182
Paid, not registered capital 5,819 4,683 -
Retained earnings and other reserves 191,356 3,867 4,734
Total equity 1,355,046 1,161,738 1,162,605
Total liabilities and equity 1,407,613 1,162,313 1,163,797
Gunn Ingemundsen
Board Member Board Member
_________________
Board Member
Tine Wollebekk
CEO
Bærum, 14 August, 2018
John Høsteland
Rolv-Erik Spilling
Board of directors of Norwegian Finans Holding ASA
Board Member
_________________ _________________ _________________
Bjørn Østbø Anita Aarnæs
Chairman of the Board Board Member
_________________ _________________ _________________
Christine Rødsæther
Report for the 2nd quarter 2018 Norwegian Finans Holding ASA
28
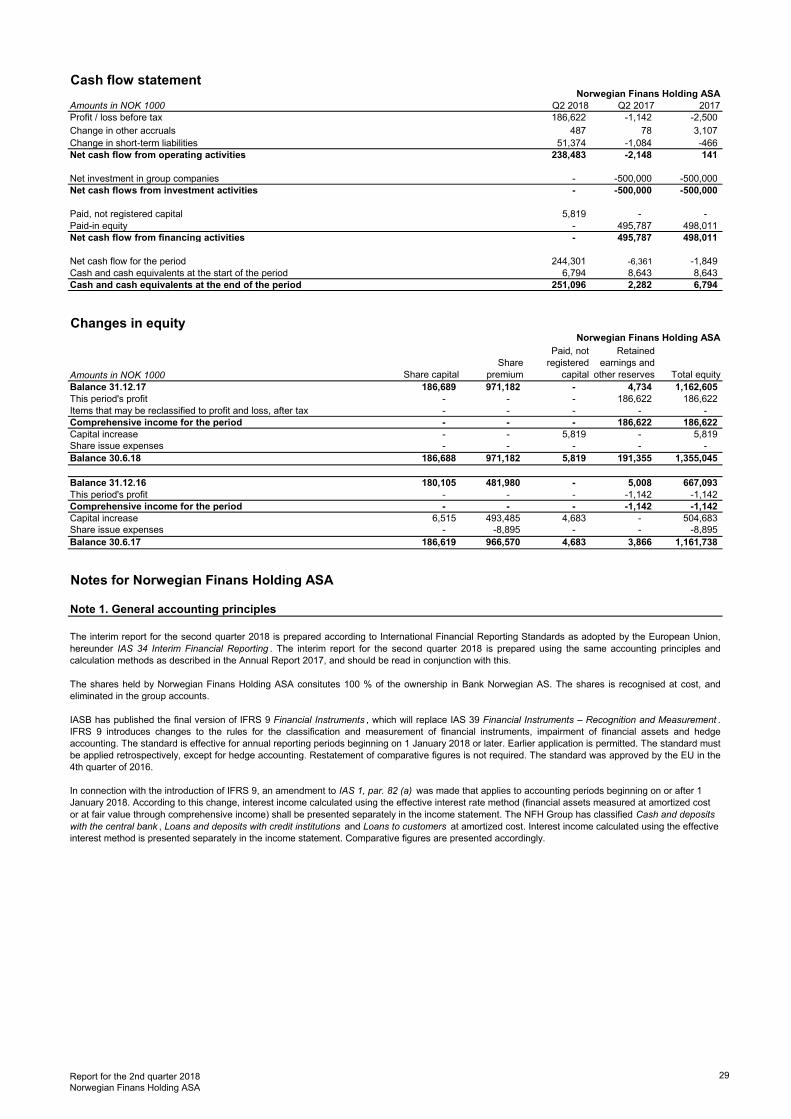
Cash flow statementNorwegian Finans Holding ASA
Amounts in NOK 1000 Q2 2018 Q2 2017 2017
Profit / loss before tax 186,622 -1,142 -2,500
Change in other accruals 487 78 3,107
Change in short-term liabilities 51,374 -1,084 -466
Net cash flow from operating activities 238,483 -2,148 141
Net investment in group companies - -500,000 -500,000
Net cash flows from investment activities - -500,000 -500,000
Paid, not registered capital 5,819 - -
Paid-in equity - 495,787 498,011
Net cash flow from financing activities - 495,787 498,011
Net cash flow for the period 244,301 -6,361 -1,849
Cash and cash equivalents at the start of the period 6,794 8,643 8,643
Cash and cash equivalents at the end of the period 251,096 2,282 6,794
Changes in equityNorwegian Finans Holding ASA
Amounts in NOK 1000
Balance 31.12.17 186,689 971,182 - 4,734 1,162,605
This period's profit - - - 186,622 186,622
Items that may be reclassified to profit and loss, after tax - - - - -
Comprehensive income for the period - - - 186,622 186,622
Capital increase - - 5,819 - 5,819
Share issue expenses - - - - -
Balance 30.6.18 186,688 971,182 5,819 191,355 1,355,045
Balance 31.12.16 180,105 481,980 - 5,008 667,093
This period's profit - - - -1,142 -1,142
Comprehensive income for the period - - - -1,142 -1,142
Capital increase 6,515 493,485 4,683 - 504,683
Share issue expenses - -8,895 - - -8,895
Balance 30.6.17 186,619 966,570 4,683 3,866 1,161,738
Total equity
In connection with the introduction of IFRS 9, an amendment to IAS 1, par. 82 (a) was made that applies to accounting periods beginning on or after 1
January 2018. According to this change, interest income calculated using the effective interest rate method (financial assets measured at amortized cost
or at fair value through comprehensive income) shall be presented separately in the income statement. The NFH Group has classified Cash and deposits
with the central bank , Loans and deposits with credit institutions and Loans to customers at amortized cost. Interest income calculated using the effective
interest method is presented separately in the income statement. Comparative figures are presented accordingly.
Share capital
Share
premium
Paid, not
registered
capital
Retained
earnings and
other reserves
IASB has published the final version of IFRS 9 Financial Instruments , which will replace IAS 39 Financial Instruments – Recognition and Measurement .
IFRS 9 introduces changes to the rules for the classification and measurement of financial instruments, impairment of financial assets and hedge
accounting. The standard is effective for annual reporting periods beginning on 1 January 2018 or later. Earlier application is permitted. The standard must
be applied retrospectively, except for hedge accounting. Restatement of comparative figures is not required. The standard was approved by the EU in the
4th quarter of 2016.
Notes for Norwegian Finans Holding ASA
Note 1. General accounting principles
The interim report for the second quarter 2018 is prepared according to International Financial Reporting Standards as adopted by the European Union,
hereunder IAS 34 Interim Financial Reporting . The interim report for the second quarter 2018 is prepared using the same accounting principles and
calculation methods as described in the Annual Report 2017, and should be read in conjunction with this.
The shares held by Norwegian Finans Holding ASA consitutes 100 % of the ownership in Bank Norwegian AS. The shares is recognised at cost, and
eliminated in the group accounts.
Report for the 2nd quarter 2018 Norwegian Finans Holding ASA
29

Note 2. Capital adequacy
Total capital
Amounts in NOK 1000 Q2 2018 Q2 2017 2017
Share capital 186,752 191,301 186,689
+ Share premium 976,938 966,570 971,182
+ Other reserves 191,355 3,867 4,734
- Deferred tax assets, intangible assets and additional valuation adjustment - 4,547 7,003
Common equity Tier 1 1,355,045 1,157,192 1,155,602
+ Additional Tier 1 capital - - -
Tier 1 capital 1,355,045 1,157,192 1,155,602
+ Tier 2 capital - - -
Total capital 1,355,045 1,157,192 1,155,602
Calculation basis
Credit risk
Covered bonds - - -
+ Institutions 50,219 456 1,359
+ Loans to customers - - -
+ Defaulted loans and other commitments 1,156,516 1,155,485 1,150,000
Operational risk - - -
Total calculation basis 1,206,735 1,155,941 1,151,359
Common equity Tier 1 % 112.29 % 100.11 % 100.37 %
Tier 1 capital % 112.29 % 100.11 % 100.37 %
Total capital % 112.29 % 100.11 % 100.37 %
Report for the 2nd quarter 2018 Norwegian Finans Holding ASA
30
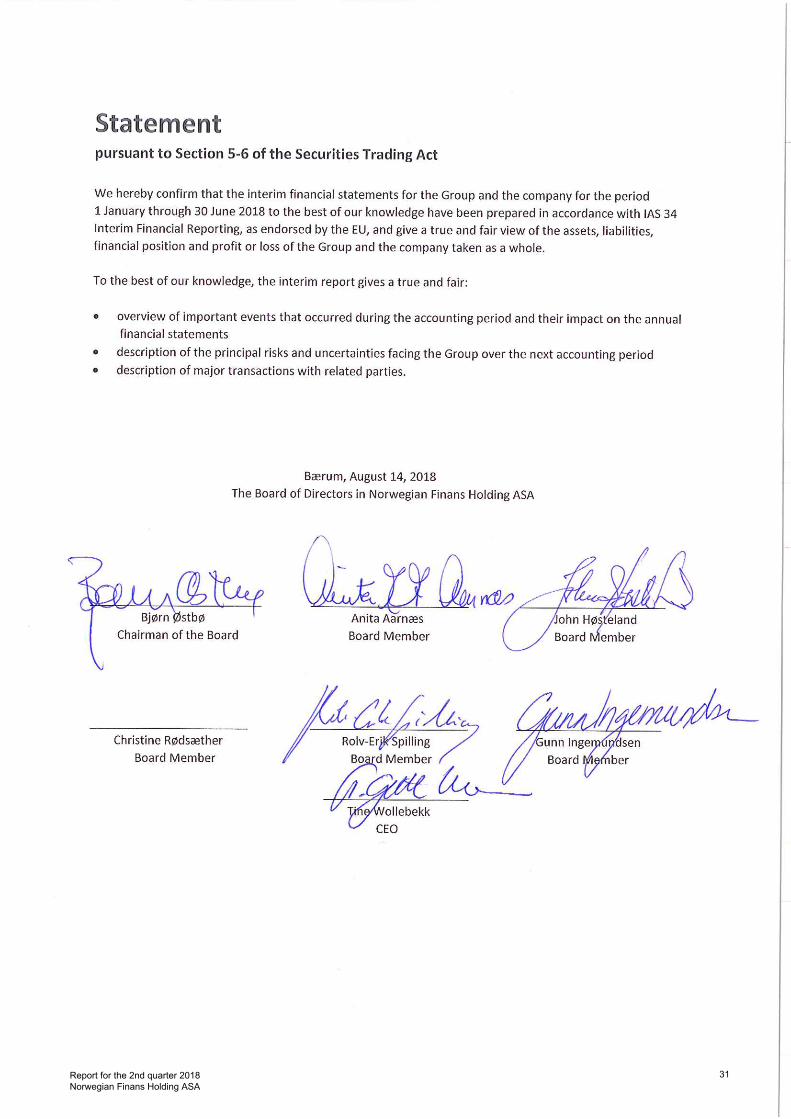
Report for the 2nd quarter 2018 Norwegian Finans Holding ASA
31