report itn 2014
TRANSCRIPT

Living PlanetReport 2014Summary
NI T
2014
REPORT
LPR2014 SUMMARY _230714.indd 14 06/08/2014 08:10

WWF Living Planet Report 2014 Summary page 2
BIODIVERSITY IS DECLINING SHARPLY, WHILE OUR DEMANDS ON NATURE ARE UNSUSTAINABLE AND INCREASING. SPECIES POPULATIONS WORLDWIDE HAVE DECLINED 52 PER CENT SINCE 1970. WE NEED 1.5 EARTHS TO MEET
THE DEMANDS WE CURRENTLY MAKE ON NATURE. THIS MEANS WE ARE EATING INTO OUR NATURAL CAPITAL,MAKING IT MORE DIFFICULT TO SUSTAIN THE NEEDS OF FUTURE GENERATIONS. THE DUAL EFFECT OF A GROWINGHUMAN POPULATION AND HIGH PER CAPITA FOOTPRINT WILL MULTIPLY THE PRESSURE WE PLACE ON
OUR RESOURCES. COUNTRIES WITH A HIGH LEVEL OF HUMAN DEVELOPMENT TEND TO HAVE HIGHER ECOLOGICAL FOOTPRINTS. THE CHALLENGE IS FOR COUNTRIES TO INCREASE THEIR HUMAN DEVELOPMENT WHILE KEEPING
THEIR FOOTPRINT DOWN TO GLOBALLY SUSTAINABLE LEVELS. WE MAY HAVE ALREADY CROSSED“PLANETARY BOUNDARIES” THAT COULD LEAD TO ABRUPT OR IRREVERSIBLE ENVIRONMENTAL CHANGES.
HUMAN WELL-BEING DEPENDS ON NATURAL RESOURCES SUCH AS WATER, ARABLE LAND, FISH AND WOOD; AND ECOSYSTEM SERVICES SUCH AS POLLINATION, NUTRIENT CYCLING AND EROSION CONTROL.
WHILE THE WORLD’S POOREST CONTINUE TO BE MOST VULNERABLE, THE INTERCONNECTED ISSUES OF FOOD, WATER AND ENERGY SECURITY AFFECT US ALL. WWF’S ONE PLANET PERSPECTIVE PROVIDES SOLUTIONS
FOR A LIVING PLANET – FOCUSING ON PROTECTING NATURAL CAPITAL, PRODUCING BETTER, CONSUMINGMORE WISELY, REDIRECTING FINANCIAL FLOWS AND MORE EQUITABLE RESOURCE GOVERNANCE.
CHANGING OUR COURSE AND FINDING ALTERNATIVE PATHWAYS WILL NOT BE EASY. BUT IT CAN BE DONE.
LPR2014 SUMMARY _230714.indd 2 06/08/2014 08:10
Summary page 3
BIODIVERSITY IS DECLINING SHARPLY, WHILE OUR DEMANDS ON NATURE ARE UNSUSTAINABLE AND INCREASING. SPECIES POPULATIONS WORLDWIDE HAVE DECLINED 52 PER CENT SINCE 1970. WE NEED 1.5 EARTHS TO MEET
THE DEMANDS WE CURRENTLY MAKE ON NATURE. THIS MEANS WE ARE EATING INTO OUR NATURAL CAPITAL,MAKING IT MORE DIFFICULT TO SUSTAIN THE NEEDS OF FUTURE GENERATIONS. THE DUAL EFFECT OF A GROWINGHUMAN POPULATION AND HIGH PER CAPITA FOOTPRINT WILL MULTIPLY THE PRESSURE WE PLACE ON
OUR RESOURCES. COUNTRIES WITH A HIGH LEVEL OF HUMAN DEVELOPMENT TEND TO HAVE HIGHER ECOLOGICAL FOOTPRINTS. THE CHALLENGE IS FOR COUNTRIES TO INCREASE THEIR HUMAN DEVELOPMENT WHILE KEEPING
THEIR FOOTPRINT DOWN TO GLOBALLY SUSTAINABLE LEVELS. WE MAY HAVE ALREADY CROSSED“PLANETARY BOUNDARIES” THAT COULD LEAD TO ABRUPT OR IRREVERSIBLE ENVIRONMENTAL CHANGES.
HUMAN WELL-BEING DEPENDS ON NATURAL RESOURCES SUCH AS WATER, ARABLE LAND, FISH AND WOOD; AND ECOSYSTEM SERVICES SUCH AS POLLINATION, NUTRIENT CYCLING AND EROSION CONTROL.
WHILE THE WORLD’S POOREST CONTINUE TO BE MOST VULNERABLE, THE INTERCONNECTED ISSUES OF FOOD, WATER AND ENERGY SECURITY AFFECT US ALL. WWF’S ONE PLANET PERSPECTIVE PROVIDES SOLUTIONS
FOR A LIVING PLANET – FOCUSING ON PROTECTING NATURAL CAPITAL, PRODUCING BETTER, CONSUMINGMORE WISELY, REDIRECTING FINANCIAL FLOWS AND MORE EQUITABLE RESOURCE GOVERNANCE.
CHANGING OUR COURSE AND FINDING ALTERNATIVE PATHWAYS WILL NOT BE EASY. BUT IT CAN BE DONE.
LPR2014 SUMMARY _230714.indd 3 06/08/2014 08:10

WWF Living Planet Report 2014 Summary page 4
FOREWORDWe are all in this together
This latest edition of the Living Planet Report is not for the faint-hearted. One key point that jumps out is that the Living Planet Index (LPI), which measures more than 10,000 representative populations of mammals, birds, reptiles, amphibians and fish, has declined by 52 per cent since 1970. Put another way, in less than two human generations, population sizes of vertebrate species have dropped by half. These are the living forms that constitute the fabric of the ecosystems which sustain life on Earth – and the barometer of what we are doing to our own planet, our only home. We ignore their decline at our peril.
We are using nature’s gifts as if we had more than just one Earth at our disposal. By taking more from our ecosystems and natural processes than can be replenished, we are jeopardizing our very future. Nature conservation and sustainable development go hand-in-hand. They are not only about preserving biodiversity and wild places, but just as much about safeguarding the future of humanity – our well-being, economy, food security and social stability – indeed, our very survival.
In a world where so many people live in poverty, it may appear as though protecting nature is a luxury. But it is quite the opposite. For many of the world’s poorest people, it is a lifeline. Importantly though, we are all in this together. We all need nutritious food, fresh water and clean air – wherever in the world we live.
Things look so worrying that it may seem difficult to feel positive about the future. Difficult, certainly, but not impossible – because it is in ourselves, who have caused the problem, that we can find the solution. Now we must work to ensure that the upcoming generation can seize the opportunity that we have so far failed to grasp, to close this destructive chapter in our history, and build a future where people can live and prosper in harmony with nature.
We are all connected – and collectively, we have the potential to find and adopt the solutions that will safeguard the future of this, our one and only planet.
Marco LambertiniDirector GeneralWWF International
© W
WF
-Ca
no
n / M
atth
ew
Lee
WE MUST SEIZE THE OPPORTUNITY TO CLOSE THIS DESTRUCTIVE CHAPTER IN OUR HISTORY, AND BUILD A FUTURE IN WHICH PEOPLE LIVE AND PROSPER IN HARMONY WITH NATURE
LPR2014 SUMMARY _230714.indd 4 06/08/2014 08:11
Summary page 5
SPECIES AND SPACES, PEOPLE AND PLACESOur societies and economies depend on a healthy planet
Sustainable development has figured prominently on the international agenda for more than a quarter of a century. People talk earnestly of the environmental, social and economic dimensions of development. Yet we continue to build-up the economic component, at considerable cost to the environmental one. We risk undermining social and economic gains by failing to appreciate our fundamental dependency on ecological systems. Social and economic sustainability are only possible with a healthy planet.
Ecosystems sustain societies that create economies. It does not work the other way round. But although human beings are a product of the natural world, we have become the dominant force that shapes ecological and biophysical systems. In doing so, we are not only threatening our health, prosperity and well-being, but our very future. The Living Planet Report® 2014 reveals the effects of the pressures we are placing on the planet. It explores the implications for society. And it underlines the importance of the choices we make, and the steps we take, to ensure this living planet can continue to sustain us all, now and for generations to come.
Figure 1: Ecosystems sustain societies that create economies
ECOLOGICALDOMAIN
SOCIALDOMAINSOCIAL
DOMAIN
ECONOMICDOMAIN
Living Planet Report 2014This booklet provides a summary of the tenth edition of WWF’s Living Planet Report ® – a biennial publication that documents the state of the planet – the changing state of biodiversity, ecosystems and humanity’s demand on natural resources – and what this means for humanity.
Download the full report at wwf.panda.org/lpr
LPR2014 SUMMARY _230714.indd 5 06/08/2014 08:11

LPR2014 SUMMARY _230714.indd 6 06/08/2014 08:11
© n
ature
pl.c
om
/ An
dy R
ou
se / W
WF
-Ca
no
n
A LIVING PLANET~Only around 880 mountain gorillas remain in the wild – about 200 of them in Virunga National Park in the Democratic Republic of Congo (DRC). Although they remain critically endangered, they are the only type of great ape whose numbers are increasing, thanks to intensive conservation eff orts.
Mountain gorillas are among the 218 mammal species found in Virunga, along with 706 bird species, 109 reptile species, 78 amphibian species and more than 2,000 species of plants. But oil concessions have been allocated across 85 per cent of the park, putting its long-term future in doubt. Drilling for oil could lead to habitat degradation and see the park lose its protected status and World Heritage Site listing, leaving its wildlife increasingly vulnerable.
Globally, habitat loss and degradation, hunting and climate change are the main threats facing the world’s biodiversity. They have contributed to a decline of 52 per cent in the Living Planet Index ® since 1970 – in other words, the number of mammals, birds, reptiles, amphibians and fi sh with which we share our planet has fallen by half.
LPR2014 SUMMARY _230714.indd 7 06/08/2014 08:11

WWF Living Planet Report 2014 Summary page 8
THE LIVING PLANET INDEXPopulation sizes of vertebrate species have halved over the last 40 years
The state of the world’s biodiversity appears worse than ever. The Living Planet Index (LPI), which measures trends in thousands of vertebrate species populations, shows a decline of 52 per cent between 1970 and 2010 (Figure 2). In other words, the number of mammals, birds, reptiles, amphibians and fi sh across the globe is, on average, about half the size it was 40 years ago. This is a much bigger decrease than has been reported previously, as a result of a new methodology which aims to be more representative of global biodiversity.
Biodiversity is declining in both temperate and tropical regions, but the decline is greater in the tropics. The 6,569 populations of 1,606 species in the temperate LPI declined by 36 per cent from 1970 to 2010. The tropical LPI shows a 56 per cent reduction in 3,811 populations of 1,638 species over the same period. Latin America shows the most dramatic decline – a fall of 83 per cent. Habitat loss and degradation, and exploitation through hunting and fi shing, are the primary causes of decline. Climate change is the next most common primary threat, and is likely to put more pressure on populations in the future.
Figure 2: Living Planet Index (LPI) The global LPI shows a decline of 52 per cent between 1970 and 2010. This suggests that, on average, vertebrate species populations are about half the size they were 40 years ago. This is based on trends in 10,380 populations of 3,038 mammal, bird, reptile, amphibian and fi sh species. The white line shows the index values and the shaded areas represent the 95 per cent confi dence limits surrounding the trend. (WWF, ZSL, 2014).
0
1
2
1970 1980 1990 2000 2010
Year
Inde
x V
alue
(197
0 =
1)
Key
Global Living Planet Index
Confi dence limits
LPR2014 SUMMARY _230714.indd 8 06/08/2014 08:11
Summary page 9
Marine LPI Marine species declined 39 per cent between 1970 and 2010. The period from 1970 through to the mid-1980s experienced the steepest decline, after which there was some stability, before another recent period of decline. The steepest declines can be seen in the tropics and the Southern Ocean – species in decline include marine turtles, many sharks, and large migratory seabirds like the wandering albatross.
Freshwater LPIThe LPI for freshwater species shows an average decline of 76 per cent. The main threats to freshwater species are habitat loss and fragmentation, pollution and invasive species. Changes to water levels and freshwater system connectivity – for example through irrigation and hydropower dams – have a major impact on freshwater habitats.
Terrestrial LPITerrestrial species declined by 39 per cent between 1970 and 2010, a trend that shows no sign of slowing down. The loss of habitat to make way for human land use – particularly for agriculture, urban development and energy production – continues to be a major threat, compounded by hunting.
-39%
-76%
-39%
TERRESTRIAL SPECIES DECLINED BY 39 PER CENT BETWEEN 1970 AND 2010
THE LPI FOR FRESHWATER SPECIES SHOWS AN AVERAGE DECLINE OF 76 PER CENT
MARINE SPECIES DECLINED 39 PER CENT BETWEEN 1970 AND 2010
LPR2014 SUMMARY _230714.indd 9 06/08/2014 08:11

WWF Living Planet Report 2014 Summary page 10
THE ECOLOGICAL FOOTPRINTWe are using more than Earth can provide
For more than 40 years, humanity’s demand on nature has exceeded what our planet can replenish. We would need the regenerative capacity of 1.5 Earths to provide the ecological services we currently use. “Overshoot” is possible because we can cut trees faster than they mature, harvest more fi sh than oceans replenish, or emit more carbon into the atmosphere than forests and oceans can absorb. The consequences are diminished resource stocks and waste accumulating faster than it can be absorbed or recycled, such as with the growing carbon concentration in the atmosphere.
The Ecological Footprint adds up the ecological goods and services people demand that compete for space. It includes the biologically productive area (or biocapacity) needed for crops, grazing land, built-up areas, fi shing grounds and forest products. It also includes the area of forest needed to absorb additional carbon dioxide emissions that cannot be absorbed by the oceans. Both biocapacity and Ecological Footprint are expressed in a common unit called a global hectare (gha).
Carbon from burning fossil fuels has been the dominant component of humanity’s Ecological Footprint for more than half a century, and remains on an upward trend. In 1961, carbon was 36 per cent of our total Footprint; by 2010, it comprised 53 per cent.
0
1
2
1961 1970 1980 1990 2000 2010
Ecol
ogic
al F
ootp
rint
(N
umbe
r of
pla
net E
arth
s)
Year
Fishing grounds
Cropland
Built-up land
Grazing products
Forest products
Carbon
Key
Figure 3: The Ecological Footprint components: the carbon component makes up more than half of the total global Ecological Footprint. (Global Footprint Network, 2014).
1 GLOBAL HECTARE (GHA) REPRESENTS A BIOLOGICALLY PRODUCTIVE HECTARE WITH WORLD AVERAGE PRODUCTIVITY
LPR2014 SUMMARY _230714.indd 10 06/08/2014 11:41
Summary page 11
Technological advances, agricultural inputs and irrigation have boosted the average yields per hectare of productive area, especially for cropland, raising the planet’s total biocapacity from 9.9 to 12 billion global hectares (gha) between 1961 and 2010. However, during the same period, the global human population increased from 3.1 billion to nearly 7 billion, reducing the available biocapacity per capita from 3.2 to 1.7 gha. Meanwhile, Ecological Footprints increased from 2.5 to 2.7 gha per capita. So while biocapacity has increased globally, there is now less of it to go around. With world population projected to reach 9.6 billion by 2050 and 11 billion by 2100, the amount of biocapacity available for each of us will shrink further – and it will be increasingly challenging to maintain biocapacity increases in the face of soil degradation, freshwater scarcity and increased energy costs.
1961 1970 1980 1990 2000 2010
Inde
x (c
hang
e fr
om 1
961,
196
1=10
0%)
Year
0%
50%
100%
150%
200%
250%
300%
Population
1961 : 3.09 billion
2010 : 6.9 billion
Biocapacity:
1961 : 9.9 billion gha
2010 : 12 billion gha
Ecological Footprint:1961 : 7.6 billion gha2010 : 18.1 billion gha
Key
Biocapacity Ecological FootprintPopulation
Figure 4: The growing global Footprint: The Ecological Footprint – which measures the area required to supply the ecological services used – increased faster than global biocapacity – the land actually available to provide these services. The increase in the Earth’s productivity has not been enough to compensate for the demands of the growing global population. (Global Footprint Network, 2014).
IN 2010, GLOBAL ECOLOGICAL FOOTPRINT WAS 18.1 BILLION GHA, OR 2.6 GHA PER CAPITA. EARTH’S TOTAL BIOCAPACITY WAS 12 BILLION GHA, OR 1.7 GHA PER CAPITA
LPR2014 SUMMARY _230714.indd 11 06/08/2014 08:11

WWF Living Planet Report 2014 Summary page 12
0
2
4
6
8
10
12
Per c
apita
Eco
logi
cal F
ootp
rint
(glo
bal h
ecta
res d
eman
ded
per p
erso
n)
Country
Kuw
ait
Qa
tar
Uni
ted
Ara
b E
mira
tes
Den
mar
kB
elgi
umTr
inid
ad a
nd T
obag
oS
inga
pore
Uni
ted
Sta
tes
of A
mer
ica
Bah
rain
Sw
eden
Can
ada
Net
herl
ands
Aus
tral
iaIr
elan
dF
inla
ndU
rugu
ayA
ustr
iaS
witz
erla
ndC
zech
Rep
ublic
Est
onia
Om
anM
ongo
liaFr
ance
Slo
veni
aG
erm
any
Italy
Por
tuga
lU
nite
d K
ingd
omK
azak
hsta
nG
reec
eR
epub
lic o
f K
orea
Mau
ritiu
sS
audi
Ara
bia
Isra
elC
ypru
sLi
thua
nia
Pol
and
Bel
arus
Rus
sia
Spa
inP
arag
uay
Japa
nTu
rkm
enis
tan
Latv
iaS
lova
kia
Leba
non
Liby
aC
roa
tiaM
exic
oV
enez
uela
New
Zea
land
Bul
garia
Bra
zil
Mac
edon
ia T
FY
RM
alay
sia
Chi
leIr
anH
unga
ryA
rgen
tina
Bot
swan
aP
apua
New
Gui
nea
Wo
rld
Ave
rag
eU
krai
neTu
rkey
Sou
th A
fric
aG
abon
Bos
nia
and
Her
zego
vina
Ser
bia
Bol
ivia
Cos
ta R
ica
Rom
ania
Mau
ritan
iaN
iger
Tha
iland
Pan
ama
Chi
naJa
mai
caE
l Sal
vado
rJo
rdan
Mya
nmar
Ecu
ador
Tuni
sia
Col
ombi
aM
ali
Egy
ptA
lban
iaC
had
Gua
tem
ala
Gha
naU
zbek
ista
nA
lger
iaS
waz
iland
Gui
nea-
Bis
sau
Gam
bia
Cub
aG
uine
aH
ondu
ras
Syr
iaV
iet N
amM
oldo
vaA
zerb
aija
nA
rmen
iaIr
aqP
eru
Bur
kina
Fas
oM
oroc
coN
icar
agua
Sud
anD
omin
ican
Rep
ublic
Ben
inK
yrgy
zsta
nIn
done
sia
Zim
babw
eS
eneg
alU
gand
aN
iger
iaLa
osN
orth
Kor
eaS
ri La
nka
Cam
eroo
nC
entr
al A
fric
an R
epub
licTa
nzan
iaG
eorg
iaLi
beria
Som
alia
Cam
bodi
aE
thio
pia
Mad
agas
car
Sie
rra
Leon
eP
hilip
pine
sLe
soth
oA
ngol
aTo
goC
ôte
d'Iv
oire
Ken
yaIn
dia
Con
goB
urun
diYe
men
Zam
bia
Rw
anda
Moz
ambi
que
Tajik
ista
nN
epal
Mal
awi
Dem
ocra
tic R
epub
lic o
f C
ongo
Ban
glad
esh
Pak
ista
nA
fgha
nist
anH
aiti
Erit
rea
Occ
upie
d P
ales
tinia
n Te
rrito
ryT
imor
-Les
te
F igure 5: Ecological Footprint per country, per capita, 2010 This comparison includes all countries with populations greater than 1 million for which complete data is available (Global Footprint Network, 2014).
FOOTPRINT BY COUNTRY
Key
Built-up land
Fishing grounds
Forest products
Grazing products
Cropland
CarbonWorld average biocapacity
0
2
4
6
8
10
12
Per c
apita
Eco
logi
cal F
ootp
rint
(glo
bal h
ecta
res d
eman
ded
per p
erso
n)
Country
Kuw
ait
Qa
tar
Uni
ted
Ara
b E
mira
tes
Den
mar
kB
elgi
umTr
inid
ad a
nd T
obag
oS
inga
pore
Uni
ted
Sta
tes
of A
mer
ica
Bah
rain
Sw
eden
Can
ada
Net
herl
ands
Aus
tral
iaIr
elan
dF
inla
ndU
rugu
ayA
ustr
iaS
witz
erla
ndC
zech
Rep
ublic
Est
onia
Om
anM
ongo
liaFr
ance
Slo
veni
aG
erm
any
Italy
Por
tuga
lU
nite
d K
ingd
omK
azak
hsta
nG
reec
eR
epub
lic o
f K
orea
Mau
ritiu
sS
audi
Ara
bia
Isra
elC
ypru
sLi
thua
nia
Pol
and
Bel
arus
Rus
sia
Spa
inP
arag
uay
Japa
nTu
rkm
enis
tan
Latv
iaS
lova
kia
Leba
non
Liby
aC
roa
tiaM
exic
oV
enez
uela
New
Zea
land
Bul
garia
Bra
zil
Mac
edon
ia T
FY
RM
alay
sia
Chi
leIr
anH
unga
ryA
rgen
tina
Bot
swan
aP
apua
New
Gui
nea
Wo
rld
Ave
rag
eU
krai
neTu
rkey
Sou
th A
fric
aG
abon
Bos
nia
and
Her
zego
vina
Ser
bia
Bol
ivia
Cos
ta R
ica
Rom
ania
Mau
ritan
iaN
iger
Tha
iland
Pan
ama
Chi
naJa
mai
caE
l Sal
vado
rJo
rdan
Mya
nmar
Ecu
ador
Tuni
sia
Col
ombi
aM
ali
Egy
ptA
lban
iaC
had
Gua
tem
ala
Gha
naU
zbek
ista
nA
lger
iaS
waz
iland
Gui
nea-
Bis
sau
Gam
bia
Cub
aG
uine
aH
ondu
ras
Syr
iaV
iet N
amM
oldo
vaA
zerb
aija
nA
rmen
iaIr
aqP
eru
Bur
kina
Fas
oM
oroc
coN
icar
agua
Sud
anD
omin
ican
Rep
ublic
Ben
inK
yrgy
zsta
nIn
done
sia
Zim
babw
eS
eneg
alU
gand
aN
iger
iaLa
osN
orth
Kor
eaS
ri La
nka
Cam
eroo
nC
entr
al A
fric
an R
epub
licTa
nzan
iaG
eorg
iaLi
beria
Som
alia
Cam
bodi
aE
thio
pia
Mad
agas
car
Sie
rra
Leon
eP
hilip
pine
sLe
soth
oA
ngol
aTo
goC
ôte
d'Iv
oire
Ken
yaIn
dia
Con
goB
urun
diYe
men
Zam
bia
Rw
anda
Moz
ambi
que
Tajik
ista
nN
epal
Mal
awi
Dem
ocra
tic R
epub
lic o
f C
ongo
Ban
glad
esh
Pak
ista
nA
fgha
nist
anH
aiti
Erit
rea
Occ
upie
d P
ales
tinia
n Te
rrito
ryT
imor
-Les
te
LPR2014 SUMMARY _230714.indd 12 06/08/2014 08:11
Summary page 13
0
2
4
6
8
10
12
Per c
apita
Eco
logi
cal F
ootp
rint
(glo
bal h
ecta
res d
eman
ded
per p
erso
n)
Country
Kuw
ait
Qa
tar
Uni
ted
Ara
b E
mira
tes
Den
mar
kB
elgi
umTr
inid
ad a
nd T
obag
oS
inga
pore
Uni
ted
Sta
tes
of A
mer
ica
Bah
rain
Sw
eden
Can
ada
Net
herl
ands
Aus
tral
iaIr
elan
dF
inla
ndU
rugu
ayA
ustr
iaS
witz
erla
ndC
zech
Rep
ublic
Est
onia
Om
anM
ongo
liaFr
ance
Slo
veni
aG
erm
any
Italy
Por
tuga
lU
nite
d K
ingd
omK
azak
hsta
nG
reec
eR
epub
lic o
f K
orea
Mau
ritiu
sS
audi
Ara
bia
Isra
elC
ypru
sLi
thua
nia
Pol
and
Bel
arus
Rus
sia
Spa
inP
arag
uay
Japa
nTu
rkm
enis
tan
Latv
iaS
lova
kia
Leba
non
Liby
aC
roa
tiaM
exic
oV
enez
uela
New
Zea
land
Bul
garia
Bra
zil
Mac
edon
ia T
FY
RM
alay
sia
Chi
leIr
anH
unga
ryA
rgen
tina
Bot
swan
aP
apua
New
Gui
nea
Wo
rld
Ave
rag
eU
krai
neTu
rkey
Sou
th A
fric
aG
abon
Bos
nia
and
Her
zego
vina
Ser
bia
Bol
ivia
Cos
ta R
ica
Rom
ania
Mau
ritan
iaN
iger
Tha
iland
Pan
ama
Chi
naJa
mai
caE
l Sal
vado
rJo
rdan
Mya
nmar
Ecu
ador
Tuni
sia
Col
ombi
aM
ali
Egy
ptA
lban
iaC
had
Gua
tem
ala
Gha
naU
zbek
ista
nA
lger
iaS
waz
iland
Gui
nea-
Bis
sau
Gam
bia
Cub
aG
uine
aH
ondu
ras
Syr
iaV
iet N
amM
oldo
vaA
zerb
aija
nA
rmen
iaIr
aqP
eru
Bur
kina
Fas
oM
oroc
coN
icar
agua
Sud
anD
omin
ican
Rep
ublic
Ben
inK
yrgy
zsta
nIn
done
sia
Zim
babw
eS
eneg
alU
gand
aN
iger
iaLa
osN
orth
Kor
eaS
ri La
nka
Cam
eroo
nC
entr
al A
fric
an R
epub
licTa
nzan
iaG
eorg
iaLi
beria
Som
alia
Cam
bodi
aE
thio
pia
Mad
agas
car
Sie
rra
Leon
eP
hilip
pine
sLe
soth
oA
ngol
aTo
goC
ôte
d'Iv
oire
Ken
yaIn
dia
Con
goB
urun
diYe
men
Zam
bia
Rw
anda
Moz
ambi
que
Tajik
ista
nN
epal
Mal
awi
Dem
ocra
tic R
epub
lic o
f C
ongo
Ban
glad
esh
Pak
ista
nA
fgha
nist
anH
aiti
Erit
rea
Occ
upie
d P
ales
tinia
n Te
rrito
ryT
imor
-Les
te
World average biocapacity per person was 1.7 gha in 2010.
The size and composition of a nation’s per capita Ecological Footprint is determined by the goods and services used by an average person in that country, and the effi ciency with which resources, including fossil fuels, are used in providing these goods and services. Not surprisingly, most of the 25 countries with the largest per capita Ecological Footprints are high-income nations; for virtually all of them, carbon was the biggest Footprint component.
Contributions to global ecological overshoot vary across nations. For example, if all people on the planet had the Footprint of the average resident of Qatar, we would need 4.8 planets. If we lived the lifestyle of a typical resident of the US, we would need 3.9 planets. The fi gure for a typical resident of Slovakia or South Korea would be 2 or 2.5 planets respectively, while a typical resident of South Africa or Argentina would need 1.4 or 1.5 planets respectively.
AT A NATIONAL LEVEL THE CARBON FOOTPRINT REPRESENTS MORE THAN HALF THE ECOLOGICAL FOOTPRINT FOR A QUARTER OF ALL COUNTRIES TRACKED
0
2
4
6
8
10
12
Per c
apita
Eco
logi
cal F
ootp
rint
(glo
bal h
ecta
res d
eman
ded
per p
erso
n)
Country
Kuw
ait
Qa
tar
Uni
ted
Ara
b E
mira
tes
Den
mar
kB
elgi
umTr
inid
ad a
nd T
obag
oS
inga
pore
Uni
ted
Sta
tes
of A
mer
ica
Bah
rain
Sw
eden
Can
ada
Net
herl
ands
Aus
tral
iaIr
elan
dF
inla
ndU
rugu
ayA
ustr
iaS
witz
erla
ndC
zech
Rep
ublic
Est
onia
Om
anM
ongo
liaFr
ance
Slo
veni
aG
erm
any
Italy
Por
tuga
lU
nite
d K
ingd
omK
azak
hsta
nG
reec
eR
epub
lic o
f K
orea
Mau
ritiu
sS
audi
Ara
bia
Isra
elC
ypru
sLi
thua
nia
Pol
and
Bel
arus
Rus
sia
Spa
inP
arag
uay
Japa
nTu
rkm
enis
tan
Latv
iaS
lova
kia
Leba
non
Liby
aC
roa
tiaM
exic
oV
enez
uela
New
Zea
land
Bul
garia
Bra
zil
Mac
edon
ia T
FY
RM
alay
sia
Chi
leIr
anH
unga
ryA
rgen
tina
Bot
swan
aP
apua
New
Gui
nea
Wo
rld
Ave
rag
eU
krai
neTu
rkey
Sou
th A
fric
aG
abon
Bos
nia
and
Her
zego
vina
Ser
bia
Bol
ivia
Cos
ta R
ica
Rom
ania
Mau
ritan
iaN
iger
Tha
iland
Pan
ama
Chi
naJa
mai
caE
l Sal
vado
rJo
rdan
Mya
nmar
Ecu
ador
Tuni
sia
Col
ombi
aM
ali
Egy
ptA
lban
iaC
had
Gua
tem
ala
Gha
naU
zbek
ista
nA
lger
iaS
waz
iland
Gui
nea-
Bis
sau
Gam
bia
Cub
aG
uine
aH
ondu
ras
Syr
iaV
iet N
amM
oldo
vaA
zerb
aija
nA
rmen
iaIr
aqP
eru
Bur
kina
Fas
oM
oroc
coN
icar
agua
Sud
anD
omin
ican
Rep
ublic
Ben
inK
yrgy
zsta
nIn
done
sia
Zim
babw
eS
eneg
alU
gand
aN
iger
iaLa
osN
orth
Kor
eaS
ri La
nka
Cam
eroo
nC
entr
al A
fric
an R
epub
licTa
nzan
iaG
eorg
iaLi
beria
Som
alia
Cam
bodi
aE
thio
pia
Mad
agas
car
Sie
rra
Leon
eP
hilip
pine
sLe
soth
oA
ngol
aTo
goC
ôte
d'Iv
oire
Ken
yaIn
dia
Con
goB
urun
diYe
men
Zam
bia
Rw
anda
Moz
ambi
que
Tajik
ista
nN
epal
Mal
awi
Dem
ocra
tic R
epub
lic o
f C
ongo
Ban
glad
esh
Pak
ista
nA
fgha
nist
anH
aiti
Erit
rea
Occ
upie
d P
ales
tinia
n Te
rrito
ryT
imor
-Les
te
LPR2014 SUMMARY _230714.indd 13 06/08/2014 08:11

LOCAL NEEDS, GLOBAL PRESSURES~In the weekly market in Vitshumbi, people buy fresh vegetables and freshly caught fi sh from Lake Edward. The lake was at the centre of oil exploration activities carried out by UK-based Soco International PLC. The company agreed to stop operations in Virunga National Park earlier this year following an international campaign led by WWF.
Few countries are richer in biocapacity and natural resources than DRC. Yet its inhabitants have one of the lowest Ecological Footprints on the planet, and the country sits rock bottom of the UN inequality-adjusted Human Development Index.
Oil extraction in Virunga, to help fuel the unsustainable lifestyles of higher-income countries, might bring short-term profi ts to a few. But it’s unlikely to deliver real development: In the Niger Delta, poverty and inequality indicators have worsened since the discovery of oil. In the long term, the only way for the Congolese people to meet their needs and improve their prospects is through sustainable management and wise use of the country’s natural capital.
LPR2014 SUMMARY _230714.indd 14 06/08/2014 08:11
© B
ren
t Stirto
n / R
ep
orta
ge
for G
etty Im
ag
es / W
WF
-Ca
no
n
LPR2014 SUMMARY _230714.indd 15 06/08/2014 08:11

WWF Living Planet Report 2014 Summary page 16
1961 1970 1980 1990 2000 2010
Ecol
ogic
al F
ootp
rint
(gha
per
cap
ita)
Year
0
1
2
3
4
5
6
7
Low income
Key
High incomeMiddle income
World biocapacity
UNEQUAL DEMANDS, UNEQUAL CONSEQUENCESLow-income countries have the smallest Footprint, but suff er the greatest ecosystem losses
Most high-income countries have maintained per capita Footprints greater than the amount of biocapacity available per person on this planet for over half a century, largely depending on the biocapacity of other countries to support their lifestyles. People in middle- and low-income countries have seen little increase in their relatively small per capita Footprints over the same time period.
Figure 6: Ecological Footprint per capita (gha) in high-, middle- and low-income countries (World Bank classifi cation and data) between 1961 and 2010 The green line represents world average biocapacity per capita. (Global Footprint Network, 2014).
LPR2014 SUMMARY _230714.indd 16 06/08/2014 08:11
Summary page 17
Figure 7: LPI and country income groups (World Bank classifi cation), 1970-2010. (ZSL, WWF, 2014).
0
1
2
Inde
x V
alue
(197
0 =
1)
1970 1980 1990 2000 2010
Year
Key
High income
Middle income
Low income
Comparing LPI trends in countries with diff erent average levels of income shows stark diff erences. While high-income countries show an increase (10 per cent) in biodiversity, middle-income countries show decline (18 per cent), and low-income countries show dramatic and marked decline (58 per cent). However, this masks large-scale biodiversity loss before 1970 in Europe, North America and Australia. It may also refl ect the way high-income countries import resources – eff ectively outsourcing biodiversity loss and its impacts to lower-income countries.
THE TRENDS OF LOW-INCOME COUNTRIES CONTINUE TO BE CATASTROPHIC, BOTH FOR BIODIVERSITY AND PEOPLE
LPR2014 SUMMARY _230714.indd 17 06/08/2014 08:11

WWF Living Planet Report 2014 Summary page 18
THE PATH TO SUSTAINABLE DEVELOPMENTNo country is yet achieving a high level of human development with a globally sustainable Footprint – but some are moving in the right direction
For a country to achieve globally sustainable development, it must have a per capita Ecological Footprint smaller than the per capita biocapacity available on the planet, while maintaining a decent standard of living. The former means a per capita Footprint lower than 1.7 gha – the maximum that could be replicated worldwide without resulting in global overshoot. The latter can be defined as a score of 0.71 or above on the UN inequality-adjusted Human Development Index (IHDI). Currently, no country meets both of these criteria.
Minimum global sustainable development quadrant
Hig
h H
uman
Dev
elop
men
t
Ver
y H
igh
Hum
anD
evel
opm
ent
Med
ium
Hum
anD
evel
opm
ent
Low Human Development
2
4
6
8
10
Ecol
ogic
al F
ootp
rint
per
cap
ita (g
ha)
0 0.0 0.2 0.4 0.6 0.8 1.0
UN inequality-adjusted Human Development Index (IHDI)
Figure 8: Correlating the Ecological Footprint with inequality-adjusted Human Development Index (for latest year)The dots representing each country are coloured according to their geographic region and scaled relative to their population. No country is yet within the global sustainable development quadrant in the bottom right corner.
Key
Africa
Middle East/Central Asia
Asia -Pacific
South America
Central America/Caribbean
North America
EU
Other Europe
Summary page 19
THE ELEVATED HUMAN DEVELOPMENT IN HIgH INcOME cOUNTrIES HAS BEEN AcHIEVED AT THE ExPENSE Of A LArgE EcOLOgIcAL fOOTPrINT. DEcOUPLINg AND rEVErSINg THIS rELATIONSHIP IS A kEy gLOBAL cHALLENgE
Hig
h H
uman
Dev
elop
men
t
Med
ium
Hum
anD
evel
opm
ent
Low Human Development
Very HighHumanDevelopment
Minimum global sustainable development quadrant
China
Turkey
USA
Germany
Brazil
Ecol
ogic
al F
ootp
rint
per
cap
ita (g
ha)
UN Human Development Index (HDI)
0
2
4
6
8
10
1.00.0 0.2 0.4 0.6 0.8
Figure 9: The Ecological Footprint in relation to HDI Time trends (1980-2010) are shown for a small selection of countries. The dotted lines mark the HDI thresholds for low, medium, high and very high human development. (Global Footprint Network, 2014; UNDP, 2013). NOTE: Since IHDI was not introduced until 2010, in this graph HDI is not inequality-adjusted.
However, some countries are moving in the right direction. The path of progression varies from country to country. Figure 9 shows that some countries have significantly increased their human development with a relatively low increase in Footprint, while others have reduced their Footprint while maintaining high levels of development.

WWF Living Planet Report 2014 Summary page 20
PLANETARY BOUNDARIESDefi ning the safe space for life on Earth
Complementary information and indicators deepen and extend our understanding of our living planet by panning out to focus on global issues or zooming in on specifi c regions, themes or species. Humans have profi ted hugely from the extraordinarily predictable and stable environmental conditions of the last 10,000 years – the geological period known as the Holocene, which made it possible for settled human communities to evolve and eventually develop into the modern societies of today. But the world has entered a new period – the “Anthropocene” – in which human activities are the largest drivers of change at the planetary scale. Given the pace and scale of change, we can no longer exclude the possibility of reaching critical tipping points that could abruptly and irreversibly change living conditions on Earth.
F igure 10: Planetary boundaries Defi ning planetary boundaries establishes a “safe operating space for humanity”, where we have the best chance of continuing to develop and thrive for many generations to come (Stockholm Resilience Centre, 2009).
(Biogeochem
ical flo
w boun
dary)
Chemical Pollution
Climate ChangeOcean
Acidification
Stratospheric Ozone
Depletion
Nitrogen Cycle
Phosphorus Cycle
Global Fresh Water Use
Change in Land Use
Biodiversity Loss
Atmospheric Aerosol Loading
Key
Progress by 2009
Safe limits
LPR2014 SUMMARY _230714.indd 20 06/08/2014 08:11
Summary page 21
The planetary boundaries concept raises questions about justice and development within the means of one planet. Just as beyond the environmental ceiling lies unacceptable environmental stress, below a “social foundation” lies unacceptable human deprivation.
WATERFOOD
HEALTH
GENDER EQUALITY
SOCIALEQUITY
ENERGY JOBS
RESILIENCE
EDUCATION
INCOME
THE S
AFE AND JUST SPACE FOR HUMANITY
ENVIRONMENTAL CEILING
SOCIAL FOUNDATION
CLIMATE CHANGE
LAND USE CHANGE
BIODIV
ERSIT
Y LOS
SBIO
DIVER
SITY L
OSS
LOADING
PHOSPHORUS CYCLES
OCEAN ACIDI
FICAT
ION
CHEMICAL POLLUTION
FRESHWATER USE
ATMOSPHERIC AEROSOL
NITROGEN AND
INCLUSIVE AND SUSTAINABLE ECONOMIC DEVELOPMENT
OZONE DEPLETION
VOICE
The planetary boundaries framework identifies the environmental processes that regulate the stability of the planet. For each it attempts to define, based on the best available science, safe boundaries. Beyond these boundaries, we enter a danger zone where abrupt negative changes are likely to occur.
While exact tipping-points are impossible to determine with any degree of certainty, three planetary boundaries appear to have already been transgressed: biodiversity loss, and changes to the climate and nitrogen cycle, with already visible impacts on the well-being of human health and our demands on food, water and energy.
The planetary boundaries concept suggests that the existence of the world that we have known and profited from through the Holocene now depends on our actions as planetary stewards.
Figure 11: The Oxfam Doughnut – A safe and just operating space for humanity Safe in that it avoids crossing environmental tipping points, and just in that it ensures that every person achieves certain standards of health, wealth, power and participation (Raworth, 2012).
LPR2014 SUMMARY _230714.indd 21 06/08/2014 08:11
LPR2014 SUMMARY _230714.indd 22 06/08/2014 08:11
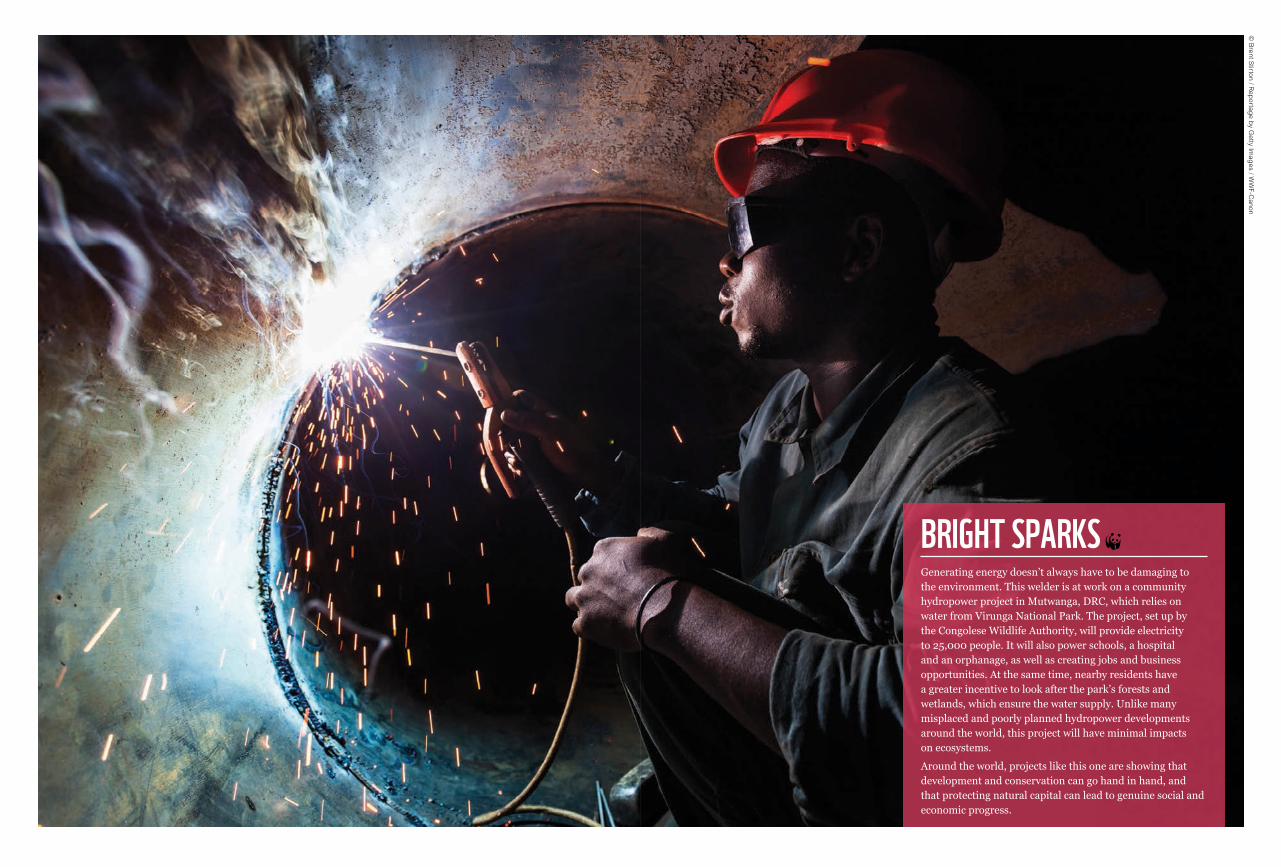
BRIGHT SPARKS~Generating energy doesn’t always have to be damaging to the environment. This welder is at work on a community hydropower project in Mutwanga, DRC, which relies on water from Virunga National Park. The project, set up by the Congolese Wildlife Authority, will provide electricity to 25,000 people. It will also power schools, a hospital and an orphanage, as well as creating jobs and business opportunities. At the same time, nearby residents have a greater incentive to look after the park’s forests and wetlands, which ensure the water supply. Unlike many misplaced and poorly planned hydropower developments around the world, this project will have minimal impacts on ecosystems.
Around the world, projects like this one are showing that development and conservation can go hand in hand, and that protecting natural capital can lead to genuine social and economic progress.
© B
ren
t Stirto
n / R
ep
orta
ge
by G
etty Im
ag
es / W
WF
-Ca
no
n
LPR2014 SUMMARY _230714.indd 23 06/08/2014 08:11

WWF Living Planet Report 2014 Summary page 24
For many, planet Earth and the staggering web of life to which we all belong are worth protecting for their own sake. A sense of wonder and a profound respect for nature runs deep in many cultures and religions. People instinctively relate to the well-known proverb: We do not inherit the Earth from our ancestors; we borrow it from our children. Yet we are not proving good stewards of our one planet. The way we meet our needs today is compromising the ability of future generations to meet theirs – the very opposite of sustainable development.
Fisheries supply 15% of the animal protein in our diets, rising to more than 50% in many of the least developed countries in Africa and Asia
45% of freshwater use in industrialized countries is for energy generation
15% 45%
Environmental changes affect all of us
WHY WE SHOULD CARE
3.6 BILLION IN 20116.3 BILLION IN 2050
7.2 BILLION IN 20139.6 BILLION IN 2050
2 BILLION 70% & 30%The majority of the world’s population
now lives in citiesWorld population is growing at a fast rate
Food production accounts for around 70% of water use and 30% of energy use globally
Forest ecosystems provide shelter, livelihoods, water, fuel and food security for more than 2 billion people
Summary page 25
Marine ecosystems support more than 660 million jobs globally
660 MILLION
The estimated cost of environmental damage globally in 2008 was US$6.6 trillion – equivalent to 11% of global GDP
768 MILLION 39of 63
Global freshwater demand is projected to exceed current supply by more than 40% by 2030
ONE THIRD
One-third of the planet’s major cities depend on nature reserves for their drinking water
US$6.6 TRILLION >40%
Humanity’s well-being and prosperity – indeed, our very existence – depends on healthy ecosystems and the services they supply, from clean water and a liveable climate, to food, fuel, fi bre and fertile soils. Progress has been made in recent years in quantifying the fi nancial value of this natural capital and the dividends that fl ow from it. Such valuations make an economic case for conserving nature and living sustainably – although any valuation of ecosystem services is a “gross underestimate of infi nity”, since without them there can be no life on Earth.
Of the 63 most populated urban areas, 39 are exposed to a high risk of at least one natural hazard – including fl ooding, cyclones and droughts
768 million people don’t have a safe, clean water supply
LPR2014 SUMMARY _230714.indd 25 06/08/2014 08:11

WWF Living Planet Report 2014 Summary page 26
FOOD, WATER AND ENERGYOur demands are linked to the health of the biosphere
With the human population predicted to swell by 2 billion by 2050, the challenge of providing everyone with the food, water and energy they need is already a daunting prospect. Today, almost a billion people suffer from hunger, 768 million live without a safe, clean water supply and 1.4 billion lack access to a reliable electricity supply. Climate change and the depletion of ecosystems and natural resources will further exacerbate the situation. While the world’s poorest continue to be most vulnerable, food, water and energy security issues affect us all.
Food, water and energy security and ecosystem health are closely intertwined. This interdependance means that efforts to secure one aspect can easily destabilize others – attempts to boost agricultural productivity, for example, may lead to increased demands for water and energy inputs, and impact biodiversity and ecosystem services.
The way we source our demands affects the health of ecosystems, and the health of ecosystems affects our ability to secure these demands. This is equally relevant for the poorest rural communities – who often rely directly on nature for their livelihoods – as for the world’s great cities, which are increasingly vulnerable to threats such as flooding and pollution as a result of environmental degradation.
Protecting nature and using its resources responsibly are prerequisites for human development and well-being, and for building resilient, healthy communities.
TODAY ALMOST A BILLION PEOPLE SUFFER FROM HUNGER, 768 MILLION LIVE WITHOUT A SAFE, CLEAN WATER SUPPLY AND 1.4 BILLION LACK ACCESS TO A RELIABLE ELECTRICITY SUPPLY
LPR2014 SUMMARY _230714.indd 26 06/08/2014 08:11
Summary page 27
Figure 12: The inter-relationships and interdependencies between the biosphere and food, water and energy security How we produce food, use water or generate energy impacts on the biosphere that supports these needs.
ENERGY CAN BE PRODUCED
FROM FOOD CROPS
WATERFOOD
FOOD PRODUCTION USES A LOT OF
ENERGYENERGY IS
USED FOR STORING, CLEANING AND
TRANSPORTING WATER
WATER IS NEEDED FOR ENERGY PRODUCTION
WATER IS NEEDED FOR FOOD
PRODUCTION
FOOD PRODUCTION AFFECTS WATER
AVAILABILITY
ENERGY
HEALTHY COMMUNITIES ARE THE BASIS OF OUR PHYSICAL, MENTAL AND SOCIAL
WELL-BEING. AND THE BASIS OF HEALTHY COMMUNITIES IS A HEALTHY ENVIRONMENT
LPR2014 SUMMARY _230714.indd 27 06/08/2014 08:11

WWF Living Planet Report 2014 Summary page 28
ONE PLANET SOLUTIONSBetter choices can be made and practical solutions do exist
WWF’s “One Planet Perspective” outlines better choices for managing, using and sharing natural resources within the planet’s limitations – so as to ensure food, water and energy security for all.
EQUITABLE RESOURCE GOVERNANCEshare available resources, make fair and ecologically informed choices, measure success beyond GDP
REDIRECT FINANCIAL FLOWSvalue nature, account for environmental and social costs, support and reward conservation, sustainable resource management and innovation
CONSUME MORE WISELYthrough low-Footprint lifestyles, sustainable energy use and healthier food consumption patterns
PRODUCE BETTER reduce inputs and waste, manage resources sustainably, scale-up renewable energy production
PRESERVE NATURAL CAPITAL restore damaged ecosystems, halt the loss of priority habitats, significantly expand protected areas
LPR2014 SUMMARY _230714.indd 28 06/08/2014 08:11
Summary page 29
Figure 13: One Planet Perspective (WWF, 2012).
FOOD, WATER AND ENERGY SECURITY
EQUITABLE RESOURCE GOVERNANCE
CONSUME MORE WISELY
PRESERVE NATURAL CAPITAL
PRODUCE BETTER
BIODIVERSITY CONSERVATION
ECOSYSTEM INTEGRITY
REDIRECTFINANCIAL
FLOWS
BETTER CHOICES
FROM A ONE PLANETPERSPECTIVE
LPR2014 SUMMARY _230714.indd 29 06/08/2014 08:11
WWF Living Planet Report 2014 Summary page 30
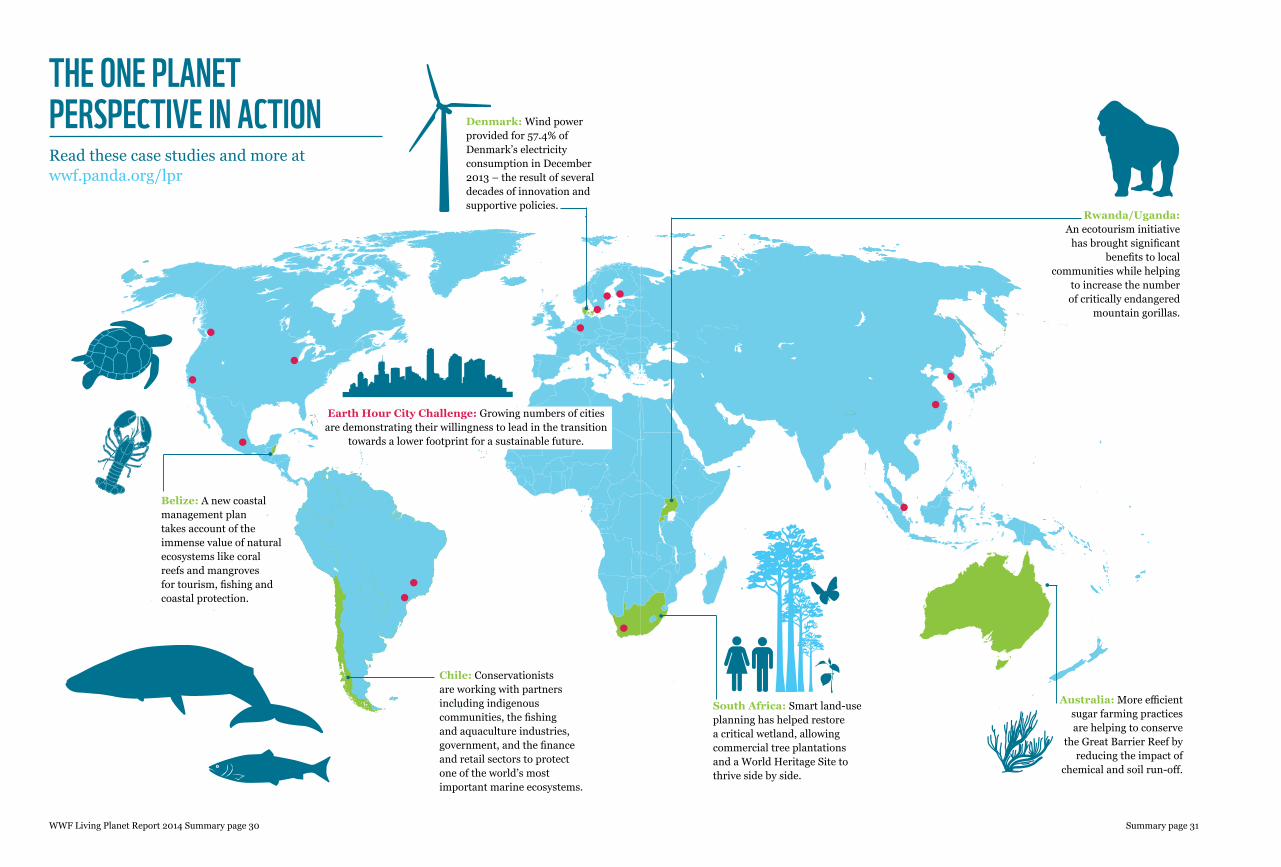
Denmark: Wind power provided for 57.4% of Denmark’s electricity consumption in December 2013 – the result of several decades of innovation and supportive policies.
Belize: A new coastal management plan takes account of the immense value of natural ecosystems like coral reefs and mangroves for tourism, fishing and coastal protection.
The One PlaneT PersPecTive in acTiOn
Earth Hour City Challenge: Growing numbers of cities are demonstrating their willingness to lead in the transition
towards a lower footprint for a sustainable future.
Read these case studies and more at wwf.panda.org/lpr
Chile: Conservationists are working with partners including indigenous communities, the fishing and aquaculture industries, government, and the finance and retail sectors to protect one of the world’s most important marine ecosystems.
Summary page 31
Australia: More efficient sugar farming practices are helping to conserve
the Great Barrier Reef by reducing the impact of
chemical and soil run-off.
South Africa: Smart land-use planning has helped restore a critical wetland, allowing commercial tree plantations and a World Heritage Site to thrive side by side.
Rwanda/Uganda: An ecotourism initiative
has brought significant benefits to local
communities while helping to increase the number of critically endangered
mountain gorillas.

LEAPING INTO THE FUTURE~DRC has one of the youngest and fastest-growing populations in the world. But what sort of future is in store for these children, from the fi shing village of Vitshumbi on the southern shores of Lake Edward?
Virunga National Park is their inheritance – and it off ers huge potential. A recent study commissioned by WWF suggests that, in a stable situation where the park is properly protected, its economic value could be more than US$1 billion a year. Responsible development of industries like tourism within the park could provide jobs for 45,000 people.
LPR2014 SUMMARY _230714.indd 32 06/08/2014 08:11
© B
ren
t Stirto
n / R
ep
orta
ge
by G
etty Im
ag
es / W
WF
-Ca
no
n
LPR2014 SUMMARY _230714.indd 33 06/08/2014 08:11

WWF Living Planet Report 2014 Summary page 34
THE PATH AHEADThe same indicators that show where we have gone wrong can point us onto a better path
There is nothing inevitable about the continuing decline in the LPI, or growing our ecological overshoot. They are the sum of millions of decisions, made with little or no consideration of the importance of protecting our natural world: poor governance at local, national and international levels;; policies with a myopic focus on economic growth and narrow interests; business models that focus on short-term profits and fail to account for externalities and long-term costs; inefficient, outmoded and unnecessarily destructive ways of generating and using energy, catching fish, raising food, transporting goods and people; desperate strategies for earning a livelihood; excessive consumption that makes few happier or healthier.
In each case, there is a better choice. Changing our course and finding alternative pathways will not be easy. But it can be done.
At the Rio+20 conference in 2012, the world’s governments affirmed their commitment to an “economically, socially and environmentally sustainable future for our planet and for present and future generations”. This is “Our Common Vision”, the place we need to aim for. It can be seen in the global sustainable development quadrant – the currently unoccupied territory where everyone is able to enjoy a high level of human development with an Ecological Footprint that is within global biocapacity (Figure 8). This is essentially the same space envisioned in the Oxfam Doughnut – the “safe, just operating space” that stays within planetary boundaries while ensuring that everyone achieves an acceptable level of health, well-being and opportunity (Figure 11).
WWF’s One Planet Perspective (Figure 13) gives an idea of how we might reach it, through a series of practical actions: we need to divert investment away from the causes of environmental problems and towards the solutions; to make fair, far-sighted and ecologically informed choices about how we manage the resources we share; to preserve our remaining natural capital, protecting and restoring important ecosystems and habitats; to produce better and consume more wisely.
WE KNOW WHERE WE WANT TO BE WE KNOW HOW TO GET THERE
NOW WE NEED TO GET MOVING
LPR2014 SUMMARY _230714.indd 34 06/08/2014 11:43
Summary page 35
WWF Offices*ArmeniaAustraliaAustriaAzerbaijanBelgiumBelizeBhutanBolíviaBrazilBulgariaCambodiaCameroonCanadaCentral African RepublicChileChinaColombiaCubaDemocratic Republic of CongoDenmarkEcuadorFinlandFijiFranceFrench GuyanaGabonGambiaGeorgiaGermanyGhanaGreeceGuatemalaGuyanaHondurasHong KongHungaryIndiaIndonesiaItalyJapanKenyaLaos
MadagascarMalaysiaMauritaniaMexicoMongoliaMozambiqueMyanmarNamibiaNepalNetherlandsNew ZealandNorwayPakistanPanamaPapua New GuineaParaguayPeruPhilippinesPolandRepublic of KoreaRomaniaRussiaSenegalSingaporeSolomon IslandsSouth AfricaSpainSurinameSwedenSwitzerlandTanzaniaThailandTunisiaTurkeyUgandaUnited Arab EmiratesUnited KingdomUnited States of AmericaViet NamZambiaZimbabwe
Publication detailsPublished in September 2014 by WWF – World Wide Fund for Nature (Formerly World Wildlife Fund), Gland, Switzerland (“WWF”). Any reproduction in full or in part of this publication must be in accordance with the rules below, and mention the title and credit the above mentioned publisher as the copyright owner.
Recommended citation:WWF. 2014. Living Planet Report 2014: Summary. [McLellan, R., Iyengar, L., Jeffries, B. and N. Oerlemans (Eds)]. WWF, Gland, Switzerland.
Notice for text and graphics: © 2014 WWF. All rights reserved.
Reproduction of this publication (except the photos) for educational or other non-commercial purposes is authorized subject to advance written notification to WWF and appropriate acknowledgement as stated above. Reproduction of this publication for resale or other commercial purposes is prohibited without WWF’s prior written permission. Reproduction of the photos for any purpose is subject WWF’s prior written permission.
The designation of geographical entities in this report, and the presentation of the material, do not imply the expression of any opinion whatsoever on the part of WWF concerning the legal status of any country, territory, or area, or of its authorities, or concerning the delimitation of its frontiers or boundaries.
Design by: millerdesign.co.ukCover photograph: © European Space AgencyISBN 978-2-940443-88-8
WWF AssociatesFundación Vida Silvestre (Argentina)Pasaules Dabas Fonds (Latvia)Nigerian Conservation Foundation (Nigeria)
*As at July 2014
WWF WORLDWIDE NETWORK
This summary document has been printed on FSC certified Revive Silk.
See LPR 2014 for a comprehensive list of references and sources for all data in this summary.
fsc logo to be added by printer

100%RECYCLED
© N
AS
A
LIVING PLANET REPORT 2014 SUMMARYINT
WWF.ORG
LIVING PLANET REPORT 2014
© 1986 Panda symbol WWF – World Wide Fund For Nature (Formerly World Wildlife Fund)
® “WWF” is a WWF Registered Trademark. WWF, Avenue du Mont-Blanc, 1196 Gland,
Switzerland – Tel. +41 22 364 9111; Fax. +41 22 364 0332. For contact details and further
information, visit our international website at panda.org
Why we are here
panda.org/lpr
To stop the degradation of the planet’s natural environment andto build a future in which humans live in harmony with nature.
SPECIES Populations of vertebrate species have fallen by half since 1970, according to the Living Planet Index.PLACES
From forests to rivers to reefs, natural ecosystems are the foundation of building healthy, resilient communities.
SPACESWith humanity currently demanding 1.5 planets’ worth of resources, pressure on ecosystems is increasing.
PEOPLE Our needs, our well-being and our prosperity depend on nature.
LPR2014 SUMMARY _230714.indd 36 06/08/2014 08:11