report no.: 103060 - independent evaluation...
TRANSCRIPT

Report No.: 103060
PROJECT PERFORMANCE ASSESSMENT REPORT
MALAWI
FINANCIAL MANAGEMENT, TRANSPARENCY, AND
ACCOUNTABILITY PROJECT
(IDA-3734A, IDA-37340, TF 90947)
March 9, 2016
IEG Human Development and Economic Management Department
Independent Evaluation Group

ii
Currency Equivalents (annual averages)
Currency Unit = Malawi Kwacha (MK)
2003 US$1.00 MK 89.50
2004 US$1.00 MK 108.55
2005 US$1.00 MK 121.25
2006 US$1.00 MK 138.00
2007 US$1.00 MK 140.61
2008 US$1.00 MK 140.51
2009 US$1.00 MK 142.55
2010 US$1.00 MK 150.77
2011 US$1.00 MK 151.05
2012 US$1.00 MK 270.40
2013 US$1.00 MK 326.00
2014 US$1.00 MK 392.50
2015 US$1.00 MK 440.00
Abbreviations and Acronyms
CoA Chart of Accounts
COTS Commercial off the shelf
DC District Commissioner
DCA Development Credit Agreement
DHRMD Department of Human Resources Management and Development
DISTMIS Department of Information Systems and Technology Management Services
ERP Enterprise Resource Planning
FIMTAP Financial Management, Transparency, and Accountability Project
FROIP Financial Reporting and Oversight Improvement Project
GOM Government of Malawi
GWAN Government Wide Area Network
HR Human Resources
HRMIS Human Resource Information System
ICB Implementation Competitive Bidding
ICR Implementation Completion Report
ICT Information and Communication Technology
IDA International Development Association
IEG Independent Evaluation Group
IMF International Monetary Fund
MCC Millennium Challenge Cooperation
MDAs Miniseries, Departments, and Agencies
MGDS Malawi Growth and Development Strategy
MOF Ministry of Finance
NAO National Audit Office
ODPP Office of the Director for Public Procurement
PAC Public Accounts Committee
PAD Project Appraisal Document
PDO Project Development Objective
PEFA Public Expenditure and Financial Accountability
PER Public Expenditure Review
PETS Public Expenditure Tracking Survey
PFEM public finance and expenditure management
PIU Project Implementation Unit
PPAR Project Performance Assessment Report
PSIP Public Sector Investment Program
P2P Procure to Purchase
QAG Quality Assurance Group
RBM Reserve Bank of Malawi

ii
Fiscal Year
Government: June 1 – June 30
Director-General, Independent Evaluation : Ms. Caroline Heider
Director, Human Development and Economic Management : Mr. Nicholas York
Manager, Country Program and Economic Management : Mr. Mark Sundberg
Task Manager : Mr. Moritz Piatti


iii
Contents
Principal Ratings ................................................................................................................. v
Key Staff Responsible......................................................................................................... v
Preface............................................................................................................................... vii
Summary ............................................................................................................................ ix
1. Background and Context................................................................................................. 1
2. Objectives, Design, and Relevance ................................................................................. 5
Objectives ....................................................................................................................... 5
Design ............................................................................................................................. 5
Relevance of Objectives ................................................................................................. 7
Relevance of Design ....................................................................................................... 9
3. Implementation ............................................................................................................. 11
4. Achievement of the Objectives ..................................................................................... 14
Objective 1. Improved effective use of public expenditures ........................................ 14
Objective 2. Improved accountable use of public expenditures ................................... 22
Objective 1. Improved Civil Service Management....................................................... 26
Objective 2. Improved Public Expenditure Management ............................................. 29
Efficiency ...................................................................................................................... 35
Ratings .......................................................................................................................... 37
Risk to Development Outcome ..................................................................................... 38
5. Bank Performance ......................................................................................................... 39
Quality at Entry ............................................................................................................. 40
Quality at Supervision................................................................................................... 40
6. Borrower Performance .................................................................................................. 42
Government Performance ............................................................................................. 42
Implementing Agency Performance ............................................................................. 43
7. Monitoring and Evaluation ........................................................................................... 43
8. Lessons .......................................................................................................................... 44
References ......................................................................................................................... 47
Appendix A. Basic Data Sheet.......................................................................................... 49
Appendix B. Targeted Reforms by PFM cluster and PEFA Achievements ..................... 52
This report was prepared by Moritz Piatti. Ali Hashim authored the FMIS appendix, which was drawn on
extensively. The team visited Malawi in June – July 2015. The report was peer reviewed by Michael
Stevens and panel reviewed by Iradj Alikhani. Yezena Yimer provided administrative support.

iv
Appendix C. Financial Management Information Systems: Design, Implementation, and
Utilization ......................................................................................................................... 59
Appendix D. Building Capacity ........................................................................................ 75
Appendix E. Factors Contributing to the Cashgate Scandal ............................................. 79
Appendix F. Government Banking Arrangements ........................................................... 80
Appendix G. Other Data and Information ........................................................................ 82
Appendix H. List of Persons Met ..................................................................................... 88
Figures
Figure 1.1. Malawi PEFA progress in relation to other countries ...................................... 3
Figure 4.1. Trend of Aggregate Expenditure Variance and Composition Variance ......... 21
Figure 4.2. CPIA Rating on Transparency, Accountability, and Corruption ................... 25
Figure 4.3. Control of Corruption Perception Index by Percentile ................................... 25
Figure 4.4. Trend of Wages as Share of GDP................................................................... 28
Figure 4.5. Malawi FMIS. Core Functional Processes and Information Flows ............... 31
Figure 4.6. FMIS implementation cost plotted against number of users .......................... 36
Tables
Table 2.1. Deviation of approved budget by votes (recurrent expenditures) and economic
classification in 2004/05 ..................................................................................................... 7
Table 3.1. Project Cost by Component (US$ million) ...................................................... 11
Table 3.2. Reallocation of funds (US$ million) ................................................................ 14
Table 4.1. Select PEFA Scores on Policy-based Budgeting ............................................. 19
Table 4.2. Development Expenditure and Share of off Budget Financing for 2012/13 ... 20
Table 4.3. Scope, Nature and Follow up of External Audit .............................................. 23
Table 4.4. PEFA Assessment on Effectiveness of Internal Audit .................................... 24
Table 4.5. PEFA Assessment on Effectiveness of Payroll Control .................................. 27
Table 4.6. Growth in Wage Bill and Number of Civil Servants ....................................... 28
Table 4.7. PEFA Assessment on Effectiveness of Internal Controls ................................ 33
Table 4.8. PEFA Assessment of Procurement in 2011 ..................................................... 34

v
Principal Ratings
Malawi Public Sector Management Program Support Project
ICR* ICR Review* PPAR
Outcome Moderately
Satisfactory
Moderately
Satisfactory
Moderately
Unsatisfactory
Risk to
Development
Outcome
Significant
Significant High
Bank Performance Moderately
Satisfactory
Moderately
Satisfactory
Moderately
Unsatisfactory
Borrower
Performance
Moderately
Satisfactory
Moderately
Satisfactory
Moderately
Unsatisfactory
* The Implementation Completion Report (ICR) is a self-evaluation by the responsible Bank department. The ICR
Review is an intermediate IEGWB product that seeks to independently verify the findings of the ICR.
Key Staff Responsible
Project Task Manager/Leader
Division Chief/
Sector Director Country Director
Appraisal Robert L. Floyd Brian David Levy Darius Mans
Completion Ross Worthington Anand Rajaram Luiz A. Pereira da Silva

vi
IEG Mission: Improving World Bank Group development results through excellence in evaluation.
About this Report
The Independent Evaluation Group (IEG) assesses the programs and activities of the World Bank for two purposes: first, to ensure the integrity of the Bank’s self-evaluation process and to verify that the Bank’s work is producing the expected results, and second, to help develop improved directions, policies, and procedures through the dissemination of lessons drawn from experience. As part of this work, IEG annually assesses 20-25 percent of the Bank’s lending operations through field work. In selecting operations for assessment, preference is given to those that are innovative, large, or complex; those that are relevant to upcoming studies or country evaluations; those for which Executive Directors or Bank management have requested assessments; and those that are likely to generate important lessons.
To prepare a Project Performance Assessment Report (PPAR), IEG staff examine project files and other documents, visit the borrowing country to discuss the operation with the government, and other in-country stakeholders, and interview Bank staff and other donor agency staff both at headquarters and in local offices as appropriate.
Each PPAR is subject to internal IEG peer review, Panel review, and management approval. Once cleared internally, the PPAR is commented on by the responsible Bank department. The PPAR is also sent to the borrower for review. IEG incorporates both Bank and borrower comments as appropriate, and the borrowers' comments are attached to the document that is sent to the Bank's Board of Executive Directors. After an assessment report has been sent to the Board, it is disclosed to the public.
About the IEG Rating System for Public Sector Evaluations
IEG’s use of multiple evaluation methods offers both rigor and a necessary level of flexibility to adapt to lending instrument, project design, or sectoral approach. IEG evaluators all apply the same basic method to arrive at their project ratings. Following is the definition and rating scale used for each evaluation criterion (additional information is available on the IEG website: http://worldbank.org/ieg).
Outcome: The extent to which the operation’s major relevant objectives were achieved, or are expected to be achieved, efficiently. The rating has three dimensions: relevance, efficacy, and efficiency. Relevance includes relevance of objectives and relevance of design. Relevance of objectives is the extent to which the project’s objectives are consistent with the country’s current development priorities and with current Bank country and sectoral assistance strategies and corporate goals (expressed in Poverty Reduction Strategy Papers, Country Assistance Strategies, Sector Strategy Papers, Operational Policies). Relevance of design is the extent to which the project’s design is consistent with the stated objectives. Efficacy is the extent to which the project’s objectives were achieved, or are expected to be achieved, taking into account their relative importance. Efficiency is the extent to which the project achieved, or is expected to achieve, a return higher than the opportunity cost of capital and benefits at least cost compared to alternatives. The efficiency dimension generally is not applied to adjustment operations. Possible ratings for Outcome: Highly Satisfactory, Satisfactory, Moderately Satisfactory, Moderately Unsatisfactory, Unsatisfactory, Highly Unsatisfactory.
Risk to Development Outcome: The risk, at the time of evaluation, that development outcomes (or expected outcomes) will not be maintained (or realized). Possible ratings for Risk to Development Outcome: High, Significant, Moderate, Negligible to Low, Not Evaluable.
Bank Performance: The extent to which services provided by the Bank ensured quality at entry of the operation and supported effective implementation through appropriate supervision (including ensuring adequate transition arrangements for regular operation of supported activities after loan/credit closing, toward the achievement of development outcomes. The rating has two dimensions: quality at entry and quality of supervision. Possible ratings for Bank Performance: Highly Satisfactory, Satisfactory, Moderately Satisfactory, Moderately Unsatisfactory, Unsatisfactory, Highly Unsatisfactory.
Borrower Performance: The extent to which the borrower (including the government and implementing agency or agencies) ensured quality of preparation and implementation, and complied with covenants and agreements, toward the achievement of development outcomes. The rating has two dimensions: government performance and implementing agency(ies) performance. Possible ratings for borrower performance: Highly Satisfactory, Satisfactory, Moderately Satisfactory, Moderately Unsatisfactory, Unsatisfactory, Highly Unsatisfactory.

vii
Preface
This Project Performance Assessment Report evaluates the Financial Management,
Transparency, and Accountability Project to Malawi, which was approved by the Board on
March 6, 2003, for US$27.4 million with a closing date of March 1, 2008. The project was
restructured in July 2006 and the closing date was extended in September 2007, to September
1, 2009. Additional financing of US$1.8 million was provided through a Trust Fund. The
project followed two previous public sector reform projects, the Institutional Development
Projects I, and II, which had run from the end of 1994 to 2001.
The original objectives of the operation were “to improve the effective and accountable use
of public expenditures.” At restructuring, the objectives were modified to “improve civil
service and public expenditure management.”
This report presents findings based on a review of the Project Appraisal Documents, the
Implementation Completion and Results Reports, Implementation Completion and Results
Review, aides-memoires, International Monetary Fund (IMF) and World Bank reports, and
other relevant materials including a number of publically available studies by various donors.
An Independent Evaluation Group (IEG) mission visited Lilongwe during June 28- July 10,
2015 to interview government officials, the staff of the World Bank, staff of the IMF, and
other development partners and stakeholders. Bank staff members, donor representatives, and
other information providers were also interviewed at the World Bank’s headquarters in
Washington, DC and by telephone (see Appendix H for the complete list of persons
interviewed).
The assessment aims to review whether and how the operation achieved its intended
objectives. The report provides additional evidence and analysis of relevant and comparative
data for a more complete picture of the outcomes and factors that influenced them. By
covering the period between 2011 and mid-2015, it offers an opportunity for broader lessons
and a longer time perspective, as well as reflection on the sustainability of policy reforms and
long-term factors that facilitated outcomes. The work was carried out in parallel to an
assessment of a Public Sector Reform Program in Zambia, which allows for a comparison of
a similar reform program.
This assessment is part of a larger body of Public Sector / Governance evaluations in Africa
and East Asia that will feed into a synthesis report to draw lessons on the cross-country
experience. The reports provide a dedicated appendix on the design, implementation, and use
of Financial Management Information Systems, which have been at the core of the reform
programs.
Following standard IEG procedures, a copy of the draft report was sent to the relevant
government officials and agencies for their review and comments. No comments were
received.


ix
Summary
The Bank extended its support to Malawi in public financial management and civil service
reform during difficult circumstances. At the time, Malawi was one of the poorest countries
in the world with 75 percent of the population living on less than US$1.25 a day. Human
development indicators were dismal. More than half of the children in the poorest wealth
quintile were stunted, only half fully immunized, and 63 percent reported a malaria episode
in the last year. The under-five mortality rate at 223 per 1,000 live births was amongst the
highest in the world and of those children that did survive past the age of five, only 58
percent could expect to complete primary school.
In this context, sound economic management, and the effective and accountable use of public
resources is paramount to improve economic and social conditions. The project aimed to
achieve this through investing in Financial Management Information Systems (FMIS),
strengthening public financial management processes and accountability institutions, and
developing the capacity of the civil service.
During the lifecycle of the project considerable progress was made. An FMIS was
successfully set up and rolled out, and now covers the majority of the budget. Core modules
are fully functioning with sufficient ex-ante commitment controls in place. Spending units
are able to produce detailed budget execution reports on request. A Human Resource
Management Information System (HRMIS) including an establishment control module was
implemented and rolled out, which now forms the backbone of civil service management. A
large number of staff were trained under the project including on accountability and
transparency, public finance, auditing, procurement, and local government financial
management. A tracer study concluded that the trainings were effective and that the majority
of beneficiaries remained in relevant positions.
However, the underlying supporting public finance environment was not conducive for
effective use of the FMIS, leading to disappointing results. Despite commitment controls
being in place, processes were frequently ignored or bypassed. Spending units were reported
to maintain an off-FMIS registry and upload funding limits on an as-needed basis. There is
evidence that spending units generated local purchase orders and payment vouchers
simultaneously, using pro-forma invoices despite directives to the contrary. Commitments
were regularly processed outside the system. Over time this resulted in the accumulation of
large payment arrears, which were estimated at 9.2 percent of GDP in 2014. Limited
compliance with the PFM legal framework and internal controls posed a high risk to the
development objectives at project end. An example of risks materializing is the
embezzlement of about US$32 million known as the cashgate scandal. Regarding civil
service reform, the number of public servants has increased rapidly over the evaluation
period raising questions about the sustainability of the overall public wage bill. Further,
significant loopholes in the HRMIS internal control environment remain (including the
possibility to introduce ghost workers), which pose risks and undermine the effectiveness of
the system.
Little progress has been made with regards to strengthened accountability. The time lag
between end of fiscal year and receipt of external audit reports by the legislative has

x
significantly increased in recent years, which undermines the legislative’s ability to hold
Controlling Officers accountable. Based on information collected in July 2015, external audit
reports were more than three years late. Furthermore, the National Audit Office reports
directly to the Ministry of Finance, which undermines the independence and integrity of the
office. This situation is exacerbated by weaknesses in the Auditor’s capacity to undertake
forensic and technical audits, and the Parliament Accounts Committee’s ability to interpret
results. There is also scarce evidence to suggest that audit recommendations are followed up.
Efficacy is rated modest reflecting on the one side achievements with regards to setting up
systems and training staff. On the other, the disregard to existing systems and procedures
compounded by inadequate accountability mechanisms meant that progress did not translate
into better public financial management outcomes. Efficiency was rated modest given the
high per-user cost of the FMIS, project resources employed on a system that was later
abandoned, and various delays in implementation. Furthermore, operating costs were high
and there were foregone benefits due to poor implementation of systems and procedures
developed under the project. Substantial relevance, modest efficacy, and modest efficiency
result in an overall outcome rating of Moderately Unsatisfactory.
There remain high risks with regards to the development outcomes that were achieved. There
is at present a considerable push for changing the FMIS platform, which could undermine
some of the hard won gains of FMIS systems implementation. To put a new system in place
could take a long time with uncertain results. Much of the human capacity that was built and
accumulated over the last decade would be lost and a whole new set of technical skills would
need to be developed. During the transitional period, the reform focus would be diverted to
the change in the software platform rather than institutions and the overall public finance
environment. Perceived benefits of changing the FMIS provider should be carefully weighed
against these significant risks and potential setbacks. Other risks pertaining to the operation
include the continued potential to introduce ghost workers, and insufficient capacity and
independence of the external audit office.
Bank performance was rated Moderately Unsatisfactory reflecting flaws in quality at entry
and shortcomings in supervision, especially prior to restructuring. In particular questionable
technical advice was provided with respect to the original FMIS platform and legal covenants
pertaining to procurement staffing were broken. Further, supervision in the early years
suffered from high TTL turnover. Restructuring was appropriate and made the operation
more streamlined and realistic. Supervision and engagement with the government and other
donors improved. The Bank became more responsive, and addressed prior implementation
bottlenecks such as procurement support and expedited “no objection” letters. However
important problems remained throughout implementation such as an inadequate M&E
framework and insufficient attention to the mitigation of risks.
The operation became effective just before elections and borrower performance suffered
initially from lacking commitment, engagement, and frank dialogue, which contributed to
poor quality at entry. At restructuring, government and implementing agency performance
improved however, providing the necessary political capital and administrative support for
more effective implementation. Nevertheless, the government did not sufficiently recognize
the weak internal control environment, which has resulted in the breakdown of the

xi
accountability chain. Going forward, the government appears focused on the replacement of
the FMIS provider rather than the underlying factors for why it failed in the first place. On
balance, borrower performance was rated Moderately Unsatisfactory.
Malawi’s poor progress with economic and social outcomes can in part be attributed to
ineffective and inefficient public expenditure management. Functioning systems in the
absence of an enabling environment have failed to produce the desired results. Reforming the
underlying systemic PFM issues will be necessary to benefit from the systems that are
already in place today.
The project offers a number of important lessons, some specific to Malawi and others that are
broader and generalizable. These are summarized below.
Public financial management reform:
A functioning FMIS alone is not sufficient to achieve good public financial
management. To be effective there must be clear commitment from the Ministry of
Finance that all transactions are routed through the system, such that all expenditures
are subject to the FMIS automated, ex ante, internal controls. Practically, this means
that no payment instructions (cheques/vouchers) issued outside of the system should
be honored. Significant political capital is needed to overcome resistance from people
who may have vested interests. The breakdown of the accountability chain that led to
a major corruption episode was chiefly because of a disregard of existing systems and
processes rather than a technical failure of the FMIS.
It is important to channel donor funds through the FMIS, which is possible whilst
retaining their own accounting mechanisms and fiduciary safeguards.
Changing an FMIS platform carries substantial risks. It is costly, time consuming, the
change provides no guarantee of eventual functionality and fit, human capacity will
be lost and needs to be rebuilt, and during the transitional period the reform focus will
be on technical issues rather than underlying PFM environment. In light of this, the
problems with the existing FMIS provider should be thoroughly diagnosed, and all
options considered including upgrades of the existing system. The decision on the
way forward should be based on what system can best fit the country needs with
minimum disruption, local capacity considerations, and competitive pricing. The
Malawi experience of switching systems in the early 2000s should critically inform
the current reform dialogue.
Having a single systems platform for central, district, and human resources
transactions is preferable for systems integration and efficiency.
Recurrent investments in both software and hardware are required to keep FMIS fully
functional, safe, and up to date. The lack of adequate maintenance in Malawi led to a
deterioration of the system, with long outdated software, insufficient capacity to
manage the transaction requirements, and exposing the system to various security
risks.

xii
Sequencing:
It is important to take advantage of synergy and linkages between parallel TA and
policy reform operations.
Oversight agencies function best when they are both capable and independent.
Proactive project management helps enhance developmental impact. In the case of
this operation, the first restructuring was initiated as soon as problems became
apparent, even if the conclusion of the process took too long. However, MTR was
initiated too late. Its impact would have been greater if it had been triggered by
another factor such as disbursements nearing 50 percent.
M&E, complemented by periodic complementary assessments strengthens project
implementation. Project implementation should be based on a needs assessment,
prioritized and derived from a sound M&E framework. Tracer studies should be an
integral part of the M&E framework to assess effectiveness of the program and justify
continued investment in capacity building. A complementary Public Expenditure
Tracking Survey exercise that could have strengthened service delivery was initiated
but not made available.
Implementation:
Frequent changes in the Bank team are counterproductive. It has been observed in
several Bank projects that when some key members of the Bank team who were
involved in the design of a project continue on the team during implementation, this
contributes significantly to a successful implementation of the FMIS and achievement
of project development objectives.
Effective project implementation requires good procurement capacity. Any Bank
operation which lacks procurement capacity could benefit from assistance of another
project unit that is already successfully implementing. The Bank should carefully
considering the consequences of breaking effectiveness conditions.
Nick York
Director
Human Development and
Economic Management Department

1
1. Background and Context
1.1 This Project Performance Assessment Report (PPAR) reviews the World Bank’s
Financial Management, Transparency, and Accountability Project (FIMTAP) in Malawi. The
project was approved on June 2, 2003 and closed on September 1, 2009, 18 months behind
schedule. The World Bank, through the International Development Association (IDA),
provided a credit for US$27.4 million. Additional financing of US$1.8 million was made
available through a Trust Fund.
Poverty and Social outcomes
1.2 In 2003 Malawi was one of the poorest countries in the world. 75 percent of the
population lived on less than US$1.25 a day, which was significantly higher than the Sub-
Saharan Africa average at the time (58 percent), and comparable to countries such as Sierra
Leone, Madagascar, and the Democratic Republic of Congo. In addition, there were profound
inequities in access to assets, services and opportunities across the population. (WDI 2015)
1.3 Human development indicators were similarly dismal. For children of the poorest
quintile, the under-five mortality rate stood at 223 per 1,000 live births, 57 percent were
recorded as stunted, only half fully immunized, and 63 percent had experienced an episode of
malaria in the last year. Of those children that survived past the age of five, only 58 percent
could expect to complete primary school. HIV prevalence was alarming at 15 percent in the
15-49 age group. (WHS 2003, NSO 2005) This is also reflected in the latest UN’s Human
Development Index that positions the country at 170 out of 187 countries and territories.1
1.4 Public service delivery was pressured by a rapidly growing population. The
population growth rate at about 3 percent continues to be among the highest in the world and
exerts pressures on service delivery, which is already overstretched. (WDI 2015) Family
planning is not an option to many, with contraception access rates of no more than 50 percent
across all wealth quintiles. (NSO 2005).
Economic and Fiscal Management
1.5 In this context, sound economic management, and the effective and accountable use
of public resources is paramount in order to improve economic and social outcomes. By 2003
the government underwent numerous PFM reform efforts. Reform of budget preparation was
already a World Bank supported policy actions under structural adjustment credits in the
mid-1980s. This was followed by the introduction of a Medium-Term Expenditure
Framework (MTEF) in 1995, a cash budgeting system, the initiation of a Financial
Management Information System (FMIS) in 1996, and cash management improvements in
2000. (Durevall and Erlandsson 2005; Fölscher et al., 2012).
1 See Human Development Reports. In 2003 the corresponding figure was 165 out of 177 countries, reflecting stagnant
progress over a decade. Human Development Report 2004.

2
1.6 However, progress in PFM reform during the 1990s was slow due to unfavorable
political conditions. The Muluzi government, which was reelected in 1999 oversaw a decline
in the quality of fiscal management, increasing corruption, inadequate checks and balances,
and generally declining standards of public management. At the end of the Muluzi
administration economic growth was well below regional averages at a sluggish 2 percent,
annual inflation was in the double digits, interest rates remained high at 30 percent, and the
real exchange rate had sharply depreciated. (South African Institute of Internal Affairs 2004;
Booth et al. 2005; Fozzard and Simwaka 2002; Fölscher et al. 2012; Rakner et al. 2004).
1.7 The already fragile fiscal situation suffered from adverse weather conditions and was
exacerbated after the IMF suspended its program in response to inadequate government
commitment to the Poverty Reduction and Growth Facility’s targets. Many bilateral and
multilateral donors providing Budget Support followed suit and suspended their aid. To
bridge the funding gap the government increased domestic borrowing, pushing already high
interest rates further up. Within three years, the government’s total debt stock more than
doubled, and by 2003 the domestic interest bill reached 9.1 percent of GDP corresponding to
an unsustainable 40 percent of domestic revenue. This increase in debt was accompanied by
less transparent forms of financing such as the accumulation of arrears; the consequence of
poor budget execution and control processes. Further, approved budgets and budget outturns
were askew, both in level and composition. In particular the budget performance of non-
wage recurrent expenditures was poor and operational and maintenance was inadequately
funded – a problem that persists until today. Given these circumstances, the Medium-Term
Expenditure Framework (MTEF) provided little guidance with regards to expenditure
allocation within a sustainable fiscal framework. (PEFA 2005, World Bank 2007).
1.8 Since then some progress in key PFM areas was made. Plotting the Malawi 2006 and
2011 public expenditure and financial accountability (PEFA) scores against the scores of the
100 countries2 in the De Renzio et al (2012) study puts progress in perspective. The grouping
of PFM areas follows the budgeting cycle as per Andrews (2010). These are: (a) strategic
budgeting; (b) budget preparation; (c) resource management; (d) internal control, audit and
monitoring; (e) accounting and reporting; and (f ) external accountability.3 The box and
whisker chart compares average scores and their distribution across these six clusters. The
box in the plot represents the spread of scores of the 100 countries, within the second and
third quartile. The line through the box represents the median value. Minimum and maximum
values are presented as outliers by the whiskers. Progress has been made in in Strategic
Budgeting, where overall Malawi in 2011 scores close to the third quartile, which is mostly
driven by annual and comprehensive debt sustainability analyses. Resource management also
improved, and Malawi raised its standing from below second quartile to close to third
quartile. This was driven by improvements in revenue administration, transfers to the
treasury, and debt management mechanisms. Less progress was achieved in Internal Control
and Accounting and Reporting. Progress was less pronounced and at times reversed in budget
preparation and external accountability. The latter suffered from inadequate and late
information provided by the Accounting Generals Office, little to no evidence of follow up to
2 Two thirds of the assessments were carried out between 2008 and 2009. Only 42 of the 100 assessment reports had been
made publicly available and 24 were still at a draft stage.
3 Appendix B provides a detailed account of PEFA scores by categories and dimensions.

3
audit recommendations, limited scope of the audits, continued lack of independence and
capacity of the National Audit Office, and insufficient oversight capacity of parliament.
(PEFA 2011; Fölscher et al 2012).
Figure 1.1. Malawi PEFA Progress in Relation to Other Countries
Source: De Renzio et al. (2012); Fölscher et al. (2012); and IEG calculations.
World Bank Engagement
1.9 The World Bank engaged in this difficult setting through the FIMTAP, the objective
of which was “to improve the effective and accountable use of public expenditures through
capacity building and institutional strengthening for budget implementation and oversight
and increased transparency of government institutions.” In particular the project was
designed to improve financial management and accountability institutions. Central to the
financial management goal was support to the ongoing development of FMIS and the
supporting environment. Strengthening accountability institutions included the Public
Accounts Committee, the Budget and Finance Committee, the external audit function, and
the internal audit. Separately the project made financing available for a training facility to
improve human capacities especially in expenditure management across ministries. Key PFM
and civil service reforms were also supported under parallel policy lending operations
including the 2001 Fiscal Restructuring and Deregulation Program, the 2004 Fiscal

4
Management and Acceleration Program, the 2008-2010 series of Poverty Reduction Support
Credits, and since project closing the 2013 Rapid Response Development Policy Grant, and
the 2013 Economic Recovery Policy Operation. FIMTAP components were in part
reinforced and complemented through policy actions including support for a medium term
pay policy, personnel audits and HRMIS review, submission of timely audit reports to
parliament, revision of budget classification, and validation of outstanding payment arrears.
A detailed list of relevant policy actions is provided in the datasheet of Appendix G.
Political and Governance Situation
1.10 Shortly after project effectiveness in 2003 the political landscape changed. In May
2004 Bingu wa Mutharika was designated successor of the Muluzi government, and was
subsequently democratically elected.4 He reshuffled the Cabinet, and appeared to present a
clear stance against corruption and on the need for governance and economic reform.
Thereby Mutharika alienated many with vested interest within his party. He eventually
formed his own party while in office and governed with a minority in Parliament. During his
first five years in office his government took many steps to improve fiscal discipline and
governance, which restored the confidence and support of international donors. The reform
program covered a wide array of PFM functions and was based on a substantive body of
analytical work including Country Fiduciary Assessments, Public Expenditure Reviews, and
PEFA Assessments.5 The four PFM reform plans adopted by the government during this
period were the 2003 Financial Accountability Action Plan, the 2006 Public Financial and
Expenditure Management (PFEM) Action Plan, the 2010 Revised PFEM Action Plan, and
the 2011-2014 PFEM Reform Program. (Fölscher et al., 2012) The comprehensive reform
program by PFM cluster and associated PEFA indicators over the evaluation period are
outlined in Appendix B.
1.11 Following the reelection of President Mutharika in 2009, and his subsequent
parliamentary majority, the focus on public finance reform somewhat waned. While the
implementation of FMIS continued to be rolled out, budget planning was done with limited
policy focus, and significant off-budget project funding was conductive to the accumulation
of arrears. In 2013 about US$32 million were misappropriated, a consequence of the lacking
internal control environment, the possibility of collusion and manual data manipulation, bank
reconciliation failure, a disregard to the PFM legal framework and a culture of impunity.6
(IMF 2014; Fölscher et al., 2012; World Bank 2013) Notwithstanding the above, the
government was of the opinion that the FMIS failed to prevent this episode, and initiated
discussion for the procurement of a new system. The tendering process is currently under
way and is largely supported by the follow up Bank project.
4 In 2002 Bakili Muluzi proposed an amendment to Malawi's constitution that would have allowed him to run for a third
term. This was abandoned in the face of demonstrations and vigorous opposition from the legislature and courts. He
handpicked his successor Bingu wa Mutharika who subsequently also won the elections.
5 These include macro-fiscal planning, FMIS, budget calendars, classification, budget / policy links, budget documentation,
revenue administration and tax collection, cash management, debt management, procurement, payroll management, aid
management, internal audit, commitment controls, payment systems, accounting standards and chart of accounts, accounting
and reconciliation procedures, financial reporting and external audits.
6 Appendix D provides a more detailed account on PFM factors leading up to the “cashgate” scandal.

5
2. Objectives, Design, and Relevance
Objectives
2.1 The project appraisal document (PAD) states the objective of the Financial
Management, Transparency and Accountability Project (FIMTAP) as “to improve the
effective and accountable use of public expenditures through capacity building and
institutional strengthening for budget implementation and oversight and increased
transparency of government institutions.” (PAD p.1) Similar in wording, the Development
Credit Agreement (DCA) states the objective of FIMTAP as “to assist the Borrower to
improve the effective and accountable use of its public expenditures through capacity
building for strengthened budget implementation and increased transparency of the
Borrower’s institutions.” (DCA p.13) For the purposes of the evaluation the original
objective is broken down into: (1) improve the effective use of public resources; and (2)
improve the accountable use of public resources. Reference to capacity building relates to the
activities funded by the project.
2.2 In 2006 the operation was restructured, including an amendment of the objective. The
revised DCA stated the new project’s development objective as “to improve civil service and
public expenditure management for better allocation and utilization of public resources.”
(Revised DCA, p.17). This is broken down into: (1) improve civil service management; and
(2) improve public expenditure management. Better allocation and use of public resources
are considered as higher level objectives, as reflected in scope of activities and made evident
by the revised results framework.
2.3 Following OPCS guidelines a split rating is applied. As 25 percent was disbursed at
restructuring, the weights applied for original and revised objectives are 25 percent and 72
percent respectively. Original objectives are assessed against the entire lifecycle of the
project.
Design
2.4 At appraisal the operation encompassed four components.7 (1) Strengthening
Accountability Institutions; (2) Improving Financial Management; (3) Human Development;
and (4) implementation support to the FIMTAP Secretariat. These first three are discussed
below:
2.5 Strengthening Accountability Institutions, through capacity building and
institutional strengthening of the Public Accounts Committee (PAC), the Internal Audit, and
External Audit. Further, this component aimed at institutionalizing voluntary performance
contracting of Permanent Secretaries, as well as Heads of Departments. Lastly, the program
aimed at piloting a Public Expenditure Tracking Survey in a number of select districts (PAD
p. 27-37).
7 Costing by components is provided in table 3-1.

6
2.6 Improving Financial Management. The operation aimed at strengthening Financial
Management through support of the design and implementation of the Financial Management
Information System (FMIS). This included significant technical assistance, software and
hardware purchase, as well as training activities. Secondly, the component aimed at
strengthening the Government Wide Area Network (GWAN), which is the electronic
infrastructure to enable FMIS among other things. This included a fiber optic expansion,
provision of uninterruptible power supply units and generators, system protection, and
building management capacity to oversee use, standards, and maintenance. Further, the
component was integrated into a broader government information and communication
technology (ICT) strategy.
2.7 Human Capital Development. The operation set up a training fund to support the
Department of Human Resource Management and Development (DHRMD) on broad
capacity building measures focused on public expenditure management across ministries.
Based on needs assessments undertaken by the DHRMD, areas would include financial
management, procurement capacity, records management, information technology, strategic
management, data analysis, project management, leadership skills, and human resource
management. Further, the fund would support training institutions in Malawi to participate in
the execution of the component. The government committed to student evaluations, which
would provide inputs to revision of the training plan on an annual basis.
2.8 FIMTAP Secretariat. This component financed the project management unit that was to
focus on coordination of implementation, financial management, procurement, monitoring and
evaluation and reporting.
2.9 At restructuring in 2006 a number of changes were made to the existing
components, the most prominent of which was a significant reduction of scope of FMIS
related activities. Sub-components dropped included capacity building for the PAC, the
Parliamentary Budget Committee, and support for the National Audit office, expenditure and
performance tracking by the National Economic Council. Most of these were instead
supported by the Millennium Challenge Cooperation (MCC). The large portion of FMIS roll-
out costs were provided by the government directly. Instead, new activities were added to the
project including rightsizing of senior public service staffing levels, rationalization of foreign
missions, implementation of a new Human Resource Information System (HRMIS),
provision of economic policy support to the Minister of Finance, support for the
implementation of procurement reforms, and the establishment of a Performance Incentive
Facility.
2.10 The project was restructured a second time in 2009 to reallocate funds and extend the
closing date. The design was somewhat simplified as the sub-component of rationalization of
senior public servants was removed. This was a low priority activity in the project with
limited funds attached. Over the lifecycle of the project the allocation to implementing
support doubled, which is in part due to increased fragmentation of activities during
restructuring, such as the inclusion of non-core PFM components (e.g. reforming foreign
missions). This is discussed in more detail under Efficiency in Chapter 4.

7
Relevance of Objectives
2.11 The original objectives were highly relevant given country conditions, notably its
poor social sector outcomes (as documented above), as a necessary intermediate step to
improving the quality and efficiency of public service delivery. A 2006 Public Expenditure
Review (PER) pointed to a number of PFM bottlenecks including allocative inefficiencies
and lacking controls that constrained the effective delivery of services. With regards to fiscal
management, budget credibility was poor with large deviations both in terms of level and
composition across spending agencies, which was in part driven by political ad-hoc
considerations and inaccurate revenue forecasting. (World Bank 2007) Notable in particular
are deviations by vote, and the underspending of Development Expenditures, while Other
Recurrent Transactions (ORTs) were disproportionately high (see table 2.1). Furthermore,
the PEFA (2005) found insufficient control in budget execution, and lacking a multi-year
perspective in fiscal planning. Expenditure policy and strategic budgeting was thus weak,
transparency and predictability lacking, and external control and legislative scrutiny
insufficient.
2.12 Considering the above, the objectives of assisting the borrower to improve the
effective and accountable use of public resources was highly relevant to address the
immediate needs in public financial management and to address bottlenecks in the delivery
of key services in a highly resource constrained environment.
Table 2.1. Deviation of Approved Budget by Votes (Recurrent Expenditures) and
Economic Classification in 2004/05
Ministries, Departments, and Agencies Deviation
OVERSPENDING
Unforeseen Expenditure 337%
Accountant General’s Department 319%
Ministry of Information 191%
Malawi Prisons 173%
Office of the President and Cabinet 156%
Malawi Policy Services 150%
Malawi Defense Force 130%
National Assembly 125%
UNDERSPENDING
Human Resources Management and Development 77%
Ministry of Local Government 66%
Ministry of Economic Planning and Development 64%
National Audit Office 41%
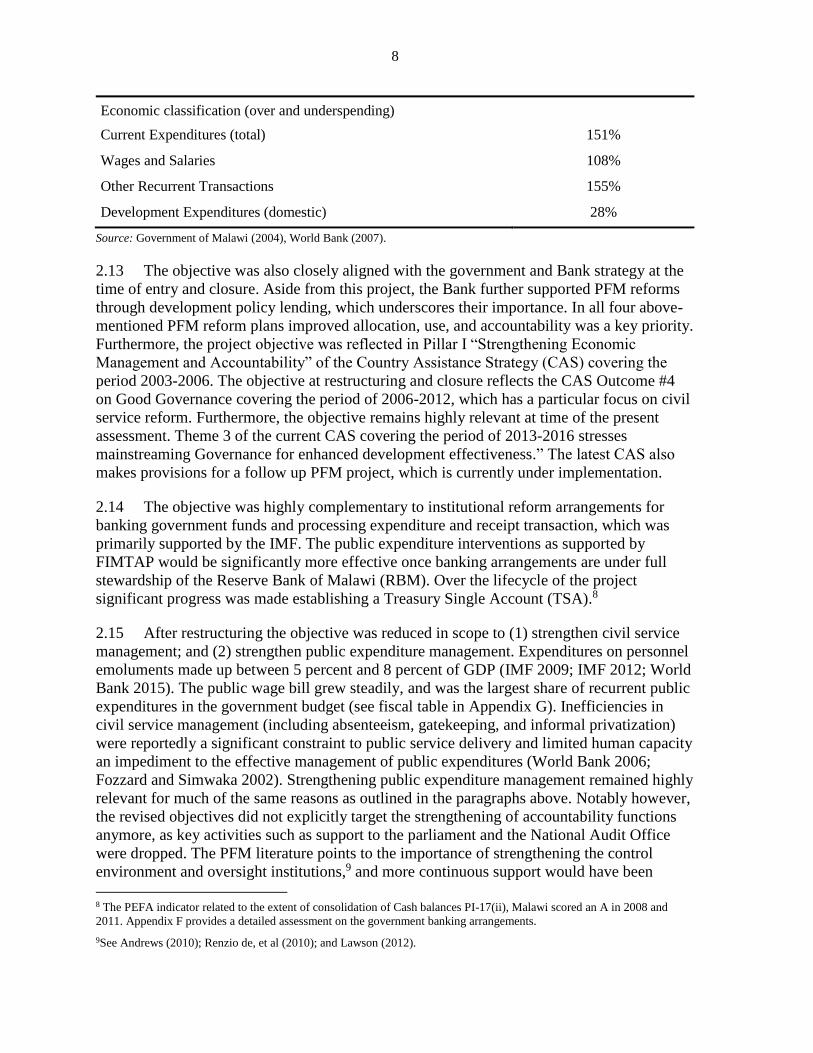
8
Economic classification (over and underspending)
Current Expenditures (total) 151%
Wages and Salaries 108%
Other Recurrent Transactions 155%
Development Expenditures (domestic) 28%
Source: Government of Malawi (2004), World Bank (2007).
2.13 The objective was also closely aligned with the government and Bank strategy at the
time of entry and closure. Aside from this project, the Bank further supported PFM reforms
through development policy lending, which underscores their importance. In all four above-
mentioned PFM reform plans improved allocation, use, and accountability was a key priority.
Furthermore, the project objective was reflected in Pillar I “Strengthening Economic
Management and Accountability” of the Country Assistance Strategy (CAS) covering the
period 2003-2006. The objective at restructuring and closure reflects the CAS Outcome #4
on Good Governance covering the period of 2006-2012, which has a particular focus on civil
service reform. Furthermore, the objective remains highly relevant at time of the present
assessment. Theme 3 of the current CAS covering the period of 2013-2016 stresses
mainstreaming Governance for enhanced development effectiveness.” The latest CAS also
makes provisions for a follow up PFM project, which is currently under implementation.
2.14 The objective was highly complementary to institutional reform arrangements for
banking government funds and processing expenditure and receipt transaction, which was
primarily supported by the IMF. The public expenditure interventions as supported by
FIMTAP would be significantly more effective once banking arrangements are under full
stewardship of the Reserve Bank of Malawi (RBM). Over the lifecycle of the project
significant progress was made establishing a Treasury Single Account (TSA).8
2.15 After restructuring the objective was reduced in scope to (1) strengthen civil service
management; and (2) strengthen public expenditure management. Expenditures on personnel
emoluments made up between 5 percent and 8 percent of GDP (IMF 2009; IMF 2012; World
Bank 2015). The public wage bill grew steadily, and was the largest share of recurrent public
expenditures in the government budget (see fiscal table in Appendix G). Inefficiencies in
civil service management (including absenteeism, gatekeeping, and informal privatization)
were reportedly a significant constraint to public service delivery and limited human capacity
an impediment to the effective management of public expenditures (World Bank 2006;
Fozzard and Simwaka 2002). Strengthening public expenditure management remained highly
relevant for much of the same reasons as outlined in the paragraphs above. Notably however,
the revised objectives did not explicitly target the strengthening of accountability functions
anymore, as key activities such as support to the parliament and the National Audit Office
were dropped. The PFM literature points to the importance of strengthening the control
environment and oversight institutions,9 and more continuous support would have been
8 The PEFA indicator related to the extent of consolidation of Cash balances PI-17(ii), Malawi scored an A in 2008 and
2011. Appendix F provides a detailed assessment on the government banking arrangements.
9See Andrews (2010); Renzio de, et al (2010); and Lawson (2012).

9
warranted, as eventually made evident from the cashgate scandal (see Appendix E). This
would also have complemented upstream policy reform from the PRSCs 1-3 (see Appendix
G for a detailed list). Capacity building for oversight institutions was only partially addressed
by other donors.10 Furthermore, accountability was a key building block across the
government PFM reform programs, as well as the Country Assistance Strategies. On balance,
relevance of the revised objectives is rated Substantial.
2.16 Relevance of objectives is rated Substantial, reflecting High relevance at entry and
Substantial relevance after restructuring.
Relevance of Design
2.17 Relevance of design at entry was Substantial. The lending instrument was
appropriate and complementary to parallel policy lending operations as well as support from
other donors. The project design at entry had a plausible results chain with components and
planned activities closely linked to the specific development objectives. While the operation
entailed a high number of activities, these were reinforcing, complementary and well
sequenced. Even though the design was complex, it was not excessively so.
2.18 The effective use of public expenditures was likely to benefit from strengthened
budget preparation, planning, improved capacity in financial management, investments in the
FMIS infrastructure, and subsequently better internal controls and budget execution. Less
credible was the link to improved allocation of expenditures. Supporting the MTEF and
investments in strategic plans was an important element, but revenues were substantially
understated with resulting under programming of expenditures. Further, the accountable use
of public resources was likely to benefit from strengthened internal control mechanisms
through FMIS and internal audits, improved oversight capacity of the National Audit Office
(NAO), and better engagement of the PAC and Budget Finance Committee.
2.19 The project focused on strengthening downstream processes such as execution,
monitoring, and accountability before investing heavily into budget preparation and medium-
term planning exercises.11 This was well sequenced as in the absence of a basic budget
execution system which is capable of recording all expenditure and receipt transactions
according to a standard Chart of Accounts (CoA) the implementation of advanced budget
preparation methodologies could at best be of limited benefit. The project also recognized
that it was necessary to improve basic financial management processes, internal controls, and
accountability mechanisms, while at the same time putting in place the requisite equipment
and skills. However, the project would have benefited from addressing more directly the role
10 This includes: US$3.9 million from DfID, CIDA, the EC, and the MCC for capacity building for Parliamentary
committees; US$17 million from the MCC for capacity building for FMIS, the Office of the Director of Public
Procurement.(ODPP), the National Audit Office, Ministry of Finance, and the Malawi Revenue Authority; Euro 2 million
from the EC for public expenditure management and budget related projects, including support for the Central Internal Audit
Unit and the National Audit Office; and US$2 million from UNDP for support of the ODPP and the Lilongwe Government
Wide Area Network.
11 It is important to note in view of subsequent difficulties with the Malawi FMIS that even with the original CODA
application there had been an effort to tighten internal financial controls by the use of double passwords and a clear division
of responsibilities and systems access among accounting cadre and controlling officers. This is discussed in more detail in
Appendix C.

10
of Controlling Officers under the law for managing their votes, reporting to the Ministry of
Finance (MOF), and being themselves accountable for following financial regulations.
2.20 Relevance after restructuring remained Substantial, although for different reasons.
The project development objective benefited from becoming more process oriented, which
made the results chain more direct and attributable. These intermediate outcomes
conceivably contributed to the higher level objectives of better allocation and use of
resources. In particular improved public expenditure management is a more downstream and
modest objective than the original objective of improved effective use of public expenditures,
while still plausibly contributing to the higher level objective of improved allocation and use
of expenditures. Downsizing expectations was appropriate, especially given the more modest
engagement in FMIS. The results chain remains by and large plausible: the development of
strategic plans in coordination with the MTEF is likely to improve on expenditure
management and eventually allocation of public resources. However, improved allocation of
resources would have also benefitted from more realistic revenue projections, the
underestimation of which proved an obstacle to good budget performance (see Appendix G).
A functioning FMIS with improved budget execution through sufficient ex-ante internal
control mechanisms is essential to expenditure management, likely to improve the credibility
of the budget, which subsequently impacts allocative efficiency as well as the use of
resources.
2.21 Improved civil service management was critically supported through strengthening
the HRMIS, including payroll and establishment controls. Further, an exhaustive training
program, and institutionalizing performance contracts were likely to contribute directly to the
objective. While rightsizing senior public service staffing levels was potentially important,
the added component was very small and thus unlikely to contribute significantly to the
objective. Arguably it complicated the operation unnecessarily. Similarly, rationalizing
foreign missions was an important aspect of civil service management, but may better have
been addressed in a trade and competitiveness program.
2.22 The logical framework, as per PAD Annex 1, and results framework of the
restructuring paper were by and large vague and weakened the chain of logic. Specifically,
the project development objective (PDO) indicators were not well defined and attributable.
Furthermore, effectiveness of public expenditure was not measured through potential
indicators such improvements in budget allocation and protection of priority expenditures,
and outturn compared to the budget. The intermediate outcomes were more closely related to
activities, even if rather output oriented. At restructuring the operation missed the
opportunity to include PEFA indicators in its results framework although an assessment had
been finalized shortly before. A more in depth assessment of the M&E design, including the
relevance of indicators is provided in chapter 7.
2.23 On balance, notwithstanding shortcomings in the results framework, relevance of
design is rated Substantial. Prior to restructuring, it was well designed, and sequenced.
Developing, and rolling out an FMIS, building capacity, and strengthening accountability
makes for a relevant, confined and well-designed operation. After restructuring the scope of
the operation was rightly reduced, though complexities were introduced that detracted

11
somewhat from the operations focus. The quality of outcome and performance indicators
accompanying the operation were lacking and only improved moderately after restructuring.
3. Implementation
3.1 The project was approved by the Board on March 6, 2003 and declared effective on
June 2, 2003. The operation was restructured twice: a first order restructuring in July 2006
that required board approval of the new PDO, indicators, and targets; following the mid-term
review a second order restructuring in February 2009 that included a reallocation of funds
and extension of the closing date. A Trust Fund of US$ 1.8 million was made available to the
operation in December 2007. A mid-term review was held in May 2008. The estimated cost
of the project at appraisal was US$27.4 million, with Bank financing of US$23.7 million and
borrower financing of US$3.7 million. Due to exchange rate fluctuations between the SDR
and the US$ the envelope of Bank funds to the project increased to US$26.5 million after the
first restructuring and to US$27.7 million after the second. The actual cost at closing was
US$30.2 million, of which the Bank financed US$29.2 million and the Government of
Malawi (GOM) US$1.0 million. In response to a request from the government, the project
has been approved for retrofitting in accordance with the Malawi Country Financing
Parameters which eliminates the need for further counterpart financing12. The Bank disbursed
US$7.6 million of the credit prior to restructuring, an equivalent of 25 percent of total
lending. A breakdown of the project cost by component is provided in the table below13.
3.2 Project implementation started during the campaign for the 2004 general elections, at
which time there was little political momentum in favor of reform and an unreceptive civil
service to the proposed activities under FIMTAP. Further, there were significant procurement
delays in the first 18 months due to (i) a lack of a procurement specialist in the Project
Implementation Unit (PIU)14; (ii) inadequate knowledge of World Bank procurement
procedures by the beneficiary agencies; and (iii) slow follow up by the Bank on processing
no-objection requests from the FIMTAP Secretariat due in part to frequent changes of task
team leader.15
Table 3.1. Project Cost by Component (US$ million)
Appraisal
estimate Actual
Percentage of
appraisal
Accountability and Public Service
Management 6.2 6.3 101.6
Improved Financial Management 12.6 11.4 90.5
Human Development 3.1 5.2 167.7
12 Much of the FMIS was funded by Government but this expenditure is not included as project cost.
13 Some of the figures presented in the ICR were incorrect and were rectified here based on available information.
14 This was an effectiveness condition that was met. However, this person either never took up the position or left it soon
after. Even though there was a legal covenant whereby this position should be throughout implementation, by all accounts
the Bank team did not enforce this provision.
15 At the time of restructuring the project had a succession of five TTLs.

12
Project Management 1.8 4.2 237.2
Performance Incentive Facility n/a 0.3 n/a
Other (Trust Fund) n/a 1.8
Total 23.7 29.2 119.0
Source: World Bank (2003); World Bank (2006); World Bank (2010).
3.3 Project implementation started during the campaign for the 2004 general elections, at
which time there was little political momentum in favor of reform and an unreceptive civil
service to the proposed activities under FIMTAP. Further, there were significant procurement
delays in the first 18 months due to (i) a lack of a procurement specialist in the PIU;16 (ii)
inadequate knowledge of World Bank procurement procedures by the beneficiary agencies;
and (iii) slow follow up by the Bank on processing no-objection requests from the FIMTAP
Secretariat due in part to frequent changes of task team leader.17
3.4 Under the previous Bank project, the Institutional Development Program 2 (IDP2),
the government had purchased CODA Financials and customized it to Malawi requirements.
Detailed pilot testing of the software had been carried out over 2000-2002. The upgraded
version was launched in pilot sites, and its functionality verified and considered ready for
roll-out by World Bank staff prior to negotiations of FIMTAP. The long time taken for
customization and testing the FMIS software under IDP2 and in the earlier years of FIMTAP,
without sufficient progress in its implementation seemingly led to the loss of confidence of
the Accountant General and uncertainty over whether the process would yield a workable
solution despite some encouraging results during the pilot phase. This in turn undermined the
commitment and support from top management in the Ministry of Finance (MOF), who
decided to abandon the customization and enhancement of the application and procure
EPICOR, an entirely new second generation application software package. This decision was
taken after a visit of a high level MOF team to Tanzania where this software was being used.
3.5 The new procurement was proposed by government to be on a sole source basis,
which was deemed incompatible with Bank procurement guidelines. The government then
decided to purchase the software from its own resources. All further work related to the
original FMIS application and training of staff for its use was suspended and the government
embarked on a new systems implementation exercise based on the new instrument. This
raises a question whether continued investment in customization and enhancement of the
original application was the appropriate route to follow. Instead it may have been better to
switch software platforms to take advantage of the new technology available at the very start
of FIMTAP in the early 2000’s. The Quality Assurance Group (QAG) noted that “The CODA
Financials, had been installed under a previous Bank project, IPD2, and updated prior to
FIMTAP commencing. The Accountant-General came to the view that an FMIS based on
CODA Financials could never work satisfactorily, and sought to switch to the EPICOR
16 This was an effectiveness condition that was met. However, this person either never took up the position or left it soon
after. Even though there was a legal covenant whereby this position should be throughout implementation, by all accounts
the Bank team did not enforce this provision.
17 At the time of restructuring the project had a succession of five TTLs.

13
system utilized by Tanzania. Bank staff urged the GoM to stick with the existing software,
and arranged for CODA to fly a team to Malawi to fix all outstanding problems…Who was
right is beside the point. What happened is that the Bank was unable to retain the confidence
of the client on a critical technical issue at the heart of the project.” (QAG 2008 para 16).
3.6 In light of lack of implementation progress the government and the Bank decided to
restructure the project in November 2004, which was only completed in July 2006. The
reasons given for this time lag were delayed approval by the Bank due to the frequent
changes in TTLs, a request for an audit due to suspicion of financial irregularities in
procurement,18 and the government proposing additional subcomponents late in the
restructuring process, such as the inclusion of a Human Resource Management Information
System (HRMIS) and addition of foreign missions. The operation subsequently benefitted
from additional financing through a dedicated Trust Fund of US$ 1.8 million, which became
effective in December 2007.
3.7 The mid-term review (MTR) was originally scheduled for June 2005, but was
postponed to April 2008 to allow for an adequate implementation period following project
restructuring based on which the performance could fairly be assessed. However, this also
meant that there was limited scope for substantial changes once the project was approaching
closure (at MTR about 75 percent of the Credit had been disbursed and a substantial part of
the funds were already committed). The MTR concluded that restructuring had put the
project back on track, most components were progressing at a satisfactory pace, and that
disbursements had increased significantly after the initial delays. It also recommended an
amendment to the DCA due to some changes in government priorities and project operations.
This included dropping the retrenchment subcomponent as officers had either retired,
resigned or died; increasing the maximum award under the performance incentive facility to
US$10,000 as US$5,000 would not meet the cost of the training or training equipment; and
an increase in the performance indicator training target from 100 to 1,000 as more funds
became available, and training was held locally / regionally rather than internationally.
(World Bank 2008).
3.8 Subsequently the operation was restructured for a second time to take into account the
recommendations of the MTR,19 provide for a further reallocation of funds, and extend the
project closing date until September 1, 2009. A breakdown of the reallocation of funds is
provided in the table below. Notable is the overestimation of operating costs. This may in
part be due to implementation cost savings of the retrenchment sub-component.
3.9 Safeguards compliance. None of the safeguards policies were triggered as per PAD
and restructuring documents. No fiduciary issues were identified during project
implementation. In 2005 the country director requested the World Bank’s Internal Audit
Department (IAD) to conduct an audit for FIMTAP on the suspicion of financial
irregularities associated with the FMIS component. The audit itself was never undertaken.
18 No irregularities were identified.
19 See restructuring paper 2009, p.3.

14
However IAD’s preliminary investigations concluded no fiscal irregularities, but several
instances of financial management lapses in relation to the FMIS.
Table 3.2. Reallocation of Funds (US$ million)
Original
Allocation
Reallocation
2006
Trust Fund
2007
Reallocation
2009
Goods 4.0 5.5 6.0 7.7
Consultant's services
audits and training 14.1 13.2 14.3 14.5
Operating costs 2.6 5.9 6.1 6.5
Refunding PPF 0.6 0.3 - 0.3
Unallocated 2.4 0.9 - -
Subprojects - 0.5 - 0.5
Severance payments - 0.3 - -
Total 23.7 26.6 28.4 29.5
Source: World Bank (2010).
4. Achievement of the Objectives
Original project
Objective 1. Improved effective use of public expenditures
4.1 The improved effective use of public resources was to be achieved through enhancing
financial management systems, building planning and budgeting capacity, and investing in
human capital. The credit supported refinements and improvements to technical specification
of the existing FMIS. Arrangements were made for technical assistance, further hardware and
software purchase as well as the provision of various training modules. The expected
outcome of this was that a functioning FMIS would provide the information needed by
controlling officers to develop better budget estimates and control spending. As a corollary,
improved budget execution through adequate ex-ante internal control mechanisms would
improve the credibility of the budget, which impacts allocative efficiency and ultimately
enhances the effective use of public expenditures. Capacity constraints to effectively
implement PFM reforms were recognized and the operation complemented support with
building critical skills in the areas of financial management, auditing, accounting,
management, and information technology.
4.2 After the government abandoned the original platform, the World Bank significantly
scaled-down its support to the FMIS. The government consequently pursued the
implementation of a second generation FMIS with its own resources. The World Bank
limited its support to the Government Wide Area Network (GWAN), the provision of
generators, and some technical support. To complement the government’s efforts, the Bank
however retargeted support to budget preparation and planning through the development of

15
annual strategic plans, strengthening the Medium-Term Expenditure Framework, and
training of planning officers in ministries, departments, and agencies (MDAs) in developing
budget estimates and aligning strategic plans with budget development processes, thus
addressing allocative efficiency issues.
Outputs
4.3 FMIS. The FMIS was launched in five pilot sites (Agriculture, Health, Finance,
Education, and the Accountant General). Training regarding project management, IT and
CODA Financials was provided, and office equipment such as computers and printers were
procured and distributed. The system was not rolled out because of the government’s
decision to change the system platform to a second generation application. The adoption of a
new system led to most investments in the financials software upgrades and trainings
becoming redundant.
4.4 To strengthen the FMIS, FIMTAP made provisions for a physical GWAN, which was
designed as the electronic infrastructure to support numerous intranet / internet capable
functions. Under the project, with parallel support of UNDP and the Millennium Challenge
Cooperation (MCC) the GWAN was upgraded and significantly expanded. Amongst other
things, electricity was provided through back-up generators, nine government buildings in
Lilongwe City were connected, and network security was strengthened. Most enhancements
for the network and its management structures were completed at project end in 2009 and the
associated target of “GWAN fully functional and secure,” though very vague, can be
considered achieved. A more comprehensive picture of the support to GWAN under the
project is provided in Appendix C. Under the Financial Reporting and Oversight
Improvement Project (FROIP) follow-up operation and support from USAID the GWAN
was again significantly refurbished including replacements of the fiber cables and network
equipment. Today the GWAN serves as a reliable backbone for the operation of government
information systems.
4.5 The operation built government capacity for strategic planning. Core planning teams
comprising ten officers each, were constituted and trained in strategic planning. In total 234
officers were trained against a target of 220. Additionally, 150 local government officials
attended workshops for the training of trainers in order to transfer strategic planning skills to
the local assembly staff. Templates for plans were developed and standardized across MDAs,
and plans were developed for 22 MDAs. Strategic plans were aligned on the one hand to the
Malawi Growth and Development Strategy, and on the other to the budget development
process directly. These plans were reported to have been used for the sectoral budget
allocations in their respective institutions. At the time of the present assessment the original
strategic plans had expired. In the ministries visited, a new strategic plan had been
subsequently developed using mostly government resources. These were broadly based on
the original template. This indicates that capacity to develop plans had indeed been built and
was maintained. Further, government ownership of strategic plans appears to be high. Line
ministries develop Medium-Term Expenditure Frameworks that are based on the priorities
identified in their respective strategic plan, and clearly reflect objectives, sub-objectives, and
targets.

16
4.6 Capacity Building. The project included support to the Malawi Capacity Building
Facility,20 and thereby provided trainings at various levels on resource and expenditure
management. The Malawi Capacity Building Facility has provided to about 1,500 civil
servants both long-term and short-term training including accountability and transparency,
public finance, auditing, project management, procurement, and local government financial
management. This exceeds the initial target set for 100 staff, and the revised target of at least
1,000 staff trained.21
4.7 A credible22 evaluation of short-term training (GOM 2008) found the program to be
effective. Attendance rates were high, and a survey results indicate that most participants had
a better attitude about their job following the training, and were subsequently able to take on
more responsibilities. Furthermore it is reported that 92 percent of the participants were able
to apply the skills, indicating that the training was indeed relevant. In particular the
assessment notes that “participants are now able to evaluate tender documents, develop and
review strategic plans, and observe principles of natural justice in decision making” (GOM
2008 p.15). Short-term training participants were predominantly from the Ministry of Local
Government and Rural Development, followed by Agriculture, and Education. However,
despite their important role regarding allocative efficiency and use of resources, the National
Audit Office, the Accountant General’s office, the Statutory Corporation, and the Parliament
had very few participants (3 percent or less each). Further there was a gender imbalance, with
only 28 percent of participants being female. No information was available on the share of
women in the public service to put this in perspective.23
4.8 Various long term training scholarships were provided under the program, as well as
supported by other partners including the Malawi government Scholarship Fund, and the
Commonwealth Scholarship and Fellowship Plan. Overall 337 beneficiaries obtained degrees
between 2005 and 2011. Of the 337, two thirds were male and one third female. The majority
(87 percent) were sponsored for a master’s degree, 8 percent for a doctorate and the
remaining 5 percent for a bachelor’s degree. The Central Internal Audit (CIA) unit received
most trainings, followed by the Office of the Director for Public Procurement (ODPP), the
National Audit office with 91, 70, and 45 beneficiaries respectively (GOM 2009). A tracer
study (GOM 2013) finds that the majority of long-term Training beneficiaries returned and
remained at the public service after receipt of their degree. By 2013 312 beneficiaries were
still in the public service, representing 92 percent. The study’s survey concludes that 92
percent of recipients were able to use the skills acquired during training, and beneficiaries
noted that the degrees had contributed to the advancement of their careers as evidence by
their promotion to higher posts. A more detailed account of the various training courses and
their effectiveness is provided in Appendix D.
20 The Malawi Capacity Building Facility is a public training facility that is managed by the DHRMD.
21 Targets were surpassed as significantly more resources were allocated toward this, and much was conducted in-house
allowing cost savings and greater participation.
22 Based on IEG’s review.
23 IEG recognizes the importance of gender balance. This was not however explicitly mentioned as an objective or outcome
indicator.

17
4.9 Performance and outcome and progress indicators only provide a partial picture of
contributions to the PDO. Progress is difficult to discern due to their vague nature, and lack
of baselines and targets. A list of indicators is provided in Appendix G. The indicator of
adequate capacity built to maintain expenditure management reforms and improvements is
vague, but significant progress had indeed been made with regards to the quality of financial
data from the FMIS. The mission verified that spending units could produce detailed
expenditure reports at any point in time. Samples are provided in Appendix F. Progress
against the indicators was thus made. However, problems remain with the indicator of
reduced FMIS reconciliation lag time (IMF 2013).
Outcomes
4.10 The operation did not include outcome indicators that would adequately measure
effective use of public expenditures. The indicator that “ministry strategic plans are used to
guide funding priorities in budget discussions between all line ministries and [the Ministry of
Economic Planning and Development] and MOF” was partially achieved, as ministries
developed and used strategic plans in line with the Malawi Growth and Development
Strategy (MGDS), but their quality varied and costing estimates were at times rudimentary.
The PEFA of 2011 notes that “sector strategies are of varying scope and comprehensiveness
with costing representing less than 25 percent of primary expenditures” (PEFA 2011, p.34).
Further, where costing was available, it was unclear to what extent estimates were considered
by the MOF during budget preparation. Other shortcomings include plans reflecting limited
prioritization or discussion of policy trade-offs and spending plans reflecting a needs basis
and historical trends, rather than being prioritized against a resource constraint. (PER 2013)
While a “C” in the associated sub-indicator PI-12 (iii) is an improvement from a “D” at
project appraisal (see table 4-1), significant shortcomings remained 10 years later (see
Appendix B for more detail on PEFA performance). Further the PER (2013) points to
significant allocative inefficiencies, which are in part driven by inaccurate revenue
projections (see fiscal table in Appendix G).
4.11 There has been significant progress in expenditure management over the lifecycle of
the operation. The use of public resources has improved due to a relatively successful
implementation of the FMIS, though challenges remain. All transactions related to the
government budget at the HQ and regional centers are reportedly processed through the
FMIS system. This was confirmed by various Directors of Finance such as that of the Office
of the Cabinet, the Department of Human Resources, and the Ministry of Health. These
departments were able to produce a budget execution report at any point in time that gave
budgeted amounts, the revised budget, the funds released, the commitments and the
expenditures to date by line item for all cost centers reporting to them. Samples of these are
provided in Appendix C.
4.12 The wider roll-out of FMIS should have made the accumulation of payment arrears
less likely. In general, where FMIS is in place, it enables the operation of a
commitment/payment system and a funds control system that does not permit the creation of
a local purchase order without approved estimates and available funds. However, in practice
Malawi accumulated a large stock of payment arrears over time that is inadequately reported,
monitored, and managed by the government in an effective and transparent manner. The IMF

18
(2014) estimates that the stock of arrears at MK155 billion in May 2014 (about US$390
million), an equivalent of about 9.2 percent of GDP.24 Factors that have led to this include:
FMIS functionality for commitment planning that is meant to record and manage
appropriation, and funding limit at line item level is not being used. MDAs maintain
an off-FMIS registry and upload funding limits on an as-needed basis;
MDAs generate LPOs and payment vouchers simultaneously, using pro-forma
invoices despite directives to the contrary;
In case of development expenditure where release is based on submission of certified
work invoices, LPOs are processed only after work/service has been delivered and
certified.
Direct payments are made through instructions issued by ST to the Reserve Bank of
Malawi bypassing FMIS and the central payment office
Commitments are regularly processed outside the system through issue of manual
LPOs as vendors ignore the mandatory requirement of an FMIS generated LPO;
Multi-year commitments are poorly monitored or controlled; and,
Budget execution reports submitted by MDAs that record the release, commitments
and expenditure against the budget appropriation are FMIS generated and do not
include the LPOs processed manually outside the system. As a result, the MOF only
has a partial picture of the total commitments entered into by MDAs.
4.13 On the upside, program managers at various levels of government interviewed for this
assessment reported that FMIS provided significant managerial value. At the Ministry of
Health for example it was noted that the system allowed the team to track outputs and actual
expenditure figures allowing them to monitor program costs accurately. Furthermore, the
system enabled them to determine which outputs could not be delivered due to insufficient
funding. The value of FMIS by program managers is thus perceived as more than merely an
accounting tool, as it allows them to better manage their day to day activities. The mission
obtained sample copies of these reports for these ministries, which are attached at Appendix
C.
4.14 The PEFA assessments note that there have been some improvements in multi-year
fiscal forecasting between 2006 and 2008, which facilitates more strategic expenditure
allocation decisions. The 2008 PEFA attributes this to the reintroduction of the Public Sector
Investment Plan (PSIP) into the budget system and the development of three year functional
forward ceilings. (PEFA 2008) The assessment at 2011 however concluded that this link was
inconsistent and not functional, and that forward approved ceilings are not consistently
updated and provided to Ministries, Departments, and Agencies (MDAs) to inform the new
fiscal year’s ceilings. (PEFA 2011; Fölscher et al., 2012). Further, both revenue projections
and cost envelopes were consistently off by about 3 percent of GDP compared to outturns
(see Appendix G) over the time period, making actual progress in functional mid-term
planning difficult.
24 This was estimated at the May 1, 2014 interbank exchange rate of 1:392.5 US$ to MK. GDP was estimated at US$4.3
billion in 2014 (World Bank World Development Indicators).

19
4.15 An MTEF was introduced in the late 90s, and went through various reform cycles25 in
order to provide a more effective link between forecasting, planning and budget processes. A
recent World Bank study classifies Malawi’s MTEF as a level 2 medium term budget
framework26 meaning it specifies spending agency expenditure ceilings based on a
compromise between top-down resource availability from the MTFF and bottom-up resource
priorities to finance sector spending plans. (World Bank 2013b) However, while core
elements of a level 2 MTEF are in place there remain significant challenges to realizing an
integrated policy led medium-term budgeting process. These include further refining the
macro-fiscal framework, making the budget comprehensive of all government expenditure,
strengthening linkage between policy priorities and expenditure planning, and achieving
better integration between current and capital spending programs. (World Bank 2013)
4.16 The link between investment budgets and forward looking recurrent expenditure
estimates supports allocative efficiency and thus effective use of public expenditures.
However, no PEFA improvements have been recorded in this dimension over the lifecycle of
the project - it has consistently been rated “D” (see table 4.1). Instead of unified approach,
the preparation of the PSIP is done in parallel to the development of recurrent spending
proposals. Thus, limited consideration is given to recurrent costs arising from investments or
the trade-off between the two. (PER 2013)
Table 4.1. Select PEFA Scores on Policy-based Budgeting
PI-12 Multi-year perspective in fiscal planning, expenditure policy
and budgeting 2006 2008 2011
(i) Multi-year fiscal forecast and functional allocations C A C
(ii) Scope and frequency of debt sustainability analysis B A A
(iii) Existence of costed sector strategies D C C
(iv) Linkages between investment budgets and forward expenditure
estimates D D D
Source: PEFA 2006, PEFA 2008, PEFA 2011.
4.17 Furthermore, the budget was insufficiently comprehensive, including large off-budget
expenditure items, which hinders well informed decisions regarding the allocation of the
budget. Estimates for off- budget donor support27 is collected by the Debt and Aid
Management Division in the MOF. In FY13 these made up almost half of the entire
development budget, and up to 76 percent in some sectors such as Health and Irrigation and
Water Development (see table 4.2). This raises significant stewardship concerns, and restricts
the government’s ability to prioritize resources against need. This is a concern, given that
only about half of externally financed project expenditures are reflected in the PSIP, with
large variations across sectors. (PER 2013) It also makes duplication of activities possible,
25 Fiscal Restructuring and Deregulation Program.
26 The study differentiates between a medium term fiscal framework (level 1); a medium term budgeting framework (level
2); and a medium term performance framework (level 3).
27 Off-budget donor support refers to donor programs that bypass the Government budget entirely.

20
allows for “double dipping,”28 which puts stress on the already stretched counterpart’s
absorptive capacity and wastes resources.
Table 4.2. Development Expenditure and Share of off Budget Financing for 2012/13
(MK billions) Domestic DP budgeted Total
budgeted
Estimated DP
off-budget
Grand
Total
Off-budget as
share of total
Agriculture and Food
Security 1.1 13.2 14.3 1.9 16.2 11.7%
Irrigation and Water
Development 1.4 2.8 4.2 13.4 17.6 76.1%
Education, Science,
and Technology 5.1 4.4 9.5 6.9 16.4 42.1%
Health 3.5 0.3 3.8 12.8 16.6 77.1%
Roads Authority 12.2 0 12.2 16.5 28.7 57.5%
Other MDAs 14.7 17.5 32.3 12.8 45 28.4%
Total 38 38.3 76.2 64.3 140.5 45.8%
Source: World Bank 2013 adapted.
4.18 A tight macroeconomic and fiscal framework with large non-discretionary budget
outlays (e.g. personnel, transfers, fertilizer subsidies) constrains the government’s ability to
fund new initiatives. In this environment strategic policy based budget planning is difficult.
While over the medium term there is scope for reallocating resources to higher priority
programs, there is little evidence that this has indeed been the case.
4.19 The Parliament’s ability to effectively scrutinize budget execution and ensure that the
budget is executed in line with its stated priorities remains limited. Deviations between
approved budgets and actual revenues and expenditures are significant, which effectively
undermines the legislative role of Parliament in approving the annual budget law. Further,
there is considerable expenditure composition variance undermining the credibility of the
budget as an indicator of resource allocation in line with policy priorities. It suggests that
there is only a weak link between in-year cash management decisions and policy priorities
insofar as these are reflected by the original budget. (PEFA 2008, PEFA 2011) The trend of
these over the project cycle is displayed in figure 4.1 below.29 Some countries facing similar
difficulties (e.g., Uganda in the 1990s and more recently) party dealt with this problem by
protecting priority expenditures, which does not appear to be the case in Malawi.
28 E.g. staff attending the same training multiple times offered from different sources.
29 Aggregate expenditure variance as per PEFA PI-1 is the difference between actual primary expenditure and originally-
budgeted primary expenditure (in other words, with debt service charges excluded, and also expenditure on projects with
external financing). Composition variance as per PEFA PI-2 refers to the deviations in composition of expenditure out-turn
compared to the original approved budget.

21
Figure 4.1. Trend of Aggregate Expenditure Variance and Composition Variance
Source: PEFA 2008, PEFA 2011.
4.20 Finally, a Public Expenditure Tracking Survey (PETS) could most credibly and
directly provide insight on the objective of “improved effective use of public expenditures.”
The ICR reports that the operation sponsored surveys in the districts of Mzimba, Mchinji,
Zomba, and Chikwawa to follow the flow to the intended beneficiaries in the rural
communities, as reflected in the annual budgets. However, neither the report nor summary
findings were made available to the evaluation team. The Malawi Civil Society Education
Coalition financed a PETS in 2012, which was revealingly titled “Down the Drain” (CSEC
2013). Surveys were conducted in 5 districts at primary schools, the District Commissioner’s
(DC) office, and for the District Education Manager. The report found that more than half of
the schools did not receive any teaching and learning materials through the budget allocation
of the District Education Manager. Further, despite the allocation of funds, the PETS reveals
that none of the sampled primary school received funds for bursaries. In summary, the report
notes that “the PETS reveals a situation where a significant proportion of education sector
financing is not reaching the targeted beneficiaries. Public money allocated to the Malawi
education budgets seem to missing the target and not all the funds are producing the outputs.”
4.21 On balance, this objective is rated Modest. Some outputs regarding expenditure
management and capacity building were achieved. Sector plans were and continue to be
developed. Capacity for doing so has been built and was retained. However, there is
insufficient evidence to suggest that there have been real improvements in the effectiveness
of public spending. The 2011 PEFA at project closure brings this to the point: “the
expenditure planning and resource prioritization processes have not been properly aligned
with the priorities expressed in the MGDS, nor has the PSIP worked as intended as a guiding
instrument for investments in the sectors. In particular, the sectors have been experiencing a
-15
-10
-5
0
5
10
15
20
25
2005 2006 2007 2008 2009 2010
Var
iance
(%
)
Agregate expenditure variance Composition variance

22
lack of coherence between their internal planning processes and the annual budget process
managed by the Ministry of Finance” (PEFA 2011, p.11).
Objective 2. Improved accountable use of public expenditures
4.22 The operation originally intended to improve the accountable use of public
expenditures through strengthening accountability institutions such as the National Audit
Office (NAO) and oversight of the Parliament. While much of these were to be achieved
through improved organizational and human capacity, strengthening the internal control
environment through FMIS investments was considered an important building block to
achieving this objective.
4.23 After the PDO was restructured, improved accountable use of public resources was
not included explicitly as it was in the original PAD. Respondents suggested that in the
revised statement accountability was subsumed under improved use of public resources.
After restructuring support to oversight institutions was largely dropped, and the operation
instead focused on internal audit capacity, procurement, and performance contracting.
Outputs
4.24 Parliamentary oversight. Little was achieved with regards to strengthening the
Public Accounts Committee (PAC) or the Parliamentary Budget Committee (PBC). As
progress of this component was slow, the Bank dropped all activities during restructuring. By
the time of restructuring no capacity development planning had been done, one workshop
had been held for junior parliamentary staff and 2 senior staff had attended general
management courses outside Malawi. No work had been done on building the capacity of
key parliamentary oversight committees, and no resources or equipment was provided to
support their functions. While the legislative does debate the budget law, the capacity for
doing so is weak, and challenges to the overall budget strategy are rare. Legislative scrutiny
of the annual budget law is rated D+ in the latest PEFA assessment. Further, legislative
scrutiny of external audit reports is limited. Evidence of issuance of recommended actions by
the legislature or implementation of previous recommendations by the executive is scant.
This dimension is also rated as D+ by the PEFA assessment.
4.25 Strengthening of the National Audit Office. The cadre of auditors in the NAO was
expanded under the project. Twenty officers obtained an Advanced Certificate in Auditing,
15 officers a Certificate in Information Technology and 30 officers underwent an induction
course. Courses in change management and leadership skills were also provided. For more
detail on capacity building see Appendix C. In addition the operation financed the
construction of a training center, computers, and other supplies. The training center was used
for audits in the initial years but was later transformed into office space.
4.26 However, the external audit function is significantly undermined by the failure of the
Accountant General’s Office to complete the annual accounts and financial statements within
the statutory period after the end of year (4 months) and forward to the NAO.30 While the
30 The reports published by the MOF on its website are few and inconsistent.

23
2011 PEFA assessments scored an “A” in this dimension, and a “B” with regards to
submitting audit reports to the legislative, this good practice has deteriorated in recent years
considerably. At the time of mission the last audit reports submitted to legislative were more
than three years delayed. Furthermore, the NAO as per Constitution (section 184(2)) reports
directly to the Minister of Finance. This undermines independence, integrity, and contradicts
international good practice. Further, the latest audit report was limited in scope, focusing
mostly on procedural issues rather than systematic problems. The forensic assessment was
particularly weak. Finally, follow up on audit recommendations was reported to be
inadequate. Audit reports between 2008 and 2010 refer to problems in responses to
management letters. This is part of a wider failing to hold heads of departments and
ministries, as “Controlling Officers” accountable for the proper stewardship of their Votes.
PEFA summary scores for this dimension are provided in the table below. A more detailed
discussion is presented in Appendix B.
Table 4.3. Scope, Nature and Follow up of External Audit
PI-26 Effectiveness of external audit 2006 2008 2011
(i)Scope/nature of audit performed C C C
(ii) Timeliness of submission of audit reports to the legislature C D B
(iii) Evidence of follow-up on audit recommendations D C D
Source: PEFA (2006), PEFA (2008), and PEFA (2011).
4.27 Internal audits were meant to improve expenditure effectiveness by providing more
administrative control and earlier identification of potential issues. As already discussed
above and in Appendix D, human capacity has been built.31 Furthermore Internal Audit
Committees were integrated into line ministries. By project end, 16 ministries32 accounting
for about 75 percent of the budget had functional Internal Audit Committees (IACs) that
meet regularly and provide reports on internal audit committee activities to the NAO, Central
Internal Audit Unit (CIAU) and the Treasury. This misses the target of functioning IACs
established in all ministries.
4.28 The functionality and effectiveness of internal audits is limited however. No progress
in PEFA scores has been made in this regard since 2006, despite low starting points (see
table 4.2) while some progress noted in 2008 has been reversed. Furthermore, management
response to internal audit recommendations has also been limited. The PEFA (2011) notes
that “evidence of management response to audit reports is weak. In most instances audit
committees are not functioning and where they do meet their role is compromised and not
well understood.”
31 Officers were encouraged to become affiliated with the Association of Chartered Certified Accountants. Ten finished the
ACCA diploma increasing the total number of officers with this advanced qualification to 16 during the project cycle. An
additional ten officers also passed the ABE exams and another two qualified as internal audit technicians.
32 These include: Education, Health, Agriculture, Local Government, Transport and Public Works, Natural Resources and
Environmental Affairs, Home Affairs, OPC, Gender, Water, Foreign Affairs, Home Affairs, Lands, Housing and Surveys,
Labor and Social Development, Disability and Justice.

24
Table 4.4. PEFA Assessment on Effectiveness of Internal Audit
PI-21 Effectiveness of internal audit 2006 2008 2011
(i)Coverage and quality of the internal audit function C C C
(ii)Frequency and distribution of reports C B C
(iii) Extent of management response to internal audit findings D C D
Source: PEFA (2006), PEFA (2008), and PEFA (2011).
Outcomes
4.29 CPIA ratings on transparency, accountability, and corruption was on par with Zambia
and above the regional average. In 2012 however Malawi ratings plummeted significantly
and have remained well below comparator countries since (see figure 4.2). The control of
corruption perception index33 shows a similar picture. While in the earlier years, both Malawi
and Zambia appear to be making significant headways, Malawi has lost ground in the last
three years and performs now markedly worse than its neighbor.34 In 2013 Zambia was in the
45th percentile of countries, and Malawi 15 percentiles lower. Malawi’s 2013 ranking was
close to the position it was in 2005, undoing much of the progress from earlier years (see
figure 4.3).
4.30 During the years leading up to 2011 there was a general perception of governance and
corruption improvements which correspond to improving government commitment to PFM
reforms. This perception however plummeted when the cashgate scandal surfaced, through
which about US$32 million where misappropriated. This exposed a severe breakdown in the
accountability chain. The IMF (2013) noted the cashgate points to a “breakdown in internal
control, lack of managerial oversight, possibility of collusion and sharing, poor bank
reconciliation, and a limited regard to the PFM legal framework including a culture of
impunity.” Further, while security measures were in place in the FMIS, the system was
unable to flag some problems. This was in part due to sharing of passwords, insufficient
integration of the NAO, and the ability to erase data entries ex-post. Appendix E provides a
more detailed discussion on the contributing factors to this system failure.
33 CPIA ratings assess the quality of a country’s policy and institutional framework. The Control of Corruption indicator
captures perceptions of the extent to which public power is exercised for private gain, including both petty and grand forms
of corruption, as well as "capture" of the state by elites and private interests. Percentile rank indicates the country's rank
among all countries covered by the aggregate indicator, with 0 corresponding to lowest rank, and 100 to highest rank.
34 A parallel PPAR was conducted for Zambia, which has undergone a similar reform program.

25
Figure 4.2. CPIA Rating on
Transparency, Accountability, and
Corruption
Figure 4.3. Control of Corruption
Perception Index by Percentile
Source: World Bank CPIA database and Worldwide Governance indicators.
4.31 While FMIS was frequently blamed for the problem, the fault does not lie with
system but its use and the underlying enabling environment. An audit commissioned by the
National Audit Office of Malawi (NAO 2014) after the cashgate scandal has noted: “During
an unannounced ad hoc IT security audit, the auditors’ inspection of the firewall
configuration indicated that the firewall settings had been changed to permit any outside
connection. The password controls had been disabled, and the connections to the FMIS
servers, that should have been routed through the network firewall, had bypassed the firewall.
This represents a fundamental weakening of the internal control framework such that it
would allow a situation similar to cashgate to occur again.”
4.32 Indicators as per original logical framework were scant and difficult to use as the
means to assess progress towards the objective. The indicator of accountability institutions
expanded role and prominence is vague and difficult to measure. Nevertheless, given delays
in the completion of annual accounts and financial statements, lack of independence by the
NAO, limited capacity in Parliament, and lack of managerial oversight and poor follow up on
recommendations it is difficult to argue that sufficient progress has been made. While there
was no target for the indicator that external audit reports are completed on time, the last
available report to the evaluation team was from 2011 and thus outdated. Internal audit
controls should facilitate improvements in internal controls. However, there appears to be
little demand for internal audits by Controlling Officers and an insufficiently enabling
climate for expenditure control to make these effective.
4.33 Given the stagnation in the relevant CPIA ratings and reversal in Governance
indicators, poor record on PEFA scores, continued weakness in oversight institutions, and the
0
1
2
3
4
5
6C
PIA
Sco
re
Zambia Malawi SSA
0
5
10
15
20
25
30
35
40
45
50
Go
ver
nan
ce P
erce
nti
le
Zambia Malawi

26
weakening of the systems that facilitated the cashgate scandal, this objective is rated
Negligible.
Restructured project
Objective 1. Improved Civil Service Management
4.34 The objective of improved civil service management was introduced after
restructuring in an effort to better align the objectives with project components and priorities
of the government. The civil service reform component included strengthening the HRMIS to
allow for better management and oversight of the civil service, and performance contracting
to provide an incentive for better performance through increased pay. Furthermore, the
revised operation sought to improve the civil service management by rationalizing senior
public servants and foreign missions where appropriate.
Outputs
4.35 HRMIS. The payroll system and establishment controls were significantly
strengthened under the project. The operation financed the introduction and training of a new
HRMIS, which is now comprehensive (including subnational government) and fully utilized.
The Establishment module of the HRMIS maintains the Schedule of Established Offices for
approved posts and associated grades allocated to each ministry or department. This module
has been centrally implemented at DHRMD in HRMIS. Adjustments to the establishment in
HRMIS can only be done by authorized officers within DHRMD. Ministries and
Departments have access to their establishments in read only mode. This means that
Departments should not be able to appoint or recruit without posts being open, as the payroll
is linked to posts that are determined by authorized establishment.35 Employee and payment
modules have been fully implemented. Although the system supports biometric controls for
unique identification of employees this functionality has not been activated due to capacity
constrains but is currently under discussion. MDAs have full reading rights, and all
payments are made through the FMIS. The indicator of “a HRMIS system operational in all
ministries” can thus be considered full achieved. Furthermore, security controls with full
audit trails are in place and the database is regularly audited. The intermediate outcome
indicator “to improve payment systems and establishment controls to ensure conformity with
budgeted public service establishments” was fully met, and payroll deviations were within 5
percent of their budgeted figure at project closure.
4.36 Rationalizing foreign missions that were no longer deemed necessary was intended
to achieve a leaner and more effective diplomatic service. As a result four missions (Ottawa,
Nairobi, Tripoli, and Paris) were closed and 15 serving officers were recalled. The
government recalled an additional 37 staff from foreign missions world-wide, in association
with a review of the staffing requirements of all missions especially in terms of the skills
required in diplomatic, trade and commerce functions. To strengthen such functions, 25 staff
from the Ministry of Industry, Trade, and Private Sector Development were trained in basic
35 It remains possible to introduce ghost workers through to the inclusion of employees on the payroll from other cost
centers over which controlling officers do not have oversight. (see GOM 2015).

27
trade and investment diplomacy, and subsequently posted to various missions. This
restructuring was intended to refocus foreign missions from a diplomatic and aid driven
focus to a more economically oriented foreign service. The indicator as per restructuring
paper of “trade and commercial functions in at least four major foreign missions enhanced” is
vague, but significant progress has been achieved. However, it cannot be established whether
this has translated into increased trade and investment or some other measure of more
effective economic relations.
4.37 The retrenchment plan, which only concerned a few dozen civil servants, was
abandoned shortly before project closure as the identified officers had either retired, resigned
or died.36 The associated indicator and target are thus not meaningful. The component was in
any event not significantly relevant to the achievement of the objective and financing for its
implementation was limited.
Outcomes
4.38 The HRMIS has become an essential tool for the functional processes related to the
management of the civil service. PEFA assessment ratings confirm this, with a strong
performance over the years. In particular the degree of integration and reconciliation between
payroll records and payroll data, as well as internal controls are very strong. Marked
improvements in payroll audits were also recorded (see table 4.5 below).
Table 4.5. PEFA Assessment on Effectiveness of Payroll Control
PI-18 Effectiveness of payroll controls 2006 2008 2011
(i) Degree of integration and reconciliation between payroll records and
payroll data
B A A
(ii) Timeliness of change to personnel records and the payroll B B B
(iii) Internal controls of changes to personnel records and the payroll C A A
(iv) Existence of payroll audits to identify control weaknesses and/or ghost
workers
C C B
Source: PEFA (2006), PEFA (2008), and PEFA (2011).
4.39 A payroll audit carried out in 2008 identified 708 unoccupied positions (i.e. ghost
workers), which have subsequently been deleted. Data from the audit was used to update the
HRMIS for effective management of the payroll. Subsequent to the audit and a HRMIS
review employee remuneration was started to be channeled through bank accounts. After
conclusion of the payroll processing a file is sent to the FMIS system for consolidation.
FMIS subsequently posts a payments file to RBM which processes payments to the
commercial banks where employees hold their accounts. Despite some initial challenges
resulting in payment delays all employees currently receive their salaries through electronic
transfers to their bank accounts. This had a marked impact on procedural efficiencies,
36 No safeguards regarding the retrenchment plan were triggered. Given that these were senior civil servants and the
numbers were few this was unlikely to have led to significant unintended consequences. As the component was abandoned
none materialized.

28
accountability and transparency, and importantly allowed for more access to finance for a
large share of the population.
4.40 However, despite a functional HRMIS, the workforce grew significantly over the
evaluation period.37 The civil service increased by almost 70,000 staff between 2003 and
2015 from 101,000 to about 178,000 in 2015.38 This is an increase of about 6,000 staff per
year. The civil service growth rate averages about 5 percent annually, which is significantly
higher than the population growth rate at 3 percent, which is already amongst the highest in
the world (see table 4.6). As a share of GDP, wages have increased by about 3 percentage
points over the period of 2008 and 2015 from just under 6 percent to more than 9 percent in
201439 (see figure 4.4). This is driven predominantly by the growth of the workforce, rather
than wages and raises questions about the sustainability of the overall public sector wage bill.
Figure 4.4. Trend of Wages as Share of
GDP
Table 4.6. Growth in Wage Bill and Number of
Civil Servants
Source: IMF Article IV 2009, IMF Article IV 2012, World Bank 2015c.
4.41 A recent payroll audit report (GOM 2015) however pointed out to a number of
remaining issues and risks. These include: it remains possible to introduce ghost workers
through to the inclusion of employees on the payroll from other cost centers over which
controlling officers do not have oversight; there is a failure to validate payroll events, as a
result of which unauthorized changes can be introduced; only junior staff are processing
salaries, which allows for potential for abuse through political and social pressure, especially
given an inappropriate segregation of duties; payroll transactions are insufficiently monitored
37 A HRMIS with an establishment control module will only ensure that no payroll payments are made to staff not on the
authorized establishment list. It will not limit the numbers of staff being put on the list. However, the matching of staff
positions with actual personnel on the payroll will prevent ghost workers and should therefore reduce the total number of
staff employed.
38 Some of this may be driven by decentralization which tends to increase staffing needs (e.g. more administrative staff per
district albeit allowing for some savings at the center).
39 Note, the 2015 figure of both wages and staff numbers is an estimate only.
0
2
4
6
8
10
12
2008 2009 2010 2011 2012 2013 2014 2015
Per
cent
of
GD
P

29
and reconciled; and the interface between the payroll and other related system remains
manual leaving room for error and mishandling. The audit concludes that internal controls
are in place but insufficiently executed. Ensuring effective control issues is not prioritized by
management and employees have been found to be insufficiently aware of their
responsibilities.
4.42 A Performance Management System has been developed and implemented at the
central level, the purpose of which was to incentivize performance through contracts and thus
utilize personnel funds more effectively. At project end about 20,000 civil servants were
enrolled. At the time of evaluation the scheme was fully rolled out to all cadres in the civil
service and civil servants have developed their performance agreements in line with their
work plans. Annual performance agreements are being prepared and are used as a basis for
end of year performance assessment. A sample of a performance assessment is displayed in
Appendix G. While these assessments are comprehensive, they do not carry any bearings on
salary arrangements. Senior staff interviewed stated that performance was taken into
consideration during promotion discussions. The evaluation team however found during field
visits that at lower levels civil servants were more skeptical whether this was indeed the case.
Additionally dispute resolution guidelines have been developed, and circulated. The
evaluation team however found little evidence that these were actively pursued. The indicator
of “annual performance reviews carried out for all public servants under contract” can be
considered as achieved, even if the quality of its implementation appears uneven.
4.43 On balance improved civil service management is rated Substantial, despite
shortcomings and risks. This reflects progress in implementing the HRMIS in an overall low
capacity environment. However, the number of civil servants and the wage bill have
expanded rapidly. Significant loopholes in the internal control environment remain, which
pose risks and undermine the effectiveness of the system.
Objective 2. Improved Public Expenditure Management
4.44 The implementation and roll out of FMIS already discussed above was seen as central
to improve public expenditure management through upgrades in internal controls, improved
budget execution, and a more efficient budgeting process. Under the restructured project the
Bank scaled down its FMIS support and focused on the GWAN, procurement of generators,
and limited technical support. Additionally the Bank provided support to capacity
development in financial management, budget preparation, and various economic advisory
services.
Outputs
4.45 Capacity Building. The project included support to the Malawi Capacity Building
Facility, and thereby provided trainings at various levels on resource management. This
activity has already been discussed in depth under Objective 1 of the original project, and a
detailed account of the various capacity building components and their effectiveness (GOM
2008; GOM 2013) can be found in Appendix D. Overall, progress was significant.

30
4.46 FMIS. System implementation was supported through the provision of computers
and servers. The GWAN was upgraded and significantly expanded. Electricity was provided
through back-up generators, and nine buildings in Lilongwe City were connected. Network
security was strengthened. Most enhancements for the network and its management
structures have been completed, and GWAN now serves as a reliable backbone for the
operation of government information systems. Training for ICT management was provided
under the project. Three officers were sent on longer-term training programs in key network
management skills and 67 officers received short term industry standard information and
communications technology courses including Microsoft Certified Engineer, Cisco
certification, and network security training. The associated target of “GWAN fully functional
and secure,” though not quantified, can be considered to have been achieved. A more
comprehensive picture of FMIS support is provided in Appendix C.
4.47 The new FMIS platform that was implicitly supported by the program is now the
main tool that is used to support the government’s budget execution process at the center and
in sub-national governments in Malawi. The budget is prepared separately by a budget
preparation system and is loaded into the FMIS at the start of the year by the budget
department. All in-year changes to the budget are made directly in the system. Cash releases
are also recorded by the MOF in the system. System implementation at the line ministry level
covers the complete Procure to Purchase (P2P) cycle with all stages of the transactions
recorded directly in the system. This includes the request for procurement. The Local
Purchasing Order (LPO) is produced directly by the system and commits funds at the time it
is raised by the system. The Goods Receipt Note (GRN) and invoice are recorded on receipt
and the payment order is produced directly by the system against the line ministry bank
account at a commercial bank. The core functionality of the central system is shown in the
figure below.

31
Figure 4.5. Malawi FMIS. Core Functional Processes and Information Flows
Source: IEG.
4.48 Procurement. The operation set out to build institutional, organizational, and human
capacity in public procurement to improve expenditure management. The ODPP was
connected to the GWAN, and a website was developed to improve information flows
between the ODPP and procuring entities. This would increase transparency and reduce
prices through increased exposure to competition. In 2009 the ODPP was named the most
transparent government body in Malawi by the Media Institute of Southern Africa. At the
time of evaluation however the website was down and had reportedly been so for the past
two years, which represents a shortage of funds and erratic cash flow were given as reasons.
The reported upkeep of the site is around US$1,000 per month, and the loss to the
government in terms of uncompetitive prices level is likely to outweigh this cost by orders of
magnitude. Advertising in spending agencies and newspapers is likely to reach fewer people
and thus make the process less competitive. Furthermore, newspaper advertisements tend to
be expensive. No data was provided to the evaluation team on prices level for similar goods
before and after the website stopped operating.
4.49 The ODPP trained 455 staff in public procurement principles and procedures,
exceeding the target of 360. These were drawn from various MDAs most of whom served in
the Specialized Procurement Units or the Internal Procurement Committees. In addition, with
funding from the project, 20 staff of the PDOO completed an MA in procurement
administration and another 50 received a certificate or diploma from the Malawi Chartered
Institute of Procurement and Supply.40 Furthermore, the ODPP facilitated an arrangement
40 The Malawi Institute of Procurement and Supply was launched in 2009, and is the body responsible for the promotion and
regulation of the procurement profession.

32
between the University of Bolton in the United Kingdom and the Malawi Institute of
Management to locally offer a master’s degree in supply chain management. An additional
20 staff were sponsored to attend this course, which is currently offered on a commercial
basis and well subscribed.
Outcomes
4.50 Expenditure management, as defined by the processes governing budget execution,
has improved due to a relatively successful implementation of the FMIS, though challenges
remain. All transactions related to the government budget at the HQ and regional centers are
reportedly processed through the FMIS system. This was confirmed by various Directors of
Finance interviewed, including those from the Office of the Cabinet, the Department of
Human Resources, and the Ministry of Health. These departments were able to produce a
budget execution report in real time that gave budgeted amounts, the revised budget, the
funds released, the commitments and the expenditures to date by line item for all cost centers
reporting to them. Samples of these are provided in Appendix G.
4.51 The FMIS was found to have managerial value for spending agencies. At the Ministry
of Health for example it was noted that the system allowed them to understand their resource
envelope, plan accordingly, monitor cash flow, and strategically prioritize. It also allowed
them to track program costs accurately. Furthermore, the system enabled the ministry to
determine which outputs could not be delivered due to insufficient funding. This is
noteworthy, as the FMIS is perceived by program managers as more than merely an
accounting tool, as it allows them to better manage their day-to-day activities. The mission
obtained sample copies of these reports for the ministry of health and other line ministries,
which are also attached in Appendix G.
4.52 The systems users expressed their general satisfaction with the system, but stated that
increased transaction frequency and the limited capacity of the servers have increased the
processing time of the transactions. It has also reduced transaction throughput and increased
the time for producing reports from the system. An upgrade to the system with improved
functionality and capacity is currently available on the market, which would make a
significant difference to system performance.
4.53 However, while donors do keep holding accounts with the central bank, and spending
units access these from commercial bank accounts run on a zero balance basis, these are not
channeled through FMIS. This would be possible, while continuing to ring-fence donor
finance project funding, without changing financing modality to budget support.41 Not using
the FMIS is problematic as transaction coverage is therefore not fully comprehensive, and
undermines the effectiveness of the system as a tool for budget management and execution.
This is especially problematic for sectors that receive a large amount of off-FMIS funds that
finance recurrent expenditures, such as health. Further, these potentially increase the risk of
41 In Zambia, even though donors are not using zero balance accounts linked to holding accounts in the central bank,
transactions to donor funding accounts are channeled through the FMIS by defining these accounts in the FMIS. This has the
advantage that the overall expenditure reports will be inclusive of donor finance projects and thus give a more
comprehensive picture of public expenditures.

33
arrears being accumulated and misappropriation of funds. The IMF (2013) recognizes this as
an issue and provides specific recommendations on how to fill the gaps in coverage.
4.54 At the district level Serenic Navigator is used as the FMIS platform for budget
execution, which is different from EPICOR at central and regional levels. The operation
supported the launch of the local government FMIS in six pilot sites through training and the
provision of equipment such as computers and servers. District reports are being collected,
compiled, and uploaded into the central FMIS on a quarterly basis. Issues still remain related
to the interface and transfer of data to the Central system. The PEFA 2011 reports that “The
FMIS at central level is integrated with itself but not with the FMIS at local level.” In
addition, some line ministries such as the Ministry of Education expressed concern regarding
the use of block grants. Reportedly, funds designated for a district are channeled through the
DC, who can prioritize if budgets fall short of plans. This has caused some discontent among
sector ministries that are now pushing for removing the funding from the ambit of the
Ministry of Local Government. They would prefer an independent mechanisms for the sector
department to manage these funds directly at the district level.
4.55 Despite the roll out of FMIS and commitment controls, payment arrears have
accumulated and continue to undermine the effective use of public expenditures. This has
been discussed in more detail above (see section 4, original objective 1). Effective
implementation of a commitment control system requires more than just a functioning FMIS.
It requires the commitment on part of MOF to enforce provisions of the legal framework and
complementary changes in the processes of budget releases, execution of commitments with
longer lead-in times, timely and accurate reporting of commitments against budget
appropriations and budget releases. These issues were addressed in an IMF technical
assistance reports that provided practical guidance on the establishment of an effective
commitment control system.
4.56 The PEFA assessment recognizes that expenditure commitment controls are in place
and could be relatively effective and comprehensive. However, it is also evident that there
appears a general lack of and declining compliance with rules (see table 4.7).
Table 4.7. PEFA Assessment on Effectiveness of Internal Controls
PI-20 Internal controls for non-salary expenditure 2006 2008 2011
(i) Effectiveness of expenditure commitment controls B B B
(ii) Comprehensiveness, relevance and understanding of other
internal control rules/procedures B C B
(iii) Degree of compliance with rules for processing and
recording transactions B C C
Source: PEFA (2006), PEFA (2008), and PEFA (2011).
4.57 Regarding procurement, the ICR notes that monitoring of the implementation of the
Public Procurement Act has been satisfactory, and that quarterly procurement monitoring
reports are received from all public procurement entities. The Public Procurement Act

34
became effective shortly after project inception when monitoring of implementation was
sporadic.
4.58 The PEFA assessment at project end however rated public procurement poorly. An
overall score of D+ is driven by the absence of reliable data for use of competitive
procurement methods, poor public access to complete, reliable, and timely procurement
information, and the lack of a provision to publish procurement plans and data on resolution
of procurement complaints (see table 4.8). Progress in value for money and controls in
procurement has been limited.42 Poor performance is attributed to the lack of reliable data,
poor procurement planning and record keeping, and procurement committees not having the
skill to prepare specifications and bid evaluations. Insufficient political capital was invested
to make inroads in this field. A series of policy lending operations missed the opportunity to
provide complimentary support.
Table 4.8. PEFA Assessment of Procurement in 2011
PI-19 Competition, value for money,
and controls in procurement
2011
Score
Explanation
(i) Transparency, comprehensiveness
and competition in the legal and
regulatory framework
C The legal and regulatory framework for
procurement is organized hierarchically with
precedence clearly established. There is no
provision to publish procurement plans and data
on resolution of procurement complaints
(ii) Use of competitive procurement
methods
D Reliable data is not available
(iii) Public access to complete, reliable
and timely procurement information
D The government lacks a system to generate
substantial and reliable coverage of key
procurement information and does not
systematically make key procurement
information available to the public
(iv) Existence of an independent
system
B The Procurement Review Committee consists of
experienced professionals and exercises the
authority to suspend the procurement process
and issue binding decisions
Source: PEFA (2011).
4.59 The CPIA score on public financial management gives a picture that’s generally on
par with the regional average, except for 2013 when the Cashgate scandal surfaced.
However, during the last ten years there has been not been any notable progress, despite the
set-up and use of a functioning and comprehensive FMIS (World Bank CPIA Database)
4.1 Overall improved public expenditure management is rated Modest. This reflects
progress made in rolling out and implementing the financial management system, and
building and retaining capacity across the civil service in financial management. However,
42 PEFA assessments for the quality of procurement in 2006 and 2008 are available, but has been omitted due to changes in
methodology. Further, the assessment predates the breakdown of the web portal, which would have negatively consequences
on the ratings.

35
considerable challenges persist with the internal control environment, use of the systems, and
willingness to abide by formal processes that have led to the accumulation of considerable
arrears. Further, progress in procurement continues to lag.
Efficiency
4.2 Efficiency is rated Modest. While some positive returns can be expected from
improvements in public financial management, a functioning HRMIS system, capacity
enhancement of staff, and efficiency gains from the closure of foreign missions, the project
suffered from significant efficiency shortcomings.
4.3 The change in FMIS provider is a source of inefficiency in use of project resources.
Substantial resources were spent on extensive customization of the CODA platform and
FMIS system upgrades, including consultancies for functionality enhancements, capacity
building, and piloting in key ministries. These efforts, capacity, and financial investments
were lost when the government decided to buy another software instead.43
4.4 The per-user cost of the system that is currently in place is an outlier and higher than
that of peer countries. Comparing the per user cost of ten countries with commercial off the
shelf (COTS) packages, including implementation services, WAN/LAN networking and
training, Hashim (2014) finds that the average implementation cost to be at about
US$15,000. Malawi’s system is an outlier at US$14.7 million for 800 users, which makes for
US$18,375 per user. Figure 8 puts Malawi’s system with and without the sunk cost of CODA
investments on a scatter plot with similar countries for comparison. This excludes the costs
of the GLOBE HRMIS, which was not available to the team. It should be noted that much of
this, however was not financed by the Bank directly.
4.5 An implementation competitive bidding (ICB) process at the stage of appraisal would
have been more appropriate. It would have invited more offers, put pressure on pricing of the
suppliers, invited the second generation systems, and ultimately retained a better Bank -
Client relationship. However, sole-sourcing may have also sped up the implementation
process due to bypassing cumbersome and lengthy Bank procurement requirements that are
not always best-suited to large IT investments (IEG 2013).
4.6 Different packages for the HRMIS and FMIS were chosen. While the GLOBE
HRMIS is currently performing well, as an EPICOR module it would likely have been
cheaper and easier to manage than as a separate stand-alone system. Furthermore, it also
means that opportunities for integration between the financial and human resources (HR)
modules were lost.
43 The assessment acknowledges that some investments in CODA customization were prior to the operation and can thus be
considered a sunk cost.

36
Figure 4.6. FMIS Implementation Cost Plotted Against Number of Users
Source: Hashim (2014) and authors calculations.
4.7 While there were no financial irregularities with project finances per se, the operation
did not preempt a major corruption scandal, when in 2013 the state was defrauded of about
US$32 million – about 0.75 percent of Malawi’s annual GDP. It is thus doubtful that the
objective of increased accountable use of public finances and investments into accountability
institutions translated into net positive returns.
4.8 There have been operational inefficiencies that resulted in project delays,
restructuring, and various extensions of the closing date. In particular it was noted that there
were significant procurement delays in the first 18 months of the project mainly due to the
absence procurement specialist in the Project Implementation Unit (PIU), inadequate
knowledge of World Bank procurement procedures by the beneficiary agencies, and slow
follow up on processing no-objection requests from the FIMTAP Secretariat. While a
decision to restructure was already taken in November 2004, actual restructuring only came
into effect in July 2006, 18 months after initiating the process, inflicting additional
inefficiencies as the restructured project couldn’t go ahead until finalized.
4.9 The operation suffered from high administrative costs that were not proportional to
project size. Actual operational cost was US$4.27 million44 (15 percent of total cost) and thus
44 This may have been underreported. The second restructuring document prepared a few months prior to project closure
projected operational expenses of about US$6.0 million. It is unclear what caused the discrepancy.
Vietnam
Kazakhstan
Pakistan
Indonesia
Moldova
KyrgyzMaldives Albania
Mongolia
Azerbaijan
0
10
20
30
40
50
60
0 1000 2000 3000 4000 5000 6000
Imp
lem
en
tati
on
Co
sts
-$
mill
ion
s
Number of Users ( COTS licenses)

37
significantly higher than projected. The PAD planned for only US$2.2 million or 8 percent of
total project cost.
Finally, while TA operations do not typically lend themselves to IRR calculations, the
evidence provided above suggests that poor implementation and use of systems has resulted
in significant foregone benefits. This in turn impacts and reduces the efficiency of the
project.
Ratings
4.10 As the operation’s objectives were formally revised, the assessment of the outcome
reflects achievement under the original objectives and the revised objectives. The weighting
of results is by the percent disbursed before and after restructuring, which is 25:75
respectively.
4.11 Relevance of objectives before and after restructuring were respectively high and
substantial reflecting close alignment to country needs, and Bank and government strategies
throughout implementation (and to present day). On the downside, accountability was vital,
but dropped at restructuring. Relevance of design was rated substantial before and after
restructuring reflecting a well sequenced, complementary, and realistic approach, despite
shortcomings in the choice of FMIS provider, and some complexity. The results chain was by
and large credible, with activities feeding into expected outcomes. The results frameworks
however, were relatively weak.
4.12 Efficacy was Modest prior to restructuring, reflecting modest progress in improving
the effective use of public expenditures, and negligible progress in strengthening the
government’s accountability functions. At restructuring, objectives became more process
oriented, with a more direct and clear link to project inputs. Civil service management
benefitted from investments in HRMIS, performance management, and capacity building
activities and was rated substantial, despite a rapidly growing wage bill and loopholes in the
internal control environment, which pose significant risks and undermine the effectiveness of
the system. Improvements in public expenditure management was rated Modest. Although an
FMIS was set up and significant capacity was built, large arrears were built up reflecting
inadequate use of the systems, a poor internal control environment and often disregard for
financial management processes in place. Further, progress in procurement reform was slow.
4.13 Efficiency is rated Modest given the high per-user cost of the FMIS, project resources
employed on a system that was later abandoned, and various delays in implementation.
Furthermore, operating costs were high and there were foregone benefits due to poor
implementation of systems and procedures developed under the project.
4.14 Substantial relevance, modest efficacy, and modest efficiency result in an overall
rating of Moderately Unsatisfactory.

38
Risk to Development Outcome
4.15 Risk to Development Outcome is rated High. There is a considerable push for
changing the FMIS platform, which may challenge some of the hard won gains of FMIS
systems implementation.45 Other risks include a lacking control environment in the public
finance system, the potential to introduce ghost workers, and an inadequate auditing system.
4.16 Changing the FMIS platform. After the cashgate scandal the responsibility for the
fraud has partly been directed at the capacity of the software to adequately provide
appropriate safeguards. There has since been increasing pressure to go back to the drawing
board and procure a new system entirely. As of writing, the government has decided to use
the developed systems specifications for a new international competitive bidding process for
a new application software. If the bidding process results in a decision to change the
application software platform yet again, this carries high risks:
Bringing the FMIS system up to its current performance level could take 3-4 years
(the time required to procure the application software through the ICB would take
about 12-18 months; it would take another 9-12 months to parametrize it for GoM
requirements and test its functionality; and another 12-18 months to roll it out to all
sites and make them operational). This will depend on the choice of provider, but the
above estimate is optimistic and could be longer if a sophisticated application
software packages with multiple modules is chosen.
Once the new system is operational, there is no guarantee of it functioning at its
current level within a short time period. In fact, significant investments in human
capacity would have to be made. Much of the expertise accumulated over the years in
the use of the existing FMIS platform would be lost and a whole new set of technical
skills will need to be developed.
During the transitional period, the focus will be diverted to the change in the software
platform rather than the overall control environment in which the software is to
operate, which is critical. Given the government’s position on blaming the system
rather than the lack of enabling environment this risk is particularly eminent.46
Similarly, in the interim period the current FMIS system would be viewed as only a
temporary system to be eventually replaced. Critical upgrades required to improve its
performance may thus not be carried out for the next five years exposing the public
financial management system in the short run.
4.17 Payment arrears are undermining the effective use of public expenditures. The
wider roll-out of FMIS should have made the accumulation of payment arrears less likely.
However, in practice Malawi has accumulated a large stock of payment arrears over the years
that is not reported, monitored, and managed by the government in an effective and
transparent manner. Risk factors that continue to make the system prone to arrears
accumulation include: (i) FMIS functionality for commitment planning that is meant to
45 Following discussions with the Bank, IEG received assurances that the current system is no longer fit for purpose, and that
replacement system would be no more costly than the upgrade of the current. IEG was noted this, but was unable to verify
this independently.
46 The FROIP follow up operation has recognized this risk at MTR and taken mitigating measures.

39
record and manage appropriation, and funding limit at line item level is not being used.
MDAs maintain an off-FMIS registry and upload funding limits on an as-needed basis; (ii)
MDAs generate Local Purchasing Orders (LPOs) and payment vouchers simultaneously,
using pro-forma invoices despite directives to the contrary; (iii) development expenditure
where release is based on submission of certified work invoices, LPOs are processed only
after work/service has been delivered and certified; (iv) direct payments are made through
instructions issued by the Secretary of the Treasury to the Reserve Bank of Malawi bypassing
FMIS and the central payment office; (v) commitments are regularly processed outside the
system through issue of manual LPOs as vendors ignore the mandatory requirement of an
FMIS generated LPO; (vi) multi-year commitments are poorly monitored or controlled; and,
(vii) budget execution reports submitted by MDAs that record the release, commitments and
expenditure against the budget appropriation are FMIS generated and do not include the
LPOs processed manually outside the system.
4.18 The HRMIS has become an essential tool for the functional processes related to the
management of the civil service. This module has been centrally implemented at DHRMD.
An establishment control module is in place, with adjustments only possible by authorized
officers within the department. However, it remains possible to introduce ghost workers
through to the inclusion of employees on the payroll from other cost centers over which
controlling officers do not have oversight. Furthermore, there is a failure to validate payroll
events, as a result of which unauthorized changes can be introduced. A recent audit (GOM
2015) also noted that payroll transactions are insufficiently monitored and reconciled and that
the interface between the payroll and other related systems remains manual leaving room for
mishandling and error. Internal controls for human resource management are in place but
risks remain that can undermine the system if left unaddressed.
4.19 The external audit function is substantially undermined by the failure of the
Accountant General Office to complete the annual accounts and financial statements within
the statutory period after the end of year (4 months) and forward to the NAO. Further the
NAO is insufficiently independent and continues to report to the Ministry of Finance. This is
a fundamental flaw in the institutional set up of the accountability chain, which compromises
the integrity of its oversight function.
4.20 Lastly, while the government has by and large been able to retain civil servants
trained under the program, low levels of civil service remuneration makes this increasingly
difficult.
5. Bank Performance
5.1 Bank Performance is rated Moderately Unsatisfactory reflecting the limitations with
Quality at Entry and shortcomings in supervision, especially prior to restructuring. In
particular the project was lacking some of the basic effectiveness conditions, and the team
provided questionable technical advice. Supervision in the early years suffered from lack of
candor, and high TTL turnover. Restructuring was appropriate and made the operation more
streamlined and realistic. Supervision and engagement with the government and other donors
improved. The Bank became more responsive, and addressed prior implementation
bottlenecks such as procurement support and expedited “no objection” letters. However

40
important problems remained throughout implementation such as a lacking M&E framework
and insufficient attention being paid to mitigation of risks that materialized after the project
closed. The quality of the ICR was also deficient which limits its potential as a learning
instrument.
Quality at Entry
5.2 At appraisal, the project objective was consistent with the Bank’s CAS and the
government priorities, and met the critical needs of the financial management sector. The
Bank's contribution to the formulation and design of FIMTAP drew on lessons from its past
involvement with institutional reforms in Malawi, international experience on budgetary
reforms (including FMIS implementation), as well as the prevailing thinking on strategic
sequencing of MTEF in the context of improved expenditure management, as discussed in
the 2001 PER. Further, including capacity development modules and an accountability focus
is in line with international good practice considerations. Together, this contributed to a
relevant, confined and adequately focused project design.
5.3 However, the Bank should have considered the adoption of a second generation FMIS
package that were already available at the time. With hindsight recommending an ICB
instead of further customizing an outdated system may have been the better option.
Furthermore, the results framework, indicators, and targets were lacking. Also, the
procurement capacity of the Bank at entry was weak that subsequently led to various delays.
Lastly, given the adverse political conditions at project inception and little reform
momentum, the Bank may have benefitted from delaying engagement until after elections
were over.
5.4 Quality at entry at restructuring improved. More experienced Bank staff were made
available to the team, procurement and M&E specialists participated in design and facilitated
quick implementation, and project design became more streamlined taking into consideration
activities from other donors in governance and accountability.47 In particular the Bank
actively coordinated with the MCC and UNDP with regards to the set-up of the FMIS and
GWAN. On the downside the project became more fragmented and complex with new
components that were only moderately relevant such as retrenchment of civil servants and
rationalizing of foreign missions.
5.5 In light of these factors, the overall quality at entry is rated Moderately
Unsatisfactory.
Quality at Supervision
5.6 Quality of Supervision was unsatisfactory, prior to restructuring. A QAG report noted
that:
47 This includes: DfID, CIDA, the EC, and the MCC for capacity building for Parliamentary committees; MCC for capacity
building for FMIS, ODPP, NAO, MOF, and the Malawi Revenue Authority; EC for PEM and budget related projects,
including support for the CIA Unit and the NAO; and UNDP for support of the ODPP and the GWAN.

41
“The quality of project supervision was a matter of concern. A Procurement issue
(recruitment of a procurement specialist) is now affecting project procurement and
causing implementation delays. The procurement specialist has yet to be recruited.
The panel does not understand the reasons that led the Bank to declare the credit
effective when a key effectiveness condition (the recruitment of a procurement
specialist) had not been met. This was in particular the case for GWAN roll out.
There was a lack of candor in reporting problems and is surprised to note that until
December 2004 the project IP as well as DO were rated satisfactory. The panel
wonders whether the Bank can effectively supervise this project given its complexity
and poor preparation.
Donor coordination appeared to have been lacking. This appears to have resulted in
significant duplication of effort among donors.
There was a high TTL turnover during the short implementation life of this project.”
5.7 High turn-over of TTLs during the first three years of the project created a lack of
continuity and ownership, thus disrupting the implementation. In addition, some staff were
lacking operational experience, which made the restructuring process difficult.
5.8 The Bank advocated continuing with the original FMIS platform despite visible
disengagement of the client. Eventually the Bank lost the client and thus its ability to
effectively contribute to the FMIS reform process.
5.9 Recruitment of a procurement officer was an effectiveness condition that was
certified as met by the team but the person recruited was not brought on board or did not stay
very long (documentation is unclear). Furthermore, given that this function was important
enough to be an effectiveness condition and a permanent legal covenant, the Bank team
should have proactively ensured that it was filled if necessary through temporary measures.
5.10 The operation was appropriately restructured, and objectives became more cohesive,
realistic, better aligned with project activities, and brought more clarity in its results
framework. However, the revised project design missed opportunities. Project design became
more complex, and the results framework still lacking adequate indicators, baselines, and
targets. Furthermore, the MTR was likely programmed too late, with little bearings on project
performance as it was close to project closure. Nevertheless after restructuring supervision
improved, and the Bank team provided adequate supervision resources and worked more
closely with GOM to support the restructure implementation. While “no objection” letters
were a major bottleneck prior to restructuring this process was expedited and generally
provided within a week. Furthermore, the then field-based TTL provided implementation
support to the revised components and those which continued to underperform. The Senior
Procurement Specialist provided targeted support through technical advice to the ODPP
subcomponent. Coordination with donors was pursued more actively and activities
streamlined. While some parallels were drawn to the Banks’s policy operation engagement
such as in accountability, this was missing in other areas. Most notably procurement reform
would have benefitted from being covered by both instruments. Similarly, insufficient
attention was paid to identifying and mitigating risks to outcomes, which subsequently
materialized. Supervision after restructuring is rated Moderately Satisfactory with
reservations.

42
5.11 Overall supervision is rated Moderately Unsatisfactory reflecting unsatisfactory
supervision at entry and Moderately Satisfactory supervision at restructuring.
6. Borrower Performance
6.1 Borrower performance suffered from insufficient government commitment at project
inception, and weak support during project implementation. Further, the government did not
recognize the weak internal control environment and instead blamed technical systems issues
for the breakdown of the accountability chain. This resulted in high risks going forward in
addition to those that have already materialized. At restructuring, government and
implementing agency performance improved however, providing the necessary political
capital and administrative support for more effective implementation. On balance, borrower
performance is rated Moderately Unsatisfactory.
Government Performance
6.2 The government was initially lacking commitment to the project design as elections
were approaching. There was a lack of frank dialogue and strong support and engagement by
the GOM contributed to the original project's poor design and quality at entry. Once
FIMTAP became effective, the FIMTAP Secretariat did not get the support from high
government officials to move forward with implementation, and counterpart financing was
not provided. Weak support created problems in staffing the project, including the
recruitment of staff for procurement and M&E, which took place only after the project was
restructured. Furthermore, the restructuring of FIMTAP was delayed in part due to
government indecision on its scope and late inclusion of new components. However,
fundamentally the government rightly identified the need for a second generation FMIS
platform, even if the decision to sole-source it may have led to uncompetitive prices.
6.3 After restructuring, government performance improved. This may in part be due to
the revised components that were less politically contentious. Especially core audit
components (e.g. parliamentary oversight and external audit) were replaced with more
administrative accountability functions such as internal audits. However, these were in part
picked up by other donors,48 and the Bank engaged through development policy operations
instead. Also, a lot of funding was redirected for capacity building, which may have
generated more political good will.
6.4 While the cashgate scandal happened after the project closed, the government has
tended to blame FMIS failure for the breakdown in the accountability chain despite various
reports indicating that it was rather the lack of an enabling environment. This constitutes the
materialization of a significant risk, and may detract from the core issues in the reform
program going forward.
6.5 On balance, government performance is rated Moderately Unsatisfactory.
48 See section 3.

43
Implementing Agency Performance
6.6 The implementing agencies were the FIMTAP Secretariat and the subcomponent
units in the various ministries. Prior to restructuring there were significant problems, which
were described in the preceding sections. These include poor M&E and procurement, various
delays, poor communication with other donors resulting in the duplication of activities, and
an inadequate communication with the Bank.
6.7 However, following restructuring there was a substantial improvement of the
implementing agency performance in executing the project. Performance improved in key
areas of procurement, M&E and financial management. The project maintained an adequate
financial management system, monitored its budget regularly, with internal control
arrangements that ensured the integrity of the accounting system and the information it
generated. The quality of external audit, of financial monitoring and of the required quarterly
and annual reports was reportedly adequate and produced in a timely manner.
6.8 The FIMTAP Secretariat was ineffective prior to restructuring. It lacked a
procurement specialist, was unfamiliar with Bank processes, and monitoring and supervision
was superficial. After restructuring performance improved. The Steering Committee met
quarterly with the participation of Principal Secretaries for each component or subcomponent
as appropriate. The Technical Committee met on a monthly base after restructuring to discuss
operational issues.
6.9 Given the progress that had been made after restructuring Implementing Agency is
rated Moderately Satisfactory.
7. Monitoring and Evaluation
7.1 M&E design. The M&E framework in the PAD was lacking. Indicators reflected
mostly components outputs and were not outcome oriented. Indicators were insufficiently
specific and often not measurable. As a result targets were either not provided, unclear, and /
or difficult to quantify and monitor. Baseline data were generally unavailable. To give
examples: it is unclear from the M&E framework, which indicator would monitor progress
against the effective use of public resources. Some provisions were made to track
improvement in the accountability institutions (e.g. external audit reports; internal audit
controls) these were process oriented and are neglecting entirely corruption perception or
actual misuse of funds. Given the time span of the project, indicators should have been more
outcome oriented. Furthermore indicators were vague. For example requiring “external audit
reports are completed on time” says little about the quality of the reports, and nothing on
what “on time” constitutes. Similarly to “train a sufficient number of civil servants to
maintain improvements and reforms made in expenditure management” is overly vague and
cannot adequately capture progress in capacity building. Furthermore, there was no M&E
specialist at entry, despite it being an explicit project effectiveness condition.
7.2 At restructuring M&E design was improved, and indicators become more specific,
measurable, and contained more meaningful baselines and targets. The new design also
introduced annual work plans, which were incorporated into quarterly reports. However

44
some shortcomings remained: There were no indicators to adequately measure improved
public expenditure management. Providing inputs to the budget development process based
on strategic plans in coordination with the MTEF is merely an input –especially if it is not
reflected in the final budget. Especially in an environment of lacking internal controls this is
an insufficient proxy for improved allocation of resources. Further, there remains ambiguity
regarding how use of public resources were to be measured, its baseline, and how
improvements were to be tracked. It is unclear why the operation did not rely on PEFA
indicators to measure progress, especially since an assessment had been conducted shortly
before restructuring.
7.3 M&E implementation was minimal prior to restructuring. Thereafter an M&E
Specialist was added to the project team which made a significant difference. An Annual
M&E plan was produced and provided to the Bank for review and approval. Quarterly M&E
reports were produced, detailing component and subcomponent performance against agreed
annual work plans. Plans were revised at the end of each quarter to reflect actual
performance. In case of disconnect between the agreed work plan and actual undertakings,
the M&E Specialist and the Project Manager met with the relevant subcomponent manager to
discuss how to address the apparent performance deficit. Further, the PETS and expenditure
tracer studies were important complements to M&E implementation – even if the former
does not appeared to have been made widely available.
7.4 On the downside, shortcomings in the M&E framework should have been apparent
and resulted in improvement of indicators. This did not occur.
7.5 M&E Utilization. In addition, data collected from quarterly M&E reports were
evaluated and used for decision making on the use of project resources, for instance the
reallocation of funds between components and sub-components. The quarterly M&E reports
were also the basis for allocating funds to high performing sub-components from the
performance incentive facility. On the downside, there is no evidence that PETS were
actively used to improve the allocation of public expenditures and service delivery.
7.6 While the M&E framework was lacking at project entry, the design and
implementation and use improved after restructuring. The overall quality of M&E is rated
modest.
8. Lessons
PFM reform, including FMIS design and implementation:
8.1 A functioning FMIS is necessary but not sufficient to achieve good public
financial management. To be effective there must be clear commitment from the Ministry
of Finance that all transactions are routed through the system, such that all expenditures are
subject to the FMIS automated, ex ante, internal controls. Practically, this means that no
payment instructions (cheques/vouchers) issued outside of the system should be honored.
Significant political capital is needed to overcome resistance from people who may have
vested interests. The breakdown of the accountability chain that led to a major corruption
episode was chiefly because of a disregard of existing systems and processes rather than a

45
technical failure of the FMIS. This should be treated as such. A focus on changing the FMIS
platform may detract from the real underlying issues instead.
8.2 Changing FMIS platforms carries substantial risks. It is costly, time consuming,
there is no guarantee of eventual functionality and fit, human capacity will be lost and needs
to be rebuilt, and during the transitional period the reform focus will be on technical issues
rather than underlying PFM environment. In light of this, the problems with the existing
FMIS provider should be thoroughly diagnosed, and all options considered including
upgrades of the existing system. The decision on the way forward should be based on what
system can best fit the country needs with minimum disruption, local capacity considerations,
and competitive pricing. The Malawi experience of switching systems in the early 2000s
should critically inform the current FMIS reform dialogue.
8.3 For FMIS to be effective it should be comprehensive of all government
expenditures and operate in an environment of no idle balances. In Malawi FMIS
benefited from a rapid roll out to line ministries and regions with most expenditures being
channeled through the system. Further, FMIS implementation benefited from parallel TSA
reform, which pertains to the reach and effectiveness of the system. It is important to channel
donor funds through the FMIS, which is possible whilst retaining their own accounting
mechanisms and fiduciary safeguards.
8.4 Having a single systems platform for all levels of government is preferable for
system integration and efficiency. In Malawi, systems were fragmented across levels of
government and HR transactions, which was inefficient and diluted already weak
implementation capacity.
8.5 Recurrent investments in both software and hardware are required to keep
FMIS fully functional, safe, and up to date. The lack of adequate maintenance in Malawi
led to a deterioration of the system, with long out dated software, insufficient capacity to
manage the transaction requirements, and exposing the system to various security risks. This
alienated stakeholders and led to mistrust of the system.
8.6 Significant political ownership is needed to embark on expenditure management
reform. In Malawi the expenditure management and FMIS reform program only gathered
momentum after a change in government and the procurement of a system that had the full
confidence of the Accountant General and Minister of Finance.
Sequencing:
8.7 It is important to take advantage of synergy and linkages between parallel TA
and policy reform operations. There is a need to closely integrate TA through investment
lending with parallel policy actions through development policy lending. Even though the
DPOs appear to have mentioned such a link as part of the design described in Program
Documents, this is not mentioned in the project documents, notably the ICR – a shortcoming
also noted in the case of other PFM operation reviewed by IEG. This undermines an
important learning opportunity though better understanding of how policy reform may
leverage and accelerate actions prepared through TA.

46
8.8 Oversight agencies function best when they are both capable and independent.
In Malawi poor capacity and the lack of legal, administrative, and financial independence of
the oversight agencies hinder their effectiveness. The reinforcement of PFM governance
systems however was dropped once it became apparent that there was resistance to the
establishment of independent oversight agencies. It should be recognized however that
capable agencies, even when not fully independent, can fulfill an important role.
8.9 M&E, complemented by periodic complementary assessments strengthens
project implementation. Project implementation should be based on a needs assessment,
prioritized and derived from a sound M&E framework. Tracer studies should be an integral
part of the M&E framework to assess effectiveness of the program and justify continued
investment in capacity building. In Malawi a tracer study was able to show that most trained
staff remained in the civil service in either an equal or superior capacity.
Implementation:
8.10 Frequent changes in the Bank team is counterproductive. The adverse effect of a
change in government functionaries which often happens in many countries is compounded
when the Bank team’s composition also changes simultaneously, as was the case during the
first two years of the Malawi project where 5 TTLs were changed over a short period of time
– which probably could and should have been avoided. It has been observed in several Bank
projects that when some key members of the Bank team who were involved in the design of a
project continue on the team during implementation, this contributes significantly to a
successful implementation of the FMIS and achievement of project development objectives
(World Bank 2014).
8.11 Effective project implementation requires good procurement capacity.
Effectiveness conditions and permanent covenants that were deemed essential at appraisal
were ignored. As a consequence the quality at entry and readiness of implementation in the
project suffered from significant procurement delays in large part because the PIU
Procurement Specialist had not been hired and there was inadequate knowledge of World
Bank procurement procedures by the beneficiary agencies. This deficiency could be
mitigated by seeking assistance from other projects that are already successfully
implementing.
8.12 Some degree of complexity may be warranted under PFM projects as long as
various components reinforce one-another. This review concludes that even though initial
project design was relatively complex this was justified by the need to achieve a critical mass
of activities that would yield high development impact, giving the opportunity to experiment
with different approaches.

47
References
Andrews, Matt. 2010. “How Far Have Public Financial Management Reforms Come in Africa?” Faculty
Research Working Paper Series RWP10 – 018, Harvard Kennedy School, Cambridge, MA.
Booth, David, Diaa Cammack, Jane Harrigan, Edge Kanyongolo, Mike Mataure, and Naomi Ngwira. 2006.
“Drivers of Change and Development in Malawi.” Working Paper 261, Overseas Development
Institute, London.
Civil Society Education Coalition (CSEC). 2013. “Down the Drain …: Findings of the 2011/2012 Public
Expenditure and Tracking Survey on Education Sector in Malawi.” Civil Society Education Coalition,
Malawi.
Durevall, D. and M. Erlandsson. 2005. “Public Finance Management Reform in Malawi.” Sida Country
Economic Report 2005:1, Sida, Stockholm, Sweden.
Fozzard, Adrian, and Chauncy Simwaka. 2002. “How, When, and Why does Poverty get Budget Priority.
Poverty Reduction Strategy and Public Expenditure in Malawi: Case Study 4.” Working Paper 166,
Overseas Development Institute, London.
Fölscher, Alta, Alex Mkandawire, and Ruth Faragher. 2012. “Evaluation of Public Financial Management
Reform in Malawi 2001 – 2010: Final Country Case Study Report.” Sida, Stockholm, Sweden.
Government of Malawi (GOM). 2004. “Consolidated Annual Appropriation Accounts for the Fiscal Year
Ending 30 June 2004, Statement 4 (a).” Ministry of Finance, Government of Malawi.
_____. 2008. “A Report on Evaluation of FIMTAP Sponsored Short Term Training Programmes Mounted
2007. Department of Human Resource Management and Development, Government of Malawi.
_____. 2009. “Financial Management, Transparency and Accountability Project. End of Project Report:
Summary of Main Activities: Capacity Building.” Department of Human Resource Management and
Development, Government of Malawi.
_____. 2013. “Report of Training Beneficiaries Tracer Study.” Department of Human Resource Management
and Development, Government of Malawi.
Hashim, Ali. 2014. A Handbook on Government Financial Management Systems. A Practitioners Guide for
Setting Reform Priorities, Systems Design and Implementation. Washington, DC: World Bank.
International Monetary Fund (IMF). 2013. Malawi: Strengthening the Public Finance Management Act and
upgrading the FMIS; Fiscal Affairs Department.
_____. 2014. Malawi Restoring Financial Control and Accountability. IMF Fiscal Affairs Department. Abdul
Khan, Suzanne Flynn, Guy Anderson, and Amitabh Tripathi.
Independent Evaluation Group (IEG). 2013. The World Bank Group and Public Procurement: An Independent
Evaluation. World Bank: Washington, DC.
Lawson, Andrew. 2012. Evaluation of Public Financial Management Reform: Burkina Faso, Ghana and
Malawi 2001-2010. Stockholm, Sweden: Sida.
National Audit Office of Malawi (NAO). 2014. “Report on Fraud and Mismanagement of Malawi Government
Finances” Baker Tilly Business Services Limited, London.
National Statistics Office (NSO) [Malawi]. 2005. Malawi Second Integrated Household Survey (IHS-2) 2004-
2005. Lilongwe, Malawi: National Statistics Office.
National Statistical Office (NSO) [Malawi] and ORC Macro. 2005. Malawi Demographic and Health Survey
2004. Calverton, Maryland: NSO and ORC Macro.
PEFA. 2005. Public Financial Management Assessment Based on the Public Expenditure and Financial
Accountability Framework. European Commission Delegation Malawi.

48
_____. 2006. Public Financial Management Assessment – Government of Malawi. Based on Public Expenditure
and Financial Accountability Framework. Government of Malawi.
_____. 2008. Public Financial Management Assessment Based on PEFA. European Commission Delegation
Malawi.
_____. 2011. Public Financial Management Assessment Based on PEFA. European Commission Delegation
Malawi.
QAG. 2008. Malawi Public Sector Governance Guidance Framework. Financial Management Transparency and
Accountability Project. Quality Enhancement Report. World Bank. Quality Assurance Group.
Rakner, L., L. Mukubwu, et al. 2004. “The budget as theatre – the formal and informal institutional makings of
the budget process in Malawi.” Bergen, CMI.
Renzio de, Paolo, Matt Andrews and Zac Mills. 2010. “Evaluation of Donor Support to Public Financial
Management (PFM) Reform in Developing Countries.” Analytical study of quantitative cross-country
evidence. London: Overseas Development Institute.
Simwaka, Chauncy 2006. “Malawi Lessons Learned from First Reforms Lead to New Approach.” OECD
Journal on Budgeting 6(2).
South African Institute of Internal Affairs. 2004. “Malawi and the African Peer Review Mechanism: A Review
of National Readiness and Recommendations for Participation.” South African Institute of Internal
Affairs, Johannesburg, South Africa.
WDI. 2015. “World Development Indicators.” Poverty and Equity Database. World Bank. Development
Research Group 2015.
WHS. 2003. “World Health Survey 2003.” Malawi.
World Bank. 2003. “Malawi Country Assistance Strategy.” Washington, DC.
_____. 2007. “Malawi Public Expenditure Review.” Report No 40145-MW. Washington, DC.
_____. 2008. “Joint Mid-Term Review Report for the Financial Management, Transparency, and Accountability
Project.” Washington, DC.
_____. 2010. “Implementation Completion and Results Report for the Financial Management, Transparency,
and Accountability Project.” Report no. ICR00001458. Washington, DC.
_____. 2012. “Joint IDA-IMF Advisory Note on the Second Malawi Growth and Development Strategy.”
Report No. 96134-MW. Washington, DC.
_____. 2013. “Malawi Public Expenditure Review.” Report No 79865-MW. Washington, DC.
_____. 2013b. “Beyond the Annual Budget. Global Experience with Medium Term Expenditure Frameworks.”
Washington, DC.
_____. 2015a. “Independent Review of Project Performance of the Public Finance and Economic Management
Reform Program.” Governance Global Practice, Africa Region.
_____. 2015b. “Malawi Economic Monitor. Managing Fiscal Pressures.” Malawi. Lilongwe.
_____. 2015c. “Malawi Economic Monitor. Adjusting in Turbulent Times.” Malawi. Lilongwe.

49
Appendix A. Basic Data Sheet
FINANCIAL MANAGEMENT, TRANSPARENCY, AND ACCOUNTABILITY PROJECT
(FIMTAP) (IDA-3734A, IDA-37340, TF 90947)
Key Project Data (amounts in US$ million)
Appraisal
estimate
Actual or
current estimate
Actual as % of
appraisal estimate
Total project costs 27.4 27.4 100.0
Loan amount 23.7 27.4 112.3
Cancellation 0.00 0.00 0.00
Cumulative Estimated and Actual Disbursements
FY03 FY04 FY05 FY06 FY07 FY08 FY09 FY10
Appraisal estimate (US$M) 0.5 8.9 14.2 18.8 22.0 23.8 23.7 23.7
Actual (US$M) 0.0 3.69 6.44 7.61 12.83 18.83 23.86 26.62
Actual as % of appraisal 0.0 41.5 45.4 40.5 58.3 79.5 100.7 112.3
Date of final disbursement: February, 2010
Project Dates
Original Actual
Initiating memorandum 03/21/2002 -
Negotiations 12/09/2002 12/09/2002
Board approval 12/20/2002 03/06/2003
Signing 04/15/2002 04/24/2003
Effectiveness 06/02/2003 06/02/2003
Closing date 03/01/2008 09/01/2009

APPENDIX A 50
Task Team Members
Names Title/Unit Responsibility/
Specialty
LENDING
R. Floyd Task Team Leader AFTPR
D. Mphande Financial Managemnt Specialist AFTQK
S. Dhingra Procurment Specialist AFTQK
J. Nyirendra Procurement Specialist AFTQK
R. Castro Project Management AFTPR
N. Dinkin Task Team Assistant AFTQK
D. Kianpour SR. E-Government, Specialist AFTQK IFMIS
D. Masone Operations Officer AFTQK M&E
SUPERVISION/ICR
R. Worthington Task Team leader AFTPR
S. Kofi Awanyo Sr. Procurement Specialist EAPPR
S. B Chenjerani Chirwa St. Procurement Specialist AFTPC
F. M. Chitalu Financial Management Specialist AFTFM
T. Gebreiyesus Lead Procurement Specialist SARPS
C. Kamwendo Operations Officer AFMMW
P. M. Kayuni Task Assistant AFMMW
F. Kanyerere Mkwandawire Financial Management Specialist AFTFM
D. H. Mphande Sr. Financial Management Specialist AFTFM
P. Palale Public Sector Management Specialist AFTPR
G. J. Alwyn Van Der Linde Lead Financial Management Specialist AFTFM
R. A. Yungu Sr. Public Sector Specialist AFTPR

51 APPENDIX A
Staff Inputs (staff weeks)
Stage of Project Cycle
Staff Time and Cost (Bank Budget Only)
No. of staff weeks USD Thousands (including travel
and consultant costs)
Lending
FY03 26 148.25
Total: 26 148.25
Supervision/ICR
FY03 5 24.31
FY04 35 170.02
FY05 35 151.75
FY06 41 161.43
FY07 46 218.10
FY08 31 144.90
FY09 22 0.00
Total: 215 870.51

52
Appendix B. Targeted Reforms by PFM cluster and PEFA
Achievements
This appendix provides an overview of the various reform areas by PFM cluster (see
Fölscher et al. (2012) for more details). At the end of each sub-section the scores of the
relevant PEFA dimensions are given as an indication for progress. Numerals are used to
allow averaging out across dimensions.49
Strategic Budgeting
Improved macro-fiscal forecasting capacity and coordination Improved domestic revenue
forecasting, modelling and capacity to undertake the modelling. Prepare implementation
plans for the MGDS in line with budget calendar
Table B.1 PEFA Scores in Strategic Budgeting
Dimensions 2006 2008 2011
PI-12 (i) Preparation of multi -year fiscal forecasts and functional allocations 2 4 2
PI-12 (ii) Scope and frequency of debt sustainability analysis 3 4 4
PI-12 (iii) Existence of sector strategies with multi-year costing of recurrent
and investment expenditure;
1 2 2
PI-12 (iv) Linkages between investment budgets and forward expenditure
estimates.
1 1 1
Average Score 1.8 2.8 2.3
Source: PEFA (2006), PEFA (2008), and PEFA (2011).
Budget Preparation
Budget Process: Develop and implement an automated budgeting module that can link to
FMIS; strengthened coordination of the budget process, improving the budget calendar;
Develop budgeting manual for central government; Rationalize budget planning and approval
processes linking national government and councils; harmonize Public Sector Investment
Plan and budget procedures. Budget Classification: Budget classification reform
implementing GFS2001 and output, activity and location coding; developing standard
administrative coding for the identification of projects and cost centers. Budget
Documentation: Disseminate Economic and Fiscal Policy Statements to Members of
Parliament; Output-based presentation of the budget, backed by budget preparation software;
Improve analysis in budget documentation of expenditure trends; ensure counterpart funding
reflected in Budget.
49 Numerical scores are applied to allow for averaging. The PEFA score “A” is given the highest value of “4,” and the PEFA
score “D” is given the lowest value of “1.”

53 APPENDIX B
Table B.2 PEFA Scores in Budget Preparation
Dimensions 2006 2008 2011
PI-11 (i) Existence of and adherence to a fixed budget calendar 2 2 2
PI-11 (ii) Clarity/comprehensiveness of and political involvement in the
guidance on the preparation of budget submissions (budget circular or
equivalent)
3 3 4
PI-11 (iii) Timely budget approval by the legislature or similarly mandated
body (within the last three years)
3 2 2
PI-5 (i) The classification system used for formulation, execution and reporting
of the central government's budget
3 3 4
PI-6 (i) Share of the listed information under PI-6 in the PFM PMF booklet in
the budget documentation most recently issued by the central government (in
order to count in the assessment, the full specification of the information
benchmark must be met)
3 3 4
PI-8 (i) Transparent and rules based systems in the horizontal allocation among
SN governments of unconditional and conditional transfers from central
government (both budgeted and actual allocations)
3 4 4
PI-8 (ii) Timeliness of reliable information to SN governments on their
allocations from central government for the coming year
2 3 2
PI-10 (i) Number of the above listed elements of public access to information
that is fulfilled (in order to count in the assessment, the full specification of the
information benchmark must be met)
3 2 2
D2 (i) Completeness and timeliness of budget estimates by donors for project
support
2 2 2
PI-27 (i) Scope of the legislature’s scrutiny NA 3 3
PI-27 (ii) Extent to which the legislature’s procedures are well-established and
respected
NA 3 2
PI-27 (iii) Adequacy of time for the legislature to provide a response to budget
proposals both the detailed estimates and, where applicable, for proposals on
macro-fiscal aggregates earlier in the budget preparation cycle (time allowed
in practice for all stages combined)
NA 3 1
PI-27 (iv) Rules for in-year amendments to the budget without ex-ante
approval by the legislature
NA 3 2
PI-11 (iii) Timely budget approval by the legislature or similarly mandated
body (within the last three years)
3 2 2
AVERAGE SCORE 2.7 2.7 2.6
Source: PEFA (2006), PEFA (2008), and PEFA (2011).
Resource Management
Revenue Administration and tax collection: Integrated tax administration; upgrade customs
systems; reduce compliance cost of tax system; introducing e-banking arrangements for large
tax payers and establishing a large tax payers unit; sector-based tax policies; monitoring of

APPENDIX B 54
revenue collection institutions. Cash management, debt management and guarantees:
development of a debt management strategy and domestic debt database and information
management system; incorporate debt repayment through FMIS; further improvement in cash
management including Implement automated system to provide more timely information to
the Reserve Bank, allowing them to better manage cash flow and strengthen the Credit
Ceiling Allocation System as a budget control mechanism. Procurement: new legislation and
development of regulations decentralizing procurement, institutional reform including the
establishment of an Office of the Director of Public Procurement, Independent Procurement
Committees and procurement units in all entities, implementation of new system and
capacity building; recentralization of aspects of procurement, including medical supplies,
vehicles and general government stores. Payroll controls: Regular reconciliation of wage bill
with personnel database; payroll audit, sanitation of the Human Resource Management
Information System (HRMIS) and follow-up; review of processes, procedures and policies
that affect payroll management and control; link the HRMIS to the FMIS.
Aid management: Development of a Development Assistance Strategy, donor database, Debt
and Aid Policy, Standard project naming and coding comparing PSIP, Debt & Aid & Budget
Division databases
Table B.3 PEFA Scores in Resource Management
PEFA Dimensions 2006 2008 2011
PI-13 (i) Clarity and comprehensiveness of tax liabilities 2 2 2
PI-13 (ii) Taxpayer access to information on tax liabilities and administrative
procedures 2 3 3
PI-13 (iii) Existence and functioning of a tax appeals mechanism 2 3 3
PI-14 (i) Controls in the taxpayer registration system 2 2 2
PI-14 (ii) Effectiveness of penalties for non-compliance with registration and
declaration obligations 2 3 2
PI-14 (iii) Planning and monitoring of tax audit and fraud investigation
programs 2 2 1
PI-15 (i) Collection ratio for gross tax arrears, being the percentage of tax
arrears at the beginning of a fiscal year, which was collected during that fiscal
year (average of the last two fiscal years)
1 2 NR
PI-15 (ii) Effectiveness of transfer of tax collections to the Treasury by the
revenue administration 1 4 3
PI-15 (iii) Frequency of complete accounts reconciliation between tax
assessments, collections, arrears records and receipts by the Treasury 2 1 2
PI-17 (i) Quality of debt data recording and reporting 2 4 4
PI-17 (ii) Extent of consolidation of the government’s cash balances 2 4 4

55 APPENDIX B
D1 (i) Annual deviation of actual budget support from the forecast provided
by the donor agencies at least six weeks prior to the government submitting its
budget proposals to the legislature (or equivalent approving body)
1 NR 4
D1 (ii) In-year timeliness of donor disbursements (compliance with aggregate
quarterly estimates) 1 NR NR
D2 (i) Completeness and timeliness of budget estimates by donors for project
support 2 2 2
D2 (ii) Frequency and coverage of reporting by donors on actual donor flows
for project support 2 2 2
D3 (i) Overall proportion of aid funds to central government that are managed
through national procedures 1 2 2
PI-16 (i) Extent to which cash flows are forecast and monitored 3 3 3
PI-16 (ii) Reliability and horizon of periodic in-year information to MDAs on
ceilings for expenditure commitment 2 3 3
PI-16 (iii) Frequency and transparency of adjustments to budget allocations,
which are decided above the level of management of MDAs 3 3 3
PI-27 (iv) Rules for in-year amendments to the budget without ex-ante
approval by the legislature NA 3 2
PI-17 (i) Extent to which cash flows are forecast and monitored 2 4 4
PI-20 (i) Effectiveness of expenditure commitment controls 3 3 3
D1 (ii) In-year timeliness of donor disbursements (compliance with aggregate
quarterly estimates) 1 NR NR
PI-19 (i) Transparency, comprehensiveness and competition in the legal and
regulatory framework 1 NR 3
PI-19 (ii) Use of competitive procurement methods 1 2 1
PI-19 (iii) Public access to complete, reliable and timely procurement
information 1 2 1
PI-18 (i) Degree of integration and reconciliation between personnel records
and payroll data 3 4 4
PI-18 (ii) Timeliness of changes to personnel records and the payroll 3 3 3
PI-18 (iii) Internal controls of changes to personnel records and the payroll 2 4 4
PI-18 (iv) Existence of payroll audits to identify control weaknesses and/or
ghost workers 2 2 3
AVERAGE SCORE 1.9 2.8 2.7
Source: PEFA (2006), PEFA (2008), and PEFA (2011).
Internal control, audit, and monitoring
Non-Salary controls: Review and revision of all internal control procedures; development of
consistent financial procedures at national and local level; design and implement a
comprehensive financial accountability compliance and enforcement strategy linked to the

APPENDIX B 56
government wide performance management system; revised Treasury instructions; Local
Authorities Model Financial Regulations; centralizing utility payments and develop FMIS for
regular utility payments; passage and assent of provisions regarding enforcement and
discipline. Internal Audit: Establishment of an Internal Audit Unit (first in the Office of the
President and Cabinet (OPC), but later in the MOF; restructuring the internal audit service
and staffing the new structure; development of legal framework and capacity building;
establish system for timely internal audit reporting; development of internal audit strategic
plan; revitalization of Internal Audit Committees. Monitoring and oversight of fiscal risk:
Develop budget and expenditure database linked to FMIS to facilitate analysis of trends in
budgets and implementation; harmonize framework for data capturing and databases for
analysis and dissemination and national and local level to strengthen monitoring and
evaluation; regular comparisons and analyses made of budget allocations against actual
financial cash expenditures for planned and actual inputs, activities and outputs;
Table B.4 PEFA Scores for Internal Control, Audit, and Monitoring
Dimensions 2006 2008 2011
PI-20 (i) Effectiveness of expenditure commitment controls. 3 3 3
PI-20 (ii) Comprehensiveness, relevance and understanding of other internal
control rules/ procedures 3 2 3
PI-20 (iii) Degree of compliance with rules for processing and recording
transactions 3 2 2
PI-21 (i) Coverage and quality of the internal audit function 2 2 2
PI-21 (ii) Frequency and distribution of reports 3 3 2
PI-21 (iii) Extent of management response to internal audit findings 1 2 1
PI-4 (i) Stock of expenditure payment arrears (as a percentage of actual total
expenditure for the corresponding fiscal year) and any recent change in the
stock
1 NR NR
PI-9 (i) Extent of central government monitoring of AGAs and PEs 2 2 3
PI-9 (ii) Extent of central government monitoring of SN government's fiscal
position 1 4 2
AVERAGE SCORE 2.1 2.5 2.3
Source: PEFA (2006), PEFA (2008), and PEFA (2011).
Accounting and reporting
Accounting standards and systems: Generally Accepted Accounting Practice included in
legal framework; capacity building in financial records management throughout GOM;
updating and reconciling accounting records. FMIS: Design, piloting, roll-out and capacity
building for an Integrated Financial Management Information System (covering all
institutions at national and local level as the main mechanism for integrated accounting, cash

57 APPENDIX B
management, payment controls and financial reporting with further modules added;
development of secure, government-wide area network and live linkages; inclusion of
Development Account Part I in FMIS; revised treasury instructions. Bank reconciliations:
Enforcing regular bank reconciliations. Reporting: Development of functional reporting
relationship between the Accountant General and the Heads of Accounts in each ministry;
strengthen and produce timely financial reporting; summary financial reports to show Part I
and Part II progress compared to budget; reviewing and revising reporting requirements of
local government; establish quarterly monitoring reports of budget implementation; summary
financial reports to show the actual costs of implemented outputs and activities, to be done
after the output-based budget is incorporated into the Chart of Accounts.
Table B.5 PEFA Scores for Accounting and Reporting
Dimensions 2006 2008 2011
PI-22 (i) Regularity of bank reconciliations 3 4 1
PI-22 (ii) Regularity of reconciliation and clearance of suspense accounts and
advances 3 3 1
PI-24 (i) Scope of reports in terms of coverage and compatibility with budget
estimates 2 2 2
PI-24 (ii) Timeliness of the issue of reports 3 4 4
PI-24 (iii) Quality of information 2 3 3
PI-25 (i) Completeness of the financial statements 1 2 2
PI-25 (ii) Timeliness of submission of the financial statements 2 4 4
PI-25 (iii) Accounting standards used 2 2 2
PI-4 (ii) Availability of data for monitoring the stock of expenditure payment
arrears 3 1 1
PI-7 (ii) Income/expenditure information on donor-funded projects which is
included in fiscal reports 3 4 NR
PI-8 (iii) Extent to which consolidated fiscal data (at least on revenue and
expenditure) is collected and reported for general government according to
sectoral categories
1 3 4
PI-9 (i) Extent of central government monitoring of AGAs and PEs 2 2 3
PI-9 (ii) Extent of central government monitoring of SN government's fiscal
position 1 4 2
PI-10 (i) Number of the above listed elements of public access to information
that is fulfilled (in order to count in the assessment, the full specification of the
information benchmark must be met)
3 2 2
PI-23 (i) Collection and processing of information to demonstrate the resources
that were actually received (in cash and kind) by the most common front-line
service delivery units (focus on primary schools and primary health clinics) in
relation to the overall resources made available to the sector(s), irrespective of
1 1 1

APPENDIX B 58
which level of government is responsible for the operation and funding of those
units
AVERAGE SCORE 2.1 2.7 2.3
Source: PEFA (2006), PEFA (2008), and PEFA (2011).
External accountability
Scope and nature of external audit: Reform of legal framework to establish the powers and
duties of an independent Auditor General, the role of the Public Audit Commission, National
Audit Office and Public Accounts Committee; institutional restructuring of the NAO; review
and modernization of audit approach; establish system for timely external audit reporting;
procurement of management systems and tools for auditing automated systems; introduction
of Performance Auditing; building capacity of the National Audit Office. Legislative scrutiny
and follow-up of external audit reports: Institutional Strengthening of the Parliamentary
Public Accounts Committee; Training for MPs, Cabinet and media on political oversight of
public finance management; training of local government finance committees.
Table B.6 PEFA Scores for External Accountability
PEFA Dimensions 2006 2008 2011
PI-26 (i) Scope/nature of audit performed (incl. adherence to auditing
standards) 2 2 2
PI-26 (ii) Timeliness of submission of audit reports to legislature 2 1 3
PI-26 (iii) Evidence of follow up on audit recommendations 1 2 1
PI-28 (i) Timeliness of examination of audit reports by the legislature (for
reports received within the last three years) 1 1 2
PI-28 (ii) Extent of hearings on key findings undertaken by the legislature 2 4 3
PI-28 (iii) Issuance of recommended actions by the legislature and
implementation by the executive 2 2 1
AVERAGE 1.7 2.0 2.0
Source: PEFA (2006), PEFA (2008), and PEFA (2011).

59
Appendix C. Financial Management Information
Systems: Design, Implementation, and Utilization
Work on the Malawi FMIS has taken place under three projects: (i) the second Institutional
Development Project (IDP2) which ran from June 1994 to June 2001 and supported the
design of a system to ensure accurate and timely flow of critical financial management
information and fiscal data; (ii) the Financial Management Transparency and Accountability
Project (FIMTAP) which ran from May 2003 to September 2009 and sought to update the
existing CODA platform and roll the system out; and (iii) the Financial Reporting and
Oversight Improvement Project (FROIP), which was approved in Dec 2012 and is expected
to be completed by June 2016. Over this 20 year period the total ICT related investment
under these projects has been around US$15 million.50 In addition the government has spent
about as much from its own resources.51 These figures give an idea of the scale of the
investment in terms of funding and time that has been expended on the Malawi FMIS.
FMIS related activities have involved work in three related areas:
(i) Design and Implementation of the Core Financial Management information
System (FMIS) itself, including the implementation of a FMIS at the local
government level;
(ii) Expanding the scope of the information systems to include core Human Resource
management functionality- the HRMIS;
(iii) Improvements in the telecommunications infrastructure, the GWAN supporting a
country wide systems network.
This appendix discusses developments in each of these areas with respect to design,
implementation, and utilization. It does not discuss subnational systems, presented in the
main text of this report.
Financial Management Information System (FMIS)
The key sector issues in the early 2000s related to expenditure management and
accountability, particularly budget discipline, and a paucity of financial management capacity
in the public service. Budgetary resources were spread thinly, with continuing pressure to
over-spend, while there continued to be large variations between planned and actual
expenditures, excessive virement, and non-compliance with financial rules and regulations.
This was compounded by poor incentives and inadequate capacity in the public sector which
hampered the government's ability to effectively and efficiently carry out critical functions.
These issues had been highlighted inter-alia, in the 2001 Malawi PER and the 2002 CFAA.
In this context, the implementation of a FMIS was considered key to the government's effort
to modernize Malawi's public financial management system and improve expenditure
management. It was envisaged that the FMIS would significantly improve overall quality and
timeliness of the government's fiscal and financial data by facilitating transaction reporting
50 FMIS data base 2014- maintained by Cem Dener.
51 The exact amount of Government financed investment is not readily available. However the amount cited has been
estimated in view of the fact that the HRMIS and the second phase of the FMIS based on EPICOR has been Government
financed.

APPENDIX C 60
and accounting; automating processes such as cash management, commitment control,
receipts and payments; and gradually help in introducing accrual accounting.
The evolution of the FMIS can be seen to have three phases over the 20 year period that it
has been under implementation. These are discussed below.
FMIS - Phase I – CODA and its customization
Under the IDP2, the government purchased the CODA financials software and customized it
to Malawi requirements. This included removing below-the-line accounts from operational
budgets and improving the interface between the payroll and personnel. The customization
also addressed gaps in the budget and accounting procedures and improved internal controls.
Detailed pilot testing of the CODA software had been carried out over 2000-2002. The
upgraded version of CODA Financials was launched in the pilot sites thereafter and its
functionality was verified by World Bank staff prior to negotiations. At the start of the
FIMTAP project the system was considered ready for roll-out to line ministries and sector
departments.
FIMTAP originally intended to make any additional enhancements as may be necessary and
then rollout the CODA application across the government. With this intention it provided
financing for:
Consultancies for further enhancement of systems functionality, including the
development of the budget recording and commitment control modules and
strengthening of the cash management, check reimbursement and receipts business
processes.
Hardware, equipment, software licenses, training, user license fees for CODA
Financials, financing for the primary implementation and maintenance contracts.
Building the government's capacity to manage the ongoing development of FMIS
including a detailed training plan for the training of trainers and end users for the
pilots and rollout. A new management structure for FMIS was instituted during
project preparation with a full time IMFIS manager and a staff of five full time
accountants and IT specialists.
The FMIS component was to be managed by the Office of the Accountant General (AGD),
while DISTMS (Department of Information Systems and Management services) would have
responsibility for the IT support necessary for the implementation of the FMIS.
Comments on FMIS Design: In the phase which covered the IDP2 and the earlier years of
the FIMTAP, it was recognized that to reap the greatest benefits from a FMIS it is necessary
that the focus be placed on improving financial management processes, internal controls,52
and accountability mechanisms, while at the same time putting in place the requisite
equipment and skills. Accordingly, these projects focused initially on core budget execution
processes and planned for these processes to be in place and functioning and stabilized before
embarking on the implementation of non-core modules such as fleet management.
52 It is important to note in view of subsequent difficulties with the Malawi FMIS, which are discussed later, that even with
the CODA application there had been an effort to tighten internal financial controls by the use of double passwords and a clear
division of responsibilities and systems access among accounting cadre and controlling officers.

61 APPENDIX C
Notwithstanding the above, in view of the extensive customization required for the CODA
application, which belonged to the first generation accounting software systems on the
market and had limited functionality, it appears that the initial choice of the application
software package was made without carrying out an assessment of the extent to which the
package could meet the government’s needs. It is also possible that since the application
software packages available at the time were mainly designed to meet commercial
requirements and had not yet incorporated the functionality required in government systems
(such as budget and commitment control), that this choice was typical of the options
available in the market at that time.53
Another important aspect of the project design was that it explicitly recognized the
importance of correct sequencing of reforms. The PAD for the project noted: “Increasingly,
reforming governments are focusing on building the credibility of the annual budget process
by focusing on downstream processes such as execution, monitoring, and accountability.
FIMTAP supports this strategic shift towards building systems and strengthening institutions
that improve budget implementation, before investing more heavily in elaborated medium-
term planning exercises.” This is in contrast with reform initiatives in several other African
countries at this time which placed a very strong emphasis on upstream budget preparation
work instead of the downstream budget execution systems despite the fact that these systems
were either nonexistent or quite limited (e.g. Zambia). In the absence of a basic budget
execution system which is capable of recording all expenditure and receipt transactions
according to a standard CoA the implementation of advanced budget preparation
methodologies would at best be of limited benefit.
Finally, concurrent to the implementation of the FMIS, work was also being done by the IMF
on the institutional arrangements for banking government funds and processing expenditure
and receipt transactions (Treasury Management) as laid out in the budget management law.
An IMF mission has reported on the status of government banking arrangements and the
improvements that are required.54 It is noted that even though there is a multiplicity of bank
accounts which could be further streamlined, all these accounts are either at the Central Bank
or with commercial banks which act as fiscal agents for the Central Bank and operate on a
zero balance basis. This means that the amount of idle balances in the system outside the
purview of the Central Bank is minimized. This is also reflected in the PEFA PI-17 (ii)
ratings for 2008 and 2011 where Malawi scores an “A.”
FMIS – Phase II- Change of the Software Platform to EPICOR
The long time spent on the customization and testing of the software under IDP2 and in the
earlier years of FIMTAP, without adequate operationalization took its toll on the Accountant
General’s confidence that the customization process would yield a workable solution, despite
the positive results of the pilot testing. This in turn had an effect on the commitment and
53 It is only in the early 2000s that even leading financial management packages such as Oracle Financials and SAP began to
adapt to and offer Government functionality as standard features after the publication of a Joint Bank and IMF document
which detailed these requirements. Treasury Reference Model, Ali Hashim and Bill Allan, World Bank Technical Paper
No: 505, 2001.
54 IMF (2014).

APPENDIX C 62
support from top management in the MOF and they decided that it may be better to abandon
the customization and enhancement of the CODA application and procure a second
generation application software package. This decision was taken after a visit of a high level
MOF team to Tanzania where EPICOR which was one of the second generation packages
that had come on the market, was being used.
The new procurement was proposed to be on a sole source basis. After a refusal of the Bank
and other donors to finance this change especially since the procurement was to be on a sole
source basis and against procurement guidelines, the government decided to do so from its
own resources. All work related to the CODA application and training of staff for its use was
suspended and the government embarked on a new systems implementation exercise based
on EPICOR.
Comments on the change of the software platform: Whilst the enhanced CODA
application would probably have been able to meet GoM immediate requirements (in view of
the results of the pilot testing noted above), it is difficult to fault the government from a
management point of view. This so since, by the time FIMTAP was being prepared, in the
early 2000s a second generation of accounting systems software, the so called Enterprise
Resource Planning (ERP) applications which encompassed more complete functionality had
already become available. Some of these packages had also been enhanced to meet
government specific requirements. Therefore much of the enhancement that had been carried
out to the CODA application would not be required (It may be mentioned that CODA has
also evolved since then and in 2010 after merger with another software company it is
marketed as a second generation package Unit4.55 However, this was several years later than
its competition.).
So a question does arise whether the continued investment in customization and enhancement
of the CODA application in FIMTAP was the best route to follow. Instead it may have been
better to switch software platforms to take advantage of the new technology available at the
very start of FIMTAP in the early 2000’s. This question has also been discussed in a QAG
QER report dated June 25, 2008. (QAG 2008)
“The CODA Financials, had been installed under a previous Bank project, IPD2, and
updated prior to FIMTAP commencing. The Accountant-General came to the view
that an FMIS based on CODA Financials could never work satisfactorily, and sought
to switch to the EPICOR system utilized by Tanzania. Bank staff urged the GoM to
stick with the existing software, and arranged for CODA to fly a team to Malawi to
fix all outstanding problems. They also warned the government that the EPICOR
system, designed originally for small to medium size companies, would not meet
expectations and would be expensive to maintain. Who was right is beside the point –
the Accountant-General of Tanzania is known to be a strong advocate of EPICOR,
and the GoM may have been swayed by her advocacy. What happened is that the
Bank was unable to retain the confidence of the client on a critical technical issue at
the heart of the project.”
55 In 2008, UK-listed accounting software company, CODA was purchased by Unit 4. In 2000, Unit4 had
merged with the Norwegian ERP software house Agresso Group ASA and the company name was changed
to Unit4Agresso. In 2010, Unit4Agresso rebranded, changing its main company name to Unit4.

63 APPENDIX C
With the benefit of hindsight, perhaps the best route for the Bank to follow would have been
to insist that the government also look at other second generation ERP options that had
become available at the time, instead of insisting that they continue with the CODA
application. With this insistence the Bank team also lost the opportunity to argue that the
change of the software platform should be made after a detailed comparison of functionality
of all available second generation packages with government requirements to minimize
future customizations which would entail additional costs and time. This missed opportunity
has continued to haunt the Malawi FMIS to-date.
EPICOR Systems Implementation: Following its decision to switch software platforms
from CODA financials to EPICOR, the government entered into a contract with the
Tanzanian company Soft tech which was the sole representative of EPICOR in Africa, to
implement the new software in Malawi. Despite repeated requests to provide the details of
this contract including its cost; these were not provided to the present mission.
The Epicor based FMIS has now been rolled out to all line ministries and departments and to
the regional centers (Zomba, Mzuzu, and Blantyre). The System has been implemented in a
centralized architecture with the central servers located in Lilongwe.
A back-up and disaster recovery site with a duplicate platform has been completed and is
connected and operational at a separate location with funding from USAID. Line Ministries
in Lilongwe have been connected via a government wide area network - the GWAN
discussed separately below. Earlier the provincial HQs were to be connected via VSAT.
However they are now connected via an optic fiber link thereby removing potential problems
of latency and delays caused by a satellite based link. Line ministry offices at the
headquarters and the provincial HQs use the system to process all transactions. There are at
present about 800 users connected to the system.
FMIS at the Local Government Level. The rollout of a FMIS to local assemblies was to be
funded by funded by the government and/or other donors and a separate tender for software
was advertised. The government entered into a contract with Techno-Brain after a
competitive bid to supply and install the application software Serenic Navigator at district
level sites.
This system has now been implemented at all 34 district sites. A central module has been
installed at the Ministry of Local government in Lilongwe which consolidates information
from the districts and interfaces with the central FMIS. Sites with fiber connectivity work in
online mode with the central system where as those where connections are not present, work
offline with periodic upload of transactions.
Systems Utilization: The EPICOR FMIS is now the main tool that is used to support the
government’s budget execution process at the center and in the regions in Malawi. The
budget is prepared separately by a budget preparation system and is loaded into the FMIS at
the start of the year by the budget department. All in year changes to the budget are made
directly in the system. Cash releases are also recorded by the MOF in the system. System
implementation at the line ministry level covers the complete P2P cycle (Procure to
Purchase) with all stages of the transactions recorded directly in the system. This includes the
request for procurement. The purchase order- LPO is produced directly by the system and
commits funds at the time it is raised by the system. The Goods Receipt Note (GRN) and
invoice are recorded on receipt and the payment order is produced directly by the system

APPENDIX C 64
against the line ministry bank account at the commercial bank. The core functionality of the
central system is shown in the figure below.
Figure C.1. Core Functional Processes and Information Flows
Source: IEG.
The review mission visited a few line ministries and met with the Directors of Finance (e.g.
the Director of Finance at the Office of the Cabinet, the Director of Finance at the
Department of Human Resources and that at the Ministry of Health) and was informed that
all transactions at the HQ and the regional centers were processed through the system and no
transaction related to the government budget is processed outside the system.56 These
Departments were able to produce a budget execution report at any point in time that gave
the budgeted amounts, the revised budget, the funds released, the commitments and the
expenditures to date by line item for all cost centers reporting to them.
Program managers at the Ministry of Health informed the present mission that they use the
outputs and actual expenditure figures from the FMIS to track program costs. These reports
enable them to determine the costs of specific health sector service delivery outputs and
which outputs could not be delivered due to insufficient funding. The real benefit of an FMIS
is that it should help program managers in their program management and not just as a tool
for accounting. The MOH example shows in some sectors the system outputs have actually
started being used for this purpose. The mission obtained sample copies of these reports for
these ministries, which are attached at the end of this appendix. It may be noted here that the
general impression around the government management and the donors has been that the
56 However, transactions related to all funds available to the government, such as donor funded projects etc. are not
channeled through the FMIS. This aspect is discussed in detail later in this report.

65 APPENDIX C
system was unable to produce such reports since ostensibly several requests from donors for
such reports had not produced any results.
However, as noted above, all transactions related to all funds available to the Government,
such as donor funded projects etc. are not channeled through the FMIS. The
comprehensiveness of transaction coverage is one of the primary criteria which determine the
effectiveness of an FMIS as a tool for budget management and to this extent the budget
execution reports available from the FMIS do not present a complete picture. The IMF
(2014) gives specific recommendations on how to fill in the gaps in coverage.
The systems users expressed their general satisfaction with the system but stated that
increased transaction loads and the limited capacity of the servers have increased the
processing time of the transactions and has reduced transaction through put and the time for
producing online reports from the system. They also expressed dissatisfaction with the level
of support provided by the contractor. Since a new version of the system was now available
with better functionality and they could benefit from an upgrade to this version. However
users were generally against a change of the application software platform.
Some Issues with the Local Government FMIS: The Serenic Navigator based FMIS is the
tool that is now used at the district level for supporting budget execution. Issues still remain
related to the interface and transfer of data to the Central system. The PEFA 2011 reports that
“The FMIS at central level is integrated with itself but not with the FMIS at local level.”
In addition, some sector departments such as Health and Education have expressed concern
that since all funds designated for a district are channeled through the District Commissioner,
who can prioritize expenditures. This has caused some sector departments to push for
removing the funding for that sector from the ambit of the Ministry of Local government and
to set up independent mechanisms for the sector department to manage these funds directly at
the district level.
FMIS Phase III - Systems Upgrade
The question of upgrading the Malawi FMIS has been under discussion for some time in
view of the fact that that the version of the EPICOR software installed currently is version 7
and several later versions have now been issued by the supplier and the current version is
version 10. The supplier will discontinue support to the version that is currently installed in
Malawi. Upgrading to the later version carries two immediate advantages. First, the Ministry
of Finance will no longer need to pay for expensive Citrix licenses as well as running a
Citrix-server to connect to FMIS clients (this is currently required for the version 7).
Secondly, it would allow FMIS clients to connect to FMIS via a browser over the internet
thereby reducing costs and creating increase facility (through, amongst others, reduced
technical complexity) for a speedier roll-out of the FMIS.
In addition the hardware platform requires an upgrade to meet increased transaction loads,
reduce processing time and improve transaction throughput. These are normal activities that
the government has to provide for in any systems implementation.
While discussing the question of the upgrade the government decided to open up the
discussion from that of upgrading from the current version of the software to the later version

APPENDIX C 66
to one where they would first document the business processes that an upgraded system
should support and then use this as basis of specifying the system requirements and compare
the suitability of the two current FMIS systems that are in use (i.e. Epicor used in central
government and Serenic Navigator used in local governments).
This has been done under a follow on project, which funded a consultancy to define the
business processes that an upgraded system should support, and specify the system
requirements. This analysis showed that that under the specific Malawi conditions the later
version of the EPICOR software would be a better fit than the Serenic Navigator.
However the cashgate scandal in 2013 in which a massive fraud was detected in the FMIS
based payment process, has overtaken these developments. The responsibility for this fraud
has been partly directed at the capacity of the software to have provided appropriate
safeguards against this to have happened. There is now growing sentiment in government
that this software should be replaced. This sentiment is compounded by the fact that the
government has for some time not been happy by the support provided by the software
representative, Soft tech.
Therefore the Government has decided that it would use the system specifications developed
above for a new international competitive bidding process for a new application software
package, although Epicor will be allowed to participate.
These bids are currently out and responses are expected within a few weeks from the writing
of this report in July 2015.
Comments on yet another change in the Software platform: It may be noted here that in
contrast to the situation at the time that CODA was replaced by EPICOR since CODA had
fallen significantly behind industry trends and its competition, EPICOR has kept pace with
developments in the industry and the features that have become available with other second
generation packages (e.g. web enabled access and others) are also available in the later
generations of the EPICOR package.
The current thinking to change the application software platform now reflects a general lack
of understanding that the technology platform is only one of the factors that determine the
outcome of an FMIS implementation and certainly not the most important one. An
understanding of the key characteristics of the core Government financial management
processes and transactions and the control environment under which they operate, is critical
to the satisfactory implementation of an FMIS.
The IMF (2013) carried out a detailed review of the problems that led to the cashgate scandal
and has found that the Application Software was not the problems. A mere change of the
software without addressing the other control issues surrounding its use would not reduce the
danger of a similar fraud occurring again. The report states that the problems associated with
the FMIS include: (i) system abuses and fraud, due to weak system access controls; (ii)
weaknesses in FMIS reporting, due to inadequate data capture, delayed reconciliation and
inaccurate data; (iii) build ups in arrears due to inadequate usage of the commitment control
system; and (iv) poor system performance due to erratic power supply, inadequate server
capacity and unreliable connectivity.
Very few of these issues are due to technical deficiencies in the FMIS. Rather, they reflect
weaknesses in the systems, processes and controls around the FMIS environment. These

67 APPENDIX C
include the lack of ICT systems audits, inadequate segregation of duties, and difficulties in
enforcing instructions. The few problems that do relate to technical issues concern limited
interfaces with other PFM systems and a failure to apply validation checks.
An audit commissioned by the National Audit Office of Malawi after the cashgate scandal
has noted: “During an unannounced ad hoc IT security audit, the Baker Tilly inspection of
the firewall configuration indicated that the firewall settings had been changed to permit any
outside connection. The password controls had been disabled, and the connections to the
FMIS servers, that should have been routed through the network firewall, had bypassed the
firewall. This represents a fundamental weakening of the internal control framework such
that it would allow a situation similar to Cashgate to occur again.
This matter is of particular concern given the high levels of funding applied to improving
FMIS, the server and virtual machine set up along with the monitoring related training given
to Accountant General Staff in May and September 2013. (NAO 2014)
In the above mentioned report 62 recommendations were made and it is not clear at this stage
how many of these have been implemented. The lack of accountability, allied to a failure to
apply or detect compliance with the PFM Act requirements, has in any case allowed what
could be considered a deliberate circumvention of the control framework.
The apparent level of collusion and circumvention of procedures, together with the limited
challenge from those charged to ensure accountability, and lack of detailed external audit
would suggest that there currently is no guarantee that future frauds would be prevented
regardless of any control improvements implemented.”
However, as a response to cashgate, and in view of the previous experience regarding losing
traction in the dialogue with the Government, the Bank and the other donors have agreed to a
new bidding process for an application software package that would be financed under
FROIP.
The risks with engaging a new system are outlined below:
Bringing the FMIS system up to its current performance level could take 3-4 years
(the time required to procure the application software through the ICB would take
about 12-18 months; it would take another 9-12 months to parametrize it for GoM
requirements and test its functionality; and another 12-18 months to roll it out to all
sites and make them operational). This timing estimate is optimistic and could be
longer if a sophisticated application software packages with multiple modules is
chosen.
Once the new system is operational, there is no guarantee of it functioning at its
current level within a short time period. In fact, significant investments in human
capacity would have to be made. Much of the expertise accumulated over the years in
the use of the existing FMIS platform would be lost and a whole new set of technical
skills will need to be developed.
During the transitional period, the focus will be diverted to the change in the software
platform rather than the overall control environment in which the software is to
operate, which is critical. Given the Government’s position on blaming the system
rather than the lack of enabling environment this risk is particularly eminent.

APPENDIX C 68
On the other hand upgrading the existing software would be a less ambitious task. Careful
consideration of the costs, advantages, and timeframe should be given prior to considering
either option.
Human Resource Management Information System (HRMIS)
The Human Resource Management Information System (HRMIS) component was added to
the project at the time of restructuring to support the Government’s increased focus on Civil
Service Management related activities.
In 2005, shortly prior to GoM agreeing on the components of the restructured project,
government had decided to discontinue use of its then payroll and establishment management
system and procure a new HRMIS. The new system was procured using government funding
through a competitive bidding process. The system chosen was produced by Globe Systems
Limited, a local information technology company in Malawi and was custom written for
GoM.
Although EPICOR (the FMIS system) suppliers did not respond to the HRMIS bid, the
government did not exercise the option of purchasing the EPICOR Human Capital
Management module, which would have provide all HRMD functionality, to integrate with
the EPICOR FMIS. The Globe HRMIS is custom developed and written in visual basic and
uses SQL server as the database.
Utilization of the HRMIS
The Establishment module of the HRMIS maintains the Schedule of Established Offices for
approved posts and associated grades allocated to each ministry or department. This module
has been centrally implemented at DHRMD in HRMIS. Adjustments to the establishment in
HRMIS can only be done by authorized officers within DHRMD. Ministries and
Departments have access to their establishments in read only mode. Government cannot
appoint or recruit when there are no posts because there will be no pay as the payroll is
linked to posts that are determined by authorized establishment.
The employee module has also been centrally implemented at DHRMD in HRMIS. The
system matches employees to their respective posts on the authorized establishment. The
module is fully integrated with the establishment and this has enabled that all employees are
placed on the appropriate posts on the establishments of their respective ministries and
departments. Only authorized officers within DHRMD can handle critical functions related to
personnel records. These functions include: introduction of new employees; promotions and
demotions; postings between ministries and departments; transfer between posts; updates of
personal and employment information; and deletions and re-instatements of employees.
Authorized human resource officers in ministries and departments can handle internal
postings; update of designated non-mandatory fields; and change of salary spine points.
The payroll module has been implemented across government. The module is fully integrated
with the establishment and employee modules. An employee could only appear on the
payroll if the record is on the employee module. Ministries and departments cannot introduce
ghost workers on the payroll because the module is fully functionally dependent on the
establishment and employee modules both of which are centrally managed by DHRMD.

69 APPENDIX C
The Secretary Treasury issues warrants for the salaries costs of line ministries and the FMIS
checks for these limits before authorizing payments which are made through commercial
banks where employees hold bank accounts. Currently about 160,000 government
employees are paid through the system. Payments are made through the FMIS.
The HRMIS has been implemented with full security features. Each user has a personal
username, password and access rights. There was an audit trail for every transaction. These
facilities assist in tracking what each user has done on the system.
The HRMIS has been decentralized to all ministries and departments at Capital Hill,
Department of Information Systems and Technology Management Services and some offices
at City Centre where GWAN connectivity is available. As GWAN is being rolled HRMIS is
expected to be rolled out alongside.
As establishment control has been linked to the HRMIS, wage bill fluctuations should be
limited and associated with the normal employment cycle (e.g. new employees joining the
Civil Service, promotions, exiting of personnel whose established posts would be
automatically deleted on expiry of authority). Further, civil service personnel audit exercises
are carried out periodically to ensure the integrity of the HRMIS. However, it remains
possible to introduce ghost workers through to the inclusion of employees on the payroll
from other cost centers over which controlling officers do not have oversight. Furthermore,
there is a failure to validate payroll events, as a result of which unauthorized changes can be
introduced. A recent audit (GOM 2015) also noted that payroll transactions are insufficiently
monitored and reconciled and that the interface between the payroll and other related systems
remains manual leaving room for mishandling and error. Internal controls for human
resource management are in place but risks remain that can undermine the system if left
unaddressed.
Government Wide Area Network (GWAN)
In addition to the FMIS, FIMTAP also included a subcomponent related to supporting the
expansion of the GWAN which had been established earlier under IDP2. The GWAN was
conceived as an electronic infrastructure to support numerous intranet / internet capable
functions including email, FMIS, payroll and personnel. A robust electronic network
architecture had been developed at Capital Hill where the majority of Ministries are located.
However, numerous other locations required further work. FIMTAP supported the next
phase of the GWAN roll-out including the expansion of the network, establishment of
institutional structures and capacity to manage the system, system protection, and ensuring
un-interrupted power supply.
Following the restructuring, the further development of the GWAN was harmonized with
activities funded by UNDP and USAID. UNDP provided technical assistance, especially
diagnostics, as well as network design support and the supply of equipment. Total Funding to
the GWAN by UNDP was $1.3 million. USAID mainly provided equipment under the MCC
Threshold Plan. Donor support to DISTMS was coordinated through a joint government
donor technical working group.
Since project closure the GWAN was considerably overhauled with support from the FROIP
follow-up project and USAID. The fiber cables were replaced and new networking
equipment provided. At the time of the mission the GWAN served as a reliable backbone for

APPENDIX C 70
the operation of Government information systems with adequate management structures in
place.
Information Systems Architecture for Fiscal Management
Three separate systems have been implemented under the various projects under discussion
here which have contributed to setting up these systems for Malawi. These include the
Central EPICOR based FMIS to manage budget execution at the Central Level, the Serenic
Navigator based FMIS that is used at the District Level and the HRMIS which is used to
manage entire civil service establishment and calculate the payroll for Government
employees. The GWAN also set up under these projects, provides the telecommunications
infrastructure to connect them with each other.
The Information Systems Architecture for the Malawi Fiscal Management is given in the
diagram below, and shows the various systems that have been implemented under the
project, their interfaces with each other and the banking system, and the core information
flows.
Figure C.2. Information Systems Architecture for Fiscal Management
Source: IEG.
At the start of the year the approved budget is loaded into the FMIS from the Budget
preparation system and all in-year changes are made directly by the Budget department in the
FMIS. For an expenditure transaction, the diagram traces the flow from the point of its
origination at the Spending unit to its payment to the payee. For a receipt transaction the
diagram shows its route from the point it is deposited in a Bank by the payer to the point of

71 APPENDIX C
its recording in the FMIS. The figure indicates the interface between the Central and the
District level FMIS and interface between the HRMIS and the FMIS which enables Payroll
transactions generated from the HRMIS to be routed to the FMIS for payment.
The 2011 PEFA assessment noted that “at the moment there is no electronic integration
between the Payroll system, the Tax Payer Identification Number system, any of the tax
administration systems (including ASYCUDA), debt management systems and RBM. It
would seem prudent to elaborate a strategy for the future interconnection of these various
systems.” This is still the case and the observation remains valid.
Implementation Costs
It is interesting to compare the Costs of the Malawi FMIS implementation with other Bank
financed projects which use an off the shelf application software package like Malawi.
Implementation costs vary with the scope and scale size of the implementation. However, it
is possible to get an approximate idea of the costs to be expected for implementing a system
with a given scope, from existing data on completed projects, by plotting the contracted cost
of actual systems implementation against the number of end-users (used as a proxy for scale
size of the system) that are connected to the system. In this exercise it is necessary to use
comparable numbers. Thus, the cost elements should cover the same elements for all
projects, and if this expense has been incurred in various phases of the project, say for pilot
implementation and rollout, then these costs should be summed.
A recent Bank publication (World Bank 2014) gives this data for 10 World Bank financed
FMIS projects that involve implementation of a COTS package. The results are displayed in
the Figure below showing the contracted costs covering the hardware, software,
implementation services, WAN/LAN networking, and training plotted against number of
COTS user licenses acquired (used as a proxy for end users).
It is possible to use this data to predict approximate costs for, say a 1000 User COTS
implementation. For example, since the costs are represented by
Y=0.0096x+4.74; if x = 1000, then y= US $ 14.34 million (+/-) 20 percent.
Therefore, implementation costs for a COTS implementation is about US$ 15,000 per user.
The Diagram also shows the Malawi FMIS capital costs plotted on this graph. The total
FMIS implementation inputs from the Government of Malawi for the EPICOR
implementation over the period 2005/6 – 2010/11 have been estimated at US$14.7 million
Fölscher et al 2012). The number of named users on the system according to the project team
is 800 as stated earlier. This gives a figure of US$ 18,375 per named user which is higher that
the costs of other Bank financed FMIS implementations in this study.
This excludes the costs of the GLOBE HRMIS (since these figures were not available). The
quoted numbers are for FMIS implementation costs over the period 2005 – 2010/2011 and
therefore also do not include the previous investment on the CODA application. With the
addition of these figures (approx. US$ 10-12 million), the per-user cost would rise even
higher to US$33,375 per user.
The sole source procurement of the Malawi FMIS appears to have contributed to the higher
per user cost for the Malawi EPICOR FMIS as explained above. Furthermore changes in the
software platform midway have resulted in high total cost for (CODA + EPICOR)

APPENDIX C 72
implementation, as shown in the graph below. Further changes would make this cost even
higher.
Figure C.3. FMIS Implementation Cost Plotted Against Number of Users
Source: Hashim (2014) and authors’ calculations.
Vietnam
Kazakhstan
Pakistan
Indonesia
Moldova
KyrgyzMaldives
Albania
Mongolia
Azerbaijan
0
10
20
30
40
50
60
0 1000 2000 3000 4000 5000 6000
Imp
lem
en
tati
on
Co
sts
-$
mill
ion
s
Number of Users ( COTS licenses)
Malawi CODA +
EPICOR
Malawi
EPICOR only

73 APPENDIX C
FMIS Outputs
Figure C.4. Sample Expenditure Statements by Cost Center
Figure C.5. Sample Cost Center Summary Report

APPENDIX C 74
Figure C.6. Sample Itemized Commitment and Expenditure Report

75
Appendix D. Building Capacity
The operation took place in a very low human capacity environment. The operation
recognized this is a bottleneck for the implementation of public sector reform initiatives and
supported various short and long-term training courses, against a training needs assessment
conducted by the DHRMD. This was unfortunately not available to the evaluation team. The
Bank, in collaboration with the DHRMD set up the Training Fund for the delivery of the
various training sessions. In total it is reported that about 1,500 short training courses were
delivered over the lifespan of the operation.
An evaluation of the programs beneficiaries in 2007 noted that 620 public servants received
training against a shortlist of 3,150. The shortlisting process was used as a mechanism to
filter out those most appropriate to part take.57 The gender imbalance of recipients is striking.
While 34 percent of total applicants were women, only 28 percent of women were actually
selected. Only training for the HRMIS module of the FMIS was more balanced with 47
percent women. This being said, IEG had no data on the gender distribution of overall public
servants. The breakdown of the trainings provided and participants by gender is provided in
the table below.
Table D.1. Distribution of Shortlisted and Selected Applicants by Course
Shortlisted applicants Selected applicants Share
COURSE MALE FEMALE TOTAL MALE FEMALE TOTAL
Strategic planning for senior staff 184 60 244 53 7 60 10%
Performance management for
junior staff
54 43 97 17 13 30 5%
Administrative law for HR
managers
51 22 73 12 8 20 3%
HRM for junior staff 105 56 161 18 12 30 5%
HRM for senior staff 62 21 83 25 5 30 5%
Induction for EO/TO 148 78 226 20 10 30 5%
Induction for AO/TO 89 38 127 18 12 30 5%
Induction for CO/TA 171 121 292 16 14 30 5%
Strategic management for mid-level
managers
221 91 312 22 8 30 5%
Strategic management for senior
staff
106 25 131 25 5 30 5%
57 It was noted that some ministries and departments made their own nominations to replace procedurally selected
applications, who failed to attend the training. Such nominations were done without prior consent of the DHRMD or the
relevant training institution who had a set up reserve list. This practice undermined the targeting effectiveness.

APPENDIX D 76
Local government financial
management
87 23 110 26 4 30 5%
Management information systems
for HRMIS staff
41 32 73 16 14 30 5%
Procurement management for
senior staff
51 21 72 23 7 30 5%
Records management for junior
staff
200 204 404 45 15 60 10%
Financial management for junior
staff
310 122 432 63 27 90 15%
Financial management for senior
staff
122 55 177 21 9 30 5%
Procurement management for
junior staff
78 58 136 24 6 30 5%
Total 2,080 1,070 3,150 444 176 620 100%
Source: GOM (2008)
Notable is also the distribution of training participants by beneficiary agency. An effort has
been made to provide trainings at decentralized levels, as over one quarter of total
participants reported to the Ministry of Local Government and Rural Development. This is
followed by Agriculture, Education, and Transport who each made up about 10 percent of
participants. Somewhat surprising is that the Ministry of Finance and the Department of the
Accountant General only had about 3 percent of participants, despite the trainings focusing
heavily on financial management, procurement, records management, and strategic planning.
Also, very few people of the National Audit Office or the Parliament were trained, despite
their important role and the acknowledged need for improved capacity.
Table D.2 Participants distribution by MDAs
Ministries, Departments and Agencies Beneficiaries Share of total
Local Government and Rural Development 111 27%
Agriculture and Food Security 41 10%
Education 39 9%
Transport and public Works 36 9%
Health 25 6%
Energy and Mines 16 4%
Irrigation and Water Development 14 3%
Lands, Housing and Physical Planning 13 3%
Home affairs and Internal Security 13 3%
Human Resource Management and Development 12 3%

77 APPENDIX D
Justice and Constitutional Affairs 12 3%
Finance and Accountant General 11 3%
Labor and Social Development 10 2%
Tourism and Wildlife 8 2%
Women and child Development 8 2%
Economic Planning and Development 7 2%
Information and Civic Education 7 2%
National Audit Office 7 2%
Statutory Corporation 6 1%
Parliament 4 1%
Other 14 3%
Total 414 100%
Source: GOM (2008).
The assessment (GOM 2008) coins the training program to have been a success. The
attendance rate for the courses ranged from 84 to 98 percent, with an average attendance rate
of 92 percent. Survey results indicate that most participants had a better attitude about their
job following the training, and were subsequently able to take on more responsibilities.
Furthermore it is reported that 92 percent of the participants were able to apply the skills,
indicating that the training was indeed relevant. In particular the assessment notes that
“participants are now able to evaluate tender documents, develop and review strategic plans,
and observe principles of natural justice in decision making” (GOM 2008 p.15).
Under a long term training initiative58 337 beneficiaries benefited from scholarships for
various degrees between 2005 and 2011. Of the 337, two thirds were male and one third
female. The majority (87 percent) were sponsored for a master’s degree, 8 percent for a
doctorate and the remaining 5 percent for a bachelor’s degree. The table below gives a
breakdown by program and agency of a large subset of the group as per GOM (2009).
Accordingly, the Central Internal Audit (CIA) unit received most trainings, followed by the
Office of the Director for Public Procurement (ODPP), the National Audit office with 91, 70,
and 45 beneficiaries respectively.
58 Long-term trainings were sponsored in part by FIMTAP, and in part by MGSF, ADS, and CSFP-UK. Participants were
sent abroad when deemed adequate.

APPENDIX D 78
Table D.3. Long-term Training Beneficiaries by Program and Agency
MA
BA
Dip
l C
om
pu
ter
Stu
die
s
IMIS
/AC
/CA
/A
BE
/
CIM
A
AC
CA
Pa
rt
2&
3
CA
T/C
IA
AC
CA
/PA
EC
Tec
h
CIP
S (
Cer
t. &
Dip
l)
To
tal
CBF (Overseas) 56 - - - - - - - - 56
DISTMIS/GWAN 8 4 24 - - - - - - 36
AGD 3 - - - - - - - - 3
NAO - 1 - 3 3 24 - 14 - 45
ODPP 20 - - - - - - - 50 70
CIA - - - 7 1 - 37 46 - 91
Total 67 5 24 10 4 24 37 60 0 301
Source: GOM (2008).
A tracer study (GOM 2013) finds that the majority of training beneficiaries returned and
remained at the public service after receipt of their degree. By 2013 312 beneficiaries were
still in the public service, representing 92 percent. The attrition rate of 7.4 percent makes up
16 beneficiaries who left the public service for the private sector and 9 beneficiaries who
either retired or passed away.
The study’s survey concludes that 92 percent of recipients were able to use the skills
acquired during training, and beneficiaries noted that the degrees had contributed to the
advancement of their careers as evidence by their promotion to higher posts. This indicates
that after the training they were in a better position to influence decision making.
Most beneficiaries of the long-term training were far from retiring, as 91.3 percent were in
the age bracket of 25-49 years. Further, work experience profile is skewed to 6-15 years. 35
percent of beneficiaries were in this age bracket followed by 32 percent in 11-15 years.

79
Appendix E. Factors Contributing to the Cashgate
Scandal
There are a number of problems that surround FMIS and have contributed to the Cashgate
scandal. They include: (i) system abuses and fraud, due to weak system access controls; (ii)
weaknesses in FMIS reporting, due to inadequate data capture, delayed reconciliation and
inaccurate data; (iii) build ups in arrears due to inadequate usage of the commitment control
system; and (iv) poor system performance due to erratic power supply, inadequate server
capacity and unreliable connectivity.
Few of these however are due to technical deficiencies in the FMIS. Rather, they reflect
weaknesses in the systems, processes and controls around the FMIS environment. These
include the lack of ICT systems audits, inadequate segregation of duties, and difficulties in
enforcing instructions. Problems that do relate to technical issues concern limited interfaces
with other PFM systems and a failure to apply validation checks. A more exhaustive
discussion is found in IMF (2013).
The factors that have contributed to the current situation include, but are not limited
to, the following:
Breakdown of internal controls and weak accountability arrangements caused by,
among other things: (i) a lack of strategic oversight and management supervision at
all levels; (ii) collusion and circumvention, possibly aided by management override of
controls; (iii) a lack of most fundamental control procedures such as bank
reconciliations; (iv) inadequate budgetary discipline––poor control is exercised before
commitments are incurred and payment cannot be made when due resulting in
arrears; (v) a weak accountability system—audit report of 2011–12 not publically
available even in November 2014; and (vi) a lack of understanding of the overall
PFM system and the inter-relationships.
Limited regard for the PFM legal framework; a culture of impunity and a perception
that malpractices will not lead to sanctions and laws and regulations will not be
enforced; and
An unrealistic expectation that the FMIS will do everything and a tendency to blame
FMIS when errors occur or reconciliation issues arise, rather than address the
problems in a proactive manner.
Technological solutions are being pursued without first addressing fundamental
issues such as bank reconciliation, coverage of the FMIS and simplification of the
framework.

80
Appendix F. Government Banking Arrangements
The Malawi Government banking arrangements are important as they pertain to the
effectiveness of FMIS. A TSA is in place and banking accounts are operating at a zero
balance basis, meaning that there are no idle balances the FMIS cannot access.
The Malawi Government account control account number 1 (MG1), is the main account from
which the operating accounts are funded, it receives revenues from the MRA revenue deposit
holding accounts by annual transfer. Budget support funds provided by development partners
are deposited into this account.
There are six main operating accounts: (i) Salaries; (ii) Other recurrent transactions (ORT);
(iii) Development; (iv) Statutory; (v) Advances; and (vi) Deposits. The operating accounts
are the means through which the budget is released from the MG1 account. Checks are drawn
from these accounts based on documentation produced by the spending MDAs. These
accounts are accounted for through the FMIS and some attempts are being made to reconcile
them. However, these efforts have revealed significant unreconciled differences and much
remains to be done before they are reconciled.
Revenue deposit account are held in the name of the Malawi Revenue Authority (MRA), not
the Accountant General. No records are maintained by the MOF and therefore no
reconciliation is undertaken.
A ways and means account, which is the government overdraft, is fully managed by RBM.
Spreadsheet based statements are provided to the MOF, but not systematically provided to
the Accountant General.
Bank statements for the public debts account are received by the Aid and Debt Management
Department. However, no formal reconciliation is done.
Donor funded project holding accounts and Sector Wide Approach (SWAP) accounts should
be reconciled by the responsible MDA, and overseen by the Accountant General. Some
reconciliations are received by the Accountant General with significant delays.
In addition to the accounts held at RBM, there are a number of accounts held in commercial
banks. These include operating accounts for each of the main accounts and a number of
accounts for treasury funds, the commercial entities of government. The operating accounts
are operated on a zero balanced basis, and the balances on these accounts should be
monitored on a regular basis to ensure that balances are not accumulating, which is not
occurring at the moment.
The structure of the bank accounts is shown in the diagram below. For a more detailed
discussion on banking arrangements see IMF (2014).

81 ANNEX G
Figure F.1. The Structure of Malawi Banking Arrangements
Source: IEG.

82
Appendix G. Other Data and Information
PDO Indicators
Annual performance reviews carried out for all public servants under contract.
Completion of personnel audits for all ministries.
All ministries, departments and agencies of the borrower provide input to the budget
development process based on strategic plans reviewed annually in coordination with
the MTEF.
Officers occupying positions identified as redundant are retrenched in accordance
with the approved Retrenchment Plan.
The Capacity Building Facility trains at least one hundred civil servants to maintain
improvements and reforms made in expenditure and public sector management.
Intermediate Indicators
Improve payroll systems and establishment controls to ensure conformity with
budgeted public service establishments.
Monitor and report on donor disbursements and project implementation.
Expansion of the borrower's computer network between Capital Hill and the City
Center in Lilongwe and between Lilongwe and major regional centers.
Establishment of an internal audit committee, including the development of terms of
reference, a manual and operating guidelines
Monitoring of the implementation of the borrower’s Public Procurement Act in at
least forty percent (40 percent) of the borrower’s government entities.
Table G.1 World Bank supported PFM policy actions in parallel
FY Project Name and Policy Action
2001 FISCAL RESTRUCTURING AND DEREGULATION PROGRAM III
Established a detailed project database within MOF to also include aid-financed projects outside
the development budget
On the basis of the ongoing PER, identified priority recurrent expenditures and protected their
share in total recurrent expenditures in its 2000/2001 budget
Announced a ten point plan to improve financial management and posted on MOF's Web site,
selected items of the FY 2000/2001 budget
Taken the decision to separate its public finance management and public audit functions by
enacting new legislation
Approved and commenced implementation of the recommendations of the Phase I study which
proposes decentralization of the borrower's procurement process
Operationalized the Malawi Revenue Authority
Identified a prioritized list of projects in its FY 2000/2001 development budget
Commenced quarterly public reporting of: balance sheets and profit and loss accounts of at least
the 5 largest parastatals
Restricted the entry of new projects to high priority sectors on the basis of the project database

83 APPENDIX G
2004 FISCAL MANAGEMENT & ACCELERATING GROWTH PROGRAM
Standardize and consolidate salary and allowance structure of the Malawi civil service to form a
uniform salary structure
Decentralize the following activities in accordance with the cabinet paper on sector devolution
by transferring the associated other recurrent transactions (ORT) budgets from the MOF directly
to the District Assemblies
Received Cabinet approval for the medium term pay policy (MTPP) for Malawi civil service
2008 PRSC 1
Reconciliation of the payroll with the backlog of personnel data takes place by Dec. 2006
Central GoM entities representing 50% of expenditures are audited
2009 MW PRSC 2
Introduced a budget calendar incorporating all budget related activities
Carried out the HRMIS review and personnel audit of its civil service
Submitted the delayed audit report for FY 05/06 to the Parliament
Debt and Aid Management Policy has been approved by the Cabinet
2010 PRSC 3
Adopted a revised budget classification structure and associated chart of accounts
Developed an action plan to address the weaknesses identified in the HRMIS review and
personnel audit of the civil service
Issued a treasury minute responding to issues raised by the Public Accounts Committee of its
Parliament in connection with audits furnished by the Recipient's Auditor General to such
committee
The Recipient has operationalized its Debt Management Committee, comprised of
representatives of its central bank, Treasury, Accountant General's Office, Ministry of Justice
and Ministry of Development, Planning and Cooperating for the purpose of making
recommendations regarding incurring of domestic and external debt
2013 RAPID RESPONSE DEVELOPMENT POLICY GRANT
Adopted the national budget for the 2012/2013 Fiscal Year which is consistent with fiscal
sustainability and prioritization of social expenditure
2013 ECONOMIC RECOVERY DPO-1
Validated its outstanding payment arrears and has developed a plan for the full clearance of said
arrears
Approved a detailed budget formulation calendar
Submitted Treasury Minutes, for the 2006/2007 fiscal year to the Recipient's Parliament
Source: OPCS Prior Action Database (accessed August 2015)

APPENDIX G 84
Table G.2 Fiscal table (Percent of GDP unless otherwise indicated)
2005/6 2006/7 2007/8 2008/9 2009/10 2010/11 2011/12 2012/13
NATIONAL INCOME AND PRICES (CALENDAR YEAR)
Real GDP
Growth 2.1 9.5 8.3 9.0 6.5 4.3 1.9 5.5
Nominal GDP
(MK Billion) 424 511 601 710 812 880 1056 1310
Inflation (CPI
Annual Average
Percent p.a.)
13.9 8.0 8.7 8.4 7.4 7.6 21.3 20.2
Revenue 27.3 30.6 29.4 32.1 33.8 32.1 26.5 37.8
Tax revenue 16.0 16.5 17.3 18.2 18.6 20.8 19.4 20.6
Nontax revenue 2.0 1.5 1.5 2.3 4.9 3.8 2.7 3.3
Grants 9.4 12.5 10.5 11.6 10.3 7.6 4.4 15.1
o/w Budget
support 3.5 1.9 2.3 3.0 4.5 1.8 0.0 6.5
Expenditure
and net lending 31.2 31.9 30.0 37.8 33.8 35.0 34.9 40.2
Current
expenditure 24.2 20.3 18.6 30.6 25.7 27.2 27.0 32.0
Wages and
salaries 5.4 5.1 5.4 5.7 5.9 6.9 7.2 8.1
Of which: health
SWAp 0.2 0.2 0.2 0.2 1.1 0.6 1.0 0.0
Interest payments 4.9 3.5 2.2 2.7 2.8 2.7 2.5 2.8
Domestic 4.0 3.1 2.1 2.6 2.7 2.6 2.2 2.4
Foreign 0.9 0.4 0.1 0.1 0.1 0.1 0.2 0.3
Goods and
services 8.9 6.6 5.5 13.1 11.0 11.2 9.8 12.0
o/w Generic
goods and
services
5.0 4.7 3.1 6.7 5.8 4.8 5.5 4.7
Subsidies and
other current
transfers
5.1 5.1 5.5 9.0 6.0 6.4 6.1 8.3
o/w Transfers to
public entities 1.5 1.6 1.4 1.9 1.7 1.7 1.8 1.9
o/w Fertilizer and
seed subsidy 1.9 2.0 2.7 5.8 2.9 2.6 2.5 4.4
Arrears
adjustment 0.0 0.1 0.0 0.1 0.0 0.0 1.5 0.8

85 APPENDIX G
Development
expenditure 7.0 11.5 11.5 7.1 7.9 7.7 8.0 8.0
Part I (foreign
financed) 6.0 9.0 8.1 4.9 4.5 3.7 3.6 5.0
Part II
(domestically
financed)
1.0 2.4 3.4 2.2 3.4 3.9 4.4 3.0
Net lending 0.0 0.1 0.0 0.0 0.2 0.1 0.0 0.0
Overall balance
(excluding
grants)
-13.3 -13.9 -11.2 -17.3 -10.3 -10.5 -12.8 -16.3
Other financing
needs n.a. n.a. n.a. 0.1 0.0 0.0 0.0 0.0
Overall balance
(including
grants)
-3.9 -1.3 -0.6 -5.7 0.1 -2.9 -8.4 -1.2
Total Financing
(net) 3.9 1.3 0.6 5.7 -0.1 2.9 8.4 0.4
Foreign
financing (net) 1.0 1.0 2.5 2.0 0.9 1.3 1.6 1.9
Borrowing 3.8 2.1 2.7 2.2 1.1 1.5 1.9 2.5
Repayments 2.7 1.1 0.2 0.2 0.2 0.2 0.3 0.5
Domestic
financing (net) 0.6 -0.3 -1.9 3.7 -0.9 1.7 6.8 -1.6
Discrepancy 1/ 2.6 0.7 0.0 -0.1 -0.1 -0.1 0.0 0.8
Net domestic
debt, percent of
GDP
15 12 17 18 14 16 20 17
BALANCE OF PAYMENTS TRENDS (CALENDAR YEAR)
Real Export
Growth 6.9 34.5 30.9 23.1 15.4 4.3 10.8 -12.5
Real Import
Growth 14.6 -12.5 59.1 -18.9 73.4 -8.8 15.9 -9.6
Current A/C
Deficit Without
Grants
-26.7 -16.3 -25.0 -19.3 -21.7 -16.4 -19.3 -4.5
Current A/C
Deficit With
Grants
-11.3 1.0 -9.7 -4.8 -1.3 -5.9 -7.1 -4.3

APPENDIX G 86
Gross Official
Reserves
(Months of
Imports)
1.1 1.2 1.5 0.7 1.5 1.0 1.1
Real Effective
Exchange Rate
Index(1998=100)
-5.7 -3.0 20.4 9.5 -6.0 -3.3 -- --
Source: IMF Article IV Agreements; World Bank 2015.
Figure G.1. Example of Annual Strategic Plan

87 APPENDIX G
Figure G.2. Example of Performance Management as per Work Plan

88
Appendix H. List of Persons Met
Richard Record, Senior Economist, World Bank.
Khuram Farooq, Senior Financial Management Specialist, World Bank.
Daniel Domelevo, Senior Financial Management Specialist, World Bank
Geoffrey Oestreicher, Resident Representative, IMF
Guy Anderson, PFM Advisor, EATEC IMF
Chimwemwe Banda, Deputy Accountant, Ministry of Finance, Economic Planning, and
Development
Patrick Machika, ICT Director, Ministry of Finance, Economic Planning, and Development
Frank Mangwaya, FMIS Manager, Ministry of Finance, Economic Planning, and Development
Mona Mhango, Fm Specialist, Ministry of Finance, Economic Planning, and Development
Lawrence AC Kampanje, Assistant Auditor General, National Audit Office
Jeane J. Munyenyembe, Director of Finance, Office of the President and Cabinet
Twaibu Ali, Permanent Secretary, Administration, Ministry of Finance, Economic Planning and
Development
Nations S. Msowoya, Assistant Director, Administration, Ministry of Finance, Economic Planning
and Development
Agnes Mengezi, Assistant Director, Ministry of Finance, Economic Planning, and Development
Arnold Chirwa, Deputy Director, Office of Director of Public Procurement.
Malumbo Kausi, Chief Accountant, Ministry of Health
Ismail Magra, Head of Training, Training Section, Department of Human Resources.
Dr. Luanga, Director, Department of Human Resources.
Dr. Chriwa, Deputy Director, HRMIS, Department of Human Resources
Hawa Mthaphari, Assistant Accountant, Accounts Department of Human Resources.
Rhoda Mfune, Senior Assistant Account, Accounts Department of Human Resources.
W. Mtumbuka, Accountant, Accounts, Department of Human Resources.
Joshua Sowoya, Director, Internal Audit Department
Josh Lievege Nthenegive, Chief Internal Auditor, Internal Audit Department.
Lusungu Sichali, Accountant, Ministry of Education
Victor Steenbergen, Budget Officer/ODI Fellow, Ministry of Education.
Yuen Chikando, Financial Analyst, USAID
Francis Mwapasa, Financial Analyst, USAID
Karen B. Fall, Controller, USIAD
Chipo Msowoya, Program Manager, EU
Chance, EU