report no. 42844-ke kenya accelerating and sustaining ... · kenya accelerating and sustaining...
TRANSCRIPT

July 2008
Document of the World Bank
Report N
o. 42844-KE
Kenya A
ccelerating and Sustaining Inclusive Grow
th
Report No. 42844-KE
KenyaAccelerating and Sustaining Inclusive Growth
Poverty Reduction and Economic Management Unit 2Country Department for KenyaAfrica Region
Pub
lic D
iscl
osur
e A
utho
rized
Pub
lic D
iscl
osur
e A
utho
rized
Pub
lic D
iscl
osur
e A
utho
rized
Pub
lic D
iscl
osur
e A
utho
rized
Pub
lic D
iscl
osur
e A
utho
rized
Pub
lic D
iscl
osur
e A
utho
rized
Pub
lic D
iscl
osur
e A
utho
rized
Pub
lic D
iscl
osur
e A
utho
rized

TABLE OF CONTENTS ACKNOWLEDGEMENTS .......................................................................................................... FOREWORD ............................................................................................................................ VI11 EXECUTIVE SUMMARY ......................................................................................................... I X 1 . INTRODUCTION ................................................................................................................. 1 2 . GROWTH-DIAGNOSTICS AND STRATEGY ............................................................. 6
GROWTH STRATEGY ................................................................................................................ 26 3 . ENHANCING GLOBAL INTEGRATION AND EXPORT DIVERSIFICATION ..... 30
KENYA'S GLOBAL COMPETITIVENESS .................................................................................... 30 EXPORTS PERFORMANCE AND POLICY ACTIONS FOR ENHANCING GLOBAL INTEGRATION ... 36 IMPROVING TRANSPORT AND TELECOMMUNICATIONS SERVICES ............ 46
TRANSPORT LOGISTICS ........................................................................................................... 46 TELECOMMUNICATIONS .......................................................................................................... 52 FISCAL POLICY FOR GROWTH .................................................................................. 58
REVENUE MOBILIZATION ........................................................................................................ 58 EXPENDITURE POLICY ............................................................................................................. 60 CREATING FISCAL SPACE BY IMPROVING THE QUALITY OF EXPENDITURE ........................... 62 MOBILIZING PRIVATE RESOURCES FOR INFRASTRUCTURE ......................... 71
LOCAL CURRENCY FINANCE OF INFRASTRUCTURE ................................................................ 75 DIASPORA BONDS .................................................................................................................... 78
APPENDIXES .............................................................................................................................. 80 BACKGROUND FIGURES AND TABLES .......................................................................... 80 KENYA AGRICULTURE POLICY REVIEW-PRELIMINARY MESSAGES ........................... 89 A NOTE ON BANKING SECTOR EFFICIENCY AND FINANCIAL OUTREACH .................... 92 INTEREST U T E S AND COUNTRY RISK PREMIUM ........................................................ 99
4 .
5 .
6 .
A .
c . D .
B .
E . F .
GROWTH SIMULATIONS .............................................................................................. 101 NATIONAL EXPORT STRATEGY IMPLEMENTATION ACTION PLAN 2005-AN EXCERPT 105
G . TO~R~SM ..................................................................................................................... 107 REFERENCES .......................................................................................................................... 109
BOXES
Box 2- 1 : Kenya's Economic Liberalization .................................................................................................... 9 Box 2-2: Macro Stability and Solvency o f Public Finances ......................................................................... 10 Box 2-3: Shrinking Primary Fiscal Surpluses and Declining Interest Payments .......................................... 13 Box 3-1: Historical Performance o f Kenyan Exports ................................................................................... 36 Box 4-1 : Extension o f Port Services Envisioned by Kenya Ports Authority ................................................ 48 Box 4-2: Realizing the Potential from Strategic Investors and Competition ................................................ 54 Box 4-3: The WTO Information Technology Agreement ............................................................................ 57 Box 5- 1 : Reliance on Seigniorage as a Source o f Revenue .......................................................................... 60 Box 6-1 : Supply Potential o f Long-term Local Currency Finance in Kenya ............................................... 75 Box 6-2: International Experience with Diaspora Bonds ............................................................................. 79
... 111

FIGURES
Figure 2-1 : Annual percent change in total GDP (market prices). 2002-07 .................................................. 6 Figure 2-2: Annual Percent Change in GDP by Main Activity and I t s Contribution (?!) to Total GDP Change during 2003-7 .................................................................................................................................... 7 Figure 2-3: Public and External Debt. 19956-2006/7 ................................................................................. 11 Figure 2-4: Primary Balance and Interest Payments ..................................................................................... 13 Figure 2-5: Trends in Shares o f Exports in Total GDP, Sustained Growth Countries, and Kenya, 1960- 2005 ............................................................................................................................................................... 22 Figure 2-6: Shares in World Exports o f Goods and Services, ....................................................................... 23 Figure 2-7: FDI and Aid-Net Inflows as Percent o f GDP, 1980-2005 ........................................................ 26 Figure 3-1 : Real and Nominal Effective Exchange Rates ............................................................................ 30 Figure 3-2: Unit Labor Costs, Kenya, Tanzania, Uganda, China, and India ................................................. 31 Figure 3-3: Perception o f Firms on Groups o f Investment Climate Variables, 2002 and 2006 ................... 33 Figure 3-4: Tax Burden as Percentage o f Gross Profits, Cross-country Comparison .................................. 35 Figure 3-5: Kenya’s Exports by Income Level o f Destination Countries, 1980-2005 ................................. 38 Figure 3-6: EXPY (proxy for degree o f sophistication), H igh Performing Countries and Kenya, 1992-2003 ....................................................................................................................................................................... 39 Figure 3-7: Measure o f Proximity to Current Export Basket (Ease to Adapt), Income Value (PRODY), and Export Values o f Products wi th RCA, Kenya, 2000-4 ................................................................................ 40 Figure 3-8: Sources o f Technological Information and Innovation ............................................................. 41 Figure 4-1 : Days to Clear Imports and Exports (Median), Selected Manufacturing Firms, Cross-Country Comparison ................................................................................................................................................... 47 Figure 5-1: Revenue Mobilization (% o f GDP) ........................................................................................... 59 Figure 5-2: Growth and Change in Reserve Money, Kenya, 1981-2006 ...................................................... 60 Figure 5-3: Primary Expenditure and Components ...................................................................................... 61
TABLES
Table 2-1: Annual Percentage Change in Expenditure on GDP (constant 2001 prices) ................................ 7 Table 2-2: Sources o f Economic Growth. Selected Period Averages. 1960-2006 ......................................... 8 Table 2-3: Factors Explaining Decline in Indebtedness. 1996/7-2006/7 (percent o f GDP. annual average) ....................................................................................................................................................................... 12 Table 2-4: Indicators o f Political and Broad Economic Institutions, Fast-Growing SSA Countries, Sustained Growth Countries, and Kenya ....................................................................................................... 19 Table 2-5: Indicators o f Social Fractionalization, Fast-Growing SSA Countries, Sustained Growth Countries, and Kenya .................................................................................................................................... 20 Table 2-6: Macroeconomic and Trade - Policies and Outcomes, Fast-Growing SSA Countries, Sustained Growth Countries, and Kenyaa ...................................................................................................................... 21 Table 3-1: Direct Costs o f Weak Security and Bribes to Formal Firms, Cross-country Comparison .......... 34 Table 3-2: Recent Trends in Kenyan Exports (all numbers in percent) ........................................................ 37 Table 4-1 : Table 4-2: Table 4-3: Table 4-4: Table 4-5: Table 5-1 : Table 5-2: Table 5-3: Table 5-4: Table 6- 1 : Table 6-2: Table 6-3:
Condition of Kenya’s Classified Roads ...................................................................................... 49 Averaging Operating Costs in Selected national Corridors in Africa ......................................... 51 Transport Prices in Africa ........................................................................................................... 51 Telecom Monthly Basket Price Comparison, Selected SSA Countries, 2006 (US$) .................. 53 Quality of Fixed L ine Service Indicators, Selected SSA Countries, 2005 .................................. 53 Education Expenditure, 2002103-2009/10 .................................................................................. 62 Kenya’s Scores on Measures o f Efficiency in Education Sector ................................................ 63 Unit Costs, Education by Level, 2002-05 (US$) ........................................................................ 64 Total Health Expenditures, 2002/03-2009/10 ............................................................................ 67 PPI in Sub-Saharan Africa and Kenya, by Sectors ..................................................................... 71 Types o f Risk and their Allocation in a Typical PPI Project ...................................................... 73 Tentative PPI Project Pipeline .................................................................................................... 75
iv

APPENDIX FIGURES AND TABLES
FIGURES
Figure A- 1 : Trend in Annual Percent Change in GDP Per Capita. 1960-2007 .......................................... -80
Figure A-3: Global Competitiveness Index, Kenya: The Most Problematic Factors for Doing Business, Figure A-2: Kenya’s Ranking in “Doing Business 2008” ............................................................................ 83
2007-8 ........................................................................................................................................................... 83
Figure C-1: Financial Sector Depth and GDP Per Capita. 2000-5 .............................................................. 92 Figure C-2: Development o f Banking Sector Interest Rate Spreads, 2000-6 .............................................. 94
Figure C-4: Number o f Bank Branches by Location .................................................................................... 98 Figure C-3: Government Securities to Earning Assets, 2000-5 ................................................................... 95
Figure D-1: Kenya 91-day T-bill Rate. 1991-2006 ................................................................................... 100
TABLES
Table A-1: Output . Composition and Growth by Productive Sectors . Ten-Year Averages During 1960- 2007 ............................................................................................................................................................... 80 Table A-2: Sources o f Growth by Periods (1 960-2003): Selected High Performing Economies and Kenya ....................................................................................................................................................................... 81
Table A- 4: Share o f Ten Largest Products in Kenya’s Total Exports ......................................................... 85 Table A- 5: Revealed Comparative Advantage o f Products, 1980-5 versus 2000-5 ................................... 86 Table A- 6: PPI Projects in Kenya ............................................................................................................... 87
Table A-3: Comparative Tax Rates for Residents in EAC Countries and Comparators .............................. 84
Table C-1: Growth and Structure o f Kenya’s Banking Sector. 2000-5 ....................................................... 93 Table C- 2: Reasons Why Respondents Are Not Banked. By District Type ................................................ 96
Table D- 1: Interest Rate Decomposition. 1991-2006 ............................................................................... 100
Table E-1: Real Macro Indicators by Simulation (% annual growth from 2006-2030) ............................. 103 Table E-2: Macro Indicators in 2006 and by Simulation in 2030 (% o f nominal GDP) ............................ 104
Table G- 1 : Public Sector Share o f Tourism Revenues from a Community-owned Wildlife Resource Conservancy in Partnership with a Private Tour Operator .......................................................................... 108
V

ACKNOWLEDGEMENTS This report i s a product o f extensive consultations and close collaboration between the Wor ld Bank and officials in the Government o f Kenya, and private sector leaders, academicians, and public leaders in Kenya outside the government. The Wor ld Bank team visited Kenya in June 2006 and again in February 2007 to collect information and hold consultations. The team would l ike to acknowledge with thanks, discussions with Joseph Kinyua (PS Treasury), Dr. Edward Sambili (PS Planning), Prof. Njuguna Ndungu (Governor, CBK), David Nalo (PS MoTI), Dr. Kamau Thugge (ES Treasury), Stephen Wainaina (ES Planning), Henry Rotich, Dr. Wahome Gakuru, Prof. Michael Chege, and their teams. Outside the government, the team benefited f rom discussions with Rick Ashley, Manu Chandaria, Lutaf Kasum, Betty Maina, Kihara Maina, Wachira Maina, Gayling May, Jimnah Mbaru, Prof. Harris Mule, J. Murigu, David Ndii, Prof. Terry Ryan, Hasit Shah, and Jonathan Stichbury among a large number o f private sector representatives and financial market leaders.
The report was authored by a core team led by Praveen Kumar and including Leonardo Garrido and Tracey Lane. The extended Wor ld Bank team included Paul Brenton, Christine Cornelius, Michael Fuchs, Madhur Gautam, Dominic Haazen, Giuseppe Iarossi, Andrew Karanja, Paivi Koljonen, Andrew Lovegrove, Michael Mills, Sonia Plaza, John Randa, Dilip Ratha, Justin Schwartz, Shobhana Sosale, David Tan, and Fahrettin Yagci, who provided inputs to the report. The team benefited f rom discussions with a large number o f other Wor ld Bank staff, too numerous to be individually mentioned here.
The work was guided by Kathie Krumm, Sudhir Shetty, and Col in Bruce. Sanjivi Rajasingham guided the dissemination o f report in Kenya in July 2008. The report benefited f rom the advice o f Br ian Pinto and Shahid Yusuf, who were peer reviewers. Br ian Pinto’s guidance went beyond that expected o f a peer reviewer. Anand Rajaram provided guidance and support to the fiscal space component o f the work. Cevdet Denizer provided helpful comments on drafts. Kenya missions were supported by Shamis Salah and Caroline Kidiavayi. The report was desk-topped by Dora Harris and Arlette Sourou.
The report draws upon the following background papershotes’ prepared toward the growth analytical work to in form Vision 2030 o f the Government o f Kenya (GoK 2007b).
1. “Kenya’s Quest for Growth-Stabilization and Reforms-But Political Stability?” Authors Luca Bandiera, Praveen Kumar, and Br ian Pinto
2. “The Challenges o f Achieving Kenya’s Vis ion 2030: A Macro Perspective.” Authors Hans Lofgren and Praveen Kumar
3. “Kenya: Growth Diagnostics.” Authors Njuguna Ndungu, Praveen Kumar, Leonardo Garrido, and John Randa
4. “Kenya’s Potential for Sustained Growth: A Benchmarking Exercise.” Author Leonardo Garrido
5. “Efficiency o f Government Education Expenditure in Kenya.” Task Manager Carla Bertoncino
Background paperdnotes can be obtained by sending an e-mail to [email protected]. This report 1
may contain more updated information than in the background papers.
v i

6. “Fiscal Space for Kenya-Health Sector.” Task Manager Dominic Haazen 7. “Fiscal Cost o f Infrastructure in Kenya.” Authors Cecilia Briceno-Garmendia and
Jane Kiringai 8. “Modeling Services Liberalization: The Case o f Kenya.” Authors Edward J.
Balistreri, Thomas F. Rutherford, and David G. Tarr 9. “Kenya: Rehabilitating and Maintaining Road Network for Growth.” Task
Manager Cecilia Briceno-Garmendia 10. “Public-Private Partnerships in Kenya. Past Trends and Future Directions”
Author Kumar V. Pratap 1 1. “Kenya-Private Participation in Infrastructure.” Author Justin Schwartz 12. “Financial Sector Efficiency and Outreach in Kenya.” Authors Robert Cull,
Michael Fuchs, and Andrew Lovegrove
The findings o f the background papers were informally shared with the Ministry o f Finance and the Ministry o f Planning and National Development to inform the ongoing development o f Vis ion 2030 document, as wel l as the central government’s budget for the fiscal year 2007/08. The team made a presentation to GOK officials at the end o f i t s mission in February 2007.
Apart f i o m the papers above, the report draws upon the Wor ld Bank Investment Climate Assessment carried out in 2007, which has been finalized in parallel as an independent report.
The work on roads was funded by DFID through a t rust fund which i s gratefully acknowledged.
vii

FOREWORD
(a) This report was prepared mostly in 2007, with January 2008 as the original delivery date.
(b) Whi le the reference point i s Vision 2030, the report focuses on what needs to be done in the next five years to realize a significantly higher growth potential and sustain high growth. I t i s therefore largely relevant to alternative time lines for implementing the Vision.
(c) The report has not been updated to take account o f developments f rom late December 2007 through March 2008. However, the main messages o f the report relate to structure o f the economy, which remains largely unchanged. Therefore, these messages remain relevant to achievement o f growth objectives o f the new government.
(d) If anything, the messages are even more relevant. The impact o f postelection incidents on the economy demonstrated the importance o f polit ical stability for growth, a key message o f this report. Similarly, this report highlights the importance o f addressing the ethnic fractionalization and income inequality as components o f a long-term growth strategy, a message that again rings true. For sustaining growth over a long term, i t i s not enough to return to the precrisis growth path; rather, Kenya must reduce the r isks o f a recurrence o f the problems highlighted by the crisis.
(e) The report i s part o f a suite o f analytic pieces being completed by the Wor ld Bank Group, including the Poverty and Inequality Assessment, Investment Climate Assessment, and Corporate Governance Report o n the Observance o f Standards and Codes (ROSC), which complement this work with insights into h o w Kenya might achieve higher and more inclusive growth and accelerated poverty reduction.
( f ) The international community i s seeking opportunities to work with the coalition government to accelerate economic growth, intensify poverty reduction, and promote economically, socially, and environmentally sustainable development. The report in i t s current form remains relevant to this effort, as wel l as to the medium-term plan o f the government.
(g) The report was shared with the G o K in M a y 2008. In addition, it was presented to stakeholders within the G o K o n July 8, 2008. This was followed by a public launch o f the report to the media and other stakeholders outside the government o n July 9, 2008.
... V l l l
EXECUTIVE SUMMARY A Focus on Inclusive Growth in the Next Five Years
This report focuses on what needs to be done in the next five years to realize a significantly higher growth potential and sustain high growth in Kenya. The challenge before Kenya and the new government i s to take the economy to the next phase o f development.
Experience from all over the world shows that growth i s central to all strategies for reducing poverty and creating jobs. This has been Kenya’s experience as well. During the 199Os, lack o f growth coincided with increase in poverty and decline in human development indicators. However, these trends were arrested, or even reversed in some cases, with the ignition o f growth after 2002.
The central message of this report i s that despite the recovery, the economy i s not yet at a stage of development where higher or even recently achieved growth rates-around 6 percent per year-can be safely assumed. Serious bottlenecks to investment-and thus to growth-continue. Infrastructure services remain costly and unreliable. Institutions at a microeconomic level, such as those dealing with trading across borders and providing security, are not efficient and do not deliver effectively. The government has not managed to make a major dent in the problem o f corruption. Above all, despite being better developed relative to regional neighbors, the economy i s underdeveloped relative to faster growing economies in the world with which Kenya should compare itself.
The Critical Importance of Reducing Business Risk by Maintaining Political and Macroeconomic Stability
T o achieve higher growth in Kenya, and to reduce poverty and generate jobs, two preconditions are critical: low political and macroeconomic risk. Political and macroeconomic stability initiated and fueled growth recovery in the past five years (see chapter 1). They will also be essential for future growth, poverty reduction, and employment generation.
The sources of political risk or instability are many. These include uncertainty over the course o f future policy, corruption, and the importance o f political connections to doing business. The December 2007 elections have highlighted additional sources o f polit ical risk in Kenya-ethnic and social tensions with roots in inequality.
I n particular, the experience of the past five years has demonstrated that growth in Kenya i s very sensitive to perceptions of political and macroeconomic risks. If political risk i s high, businesses will make fewer new investments. In the absence o f macroeconomic stability, economic uncertainty will tend to increase-and with it, expectations o f rising inflation and interest rates, which will slow down private investment and growth.
To sustain growth over a long term, it would not be enough to return to the precrisis business environment; additionally, Kenya must reduce the r isks o f a recurrence o f the socioeconomic problems that contributed to the crisis.
This report offers some steps to help maintain macroeconomic stability through fiscal policy for growth. Upcoming work by the Wor ld Bank on poverty assessment addresses some o f the
i x

distributional issues that must be addressed to reduce political risk from social tensions. T h i s report focuses the bulk o f i t s analysis on the question o f removing constraints to growth, particularly in the form o f rapidly improving total factor productivity (TFP). Kenya has considerable scope for enhancing productivity by reducing business costs. These can be seen as “ low hanging fruits”: relatively easy improvements that can yield large results in the next few years. Improved integration with the global economy through trade and investment would provide other sources for TFP enhancement. These steps can trigger a virtuous cycle leading to ‘higher growth: including further improvements in investments-both domestic and foreign-improved productivity, greater competitiveness, and increased international trade.
In particular, the report examines the following areas more fully:
0 Pursuing fiscal pol icy to promote growth including steps to mobilize private resources for infrastructure.
0 Steps to improve transport and telecommunications services and reduce their costs.
0 Steps to accelerate global integration.
This report reinforces the findings of the Vision 2030 document in several areas, adds value in many others, and modifies some. Most significantly, this report agrees with the Vision that tourism, manufacturing, and service sectors based on information and communication technology (ICT) are l ikely engines for growth. However, this report i s much less emphatic than Vis ion 2030 about the sectors (identified winners and flagship projects) on which government should focus for delivering the aspired growth. The emphasis o f the report i s instead o n generic economy-wide reforms aimed at reducing business costs and improving productivity. A sectorhndustry lens i s supported to address only sectorhndustry specific binding constraints to growth. This shift in emphasis has large implications for policy. I t frees up the resources o f the state-financial resources, as wel l as the time and effort o f policymakers-to focus o n generic reforms rather than implement and follow-up elaborate grand sector strategies.
X

Box 1: About this Report
This report attempts to answer a major question faced by policymakers: if pol i t ical and macroeconomic stability are maintained, what more would be needed to accelerate and sustain growth in Kenya. The answer to this question lies in understanding the constraints to accelerating and sustaining growth. Empir ical work shows that constraints to accelerating growth at a particular time (proximate constraints) may differ f r o m constraints to long-term sustained growth (deeper constraints). Therefore, th is report carries out analysis towards understanding constraints to growth at three levels. First, a benchmarking exercise is carried out, comparing Kenya with successful economies, to highlight areas where Kenya would need to make deeper efforts to achieve sustained growth. Second, a growth diagnostics exercise i s carried out to understand the nature o f binding constraints to accelerating growth in the medium term. This exercise asks why the investment rate is l o w in Kenya. Finally, a macroeconomic perspective i s developed to look at the feasibility o f a very high growth rate-such as 10 percent envisioned in the Vis ion 2030. These analyses are then combined to propose a strategy for accelerating and sustaining growth.
In its analysis, the report draws upon the state-of-the-art thinking o n the issues o f growth, which is going through considerable rethinking among economists and practitioners. Among several departures f rom the conventional view, the new thinking shies away f rom providing prepackaged answers to an economy’s problems and emphasizes country-specific analysis instead. Similarly, the focus has shifted f rom identifying correlates o f growth at a macroeconomic level (as in growth regressions), to identifying constraints to growth at a microeconomic level. This report reflects this s h i f t in thinking and draws mainly upon analysis specific to Kenya (such as growth diagnostics and the Investment Climate Assessment, ICA) to arrive at conclusions relevant to pol icy choices. W e would hope that the approach and methodologies o f t h i s report influence future thinking about growth issues in Kenya.
Deep Determinants of Kenya’s Long-term Growth
The analysis underlying this report yields the following major conclusions:
Kenya has a number of strengths when it comes to potential for high long-term growth compared to sustained growth economies in other parts of the world. Kenya has developed a skilled, English-speaking labor force. Kenya’s natural beauty and coastal location provide unexploited potential. Policy choices have evolved in the right direction in Kenya (see Figure 1). The structural reforms carried out during the past two decades have positioned Kenya wel l to exploit the potential offered by geography and skilled labor through private sector-led development strategy. Continued structural reforms aimed at strengthening the country’s external orientation and the role o f the private sector should further advance Kenya’s prospects.
xi

Figure 1: Macroeconomic stability has been achieved through fiscal reforms and discipline
1995196 1996197 1997198 1998199 1999100 2000101 2001102 2002103 2003104 2004105 2005106 2006107
Years
Source: Staff calculations, based on data from Kenyan authorities, IMF Staff Reports, and World Bank. Note: Domestic debt i s net o f government deposits in the banking system and on-lending. External debt i s on a gross basis and includes borrowings from the IMF.
In terms of political and broad economic institutions, Kenya’s position i s mixed. It does wel l on international indicators o f institutionalized constraints on executive decision-malung. However, the recent political crisis has highlighted the inherent weakness o f institutions to ensure smooth political transition in a democratic context. Kenya ranks much lower on control o f corruption, even compared to fast-growing Sub-Saharan African (SSA) countries (see paragraph 2.33). Finally, income inequality i s relatively high. Research shows that high inequality in incomes can be inimical to growth.
Kenya i s significantly disadvantaged on measures o f social fractionalization (ethnic, religious and linguistic), compared to sustained growth countries, and i s disadvantaged even compared to fast-growing SSA economies (Table 1). Globally, there i s evidence that social fractionalization affects economic outcomes and hurts growth due to ethno-regional biases in policy, particularly the provision o f public goods, and indicates a higher potential for conflict and derailing growth.
x i i
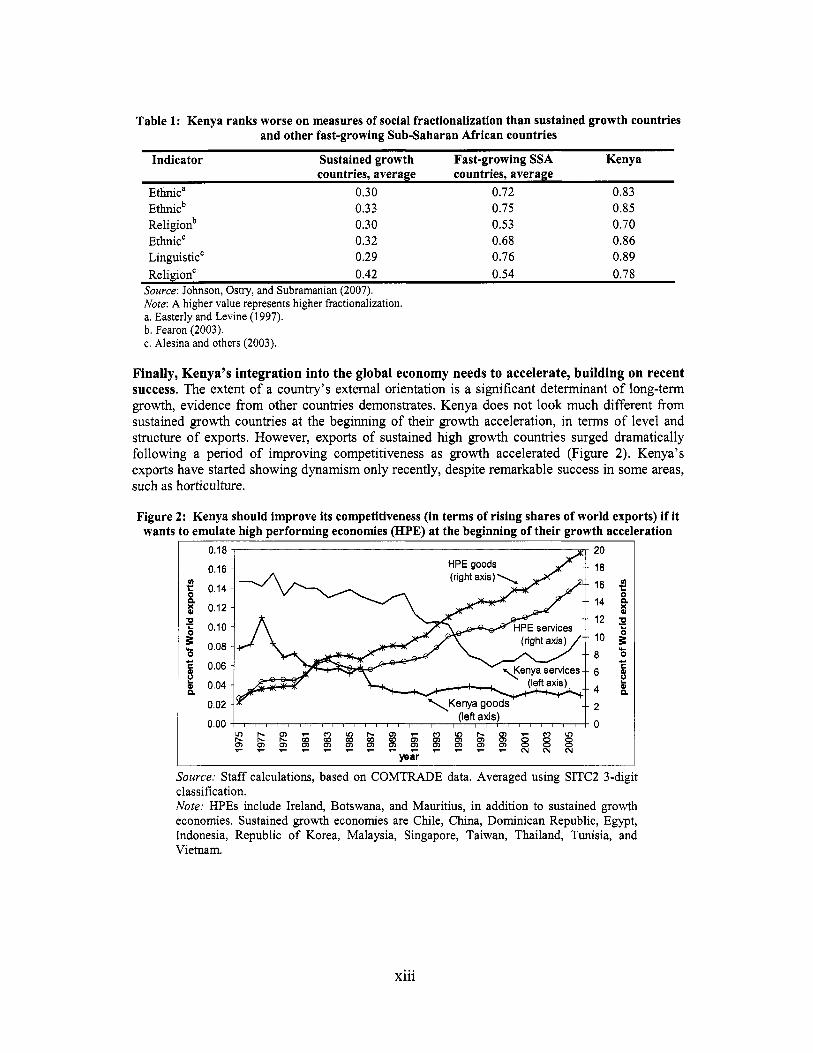
Table 1: Kenya ranks worse on measures of social fractionalization than sustained growth countries and other fast-growing Sub-Saharan African countries
countries, average countries, average Indicator Sustained growth Fast-growing SSA Kenya
E t h i c a 0.30 0.72 0.83
Religionb 0.30 0.53 0.70 Ethnic' 0.32 0.68 0.86 Linguistic' 0.29 0.76 0.89 Religion' 0.42 0.54 0.78
Ethnicb 0.33 0.75 0.85
Source: Johnson, Ostry, and Subramanian (2007). Note: A higher value represents higher fractionalization. a. Easterly and Levine (1 997). b. Fearon (2003). c. Alesina and others (2003).
Finally, Kenya's integration into the global economy needs to accelerate, building on recent success. The extent o f a country's external orientation i s a significant determinant o f long-term growth, evidence from other countries demonstrates. Kenya does not look much different f rom sustained growth countries at the beginning o f their growth acceleration, in terms o f level and structure o f exports. However, exports o f sustained high growth countries surged dramatically following a period o f improving competitiveness as growth accelerated (Figure 2). Kenya's exports have started showing dynamism only recently, despite remarkable success in some areas, such as horticulture.
Figure 2: Kenya should improve its competitiveness (in terms of rising shares of world exports) if it wants to emulate high performing economies (HPE) at the beginning of their growth acceleration
0.18
0.16
2 0.14 x 8 0.12
E 0.10
! $ 0.08
cI 0.06
& 0.04 n 0.02
0.00
0
Source: Staff calculations, based on COMTRADE data. Averaged using SITC2 3-digit classification. Note: HPEs include Ireland, Botswana, and Mauritius, in addition to sustained growth economies. Sustained growth economies are Chile, China, Dominican Republic, Egypt, Indonesia, Republic o f Korea, Malaysia, Singapore, Taiwan, Thailand, Tunisia, and Vietnam.
xi i i

Binding Constraints to Accelerating Growth in the Next Five Years
Investment i s low in Kenya for two broad reasons. First, returns to investment are l o w and r isks to appropriation o f returns by private investors are high. Second, access to finance i s l imited and costs are high for certain categories o f borrowers, such as rural and small entrepreneurs. Returns to investment are low, in turn, mainly because business costs other than the cost o f labor and capital are high. These include the high cost and unreliable supply o f infrastructure services, particularly transportation and energy, as wel l as opportunity costs due to logistics bottlenecks, such as delays o f shipments and trading costs at the border. Risks due to corruption and the security situation remain serious deterrents to investment.
The high costs of business have reduced Kenya’s global competitiveness in tradable goods and services. The extent o f loss o f competitiveness i s highlighted in Table 2, which compares Kenya with a number o f countries. To these costs must be added opportunity costs o f delays due to logistics bottlenecks. Largely because o f these costs, Kenya i s rated l o w on various cross- country indexes o f global competitiveness.
Table 2: Costs o f crime, security, bribes, and lost production are several times higher in Kenya than in other countries
Cost as % of sales Kenya China India S. Africa Senegal Tanzania Uganda (2002) (2006) (2003) (2003) (2006) (2006)
Production lost due to crime 3.9 0.3 0.2 0.6 1 .o 1.1 1 .o Payment for security 2.9 0.8 1.3 0.9 1.5 2.3 1.4 Bribes 3.6 1.9 2.1 0.3 0.4 3.4 3.7 Production lost in transit 2.6 1.2 0.8 0.8 n.a. 1.6 1.2 Production lost due to 7.1 2.0 7.8 0.9 5.1 10.7 10.2 power outages Total costs 20.1 6.2 12.2 3.5 n.a. 19.1 17.5
Source; ICA 2007 -- not available
The tax burden (including fees and levies) i s perceived to be high. Experience elsewhere suggests that negative perceptions about the tax burden could be rooted in unreliable and costly public services. Given these perceptions, further analysis i s needed to establish if tax levels constrain new investment or otherwise create large distortions.
Investment by smaller businesses could be constrained because of poor and costly access to finance. One reason for these perceptions appears to be the high cost o f collateral requirements in Kenya. Informal businesses also have greater problem in accessing credit. Access to credit declines as one moves from urban to rural areas and i s the thinnest in arid areas.
A Macro Perspective on the Feasibility of Vision 2030’s Goal of 10 Percent Growth
Vision 2030’s goal of 10 percent long-run growth i s ambitious, considering that Kenya’s average annual GDP growth rate was around 3 percent from 1980 to 2005. T o put the goal in an international perspective, only ten economies with population greater than 1 mi l l ion achieved an average per capita growth rate higher than 4 percent f rom 1980 to 2005. Only China was able to achieve an average growth rate o f about 10 percent during this period.
For the long-run high growth rates that Kenya aspires to achieve, it will be necessary to make strong long-run progress along multiple fronts, according to the analysis carried out for
xiv

this report: raising growth o f total factor productivity (TFP); attracting foreign direct investment (FDI) and foreign aid; and mobil izing domestic savings.
To accelerate growth, rapid improvement in total factor productivity (TFP) will be critical. Reducing business costs and improving integration with the global economy through trade and investment would provide sources for enhancing total factor productivity. A target contribution o f about 2 percent to overall growth by TFP growth could provide a reasonable challenge. In comparison, TFP growth contributed 1.8 percent per annum to the per capita growth rate during 2003-06.
To support capital accumulation, there i s considerable scope for greater use of foreign savings, in the form of foreign direct investment and remittances (Figure 3). Kenya’s private savings rate i s relatively l o w and i s expected to improve slowly. A rapid increase in private savings rate would require an init ial slowdown in the growth o f personal consumption. Therefore, foreign savings in the form o f foreign direct investment (FDI) could help relax the domestic savings constraint, especially in the beginning o f the period o f growth acceleration.
Attracting foreign direct investment i s especially important. FDI would bring with it newer technology and newer products and help improve productivity, as happened in the horticulture and garments sectors. Indeed, Kenya i s likely to rely considerably for i t s productivity growth on technological change embodied in new investment. Lastly, FDI i s l ikely to be a source o f access to other markets, particularly in niche products, as has happened in East Asia. FDI would increase as the public infrastructure, crime, and security situation improve.
Figure 3: FDI i s miniscule and aid flows also have stagnated and remain at a low level
18 1 16 14
& 12 5 10
f 8
Q
c1
k 6 4 2 0
year
Source: WDI database, World Bank.
Flows of foreign aid could go up, as well. They have been stagnant at around 3 percent o f GDP in the past five years. Improvements in governance and investment climate, combined with init ial signs o f success, have the potential to convince aid providers that additional aid would be put to good use. Kenya should work with aid providers to ensure that transaction costs o f a id are low, that aid i s predictable, and that i t goes into priorities for growth and poverty reduction. Too much aid going into the services sectors would l ikely impede efforts to maintain a competitive real
xv

exchange rate. The trick would also be to ensure that foreign aid does not dampen revenue efforts. The caveat about the revenue effort i s important because a l o w level o f a id appears to have motivated fiscal reforms in Kenya in1990s.
A Recommended Growth Strategy
Assuming continued macroeconomic stability and that Kenya can keep political risk low, the growth strategy should focus on relaxing other constraints to accelerating and sustaining growth.
To accelerate growth, attention should be paid to reducing the cost o f transportation services including logistics and telecommunication services, and improving the reliability of energy supply; reducing the costs and risk that stem from inadequate security and corruption; and improving access to finance to small and rural entrepreneurs.
Reducing business costs would improve productivity. I t would also enhance international competitiveness and thereby improve Kenya’s integration into global economy. Additional policy actions could support faster integration into the fast-growing global economy.
The discussion that follows drills down into selected elements o f the growth strategy outlined above. Some elements are not covered by this report; these are policy issues in the energy sector, access to finance issues, and reducing corruption and improving security. Some areas need future analytical work. These are discussed in Chapter 1.
Pursuing Fiscal Policy with Growth Objectives
Kenya appears to have some fiscal space for increased infrastructure spending. T h e goal o f fiscal policy in the next five years should be to “expand fiscal space” for infrastructure and social spending (to accelerate attainment o f the Mi l lennium Development Goals) without compromising the solvency o f public finances. T o this end, Kenya should:
Tap concessional resources for high return projects. Largely untapped concessional resources should be used effectively to meet infrastructure needs. Taking on any nonconcessional financing (such as Eurobonds) should be explicitly l inked to projects with unquestionably high rates o f return.
Improve the institutional mechanism for selecting high-return projects. Currently, there does not appear to be a systematic process for identifying capital projects based o n economic analysis. There i s ambiguity about the respective roles o f the Ministry o f Finance (MoF) and line ministries on individual project selection. An institutional mechanism should be established for developing a pipeline o f high-return projects us ing consistent cost benef i t analysis and project appraisal techniques. The M o F should also issue standard project identification and appraisal guidelines, supplemented with sector-specific guidelines for demand and benefit measurement.
Improve the efficiency of public spending. Kenyan policymakers have long been sensitive to the need to improve value for money. The current government has focused attention o n results, which aims to improve outputs for a given level o f inputs. The prime sectors for attention to efficiency are education, health, and roads, since these sectors are important to human and physical capital accumulat ion and hence long-run growth, and are the biggest public spenders.
xvi

Box 2: Improving Value for Money in Education, Health, and Roads
In the education sector, the fiscal challenge i s to finance the ongoing expansion o f education on a sustainable basis and maintain or improve quality o f education outcomes. The principal challenges are to improve completion at primary school, increase enrollment in lagging regions, and increase opportunities to go o n to study at secondary school without damaging quality. Efficiency gains and targeted policies wil l be required to keep within the medium-term resource envelope, which remains reasonable at 7 percent o f GDP. Solutions wil l primari ly come f rom improving the use o f teachers, making the most o f nonformal, nonpublic providers, reducing repetition, and improving accountability for household expenditures.
In the health sector, improving efficiency and effectiveness o f public sector spending is o f paramount importance. The challenges include improving management and accountability for publ ic funds and health results, regulation over private sector provision, and increasing the rate at which donor and government commitments turn into actual spending and service delivery. There i s scope for improving efficiency o f hospital-provided curative services-which constitute around ha l f o f government’s health spending-by strengthening financial management. Greater use o f district hospitals could lower overall unit costs o f hospital care. There i s scope to rebalance staff to address shortages and improve productivity; t o improve efficiency in drug and medical supplies; and to improve budget uti l ization considerably through decentralizing.
In the roads sector, priori ty po l icy actions to improve value for money have been identified; n o w they need to be implemented. They include: improving planning and preparation o f projects; choosing projects with high rates o f return; adhering to good procurement procedures and practices; and strengthening o f supervision, monitoring, and evaluation. Putting the new institutional structure in place would help, but the government attention should remain f d y focused o n the above objectives.
Encourage the inflow of remittances. Remittances have reached up to the level o f 5 percent o f GDP in the past. Whi le a large part o f the remittances generally finance consumption, remittances could finance investment directly or could lead to increased private savings. The government could explore innovative instruments such as diaspora bonds to attract higher savings from the Kenyans living abroad (see Chapter 6).
Improve the enabling environment for Private Participation in Infrastructure (PPI), to leverage public resources with the private resources. Kenya’s experience with private investment in infkastructure fkom 1990 to 2007 has been mixed. There are examples both o f outstanding success (in telecommunications) and o f failures (in power and port projects). T h i s experience has yielded several lessons. First, overall, Kenya has followed an unstructured approach to PPI. Developing institutional support for public-private partnerships (PPP) to implement transactions in a transparent and effective manner should be a priority. Second, an effective regulatory regime i s important to mitigate risk to private providers, especially in the energy sector and transport sector. Third, local capital markets should be developed. Finally, i t i s important to manage the politics o f PPP. The unsuccessful privatization o f Mombasa container terminal i s an example where political considerations have delayed a good economic decision. Confidence and t rust can be built by involving stakeholders, maintaining transparency, and generating quick results.
Establish adequate institutional arrangements for project analysis, negotiation, implementation, and monitoring o f PPP transactions. Well-defined institutional arrangements such as competitive bidding, clear bid evaluation criteria, disclosure o f winning bidder and the bid price, and putting the transaction agreements in public domain to provide oversight are also needed to make the process transparent. The government can demonstrate i t s commitment to PPP by publishing a pol icy in the National Gazette. The government should consider establishing a
xvii
PPP Secretariat in the M o F and use it to evaluate PPP undertaken by line ministries. In the interim, the M o F should take stock o f a l l large PPP that are in the procurement stage to ensure that such deals are both affordable and do not result in a level o f financial exposure that i s unacceptable.
Steps to Improve Transport and Telecommunications Services
Improve the efficiency of the Mombasa port. This i s the single most important step that policymakers could take to improve global competitiveness. The port i s critical to reducing logistics costs and increasing opportunities for Kenya to participate in global production chains. Despite ongoing reforms, the Mombasa port i s plagued by inefficient handling o f containers and bureaucratic procedures, resulting in long waits and dwell times. The government should give priority to completing the ongoing modernization program o f the port, including moving to a computer-based system to organize and manage container stacking and storage. The government should implement the decision to convert the Kenya Ports Authority (KPA) into a landlord port authority. I t should also separate the commercial and regulatory functions, and put commercial operations into the private sector through concessions.
Give priority to the rehabilitation, and routine and periodic maintenance, o f the existing classified road network. Kenya has an extensive road network. However, among the main trading routes, many roads are in less than “good” condition, which raises costs and hampers Kenya’s competitiveness. Rehabilitation o f the existing classified network to a maintainable level should be a top priority. Decisions to expand the capacity o f the existing roads or the road network should be made only based o n rigorous cost-benefit analysis, which has not routinely happened in the past.
Implement and monitor logistics reforms as a package, since the weakest link in the supply chain can act as a bottleneck for the entire chain. Reducing wait time at the port, weighbridges, and borders i s at least as important as expanding the capacity o f existing roads, f rom a trade logistics point o f view. Similarly, giving priority to rehabilitating certain sections o f roads, such as those that are acting as a bottleneck to off-take from the port, would y ie ld high benefits. A set o f logistics indicators should be developed to benchmark reforms and progress (see Wor ld Bank 2007a). The private sector should occupy an important role in driving forward reform, as well as in some advisory capacity.
So the economy can benefit from lower costs and more reliable telecommunications services, quickly implement plans to connect to a global fiber optic cable through any of the current projects (such as EASSy and TEAMS). This i s particularly important if Kenya i s to develop a competitive advantage in newer telecommunications products. The lack o f affordable international backbone bandwidth i s a major constraint to improving productivity across the economy, and probably the biggest obstacle to the development o f the business process outsourcing (BPO) and other ICT-related industry. Continued liberalization in the sector will reduce costs further. The fixed line market i s one o f the most restricted. Introducing a Second National Operator (SNO) and a third mobile operator, as wel l as and privatizing the remaining shares in Telkom Kenya Limited, offer considerable opportunities to improve services through increased competition and technology transfer. Bringing down the prices o f mobile phones handsets and calls will help extend coverage and boost Kenya’s competitiveness. Kenya should also consider jo in ing the optional WTO Information Technology Agreement (ITA). This could reduce the cost o f I C T inputs to businesses by binding Kenya to eliminate customs duties on major information technology products.
xviii

Steps to Increase Global Integration
Deepen regional integration within the countries of the East African Community (EAC). Kenya’s exports to neighboring countries have expanded in the past few years. Regional trade will therefore remain important. Deepening o f regional integration i s also desirable because regional trade helps in integrating fragmented markets, allowing economies o f scale and helping in developing new exports to third markets.
Push into expanding trade with middle- and high-income countries (Figure 4). Kenya should use i t s membership in trade groups-EAC and COMESA-to consolidate further trade openness, rather than secure trade-diverting preferences. In areas where Kenya cannot move speedily enough through these trade groups, it should liberalize unilaterally, with an eye on global competitiveness beyond the borders o f regional partners. In addition, Kenya should continue i t s efforts to secure access to markets outside the region, particularly in Asia. Kenya has recently signed an interim Economic Partnership Agreement (EPA) with the European Union (EU) joint ly with i t s partners in the East Afkican Community. Kenya will need to continue negotiations with the EU in 2008 for a full EPA and participate effectively in multilateral negotiations. The multilateral route may be the best way to negotiate market access to dynamic Asian markets, where Kenyan products face high tar i f f barriers.
Figure 4: Kenya needs to expand its trade with middle- and high-income countries (percent of total trade)
100 I I
C E
! P
90 80 low-income
hig h-income 20
lo 0 ~
year
Source: Staff calculations, based on COMTRADE data,
Use an industry-wide or sector focus to address micro-constraints faced by the private sector in key areas of export growth. This i s the approach taken by Vision 2030. The Vision identifies manufacturing, high-valued services based o n Internet, and tourism as areas where a sectorhndustry lens could prove useful. Horticulture and tea sectors are good examples where government provided helpful nonfinancial support. Similarly, the National Export Strategy Implementation Act ion Plan 2005 (GoK 2005a) developed a l i s t o f sensible policy actions to support various products and subsectors. (See Chapter 4 o f this report for actions in the Information and Communications Technology (ICT) sector, and Appendix G for preliminary findings o f an ongoing Wor ld Bank study o n tourism.) Generally, the objective o f government involvement would not be to provide financial support or make public investments, but to try to identify sector-specific issues-such as government/market failures-and provide solutions, in
xix

close dialogue with industry groups and associations, to recover, maintain, or improve Kenya’s competitive position.
Maintain a competitive real exchange rate. Many o f the policy actions discussed in this executive summary would help keep the real exchange rate competitive. For example, an improvement in productivity in the services sector through reduction o f costs would help maintain competitiveness. Similarly, further trade liberalization would help through increased imports. The report would caution against active attempts to manage the nominal exchange rate. More analytical work needs to be done to identify other policies that could help in maintaining a competitive real exchange rate.
A Strong and Positive Role for Government
The growth strategy presented in this report implies a strong, positive, and enabling role for the government.
w Improving the investment climate and adopting appropriate trade policy to enhance competitiveness i s largely in the domain o f the government. T h e government has made a good beginning in identifying regulatory hurdles and streamlining administrative processes faced by the businesses. Substantial and lasting benefits will accrue only if these re foms are deepened. Some sectors could also benefit f rom sector-specific policy actions.
w Managing public finances to create fiscal space for social spending and infrastructure spending without compromising the solvency o f public finances i s government’s job. The challenge before the government i s to put a system in place for selecting projects and programs with high rates o f retum and improving the efficiency o f spending in the ministries o f education, health, and roads.
w Pursuing an implementation/results orientation in the public sector would be critical to success o f the growth strategy. The government has been successful in the past two years in improving focus on results. Yet an inordinate amount o f government time continues to be devoted to preparing and discussing comprehensive strategies and plans. Whi le short and sharply focused studies may be needed in some areas, attention should shift to implementing plans and finding pragmatic solutions to immediate issues and problems at hand.
w Improving policy coordination in the government would be important for trade and tourism. In both these areas there are a large number o f agencies with overlapping mandates. Improvement in Trade logistics, for example, needs coordination between the Treasury, Transport, and Trade Ministries.
w Deepening civil service capacity would improve implementation. T h i s does not necessarily mean higher wages for top c i v i l servants. Instead, i t could mean developing a cadre o f qualified senior c i v i l servants with well-defined career succession plans.
w Establishing strong feedback mechanisms to improve implementation and fine-tune policy. Feedback mechanisms are not only about collecting good quality information, but also about making changes to pol icy in response. They also include evaluation o f government programs and two-way open communication with the private sector.
xx

Above all, the growth strategy should be part o f politically shared development strategy. The Vis ion 2030 process has created a political convergence o f sorts on the development strategy. I t remains to be seen how robust it i s to alternative leadership. Continuing efforts to strengthen political stability (including avoidance o f scandals) i s critical.
xxi

1. INTRODUCTION 1.1 The Kenyan economy has come a long way since 2002. Political uncertainty loomed before the December 2002 elections. It was not clear if elections would loosen the gnp o f the incumbent president, whose 24 years in power were r i fe with corruption and had severely hampered the economy. The political uncertainty came with attendant uncertainty about economic outlook. Investor confidence was l o w and the government’s relations with donors were at an impasse. Interest rates were high, as the government borrowed heavily f rom the domestic market to shore up fiscal resources. In short, the economy was moribund. The peaceful change in political leadership produced a large economic dividend. Starting in 2003/4, there was a perceptible change for the better in Kenya’s economic outcomes. Interest rates declined, external assistance started f lowing in, investor confidence jumped, and growth prospects improved (see Appendix A).
1.2 The N A R C government built upon the opportunity provided by the peaceful political transition. I t strengthened the inherited foundations for growth during i t s f ive years in office. I t strengthened macroeconomic stability through continued fiscal discipline. It built upon the good feeling created by the peaceful political transition o f 2002, and promoted an environment where businesses were not overly concerned about politics. As a result, the economy continued to hum along well in a pre-election year, something unthinkable five years ago. I t also deepened structural reforms: regulatory reforms were initiated; parastatal reforms were carried out in the telecommunications, railway, and energy sectors; and trade openness improved with the formation o f Eastern Africa Community (EAC). Growth surged as the economy recovered from a decade-old period o f stagnation.
1.3 However, the NARC administration did not go far enough. I t did not make a serious dent on the problem of corruption, crime, and insecurity, which are al l equally important elements o f the business-government relationship. In addition, the widespread perception that political risk had fallen turned out to be premature and deeper determinants o f polit ical instability in Kenya came to the top. Structural reforms in the financial sector have made l imi ted progress; specifically the issue o f l o w efficiency in government-influenced banks remains unaddressed. M u c h needed reforms at Mombasa port have not progressed far enough, either.
1.4 The postelection crisis demonstrated the fragility o f Kenya’s polit ical stability. I t raised questions about the strength o f institutions in ensuring peaceful polit ical transition. The crisis also demonstrated the importance o f political stability to economic development in Kenya. There was almost a unanimous view during the crisis that Kenya’s growth spell would come to an abrupt end in the absence o f political certainty.
1.5 The challenge before the new government i s to take the economy to the next phase o f development. The central message o f this report i s that despite the recovery, the economy i s not yet at a stage o f development where higher or even current growth rates-around 6 percent per y e a r - c a n be safely assumed. Serious bottlenecks to investment, and thus to growth, continue. Infrastructure services remain costly and unreliable. Institutions at a micro level, such as those dealing with trading across borders and providing security, are not efficient and do not deliver effectively. The government has not managed to make a major dent in the problem o f corruption. Above all, despite being better developed relative to regional neighbors, the economy i s
1

underdeveloped relative to faster growing economies in the world with which Kenya should compare itself.
1.6 Poverty has declined since 1997, but the number o f poor remains large and poverty remains widespread. The percentage o f individuals living below the poverty l ine declined slightly between 1997 and 2005/6, f rom 52.6 percent to 46.6 percent, the Kenya National Bureau of Statistics (KNBS) reports (Government o f Kenya, GoK, 2007a).* However, there are significant geographical differences in the incidence o f poverty. The proportion o f the population below the absolute poverty l ine i s the lowest in Central province, followed by Rift Valley, Nyanza, Eastern, Western, Coast, and North Eastern provinces, according to the K N B S report.
1.7 Creating enough jobs for a burgeoning labor force remains a major challenge for the government. A report on labor matters being prepared by the Wor ld Bank (World Bank 2007c) estimates that the Kenyan labor force i s growing at an annual rate o f about 2 percent. With this rate o f growth, an estimated 350,000 to 400,000 new entrants seek jobs every yearn3 Inabil ity to create good jobs at a pace faster than the growth o f labor force has resulted in open unemployment, estimated at 1.4 million-about 10.5 percent o f the labor force (Pollin, Githinji, and Heintz 2007). The problem i s more acute in urban areas due to accelerating urbanization.
1.8 Against this background, the Kenyan leadership has rightly identified strong broad-based growth as the main economic goal o f Vision 2030. Experience elsewhere shows that growth i s the basic key to reducing poverty and creating jobs. This has been Kenya’s experience as well. During the 1990s, lack o f growth coincided with increase in poverty and decline in human development indicators. However, these trends were arrested, or even reversed in some cases, with the ignition o f growth after 2002.
The Objective and Scope o f this Report
1.9 The main objective o f this report i s to help inform the government’s medium-tern plans for implementing Vis ion 2030. The report attempts to do this in two ways. First, i t applies the insights from the recent empirical work and experience in other high growth countries to Kenya to propose a growth strategy. The strategy, so developed, would validate and l ikely help sharpen the broad thrust and direction o f the ongoing reform efforts. Second, i t d r i l l s down selectively into certain aspects o f the growth strategy to generate a set o f specific pol icy and institutional reforms. The net result i s a reform agenda consisting o f detailed pol icy actions that are expected to add up to a well-articulated growth strategy.
1.10 Apart f rom influencing government action, the report i s also expected to influence thinking about growth in policy circles outside the government. In i t s analysis, the report draws upon the state-of-the-art thinking on the issues o f growth, which i s going through considerable rethinking among economists and practitioners. Among several departures f rom the conventional view, the new thinking shies away from providing prepackaged answers to an economy’s problems and emphasizes country-specific analysis instead. Similarly, the focus has shifted f rom
* The estimate o f the incidence o f poverty for 2005/6 i s not directly comparable to the earlier one because o f differences in methodology, so these results need to be treated with caution.
Wor ld Bank ( 2 0 0 7 ~ ) uses labor force data f r o m 1998. I t i s possible that the rate o f growth o f labor force has slowed down since then. Pollin, Githinji, and Heintz (2007) estimate a labor force o f 13.5 m i l l i on in 2005/06, which wou ld be consistent with a growth rate slower than 2 percent. These estimates would be reconciled once K I H B S micro-data become available to a wider poo l o f researchers.
2

identifying correlates o f growth at a macroeconomic level (as in growth regressions), to identifying constraints to growth at a microeconomic level. This report reflects this shift in thinking and draws mainly upon analysis specific to Kenya (such as growth diagnostics and Investment Climate Assessment, ICA) to arrive at conclusions relevant to policy choices. We would hope that the approach and methodologies o f this report influence future thinking about growth issues in Kenya.
1.1 1 The report i s deliberately selective in scope and coverage, rather than comprehensive. It lays a particular emphasis on the economic pillar o f the Vision 20304 and more specifically on how to overcome the constraints to accelerating growth in the medium term. There are two types o f omissions. It leaves out several areas, which would be important components o f an overall development strategy. Moreover, some areas that are identified as important components o f the growth strategy are not developed fully in the report. Examples o f both types o f omissions are described below. Various passages in the report also identify areas that would need further analytical work.
1.12 Most importantly, the report leaves out discussion about distributional consequences o f growth and their implications for the growth strategy. This discussion would be relevant for the social pil lar o f Vis ion 2030. It i s wel l accepted that growth helps everyone, including the poor. At the same time, benefits o f growth can be unevenly distributed; for example, across different regions o f the country, between labor and owners o f capital, between men and women, and between low-skilled and high-skilled workers. Given the high levels o f poverty and inequality, patterns o f growth are material to a discussion o f growth strategy in Kenya.
1.13 As an example o f the importance o f patterns and sources o f growth to poverty, research shows that in Kenya, growth in the agriculture sector would have a much bigger impact on poverty than that in other sectors because more poor are located in rural areas and are engaged in agricultural activities (Kiringai, Thurlow, and Wanjala 2006).5 Therefore, a strategy for improving agricultural productivity should be seen as an integral part o f the development strategy that gives attention to poverty and employment. The Bank i s engaged in ongoing work on agriculture sector policies for enhancing productivity growth. That work should be read as a complement to the growth strategy described in this report. Appendix B has a br ie f excerpt o f preliminary recommendations coming out o f that work.
1.14 In Kenya, informal employment i s large and has been a concern for policymakers for a long time. Many aspects o f the growth strategy proposed in this report such as improving access to finance for rural and small entrepreneurs and reducing regulatory hurdles would be important components o f a development strategy that gives attention to informal employment. However, this report does not go into a deeper discussion o f what additional incentives could be created for informal businesses to formalize. Given recent data collection efforts, i t should be possible to carry out more policy work o n informal sector in the fbture.
1.15 A related area i s the issue o f relatively high inequality o f income, which even has implications for sustainability o f growth. The spatial dimension o f income inequality and the role o f public action, especially public goods, in addressing inequality i s an area for further analysis, which i s partly being covered by the ongoing jo in t work o n the poverty assessment by the Government o f Kenya (GoK) and the Wor ld Bank.
The other two pil lars are the social pillar and the political pillar.
On the other hand, growth in the industrial and services sectors has a bigger impact o n reducing urban 5
unemployment, which i s an important social and pol i t ical goal in itself.
3

1.16 detail in this report, but are material to discussion o f such strategy in Kenya, are the following:
Some aspects o f the growth strategy proposed by this report, which are not covered in
Policy issues in the energy sector. The report identifies the high cost and poor reliabil i ty o f electricity services (frequent outages) as one o f the major complaints o f private sector. The key issues relate to regulatory efficiency: in particular, ensuring the separation o f the Energy Regulatory Commission from polit ical considerations, pricing o f electricity to maintain the financial viability o f power companies, developing incentives for power sector operator to improve operational efficiency, and developing a plan for energy security over the longer term (for example, by facilitating regional energy trade). Another set o f issues are ensuring the use o f appropriate least-cost criteria to select rural electrification schemes, and defining clearly stated criteria for allocating capital subsidies for rural electrification projects balancing economic, financial, and equity considerations.6
Access tofinance. Based on ICA 2007 and another survey o f financial access (see paragraph 3.15), this report identifies access to financial services, particularly credit services, to be a constraint on investment by small businesses and rural investors. However, specific policy recommendations are not developed, pending further work.
Reducing corruption and improving security. These are the subjects o f ongoing analytical work by donors, and policy actions at several levels in the government. Therefore, this report does not include discussion on governance issues, even though they are identified as important for accelerating growth.
How this Report Relates to Vision 2030
1.17 This report reinforces the findings o f the Vision 2030 document in several areas, adds value in many others, and modifies some. L i ke Vision 2030, this report identifies “securing political stability, achieving balanced fiscal and monetary policy, improving business climate, attracting investments and improving trade, and stimulating productivity” as important economic pre-conditions for sustained growth. Further, this report agrees with the Vis ion that tourism, manufacturing, and service sectors based on information and communication technology (ICT) are l ikely engines for ‘growth. The main value-added by this report, however, i s in providing a consistent macroeconomic framework for thinking about growth process and in throwing light on relative roles o f accumulation and productivity in growth process. In addition, it draws upon rigorous Kenya-specific microeconomic analysis to unbundle productivity, and provides a detailed set o f pol icy actions to improve productivity across the whole economy, including in specific growth-engine sectors. Such analysis, in many places, modifies the findings o f the Vision. For example, o n business climate, this report’s analysis and recommendations draw upon the latest investment climate survey. This survey shows that Kenya’s labor costs do not hurt competitiveness: a finding at odds with the emphasis on labor cost reduction in the Vision.
These issues are being addressed in various ways. In 2007, a major study o f tariffs in power sector was completed by Fitchner (a German consulting fm). In addition, Kenya Power and Lighting Company’s (KPLC) performance contract with the government contains 25 performance targets; seven o f these performance targets are explicit ly included in KPLC’s management contract with Manitoba Hydro. The Wor ld Bank has recently prepared a study with The Earth Institute at Columbia University o n costing o f rural electrification projects.
4

1.18 There are many differences in emphasis and details as well. For example, the Vis ion lays significant emphasis on raising government investment-by as much as (cumulative) $3.5 b i l l ion during the f irst five years o f implementation-for financing new investment projects. Whi le this report advocates making cautious use o f available headroom for domestic borrowing to finance capital projects, i t lays more stress on rehabilitation o f existing infrastructure (such as roads) and cautions against expansion o f infrastructure without careful economic analysis. The report advocates a position that new investments targeted on specific sectors should be lef t to the private sector, with the government sharing the risk in a calculated manner through Public Private Partnership (PPP) transactions and helping develop financial markets further.
1.19 The report i s much less emphatic than the Vis ion about the sectors (identified winners and flagship projects) on which government should focus for delivering the aspired growth. The emphasis o f the report i s instead on reducing business costs and improving productivity. These could be complemented with targeted policy actions to address sector-specific issues-such as governmendmarket failures-and provide solutions, in close dialogue with industry groups and associations. This shift in emphasis has large implications for policy. I t frees up the resources o f the state-the capacity o f policymakers and financial resources-to focus on generic reforms rather than implement and follow-up elaborate grand sector strategies.
5

2. GROWTH-DIAGNOSTICS AND STRATEGY 2.1 After prolonged stagnation, the Kenyan economy finally started to grow after 2002 (Figure 2-1). Remarkably, in 2006, real GDP grew at a rate o f 6.1 percent followed by 7 percent in 2007. During the five years 2003-07, the average growth rate was 5.4 percent per year. Spurred by the economic successes o f the last f ive years, the government has set out in i t s Vision 2030 document, an ambitious target o f 10 percent annual real growth for 20 years f rom 201 1 onward in order to catch up with the East Asian economies and become a middle-income country by 2030.7
Figure 2-1: Annual percent change in total GDP (market prices), 2002-07
8 1 7
6 CI
e 4 P
2
0 2002 2003 2004 2005 2006 2007
year
Source: Economic Survey 2008, KNBS.
2.2 During 2003 to 2007, value addition expanded in a l l sectors o f the economy, but services sector led. Hotels and restaurant, transport and telecommunications, and trading activities together expanded at an annualized 9 percent per year (Figure 2-2). The expansion o f hotel, restaurant, and transport activities largely reflected increased volume o f tourist arrivals. During this period, visitor arrivals increased by about 60 percent due to better marketing, improved perceptions about security, and increased volume o f conference tourism. Transit transportation activities to neighboring countries (Uganda, southern Sudan, and Rwanda) also increased moderately. The demand for mobile telephony and other telecommunication products soared. Given the large size o f the services sector (about 53 percent o f the total economy in 2007), i t s growth contributed more than hal f the total growth in the economy from 2003 to 2007 (Table A- 1, Appendix A). Agricultural output (about 24 percent o f the total economy in 2007) also grew in an impressive manner, led by maize, coffee, and livestock products. The growth in manufacturing sector was less inspiring and resulted largely f rom increased supply o f agricultural inputs for agro-based activities, an increase in clothing production, and cement output.
The onset o f growth i s particularly welcome, since it followed zero or negative per capita income growth in eleven out o f thirteen years from 1991 to 2003 (Figure A-I:, Appendix A). Kenya would need to grow at 7.3 percent a year for 30 years to reach the current per capita income level o f Malaysia. However, encouraging as it may be, the growth rate after 2002 cannot yet be termed “acceleration” as commonly defined in recent growth literature. Hausmann, Pritchett, and Rodrik (2004) define acceleration as the seven-year period during which real per capita GDP grows at rates over 3.5 per cent per year.
6

Figure 2-2: Annual Percent Change in GDP by Main Activity and Its Contribution (YO) to Total GDP Change during 2003-7
Source: Economic Survey 2008, KNBS, Kenya.
2.3 In terms o f expenditure (demand) components, growth during the period 2003 to 2007 was led by gross f ixed capital formation, which expanded at an average rate o f 17 percent per year between 2003 and 2007. Within the capital expenditure component, transport equipment, and machinery and equipment were the main contributors, registering fast annual growth rates o f 25 percent and 27 percent, respectively. The strong growth in expenditure o n machinery and equipment i s a good s ign that businesses were investing in expanding production capacity in response to demand. However, there are indications that the expansion in capacity was more to meet regional demand, which has been expanding. In addition, growth in expenditure on transport equipment was partly for consumption, fueled by easier availability o f consumer credit. Average growth o f exports was 7 percent during this period (Table 2-1): clearly not spectacular. The fastest growing component o f exports was tourism receipts. W h i l e the change in structure o f exports has been encouraging, exports wi l l need to play a more important role if growth i s to be accelerated and sustained (see discussion below).
Table 2-1: Annual Percentage Change in Expenditure on GDP (constant 2001 prices)
Expenditure category 2003 2004 2005 2006 2007* Government consumption 6 0.6 -0.6 1.5 7.2 Private Consumption 2.2 2.4 6.4 7.6 7.3
Exports o f goods and services 7.2 12.8 9.7 3.4 6.0 Gross fixed capital formation -8 7.3 27.9 18.3 13.3
Imports o f goods and services -0.1 12.3 15.0 18.2 12.7 Source: Economic Survey 2008, KNBS. * Provisional.
2.4 When the whole economy i s looked upon as one production unit, a large part o f the increase in output f rom 2003 to 2007 remains unexplained after accounting for increases in physical capital and human capital (educational attainment o f the labor force). Table 2-2 includes a decomposition o f per capita economic growth f rom 2003 to 2007 into growth in stocks o f physical and human capital and the residual component, Total Factor Productivity (TFP).*
* The Bosworth and Collins (2003) methodology i s used for growth accounting. Human capital i s approximated by an index that considers the returns to education and years o f schooling o f Kenyan
7

Physical capital accumulation contributed about one-half o f the total growth per unit o f labor during this period, while TFP growth “explains” the remaining one-half.
Table 2-2: Sources of Economic Growth, Selected Period Averages, 1960-2006
Period Average annual change in GDP Per unit of labor (%) Physical capital Human capital TFP
Contribution to GDP per unit of labor change (%)
1960-1 980 3.0 198 1-1990 0.7 1991-2000 -1.2 200 1-2007 1.6
0.4 -2.0 -1.1 0.9
0.8 1.8 0.1 2.6 1 .o -1.1 0.1 0.5
2003-2007 2.4 1 .o 0.1 1.3 1960-2007 1.4 -0.4 0.6 1.2
Source: Staff calculations. GDP, investment, and labor force data are from World Development Indicators (WDI) database, World Bank. Capital stock data are from Nehru and Dhareshwar (1995). Factor shares in GDP are based on Economic Surveys, KNBS.
2.5 As measured above, TFP growth f rom 2003 to 2007 captures an improvement in the economy’s productivity, as wel l as increased utilization o f existing ~ a p a c i t y . ~ There i s firm-level evidence for both these components. Data f rom the recent Investment Climate Assessment (World Bank 2007h I C A 2007 hereafter) shows that between 2002 and 2006, firm-level TFP improved by about 15 percentage points in manufacturing” and capacity utilization improved by another 23 percentage points. Moreover, businesses, on average, showed an increase in employment without a commensurate increase in physical capital. The last finding i s an indication that businesses were hiring more labor to make use o f the existing capacity before adding fresh capital to expand capacity. (This was quite evident, for example, in the hotel industry.)
2.6 Whi le there i s evidence o f TFP improvement at the level o f f irms, there i s n o clear evidence o f TFP improvement resulting f rom reallocation o f labor and capital across sectors, f rom less productive uses in the economy to uses that are more productive.
2.7 The main question i s to what extent is the recently achieved growth rate sustainable over a longer term. Clearly, several factors came together to enable expansion o f economic activity during 2003-7. Tourist arrivals, regional demand for Kenya’s manufactures and transportation services, consumption demand fueled by remittances, and domestic demand for telecommunications services-all expanded. A favorable business climate enabled businesses to respond to increased demand by improving capacity utilization, expanding capacity, and
population. For th is purpose, estimates o f returns to education by level are borrowed f rom Appleton, Bigsten, and Manda (1999) for 1978 and 1986, and f rom Manda, Mwabu, and K imeny i (2004) for 1994. Barro and Lee (2000) estimates o n average years o f schooling (primary, secondary and higher education) for 1960 to 1999 are used. Returns o n education and schooling years data are extrapolated as needed. The human capital index is multiplicative o n the returns to education by level raised to the average years o f education by year.
Whi le it would be o f interest t o know the relative magnitudes o f the two components, i t i s not feasible to disentangle the two at a macroeconomic level for a short period o f f ive years.
lo ICA (2007) reports significant improvement in labor productivity and use o f capital inputs, as well.
8

improving productivity. Clearly, both temporary and more permanent elements have contributed to Kenya’s growth recovery. T o assess the sustainability o f growth over a longer term, the discussion n o w turns to factors that initiated recovery in the f i rs t place and have fueled it in the past f ive years.
Foundations of Growth Recovery
2.8 T h e onset o f growth in 2003 coincided with a perceptible change for the better in other macroeconomic outcomes. Specifically, the analysis shows that the pos i t ive trends are b e i n g d r i ven by three main factors. T h e f i rst factor i s the lagged effects o f price, trade, exchange rate, and interest rate l iberalization. T h e second i s macroeconomic stabi l i ty based on reduced indebtedness, and eff ic ient and significant domestic revenue mobilization f o l l o w i n g sustained r e f o r m in tax p o l i c y and administration. Third are perceptions about improved pol i t ica l stabi l i ty after the successful 2002 elections. Importantly, the f i rst two factors were largely stimulated by reduced donor a id and K e n y a n attempts to restore credib i l i ty after the Goldenberg scandal. T h e last factor had a ro le to play in lower ing rea l interest rates.
Box 2-1: Kenya’s Economic Liberalization Economic liberalization in Kenya was launched in January 1986, when the government decided to shift from dirigisme to freeing up the economy, as explained in Sessional Paper Number 1 (GOK 1986). After the Berlin Wall collapsed in November 1989, a series o f incidents intervened and Kenya began to lose its geopolitical bargaining power (as i t was the most prominent market economy in East Africa and the US. fleet was able to use the Mombasa port). Among these events were the following:
0
0
0
November 1991: Emphasis in Consultative Group shifted abruptly from economics to governance. Donors froze aid. January 1992: IMF refused to go to i t s Board with an unfhanced gap. The World Bank pulled back loans in response. 1992: Kenya started building up external debt arrears; foreign exchange becomes the critical constraint. End 1994: IMF shadow program enabled Paris Club rescheduling.
In the interim, the Goldenberg scandal hit (1991-3), interest rates on Treasury bills soared to 80 percent because o f a loss o f monetary control, and banks allied to Goldenberg’s Exchange Bank collapsed. Liberalization continued; by the end o f 1994, prices, interest rates and the exchange rate had been liberalized. In the meanwhile, flows o f aid became small and unpredictable. Since 1995, net foreign transfers to the government have been negative except for 2001, when a debt rescheduling occurred. As a result, domestic borrowing served not only to finance the deficit but also to pay down external debt.
Private sector firms interviewed in July 2006 invariably pointed to the liberalization, which picked up steam in 1993-94, as a critical, positive turning point for Kenya’s economy.
Source; Various meetings with academicians, private sector firms, IMF files.
2.9 B o x 2-1 briefly describes the main events related to economic liberalization. There i s anecdotal evidence that economic liberalization decreased protection and increased competition and that the resulting compression o f profit margins forced f i r m s to become more efficient. For example, about two-thirds o f the manufacturing f i r m s surveyed in I C A 2007 report that in the past three years they have introduced a ‘new or significantly improved process o f production’-a higher rate o f innovation than the average for counties in SSA. Manda (2004) records the churning in the labor market in the1990s’ fo l lowing the liberalization. In addition, cutting o f
9

import tar i f fs also helped improve the external orientation o f f i r m s by lowering the cost o f imported machinery and raw materials (and reducing the tax on exports, by Lerner symmetry).” External orientation o f f i r m s further improved after the East African Community (EAC) Customs Union came into being in 2005. For example, the simple average tar i f f fe l l f rom 16.8 percent in 2004 to 12.9 percent after the introduction o f the E A C Common External Tar i f f (CET).
Improved Business Environment-Macroeconomic Stability Due to Reduced Indebtedness
2.10 Expansion in private investment was enabled by improved business environment. T w o aspects o f improved business environment were fundamental: one, macroeconomic policy credibility; and two, perception o f the private sector that business decisions could be made without caring for politics. These two aspects together could be seen as behind the decline in country risk, which was an important factor behind the significant decline in real interest rates. At the microeconomic level, investment horizons lengthened because o f improved certainty about government policies, which in turn, would result in lower hurdle rates o f return for investment projects. The overall impact was a perceptible change for the better in Kenya’s macroeconomic outcomes.
2.1 1 Kenya’s current macroeconomic policy credibility rests on more than a decade o f reform efforts Box 2-2. I t rests largely on the successful fiscal consolidation after Goldenberg scandal and a significant decline in government indebtedness since 199Y96. In addition, Kenya has been able to lay a solid foundation for solvency o f public finances based on efficient and significant own-revenue mobilization at about 21 percent o f GDP. Indeed, Kenya’s ability to issue nominal (Le., un-indexed) debt at single-digit interest rates i s impressive. This indicates a high degree o f macro pol icy credibility and the absence o f “debt intolerance.”
Box 2-2: Macro Stability and Solvency of Public Finances
Macroeconomic stability does not depend upon today’s fiscal deficit and inf lat ion alone. I t needs to be seen in terms o f a longer-term solvency o f public finances-for which future growth and tax collection are equally important. Recent empirical work shows that a longer-term perspective o n macroeconomic stability has two components. The f i r s t i s a comprehensive approach to managing public finances. That is, apart f rom today’s fiscal deficit, bailouts, and contingent liabilities, the efficiency and predictabil ity o f taxation, the composition o f expenditures, and the rate o f return on public investments are equally important. The second component i s sound macro-micro linkages. Finns and banks must have incentives to operate efficiently, thereby creating strong micro-foundations for future growth and taxes: essential underpinnings for a solvent government. Finns and banks, in turn, require macro stability, efficient taxation, reasonable real interest rates, competitive real exchange rates, and good infrastructure. These are directly influenced by macro management and decisions o n the composition o f public expenditures.
2.12 Figure 2-3 shows the path o f Kenya’s debt-to-GDP ratio, as wel l as i t s currency composition over the period 1995/6 to 2006/7. The government debt-to-GDP ratio has fallen by some 27-percentage points over this period to a level o f 46 percent by 2006/7, while the share o f foreign-currency denominated debt has decreased from about 80 percent o f total debt in 1996/7 to 60 percent in 2006/7.
Lerner Symmetry i s a result in trade theory that states that if trade i s balanced, an ad valorem tar i f f o n imports has the same impact o n relative prices as a tax o n exports.
10

Figure 2-3: Public and External Debt, 1995/6-2006/7
70 h I
50
20
10
0 1995196 1996197 1997198 1998199 1999100 2000101 2001102 2002103 2003104 2004105 2005106 2006107
Years
Source: Staff calculations, based on data from Kenyan authorities, IMF Staff Reports, and World Bank. Note: Domestic debt i s net o f government deposits in the banking system and on-lending. External debt i s on a gross basis and includes borrowings from the IMF.
2.13 Table 2-3 provides more insight into the factors explaining the declining indebtedness by apportioning the change in indebtedness to the primary fiscal balance, growth, real interest and exchange rates, and other factors. In order to capture the recent improvement in macroeconomic conditions, divides the past decade into two sub-periods: 1996197-2002103 and 2003104-2006107. For each sub-period, the average annual change in the debt-to-GDP ratio i s given, as wel l as the portion attributable to the factors mentioned above. The biggest factor explaining the sharp decline in the debt-GDP ratio i s the jo int effect o f the GDP growth and the real appreciation o f the Kenyan shilling after 2003. The decline in real interest rates also helped. The contribution o f real interest rate to the rise in GDP-debt ratio was greatly reduced after 2003.''
l2 This report does not go into a detailed analysis o f reasons for the decline in interest rates after 2002. A l ike ly reason for the decline appears to be the fa l l in country risk premium, discussed in Appendix D along with other plausible reasons.
11

Table 2-3: Factors Explaining Decline in Indebtedness, 1996/7-2006/7 (percent of GDP, annual average)
199617- 200314- 199617- 200213 200617 200617
Change in public sector debt -1.8 -4.9 -2.7 Contribution from: 1. Primary deficit (- surplus) -2.5 -0.1 -2.2
4. Real exchange rate (- appreciation) 0.6 -2.4 0.0
2. Real GDP growth -1.4 -2.6 -1.8 3. Real interest rate 2.1 0.5 1.6
5. Other factors -0.6 0.8 -0.2 Source: Staff calculations, based on data from Kenyan authorities, IMF Staff Reports, and World Bank.
2.14 Notably, the decline in indebtedness and interest payments occurred even though the primary fiscal surplus (including grants)'declined as a share o f GDP (Figure 2-4). T w o main arguments to explain this feature are that the rather high level o f primary fiscal surplus after the Goldenberg scandal was a part o f an attempt to bolster credibility and carry out fiscal consolidation; there was a slow return to more natural levels in the later ha l f o f the 1990s. The second argument i s that interest rates in the f i rst ha l f o f the 1990s were being driven by factors other than fiscal fundamentals. Box 2-3 discusses the latter argument in some detail.
12

Box 2-3: Shrinking Primary Fiscal Surpluses and Declining Interest Payments
Figure 2-4 plots the primary balance and interest payments, both as a percentage o f GDP, f r o m 1990 to 2006. T w o observations stand out. First, the primary fiscal surplus (with grants and after cash adjustment) went up in the wake o f the Goldenberg scandal and reached close to 6 percent o f GDP by the mid-I990s, but has been o n a declining trend ever since. Second, interest payments peaked at over 10 percent o f GDP in 1993/4 but have then fallen f rom 6 percent o f GDP in 1995/6 to 2.4 percent in 2006/7, even as the primary fiscal balance was deteriorating.
Figure 2-4: Primary Balance and Interest Payments
10 e4
Primary Balance /‘ / \
- - 0 ‘ W
m s ch 9\ 3
5 m ch ch 3
P d ch 9
ch
ch ch
f 3
0 s QI
9
3 s 0 0 N
N e 3 0 0 N
m s 0 0 N
d
0 0 N
2 m 3 0 0 N
\ o b
0 0 0 0 N N
$ s Ye a n
Source: Staff calculations based on data from Kenyan authorities, IMF Staff Reports, and World Bank.
There are two possible explanations for th is apparent paradox. First, the Goldenberg scandal prompted a large increase in the primary fiscal surplus in an attempt to bolster credibility. Second, interest rates were being driven by factors other than the fiscal fundamentals. Once these factors attenuated, interest rates and interest payments came down. The f i r s t explanation i s validated by the figure, and the second explanation has some credence. Between 1991 and 1993, Kenya suffered f rom the Goldenberg scandal, which i s estimated to have had a cumulative cost o f $600 m i l l i on to $1 bil l ion: some 9 to 16 percent o f 1994 GDP. The scandal was uncovered in 1992 and the efforts to mop up excessive monetary infusion arising f rom the scandal pushed interest rates o n T-bills to over 80 percent. The breaking o f the scandal on ly intensified the pullback o f the donors, forcing Kenya to re ly o n domestic debt, which was “more expensive.” This was also the time that Kenya started shifting to domestic debt t o pay o f f maturing external debt because o f the aid squeeze.
2.15 Kenya’s current debt situation has several strengths. Most important i s Kenya’s ability to issue nominal (that is, unindexed) debt at single-digit interest rates. Even countries such as Brazi l and Turkey have not been able to do so in spite o f running significant primary surpluses (far greater than Kenya’s) for several years in a r o w (Brazil, since 1999). This indicates a high degree o f macro policy credibility in Kenya and the absence o f “debt intolerance,” developed over more than a decade. Further, Kenya’s debt structure i s less vulnerable to external shocks because o f the falling share o f external debt over the past decade. Finally, Kenya’s debt dynamics are favorable
13

and i t has been growing impressively over the past five years, in contrast to the debt sustainability problems and slow growth in many other c~un t r i es . ’~
Improved Business Environment-Decline in Political Interference and the Government’s Business-friendly Attitude
2.16 Interviews with private sector and participants in financial markets show that they perceived the peaceful political change in 2002 as a watershed event. The change o f political leadership was seen as a successful transition to multiparty democracy, a process that began in 1992. Economic agents widely believe that Kenya’s political development i s irreversible and economic policies are unlikely to change dramatically with changes in polit ical 1eader~hip. l~ These developments can be construed as improvements in political and economic risk by the investors.
2.17 The reduction in political risk that accompanied the change in polit ical leadership in 2002 fueled an improvement in sovereign creditworthiness and the private investment climate, thus permitting Kenya to begin reaping the benefits o f political and economic reforms that date back to at least 1986. Improved sovereign creditworthiness has resulted in a reduction in country risk that showed up in a fall o f real interest rates and greater willingness o f f i r m s to invest without concerns about polit ical interferen~e. ’~
2.18 The findings o f ICA 2007 confirm that at a microeconomic level, perceptions about polit ical stability, together with macroeconomic stability, improved significantly between 2003 and 2007. In the 2007 assessment, about 16 percent o f respondent manufacturing f i r m s perceived polit ical instability or uncertainty as a major to severe constraint to business, compared to a significantly larger 52 percent in 2003. Similarly, the percentage o f manufacturing f i r m s that consider macroeconomic stability to be a major constraint to business dropped to 26 percent in 2007 from 5 1 percent in 2003.16 A reduced perception o f r i sk i s apparently leading to lengthening o f business horizons and thus a lower hurdle rate o f return.” About 59 percent o f the f i r m s
l3 The debt dynamics do not take into account significant unreported contingent liabilities f rom a large parastatal sector and unfunded fhture pension obligations. A fiscal Report o n the Observance o f Standards and Codes (ROSC) carried out by the IMF in 2007 estimated these two sets o f liabilities at a cumulative 20 percent o f GDP. Due to non-accounting o f contingent liabilities, Kenya’s domestic debt i s l ike ly to be underestimated.
A statement by Titus Naikuni, chief executive o f Kenya Airways, reported in the June 13,2007 Financial Times, characterized the attitude o f businesses at that time. H e said, “I think we’ve sort o f separated the politicians, who are making noise, f rom those o f us who want to make money. Because the politicians realize that without this money we won’t have development.” O f the election, he said, “It’s t ime people realized Kenya has become very mature, in the sense that the business community couldn’t care less about what happens. I don’t put our business plans based o n whether we’re going to elect K ibak i o r someone else.”
l5 The decline in real interest rate has also been accompanied by a sharp reduction in the average interest rate spread charged by banks, reducing the cost o f borrowing for the private sector. This reduction reflects greater competition, wh ich has led banks to focus more intensively on providing finance to previously under-served or un-served markets. See Appendix C for an analysis o f spreads.
l6 These findings are based o n a panel o f 160 firms that participated in bo th surveys.
A fm seeking to recoup an investment over three years rather than six years i s l ike ly to require a much higher rate o f return because the rate o f capital depreciation would be much higher. One would also expect to see a greater willingness to ho ld assets denominated in Kenyan shillings in the banking system.
14
14

surveyed in ICA 2007 reported preparing multi-year business plans in 2007, against 41 percent in 2003.
Weaknesses of the Current Growth Spell
2.19 With the resumption o f normalcy in political and social l i fe, economic expansion i s expected to resume, but high growth, even at pre-crisis levels, cannot be assumed. There are two reasons. First, the two underlying causes behind the recent growth, discussed above have weakened. Macroeconomic policy credibility i s likely to be under strain in view o f the fiscal pressures o f crisis-related expenditure and demands o f a coalition government and double-digit inflation during 2007. In addition, estimates o f polit ical risk are l ikely to have been revised fol lowing the political crisis. The expectation i s that political uncertainty will linger on, thereby keeping away significant new investment, particularly by foreigners in the near term. Second, the five-year growth spurt had temporary components-both domestic and external in origin-that cannot be assumed in the future. The domestic component was the improvement in capacity utilization after prolonged stagnation, and the external component was the favorable environment such as l o w international interest rates and high growth rates in partner countries. The latter particularly lies beyond the influence o f Kenyan policy makers. Excluding the cyclical expansion, trend growth rate during the past five years was low, as was the annual rate o f f ixed capital formation (the latter around 15 percent o f GDP). T o ensure that the Kenyan economy i s o n a steeper trend growth rate, much more would need to be done as discussed below.
2.20 The main question faced by policymakers i s that if political and macroeconomic stability are maintained, what more would be needed to accelerate and sustain growth over long run in Kenya. The answer to this question lies in understanding the constraints to accelerating and sustaining growth. Empirical work shows that constraints to accelerating growth at a particular time (proximate constraints) may differ f rom constraints to long-term sustained growth (deeper constraints). Therefore, this report carries out analysis towards understanding constraints to growth at three levels. First, a benchmarking exercise i s carried out, comparing Kenya with successful economies, to highlight areas where Kenya would need to make deeper efforts to achieve sustained growth. Second, a growth diagnostics exercise i s carried out to understand the nature o f binding constraints to accelerating growth in the medium-term. This exercise asks the question as to why investment rate i s l o w in Kenya. Finally, a macroeconomic perspective i s developed to look at the feasibility o f a very high growth rate-such as 10 percent envisioned in the Vis ion 2030. These analyses are then combined to propose a strategy for accelerating and sustaining growth.
Binding Constraints to Accelerating Growth in Kenya
2.2 1 Identifying and prioritizing the most significant (binding) bottlenecks will be important t o realize gains from growth quickly. T h i s study applies a growth diagnostics approach-along the lines o f Hausmann, Rodrik, and Velasco (2005)--to identify binding constraints to accelerating growth in Kenya.18 The binding constraint approach posits that not al l constraints matter equally
~ ~ ~
l8 The authors, Hausmann, Rodrik, and Velasco, group the factors (constraints) behind inadequate levels o f private investment (toward both physical and human capital) and entrepreneurship into three sets: (a) low returns to factors of production (insufficient investment in complimentary factors such as human capital, technical know-how, infrastructure, or poor geography; (b) poor private appropriability due to government failures (such as h igh taxation, macro risks such as financial and fiscal crises, poor property rights and contract enforcement, high corruption and crime, labor-capital confl ictshigid labor market) andor market failures (such as learning and coordination externalities leading to l o w product diversification); and (c) financing constraints (low savings, poor intermediation in domestic financial markets, high country risk, o r
15

for growth at a l l times and growth acceleration need not wait for a resolution o f a l l constraints. At a given point o f time, addressing certain constraints will provide higher value (in terms o f growth) than addressing others.
2.22 The diagnostics approach shows that the investment rate i s l o w in Kenya for two broad reasons. First, returns to investment are l o w and risks to appropriation o f returns by private investors are high. Second, access to finance i s l imited and costs are high for certain categories o f borrowers, such as rural and small entrepreneurs. Returns to investment are low, in turn, mainly because non-factor costs-other than the cost o f labor and capital-are high.lg These nonfactor costs take various forms. They include high logistics costs and high costs o f energy. They also include opportunity costs due to delays o f shipments, as wel l as direct payments in the form o f bribes.*’ The net impact o f these nonfactor costs on a business i s either reduced sales revenue- and hence reduced profitability and productivity (as m e a s u r e d M r high total costs o f production.
2.23 O n the issue o f risk to appropriation o f returns, macroeconomic and polit ical r isks have receded considerably since the 2002 elections. However, risks due to corruption, crime and the security situation remain deterrents to investment.
2.24 Certain constraints do not act as binding on investment, the diagnostics exercise finds. I t finds that scarcity o f human capital does not act as a binding constraint currently.*l Various enterprise surveys bear out this conclusion, since businesses do not identify ski l ls supply as a major constraint to business. This finding should not be construed as saying that Kenya should not continue to invest in expanding the stock o f human capital. All it does i s to highlight that at present, investment-and hence growth-is not being held back by lack o f general ski l ls . This view would be consistent with a tight supply o f spec@ sk i l l s in certain industries.
2.25 Likewise, while investment in innovation and research in Kenya i s low, at Kenya’s current stage o f development, these are not seen as l ikely binding constraints. Kenya i s s t i l l seen as operating wel l inside the wor ld technology frontier and innovation i s more l ikely to take the form o f copying and adapting than creating new products. However, it i s possible that as the economy grows further, some o f the constraints that are not binding n o w could tighten. For example, at some stage there may be a need to provide public support to innovation through investment in R&D.
poor integration with external financial markets). Details o f the diagnostic exercise as applied to Kenya are included in the background paper, “Kenya: Growth Diagnostics,” by Nuguna and others; only key results are reported here.
The l o w level o f investment also explained poor growth in Kenya in the 1990s. Investment collapsed for two main reasons. First, expected private returns were l o w because o f the high r isks arising f r o m macroeconomic instabil ity (with roots in both monetary and fiscal instability), as we l l as pol i t ical uncertainty, corruption, and predatory policies o f the government. Second, returns were l o w due to deteriorating infrastructure.
2o A number o f internationally comparable surveys and detailed enterprise surveys o f business environment within Kenya have also identif ied the constraints to growth associated with costs and risks to businesses. Kenya i s ranked l o w compared to its peers and even to the average for Sub-Saharan Afr ican in these surveys. These are discussed in Chapter 3.
Kurnar and Garrido (2006) show that during the 199Os, returns to basic education declined significantly. Only tertiary education showed improvement in returns.
16

2.26 I s the cost o f financing investment a binding constraint to growth in Kenya? In other words, i s investment l o w because either domestic or foreign savings become available to the private sector at high cost? On the face o f it, cost o f finance may not be acting as a binding constraint. Deposit rates and lending rates have been relatively l o w in Kenya, particularly after 2002. The average lending rate by commercial banks after 2002 was about 13.2 percent with very l o w volatility.22 The view that cost o f finance may not be acting as a binding constraint i s echoed by respondent manufacturing f i r m s in ICA 2007; only 28 percent o f them rated access to finance as a major or severe constraint to business. However, smaller and rural borrowers report much restricted access to financial services. Chapter 3 reports more on issues related to access to financial services.
2.27 Moreover, cost o f finance could become a binding constraint in future. Whi le Kenya’s financial systems are wel l developed by regional standards, they lack the depth and efficiency to deliver high levels o f growth. In 2006, the ratio o f financial system deposits to GDP was 34.6 percent, while the ratio o f bank deposits to GDP was 33.1 percent.23 Those figures compare favorably with other African countries, where average bank deposits/GDP hover near 25 percent, but they remain however substantially below the averages for higher growth regions l ike East Asia Pacific (5 1.4 percent) and South Asia (46.3 percent). Private credit to GDP-a key indicator for intermediation efficiency-shows a similar profile, at 24.3 percent in 2006 for Kenya, exceeding the A f i x a region average, but significantly below the averages for East Asia Pacific (43.0 percent) and South Asia (38.3 percent. Using estimates f rom cross-country regressions in Beck and Levine (2004), were Kenya’s private credit/GDP ratio to increase from roughly 25 percent to 35 percent, i t s real per capita GDP growth would increase by 0.4 percentage points per year.
2.28 There are indications that banks in Kenya have become more efficient after 2002. Banlung sector interest rate spreads-another indicator o f intermediation efficiency-declined to a l itt le more than 8 percent in 2006 from about 12 percent in 2002. Analysis carried out for this report shows that decline in spreads reflects improved competition among banks for lending o p p o r t u n i t i e ~ . ~ ~ The increased competition resulted in banks cutting their costs; however, efficiency improved much more in private banks than the government-influenced banks. Overhead costs o f government-influenced banks remain high. Appendix C has more information on banking sector efficiency in Kenya.
Kenya’s Prospects for Sustained Growth-A Look at Deep Determinants of Growth
2.29 Empirical evidence from various studies shows that growth accelerations and sustained long-term growth may have different drivers. In other words, constraints to accelerating growth at a particular time may differ f rom constraints to long-term sustained growth. The discussion that follows analyzes how Kenya’s prospects for sustained growth are influenced by deeper determinants o f growth: namely, geography, institutions, and global integration.
2.30 Geography i s arguably the truly exogenous factor and an important determinant o f growth. It in large part determines the opportunities for economic development. Recent work by Collier and O’Connell (2006) shows that a coastal country has an average advantage o f 1.5
22 Lending rates were particularly h igh in 1998 and 1999 (around 25-26 percent) when large domestic borrowing by the government resulted in high interest rates.
23 Wor ld Bank financial structure database, October 2007 update.
24 Background paper ‘Financial Sector Efficiency and Outreach in Kenya’.
17

percentage points in economic growth relative to a landlocked country.25 On average, being resource-poor i s found to be an advantage since the benefits o f the resource endowment do not outweigh the costs that frequently affect resource-rich countries associated with Dutch Disease or governance problems-and even conflict. Collier and O’Connell, however, caution that the probability o f economic success for coastal, resource-poor countries in Sub-Saharan Afr ica depends upon government’s avoidance o f predatory actions on the exportable sector (the regulatory syndrome). Their empirical findings support this argument and show that resource- poor Afkican coastal economies, such as Mauritius, that have managed to avoid such actions have succeeded in new export markets. According to this viewpoint, being coastal and resource-poor, Kenya could have a growth advantage-in terms o f opportunities-as similarly situated countries, but policy choices must be made in a way to exploit that potential. The good news i s that with the structural reforms o f the 1980s and the 1990s, and the political transition in 2002, the regulatory syndrome has attenuated in Kenya and export promotion i s more clearly articulated as a key development objective. The bad news i s that Kenya has far to go in making full use o f i t s geographic advantage, as discussed later in this report.
2.31 However, geography i s not everything. Other deep determinants o f growth are institutions and the extent o f a country’s integration into the global economy. Rodrik, Subramanian, and Trebbi (2002) find quality o f institutions to be a more relevant variable for explaining income differences across countries.26 Their work suggests that, once institutions are controlled for, measures o f geography and integration remain jus t slightly important for explaining income; however they remain as relevant, indirect, explanatory variables through their ability to influence the quality o f institutions.
2.32 The analysis in this study draws upon the recent work done by Johnson, Ostry, and Subramanian (2007) to benchmark Kenya on selected indicators related to institutions and global integration that have been found in the literature to matter for sustained growth.*’ Kenya i s compared with two sets o f countries. The f i rst set consists o f Sub-Saharan African (SSA) countries that are not resource-rich and not post-conflict, and that have grown at more than 2 percent per capita f rom 1996 to 2005 (called fast-growing SSA countries). The second set
25 Collier and O’Connell (2006) classify countries according to their growth opportunities and po l i cy choices. Opportunities are given by two attributes o f an economy: endowments and location. Choices refer to strategic pol icy approaches such as import substitution versus export promotion and the provision o f public goods. The authors classify countries into four mutually exclusive groups by interacting endowments (resource ricldresource poor) with location (coastaYlandlocked). Other authors also find geography to be important for growth: see Sachs and Warner (1997) and Gallup, Sachs, and Mell inger (1999).
26 Rodr ik , Subramanian, and Trebbi (2002) measure quality o f institutions using a composite indicator o f a number o f elements that capture the protection afforded to property rights as we l l as the strength o f the rule o f law. Rodr ik (2008) expands the scope o f desirable institutions, beyond protecting property rights and ensuring that contracts are enforced, to include those that stimulate entrepreneurship, foster integration in the wor ld economy, maintain macroeconomic stability, manage risk-taking by financial intermediaries, supply social insurance and safety nets, and enhance voice and accountability.
27The exercise in Johnson, Ostry, and Subramanian (2007) i s strictly a benchmarking exercise. The authors do not carry out growth regressions. They instead draw upon literature to identify indicators (variables) that have been found to matter for sustained growth. As i s always the case, the benchmarking exercise flags areas for attention and deeper analysis without assigning any explanatory significance to indicators used.
18

consists o f 12 countries that have sustained high growth rates over a long period (called Sustained Growth countries), as defined by Johnson, Ostry, and Subramanian (2007).28
2.33 Table 2-4 displays Kenya’s scores on a number o f indicators o f quality o f institutions, compared across counties. It shows that Kenya’s position on quality of political and broad economic institutions is mixed. Overall, Kenya’s (current) measures o f quality o f political and broad economic institutions appear to be o n par with or better than comparable measures of fast- growing SSA economies or sustained growth comparators. Institutionalized constraint on executive decision-making, a measure o f political institutions, i s much higher for Kenya than for the fast-growing SSA economies or the sustained growth economies at the start o f growth episode. However, the recent political crisis has highlighted the inherent weakness o f institutions to ensure smooth political transition in a democratic context. Kenya’s scores on both economic risk and investment risk are also better than the sustained growth economies in mid-1980s and fast-growing SSA economies in 2006. Given that by the mid-l980s, the sustained growth economies had already been growing for more than a decade and their institutions had l ikely improved in a virtuous cycle o f growth and institutional quality, Kenyan institutions look even better.
2.34 However, income inequality, which i s l ikely to be associated with polit ical and broad economic institutions, i s higher in Kenya than it was in the sustained growth economies. This could be an obstacle to political stability. Research shows that in countries with higher init ial income inequality, growth spells tend to be shorter (Berg, Ostry, and Zettlemeyer 2006). In other words, this evidence would suggest that Kenya’s growth spells would have a relatively higher risk o f being derailed because o f higher inequality. Therefore, mitigating income inequality should be seen as a part o f long-mn growth strategy.
Table 2-4: Indicators of Political and Broad Economic Institutions, Fast-Growing SSA Countries, Sustained Growth Countries, and Kenya
Indicator (range) A higher value Fast - Sustained Kenya indicates., . growing growth (Year)
SSA countries- countries - average (year)
average h e a r )
Constraint o n the executive (1-7)’ More constraint 3.9 (2004) 2.2 (qe 6 (2004) Economic risk ( 1-50)b Lower r isk 31 (2002) 31.7 (1984) 33 (2002) Investment r isk (1-12) Lower r isk 8.1 (2006) 7.1 (1996) 9.5 (2006) Control o f corruption (1-6)‘ Higher control 2.4 (2005) 3.4 (1996) l(2005)
Source: Johnson, Ostry, and Subramanian (2007). a. Polity IV database. b. ICRG database. c Normalized Kaufmann-Kraay index. d. WDI database. e. See footnote 28 for the definition o f year T.
Income inequality-Ginid Higher inequality 49 39.5 ( r ) 43
28 Johnson, Ostry, and Subramanian (2007) identify the fol lowing sustained growth economies (Year Tin parentheses is the start o f growth episode): Chile (1986), China (1978), Dominican Republic (1969), Egypt (1976), Indonesia (1967), Republic o f Korea (1962), Malaysia (1970), Singapore (1969), Taiwan, China (1961), Thailand (1960), Tunisia (1968), and Vietnam (1985). Fast-growing Afr ican economies in the sample are Burkina Faso, Cameroon, Cape Verde, Ethiopia, Ghana, Guinea, Lesotho, Mali , Mozambique, Tanzania, and Uganda.
19

2.35 In addition, if we use the wider definition o f institutions as in Rodrik 2008 (see footnote 26), we find that micro-level institutions are problematic in Kenya. The results o f ICA 2007 show that security situation i s also much worse than most comparator countries.*' As measured in terms o f costs o f doing business, including costs o f trading, Kenya does worse than both fast-growing SSA economies and sustained growth countries. On control o f corruption, Kenya scores below both groups (Table 2-4).
2.36 Kenya i s also significantly disadvantaged on measures o f socialfractionalization (ethnic, religious, and linguistic), compared to sustained growth comparators (Table 2-5). I t i s disadvantaged even compared to fast-growing SSA economies. Globally, there i s evidence that social fractionalization affects economic outcomes and hurts growth due to ethno-regional biases in policy, particularly the provision o f public goods. I t also indicates a higher potential for conflict and derailing growth. Indeed, development o f a credible political compact that could provide the glue to bring together ethno-regional fractions remains a social and economic challenge in Kenya, as in many other Af i ican countries.
Table 2-5: Indicators of Social Fractionalization, Fast-Growing SSA Countries, Sustained Growth Countries, and Kenya
Indicator Fast-growing SSA Sustained growth countries Kenya countries average average
Ethnica 0.72 0.30 0.83 Ethnicb 0.75 0.33 0.85 Religionb 0.53 0.30 0.70 Ethnic' 0.68 0.32 0.86
Religion' 0.54 0.42 0.78 Source: Johnson, Ostry, and Subramanian (2007). Note: A higher value represents higher fractionalization. a. Easterly and Levine (1 997). b. Fearon (2003). c. Alesina and others (2003).
Linguistic' 0.76 0.29 0.89
2.37 In terms o f integration into global trading activities, at a f i r s t grance, Kenya does not look much different f rom the sustained growth countries at the start o f their growth acceleration (Table 2-6). The current exports-to-GDP ratio i s comparatively high, at about 25 percent. The share o f manufacturing exports in total exports i s also comparable to the levels in sustained growth countries at the start o f the growth acceleration. This insight i s meaningful because manufacturing exports were the prime engine for growth in almost al l sustained growth countries. The share o f l o w value exports such as apparel i s also low. Therefore, in terms o f structure o f exports, Kenya does not look much different f rom sustained growth countries at the beginning o f their growth episodes.
*' The findings o f I C A 2007 are discussed in detail in Chapter 3.
20

Table 2-6: Macroeconomic and Trade - Policies and Outcomes, Fast-Growing SSA Countries, Sustained Growth Countries, and Kenyaa
Measure Fast-growing Sustained growth Kenya SSA countries countries- average
Total exports to GDP 25.1 19.1C 24.7 Manufacturing exports to GDP 4.8 2.2 3.2 Apparel, footwear, textiles exports to GDP 3.9 1.1 0.5 Fuel and ore exports to GDP 3.1 4.2 3.1 Agriculture and food exports to GDP 7.3 7.8 7.7 Trade restrictiveness (O-l)b 0.9 0.4 1 Balassa-Samuelson average currency overvaluation 10.8 -17.7 9.4 Largest consecutive spell o f overvaluation in
Average overvaluation during largest spell 43.8 11.4 16.9 Inflation 7.3 14.6 10.3 Aid to GDP 13.3 4.7 (T-4 to T+5) 4
years since 1970 15.4 6.4 21
Source; Johnson, Ostry, and Subramanian (2007). a. Average for years after 2000 unless otherwise indicated. b. Sachs-Warner measure updated by Wacziarg and Welch (2003). I t i s a dummy variable, with 1 indicating fully open trade. c. Al l export outcomes for sustained growth countries are averages for T to T+4.
2.38 However, the current levels o f exports do not provide any indication o f the potential for future growth in exports. The exports o f sustained growth countries surged dramatically along with growth take-off (Figure 2-5), but Kenya’s exports do not show that promise yet. Whi le there are signs o f reversal o f the long decline o f Kenyan exports, and diversification away from traditional products and destinations i s emerging, manufacturing exports yet do not show much dynamism. In addition, exports are largely directed toward low-income neighboring countries: a feature that i s an indication o f lower potential for future growth, as discussed in Chapter 3.
21
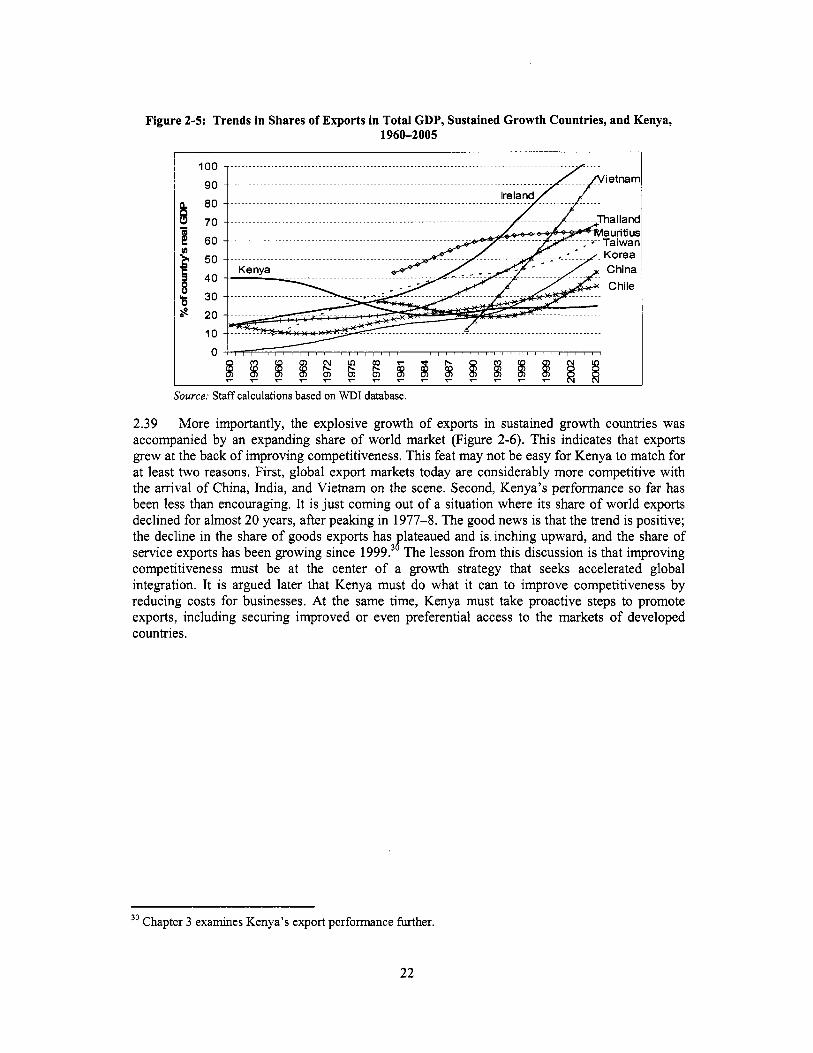
Figure 2-5: Trends in Shares of Exports in Total GDP, Sustained Growth Countries, and Kenya, 1960-2005
100
90
B ;: 1 60
50
t! 40 t 30 -a? 20
10
0
...........................................................................................
.......................................................................................
................................................................................
.............................................................................
.............................................................
...................................
.........................
................
.........................
Source: Staff calculations based on WDI database.
2.39 More importantly, the explosive growth o f exports in sustained growth countries was accompanied by an expanding share o f wor ld market (Figure 2-6). This indicates that exports grew at the back o f improving competitiveness. This feat may not be easy for Kenya to match for at least two reasons. First, global export markets today are considerably more competitive with the arrival o f China, India, and Vietnam on the scene. Second, Kenya’s performance so far has been less than encouraging. It i s just coming out o f a situation where i t s share o f wor ld exports declined for almost 20 years, after peaking in 1977-8. The good news i s that the trend i s positive; the decline in the share o f goods exports has plateaued and i s inching upward, and the share o f service exports has been growing since 1999.30 The lesson from this discussion i s that improving competitiveness must be at the center o f a growth strategy that seeks accelerated global integration. It i s argued later that Kenya must do what it can to improve competitiveness by reducing costs for businesses. At the same time, Kenya must take proactive steps to promote exports, including securing improved or even preferential access to the markets o f developed countries.
30 Chapter 3 examines Kenya’s export performance further.
22

Figure 2-6: Shares in World Exports of Goods and Services, High Performing Economies (HPEs) and Kenya, 1975-2005
0.18
0.16
f 0.14 n gj 0.12
5 0.10 U
z 0.08
E 0.06
0.04
0.02
0.00
0
20 18 16 14 12
10 8
6 4 2 0
Source: Staff calculations, based on COMTRADE data. Averaged using SITCZ 3-digit classification. Note; HPEs include Ireland, Botswana, and Mauritius in addition to sustained growth economies.
2.40 Increasingly, evidence from successful countries suggests that real exchange rate i s important to growth o f exports. Literature shows that sustained growth countries maintained competitive currencies and more specifically, avoided overvaluation o f their currencies (Rodrik 2007). Indonesia and Thailand actually had substantially undervalued currencies as their exports surged. Table 2-6 includes results o f a simple exercise reported in Johnson, Ostry, and Subramanian (2007) that measures overvaluation as the deviation o f actual real exchange rate f rom the one predicted by the income level o f a country relative to the United States. I t shows that historically Kenya had a moderate overvaluation, which persisted for a long time. Without overstressing this finding, we would l ike to note that pursuing a competitive real exchange rate should be a key policy objective if Kenya i s to fo l low an externally oriented growth strategy.
2.41 In summary, Kenya’s prospects for sustained growth do not appear too constrained, when looked at f rom the perspective o f deep determinants. In terms o f geography, unexploited potential exists for Kenya to improve i t s external orientation. At the level o f broad economic and polit ical institutions, there i s scope for further improvement, but that gap i s not likely to stand in the way o f embarking upon sustained growth. At the same time, a strategy to achieve sustained growth wi l l need to focus o n improving micro-level institutions related to business environment, controlling corruption, and improving security. These same micro-level institutions are also important for accelerating growth, as discussed earlier in the context o f identifying binding constraints. Social fractionalization i s a potential hurdle for which polit ical solutions would need to be found and implemented over time. Kenya does not yet show the promise o f dramatically increasing manufacturing exports. Improving competitiveness, including by maintaining a competitive real exchange rate, would be important to develop that promise.
Vision 2030’s Goal of a 10 percent Growth RateA Perspective on i t s Feasibility and Implications for Policy Strategy
2.42 Vision 2030 has adopted a long-term goal o f achieving an average 10 percent annual growth rate. This i s an ambitious goal, considering that during the 1980-2005 period, Kenya’s annual GDP growth rate was around 3 percent. T o put the goal in an international perspective,
23

China was the only economy in the world to achieve growth rates anywhere close to 10 percent over a prolonged period in the recent history (Appendix Table A-2).
2.43 Even though the goal o f 10 percent growth i s ambitious, it i s instructive to develop insights into what will i t take to achieve it. It i s done for this report by developing an analytical perspective o n what combination o f capital (physical and human) accumulation-financed by both domestic and foreign savings-and TFP growth would result in the desired growth rate. A dynamic-recursive Computable General Equilibrium (CGE) model i s used to simulate scenarios for the economy for the period 2006-30.31 Appendix E describes the simulations briefly; more details are available in the background paper, Lofgren and Kumar (2007). The simulations illustrate that for the long-run growth rates that Kenya aspires to achieve, it will be necessary to make strong long-run progress along multiple fronts: raising TFP growth, attracting foreign direct investment (FDI) and foreign aid, as wel l as mobilizing domestic savings.
2.44 It i s insightful to focus on one scenario (Scenario v30-Gradual in Appendix Table E-1) that generates an average growth rate o f around 9 percent per annum for the 2006-30 period. T h i s growth rate would result from a combination o f an annual TFP growth rate o f 2.6 percent and an annual increase o f 6.4 percent in the stock o f capital. In turn, desired growth in the stock o f capital would result f rom a private fixed investment rate o f about 24 percent o f GDP by 2017 (and maintained at that level afterward). In parallel, an average public investment rate o f about 5 percent o f GDP would also be needed for the whole 25 years. In this scenario, investment would be financed by domestic savings, which would reach a rate o f 24 percent o f GDP by 2017, and external savings, at the rate o f 5 percent o f GDP during the entire period.
2.45 H o w feasible, in Kenya’s context, are the “required” growth rates o f TFP and capital accumulation obtained above? I t i s not possible to answer this question precisely. However, to get a better sense o f the order o f magnitudes involved here, one could compare the “required” growth rates with comparable historical rates achieved by the benchmark set o f high performing economies during the period 1960-2003 (Appendix Table A-2).32 The table shows that with the exception o f China, TFP improvement o f the order o f 2.5 percent per year per capita over long periods i s rare,33 However, capital accumulation rates o f about 4 to 5 percent per year were not uncommon for high performing economies. In comparison, Kenya’s historical record o f capital accumulation has been considerably poorer. For the entire 1960-2003 period, it averaged around 2.5 percent per year. During 1980-90 and 1990-2003, the capital stock actually shrank. This comparison exercise suggests that one way to achieve the aspired high growth rates would be to
3’ The simulations re ly o n a macro-oriented version o f Maquette for MDG Simulations-MAMS-a model developed at the Wor ld Bank for analysis o f development strategies. The advantage o f using a model l ike M A M S for th is type o f analysis i s that it, in a consistent and comprehensive manner, simulates the combined impact o f changes in gross national savings, aid, foreign direct investment (FDI), and TFP o n major economic indicators (including GDP, trade, private and government consumption and investment), considering the presence o f constraints at the macro level (represented by fiscal, foreign exchange, and savings-investment balances) and in factor markets and using standard assumptions about the behavior o f producers, consumers, and government.
32 For more details, see the background paper, “Kenya’s Potential for Sustained Growth: A Benchmarking Exercise” by Garrido.
33 Interestingly, during 1970-80, Kenya managed to improve TFP by an average 2.9 percent per capita per year. However, th is fact i s l ikely to be o f historical interest alone and may not ho ld any lessons for the future because Kenya’s economic landscape, and that o f the world, has changed completely since then.
24

accelerate TFP growth rate to about 2.5 percent per year and double the rate o f capital accumulation to what it was in 1 9 7 0 ~ ~ ~ This clearly i s a tall order.
2.46 Further, Kenya’s domestic savings rate i s relatively l o w at 15 to 16 percent o f GDP and i s expected to grow slowly. A relevant question for policy makers to ask is, “Will growth be constrained by the availability o f domestic savings, and should extra effort be made to bolster the private savings rate?” This report does not get into the issue o f how, if at all, pol icy should attempt to improve the savings rate. The main reason i s that policy guidance f rom experience elsewhere i s not clear on this issue.35 Instead, it i s suggested that areas that are more amenable to government effort-foreign aid and foreign direct investment-can be pursued more vigorously. The simulations referred to above also highlight some strategic trade-offs that are relevant to the above question about domestic savings:
An increase in gross national savings rate f rom about 16 percent to about 24 percent o f GDP by 2017 would require an init ial slow down in private consumption growth (as a share o f GDP and not in real absolute levels). Therefore accelerating savings rate involves some sacrifice up front in terms o f slower pace o f welfare improvement.
FDI has the potential to increase more rapidly (and lead to more rapid technological progress) than more slow-moving domestic financing resources, and it avoids an init ial slowdown in private consumption growth.
Foreign aid relaxes the budget constraint o f the government, pemi t t i ng increases in domestic consumption and investment. Welfare effects are more positive than when growth i s driven primarily by an increase in savings rate or FDI.
2.47 The insight f rom the above discussion i s that at Kenya’s current stage o f development, achieving a high growth rate would require that the country draw upon both FDI and concessional finance in a big way. FDI flows to Kenya have been miniscule: much lower than neighboring Uganda and Tanzania (Figure 2-7). Experience elsewhere shows that FDI flows respond the most to the size o f the domestic market. Therefore, FDI flows are expected to respond somewhat to increased demand for Kenyan products in the expanding regional market. Improvement in investment climate should also enable Kenya to attract higher volume o f FDI flows, as would reforms to the governance and regulation o f the Nairobi Stock Exchange (NSE) to enable greater use by enterprises o f the equity markets. More analytical work i s needed, however, to understand the behavior o f FDI flows in Kenya before specific policy recommendations could be made.
34 Appendix Table A -2 provides another insight. There i s no clear pattern o n the relative role o f accumulation versus TFP as a source o f growth at different stages o f growth acceleration. For the Asian economies o f the Rep. o f Korea, Malaysia, Singapore, Taiwan, and Thailand, a rapid accumulation played a much bigger role earlier on. In contrast, for late bloomers such as China, India, Ireland, and Mauritius, the contribution o f TFP to growth appears to have been much more central.
All high performing economies showed improving shares o f private savings and declining share o f consumption in national income, with growing per capita income. The same should be expected in Kenya. In addition, restructuring o f the pensions sector and reforms to strengthen the insurance sector would offer opportunities to both increase domestic savings and improve the efficiency with which those savings are intermediated.
35
25

Figure 2-7: FDI and Aid-Net Inflows as Percent of GDP, 1980-2005
14 12
(3 ’s 10
16 A
year Source: WDI database, World Bank.
2.48 Similarly, there i s scope for aid flows to go up in Kenya, which have been stagnant at around 3 to 4 percent o f GDP in the past five years (compared to 6 to 8 percent o f GDP during 1980s and an all time high o f 13 percent o f GDP in 1990). Improvements in governance and the investment climate, combined with init ial signs o f success, have the potential to convince aid providers that additional aid would be put to good use. Kenya should work with aid providers to ensure that transaction costs o f aid are low, that aid i s predictable, and that i t goes into growth p r i o r i t i e ~ . ~ ~ Too much aid going to the services sectors would l ikely get in the way o f maintaining a competitive real exchange rate. The t i c k would also be to ensure that foreign aid does not dampen revenue efforts. The caveat about the revenue effort i s important because it can be plausibly argued that the motivation for fiscal reforms in the 1990s was partly the result o f l o w level o f aid.
GROWTH STRATEGY
2.49 Results o f analysis carried out in this chapter so far provide the necessary elements o f a future growth strategy. First, the experience o f the past f ive years shows that growth in Kenya i s sensitive to perceptions o f business risk. Therefore, much as they initiated and fueled growth recovery, political and macroeconomic stability would also be preconditions for h t u r e growth. In the absence o f polit ical stability, businesses will make fewer new investments. Conversely, increasing political stability will further reduce political risk, thereby lowering the cost o f capital for investment projects. In the absence o f macroeconomic stability, there will be a tendency for economic uncertainty to increase, and with it, expectations o f rising inflation and interest rates, which will slow down private investment and growth.
2.50 Fiscal policy will have an important role to play in maintaining macroeconomic stability. Kenya appears to have some fiscal space for increased infrastructure spending. The goal o f fiscal policy in the next five years should be to “expand fiscal space” for infrastructure and social
The priorities are best identif ied in an explicit and transparent manner in a medium-term plan, such as i s 36
expected to take the place o f the Economic Recovery Strategy (ERS).
26

spending (to accelerate attainment o f the Mi l lennium Development Goals) without compromising the solvency o f public finances. T o this end, Kenya should tap concessional resources for high- return projects, improve the institutional mechanism for selecting high-return projects, and improve the efficiency o f public spending, especially in education, health, and roads. Fiscal resources could be complemented with private resources through public-private partnership arrangements.
2.5 1 If macro stability i s maintained and polit ical risk i s kept low, the strategy should focus on relaxing other constraints to accelerating and sustaining growth. In order to accelerate growth, attention should be paid to reducing: the cost o f transportation services, including logistics and telecommunication services and improving the reliability o f energy supply; reducing the costs and risk that stem from inadequate security and corruption; and improving access to finance to small and rural entrepreneurs.
2.52 Reduction in risk to investment through political and macroeconomic stability, combined with reduction in costs, would accelerate growth through two channels. First, reducing business costs would generate growth by improving productivity. The manufacturing sector would benefit more than other sectors because infrastructure-related services are a bigger component o f total production costs in manufacturing. Second, reduced costs and risks would improve incentives to invest by raising the return on capital, not only for domestic investors but for foreign investors as well. FDI would go up as the public infrastructure, crime, and security situation improve.
2.53 Reducing business costs would also help enhance international competitiveness o f tradable goods and services, and thereby improve Kenya’s integration into the global trading system. The impact o n competitiveness o f the tradable goods sector would be direct through reductions in total production costs. The impact o n competitiveness o f reduced costs in non- tradable sectors would be indirect, through reduced price o f services for the whole economy. More specifically, reducing internal transportation costs would help development o f natural resource-based exports, and reducing maritime transportation costs would increase opportunities for Kenya to participate in global production chains.
2.54 Improved global integration would have a dynamic effect on the productivity o f Kenya’s private sector. Exporting would help the private sector become more dynamic and further improve productivity. Increasing FDI would bring with it newer technology, newer products, and help improve productivity, as happened in the horticulture and garments sectors. Indeed, Kenya i s l ikely to rely considerably for i t s productivity growth o n technological change embodied in new investment. Lastly, FDI i s l ikely to be a source o f access to other markets, particularly in niche products, as has happened in East Asia.
2.55 Arguably, Kenya could do more to accelerate integration o f the country into the fast- growing global economy, which i s being driven by historical f lows o f goods, services, and finances. Kenya’s advantageous geography (coastal location and natural beauty) and skilled English-speaking labor force makes it wel l placed to fo l low such a strategy. Potential exists both in global and regional markets and in traditional and nontraditional products. Realizing this potential would require orchestrating other policies-general and sectorhndustry-specific- toward creating a commercial environment conducive to increasing investment (both domestic and foreign) and improving competitiveness even further.
2.56 Trade policy would be an important component o f such a strategy. Kenya’s exports to neighboring countries have expanded in the past few years. Regional trade will therefore remain important. Deepening o f regional integration i s also desirable because regional trade helps in
27

integrating fragmented markets, allowing economies o f scale and helping in developing new exports to third markets. However, there i s a limit to regional trade because the countries in the region have similar resource endowments and produce similar products (lack o f complementarities). Therefore, the Kenyan growth strategy would need to push and help the private sector in enhancing i t s competitiveness beyond the East Africa region. This would include further trade liberalization and improved trade facilitation, among other pol icy actions.
2.57 While deepening regional integration, Kenya would need to continue i t s efforts to secure access to markets outside the region, particularly in Asia. Securing access to markets would also promote FDI-essent ia l for product diversification and productivity improvement-since uncertainty about markets inhibits FDI. Kenya has recently signed an interim Economic Partnership Agreement (EPA) with the European Union (EU) joint ly with its partners in the East African Community. Kenya will need to continue negotiations with the EU in 2008 for a full EPA and participate effectively in multilateral negotiations. The multilateral route would be better for getting access to Asian markets.
2.58 A sectorhndustry-specific approach to addressing binding constraints could complement the general economy-wide actions discussed above. The objective o f government involvement would be to try to identify sector-specific issues-such as government/market failures-and provide solutions, in close dialogue with industry groups and associations, to recover, maintain, or improve Kenya’s competitive position. These industry-specific issues could relate to competition, regulation, government policy, bottlenecks in supply chain, information gaps, coordination failures, and the like. The solutions to identified issues would often be in the form o f policy fine-tuning, improving coordination through institutional changes, and so on. Such an approach could be used for both traditional sectors and nontraditional, natural resource-based industries in which there i s potential for growth and poverty reduction. Vis ion 2030 identifies manufacturing, high-valued services based on Internet, and tourism as areas where a sectorhndustry lens could prove useful.
2.59 Maintaining a competitive real exchange rate would also be an integral component a strategy aimed at faster global integration. Many o f the policy actions discussed earlier would help keep the real exchange rate competitive. For example, an improvement in productivity in the services sector through reduction o f costs would help maintain competitiveness. Similarly, further trade liberalization would help through increased imports. This report would caution against active attempts to manage the nominal exchange rate. More analytical work needs to be done to identify various pol icy levers that could help in maintaining a competitive real exchange rate.
2.60 government.
The growth strategy above implies a strong positive and enabling role for the
b Improving the investment climate and adopting appropriate trade policy to enhance competitiveness i s largely in the domain o f the government. The government has made a good beginning in identifying regulatory hurdles and streamlining administrative processes faced by the businesses. Substantial and lasting benefits will accrue only if these reforms are deepened. Some sectors could also benefit f rom sector-specific pol icy actions.
b Managing public finances to create fiscal space for social spending and infrastructure spending without compromising the solvency o f public finances i s government’s job. The challenge before the government i s to put a system in place
28

for selecting projects and programs with high rates o f return and improving the efficiency o f spending in the ministries o f education, health, and roads.
Pursuing an implementationhesults orientation in the public sector would be critical to success o f the growth strategy. The government has been successful in the past two years in improving focus o n results. Yet an inordinate amount o f government time continues to be devoted to preparing and discussing comprehensive strategies and plans. Whi le short and sharply focused studies may be needed in some areas, attention should shift to implementing plans and finding pragmatic solutions to immediate issues and problems at hand.
Improving policy coordination in the government would be important for trade and tourism. In both these areas there are a large number o f agencies with overlapping mandates.
Deepening civil service capacity would improve implementation. This does not necessarily mean higher wages for top c iv i l servants. Instead, i t could mean developing a cadre o f qualified senior c iv i l servants with well-defined career succession plans.
b Establishing strong feedback mechanisms to improve implementation and jine-tune policy. Feedback mechanisms are not only about collecting good quality information, but also about making changes to policy in response. They also include evaluation o f government programs and two-way open communication with the private sector.
2.61 Above all, the growth strategy should be part o f polit ically shared development strategy. The Vision 2030 process has created a political convergence o f sorts on the development strategy. I t remains to be seen how robust i t i s to alternative leadership. Continuing efforts to strengthen political stability (including avoidance o f scandals) i s critical.
How to Implement the Growth Strategy-A Roadmap to the Rest o f the Report
2.62 The rest o f this report selectively drills down into some key areas o f the growth strategy outlined above. Chapter 3 examines the elements o f competitiveness, discusses export performance, and elaborates on trade policy, including trade facilitation, and sector-specific and industry-specific approaches to accelerate global integration. Chapter 4 delves into the details o f how the performance o f port, roads, and telecommunications sectors can be improved. Chapter 5 discusses actions to orient fiscal policy toward growth objectives. Chapter 6 focuses on the issue o f mobil izing private resources for infrastructure.
29

3. ENHANCING GLOBAL INTEGRATION AND EXPORT DIVERSIFICATION
3.1 The growth strategy presented in Chapter 2 emphasized the need for Kenya’s economy to get more globally integrated. This chapter provides more details about Kenya’s competitiveness at both mucro and micro levels in order to inform policy actions. Evidence on investment climate i s brought to bear f rom I C A 2007. Export outcomes are then reviewed from several angles, such as growth potential, dynamism, and sophistication, and recommendations for trade pol icy are offered.
KENYA’S GLOBAL COMPETITIVENESS
3.2 International competitiveness refers to a broad assessment o f economic performance relative to other similar countries. Narrower measures, such as price or cost competitiveness, are used in macroeconomics, such as price or cost competitiveness. The real exchange rate i s often used as a medium-term measure o f price competitiveness since it measures the ratio o f prices o f the goods and services that one country produces relative to that o f i t s trading partners. A depreciation o f the real exchange rate i s seen as an improvement in competitiveness since it i s easier to sel l domestic goods to partner countries. Kenya’s real effective exchange rate (REER) and nominal effective exchange rate (NEER) have both appreciated since October 2004 (Figure 3-1). REER has appreciated more (24 percent)37 than the NEER (18 percent) because inflation has been higher in Kenya than in trading partner countries.38
Figure 3-1: Real and Nominal Effective Exchange Rates (Oct. 1997 = 100)
7 8d Oct-97 OCt-98 Oct-99 OCt-00 Oct-01 OCt-02 Oct-03 Oct-04 Oct-05 Oct-06
Source: IMF (2007).
37 Nonfood CPI i s used to calculate REER.
38 The REER, measured using relative price levels, would be expected to appreciate in a country where unit labor costs in traded goods are fal l ing more rapidly than in competing economies. Thus, despite the appreciation in REER, competitiveness could be maintained. To some extent, t h i s appears to have been Kenya’s experience in the past four years f r o m 2004 to 2007.
30

3.3 The unit labor cost by i t s e l f i s often used as a measure o f cost competitiveness. I t i s obtained by dividing labor cost by output per worker. An improvement in labor productivity that i s not matched by an increase in labor costs (wages plus other labor-related costs to the employer) implies a fall in unit labor cost and an improvement in compet i t ivene~s.~~ Unit labor costs can be measured at an economy-wide aggregate level as wel l as at an individual business level. Figure 3-2 presents average unit labor cost data for several countries, based o n investment climate assessments conducted by the Wor ld Bank and partner organizations. Unit labor costs in Kenya in 2007 were only slightly higher than India and were lower than Tanzania and Uganda.40 Between 2002 and 2006, unit labor cost fe l l in Kenya because o f increased productivity, without corresponding increase in real wages. Whi le this shows that Kenya's competitiveness has improved, i t should be noted that unit labor costs have fallen far more substantially in China, India, and Tanzania. In Uganda, on the other hand, unit labor costs increased marginally between 2002 and 2005 ,41
Figure 3-2: Unit Labor Costs, Kenya, Tanzania, Uganda, China, and India
40
30
20
10
0
al
Country (year)
Source: Staff calculations based o n ICA surveys, various years and countries, Wor ld Bank.
Recent Evidence on Investment Climate in Kenya
3.4 The investment climate refers to government policies and behaviors that shape opportunities and incentives for f i r m s to invest. Specifically, measures o f costs, operating risks, and barriers to entry faced by a firm are used to assess how conducive the investment climate i s
39 Empirical literature presents evidence that a decline in the unit labor cost i s associated with an increase in the export share o f the country.
40 This observation is consistent with previous evidence o n labor costs in the garment industry (Cadot and Nasir 2001) that Kenya, along with other countries such as Ghana, Lesotho, Madagascar, and Mozambique, i s competitive in shop f loor productivity o f labor once wages are taken into account.
4 ' A decrease in unit labor cost implies that at the fm level, total labor compensation did not increase in the same proportion as the total value added.
31

for the private sector. A poor investment climate as a result o f policy uncertainty, macroeconomic instability, corruption and high infrastructure costs was widely associated with the decline in the Kenyan economy during the 1990s and was found to be a major obstacle to growth and competitiveness in the early part o f this decade (World Bank 2004).
3.5 Kenya’s performance on cross-country measures o f the investment climate suggests considerable potential for improvement. The “Doing Business 2008” report (World Bank 2007e) highlights Kenya’s ambitious licensing reform program aimed at streamlining business startup, and cutting both the time and costs o f getting building permits. The report recognizes Kenya as one o f the ten best reformers in 2007, yet i t ranks only seventy-second out o f 128 countries o n the Ease o f Doing Business Index.42 Appendix Figure A-2 shows that paying taxes, trading across borders, registering property, and enforcing contracts are seen as areas that are more problematic.
3.6 Kenya i s ranked ninety-ninth (out o f 131 countries) o n the Wor ld Economic Forum’s Global Competitiveness Index (GCQ4’ The survey identifies the areas o f corruption, inadequate supply o f infrastructure, access to financing, tax rates, and crime and theft as the most problematic factors for doing business (Appendix Figure A-3). On the other hand, innovation, business sophistication, FDI and technology transfers, education expenditures, legal financial rights, labor costs, and hiring and firing practices are noted as areas o f notable relative competitive advantage.
3.7 The recent Wor ld Bank investment climate survey (ICA 2007) confirms that Kenya’s investment climate has improved in general since 2002. This i s true in terms o f perceptions as wel l as objective data, such as on business costs and losses (Figure 3-3). 44 The improvement i s significant along the dimensions o f macro and political stability and availability o f factors (land, labor, finance). For example, more than ha l f the manufacturing f i r m s that had identified macroeconomic and polit ical stability as a serious constraint to business switched their perception in 2007.
In 2006/7 the government launched an ambitious licensing reform program, which has led to the elimination o f 110 business licenses and the simplification o f eight, reducing the time and cost o f obtaining building licenses and registering a company. A t the end o f the program, i t i s anticipated that more than 600 o f the 1,300 licenses w i l l be simplified or eliminated. In addition, introducing competition among land valuers (allowing private practitioners) has cut the time needed to complete land valuation from one month to one week. The licensing reform program i s s t i l l far from complete and needs to be deepened for it to have an impact on private sector’s costs.
World Economic Forum (2007). The GCI survey includes ratings for corruption, infrastructure, and the like, which the Doing Business survey does not. That could explain the relatively lower rank.
Investment climate variables (as referred to in World Bank surveys) variables overlap significantly wi th Doing Business Indicators, but include additional questions on infrastructure costs and political and macroeconomic risks. They also include information on perceptions o f business owners beyond objective quantitative data.
42
43
44
32

Figure 3-3: Perception of Firms on Groups of Investment Climate Variables, 2002 and 2006 (0-0 obstacle; 4=major obstacle)
I access to infrasbucbre
access to land and Mance
1 2002 2006 1 Source: World Bank’s Kenya Investment Climate Assessments (2004,2007).
3.8 In al l the surveys discussed above, the private sector has repeatedly identified poor and costly infrastructure services as the binding constraint o n business. In ICA 2007, 47 percent and 55 percent o f businesses consider transportation and electricity, respectively, as a major obstacle. Importantly, o f a l l the manufacturing f i r m s that were surveyed in both periods, an additional 12 percent considered infrastructure services (transport or electricity) to be a major obstacle in 2007 compared to 2002. As expected, manufacturing f i r m s (including agribusiness) are more severely hurt by poor infrastructure services than other businesses. On average, transport costs are about 10 percent o f non-factor costs (excluding the cost o f materials) o f manufacturing f i r m s in 2007.45
3.9 From the point o f view o f competitiveness in international trade, i t i s more instructive to examine performance o f trade logistics as a package. For trading f i r m s competing globally, overall reliability o f the supply chain i s critical. This includes customs procedures, logistics costs, ability to track and trace shipments, timeliness in reaching the destination, and the efficiency o f domestic logistics. Kenya ranks 76 out o f 150 countries o n the Logistics Performance Index, recently released by the Wor ld Bank. In comparison, South Afi-ica ranked at 24, China at 30, and India at 39. Kenya’s rankings on the competence o f public and private logistics service providers, domestic logistics costs, and transport infrastructure are particularly l o w and highlight the need for priority attention to these areas. The next chapter returns to the subject o f transport logistics to identify a policy agenda for reform.
45 There i s significant regional variation in perceptions about infrastructure services as a constraint. Firms outside Nairobi find infrastructure services a bigger hindrance to doing business. Costs o f infrastructure service inputs (electricity, transportation, and water) outside Nairobi represent 35 percent o f total nonfactor costs, excluding materials, compared with 24 percent in Nairobi (without controlling for fm characteristics).
33

3.10 Cost o f energy inputs continues to be cited as a major competitiveness issue by manufacturing f i rms. Power outages increased from an average o f 16.4 hours per month in 2002 to 24.5 hours in 2006, with perceived losses o f 7.1 percent o f sales in the latter year.
3.1 1 Crime, theft, disorder, and corruption remain serious constraints to doing business. Some 54 percent o f f i r m s reported corruption, and 58 percent o f f i r m s reported crime, as a major or very severe constraint to doing business in I C A 2007.46 Cross-country comparisons show that losses and costs due to crime, security, and corruption remain high. Estimated losses o n these counts add up to 10.4 percent o f sales in Kenya compared to 1.8 percent in South Africa, 2.9 percent in Senegal, and 3.6 percent in India (Table 3-1). Managers participating in government procurement report that informal payments can be as high as 12 percent o f the contract value ( ICA 2007).
Table 3-1: Direct Costs of Weak Security and Bribes to Formal Firms, Cross-country Comparison
Cost as YO of Kenya China India South Africa Senegal Tanzania Uganda sales (2007) (2002) (2005) (2003) (2003) (2006) (2006) Crime 3.9 0.3 0.2 0.6 1 .o 1.1 1 .o Cost o f security 2.9 0.8 1.3 0.9 1.5 2.3 1.4 Bribes 3.6 1.9 2.1 0.3 0.4 3.4 3.7 Total costsa 10.1 2.0 3.6 1.8 2.9 6.8 6.1
~~
Source: ICA surveys. a. Adding up in each column i s for illustration only. Strictly, average o f costs cannot be added.
3.12 The perceptions o f Kenyan f i r m s about the tax burden are negative. ICA 2007 finds that almost 60 percent o f surveyed businesses identified tax burden as a major constraint to business. Objective indicators o f fiscal pressure reported in the “Doing Business 2008” report suggest the Kenya’s tax burden i s higher than most comparator countries (Figure 3-4).47 This finding begs more analysis because Kenya’s tax rates are comparable to neighboring countries (Appendix Table A-4). The burden o f paying taxes i s relatively high though. Experience elsewhere suggests that negative perceptions about the tax burden could be rooted in unreliable and costly public services. Given these perceptions, further analysis may be needed to establish if tax levels constrain new investment or create large distortions otherwise. At the very minimum, the government should make sure that earmarked tax revenues such as the road levy or the sugar levy are efficiently spent for the purposes for which they are collected. In addition, a simple and predictable tax environment that reduces the cost o f compliance with tax obligations i s desirable.
46 These figures were higher in 2003,
47 The “Doing Business 2008” report measures Kenya’s tax burden as 50.9% o f gross profits. This burden includes the following: fuel tax (0/02), land rent (0.02), financial transactions (0.03), land rates (0.30), road maintenance levy (0.42), excise o n fuel tax (0.48), business license (0.84), apprenticeship tax (1.52), manufacturing tax (4.21), NSSF (5.25), standards levy (5.30), and corporate income tax (32.53). I t should be noted that Kenya’s tax rates are comparable with other EAC and comparator countries in SSA.
34

Figure 3-4: Tax Burden as Percentage of Gross Profits, Cross-country Comparison
70 Y
n E 60
3 50
8 20
40
2 30 +
E
10
0
d
China India Kenya Senegal Tanzania South Ghana Uganda
country Africa
Source: World Bank (2007e).
3.13 Access to jnance (availability and cost) has improved between 2003 and 2007, yet it was cited as major or severe obstacle to doing business by about 42 percent o f f i r m s in the ICA 2007. The problem i s more severe for smaller businesses. About 76 percent o f microenterprises considered access to finance a serious constraint. One reason for these perceptions appears to be the high cost o f collateral requirements in Kenya. The median firm posts 120 percent o f the loan amount as collateral. This discourages f i r m s f rom applying for loans. Microenterprises are less likely to meet the collateral requirements than larger enterprises. Some 43 percent of microenterprises (out o f a sample o f 92) reported that they did not apply for a loan because collateral requirements were high. The reason for conservative lending practices appears to be that the l aw i s restrictive in what can be used as collateral. On average, the value o f the required collateral represented 125 percent o f the credit l ine or
3.14 Informality also significantly restricts access to finance. Importantly, some kind o f legal status (such as registration o f company name, commercial registration, an operating or trade license or a general business license, or a tax identification number) i s highly correlated with access to finance. Nearly 35 percent o f microenterprises that had some legal status had access to external credit, compared to only 4 percent o f nonlegal enterprises. Apparently, a legal status i s a signal o f firm quality to the lender.
3.15 Evidence from another source-the Financial Access Survey 2006 (FAS-conducted by Financial Sector Development Trust, Kenya) finds that access to credit depends on geographic location o f businesses as well. I t shows that access to credit declines as one goes from urban to rural to arid to semi-arid areas. I t may partly be due to the density o f branch network in different areas. Over 90 percent o f Kenya’s bank branches are in urban and rural districts. Branches in semi-arid districts account for 4.7 percent o f the national total, while those in arid districts account for 2.8 percent. Appendix C contains more findings o f the FAS.
48 Some 60 percent o f manufacturing firms applying for a credit l ine o r for a loan with financial institutions were required to post collateral based o n their land, buildings, machinery, and equipment. Some 38 percent were required to post account receivables and inventories; and 15 percent were required to post personal assets o f the owner.
35

EXPORTS PERFORMANCE AND POLICY ACTIONS FOR ENHANCING GLOBAL INTEGRATION
3.16 Historically Kenya’s export performance has been below i t s potential despite some notable achievements. The Wor ld Bank (2007a) report carried out a detailed review o f Kenya’s export performance over the past three decades (Box 3-1) and made recommendations to accelerate diversification o f exports. The following paragraphs extend the analysis o f the 2007 report to a more recent period and introduce newer tools o f analysis to get a sense o f future prospects.
I Box 3-1: Historical Performance of Kenyan Exports I In several areas, Kenya’s exports have done very we l l over the past two decades. Kenya has built a competitive supply chain based o n i t s comparative advantage as an off-season producer in cut flowers and fresh h i t s and vegetables. Exports o f cut flowers and fresh vegetables to the EU grew at annual rates close to 10 percent between 1995 and 2003. The country i s n o w Africa’s biggest grower o f cut flowers and one o f Africa’s largest exporters o f fresh horticultural produce. Horticulture exports comprise approximately 27 percent o f Kenyan exports. In the apparel sector, Kenyan exporters were able to take advantage o f preferences provided by the Afr ican Growth and Opportunity A c t (AGOA). Apparel exports also grew two hundred-fold between 1976 and 2003. The tourism industry boomed after the U.S. and UK travel bans were lifted, and total tourism receipts were estimated at more than US$750 m i l l i on in 2006.
Overall, however, Kenyan exports have stagnated until recently. Between 1980 and 1985, Kenya supplied 0.65 percent o f wor ld trade; by 2003, i t s share o f trade had declined to less than ha l f o f that, although Kenya maintained i ts share o f the manufacturing market. Between 1980 and 2003, Kenya experienced diminished competitiveness in many o f i ts exports, coffee being a notable example. While Kenya has expanded i t s nontraditional natural resource-based exports, a significant share o f exports are st i l l agricultural commodities (mainly coffee and tea), for which prices have shown declining trend. Yet natural resource-based exports, in which Kenya has a comparative advantage, are expected to continue to b e the mainstay o f i t s trade for quite some time. Source: World Bank (2007a).
3.17 In the past few years, important changes have taken place in Kenya’s exports in terms o f the pace o f growth, the commodity composition, and the relative importance o f trading partners, a l l indicating that the chronic decline in Kenya’s exports since the early 1980s could have ended and a process o f renewal i s emerging (Table 3-2) records recent trends in Kenyan exports. Since 200 1, Kenya has experienced export growth for six consecutive years, averaging 15.1 percent a year. This constitutes a significant pick up compared to an average 1.8 percent in the previous six years. Exports o f both goods and services have grown. Kenya’s exports o f services grew at a rate o f 16.3 percent per year between 2000 and 2006.49 The goods exports-to-GDP ratio has improved, averaging about 17 percent in the six years since 2001, compared with 15.5 percent for the previous six years.
All components o f service exports contributed to this dynamic behavior. Annually, transportation services grew at 16.4 percent, telecommunication services grew at 56.1 percent, and travel and government export services grew at 15.1 and 9.2 percent each during this period.
49
36

Table 3-2: Recent Trends in Kenyan Exports (all numbers in percent)
1995 1996 1997 1998 1999 2000 2001 2002 2003 2004 2005 2006
Annualchangein thevalue 12.8 9.8 -2.7 -1.8 5.8 -13.1 6.4 14.5 12.1 31.0 14.5 12.1 of Total goods exports
Annualchangeinthevalue -- 8.6 -5.4 -1.1 7.9 -13.4 5.8 4.9 5.7 9.1 35.2 -- of Non-oil’goods exports
Annual changein thevalue -- 29.4 33.3 -9.1 -15.6 -8.1 13.7 132.6 47.6 25.8 16.6 -- of oil exports
Annual change in the value -- -8.7 -2.4 -9.2 12.7 6.2 12.8 3.0 3.8 30.0 21.0 -- of services exports
Shareofgoods exports in 18.2 16.7 14.9 13.6 15.7 13.9 14.2 16.6 16.4 16.7 18.5 19.6 GDP
Share of goods exports in 0.038 0.036 0.035 0.035 0.036 0.028 0.030 0.033 0.032 0.030 0.034 0.035 world exports
Source: IMF Balance o f Payments Statistics, UNTFL4DE. 1. Oil refers to petroleum products exported to neighboring countries. -- not available.
3.18 Product composition has also changed. The combined share o f the traditional export items such as tea and coffee fel l f rom 35.4 percent o f total exports to 18.5 percent f rom 1995 to 2006. The share o f petroleum products climbed from 7.1 percent to 24.1 percent during the same period.50 While product diversification has taken place, export concentration has increased- reflected in the share o f largest f ive export items in total exports, which has increased f rom 5 1.9 percent to 58.3 percent since the mid-1990s (Appendix Table A- 4).
3.19 The “discovery” o f new products appears to have stalled, however.” In the past, Kenya had discovered several new products such as cut flowers and horticultural products. However, in the 2000 to 2005 period while Kenyan exports gained world markets share in certain products such as fresh horticultural and floricultural products, garments, and fish, there were n o new lasting “d i~cover ies. ”~~ In comparison, Uganda has discovered 97 nontraditional products between 1976 and 2004, which accounted for 40 percent o f Uganda’s overall export basket f rom 2001 to 2004 (World Bank 2007j).
The increased share o f energy-product exports is the result o f increased domestic capacity to refine foreign-produced crude petroleum. Mos t o f t h i s i s destined for Uganda and Tanzania.
” “Discovery” refers to a situation in which a country produces and develops export capability for a product that i s new to the country, but not necessarily new to the international market. The methodology o f Kl inger and Lederman (2004) i s used to identify discoveries for the 1969-2005 period using COMTRADE data. A new product (discovery) i s recorded when the ten-year average exports (up to year “t”) jump f rom less than US$lO,OOO to more than U S $ l m i l l i on per year in year t+10 (10 years later). Lowering the threshold for the jump o f exports to US$500,000 yields two new products: “unmilled barley” and “chocolate and other food preparations containing chocolate.” A similar methodology and criteria to that used to identify product discoveries was used for c o u t r y discoveries.
Fol lowing Kl inger and Lederman (2004), one can find isolated discoveries in the 2000s, such as fats oils f rom fish, fuel wood, coal, and y a m o f regenerated fibers in 2001; and tin and tin alloys in 2002. However, these discoveries did not last, as their export value in US. dollars has fallen in subsequent years.
50
52
37

3.20 The good news though i s that exports have become more diversified in terms o f destination countries. Kenya has “discovered” a handh l o f new export destinations, both within and outside the SSA region. N e w export destinations for Kenya outside SSA include Belgium, Kazakhstan, Luxembourg, Poland, and Russian Federation.
3.21 Despite the discoveries, Kenya i s in the midst o f a long-term trend o f exporting more o f i t s goods to low-income countries. This shift has occurred as Kenya’s trade with the EU has shrunk, while i t s trade within the East African Communities (EAC) and the Common Market for Eastern and Southern Africa (COMESA) has expanded (Figure 3-5). There i s further scope for Kenya to expand i t s regional trade, particularly in commodities such as maize, dairy, processed food, and cotton and cotton products following the expiration o f a provision in the AGOA allowing the use o f third-party fabrics. However, the growth potential for regional trade in finished goods i s l imited because countries in the region have similar resource endowments producing similar products (low complementarity). An important implication o f this view i s that the primary objective o f regional integration for Kenya should be to improve competitiveness by integrating fragmented markets. Regional integration should be seen as a stepping-stone to greater integration in the world economy, rather than expanding regional trade.
Figure 3-5: Kenya’s Exports by Income Level o f Destination Countries, 1980-2005
90 80 70
E 60 50 ! 40 30 20 10 0
Q
O N w a c o O m t Q c o O m w c o c o w w c o a a a a a o o o N N N
z z z z ~ ~ ~ z z z o o o year
Source; Staff calculations, based o n COMTRADE data.
3.22 Digging deeper into the structure o f Kenya’s exports produces some more positive news. One approach i s to look at the revealed comparative advantage (RCA) o f goods in Kenya’s export basket between two periods, 1980-85, and 2000-05.53 Between these periods, Kenya managed to gain comparative advantage in the export o f 20 groups o f exportable products, representing almost 28 percent o f the country’s average exports f rom 2000 to 2005. M a i n examples are outer garments, metal equipment, i ron sheets, fish products, and sugar confectionary. During the same period, the country maintained i t s RCA in 14 groups o f products that contributed over 55 percent o f goods exports f rom 2000 to 2005. Importantly Kenya did not lose R C A in any o f the groups o f exports. Products in which Kenya did not have a RCA in either o f the two periods represented a
53 Balassa’s concept o f RCA is used. A country has RCA in a product if the share o f that product in the country’s total exports exceeds the share o f the product in total wor ld exports. Th is i s the same as saying that the share o f a country’s exports in the world exports o f a product exceeds that country’s share in total wor ld exports.
38

small 12 percent o f Kenya’s exports f i om 2000 to 2005. (Appendix Table A-5 l i s t s each category o f products.) This analysis suggests that generally Kenya i s adding to the l i s t o f products in which it has comparative advantage while maintaining its strengths.
3.23 Another summary way to look at Kenya’s export package i s to use the EXPY index suggested by Hausmann and Klinger (2006). The EXPY index constitutes a proxy for the degree o f sophistication or productivity that an economy achieves because o f the process o f discovering new products by entrepreneur^.^^ By definition, richer countries would have higher EXPY, and a progression over time would indicate change in sophistication o f a country’s export package. Figure 3-6 plots E X P Y progression for a selected group o f countries. I t can be seen that Kenya’s level o f EXPY i s low, which indicates that Kenya’s exports are largely poor countries’ exports. The good news i s that EXPY appears to be improving since 1998/99.
Figure 3-6: EXPY (proxy for degree of sophistication), High Performing Countries and Kenya, 1992-2003
18000 1 16000
14000
P 12000 n 10000
((+ 8000
6000
4000
i Ireland _. Japan
--c 91 nga pore 7 ’ A r e a , Rep.
Kenya 2000 1 I I
Source: Hausmann, Hwang, and Rodrik (2005) database.
3.24 What i s Kenya’s potential to develop comparative advantage in products with higher sophistication? In recent research, Hausmann and Klinger (2006) have proposed that the probability o f developing RCA in a particular good in the future i s affected by the ease with which the current capabilities in the economy can be adapted to the new product. In other words, the “proximity” o f a new product to the country’s current export basket will matter. A “new” product with higher proximity to the country’s export basket and with higher income value (as measured by PRODY) will be more l ikely to attract entrepreneurs’ attention and the country i s likely to develop RCA in those products in due course.55 Indeed, in Kenya, between 1980-85 and 2000-5, several products with higher PRODY and higher proximity to the export basket in the
s4 EXPY i s an indicator that measures the income levels associated with a country’s export basket. I t i s calculated as the weighted average o f the country’s implicit export basket income, using as weight the shares o f each product in the country’s export. In tum, each exportable product income (PRODY) i s calculated as the weighted average o f incomes o f countries exporting that product, using as weight the revealed comparative advantage o f each country in the product. See Hausmann and Klinger (2006) for details.
s5 This, in a way, suggests the process o f structural transformation and growth. Resources will move from products with low PRODY to high PRODY, producing a shi f t in the country’s production basket.
39

1 9 8 0 4 periods have become products with R C A in 2 0 0 0 4 . This highlights a certain amount of dynamism in the Kenyan production-and hence export-basket; Kenya appears to be moving toward higher value products.
3.25 Extending the methodology discussed above, i t i s apparent that Kenya has the potential to develop comparative advantage in several “new” products. Specifically, products that today show a combination o f high density or proximity and high income value (PRODY) and that are currently not exported, or are exported in relatively small amounts, constitute the candidates for developing future RCA. Such products include: fish and i t s preparations; essential oils and toilet articles; manufactures o f metals; paper, paperboard, and articles o f paper; resins, cellulose, and plastic materials; and edible products and their preparations (Figure 3-7).
Figure 3-7: Measure of Proximity to Current Export Basket (Ease to Adapt), Income Value (PRODY), and Export Values of Products with RCA, Kenya, 2000-4
22000
.- !3
5 ; 12000
17000
s
2
8
0
0 0 hl
5; 7000
n
1
2000 1.2 1.4 1.6 1.8 2
Proximity (log of inverse density. 2000-2004) 0 1. Kraftpaper and paperboardjn rolls e 2. Fish,dried,salted or in brine ; smo o 3. Malt extract;prep.of flour &,for 0 4. Printed rnatter,n.e.s. a 5. h inop las ts 0 6. Seep’s or lambs’woo1,greasyorfle
0 8. Polishes & creams,forfootwear,furn 0 9. Disinfect.,anti-sprouting prod.etc. 10. Malt,roasted or not (including malt 0 11. Fish fillets,frozen 12. Other sugars;sugar syups;artificia a 13. Boxes,bags & oth.packing containers a 14. Paper & paperboard,corrugated,crepe
15. Art.commonlyused for dorn.purposes, 0 16. Metallic salts and peroxrjalts of i @ 17. Edible products and preparations n. 0 18. Starches,inulin and wheat gluten 0 19. Seeds,fruit & spores,nes,of a kind 0 20. BulbsJubers &rhizomes offlowerin
7. Miscellaneous articles of base meta
Source: Staff calculations, based on COMTRADE Note: The size o f the circles represents the share o f exports o f the product in total Kenya exports. PRODY i s a measure o f the weighted income level o f countries exporting that product. Density i s a measure o f the ability o f the economy to produce and export a given product (in other words, o f the proximity o f the product to the country’s export basket).
3.26 More evidence o f dynamism i s that Kenyan f i r m s are investing in innovation. Over the last three years, two-thirds o f a l l manufacturing f i r m s reported having introduced a “new or significantly improved process o f production” and 57 percent reported having introduced technological innovation (ICA 2007). These data suggest a higher rate o f innovation than that reported in other African countries by Bigsten and Soderbom (2006). Figure 3-8 shows the
40

sources o f technological information and innovation reported by manufacturing f i r m s in ICA 2007.
Figure 3-8: Sources of Technological Information and Innovation
Embodied in new equipment
B y hiring key staff
Domestic licensing
From parent company
In collaboration with client f i rms
I
1 International licensing 1
In collaboration wth supplier o f equipment
I
Developed locally
Other I
1 , 1
0 0.1 0.2 0.3 0.4 0.5
1 H Technlogical innovation Technological information 1 Source: ICA 2007.
Improving Global Integrations6
3.27 As the preceding discussion indicates, there are several positive aspects to Kenya’s recent export performance. Apart f rom the growth o f exports, which i s showing some dynamism, the product and country composition o f exports i s also changing toward a more balanced mix in terms o f traditional and manufacturing products, as wel l as high- and low-income trading partners, ensuring a broader base for an export-led strategy. The R C A analysis shows that Kenya continues to have comparative advantage in a large number o f resource-intensive and labor- intensive subsectors in agriculture, manufacturing, and services. In addition, EXPY analysis provides signs o f improving sophistication o f output mix. Overall, i t appears that serious opportunities exist for Kenya to accelerate export growth. In terms o f products and markets, these opportunities are in the following areas:
This section draws considerably upon Wor ld Bank (2007a), which carried a detailed review o f Kenya’s trade pol icy and institutions. The paragraphs that fo l low highlight and update key recommendations o f that study. This discussion s t i l l leaves out institutions and policies for export promotion, such as export processing zone (EPZ) schemes. Export promotion i s an important topic for further analysis.
56
41

Increasing exports of existing products in existing markets A good example i s increasing garments exports in the EU market to take advantage o f the recent improvement in the rules o f origin agreed as part o f the interim Economic Partnership Agreement (EPA). Under the new “single transformation” rule, the EAC countries can export garments to the EU made from cloth imported from any country. This important market access opportunity would allow Kenya to intensify i t s penetration in the EU and repeat i t s success in garment exports to the United States under AGOA.
Expanding the range of markets into which existing products are sold. Recent experience show that this opportunity exists both in the industrialized countries (horticulture and floriculture) and in low-income countries in the region (labor- intensive manufactures). Fast-growing emerging economies such as Brazil, China, and India can also be targeted to export existing products (World Bank 2007b).
Upgrading the quality of the existing products and/or adding further value to these products. This would apply particularly to food processing-and moving up in the value chain, to textiles and garment products. For example, options should be explored to repeat the success in exporting fish fillets instead o f frozen fish.
Taking advantage of opportunities to expand exports of services. Opportunities exist especially in the tourism, financial, and off-shoring services, to serve global as wel l as regional markets. Recent performance shows recovery in exports o f services.
Producing parts and components as part of global production and trading networks. Kenya should explore both the global and regional markets in these new dynamic areas o f trade (World Bank 2007a).
Introducing new products (discovery) These products would l ikely be new to Kenya. As discussed, during the past 25 years, Kenya has developed a number o f “emerging products” where it demonstrates R C A (20 products at the three-digit level, constituting 27.6 percent o f Kenya’s exports in 2 0 0 M 5 ) .
3.28 H o w can these opportunities be exploited? A m i x o f policy actions will help the private sector exploit these opportunities. Foremost among these are the actions that would cut costs identified in the previous section and improve global competitiveness o f the Kenyan businesses. Chapter 4 lays out the policy agenda for reducing the cost o f backbone services in transport and telecommunications. The final part o f this chapter discusses actions in two other areas to improve competitiveness: trade policy, including trade facilitation and trade policy coordination; and sectorhndustry-specific actions.
Trade Policy and Trade Facilitation Actions
3.29 Kenya should use i t s membership in regional trade groups-EAC and COMESA-to consolidate fwther trade openness, with a v iew to enhancing i t s competitiveness rather than securing trade-diverting preferences. Within EAC, the priority for Kenya i s to push for the completion o f the full E A C free trade area (FTA). This would require elimination o f the remaining nontariff barriers (NTBs) on intra-EAC trade and liberalization o f the backbone services (transport, telecommunications, and finance) in the E A C zone. In the medium term, the E A C will need to reduce tariff protection further by cutting the maximum common external tar i f f (CET) and i t s exemptions, improving and harmonizing the business environment to establish a
42

common market, and reducing the role o f internal border posts to consolidate the E A C customs union. The scheduled CET review in 2009/10 will offer an opportunity to reduce the maximum CET rate, simplify the exceptions regime, and reduce tar i f f variation and escalation.
3.30 COMESA i s a significant and growing market for Kenya, constituting over 30 percent o f i t s total exports. Within COMESA, the priority i s to deepen the free trade area by eliminating non-tariff barriers on intra-COMESA trade, and harmonizing and improving customs procedures and transit policies.” The medium-term measures include liberalization o f the backbone services and harmonization o f the behind the border policies such as the investment code and competition policy to make the COMESA zone an investment destination.
3.3 1 In areas where Kenya cannot move speedily enough through these trade groups, i t should move unilaterally with an eye on global competitiveness beyond the borders o f regional partners. Further liberalization in telecommunications (discussed in Chapter 4) and financial services can be carried out unilaterally. The variable geometry principle (the idea that not every country need take part in every policy but some can cooperate more closely) included in the E A C and COMESA agreements allows Kenya to move faster in these areas, with the expectation that other members would catch up and the policies would be harmonized later.
3 -32 Equally important i s securing access to export markets. As noted earlier, Kenya, together with i t s E A C members, has signed an interim Economic Partnership Agreement with the EU.” Negotiations will continue toward a full EPA in 2008. Among the issues yet t o be negotiated are trade in services, rules o f origin, and competition policy, which are critically important for Kenya. Together with i t s EAC partners, Kenya needs to prepare for these negotiations and conclude a full EPA in 2008.
3.33 The outcome o f the Doha Round o f negotiations i s important for Kenya, given the increasing geographic diversification o f i t s exports. Kenya’s interests in these negotiations include substantial reduction in agricultural protection, and tariff peaks and escalation in manufacturing, both in the industrialized and emerging market economies. The multilateral route may also be the best route to negotiate market access to dynamic Asian markets, where Kenyan products face high tar i f f barriers.
3.34 Compliance with food safety and agricultural health standards has been an important factor driving Kenya’s diversification into such nontraditional exports as horticulture, cut flowers, and to a lesser extent, fish. Public-private partnerships in these sectors, encompassing a suitable regulatory framework and the broad adoption o f good agricultural and manufacturing practices, should serve as an example to other industries. The development o f such systems i s crucial if
’’ Kenya (together with Burundi, Rwanda, and Uganda) recently agreed to a C O M E S A CET, which wil l be launched in December 2008. This clearly conflicts with i t s commitment to the EAC CU and does not seem to be in the trade interests o f Kenya. I t would therefore appear advisable for Kenya (and other EAC members) not to participate in the C O M E S A CET.
The Agreement allows 100 percent liberalization by value by the EU as o f January 1, 2008 (with transition periods for rice and sugar) and 82 percent liberalization by value by the EAC (64 percent in 2 years, 80 percent in 15 years, and the remainder 2 percent in 25 years). I t covers 100 percent o f EU tar i f f lines and 74 percent o f EAC tar i f f lines. EAC’s excluded products include agricultural products, wines and spirits, chemicals, plastics, wood-based paper, textiles and clothing, footwear, and glassware. The Agreement also allows “single transformation” for clothing to be eligible for duty-free, quota-free entry into the EU market (the same rules o f or ig in as AGOA) and covers the fisheries sector, main ly aiming at reinforcing cooperation o n sustainable use o f resources and improving rules o f origin for fisheries products.
58
43

Kenya’s industries are to meet the evolving challenges associated with competing in developed markets. Three broad priorities are raising awareness about good agricultural practices; improving pest risk assessment and management capacities; and improving landing sites and environmental management in Lake Victoria.
3.35 In other sectors, quality, standards, and conformity-assessment systems should fo l low a medium-term strategy o f diversification into new regional and global export markets. With this goal in mind, it i s important that institutions for setting standards and assessing conformity are reoriented toward facilitation. This will necessitate increased private-sector participation in the regulatory debate and private-sector provision o f services (mainly testing, conformity assessment, and consultancy), whenever possible. Regionally, the government should lead efforts to develop jo int sanitary and phytosanitary management capacity and share selected resources. The use o f Kenya’s pending accreditation system as a regional platform i s an obvious starting point. Other promising areas for regional cooperation are cross-border management o f pests and diseases (a clear public international/regional good); food safety, hygiene services and training in the tourism industry; and establishing “regional centers o f excellence” in instances where capacity i s lacking in neighboring countries and regional markets.
3.36 The Wor ld Bank (2007a) report identified several shortcomings in Kenya’s trade institutional framework. The main weakness i s that policy making for trade i s divided among various ministries and institutions without an effective coordination o f policies. Under the current institutional structure, the Ministry o f Planning and National Development (MF’ND) nominally takes the lead in formulating trade policy and the Ministry o f Trade and Industry (MoTI) oversees implementation. In practice, these roles are not clear-cut, and as many as 12 ministries are involved directly and indirectly in developing and implementing trade policies and programs. There i s a need for streamlining the responsibilities o f various ministries and developing an effective coordination mechanism at the level o f consultation with the stakeholders, policymalung, and implementation. It i s equally important that the M o T I closely consult with exporters to remain informed about developments. T o that end, the various public-private consultative bodies and committees on trade policy should be consolidated into one such body. Particular attention should be given to ensuring effective private sector participation in the consulting mechanisms.
Industry/Sector-specific Actions
3.37 As argued in the growth strategy section o f Chapter 2, industry/sector-specific pol icy actions also have the potential to improve competitiveness, beyond the across the board measures discussed above. One issue in this regard i s what sectors/industries should receive government attention because the government could end up spending public resources to support “strategic” sectors that turn out to be not so strategic after all. The Vis ion 2030 document identifies tourism, agriculture, retail and wholesale trade, manufacturing, business process outsourcing, and financial services as the potential “engines o f growth” and develops sector strategies for each o f them.59 These sectors mostly appear to be wel l chosen. Tourism’s potential i s widely accepted. There can be n o doubt about the importance o f agriculture and manufacturing sectors to the growth strategy. Finally, information and communication technology-based services could also have the potential since Kenya has a skilled and English-speaking labor force. However, the issue i s more in terms o f what i s done within each o f these main sectors. The fol lowing paragraphs attempt to address this issue.
59 National Industrial Policy, draft interim report, Min is t ry o f Trade and Industry (GoK 2007c) also develops a l i s t o f government actions for various sectors.
44

3.38 A general caution based on experience o f other countries i s that tailoring government policy or tying up government resources and management capacity to the identified sectors could be costly: in terms o f both opportunity costs and direct costs. Instead o f developing and implementing grand sector strategies, it i s better to focus f irst o n generic economy-wide reforms. Sector interventions, where needed, would be more in terms o f addressing governmentlmarket failures specific to a sectorhndustry. These sector/industry-specific actions would relate to competition, regulation, bottlenecks in supply chain, information gaps, infrastructure gaps, coordination failures, and so on. They would not entail tax breaks, subsidies, or direct financial support. Kenya’s own experience o f past successes i s il luminating in this regard. For example, in the horticulture industry, much o f the success has been attributed to the “light” regulation and taxation by the Horticultural Crops Development Agency rather than government financial support. Similarly, tea exports have benefited f rom the supervision o f the Kenya Tea Development Agency, which efficiently manages input provision and collection o f green leaf tea, and from allowing smallholders to sell their produce directly to buyers, rather than any input subsidies (World Bank 2007a).
3.39 Within the main sectors identified by Vision 2030, there are possibilities o f policy actions at the subsector/product level. For example, the National Export Strategy Implementation Act ion Plan 2005 (GoK 2005a) covered livestock and livestock products, fish and fish products, textiles and clothing, horticulture, and food and beverages subsectors.60 It came up with sensible actions that the government could take to accelerate export growth in the identified subsectors (Appendix F contains an excerpt f rom this action plan). A general approach in identifying subsectors/products for government support i s to listen to the private sector. This means that the government follows the private sector rather than try to lead it. If this approach were followed, the first stop would be the sectorshndustries that have already achieved a success, or where success i s building. For example, the government would f i rs t concentrate on providing an enabling environment to recover, maintain, or improve i t s competitive position in traditional sectors, along with nontraditional, natural resource-based industries in which there i s proven potential for growth and poverty reduction.61
3.40 Using the approach described above, this report identifies policy actions to accelerate growth in ICT-based industry in Chapter 4. An ongoing study at the Wor ld Bank i s attempting to identify actions for the tourism subsector (World Bank 2008b). Appendix G contains selected preliminary findings o f the study.
6o Similarly, the W o r l d Bank (2005) report includes recommendations for clothing, coffee, and pyrethrum sectors based on value-chain analysis.
Beyond the existing successes, or sectors/industries where success i s building up, analysis can suggest other products to be “targeted.” For example, the PRODY methodology discussed earlier in th is section can be used to generate a l i s t o f products where Kenya would have the potential to develop comparative advantage. However, a general caution should be used against such an exercise to be taken at i t s face value. The private sector would remain the best judge o f what i s possible, and the government would do we l l to fo l low the private sector rather than lead it.
45

4. IMPROVING TRANSPORT AND TELECOMMUNICATIONS SERVICES
4.1 Reducing the cost and improving the quality o f transport and telecommunication services i s expected to generate significant benefits to the Kenyan economy. The benefits would accrue through reduction o f transaction costs and improvement in productivity. The benefits would reach the whole economy because al l real productive activities use these services, but manufacturing and tourism sectors would benefit more than others would. In a background paper done for this report, Ballistreri, Rutherford, and Tarr (2008) estimate that Kenya could gain as much as 9.9 percent o f consumption or 8.3 percent o f GDP by reforming i t s business services.62 This chapter identifies a policy agenda for reforming transport and telecommunications services.
TRANSPORT LOGISTICS
4.2 Kenya’s transport logistics include air, rail, maritime, road, and pipeline facilities. Performance and issues vary enormously across these sectors.63 Reforms have resulted in a wel l functioning air transportation system. However, Kenya’s port, rail, and road transportation services are a significant drag o n the competitiveness o f i t s exportables. These problems were highlighted by Kenya’s ranking on the international Logistics Perception Index o f 2006.64 Of 150 countries, Kenya ranked seventy-fifth-below several Afkican countries, although above the average for Sub-Saharan Africa.
Maritime Transport
4.3 Kenya’s port operations are plagued by complicated bureaucratic procedures and inefficient handling o f containers. The Kenya Ports Authority (KPA), a statutory body under the Ministry o f Transport, operates the international port at Mombassa. Both port and container traffic at Mombassa port have increased substantially since 2002 and KPA i s struggling to improve the efficiency o f handling operations to meet the demands o f increased traffic. It takes an average o f two weeks to clear a container at the port; for 18 percent o f containers, it takes as much as three weeksa6’ Performance o f the port suffers f rom lengthy clearance and documentation procedures. Although most o f the procedures relate to customs documentation, other government agencies exacerbate the problems. In 2007, at least ten government agency stamps were required on clearance documents to clear a single container. Handling and management o f containers within the terminal i s s t i l l based o n an ineffective manual card system.
62 The paper covers banking, insurance, and wholesale and retail distribution services in addition to transport and telecommunications services. These gains are static gains: a one-time increase in the level o f GDP .
This chapter does not get into the details o f trade logistics issues at the borders (such as customs), which are equally important for competitiveness, as discussed in the previous chapter. W o r l d Bank (2007a) has detailed pol icy recommendations on that topic.
64 The Logistics Perception Index measures the perceptions o f managerial level personnel o f international freight forwarding companies. I t is published by the Global Facilitation Partnership for Transportation and Trade and i s available at www.gfptt.org.
65 Kenya Ports Authority (2005).
46

As a result, shipping and clearing agents cannot rely on KPA systems to keep track o f their containers. Efficient international container terminals moved to computer-based systems for the organization and management o f container stacking and storage in the 1980s; Mombasa needs to do the same as a top priority.
4.4 The sluggish clearance and handling procedures result in delays and an increase in overall cost o f trading goods, which has an adverse impact on Kenya’s competitiveness. I t takes, on average, ten days to clear imports, compared with five days each in Senegal and India, and four days in China (Figure 4-1). Firms report that median cost o f clearing customs i s 6.2 percent o f consignment value ( ICA 2007). The cost o f exporting a cargo container f rom Kenya i s also relatively expensive. According to the “Doing Business” report, the cost to export a 20-foot container i s US$1,955 in Kenya, compared with US$728 in Mauritius, US$390 in China, and U S $ l ,155 in Mozambique (World Bank 2007e).
Figure 4-1: Days to Clear Imports and Exports (Median), Selected Manufacturing Firms, Cross- Country Comparison
14 12 I O
E a ‘0
6 4 2 0
Kenya Kenya Uganda Tanzania Zarrbia Senegal Benin Moroaxr China India (2006) (2002) (2002) (2002) (2001) (2002) (2002) (2003) (2002) (2001)
year
time to clear customs (imports) ~d time to clear custom (exports) I Source. Compiled from World Bank Investment Climate Assessments, various countries and years.
4.5 Reforms are being implemented, however. KPA has set itself the goal o f being in the top 20 in the world in terms o f performance and reputation by 2010. The reform program includes transforming KPA into a landlord port authority, separating the commercial and regulatory functions, and putting commercial operations v ia concessions into the private sector.66 However, the Kenya Ports Authority Ac t has not been amended to allow for the envisioned private sector participation. Areas o f progress nonetheless include privatizing conventional cargo operations; issuing concessions for operating dockyard facilities and inland container depots as a step toward privatization; corporatizing Mombasa Container Terminal and Marine Services, including pilotage, through listing on the stock exchange; and outsourcing Bandari College6’ (Helu 2007).68 There are also on-going projects to improve automation, such as the Waterfront Project and the Community Based System, which will increase the f low o f reliable information to stakeholders and reduce the reliance o n a paper-based system. Achievement o f full e-port status, however, will
66 The commercial functions at the por t would be handled by the private sector, while the landlord por t authority would handle safety and regulatory functions and some infrastructure and maintenance functions.
67 Bandari College o f Marit ime Studies was established in 1980 as a training and staff development institution o f the KPA.
As o f 2007, close to 50 percent o f port operations had been privatized, including handling o f bulk grains, soda ash, cement, fertilizer, empty containers, and motor vehicles.
47

require KPA collaboration with the Kenya Revenue Authority and other agencies operating in the port.
4.6 Completing the modernization reform program will require strong political will, as modernization reduces opportunities for rent seeking (automation o f container tracking i s a good example, which has been resisted) and needs to be pushed with stronger political resolve than has been visible in the past. It would be advisable to temper ambitious plans for modernizing the port, expanding the facilities, and developing new port services B o x 4-1, and give priority to accelerating the ongoing reforms with political will and support f rom the highest level. Most importantly, the private sector- the ultimate beneficiary o f reforms-should be actively involved in the execution, monitoring, and evaluation o f the reform program.
Box 4-1: Extension of Port Services Envisioned by Kenya Ports Authority
Improvements at the port o f Mombasa KPA’s plans for improvements at the port o f Mombasa include increasing handling capacity by increasing the number o f container handling berths. KPA also plans to develop a second container terminal west o f K ipevu Oi l Terminal, at an estimated cost o f K S h 22 bil l ion. Complete financing for the project has been secured f rom the Japanese Bank for International Development. Construction on the f i ist phase o f the project i s scheduled to begin in 2008 and completed around 2020.
Second seaport city There i s a proposal to construct a second commercial seaport t o the north o f Mombasa to serve not only Kenya, but also other countries such as Ethiopia, Somalia, southern Sudan, and Uganda. This would be done through a public-private partnership program.
Cruise ship reception facilities
The Mombasa port lacks cruise ship reception facilities, which, if available, would contribute to the development o f cruise ship tourism. The KPA has solicited offers to develop and operate a Cruise Passenger Terminal facil i ty through public-private partnership arrangements.
Development of a free port
KPA i s contemplating a free port (free trade zone) in the port o f Mombasa through a public-private partnership. Goods entering the free port would be considered outside the customs territory o f Kenya and not subject t o duty. The p lan i s to create a free port with a business-friendly environment and good infrastructure to encourage exporters. Existing laws, however, do not al low the development o f such a facil i ty and litt le private sector interest has been shown to date.
4.7 Some institutional reforms at KPA may also be warranted. Since 2000, KPA has received some l imited flexibility, but s t i l l lacks sufficient f lexibil i ty to respond to market demand changes. I t suffers f rom extensive intervention by the government in decision making and lack o f clarity in i t s role vis-a-vis the g~vernment .~ ’
69 All major decisions o f the KPA Board involve a lengthy decision-making process involving a l l responsible ministries o f the government and the Off ice o f the President; th is includes privatization decisions. Fo r example, the government has not approved the privatization o f management and operation o f the inland container depots and container terminal operations; and the government intervened in awarding the rights to do grain bulk handling. Although the KPA Board approved a p lan to carry out staff rationalization and retrenchment, the government has not approved the plan. A considerable number o f employees o n temporary contracts were added in 2006.
48

Roads Infrastructure
4.8 Kenya’s road network i s in a state o f disrepair. In 2003, fully one-third o f the classified road network was in a poor or worse condition and required major maintenance or reconstruction to restore i t to original functionality (Table 4-1). In comparison to other countries in Africa, this i s a reasonably high proportion o f the classified network in goodfair condition, but the condition o f the road network i s widely perceived as a binding constraint on accelerating growth.
Table 4-1: Condition of Kenya’s Classified Roads
Condition Share of total classified (YO) kms Good or Excellent 1 1,400 18 Fair 3 1,200 49 Poor 16,900 27 Very poor 3,800 6 Total 63,300 100 Source: GoK (2003).
4.9 In the medium to long run, a sizable volume o f funds would be required to rehabilitate and maintain the network. The government estimates that backlog maintenance would require approximately K Sh 150 billion, which if implemented over a seven-year period would equate to K Sh 21.4 bi l l ion per year. Periodic and routine maintenance would require an additional K Sh 15 bi l l ion per year, increasing over time in proportion to the size o f the rehabilitated and maintainable road network (GoK 2006).
4.10 To generate additional public resources for rehabilitation and maintenance, the government increased the road maintenance levy in June 2006.70 The government has also been allocating increasing budget amounts for development projects (executed by the Ministry o f Roads). There may be a possibility o f attracting donor funds for rehabilitation o f the network, provided the government can credibly commit to a l i s t o f rehabilitation projects that have been prioritized based on economic ana ly~ is .~ ’
4.1 1 The government’s strategy i s that backlog rehabilitation shall have priority over new developments. However, equal importance needs to be attached to the routine and periodic maintenance o f roads in goodfair condition. If investments are focused only o n rehabilitating the roads in poor condition, the roads in goodfair condition will quickly deteriorate to poor condition, requiring expensive rehabilitation works in fbture. It i s estimated that for every shilling deferred in maintenance, society stands to lose 3 to 6 shillings in higher vehicle operating and future rehabilitation costs.
4.12 There are serious issues about the efficiency o f use o f existing resources made available to the Roads Department. A review o f the roads sector portfolio conducted by the Bank jo int ly with the Roads Department in 2006/772 identified several problems in project planning,
70 The Road Maintenance Fuel Levy generates about K S h 10-12 b i l l i on every year, which is considered sufficient for routine and periodic maintenance o f the existing classified road network once i t i s rehabilitated to maintenance standards.
” A priorit ized l ist o f 72 road works requiring rehabilitation, widening, and upgrading has been developed by the Ministry o f Roads with the support o f the Wor ld Bank.
’’ Background paper “Kenya: Rehabilitating and Maintaining Road Network for Growth.”
49

preparation, and implementation, resulting in l o w budget utilization and inefficient use o f resources in the form o f cost and time overruns. Chapter 5 returns to the issue o f efficiency o f public expenditure on roads in details.
4.13 Inadequate financing and prioritization are not the only issues. The institutional framework in the Ministry o f Roads i s unsuitable and too cumbersome for efficient and effective delivery o f road works. Through the Roads Bill o f 2007, the government has created three statutory road authorities: the Kenya National Highways Authority, to be responsible for the development and management o f major roads (Class A, B, C); the Kenya Rural Roads Authority, to be responsible for development and management o f rural and small town roads (Class D, E and others); and the Kenya Urban Roads Authority, to be responsible for development and management o f roads in the cities and municipalities. Expeditious transition to the new institutional set-up would help improve implementation o f roads works.
4.14 There i s also a need to improve capacity in the local construction industry. The government’s role could be in terms o f strengthening professional governance and self-regulation. For example, the government could strengthen the Engineers’ Registration Board and further empower it to discipline and sanction engineers and f i r m s that perform poorly and violate i t s charter with regard to professional conduct and ethics. The same i s true for the Association o f Consulting Engineers. The government could also assist the construction industry in establishing a professional body for construction contractors (Association o f Buildings and Roads Construction Contractors) and strengthen it to engage in self-regulation. Lastly, the government could strengthen the contractors’ registration process to ensure regular updating o f contractors’ qualifications and capacity, facilitate training in different aspects o f construction and supervision techniques, and to reprimand poor performance.
Reducing Transportation Costs through Administrative Measures
4.15 I t i s important to note that reducing transport costs does not necessarily mean developing new roads and highways, or even expanding the capacity o f existing roads and highways.73 An ongoing study (World Bank 20070 on transport costs and prices in Afr ica has recently compiled data on transport costs in Afr ica along four international transport corridors.74 Table 4-2 shows that variable costs faced by trucking companies at $ 0 . 9 8 h are the lowest for the Northern Corridor, while their fixed costs are relatively higher. In terms o f transport prices (Table 4-3), which are the cost to final consumers o f transport services, however, the Northern Corridor i s at the higher end. This shows that variable costs, which reflect the vehicle operating costs (which, in turn, depend upon the condition o f the road) are less important component o f f inal price faced by the consumers.
73 As discussed later, each o f these new infrastructure projects should be submitted to rigorous cost-benefit analysis. While developing new transport infrastructure need not be a top priority, rehabilitating and maintaining the existing infrastructure would have high rates o f return.
The study covers Cotonou-Ouagadougou, Cotonou-Niamey, Tema-Ouagadougou, LombOugadougou, and Lorn&-Niamey sections in West Africa; Douala-Bangui and Douala-N’djamkna in Central Africa; Mombasa-Kampala-Kigali in East Africa; and Durban-Lusaka-Ndola in Southern Africa.
74
50

Table 4-2: Averaging Operating Costs in Selected national Corridors in Africa Corridor Route Variable cost Fixed cost Yearly ratio
gateway-destination (VC) (US$/km) (FC) FCNC (US$/day) (percent)
Central Africa Douala-YaoundC 1.15 52 28-7 1 (Cameroon) Douala-Bafoussam 0.98 46 28-71 East Africa Mombasa-Nairobi 0.83 63 54- 45
(Kenya) Mombasa-Eldoret
West Africa Tern-AccrdKumasi (Ghana) Tema-AccrdTamale
0.98 62 56-43 1.52 30 15-84 1.61 26 10-89
Source: World Bank (2007 f, Table 3.3).
Table 4-3: Transport Prices in Africa
Average transport price per ton-km (U.S. cents)
Southern Africa corridor (North-South) 4-5 West Africa corridor (Cotonou-Niamey) 6-8 East Africa corridor (Mombasa-Kampala) 8 Central Africa corridor (Douala-Chad) 10-25 Source; World Bank (2007 f, Table 3.1).
4.16 The study reaches a few important conclusions:
A major cause o f high transport prices i s lower than optimum truck usage-due mostly to factors not related to infrastructure.
As long as international corridors are paved in a fair condition, road capacity does not emerge as a major hindrance to transport efficiency. The existing physical infrastructure may not be considered to be the most binding constraint o n several international corridors in Africa including the Northern Corridor.
4.17 The study identifies idling time-the opportunity cost o f waiting while loading, unloading, and completing administrative procedures at the borders and ports-to be much more important determinant o f transport prices than variable costs, which are determined by the physical condition o f road infrastructure. The lesson from this study i s that f rom a trade logistics point o f view, reducing wait time at the port, weighbridges, and borders i s at least as important as expanding the capacity o f existing roads. As for roads, giving priority to certain sections-for example, those that are acting as a bottleneck to off-take from the port-would bring higher benefits.
Implementing and Monitoring Logistics Reforms as a Package
4.18 As recommended by the Wor ld Bank (2007a) report, logistics reforms should be implemented and monitored as a package, since the weakest link in the supply chain can act as a bottleneck for the entire chain. A set o f logistics indicators should be developed to benchmark reforms and progress. The weakest link in the chain should get attention first. It would be critical that the private sector occupy an important role in driving forward reform, as wel l as in some advisory capacity.
51
TELECOMMUNICATIONS
4.19 Telecommunication services are an important source o f productivity improvement in supply chain management. They are also critical to the ICT-based service industry that i s seen as having potential to drive the growth targets in Vision 2030. Considerable success in liberalizing the sector has already been achieved which i s acknowledged by the private sector. In ICA 2003, telecommunication services were cited as one o f the major constraints faced by the private sector; in the 2007 ICA, they were n o longer cited as a major obstacle for doing business. The ongoing liberalization has already resulted in a significant decline in costs, yet more can be done. A regional and international comparison shows that telecommunications services remain relatively costly and there i s further scope to improve competition in the sector to bring down costs further.
4.20 The government has implemented significant reforms in the sector in the last ten years.75 The fixed-line incumbent Telkom Kenya Limited (TKL) was partially privatized in 2007; following a sale o f 51 percent o f shares, i t i s now jo int ly owned by the government and France Telecom. In 2004, TKL’s exclusivities were terminated and the licensing process for a second national operator (SNO) initiated. Competition in the mobile market was also introduced in 2000, when a second mobile license was issued to Celtel. The first, Safaricom Limited i s jo int ly owned by TKL (60 percent) and Vodafone Kenya, which acquired a 40 percent share o f Safaricom in 2000. An In i t ia l Public Offer (PO) o f 25 percent o f Safaricom shares to the residents o f East Africa was undertaken by the government in 2008 to broaden ownership further. A third mobile license was issued in 2003 to Econet Wireless Kenya who have yet to start operations but are anticipated to do so in 2008. Since 2004, additional competition to provide telecommunications services has been generated by the licensing o f four Internet backbone suppliers, seven public data operators, and five commercial Very Small Aperture Terminal (VSAT) operators. Voice over Internet Protocol (VoIP) was legalized in 2005, and mobile operators were granted licenses for international voice services the following year.76
4.21 Despite the reforms, there i s a relatively high cost o f services and some performance indicators do not compare wel l in the region. The high direct dial rates o f f ixed l ine outgoing international calls may in part be attributed to the current monopoly position o f TKL; and the relatively high costs o f mobile telephone services i s l ikely to be due to the duopolistic market structure. I t i s important, therefore, that additional operators appear on the market; and the prospect o f the third mobile operator commencing operations i s a welcome addition to improve competitiveness in the industry.
4.22 In thefixed l ine market, TKL does not have any legal exclusivity, yet i t s market share remains at 99 percent, and there i s very l imi ted competition. This has at least three effects: prices remain high, access i s low, and service delivery i s poor. Using a comparison o f the monthly basket o f connection, subscription, and on- and off-peak calls, Kenya’s fixed l ine basket was
75 The government’s initial strategy for the sector was outlined in the Postal and Telecommunications Policy Statement o f 1997. The strategy outlined a more liberal and private sector-led development designed to optimize the sector’s contribution to the economic growth o f Kenya. The Policy Statement led to the enactment o f the Kenya Communications Act o f 1998, which created the Communication Commission o f Kenya (CCK) as an independent regulator o f the sector. Since the passage o f the Act, Kenya has been gradually liberalizing the telecommunications sector. The Information and Communications Technology Sector Policy Guidelines o f March 2006 further c o n f i i the more liberal, private sector-led strategy.
Legalizing VoIP really put Kenya ahead o f the game. Currently, 36 African countries s t i l l prohibit VoIP adoption except by the monopoly incumbents. Only seven countries have legalized VoIP services (Algeria, Kenya, Mauritius, Somalia, South Africa, Tanzania, and Uganda).
76
52

twice as expensive as Rwanda and was the highest o f the countries surveyed in a recent World Bank Study (Table 4-4).77
Table 4-4: Telecom Monthly Basket Price Comparison, Selected SSA Countries, 2006 (US%)
Fixed line Prepaid Dial-up International Internet mobile Internet bandwidth bits per person
Ethiopia 1.65 4.03 14.72 0.32 Sudan 5.01 4.54 29.57 6.78 Rwanda 7.65 9.46 84.13 2.33 Tanzania 10.48 9.19 144.39 2.67
Kenya 14.16 15.86 81.13 5.12 Source: Th4G (2007). Note: The fixed line basket i s calculated using a post-paid basket comprised o f one-fifth o f the connection fee, the monthly subscription and fifteen three-minute peak and fifteen three-minute off-peak calls. The prepaid mobile basket i s based on OECD methodology (see TMG 2007). The dial-up Internet basket i s based on ten hours o f off-peak and ten hours o f peak use per month. T h i s does not necessarily compare like with like, since the speed o f connection i s also likely to vary by available bandwidth. Unfortunately, data for broadband services were not available. Mobile and Internet prices include taxes.
4.23 K e y performance indicators for the fixed line market show that Kenyans suffer long waits for a connection and unreliable service. Firms reported waiting over three months for a main line connection-more than one-and-half times the average in Afhca. In 2006, only 60 percent o f the ha l f a mi l l ion lines were actually connected and in service. Outages, incomplete calls, and faults per l ine are al l considerably higher in Kenya than many o f i t s neighbors (Table 4-5). Kenya’s main fault l ine rate i s three times higher than the Sub-Saharan African average.
Uganda 12.30 9.46 94.40 4.93
Table 4-5: Quality of Fixed Line Service Indicators, Selected SSA Countries, 2005
Percent of faults cleared by next working day
Percent of unsuccessful calls- local network
Number of faults per 100 main lines per year
Tanzaniaa 87 -- 47 Sudan 90 -- 96 Uganda 93 2.8 -_ Kenya 43 21 145 Source: TMG (2007). -- not available.
a. Data for Tanzania are for 2004.
4.24 Given the poor performance, a second national operator (SNO) and the privatization o f TKL offer considerable opportunities for service improvements (Box 4-2). The plans to issue a SNO license have stalled. Although the government has issued 19 “local loop provider” licenses, operations are restricted in scope and geography and interconnection i s difficult; hence, only a handful o f the entities holding licenses have actually launched services.
” TMG (2007). Competit ion from mobile and VoIP keeps the cost o f international calls down. As a result, the price o f international calls i s relatively low, the lowest being VoIP from Te lkom Kenya, which charges only US$0.21 per minute for calls to the Uni ted States.
53

Box 4-2: Realizing the Potential f rom Strategic Investors and Competition
Kenya has been one o f the more l iberal reformers in the area o f telecommunications. There i s no reason to stop now, and much can be learned f rom other re form success stories in the region. Morocco licensed a second mobile operator and sold 35 percent o f the incumbent in 1999. Mobi le quickly surpassed f ixed l ine provision. However, the f ixed l ine provider responded to the competition and two years later, there were 3 m i l l i on f ixed l ine customers. The dynamism continued into Internet provision, and broadband now accounts for 98 percent o f a l l Internet connections, with speeds as high as 214 Mbps (used by 6 percent o f users in 2006). Nigeria issued three mobile cellular licenses in 2001 and a SNO in 2002, and more than a dozen local network ,licenses have been granted since 2000. Population coverage o f mobile networks increased f rom 5 percent to 75 percent between 2000 and 2006. Nigeria now has some o f the most competitive f ixed and mobile markets in Africa and Celtel has deals that offer prepaid customers 60 to 120 minutes o f free on-network weekend calls.
4.25 The mobile sector has been more successful in expanding access and providing quality service. Competition f rom Code Division Multiple Access (CDMA)-based services, which offer some o f the cheapest tariffs in the market, has helped in reducing tariffs.” The sector has also been innovative in offering new services (such as the M-PESA”, the mobile phone money transfer service offered by Safaricom). However, the monthly basket o f mobile tari f fs i s s t i l l relatively high-largely driven by much higher peak call tariffs-at almost $16 per month, compared to the SSA average o f $12 per month.
4.26 The price o f mobile phones and calls could be brought down further. The issue o f additional licenses could improve competition and put further downward pressure on prices. So far, the third mobile license operator has not materialized, although it seems likely that a new mobile operator (70 percent owned by Econet) has managed to finance the fee requirements and i s due to start operations. The high prices are also driven by relatively high interconnection rates and are not helped by the addition o f a 10 percent excise tax (Table 4-4). The cost o f owning a mobile phone could also be brought down, for example, by introducing ultra l o w cost handsets at around !3 10 each. ’’ 4.27 Bringing the price o f mobile phones and calls down would help extend coverage and boost Kenya’s competitiveness. The potential productivity gains f rom increased mobile use are considerable. TradeNet, a software company in Ghana, has introduced a simplified version o f e- Bay over mobile phones for agricultural products across more than 10 countries in West Africa. Such initiatives can improve the f low o f business information, help reduce costs, and raise profits.
78 Otherwise known as fixed-line wireless, currently TKL offers CDMA2000 1X nationwide. T w o private operators, Flashcom Limi ted and E. M. Communications Ltd, provide services in Nairobi. In 2007, Celtel introduced a uni form tar i f f for calls to a l l networks and Safaricom fol lowed with a new set o f tariffs. This offered consumers huge concessions o n airtime costs, bringing the average call costs to K Sh14 per minute and K Sh20 per minute for intra-network and across network calls, respectively.
79 The M-PESA service was originally created as a p i lo t funded jo in t ly by Vodafone and the UK Department for International Development [DFID] Financial Deepening Challenge Fund. The p i lo t ran for over 6 months in Kenya f rom October 2005 in partnership with Faulu Kenya, a local Microfinance Institution.
This i s unique to the region. I t i s quite l ikely that abolishing the excise tax would not only remove a distortion but also potentially raise revenues f rom greater mobile penetration. See TMG (2007).
“Cheap handsets are already available in Chinese and South Asian markets. Bringing down the cost o f mobile and extending coverage also reduces the need for universal service obligations.
54

4.28 The Internet market has many players,82 but accessing international Internet bandwidth i s v ia expensive satellite technology rather than a fiber optic cable. The cost differential between undersea fiber optic cable and satellite i s considerable, resulting in high prices.83 Even for dial-up services the cost o f the monthly basket in Kenya i s $81, compared to only US$30 in Sudan and US$15 in Ethiopia (Table 4-4). At least ten African countries now offer broadband below US$15 per 100 kbit/s per month-which i s something for Kenya to aspire to.84 The lack o f affordable international backbone bandwidth i s probably the biggest obstacle to the development o f the I C T industry and a major constraint to improving productivity across the economy. Several initiatives are underway to connect to the under-sea global fiber optic cable. The T E A M S initiative i s wel l advanced with a contract signed in 2007 with Alcatel-Lucent to manufacture the cable to connect Mombasa with Fujairah, U.A.E. by end 2009. EASSy (which i s a regional consortium with IFC backing) i s an alternative to connect the east coast o f Afr ica to the fiber optic cable also with a 2009 target implementation date.
4.29 The limited fixed line network constrains access to alternative A D S L Internet provision. The limited number o f main lines, shortage o f international connectivity, and inadequate inter- modal competition affects broadband development.
4.30 Universal service in Kenya i s defined as the provision o f communication services to rural and other high costs areas. During the monopoly era, this was the responsibility o f Kenya Posts and Telecommunications, which installed public payphones in various parts o f the country. Relative to counties with comparable income, Kenya has fewer fixed lines per capita. Kenya’s fixed l ine tele-density i s 0.84 percent; that is, Kenya has less than one fixed l ine telephone per one hundred inhabitants. TKL had a waiting l i s t for f ixed line phones o f 85,177 customers in 2005, which has reportedly declined significantly since the wider use o f mobile telephones.
4.3 1 In the liberalized market, mobile operators are called upon to provide coverage. With the growth in the mobile industry, the fixed telephone line density has fallen since it reached the 1:100,000 mark in 2002 to 0.9:100,000 in 2006. T h i s i s far below the Sub-Saharan African average o f 1.7, and even Sudan’s average o f 1.91 per 100,000. If cellular subscribers are included, Kenya’s tele-density increases to 19.6 percent by 2006, which i s about 1.5 times the Sub-Saharan African average. These data indicate that the vast majority o f Kenyans who receive telephone service obtain that service through mobile telephones. In practice, mobile operators exceeded the rollout obligations stipulated in their license agreements, and have been providing community payphones. However, estimates are that there i s mobile telephone coverage for only about 60 percent o f the country.
4.32 The government expects the private sector to play a key role in meeting universal service targets. In addition, i t i s establishing a Universal Service Fund to subsidize the cost o f infrastructure to unserved areas. The Fund i s to be financed by the operators, but the contribution o f operators awaits enactment o f the Information and Communications Technology (ICT) law.
There i s a reasonable degree o f competition for service provision. There are some 39 Internet Service Providers (ISPs) in operation (although they are not al l operating in al l districts-most operate in only 8 out o f 47); 8 International Backbone Gateway Operators; and 2 VSAT operators.
The cost o f international broadband capacity i s in the range o f US$7000 per month for 1 M b i t / s duplex, compared to about US$700 in India or the Philippines. A leased circuit between Africa and Europe i s estimated to cost US$130,000 per month for satellite, compared to US$25,000 for a submarine cable.
84 As o f August 2006, those ten countries were Botswana, Cote d’Ivoire, Egypt, Madagascar, Mauritius, Morocco, Senegal, Sierra Leone, South Africa, and Tunisia (World Economic Forum 2007).
82
83
55
The ICT-enabled Services (ICTES) Industry
4.33 W h i l e there are some f i rst movers into the call center market in Kenya, the sector i s s t i l l relatively Reliable, affordable, high-speed Internet access i s essential for the development o f the business processing outsourcing (BPO) and other ICTES industry. I t i s therefore essential that one o f the four possible projects to connect Kenya to the rest o f the wor ld with a submarine fiber optic cable be implemented as soon as possible. In the meantime, a Wor ld Bank project will provide subsidies to BPO operators to bring costs down to where they can be expected to be once the cable i s in place.86
4.34 The lack o f international backbone i s not the only obstacle to the ICT industry development. The expensive and unreliable or unavailable electricity i s a major barrier. General business climate concerns such as security and corruption also need to be tackled. There i s also considerable scope for deregulation to improve the I C T business climate. There are 50 types o f service categories and associated licenses. A company must f irst identify the type o f license that i t needs to operate and potentially apply for a l l those that might apply-all o f which are subject to numerous application fees and annual regulatory fee requirements. Whi le the Communication Commission o f Kenya (CCK) has plans to simplify the regime, i t has not yet adopted them.
4.35 Another barrier to entry i s the foreign ownership restrictions, which provide an additional disincentive to foreign investment. The Government o f Kenya currently requires that telephone companies must be at least 30 percent owned by Kenyan nationals. The 30 percent ownership requirement i s delaying licensing o f additional telecom operators. In this context, the plan o f the government to allow the SNO to operate for at least one year without meeting the 30 percent local ownership requirement i s a useful first step. If a viable Kenyan partner cannot be found, however, the government would be wise to consider abolishing the 30 percent local equity requirement.
4.36 There may be some benefits f rom tying proposed reforms in the telecom sector to Wor ld Trade Organization (WTO) commitments in ICT. This will give some pol icy credibility, which i s badly needed given the number o f currently stalled initiatives to improve competition, reduce the public sector ownership, and deregulate the industry. African countries that have made commitments had higher growth in sector revenues than countries that have not, Bressie, Kende, and Williams (2005) found.
4.37 With a v iew to strengthening the development o f i t s I C T sector, Kenya should also j o in the optional WTO Information Technology Agreement (ITA). T h i s would bind Kenya to eliminate customs duties on major information technology products (Box 4-3). Joining would thus reduce the cost o f I C T inputs, and encourage new investment in Kenya and broaden access to IT inputs to include smaller businesses. Given that imports o f many IT products are already subject to exemptions, the impact on revenues i s unlikely to be significant. Moreover, jo in ing the ITA would allow the exemption scheme to be dismantled, and thus save o n administrative costs.
Information Week estimates i t at US$5 million, with 3,000 employees. See www.informationweek.com
86 World Bank (2007i). In addition to government and higher education institutions, the World Bank Regional Communications Infrastructure Program (RCIP) has US$8 million to provide targeted subsidies to the BPO industry to bring international broadband costs down where they might be expected to be in the longer run (approximately US$l ,OOO Mbi t /s per month). The subsidy wil l be consistent with World Trade Organization obligations and will be transitional and nondiscriminatory, based on a fixed amount and a fixed time-period.
56

Box 4-3: The WTO Information Technology Agreement
The Information Technology Agreement (ITA) i s a tariff-cutting mechanism with three basic principles. All products l isted in the Declaration must be covered. All must b e reduced to a zero-tariff level. All other duties and charges must be bound at zero. There are no exceptions to product coverage. However, for sensitive items, i t i s possible to have an extended implementation period. Commitments undertaken under the ITA are o n a Mos t Favored Nat ion (MFN) basis, and therefore market access i s extended equally to a l l WTO members. The agreement covers the ma in categories o f IT products: computers, telecommunications equipment, semiconductors, semiconductor manufacturing equipment, software, and scientific instruments. ITA has 63 members, among them such developing countries as China, Egypt, El Salvador, India, Mauritius, Moldova, and Morocco. There are n o least developed country (LDC) members.
Source: World Bank (2007a).
Summary of Recommendations for Telecommunications
Issue a SNO license. Issue a third mobile license. Streamline licensing, as per C C K plans. Get fiber optic international Internet access. Remove the 10 percent excise duty on airtime. Remove the foreign ownership requirement. Consider jo in ing the optional WTO ITA.
57

5. FISCAL POLICY FOR GROWTH 5.1 Chapter 2 argued that Kenya’s fiscal policy has a major role to play in pursuit o f growth. The policy challenge before the Kenyan authorities i s how to scale up spending rapidly in order to maintain and rehabilitate infrastructure while maintaining macroeconomic stability. The challenge needs to be seen in conjunction with the competing demand for social spending, which has been increasing at a fast pace following the government’s adoption o f free primary education in 2003 and various health goals. In other words, the goal o f fiscal policy in the medium term would be to create fiscal space for infrastructure and social spending (to accelerate attainment o f the Mi l lennium Development Goals) without compromising the solvency o f public finances.
5.2 The discussion that follows argues that (limited) fiscal space for infrastructure spending exists, given the solid revenue mobilization, good debt dynamics, and identified projects with high economic returns. At the same time, the government will need to squeeze more value out o f i t s current level o f social and infrastructure expenditure and curtail general administrative expenditure. This chapter covers the education, health, and roads sectors f rom the point o f v iew o f stretching the shilling. T h e coverage o f public expenditure policy in these sectors i s selective rather than comprehensive, focusing only on areas where there i s scope for improving efficiency.
REVENUE MOBILIZATION
5.3 The quality o f a nation’s fiscal stance and i t s conduciveness to long-run growth and poverty alleviation depend upon the efficiency and adequacy o f revenue mobilization and expenditure composition. In spite o f the decline in revenues since the mid-l990s, the revenue-to- GDP ratio at around 21 percent i s high in Kenya compared to other countries o f a similar income level. Kenya-which collects about 7 percentage points o f GDP more in revenue than i t s East Afr ican Community partner Uganda, and about 4 percentage points more than Tanzania-is a positive outlier among developing countries.
5.4 The structure o f revenue in Kenya i s conducive to growth. An important consideration in tax pol icy i s that the taxes should minimize relative price distortions and should be predictable. In this regard, Kenya has undertaken several impressive reforms in tax policy since the mid- 1990s. These include reduction in import tariffs, reductions in income taxes, reduction in value added tax (VAT) rates, and extension o f VAT coverage. Figure 5-1 plots four important revenue components over the 1995/9&2006/07 period: import and excise duties, income tax, and VAT as a percentage o f GDP. The figure illustrates the point that revenue init ially fe l l as tax rates were cut, but has picked up after 2002 because o f stronger tax administration. The steady decline in import duty collection i s due to trade liberalization policy. Income tax displays a U-shaped pattern, falling in the late 1990s, but then, unlike import duty, recovering after 2003. T h i s i s encouraging to the extent that it captures lower tax rates combined with a broadening o f the tax base and improving compliance, which i s the case in Kenya. Cutting income tax rates would have increased the incentives for investment by raising private returns to capital. In combination with the increased competition f rom imports, this would have spurred both new investment and higher productivity in firms, improving growth prospects. The same factors are l ikely to increase private sector confidence. VAT was introduced in 1990; the number o f rates has been reduced from 15 (with the highest rate once 210 percent) to a unified rate o f 16 percent (except for some zero-rated products), with obvious advantages o f reducing misclassification and tax evasion and easing
58

administration. Excise duties have been largely replaced by the VAT, except o n o i l imports and other specific products.
Figure 5-1: Revenue Mobilization (YO of GDP)
a 6.5 e 5.5
c 4.5 0 $ 3.5
2.5
1.5
year l - incometax - - VAT - exciseduty - .-. - Importduty I
Source: Data from Kenyan authorities, IMF Staff Reports, and World Bank.
5.5 Several impressive reforms have also taken place in tax administration. These include setting up a large taxpayers unit and other reforms in the Kenya Revenue Authority (a) as part o f a revenue administration reform and modernization program. However, these reforms are not yet complete.
5.6 An important conclusion from the discussion above i s that Kenya has managed a successful transition f rom a high tax rate, l o w tax base system with considerable reliance on import taxes and seigniorage (Box 5-1) to a more efficient and equitable revenue system based on broad-based taxes l ike income tax and VAT. This accomplishment i s considered diff icult to achieve. Countries marked by polit ical instability, social division, and weak governance-which i s the stereotypical image o f Kenya-are more l ikely to rely on seigniorage and import tariffs: taxes that are relatively easy to collect but highly distortionary.
5.7 The above accomplishment, however, must be seen against the background that businesses perceive tax administration to be burdensome and tax rates to be high. As discussed in Chapter 3, further analytical work i s needed to see i f at the margin tax rates are a deterrent to investment and if average tax burden i s excessive. Pending such work, any increase in tax rates with an objective to finance increased spending on infrastructure should be cautiously considered. At the same time, there may be limited scope for further increase in revenues by expanding the tax base and improving revenue administration. Another approach to counter the negative perception o f businesses about taxation would be to ensure higher efficiency in government spending. Businesses are less l ikely to resent taxation when they can see the benefit o f taxes accruing in the form o f efficient public services.
59

Box 5-1: Reliance on Seigniorage as a Source of Revenue
Figure 5-2 plots both the growth rate o f reserve (base) money and the change in reserve money divided by GDP (an indicator o f seigniorage). Both the level and volatility o f these indicators have declined sharply after 1999. This in turn could have contributed to lower macroeconomic uncertainty and inflation, lowering interest rates. In this context, the rise in the growth rate o f reserve money in 2006 and 2007 needs to be viewed with some concern, particularly in view o f double-digit headline inflation rates in these years.
Figure 5-2: Growth and Change in Reserve Money, Kenya, 1981-2006
5.0
change m 4.0 resyve money
growth m 60
50
40 A
lo 1 0
year
Source: Data from the Central Bank o f Kenya.
EXPENDITURE POLICY
5.8 The major complaint voiced by the private sector pertains to the quantity and quality o f infrastructure. Roads in particular are singled out. The fuel levy has not translated into better roads. This brings us to the Achilles’ heel o f the Kenyan public finances: the expenditure policy. Figure 5-3 plots total primary expenditure and two o f i t s key components: development expenditure and recurrent expenditure in the past ten years. The development expenditure consists largely o f capital expenditure, and most o f it i s on public infrastructure. During the fiscal consolidation o f the 1990s’ the development expenditure was sharply cut f rom a high o f 6.4 percent o f GDP in 1994/95 to 1.9 percent in 1999/2000. The sharp cuts were accompanied by deterioration in the quality o f public investment portfolio. A number o f construction projects with questionable economic rationale were taken up (Eldoret airport was a prime example) and a large stock o f incomplete projects accumulated.*’ Maintenance also suffered severely and networks (roads and electricity) deteriorated. One estimate for roads puts the current backlog maintenance
World Bank and Government o f Kenya (1997).
60

cost alone at approximately K Sh 150 billion; periodic and routine maintenance would require an additional 15 bi l l ion K Sh per year (about 0.7 percent o f GDP)?
25
p3 20 n
s 15
10
5
c 0
Figure 5-3: Primary Expenditure and Components
prirrary expenditure excluding drought
.----..-.._ - * - - . _.._..-.- - * - - * -
/ . . C ' , fi , # - - - - - - . .-. . _. . -. . - - - recurrent excluding
development drought excluding net lending
-drought
year
Source: Based on information provided by Kenyan authorities.
Fiscal Space for High-return Projects
5.9 Kenya does not appear to have a debt sustainability problem, and therefore has more latitude in generating fiscal space for infrastructure spending. I t s debt dynamics have been especially favorable since 2003, as discussed. With Kenya's indebtedness o n a steady decline over the past 10 years, the key question that policymakers need to ask i s whether this trend should be preserved or whether an alternative goal may be socially more desirable, such as either keeping the government debt-to-GDP ratio constant or even letting it rise in the short run while alleviating the infrastructure constraint.
5.10 A debt-sustainability analysis carried out jo int ly by the Wor ld Bank and IMF in 2007 (IMF 2007) analyzed the impact o f higher nonconcessional borrowing equivalent to 1 percent o f GDP per year during the 2006-10 period to help finance additional public spending o n i n f r a ~ t r u c t u r e . ~ ~ The analysis pointed to considerable r isks to public debt sustainability f rom higher nonconcessional borrowing if interest rates go up and there i s n o growth impact. Further analysis carried out for this report showed that r isks are considerably mitigated if the borrowing results in improved growth performance. The policy lesson from the analysis i s that largely untapped concessional resources should preferably be used effectively to meet infrastructure needs and any attempt to exploit the l imited scope for additional borrowing for infrastructure needs should be explicitly l inked to projects with unquestionably high rates o f return.
Government o f Kenya (2006). 88
89 The scenario also assumes that these amounts are raised domestically and result in an increase in domestic interest rates o f 200 basis points throughout the projection period. During the projection period, the average real interest rate o f domestic debt o f 7.6 percent would s t i l l be substantially be low the historical average of 10.2 percent. The analysis i s carried out for additional commercial domestic borrowing, but equally applies to increasing nonconcessional external borrowing. Alternatively, it illustrates the r isk to public debt sustainability when contingent liabilities result in additional non-concessional debt. This scenario fiu-ther assumes that o n balance additional borrowing has no effect on real GDP growth.
61

5.1 1 Institutional mechanisms for selecting high-return projects, however, are weak. Currently there does not appear to be a systematic process for identifying capital projects based on economic analysis. The Ministry o f Finance (MoF) delegates expenditure prioritization within an overall ceiling to l ine ministries (including the Roads Board for maintenance o f roads), but line ministries look back to the M o F for the final decision as to which projects are budgeted. There i s ambiguity about the respective roles o f the M o F and line ministries o n individual project selection. There i s a need to put in place an institutional mechanism (which could play the role played by the Public Investment Program earlier) for developing a pipeline o f high-return projects. The M o F should also issue standard project identification and appraisal guidelines, supplemented with sector-specific guidelines for demand and benefit measurement.
CREATING FISCAL SPACE BY IMPROVING THE QUALITY OF EXPENDITURE
5.12 “Fiscal space” can also be “created” by more efficient public spending. Kenyan policymakers have long been sensitive to the need to improve value for money. The current government has focused attention on results, which aims to improve outputs for the given level o f inputs. The prime candidate sectors for attention to efficiency are education, health, and roads. These sectors together accounted for more than hal f o f total government expenditure in 2006/7. These sectors are also l ikely to be the source o f fiscal pressures in the medium term, given the projected trajectories o f their expenditure. The discussion that follows examines the scope for improving the quality o f public expenditure in these sectors.
Education
5.13 The overall education budget o f the government was 6.6 percent o f GDP in 2005/6 and i s above most Sub-Saharan African countries. In per capita terms, government’s basic education spending has been growing and was K Sh 4,750 per chi ld (aged 6 to 17) in 2005/6. The fiscal challenge in education i s to finance the ongoing expansion o f school education o n a sustainable basis and maintain or improve quality o f education outcomes (Table 5-1).
Table 5-1 : Education Expenditure, 2002103-2009110
20021 20031 20041 20051 20061 20071 20081 20091 3 4 5 6 7 8 9 10
K Sh billions Actual Estimates Projections
Total public sector Government expenditure 63.0 72.0 80.1 92.7 103.4 115.8 118.5 129.6
Recurrent 60.9 68.2 77.2 86.3 94.8 106.4 110.9 120.8 Development 2.6 4.1 2.9 6.5 8.6 9.4 7.6 8.8
External assistance K Sh thousands
Percent of GDP Government spend per childa 2.96 4.17 4.44 4.75 -- -- -- --
Government expenditure 6.2 6.4 6.2 6.6 Source: Appropriation Accounts published by Kenya National Audit Office, Ministerial Public Expenditure Review, various issues, concerned ministries. a. Government’s basic education spending (development and recurrent including salaries) per population aged 6 to 17.
62

5.14 I t i s l ikely that within the projected resource envelope, improvements in efficiency can yield significant improvements in outcomes.90 The work by Herrera and Pang (2005) shows that Kenya lies wel l below the education efficiency frontier, although above average for the Sub- Saharan African region. Therefore, both input and output efficiency gains are possible. That is, fewer resources are required to produce the same education results. Moreover, with the same resources, other countries-even in Sub-Saharan Africa-have higher education outcomes. Kenya’s efficiency scores, and how they compare with the best and worst performers in the world, are shown in Table 5-2. Some areas to target for efficiency improvements are discussed below.
Table 5-2: Kenya’s Scores on Measures of Efficiency in Education Sector
Most efficient Least efficient Africa Kenya examples examples region
Indonesia Chile Ma l i Zimbabwe P r i m a y school enrollment (net) Input efficiency 0.913 0.842 0.679 0.549 0. 68 0.63 1 Output efficiency 0.966 0.866 0.382 0.741 0. 64 0.643 Seconda y school enrollment (net) Input efficiency 0.795 0.733 0.679 0.478 0. 64 0.63 1 Output efficiency 0.593 0.813 0.128 0.344 0. 26 0.296 Learning scores Input efficiency 0.826 1 .ooo 0.29 1 0.122 _ _ 0.232 Output efficiency 0.814 1 .ooo 0.430 0.61 1 -- 0.644
Source: Herrera and Pang (2005). Note: Efficiency measures for free-disposable hull analysis o f efficiency excluding developed countries.
5.15 Improving Teacher Utilization. Teacher salaries are about 80 percent o f the education budget. T o accommodate the ongoing expansion in school education, there i s significant scope for improving teacher utilization through various approaches:
The national average pupil-teacher ratio (PTR) at the primary level i s about 41. This could go up to 43 by 2010, accompanied by the rebalancing o f teachers using a differentiated staffing norm o f a PTR o f 45: 1 in high potential areas and 1:25 in Arid and Semi-Arid Land ( A S K ) areas, as wel l as the introduction o f multi-grade and multi-shift teaching where appropriate.
PTRs are positively correlated with school size. Hence, dealing with small schools wi l l also raise efficiency. Establishing limits on the size o f school and size o f class for operations will encourage merger and multi-grade teaching where necessary and improve the efficiency o f teacher use.
There i s considerable scope to increase the amount o f time teachers actually spend teaching, which i s currently relatively low. I t could be done, first, by reducing their administrative load, which could instead be carried by administrative staff; second, by raising the norm for teaching hours per week to a minimum level; and third, by
90 The focus here i s o n technical efficiency improvements in primary and secondary education, rather than on allocative efficiency improvements. Government strategies for tertiary, industrial, and vocational education and training (TIVET) and higher education are not yet finalized, which l i m i t s the potential t o assess the scope or desirability for shifting public resources across subsectors. Furthermore, no work has been done o n the social and private returns to investment in education by level in Kenya.
63

having the duties o f teachers who are absent on a part-time basis taken over by colleagues working additional hours.
Employing short-term and contracthemporary teachers can also help to relieve teacher shortages and improve learning outcomes.g1
Addressing teacher absenteeism could significantly improve value-for-money. Evidence from 2004 in two districts in Western province indicated absenteeism to be a significant p r ~ b l e m . ’ ~ Further analysis i s needed to determine the extent and causes o f the absenteeism problem in the country as a whole.
At secondary education level, raising recommended teaching load for courses with high demand, retraining under-utilized teachers, sharing teachers across schools as appropriate, and making full use o f contract and especially part-time teachers as appropriate would help improve efficiency.
5.16 Lowering Unit Costs. Making use o f mobile schools in the sparsely populated and nomadic parts o f the country would lower unit costs and arguably be more effective at keeping children in school. The establishment o f boarding primary schools in areas with l o w enrollment has not been a huge success since many remain underutilized and under-enrolled. T o enable an equitable expansion o f the secondary system and to save costs, more emphasis should be placed on day schools, as opposed to boarding schools. Table 5-3 shows unit costs in Kenya by level o f education.
Table 5-3: Unit Costs, Education by Level, 2002-05 (US$)
2002 2003 2004 2005 estimate Primary 69 71 83 88 Secondary Technical
330 286 287 286 292 261 305 363
University 1,309 1,405 1,508 2,070 Source: Staff estimates.
5.17 Reducing Repetition. Reducing repetition would save resources. The overall repetition rate in 2006 was estimated at 6.1 percent, at a cost o f about US$ 6.8 milli~n.’~ The effectiveness o f repeating a year as a way to improve education outcomes i s questionable.
5.18 Improving Accountability for Household Expenditure. Surveys indicate that households pay on average US$450 per year for each pupil in public secondary school (about 60 percent o f the total cost). The figure is much higher than statutory fees, which are about US$71, US$142, and US$2 13 for day, provincial, and national schools, respectively. Ensuring that out-of-pocket expenditures that go directly to school management are properly and transparently accounted for will improve the incentives for schools to use public resources effectively and improve accountability to parents for use o f those resources.
Duflo, Dupas, and Kremer (2007). 91
92 Glewwe and others (1999) found that teachers in one area o f Kenya were absent f rom school 28.4 percent o f the time and in school but absent f rom the class a fiuther 12.4 percent o f the time. Further work by Glewwe, Ilias, and Kremer (2004) used evidence f rom two districts in Kenya.
93 See the background paper, “Efficiency o f Government Education Expenditures in Kenya, 2007.”
64

5.19 Helping the Nonformal Sector. Nonformal schools can provide a cost-effective alternative to expand service provision, especially in hard-to-reach areas. Registered nonformal schools that have adopted the 8-4-4 education system are eligible for textbook grants f rom the Ministry o f Education. Bringing more o f them on board would certainly help the poor access education-ven outside the formal system. The quality o f the education in nonformal schools needs further examination. These schools typically employ teachers outside o f the Teachers Service Commission “quality control” mechanism and their physical buildings are often in need o f significant renovation. The Ministry o f Education (MoE) should also examine ways in which it can help improve the quality o f the facilities at these school sites by offering matching capital grants, for example, as wel l as by monitoring exam performance in order to assess good (and bad) performance in nonformal schools. Publicizing the exam results o f nonformal schools will also help parents make informed decisions when choosing a nonformal education establishment.
5 -20 Eficiency Improvements at the Primary Education Level. Regular provision o f learning materials in the classroom can lead to a reduction in repetition and dropout rates. This i s the finding o f an analysis o f internal efficiency gains in the context o f the Free Primary Education Support Project (FPESP).94 The repetition rate in the highest poverty band (more than 70 percent o f children from poor families) fell f rom 9.2 percent in academic year 2002 to 7.7 percent in 2005. The overall primary school dropout rate was reduced from 2 percent in 2003 to 1.5 percent in 2006. The primary completion rate improved from an estimated 68.2 percent to 77.6 percent in 2006.
5.21 Other Ongoing Eforts to Improve Eficiency in the Education Sector. A number o f promising measures are underway. The government’s commitment to introducing efficiency measures i s evident in the “audits for value,” which are undertaken in the education sector o n a fiscal year basis, and on the public expenditure tracking surveys (PETS), which are expected to feature as a biennial exercise. Furthermore, f rom a technical perspective, the employment o f teachers on a contract basis i s being actively piloted in various parts o f the country. In the context o f the Kenya Education Sector Support Program (KESSP), M o E has committed to adopting the recommendations o f the Teaching Norms Study completed in 2005, encouraging nonformal education, and addressing other supply-side constraints to access for al l school-age children. T h e government has developed the Secondary Education Strategy in anticipation o f the increase in primary school graduate^.^' Government strategies for Technical, Vocational and Educations Training (TIVET) and higher education are also being developed. In the context o f operationalizing the strategies, the Ministries o f Education, and Science and Technology are focusing o n introducing efficiency measures within the TIVET and higher education subsectors. There i s also potential to assess potential allocative efficiency measures and the scope and desirability o f shifting public resources across subsectors. Analytical work by the Wor ld Bank and the Ministry o f Education i s envisaged in the near future for calculating the social and private returns to investment in education, by levels o f education, in Kenya.
Health
5.22 The key challenge in the health sector i s to reverse a decline in health indicators. T h i s has been recognized by the government and i s the main objective o f the National Health Sector Strategic Plan 11, 2005-10 (NHSSP, G o K 2005b). Although s t i l l lower than many Sub-Saharan
94 FPESP Implementation Completion Report, World Bank.
Secondary Education, Ministry o f Education, Science and Technology, GoK. See also the recommendations o f the recently concluded study o f the Task Force on Affordable 95
65
African countries, infant and childhood mortality rates increased between 1993 and 2003, with malaria constituting the main cause o f deaths. The government has adopted a number o f new measures to bring malaria under control. These include the adoption in 2006 o f a new drug (coartem) for malaria treatment, national insecticide-treated bednet programs, and intensified vector control. These measures have brought about a substantial decline (of up to 44 percent) in chi ld mortality due to malaria in high-prevalence districts. HIV prevalence has also improved, with rates estimated at 5.1 percent o f the adult population in 2006, down f rom over 10 percent in the 1990s. However, the prevalence o f H N / A I D S has led to an upsurge in tuberculosis (TB). There are at least 1.2 m i l l i o n Kenyans now living with HIV/AIDS and tuberculosis, and the country’s estimated TB incidence rate o f 620 per 100,000 i s one o f the highest rates in the world.
5.23 The indicators o f health service delivery show mixed results. The proportion o f women o f reproductive age receiving family planning commodities has risen from 10 percent in 2004/5 to 43 percent in 2006/7. The proportion of HIV-positive pregnant women receiving prevention o f mother-to-child transmission treatment has increased from 10 percent to 29 percent over the same period. Immunization coverage improved from 59 percent in 2003 to 71 percent by 2006/7, but then fell to just 5 1 percent in the f irst five weeks o f 2008 due to the post-election crisis.
5.24 Nevertheless, access to health and medical care services i s unequal across the country. The inequalities reflect health systems weaknesses and inefficiencies that have led to leakages and wastage, shortage and unequal distribution o f personnel, poor f low and l o w utilization o f funds at lower facilities, and reliance on input-based rather than output-based financing and resource allocation. Regional disparities imply that the need to improve access to health services i s most acute in the Coast, Nyanza, Western, and North Eastern provinces.
5.25 Encouragingly, recent fiscal trends show an increase in government spending on health. Table 5-4 shows that between 2002 and 2005, recurrent government expenditure o n health increased by 37 percent. Total government health expenditure i s projected to increase by a hr ther 50 percent between 2006/07 and 2009/10. That said, i t i s important to note that actual government expenditures often fall short o f budgeted projections, particularly in the case o f development expenditures, and that comparisons o f estimated and actual spending figures can be very misleading. For example, actual health expenditures in 2005/06 were 23 percent (K Sh7 billion) below the voted budget o f K Sh 30.4 bil l ion. Execution o f external aid-financed health projects i s particularly problematic, and implies the need to be cautious in using future projections o f external assistance. Total per capita health spending (including external assistance) i s estimated to be approximately US$24 (WDI estimates total per capita health spending for 2004/05 to be around US$24, as do total public spending estimates for 2006/7). This i s some US$7 per capita short o f the WHO recommendation o f US$34 per capita, but i s slightly above both the United Nations Development Programme (UNDP) estimates o f spending per capita to achieve the health Mi l lennium Development Goals (MDGs) (US$23) and the government’s estimate for an essential health care package (US$22).96
96 Private health expenditures are estimated to b e an additional 2 percent o f GDP. According to the 2002 National Health Accounts, private health expenditures were 54 percent o f total health spending.
66
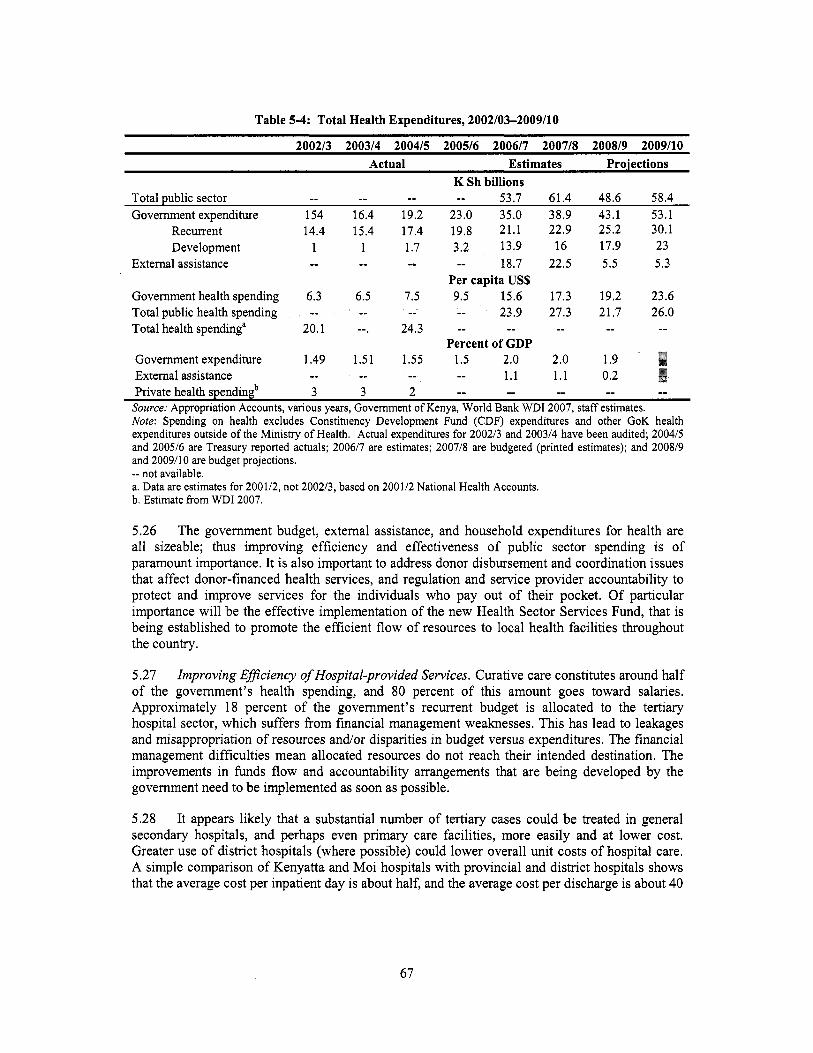
Table 5-4: Total Health Expenditures, 2002103-2009110
200213 200314 200415 200516 200617 200718 200819 2009110
K Sh billions Actual Estimates Projections
Total public sector -- -- _ _ _ _ 53.7 61.4 48.6 58.4 Government expenditure 154 16.4 19.2 23.0 35.0 38.9 43.1 53.1
Recurrent 14.4 15.4 17.4 19.8 21.1 22.9 25.2 30.1 Development 1 1 1.7 3.2 13.9 16 17.9 23
External assistance _ _ _ _ -- -- 18.7 22.5 5.5 5.3
Government health spending 6.3 6.5 7.5 9.5 15.6 17.3 19.2 23.6 Total public health spending -- -- -- -- 23.9 27.3 21.7 26.0 Total health spendinga 20.1 -- . 24.3
Government expenditure 1.49 1.51 1.55 1.5 2.0 2.0 1.9 External assistance -- -- -- -- 1.1 1.1 0.2
Source: Appropriation Accounts, various years, Government o f Kenya, World Bank WDI 2007, staff estimates. Note: Spending on health excludes Constituency Development Fund (CDF) expenditures and other GoK health expenditures outside of the Ministry of Health. Actual expenditures for 200213 and 2003/4 have been audited; 2004/5 and 200516 are Treasury reported actuals; 2006/7 are estimates; 2007/8 are budgeted (printed estimates); and 2008/9 and 2009/10 are budget projections. -- not available. a. Data are estimates for 200112, not 2002/3, based on 2001/2 National Health Accounts. b. Estimate from WDI 2007.
Per capita US$
_- -- -- _ _ -- Percent of GDP
__ -- __ __ -- Private health spendingb 3 3 2
5 -26 The government budget, external assistance, and household expenditures for health are al l sizeable; thus improving efficiency and effectiveness o f public sector spending i s o f paramount importance. I t i s also important to address donor disbursement and coordination issues that affect donor-financed health services, and regulation and service provider accountability to protect and improve services for the individuals who pay out o f their pocket. Of particular importance will be the effective implementation o f the new Health Sector Services Fund, that i s being established to promote the efficient f low o f resources to local health facilities throughout the country.
5 -27 Improving Eficiency of Hospital-provided Services. Curative care constitutes around hal f o f the government’s health spending, and 80 percent o f this amount goes toward salaries. Approximately 18 percent o f the government’s recurrent budget i s allocated to the tertiary hospital sector, which suffers f rom financial management weaknesses. T h i s has lead to leakages and misappropriation o f resources and/or disparities in budget versus expenditures. The financial management difficulties mean allocated resources do not reach their intended destination. The improvements in funds f low and accountability arrangements that are being developed by the government need to be implemented as soon as possible.
5.28 It appears l ikely that a substantial number o f tertiary cases could be treated in general secondary hospitals, and perhaps even primary care facilities, more easily and at lower cost. Greater use o f district hospitals (where possible) could lower overall unit costs o f hospital care. A simple comparison o f Kenyatta and M o i hospitals with provincial and district hospitals shows that the average cost per inpatient day i s about half, and the average cost per discharge i s about 40
67

percent, o f that o f the Kenyatta and M o i hospitals.97 However, such a change in patterns o f use i s unlikely to take place without careful planning by stakeholders to improve access and quality o f care at lower levels-and hence shift incentives for users-and rebalancing staff to these lower- level institutions.
5.29 As in the case o f teachers, there i s scope to rebalance staff to address shortages and improve productivity. Unl ike other countries in the region, Kenya has a pool o f health sector workers who would be available for employment. A recent “Emergency Recruitment” o f s ta f f funded through the U.S. Agency for International Development (USAID) showed that o f the total o f 6,566 people who applied for 677 positions, about a third were considered qualified but were not currently employed. Public sector health staff, recruitment, and retention policies and incentives also need to be examined to address staffing shortages where they are most critical. A human resources survey found some under- utilization o f existing staff and the possibility o f relocating up to 110 doctors and 2,300 nurses f rom district and provincial hospitals to health centers and dispensaries.
Improved Use of Medical Personnel.
5.30 Access to Specific Health Interventions. Under the auspices o f NHSSP, backed by financing by development partners, there has been progress in improving health interventions. There i s s t i l l considerable scope to scale up interventions-such as immunization, antenatal care visits, anti-retroviral (ARV), and malaria prevention-to prevent and control infectious disease and so limit the demands on the health system further down the line.
5.3 1 Improving Eflciency in Drug and Non-pharmaceutical Use. Drugs and medical supplies are around 15 percent o f government’s recurrent expenditures, amounting to K Sh 3.2 b i l l ion in 2007/8, and 54 percent o f the development budget, a further K Sh 7 bil l ion. In addition, in-kind supplies are often provided as contributions f rom the donor community for specific service delivery programs such as malaria, immunizations, and HIV/AIDS, as wel l as for reproductive health commodities. If the unpredictability and r i sks o f relying on external funds and contributions can be minimized, this could provide the Ministry additional spending flexibility. Improved harmonization o f commodities procurement i s a cornerstone o f current jo int initiatives between the Ministry o f Health (MoH) and i t s development partners.
5.32 Decentralization. The concentration o f authority over resources at the national level curtails the flexibil i ty o f the districts in planning for, and use of, the allocated resources. A 2004 Public Expenditure Tracking Survey (PETS) found that health facilities such as dispensaries and health centers do not take part in the procurement processes, which resulted in poor quality and unnecessary drugs being procured and supplied. Inflexible rules governing the use o f funds resulted in slow budget execution. Thus the centralized budget and cash management limits flexibil i ty and tends to undermine the districts’ ability to utilize their budgets fully, culminating in reduced services. Cognizant o f these problems, the M o H has initiated various measures to increase the autonomy o f lower level facilities, including “pull” rather than “push” systems o f drug and medical supply distribution and the use o f Health Facility Funds to allow facilities to make decisions over their own needs for operations and maintenance. Of course, adequate training and preparation o f s ta f f at the lower levels i s essential to ensure a smooth rollout o f promising pi lot projects throughout Kenya, and these initiatives are currently being pursued.
5.33 The sector has also suffered from serious governance problems, but steps are being taken to address them. Since 2004, a series o f reviews and special audits have identified a range o f
’’ More detailed cost calculations are being undertaken by the Min is t ry o f Health, which should shed more light o n the potential efficiency gains.
68

problems in the sector, including weaknesses in financial management, lack o f fraud risk management, limited oversight, and inadequate procurement procedures and practices. Lack of transparency and accountability has also been found to obstruct service delivery. For example, the 2004 PETS found leakage in the supply chain o f drugs and vaccines, and Transparency International found a rising case o f leakages o f antiretroviral drugs. However, there are already signs o f improved management in the health sector with some good results. Performance-based contracts are now in place for the sector leadership at the national and provincial levels. Social accountability by public facilities i s being enhanced with the establishment o f a Citizen’s Charter, District Health Management Boards and Facil ity Management Committees, which provide oversight by c iv i l society in the management o f public facilities. These initiatives appear to be having some impact. For example, the results o f the 2007 Client Satisfaction Survey showed that, o f patients who indicated that i t was not their f i rs t time to visit the sampled facility, 89 percent reported improvements.
5.34 Donor Disbursement Issues. A study conducted in 2004 reported that a significant proportion o f donor resources were not used because o f centralized channels o f control. Many donors bypass the M o H and Treasury systems and provide funding off-budget as a way o f fast- tracking project implementation and achieving faster results. One downside i s that this can weaken the public system by making it more diff icult for the government to plan and program resources i t has control over to health priorities not benefiting f rom off-budget assistance. Donor harmonization efforts are seeking to minimize the adverse impacts o f off-budget financing.
5.35 Development Vote Expenditure Issues. There i s a need to examine closely the reasons for the l o w level o f development budget execution. A recent review o f health expenditures revealed that there are particular issues in the “Preventive and Promotive Health” sub-vote (where execution was as l o w as 24 percent), which had received almost ha l f the approved development budget. Raising the execution rates o f development budget back to the 2001/2 level o f 67 percent would make available an additional K Sh 3.4 bi l l ion into the publicly financed health system.
Roads
5.36 The budget for roads has grown quickly in the past three years and i s set to expand further. The fiscal challenge i s o f two types. First, the Roads Department has a history o f l o w budget execution, which means that increased allocations are unlikely to translate completely into increased spending. Second, value for money i s low. Road projects were and s t i l l are not chosen based on traffic assessments, let alone sound economic appraisal or cost-benefit analysis.” As a result, there are several examples o f high priority roads that have not yet made it into the portfolio, as wel l as examples o f roads that are included but should not have been a priority. Stakeholders f rom the productive sectors, such as manufacturing, flower, and tourism boards, have argued that important roads affecting their businesses are not included in the budget. Moreover, poor management and lack o f accountability and transparency in transactions have led to inefficient execution o f works, leading to sizeable cost and time overruns and dubious quality of works. A review carried out in 2007 showed that out o f 207 ongoing projects, 35 showed a cost overrun. In the case o f these 35 projects, the markup reached about 80 percent o f the original contract sums, totaling some K Sh 7 bil l ion. Time overrun was even more serious: 57 percent o f
’’ The government i s giving priority to addressing the backlog o f maintenance and rehabilitation over the expansion o f the network. However, within the area o f maintenance and rehabilitation, there i s no prioritization at project level. There i s no recent traffic assessment, which could allow proper economic analysis.
69

the ongoing portfolio exceeded the original construction completion time at the tender stage. On average, the actual time for completion was more than twice that estimated at the tender stage.
5 -37 The roads sector i s predominantly government-owned and government-funded. Improving value for public monies requires improvements at almost al l stages o f the standard project cycle.
5.3 8 Improve Planning and Preparation of Projects. Insufficient upfront planning and preparation o f projects i s the biggest cause o f inefficiencies. Poorly prepared projects lead to delays in implementation, poor quality in init ial design, rushed redesign later on, cost, and time overruns, and changes in the scope o f works to fit the available budget. At present there i s n o requirement that projects identified to be financed from the central budget meet any specific level o f preparation or economic appraisal (such as a cost-benefit analysis) to ensure that they are feasible and have an economic rate o f return above a threshold. The government (through the Ministry o f Finance) should establish common guidelines for selection and appraisal o f road projects. This should include establishing a project cycle, identifying selection criteria, specifying decision stages, and integrating the project cycle with the timing o f the budget processes. The existing Kenya Roads Board guidelines provide a useful starting point. Incentives to stop poor costing practices need to be introduced, such as sanctions for under-costed projects.
5.39 Choose Projects with High Rates of Return. An economic appraisal should be required for al l projects costing over a certain minimum threshold. N o t al l projects may need cost-benefit analysis for their prioritization (for example, Class D and E roads), but they do need to pass explicit and transparent criteria for inclusion in the public investment program and budget. The result should be a multiyear investment program based on appraised and priority-ranked projects, which i s then included as a part o f Medium Term Expenditure Framework (MTEF).
5.40 Adhere to Good Procurement Procedures and Practices. Putting an end to the lax procurement procedures and practices wi l l improve economic efficiency enormously. There are credible concerns o f corruption. N o w that there i s a modem framework for procurement in the government, ensuring transparency, fairness, efficiency, and accountability in procurement procedures and practices i s just a matter o f implementation.
5.4 1 Strengthen Supervision, Monitoring, and Evaluation. Overall portfolio management can be strengthened using agreed indicators o f portfolio health or performance. Similarly, procurement could be tightened by developing standards or norms for various steps in the procurement process. There i s a need for continuous monitoring during the entire implementation process to help identify potential problems so that they can be addressed early. In this regard, the government should consider developing a system o f measuring r isks associated with each project so that intensity o f supervision could be related to the riskiness o f a project. The M o F should demand annual reports on the indicators o f portfolio health and the network condition provided by each roads agency as part o f the budget cycle.
70

6. MOBILIZING PRIVATE RESOURCES FOR
Sector Sub-Saharan Africa, 1990-2006
No. o f Total
INFRASTRUCTURE
Kenya, 1990-2007
No. o f Total investment (US$billion)
6.1 Kenya has used private participation in infrastructure (PPI) in al l the major infrastructure sectors for leveraging public resources and donor funding, and improving the efficiency o f these sectors. From 1990 to 2007, PPI in Kenya attracted $US3.64 b i l l ion in investment commitments, about 6 percent o f the f low to Sub-Saharan Africa during this period (Table 6-1). The telecommunications sector accounted for the overwhelming majority-about 72 percent-f these investment commitments. Appendix Table A-6 l is ts a l l PPI projects in Kenya to date. The pace o f transactions has quickened in the past two years. The current government remains committed to PPI; in the FY08 budget speech, the Minister for Finance reiterated that PPI remains a strategic objective.”
billion)
Telecommunications 146 32.77 Energy 82 7.65 Transport 82 10.03 Water and sewerage 22 0.15 Total 332 50.59
Table 6-1: PPI in Sub-Saharan Africa and Kenya, by Sectors
Greenfield Divestiture Concession
4 2.25 0.39 -- 7 0.25 0.11 _- 5 0.05 -_ 0.59 1 0 --
17 2.55 0.50 0.59
projects investment projects (US$ I
6.2 An analysis o f Kenya’s past experience with PPI shows that the results have been mixed.”’ Overall, Kenya l ike many other developing countries, has received litt le private investment in infrastructure other than mobile phone networks. At the level o f individual transactions, some o f the contracts were doomed from inception because they had a flawed design
99 Several transactions have taken place since 2006. In the energy sector, Kenya Electricity Generating Company (KenGen) issued 30 percent o f i t s shares to the public in 2006; Kenya Power and Lighting Company (KPLC) entered into a two-year management contract with Manitoba Hydro in July 2006. The contracts for two more independent power producers (IPPs) have been awarded. In the transport sector, the Rif t Valley Railways concession for the Kenya-Uganda railway closed in November 2006. In November 2007, a decision was taken to transfer 5 1 percent stake in Telkom Kenya to France Telecom, in consortium with Dubai-based Alcazar Capital Limited. Further, the Treasury plans to sel l 25 percent o f its 60 percent stake in Telkom Kenya.
See the background paper, “Public-Private Partnerships in Kenya. Past Trends and Future Directions.” 100

and the government was not committed to make them work (such as the Felixstowe Port Consultants management contract for Mombasa container terminal). Others, l ike the Westmont Power Project, were hurriedly drawn up in a nontransparent fashion, and therefore could not be sustained. However, there have also been successes, most notably in the telecommunications sector, as the service i s expanding at a scorching pace.
6.3 The important reasons for the success o f PPI in the telecommunications sector were the reasonably long concession period, favorable init ial conditions in the form o f cost-covering user charges, and development o f regulatory institutions. The reasonably long concession period mitigated commercial risk o f the private operators by providing them assurance that they would be able to recoup their high level o f investment. The cost-covering user charges ensured that there are n o substantive political economy issues associated with the entry o f the private sector in telecommunications. The regulatory institution in the form o f the Communication Commission o f Kenya (CCK) addressed the regulatory risk o f the operators.
6.4 Overall, however, i t can be said that Kenya has followed an unstructured approach to PPI until now. The infrastructure deficit o f Kenya and i t s experience with PPI highlights the need for a more structured and successful approach for future transactions. The discussion below f irst presents general lessons about the enabling environment for PPI and important policy-level issues relating to design o f transactions-without getting into details, which would vary f rom one project to another. The section that follows briefly discusses institutional arrangements that should be put in place before undertaking PPP transactions o n a larger scale.
6.5 Competitive Markets. The experience with telecommunications sector suggests that privatization per se does not lead to increases in coverage, but that i t does when combined with an effective regulatory regime and competition. In Kenya, competition among service providers has led to rapid expansion o f the telecommunications network. Competition i s also useful in avoiding renegotiation o f concession contracts by increasing government leverage in thwarting such requests.
6.6 Regulation. Independent regulation mitigates political risk for private service providers by creating a level playing field. In addition, i t promotes accountability and performance by setting price caps and quality standards, and by monitoring and enforcing compliance with them. Regulation also facilitates dispute resolution. The recent public wrangling between KenGen and K P L C regarding their interim power purchase agreement demonstrates that there i s a relatively high degree o f regulatory risk in the power sector, where the Energy Regulatory Board (ERB) has yet to establish credibility. In telecommunications, o n the other hand, the Communications Commission o f Kenya (CCK) has been able to mitigate regulatory risk. There i s n o regulator yet in the transport sector, which i s l ikely to hamper successful private participation in the road and port sectors.
6.7 Development of the Local Capital Market. Kenya has pension fund assets estimated at US$4 billion-almost 15 percent o f 2006 GDP-which can be productively uti l ized for infrastructure financing. Development o f the local capital market, besides making debt and equity funding available for infrastructure, would also provide hedging opportunities and thus help in managing foreign exchange risk."' The issue o f developing local currency bond markets and attracting institutional investment into infrastructure i s discussed in the next section.
lo' Hedging opportunities refer to the development o f derivative markets in future.
72

6.8 The Importance of Managing Politics. There are always vociferous losers f rom private sector participation: inefficient workers o f the affected public sector un i t s organized in powerful unions, bureaucrats o f the controlling ministries who would see their f iefdom shrink, and politicians who would see their power o f patronage at state expense whither. T h e unsuccessful privatization o f the Mombasa container terminal i s a prime example, where political considerations have delayed a good economic decision. Confidence and t rust can be built in the PPI process by involving stakeholders, maintaining transparency, and generating quick results. The potential welfare gains f rom service provision through PPI should enable the winners to compensate the losers (most notably laid-off workers through, for example, an attractive severance package, as in the case o f Telkom Kenya Limited).
6.9 Risk Allocation. Risk mitigation i s the key to successful PPI projects. The objective should be to assure the private investor o f a market-driven return at a reasonable level o f risk, and the user o f adequate service quality at affordable costs. The different types o f r isks associated with infrastructure projects, and the agency that should handle them, are shown in Table 6-2.
Table 6-2: Types of Risk and their Allocation in a Typical PPI Project
Who should bear it Government should bear the risk. In case o f contract termination, compensation should be paid by the government. Government should bear the risk.
Type of risk Political risk, including expropriation, inconvertibility, or nontransferability
Concession design or development risk Construction risk (within private partner’s control)
Construction risk (outside private partner’s control: government action that delays the project, such as delays in obtaining approvals or permits) Commercial risk Financial risk Exchange rate risk Interest rate risk Solvency risk
UnexDected event risk
Private partner should bear the risk through fixed price construction contracts plus liquidated damages. Government should bear the risk.
Private partner should bear the risk. Private partner should bear the risk, as it i s a commercial risk. Government can help through macroeconomic stability. Private partner should bear the risk. Government debt guarantees lead to higher solvency risk through increased leverage. Insurer’s risk. if risk i s insured. Otherwise. risk
(Actsf God likefloods, earthquakes) Unexpected event risk (Changes in legal or contractualfiamework directly
should be borne by private partner. Government should bear the risk.
affecting the project) Regulatory risk Private partner bears this risk. Government should
set up credible regulatory institutions to mitigate th i s risk. a
Renegotiation risk Government bears this risk. Government should design proper concession agreements and regulatory framework to mitigate t h i s risk.
a. T h i s i s what the government should strive for. In the interim, until there are credible regulators, regulatory risk will largely need to be covered through government guarantees or World Bank partial risk guarantees, which are countersigned by the government. Source: Prepared by staff from various sources.
73

6.10 User Fees. There i s especially a need for consensus on this aspect before PPI can play a useful role. Legally binding contracts with the private operator and a hard budget constraint for them mean that the issue o f cost-covering user fees cannot be addressed in vague terms. Appropriate user fees are also necessary for financial closure o f projects and their post- commissioning sustenance. The government could consider some form o f subsidy to shield the poor f rom full recovery o f costs and build it into the contractual terms.
Developing Institutional Support for Public Private Partnerships
6.1 1 Institutional Arrangements. Public private partnership (PPP) projects involve considerable potential financial liabilities for the government; therefore, adequate institutional arrangements need to be in place for project analysis, negotiation, implementation, and monitoring o f transactions. Well-defined institutional arrangements such as competitive bidding, clear bid evaluation criteria, disclosure o f winning bidder and the bid price, and putting the transaction agreements in public domain to provide oversight are also needed to make the process transparent. The study funded by the Public-Private Infrastructure Advisory Facil ity (PPIAF) on the legal, policy, and institutional framework for PPP (IP3 2007) has suggested potential institutional arrangements, which can be drawn upon by the government.
6.12 The government can demonstrate i t s commitment to PPP by publishing a policy in the National Gazette. At this stage, there may not be a need to pass a new law, as there are n o restrictions on PPP in the existing laws o f Kenya. As suggested in the PPIAF study, amendments to the Public Procurement and Disposal Act, Government Contracts Act, and Permanent Secretary to the Treasury (Incorporated) Act, as wel l as subsidiary legislation in the form o f regulations, would help codify the institutional set-up for PPP. Whi le the proposed amendments will clarify the legality o f PPP, the regulations are needed to define the responsibilities and obligations o f the Public Procurement Oversight Authority, the Privatization Commission, l ine ministries, state corporations, and local government vis-a-vis the Ministry o f Finance.
6.13 The government should consider establishing a PPP Secretariat in the M o F and use i t to evaluate PPP undertaken by line ministries. A few PPPs with large value are currently being negotiated by line ministries with minimal involvement f rom Treasury. The line ministries have limited experience with financial analysis and structuring PPP, thus potentially exposing the government to fiscal r isks. The PPP Secretariat would ensure that PPP negotiated by line ministries are affordable, that they generate adequate value for money to the government, that there i s appropriate risk transfer, and that contingent liabilities are accounted for. In the interim, the M o F should take stock o f a l l large PPPs that are in the procurement stage to ensure that such deals are both affordable and do not result in a level o f financial exposure that i s unacceptable.
6.14 Based o n the pipeline o f PPP projects, the PPP Secretariat should start small and be scaleable. The project pipeline should be one o f the key factors in determining the size, composition, and mandate o f the PPP Secretariat. In many countries, the lack o f a robust PPP pipeline has led to unsuccessful PPP units. The pipeline o f PPP projects over the next few years i s modest and includes several projects that have long been under consideration; however, there are some potentially large transactions (see Table 6-3). Based on international best practice, it needs to be stressed that the PPP Secretariat should have n o role in promoting individual PPP transactions, in order to prevent a conflict o f interest.
74
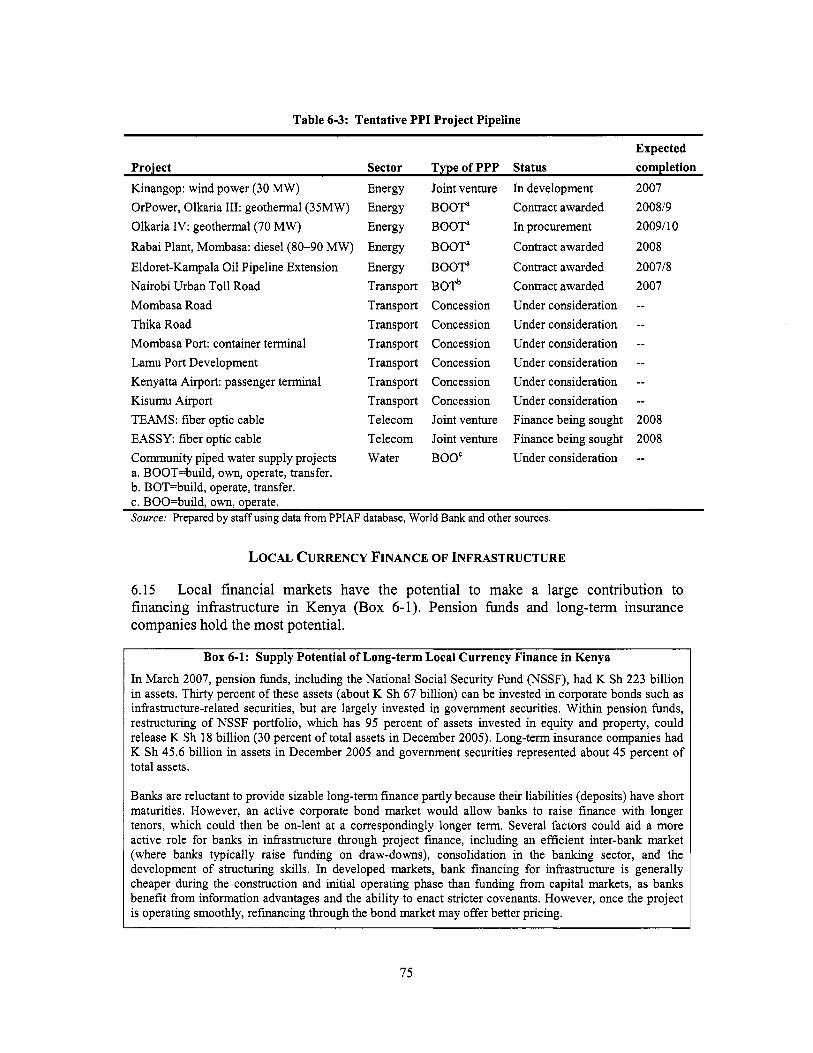
Table 6-3: Tentative PPI Project Pipeline
Expected Project Sector Type of PPP Status completion
Kinangop: wind power (30 MW) OrPower, Olkaria 111: geothermal (35MW) Olkaria IV: geothermal (70 MW) Rabai Plant, Mombasa: diesel (80-90 MW) Eldoret-Kampala Oi l Pipeline Extension Nai rob i Urban T o l l Road Mombasa Road Thika Road Mombasa Port: container terminal L a m u Port Development Kenyatta Airport: passenger terminal Kisumu Airport TEAMS: fiber optic cable EASSY: fiber optic cable Community piped water supply projects a. BOOT=build, own, operate, transfer. b. BOT=build, operate, transfer. c. BOO=build. own. onerate.
Energy Energy Energy Energy Energy Transport Transport Transport Transport Transport Transport Transport Telecom Telecom Water
Joint venture BOOT" BOOTa BOOT" BOOTa BOT^ Concession Concession Concession Concession Concession Concession Joint venture Joint venture BOOC
In development Contract awarded In procurement Contract awarded Contract awarded Contract awarded Under consideration Under consideration Under consideration Under consideration Under consideration Under consideration Finance being sought Finance being sought Under consideration
2007 200819 2009110 2008 200718 2007 -- -- -- -_ _ _ _ _ 2008 2008 -_
Source: Prepared by staff using data from PPIAF database, World Bank and other sources.
LOCAL CURRENCY FINANCE OF INFRASTRUCTURE
6.15 Local financial markets have the potential to make a large contribution to financing infrastructure in Kenya (Box 6-1). Pension funds and long-term insurance companies hold the most potential.
Box 6-1: Supply Potential of Long-term Local Currency Finance in Kenya
In March 2007, pension funds, including the National Social Security Fund (NSSF), had K Sh 223 b i l l i on in assets. Thirty percent o f these assets (about K Sh 67 bil l ion) can be invested in corporate bonds such as infrastructure-related securities, but are largely invested in government securities. Within pension funds, restructuring o f NSSF portfolio, which has 95 percent o f assets invested in equity and property, could release K Sh 18 b i l l i on (30 percent o f total assets in December 2005). Long-term insurance companies had K Sh 45.6 bi l l ion in assets in December 2005 and government securities represented about 45 percent o f total assets.
Banks are reluctant to provide sizable long-term finance partly because their liabilities (deposits) have short maturities. However, an active corporate bond market would al low banks to raise finance with longer tenors, which could then be on-lent at a correspondingly longer term. Several factors could a id a more active role for banks in infrastructure through project finance, including an efficient inter-bank market (where banks typically raise funding on draw-downs), consolidation in the banking sector, and the development o f structuring sk i l l s . In developed markets, bank financing for infrastructure i s generally cheaper during the construction and init ial operating phase than funding f rom capital markets, as banks benefit f rom information advantages and the abi l i ty t o enact stricter covenants. However, once the project i s operating smoothly, refinancing through the bond market may offer better pricing.
75

Developing of the Corporate Bond Market
6.16 Developing the corporate bond market i s important for long-term financing o f infrastructure through capital markets. However, there are several obstacles to the development of a healthy bond market at present:
The major impediment i s an ill-suited regulatory framework. Many countries, such as Brazil, the Republic o f Korea, and Malaysia, have successfully developed their bond market by shifting to a regulatory environment that focuses on disclosure. In contrast, the Capital Markets Authority (CMA) in Kenya operates a merit-based system, where it has on occasion used i t s own discretion in a nontransparent manner to decide which companies can access the bond market. This filtering process has turned the regulator largely into a bottleneck.
Over-regulation o f secondary market activity (such as the lack o f an Over-the- Counter market) could be stifling liquidity. The requirement that corporate bonds must be traded o n the Nairobi Stock Exchange (NSE) closes down a channel for introducing liquidity in to the market. The negotiation o f the instrument by dealers and institutional investors in the Over-the-counter (OTC) market i s the predominant practice around the world. To maintain transparency, i t i s advisable that corporate bonds continue to be listed on the Nairobi Stock Exchange; however, where they are traded i s best lef t up to the trading parties.
Private placements can reduce the overall costs o f a bond issuance. One o f the advantages o f private placements i s that i t shortens the time it takes companies to access the market. The current regulatory framework does not encourage companies that prefer to remain private or issues with more complex structures to access institutional investors through a more appropriate channel such as a private issue. In the case o f infrastructure bonds, these are l ikely to be structured products targeted toward institutional investors. If the concern i s that such instruments could reach the hands o f unsophisticated investors, there are ways o f addressing this: for example, by requiring that the denomination o f the notes i s high enough that they are only affordable for institutional investors.
Lower fees would make bonds much more attractive to companies f rom a pricing perspective. Bond issuance fees are becoming more competitive with the arrangement fees o n bank loans. By most accounts, issuance fees for corporate bonds have historically ranged from 3 to 4 percent, as compared to 1 to 2 percent for bank loans.
Under CMA practice, many issuers are required to obtain a credit guarantee. The de facto requirement for credit guarantees has led enterprises to view bonds as unaffordable. Guarantees can add as many as 300 to 400 basis points in cost for the issuer. Going forward in a disclosure-based environment, the C M A would allow the market to determine the risk premium and structure o f bonds issuances. In order to stimulate the development o f the corporate bond market and ensure i t s stability, the C M A might require in the interim that companies obtain a rating.
76

The several months that it takes to get a bond approved (six months, in some cases) encourages parastatals and companies to source financing from banks. One reason for the proposed switch to a disclosure-based regulatory framework for the corporate bond market i s to shorten the approval process.
6.17 The issuance o f asset-backed securities ( A B S ) regulations will make it easier for infrastructure f i r m s to access long-term finance. In fiscal year 2004/5, the CMA developed regulations for asset-backed securities. The regulations were adopted in late 2007. Once implemented, the asset-backed securities regulations could be a major catalyst in mobilizing long- term resources for infrastructure.
6.18 A certification program for various capital market players would help improve the professionalism o f the securities industry. Currently, there are n o industry standards for key activities o f the market such as trading, asset management, and investment banking. The CMA carries out basic controls over certain segments o f the market through i t s licensing process.
6.19 The supervisory and enforcement capacity o f market authorities needs to be strengthened. There are two ways that this can be done: by centralizing a l l supervision o f the market and market participants at the CMA; or by establishing an independent self-regulatory organization (SRO), assuming the Nairobi Stock Exchange demutualizes. The SRO option may be better suited to the circumstances in Kenya, as it provides for more wage flexibil i ty and for surveillance by market practitioners with the requisite skill-set. The development o f SRO capacity would also lessen the burden on the C M A to oversee every facet o f the market.
6.20 Establishing the Privatization Commission and proceeding with planned init ial public offerings (IPOs) and secondary offerings will deepen capital markets. There i s s t i l l substantial demand for new securities among institutional and retail investors.
6.21 Private sector representation i s lacking o n the board o f directors o f partially privatized infrastructure parastatals. Those infrastructure state-owned enterprises that have done IPOs continue to have boards dominated by government, thus undercutting one o f the reasons for privatization (that is, private sector management). Once established, it i s advisable for the Privatization Commission to prioritize among different methods o f privatization. Based o n international experience, selling a portion o f equity to a diffuse ownership base (through an PO, for example) typically does not lead to an improvement in performance. On the other hand, selling a stake to a single strategic investor often brings with it management experience and technological knowledge gained from years o f experience in the sector. W h i l e selling stock through an P O does have the benefit o f “allowing Kenyans to own a part o f Kenya,” the government needs to balance this objective with doing what i s l ikely to improve best the performance o f infrastructure utilities and the delivery o f services.
Improving Banking Sector Efficiency
6.22 The government continues to exercise de facto control over four banks (Consolidated, Co-op, KCB, and NBK) and has injected large amounts o f financial assistance to maintain the solvency o f three o f these, Co-op, KCB, and NBK. The analysis carried out for this report shows that government-influenced banks have lagged private banks in improving banking efficiency during the past five years. They also have much higher share o f their loan portfolios as non- performing and their overhead costs are higher. The governance o f the state-influenced banks also poses a long-term fiscal risk given their history o f questionable lending by these banks. The government had la id out an agenda for financial sector reform in the ERS but progress has been
77

l imited in the area o f improving the efficiency o f public-influenced banks. Among the suggested steps to take the reform process forward are: (i) reduce government influence in Consolidated, KCB, and NBK; (ii) restructure the governance o f Co-op to provide it with an independent and professional board o f directors capable o f adequately supervising management; and, (iii) amend Co-op’s statutes to permit it to access capital f rom sources outside the co-operative movement.
Improving the Performance of NSSF
6.23 Governance improvements and structural reforms are needed at the National Social Security Fund. By nearly every metric o f pension fund performance, NSSF has performed badly. Past and current management has suffered from allegations o f improper conduct and corruption. The recent Wor ld Bank study (World Bank 2007d) on pension reform includes several recommendations for reforming NSSF. Among the suggested reforms are: developing a more detailed governance framework for investment management; uti l izing external investment managers; introducing stronger disclosure requirements and submitting to external reviews; being required to comply with the Retirement Benefits Authority (RBA) Act; and strengthening the management o f NSSF itself. As o f late 2006, NSSF has not been exempt f rom the RBA Act; however, NSSF has been very slow in complying with the RBA requirements and has resisted efforts to perform a diagnostic audit.
Developing Investment Guidelines for Insurance Companies
6.24 Establishing an autonomous insurance regulator with responsibility for setting investment guidelines will help ensure that insurance companies make prudent investments. Many o f the larger l i fe insurance companies have followed a relatively prudent portfolio allocation strategy, investing primarily in long-term government bonds. However, largely the sector has operated unregulated, with many small to medium-sized f i r m s making riskier investments.
Utilizing Guarantee Instruments
6.25 The government and international financial institutions (IFIs) can facilitate private sector investment by providing guarantee instruments. The government can provide a partial risk guarantee (PRG) issued by the Wor ld Bank to lenders to the project sponsor in the event that the company defaults because o f revenue shortfalls due to unscheduled changes in policy and/or regulation.
6.26 Furthermore, partial credit guarantees can help an enterprise raise a larger sum o f funds and achieve a longer tenor than otherwise would have been possible had the firm relied solely o n i t s own credit. Authorization f rom the central bank for the use o f partial credit guarantees (PCGs), provided by the International Finance Corporation (IFC), will enable local banks to expand lending by overcoming exposure limits.
DIASPORA BONDS
6.27 Instead o f borrowing money in the international capital markets or f rom foreign governments or multilateral financial institutions, some homeland governments have begun to turn to their diasporas for funding. Examples include India, Israel, the Philippines, Sri Lanka, and South Africa through i s Reconciliation and Development Bonds. However, diaspora bonds are not yet widely used as an instrument o f development finance. The diaspora purchases o f bonds issued by their country o f origin are likely to be driven by a sense o f patriotism, and the desire to contribute to the development o f the home country. The placement o f bonds at a premium allows
78

the issuing country to leverage the charity element into a substantially larger f low o f capital. T o the investors, diaspora bonds provide opportunity to diversify asset composition and improve r i s k management.
6.28 There were about 427,000 people o f Kenyan origin in high-income countries in 2005. Assuming that members o f the diaspora earn the average income o f their host counties and save a fifth o f their income, the potential diaspora savings i s about $US1.7 bil l ion. There i s scope for tapping into these savings and diaspora bonds could potentially raise US$300 mi l l ion to US$600 mi l l ion annually for Kenya. Of course, raising funds through such bonds i s l ikely to have an impact on remittances, which have reached up to the level o f 5 percent o f GDP in the past. The plus side o f bonds i s that while a large part o f the remittances generally finances consumption, diaspora bonds would finance investment directly. Box 6-2 discusses the experience o f some countries with diaspora bonds.
Box 6-2: International Experience with Diaspora Bonds
Israeli and Indian Experience The Jewish diaspora in the Uni ted States (and to lesser extent Canada) has supported development o f Israel by buying bonds issued by the Development Corporation for Israel (offered by the fledgling state beginning in 1951). Currently, Israel uses proceeds f r o m bond sales to finance major public sector projects such as desalination, construction o f housing, and communication infrastructure. The Israeli government has adapted and expanded the range o f instruments available to Jewish diaspora investors. N e w bond offerings have moved in recent years toward market pricing.
The Indian government has tapped its diaspora base o f nonresident Indians (NRIs ) for f i nd ing on three occasions (India Development Bonds after the balance o f payments crisis in 1991; Resurgent India Bonds fol lowing the imposition o f sanctions after nuclear testing in 1998; and India M i l l enn ium Deposits in 2000).
Conditions and Candidates for Successful Diaspora Bond Issuance Factors that facilitate o r constrain the issuance o f diaspora bonds include having a sizeable diaspora abroad and a strong and transparent legal system for contract enforcement at home. Diaspora investors would require a minimum level o f governability in their countries. The presence o f national banks and other institutions in destination countries facilitates the marketing o f bonds to the diaspora.
Countries also must fo l low the securities regime in the country where they p lan to issue the diaspora bonds. If countries want to tap to the diaspora in the US. market, they wil l have to register their diaspora bonds with the US. Security and Exchange Commission. In Europe, the regulatory requirements are relatively less stringent than in the Uni ted States.
Source: Ketkar and Ratha (2007); Ratha, Mohapatra, and Plaza (2007).
79

APPENDIXES
Period Comoosition o f outout bv sector (Dercent of
total)
A. BACKGROUND FIGURES AND TABLES
Growth o f outout bv sector (oercent per year)
Contribution to Prowth o f outout by sector hercentage ooints)'
Figure A-1: Trend in Annual Percent Change in GDP Per Capita, 1960-2007
1960s 1970s 1980s 1990s 2000s
2003-7
I -10%
37.5 17.9 44.6 2.8 5.2 6.3 4.8 1.1 0.9 2.8 35.6 20.0 44.4 5.3 10.6 7.6 7.4 1.9 2.1 3.4 32.6 19.4 48.0 3.7 3.9 4.9 4.3 1.2 0.8 2.4 30.7 18.0 51.2 1.1 0.7 2.5 1.8 0.3 0.1 1.3 28.6 17.5 53.9 2.8 3.5 4.0 3.6 0.8 0.6 2.2 27.1 17.9 55.0 3.5 5.2 5.1 4.7 0.9 0.9 2.8
I I . . .E . . Annual real per capita GDP growth - trend (HP filter) I Source: WDI database.
80

Table A-2: Sources of Growth by Periods (1960-2003): Selected High Performing Economies and Kenya
Contribution by component (percentage points)
Physical
worker (TFP) +TFP
Growth in Growth in output per Physical Total Factor capital per output (percent a
Year) year)
Education Productivity worker capita1 per per worker (percent a worker
(5)=(2)-(3)- (1) (2) (3) (4) (4) (6)=(3)+( 5)
China 1960-70 1970-80 1980-90 1990-2003 1960-2003 Korea, Rep. 1960-70 1970-80 1980-90 1990-2003 1960-2003 Singapore 1960-70 1970-80 1980-90 1990-2003 1960-2003 Taiwan 1960-70 1970-80 1980-90 1990-2003 1960-2003 Thailand 1960-70 1970-80 1980-90 1990-2003 1960-2003 Chile 1960-70 1970-80 1980-90 1990-2003 1960-2003 Mauritius 1960-70 1970-80 1980-90 1990-2003
2.79 5.30 9.19 9.70 6.91
8.20 7.42 8.64 5.74 7.37
9.84 9.01 7.29 5.97 7.87
9.65 9.75 7.92 6.34 8.41
8.16 6.86 7.85 4.53 6.68
4.11 2.86 3.77 5.62 4.19
2.87 5.88 6.02 5.09
0.91 2.76 6.83 8.51 4.97
4.90 4.15 6.13 3.81 4.68
6.72 4.41 3.79 3.51 4.52
6.92 5.93 5.36 4.76 5.74
5.22 3.38 5.14 3.35 4.20
2.58 0.28 1.04 3.36 1.92
0.38 2.63 3.61 3.32
0.02 1.60 2.09 3.32 1.86
1.93 3.74 2.84 2.40 2.70
4.49 3.53 2.01 1.76 2.86
3.64 3.69 2.19 2.67 3.04
3.52 2.21 1.86 1 .go 2.34
1.32 -0.19 0.03 1.71 0.78
-0.1 1 0.55 0.28 1.29
81
0.34 0.41 0.43 0.29 0.36
0.53 1.09 0.79 0.46 0.70
0.51 0.07 0.35 0.82 0.46
0.63 1.02 0.16 0.34 0.54
0.08 0.25 0.79 0.40 0.38
0.3 1 0.41 0.3 1 0.26 0.32
0.49 0.52 0.32 0.25
0.54 0.73 4.19 4.72 2.68
2.38 -0.69 2.39 0.91 1.22
1.61 0.78 1.38 0.90 1.15
2.51 1.14 2.94 1.69 2.07
1.56 0.89 2.42 1.02 1.44
0.94 0.06 0.70 1.35 0.80
0.00 1.54 2.99 1.75
0.56 2.33 6.28 8.04 4.54
4.3 1 3.05 5.23 3.31 3.92
6.10 4.3 1 3.40 2.66 4.01
6.16 4.82 5.13 4.36 5.1 1
5.08 3.10 4.27 2.92 3.78
2.25 -0.13 0.73 3.06 1.59
-0.1 1 2.09 3.27 3.04

Contribution by component (percentage points)
Physical
Education Productivity worker
(TFP) +TFP
Growth in Growth in output per Physical Total Factor capital per
(percent a worker capital per per worker output
Year) year) (percent a worker
(5)=(2)-(3)- (1) (2) (3) (4) (4) (6)=(3)+(5)
1960-2003 4.97 2.53 0.56 0.38 1.58 2.13 Ireland 1960-70 1970-80 1980-90 1990-2003 1960-2003 India 1960-70 1970-80 1980-90 1990-2003 1960-2003 Malaysia 1960-70 1970-80 1980-90 1990-2003 1960-2003 Mozambique 1960-70 1970-80 1980-90 1990-2003 1960-2003 Kenya 1960-70 1970-80 1980-90 1990-2003
4.19 4.74 3.62 6.84 4.98
3.74 3.08 5.50 5.82 4.62
6.48 7.83 5.98 6.20 6.59
5.04 -0.96 0.15 6.38 2.86
4.48 8.01 4.07 1.61
4.21 3.76 3.57 3.39 3.71
1.81 0.70 3.48 3.99 2.59
3.51 4.13 2.49 3.20 3.32
2.98 -3.17 -1.17 4.23 0.92
1.66 4.35 0.53 -1.50
1.78 1.77 1.17 0.49 1.24
1.34 0.73 1.06 1.48 1.17
1.97 2.37 1.85 2.00 2.04
0.03 -0.07 -0.25 1.35 0.34
0.33 0.88 -0.66 -0.47
0.22 0.33 0.42 0.26 0.30
0.17 0.33 0.36 0.46 0.34
0.51 0.60 0.59 0.48 0.54
0.10 0.09 0.24 0.12 0.14
0.34 0.54 0.30 0.32
2.16 1.63 1.95 2.63 2.13
0.74 -0.21 2.05 1.95 1.19
0.99 1.12 0.03 0.70 0.71
2.84 -3.19 -1.16 2.72 0.44
0.99 2.89 0.89 -1.35
3.94 3.40 3.11 3.12 3.37
2.08 0.52 3.1 1 3.43 2.36
2.97 3.48 1.89 2.69 2.75
2.88 -3.26 -1.41 4.07 0.78
1.32 3.77 0.24 -1.82
1960-2003 4.31 1.04 -0.02 0.37 0.69 0.67 Source: Data obtained from the authors o f Bosworth and Collins (2003).
82

Figure A-2: Kenya’s Ranking in “Doing Business 2008” 180 1 160 140 120 100 80 60 40 20
0
Source: World Bank (2007e).
Figure A-3: Global Competitiveness Index, Kenya: The Most Problematic Factors for Doing Business, 2007-8
corruption inadequate supply of infrastructure
access to finance tax rates
crime and theft inefficient gowrnment bureaucracy
tax regulations inflation
policy instability poor work ethics in national labor force
inadequately educated labor force restrictiw labor regulations
foreign currency regulations gowmment instability / coups
0 2 4 6 8 10 12 14 16 18 Source. World Economic Forum (2007).
83

Table A-3: Comparative Tax Rates for Residents in EAC Countries and Comparators
Tax Corporate Tax rate (%) (PAYE) Top Income Tax rate VAT rate
Excise o n petrol (p)/diesel( d)
Excise tax o n spirits Source: Kenyan authorities
South Kenya Uganda Tanzania Rwanda Afr ica Maurit ius Burundi Zambia
30 30 30
30 16
30 18
30 20
K s h 19.8 per litre ( P W h 10.3per Ush530 Tsh litre (d) per l i tre 200Aitre K s h
35 28 22.5 35 35
30 40 - 35 35 18 14 0 - 17.5
250Aitre - - 70% 43%
84

Table A- 4: Share o f Ten Largest Products in Kenya’s Total Exports
1995-7 2002-4
Product Product name code
Percent o f total exports
074
07 1
334
292
674
05 8
054
034
5 54
66 1
Tea and mate
Coffee and coffee substitutes
Refined petroleum products
Crude vegetable materials
Plates and sheets o f iron
Fruit, preserved
Vegetable, fresh, frozen
Fish, fresh
Soap, cleansing and polishing
Lime, cement, fabricated construction materials
20.3
15.1
7.1
5.8
3.6
3.4
2.3
2.3
2.2
2.1
- Rank
- 1
2
3
4
5
6
7
8
9
10
-
Product Product name Percent o f code total exports
334 Refined petroleum 24.1 products
074 Tea and mate 15.4
292 Crude vegetable 9.9 materials
054 Vegetable, fresh, 5.8 frozen
07 1 Coffee and coffee 3.2 substitute
058 Fruit, preserved 2.8
892 Printed matter 2.4
278 Other crude 2.3 materials
674 Plates and sheets o f 2.2 iron
034 Fish, fresh 1.8
Source: UNTRADE.
85

Code 44 48 61 263 287 286 335 423 512 522 541 553 582 582 583 592 825 634 635 841 642 851 658 867 873 676 884 891 899 714 723 752 764 778 778 782 763 786 792 845 846 851 874 892 893 694 971
Product N ~ M Mails (com),unmilled Cereai prepar 8 p rep of flour of Swar and honey Conon Ores and wnmnlrales of base metal Non-fernus bare metal wane and sc Reslduai petroleum pmductr.nes 8 r Fixed vw taMe oilo.soH.crude.ref Alwhcls,phenols,phenol-alcohois,~ Inorganic chsmical elemen!s,oxldeo Medicinal and pharmxaulical produc Perfumery.wsmelics and loikl p e p FenilizerS.manufadured Condensaiion,poh/wndensalwn 8 pot Polymenzalon and mplymeriralon Slarches,inulin 8 wheat glulen.albu Rubber 1yms.Iyre cases,eIc for whe V e n e e n , ~ ~ , i m p m v e d or rewnsl Wood manufadureJ,n e s P a p r and paprboard Paper and pararboard.cu1 lo size or Te~tile yam Made-up anicles,whollylchkny of PearkweciousL semi-pmc st0nas.u lion and steel bars.icdr.angleo.rha T~ tes ,p~ ras and nnlngs,of imn or Aluminium Slrunures & pans of S!NC .iron.s Manufadurns of baDa me1ai.n e I Engines & moton,non-ekcIric Civil engineanng 8 SontradorS @a Auiormc data procassing machines Telemmmunicalions equipment and pa Thermwno.wld 8 phoIc-mlhDdB Val Elenricai machineryand apparalw Motor vehicles for lranspoll of gw Road motor vehicie6.n 8.6 TraIbn 8 other whlcIeS,nOt motor Aircraft & asscaaled equipmen1 and Ouler garmen18 and other ar1cles.k Under garments,knmed or crocheted Footwear Msarur~ng,checking.analyJinO inslru Printed maner Anicles of matenab descnbed in Baby carnager,toys,games and spon Gold.non-monetary
Kenya 4 6 0 2
34 7 1 5
1Og 4 8 4 2 0
77 0 29 8 13 0 5 6
13 8 21 5 18 7 10 2 9 1 5 1
-15 9 4 4 7 5
12 9 17 9 -51 -9 6 4 7
16 6 1 4
15 8 11 9
-16 3 20 8
1 8 -0 6
-20 1 1 7 8 8 9 8 5
34 9 44 1 97 4
1 3 7 18 1 -3 0 11 4 1 3 2
-14 1
70 1
8 9 12 3 8 3 7 0
184 12 2 18 7 14 8 15 3 11 3 192 13 0 12 7 12 6 12 4 10 0 11 3 10 0 9 1 7 3 8 1 3 3
11 8 9 3
18 4 15 1 9 8
12 8 10 0 4 4
15 9 6 3 9 1 6 1 8 5 9 0
11 9 13 2 5 2 6 6 7 8 7 2 8 6 8 4
102 6 4
136
86

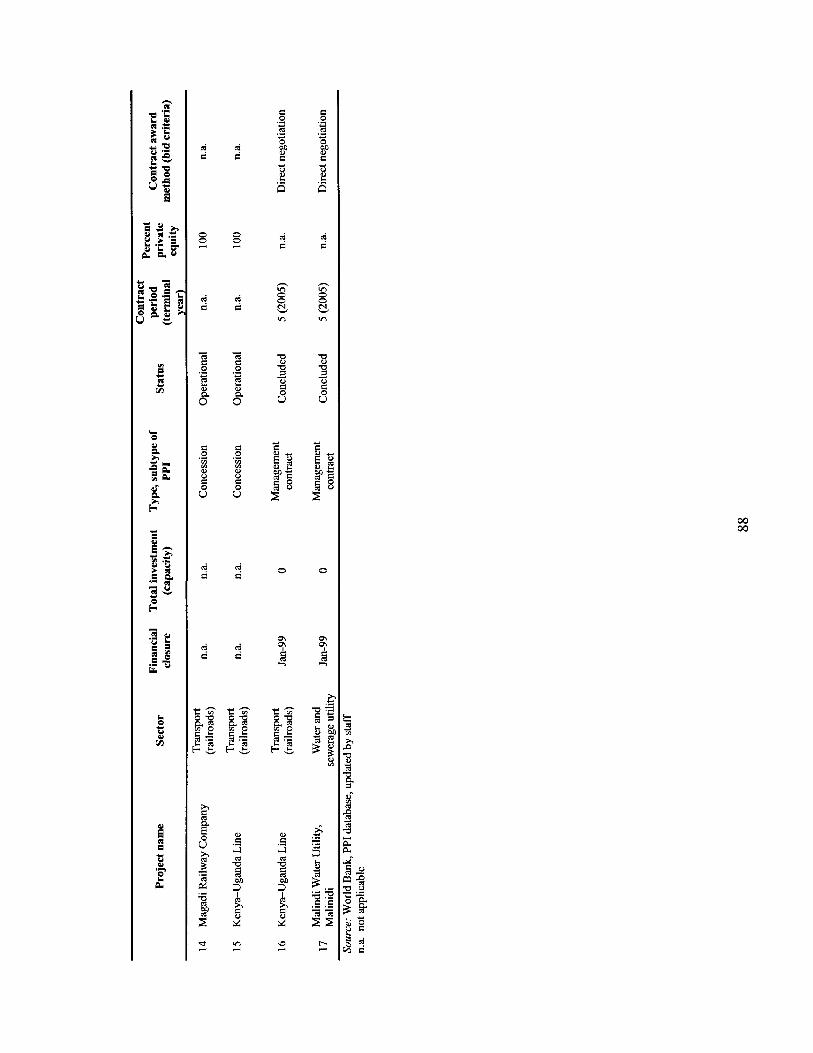
00 00

B. KENYA AGRICULTURE POLICY REVIEW-PRELIMINARY MESSAGES’ O2
Agriculture remains a critical sector in the Kenyan economy-for poverty reduction as wel l as for overall economic growth. I t not only constitutes almost a quarter o f the total GDP, but also accounts for ha l f the manufacturing production. It contributes a disproportionately large share of total employment and exports. About 65 percent o f Kenyan population i s rural, and o f these almost 60 percent l ive in poverty, relying directly or indirectly on agriculture for their livelihoods. Their wellbeing and overall economic growth depend o n the performance o f agriculture.
The key to better performance in agriculture i s rapid increases in productivity, particularly in smallholder farming. This requires not only increases in physical production volumes and values (the supply side), but also better linkages o f farmers to diversifying consumer markets (the demand side). In other words, the need i s to not only encourage food crop productivity, which i s critical for poverty reduction and promoting broader economic growth through lower real prices o f food, but to also help small- and medium-size landholders to transform from subsistence- oriented agriculture to more commercial and higher-valued outputs. To bring about this transformation, the role o f the state i s central by investing in critical public goods and facilitating key institutions to promote better and more efficient markets and private sector participation. The analysis in the review identifies three areas o f focus for the state’s efforts: responsive and efficient delivery o f key agricultural services, upgrading and maintaining critical rural infrastructure, and supporting more efficient markets and private sector.
Some crosscutting pol icy recommendations relevant for the most agricultural subsectors are presented below. More detailed sub-sector specific recommendations for policy actions are summarized in the final concluding section o f the review. Whi le al l o f the below measures can contribute to increased agricultural growth, i t i s unlikely that any one will prove effective in isolation. Policy makers should, therefore, select strategic combinations o f both investments and policy measures to achieve the desired outcomes.
1. Increasing public expenditure for the agriculture-related public goods. Public spending on agriculture in Kenya has fallen dramatically in real terms, having peaked in the late 1980s and declined substantially thereafter. Since 2000, total public spending on agriculture has not exceeded 5 percent o f the total budget spending, and based on the GoK’s projections, i t s share will remain around 5 percent.
Sustained public expenditures in agricultural research, extension, irrigation, animal health and veterinary services, market information, grades and standards, capacity strengthening o f public staff, and other public goods are indispensable for agricultural growth and increased competitiveness. Land constraints and decreasing farm size imply the need to develop (agricultural research) and disseminate (extension) the low-cost technologies that increase yield and value. A critical factor for more effective research and extension or advisory services, i s to make them more accountable to the farmers and more dynamic and responsive to the changing market environment. Overdependence on rain results in volatile yields and high crop loss, calling for increased support to cost-efficient irrigation and more effective water management, where economically feasible. Increasing the farmers’ share in consumer price would require the public expenditure in grades and standards, while the wide dissemination o f market information would
‘02 This appendix i s drawn from an ongoing “Kenya Agriculture Policy Review” (World Bank 2008a).
89

better integrate markets and link farmers to consumers. This i s also crucial for introduction of commodity risk management instruments.
2. Improvement in rural infrastructure and market access i s another top and cross-cutting priority for public expenditure. Productivity enhancement, diversification, adoption o f inputs and market performance are al l found to be significantly influenced by access and infrastructure costs. Over time, the performance o f major markets for agricultural products and inputs has improved significantly, but the transport costs f rom farm gate to primary and secondary markets remain high. Thus, the challenge i s t o tackle the rural transport problem, which adds at least 16 percent to wholesale maize price in Nairobi, 37 percent to sugar costs, and 50 percent to imported fertilizer cost in western Kenya, and staggering 69 percent to coffee. Addressing inefficiencies and problems with Mombasa port related services i s also an important area.
3. Providing stable policy environment and more transparent regulatory framework, with consistent shift to market facilitation. In order to bring benefits, the public spending requires o f being complemented and supported by stable policy environment with clear and rule-based public operations. The liberalization has reduced market distortions and domestic prices have increasingly followed correspondent border prices. However, the GoK’s direct involvement in private sector activities and markets remains high and needs to be changed. The examples are the pan-seasonal buying and selling o f maize by NCPB, the price support to sugarcane producers, the continued state ownership o f the most sugar factories, Kenya Seeds Company (KSC)’s dominant position in seeds market, and the reintroduction o f assets o f Kenya Cooperative Creameries (KCC) dairy plants and Kenya Meat Company (KMC) processing facilities in disease-free zones, which al l significantly diminish the economic value o f the existing private investment in the agricultural sector and displace future investment.
The phenomenon o f subsidized government intervention in the market, or the threat o f it, leading to private sector inaction, i s one o f the greatest problems plaguing the food and input marketing systems in Kenya, and doubtlessly raises the costs o f marketing, production, and coordination in the supply value chains. A more transparent and investor friendly regulatory framework i s needed to encourage investment in the sector and related service sectors.
A more consultative framework for public-private sector dialogue i s needed to move toward greater coordination and predictability in government behavior. Regular consultative meetings between public and private sector can build t rust and communication that i s needed to reduce market r isks and promote long-term investments. Mi l lers and traders would benefit f rom more transparent system o f maize price setting by NCPB. Stakeholders in some industries such as dairy and livestock should have more opportunities to say in decision m a h n g over the use o f cess and management o f the boards.
4. Strengthening the performance of traditional marketing systems. The performance o f “traditional” food systems will remain a much more important determinant o f farmer welfare and consumer food security than supermarkets. Hence, focus investment priorities on improving the performance o f traditional food marketing systems i s crucial.
Increasing public investment in upgrading the urban wholesale and retail market facilities to reduce the costs and r isks to farmers and traders and to leverage private investments. Investing in development and enforcement o f grades and standards and more easily available information on prices and volume by grade o f product to increase market transparency and further attract customers.
0
90

Increasing public investment in rural roads, market infrastructure, and storage facilities. Strengthen the focus o f extension services in favor o f smallholders to build the capacity for producer organizations that can bulk produce; access to market information; credit to enable groups to rent storage space and vehicle to transport produce themselves; and trade linkages through commodity exchange arrangements.
5. Promoting regional trade. While the increased competitiveness o f export crops remains important task in the policy agenda, more gains should be extracted from regional trade in staple crops to foster broad-based agricultural growth and promote farm diversification. This trade has increasingly taken place in the region, through both formal and informal channels, and i t s expansion has the great potential to become a source o f “quick wins” for reducing price volatility, expanding the size o f the market (both input and output), increasing the elasticity o f demand facing farmers, and consequently promoting food security at household level. Investing in market infrastructure, reducing trade restrictions and interventions, reducing nontariff barriers to trade, harmonizing quality, safety standards and phytosanitary requirements with neighbors, and streamlining customs procedures would al l contribute to further regional trade.
’
91

C. A NOTE ON BANKING SECTOR EFFICIENCY AND FINANCIAL OUTREACH
Kenya's financial systems are wel l developed by regional standards, but they lack the depth and efficiency to deliver the desired growth. In 2006, the ratio o f financial system deposits to GDP was 34.6 percent, while the ratio o f bank deposits to GDP was 33.1 percent.lo3 Those figures compare favorably with other African countries, where average bank deposits/GDP hover near 25 percent, but they remain however substantially below the averages for higher growth regions l ike East Asia Pacific (5 1.4 percent) and South Asia (46.3 percent). Private sector credit to GDP-a key indicator for intermediation efficiency-shows a similar profile, at 24.3 percent in 2006 for Kenya, exceeding the Afr ica region average, but significantly below the averages for East Asia Pacific (43.0 percent) and South Asia (38.3 percent) (Figure C-1).
Figure C-1: Financial Sector Depth and GDP Per Capita, 2000-5
-a 4 1- E T 0 -
s P -1 - b
SLE
-3 - I I I I I
-4 -2 0 2 4 (GDP per CapiIaAnflation) residual
Sub-Saharan Africa ' All Other Regions
SWYCe Fmmcid Stnrctura Database, 2006, WDI Sampla sua 151 coun!~ua6, Tuna penod 20m45
The vast majority o f deposits and assets in the financial system are housed in banks, and the government s t i l l maintains a sizable ownership stake in the sector. Though it i s the most important component o f the financial system, the banking sector continues to be heavily influenced by the state, with over a quarter o f deposits and assets held by four state-influenced banks: KCB, Co-op, NBK, and Consolidated (Table (2-1). Recent loan growth has been concentrated in foreign and domestic private banks. Domestic privately owned banks grew most rapidly, sharply increasing their share o f total loans as the shares o f the state-influenced banks de~ l i ned . "~ Private domestic banks had the largest gains in the share o f total assets and loans net
I O 3 Wor ld Bank financial structure database, October 2007 update.
I O 4 The decline in the net loans o f state banks was in large measure caused by two factors. First, state- influenced banks f inal ly provisioning against the very large losses in their loan portfolios (reducing the banks' net loans), which had been built up because o f decades o f pol i t ical ly influenced and incompetent lending. Second, new lending by NBK and Consolidated was effectively frozen because o f insolvency and
92

o f provisions, from 22 percent to 29 percent on both measures. Foreign banks experienced a decline in asset share f rom 2003 to 2005 (from 49 percent to 43 percent), though a slighter decline in net loan share (from 44 percent to 42 percent), which i s a reflection o f the relatively high quality o f their portfolios.
Table C-1: Growth and Structure of Kenya’s Banking Sector, 2000-5
Indicator 2000 2001 2002 2003 2004 2005
Private credit/GDP 25.6 24.1 23.8 23.1 23.3 24.3 Loans (net o f provisions)/GDP 20.8 20.2 21.3 21.0 22.9 22.9 Real GDP growth 0.6 3.8 0.6 3.0 4.9 5.8
Share o f banking sector assets
Private domestic 21.9 22.7 22.6 24.1 25.7 28.7 Government 7.1 7.1 6.6 6.0 6.2 5.6
NBK 6.1 5.9 5.7 5.2 5.5 5.2 Government-influenced 26.7 23.9 22.5 21.2 22.7 22.2
KCB 16.6 15.0 12.8 11.7 11.9 11.8 Cooperative 5.7 5.2 6.5 6.5 8.3 8.2
Foreign 44.3 46.3 48.3 48.7 45.3 43.4
Share of total loans (net o f provisions) Foreign 39.9 40.8 41.9 43.7 42.5 42.3 Private domestic 22.1 22.0 22.6 24.4 25.4 28.8 Government 10.0 9.8 10.0 9.7 8.4 7.7
NBK 9.2 8.9 9.0 8.7 7.6 7.3 Government-influenced 28.0 27.4 25.5 22.3 23.6 21.3
KCB 16.5 15.8 12.8 10.7 11.5 9.9 coop 5.8 6.3 8.3 7.7 9.2 8.7
Source: Data for private credit/GDP are from the World Bank financial structure database. Data for real GDP growth and nominal GDP are from World Development Indicators. Data for all other calculations are from the Central Bank o f Kenya.
Recent declines in interest rate spreads indicate that banks have become more efficient, resulting in more affordable interest rates for borrowers. Private domestic and foreign banks were responsible for those improvements, while enhanced efficiency and governance o f state-owned banks could provide further gains. Mirror ing the Investment Climate Assessment results described in the body o f the report, which showed that firm owners are less apt to cite the availability and costs o f finance as a severe obstacle to doing business in 2007 than they were in 2003, the difference between lending and deposit rates has declined (figure C-2). Regression analysis o f the determinants o f Kenyan spreads strongly indicates that the decline was attributable to reductions in overhead costs and improvements in portfolio quality on the part o f private banks.lo5 High overhead costs and poor portfolio quality at state banks represent a large opportunity cost, as the deposits and other liabilities o f those banks could be intermediated at lower costs and channeled to investments that are more productive.
illiquidity-problems that the government failed to address by implementing a comprehensive scheme for restructuring and privatizing both banks.
See background report, “Financial Sector Efficiency and Outreach in Kenya.” 105
93

Figure C-2: Development of Banking Sector Interest Rate Spreads, 2000-6
12
s a
4
0 2000 2001 2002 2003 2004 2005 2006
year
Source: Central Bank o f Kenya.
Reductions in interest spreads coincided with a shift from holding government securities and lending to manufacturing toward consumer lending, but only for foreign and private domestic banks, including consumer-focused new entrants such as Equity Bank. The sharp decline in spreads since 2003 owes much to improvements in Kenya’s fiscal situation and general macroeconomic management, which led in turn to increasing competition among banks as a result o f substantial declines in both the volume o f government securities issued and the interest rates paid. As government securities became a less attractive investment option for banks, they were forced to seek lending opportunities, and the competition between banks for those lending opportunities coincided with lower spreads.
Private and state banks did not respond to these pressures in the same way. Private domestic banks roughly doubled their holdings o f government securities f rom 2000 to 2003 as the supply o f these instruments increased. Foreign banks maintained much higher shares than other banks throughout the period, reaching their highest average share in 2003 (50 percent o f earning assets). Subsequently, both groups o f banks shifted out o f these holdings as the issuance o f government securities fell as a percentage o f GDP after 2003 (Figure C-3). By contrast, government banks decreased their holdings o f government securities when the supply and yield on these instruments were highest (from 2000 to 2002), and then increased their holdings as the supply and yield decreased (from 2003 on). This pattern provides another indication that government banks were not responsible for the reduction in interest rate spread.
94

Figure C-3: Government Securities to Earning Assets, 2000-5
50
40 $ 30
20
10 0
private government.-influenced
2000 2001 2002 2003 2004 2005
years
Source: Central Bank o f Kenya.
Since 2003, in addition to improved macroeconomic management, the government also made some efforts to restructure and provide new incentives and management for banks in which the government retained an ownership stake: KCB received a capital injection in 2004 by means o f a rights issue combined with resolution o f certain state-guaranteed nonperforming loans. Industrial Development Bank was delicensed in 2005. Efforts were also made to restructure Co-operative Bank. The government provided some financial support to the bank, although the bank’s ownership structure-dispersed across the savings co-operative movement-weakens i t s ability both to strengthen i t s governance and i t s potential for serving i t s target client base in the rural communities by limiting i t s ability to raise capital to the resources available f rom within the co- operative movement. Lastly, the C B K intervened to restrict NBK’s lending and forced it to adopt an internal restructuring program while i t s liquidity was at least partially restored by means o f government purchases o f nonperforming loans.
Despite the above-described positive steps taken toward improving the condition o f the state influenced banks, critical steps were not taken to complete the restructuring process. In KCB’s case, the government did not take advantage o f positive market conditions to dispose o f i t s remaining 26 percent stake in the bank, and as a result retains effective control, posing the threat that K C B could be subject to political abuse in the future as it was in the past. In NBK’s case, the government (in 2007) proceeded to recapitalize the bank without f irst taking steps to transform i t s governance and thus leaving it also exposed to abuse. Lastly, n o action was taken to dispose o f the state’s stake in Consolidated, which continues to be financially weak.
Access to Financial Services
In 2006, the Financial Sector Development Trust Kenya completed the Financial Access Survey (FAS) which provides an up-to-date and comprehensive survey o f access to financial services in Kenyal06. The F A S confirms four previously-assumed conclusions about access to financial services: (a) a large proportion o f the Kenyan population has n o access to financial services, whether formal or informal; (b) there i s a general tendency for access to a given service to decline as one goes f i om urban, to rural, to semi-arid and then arid districts; (c) the percentage o f the population that uses n o financial services i s much higher in arid districts than in others; and (d)
The FAS dataset contains responses f rom 4,070 adults, 450 f rom urban districts, 2,651 f r o m rural districts, 577 f rom semi-arid districts, and 392 f r om arid districts. These data are the basis for most o f the analysis in th is section o f the document.
106
95

although the percentage o f the population that i s served i s similar in urban, rural, and semi-arid districts, the mix o f those services i s different. In urban areas, respondents rely more heavily on services f rom banks and semi-formal sources (SACCOs and MFIs) while in rural and semi-arid districts, there i s greater reliance o n services provided via informal groups.
The F A S data reveals that the costs o f an account and the qualifications necessary to obtain one are the second and third most popular reasons for being unbanked (table C-2).Io7 Roughly one- quarter to ha l f o f the respondents mentioned costs or qualifications as being relevant, which suggests that there are supply side constraints that impede access. Cross-country evidence for leading banks confirms that minimum balances, annual account fees, and the number o f documents required to obtain an account are high by developing country standards.”’ Wireless delivery mechanisms for basic payments and savings services could help consumers avoid these costs, and put competitive pressure on banks. I f unbanked current cell phone users availed themselves o f these services, the level o f formal financial inclusion in Kenya would increase from i t s current 19 percent to almost 33 percent o f adult Kenyans. Whi le regulating these new providers and protecting their depositors would pose challenges, the potential for increasing the supply o f available savings and thus boosting GDP growth rates would appear to be substantial.
Table C- 2: Reasons Why Respondents Are Not Banked, By District Type
Urban Rural other Semi-arid Arid Nohadequate income 100.0 99.0 100.0 100.0
Top: No money to save 57.1 56.7 58.5 69.0
Costs of account too high Top: Cannot afford account
Prefer other options Top: Prefer dealing in cash
Lack of qualifications Top: Y o u do not have a j o b
Negative perceptions of banks Top: Don’t t rust banks
Inconvenience Top: Bank i s too far away
61.6 43.1 48.6 40.7 29.8 22.0 23.0 19.9
30.1 15.4 22.4 17.8 14.5 5.9 11.5 9.7
30.1 26.5 36.7 24.9 20.1 16.3 21.0 11.8
5.2 1.3 2.4 2.6 4.2 0.9 2.4 2.6
4.8 4.0 9.9 9.2 3.1 2.8 8.3 8.1
Other 6.6 2.7 2.2 2.4 Source: Sta f f calculations based on Financial Access Survey 2006, Financial Sector Development Trust, Kenya. Note: Sample size =3,493. The table reports the total number o f reasons that respondents checked in the survey divided by the number o f respondents in a given category. Because multiple reasons could be checked, the number o f affirmative responses can
lo’ The data are taken f rom the 2006 Financial Access Survey undertaken by the Financial Sector Development Trust Kenya.
See background report, “Financial Sector Efficiency and Outreach in Kenya.” The data o n the costs and procedures for providing financial services for the leading banks in developing countries are f rom Beck, Demirguc-Kunt, and Martinez Peria (2007).
108
96

exceed the number o f respondents, and thus the ratio reported in the table could conceivably exceed 100 percent. In those rare cases, the figure has been set equal to 100 percent. T h e most popular reason in each category i s also reported, along with the number o f times i t was checked divided by the number o f respondents in that category. Th is figure is not subject to the same double-counting problems as the ratio reported for the full category. It therefore indicates the lower bound on the share o f individuals in an income/district type group that report a given category as a reason for not having a bank account. Under “Nohnadequate income” the reasons were: (1) you don’t have money to save, (2) you don’t have a regular income, and (3) you earn too little to make i t worthwhile. For “Costs o f an account too high,” the reasons were: (1) you don’t want to pay service fees, (2) you have to keep a minimum balance in the account, (3) i t ’s expensive to have a bank account, (4) you can’t afford to. For “Prefer other options,” the reasons were: (1) you prefer dealing in cash, (2) you prefer to use other options rather than a bank, (3) i t ’ s cheaper to use someone else’s account, (4) you use someone else’s bank account, (5) you don’t need a bank account. For “Lack o f qualifications,” the reasons were: (1) you don’t have a job, (2) you don’t have a national ID, (3) you can’t read or write, (4) you don’t have a referee, (5) you don’t qualify to open an account, (6) you are too young to have a bank account, (7) you don’t h o w how to open an account, (8) they can’t speak your language. For “Negative perceptions o f banks,” the reasons were: (1) you don’t trust banks, (2) someone you h o w has lost money kept at a bank. For “Inconvenience,” the reasons were: (1) the bank is too far from where you live, (2) it takes too long to get your money.
Access to Credit
A large proportion o f the Kenyan population-regardless o f where they live-has n o access to any type o f financial services. However, when access to credit i s considered, the picture i s even bleaker. Only wage earners have any significant (and s t i l l extremely limited) access to formal sources o f credit and although there i s evidence o f declining access to credit as one goes from urban to arid areas, i t i s the l o w levels o f credit for any district type that i s most significant. The data are thus consistent with the notion that formal providers o f credit find it easier to deal with individuals that earn a regular wage, and this appears to be because wage earners are seen as posing fewer risks, are more aware o f opportunities to obtain credit, or are somehow better targeted by banks. Together, the data indicates that even for the proportion o f the population that does have access to financial services in some form, these services are limited to savings and payments products.
The Effect of Bank Branching on Access to Finance
Over 90 percent o f the Kenya’s branches are in urban and rural districts (Figure C-4). Branches in semi-arid districts account for 4.7 percent o f the national total; those in arid districts account for 2.8 percent. Even if the definition o f branch i s expanded to include al l types o f access points- agencies, pay-points, mobile units, satellite branches, and sub-branches-this picture i s essentially unchanged (93 percent in urban and rural areas, 7 percent in arid and semi-arid areas). The distribution o f also reflects a difference in geographical emphasis between private and government-owned or influenced banks.
97

Figure C-4: Number of Bank Branches by Location'og 'lo
250
200
150 e
100
* 50
0
u) Q) r
0
Urban Rural Other Semi-Arid Arid
E2 Top 10 Foreign non-top 10 Foreign
Top 10 Private Domestic €I non-top10 Private Domestic
The government and government-influenced banks represent about a fifth o f total branches in urban districts, over ha l f in rural districts, three-quarters in semi-arid districts, and almost ninety percent in arid districts. This suggests that government influence has a positive impact in promoting access to financial services but, in the absence o f an analysis to assess the costs o f government-influenced banks' poor lending practices, it should not be concluded that government ownership i s either the best or the cheapest way in which to maintain rural access to the banking system. A detailed analysis i s l ikely to show that a more effective-and cheaper-approach may be to provide subsidies to private sector banks to increase their rural presence using lower-cost mechanisms (such as mobile offices and new technologies such as mobile payments) and reinforce this by promoting the development and regulation o f nonbanking institutions such as SACCOs and MFIs.
The important role o f the top 10 banks (ranked by assets) in providing access to banking services i s also clearly reflected in Figure (2-4. A member o f the Top 10 i s the main bank for 75 percent o f the banked respondents in urban areas, 67 percent in rural and semi-arid areas, and 55 percent in arid areas. The PostBank provides most o f the remaining access, playing an increasingly important role as one goes from urban to arid districts. Non-Top 10 banks play a much more marginal role, and then only in urban and rural districts. Although the branching figures indicate that non-top 10 banks account for 45 percent o f urban branches and 35 percent o f rural branches, those branches provide services to far fewer people than do the branches o f the Top 10 banks.
F ive branches owned by private domestic banks were not identif ied as belonging to a district type. In parentheses are the shares o f total points o f presence pertaining to each bank type/district type pair.
Foreign banks in the Top 10 include Barclays, Standard Chartered, and Stanbic. The domestic banks in the Top 10 are Equity, KREP, Baroda, and Commercial Bank o f Africa. Cooperative, KCB, and NBK are the government-owned banks that round out the Top 10.
109
110
98

D. INTEREST RATES AND COUNTRY RISK PREMIUM
In 2006, S&P rated Kenya’s capacity to repay long-term sovereign obligations denominated in foreign currency as B+, which indicates that the sovereign has the capacity to meet i t s financial commitment, but adverse business, financial, or economic conditions could impair i t s capacity. Kenya’s external debt i s mainly on concessional terms and it has not had access to international capital markets; hence, a time series on external market borrowing costs i s not available. However, the S&P rating implies that i t s obligations today would be substantially below investment grade. Countries that received the same S&P rating o f B+ in 2006 and are tracked by the EMBI+ index exhibited a spread o f over 200 basis points (bps) at end-2006 over U.S. Treasuries, about 50 bps above the overall EMBI+ spread at end-2006.
What can be inferred about sovereign risk from Kenya’s domestic borrowing costs? Figure D-1 shows the annualized yield on Kenya’s 91-day T-bill rate. There i s a clear declining trend after the spike associated with the Goldenberg scandal, with interest rates continuing to fall and going below 10 percent starting in 2002, with lows in 2003 and 2004. Since Kenya has n o exchange controls, the following formal construct can help shed light on risks:
i, = i , + i + D R P + S R P ,
where i, i s the nominal interest rate on Kenyan government T-bills (denominated in Kenyan shillings), i, i s the nominal interest rate on U.S. government T-bills (denominated in U.S. dollars), and i i s the target devaluation rate for the K Sh/US$ exchange rate. This i s standard interest parity. Risk could arise on two counts. Suppose the market believes the eventual depreciation rate will tum out higher than that (explicitly or implicitly) targeted by the CBK. I t will then demand a devaluation risk premium, DRP, to compensate for this. Suppose it also believes-given Kenya’s image o f political instability and weak governance-that the government could default on i t s debt. I t would then demand a sovereign or default r i sk premium, SRP, to compensate for this. The SRP could be regarded as a function o f Kenya’s credit and inflation history, i t s political risk and the quality o f i t s fiscal and financial institutions.
99

Figure D-1: Kenya 91-day T-bill Rate, 1991-2006
80
70
60
20
10
0
-10
year, month
Table D-1 presents data organized around the preceding equation. It shows that Kenyan T-bill rates have fallen along with US. T-bill rates, suggesting that the favorable global interest rate climate has filtered through to Kenya; this i s particularly evident in 2003 and 2004. In addition, changes in monetary pol icy may have contributed to the very l o w interest rates in 2003 and 2004. The cash reserve ratio was lowered from 10 percent (on 14-day average) and 8 percent daily average in October 2000 to and 6 percent daily in July 2003. Some o f these moves coincided with the maturing o f a large tranche o f rep0 operations, boosting short-run liquidity and lowering domestic interest rates. O f course, since Kenya has an open capital account, this money could leave and be invested in US. or UK T-bills; this would put upward pressure on interest rates on Kenyan T-bills. Alternatively, banks and other investors may be hampered from investing overseas because o f prudential restrictions; however, there i s l i tt le evidence that such restrictions are binding. Investors have the option o f investing in capital market or real estate if returns on T- bills are considered too low, but capital markets are not wel l developed and they themselves have been showing signs o f asset overpricing. One additional factor may be contributing to l o w interest rates: Kenya as a regional safe haven for financial assets. Such investors are not l ikely to be fussy about the rate o f return.
Table D- 1: Interest Rate Decomposition, 1991-2006 1999 2000 2001 2002 2003 2004 2005 2006
91-day Kenya T-bill rate 13.3 12.1 12.7 6.9 3.7 3 8.4 7.4 U.S T-bill rate 4.7 5.8 3.5 1.6 1 1.4 3.2 4.6
Difference 8.6 6.2 9.3 7.3 2.7 1.6 5.3 2.9
EMBl Africa (in basis points) 529 313.6 216.7 161.8 123.8 Nigeria 1338 2037 1426 2276 732 667 523 481 South Africa 236 141 95 85 81
Actual KSh./US$ depreciation (end of period) 17.8 7 0.7 -1.9 -1.2 1.6 -6.4 2.1
EMBl+spread (in basis points) 824 756 731 765 418 356 245 169 Source: Central Bank of Kenya; International Financial Statistics: JP Morgan; and staff estimates
100

E. GROWTH SIMULATIONS
The development policies o f the Government o f Kenya are dnven by the objective o f achieving Vis ion 2030, under which the key objective i s to accelerate GDP growth to an annual rate o f 10 percent. This i s a very ambitious objective considering that, during the last 25 years, annual real GDP growth was merely 3 percent.
This appendix explores what steps may be required for Kenya to achieve this objective. The work takes a macro perspective and i s meant to complement sector- and micro-oriented policy analysis. Methodologically, i t combines simulations o f alternative scenarios for Kenya’s economy for the 2006-30 period with a discussion o f the implications o f the results for policy makers. The simulations rely on a macro-oriented Kenyan version o f M A M S (Maquette for MDG Simulations), a tool developed at the Wor ld Bank for analysis o f development strategies.
The simulations investigate the potential roles o f l ikely driving forces behind the required growth acceleration. More specifically, the simulations f i rs t introduce, one by one, increases in national savings, foreign direct investment (FDI), and foreign aid. Subsequently, the analysis simulates the effect o f combining changes in these growth determinants with increases in TFP (total factor productivity) growth. The advantage o f using a model l ike M A M S for this type o f analysis i s that it, in a consistent and comprehensive manner, simulates the combined impact o f these changes on major economic indicators including GDP, trade, private and government consumption, and investment, considering the presence o f constraints at the macro level (represented by fiscal, foreign exchange, and savings-investment balances) and in factor markets and using standard assumptions about the behavior o f producers, consumers, and government. Results o f the simulations are summarized in Table E- 1 and Table E-2.
Under the BASE scenario, which i s a business-as-usual scenario that extrapolates on the recent pick-up in economic performance, GDP and most other aggregate indicators grow at around 5 percent per year, out o f which 3.9 percent i s due to increased factor employment and 1.1 percent i s due to increased TFP. There are n o major changes in the GDP shares o f the national account aggregates or o f major spending and receipt items in the government budget and the balance o f payments.
High national savings rates are needed to sustain rapid GDP growth and high investment rates. The scenario BASE+GNS i s identical to B A S E except for a 50 percent increase in the gross national savings (GNS) rate f rom 2007 to 2017, f rom 15.7 percent to 23.5 percent, through an increase in private savings rates. After 2017, the GNS rate stays at 23.5 percent. For the 2007-30 period, this change leads to a strong increase in private investment, increasing growth in GDP by 1.6 percent, with a particularly strong increase for private investment. Due to the savings increase, private consumption growth init ially slows down compared to other scenarios.
FDI may increase (and decrease) more rapidly than more slow-moving domestic financing sources and may lead to more rapid technological progress than investment by domestic f i rms. Under the scenario BASE+FDI, FDI gradually increases from a very l o w level in 2006 to 4 percent o f GDP in 2017, a GDP share that i s retained, with a slight decline, up to 2030. The scenario does not consider possible direct technological gains f rom FDI. The simulated effects are quite similar to those o f the simulated GNS increase (but roughly ha l f as large, given the smaller magnitude o f the shock): a strong increase in private investment growth i s coupled with a smaller
101

growth increase for GDP and other national account aggregates.'" Initially, private consumption and welfare fares better since there i s n o need to switch private income to savings. However, over time, growth in profit repatriation forces more export growth while reducing import growth (given balance o f payments constraints a lower trade deficit i s required), dampening the long-run positive impact on absorption (private and government consumption and investment) and welfare.
Foreign aid relaxes the budget constraint o f the government, permitting increases in domestic consumption and investment. Under the scenario BASE+AID, aid (the part represented by current transfers f rom the rest o f the wor ld to the government) i s increased gradually f rom a l o w level to around 4 percent o f GDP in 2017: that is, a magnitude that i s similar to the FDI level under BASE+FDI. It i s kept close to this share up, to 2030. The extra aid i s used to reduce taxes. Government spending will increase in so far as GDP grows more rapidly."* Households allocate their additional incomes to savings that feed into domestic private investment. The growth effects are very similar to those o f BASE+FDI, but the welfare effects are more positive since grant aid does not lead to any resource outflow corresponding to profit repatriation. It also avoids the init ial dampening o f private consumption growth that i s required under BASE+GNS.
The preceding scenarios have relaxed domestic resource constraints, permitting more savings, investments, and growth. However, they have only had smaller, indirect effects o n TFP growth, the acceleration o f which has to be at the core o f Kenya's Vis ion 2030 strategy. More rapid TFP growth would be l ikely in the context o f rapid increases in investment (including FDI) and private savings, supported by increased aid. Hence, the scenario V30-GR4DUAL combines the changes in the preceding scenarios (in GNS, FDI, and aid) with an increase in TFP growth sufficient to gradually raise GDP growth to 10 percent by 2017, a rate that i s maintained up to 2030. The results indicate that this growth acceleration requires annual TFP growth at 2.6 percent, a rate that i s far in excess o f Kenya's recent record (but actually slightly below the rate achieved during the f i rs t 13 years o f independence) (Ndulu and others 2007, table 3.1, p, 61). Under this scenario, the growth rates for the full period 2006-30 are around 9 percent for GDP, 12 percent for private investment, and 8 to 11 percent for other national account aggregates. In 2030, private consumption per capita i s 270 percent higher than in 2006: that is, not far f rom tripled.
The final scenario, V30-FAST, i s similar to V30-GRADUAL except that the changes now are introduced more quickly, during the period 2007-1 3, after which GDP growth stays at 10 percent. Annual growth in TFP and most national account aggregates increase by an additional 0.2-0.5 percent (compared to V3O-GRAUAL). In the final year, private per capita consumption i s 310 percent above the level in 2006.
In terms o f policy, what can be done to bring about such scenarios or, more broadly, to drastically accelerate growth in Kenya? Accumulated evidence suggests that the factors that may initiate the strived-for acceleration are increases in investment, including FDI accompanied by technological improvements. In the short to medium run, i t i s possible to improve governance and infrastructure, giving a needed boost to the investment climate and raising TFP (especially via
'I' The relative magnitudes o f the shocks reflect what was considered plausible. Cross-country data indicate that the bulk o f investment is typically financed from domestic sources. For high-investment countries, i t i s rare that foreign savings (out o f which FDI i s a part) finances more then 20 percent o f investment (Rodrik
'I2 The underlying assumption i s that decisions about private vs. government shares in the economy do not depend on the size o f foreign aid. However, if GDP growth increases or decreases, then government consumption and investment will also increase/decrease sufficiently to maintain unchanged GDP shares.
2000).
102

reduced transactions costs). In the long run, human capital improvements are an essential ingredient o f a good investment climate supportive o f rapid TFP growth. Increases in private savings rates are more l ikely to follow than lead, given that they respond to income growth and changes in per capita income levels and dependency ratios that change more slowly. Further improvements in Kenya’s financial sector may provide better incentives to savers and more efficiently channel their funds to private investors. Kenya can do less to influence aid inflows, especially in grant form. However, aid can play a critical role, especially in the beginning o f the growth acceleration. Improvements in governance and the investment climate, combined with init ial signs o f success, should convince donors that additional a id would be put to good use, with long-lasting positive effects on welfare and poverty reduction.
Table E-1: Real Macro Indicators by Simulation (% annual growth from 2006-2030)
base base+g base+ base+ v30- ~ 3 0 - ns fdi aid gradual fast
Absorption 5 .O 6.5 5.4 5.7 8.8 9.2 Consumption-private 4.8 6.0 5.0 5.5 8.1 8.5
Consumption-private per capita 2.5 3.6 2.6 3.1 5.6 6.0 Consumption-government 5.4 6.4 5.9 5.8 7.6 7.8 Fixed investment-private 4.6 8.3 5.9 5.9 11.8 12.3 Fixed investment-government 6.5 8.0 7.2 7.2 10.5 10.8 Exports 5.0 7.5 6.5 5.5 10.6 11.1 Imports 5.0 7.0 5.6 5.8 9.7 10.2 GDP at market prices 5.0 6.6 5.6 5.6 9.0 9.4 GDP at factor cost 5.0 6.6 5.6 5.6 8.9 9.4 Total factor employment 3.9 5.3 4.5 4.4 6.4 6.6 Total factor productivity (TFP) 1.1 1.3 1.2 1.1 2.6 2.7 ICORa 3.8 4.0 3.8 3.8 3.3 3.3 Real exchange rate -0.1 0.0 0.2 -0.2 -0.4 -0.4 Source: Staff calculations. a. Gross ICOR (Incremental Capital-Output Ratio; not adjusted for depreciation) for 2007-30.
103

Table E-2: Macro Indicators in 2006 and by Simulation in 2030 (% of nominal GDP)
Indicator
Absorption Consumption - private Consumption - government Investment - private Investment - government Exports Imports GDP at market prices Ne t indirect taxes GDP at factor cost Foreign savings Gross national savings (GNS)a
Private savings Government savings
Gross domestic savings (GDS)a Foreign government debt Domestic government debt Source: Staff calculations.
2006
108.4 73.9 16.3 14.1 4.1
29.1 -37.5 100.0
9.6 90.4 2.5
15.7 14.3 1.4 9.8
23.1 19.9
Final year base base+g base+ base+ v30- v30-fast
ns fdi aid gradual 108.2 105.7 101.9 110.5 103.1 102.5 72.1 63.5 63.8 72.6 57.7 57.2 17.2 17.1 17.1 17.2 17.1 17.1 13.0 19.8 15.2 15.0 23.3 23.3 5.8 5.3 5.8 5.8 5.0 4.9
29.2 35.1 36.5 28.4 38.6 39.0 -37.3 -40.9 -38.5 -39.0 -41.7 -41.5 100.0 100.0 100.0 100.0 100.0 100.0
9.8 10.2 10.4 8.0 9.5 9.7 90.2 89.8 89.6 92.0 90.5 90.3 2.3 1.6 5.8 2.0 4.8 4.6
16.5 23.6 15.3 18.7 23.6 23.6 14.0 20.5 12.4 15.8 19.8 19.8 2.5 3.1 2.9 2.9 3.7 3.7
10.6 19.4 19.1 10.2 25.2 25.7 23.8 16.5 21.4 20.6 9.2 8.3 20.2 13.5 17.2 17.4 7.8 7.1
a. GDS = GNS - [Net current transfers from Rest o f the World to gov't and non-gov't] + [Net factor income to Rest o f the World] + [Net interest income to Rest o f the World].
104

F. NATIONAL EXPORT STRATEGY IMPLEMENTATION ACTION PLAN 2005-AN EXCERPT
For each o f the sectors, product groupdproducts that have potential to expand exports immediately or in the medium term are identified. Binding constraints or threats holding export expansion were also identified as wel l as the responsive actions.
Livestock and Livestock Products 0
0
Pork, poultry, red meat, raw hides and skins, “wet blue” skins, leather and leather products are identified for export expansion. The factors holding exports o f these products include high costs, high disease preference, lack o f internationally acceptable slaughterhouses, and poor quality hides and skins. The key activities to be undertaken include: - - Supporting investments in slaughterhouses - -
0
Streamlining the Tax Remission for Export Office (TREO)
Monitor the development o f Disease Free Zones Lobbying for removal o f unilateral export barriers imposed by regional trading partners in the East African Community (EAC) and Common Market for Eastern and Southern Africa (COMESA) Training farmers and tanners on quality chain management -
Fish and Fish Products 0
0
0
Exports o f fish fi l let (frozen), fish fi l let (fresh or chilled), and l ive f ish will be emphasized Factors affecting export expansion include; post harvest losses, lack o f equipment for value addition, unexploited resources, and sustainability o f Lake Victoria The key activities that are identified for implementation are to: - Train fishermen in fishing and handling techniques - Develop landing beaches along the shores o f Lake Victoria - Negotiate fish agreement for landing marine fish in Kenya - Conduct study o n fishing sustainability at Lake Victoria - Carry out study to facilitate exploitation o f Lake Turkana
Textiles and Clothing 0
0
The immediate export f low will continue to be garments to USA. The future o f the sector i s threatened by high production costs, l o w productivity, and expiry o f the Agreement o n Textile and Clothing (ATC) in 2005 and third-country sourcing o f fabrics in 2007. The key activities recommended here are to: -
-
-
0
Negotiate with workers, unions, Ministry o f Labor and Human Resources Development (MoLHRD) on modalities to reduce wages Negotiate with Kenya Power and Lighting Company (KPLC) to reduce power tariffs A l l o w containers be opened at factory under Kenya Revenue Authority (KRA) supervision Establish export credit guarantee scheme based on confirmed orders -
105
Horticulture Cut flowers, vegetables, and avocados will be the main export products for immediate and medium term expansion. The issues o f concern to the sector are to increase sector competitiveness through cost reduction and value addition. The key activities that are envisaged include: - - - -
Re-establishing Value Added Tax (VAT) refunds Eliminating unnecessary taxes and levies Rehabilitate roads in growing areas Improving capacity at Kenya Plant Health Inspectorate Service (KEPHIS)
Food and Beverages The products identified for export expansion are edible oils, alcoholic beverages, and dairy products. The constraints affecting expansion include duties, non-compliance with COMESA Rules o f Origin, delays at Customs, and infrastructure. The key activities for implementation in this sector include: - Pressing Common Market for Eastern and Southern Afr ica (COMESA)
partners to apply import rules as per the agreement o f the Rules o f Origin - Northern Corridor road to be upgraded - Improving capacity at Kenya Bureau o f Standards (KEBS)
106

G. TOURISM
Tourism i s Kenya’s main service export. Tourism receipts in 2006 were estimated at K Sh 56 bil l ion. There i s a consensus view that tourism receipts have a significant potential to grow. This view i s partly supported by the fact that Kenya’s tourism industry has grown wel l below average compared to other countries in Sub-Saharan Africa. Vis ion 2030’s target i s for Kenya “to become a top ten long-haul destinations offering a high-end, diverse, and distinctive visitor experience.”
Vision 2030’s focus i s on new investments to bring about rapid growth o f tourism. Apart f rom growth, National Tourism Policy o f 2006 lays down several other goals, such as safeguarding the sustainable conservation o f Kenya’s beaches, wildlife, and culture, and sharing benefits with local communities. The discussion that follows outlines key priorities for policy and institutional reform to complement targeted public and private investments proposed by the Vision. These priorities are stated in general terms at this stage and will be made specific as the ongoing analytic work on tourism in Kenya i s completed (World Bank 2008b).
Priorities for policy and institutional reform
There i s a need to improve coordination between several ministries (about seven) and public agencies involved in tourism-related activities. The main ones are Kenya Wildl i fe Service (KWS), Kenya Tourism Board (KTB), and National Environmental Management Authority (NEMA). In addition, County Councils play a role in some areas such as Masai Mara. Regional development authorities such as the Coast Development Authority also have overlapping mandates. Policy and institutional reform would have the following objectives:
Developing coordination mechanisms among accountable ministries and public agencies. Harmonizing mandates. Legal and regulatory framework may need to be adjusted to support mandates.
0
0
0 Clarifying leadership roles in areas where mandates overlap.
All these objectives are related and they can be met in many different ways. For example, an apex body (such as in Rwanda) could help in improving coordination among accountable bodies. Development o f an overall tourism development strategy could also improve coordination. Adjusting the legal and regulatory framework would be critical to harmonizing mandates and clarifying leadership roles (about 44 Acts legislate o n issues related to tourism).
For the wi ld l i fe tourism subsector, the objectives o f pol icy and institutional reforms would be to engage local communities more in wildlife management and develop a comprehensive land use plan, particularly with a view to balance conservation and productive economic activities.
There i s a need to give priority to improving public services that impact tourism directly. This would include rehabilitating key infrastructure that supports tourism and redoubling efforts to reduce crime in tourism hotspots such as Nairobi, Mombasa, Malindi, and roads to and from national parks.
The government will also need to assess the impact o f tax policy on tourism activities. A value chain analysis o f the tourism sector in Kenya reveals that about 45 to 55 percent o f expenditure by tourists in the case o f private conservancy i s captured through various public sector charges (Table G-l), These charges appear high, particularly in view o f the poor condition and l o w quality o f public tourism infrastructure and public services. Policy options could explore giving
107

tax breaks to private operators based on proven investment in human and capital assets. The latter has been a very effective tool in countries l ike Costa Rica, Dominican Republic, and Malaysia.
Table G-1: Public Sector Share of Tourism Revenues from a Community-owned Wildlife Resource Conservancy in Partnership with a Private Tour Operator
Public sector taxes, levies and fees $US amount Percent of total VISA 50.00 3.9 Airport tax 20.00 1.6
Tadsurcharge (flight) 38.00 3.0
Park fee (visitor) 101.31 8.0 Part fee (vehicles) 22.86 1.8
VAT 342.02 27.0 Service tax 203.00 16.0 Training Levy 40.60 3.2 Fuel levy 3.84 0.3
Airport charges (KAA) 0.0
Corporate income tax 429.44 33.9
Speed governance 0.01 0.0 Drivedguide (PSV) 0.01 0.0 Guide license (Ministry o f Tourism 0.01 0.0 Pay as you go (Ministry o f Finance) 2.97 0.2 NSSF/NHIF 0.65 0.1 Ministry o f Tourism license 7.05 0.6 Local council license 2.1 1 0.2 Local council-environmental charges 2.97 0.2 Informal charges 0.20 0.0 Total 1,267.05 100.0
Total expenditure 51.2 Local expenditure 51.2 Source: “Integrated Value Chain Analysis o f the Tourism Sector in Kenya,” prepared by Global Development Solutions, LLC for World Bank (2008b).
108

REFERENCES Aka, Emmanuel B., Bernardin Akitoby, Dhaneshwar Ghura, and Amor Tahari. 2004. “Sources o f
Growth in Sub-Saharan Africa,” IMF Working Paper 04/176, International Monetary Fund, Washington, DC.
Alesina, Alberto, Arnaud Devleeschauwer, Will iam Easterly, Sergio Kurlat, and Romain Wacziarg. 2003. “Fractionalization.” Journal of Economic Growth 8 (2): 155-94.
Appleton, Simon, Arne Bigsten, and Damiano Manda. 1999. “Educational Expansion and Economic Decline: Returns to Education in Kenya, 1978-95.” Working Paper 90, Centre for the Study o f African Economies.
Barro, Robert, and Jong-Wha Lee. 2000. “International Data on Educational Attainment: Updates and Implications.” Working Paper 42, Center for International Development, Harvard University (April).
Beck, Thorsten and Ross Levine. 2004. “Stock Markets, Banks, and Growth: Panel Evidence.” Journal of Banking and Finance 28: 423-442.
Beck, Thorsten, Asli Demirguc-Kunt, and Maria Soledad Martinez Peria. 2007. “Reaching Out: Access to and Use o f Banking Services Across Countries.” World Bank, Washington, D C .
Berg, Andy, Jonathan D. Ostry, and Jeromin Zettelmeyer. 2006. “What Makes Growth Sustained.” International Monetary Fund (November).
Bigsten, Arne, and Mans Soderdom. 2006. “What Have We Learned from a Decade o f Manufacturing Enterprise Surveys in Africa?” World Bank Research Observer 2 l(2): 241-65.
Bosworth, Barry, and Susan Collins. 2003. “The Empirics o f Growth: An Update.” Brookings Papers on Economic Activity, No. 2, 113-206.
Bressie, K., M. Kende, and H. Williams. 2005. “Telecommunications Trade Liberalisation and the WTO.” I n fwThe Journal of Policy, Regulation and Strategy for Telecommunications 7 (2): 3-24.
Cadot, O., and J. Nasir. 2001, “Incentives and Obstacles to Growth: Lessons from Manufacturing Case Studies in Madagascar.” Discussion Paper 17, Regional Program on Enterprise Development, World Bank, Washington, DC.
Collier, Paul, and Stephen A. O‘Connell. 2006. “Opportunities and Choices” Draft chapter for Explaining African Growth Project, African Economic Research Consortium, Nairobi.
109

Duflo, Esther, Pascaline Dupas, and Michael Kremer. 2007. “Peer Effects, Pupil-Teacher Ratio, and Teacher Incentives: Evidence from a Randomized Evaluation in Kenya.” Available at httu:// econ-www.mit.edu/files/2099.
Easterly, William, and Ross Levine. 1997. “Africa’s Growth Tragedy. Policies and Ethnic Divisions.” World Bank, Washington, D C (April).
Fearon, James D. 2003. “Ethnic and Cultural Diversity by Country.” Journal of Economic Growth 8 (2): 195-222.
Gallup, John Luke, Jeffrey Sachs, and Andrew Mellinger. 1999. “Geography and Economic Growth.” In Annual World Bank Conference on Development Economics, eds. Boris Pleskovic and Joseph E. Stiglitz. Washington, DC: World Bank.
Glewwe, Paul, Nauman Ilias, and Michael Kremer. 2004. “Teacher Incentives.” Processed.
Glewwe, Paul, Michael Kremer, Sylvie Moulin, and R. Nyamuru. 1999. “Textbooks and Test Scores, Evidence from a Randomized Evaluation in Kenya.” Processed.
GOK (Government o f Kenya). 1986. “Sessional Paper Number 1 o f 1986 on Economic Management for Renewed Growth.” Ministry o f Finance.
-------- . 2003. “Kenya Road Inventory and Condition Survey Study.” Ministry o f Roads and Public Works, Nairobi.
____-___ . 2005a. “National Export Strategy Implementation Action Plan 2005-8.” Ministry o f Trade and Industry, Nairobi.
____-_-_ . 2005b. “National Health Services Strategic Plan 11, 2005-10.” Ministry o f Health, Nairobi.
- - - - - - - - . 2006. “Sessional Paper: The Development and Management o f the Roads Sector for Sustainable Economic Growth.” Ministry o f Roads and Public Works, Nairobi.
-------- . 2007a. “Kenya Integrated Household Budget Survey (KIHBS) 2005/06, Vol. I Basic Report.” Kenya National Bureau o f Statistics, Nairobi.
-------- . 2007b. “Vision 2030.” National Economic and Social Council, Office o f the President, Nairobi.
- - - - - - - - . 2007c. “National Industrial Policy,” drafl interim report. Ministry o f Trade and Industry, Nairobi.
_----___ , Various years. “Economic Survey.” Kenya National Bureau o f Statistics, Nairobi.
Hausmann, Ricardo, and Bailey Klinger. 2006. “Structural Transformation and Patterns o f Comparative Advantage in the Product Space.” Working Paper 128, Center for International Development, Harvard University (August).
Hausmann, Ricardo, Jason Hwang, and Dani Rodrik. 2005. “What You Export Matters.” Working Paper 11905, National Bureau o f Economic Research (December).
110

Hausmann, Ricardo, Lant Pritchett, and Dani Rodrik. 2004. “Growth Accelerations.” Working Paper 10566, John F. Kennedy School o f Government, Harvard University (June).
Hausmann, Ricardo, Dani Rodrik, and Andres Velasco. 2005. “Growth Diagnostics.” John F. Kennedy School o f Government, Harvard University (March).
Helu, Samuel. 2007. “Maritime Services in Kenya.” Paper presented at the Ministry o f Trade and Industry, GoK, and International Lawyers and Economists against Poverty Trade in Services Workshop, Nairobi, , March 26-27.
Herrera, Santiago, and Gaobo Pang. 2005. “Efficiency o f Public Spending in Developing Countries: An Efficiency Frontier Approach”. Policy Research Working Paper No. 3645, World Bank, Washington, DC.
ICA. 2007. See World Bank (2007h).
IMF (International Monetary Fund). 2007. “Kenya-Staff Report for the 2006 Article IV Consultation, Second Review under the PRGF Arrangement,” Appendix 2 (April). Washington, DC.
IP3 (Institute for Public Private Partnerships). 2007. “Policy, Legal, and Institutional Framework for PPPs in Kenya.” Consultant report prepared for the World Bank, Washington DC.
Johnson, Simon, Jonathan D. Ostry, and Arvind Subramanian. 2007. “The Prospects for IMF Working Paper Sustained Growth in Afkica: Benchmarking the Constraints.”
wP/07/52, International Monetary Fund, Washington, D C (March).
Kenya Ports Authority. 2005. “Dwell Time Study” (December).
Ketkar, Suhas L., and Dilip Ratha. 2007. “Development Finance via Diaspora Bonds, Track Record and Potential.” Policy Research Working Paper 43 1 1, World Bank, Washington, D C (August).
Kiringai, Jane, James Thurlow, and Bernadette Wanjala. 2006. “Beyond Recovery: An Equitable Growth Strategy for Kenya.” Processed (October).
Klinger, Bailey, and Daniel Lederman. 2004. “Discovery and Development: An Empirical Exploration o f New Products.” Policy Research Working Paper 3450, World Bank, Washington, DC.
Kumar, Praveen, and Leonard0 Garrido. 2006. “Labor Market Outcomes in the Nineties.” Note prepared for “Jobs in Kenya,” GOK-Bank ESW Task, World Bank, Washington, DC.
Lofgren, Hans, and Praveen Kumar. 2007. “The Challenges o f Achieving Kenya’s Vision 2030: A Macro Perspective.” In Perspectives in Poverty Reduction and Human Development: Analysis of Alternative Strategies with an Economy-wide Framework, eds. Carolina Diaz- Bonilla and Hans Lofgren. Forthcoming.
Manda, Damiano. 2004. “Globalization and the Labor Market in Kenya.” Discussion Paper 3 1, Kenya Institute for Public Policy Research and Analysis, Nairobi.
111

Manda, Damiano, German0 Mwabu, and Mwangi Kimenyi. 2004. “Human Capital Externalities and Private Returns to Education in Kenya,” Working Paper 2004-08, Department o f Economics, University o f Connecticut.
Ndulu, Benno, J., with Lopamudra Chakraborti, Lebohang Lijane, Vijaya Ramachandran, and Jerome Wolgin. 2007. Challenges of African Growth, Opportunities, Constraints, and Strategic Directions. Washington DC: World Bank.
Nehru, Vikram and Ashok Dhareshwar. 1995. “A New Database on Physical Capital Stock: Sources, Methodology and Results.” World Bank, Washington DC.
Pollin, Robert, Mwangi wa Githinji, and James Heintz. 2007. “An Employment-Targeted Economic Program for Kenya.” UNDP report.
Ratha, Dilip, Sanket Mohapatra, and Sonia Plaza. 2007. “Beyond Aid: New Sources and Innovative Mechanisms for Financing Development in Sub-Saharan Africa.” Discussion draft (November l), World Bank, Washington DC.
Rodrik, Dani. 2000. “Saving Transitions.” World Bank Economic Review 14 (3): 48 1-5 17
- - - - - - - - , 2007. “The Real Exchange Rate and Economic Growth: Theory and Evidence.” John F. Kennedy School o f Government, Harvard University (August).
-_______ .2008. “Second-Debt Institutions.” http://rodrik.typepod-com.
Rodrik, Dani, h i n d Subramanian, and Francesco Trebbi. 2002. “Institutions Rule: The Primacy o f Institutions over Geography and Integration in Economic Development.” Harvard University and International Monetary Fund (October).
Sachs, Jeffrey, and Andrew M. Warner. 1997. “Sources o f Slow Growth in African Economies.” Journal ofAfrican Economies 6 (3): 335-76.
TMG (Telecommunications Management Group). 2007. “Trade in Information and Opportunities for East and Southern Africa, Kenya Case Communication Services:
Study.” Consultant report for the World Bank.
Wacziarg, Romain T., and Karen H. Welch. 2003. “Trade Liberalization and Growth: New Evidence.” Working Paper W 10 152, National Bureau o f Economic Research.
World Bank. 2004. “Kenya Investment Climate Assessment: Enhancing the Competitiveness o f Kenya’s Manufacturing Sector: The Role o f the Investment Climate” (November).
_ _ _ _ _ _ _ _ . 2007a. “Kenya Unleashing the Potential for Trade and Growth.” Report No. 37688-KE.
-_______ .2007b. “Africa’s Silk Road: China and India’s New Economic Frontier.”
_ _ _ _ _ _ _ _ . 2007c. “An Emerging Picture o f Jobs in Kenya in the 1990s: Lessons for Today?” Ongoing (February draft).
____--__ .2007d. “Kenya : An Assessment o f Pensions Reform Directions.” (April draft).
112

_------- .2007e. “Doing Business 2008.” (September).
_--_____ ,2007f. “Transport Costs in Africa: A Review o f the Main International Corridors in the Four Sub-regions.” Ongoing (September draft).
_--_____ .2007g. “Connecting to Compete, Trade Logistics in the Global Economy” (November).
-__-__-_ .2007h. “Kenya Investment Climate Assessment.” Ongoing (December draft).
-------- .2007i. “Africa Regional Communications Infrastructure Program.” www .worldbank.ora/rciu
-------- .2007j, “Uganda Moving Beyond Recovery: Investment and Behaviour Change for Growth.” Country Economic Memorandum, Report No. 39221 -UG.
-------- .2008a. “Kenya Agriculture Policy Review.” Ongoing.
-__-_-_- . 2008b. “Kenya Tourism Study.” Ongoing.
-__--_-_ . Various years. Investment Climate Assessments.
-------- . Various years. World Development Indicators Database.
World Bank and Government o f Kenya. 1997. “Kenya Public Expenditure Review.”
World Economic Forum. 2007. “Global Competitiveness Report 2007-2008.”
113