report no t21-87 - defense technical information center · report no t21-87 the psychological...
TRANSCRIPT

FILE Upi,
AD-A185 015 D
REPORT NO T21-87
THE PSYCHOLOGICAL ATTRIBUTESOF ULTRAMARATHON
RUNNERS AND FACTORSWHICH LIMIT ENDURANCE i
U S ARMY RESEARCH INSTITUTEOF
ENVIRONMENTAL MEDICINENatick, Massachusetts
-ZLECTE --.APRIL 1987 SEP 2 5s1987,
_ _ _ _ S EP 2 5 i18rl,JD
UNITED STATES ARMY
MEDICAL RESEARCH & DEVELOPMENT COMMAND
87 9 23 019 _9
-4

The findings in this report are not to be construed as an official
Department of the Army position, unless so designated by other authorized
documents.
DISPOSITION INSTRUCTIONS
Destroy this report when no longer needed.
Do not return to the originator.
lit

UNCLASSIFIED O'J 'SECURITY CLASSIFICATION OF THIS PAGE jqD04 1950
Form ApprovedREPORT DOCUMENTATION PAGE O16NO 0704-0188I Exp. Date Jun 30. 1986
Ia. REPORT SECURITY CLASSIFICATION lb. RESTRICTIVE MARKINGS
Unclassified2a. SECURITY CLASSIFICATION AUTHORITY 3. DISTRIBUTION/AVAILABILITY OF REPORT
Approved for public release; distribution2b. DECLASSIFICATIONIDOWNGRAOING SCHEDULE is unlimited.
4. PERFORMING ORGANIZATION REPORT NUMBER(S) S. MONITORING ORGANIZATION REPORT NUMBER(S)
T21-87
6a. NAME OF PERFORMING ORGANIZATION 6b. OFFICE SYMBOL 7a. NAME OF MONITORING ORGANIZATIONUS Army Research Institute (If applicable)of Environmental Medicine SGRD-UE-HP6c. ADDRESS (City, State, and ZIP Code) 7b. ADDRESS (City, State, and ZIP Code)
Natick, MA 01760-5007
Sa. NAME OF FUNDING/ SPONSORING 8b. OFFICE SYMBOL 9. PROCUREMENT INSTRUMENT IDENTIFICATION NUMBERORGANIZATION (Of applic(able)
8c. ADDRESS (City, State, and ZIP Code) 10. SOURCE OF FUNDING NUMBERSPROGRAM PROJECT TASK WORK UNITELEMENT NO. NO. 3-61 NO. ACCESSION NO61101A OlA91C 00 DA308410
11. TITLE (Include Security Classification)The Psychological Attributes of Ultramarathon Runners and Factors which Limit Endurance
12. PERSONAL AUTHOR(S)W.J. Tharion, T.M. Rauch, S.R. Strowman, B.L. Shikitt13a. TYPE OF REPORT 13b. TIME COVERED 14. DATE OF REPORT (Year, Month, Day) 1S. PAGE COUNTTechnical Report FROM 46 TO 5/87 April 30, 1987 3616. SUPPLEMENTARY NOTATION
17. COSATI CODES 18. SUBJECT TERMS (Continue on reverse if necessary and identify by block number)FIELD GROUP SUB-GROUP Ultramarathon, Symptomatology, Moods, Psychological
Attributes, Endurance Training
19. ABSTRACT (Continue on reverse if necessary and identify by block number)Psychological and training characteristics of 44 ultramarathoners competing in a50-mile trail race were studied. These psychological and training variables wereused to distinguish differences between survivors and casualties in the race andto predict race time. In addition, mood changes and runners' physical symptoms wereexamined to assess changes from pre to post-race. Results show a mood profile andself-motivation scores similar to other athletic populations. Mood profile changedfrom pre to post race and training pace was found to be a highly significant factorin predicting finish time.
20. DISTRIBUTION/AVAILABILITY OF ABSTRACT 21. ABSTRACT SECURITY CLASSIFICATIONUNCLASSIFIEDfUNLIMITED 0 SAME AS RPT. El DTIC USERS Unclassified
22a. NAME OF RESPONSIBLE INDIVIDUAL 22b. TELEPHONE (Include Area Code) 22c. OFFICE SYMBOL
W.T. Tharlnn =(17 651-4715 SGRD-UE-HPDO FORM 1473. 84 MAR 83 APR edition may be used until exhausted. SECURITY CLASSIFICATION OF THIS PAGE
All other editions are obsolete. UNCLASSIFIED
ACKNOWLEDGEMENT
The authors would like to express their great appreciation to EdDemoney for the organizational help provided in the data collection phase.In addition for providing demographic information obtained from the OldDominion 100-mile 1983-1985 Endurance Runs. A note of thanks is alsoextended to Jack Stoskopf and Ann Simpson for their help in the data entryand manuscript preparation phases of the study respectively.
HH3,

The views, opinions and/or findings contained in this report are thoseof the authors and should not be construed as an official Department of theArmy position, policy or decision, unless so designated by other officialdocument at ion.
Human subjects participated in this study after giving their free andinformed voluntary consent. Investigators adhered to AR 70-25 and USAMRDCRegulation 70-25 on Use of Volunteers in Research.
Ki
:NTISC>\I 4
U .. ~..:r'o......_
Dist
QrAiyt itIt','IIVSPET~O ID2 It +
......, , : : : , .. . ..-
D~st g; " " I
.i 1
Approved for public release ADDistribution unlimited
TECHNICAL REPORT
NO. T21-87
THE PSYCHOLOGICAL ATTRIBUTES OF
ULTRAMARATHON RUNNERS AND FACTORS
WHICH LIMIT ENDURANCE
W. J. Tharion, T.M. Rauch,
S.R. Strowman, B. L. Shukitt
April 1987
US Army Research Institute of Environmental MedicineNatick, Massachusetts 01760-5007
Project Reference Series HP3A161101A91C

TABLE OF CONTENTS
Page
List of Figures iv
List of Tables v
Abstract vi
Introduction 1
Method 4Subj ects LApparatus 5
Procedure 6
Results 7DemographicsPsychological Measures 10
Discussion 20
References 28
~iii

LIST OF FIGURES
Page
Figure 1 Profile of Mood States Pre Run Moods forSurvivors and Casualties 12
Figure 2 Profile of Mood States Post Run Moods forSurvivors and Casualties 13
Figure 3 Profile of Mood States Comparison ofUltramarathoners and Elite Runners 14
Figure 4 Profile of Mood States Comparison ofPre and Post Run Moods 16
Figure 5 Regression of Predicted Race Time vsActual Race Time 21
Figure 6 Comparison of Self-Motivation Inventory Scores 24
iv

LIST OF TABLES
Page
Table 1 Relationship Between Ultramarathon PastExperience and Race Completion 9
Table 2 Means and Standard Deviations BetweenSurvivors and Casualties of DemographicCharacteristics and Level of SignificantDifference 11
Table 3 Symptom Intensity Means, Standard Deviationsand Level of Significant Difference from Preto Post-Run 18
Table 4 Rank Order of Complaint Expressed with aSymptom Intensity Greater Than 1.0 (or aRating of Slight) 19
e

ABSTRACT
Psychological and training characteristics of 44 ultramarathonerscompeting in a 50-mile trail race were studied. These psychological andtraining variables were used to distinguish differences between survivorsand casualties in the race and to predict race time. In addition, moodchanges and runners physical symptoms were examined to assess changes frompre to post-race. Results show a mood profile and self-motivation scoressimilar to other athletic populations. Mood profile changed from pre topost race and training pace was found to be a highly significant factor inpredicting finish time.
vi
C7

INTRODUCTION
The tactical importance of a soldier's ability to move as
quickly as possible over a variety of terrain is critical in certain
military maneuvers. Air assault, light infantry and special forces
may require the soldier to navigate cross country for a sustained
period of 72 hours or more. The physical and psychological demands
of these types of military operations are similar to competitive
endurance events such as 50 and 100 mile trail runs. These trail
racing ultramarathoners, like dismounted soldiers, must often
traverse distances up to 100 miles over wet and rocky terrain in
temperatures ranging from below freezing to above 100 degrees
fahrenheit. Reports of sprains, lacerations, excessive weight loss
and hypothermia are common during races as are complaints of
hallucinations and paranoia. The importance that psychological
factors play in this type of endeavor cannot be underestimated.
Since the ultramarathoner and dismounted soldier must persevere at a
physically demanding task for an extended period of time, his
psychological state can be expected to have a profound impact on
endurance performance.
Previous research over the past decade has thoroughly
demonstrated changes in mood states as a function of physical
exercise (Folkins, 1976; Folklns and Sime, 1981; Dishman, 1985;
Morgan, 1985). Most studies to date have assessed mood states
before and after acute physical exercise of one to three hours
%-

duration or before and after chronic exercise programs lasting 6-20
weeks. Typically, improved affective states and antidepressant
effects accompany both acute and chronic physical activity (see
review by Dishman, 1985). Acute exercise of vigorous intensities
has been shown to reduce state anxiety and depression (Markoff et
al. 1982; Bahrke and Morgan, 1978; Morgan et al. 1980; Berger and
Owen, 1983). Moreover, exercise-induced euphoria, most typically
reported in runners and commonly known as "runner's high", may
represent another form of mood alteration. Most of the
psychological and physiological studies of acute exercise have
focused on running durations of anywhere from 30 minutes on a
treadmill to 3 hours for a marathon. Much less well known, however,
are mood changes associated with a single sustained vigorous
exercise of ten hours or more in duration such as the ultramarathon.
Costill (1972) reported that the average marathoner expenos
approximately 2,400 kcal while Thompson et al (1982) report that 50-
mile ultramarathoners expend from 5,937 kcal for nonelite runners to
6,065 kcal for elite runners. Where there are differences in the
physiologic demands of these endurance events there may also be
differences in mood states. In addition, research investigating the
subjective symptomatology associated with ultramarathon performance
is lacking.
Successful performance in endurance events such as the
ultramarathon may be associated with changes in subjective symptoms
and mood states during competition. Previous research by Morgan and
2
~ ~ . p N.%

Pollock (1977) suggest that successful endurance performance is
governed by one's physical capacity and the willingness to tolerate
discomfort associated with hard physical work. The decision to
stop, maintain pace, or accelerate pace while performing an
endurance event such as the marathon is a cognitive process (Morgan,
Horstman, Cymerman & Stokes, 1983) characterized by an integration
of parameters such as ventilatory minute volume, catecholamine
production, muscle lactate, cardiac frequency, and state of physical
fitness (Pandolf, 1978). The successful ultramarathon runner must
persevere in an event involving prolonged strenuous exercise at an
average of 72% to 84% of V02 max (Thompson et al., 1982) often under
environmentally taxing conditions (i.e., heat, altitude, rugged
footing, etc.).
Published studies on subjective reports of physical symptoms or
mood states associated with ultramarathon competitions are
practically non-existent. One of the few studies (Joesting, 1981)
found no differences in depression, anxiety, or hostility before,
during, and after running in a 50-mile race. Since the author was
the only test subject, however, there is skepticism with respect to
these results.
Previous studies have investigated factors related to marathon
performance time. Slovic (1977) reported that the best predictors
of marathon time, in two male samples (R = .89, .87), were
combinations of quantitative (total mileage and length of longest
training run) and qualitative variables (fastest 5- and 10-mile

times). Slovic also reported equations without 5- and 10-mile times
which were less accurate (R = .72, .74) and based on total mileage,
longest run and marathon completion, age, and ponderal index (a
measure based on height and weight to characterize leanness). Mc
Kelvie et. al. (1985) also identified variables to predict marathon
time. The overall prediction was accurate (R - .89), with training
pace the most important factor in combination with 10-km time, miles
per week run, previous marathons completed, days lost through injury
or illness, and a personality characteristic for repression-
sensitization.
The purpose of the present study was to examine psychological
characteristics associated with performance in the ultramarathon.
Specifically under study were 1) mood states and physical symptoms
which change as a function of the sustained acute strenuous exercise
of a 50 mile ultramarathon, 2) demographic factors, moods and
physical symptoms which differentiate finishers from non-finishers,
3) goals for participation along with motivation level, and 4)
factors which best predict ultramarathon (50-mile) time.
METHOD
Subjects
The subjects consisted of 44 registered entrants (42 males and
2 females) of the Massanutten Mountain Massacre 50-mile trail run
who volunteered to participate in the study. All subjects were
4 * -

instructed to read and sign a volunteer agreement of informed
consent.
Apparatus
A Performance Assessment Battery was administered pre and post
run. The battery consisted of a Demographics Questionnaire, a Self-
Motivation Inventory (SMI), an Environmental Symptoms Questionnaire
(ESQ), Profile of Mood States (POMS), and a test of Trait Anxiety
(FORM X-2). The Demographics Questionnaire was administered to
ascertain basic demographic variables such as height, weight, age,
and background running and training information. The ESQ consisted
of a 41 item inventory of symptom states and was administered to
assess psychological perceptions of physiologically based symptoms
experienced pre and post run. The POMS (McNair, Lorr & Druppleman,
1981) consisted of 65 mood items administered to assess mood state
changes in pre and post-run conditions. The SMI (Dishman, Ickles &
Morgan, 1980) was composed of a 40 item inventory administered to
assess motivation towards training. The FORM X-2 questionnaire
consisted of a 20 item test measuring trait anxiety (Spielberger,
Gorsuch & Lushene, 1970).
5

Procedure
All registered runners in the Massanutten Mountain Massacre
Trail Run were requested to complete the Performance Assessement
Battery. Of the sixty-one registered runners, forty-four
volunteered to participate as subjects. All subjects were asked to
complete the battery which was administered ten hours prior to the
start of the run. In addition, subjects were informed that they
would be requested to complete the ESQ and POMS upon terminating the
run. During the run, data collectors waited for subjects to reach
various checkpoints and administered post-run questionnaires to any
subject that withdrew or was removed from the race. Runners were
pulled from the race at the 33-mile mark if they had not completed
that distance by eight hours and removed at the 44-mile mark if not
completed by ten hours. The time constraint was necessary to ensure
that all runners completed the race in daylight. The race course
terrain ranged from soft muddy footing to rugged rocky covering.
Elevation varied from a low of 700 feet to a high of 2650 feet. A
net gain and loss of 7000 feet was achieved. The average daytime
temperature was 60 degrees fahrenheit with a range of 54 to 63
degrees. Upon completion of the race, voluntary withdrawl, or
administrative or medical removal, a post-run questionnaire was
administered. Any subject who withdrew from the race and was not
administered a questionnaire at one of the checkpoints was
administered the post-run questionnaire at the finish area.
6

RESULTS
The 50-mile trail run was completed by 22 of the 61 entrants.
The average time to complete the course was 10 hours and 21 minute3
while the winning time was 9 hours and 15 minutes.
Demographics
The sample ranged in age from 23 to 53 years (M = 35.59 + 7.89
years), ranged in weight from 130 to 192 pounds (M = 156.15 + 15.08
pounds), and height ranged from 63 to 75 inches (M = 70.36 + 2.67
inches). Additional oemographic characteristics included: years of
running (M - 8.30 + 5.26 years); longest race run (M = 78.19 + 68.43
miles); weeks trained for the race (M - 10.21 + 8.70 weeks); miles
per week trained (M = 59.26 + 21.90 miles); average training pace (M
- 7:54 + 0:41 min:sec/mile); and predicted finish time (M - 9:41 +
1:18 hours:min). The data presented includes the two female
subjects except where otherwise indicated. Fifty-seven responses of
the 61 entrants were obtained with respect to occupation. Eighty-
four percent held white-collar or professional job positions, 7.6
percent held blue-collar or labor positions, and 7.6 percent were
students. All subjects were white and non-smokers.
Subjects were divided into two groups post hoe. Survivors
(n-18), were subjects who completed the race, while casualties
(n-26), were subjects who either voluntarily withdrew or were
7

administratively or medically removed from the race for safety
reasons. Significant differences existed between survivors and
casualties for mean body weight t = (35) 2.73, P < .01, predicted
race time t = (35) 2.13, p < .05, and average training pace t =
(34) 2.15, p < .05. The average values for these three measures
were significantly lower for the survivor group. The two females
were omitted from the analysis with respect to weight and height
because of the distinct morophological differences between the
sexes. The two groups significantly differed with respect to
previous race experience, X 2 = (7) 11.20, p < .05, indicating
runners with less race experience had a greater representation in
the casualty group as presented in Table 1. It is noteworthy that
of the seven runners who had never completed an ultramarathon prior
to this race, only one finished. While prior race experience
appears to be important, nine individuals with ten or more previous
ultramarathons to their credit became casualties.
The most frequently stated goal reported by subjects (n-14) was
to "finish the race" followed by the goal to "run a specific time"
(N=13). The mean goal time was 10 hours and 2 minutes, with a range
from 9 to 12 hours. Ten runners cited a specific finish place they
wished to obtain. Finally, four individuals expressed a number of
goals that were more subjective in nature than finishing for a
certain time or place. These goals were to "run my best effort",
"enjoy the run and make social contacts", "train for the Old
Dominion 100-miler" and "to not get hurt."
8

TABLE 1
RELATIONSHIP BETWEEN ULTRAMARATHON PASTEXPERIENCE AND RACE COMPLETION
NUMBER OF PAST RACES SURVIVOR CASUALTY TOTALN % N % N %
None 1 2.5 6 15.4 7 17.9
1 to 5 6 15.4 5 12.8 11 28.2
6 to 10 4 10.3 1 2.5 5 12.8
More than 10 7 17.9 9 23.1 16 41.0
x2 -11.20 p < .05
9
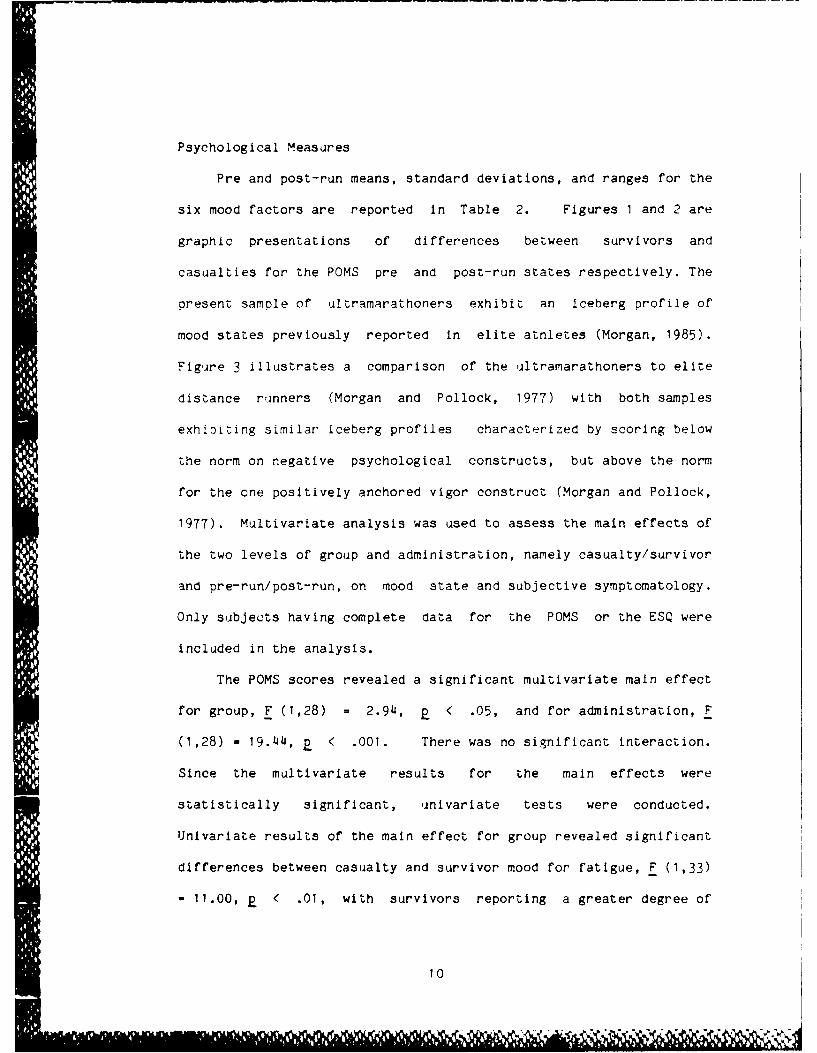
Psychological Measures
Pre and post-run means, standard deviations, and ranges for the
six mood factors are reported In Table 2. Figures 1 and 2 are
graphic presentations of differences between survivors and
casualties for the POMS pre and post-run states respectively. The
present sample of ultramarathoners exhibit an iceberg profile of
mood states previously reported in elite athletes (Morgan, 1985).
Figure 3 illustrates a comparison of the ultramarathoners to elite
distance runners (Morgan and Pollock, 1977) with both samples
exhibiing similar iceberg profiles characterized by scoring below
the norm on negative psychological constructs, but above the norm
for the one positively anchored vigor construct (Morgan and Pollock,
1977). Multivariate analysis was used to assess the main effects of
the two levels of group and administration, namely casualty/survivor
and pre-run/post-run, on mood state and subjective symptomatology.
Only subjects having complete data for the POMS or the ESQ were
included in the analysis.
The POMS scores revealed a significant multivariate main effect
for group, F (1,28) = 2.94, p < .05, and for administration, F
(1,28) - 19.44, p < .001. There was no significant interaction.
Since the multivariate results for the main effects were
statistically significant, univariate tests were conducted.
Univariate results of the main effect for group revealed significant
differences between casualty and survivor mood for fatigue, F (1,33)
- 11.00, p < .01, with survivors reporting a greater degree of
10
I If 1.

TABLE 2
MEANS AND STANDARD DEVIATIONS BETWEEN SURVIVORS AND CASUALTIESOF DEMOGRAPHIC CHARACTERISTICS AND LEVEL OF SIGNIFICANT DIFFERENCE.
SURVIVORS CASUALITIESCHARACTERISTIC MEAN+S.D. (N) MEAN+S.D.(N) T (DF) SIG.
Age 1yrs.) 35.24+ 8.97 (17) 36.10+ 7.38 (20) .32 (35) NS
Height (inches) 69.88+ 2.15 (17) 71.30+ 2.41 (20) 1.87 (35) NS
Weight (lbs.) 151.24+10.79 (17) 162.95+14.65 (20) 2.73 (35) .01
Years Running 9.32+ 5.76 (17) 7.58+ 4.96 (20) .99 (35) NS
Longest Race Run 96.96+83.54 (17) 65.94+53.42 (20) 1.37 (35) NS(miles)
Predicted Race Time 9:07+ 0:55 (15) 9:56+ 1:22 (20) 2.13 (33) .04(hours:mins)
Weeks Trained For Race 10.00+ 6.20 (17) 10.10+10.82 (20) .03 (35) NS
Miles/Week Trained 62.47+20.78 (17) 58.33+23.96 (20) .56 (35) NS
Avg. Training Pace 7:35+ 0:42 (16) 8:03+ 0:46 (20) 2.15 (34) .04(mn: sec/mile)
1
1:10 JilN dK&A& II 11

wCO iI F
0 z
0 :LL >
.J~
0.
ccLL
0(
cr
OEL U0 L 0 Lm in 00 to o
3NOOS-i NV3I1
12

I.-
00WS
~cr
0 4V0
WL 0 r 5L
J0 In IO q n P
CL 3NOOS1NYS
* 13I I'.j11 A~ fill,

z
LI
Lii
00 z0a
Oz0 0 L
0 < S*<*00
z
LL. <
0 3NO- NV3'
14V

fatigue compared to casualties. A closer examination revealed no
significant difference between casualties and survivors on the pre-
run test. Post-run values, however, indicate that survivors
expressed a greater degree of fatigue than casualties via a Scheffe'
post hoc test with a critical difference of 5.91 necessary and
acheived (1,33) P < .05. The difference in post-run fatigue is
undoubtdly because survivors ran greater distances. Univariate
results of the main effect for administration revealed significant
differences between pre and post-run mood states for tension, F
(1,33) = 27.09, p < .001, vigor, F (1,33) = 16.37, c < . 0', and
fatigue, F (1,33) = 38.40, p < .001. As shown in Figure 4, tension
and vigor were reduced, while fatigue was elevated post run.
Table 2 also presents means, standard deviations, and ranges
for self-motivation and trait anxiety scores. The present sample of
ultramarathoners reported self-motivation scores above those found
in college norms. No significant differences existed between
survivors (160.50 + 21.29) and casualties (160.00 + 16.42) for self-
motivation. Additionally, there was no significant difference
between survivors (34.24 + 7.66) and casualties (35.55 + 7.36) for
trait anxiety.
Multivariate analysis of the ESQ scores revealed a significanti
main effect for group, F (1,26) - 3.31, p < .05, and administration,
F (1,26) - 14.13, P < .001. There was no significant int'raction.
Univariate results of the main effect for group revealed that
survivors expressed significantly greater symptom intensities for
15

0a ILJ~ j10<"IE
z0 :
OIaJ4 ie.00
0 =
(0 0.
zS
! IlkIII
OILc0
a. z00
W0 o
L 0 CA)_0_ _ _ _ _ _ _ _ In _
3 IOS-1 NV3N
16

muscle cramps, F (1,34) = 5.26, p < .05, coordination off, F (1,34)
= 4.31, P < .05, and concentration off, F (1,34) = 4.91, p < .05.
Univariate results of the main effect for administration revealed
significant differences in symptom intensity for a wide array of
symptoms (Table 3), however, most notable were muscles feel tight, F
(1,34) = 49.74, o < .001, feel weak, F (1,34) = 44.53, p < .001,
legs or feet ache, F (1,34) = 155.74, < .001, and feel tired, F
(1,34) = 46.48, p < .001. Table 3 reports summary statistics and
univariate F-values for the main effect of administration. All
symptoms except for "feeling good" increased in intensity from pre-
run to post-run. Twenty-six of the symptoms showed a significant
change. Each symptom score was behaviorally anchored with "0"
indicating the absence of a symptom, "1" the presence of a symptom
of slight intensity, "2" a symptom being somewhat intense, "3"
moderate symptom intensity, "14" quite a bit of symptom intensity,
and "5" extreme symptom intensity. Table 4 shows symptoms that were
present (i.e., having a mean > 1), before and after the run.
Notably there were only two symptoms, both of which relate to
fatigue, reported before the run. There were, however, a variety of
symptoms most of which were dominated by feelings of muscular
fatigue and muscular exhaustion present after the run.
A stepwise multiple regression analysis was performed to
identify factors which best predict 50-mile ultramarathon finish
time. Finish time was converted from hours to minutes for
conductIng the multiple regression. Two factors, training pace and
17

TABLE 3
SYMPTOM INTENSITY MEANS, STANDARD DEVIATIONS ANDLEVEL OF SIGNIFICANT DIFFERENCE FROM PRE TO POST-RUN
SYMPTOM PRE-RUN POST-RUN F SIG.MEAN+ S.D. MEAN+S.D.
Short Of Breath .11+ .40 1.08+1.25 20.58 .001Hard To Breathe .05+ .23 .58+ .73 18.68 .001Hurts To Breathe .03+ .17 .28 .51 10.04 .001Muscle Cramps .25+ .69 1.64+1.51 36.85 .001Muscle Feel Tight .47+ .84 2.64+1.64 49.74 .001Feel Weak .36+ .64 2.03+1.38 44.53 .001Legs or Feet Ache .42+ .69 3.39+1.42 155.74 .001Hands, Arms, Shou. Ache .11+ .32 1.42+1.32 37.11 .001Back Aches .44+1.00 1.33+1.26 19.82 .001Feel Lightheaded .17+ .61 .83+1.06 15.36 .01Feel Dizzy .08+ .28 .38+ .60 10.27 .01Feel Faint .06+ .23 .33+ .67 5.56 .05Coordination Off .03+ .16 .97+1.00 34.61 .001Nauseous .05+ .33 .781.35 11.89 .01Gas Pressure .83+1.21 .33+ .83 6.60 .05Feet Are Sweaty .41 + .77 1 .19+1 .51 8.32 .01Parts Of Body Are Numb .03+ .17 .75+1.16 15.45 .001Mouth Is Dry .17+ .45 1 .03+1 .13 23.82 .001Lost Appetite .44+ .97 1.19+1.51 8.57 .01Feel Sick .17+ .51 .69+1.14 13.15 .001Thirsty .61+ .90 .61+ .90 26.72 .001Feel Tired 1.05+1.21 3.00+1.55 46.48 .001Couldn't Sleep Well .61+1.02 1.72+1.92 11.88 .01Concentration Off .39+ .73 .89+ .91 5.18 .05Feel Good 3.11+1..45 2.44+1.30 4.99 .05
18

TABLE 4
RANK ORDER OF COMPLAINT EXPRESSED WITH ASYMPTOM INTENSITY GREATER THAN 1.0 (OR A RATING OF SLIGHT)
PRE-RACE POST-RACE
1. Feeling Sleepy 1. Legs or Feet Ache2. Feeling Tired 2. Feeling Tired
3. Muscles Feel Tight4. Thirsty5. Couldn't Sleep Well6. Muscle Cramps7. Feeling Sleepy8. Hands, Arms or Shoulders Ache9. Sweating All Over10. Back Aches11. Feet Sweaty
12. Lost Appetite13. Short of Breath14. Feel Warm15. Mouth is Dry
19

predicted finish time, were fairly successful in predicting final
2time (R = .564, F (2,11) = 7.14, p < .01). All other variables
failed to meet the entry criterion of the probability associated
with F (p < .05). The coefficients for the final equation were
(pace * 55.442 + predicted time * .379 + 4.253). Figure 5
illustrates the direction and strength (R - .75) of the relationship
between actual race time and predicted race time for the 14
survivors who had complete data.
DISCUSSION
Several variables assisted in determining characteristics that
best differentiate survivors from casualties. Ultramarathoners who
finished the race (i.e., survivors) weighed less, ran faster in
training, and aspired to run a faster time for this particular race
in contrast to non-finishers (i.e.,casualties). One keynote that
must be taken into account is that within the group classified post
hoe as casualties were subjects who were medically pulled for saftey
reasons. Medical pulls occurred when runners did not reach certain
checkpoints in designated time periods. Since many runners were
forced to run faster than they are capable of running or face being
disqualified the results are skewed towards the faster runners being
survivors. Not taken into account is the runner who is the slow,
but steady performer, and given enough time would be able to
complete the race.
20

LLu
LLI
* 0j
0 L
z <00
00fm(
LL
iJ* O0L 0 (l)
Oi- V: 6 o-r- I- I0(soo ul 0l. oN mij
21-
tl 0M

The means and standard deviations for background running
information are consistent with those obtained in a previous studyon
ultramarathoners (McCutcheon & Yoakum, 1983) and race summaries of
the Old Dominion 100-Mile Endurance Run. Previous studies
(McCutcheon & Yoakum, 1983 and Thompson et al., 1982) reportec that
fast ultramarathoners ran significantly more miles in training than
did the slower runners. Folkins and Wieselberg-Bell (1981) reported
no difference between ultramarathon finishers and non-finishers for
age, years of running and miles per week trained. Significant
differences were, however, found between finishers and non-finishers
on the confidence-in-finishing scale (finishers scorea higher) and
finishers had run longer distances in previous races. The present
results focused on survivor-casualty relationships and did not find
a significant difference in training mileage, although, survivors
were found to train at a significantly faster pace. The present
findings also show that predicted finish time was significantly
lower for survivors which corroborates the finding of Folkins ana
Wieselberg-Bell (1981) and possibly indicates that survivors had
greater confidence in their ability. Moreover, the present findings
indicate that previous ultramarathon experience does seem to be
related to the ability to finish an ultramarathon.
The goals for participation support the groupings Thompson et
al. (1982) reported in a previous study of ultramarathoners. These
groups ranged from extremely competitive individuals to the non-
competitive/social runner. The majority of runners were found to be
22

most interested in improving their own performance either by running
longer, faster or for a higher place than they have achieved in the
past.
The measure of self-motivation used in the present study is a
valid, internally consistent and reliable score when assessing
individual motivation towards a training or exercise program
(Dishman, et al. 1980). The present results indicate that the
ultramarathoner's level of self-motivation was similar to the other
athletic groups tested and higher than college norms (see Figure 6).
The high self-motivation score may be indictive of the importance
"running and training" has in the lives of these subjects. Previous
research reported no significant differences in self-motivation
scores between fast and slow runners (McCutcheon & Yoakum, 1983).
The present findings indicate there were no significant differences
in self-motivation between casualties and survivors.
The affective (mood) state of the present sample of
ultramarathoners is similiar to elite athletes in middle-distance to
marathon running, wrestling and crew (Morgan and Pollock, 1977 and
Morgan, 1985) and psychometrically configure the iceberg profile
previously reported by Morgan (1985). Affective variables from the
POMS are traditionally reported and graphically presented in a
sequential order of; tension, depression, anger, vigor, fatigue, and
confusion (McNair, Lorr & Druppleman, 1981). Morgan (1985) further
reported that since elite runners express vigor scores normally
elevated far above college norms while the other five mood states
23

LU
0C)
0
z-0U
<>S
0
IL
0 C0CO LaCL woa*
0 i
0 0 0n 0 0
0o ao 0 U) U)g) N
-j -4
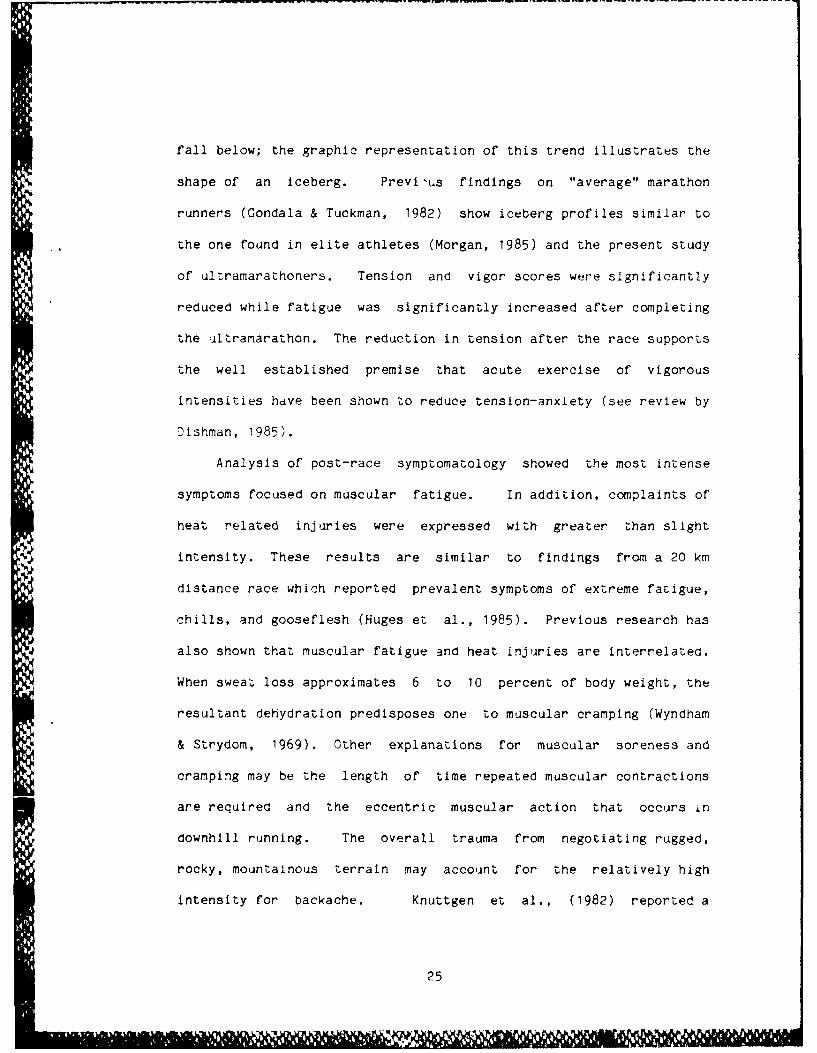
fall below; the graphic representation of this trend illustrates the
shape of an iceberg. Previ-us findings on "average" marathon
runners (Gondala & Tuckman, 1982) show iceberg profiles similar to
the one found in elite athletes (Morgan, 1985) and the present study
of ultramarathoners. Tension and vigor scores were significantly
reduced while fatigue was significantly increased after completing
the ultranarathon. The reduction in tension after the race supports
the well established premise that acute exercise of vigorous
intensities hdve been shown to reduce tension-anxiety (see review by
Dishman, 1985).
Analysis of post-race symptomatology showed the most intense
symptoms focused on muscular fatigue. In addition, complaints of
heat related injuries were expressed with greater than slight
intensity. These results are similar to findings from a 20 km
distance race which reported prevalent symptoms of extreme fatigue,
chills, and gooseflesh (Huges et al., 1985). Previous research has
also shown that muscular fatigue and heat injuries are Interrelated.
When sweat loss approximates 6 to 10 percent of body weight, the
resultant dehydration predisposes one to muscular cramping (Wyndham
& Strydom, 1969). Other explanations for muscular soreness and
cramping may be the length of time repeated muscular contractions
are required and the eccentric muscular action that occurs in
downhill running. The overall trauma from negotiating rugged,
rocky, mountainous terrain may account for the relatively high
intensity for backache. Knuttgen et al., (1982) reported a
25

relationship of downhill running and eccentric muscular action with
perceived muscle soreness.
The results of the multiple regression confirm the finding of
previous studies by Slovic (1977) and Mc Kelvie et. al. (1985)
identifying training pace as a highly significant predictor of
marathon finish time and for the present sample, ultramarathon
finish time. It is worthy of note that we took a conservative
approach in building the regression equation. Since our primary
focus was on applying the equation to predict performance in
ultramarathon population, the two constraints to building the model
were the adjusted R2 and the standard error. Since the sample R2
tends to overestimate the population value of R , adjusted R is a
perferred measure of goodness of fit because it is not subject to
the inflationary bias which occurs in an unadjusted R2 when numerous
independent variables are added. Therefore, any factors which
adversely affected the adjusted R2 and the standard error were
eliminated.
It is important to identify moods and symptoms that predict
success at finishing an ultramarathon or performance time since once
Identified, runners focus attention on those feelings or symptoms
and avoid those that deter from successful performance. Morgan and
Pollack (1977) found that elite distance runners avoided pain zones
by monitoring sensory input and adjusting their pace. These
associative techniques were used by elite athletes as opposed to
disassociative ones (e.g. sing to oneself, daydreaming pleasant
26

fantasies, etc.), which were more predominant in the slower runners.
By using associative techniques on those symptoms and moods that
contribute to success one would expect better performances.
The findings of the present study are of significance to the
U.S. Army in that comparisons between the ultramarathon and a
sustained military operation show many similarities. Sustained
military operations require physical exertion for a prolonged period
of up to 72 hours. Recommendations made to the ultrarunning
community are also relevant to the military. Learning to manage
stress, itilizing the most advantgeous training techniques, and the
employment of goal-setting strategies are important to enhance human
performance.
The athlete and the solidier must appreciate the efficancy of
cognition on physical performance. Contemporary training strategies
must consider an interdisciplinary approach emphasizing both
physiological and psychological parameters.
27
REFERENCES
1. Bahrke MS, Morgan WP: Anxiety reduction following exercise and
meditation. Cog Ther Res 2: 323-333 1978.
2. Berger BG, Owen DR: Mood alteration with swimming. Psychosom Mea
45: 425-433 1983.
3. Costill DL: Physiology of marathon running. JAMA 221: 1024-1029
1972.
4. Dishman RK: Medical psychology in exercise and sport. Med Clin
North Am 69: 123-143 1985.
5. Dishman RK, Tckles W, Morgan WP: Self-motivation and adherence
to habitual physical activity. J Appl Soc Psychol 10: 115-132
1980.
6. Folkins CH: Effects of physical training on mood. J Clin
Psychol 32: 385-388, 1976.
7. Folkins CH, Sime WF: Physical fitness training and mental
health. Am Psychol 36: 373-389 1981.
28
8. Folkins C, Wieselberg-Bell N: A personality profile of
ultramarathon runners: a little deviance may go a long way. J
Sport Behav 4: 119-12 1981.
9. Gondala JC, Tuckman BW: Psychological mood sic.te in average
marathon runners. Percept Mot Skills 55: 1295-1300 1982.
10. Huges WA, Noble HB, Porter M: Distance race injuries: an
analysis of runner's perceptions. Phys SportsmeC 13: 43 -58 1985.
11. Joesting J: Affective changes before, during and after a 50-mile
run. Percept Mot Skills 52: 162 1981.
12. Knuttgen HG, Nadel ER, Pandolf KB, Patton JF: Effects of
training with eccentric muscle contra-ctions on exercise
performance, energy expenditure, and body temperature. Int J
Sports Med 1: 13-1 1982.
13. Markoff RA, Ryan P, Young T: Endorphins and mood changes in
long-distance running. Med Sci Sport Exerc 14: 11-15 1982.
14. McCutcheon LE, Yoakum ME: Personality attributes of
ultramarathoners. J Pers Assess 47: 178-180 198.
29
..... 0 I~ i U11

15. McKelvie SJ, Valliant PM, Asu, ME Physical training and
personality factors as predictors of marathon time and training
injury. Percept Mot Skills 60: 551-556 1985.
16. McNair DM, Lorr M, Druppleman LF: EITS manual for the profile of
mood states. San Diego, 1981, Fducational and Indlistrial Tes' inv
Service.
17. Morgan WP: Selected factors limiting performance.:
health model. In Clark DH, Ecker HM editors: L ,
Performance. Champaign, 1985, Human Kinetics Piblishe-s, :nc., c
70-80.
18. Morgan WP, Horstman DH, Cymerman A, Stokes J: Facilitation of
physical performance by means of a cognitive strategy. Cog Ther
Res 7: 251-264 1983.
19. Morgan WP, Horstman DH, Stokes J, Cymerman A: Exercise as a
relaxation technique. Primary Cardiol 6: 48-57 1983.
20. Pandolf KB: Influences of local and central factors in
dominating rated perceived exertion during physical work.
Percept Mot Skills 46: 683-698 197,.
21. Slovic P: Empirical study of training and performance in the
marathon. Res Quart 48: 769-777 1977.
30

22. Spielberger CD, Gorsuch RL, Lushene RE: STAI manual. Palo Alto,
1970, Consulting Psychologists Press Inc.
23. Thompson WR, Nequin ND, Lesmes GR, Garfield DS: Physiological
and training profiles of ultramarathoners. Phys Sportsmed 10:
61-6 1982.
24. Wyndham CH, Strydom NB: The danger of an inadequate water intake
during marathon running. S Afr Med J 43: 893-896 1963.
31
31k

DISTRIBUTION LIST
2 Copies to:
Commander
US Army Medical Research and Development Command
SGRD-RMSFort DetrickFrederick, MD 21701
12 Copies to:
Defense Technical Information CenterATTN: DTIC-DDA
Alexandria, VA 22304-61145
1 Copy to:
Commandant
Academy of Health Sciences, US Army
ATTN: AHS-COMFort Sam Houston, TX 78234
I Copy to:
Dir of Biol & Med Sciences Division
Office of Naval Research800 N. Quincy StreetArlington, VA 22217
1 Copy to:
CO, Naval Medical R&D CommandNational Naval Medical Center
Bethesda, MD 20014
1 Copy to:
HQ AFMSC/SGPABrooks AFB, TX 78235
1 Copy to:
Director of Defense Research and EngineeringATTN: Assistant Director (Environment and Life Sciences)Washington, DC 20301
I Copy to:
Dean
School of Medicine Uniformed ServicesUniversity of Health Sciences4301 Jones Bridge RoadBethesda, MD 20014
32