report of 1st quarter national survey 2002 (ns2)...report of 1st quarter national survey 2002 (ns1):...
TRANSCRIPT

1st Quarter National Microbiological Survey 2002 (NS1):
Microbiological quality of Ice for Cooling Drinks
Page 1 of 19

Executive Summary Background •
•
•
•
•
•
Ice used to cool drinks was sampled from catering premises (i.e. pubs, restaurants, take aways, cafes, hotels etc) and was analysed for E. coli and coliforms. Sampling took place during January, February and March 2002. A total of 580 samples were analysed. E.coli was detected in 5.0% (n=29) and coliforms were detected in 29.5% (n=171) of samples (Figure 1). Samples in which coliforms were detected fail to meet the microbiological criteria specified in the drinking water legislation¥.
Figure 1: Microbiological quality of ice samples (n=580)
100 95
90 80
70.5 Coliforms E.coli70
% o
f sam
ples
60 50 40 30 22.8
20 6.7 4.7
10 0.3
0 ≥100 0 >0-<100
Count/100ml
This survey included a questionnaire through which information was received on the method of production, the type of storage and subsequent practices. There was a 63.7% (n=370) response rate to the questionnaire. The microbiological quality of the 370 samples was similar to the quality of the total 580 samples. The majority of the 370 samples (97%) were produced in an ice machine. All of these samples were subsequently stored in the storage bin of the ice machine (31%) or in an ice bucket (65%). The type of storage had a significant effect (p<0.05) on the microbiological results. Other parameters (such as serving methods, access to ice etc) did not affect (p<0.05) the microbiological quality of the ice.
¥ There are currently no Irish microbiological guidelines for ice. In the absence of specific microbiological guidelines for ice the microbiological criteria specified in the drinking water legislation (S.I. No. 81 of 1988 which transposes Council Directive 80/778/EEC) tends to be applied.
Page 2 of 19

Report of 1st Quarter National Survey 2002 (NS1):
Microbiological Quality of Ice for Cooling Drinks Summary This study investigated the microbiological quality of ice for cooling drinks. Sampling took place during the first three months of 2002. A total of 580 samples from a variety of premises were tested for levels of Escherichia coli and coliforms. E.coli was absent in 95% (n=551) of all samples but was detected at levels >0-<100/100ml in 4.7% (n=27) and ≥100/100ml in 0.3% (n=2) of samples. Coliforms were absent in 70.5% (n=409) of samples (i.e. these samples were compliant with the legal limits for potable water). Coliforms were detected at levels of >0-<100/100ml in 22.8% (n=132) of samples and at levels ≥100/100ml in 6.7% (n=39) of samples. This survey included a questionnaire from which information was obtained on the method of ice production and the type of storage. The majority of samples tested (97%) were produced in an ice machine. All of these samples were subsequently stored in the storage bin of the ice machine (31%) or in an ice bucket (65%). The type of storage had a significant effect on the microbiological results. Introduction In recent years consumer demand for chilled foods and beverages has increased dramatically to the extent that ice is now produced in almost every premises serving food and drink. Traditionally ice has been associated with food preservation because of its role in temperature regulation and therefore was never considered to be of microbiological concern. However, a number of well documented outbreaks of illness caused by ice changed this perception. One of these iceborne outbreaks occurred in Pennsylvania, USA in 1987 when more than 5,000 people became ill with gastroenteritis. In this outbreak an overflowing creek contaminated a well water supply of an ice manufacturer. High levels of faecal coliforms were detected in both the ice and water supply (1). Norwalk like viruses (2), Giardia (3) and hepatitis (4) are just a number of other microorganisms implicated in iceborne outbreaks. The ability of microorganisms to survive the freezing and thawing process depends on a number of factors such as the type and strain of the organism, the growth phase and rate of growth, cooling rate and holding temperature (5). Although the freezing/thawing process may injure the cells (6), it has been shown that bacteria (E.coli, Salmonella and Shigella) can survive this process even in conditions of high alcohol (7). This research together with the epidemiological studies highlights the potential microbiological risk associated with ice.
Page 3 of 19

There are currently no Irish microbiological guidelines for ice. However, the Hygiene of Foodstuffs Regulations (8) states that ‘When appropriate, ice must be made from potable water’ (i.e. drinking water). The basic criteria governing the quality of drinking water are set out in the drinking water legislation (S.I. No. 81 of 1988¥ (9) which transposes Council Directive 80/778/EEC (10)). Therefore in the absence of specific microbiological guidelines for ice the microbiological criteria specified in the drinking water legislation tends to be applied. However the authors of a survey undertaken in the UK by LACOTS/PHLS (Local Authorities Coordinating Body on Food and Trading Standards/Public Health Laboratory Service) (11) suggest that these criteria are unrealistic for ice because it undergoes a handling process. They propose that ice used to cool drinks should be of a microbiological quality at least as good as that for ready-to-eat foods (thus implying that ice should be considered a food rather than water). To address these issues, guidelines based on the LACOTS/PHLS survey (which have no legal status) were set for the purpose of this survey. The criteria were set for both E.coli and coliforms. E.coli is an indicator of faecal contamination while coliforms were chosen to give an indication of the overall microbiological condition of the ice. Specific objectives The specific objectives of this survey were to examine the microbiological quality of ice used to cool drinks and to examine the factors which influence its microbiological quality. Method Sample source: Any premises serving drinks cooled by the addition of ice, e.g. pubs, restaurants, take-aways, cafes, hotels etc. Sample description: All ice used to cool drinks were included in this survey. Flavoured ice drinks (e.g. slush puppies) and ice used to cool ready-to-eat food were excluded. Sample collection and analysis: Environmental Health Officers (EHOs) from the various health boards (Appendix 1) collected samples (minimum 300ml). The samples were analysed for E.coli and coliforms in one of the 7 Official Food Microbiology Laboratories (OFMLs – Appendix 2) using an approved / standard method (methods accredited by the National Accreditation Board). The microbiological quality of the ice was assessed using the following guidelines (these guidelines have no legal status):
¥ This will be revoked in January 2004 by European Communities (Drinking Water) Regulations, 2000 (S.I. No. 439 of 2000)
Page 4 of 19

Parameter Result Action
Present/100ml - < 102/100ml Total coliforms >102/100ml Further investigation (see below) Present/100ml - < 102/100ml E. coli
>102/100ml Further investigation (see below) Further investigation It was at the discretion of the EHO to determine whether the following warranted further investigation:
− water source (public or group water scheme) − recent microbiological results for the water source (if available) − plumbing details (e.g. ice machine linked to water from a storage tank) − frequency of cleaning ice buckets and ice machines − environmental conditions of the area used to locate the ice machine − hygienic practices and knowledge of staff − etc.
Information on further investigation and/or repeat samples (if taken following corrective action) was not included in this report.
Page 5 of 19

Results and Discussion A. Results of Samples Submitted for Microbiological Testing A total of 580 samples of ice were obtained in each of the 10 health boards (Table 1) and were analysed by the 7 official food microbiology laboratories. Figure 1 illustrates the microbiological quality (E.coli and coliforms) of the 580 samples.
Table 1. Number of samples from each health board (n=580) Health board Number of survey samples ECAHB 46 MHB 25 MWHB 54 NAHB 52 NEHB 32 NWHB 50 SEHB 77 SHB 110 SWAHB 75 WHB 59 Total 580 Figure 1: Microbiological quality (E.coli and coliforms) of samples (n=580)
100 95
90 80
70.5 Coliforms E.coli70
% o
f sam
ples
60 50 40 30 22.8
20 6.7 4.7
10 0.3
0 ≥100 0 >0-<100
Count/100ml
Page 6 of 19

Of the 580 samples submitted for microbiological analysis, E.coli was absent in 95% (n=551) of all samples but was detected at levels >0-<100/100ml in 4.7% (n=27) and ≥100/100ml in 0.3% (n=2) of samples. The breakdown of these results by health board is outlined in Table 2. Table 2. E.coli results by health board
Count / 100ml
Health Board Number of samples 0 (%)
> 0 -<100 (%)
≥ 100 (%)
ECAHB 46 42 (91.3) 4 (8.7) 0 (0.0) MHB 25 23 (92.0) 2 (8.0) 0 (0.0) MWHB 54 51 (94.4) 3 (5.6) 0 (0.0) NAHB 52 49 (94.2) 3 (5.8) 0 (0.0) NEHB 32 29 (90.6) 3 (9.4) 0 (0.0) NWHB 50 49 (98.0) 1 (2.0) 0 (0.0) SEHB 77 76 (98.7) 1 (1.3) 0 (0.0) SHB 110 107 (97.3) 3 (2.7) 0 (0.0) SWAHB 75 66 (88.0) 7 (9.3) 2 (2.7) WHB 59 59 (100.0) 0 (0.0) 0 (0.0) Total 580 551 (95.0) 27 (4.7) 2 (0.3) Coliforms were absent in 70.5% (n=409) of samples and were detected at levels of >0-<100/100ml in 22.8% (n=132) of samples and at levels ≥100/100ml in 6.7% (n=39) of samples. The breakdown of these results by health board are outlined in Table 3. Table 3. Coliform results by health board
Count / 100ml
Health Board Number of samples 0 (%)
> 0 -<100 (%)
≥ 100 (%)
ECAHB 46 30 (65.2) 10 (21.7) 6 (13.0) MHB 25 16 (64.0) 8 (32.0) 1 (4.0) MWHB 54 44 (81.5) 7 (13.0) 3 (5.5) NAHB 52 18 (34.6) 21 (40.4) 13 (25.0) NEHB 32 19 (59.4) 12 (37.5) 1 (3.1) NWHB 50 47 (94.0) 3 (6.0) 0 (0.0) SEHB 77 61 (79.2) 13 (16.9) 3 (3.9) SHB 110 84 (76.4) 23 (20.9) 3 (2.7) SWAHB 75 45 (60.0) 21 (28.0) 9 (12.0) WHB 59 45 (76.3) 14 (23.7) 0 (0.0) Total 580 409 (70.5) 132 (22.8) 39 (6.7)
Page 7 of 19

The results of this survey are marginally better than those of a comparable survey in the UK by LACOTS/PHLS (11). The following table (Table 4) compares both survey results: Table 4: Comparison of microbiological results with LACOPTS/PHLS survey (11)
E. coli Coliforms
Origin of study
No. of
samples 0
(%)
> 0 -<100
(%)
≥ 100 (%)
No. of samples
0
(%)
> 0 -<100
(%)
≥ 100 (%)
Irish
580
551 (95.00)
27 (4.70)
2 (0.30)
580
409 (70.50)
132 (22.80)
39 (6.70)
UK(11)
3498
3255 (93.05)
207 (5.92)
36 (1.03)
3511
2214 (63.06)
989 (28.17)
308 (8.77)
In a Denver study (12), coliform levels of <1/100ml were recorded for 91% of all ice samples manufactured in on-the-premise automatic ice making machines. In a study on the quality of packaged ice (n=22) purchased at retail establishments in Iowa (13), all samples were negative for faecal coliforms and only one sample (4.5%) was positive for total coliforms (MPN 2.2/100ml). Further examination of this positive sample showed that Klebsiella pneumonia was the predominant organism. In a study in Florida (14), coliforms were detected in 12.3% of all ice samples manufactured on the premises (n=81). As stated in the introduction, in the absence of microbiological guidelines specifically for ice, the legal criteria for drinking water tends to be applied. Applying these criteria for total coliforms (absence in 100ml) to the results of this survey, shows that 70.5% of samples tested meet the drinking water criteria, in other words 29.5% of samples do not.
Page 8 of 19

B. Results of Samples Returned with a Questionnaire A total of 370 questionnaires were returned which were successfully matched with the corresponding laboratory report (i.e. response rate of 63.7%). The microbiological quality of these samples is illustrated in Figure 2. The results are similar to those of the total samples (n=580) illustrated in Figure 1. Figure 2: Microbiological quality (E.coli and Coliforms) of those samples with
accompanying questionnaires (n=370)
100 94.9 90
80 72.2
70 Coliforms
% o
f sam
ples
E.coli
60
50
40
30 21.6
20 6.2 10 4.9
0.20
0 ≥100 >0-<100
Count/100ml
Typical methods currently used in retail premises for the production of ice include ice machines, ice bags, ice trays etc. Of the samples assessed in this study (n=370), 97.3% (n=360) were produced in an ice machine while only 1.6% (n=6) of samples were produced in ice bags (Figure 3).
Page 9 of 19
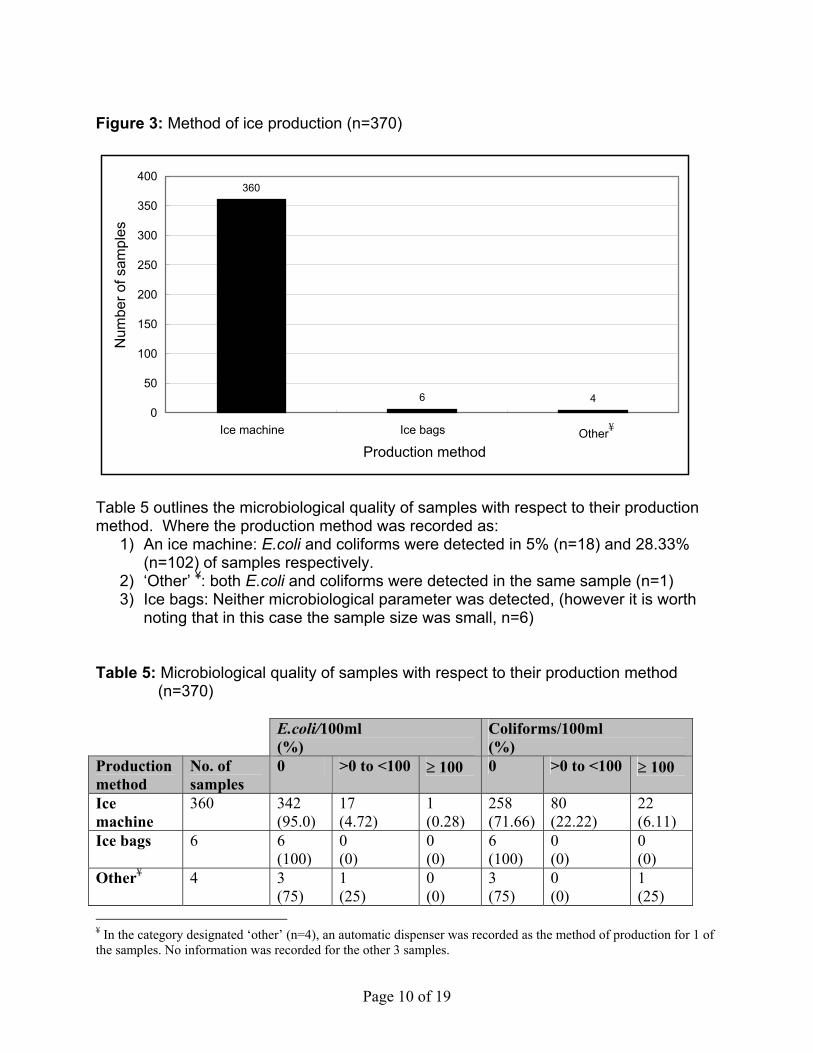
Figure 3: Method of ice production (n=370)
400 360
350
Num
ber o
f sam
ples
300
250
200
150
100
50 4 6
0 Ice machine Other¥ Ice bags
Production method
Table 5 outlines the microbiological quality of samples with respect to their production method. Where the production method was recorded as:
1) An ice machine: E.coli and coliforms were detected in 5% (n=18) and 28.33% (n=102) of samples respectively.
2) ‘Other’ ¥: both E.coli and coliforms were detected in the same sample (n=1) 3) Ice bags: Neither microbiological parameter was detected, (however it is worth
noting that in this case the sample size was small, n=6) Table 5: Microbiological quality of samples with respect to their production method
(n=370)
E.coli/100ml (%)
Coliforms/100ml (%)
Production method
No. of samples
0 >0 to <100 ≥ 100 0 >0 to <100 ≥ 100
Ice machine
360 342 (95.0)
17 (4.72)
1 (0.28)
258 (71.66)
80 (22.22)
22 (6.11)
Ice bags 6 6 (100)
0 (0)
0 (0)
6 (100)
0 (0)
0 (0)
Other¥ 4 3 (75)
1 (25)
0 (0)
3 (75)
0 (0)
1 (25)
Page 10 of 19
¥ In the category designated ‘other’ (n=4), an automatic dispenser was recorded as the method of production for 1 of the samples. No information was recorded for the other 3 samples.

It was not possible to statistically compare production methods due to the small number of samples produced by methods other than by ice machines. However, other studies have noted a correlation between the method of ice production and the microbiological quality. In the PHLS/LACOTS study (11) it was noted that ice produced in ice trays contained significantly more coliforms (46%) and enterococci (21%) than ice produced using other methods such as ice making machines or ice bags. It was postulated that unclean ice trays or improper handling techniques during or post preparation may have been responsible. Variation exists in premises not only in the production method but also in the type of storage. As illustrated in Figure 4 approximately twice as many samples were stored in an ice bucket as in the storage bin of the ice machine. Figure 4: Type of storage immediately prior to use (n=370)
300
240250
Num
ber o
f sam
ples
200
150 114
100
50 16
0 Storage bin of the ice Other¥ Ice bucket
machine
Method of storage
Table 6 shows the breakdown between production method and type of storage. Of the samples produced in an ice machine (n=360), 65% and 31% of these were subsequently stored in an ice bucket and the storage bin of the ice machine respectively. ________________________ ¥ In the category designated ‘other’ (n=16), the following details were recorded: Stainless steel container/compartment (n=3), built in ice sink with integral drainer (n=1), Freezer (n=2), Plastic container (n=1), Chilled dispenser/cabinet (n=2), Dispenser (n=2), missing (5).
Page 11 of 19

Table 6: Relationship between production method and type of storage (n=370)
Storage method immediately prior to use (%) Production method Ice bucket
Storage bin of the ice machine Other Missing Total
Ice machine 235 (65.28) 112 (31.11) 9 (2.50) 4 (1.11) 360 Ice bags 3 (50.0) 2 (33.33) 1 (16.67) 0 (0.00) 6 Other 2 (50.00) 0 (0.00) 1 (25.00) 1 (25.00) 4 Total 240 (64.86) 114 (30.81) 11 (2.97) 5 (1.35) 370 As identified in Table 5, E.coli and coliforms were detected primarily in samples produced in an ice machine (n=360). The microbiological quality of this group of samples is outlined in Table 7 with respect to their subsequent storage. Table7: The microbiological quality of samples produced in an ice machine (n=360) with
respect to their subsequent storage conditions
E.coli cfu/100ml Coliforms cfu/100ml Type of storage
No. of samples
0 >0 to <100 ≥ 100 0 >0 to <100
≥ 100
Ice bucket
235 219 (93.19)
15 (6.38)
1 (0.43)
159 (67.66)
55 (23.40)
21 (8.94)
Storage bin of ice machine
112 110 (98.21)
2 (1.79)
0 (0.00)
89 (79.46)
22 (19.64)
1 (0.89)
The type of storage had a significant effect on the microbiological quality of the sample with respect to both E.coli (χ2=3.9, df=1, p<0.05) and coliforms (χ2=9.79, df=2, p<0.05). E.coli was detected in 6.81% of samples stored in an ice bucket compared to 1.79% of samples stored in an ice machine. Coliforms were detected in 32.34% of samples stored in an ice bucket compared to 20.53% of samples stored in an ice machine. Similar findings have been noted in other studies. In a survey of 12 licensed premises in Leeds, ice samples from buckets were of a lower microbiological quality (total viable bacteria) than ice sampled directly from the machine (15). Correlations between microbiological quality and storage conditions were also observed in the Denver (12) and the PHLS/LACOTS studies (11).
Page 12 of 19

A more detailed analysis of the conditions and practices during storage of ice in an ice bucket (Figure 5) found that: • •
• •
Meltwater was present in the 22.5% of buckets The public had access to 11.6% of the ice buckets (this compares to 0.8% of the ice machines) 90.8% of buckets were not covered There were no utensils present to scoop 3.8% of the ice samples
Figure 5: Conditions and practices during storage of ice in an ice bucket (n=240)
93.3
50.8
90.8
26.722.5
11.6 5
84.2
3.8 2.94.24.2
0
10
20
30
40
50
60
70
80
90
100
Meltwater present Public access Bucket covered Utensil used toscoop ice
Parameter
% o
f sam
ples
Yes
No
Unknown
The effect of each parameter on the microbiological quality of the ice is outlined in Table 8.
Page 13 of 19

Table 8: Relationship between storage parameters (in the ice bucket) and microbiological quality (n=240).
E.coli Coliforms
Parameter Yes/No/ Unknown
0 >0 to <100
≥ 100 0 >0 to <100
≥ 100
Total
Meltwater present
Yes 51 3 0 35 15 4 54
No 115 6 1 79 33 10 122 Unknown 58 6 0 50 7 7 64 Public access Yes 25 2 0 17 9 2 28 No 189 12 1 138 45 19 202 Unknown 10 0 0 9 1 0 10 Bucket covered
Yes 12 0 0 10 2 0 12
No 202 15 1 146 52 20 218 Unknown 10 0 0 9 1 0 10 Utensil used to scoop ice
Yes 209 14 1 151 52 21 224
No 8 1 0 6 3 0 9 Unknown 7 0 0 7 0 0 7 A statistical analysis (χ2) was carried out to investigate the effect of each parameter on the microbiological quality of the samples. None of the parameters examined had a significant effect on the microbiological quality (either E.coli or coliforms) of the ice. This contrasts to one of the findings of the LACOTS/PHLS study (11). In that study the microbiological quality of ice in ice buckets was significantly lower when meltwater was present. (Note: The LACOTS/PHLS study may have been more sensitive due to the larger number of samples examined). They proposed that this may have been caused by inadequate cleaning, improper storage and/or cross contamination.
Page 14 of 19

Conclusions The current survey has found that 29.5% of ice used to cool drinks (n=580) did not comply with the criteria for total coliforms (absence in 100ml) as specified in the drinking water legislation. E.coli was detected in 5% of samples. Contamination of ice may arise from a number of different sources such as the source of water and poor food hygiene practices. A good quality water supply is a prerequisite to the production of good quality ice. In Ireland, water is supplied by public water supplies, group water schemes or private supplies. Concern was expressed by the Environmental Protection Agency (EPA) in its recent report on the quality of drinking water in Ireland for 2001 (16), on the quality of water from group water schemes. Of particular concern was the low level of compliance of group water schemes with the standard for faecal coliforms (only 74.1% of group water schemes were compliant compared to 97.2% of public water supplies). A number of recommendations were made in the EPA report to deal with these deficiencies. Apart from the water supply, ice can become contaminated by airborne discharges, improper handling and cross contamination (17, 18). In the survey of licensed premises in Leeds (15), the microbiological quality of the ice produced on the premises was found to be lower than that of the mains water supply from which the ice was produced, suggesting poor hygienic practices. This was confirmed by the finding that in these premises that little emphasis was placed on hygiene issues relating to the ice machines (siting, servicing and maintenance), the equipment which come in contact with the ice (utensils and ice buckets) and the training of staff (15, 17). Also, the microbiological quality of ice made on retail premises has been shown to be of a lower microbiological quality than that produced by commercial manufacturers (14). This may suggest lower hygiene standards in premises not specialised for this purpose. Recommendations •
•
• •
• •
•
Manufacturers instructions relating to the maintenance, storage, cleaning and situation of ice machines should be followed. Ice machine manufacturers should assess the results of this survey and prepare guidance on best practice. Where possible, ice should be stored in the storage bin of the ice machine. If ice buckets are used, they should be maintained in a hygienic condition and meltwater should not be present. All staff should have basic training in food hygiene and safety. A food safety management system based on the principles of HACCP should be implemented. The results of this survey will be assessed by the FSAI to determine the need for specific microbiological guidelines for ice.
Page 15 of 19

Bibliography 1.
2.
Talbot, G.H., Brown, E.A., Collins, M., Smith, D.S., Hishorn, R.B., Sharrar, R.G., Farris, D., David, R., Rodeheaver, D.C., Silverman, P.R., Johnson, L. and Oliver L. 1987. Outbreak of viral gastroenteritis – Pennsylvania and Delaware. Morbidity and Mortality Weekly Report, 36, 43, 709-711.
Khan A.S., Moe, C.L., Glass, R.I., Monroe, S.S., Estes, M.K. Chapman, L.E., Jiang, X., Humphrey, C., Pon, E., Iskander, J.K., and Schonberger, L.B. 1994. Norwalk virus-associated gastroenteritis traced to ice consumption aboard a cruise ship in Hawaii: comparison and application of molecular method-based assays. Journal of Clinical Microbiology, 32, 2, 318-322.
3.
4.
Quick, R., Paugh, K., Addiss, D., Kobayashi, J. and Baron, R. 1992. Restaurant associated outbreak of giardiasis. Journal of Infectious Diseases, 166, 673-676.
Centers for Disease Control. 1972. Infectious Hepatitis-Wickes, Arkansas. EPI, 71-130-2.
5.
6.
MacLeod, R.A. and Calcott, P.H. 1976. Cold shock and freezing damage to microbes. In The Survival of Vegetative Microbes (eds Gray, T.R.G. and Postgate, J.R.) Symposium 26, The Society for General Microbiology, Cambridge University Press, Cambridge, pp81-109.
Janssen, D.W. and Busta, F.F. 1973. Influence of milk components on the injury, repair of injury and death of Salmonella anatum cells subjected to freezing and thawing. Applied Microbiology, 26, 5, 725-732.
7.
8.
9.
Dickens, D.L., Dupont, H.L. and Johnson, P.C. 1985. Survival of bacterial enteropathogens in the ice of popular drinks. Journal of the American Medical Association, 252, 21, 3141-3143.
S.I. 165 of 2000. European Communities (Hygiene of Foodstuffs) Regulations, 2000.
S.I. No. 81 of 1988. European Communities (Quality of water intended for Human Consumption) Regulations, 1988.
10. Council Directive 80/778/EEC (OJ L229, p.11, 30/08/1980) of 15 July 1980 relating
to the quality of water for human consumption.
Page 16 of 19

11.
12.
Nichols, G., Gillespie, I. and deLouvois, J. 2000. The microbiological quality of ice used to cool drinks and ready-to-eat food from retail and catering premises in the United Kingdom. Journal of Food Protection, 63, 1, 78-82.
Morrison, SM., Barela, G and Ladanyi, PA. 1968. A sanitary survey of ice. II: Denver on-the- premise ice dispensers. J. Milk Food Technol. 31, 263-268.
13.
14.
Moyer, NP., Breuer, GM., Hall, NH., Kempf, JL., Friell, LA., Ronald, GW., Hausler, WJ Jr. 1993. Quality of packaged ice purchased at retail establishmnets in Iowa. Journal of Food Protection, 56, No. 5, 426-431.
Schmidt, R.H. and Rodrick, G.E. 1999. Microbial, physical and chemical quality of packaged ice in Florida. Journal of Food Protection, 62, 5, 526-531.
15.
16.
Murphy, FJ and Mepham, P. 1988. Microbial quality of ice cubes: A survey. Br. Food J., 90, 3, 120-122.
Environmantal Protection Agency. Quality of drinking water – a report for the year 2001. http://www.epa.ie/pubs/docs/The%20Quality%20of%20Drinking%20Water%20in%20Ireland%202001.pdf
17.
18.
Murphy, FJ and Mepham, P. 1988. Dangers in the ice bucket. Environ Health. 96, 25-28.
Felix, C.W. 1989. Ice - the forgotten food. J. Assoc. Food Drug Off., 53, 19-24.
Page 17 of 19

Appendix 1: List of Health Boards
Health board Abbreviation
East-Coast Area Health Board ECAHB
Midland Health Board MHB
Mid-Western Health Board MWHB
Northern Area Health Board NAHB
North-Eastern Health Board NEHB
North-Western Health Board NWHB
South-Eastern Health Board SEHB
Southern Health Board SHB
South-Western Area Health Board SWAHB
Western Health Board WHB
Page 18 of 19

Page 19 of 19
Appendix 2: List of the Official Food Microbiology Laboratories (OFMLs)
Laboratory Cherry Orchard Hospital Mid-Western Regional Hospital Public Analysts Laboratory, Dublin Sligo General Hospital St Finbarr’s Hospital, Cork University College Hospital, Galway Waterford Regional Hospital