report of findings 2009 nursing facility staff retention ... · pdf filereport of findings...
TRANSCRIPT

REPORT OF FINDINGS
2009 NURSING FACILITY STAFF
RETENTION AND TURNOVER SURVEY
American Health Care Association
Department of Research
May, 2011

ABSTRACT
Approximately 2 million employees worked at nursing facilities across the United States in 2009. 1.3 million nursing staff represented 66 percent of the total nursing facility workforce. Retention rate for nursing facility employees was 53 percent. The retention rates among Staff Registered Nurses, Licensed Practical Nurses and Certified Nurse Assistants ranged from 48 to 52 percent. The turnover rate for all nursing facility employees was 40 percent. The turnover rate for Certified Nurse Assistants was higher than other nursing staff, at 47 percent.
American Health Care Association
1201 L Street, N.W., Washington, DC 20005
Contact William W. Hartung at (202) 898-2841
© Copyright, American Health Care Association, 2011

Table of Contents
Executive Summary ........................................................................................................................ 1 1.0 Introduction ......................................................................................................................... 5 2.0 Retention and Turnover of Nursing Staff ......................................................................... 11 3.0 Retention and Turnover of Other Nursing Facility Employees ........................................ 14 3.1 Retention and Turnover of Administrative and Management Staff.................................. 14 3.2 Retention and Turnover of Therapy Staff ......................................................................... 15 3.3 Retention and Turnover of Food Services Staff ............................................................... 16 3.4 Retention and Turnover of Housekeeping and Maintenance Staff ................................... 17 3.5 Retention and Turnover of Social Services and Activities Staff ...................................... 18 4.0 Survey Methodology ......................................................................................................... 19 Appendix A: Tables of Retention and Turnover Rates by Job Category and Position ..................... Appendix B: Tables of Retention and Turnover Rates by State .......................................................

REPORT OF FINDINGS 2009 NURSING FACILITY STAFF RETENTION AND TURNOVER SURVEY
© May 2011, American Health Care Association 1
EXECUTIVE SUMMARY
In order to provide updated information of nursing facility workforce at the national and state level, the American Health Care Association (AHCA) conducted a nationwide nursing facility survey, which collected 2009 data to estimate the retention and turnover rates of nursing facility employees. More than 3,120 nursing facilities (NFs) participated in this survey. This study found that approximately 2 million workers were employed at nursing facilities across the United States in 2009. A total of 1.3 million persons, including Director of Nursing (DON), Registered Nurse with Administrative Duties (ARN), Staff Registered Nurse (RN), Licensed Practical Nurse (LPN), Certified Nurse Assistant (CNA), and other nursing staff, provided nursing care to facility residents.
Figure 1. Percentage Breakdown of Nursing Facility Employees by Job Category, 2009 *
*May not add due to rounding
The majority of the nursing staff – approximately 764,000 or 59 percent of total nursing staff – were Certified Nurse Assistant (CNA).
Retention Rates
The retention rate indicates a sense of the stability of the staff. In 2009, the retention rate for all nursing facility employees was 53.1 percent. As shown in Figure 2, retention rates ranged from 49.4 to

REPORT OF FINDINGS 2009 NURSING FACILITY STAFF RETENTION AND TURNOVER SURVEY
© May 2011, American Health Care Association 2
71.1 percent across all major nursing facility job categories. The overall nursing staff retention rate (49.4 percent) was the lowest among all job categories. Figure 2. Total Nursing Facility Employee Retention Rates by Job Category, 2009
71.1%
49.4%
59.5%
54.5%
63.6%
66.1%
Administrative
Nursing
Therapy
Food Services
Housekeeping
Social Services & Activities
Figure 3. Nursing Staff Retention Rates by Job Position, 2009
65.6%
53.9%
47.5%
52.4%
47.8%
Dir. of Nursing
Admin. RN
Staff RN
Lic. Practical Nurse
Cert. Nurse Assist
Retention rates exhibited variability across the five major nursing positions. As shown in Figure 3, retention rates were highest for the director of nursing (65.6 percent) and lowest among Staff RNs (47.5 percent).

REPORT OF FINDINGS 2009 NURSING FACILITY STAFF RETENTION AND TURNOVER SURVEY
© May 2011, American Health Care Association 3
Turnover Rates
The turnover rate for all nursing facility employees was 40.0 percent. Turnover rates exhibited a high degree of variability across nursing facility job categories. As shown in Figure 4, turnover rates in nursing facilities were highest among nursing staff (45.2 percent) and lowest for administrative staff (20.3 percent). As shown in Figure 5, turnover rates for Staff RNs, LPNs, and CNAs ranged from 41.8 to 46.7 percent. Turnover rates for DONs and ARNs were 25.3 and 36.3 percent, respectively.
Figure 4. Turnover Rates by Nursing Facility Job Category, 2009
Figure 5. Turnover Rates by Nursing Job Position, 2009

REPORT OF FINDINGS 2009 NURSING FACILITY STAFF RETENTION AND TURNOVER SURVEY
© May 2011, American Health Care Association 4
The findings from the 2009 AHCA survey of nursing facility staff indicate that America’s nursing facilities still experience high levels of turnover and relatively low retention for nursing facility employees, especially for direct nursing care staff.

REPORT OF FINDINGS 2009 NURSING FACILITY STAFF RETENTION AND TURNOVER SURVEY
© May 2011, American Health Care Association 5
1.0
INTRODUCTION
The American Health Care Association (AHCA) conducted a nationwide nursing facility survey, which collected 2009 data to estimate the retention and turnover rates of nursing facility employees. More than 3,120 nursing facilities nationwide participated in this survey. In 2002, 2004 and 2007 AHCA conducted a nursing position vacancy and turnover survey that collected staff information from the six nursing staff categories including Directors of Nursing (DONs), Registered Nurses (RNs) with administrative responsibilities (ARNs), Staff RNs, Licensed Practical and Vocational Nurses (LPNs), Certified Nurse Assistants (CNAs), and non-certified nursing aides. Although nursing staff constitutes the majority of total employees of nursing facilities, other employees, including administrative and management staff, therapy staff, food services staff, housekeeping and maintenance staff, and social services and activities staff also make critical contributions in the provision of services to residents in nursing facilities. Therefore, in 2008, AHCA conducted Nursing Facility Staff Vacancy, Retention and Turnover Survey that was the first study to collect nationwide retention, vacancy and turnover information for all nursing facilty employees. The survey questionnaire was made available for all eligible nursing facilities in the United States. The detailed methodology of this study can be found in Section 4.0. This report presents findings from the AHCA 2009 Nursing Facility Staff Retention and Turnover Survey. This is a descriptive study of retention and turnover of employees of nursing facilities. Initially, statistics in this report are not intended to be used as benchmarks. In general, retention and turnover rates vary across job categories and across states. State level retention and turnover statistics can be found in Appendix A. Approximately 2 million workers were employed at nursing facilities across the United States in 2009. A total of 1.3 million nursing staff, including Director of Nursing, Registered Nurse with Administrative Duties, Staff Registered Nurse, Licensed Practical Nurse, Certified Nurse Assistant, and other nursing staff, represented 66 percent of the total nursing facility workforce. Of these workers, the majority were Certified Nurse Assistants (59 percent of total nursing staff).

REPORT OF FINDINGS 2009 NURSING FACILITY STAFF RETENTION AND TURNOVER SURVEY
© May 2011, American Health Care Association 6
Table 1.1. Estimated Number of Nursing Facility Employees by Job Category, 2009
Number of Employees
Percentage
All Nursing Facility Employees 1,964,203 100.0%
Administrative and Management Staff 91,497 4.7%
Nursing Staff 1,294,265 65.9%
Therapy Staff 75,887 3.9%
Food Services Staff 231,020 11.8%
Housekeeping and Maintenance Staff 183,562 9.3%
Social Service and Activities Staff 87,971 4.5%
In 2009, the retention rate for all nursing facility employees was 53.1 percent. As shown in Table 1.2, the retention rates ranged from 49.4 to 71.1 percent across nursing facility job categories. The retention rate of nursing staff was the lowest among all nursing facility employees. The turnover rate for all nursing facility employees was 40.0 percent. Turnover rates exhibited a high degree of variability across all nursing facility job categories. As shown in table 1.2, turnover rates in nursing facilities were particularly high among nursing staff (45.2 percent) and were lowest for administrative staff (20.3 percent).
Table 1.2. Retention and Turnover Rates by Nursing Facility Job Category, 2009
Retention Turnover
All Nursing Facility Employees 53.1% 40.0%
Administrative and Management Staff 71.1% 20.3%
Nursing Staff 49.4% 45.2%
Therapy Staff 59.5% 30.8%
Food Services Staff 54.5% 37.7%
Housekeeping and Maintenance Staff 63.6% 28.0%
Social Services and Activities Staff 66.1% 24.7%
The findings from the 2009 Nursing Facility Staff Retention and Turnover Survey indicate that America’s nursing facilities continue to experience difficulties in retention of nursing staff in 2009.

REPORT OF FINDINGS 2009 NURSING FACILITY STAFF RETENTION AND TURNOVER SURVEY
© May 2011, American Health Care Association 7
Figure 1.1. Retention Rates of All Nursing Facility Employees by State, 2009

REPORT OF FINDINGS 2009 NURSING FACILITY STAFF RETENTION AND TURNOVER SURVEY
© May 2011, American Health Care Association 8
Figure 1.2. Turnover Rates of All Nursing Facility Employees by State, 2009

REPORT OF FINDINGS 2009 NURSING FACILITY STAFF RETENTION AND TURNOVER SURVEY
© May 2011, American Health Care Association 9
Figure 1.3. Retention Rates of Nursing Staff by State, 2009

REPORT OF FINDINGS 2009 NURSING FACILITY STAFF RETENTION AND TURNOVER SURVEY
© May 2011, American Health Care Association 10
State specific turnover rates for nursing staff ranged from a low of 16.0 percent to a high of 91.2 percent, a difference of 75.2 percentage points (see the figure below).
Figure 1.4. Turnover Rates of Nursing Staff by State, 2009

REPORT OF FINDINGS 2009 NURSING FACILITY STAFF RETENTION AND TURNOVER SURVEY
© May 2011, American Health Care Association 11
2.0
RETENTION AND TURNOVER OF NURSING STAFF
In 2009, an estimated 1.3 million workers were employed as nursing staff in more than 15,000 nursing facilities nationwide. Nursing staff, including Director of Nursing (DON), Registered Nurse with Administrative Duties (ARN), Staff Registered Nurse (RN), Licensed Practical Nurse (LPN), Certified Nurse Assistant (CNA), and other nursing staff, represented 66 percent of the total nursing facility workforce. Certified Nurse Assistants constituted the largest portion of entire nursing staff (see Figure 2.1). Figure 2.1. Percentage Breakdown of Nursing Staff by Job Position, 2009
Table 2.1. Estimated Number of Nursing Staff by Job Position, 2009
Number Percentage
All Nursing Staff 1,294,265 100.0%
Director of Nursing (DON) 15,625 1.2%
RN with Administrative Duties (ARN) 33,874 2.6%
Staff Registered Nurse (RN) 119,260 9.2%
Licensed Practical Nurse (LPN) 260,973 20.2%
Certified Nurse Assistant (CNA) 764,049 59.0%
Other Nursing Staff 100,484 7.8%

REPORT OF FINDINGS 2009 NURSING FACILITY STAFF RETENTION AND TURNOVER SURVEY
© May 2011, American Health Care Association 12
2.1 Retention of Nursing Staff
In 2009, the overall retention rate for nursing staff was 49.4 percent. The nursing staff retention rate was the lowest among all nursing facility employees. Retention rates exhibited variability across the nursing positions. Figure 2.2 shows retention rates of nursing staff by major job positions. Retention rates were highest for the MDS Coordinators (70.5 percent) and lowest among Staff RNs (47.5 percent). The low level of retention among Staff RNs, LPNs and CNAs illustrated the difficulty that nursing facilities had in retaining direct care staff, particularly for Staff RNs and CNAs. Figure 2.2. Nursing Staff Retention Rates by Job Position, 2009
2.2 Turnover of Nursing Staff Turnover rates were high for most nursing job positions in 2009. Nationally, turnover rates exhibited a high degree of variability across nursing job positions. As shown in Figure 2.3, turnover rates in nursing facilities were particularly high among RNs (46.7 percent), CNAs (46.6 percent), and LPNs (41.8 percent). Meanwhile, the turnover rate for DONs was lowest at 25.3 percent. The low level of retention and the high level of turnover among CNAs continue to be a particular concern to nursing facilities as CNAs are responsible for much of the direct, hands-on resident care.

REPORT OF FINDINGS 2009 NURSING FACILITY STAFF RETENTION AND TURNOVER SURVEY
© May 2011, American Health Care Association 13
Figure 2.3. Nursing Staff Turnover Rates by Job Position, 2009
25.3%
36.3%
46.7%
41.8%
46.6%
20.0%
36.0%
Director of Nursing (DON)
RN with Administrative Duties
Staff Registered Nurse (RN)
Licensed Practical Nurse (LPN)
Certified Nurse Assistant (CNA)
MDS Coordinator
Staff Development Coordinator

REPORT OF FINDINGS 2009 NURSING FACILITY STAFF RETENTION AND TURNOVER SURVEY
© May 2011, American Health Care Association 14
3.0
RETENTION AND TURNOVER OF OTHER EMPLOYEES
In order to measure the extent of the difficulty that nursing facilities had in retaining their entire nursing facility workforce, the 2009 Nursing Facility Staff Retention and Turnover Survey also collected nationwide retention and turnover information among all nursing facilty employees.
3.1
RETENTION AND TURNOVER OF ADMINISTRATIVE AND MANAGEMENT STAFF
In 2009, an estimated 91,000 workers were employed as administrative and management staff, representing 4.7 percent of the total nursing facility workforce. Figure 3.1. Percentage Breakdown of Administrative and Management Staff by Job Position, 2009
In 2009, the retention rate for all administrative and management staff was 71.1 percent, the highest among all nursing facility employees. The overall turnover rate for administrative and management staff was 20.3 percent, the lowest among all nursing facility employee categories. Table 3.1. Administrative and Management Staff Retention and Turnover Rates, 2009
Retention Turnover
All Administrator & Management Staff 71.1% 20.3%
Administrator 71.0% 20.5%

REPORT OF FINDINGS 2009 NURSING FACILITY STAFF RETENTION AND TURNOVER SURVEY
© May 2011, American Health Care Association 15
Office Manager/Controller 76.9% 16.1%
Other Office Staff 69.9% 21.3%
3.2
RETENTION AND TURNOVER OF THERAPY STAFF
In 2009, an estimated 76,000 workers were employed by nursing facilities as therapy staff, representing 3.9 percent of the total nursing facility workforce. Employees of outside contractors are widely used as therapy staff at nursing facilities across the nation. Contract staff was not included in this survey. Figure 3.2. Percentage Breakdown of Therapy Staff by Job Position, 2009
In 2009, the retention rate for therapy staff was 59.5 percent. The overall turnover rate for therapy staff was 30.8 percent.
Table 3.2. Retention and Turnover Rates by Therapy Job Position, U.S., 2009
Retention Turnover
All Therapy Staff 59.5% 30.8%
Physical Therapist 58.2% 34.5%
Occupational Therapist 57.4% 34.5%
Speech /Language Therapist 54.2% 36.4%
Physical Therapy Aide 63.5% 23.7%
Occupational Therapy Aide 64.5% 26.8%
Speech Therapy Aide 73.3% 7.1%

REPORT OF FINDINGS 2009 NURSING FACILITY STAFF RETENTION AND TURNOVER SURVEY
© May 2011, American Health Care Association 16
3.3
RETENTION AND TURNOVER OF FOOD SERVICES STAFF
In 2009, an estimated 231,000 workers were employed as food services staff, representing 11.8 percent of the total nursing facility workforce.
Figure 3.3. Percentage Breakdown of Food Services Staff by Job Position, 2009
In 2009, the retention rate for food services staff was 54.5 percent, the second lowest among all nursing facility employees (see page 6, table 1.2). The overall turnover rate for food services staff was 37.7 percent.
Table 3.3. Retention and Turnover Rates by Food Services Job Position, 2009
Retention Turnover
All Food Service Staff 54.5% 37.7%
Dietician Supervisor 73.2% 17.0%
Other Food Service Staff 53.3% 39.2%

REPORT OF FINDINGS 2009 NURSING FACILITY STAFF RETENTION AND TURNOVER SURVEY
© May 2011, American Health Care Association 17
3.4
RETENTION AND TURNOVER OF
HOUSEKEEPING AND MAINTENANCE STAFF
In 2009, an estimated 184,000 workers were employed as housekeeping and maintenance staff, representing 9.3 percent of the total nursing facility workforce.
Figure 3.4. Percentage Breakdown of Housekeeping and Maintenance Staff by Job Position, 2009
In 2009, the retention rate for housekeeping and maintenance staff was 63.6 percent. The overall turnover rate for housekeeping and maintenance staff was 28.0 percent.
Table 3.4. Retention and Turnover Rates by Housekeeping and Maintenance Job Position, U.S., 2009
Retention Turnover
All Housekeeping & Maintenance Staff 63.6% 28.0%
Housekeeping Staff 60.6% 31.4%
Laundry Staff 66.0% 25.5%
Maintenance Staff 70.1% 21.1%

REPORT OF FINDINGS 2009 NURSING FACILITY STAFF RETENTION AND TURNOVER SURVEY
© May 2011, American Health Care Association 18
3.5
RETENTION AND TURNOVER OF SOCIAL SERVICES
AND ACTIVITIES STAFF
In 2009, an estimated 88,000 workers were employed as social services and activities staff, representing 4.5 percent of the total nursing facility workforce.
Figure 3.5. Percentage Breakdown of Social Services and Activities Staff by Job Position, 2009
In 2009, the retention rate for social services and activities staff was 66.1 percent, the second highest among all nursing facility employees (see page 6, table 1.2). The overall turnover rate for social services and activities staff was 24.7 percent.
Table 3.5. Retention and Turnover Rates by Social Services and Activities Job Position, U.S., 2009
Retention Turnover
All Social Service & Activities Staff 66.1% 24.7%
Activity Director 77.6% 15.1%
Activity Staff 61.7% 29.2%
Social Service Director 72.7% 18.6%
Social Service Staff 63.9% 26.1%

REPORT OF FINDINGS 2009 NURSING FACILITY STAFF RETENTION AND TURNOVER SURVEY
© May 2011, American Health Care Association 19
4.0
SURVEY METHODOLOGY
2009 Nursing Facility Staff Retention and Turnover Survey collects nationwide retention and turnover information among nursing facilty employees of six major job category and twenty-nine job positions (see the table below).
Nursing Facility Job Category Nursing Facility Job Position
Administrative & Management
Administrator
Office Manager/Controller
Other Office Staff
Nursing
Director of Nursing (DON)
Assistant Director of Nursing (ADON)
RN with Administrative Duties
Staff Registered Nurse (RN)
Licensed Practical Nurse (LPN)
Certified Nurse Assistant (CNA)
Non-Certified Nurse Aide, if applicable
MDS Coordinator
Staff Development Coordinator
Other Nursing Staff – Clinical Support
Unit Clerical Support
Therapy
Physical Therapist
Occupational Therapist
Speech Therapist/Language Pathologist
Physical Therapy Aide
Occupational Therapy Aide
Speech Therapy Aide
Food Services Dietician Supervisor
Other Food Service Staff
Housekeeping & Maintenance
Housekeeping Staff
Laundry Staff
Maintenance Staff
Social Activities
Activity Director
Activity Staff
Social Service Director
Social Service Staff

REPORT OF FINDINGS 2009 NURSING FACILITY STAFF RETENTION AND TURNOVER SURVEY
© May 2011, American Health Care Association 20
The survey questionnaire was used to collect three pieces of nursing facility staff information:
• Number of total current employees - the total number of persons on the payroll who worked or received pay as of December 31, 2009. All full-time, part-time, permanent, short-term, seasonal, salaried, and hourly employees were included. Employees of temporary help agencies and outside contractors were excluded because they are counted by their employer of record, not by the nursing facility where they are working.
• Total number of employees who had worked in the facility for 12 months or longer - should not
include employee(s) who had changed her/his job position within the same facility in the 12 months. For example, if the facility administrator left during 2009 and was replaced by the individual in the director of nursing position, the number of employees in this column would be reported as 0 for both the administrator and director of nursing positions.
• Total number of employees who had worked in the facility during calendar year 2009.
In this report, we present aggregated results for the all job categories. We also report results for selected job positions, particularly for all major nursing staff positions. Data for some job positions was insufficient for analysis. Data for the state of Alaska and the District of Columbia was insufficient to generate state level analysis. To ensure the reliability of the data, frequency distributions were examined and data was omitted from the analysis where individual responses were out of range or a combination of responses were deemed implausible through contingency checks. In cases where implausible or out of range data was detected, responses were omitted from analysis for the specific job position, except where noted otherwise. Results were adjusted to provide estimates representing the universe of nursing facilities eligible to participate in the survey. Population weights were calculated and applied for nursing facilities related to retention and turnover rates. Population adjustment factors were calculated in each job-specific analysis of retention and turnover by dividing the number of facilities in the population within each category by the number of responding facilities in the category with usable data. The resulting factors were incorporated into the calculation of retention and turnover rate estimates. All retention and turnover rates are presented in this report as percentages. Retention rates were calculated by dividing the total number of employees who had worked in the nursing facility for 12 months or longer as of December 31, 2009 by the total number of employees during calendar year 2009. Turnover rates were calculated by dividing the total number of terminations in 2009 by the total number of employees as of December 31, 2009. AHCA has conducted several national surveys about nursing staff since 2002. However, survey-to-survey comparison can be complex or even potentially misinterpreted by the different nursing facilities that participated in surveys.

REPORT OF FINDINGS 2009 NURSING FACILITY STAFF RETENTION AND TURNOVER SURVEY, APPENDIX A
© May 2011, American Health Care Association Appendix A 1
Appendix A
TABLES OF RETENTION AND TURNOVER RATES
BY JOB CATEGORY AND JOB POSITION

REPORT OF FINDINGS 2009 NURSING FACILITY STAFF RETENTION AND TURNOVER SURVEY, APPENDIX A
© May 2011, American Health Care Association Appendix A 2
1.
RETENTION AND TURNOVER RATES OF ADMINISTRATIVE
AND MANAGEMENT STAFF
Table A1. Administrative and Management – All
Retention Turnover Retention Turnover
United States 71.1% 20.3% Mississippi 72.0% 22.8%
Alaska* Montana 72.4% 20.7%
Alabama 74.4% 16.1% North Carolina 65.6% 25.5%
Arkansas 72.4% 18.7% North Dakota 85.7% 8.5%
Arizona 64.0% 30.8% Nebraska 71.6% 25.0%
California 69.9% 19.8% New Hampshire 73.3% 20.4%
Colorado 59.9% 34.7% New Jersey 80.1% 11.9%
Connecticut 70.3% 19.9% New Mexico 51.4% 43.4%
District of Columbia* Nevada 52.7% 54.3%
Delaware 69.8% 12.0% New York 86.9% 7.8%
Florida 68.9% 17.5% Ohio 74.3% 13.6%
Georgia 75.6% 18.5% Oklahoma 61.5% 32.3%
Hawaii 75.7% 7.7% Oregon 54.2% 53.7%
Iowa 77.8% 14.7% Pennsylvania 75.1% 16.2%
Idaho 83.9% 10.7% Rhode Island 81.4% 17.2%
Illinois 60.1% 29.2% South Carolina 76.7% 34.3%
Indiana 63.2% 23.4% South Dakota 91.6% 3.5%
Kansas 68.3% 21.0% Tennessee 74.3% 15.7%
Kentucky 66.1% 26.7% Texas 54.6% 44.2%
Louisiana 66.9% 25.0% Utah 59.8% 34.9%
Massachusetts 68.7% 23.0% Virginia 73.9% 19.4%
Maryland 63.7% 25.2% Vermont 78.6% 15.1%
Maine 73.0% 18.4% Washington 64.0% 26.6%
Michigan 80.4% 7.1% Wisconsin 77.1% 13.3%
Minnesota 84.9% 12.0% West Virginia 69.9% 23.0%
Missouri 71.2% 20.4% Wyoming 62.5% 41.2%
* Data is insufficient for meaningful analysis.

REPORT OF FINDINGS 2009 NURSING FACILITY STAFF RETENTION AND TURNOVER SURVEY, APPENDIX A
© May 2011, American Health Care Association Appendix A 3
Table A2. Administrative and Management – Administrator
Retention Turnover Retention Turnover
United States 71.0% 20.5% Mississippi 68.4% 18.8%
Alaska* Montana 71.4% 27.3%
Alabama 75.2% 16.7% North Carolina 74.2% 18.7%
Arkansas 83.3% 9.1% North Dakota 93.9% 3.1%
Arizona 60.6% 32.0% Nebraska 84.0% 16.3%
California 72.1% 17.1% New Hampshire 72.3% 20.5%
Colorado 44.2% 48.6% New Jersey 86.2% 5.5%
Connecticut 54.7% 36.2% New Mexico 52.6% 40.7%
District of Columbia* Nevada 61.1% 28.6%
Delaware 50.0% 11.1% New York 88.6% 6.0%
Florida 65.1% 26.5% Ohio 75.3% 12.4%
Georgia 72.4% 19.1% Oklahoma 61.1% 36.1%
Hawaii 90.0% 0.0% Oregon 52.8% 53.2%
Iowa 83.3% 10.2% Pennsylvania 71.4% 16.7%
Idaho 72.4% 20.8% Rhode Island 91.9% 5.7%
Illinois 81.8% 11.9% South Carolina 86.4% 57.1%
Indiana 63.3% 27.1% South Dakota 100.0% 0.0%
Kansas 62.9% 22.8% Tennessee 71.0% 22.0%
Kentucky 62.5% 24.1% Texas 55.4% 45.4%
Louisiana 70.0% 17.6% Utah 58.8% 41.7%
Massachusetts 64.7% 27.2% Virginia 65.2% 15.0%
Maryland 71.4% 14.8% Vermont 83.3% 20.0%
Maine 77.8% 18.4% Washington 63.0% 39.4%
Michigan 81.0% 7.4% Wisconsin 71.0% 16.3%
Minnesota 91.4% 5.2% West Virginia 67.7% 17.0%
Missouri 68.7% 25.3% Wyoming 71.4% 16.7%
* Data is insufficient for meaningful analysis.

REPORT OF FINDINGS 2009 NURSING FACILITY STAFF RETENTION AND TURNOVER SURVEY, APPENDIX A
© May 2011, American Health Care Association Appendix A 4
2.
RETENTION AND TURNOVER RATES OF NURSING STAFF
Table A3. Nursing Staff - All
Retention Turnover Retention Turnover
United States 49.4% 45.2% Mississippi 55.2% 33.2%
Alaska* Montana 41.7% 56.2%
Alabama 47.0% 50.5% North Carolina 42.3% 54.7%
Arkansas 35.2% 75.7% North Dakota 59.3% 27.7%
Arizona 43.0% 58.0% Nebraska 46.0% 48.9%
California 59.5% 30.2% New Hampshire 53.8% 41.4%
Colorado 40.5% 60.8% New Jersey 58.4% 34.6%
Connecticut 63.9% 29.0% New Mexico 31.3% 91.2%
District of Columbia* Nevada 34.0% 76.4%
Delaware 54.6% 34.8% New York 67.5% 20.5%
Florida 55.8% 36.6% Ohio 50.3% 41.1%
Georgia 52.7% 38.7% Oklahoma 25.5% 89.9%
Hawaii 71.2% 16.0% Oregon 43.1% 64.6%
Iowa 58.2% 28.6% Pennsylvania 54.7% 37.5%
Idaho 40.2% 61.1% Rhode Island 58.2% 38.1%
Illinois 48.1% 41.8% South Carolina 51.9% 40.6%
Indiana 41.3% 57.0% South Dakota 49.4% 44.3%
Kansas 34.8% 64.5% Tennessee 47.7% 46.8%
Kentucky 38.7% 66.5% Texas 33.0% 82.7%
Louisiana 41.1% 40.1% Utah 35.1% 73.7%
Massachusetts 56.1% 39.0% Virginia 45.7% 52.8%
Maryland 51.8% 42.1% Vermont 49.5% 42.8%
Maine 53.8% 38.7% Washington 40.2% 56.4%
Michigan 54.9% 32.9% Wisconsin 50.5% 43.1%
Minnesota 52.1% 39.9% West Virginia 52.5% 45.6%
Missouri 37.4% 65.1% Wyoming 32.2% 90.8%
* Data is insufficient for meaningful analysis
REPORT OF FINDINGS 2009 NURSING FACILITY STAFF RETENTION AND TURNOVER SURVEY, APPENDIX A
© May 2011, American Health Care Association Appendix A 5
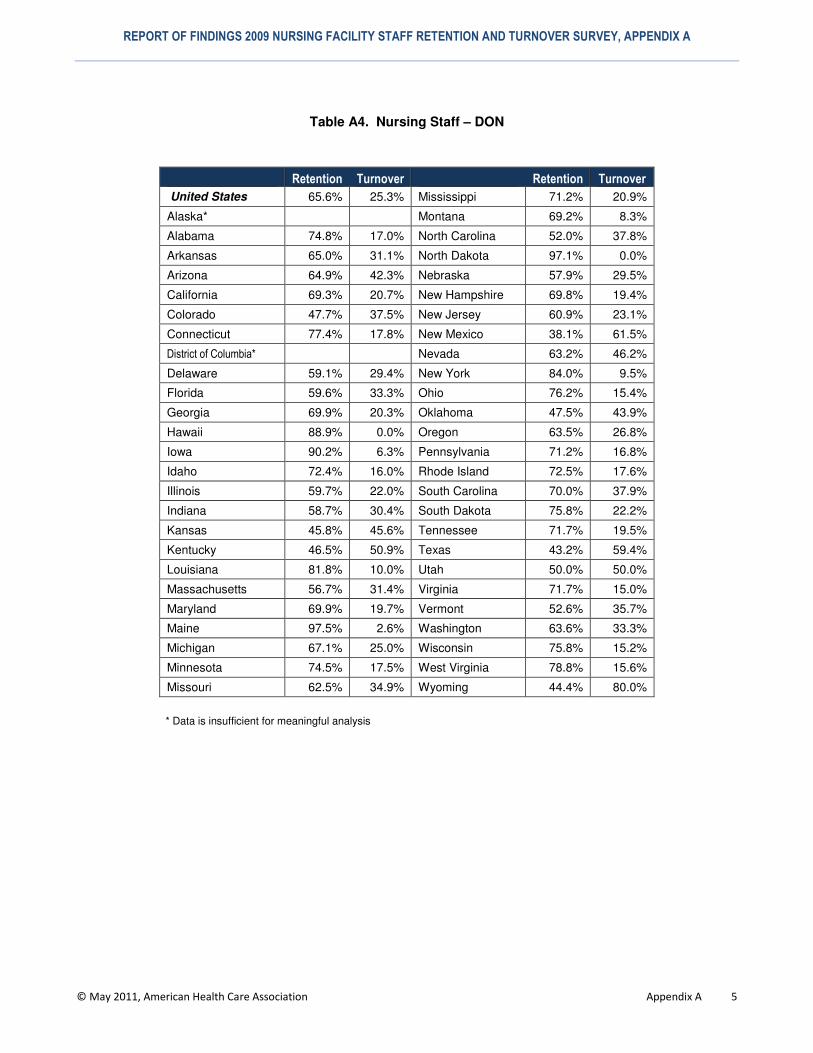
Table A4. Nursing Staff – DON
Retention Turnover Retention Turnover
United States 65.6% 25.3% Mississippi 71.2% 20.9%
Alaska* Montana 69.2% 8.3%
Alabama 74.8% 17.0% North Carolina 52.0% 37.8%
Arkansas 65.0% 31.1% North Dakota 97.1% 0.0%
Arizona 64.9% 42.3% Nebraska 57.9% 29.5%
California 69.3% 20.7% New Hampshire 69.8% 19.4%
Colorado 47.7% 37.5% New Jersey 60.9% 23.1%
Connecticut 77.4% 17.8% New Mexico 38.1% 61.5%
District of Columbia* Nevada 63.2% 46.2%
Delaware 59.1% 29.4% New York 84.0% 9.5%
Florida 59.6% 33.3% Ohio 76.2% 15.4%
Georgia 69.9% 20.3% Oklahoma 47.5% 43.9%
Hawaii 88.9% 0.0% Oregon 63.5% 26.8%
Iowa 90.2% 6.3% Pennsylvania 71.2% 16.8%
Idaho 72.4% 16.0% Rhode Island 72.5% 17.6%
Illinois 59.7% 22.0% South Carolina 70.0% 37.9%
Indiana 58.7% 30.4% South Dakota 75.8% 22.2%
Kansas 45.8% 45.6% Tennessee 71.7% 19.5%
Kentucky 46.5% 50.9% Texas 43.2% 59.4%
Louisiana 81.8% 10.0% Utah 50.0% 50.0%
Massachusetts 56.7% 31.4% Virginia 71.7% 15.0%
Maryland 69.9% 19.7% Vermont 52.6% 35.7%
Maine 97.5% 2.6% Washington 63.6% 33.3%
Michigan 67.1% 25.0% Wisconsin 75.8% 15.2%
Minnesota 74.5% 17.5% West Virginia 78.8% 15.6%
Missouri 62.5% 34.9% Wyoming 44.4% 80.0%
* Data is insufficient for meaningful analysis

REPORT OF FINDINGS 2009 NURSING FACILITY STAFF RETENTION AND TURNOVER SURVEY, APPENDIX A
© May 2011, American Health Care Association Appendix A 6
Table A5. Nursing Staff – ARN
Retention Turnover Retention Turnover
United States 53.9% 36.3% Mississippi 45.1% 44.7%
Alaska* Montana 57.1% 40.0%
Alabama 46.8% 39.5% North Carolina 37.6% 49.1%
Arkansas 46.7% 41.5% North Dakota 90.4% 2.0%
Arizona 70.0% 5.3% Nebraska 37.7% 52.9%
California 47.9% 40.9% New Hampshire 80.4% 17.9%
Colorado 57.0% 47.6% New Jersey 81.2% 12.5%
Connecticut 60.1% 33.6% New Mexico 60.0% 25.0%
District of Columbia* Nevada 23.8% 133.3%
Delaware 93.5% 0.0% New York 77.1% 17.6%
Florida 57.1% 33.8% Ohio 64.7% 29.1%
Georgia 48.4% 41.9% Oklahoma 40.7% 50.0%
Hawaii 84.4% 6.7% Oregon 42.6% 75.2%
Iowa 66.7% 28.6% Pennsylvania 51.0% 38.3%
Idaho 100.0% 0.0% Rhode Island 75.8% 15.8%
Illinois 82.0% 16.3% South Carolina 57.1% 35.5%
Indiana 44.7% 45.2% South Dakota 52.1% 35.7%
Kansas 33.1% 63.5% Tennessee 60.7% 22.7%
Kentucky 44.4% 48.8% Texas 51.6% 37.8%
Louisiana 53.3% 25.0% Utah 100.0% 0.0%
Massachusetts 54.1% 39.5% Virginia 44.3% 43.6%
Maryland 42.1% 56.7% Vermont 75.0% 14.3%
Maine 70.0% 15.9% Washington 55.6% 43.2%
Michigan 68.0% 22.5% Wisconsin 48.7% 43.3%
Minnesota 55.4% 29.5% West Virginia 40.0% 66.7%
Missouri 48.4% 38.5% Wyoming 100.0% 0.0%
* Data is insufficient for meaningful analysis.

REPORT OF FINDINGS 2009 NURSING FACILITY STAFF RETENTION AND TURNOVER SURVEY, APPENDIX A
© May 2011, American Health Care Association Appendix A 7
Table A6. Nursing Staff – RN
Retention Turnover Retention Turnover
United States 47.5% 46.7% Mississippi 44.8% 53.4%
Alaska* Montana 41.7% 38.9%
Alabama 41.4% 62.8% North Carolina 36.5% 60.5%
Arkansas 48.1% 48.0% North Dakota 73.8% 14.8%
Arizona 36.1% 57.8% Nebraska 70.8% 14.3%
California 52.5% 33.6% New Hampshire 48.7% 44.5%
Colorado 38.5% 62.7% New Jersey 52.6% 40.0%
Connecticut 51.4% 47.2% New Mexico 28.5% 89.9%
District of Columbia* Nevada 26.4% 87.8%
Delaware 52.9% 32.9% New York 65.0% 22.1%
Florida 48.9% 52.6% Ohio 48.7% 46.6%
Georgia 48.7% 45.0% Oklahoma 26.7% 81.6%
Hawaii 61.1% 18.9% Oregon 34.2% 85.2%
Iowa 60.2% 26.7% Pennsylvania 51.3% 44.7%
Idaho 33.3% 68.5% Rhode Island 49.2% 47.9%
Illinois 51.3% 43.0% South Carolina 41.3% 62.4%
Indiana 33.7% 67.6% South Dakota 70.1% 33.3%
Kansas 41.4% 56.9% Tennessee 54.0% 41.2%
Kentucky 34.4% 78.1% Texas 33.0% 71.1%
Louisiana 58.0% 22.0% Utah 38.1% 61.6%
Massachusetts 49.7% 44.2% Virginia 41.0% 65.4%
Maryland 49.1% 45.6% Vermont 45.1% 53.7%
Maine 45.1% 52.7% Washington 46.0% 41.2%
Michigan 52.5% 37.1% Wisconsin 45.5% 49.3%
Minnesota 53.9% 32.8% West Virginia 42.5% 56.2%
Missouri 36.2% 62.4% Wyoming 34.3% 75.0%
* Data is insufficient for meaningful analysis.

REPORT OF FINDINGS 2009 NURSING FACILITY STAFF RETENTION AND TURNOVER SURVEY, APPENDIX A
© May 2011, American Health Care Association Appendix A 8
Table A7. Nursing Staff – LPN
Retention Turnover Retention Turnover
United States 52.4% 41.8% Mississippi 54.1% 37.9%
Alaska* Montana 53.5% 37.9%
Alabama 48.2% 49.2% North Carolina 48.3% 48.2%
Arkansas 44.6% 44.6% North Dakota 69.8% 20.5%
Arizona 48.2% 54.8% Nebraska 52.5% 41.9%
California 59.8% 33.6% New Hampshire 56.8% 40.7%
Colorado 41.4% 59.4% New Jersey 59.7% 37.3%
Connecticut 66.4% 27.8% New Mexico 35.8% 64.8%
District of Columbia* Nevada 38.9% 74.2%
Delaware 57.4% 33.7% New York 66.1% 21.9%
Florida 54.1% 41.7% Ohio 54.9% 36.0%
Georgia 52.5% 38.1% Oklahoma 33.5% 71.7%
Hawaii 71.3% 11.5% Oregon 38.0% 85.8%
Iowa 61.5% 23.7% Pennsylvania 59.1% 31.7%
Idaho 42.4% 60.2% Rhode Island 64.1% 35.8%
Illinois 46.5% 42.4% South Carolina 49.9% 41.0%
Indiana 47.1% 50.5% South Dakota 62.5% 24.7%
Kansas 37.9% 55.4% Tennessee 50.0% 41.8%
Kentucky 43.8% 56.8% Texas 35.0% 70.5%
Louisiana 41.3% 28.6% Utah 45.8% 62.4%
Massachusetts 57.6% 40.2% Virginia 51.0% 47.4%
Maryland 55.8% 41.9% Vermont 62.8% 29.1%
Maine 61.1% 36.0% Washington 43.9% 48.4%
Michigan 53.5% 35.0% Wisconsin 54.9% 39.4%
Minnesota 62.2% 32.4% West Virginia 57.3% 42.2%
Missouri 47.0% 48.3% Wyoming 50.0% 37.3%
* Data is insufficient for meaningful analysis.

REPORT OF FINDINGS 2009 NURSING FACILITY STAFF RETENTION AND TURNOVER SURVEY, APPENDIX A
© May 2011, American Health Care Association Appendix A 9
Table A8. Nursing Staff – CNAs
Retention Turnover Retention Turnover
United States 47.8% 46.6% Mississippi 56.6% 29.5%
Alaska* Montana 39.0% 65.0%
Alabama 47.4% 49.8% North Carolina 40.6% 58.5%
Arkansas 34.0% 77.3% North Dakota 52.8% 33.9%
Arizona 40.7% 61.6% Nebraska 39.4% 59.4%
California 60.3% 28.4% New Hampshire 53.4% 42.3%
Colorado 40.4% 60.8% New Jersey 59.0% 33.4%
Connecticut 65.4% 26.5% New Mexico 32.5% 87.0%
District of Columbia* Nevada 33.4% 69.6%
Delaware 52.3% 39.3% New York 67.2% 20.1%
Florida 57.3% 30.9% Ohio 47.0% 44.3%
Georgia 52.0% 40.2% Oklahoma 21.1% 95.4%
Hawaii 71.8% 17.4% Oregon 44.2% 56.8%
Iowa 54.6% 31.7% Pennsylvania 53.2% 39.3%
Idaho 41.6% 55.3% Rhode Island 57.4% 39.0%
Illinois 45.7% 43.6% South Carolina 51.9% 39.0%
Indiana 37.6% 61.8% South Dakota 44.2% 51.3%
Kansas 30.9% 71.0% Tennessee 44.4% 51.0%
Kentucky 35.9% 72.1% Texas 30.0% 91.9%
Louisiana 36.1% 50.1% Utah 36.0% 65.8%
Massachusetts 56.2% 38.3% Virginia 42.9% 56.4%
Maryland 50.3% 43.0% Vermont 44.5% 49.0%
Maine 53.1% 38.3% Washington 37.1% 60.7%
Michigan 53.8% 32.7% Wisconsin 49.0% 44.8%
Minnesota 46.5% 46.9% West Virginia 53.0% 45.4%
Missouri 34.4% 68.9% Wyoming 35.1% 77.4%
* Data is insufficient for meaningful analysis.
REPORT OF FINDINGS 2009 NURSING FACILITY STAFF RETENTION AND TURNOVER SURVEY, APPENDIX A
© May 2011, American Health Care Association Appendix A 10
3.
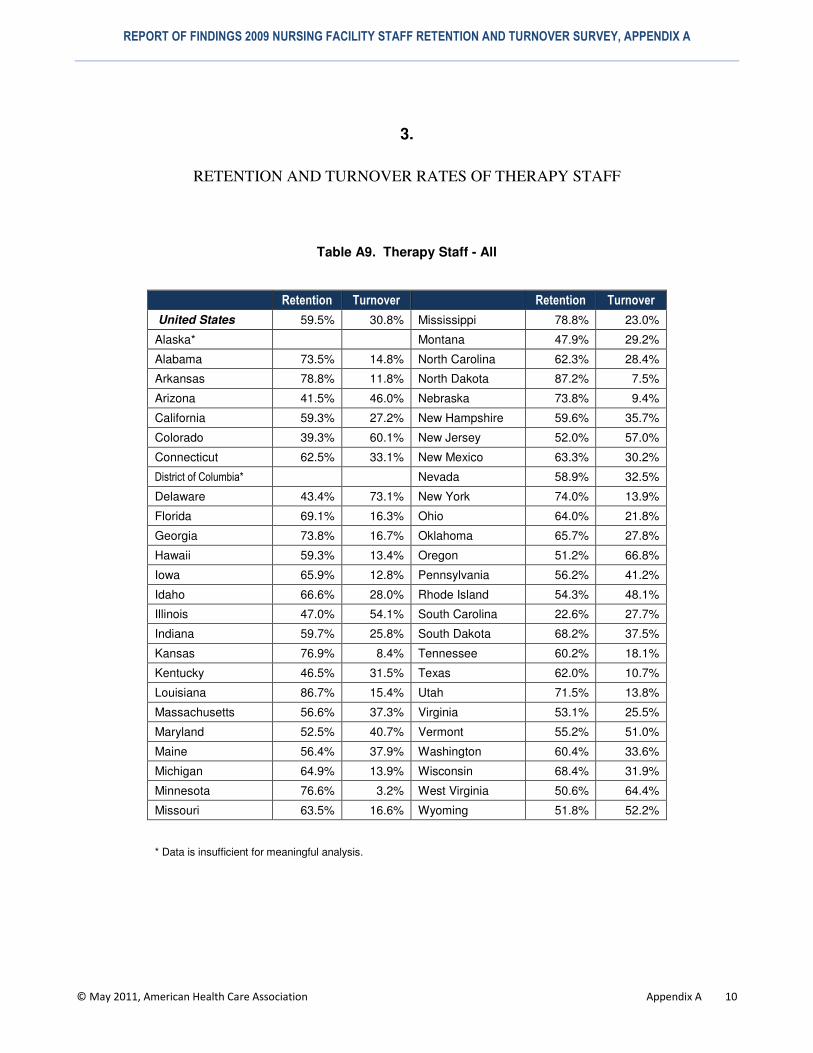
RETENTION AND TURNOVER RATES OF THERAPY STAFF
Table A9. Therapy Staff - All
Retention Turnover Retention Turnover
United States 59.5% 30.8% Mississippi 78.8% 23.0%
Alaska* Montana 47.9% 29.2%
Alabama 73.5% 14.8% North Carolina 62.3% 28.4%
Arkansas 78.8% 11.8% North Dakota 87.2% 7.5%
Arizona 41.5% 46.0% Nebraska 73.8% 9.4%
California 59.3% 27.2% New Hampshire 59.6% 35.7%
Colorado 39.3% 60.1% New Jersey 52.0% 57.0%
Connecticut 62.5% 33.1% New Mexico 63.3% 30.2%
District of Columbia* Nevada 58.9% 32.5%
Delaware 43.4% 73.1% New York 74.0% 13.9%
Florida 69.1% 16.3% Ohio 64.0% 21.8%
Georgia 73.8% 16.7% Oklahoma 65.7% 27.8%
Hawaii 59.3% 13.4% Oregon 51.2% 66.8%
Iowa 65.9% 12.8% Pennsylvania 56.2% 41.2%
Idaho 66.6% 28.0% Rhode Island 54.3% 48.1%
Illinois 47.0% 54.1% South Carolina 22.6% 27.7%
Indiana 59.7% 25.8% South Dakota 68.2% 37.5%
Kansas 76.9% 8.4% Tennessee 60.2% 18.1%
Kentucky 46.5% 31.5% Texas 62.0% 10.7%
Louisiana 86.7% 15.4% Utah 71.5% 13.8%
Massachusetts 56.6% 37.3% Virginia 53.1% 25.5%
Maryland 52.5% 40.7% Vermont 55.2% 51.0%
Maine 56.4% 37.9% Washington 60.4% 33.6%
Michigan 64.9% 13.9% Wisconsin 68.4% 31.9%
Minnesota 76.6% 3.2% West Virginia 50.6% 64.4%
Missouri 63.5% 16.6% Wyoming 51.8% 52.2%
* Data is insufficient for meaningful analysis.
REPORT OF FINDINGS 2009 NURSING FACILITY STAFF RETENTION AND TURNOVER SURVEY, APPENDIX A
© May 2011, American Health Care Association Appendix A 11
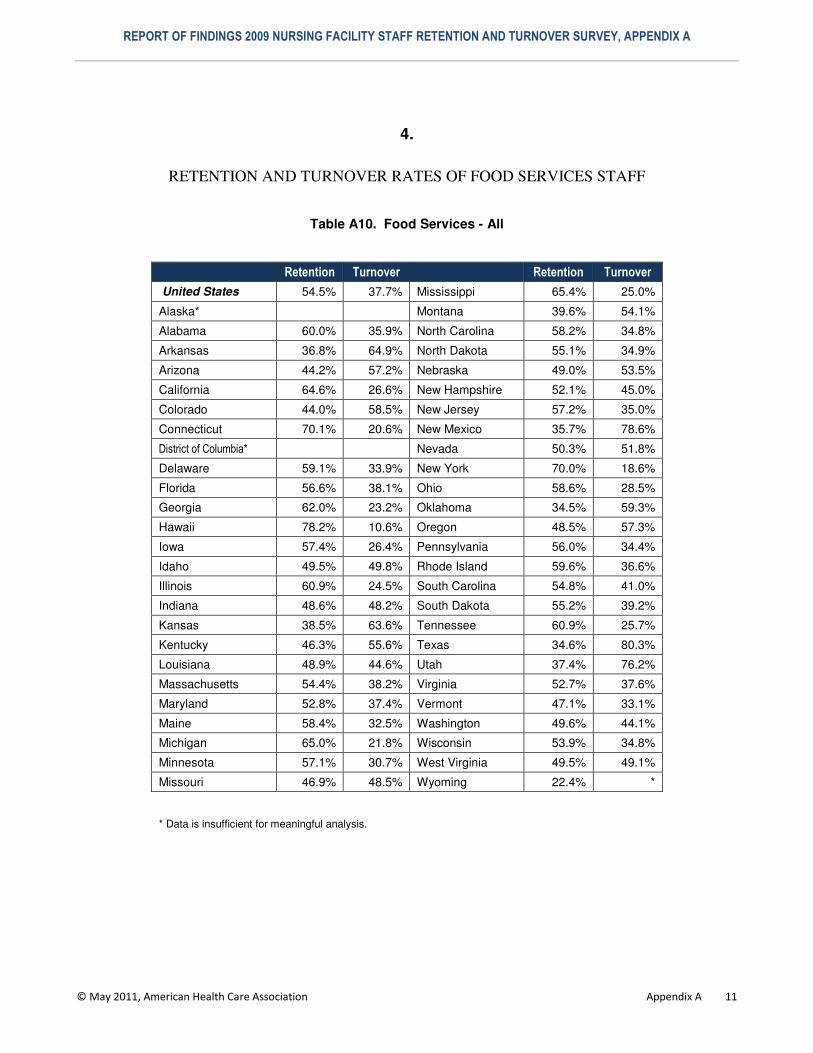
4.
RETENTION AND TURNOVER RATES OF FOOD SERVICES STAFF
Table A10. Food Services - All
Retention Turnover Retention Turnover
United States 54.5% 37.7% Mississippi 65.4% 25.0%
Alaska* Montana 39.6% 54.1%
Alabama 60.0% 35.9% North Carolina 58.2% 34.8%
Arkansas 36.8% 64.9% North Dakota 55.1% 34.9%
Arizona 44.2% 57.2% Nebraska 49.0% 53.5%
California 64.6% 26.6% New Hampshire 52.1% 45.0%
Colorado 44.0% 58.5% New Jersey 57.2% 35.0%
Connecticut 70.1% 20.6% New Mexico 35.7% 78.6%
District of Columbia* Nevada 50.3% 51.8%
Delaware 59.1% 33.9% New York 70.0% 18.6%
Florida 56.6% 38.1% Ohio 58.6% 28.5%
Georgia 62.0% 23.2% Oklahoma 34.5% 59.3%
Hawaii 78.2% 10.6% Oregon 48.5% 57.3%
Iowa 57.4% 26.4% Pennsylvania 56.0% 34.4%
Idaho 49.5% 49.8% Rhode Island 59.6% 36.6%
Illinois 60.9% 24.5% South Carolina 54.8% 41.0%
Indiana 48.6% 48.2% South Dakota 55.2% 39.2%
Kansas 38.5% 63.6% Tennessee 60.9% 25.7%
Kentucky 46.3% 55.6% Texas 34.6% 80.3%
Louisiana 48.9% 44.6% Utah 37.4% 76.2%
Massachusetts 54.4% 38.2% Virginia 52.7% 37.6%
Maryland 52.8% 37.4% Vermont 47.1% 33.1%
Maine 58.4% 32.5% Washington 49.6% 44.1%
Michigan 65.0% 21.8% Wisconsin 53.9% 34.8%
Minnesota 57.1% 30.7% West Virginia 49.5% 49.1%
Missouri 46.9% 48.5% Wyoming 22.4% *
* Data is insufficient for meaningful analysis.

REPORT OF FINDINGS 2009 NURSING FACILITY STAFF RETENTION AND TURNOVER SURVEY, APPENDIX A
© May 2011, American Health Care Association Appendix A 12
5.
RETENTION AND TURNOVER RATES OF
HOUSEKEEPING AND MAINTENANCE STAFF
Table A11. Housekeeping and Maintenance Staff - All
Retention Turnover Retention Turnover
United States 63.6% 28.0% Mississippi 71.7% 13.7%
Alaska* Montana 45.1% 52.6%
Alabama 73.9% 18.4% North Carolina 60.5% 31.2%
Arkansas 43.2% 55.9% North Dakota 69.8% 18.3%
Arizona 56.7% 41.3% Nebraska 67.8% 24.6%
California 69.6% 21.4% New Hampshire 68.4% 24.8%
Colorado 40.6% 60.4% New Jersey 65.6% 25.4%
Connecticut 76.7% 16.9% New Mexico 32.0% 68.5%
District of Columbia* Nevada 45.8% 40.7%
Delaware 55.6% 27.9% New York 82.1% 13.5%
Florida 68.9% 24.1% Ohio 65.9% 22.2%
Georgia 70.3% 21.1% Oklahoma 39.7% 67.3%
Hawaii 83.6% 10.6% Oregon 62.2% 39.6%
Iowa 73.7% 16.8% Pennsylvania 70.0% 18.9%
Idaho 57.5% 35.7% Rhode Island 73.2% 20.4%
Illinois 64.7% 24.6% South Carolina 74.6% 12.0%
Indiana 60.5% 34.5% South Dakota 59.1% 32.7%
Kansas 50.3% 37.5% Tennessee 66.2% 22.1%
Kentucky 52.2% 47.5% Texas 39.9% 67.8%
Louisiana 52.0% 31.4% Utah 47.7% 55.3%
Massachusetts 65.7% 27.4% Virginia 64.3% 28.5%
Maryland 66.1% 24.9% Vermont 57.8% 23.9%
Maine 67.8% 23.4% Washington 50.3% 42.1%
Michigan 74.8% 15.5% Wisconsin 67.9% 23.2%
Minnesota 70.8% 22.8% West Virginia 69.0% 23.5%
Missouri 53.3% 39.9% Wyoming 36.2% 99.6%
* Data is insufficient for meaningful analysis.

REPORT OF FINDINGS 2009 NURSING FACILITY STAFF RETENTION AND TURNOVER SURVEY, APPENDIX A
© May 2011, American Health Care Association Appendix A 13
6.
RETENTION AND TURNOVER RATES OF
SOCIAL SERVICES AND ACTIVITIES STAFF
Table A12. Social Services and Activities Staff - All
Retention Turnover Retention Turnover
United States 66.1% 24.7% Mississippi 76.8% 15.6%
Alaska* Montana 65.5% 17.7%
Alabama 70.9% 16.4% North Carolina 62.0% 28.5%
Arkansas 67.9% 32.6% North Dakota 74.8% 16.3%
Arizona 60.2% 39.2% Nebraska 61.4% 31.9%
California 67.0% 25.7% New Hampshire 64.7% 27.8%
Colorado 50.6% 48.9% New Jersey 63.4% 27.0%
Connecticut 73.7% 18.0% New Mexico 46.4% 49.2%
District of Columbia* Nevada 39.7% 76.2%
Delaware 54.9% 33.4% New York 81.1% 12.2%
Florida 79.4% 14.7% Ohio 67.5% 20.7%
Georgia 72.8% 16.1% Oklahoma 53.4% 44.1%
Hawaii 84.3% 6.9% Oregon 53.7% 51.2%
Iowa 84.4% 9.2% Pennsylvania 69.2% 20.9%
Idaho 67.7% 21.4% Rhode Island 65.0% 31.0%
Illinois 65.4% 22.2% South Carolina 68.0% 23.7%
Indiana 61.8% 28.6% South Dakota 69.3% 16.5%
Kansas 59.2% 24.1% Tennessee 67.2% 19.6%
Kentucky 64.0% 24.9% Texas 54.6% 37.3%
Louisiana 79.5% 8.5% Utah 67.3% 33.6%
Massachusetts 59.9% 31.9% Virginia 68.5% 20.4%
Maryland 56.5% 34.7% Vermont 70.8% 20.3%
Maine 67.3% 27.6% Washington 64.2% 26.0%
Michigan 69.6% 16.3% Wisconsin 65.2% 23.6%
Minnesota 76.2% 16.6% West Virginia 65.3% 28.5%
Missouri 67.3% 23.7% Wyoming 42.0% 60.8%
* Data is insufficient for meaningful analysis.

REPORT OF FINDINGS 2009 NURSING FACILITY STAFF RETENTION AND TURNOVER SURVEY, APPEDIX B
ALABAMAALABAMAALABAMAALABAMA
Retention and Turnover Rates of Nursing Facility Employees by Job Category and Nursing Job Position, 2009
RETENTION RATE TURNOVER RATE
STATE U.S. STATE U.S.
All Nursing Facility Employees 52.4% 53.1% 42.7% 40.0%
Administrative and Management Staff 74.4% 71.1% 16.1% 20.3%
Nursing Staff 47.0% 49.4% 50.5% 45.2%
Therapy Staff 73.5% 59.5% 14.8% 30.8%
Food Services Staff 60.0% 54.5% 35.9% 37.7%
Housekeeping and Maintenance Staff 73.9% 63.6% 18.4% 28.0%
Social Services and Activities Staff 70.9% 66.1% 16.4% 24.7%
Nursing Staff
Director of Nursing (DON) 74.8% 65.6% 17.0% 25.3%
RN with Administrative Duties (ARN) 46.8% 53.9% 39.5% 36.3%
Staff Registered Nurse (RN) 41.4% 47.5% 62.8% 46.7%
Licensed Practical Nurse (LPN) 48.2% 52.4% 49.2% 41.8%
Certified Nurse Assistant (CNA) 47.4% 47.8% 49.8% 46.6%
Estimated Number and Percentage* of Nursing Facility Employees
by Job Category and Nursing Job Position, 2009
STATE UNITED STATES
All Nursing Facility Employees 29,766 100.0% 1,964,203 100.0%
Administrative and Management Staff 1,169 3.9% 91,497 4.7%
Nursing Staff 21,163 71.1% 1,294,265 65.9%
Therapy Staff 395 1.3% 75,887 3.9%
Food Services Staff 2,836 9.5% 231,020 11.8%
Housekeeping and Maintenance Staff 3,139 10.5% 183,562 9.3%
Social Services and Activities Staff 1,064 3.6% 87,971 4.5%
Nursing Staff 21,163 100.0% 1,294,265 100.0%
Director of Nursing (DON) 223 1.1% 15,625 1.2%
RN with Administrative Duties (ARN) 699 3.3% 33,874 2.6%
Staff Registered Nurse (RN) 868 4.1% 119,260 9.2%
Licensed Practical Nurse (LPN) 4,993 23.6% 260,973 20.2%
Certified Nurse Assistant (CNA) 12,913 61.0% 764,049 59.0%
Other Nursing Staff 1,467 6.9% 100,484 7.8%
All retention and turnover statistics were produced by AHCA Research Department using data from 2009 AHCA Nursing Facility Staff
Retention and Turnover Survey. * May not add due to rounding.

REPORT OF FINDINGS 2009 NURSING FACILITY STAFF RETENTION AND TURNOVER SURVEY, APPEDIX B
ARKANSASARKANSASARKANSASARKANSAS
Retention and Turnover Rates of Nursing Facility Employees by Job Category and Nursing Job Position, 2009
RETENTION RATE TURNOVER RATE
STATE U.S. STATE U.S.
All Nursing Facility Employees 38.0% 53.1% 68.7% 40.0%
Administrative and Management Staff 72.4% 71.1% 18.7% 20.3%
Nursing Staff 35.2% 49.4% 75.7% 45.2%
Therapy Staff 78.8% 59.5% 11.8% 30.8%
Food Services Staff 36.8% 54.5% 64.9% 37.7%
Housekeeping and Maintenance Staff 43.2% 63.6% 55.9% 28.0%
Social Services and Activities Staff 67.9% 66.1% 32.6% 24.7%
Nursing Staff
Director of Nursing (DON) 65.0% 65.6% 31.1% 25.3%
RN with Administrative Duties (ARN) 46.7% 53.9% 41.5% 36.3%
Staff Registered Nurse (RN) 48.1% 47.5% 48.0% 46.7%
Licensed Practical Nurse (LPN) 44.6% 52.4% 44.6% 41.8%
Certified Nurse Assistant (CNA) 34.0% 47.8% 77.3% 46.6%
Estimated Number and Percentage* of Nursing Facility Employees
by Job Category and Nursing Job Position, 2009
STATE UNITED STATES
All Nursing Facility Employees 25,747 100.0% 1,964,203 100.0%
Administrative and Management Staff 771 3.0% 91,497 4.7%
Nursing Staff 18,268 71.0% 1,294,265 65.9%
Therapy Staff 290 1.1% 75,887 3.9%
Food Services Staff 2,595 10.1% 231,020 11.8%
Housekeeping and Maintenance Staff 3,179 12.3% 183,562 9.3%
Social Services and Activities Staff 643 2.5% 87,971 4.5%
Nursing Staff 18,268 100.0% 1,294,265 100.0%
Director of Nursing (DON) 234 1.3% 15,625 1.2%
RN with Administrative Duties (ARN) 222 1.2% 33,874 2.6%
Staff Registered Nurse (RN) 504 2.8% 119,260 9.2%
Licensed Practical Nurse (LPN) 3,998 21.9% 260,973 20.2%
Certified Nurse Assistant (CNA) 12,424 68.0% 764,049 59.0%
Other Nursing Staff 886 4.9% 100,484 7.8%
All retention and turnover statistics were produced by AHCA Research Department using data from 2009 AHCA Nursing Facility Staff
Retention and Turnover Survey. * May not add due to rounding.

REPORT OF FINDINGS 2009 NURSING FACILITY STAFF RETENTION AND TURNOVER SURVEY, APPEDIX B
ARIZONAARIZONAARIZONAARIZONA
Retention and Turnover Rates of Nursing Facility Employees by Job Category and Nursing Job Position, 2009
RETENTION RATE TURNOVER RATE
STATE U.S. STATE U.S.
All Nursing Facility Employees 45.9% 53.1% 53.5% 40.0%
Administrative and Management Staff 64.0% 71.1% 30.8% 20.3%
Nursing Staff 43.0% 49.4% 58.0% 45.2%
Therapy Staff 41.5% 59.5% 46.0% 30.8%
Food Services Staff 44.2% 54.5% 57.2% 37.7%
Housekeeping and Maintenance Staff 56.7% 63.6% 41.3% 28.0%
Social Services and Activities Staff 60.2% 66.1% 39.2% 24.7%
Nursing Staff
Director of Nursing (DON) 64.9% 65.6% 42.3% 25.3%
RN with Administrative Duties (ARN) 70.0% 53.9% 5.3% 36.3%
Staff Registered Nurse (RN) 36.1% 47.5% 57.8% 46.7%
Licensed Practical Nurse (LPN) 48.2% 52.4% 54.8% 41.8%
Certified Nurse Assistant (CNA) 40.7% 47.8% 61.6% 46.6%
Estimated Number and Percentage* of Nursing Facility Employees
by Job Category and Nursing Job Position, 2009
STATE UNITED STATES
All Nursing Facility Employees 18,393 100.0% 1,964,203 100.0%
Administrative and Management Staff 921 5.0% 91,497 4.7%
Nursing Staff 11,831 64.3% 1,294,265 65.9%
Therapy Staff 944 5.1% 75,887 3.9%
Food Services Staff 2,145 11.7% 231,020 11.8%
Housekeeping and Maintenance Staff 1,732 9.4% 183,562 9.3%
Social Services and Activities Staff 821 4.5% 87,971 4.5%
Nursing Staff 11,831 100.0% 1,294,265 100.0%
Director of Nursing (DON) 135 1.1% 15,625 1.2%
RN with Administrative Duties (ARN) 135 1.1% 33,874 2.6%
Staff Registered Nurse (RN) 1,382 11.7% 119,260 9.2%
Licensed Practical Nurse (LPN) 2,596 21.9% 260,973 20.2%
Certified Nurse Assistant (CNA) 6,537 55.3% 764,049 59.0%
Other Nursing Staff 1,045 8.8% 100,484 7.8%
All retention and turnover statistics were produced by AHCA Research Department using data from 2009 AHCA Nursing Facility Staff
Retention and Turnover Survey. * May not add due to rounding.

REPORT OF FINDINGS 2009 NURSING FACILITY STAFF RETENTION AND TURNOVER SURVEY, APPEDIX B
CALIFORNIACALIFORNIACALIFORNIACALIFORNIA
Retention and Turnover Rates of Nursing Facility Employees by Job Category and Nursing Job Position, 2009
RETENTION RATE TURNOVER RATE
STATE U.S. STATE U.S.
All Nursing Facility Employees 61.6% 53.1% 28.3% 40.0%
Administrative and Management Staff 69.9% 71.1% 19.8% 20.3%
Nursing Staff 59.5% 49.4% 30.2% 45.2%
Therapy Staff 59.3% 59.5% 27.2% 30.8%
Food Services Staff 64.6% 54.5% 26.6% 37.7%
Housekeeping and Maintenance Staff 69.6% 63.6% 21.4% 28.0%
Social Services and Activities Staff 67.0% 66.1% 25.7% 24.7%
Nursing Staff
Director of Nursing (DON) 69.3% 65.6% 20.7% 25.3%
RN with Administrative Duties (ARN) 47.9% 53.9% 40.9% 36.3%
Staff Registered Nurse (RN) 52.5% 47.5% 33.6% 46.7%
Licensed Practical Nurse (LPN) 59.8% 52.4% 33.6% 41.8%
Certified Nurse Assistant (CNA) 60.3% 47.8% 28.4% 46.6%
Estimated Number and Percentage* of Nursing Facility Employees
by Job Category and Nursing Job Position, 2009
STATE UNITED STATES
All Nursing Facility Employees 144,977 100.0% 1,964,203 100.0%
Administrative and Management Staff 8,123 5.6% 91,497 4.7%
Nursing Staff 99,621 68.7% 1,294,265 65.9%
Therapy Staff 4,112 2.8% 75,887 3.9%
Food Services Staff 14,642 10.1% 231,020 11.8%
Housekeeping and Maintenance Staff 11,980 8.3% 183,562 9.3%
Social Services and Activities Staff 6,500 4.5% 87,971 4.5%
Nursing Staff 99,621 100.0% 1,294,265 100.0%
Director of Nursing (DON) 1,256 1.3% 15,625 1.2%
RN with Administrative Duties (ARN) 2,868 2.9% 33,874 2.6%
Staff Registered Nurse (RN) 9,558 9.6% 119,260 9.2%
Licensed Practical Nurse (LPN) 14,934 15.0% 260,973 20.2%
Certified Nurse Assistant (CNA) 58,255 58.5% 764,049 59.0%
Other Nursing Staff 12,750 12.8% 100,484 7.8%
All retention and turnover statistics were produced by AHCA Research Department using data from 2009 AHCA Nursing Facility Staff
Retention and Turnover Survey. * May not add due to rounding.

REPORT OF FINDINGS 2009 NURSING FACILITY STAFF RETENTION AND TURNOVER SURVEY, APPEDIX B
COLORADOCOLORADOCOLORADOCOLORADO
Retention and Turnover Rates of Nursing Facility Employees by Job Category and Nursing Job Position, 2009
RETENTION RATE TURNOVER RATE
STATE U.S. STATE U.S.
All Nursing Facility Employees 42.1% 53.1% 58.6% 40.0%
Administrative and Management Staff 59.9% 71.1% 34.7% 20.3%
Nursing Staff 40.5% 49.4% 60.8% 45.2%
Therapy Staff 39.3% 59.5% 60.1% 30.8%
Food Services Staff 44.0% 54.5% 58.5% 37.7%
Housekeeping and Maintenance Staff 40.6% 63.6% 60.4% 28.0%
Social Services and Activities Staff 50.6% 66.1% 48.9% 24.7%
Nursing Staff
Director of Nursing (DON) 47.7% 65.6% 37.5% 25.3%
RN with Administrative Duties (ARN) 57.0% 53.9% 47.6% 36.3%
Staff Registered Nurse (RN) 38.5% 47.5% 62.7% 46.7%
Licensed Practical Nurse (LPN) 41.4% 52.4% 59.4% 41.8%
Certified Nurse Assistant (CNA) 40.4% 47.8% 60.8% 46.6%
Estimated Number and Percentage* of Nursing Facility Employees
by Job Category and Nursing Job Position, 2009
STATE UNITED STATES
All Nursing Facility Employees 24,346 100.0% 1,964,203 100.0%
Administrative and Management Staff 1,145 4.7% 91,497 4.7%
Nursing Staff 15,817 65.0% 1,294,265 65.9%
Therapy Staff 902 3.7% 75,887 3.9%
Food Services Staff 3,059 12.6% 231,020 11.8%
Housekeeping and Maintenance Staff 2,188 9.0% 183,562 9.3%
Social Services and Activities Staff 1,235 5.1% 87,971 4.5%
Nursing Staff 15,817 100.0% 1,294,265 100.0%
Director of Nursing (DON) 204 1.3% 15,625 1.2%
RN with Administrative Duties (ARN) 236 1.5% 33,874 2.6%
Staff Registered Nurse (RN) 2,179 13.8% 119,260 9.2%
Licensed Practical Nurse (LPN) 3,105 19.6% 260,973 20.2%
Certified Nurse Assistant (CNA) 9,260 58.5% 764,049 59.0%
Other Nursing Staff 833 5.3% 100,484 7.8%
All retention and turnover statistics were produced by AHCA Research Department using data from 2009 AHCA Nursing Facility Staff
Retention and Turnover Survey. * May not add due to rounding.

REPORT OF FINDINGS 2009 NURSING FACILITY STAFF RETENTION AND TURNOVER SURVEY, APPEDIX B
CONNECTICUTCONNECTICUTCONNECTICUTCONNECTICUT
Retention and Turnover Rates of Nursing Facility Employees by Job Category and Nursing Job Position, 2009
RETENTION RATE TURNOVER RATE
STATE U.S. STATE U.S.
All Nursing Facility Employees 66.2% 53.1% 26.3% 40.0%
Administrative and Management Staff 70.3% 71.1% 19.9% 20.3%
Nursing Staff 63.9% 49.4% 29.0% 45.2%
Therapy Staff 62.5% 59.5% 33.1% 30.8%
Food Services Staff 70.1% 54.5% 20.6% 37.7%
Housekeeping and Maintenance Staff 76.7% 63.6% 16.9% 28.0%
Social Services and Activities Staff 73.7% 66.1% 18.0% 24.7%
Nursing Staff
Director of Nursing (DON) 77.4% 65.6% 17.8% 25.3%
RN with Administrative Duties (ARN) 60.1% 53.9% 33.6% 36.3%
Staff Registered Nurse (RN) 51.4% 47.5% 47.2% 46.7%
Licensed Practical Nurse (LPN) 66.4% 52.4% 27.8% 41.8%
Certified Nurse Assistant (CNA) 65.4% 47.8% 26.5% 46.6%
Estimated Number and Percentage* of Nursing Facility Employees
by Job Category and Nursing Job Position, 2009
STATE UNITED STATES
All Nursing Facility Employees 43,990 100.0% 1,964,203 100.0%
Administrative and Management Staff 2,168 4.9% 91,497 4.7%
Nursing Staff 28,183 64.1% 1,294,265 65.9%
Therapy Staff 2,802 6.4% 75,887 3.9%
Food Services Staff 5,067 11.5% 231,020 11.8%
Housekeeping and Maintenance Staff 3,988 9.1% 183,562 9.3%
Social Services and Activities Staff 1,783 4.1% 87,971 4.5%
Nursing Staff 28,183 100.0% 1,294,265 100.0%
Director of Nursing (DON) 235 0.8% 15,625 1.2%
RN with Administrative Duties (ARN) 597 2.1% 33,874 2.6%
Staff Registered Nurse (RN) 3,707 13.2% 119,260 9.2%
Licensed Practical Nurse (LPN) 5,692 20.2% 260,973 20.2%
Certified Nurse Assistant (CNA) 16,411 58.2% 764,049 59.0%
Other Nursing Staff 1,542 5.5% 100,484 7.8%
All retention and turnover statistics were produced by AHCA Research Department using data from 2009 AHCA Nursing Facility Staff
Retention and Turnover Survey. * May not add due to rounding.

REPORT OF FINDINGS 2009 NURSING FACILITY STAFF RETENTION AND TURNOVER SURVEY, APPEDIX B
DELAWAREDELAWAREDELAWAREDELAWARE
Retention and Turnover Rates of Nursing Facility Employees by Job Category and Nursing Job Position, 2009
RETENTION RATE TURNOVER RATE
STATE U.S. STATE U.S.
All Nursing Facility Employees 55.3% 53.1% 34.3% 40.0%
Administrative and Management Staff 69.8% 71.1% 12.0% 20.3%
Nursing Staff 54.6% 49.4% 34.8% 45.2%
Therapy Staff 43.4% 59.5% 73.1% 30.8%
Food Services Staff 59.1% 54.5% 33.9% 37.7%
Housekeeping and Maintenance Staff 55.6% 63.6% 27.9% 28.0%
Social Services and Activities Staff 54.9% 66.1% 33.4% 24.7%
Nursing Staff
Director of Nursing (DON) 59.1% 65.6% 29.4% 25.3%
RN with Administrative Duties (ARN) 93.5% 53.9% 0.0% 36.3%
Staff Registered Nurse (RN) 52.9% 47.5% 32.9% 46.7%
Licensed Practical Nurse (LPN) 57.4% 52.4% 33.7% 41.8%
Certified Nurse Assistant (CNA) 52.3% 47.8% 39.3% 46.6%
Estimated Number and Percentage* of Nursing Facility Employees
by Job Category and Nursing Job Position, 2009
STATE UNITED STATES
All Nursing Facility Employees 7,210 100.0% 1,964,203 100.0%
Administrative and Management Staff 334 4.6% 91,497 4.7%
Nursing Staff 5,200 72.1% 1,294,265 65.9%
Therapy Staff 216 3.0% 75,887 3.9%
Food Services Staff 687 9.5% 231,020 11.8%
Housekeeping and Maintenance Staff 476 6.6% 183,562 9.3%
Social Services and Activities Staff 297 4.1% 87,971 4.5%
Nursing Staff 5,200 100.0% 1,294,265 100.0%
Director of Nursing (DON) 46 0.9% 15,625 1.2%
RN with Administrative Duties (ARN) 89 1.7% 33,874 2.6%
Staff Registered Nurse (RN) 904 17.4% 119,260 9.2%
Licensed Practical Nurse (LPN) 874 16.8% 260,973 20.2%
Certified Nurse Assistant (CNA) 2,974 57.2% 764,049 59.0%
Other Nursing Staff 313 6.0% 100,484 7.8%
All retention and turnover statistics were produced by AHCA Research Department using data from 2009 AHCA Nursing Facility Staff
Retention and Turnover Survey. * May not add due to rounding.

REPORT OF FINDINGS 2009 NURSING FACILITY STAFF RETENTION AND TURNOVER SURVEY, APPEDIX B
FLORIDAFLORIDAFLORIDAFLORIDA
Retention and Turnover Rates of Nursing Facility Employees by Job Category and Nursing Job Position, 2009
RETENTION RATE TURNOVER RATE
STATE U.S. STATE U.S.
All Nursing Facility Employees 58.8% 53.1% 32.9% 40.0%
Administrative and Management Staff 68.9% 71.1% 17.5% 20.3%
Nursing Staff 55.8% 49.4% 36.6% 45.2%
Therapy Staff 69.1% 59.5% 16.3% 30.8%
Food Services Staff 56.6% 54.5% 38.1% 37.7%
Housekeeping and Maintenance Staff 68.9% 63.6% 24.1% 28.0%
Social Services and Activities Staff 79.4% 66.1% 14.7% 24.7%
Nursing Staff
Director of Nursing (DON) 59.6% 65.6% 33.3% 25.3%
RN with Administrative Duties (ARN) 57.1% 53.9% 33.8% 36.3%
Staff Registered Nurse (RN) 48.9% 47.5% 52.6% 46.7%
Licensed Practical Nurse (LPN) 54.1% 52.4% 41.7% 41.8%
Certified Nurse Assistant (CNA) 57.3% 47.8% 30.9% 46.6%
Estimated Number and Percentage* of Nursing Facility Employees
by Job Category and Nursing Job Position, 2009
STATE UNITED STATES
All Nursing Facility Employees 106,651 100.0% 1,964,203 100.0%
Administrative and Management Staff 4,297 4.0% 91,497 4.7%
Nursing Staff 71,400 66.9% 1,294,265 65.9%
Therapy Staff 7,131 6.7% 75,887 3.9%
Food Services Staff 11,398 10.7% 231,020 11.8%
Housekeeping and Maintenance Staff 9,002 8.4% 183,562 9.3%
Social Services and Activities Staff 3,423 3.2% 87,971 4.5%
Nursing Staff 71,400 100.0% 1,294,265 100.0%
Director of Nursing (DON) 713 1.0% 15,625 1.2%
RN with Administrative Duties (ARN) 1,313 1.8% 33,874 2.6%
Staff Registered Nurse (RN) 4,613 6.5% 119,260 9.2%
Licensed Practical Nurse (LPN) 14,912 20.9% 260,973 20.2%
Certified Nurse Assistant (CNA) 45,910 64.3% 764,049 59.0%
Other Nursing Staff 3,940 5.5% 100,484 7.8%
All retention and turnover statistics were produced by AHCA Research Department using data from 2009 AHCA Nursing Facility Staff
Retention and Turnover Survey. * May not add due to rounding.

REPORT OF FINDINGS 2009 NURSING FACILITY STAFF RETENTION AND TURNOVER SURVEY, APPEDIX B
GEORGIAGEORGIAGEORGIAGEORGIA
Retention and Turnover Rates of Nursing Facility Employees by Job Category and Nursing Job Position, 2009
RETENTION RATE TURNOVER RATE
STATE U.S. STATE U.S.
All Nursing Facility Employees 57.2% 53.1% 33.1% 40.0%
Administrative and Management Staff 75.6% 71.1% 18.5% 20.3%
Nursing Staff 52.7% 49.4% 38.7% 45.2%
Therapy Staff 73.8% 59.5% 16.7% 30.8%
Food Services Staff 62.0% 54.5% 23.2% 37.7%
Housekeeping and Maintenance Staff 70.3% 63.6% 21.1% 28.0%
Social Services and Activities Staff 72.8% 66.1% 16.1% 24.7%
Nursing Staff
Director of Nursing (DON) 69.9% 65.6% 20.3% 25.3%
RN with Administrative Duties (ARN) 48.4% 53.9% 41.9% 36.3%
Staff Registered Nurse (RN) 48.7% 47.5% 45.0% 46.7%
Licensed Practical Nurse (LPN) 52.5% 52.4% 38.1% 41.8%
Certified Nurse Assistant (CNA) 52.0% 47.8% 40.2% 46.6%
Estimated Number and Percentage* of Nursing Facility Employees
by Job Category and Nursing Job Position, 2009
STATE UNITED STATES
All Nursing Facility Employees 38,532 100.0% 1,964,203 100.0%
Administrative and Management Staff 1,734 4.5% 91,497 4.7%
Nursing Staff 26,442 68.6% 1,294,265 65.9%
Therapy Staff 812 2.1% 75,887 3.9%
Food Services Staff 4,426 11.5% 231,020 11.8%
Housekeeping and Maintenance Staff 3,782 9.8% 183,562 9.3%
Social Services and Activities Staff 1,336 3.5% 87,971 4.5%
Nursing Staff 26,442 100.0% 1,294,265 100.0%
Director of Nursing (DON) 359 1.4% 15,625 1.2%
RN with Administrative Duties (ARN) 464 1.8% 33,874 2.6%
Staff Registered Nurse (RN) 1,101 4.2% 119,260 9.2%
Licensed Practical Nurse (LPN) 7,575 28.6% 260,973 20.2%
Certified Nurse Assistant (CNA) 15,495 58.6% 764,049 59.0%
Other Nursing Staff 1,447 5.5% 100,484 7.8%
All retention and turnover statistics were produced by AHCA Research Department using data from 2009 AHCA Nursing Facility Staff
Retention and Turnover Survey. * May not add due to rounding.

REPORT OF FINDINGS 2009 NURSING FACILITY STAFF RETENTION AND TURNOVER SURVEY, APPEDIX B
HAWAIIHAWAIIHAWAIIHAWAII
Retention and Turnover Rates of Nursing Facility Employees by Job Category and Nursing Job Position, 2009
RETENTION RATE TURNOVER RATE
STATE U.S. STATE U.S.
All Nursing Facility Employees 74.1% 53.1% 13.6% 40.0%
Administrative and Management Staff 75.7% 71.1% 7.7% 20.3%
Nursing Staff 71.2% 49.4% 16.0% 45.2%
Therapy Staff 59.3% 59.5% 13.4% 30.8%
Food Services Staff 78.2% 54.5% 10.6% 37.7%
Housekeeping and Maintenance Staff 83.6% 63.6% 10.6% 28.0%
Social Services and Activities Staff 84.3% 66.1% 6.9% 24.7%
Nursing Staff
Director of Nursing (DON) 88.9% 65.6% 0.0% 25.3%
RN with Administrative Duties (ARN) 84.4% 53.9% 6.7% 36.3%
Staff Registered Nurse (RN) 61.1% 47.5% 18.9% 46.7%
Licensed Practical Nurse (LPN) 71.3% 52.4% 11.5% 41.8%
Certified Nurse Assistant (CNA) 71.8% 47.8% 17.4% 46.6%
Estimated Number and Percentage* of Nursing Facility Employees
by Job Category and Nursing Job Position, 2009
STATE UNITED STATES
All Nursing Facility Employees 6,053 100.0% 1,964,203 100.0%
Administrative and Management Staff 368 6.1% 91,497 4.7%
Nursing Staff 3,800 62.8% 1,294,265 65.9%
Therapy Staff 127 2.1% 75,887 3.9%
Food Services Staff 663 10.9% 231,020 11.8%
Housekeeping and Maintenance Staff 620 10.3% 183,562 9.3%
Social Services and Activities Staff 475 7.8% 87,971 4.5%
Nursing Staff 3,800 100.0% 1,294,265 100.0%
Director of Nursing (DON) 42 1.1% 15,625 1.2%
RN with Administrative Duties (ARN) 141 3.7% 33,874 2.6%
Staff Registered Nurse (RN) 685 18.0% 119,260 9.2%
Licensed Practical Nurse (LPN) 333 8.8% 260,973 20.2%
Certified Nurse Assistant (CNA) 2,323 61.1% 764,049 59.0%
Other Nursing Staff 276 7.3% 100,484 7.8%
All retention and turnover statistics were produced by AHCA Research Department using data from 2009 AHCA Nursing Facility Staff
Retention and Turnover Survey. * May not add due to rounding.

REPORT OF FINDINGS 2009 NURSING FACILITY STAFF RETENTION AND TURNOVER SURVEY, APPEDIX B
IOWAIOWAIOWAIOWA
Retention and Turnover Rates of Nursing Facility Employees by Job Category and Nursing Job Position, 2009
RETENTION RATE TURNOVER RATE
STATE U.S. STATE U.S.
All Nursing Facility Employees 61.9% 53.1% 24.9% 40.0%
Administrative and Management Staff 77.8% 71.1% 14.7% 20.3%
Nursing Staff 58.2% 49.4% 28.6% 45.2%
Therapy Staff 65.9% 59.5% 12.8% 30.8%
Food Services Staff 57.4% 54.5% 26.4% 37.7%
Housekeeping and Maintenance Staff 73.7% 63.6% 16.8% 28.0%
Social Services and Activities Staff 84.4% 66.1% 9.2% 24.7%
Nursing Staff
Director of Nursing (DON) 90.2% 65.6% 6.3% 25.3%
RN with Administrative Duties (ARN) 66.7% 53.9% 28.6% 36.3%
Staff Registered Nurse (RN) 60.2% 47.5% 26.7% 46.7%
Licensed Practical Nurse (LPN) 61.5% 52.4% 23.7% 41.8%
Certified Nurse Assistant (CNA) 54.6% 47.8% 31.7% 46.6%
Estimated Number and Percentage* of Nursing Facility Employees
by Job Category and Nursing Job Position, 2009
STATE UNITED STATES
All Nursing Facility Employees 39,961 100.0% 1,964,203 100.0%
Administrative and Management Staff 1,693 4.2% 91,497 4.7%
Nursing Staff 23,988 60.0% 1,294,265 65.9%
Therapy Staff 791 2.0% 75,887 3.9%
Food Services Staff 6,522 16.3% 231,020 11.8%
Housekeeping and Maintenance Staff 5,019 12.6% 183,562 9.3%
Social Services and Activities Staff 1,948 4.9% 87,971 4.5%
Nursing Staff 23,988 100.0% 1,294,265 100.0%
Director of Nursing (DON) 466 1.9% 15,625 1.2%
RN with Administrative Duties (ARN) 356 1.5% 33,874 2.6%
Staff Registered Nurse (RN) 2,593 10.8% 119,260 9.2%
Licensed Practical Nurse (LPN) 3,855 16.1% 260,973 20.2%
Certified Nurse Assistant (CNA) 15,375 64.1% 764,049 59.0%
Other Nursing Staff 1,344 5.6% 100,484 7.8%
All retention and turnover statistics were produced by AHCA Research Department using data from 2009 AHCA Nursing Facility Staff
Retention and Turnover Survey. * May not add due to rounding.

REPORT OF FINDINGS 2009 NURSING FACILITY STAFF RETENTION AND TURNOVER SURVEY, APPEDIX B
IDAHOIDAHOIDAHOIDAHO
Retention and Turnover Rates of Nursing Facility Employees by Job Category and Nursing Job Position, 2009
RETENTION RATE TURNOVER RATE
STATE U.S. STATE U.S.
All Nursing Facility Employees 45.8% 53.1% 52.4% 40.0%
Administrative and Management Staff 83.9% 71.1% 10.7% 20.3%
Nursing Staff 40.2% 49.4% 61.1% 45.2%
Therapy Staff 66.6% 59.5% 28.0% 30.8%
Food Services Staff 49.5% 54.5% 49.8% 37.7%
Housekeeping and Maintenance Staff 57.5% 63.6% 35.7% 28.0%
Social Services and Activities Staff 67.7% 66.1% 21.4% 24.7%
Nursing Staff
Director of Nursing (DON) 72.4% 65.6% 16.0% 25.3%
RN with Administrative Duties (ARN) 100.0% 53.9% 0.0% 36.3%
Staff Registered Nurse (RN) 33.3% 47.5% 68.5% 46.7%
Licensed Practical Nurse (LPN) 42.4% 52.4% 60.2% 41.8%
Certified Nurse Assistant (CNA) 41.6% 47.8% 55.3% 46.6%
Estimated Number and Percentage* of Nursing Facility Employees
by Job Category and Nursing Job Position, 2009
STATE UNITED STATES
All Nursing Facility Employees 6,955 100.0% 1,964,203 100.0%
Administrative and Management Staff 279 4.0% 91,497 4.7%
Nursing Staff 4,619 66.4% 1,294,265 65.9%
Therapy Staff 286 4.1% 75,887 3.9%
Food Services Staff 876 12.6% 231,020 11.8%
Housekeeping and Maintenance Staff 575 8.3% 183,562 9.3%
Social Services and Activities Staff 320 4.6% 87,971 4.5%
Nursing Staff 4,619 100.0% 1,294,265 100.0%
Director of Nursing (DON) 82 1.8% 15,625 1.2%
RN with Administrative Duties (ARN) 7 0.2% 33,874 2.6%
Staff Registered Nurse (RN) 533 11.5% 119,260 9.2%
Licensed Practical Nurse (LPN) 810 17.5% 260,973 20.2%
Certified Nurse Assistant (CNA) 2,851 61.7% 764,049 59.0%
Other Nursing Staff 336 7.3% 100,484 7.8%
All retention and turnover statistics were produced by AHCA Research Department using data from 2009 AHCA Nursing Facility Staff
Retention and Turnover Survey. * May not add due to rounding.

REPORT OF FINDINGS 2009 NURSING FACILITY STAFF RETENTION AND TURNOVER SURVEY, APPEDIX B
ILLINOISILLINOISILLINOISILLINOIS
Retention and Turnover Rates of Nursing Facility Employees by Job Category and Nursing Job Position, 2009
RETENTION RATE TURNOVER RATE
STATE U.S. STATE U.S.
All Nursing Facility Employees 52.8% 53.1% 36.2% 40.0%
Administrative and Management Staff 60.1% 71.1% 29.2% 20.3%
Nursing Staff 48.1% 49.4% 41.8% 45.2%
Therapy Staff 47.0% 59.5% 54.1% 30.8%
Food Services Staff 60.9% 54.5% 24.5% 37.7%
Housekeeping and Maintenance Staff 64.7% 63.6% 24.6% 28.0%
Social Services and Activities Staff 65.4% 66.1% 22.2% 24.7%
Nursing Staff
Director of Nursing (DON) 59.7% 65.6% 22.0% 25.3%
RN with Administrative Duties (ARN) 82.0% 53.9% 16.3% 36.3%
Staff Registered Nurse (RN) 51.3% 47.5% 43.0% 46.7%
Licensed Practical Nurse (LPN) 46.5% 52.4% 42.4% 41.8%
Certified Nurse Assistant (CNA) 45.7% 47.8% 43.6% 46.6%
Estimated Number and Percentage* of Nursing Facility Employees
by Job Category and Nursing Job Position, 2009
STATE UNITED STATES
All Nursing Facility Employees 89,955 100.0% 1,964,203 100.0%
Administrative and Management Staff 4,598 5.1% 91,497 4.7%
Nursing Staff 55,665 61.9% 1,294,265 65.9%
Therapy Staff 2,820 3.1% 75,887 3.9%
Food Services Staff 10,343 11.5% 231,020 11.8%
Housekeeping and Maintenance Staff 11,227 12.5% 183,562 9.3%
Social Services and Activities Staff 5,301 5.9% 87,971 4.5%
Nursing Staff 55,665 100.0% 1,294,265 100.0%
Director of Nursing (DON) 805 1.4% 15,625 1.2%
RN with Administrative Duties (ARN) 709 1.3% 33,874 2.6%
Staff Registered Nurse (RN) 6,512 11.7% 119,260 9.2%
Licensed Practical Nurse (LPN) 9,760 17.5% 260,973 20.2%
Certified Nurse Assistant (CNA) 33,181 59.6% 764,049 59.0%
Other Nursing Staff 4,699 8.4% 100,484 7.8%
All retention and turnover statistics were produced by AHCA Research Department using data from 2009 AHCA Nursing Facility Staff
Retention and Turnover Survey. * May not add due to rounding.

REPORT OF FINDINGS 2009 NURSING FACILITY STAFF RETENTION AND TURNOVER SURVEY, APPEDIX B
INDIANAINDIANAINDIANAINDIANA
Retention and Turnover Rates of Nursing Facility Employees by Job Category and Nursing Job Position, 2009
RETENTION RATE TURNOVER RATE
STATE U.S. STATE U.S.
All Nursing Facility Employees 46.6% 53.1% 48.6% 40.0%
Administrative and Management Staff 63.2% 71.1% 23.4% 20.3%
Nursing Staff 41.3% 49.4% 57.0% 45.2%
Therapy Staff 59.7% 59.5% 25.8% 30.8%
Food Services Staff 48.6% 54.5% 48.2% 37.7%
Housekeeping and Maintenance Staff 60.5% 63.6% 34.5% 28.0%
Social Services and Activities Staff 61.8% 66.1% 28.6% 24.7%
Nursing Staff
Director of Nursing (DON) 58.7% 65.6% 30.4% 25.3%
RN with Administrative Duties (ARN) 44.7% 53.9% 45.2% 36.3%
Staff Registered Nurse (RN) 33.7% 47.5% 67.6% 46.7%
Licensed Practical Nurse (LPN) 47.1% 52.4% 50.5% 41.8%
Certified Nurse Assistant (CNA) 37.6% 47.8% 61.8% 46.6%
Estimated Number and Percentage* of Nursing Facility Employees
by Job Category and Nursing Job Position, 2009
STATE UNITED STATES
All Nursing Facility Employees 59,958 100.0% 1,964,203 100.0%
Administrative and Management Staff 2,688 4.5% 91,497 4.7%
Nursing Staff 37,577 62.7% 1,294,265 65.9%
Therapy Staff 4,610 7.7% 75,887 3.9%
Food Services Staff 6,490 10.8% 231,020 11.8%
Housekeeping and Maintenance Staff 5,669 9.5% 183,562 9.3%
Social Services and Activities Staff 2,923 4.9% 87,971 4.5%
Nursing Staff 37,577 100.0% 1,294,265 100.0%
Director of Nursing (DON) 491 1.3% 15,625 1.2%
RN with Administrative Duties (ARN) 967 2.6% 33,874 2.6%
Staff Registered Nurse (RN) 2,588 6.9% 119,260 9.2%
Licensed Practical Nurse (LPN) 9,601 25.5% 260,973 20.2%
Certified Nurse Assistant (CNA) 21,342 56.8% 764,049 59.0%
Other Nursing Staff 2,589 6.9% 100,484 7.8%
All retention and turnover statistics were produced by AHCA Research Department using data from 2009 AHCA Nursing Facility Staff
Retention and Turnover Survey. * May not add due to rounding.

REPORT OF FINDINGS 2009 NURSING FACILITY STAFF RETENTION AND TURNOVER SURVEY, APPEDIX B
KANSASKANSASKANSASKANSAS
Retention and Turnover Rates of Nursing Facility Employees by Job Category and Nursing Job Position, 2009
RETENTION RATE TURNOVER RATE
STATE U.S. STATE U.S.
All Nursing Facility Employees 39.3% 53.1% 56.9% 40.0%
Administrative and Management Staff 68.3% 71.1% 21.0% 20.3%
Nursing Staff 34.8% 49.4% 64.5% 45.2%
Therapy Staff 76.9% 59.5% 8.4% 30.8%
Food Services Staff 38.5% 54.5% 63.6% 37.7%
Housekeeping and Maintenance Staff 50.3% 63.6% 37.5% 28.0%
Social Services and Activities Staff 59.2% 66.1% 24.1% 24.7%
Nursing Staff
Director of Nursing (DON) 45.8% 65.6% 45.6% 25.3%
RN with Administrative Duties (ARN) 33.1% 53.9% 63.5% 36.3%
Staff Registered Nurse (RN) 41.4% 47.5% 56.9% 46.7%
Licensed Practical Nurse (LPN) 37.9% 52.4% 55.4% 41.8%
Certified Nurse Assistant (CNA) 30.9% 47.8% 71.0% 46.6%
Estimated Number and Percentage* of Nursing Facility Employees
by Job Category and Nursing Job Position, 2009
STATE UNITED STATES
All Nursing Facility Employees 23,725 100.0% 1,964,203 100.0%
Administrative and Management Staff 1,351 5.7% 91,497 4.7%
Nursing Staff 15,481 65.2% 1,294,265 65.9%
Therapy Staff 247 1.0% 75,887 3.9%
Food Services Staff 3,330 14.0% 231,020 11.8%
Housekeeping and Maintenance Staff 2,168 9.1% 183,562 9.3%
Social Services and Activities Staff 1,149 4.8% 87,971 4.5%
Nursing Staff 15,481 100.0% 1,294,265 100.0%
Director of Nursing (DON) 341 2.2% 15,625 1.2%
RN with Administrative Duties (ARN) 518 3.3% 33,874 2.6%
Staff Registered Nurse (RN) 1,079 7.0% 119,260 9.2%
Licensed Practical Nurse (LPN) 2,494 16.1% 260,973 20.2%
Certified Nurse Assistant (CNA) 9,548 61.7% 764,049 59.0%
Other Nursing Staff 1,501 9.7% 100,484 7.8%
All retention and turnover statistics were produced by AHCA Research Department using data from 2009 AHCA Nursing Facility Staff
Retention and Turnover Survey. * May not add due to rounding.

REPORT OF FINDINGS 2009 NURSING FACILITY STAFF RETENTION AND TURNOVER SURVEY, APPEDIX B
KENTUCKYKENTUCKYKENTUCKYKENTUCKY
Retention and Turnover Rates of Nursing Facility Employees by Job Category and Nursing Job Position, 2009
RETENTION RATE TURNOVER RATE
STATE U.S. STATE U.S.
All Nursing Facility Employees 42.5% 53.1% 59.0% 40.0%
Administrative and Management Staff 66.1% 71.1% 26.7% 20.3%
Nursing Staff 38.7% 49.4% 66.5% 45.2%
Therapy Staff 46.5% 59.5% 31.5% 30.8%
Food Services Staff 46.3% 54.5% 55.6% 37.7%
Housekeeping and Maintenance Staff 52.2% 63.6% 47.5% 28.0%
Social Services and Activities Staff 64.0% 66.1% 24.9% 24.7%
Nursing Staff
Director of Nursing (DON) 46.5% 65.6% 50.9% 25.3%
RN with Administrative Duties (ARN) 44.4% 53.9% 48.8% 36.3%
Staff Registered Nurse (RN) 34.4% 47.5% 78.1% 46.7%
Licensed Practical Nurse (LPN) 43.8% 52.4% 56.8% 41.8%
Certified Nurse Assistant (CNA) 35.9% 47.8% 72.1% 46.6%
Estimated Number and Percentage* of Nursing Facility Employees
by Job Category and Nursing Job Position, 2009
STATE UNITED STATES
All Nursing Facility Employees 33,470 100.0% 1,964,203 100.0%
Administrative and Management Staff 1,409 4.2% 91,497 4.7%
Nursing Staff 22,857 68.3% 1,294,265 65.9%
Therapy Staff 1,418 4.2% 75,887 3.9%
Food Services Staff 3,796 11.3% 231,020 11.8%
Housekeeping and Maintenance Staff 2,727 8.1% 183,562 9.3%
Social Services and Activities Staff 1,262 3.8% 87,971 4.5%
Nursing Staff 22,857 100.0% 1,294,265 100.0%
Director of Nursing (DON) 273 1.2% 15,625 1.2%
RN with Administrative Duties (ARN) 755 3.3% 33,874 2.6%
Staff Registered Nurse (RN) 1,532 6.7% 119,260 9.2%
Licensed Practical Nurse (LPN) 4,869 21.3% 260,973 20.2%
Certified Nurse Assistant (CNA) 13,360 58.4% 764,049 59.0%
Other Nursing Staff 2,068 9.0% 100,484 7.8%
All retention and turnover statistics were produced by AHCA Research Department using data from 2009 AHCA Nursing Facility Staff
Retention and Turnover Survey. * May not add due to rounding.

REPORT OF FINDINGS 2009 NURSING FACILITY STAFF RETENTION AND TURNOVER SURVEY, APPEDIX B
LOUISIANALOUISIANALOUISIANALOUISIANA
Retention and Turnover Rates of Nursing Facility Employees by Job Category and Nursing Job Position, 2009
RETENTION RATE TURNOVER RATE
STATE U.S. STATE U.S.
All Nursing Facility Employees 46.2% 53.1% 37.2% 40.0%
Administrative and Management Staff 66.9% 71.1% 25.0% 20.3%
Nursing Staff 41.1% 49.4% 40.1% 45.2%
Therapy Staff 86.7% 59.5% 15.4% 30.8%
Food Services Staff 48.9% 54.5% 44.6% 37.7%
Housekeeping and Maintenance Staff 52.0% 63.6% 31.4% 28.0%
Social Services and Activities Staff 79.5% 66.1% 8.5% 24.7%
Nursing Staff
Director of Nursing (DON) 81.8% 65.6% 10.0% 25.3%
RN with Administrative Duties (ARN) 53.3% 53.9% 25.0% 36.3%
Staff Registered Nurse (RN) 58.0% 47.5% 22.0% 46.7%
Licensed Practical Nurse (LPN) 41.3% 52.4% 28.6% 41.8%
Certified Nurse Assistant (CNA) 36.1% 47.8% 50.1% 46.6%
Estimated Number and Percentage* of Nursing Facility Employees
by Job Category and Nursing Job Position, 2009
STATE UNITED STATES
All Nursing Facility Employees 30,879 100.0% 1,964,203 100.0%
Administrative and Management Staff 1,508 4.9% 91,497 4.7%
Nursing Staff 20,555 66.6% 1,294,265 65.9%
Therapy Staff 611 2.0% 75,887 3.9%
Food Services Staff 3,274 10.6% 231,020 11.8%
Housekeeping and Maintenance Staff 3,954 12.8% 183,562 9.3%
Social Services and Activities Staff 976 3.2% 87,971 4.5%
Nursing Staff 20,555 100.0% 1,294,265 100.0%
Director of Nursing (DON) 297 1.4% 15,625 1.2%
RN with Administrative Duties (ARN) 398 1.9% 33,874 2.6%
Staff Registered Nurse (RN) 642 3.1% 119,260 9.2%
Licensed Practical Nurse (LPN) 5,699 27.7% 260,973 20.2%
Certified Nurse Assistant (CNA) 12,349 60.1% 764,049 59.0%
Other Nursing Staff 1,170 5.7% 100,484 7.8%
All retention and turnover statistics were produced by AHCA Research Department using data from 2009 AHCA Nursing Facility Staff
Retention and Turnover Survey. * May not add due to rounding.

REPORT OF FINDINGS 2009 NURSING FACILITY STAFF RETENTION AND TURNOVER SURVEY, APPEDIX B
MASSACHUSETTSMASSACHUSETTSMASSACHUSETTSMASSACHUSETTS
Retention and Turnover Rates of Nursing Facility Employees by Job Category and Nursing Job Position, 2009
RETENTION RATE TURNOVER RATE
STATE U.S. STATE U.S.
All Nursing Facility Employees 57.3% 53.1% 36.9% 40.0%
Administrative and Management Staff 68.7% 71.1% 23.0% 20.3%
Nursing Staff 56.1% 49.4% 39.0% 45.2%
Therapy Staff 56.6% 59.5% 37.3% 30.8%
Food Services Staff 54.4% 54.5% 38.2% 37.7%
Housekeeping and Maintenance Staff 65.7% 63.6% 27.4% 28.0%
Social Services and Activities Staff 59.9% 66.1% 31.9% 24.7%
Nursing Staff
Director of Nursing (DON) 56.7% 65.6% 31.4% 25.3%
RN with Administrative Duties (ARN) 54.1% 53.9% 39.5% 36.3%
Staff Registered Nurse (RN) 49.7% 47.5% 44.2% 46.7%
Licensed Practical Nurse (LPN) 57.6% 52.4% 40.2% 41.8%
Certified Nurse Assistant (CNA) 56.2% 47.8% 38.3% 46.6%
Estimated Number and Percentage* of Nursing Facility Employees
by Job Category and Nursing Job Position, 2009
STATE UNITED STATES
All Nursing Facility Employees 60,322 100.0% 1,964,203 100.0%
Administrative and Management Staff 2,455 4.1% 91,497 4.7%
Nursing Staff 39,329 65.2% 1,294,265 65.9%
Therapy Staff 3,501 5.8% 75,887 3.9%
Food Services Staff 7,204 11.9% 231,020 11.8%
Housekeeping and Maintenance Staff 4,826 8.0% 183,562 9.3%
Social Services and Activities Staff 3,007 5.0% 87,971 4.5%
Nursing Staff 39,329 100.0% 1,294,265 100.0%
Director of Nursing (DON) 431 1.1% 15,625 1.2%
RN with Administrative Duties (ARN) 1,190 3.0% 33,874 2.6%
Staff Registered Nurse (RN) 4,787 12.2% 119,260 9.2%
Licensed Practical Nurse (LPN) 8,076 20.5% 260,973 20.2%
Certified Nurse Assistant (CNA) 22,424 57.0% 764,049 59.0%
Other Nursing Staff 2,421 6.2% 100,484 7.8%
All retention and turnover statistics were produced by AHCA Research Department using data from 2009 AHCA Nursing Facility Staff
Retention and Turnover Survey. * May not add due to rounding.

REPORT OF FINDINGS 2009 NURSING FACILITY STAFF RETENTION AND TURNOVER SURVEY, APPEDIX B
MARYLANDMARYLANDMARYLANDMARYLAND
Retention and Turnover Rates of Nursing Facility Employees by Job Category and Nursing Job Position, 2009
RETENTION RATE TURNOVER RATE
STATE U.S. STATE U.S.
All Nursing Facility Employees 53.9% 53.1% 38.8% 40.0%
Administrative and Management Staff 63.7% 71.1% 25.2% 20.3%
Nursing Staff 51.8% 49.4% 42.1% 45.2%
Therapy Staff 52.5% 59.5% 40.7% 30.8%
Food Services Staff 52.8% 54.5% 37.4% 37.7%
Housekeeping and Maintenance Staff 66.1% 63.6% 24.9% 28.0%
Social Services and Activities Staff 56.5% 66.1% 34.7% 24.7%
Nursing Staff
Director of Nursing (DON) 69.9% 65.6% 19.7% 25.3%
RN with Administrative Duties (ARN) 42.1% 53.9% 56.7% 36.3%
Staff Registered Nurse (RN) 49.1% 47.5% 45.6% 46.7%
Licensed Practical Nurse (LPN) 55.8% 52.4% 41.9% 41.8%
Certified Nurse Assistant (CNA) 50.3% 47.8% 43.0% 46.6%
Estimated Number and Percentage* of Nursing Facility Employees
by Job Category and Nursing Job Position, 2009
STATE UNITED STATES
All Nursing Facility Employees 33,466 100.0% 1,964,203 100.0%
Administrative and Management Staff 1,791 5.4% 91,497 4.7%
Nursing Staff 21,867 65.3% 1,294,265 65.9%
Therapy Staff 1,589 4.7% 75,887 3.9%
Food Services Staff 3,818 11.4% 231,020 11.8%
Housekeeping and Maintenance Staff 2,983 8.9% 183,562 9.3%
Social Services and Activities Staff 1,420 4.2% 87,971 4.5%
Nursing Staff 21,867 100.0% 1,294,265 100.0%
Director of Nursing (DON) 234 1.1% 15,625 1.2%
RN with Administrative Duties (ARN) 284 1.3% 33,874 2.6%
Staff Registered Nurse (RN) 2,689 12.3% 119,260 9.2%
Licensed Practical Nurse (LPN) 4,784 21.9% 260,973 20.2%
Certified Nurse Assistant (CNA) 12,360 56.5% 764,049 59.0%
Other Nursing Staff 1,515 6.9% 100,484 7.8%
All retention and turnover statistics were produced by AHCA Research Department using data from 2009 AHCA Nursing Facility Staff
Retention and Turnover Survey. * May not add due to rounding.

REPORT OF FINDINGS 2009 NURSING FACILITY STAFF RETENTION AND TURNOVER SURVEY, APPEDIX B
MAINEMAINEMAINEMAINE
Retention and Turnover Rates of Nursing Facility Employees by Job Category and Nursing Job Position, 2009
RETENTION RATE TURNOVER RATE
STATE U.S. STATE U.S.
All Nursing Facility Employees 56.9% 53.1% 35.2% 40.0%
Administrative and Management Staff 73.0% 71.1% 18.4% 20.3%
Nursing Staff 53.8% 49.4% 38.7% 45.2%
Therapy Staff 56.4% 59.5% 37.9% 30.8%
Food Services Staff 58.4% 54.5% 32.5% 37.7%
Housekeeping and Maintenance Staff 67.8% 63.6% 23.4% 28.0%
Social Services and Activities Staff 67.3% 66.1% 27.6% 24.7%
Nursing Staff
Director of Nursing (DON) 97.5% 65.6% 2.6% 25.3%
RN with Administrative Duties (ARN) 70.0% 53.9% 15.9% 36.3%
Staff Registered Nurse (RN) 45.1% 47.5% 52.7% 46.7%
Licensed Practical Nurse (LPN) 61.1% 52.4% 36.0% 41.8%
Certified Nurse Assistant (CNA) 53.1% 47.8% 38.3% 46.6%
Estimated Number and Percentage* of Nursing Facility Employees
by Job Category and Nursing Job Position, 2009
STATE UNITED STATES
All Nursing Facility Employees 15,778 100.0% 1,964,203 100.0%
Administrative and Management Staff 608 3.9% 91,497 4.7%
Nursing Staff 10,366 65.7% 1,294,265 65.9%
Therapy Staff 771 4.9% 75,887 3.9%
Food Services Staff 1,780 11.3% 231,020 11.8%
Housekeeping and Maintenance Staff 1,593 10.1% 183,562 9.3%
Social Services and Activities Staff 660 4.2% 87,971 4.5%
Nursing Staff 10,366 100.0% 1,294,265 100.0%
Director of Nursing (DON) 109 1.1% 15,625 1.2%
RN with Administrative Duties (ARN) 221 2.1% 33,874 2.6%
Staff Registered Nurse (RN) 1,638 15.8% 119,260 9.2%
Licensed Practical Nurse (LPN) 1,210 11.7% 260,973 20.2%
Certified Nurse Assistant (CNA) 6,473 62.4% 764,049 59.0%
Other Nursing Staff 715 6.9% 100,484 7.8%
All retention and turnover statistics were produced by AHCA Research Department using data from 2009 AHCA Nursing Facility Staff
Retention and Turnover Survey. * May not add due to rounding.

REPORT OF FINDINGS 2009 NURSING FACILITY STAFF RETENTION AND TURNOVER SURVEY, APPEDIX B
MICHIGANMICHIGANMICHIGANMICHIGAN
Retention and Turnover Rates of Nursing Facility Employees by Job Category and Nursing Job Position, 2009
RETENTION RATE TURNOVER RATE
STATE U.S. STATE U.S.
All Nursing Facility Employees 60.1% 53.1% 27.0% 40.0%
Administrative and Management Staff 80.4% 71.1% 7.1% 20.3%
Nursing Staff 54.9% 49.4% 32.9% 45.2%
Therapy Staff 64.9% 59.5% 13.9% 30.8%
Food Services Staff 65.0% 54.5% 21.8% 37.7%
Housekeeping and Maintenance Staff 74.8% 63.6% 15.5% 28.0%
Social Services and Activities Staff 69.6% 66.1% 16.3% 24.7%
Nursing Staff
Director of Nursing (DON) 67.1% 65.6% 25.0% 25.3%
RN with Administrative Duties (ARN) 68.0% 53.9% 22.5% 36.3%
Staff Registered Nurse (RN) 52.5% 47.5% 37.1% 46.7%
Licensed Practical Nurse (LPN) 53.5% 52.4% 35.0% 41.8%
Certified Nurse Assistant (CNA) 53.8% 47.8% 32.7% 46.6%
Estimated Number and Percentage* of Nursing Facility Employees
by Job Category and Nursing Job Position, 2009
STATE UNITED STATES
All Nursing Facility Employees 71,462 100.0% 1,964,203 100.0%
Administrative and Management Staff 3,182 4.5% 91,497 4.7%
Nursing Staff 45,411 63.5% 1,294,265 65.9%
Therapy Staff 1,841 2.6% 75,887 3.9%
Food Services Staff 9,129 12.8% 231,020 11.8%
Housekeeping and Maintenance Staff 7,896 11.0% 183,562 9.3%
Social Services and Activities Staff 4,002 5.6% 87,971 4.5%
Nursing Staff 45,411 100.0% 1,294,265 100.0%
Director of Nursing (DON) 427 0.9% 15,625 1.2%
RN with Administrative Duties (ARN) 1,068 2.4% 33,874 2.6%
Staff Registered Nurse (RN) 4,649 10.2% 119,260 9.2%
Licensed Practical Nurse (LPN) 7,852 17.3% 260,973 20.2%
Certified Nurse Assistant (CNA) 27,897 61.4% 764,049 59.0%
Other Nursing Staff 3,519 7.7% 100,484 7.8%
All retention and turnover statistics were produced by AHCA Research Department using data from 2009 AHCA Nursing Facility Staff
Retention and Turnover Survey. * May not add due to rounding.

REPORT OF FINDINGS 2009 NURSING FACILITY STAFF RETENTION AND TURNOVER SURVEY, APPEDIX B
MINNESOTAMINNESOTAMINNESOTAMINNESOTA
Retention and Turnover Rates of Nursing Facility Employees by Job Category and Nursing Job Position, 2009
RETENTION RATE TURNOVER RATE
STATE U.S. STATE U.S.
All Nursing Facility Employees 56.8% 53.1% 34.1% 40.0%
Administrative and Management Staff 84.9% 71.1% 12.0% 20.3%
Nursing Staff 52.1% 49.4% 39.9% 45.2%
Therapy Staff 76.6% 59.5% 3.2% 30.8%
Food Services Staff 57.1% 54.5% 30.7% 37.7%
Housekeeping and Maintenance Staff 70.8% 63.6% 22.8% 28.0%
Social Services and Activities Staff 76.2% 66.1% 16.6% 24.7%
Nursing Staff
Director of Nursing (DON) 74.5% 65.6% 17.5% 25.3%
RN with Administrative Duties (ARN) 55.4% 53.9% 29.5% 36.3%
Staff Registered Nurse (RN) 53.9% 47.5% 32.8% 46.7%
Licensed Practical Nurse (LPN) 62.2% 52.4% 32.4% 41.8%
Certified Nurse Assistant (CNA) 46.5% 47.8% 46.9% 46.6%
Estimated Number and Percentage* of Nursing Facility Employees
by Job Category and Nursing Job Position, 2009
STATE UNITED STATES
All Nursing Facility Employees 43,121 100.0% 1,964,203 100.0%
Administrative and Management Staff 1,698 3.9% 91,497 4.7%
Nursing Staff 28,438 66.0% 1,294,265 65.9%
Therapy Staff 755 1.8% 75,887 3.9%
Food Services Staff 6,325 14.7% 231,020 11.8%
Housekeeping and Maintenance Staff 3,256 7.6% 183,562 9.3%
Social Services and Activities Staff 2,649 6.1% 87,971 4.5%
Nursing Staff 28,438 100.0% 1,294,265 100.0%
Director of Nursing (DON) 380 1.3% 15,625 1.2%
RN with Administrative Duties (ARN) 1,246 4.4% 33,874 2.6%
Staff Registered Nurse (RN) 2,364 8.3% 119,260 9.2%
Licensed Practical Nurse (LPN) 5,409 19.0% 260,973 20.2%
Certified Nurse Assistant (CNA) 17,354 61.0% 764,049 59.0%
Other Nursing Staff 1,686 5.9% 100,484 7.8%
All retention and turnover statistics were produced by AHCA Research Department using data from 2009 AHCA Nursing Facility Staff
Retention and Turnover Survey. * May not add due to rounding.

REPORT OF FINDINGS 2009 NURSING FACILITY STAFF RETENTION AND TURNOVER SURVEY, APPEDIX B
MISSOURIMISSOURIMISSOURIMISSOURI
Retention and Turnover Rates of Nursing Facility Employees by Job Category and Nursing Job Position, 2009
RETENTION RATE TURNOVER RATE
STATE U.S. STATE U.S.
All Nursing Facility Employees 42.5% 53.1% 55.8% 40.0%
Administrative and Management Staff 71.2% 71.1% 20.4% 20.3%
Nursing Staff 37.4% 49.4% 65.1% 45.2%
Therapy Staff 63.5% 59.5% 16.6% 30.8%
Food Services Staff 46.9% 54.5% 48.5% 37.7%
Housekeeping and Maintenance Staff 53.3% 63.6% 39.9% 28.0%
Social Services and Activities Staff 67.3% 66.1% 23.7% 24.7%
Nursing Staff
Director of Nursing (DON) 62.5% 65.6% 34.9% 25.3%
RN with Administrative Duties (ARN) 48.4% 53.9% 38.5% 36.3%
Staff Registered Nurse (RN) 36.2% 47.5% 62.4% 46.7%
Licensed Practical Nurse (LPN) 47.0% 52.4% 48.3% 41.8%
Certified Nurse Assistant (CNA) 34.4% 47.8% 68.9% 46.6%
Estimated Number and Percentage* of Nursing Facility Employees
by Job Category and Nursing Job Position, 2009
STATE UNITED STATES
All Nursing Facility Employees 48,518 100.0% 1,964,203 100.0%
Administrative and Management Staff 2,161 4.5% 91,497 4.7%
Nursing Staff 32,196 66.4% 1,294,265 65.9%
Therapy Staff 825 1.7% 75,887 3.9%
Food Services Staff 6,235 12.9% 231,020 11.8%
Housekeeping and Maintenance Staff 5,234 10.8% 183,562 9.3%
Social Services and Activities Staff 1,868 3.8% 87,971 4.5%
Nursing Staff 32,196 100.0% 1,294,265 100.0%
Director of Nursing (DON) 489 1.5% 15,625 1.2%
RN with Administrative Duties (ARN) 584 1.8% 33,874 2.6%
Staff Registered Nurse (RN) 1,634 5.1% 119,260 9.2%
Licensed Practical Nurse (LPN) 6,212 19.3% 260,973 20.2%
Certified Nurse Assistant (CNA) 19,410 60.3% 764,049 59.0%
Other Nursing Staff 3,866 12.0% 100,484 7.8%
All retention and turnover statistics were produced by AHCA Research Department using data from 2009 AHCA Nursing Facility Staff
Retention and Turnover Survey. * May not add due to rounding.

REPORT OF FINDINGS 2009 NURSING FACILITY STAFF RETENTION AND TURNOVER SURVEY, APPEDIX B
MISSISSIPPIMISSISSIPPIMISSISSIPPIMISSISSIPPI
Retention and Turnover Rates of Nursing Facility Employees by Job Category and Nursing Job Position, 2009
RETENTION RATE TURNOVER RATE
STATE U.S. STATE U.S.
All Nursing Facility Employees 59.5% 53.1% 29.2% 40.0%
Administrative and Management Staff 72.0% 71.1% 22.8% 20.3%
Nursing Staff 55.2% 49.4% 33.2% 45.2%
Therapy Staff 78.8% 59.5% 23.0% 30.8%
Food Services Staff 65.4% 54.5% 25.0% 37.7%
Housekeeping and Maintenance Staff 71.7% 63.6% 13.7% 28.0%
Social Services and Activities Staff 76.8% 66.1% 15.6% 24.7%
Nursing Staff
Director of Nursing (DON) 71.2% 65.6% 20.9% 25.3%
RN with Administrative Duties (ARN) 45.1% 53.9% 44.7% 36.3%
Staff Registered Nurse (RN) 44.8% 47.5% 53.4% 46.7%
Licensed Practical Nurse (LPN) 54.1% 52.4% 37.9% 41.8%
Certified Nurse Assistant (CNA) 56.6% 47.8% 29.5% 46.6%
Estimated Number and Percentage* of Nursing Facility Employees
by Job Category and Nursing Job Position, 2009
STATE UNITED STATES
All Nursing Facility Employees 22,178 100.0% 1,964,203 100.0%
Administrative and Management Staff 828 3.7% 91,497 4.7%
Nursing Staff 15,431 69.6% 1,294,265 65.9%
Therapy Staff 496 2.2% 75,887 3.9%
Food Services Staff 2,633 11.9% 231,020 11.8%
Housekeeping and Maintenance Staff 2,068 9.3% 183,562 9.3%
Social Services and Activities Staff 722 3.3% 87,971 4.5%
Nursing Staff 15,431 100.0% 1,294,265 100.0%
Director of Nursing (DON) 193 1.3% 15,625 1.2%
RN with Administrative Duties (ARN) 633 4.1% 33,874 2.6%
Staff Registered Nurse (RN) 823 5.3% 119,260 9.2%
Licensed Practical Nurse (LPN) 3,791 24.6% 260,973 20.2%
Certified Nurse Assistant (CNA) 9,202 59.6% 764,049 59.0%
Other Nursing Staff 789 5.1% 100,484 7.8%
All retention and turnover statistics were produced by AHCA Research Department using data from 2009 AHCA Nursing Facility Staff
Retention and Turnover Survey. * May not add due to rounding.

REPORT OF FINDINGS 2009 NURSING FACILITY STAFF RETENTION AND TURNOVER SURVEY, APPEDIX B
MONTANAMONTANAMONTANAMONTANA
Retention and Turnover Rates of Nursing Facility Employees by Job Category and Nursing Job Position, 2009
RETENTION RATE TURNOVER RATE
STATE U.S. STATE U.S.
All Nursing Facility Employees 44.0% 53.1% 51.0% 40.0%
Administrative and Management Staff 72.4% 71.1% 20.7% 20.3%
Nursing Staff 41.7% 49.4% 56.2% 45.2%
Therapy Staff 47.9% 59.5% 29.2% 30.8%
Food Services Staff 39.6% 54.5% 54.1% 37.7%
Housekeeping and Maintenance Staff 45.1% 63.6% 52.6% 28.0%
Social Services and Activities Staff 65.5% 66.1% 17.7% 24.7%
Nursing Staff
Director of Nursing (DON) 69.2% 65.6% 8.3% 25.3%
RN with Administrative Duties (ARN) 57.1% 53.9% 40.0% 36.3%
Staff Registered Nurse (RN) 41.7% 47.5% 38.9% 46.7%
Licensed Practical Nurse (LPN) 53.5% 52.4% 37.9% 41.8%
Certified Nurse Assistant (CNA) 39.0% 47.8% 65.0% 46.6%
Estimated Number and Percentage* of Nursing Facility Employees
by Job Category and Nursing Job Position, 2009
STATE UNITED STATES
All Nursing Facility Employees 8,213 100.0% 1,964,203 100.0%
Administrative and Management Staff 385 4.7% 91,497 4.7%
Nursing Staff 5,218 63.5% 1,294,265 65.9%
Therapy Staff 257 3.1% 75,887 3.9%
Food Services Staff 1,095 13.3% 231,020 11.8%
Housekeeping and Maintenance Staff 836 10.2% 183,562 9.3%
Social Services and Activities Staff 422 5.1% 87,971 4.5%
Nursing Staff 5,218 100.0% 1,294,265 100.0%
Director of Nursing (DON) 90 1.7% 15,625 1.2%
RN with Administrative Duties (ARN) 41 0.8% 33,874 2.6%
Staff Registered Nurse (RN) 777 14.9% 119,260 9.2%
Licensed Practical Nurse (LPN) 773 14.8% 260,973 20.2%
Certified Nurse Assistant (CNA) 3,255 62.4% 764,049 59.0%
Other Nursing Staff 282 5.4% 100,484 7.8%
All retention and turnover statistics were produced by AHCA Research Department using data from 2009 AHCA Nursing Facility Staff
Retention and Turnover Survey. * May not add due to rounding.

REPORT OF FINDINGS 2009 NURSING FACILITY STAFF RETENTION AND TURNOVER SURVEY, APPEDIX B
NORTH CAROLINANORTH CAROLINANORTH CAROLINANORTH CAROLINA
Retention and Turnover Rates of Nursing Facility Employees by Job Category and Nursing Job Position, 2009
RETENTION RATE TURNOVER RATE
STATE U.S. STATE U.S.
All Nursing Facility Employees 47.5% 53.1% 47.2% 40.0%
Administrative and Management Staff 65.6% 71.1% 25.5% 20.3%
Nursing Staff 42.3% 49.4% 54.7% 45.2%
Therapy Staff 62.3% 59.5% 28.4% 30.8%
Food Services Staff 58.2% 54.5% 34.8% 37.7%
Housekeeping and Maintenance Staff 60.5% 63.6% 31.2% 28.0%
Social Services and Activities Staff 62.0% 66.1% 28.5% 24.7%
Nursing Staff
Director of Nursing (DON) 52.0% 65.6% 37.8% 25.3%
RN with Administrative Duties (ARN) 37.6% 53.9% 49.1% 36.3%
Staff Registered Nurse (RN) 36.5% 47.5% 60.5% 46.7%
Licensed Practical Nurse (LPN) 48.3% 52.4% 48.2% 41.8%
Certified Nurse Assistant (CNA) 40.6% 47.8% 58.5% 46.6%
Estimated Number and Percentage* of Nursing Facility Employees
by Job Category and Nursing Job Position, 2009
STATE UNITED STATES
All Nursing Facility Employees 50,955 100.0% 1,964,203 100.0%
Administrative and Management Staff 2,221 4.4% 91,497 4.7%
Nursing Staff 34,875 68.4% 1,294,265 65.9%
Therapy Staff 2,063 4.0% 75,887 3.9%
Food Services Staff 5,485 10.8% 231,020 11.8%
Housekeeping and Maintenance Staff 4,332 8.5% 183,562 9.3%
Social Services and Activities Staff 1,979 3.9% 87,971 4.5%
Nursing Staff 34,875 100.0% 1,294,265 100.0%
Director of Nursing (DON) 423 1.2% 15,625 1.2%
RN with Administrative Duties (ARN) 778 2.2% 33,874 2.6%
Staff Registered Nurse (RN) 3,158 9.1% 119,260 9.2%
Licensed Practical Nurse (LPN) 7,494 21.5% 260,973 20.2%
Certified Nurse Assistant (CNA) 20,332 58.3% 764,049 59.0%
Other Nursing Staff 2,690 7.7% 100,484 7.8%
All retention and turnover statistics were produced by AHCA Research Department using data from 2009 AHCA Nursing Facility Staff
Retention and Turnover Survey. * May not add due to rounding.

REPORT OF FINDINGS 2009 NURSING FACILITY STAFF RETENTION AND TURNOVER SURVEY, APPEDIX B
NORTH DAKOTANORTH DAKOTANORTH DAKOTANORTH DAKOTA
Retention and Turnover Rates of Nursing Facility Employees by Job Category and Nursing Job Position, 2009
RETENTION RATE TURNOVER RATE
STATE U.S. STATE U.S.
All Nursing Facility Employees 62.0% 53.1% 25.8% 40.0%
Administrative and Management Staff 85.7% 71.1% 8.5% 20.3%
Nursing Staff 59.3% 49.4% 27.7% 45.2%
Therapy Staff 87.2% 59.5% 7.5% 30.8%
Food Services Staff 55.1% 54.5% 34.9% 37.7%
Housekeeping and Maintenance Staff 69.8% 63.6% 18.3% 28.0%
Social Services and Activities Staff 74.8% 66.1% 16.3% 24.7%
Nursing Staff
Director of Nursing (DON) 97.1% 65.6% 0.0% 25.3%
RN with Administrative Duties (ARN) 90.4% 53.9% 2.0% 36.3%
Staff Registered Nurse (RN) 73.8% 47.5% 14.8% 46.7%
Licensed Practical Nurse (LPN) 69.8% 52.4% 20.5% 41.8%
Certified Nurse Assistant (CNA) 52.8% 47.8% 33.9% 46.6%
Estimated Number and Percentage* of Nursing Facility Employees
by Job Category and Nursing Job Position, 2009
STATE UNITED STATES
All Nursing Facility Employees 12,510 100.0% 1,964,203 100.0%
Administrative and Management Staff 521 4.2% 91,497 4.7%
Nursing Staff 8,115 64.9% 1,294,265 65.9%
Therapy Staff 280 2.2% 75,887 3.9%
Food Services Staff 1,675 13.4% 231,020 11.8%
Housekeeping and Maintenance Staff 1,204 9.6% 183,562 9.3%
Social Services and Activities Staff 715 5.7% 87,971 4.5%
Nursing Staff 8,115 100.0% 1,294,265 100.0%
Director of Nursing (DON) 89 1.1% 15,625 1.2%
RN with Administrative Duties (ARN) 159 2.0% 33,874 2.6%
Staff Registered Nurse (RN) 792 9.8% 119,260 9.2%
Licensed Practical Nurse (LPN) 1,073 13.2% 260,973 20.2%
Certified Nurse Assistant (CNA) 5,415 66.7% 764,049 59.0%
Other Nursing Staff 586 7.2% 100,484 7.8%
All retention and turnover statistics were produced by AHCA Research Department using data from 2009 AHCA Nursing Facility Staff
Retention and Turnover Survey. * May not add due to rounding.

REPORT OF FINDINGS 2009 NURSING FACILITY STAFF RETENTION AND TURNOVER SURVEY, APPEDIX B
NEBRASKANEBRASKANEBRASKANEBRASKA
Retention and Turnover Rates of Nursing Facility Employees by Job Category and Nursing Job Position, 2009
RETENTION RATE TURNOVER RATE
STATE U.S. STATE U.S.
All Nursing Facility Employees 50.1% 53.1% 44.9% 40.0%
Administrative and Management Staff 71.6% 71.1% 25.0% 20.3%
Nursing Staff 46.0% 49.4% 48.9% 45.2%
Therapy Staff 73.8% 59.5% 9.4% 30.8%
Food Services Staff 49.0% 54.5% 53.5% 37.7%
Housekeeping and Maintenance Staff 67.8% 63.6% 24.6% 28.0%
Social Services and Activities Staff 61.4% 66.1% 31.9% 24.7%
Nursing Staff
Director of Nursing (DON) 57.9% 65.6% 29.5% 25.3%
RN with Administrative Duties (ARN) 37.7% 53.9% 52.9% 36.3%
Staff Registered Nurse (RN) 70.8% 47.5% 14.3% 46.7%
Licensed Practical Nurse (LPN) 52.5% 52.4% 41.9% 41.8%
Certified Nurse Assistant (CNA) 39.4% 47.8% 59.4% 46.6%
Estimated Number and Percentage* of Nursing Facility Employees
by Job Category and Nursing Job Position, 2009
STATE UNITED STATES
All Nursing Facility Employees 18,212 100.0% 1,964,203 100.0%
Administrative and Management Staff 946 5.2% 91,497 4.7%
Nursing Staff 12,053 66.2% 1,294,265 65.9%
Therapy Staff 422 2.3% 75,887 3.9%
Food Services Staff 2,623 14.4% 231,020 11.8%
Housekeeping and Maintenance Staff 1,247 6.8% 183,562 9.3%
Social Services and Activities Staff 921 5.1% 87,971 4.5%
Nursing Staff 12,053 100.0% 1,294,265 100.0%
Director of Nursing (DON) 220 1.8% 15,625 1.2%
RN with Administrative Duties (ARN) 632 5.2% 33,874 2.6%
Staff Registered Nurse (RN) 735 6.1% 119,260 9.2%
Licensed Practical Nurse (LPN) 2,162 17.9% 260,973 20.2%
Certified Nurse Assistant (CNA) 6,075 50.4% 764,049 59.0%
Other Nursing Staff 2,229 18.5% 100,484 7.8%
All retention and turnover statistics were produced by AHCA Research Department using data from 2009 AHCA Nursing Facility Staff
Retention and Turnover Survey. * May not add due to rounding.

REPORT OF FINDINGS 2009 NURSING FACILITY STAFF RETENTION AND TURNOVER SURVEY, APPEDIX B
NEW HAMPSHIRENEW HAMPSHIRENEW HAMPSHIRENEW HAMPSHIRE
Retention and Turnover Rates of Nursing Facility Employees by Job Category and Nursing Job Position, 2009
RETENTION RATE TURNOVER RATE
STATE U.S. STATE U.S.
All Nursing Facility Employees 56.2% 53.1% 38.6% 40.0%
Administrative and Management Staff 73.3% 71.1% 20.4% 20.3%
Nursing Staff 53.8% 49.4% 41.4% 45.2%
Therapy Staff 59.6% 59.5% 35.7% 30.8%
Food Services Staff 52.1% 54.5% 45.0% 37.7%
Housekeeping and Maintenance Staff 68.4% 63.6% 24.8% 28.0%
Social Services and Activities Staff 64.7% 66.1% 27.8% 24.7%
Nursing Staff
Director of Nursing (DON) 69.8% 65.6% 19.4% 25.3%
RN with Administrative Duties (ARN) 80.4% 53.9% 17.9% 36.3%
Staff Registered Nurse (RN) 48.7% 47.5% 44.5% 46.7%
Licensed Practical Nurse (LPN) 56.8% 52.4% 40.7% 41.8%
Certified Nurse Assistant (CNA) 53.4% 47.8% 42.3% 46.6%
Estimated Number and Percentage* of Nursing Facility Employees
by Job Category and Nursing Job Position, 2009
STATE UNITED STATES
All Nursing Facility Employees 11,281 100.0% 1,964,203 100.0%
Administrative and Management Staff 448 4.0% 91,497 4.7%
Nursing Staff 7,169 63.5% 1,294,265 65.9%
Therapy Staff 662 5.9% 75,887 3.9%
Food Services Staff 1,461 12.9% 231,020 11.8%
Housekeeping and Maintenance Staff 968 8.6% 183,562 9.3%
Social Services and Activities Staff 574 5.1% 87,971 4.5%
Nursing Staff 7,169 100.0% 1,294,265 100.0%
Director of Nursing (DON) 80 1.1% 15,625 1.2%
RN with Administrative Duties (ARN) 92 1.3% 33,874 2.6%
Staff Registered Nurse (RN) 1,177 16.4% 119,260 9.2%
Licensed Practical Nurse (LPN) 1,320 18.4% 260,973 20.2%
Certified Nurse Assistant (CNA) 4,034 56.3% 764,049 59.0%
Other Nursing Staff 467 6.5% 100,484 7.8%
All retention and turnover statistics were produced by AHCA Research Department using data from 2009 AHCA Nursing Facility Staff
Retention and Turnover Survey. * May not add due to rounding.

REPORT OF FINDINGS 2009 NURSING FACILITY STAFF RETENTION AND TURNOVER SURVEY, APPEDIX B
NEW JERSEYNEW JERSEYNEW JERSEYNEW JERSEY
Retention and Turnover Rates of Nursing Facility Employees by Job Category and Nursing Job Position, 2009
RETENTION RATE TURNOVER RATE
STATE U.S. STATE U.S.
All Nursing Facility Employees 59.8% 53.1% 33.3% 40.0%
Administrative and Management Staff 80.1% 71.1% 11.9% 20.3%
Nursing Staff 58.4% 49.4% 34.6% 45.2%
Therapy Staff 52.0% 59.5% 57.0% 30.8%
Food Services Staff 57.2% 54.5% 35.0% 37.7%
Housekeeping and Maintenance Staff 65.6% 63.6% 25.4% 28.0%
Social Services and Activities Staff 63.4% 66.1% 27.0% 24.7%
Nursing Staff
Director of Nursing (DON) 60.9% 65.6% 23.1% 25.3%
RN with Administrative Duties (ARN) 81.2% 53.9% 12.5% 36.3%
Staff Registered Nurse (RN) 52.6% 47.5% 40.0% 46.7%
Licensed Practical Nurse (LPN) 59.7% 52.4% 37.3% 41.8%
Certified Nurse Assistant (CNA) 59.0% 47.8% 33.4% 46.6%
Estimated Number and Percentage* of Nursing Facility Employees
by Job Category and Nursing Job Position, 2009
STATE UNITED STATES
All Nursing Facility Employees 59,501 100.0% 1,964,203 100.0%
Administrative and Management Staff 3,118 5.2% 91,497 4.7%
Nursing Staff 37,166 62.5% 1,294,265 65.9%
Therapy Staff 3,164 5.3% 75,887 3.9%
Food Services Staff 6,764 11.4% 231,020 11.8%
Housekeeping and Maintenance Staff 6,090 10.2% 183,562 9.3%
Social Services and Activities Staff 3,199 5.4% 87,971 4.5%
Nursing Staff 37,166 100.0% 1,294,265 100.0%
Director of Nursing (DON) 353 1.0% 15,625 1.2%
RN with Administrative Duties (ARN) 681 1.8% 33,874 2.6%
Staff Registered Nurse (RN) 5,557 15.0% 119,260 9.2%
Licensed Practical Nurse (LPN) 6,958 18.7% 260,973 20.2%
Certified Nurse Assistant (CNA) 21,015 56.5% 764,049 59.0%
Other Nursing Staff 2,602 7.0% 100,484 7.8%
All retention and turnover statistics were produced by AHCA Research Department using data from 2009 AHCA Nursing Facility Staff
Retention and Turnover Survey. * May not add due to rounding.
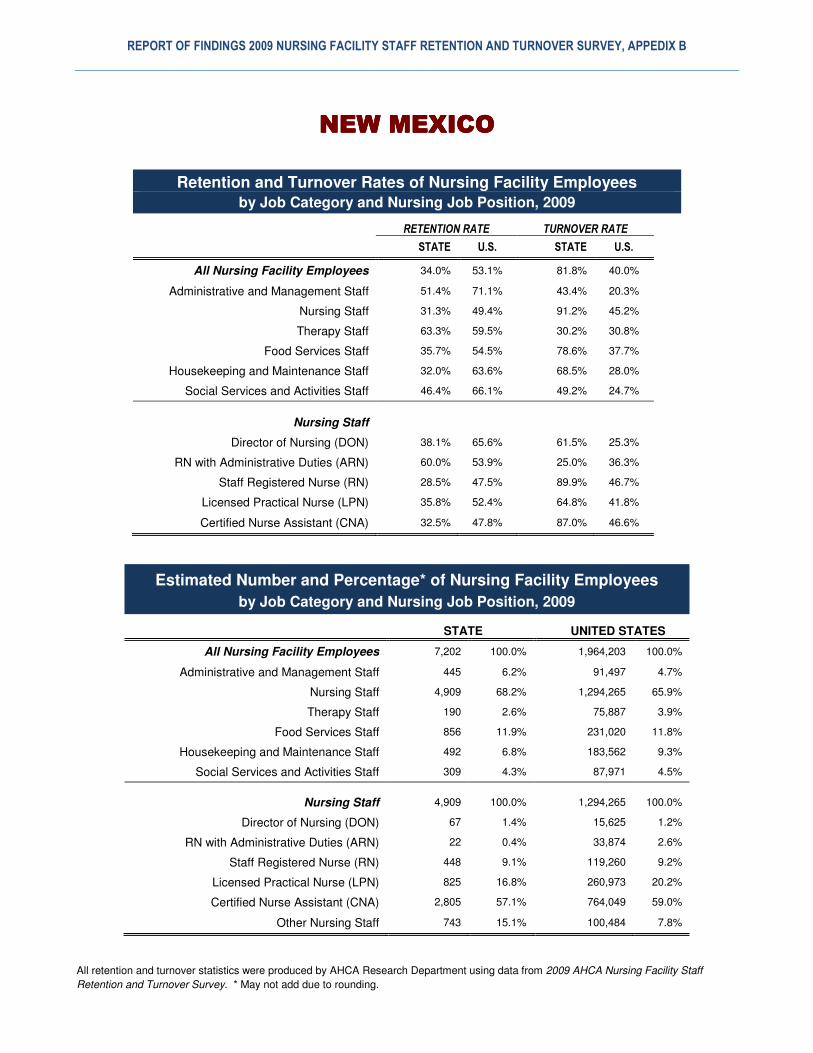
REPORT OF FINDINGS 2009 NURSING FACILITY STAFF RETENTION AND TURNOVER SURVEY, APPEDIX B
NEW MEXICONEW MEXICONEW MEXICONEW MEXICO
Retention and Turnover Rates of Nursing Facility Employees by Job Category and Nursing Job Position, 2009
RETENTION RATE TURNOVER RATE
STATE U.S. STATE U.S.
All Nursing Facility Employees 34.0% 53.1% 81.8% 40.0%
Administrative and Management Staff 51.4% 71.1% 43.4% 20.3%
Nursing Staff 31.3% 49.4% 91.2% 45.2%
Therapy Staff 63.3% 59.5% 30.2% 30.8%
Food Services Staff 35.7% 54.5% 78.6% 37.7%
Housekeeping and Maintenance Staff 32.0% 63.6% 68.5% 28.0%
Social Services and Activities Staff 46.4% 66.1% 49.2% 24.7%
Nursing Staff
Director of Nursing (DON) 38.1% 65.6% 61.5% 25.3%
RN with Administrative Duties (ARN) 60.0% 53.9% 25.0% 36.3%
Staff Registered Nurse (RN) 28.5% 47.5% 89.9% 46.7%
Licensed Practical Nurse (LPN) 35.8% 52.4% 64.8% 41.8%
Certified Nurse Assistant (CNA) 32.5% 47.8% 87.0% 46.6%
Estimated Number and Percentage* of Nursing Facility Employees
by Job Category and Nursing Job Position, 2009
STATE UNITED STATES
All Nursing Facility Employees 7,202 100.0% 1,964,203 100.0%
Administrative and Management Staff 445 6.2% 91,497 4.7%
Nursing Staff 4,909 68.2% 1,294,265 65.9%
Therapy Staff 190 2.6% 75,887 3.9%
Food Services Staff 856 11.9% 231,020 11.8%
Housekeeping and Maintenance Staff 492 6.8% 183,562 9.3%
Social Services and Activities Staff 309 4.3% 87,971 4.5%
Nursing Staff 4,909 100.0% 1,294,265 100.0%
Director of Nursing (DON) 67 1.4% 15,625 1.2%
RN with Administrative Duties (ARN) 22 0.4% 33,874 2.6%
Staff Registered Nurse (RN) 448 9.1% 119,260 9.2%
Licensed Practical Nurse (LPN) 825 16.8% 260,973 20.2%
Certified Nurse Assistant (CNA) 2,805 57.1% 764,049 59.0%
Other Nursing Staff 743 15.1% 100,484 7.8%
All retention and turnover statistics were produced by AHCA Research Department using data from 2009 AHCA Nursing Facility Staff
Retention and Turnover Survey. * May not add due to rounding.

REPORT OF FINDINGS 2009 NURSING FACILITY STAFF RETENTION AND TURNOVER SURVEY, APPEDIX B
NEVADANEVADANEVADANEVADA
Retention and Turnover Rates of Nursing Facility Employees by Job Category and Nursing Job Position, 2009
RETENTION RATE TURNOVER RATE
STATE U.S. STATE U.S.
All Nursing Facility Employees 38.4% 53.1% 68.0% 40.0%
Administrative and Management Staff 52.7% 71.1% 54.3% 20.3%
Nursing Staff 34.0% 49.4% 76.4% 45.2%
Therapy Staff 58.9% 59.5% 32.5% 30.8%
Food Services Staff 50.3% 54.5% 51.8% 37.7%
Housekeeping and Maintenance Staff 45.8% 63.6% 40.7% 28.0%
Social Services and Activities Staff 39.7% 66.1% 76.2% 24.7%
Nursing Staff
Director of Nursing (DON) 63.2% 65.6% 46.2% 25.3%
RN with Administrative Duties (ARN) 23.8% 53.9% 133.3% 36.3%
Staff Registered Nurse (RN) 26.4% 47.5% 87.8% 46.7%
Licensed Practical Nurse (LPN) 38.9% 52.4% 74.2% 41.8%
Certified Nurse Assistant (CNA) 33.4% 47.8% 69.6% 46.6%
Estimated Number and Percentage* of Nursing Facility Employees
by Job Category and Nursing Job Position, 2009
STATE UNITED STATES
All Nursing Facility Employees 7,143 100.0% 1,964,203 100.0%
Administrative and Management Staff 363 5.1% 91,497 4.7%
Nursing Staff 4,850 67.9% 1,294,265 65.9%
Therapy Staff 393 5.5% 75,887 3.9%
Food Services Staff 720 10.1% 231,020 11.8%
Housekeeping and Maintenance Staff 471 6.6% 183,562 9.3%
Social Services and Activities Staff 346 4.8% 87,971 4.5%
Nursing Staff 4,850 100.0% 1,294,265 100.0%
Director of Nursing (DON) 49 1.0% 15,625 1.2%
RN with Administrative Duties (ARN) 40 0.8% 33,874 2.6%
Staff Registered Nurse (RN) 600 12.4% 119,260 9.2%
Licensed Practical Nurse (LPN) 1,112 22.9% 260,973 20.2%
Certified Nurse Assistant (CNA) 2,605 53.7% 764,049 59.0%
Other Nursing Staff 444 9.2% 100,484 7.8%
All retention and turnover statistics were produced by AHCA Research Department using data from 2009 AHCA Nursing Facility Staff
Retention and Turnover Survey. * May not add due to rounding.

REPORT OF FINDINGS 2009 NURSING FACILITY STAFF RETENTION AND TURNOVER SURVEY, APPEDIX B
NEW YORKNEW YORKNEW YORKNEW YORK
Retention and Turnover Rates of Nursing Facility Employees by Job Category and Nursing Job Position, 2009
RETENTION RATE TURNOVER RATE
STATE U.S. STATE U.S.
All Nursing Facility Employees 70.9% 53.1% 18.3% 40.0%
Administrative and Management Staff 86.9% 71.1% 7.8% 20.3%
Nursing Staff 67.5% 49.4% 20.5% 45.2%
Therapy Staff 74.0% 59.5% 13.9% 30.8%
Food Services Staff 70.0% 54.5% 18.6% 37.7%
Housekeeping and Maintenance Staff 82.1% 63.6% 13.5% 28.0%
Social Services and Activities Staff 81.1% 66.1% 12.2% 24.7%
Nursing Staff
Director of Nursing (DON) 84.0% 65.6% 9.5% 25.3%
RN with Administrative Duties (ARN) 77.1% 53.9% 17.6% 36.3%
Staff Registered Nurse (RN) 65.0% 47.5% 22.1% 46.7%
Licensed Practical Nurse (LPN) 66.1% 52.4% 21.9% 41.8%
Certified Nurse Assistant (CNA) 67.2% 47.8% 20.1% 46.6%
Estimated Number and Percentage* of Nursing Facility Employees
by Job Category and Nursing Job Position, 2009
STATE UNITED STATES
All Nursing Facility Employees 134,012 100.0% 1,964,203 100.0%
Administrative and Management Staff 6,399 4.8% 91,497 4.7%
Nursing Staff 86,368 64.4% 1,294,265 65.9%
Therapy Staff 4,980 3.7% 75,887 3.9%
Food Services Staff 16,391 12.2% 231,020 11.8%
Housekeeping and Maintenance Staff 13,850 10.3% 183,562 9.3%
Social Services and Activities Staff 6,025 4.5% 87,971 4.5%
Nursing Staff 86,368 100.0% 1,294,265 100.0%
Director of Nursing (DON) 640 0.7% 15,625 1.2%
RN with Administrative Duties (ARN) 3,533 4.1% 33,874 2.6%
Staff Registered Nurse (RN) 8,044 9.3% 119,260 9.2%
Licensed Practical Nurse (LPN) 17,466 20.2% 260,973 20.2%
Certified Nurse Assistant (CNA) 50,782 58.8% 764,049 59.0%
Other Nursing Staff 5,903 6.8% 100,484 7.8%
All retention and turnover statistics were produced by AHCA Research Department using data from 2009 AHCA Nursing Facility Staff
Retention and Turnover Survey. * May not add due to rounding.

REPORT OF FINDINGS 2009 NURSING FACILITY STAFF RETENTION AND TURNOVER SURVEY, APPEDIX B
OHIOOHIOOHIOOHIO
Retention and Turnover Rates of Nursing Facility Employees by Job Category and Nursing Job Position, 2009
RETENTION RATE TURNOVER RATE
STATE U.S. STATE U.S.
All Nursing Facility Employees 54.9% 53.1% 34.7% 40.0%
Administrative and Management Staff 74.3% 71.1% 13.6% 20.3%
Nursing Staff 50.3% 49.4% 41.1% 45.2%
Therapy Staff 64.0% 59.5% 21.8% 30.8%
Food Services Staff 58.6% 54.5% 28.5% 37.7%
Housekeeping and Maintenance Staff 65.9% 63.6% 22.2% 28.0%
Social Services and Activities Staff 67.5% 66.1% 20.7% 24.7%
Nursing Staff
Director of Nursing (DON) 76.2% 65.6% 15.4% 25.3%
RN with Administrative Duties (ARN) 64.7% 53.9% 29.1% 36.3%
Staff Registered Nurse (RN) 48.7% 47.5% 46.6% 46.7%
Licensed Practical Nurse (LPN) 54.9% 52.4% 36.0% 41.8%
Certified Nurse Assistant (CNA) 47.0% 47.8% 44.3% 46.6%
Estimated Number and Percentage* of Nursing Facility Employees
by Job Category and Nursing Job Position, 2009
STATE UNITED STATES
All Nursing Facility Employees 128,360 100.0% 1,964,203 100.0%
Administrative and Management Staff 5,735 4.5% 91,497 4.7%
Nursing Staff 82,416 64.2% 1,294,265 65.9%
Therapy Staff 6,679 5.2% 75,887 3.9%
Food Services Staff 15,800 12.3% 231,020 11.8%
Housekeeping and Maintenance Staff 12,083 9.4% 183,562 9.3%
Social Services and Activities Staff 5,648 4.4% 87,971 4.5%
Nursing Staff 82,416 100.0% 1,294,265 100.0%
Director of Nursing (DON) 989 1.2% 15,625 1.2%
RN with Administrative Duties (ARN) 1,990 2.4% 33,874 2.6%
Staff Registered Nurse (RN) 7,391 9.0% 119,260 9.2%
Licensed Practical Nurse (LPN) 18,400 22.3% 260,973 20.2%
Certified Nurse Assistant (CNA) 49,466 60.0% 764,049 59.0%
Other Nursing Staff 4,179 5.1% 100,484 7.8%
All retention and turnover statistics were produced by AHCA Research Department using data from 2009 AHCA Nursing Facility Staff
Retention and Turnover Survey. * May not add due to rounding.

REPORT OF FINDINGS 2009 NURSING FACILITY STAFF RETENTION AND TURNOVER SURVEY, APPEDIX B
OKLAHOMAOKLAHOMAOKLAHOMAOKLAHOMA
Retention and Turnover Rates of Nursing Facility Employees by Job Category and Nursing Job Position, 2009
RETENTION RATE TURNOVER RATE
STATE U.S. STATE U.S.
All Nursing Facility Employees 30.7% 53.1% 78.0% 40.0%
Administrative and Management Staff 61.5% 71.1% 32.3% 20.3%
Nursing Staff 25.5% 49.4% 89.9% 45.2%
Therapy Staff 65.7% 59.5% 27.8% 30.8%
Food Services Staff 34.5% 54.5% 59.3% 37.7%
Housekeeping and Maintenance Staff 39.7% 63.6% 67.3% 28.0%
Social Services and Activities Staff 53.4% 66.1% 44.1% 24.7%
Nursing Staff
Director of Nursing (DON) 47.5% 65.6% 43.9% 25.3%
RN with Administrative Duties (ARN) 40.7% 53.9% 50.0% 36.3%
Staff Registered Nurse (RN) 26.7% 47.5% 81.6% 46.7%
Licensed Practical Nurse (LPN) 33.5% 52.4% 71.7% 41.8%
Certified Nurse Assistant (CNA) 21.1% 47.8% 95.4% 46.6%
Estimated Number and Percentage* of Nursing Facility Employees
by Job Category and Nursing Job Position, 2009
STATE UNITED STATES
All Nursing Facility Employees 27,819 100.0% 1,964,203 100.0%
Administrative and Management Staff 1,219 4.4% 91,497 4.7%
Nursing Staff 18,450 66.3% 1,294,265 65.9%
Therapy Staff 613 2.2% 75,887 3.9%
Food Services Staff 3,372 12.1% 231,020 11.8%
Housekeeping and Maintenance Staff 3,056 11.0% 183,562 9.3%
Social Services and Activities Staff 1,109 4.0% 87,971 4.5%
Nursing Staff 18,450 100.0% 1,294,265 100.0%
Director of Nursing (DON) 324 1.8% 15,625 1.2%
RN with Administrative Duties (ARN) 163 0.9% 33,874 2.6%
Staff Registered Nurse (RN) 880 4.8% 119,260 9.2%
Licensed Practical Nurse (LPN) 3,579 19.4% 260,973 20.2%
Certified Nurse Assistant (CNA) 11,562 62.7% 764,049 59.0%
Other Nursing Staff 1,943 10.5% 100,484 7.8%
All retention and turnover statistics were produced by AHCA Research Department using data from 2009 AHCA Nursing Facility Staff
Retention and Turnover Survey. * May not add due to rounding.

REPORT OF FINDINGS 2009 NURSING FACILITY STAFF RETENTION AND TURNOVER SURVEY, APPEDIX B
OREGONOREGONOREGONOREGON
Retention and Turnover Rates of Nursing Facility Employees by Job Category and Nursing Job Position, 2009
RETENTION RATE TURNOVER RATE
STATE U.S. STATE U.S.
All Nursing Facility Employees 46.9% 53.1% 60.2% 40.0%
Administrative and Management Staff 54.2% 71.1% 53.7% 20.3%
Nursing Staff 43.1% 49.4% 64.6% 45.2%
Therapy Staff 51.2% 59.5% 66.8% 30.8%
Food Services Staff 48.5% 54.5% 57.3% 37.7%
Housekeeping and Maintenance Staff 62.2% 63.6% 39.6% 28.0%
Social Services and Activities Staff 53.7% 66.1% 51.2% 24.7%
Nursing Staff
Director of Nursing (DON) 63.5% 65.6% 26.8% 25.3%
RN with Administrative Duties (ARN) 42.6% 53.9% 75.2% 36.3%
Staff Registered Nurse (RN) 34.2% 47.5% 85.2% 46.7%
Licensed Practical Nurse (LPN) 38.0% 52.4% 85.8% 41.8%
Certified Nurse Assistant (CNA) 44.2% 47.8% 56.8% 46.6%
Estimated Number and Percentage* of Nursing Facility Employees
by Job Category and Nursing Job Position, 2009
STATE UNITED STATES
All Nursing Facility Employees 13,381 100.0% 1,964,203 100.0%
Administrative and Management Staff 663 5.0% 91,497 4.7%
Nursing Staff 8,504 63.5% 1,294,265 65.9%
Therapy Staff 753 5.6% 75,887 3.9%
Food Services Staff 1,353 10.1% 231,020 11.8%
Housekeeping and Maintenance Staff 1,340 10.0% 183,562 9.3%
Social Services and Activities Staff 768 5.7% 87,971 4.5%
Nursing Staff 8,504 100.0% 1,294,265 100.0%
Director of Nursing (DON) 134 1.6% 15,625 1.2%
RN with Administrative Duties (ARN) 305 3.6% 33,874 2.6%
Staff Registered Nurse (RN) 660 7.8% 119,260 9.2%
Licensed Practical Nurse (LPN) 1,089 12.8% 260,973 20.2%
Certified Nurse Assistant (CNA) 5,281 62.1% 764,049 59.0%
Other Nursing Staff 1,035 12.2% 100,484 7.8%
All retention and turnover statistics were produced by AHCA Research Department using data from 2009 AHCA Nursing Facility Staff
Retention and Turnover Survey. * May not add due to rounding.

REPORT OF FINDINGS 2009 NURSING FACILITY STAFF RETENTION AND TURNOVER SURVEY, APPEDIX B
PENNSYLVANIAPENNSYLVANIAPENNSYLVANIAPENNSYLVANIA
Retention and Turnover Rates of Nursing Facility Employees by Job Category and Nursing Job Position, 2009
RETENTION RATE TURNOVER RATE
STATE U.S. STATE U.S.
All Nursing Facility Employees 57.7% 53.1% 33.7% 40.0%
Administrative and Management Staff 75.1% 71.1% 16.2% 20.3%
Nursing Staff 54.7% 49.4% 37.5% 45.2%
Therapy Staff 56.2% 59.5% 41.2% 30.8%
Food Services Staff 56.0% 54.5% 34.4% 37.7%
Housekeeping and Maintenance Staff 70.0% 63.6% 18.9% 28.0%
Social Services and Activities Staff 69.2% 66.1% 20.9% 24.7%
Nursing Staff
Director of Nursing (DON) 71.2% 65.6% 16.8% 25.3%
RN with Administrative Duties (ARN) 51.0% 53.9% 38.3% 36.3%
Staff Registered Nurse (RN) 51.3% 47.5% 44.7% 46.7%
Licensed Practical Nurse (LPN) 59.1% 52.4% 31.7% 41.8%
Certified Nurse Assistant (CNA) 53.2% 47.8% 39.3% 46.6%
Estimated Number and Percentage* of Nursing Facility Employees
by Job Category and Nursing Job Position, 2009
STATE UNITED STATES
All Nursing Facility Employees 106,097 100.0% 1,964,203 100.0%
Administrative and Management Staff 5,659 5.3% 91,497 4.7%
Nursing Staff 68,466 64.5% 1,294,265 65.9%
Therapy Staff 3,764 3.5% 75,887 3.9%
Food Services Staff 13,868 13.1% 231,020 11.8%
Housekeeping and Maintenance Staff 9,305 8.8% 183,562 9.3%
Social Services and Activities Staff 5,035 4.7% 87,971 4.5%
Nursing Staff 68,466 100.0% 1,294,265 100.0%
Director of Nursing (DON) 711 1.0% 15,625 1.2%
RN with Administrative Duties (ARN) 3,448 5.0% 33,874 2.6%
Staff Registered Nurse (RN) 6,866 10.0% 119,260 9.2%
Licensed Practical Nurse (LPN) 13,772 20.1% 260,973 20.2%
Certified Nurse Assistant (CNA) 38,966 56.9% 764,049 59.0%
Other Nursing Staff 4,704 6.9% 100,484 7.8%
All retention and turnover statistics were produced by AHCA Research Department using data from 2009 AHCA Nursing Facility Staff
Retention and Turnover Survey. * May not add due to rounding.

REPORT OF FINDINGS 2009 NURSING FACILITY STAFF RETENTION AND TURNOVER SURVEY, APPEDIX B
RHODE ISLANDRHODE ISLANDRHODE ISLANDRHODE ISLAND
Retention and Turnover Rates of Nursing Facility Employees by Job Category and Nursing Job Position, 2009
RETENTION RATE TURNOVER RATE
STATE U.S. STATE U.S.
All Nursing Facility Employees 60.5% 53.1% 35.7% 40.0%
Administrative and Management Staff 81.4% 71.1% 17.2% 20.3%
Nursing Staff 58.2% 49.4% 38.1% 45.2%
Therapy Staff 54.3% 59.5% 48.1% 30.8%
Food Services Staff 59.6% 54.5% 36.6% 37.7%
Housekeeping and Maintenance Staff 73.2% 63.6% 20.4% 28.0%
Social Services and Activities Staff 65.0% 66.1% 31.0% 24.7%
Nursing Staff
Director of Nursing (DON) 72.5% 65.6% 17.6% 25.3%
RN with Administrative Duties (ARN) 75.8% 53.9% 15.8% 36.3%
Staff Registered Nurse (RN) 49.2% 47.5% 47.9% 46.7%
Licensed Practical Nurse (LPN) 64.1% 52.4% 35.8% 41.8%
Certified Nurse Assistant (CNA) 57.4% 47.8% 39.0% 46.6%
Estimated Number and Percentage* of Nursing Facility Employees
by Job Category and Nursing Job Position, 2009
STATE UNITED STATES
All Nursing Facility Employees 12,736 100.0% 1,964,203 100.0%
Administrative and Management Staff 562 4.4% 91,497 4.7%
Nursing Staff 8,232 64.6% 1,294,265 65.9%
Therapy Staff 797 6.3% 75,887 3.9%
Food Services Staff 1,435 11.3% 231,020 11.8%
Housekeeping and Maintenance Staff 1,141 9.0% 183,562 9.3%
Social Services and Activities Staff 568 4.5% 87,971 4.5%
Nursing Staff 8,232 100.0% 1,294,265 100.0%
Director of Nursing (DON) 89 1.1% 15,625 1.2%
RN with Administrative Duties (ARN) 153 1.9% 33,874 2.6%
Staff Registered Nurse (RN) 1,229 14.9% 119,260 9.2%
Licensed Practical Nurse (LPN) 1,043 12.7% 260,973 20.2%
Certified Nurse Assistant (CNA) 5,044 61.3% 764,049 59.0%
Other Nursing Staff 675 8.2% 100,484 7.8%
All retention and turnover statistics were produced by AHCA Research Department using data from 2009 AHCA Nursing Facility Staff
Retention and Turnover Survey. * May not add due to rounding.

REPORT OF FINDINGS 2009 NURSING FACILITY STAFF RETENTION AND TURNOVER SURVEY, APPEDIX B
SOUTH CAROLINASOUTH CAROLINASOUTH CAROLINASOUTH CAROLINA
Retention and Turnover Rates of Nursing Facility Employees by Job Category and Nursing Job Position, 2009
RETENTION RATE TURNOVER RATE
STATE U.S. STATE U.S.
All Nursing Facility Employees 54.5% 53.1% 37.5% 40.0%
Administrative and Management Staff 76.7% 71.1% 34.3% 20.3%
Nursing Staff 51.9% 49.4% 40.6% 45.2%
Therapy Staff 22.6% 59.5% 27.7% 30.8%
Food Services Staff 54.8% 54.5% 41.0% 37.7%
Housekeeping and Maintenance Staff 74.6% 63.6% 12.0% 28.0%
Social Services and Activities Staff 68.0% 66.1% 23.7% 24.7%
Nursing Staff
Director of Nursing (DON) 70.0% 65.6% 37.9% 25.3%
RN with Administrative Duties (ARN) 57.1% 53.9% 35.5% 36.3%
Staff Registered Nurse (RN) 41.3% 47.5% 62.4% 46.7%
Licensed Practical Nurse (LPN) 49.9% 52.4% 41.0% 41.8%
Certified Nurse Assistant (CNA) 51.9% 47.8% 39.0% 46.6%
Estimated Number and Percentage* of Nursing Facility Employees
by Job Category and Nursing Job Position, 2009
STATE UNITED STATES
All Nursing Facility Employees 22,213 100.0% 1,964,203 100.0%
Administrative and Management Staff 1,049 4.7% 91,497 4.7%
Nursing Staff 15,556 70.0% 1,294,265 65.9%
Therapy Staff 573 2.6% 75,887 3.9%
Food Services Staff 2,734 12.3% 231,020 11.8%
Housekeeping and Maintenance Staff 1,466 6.6% 183,562 9.3%
Social Services and Activities Staff 836 3.8% 87,971 4.5%
Nursing Staff 15,556 100.0% 1,294,265 100.0%
Director of Nursing (DON) 177 1.1% 15,625 1.2%
RN with Administrative Duties (ARN) 196 1.3% 33,874 2.6%
Staff Registered Nurse (RN) 1,014 6.5% 119,260 9.2%
Licensed Practical Nurse (LPN) 3,748 24.1% 260,973 20.2%
Certified Nurse Assistant (CNA) 9,242 59.4% 764,049 59.0%
Other Nursing Staff 1,179 7.6% 100,484 7.8%
All retention and turnover statistics were produced by AHCA Research Department using data from 2009 AHCA Nursing Facility Staff
Retention and Turnover Survey. * May not add due to rounding.

REPORT OF FINDINGS 2009 NURSING FACILITY STAFF RETENTION AND TURNOVER SURVEY, APPEDIX B
SOUTH DAKOTASOUTH DAKOTASOUTH DAKOTASOUTH DAKOTA
Retention and Turnover Rates of Nursing Facility Employees by Job Category and Nursing Job Position, 2009
RETENTION RATE TURNOVER RATE
STATE U.S. STATE U.S.
All Nursing Facility Employees 53.6% 53.1% 39.0% 40.0%
Administrative and Management Staff 91.6% 71.1% 3.5% 20.3%
Nursing Staff 49.4% 49.4% 44.3% 45.2%
Therapy Staff 68.2% 59.5% 37.5% 30.8%
Food Services Staff 55.2% 54.5% 39.2% 37.7%
Housekeeping and Maintenance Staff 59.1% 63.6% 32.7% 28.0%
Social Services and Activities Staff 69.3% 66.1% 16.5% 24.7%
Nursing Staff
Director of Nursing (DON) 75.8% 65.6% 22.2% 25.3%
RN with Administrative Duties (ARN) 52.1% 53.9% 35.7% 36.3%
Staff Registered Nurse (RN) 70.1% 47.5% 33.3% 46.7%
Licensed Practical Nurse (LPN) 62.5% 52.4% 24.7% 41.8%
Certified Nurse Assistant (CNA) 44.2% 47.8% 51.3% 46.6%
Estimated Number and Percentage* of Nursing Facility Employees
by Job Category and Nursing Job Position, 2009
STATE UNITED STATES
All Nursing Facility Employees 9,489 100.0% 1,964,203 100.0%
Administrative and Management Staff 432 4.6% 91,497 4.7%
Nursing Staff 6,137 64.7% 1,294,265 65.9%
Therapy Staff 67 0.7% 75,887 3.9%
Food Services Staff 1,494 15.7% 231,020 11.8%
Housekeeping and Maintenance Staff 819 8.6% 183,562 9.3%
Social Services and Activities Staff 540 5.7% 87,971 4.5%
Nursing Staff 6,137 100.0% 1,294,265 100.0%
Director of Nursing (DON) 101 1.7% 15,625 1.2%
RN with Administrative Duties (ARN) 634 10.3% 33,874 2.6%
Staff Registered Nurse (RN) 447 7.3% 119,260 9.2%
Licensed Practical Nurse (LPN) 676 11.0% 260,973 20.2%
Certified Nurse Assistant (CNA) 3,884 63.3% 764,049 59.0%
Other Nursing Staff 395 6.4% 100,484 7.8%
All retention and turnover statistics were produced by AHCA Research Department using data from 2009 AHCA Nursing Facility Staff
Retention and Turnover Survey. * May not add due to rounding.

REPORT OF FINDINGS 2009 NURSING FACILITY STAFF RETENTION AND TURNOVER SURVEY, APPEDIX B
TENNESSEETENNESSEETENNESSEETENNESSEE
Retention and Turnover Rates of Nursing Facility Employees by Job Category and Nursing Job Position, 2009
RETENTION RATE TURNOVER RATE
STATE U.S. STATE U.S.
All Nursing Facility Employees 52.9% 53.1% 38.0% 40.0%
Administrative and Management Staff 74.3% 71.1% 15.7% 20.3%
Nursing Staff 47.7% 49.4% 46.8% 45.2%
Therapy Staff 60.2% 59.5% 18.1% 30.8%
Food Services Staff 60.9% 54.5% 25.7% 37.7%
Housekeeping and Maintenance Staff 66.2% 63.6% 22.1% 28.0%
Social Services and Activities Staff 67.2% 66.1% 19.6% 24.7%
Nursing Staff
Director of Nursing (DON) 71.7% 65.6% 19.5% 25.3%
RN with Administrative Duties (ARN) 60.7% 53.9% 22.7% 36.3%
Staff Registered Nurse (RN) 54.0% 47.5% 41.2% 46.7%
Licensed Practical Nurse (LPN) 50.0% 52.4% 41.8% 41.8%
Certified Nurse Assistant (CNA) 44.4% 47.8% 51.0% 46.6%
Estimated Number and Percentage* of Nursing Facility Employees
by Job Category and Nursing Job Position, 2009
STATE UNITED STATES
All Nursing Facility Employees 43,005 100.0% 1,964,203 100.0%
Administrative and Management Staff 1,951 4.5% 91,497 4.7%
Nursing Staff 28,002 65.1% 1,294,265 65.9%
Therapy Staff 2,023 4.7% 75,887 3.9%
Food Services Staff 4,661 10.8% 231,020 11.8%
Housekeeping and Maintenance Staff 4,834 11.2% 183,562 9.3%
Social Services and Activities Staff 1,533 3.6% 87,971 4.5%
Nursing Staff 28,002 100.0% 1,294,265 100.0%
Director of Nursing (DON) 322 1.2% 15,625 1.2%
RN with Administrative Duties (ARN) 507 1.8% 33,874 2.6%
Staff Registered Nurse (RN) 2,108 7.5% 119,260 9.2%
Licensed Practical Nurse (LPN) 7,021 25.1% 260,973 20.2%
Certified Nurse Assistant (CNA) 16,034 57.3% 764,049 59.0%
Other Nursing Staff 2,010 7.2% 100,484 7.8%
All retention and turnover statistics were produced by AHCA Research Department using data from 2009 AHCA Nursing Facility Staff
Retention and Turnover Survey. * May not add due to rounding.

REPORT OF FINDINGS 2009 NURSING FACILITY STAFF RETENTION AND TURNOVER SURVEY, APPEDIX B
TEXASTEXASTEXASTEXAS
Retention and Turnover Rates of Nursing Facility Employees by Job Category and Nursing Job Position, 2009
RETENTION RATE TURNOVER RATE
STATE U.S. STATE U.S.
All Nursing Facility Employees 35.7% 53.1% 76.1% 40.0%
Administrative and Management Staff 54.6% 71.1% 44.2% 20.3%
Nursing Staff 33.0% 49.4% 82.7% 45.2%
Therapy Staff 62.0% 59.5% 10.7% 30.8%
Food Services Staff 34.6% 54.5% 80.3% 37.7%
Housekeeping and Maintenance Staff 39.9% 63.6% 67.8% 28.0%
Social Services and Activities Staff 54.6% 66.1% 37.3% 24.7%
Nursing Staff
Director of Nursing (DON) 43.2% 65.6% 59.4% 25.3%
RN with Administrative Duties (ARN) 51.6% 53.9% 37.8% 36.3%
Staff Registered Nurse (RN) 33.0% 47.5% 71.1% 46.7%
Licensed Practical Nurse (LPN) 35.0% 52.4% 70.5% 41.8%
Certified Nurse Assistant (CNA) 30.0% 47.8% 91.9% 46.6%
Estimated Number and Percentage* of Nursing Facility Employees
by Job Category and Nursing Job Position, 2009
STATE UNITED STATES
All Nursing Facility Employees 115,959 100.0% 1,964,203 100.0%
Administrative and Management Staff 6,220 5.4% 91,497 4.7%
Nursing Staff 78,527 67.7% 1,294,265 65.9%
Therapy Staff 2,118 1.8% 75,887 3.9%
Food Services Staff 13,479 11.6% 231,020 11.8%
Housekeeping and Maintenance Staff 11,916 10.3% 183,562 9.3%
Social Services and Activities Staff 3,699 3.2% 87,971 4.5%
Nursing Staff 78,527 100.0% 1,294,265 100.0%
Director of Nursing (DON) 1,154 1.5% 15,625 1.2%
RN with Administrative Duties (ARN) 504 0.6% 33,874 2.6%
Staff Registered Nurse (RN) 3,405 4.3% 119,260 9.2%
Licensed Practical Nurse (LPN) 19,335 24.6% 260,973 20.2%
Certified Nurse Assistant (CNA) 45,093 57.4% 764,049 59.0%
Other Nursing Staff 9,037 11.5% 100,484 7.8%
All retention and turnover statistics were produced by AHCA Research Department using data from 2009 AHCA Nursing Facility Staff
Retention and Turnover Survey. * May not add due to rounding.

REPORT OF FINDINGS 2009 NURSING FACILITY STAFF RETENTION AND TURNOVER SURVEY, APPEDIX B
UTAHUTAHUTAHUTAH
Retention and Turnover Rates of Nursing Facility Employees by Job Category and Nursing Job Position, 2009
RETENTION RATE TURNOVER RATE
STATE U.S. STATE U.S.
All Nursing Facility Employees 41.0% 53.1% 62.8% 40.0%
Administrative and Management Staff 59.8% 71.1% 34.9% 20.3%
Nursing Staff 35.1% 49.4% 73.7% 45.2%
Therapy Staff 71.5% 59.5% 13.8% 30.8%
Food Services Staff 37.4% 54.5% 76.2% 37.7%
Housekeeping and Maintenance Staff 47.7% 63.6% 55.3% 28.0%
Social Services and Activities Staff 67.3% 66.1% 33.6% 24.7%
Nursing Staff
Director of Nursing (DON) 50.0% 65.6% 50.0% 25.3%
RN with Administrative Duties (ARN) 100.0% 53.9% 0.0% 36.3%
Staff Registered Nurse (RN) 38.1% 47.5% 61.6% 46.7%
Licensed Practical Nurse (LPN) 45.8% 52.4% 62.4% 41.8%
Certified Nurse Assistant (CNA) 36.0% 47.8% 65.8% 46.6%
Estimated Number and Percentage* of Nursing Facility Employees
by Job Category and Nursing Job Position, 2009
STATE UNITED STATES
All Nursing Facility Employees 8,314 100.0% 1,964,203 100.0%
Administrative and Management Staff 415 5.0% 91,497 4.7%
Nursing Staff 5,381 64.7% 1,294,265 65.9%
Therapy Staff 857 10.3% 75,887 3.9%
Food Services Staff 712 8.6% 231,020 11.8%
Housekeeping and Maintenance Staff 583 7.0% 183,562 9.3%
Social Services and Activities Staff 366 4.4% 87,971 4.5%
Nursing Staff 5,381 100.0% 1,294,265 100.0%
Director of Nursing (DON) 82 1.5% 15,625 1.2%
RN with Administrative Duties (ARN) 52 1.0% 33,874 2.6%
Staff Registered Nurse (RN) 857 15.9% 119,260 9.2%
Licensed Practical Nurse (LPN) 749 13.9% 260,973 20.2%
Certified Nurse Assistant (CNA) 3,127 58.1% 764,049 59.0%
Other Nursing Staff 515 9.6% 100,484 7.8%
All retention and turnover statistics were produced by AHCA Research Department using data from 2009 AHCA Nursing Facility Staff
Retention and Turnover Survey. * May not add due to rounding.

REPORT OF FINDINGS 2009 NURSING FACILITY STAFF RETENTION AND TURNOVER SURVEY, APPEDIX B
VIRGINIAVIRGINIAVIRGINIAVIRGINIA
Retention and Turnover Rates of Nursing Facility Employees by Job Category and Nursing Job Position, 2009
RETENTION RATE TURNOVER RATE
STATE U.S. STATE U.S.
All Nursing Facility Employees 50.0% 53.1% 45.0% 40.0%
Administrative and Management Staff 73.9% 71.1% 19.4% 20.3%
Nursing Staff 45.7% 49.4% 52.8% 45.2%
Therapy Staff 53.1% 59.5% 25.5% 30.8%
Food Services Staff 52.7% 54.5% 37.6% 37.7%
Housekeeping and Maintenance Staff 64.3% 63.6% 28.5% 28.0%
Social Services and Activities Staff 68.5% 66.1% 20.4% 24.7%
Nursing Staff
Director of Nursing (DON) 71.7% 65.6% 15.0% 25.3%
RN with Administrative Duties (ARN) 44.3% 53.9% 43.6% 36.3%
Staff Registered Nurse (RN) 41.0% 47.5% 65.4% 46.7%
Licensed Practical Nurse (LPN) 51.0% 52.4% 47.4% 41.8%
Certified Nurse Assistant (CNA) 42.9% 47.8% 56.4% 46.6%
Estimated Number and Percentage* of Nursing Facility Employees
by Job Category and Nursing Job Position, 2009
STATE UNITED STATES
All Nursing Facility Employees 39,903 100.0% 1,964,203 100.0%
Administrative and Management Staff 2,316 5.8% 91,497 4.7%
Nursing Staff 26,955 67.6% 1,294,265 65.9%
Therapy Staff 1,567 3.9% 75,887 3.9%
Food Services Staff 4,488 11.2% 231,020 11.8%
Housekeeping and Maintenance Staff 3,111 7.8% 183,562 9.3%
Social Services and Activities Staff 1,465 3.7% 87,971 4.5%
Nursing Staff 26,955 100.0% 1,294,265 100.0%
Director of Nursing (DON) 281 1.0% 15,625 1.2%
RN with Administrative Duties (ARN) 984 3.6% 33,874 2.6%
Staff Registered Nurse (RN) 1,440 5.3% 119,260 9.2%
Licensed Practical Nurse (LPN) 6,950 25.8% 260,973 20.2%
Certified Nurse Assistant (CNA) 15,496 57.5% 764,049 59.0%
Other Nursing Staff 1,805 6.7% 100,484 7.8%
All retention and turnover statistics were produced by AHCA Research Department using data from 2009 AHCA Nursing Facility Staff
Retention and Turnover Survey. * May not add due to rounding.

REPORT OF FINDINGS 2009 NURSING FACILITY STAFF RETENTION AND TURNOVER SURVEY, APPEDIX B
VERMONTVERMONTVERMONTVERMONT
Retention and Turnover Rates of Nursing Facility Employees by Job Category and Nursing Job Position, 2009
RETENTION RATE TURNOVER RATE
STATE U.S. STATE U.S.
All Nursing Facility Employees 52.4% 53.1% 37.1% 40.0%
Administrative and Management Staff 78.6% 71.1% 15.1% 20.3%
Nursing Staff 49.5% 49.4% 42.8% 45.2%
Therapy Staff 55.2% 59.5% 51.0% 30.8%
Food Services Staff 47.1% 54.5% 33.1% 37.7%
Housekeeping and Maintenance Staff 57.8% 63.6% 23.9% 28.0%
Social Services and Activities Staff 70.8% 66.1% 20.3% 24.7%
Nursing Staff
Director of Nursing (DON) 52.6% 65.6% 35.7% 25.3%
RN with Administrative Duties (ARN) 75.0% 53.9% 14.3% 36.3%
Staff Registered Nurse (RN) 45.1% 47.5% 53.7% 46.7%
Licensed Practical Nurse (LPN) 62.8% 52.4% 29.1% 41.8%
Certified Nurse Assistant (CNA) 44.5% 47.8% 49.0% 46.6%
Estimated Number and Percentage* of Nursing Facility Employees
by Job Category and Nursing Job Position, 2009
STATE UNITED STATES
All Nursing Facility Employees 4,912 100.0% 1,964,203 100.0%
Administrative and Management Staff 195 4.0% 91,497 4.7%
Nursing Staff 2,949 60.0% 1,294,265 65.9%
Therapy Staff 188 3.8% 75,887 3.9%
Food Services Staff 693 14.1% 231,020 11.8%
Housekeeping and Maintenance Staff 609 12.4% 183,562 9.3%
Social Services and Activities Staff 279 5.7% 87,971 4.5%
Nursing Staff 2,949 100.0% 1,294,265 100.0%
Director of Nursing (DON) 37 1.3% 15,625 1.2%
RN with Administrative Duties (ARN) 43 1.5% 33,874 2.6%
Staff Registered Nurse (RN) 420 14.2% 119,260 9.2%
Licensed Practical Nurse (LPN) 523 17.7% 260,973 20.2%
Certified Nurse Assistant (CNA) 1,715 58.1% 764,049 59.0%
Other Nursing Staff 211 7.2% 100,484 7.8%
All retention and turnover statistics were produced by AHCA Research Department using data from 2009 AHCA Nursing Facility Staff
Retention and Turnover Survey. * May not add due to rounding.

REPORT OF FINDINGS 2009 NURSING FACILITY STAFF RETENTION AND TURNOVER SURVEY, APPEDIX B
WASHINGTONWASHINGTONWASHINGTONWASHINGTON
Retention and Turnover Rates of Nursing Facility Employees by Job Category and Nursing Job Position, 2009
RETENTION RATE TURNOVER RATE
STATE U.S. STATE U.S.
All Nursing Facility Employees 44.7% 53.1% 50.0% 40.0%
Administrative and Management Staff 64.0% 71.1% 26.6% 20.3%
Nursing Staff 40.2% 49.4% 56.4% 45.2%
Therapy Staff 60.4% 59.5% 33.6% 30.8%
Food Services Staff 49.6% 54.5% 44.1% 37.7%
Housekeeping and Maintenance Staff 50.3% 63.6% 42.1% 28.0%
Social Services and Activities Staff 64.2% 66.1% 26.0% 24.7%
Nursing Staff
Director of Nursing (DON) 63.6% 65.6% 33.3% 25.3%
RN with Administrative Duties (ARN) 55.6% 53.9% 43.2% 36.3%
Staff Registered Nurse (RN) 46.0% 47.5% 41.2% 46.7%
Licensed Practical Nurse (LPN) 43.9% 52.4% 48.4% 41.8%
Certified Nurse Assistant (CNA) 37.1% 47.8% 60.7% 46.6%
Estimated Number and Percentage* of Nursing Facility Employees
by Job Category and Nursing Job Position, 2009
STATE UNITED STATES
All Nursing Facility Employees 27,608 100.0% 1,964,203 100.0%
Administrative and Management Staff 1,140 4.1% 91,497 4.7%
Nursing Staff 18,380 66.6% 1,294,265 65.9%
Therapy Staff 1,466 5.3% 75,887 3.9%
Food Services Staff 2,817 10.2% 231,020 11.8%
Housekeeping and Maintenance Staff 2,461 8.9% 183,562 9.3%
Social Services and Activities Staff 1,344 4.9% 87,971 4.5%
Nursing Staff 18,380 100.0% 1,294,265 100.0%
Director of Nursing (DON) 226 1.2% 15,625 1.2%
RN with Administrative Duties (ARN) 331 1.8% 33,874 2.6%
Staff Registered Nurse (RN) 2,366 12.9% 119,260 9.2%
Licensed Practical Nurse (LPN) 3,036 16.5% 260,973 20.2%
Certified Nurse Assistant (CNA) 10,052 54.7% 764,049 59.0%
Other Nursing Staff 2,368 12.9% 100,484 7.8%
All retention and turnover statistics were produced by AHCA Research Department using data from 2009 AHCA Nursing Facility Staff
Retention and Turnover Survey. * May not add due to rounding.

REPORT OF FINDINGS 2009 NURSING FACILITY STAFF RETENTION AND TURNOVER SURVEY, APPEDIX B
WISCONSINWISCONSINWISCONSINWISCONSIN
Retention and Turnover Rates of Nursing Facility Employees by Job Category and Nursing Job Position, 2009
RETENTION RATE TURNOVER RATE
STATE U.S. STATE U.S.
All Nursing Facility Employees 54.4% 53.1% 37.7% 40.0%
Administrative and Management Staff 77.1% 71.1% 13.3% 20.3%
Nursing Staff 50.5% 49.4% 43.1% 45.2%
Therapy Staff 68.4% 59.5% 31.9% 30.8%
Food Services Staff 53.9% 54.5% 34.8% 37.7%
Housekeeping and Maintenance Staff 67.9% 63.6% 23.2% 28.0%
Social Services and Activities Staff 65.2% 66.1% 23.6% 24.7%
Nursing Staff
Director of Nursing (DON) 75.8% 65.6% 15.2% 25.3%
RN with Administrative Duties (ARN) 48.7% 53.9% 43.3% 36.3%
Staff Registered Nurse (RN) 45.5% 47.5% 49.3% 46.7%
Licensed Practical Nurse (LPN) 54.9% 52.4% 39.4% 41.8%
Certified Nurse Assistant (CNA) 49.0% 47.8% 44.8% 46.6%
Estimated Number and Percentage* of Nursing Facility Employees
by Job Category and Nursing Job Position, 2009
STATE UNITED STATES
All Nursing Facility Employees 47,248 100.0% 1,964,203 100.0%
Administrative and Management Staff 2,212 4.7% 91,497 4.7%
Nursing Staff 31,349 66.4% 1,294,265 65.9%
Therapy Staff 1,503 3.2% 75,887 3.9%
Food Services Staff 6,108 12.9% 231,020 11.8%
Housekeeping and Maintenance Staff 3,592 7.6% 183,562 9.3%
Social Services and Activities Staff 2,484 5.3% 87,971 4.5%
Nursing Staff 31,349 100.0% 1,294,265 100.0%
Director of Nursing (DON) 391 1.2% 15,625 1.2%
RN with Administrative Duties (ARN) 1,620 5.2% 33,874 2.6%
Staff Registered Nurse (RN) 3,143 10.0% 119,260 9.2%
Licensed Practical Nurse (LPN) 4,570 14.6% 260,973 20.2%
Certified Nurse Assistant (CNA) 19,623 62.6% 764,049 59.0%
Other Nursing Staff 2,003 6.4% 100,484 7.8%
All retention and turnover statistics were produced by AHCA Research Department using data from 2009 AHCA Nursing Facility Staff
Retention and Turnover Survey. * May not add due to rounding.
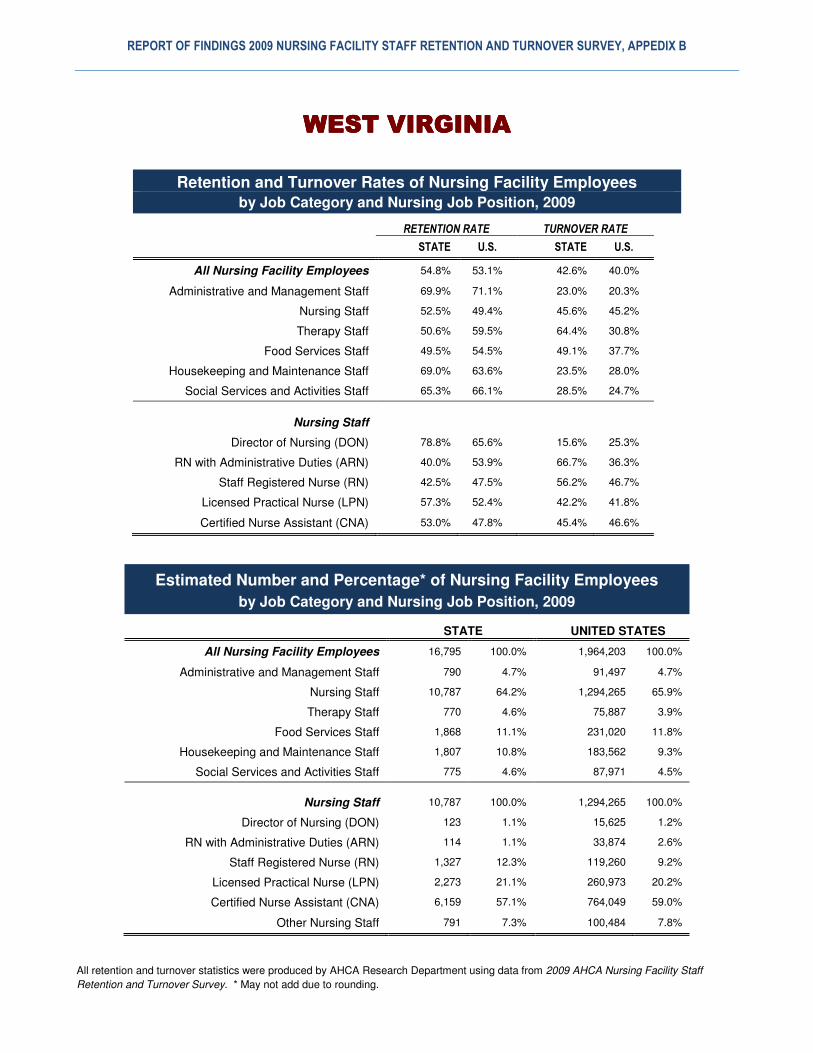
REPORT OF FINDINGS 2009 NURSING FACILITY STAFF RETENTION AND TURNOVER SURVEY, APPEDIX B
WEST VIRGINIAWEST VIRGINIAWEST VIRGINIAWEST VIRGINIA
Retention and Turnover Rates of Nursing Facility Employees by Job Category and Nursing Job Position, 2009
RETENTION RATE TURNOVER RATE
STATE U.S. STATE U.S.
All Nursing Facility Employees 54.8% 53.1% 42.6% 40.0%
Administrative and Management Staff 69.9% 71.1% 23.0% 20.3%
Nursing Staff 52.5% 49.4% 45.6% 45.2%
Therapy Staff 50.6% 59.5% 64.4% 30.8%
Food Services Staff 49.5% 54.5% 49.1% 37.7%
Housekeeping and Maintenance Staff 69.0% 63.6% 23.5% 28.0%
Social Services and Activities Staff 65.3% 66.1% 28.5% 24.7%
Nursing Staff
Director of Nursing (DON) 78.8% 65.6% 15.6% 25.3%
RN with Administrative Duties (ARN) 40.0% 53.9% 66.7% 36.3%
Staff Registered Nurse (RN) 42.5% 47.5% 56.2% 46.7%
Licensed Practical Nurse (LPN) 57.3% 52.4% 42.2% 41.8%
Certified Nurse Assistant (CNA) 53.0% 47.8% 45.4% 46.6%
Estimated Number and Percentage* of Nursing Facility Employees
by Job Category and Nursing Job Position, 2009
STATE UNITED STATES
All Nursing Facility Employees 16,795 100.0% 1,964,203 100.0%
Administrative and Management Staff 790 4.7% 91,497 4.7%
Nursing Staff 10,787 64.2% 1,294,265 65.9%
Therapy Staff 770 4.6% 75,887 3.9%
Food Services Staff 1,868 11.1% 231,020 11.8%
Housekeeping and Maintenance Staff 1,807 10.8% 183,562 9.3%
Social Services and Activities Staff 775 4.6% 87,971 4.5%
Nursing Staff 10,787 100.0% 1,294,265 100.0%
Director of Nursing (DON) 123 1.1% 15,625 1.2%
RN with Administrative Duties (ARN) 114 1.1% 33,874 2.6%
Staff Registered Nurse (RN) 1,327 12.3% 119,260 9.2%
Licensed Practical Nurse (LPN) 2,273 21.1% 260,973 20.2%
Certified Nurse Assistant (CNA) 6,159 57.1% 764,049 59.0%
Other Nursing Staff 791 7.3% 100,484 7.8%
All retention and turnover statistics were produced by AHCA Research Department using data from 2009 AHCA Nursing Facility Staff
Retention and Turnover Survey. * May not add due to rounding.

REPORT OF FINDINGS 2009 NURSING FACILITY STAFF RETENTION AND TURNOVER SURVEY, APPEDIX B
WYOMINGWYOMINGWYOMINGWYOMING
Retention and Turnover Rates of Nursing Facility Employees by Job Category and Nursing Job Position, 2009
RETENTION RATE TURNOVER RATE
STATE U.S. STATE U.S.
All Nursing Facility Employees 33.2% 53.1% 89.5% 40.0%
Administrative and Management Staff 62.5% 71.1% 41.2% 20.3%
Nursing Staff 32.2% 49.4% 90.8% 45.2%
Therapy Staff 51.8% 59.5% 52.2% 30.8%
Food Services Staff 22.4% 54.5% 117.1% 37.7%
Housekeeping and Maintenance Staff 36.2% 63.6% 99.6% 28.0%
Social Services and Activities Staff 42.0% 66.1% 60.8% 24.7%
Nursing Staff
Director of Nursing (DON) 44.4% 65.6% 80.0% 25.3%
RN with Administrative Duties (ARN) 100.0% 53.9% 0.0% 36.3%
Staff Registered Nurse (RN) 34.3% 47.5% 75.0% 46.7%
Licensed Practical Nurse (LPN) 50.0% 52.4% 37.3% 41.8%
Certified Nurse Assistant (CNA) 35.1% 47.8% 77.4% 46.6%
Estimated Number and Percentage* of Nursing Facility Employees
by Job Category and Nursing Job Position, 2009
STATE UNITED STATES
All Nursing Facility Employees 3,372 100.0% 1,964,203 100.0%
Administrative and Management Staff 108 3.2% 91,497 4.7%
Nursing Staff 2,158 64.0% 1,294,265 65.9%
Therapy Staff 228 6.8% 75,887 3.9%
Food Services Staff 443 13.1% 231,020 11.8%
Housekeeping and Maintenance Staff 282 8.4% 183,562 9.3%
Social Services and Activities Staff 152 4.5% 87,971 4.5%
Nursing Staff 2,158 100.0% 1,294,265 100.0%
Director of Nursing (DON) 32 1.5% 15,625 1.2%
RN with Administrative Duties (ARN) 8 0.4% 33,874 2.6%
Staff Registered Nurse (RN) 253 11.7% 119,260 9.2%
Licensed Practical Nurse (LPN) 323 15.0% 260,973 20.2%
Certified Nurse Assistant (CNA) 1,343 62.2% 764,049 59.0%
Other Nursing Staff 200 9.3% 100,484 7.8%
All retention and turnover statistics were produced by AHCA Research Department using data from 2009 AHCA Nursing Facility Staff
Retention and Turnover Survey. * May not add due to rounding.

THIS PAGE INTENTIONALLY LEFT BLANK

Visit www.LTCTrendTracker.com to learn more
American Health Care Association
1201 L Street, N.W., Washington, DC 20005
www.ahcancal.org