report of survey and inventory activities waterfowl - hunter · pdf file ·...
TRANSCRIPT
A L A S K A D E P A R T M E N T 0 F F I S H A N D G A M E
J U N E A U, A L A S K A
STATE OF ALASKA William A. Egan, Governor
DEPARTMENT OF FISH AND GAME James W. Brooks, Commissioner
DIVISION OF GAME Frank Jones, Director
REPORT OF SURVEY AND INVENTORY ACTIVITIES
WATERF{)IL HUNTER MAIL OOESTIONNAIRE SURVEY - 1971-72
Prepared and Submitted by Dan Timm, Waterfowl Biologist Edited by Don McKnight, Research Chief
Amendment to Volume III Annual Project Segment Report
Federal Aid in Wildlife Restoration Project W-17-4, Job No. 10
(Printed November, 1972)

MEMORANDUM OF TRANSMITTAl.
To: James w. Brooks. CollllllUsioner Alaska Department of tilth and Game
From: Frank Jones, Director Division of Game
Subject: 1971-72 Waterfowl Bunter Mail Questionnaire Survey -Survey and Inventory Activity
Surveys and inventories include all routine data collections directed toward assessment of the status of J&n\e populations and/or determination of annual game harvests. These reports include study results and conclusions and, Where applicable, recommend hunting regulation changes.
This mail questionnaire survey represents the first one of its kind in Alaska. The federal government annually measures waterfowl harvest and hunter acti,.vity on a statewide basis. Their survey does not break down harvest by area, provide insight into characteristics of Alaska waterfowl hunters, nor does it enable projections of crane and snipe harvests to be made.
We believe the 1971-72 state survey to be the most accurate assessment of waterfowl harvests and hunting activity in Alaska ever made. Similar annual surveys of resident hunters are planned for the future, using s reduced sample size. Nonresident surveys may be conducted every three to five years.
A copy of the 1971-72 seasons and bag limits is included. Also, a sample first mailing resident survey form and second mailing nonresident survey form is included. A table of contents is contained in the report to facilitate access to specific information.
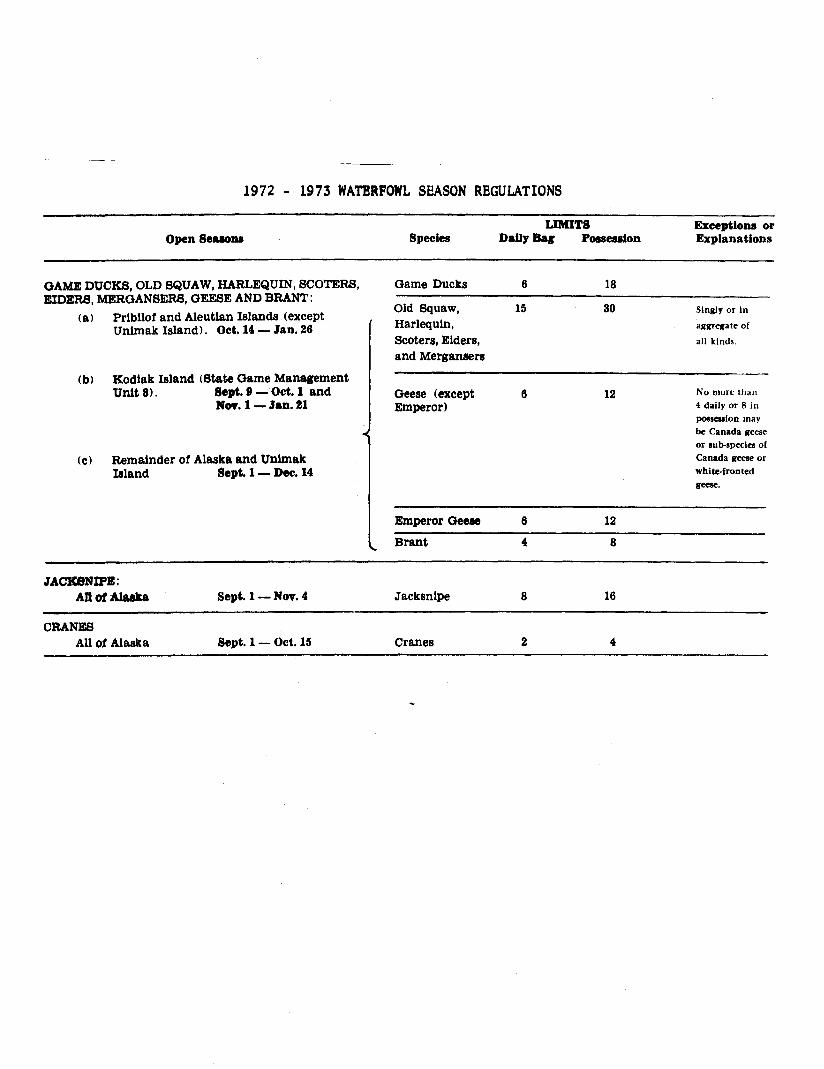
1972 - 1973 WATBRPOWL SEASON REGULATIONS
LIMITS Exceptions or Open SeaiODS Species DaUyBar Poeseulon Explanations
GAME DUCKS, OLD SQUAW, HARLEQUIN, SCOTERS, Game Ducks 6 18 EIDERS, MERGANSERS, GEESE AND BRANT:
<a> Prlbllof and Aleutian Islands <except Unlmak Island). Oct. 14 - Jan. 26
(b) Kodiak Island (State Game Management Unit 8). Sept. 9 - Oct. 1 and
Nov. 1 -Jan. 21
<cl Remainder of Alaska and Unlmak Island Sept. 1 - Dec. 14
Old Squaw, 15 30 Singly or in
Harlequin, al{grega te of
Scoters, Elders, all kinds.
and Mergansers
Geese <except Emperor>
6 12 No mort' than 4 dally or 8 in posseuion may
be Canada geese or sub-species of
Canada geese or
white-fronted geese.
Emperor Geese 6 12
Brant 4 8
JACKSNIPE: AD of Alalka Sept. 1 -Nov. 4 Jacksnlpe 8 16
CRANES All Of Alaska Sept. 1 - Oct. 15 Cranes 2 4

How many days? ___ ,, <:.
Approximate dote of freeze.up in your a reo?---'~----
WILLIAM A. EGAN, GOVERNOR
DEPARTMENT OF FISH AND GAME
SUBPORT BUILDING JUNEAU 99801
Hunter 1 s Name Hunter 1 s Address
License Number
DEAR HUNTER:
Your cooperation is needed to better manage Alaska's waterfowl··now and in the future. By accurately answering the questions below concerning your hunting activities in 1971, you can help insure con· tinued liberal bag limits and good hunting for the future.
Thank you for your cooperation.
WATERFOWL HUNTER SURVEY- 1971-72.
lnatrudlona:
~ hunters complete Port I. Only those who hunted waterfowl or bought o duck stomp in 1971 complete Port II. If you can't remember exact numbers, give your best estimates. Moil promptly. no stomp is necessary.
PART I
Yes ____D1d you hunt for waterfowl !ducks, geese, crones, snMl in Alosko during the 1971·72 season? No ··~~· .
Did you buy o duck stomp in Alosko in 19;,~? Yes . ,~·----
PART II IComplete~ if you hunted wot~owl in Alas~ season or bought o duck stomp in 1971.1 -- ,,. How mony different days did you hunt waterfowl in~·~ko?_____________________
How mony of the following birds did you ·,hoof ~reive? Game ducks I mol lord, teal, pintail. bluebill, tkj...
Non·gome ducks !merganser, scoter, eider, ~yow, etc. I ------"'"'------------ Geese Crones ..;'·-· _______ Snip4 _..,.._____________
In which gome management unit did you shoot most of your ducks? ----l!~i---fi--------------geese? crones? snipe? ~;-""·._.------------ At what place did you shoot most of your ducks? ' gete?.·'------------ li.e., Pilot Point, Minto Flats, 6 m1les S.W. Sitko, Chickaloon Flats, etc. I \ ; f How do you hunt waterfowl? Jump shoot Pass sh~~,; ' Decoys Some people hunt waterfowl ~ incidental to other hunting trips. ~fone day did you g_o_h_u-nt-in-g-in-A-Io-s-ko
only for waterfowl in 1971? Yes No ·· '
UPON COMPLETION, FOLD THIS LETTER ON THE LINES INDICATED, STAPLE SHUT AND DROP IT IN THE MAIL. NO STAMP IS NECHSARY.
41Commissioner~ Department of Fish and Game
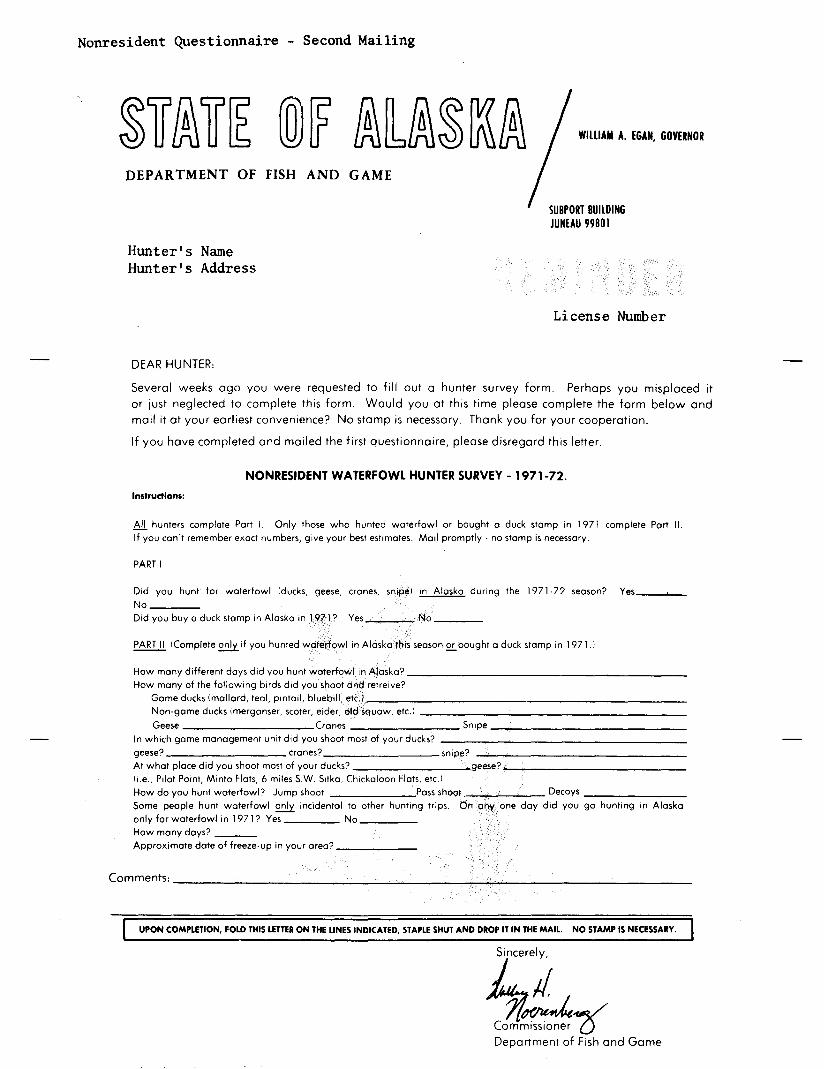
Nonresident Questionnaire - Second Mailing
WILLIAM A. EGAN, GOVERNOR
DEPARTMENT OF FISH AND GAME
SUBPORT BUILDING JUNEAU 9980 I
Hunter 1 s Name Hunter's Address
License Number
DEAR HUNTER:
Several weeks ago you were requested to fill out a hunter survey form. Perhaps you misplaced it
or just neglected to complete this form. Would you at this time please complete the form below and
mail it at your earliest convenience? No stamp is necessary. Thank you for your cooperation.
If you have completed and mailed the first questionnaire, please disregard this letter.
NONRESIDENT WATERFOWL HUNTER SURVEY - 1971-72.
lnslrudions:
.8J.!. hunters complete Part I. Only those who hunted waterfowl or bought a duck stamp in 1971 complete Part II. If you can't remember exact numbers, give your best estimates. Mail promptly· no stamp is necessary.
PART I
Did you hunt for waterfowl !ducks, geese, cranes, snipel in Alaska during the 1971·72 season? Yes ___,__ No ____
Did you buy a duck stamp in Alaska in 19.7!? Yes ____ No ____
E6E!Jl !Complete~ if you hunted waterfowl in Alaska this season£!:_ bought a duck stamp in 1971. I
How many different days did you hunt waterfowl in Alaska?---------------~-----How many of the following birds did you shoot and retreive?
Game ducks I mallard, teal, pintail, bluebill, etc. I _________________________
Non·game ducks I merganser, scoter, eider, ~d squaw, etc. I -------------------- Geese .Cranes Snipe--------------
In which game management unit did you shoot most of your ducks? -------------------- geese? cranes?_________ snipe? At what place did you shoot most of your ducks? geese? ______________
I i.e., Pilot Point, Minto Flats, 6 miles S.W. Sitka, Chickaloon Flats, etc. I How do you hunt waterfowl? Jump shoot ·Pass shoot Decoys ------- Some people hunt waterfowl ~ incidental to other hunting trips. On any one day did you go hunting in Alaska only for waterfowl in 1971? Yes No _____ How many days? ___
Approximate date of freeze-up in your area?-----
Comments: ______________________________________~--------------------------
UPON COMPLETION, FOLD THIS LETTER ON THE LINES INDICATED, STAPLE SHUT AND DROP IT IN THE MAIL. NO STAMP IS NECESSARY.
41Commissioner~ Department of Fish and Game
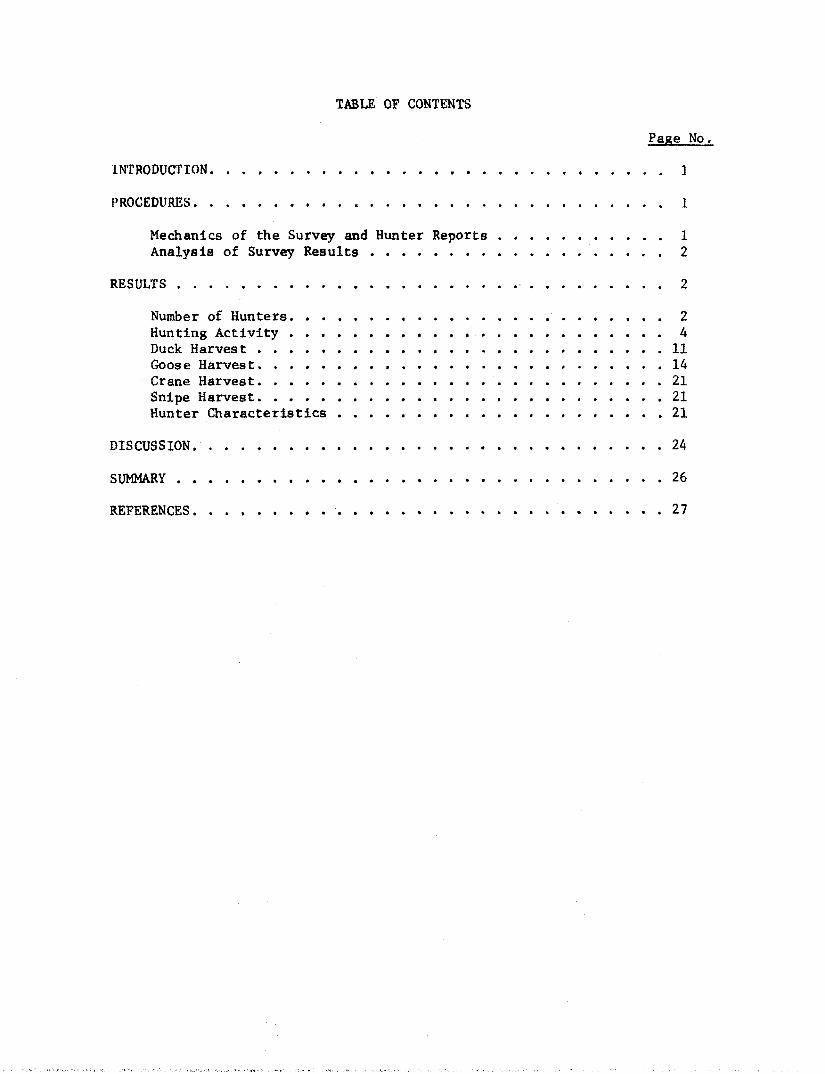
TABLE OF CONTENTS
Page No.
INTRODUCTION. ]
PROCEDURES • 1
Mechanics of the Survey and Hunter Reports 1 Analysis of Survey Results 2
RESULTS .. . 2
Number of Hunters. 2 Hunting Activity 4 Duck Harvest 11 Goose Harvest. 14 Crane Harvest. 21 Snipe Harvest. 21 Hunter Characteristics 21
DISCUSSION. 24
SUMMARY 26
REFERENCES. 27
INTRODUCTION
Although Shepherd (1964) conducted a mail survey of waterfowl hunters in 1964, the Alaska Department of Fish and Game had never accurately determined Alaska's statewide waterfowl harvest until the 1971-72 hunting season. Data derived from a limited number of hunter bag checks and information gathered by the Bureau of Sport Fisheries and Wildlife provided the sole measures of Alaska's annual duck and goose harvests.
Hunter bag checks, conducted annually by state biologists and law enforcement officers as well as personnel of the Bureau of Sport Fisheries and Wildlife, gave some insight into the species composition of the harvest and indicated relative hunter success in localized areas. However, accuracy of species composition projections based on bag checks varied by year, species and harvest area.
Mail questionnaire and parts collections surveys, conducted annually by the Bureau of Sport Fisheries and Wildlife, are designed to assess total harvest and species composition of the nationwide waterfowl harvest. Projections derived from these surveys for Alaska are admittedly questionable, especially for lightly harvested species (Carney, pers. comm., 1970). In addition, the Bureau surveys make no attempt to break down harvests by area or to assess harvests by nonresident hunters. During the 1972-73 waterfowl season the Bureau increased its sample of hunters cooperating in the parts collection survey. This expanded sample base should eventually result in more accurate estimates of the species composition of harvested waterfowl.
The 1971-72 Alaska Department of Fish and Game mail survey is considered to be the most accurate waterfowl harvest estimate ever made in Alaska. This survey provided valuable information on nonresident harvest, derivation of harvest by area and specific location, hunter attitudes and general characteristics of Alaska waterfowl hunting that were unknown until this survey was conducted. The 1970-71 waterfowl season in Alaska was considered by most biologists to be "an average year" in regard to hunter success.
PROCEDURES
Mechanics of the Survey and Hunter Reports
A computerized list of all people purchasing a 1972 resident or nonresident hunting license was used for a sampling base. Approximately every fourth resident and every third nonresident was sent a survey form (24.5% and 34.4% samples, respectively) during early February. Each form was self-contained with a postage-paid return address printed on its reverse side. Three weeks were allowed for return and those persons not replying were then sent a reminder form. Forms received three weeks after the second mailing were not considered in the analysis.
1

Each hunter's name and address was printed on individual IBM cards. Upon return of a completed survey form, the corresponding IBM card was located and destroyed. Those IBM cards remaining after three weeks were processed for a second mailing. Both the IBM cards and corresponding survey forms were numbered.
The survey sampled 14,150 resident and 3,960 nonresident license buyers. Of these totals, 73.3 percent and 81.2 percent of the residents and nonresidents, respectively, returned the questionnaires. Responses usable for analysis (people who purchased a duck stamp and hunted waterfowl or bought a stamp but didn't hunt) were received from 2,082 residents and 594 nonresidents.
Analysis of Survey Results
The state was divided into 11 harvest areas to facilitate analysis of survey data (Fig. 1). These areas roughly correspond to areas the Bureau has selected for harvest data analysis (Carney, pers. cornrn., 1971). Because the area of residence for each hunter was known, an accurate estimate of days hunted, birds bagged, etc., could be made in each harvest area. Some idea of hunter movements out of their area of residence could also be obtained by knowing their residence and where they shot most of their ducks.
Bias factors influencing reported days hunted and ducks bagged were considered to be: 1) a superstition bias resulting from a tendency not to report the number 13; 2) a memory bias from the tendency to report numbers ending in zero and five and multiples of the daily bag; and 3) a memory bias from the unreliability of those reporting large numbers. Bias corrections for mean season resident hunter duck bag and hunter days were made (Williams, 1953).
No bias corrections for goose harvest were made. It is believed that most hunters know exactly haw many geese they take each year. Reporting rates for geese may be greater than for ducks because geese are generally considered more of a trophy. Corrections for such a bias are unknown.
Data received from the 2,082 residents and 594 nonresidents were expanded for total waterfowl hunters on a proportion basis.
RESULTS
Number of Hunters
The assessment of waterfowl harvests and hunter activity in Alaska is complicated by several unique problems. No other state experiences the magnitude of hunting outside the legal season limits (subsistence hunting) as does Alaska. Cornrnents on survey forms such as, "Got six swans with a fense (sic.) and stick" were. not uncommon. Other people, who apparently hunted during the legal season, commented that there were no duck stamps available where they lived.
2

---
0
-
I /,____ ----,.../-
/
...-- I_.-.I~--- / l
" .... "
' ' /Sb
/ '
/ (
4 I
~c:::> \ \ \
' ' ... IJ ..... .... ....
Fig.~· 1. liarvest .Areas Used for D
1 - N 2 - S Orth Sl 3 ef.lard ooe
- Yuk Pe~. - C on \' lnsul45 entr alJev a - Yuk al .
6 _ on D 7 Cook I elta 8 - Gulf nlet 9 - South Coast
10 - I<odi east - "~ ak
11 .n.t.C!Sk-AI a Peutian eninCh sula ain
,... , / ',
' ......
' ...... '\
' a' .... ' '\
' ' \ \ \
/
ata Anal_vsis
I
A projected 4,498 people holding a $.25 subsistence license hunted without a stamp. Out of 1,400 forms sent to holders of these licenses, only 51 were returned. Forty-one (80.4 percent) had not purchased a stamp. The comment on one form, "I tear my name off because I afra:ld you send me to jail," possibly typifies the reason why the subsistence license response rate was very low. It appears that the total number of people taking waterfowl during the legal seasons without a stamp could well be over 5,000. Perhaps twice that many take waterfowl outside the legal season. Data on number of hunters, harvest, etc., in this report are based solely on duck stamp sales and therefore should be considered to be the sport hunting harvest.
One problem associated with determining the number of waterfowl hunters in Alaska is the rate of ingress into the state. A hunter must reside in Alaska one year before becoming eligible for a resident license. Thus, persons intending residency and living in the state must buy a nonresident license. A projected total of 1,726 such nonresidents purchased a duck stamp.
Total duck stamp sales in Alaska were 14,360 according to Bureau of Sport Fisheries and Wildlife figures (Carney, 1972). There were 14,160 potential duck hunters (excluding stamp sales to collectors) according to the Bureau's figures. Residency categories of 1971-72 projected stamp buyers and active hunters in Alaska were: resident - 11,860 and 8,386 (70.71% active); nonresident with Alaska address- 1,726 and 1,457 (84.43% active); nonresidents- 574 and 391 (68,09% active). A projected 118 nonresidents hunted waterfowl in Alaska but purchased a stamp outside the state. All calculations of resident harvest, hunter activity, etc., are based on 9,843 resident active hunters (residents plus nonresidents with an Alaska address). There was an estimated total of 10,352 active waterfowl hunters in the state. Table 1 summarizes these data, Table 2 presents duck stamp sale data by harvest area from 1968 to 1971 and Table 3 provides a 38-year history of stamp sales in Alaska.
Hunting Activity
Residents and nonresidents reported hunting an average of 6.0 and 3.8 days, respectively, during the 1971-72 season. After bias corrections, resident hunters were calculated to have hunted 4.3 days per active hunter. The average of 3.8 days of waterfowl hunting per active nonresident hunter was assumed to be an accurate figure because there were few indications of reporting bias.
Total man-days of waterfowl hunting for residents was calculated to be 42,719. Nonresidents were calculated to have hunted a total of 1,934 man-days.
Table 4 presents a summary of resident hunter activity and success as reported by harvest area. In Table 5 statewide hunter activity and success is broken down into calculated days hunted, birds bagged, etc., by harvest area. Table 6 presents similar information for nonresident hunters. Table 7 provides projected hunter days and duck and goose
4

Table 1. Summary of Alaska Waterfowl Hunter Mail Questionnaire Survey, 1971-72.
Number of licensed hunters: resident 57,755 (5,595 subsistence), nonresident 11,525
Number of license buyers sampled: resident 14,150 (24.5%), nonresident 3,960 (34.4%)
Number of respondents from resident survey: 1st mailing 8,005, 2nd mailing 1,698
Number of respondents from nonresident survey: 1st mailing 2,329, 2nd mailing 640
Number of returns usable for waterfowl calculations: resident 2,082 nonresident 594
Response rate*: 1st mailing- resident 59.6%, nonresident 61.9% 2nd mailing - resident 32.4%, nonresident 40.1% Total - resident 73.3%, nonresident 81.2%
Number of hunters:
Duck stamps sold in Alaska: 14,320 (14,160 potential hunters) fercent active hunters: resident 70.7%, nonresident (Alaska address) 84.4%,
nonresident 68.1% Total active residents**: 72.44% Calculated number of active hunters: resident 9,843**, nonresident 509***
Calculated Statewide Harvest:
Ducks: resident 80,417, nonresident 3,206 Geese: resident 10,630, nonresident 713 Cranes: resident 492, nonresident 10 Snipe: resident 3,051, nonresident 36
Hunter days: resident 42,719, nonresident 1,934
* Rate of deliverable questionnaires only. **Includes nonresidents with an Alaska address. ***Includes 118 hunters who purchased a duck stamp outside Alaska.
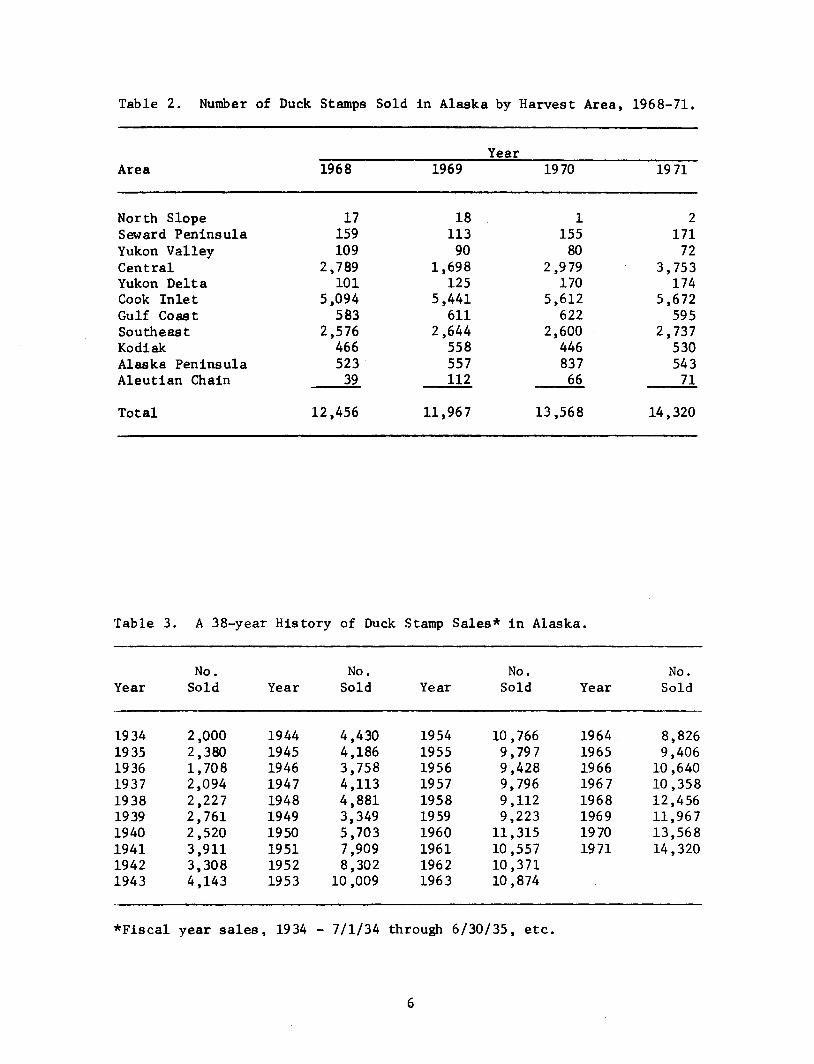
Table 2. Number of Duck Stamps Sold in Alaska by Harvest Area, 1968-71.
Year Area 1968 1969 1970 1971
North Slope 17 18 1 2 Seward Peninsula 159 113 155 171 Yukon Valley 109 90 80 72 Central 2 '789 1,698 2,979 3, 753 Yukon Delta 101 125 170 174 Cook Inlet 5,094 5,441 5,612 5,672 Gulf Coast 583 611 622 595 Southeast 2,576 2,644 2,600 2,737 Kodiak 466 558 446 530 Alaska Peninsula 523 557 837 543 Aleutian Chain 39 112 66 71
Total 12,456 11,96 7 13,568 14,320
Table 3. A 38-year History of Duck Stamp Sales* in Alaska.
No. No. No. No. Year Sold Year Sold Year Sold Year Sold
1934 2,000 1944 4,430 1954 10,766 1964 8,826 1935 2,380 1945 4,186 1955 9 '79 7 1965 9,406 1936 1, 708 1946 3,758 1956 9,428 1966 10,640 1937 2,094 1947 4,113 1957 9,796 1967 10,358 1938 2,227 1948 4,881 1958 9,112 1968 12,456 1939 2,761 1949 3,349 1959 9,223 1969 11,96 7 1940 2,520 1950 5 '703 1960 11,315 1970 13,568 1941 3,911 1951 7,909 1961 10,557 1971 14,320 1942 3,308 1952 8,302 1962 10,371 1943 4,143 1953 10,009 1963 10,874
*Fiscal year sales, 1934 - 7/1/34 through 6/30/35, etc.
6

Table 4. Resident Hunter Success and Activity as Reported by Area, 1971-72.
Percent No. Ducks No. Days No. Ducks No. Geese No. Cranes No. Snipe Active Shot Per Hunted Per Shot Per Shot Per Shot Per Shot Per
Area Hunters Season Season Day Season* Season* Season*
North Slope 100 .o 14.4 8.4 1.7 7.0 0.0 0.0 Seward Peninsula 81.0 14.3 8.0 1.8 8.3 3.3 3.3 Yukon Valley 80.7 10.2 3.3 3.1 9.4 2.3 0.0 Central 70.8 10.1 5.9 1.7 2.5 1.4 2.6 Yukon Delta 86.7 14.1 8.3 1.7 12.9 6.0 3.0 Cook Inlet 74.7 10.3 5.3 1.9 3.6 1.3 7.3 Gulf Coast 65.3 10.5 8.1 1.3 4.3 1.5 18.6 Southeast 71.8 11.4 7.8 1.5 3.2 1.5 6.3 Kodiak 77.1 13.3 8.5 1.6 1.8 0.0 11.8 Alaska Peninsula 75.4 8.3 6.1 1.4 7.9 2.0 6.0 Aleutian Chain 92.3 5.8 8.2 0.7 7.3 0.0 0.0 Unknown 0.5 2.9 0.2 5.0 1.0 11.0
Statewide 72.44 9.59 5.99 1.6 4.9 2.2 8.3 **8.17 per **4.34 **1.88 1.08 per .05 per .31 per active active active active hunter hunter hunter hunter
* Bag per hunter taking geese. **After corrections for bias.

Table 5. Calculated Harvest and Activity by Resident Hunters by Area*, 1971-72.
Birds Harvested Hunter D!!S Game Ducks Nongame Ducks Geese Crane Sni;ee
% of % of % of % of % of % of Area No. total No. total No. total No. total No. total No. total
North Slope 171 0.4 0.0 326 5.3 32 0.3 0.0 0.0 Seward Peninsula 1,581 3.7 2,599 3.5 597 9.7 1,063 10.0 196 39.8 76 2.5 Yukon Valley 427 1.0 1,411 1.9 62 1.0 225 2.4 45 9.2 0.0
00 Central Yukon Delta
9,911 769
23.2 1.8
18,121 1,485
24.4 2.0
849 25
13.8 0.4
978 1,031
9.2 9.7
105 61
21.4 12.2
76 15
2.5 0.5
Cook Inlet 13,688 29.7 26,290 35.4 1,205 19.6 1, 722 16.2 45 9.2 962 31.5 Gulf Coast 2,264 5.3 3,193 4.3 00 1.3 840 7.9 15 3.1 540 17.7 Southeast 9,398 22.0 14,185 19.1 1,206 19.6 1,254 11.8 15 3.1 430 14.1 Kodiak 2,606 6.1 3,342 4.5 1,335 21.7 64 0.6 0.0 882 28.9 Alaska Peninsula 2,093 4.9 3,045 4.1 129 2.1 2,796 26.3 10 2.0 70 2.3 Aleutian Chain 811 1.9 594 0.8 338 5.5 595 5.6 0.0 0.0
Statewide 42,719 100.0 74,265 100.0 6,152 100 .o 10,630 100.0 492 100.0 3,051 100.0
*Unknown area of harvest and activity proportionally included in known areas.

Table 6. Nonresident Hunter Success and Activity as Reported by Area Hunted*, 1971-72.
Hunters Hunter Days Duck Harvest Goose Harvest % of % of % of % of
Area No. total No. total No. total No. total
North Slope 5 0.9 14 0.7 26 0.8 0.0
Seward Peninsula 5 0.9 19 1.0 22 0.7 4 0.6
Yukon Valley 24 4.7 141 7.3 131 4.1 4 0.6
Central 110 21.7 502 25.9 1,164 36.3 32 4.5
Yukon Delta 5 0.9 19 1.0 0.0 42 5.8
Cook Inlet 125 24.5 369 19.1 628 19.6 58 8.2
Gulf Coast 72 14.2 277 14.3 423 13.2 99 13.9
Southeast 53 10.4 253 13.1 430 13.4 18 2.5
Kodiak 10 1.9 75 3.9 199 6.2 0.0
Alaska Peninsula 97 19.0 219 11.3 183 5.7 456 63.9
Aleutian Chain 5 0.9 46 2.4 0.0 0.0
Statewide Average 509 100.0 1,934 100 .o 3,206 100 .o 713 100.0
3.8 6.3 1.4 days/ ducks/ geese/ hunter hunter active
hunter
*Unknown area of harvest and activity proportionately included in known areas.
9
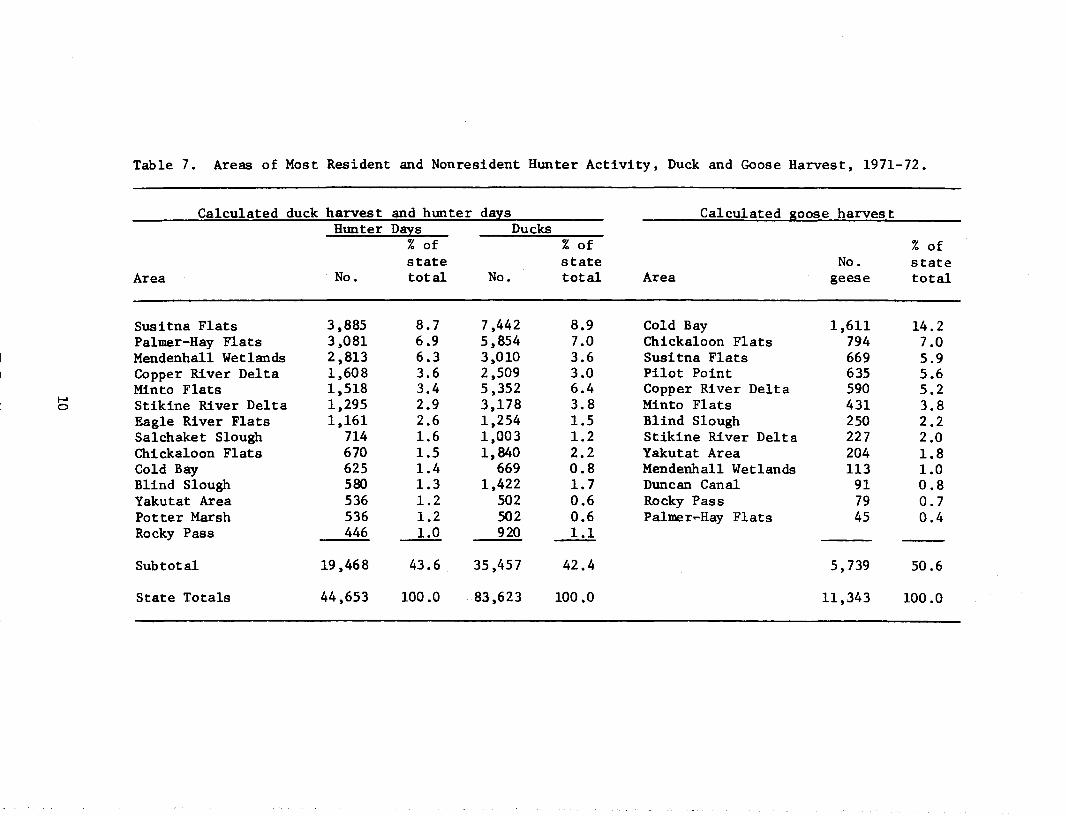
Table 7. Areas of Most Resident and Nonresident Hunter Activity, Duck and Goose Harvest, 1971-72.
Calculated duck harvest and hunter d!IS Hunter D!IS Ducks
Calculated goose harvest
% of %of % of
Area No. state total No.
state total Area
No. geese
state total
Susitna Flats 3,885 8.7 7,442 8.9 Cold Bay 1,611 14.2 Palmer-Hay Flats 3,081 6.9 5,854 7.0 Chickaloon Flats 794 7.0 Mendenhall Wetlands 2,813 6.3 3,010 3.6 Susitna Flats 669 5.9 Copper River Delta 1,608 3.6 2,509 3.0 Pilot Point 635 5.6
1--" 0
Minto Flats Stikine River Delta
1,518 1,295
3.4 2.9
5,352 3,178
6.4 3.8
Copper River Delta Minto Flats
590 431
5.2 3.8
Eagle River Flats 1,161 2.6 1,254 1.5 Blind Slough 250 2.2 Salchaket Slough 714 1.6 1,003 1.2 Stikine River Delta 227 2.0 Chickaloon Flats 670 1.5 1,840 2.2 Yakutat Area 204 1.8 Cold Bay 625 1.4 669 0.8 Mendenhall Wetlands 113 1.0 Blind Slough 580 1.3 1,422 1.7 Duncan Canal 91 0.8 Yakutat Area 536 1.2 502 0.6 Rocky Pass 79 0.7 Potter Marsh 536 1.2 502 0.6 Palmer-Hay Flats 45 0.4 Rocky Pass 446 1.0 920 1.1
Subtotal 19,468 43.6 35,457 42.4 5,739 50.6
State Totals 44,653 100.0 83,623 100 .o 11,343 100.0
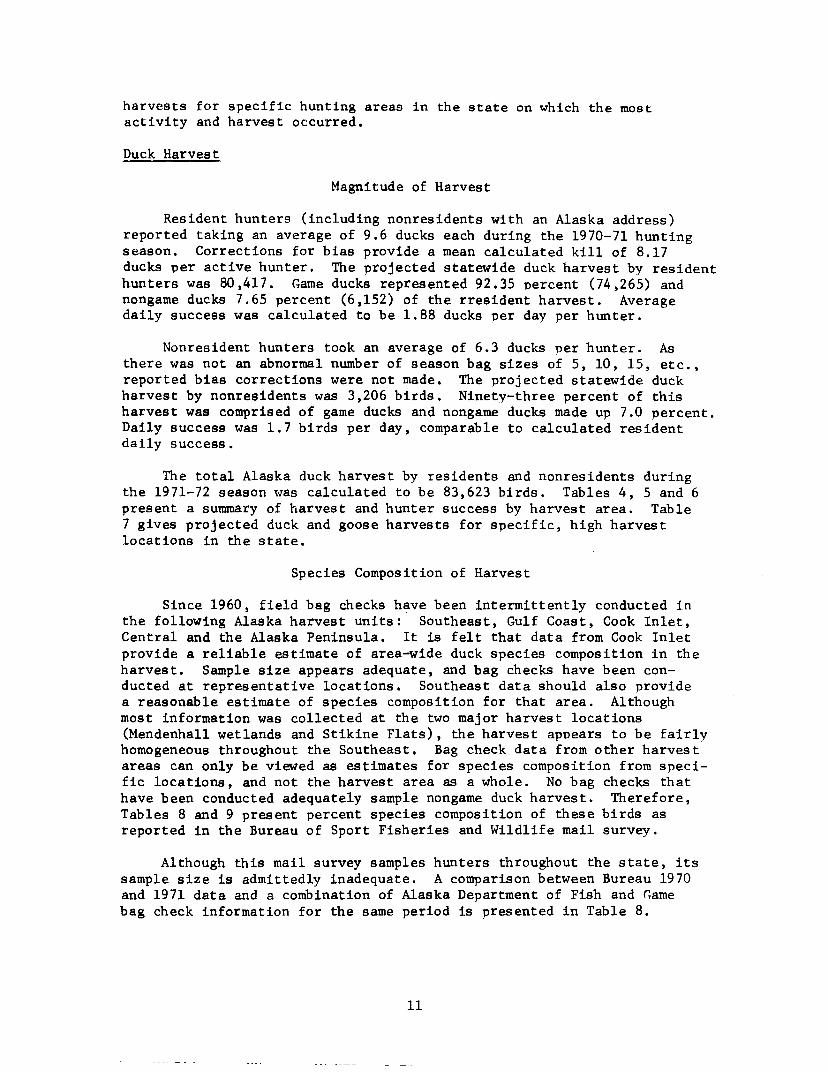
harvests for specific hunting areas in the state on which the most activity and harvest occurred.
Duck Harvest
Magnitude of Harvest
Resident hunters (including nonresidents with an Alaska address) reported taking an average of 9.6 ducks each during the 1970-71 hunting season. Corrections for bias provide a mean calculated kill of 8.17 ducks per active hunter. The projected statewide duck harvest by resident hunters was 80,417. Game ducks represented 92.35 percent (74,265) and nongame ducks 7.65 percent (6,152) of the rresident harvest. Average daily success was calculated to be 1.88 ducks per day per hunter.
Nonresident hunters took an average of 6.3 ducks per hunter. As there was not an abnormal number of season bag sizes of 5, 10, 15, etc., reported bias corrections were not made, The projected statewide duck harvest by nonresidents was 3,206 birds. Ninety-three percent of this harvest was comprised of game ducks and nongame ducks made up 7.0 percent. Daily success was 1.7 birds per day, comparable to calculated resident daily success.
The total Alaska duck harvest by residents and nonresidents during the 1971-72 season was calculated to be 83,623 birds. Tables 4, 5 and 6 present a summary of harvest and hunter success by harvest area. Table 7 gives projected duck and goose harvests for specific, high harvest locations in the state.
Species Composition of Harvest
Since 1960, field bag checks have been intermittently conducted in the following Alaska harvest units: Southeast, Gulf Coast, Cook Inlet, Central and the Alaska Peninsula. It is felt that data from Cook Inlet provide a reliable estimate of area-wide duck species composition in the harvest. Sample size appears adequate, and bag checks have been conducted at representative locations. Southeast data should also provide a reasonable estimate of species composition for that area. Although most information was collected at the two major harvest locations (Mendenhall wetlands and Stikine Flats), the harvest appears to be fairly homogeneous throughout the Southeast, Bag check data from other harvest areas can only be viewed as estimates for species composition from specific locations, and not the harvest area as a whole. No bag checks that have been conducted adequately sample nongame duck harvest. Therefore, Tables 8 and 9 present percent species composition of these birds as reported in the Bureau of Sport Fisheries and Wildlife mail survey.
Although this mail survey samples hunters throughout the state, its sample size is admittedly inadequate. A comparison between Bureau 1970 and 1971 data and a combination of Alaska Department of Fish and r.ame bag check information for the same period is presented in Table 8.
11
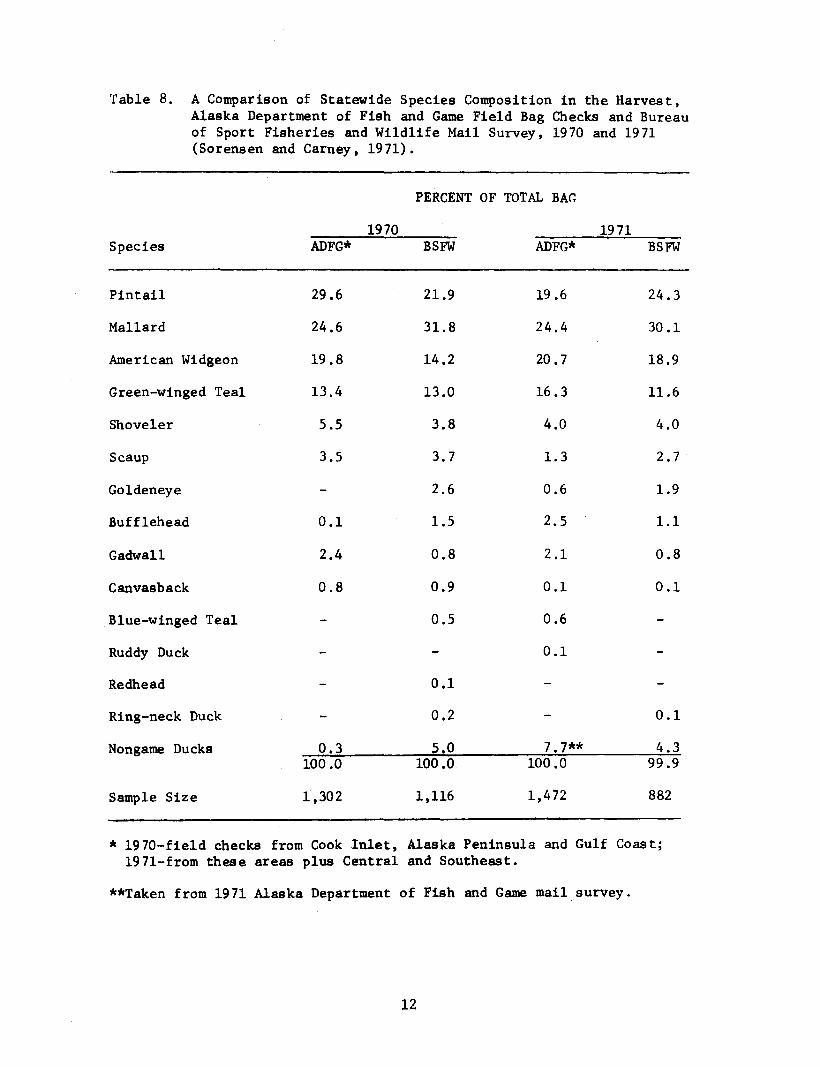
Table 8. A Comparison of Statewide Species Composition in the Harvest, Alaska Department of Fish and Game Field Bag Checks and Bureau of Sport Fisheries and Wildlife Mail Survey, 1970 and 1971 (Sorensen and Carney, 1971).
PERCENT OF TOTAL BAG
1970 1971 Species ADFG* BSFW ADFG* BSFW
Pintail 29.6 21.9 19.6 24.3
Mallard 24.6 31.8 24.4 30.1
American Widgeon 19.8 14.2 20.7 18.9
Green-winged Teal 13.4 13.0 16.3 11.6
Shoveler 5.5 3.8 4.0 4.0
Scaup 3.5 3.7 1.3 2.7
Goldeneye 2.6 0.6 1.9
Bufflehead 0.1 1.5 2.5 1.1
Gadwall 2.4 0.8 2.1 0.8
Canvasback 0.8 0.9 0.1 0.1
Blue-winged Teal 0.5 0.6
Ruddy Duck 0.1
Redhead 0.1
Ring-neck Duck 0.2 0.1
Nongame Ducks 0.3 s.o 7.7** 4.3 100 .o 100.0 100 .o 99.9
Sample Size 1,302 1,116 1,472 882
* 1970-field checks from Cook Inlet, Alaska Peninsula and Gulf Coast; 1971-from these areas plus Central and Southeast.
**Taken from 1971 Alaska Department of Fish and Game mail. survey.
12

Table 9. Calculated Resident and Nonresident Harvest by Species - Cook Inlet, Southeast and Statewide, 1971-72.
Cook Inlet* Southeast* Statewide* % of % of % of
Species No. total No. total No. total
Game Ducks
Pintail Mallard Am. Widgeon G-W Teal Shoveler Scaup Goldeneye Bufflehead Gadwall Canvasback B-W Teal Ruddy Duck
8,241 6,047 6,271 4,585 1,098
169
28 395
84
29.3 21.5 22.3 16.3
3.9 0.6
0.1 1.4 0.3
1,740 5,980 2,167 3,813
490 111
47 111 158
11.0 37.8 13.7 24.1 3.1 0.7 0.3 0.7 1.0
16,372 20 ,388 17,299 13,669
3,321 1,081
463 2,085 1,699
695 77 77
19.6 24.4 20.7 16.3
4.0 1.3 0.6 2.5 2.1 0.1 0.6 0.1
Total Game Ducks Nongame Ducks Total Ducks
26 ,918 1,205
28,123
95.7 4.3
100.0
14,615 1,206
15,821
92.4 7.6
100.0
77,226 6,397
83,623
92.3 7.7
100 .o
Geese
Canada White-fronted Snow Black brant Emperor
8,008 828 578
1,214 715
70.6 7.3 5.1
10.7 6.3
Total Geese 11,343 100.0
*Cook Inlet, Southeast and statewide ducks - projected from 1971 field bag checks; statewide goose bag composition from an average of 1969 and 1970 Fish and Wildlife Service harvest estimates; nongame duck percent composition from 1971 Alaska Department of Fish and Game mail survey.
13

Table 9 presents information on the calculated harvest by species for Cook Inlet, the Southeast and statewide, Alaska Department of Fish and Game field bag checks are thought to provide the best estimate of game duck harvest by species available, for the 1971-72 season. Mallards, American widgeons, pintails, green~inged teal and shovelers constituted over 80 percent of the total duck harvest.
All past bag check data for Cook Inlet, Southeast, Gulf Coast, Central and the Alaska Peninsula are summarized in Tables 10, 11, 12, 13 and 14. Average species composition for each area for all years is also presented.
Goose Harvest
Resident hunters (including nonresidents with an Alaska address) reported an average of 4.9 geese per hunter taking geese and 1.08 birds per active hunter. Twenty-two percent of all active hunters reported taking one or more geese. The 1971-72 statewide resident hunter goose harvest was calculated to be 10,630 birds. Bias corrections were not made on reported goose bag information. Most hunters apparently know exactly how many birds they shot during the season.
Table 15 presents data on the frequency of reported season goose bag sizes by resident hunters and what percent of the total harvest each bag size represented. It was assumed that hunters who took five or fewer geese per season took them incidental to duck hunting. These hunters represented about two-thirds of all hunters taking geese, but accounted for only about one-third of the harvest. Conversely, those hunters who apparently actively hunted specifically for geese (killed six or more per season) represented one-third of the hunters taking, but took two-thirds of the harvest.
Nonresident hunters reported an average of 4.1 geese per hunter taking geese and 1.4 geese per active hunter. Thirty-four percent of all active nonresidents reported taking one or more geese. The statewide nonresident goose harvest was calculated to be 713 birds and the total resident and nonresident goose harvest was projected to be 11,343 birds.
Field bag checks are felt to be inadequate for determining statewide or even areawide species composition of the goose kill. Numbers of geese checked are relatively few, and number of bag check locations are not adequate to sample harvest of all species. For example, most of the brant, cackling Canada goose, emperor goose, snow goose and white-fronted goose harvest is not monitored by field checks. Consequently, the Bureau of Sport Fisheries and Wildlife mail survey probably provides the best measure of statewide species composition in the goose harvest. The Bureau does not analyze harvests by harvest area. Table 9 projects statewide harvest by species. Total kill was derived by the Alaska Department of Fish and Game mail survey, and percent composition in the kill was taken from Bureau of Sport Fisheries and Wildlife reports (Carney, et al, 1971). Canada geese comprised over 70 percent of the kill, followed by black brant, whitefronts, emperors and snow geese. The Bureau made no attempt to isolate cackling goose harvest from total Canada goose harvest.
14
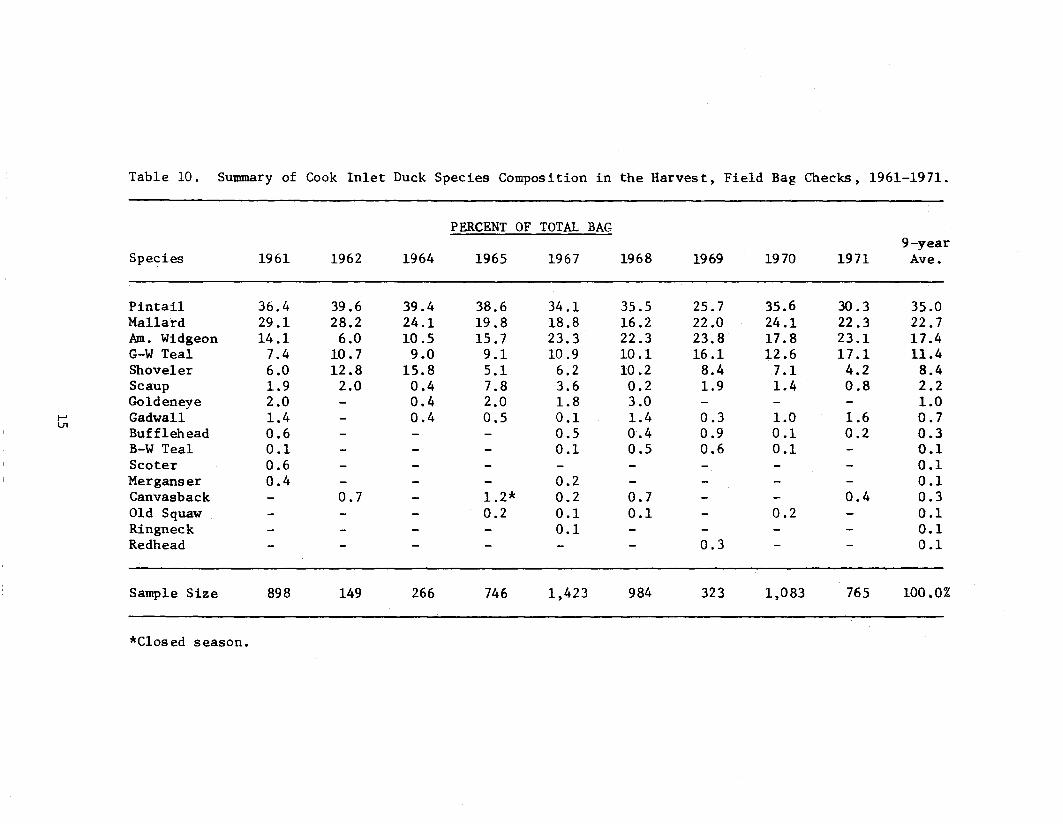
Table 10. Summary of Cook Inlet Duck Species Composition in the Harvest, Field Bag Checks, 1961-1971.
PERCENT OF TOTAL BAG 9-year
Species 1961 1962 1964 1965 1967 1968 1969 1970 1971 Ave.
Pintail 36.4 39.6 39.4 38.6 34.1 35.5 25.7 35.6 30.3 35.0 Mallard 29.1 28.2 24.1 19.8 18.8 16.2 22.0 24.1 22.3 22.7 kn. Widgeon 14.1 6.0 10.5 15.7 23.3 22.3 23.8 17.8 23.1 17.4 G-W Teal 7.4 10.7 9.0 9.1 10.9 10.1 16.1 12.6 17.1 11.4 Shoveler 6.0 12.8 15.8 5.1 6.2 10.2 8.4 7.1 4.2 8.4 Scaup 1.9 2.0 0.4 7.8 3.6 0.2 1.9 1.4 0.8 2.2 Goldeneye 2.0 0.4 2.0 1.8 3.0 1.0
I-' 1./1
Gadwall Bufflehead
1.4 0.6
0.4 0.5 0.1 0.5
1.4 0.4
0.3 0.9
1.0 0.1
1.6 0.2
0.7 0.3
B-W Teal 0.1 0.1 0.5 0.6 0.1 0.1 Scoter 0.6 0.1 Merganser 0.4 0.2 0.1 Canvasback 0.7 1.2* 0.2 0.7 0.4 0.3 Old Squaw 0.2 0.1 0.1 0.2 0.1 Ringneck 0.1 0.1 Redhead 0.3 0.1
Sample Size 898 149 266 746 1,423 984 323 1,083 765 100.0%
*Closed season.

Table 11. Summary of Southeast Duck Species Composition in the Harvest, Field Bag Check, 1964-1971.
PERCENT OF TOTAL BAG 3-year
Species 1964 1965 1971 Ave.
Pintail 13.7 11.3 11.9 12.3
Mallard 65.0 44.2 40.9 50.1
Am. Widgeon 11.5 14.1 14.9 13.5
G-W Teal 6.6 23.5 26.0 18.8
Shoveler \
1.1 1.2 3.4 1.9
Scaup 2.2 2.6 0.7 1.9
Goldeneye 0.4 0.1
Gadwall 1.2 1.1 0.8
Bufflehead 0.7 0.2
Canvasback 1. 2* 0.4
Sample Size 183 256 269
*Closed season.
Note: The bulk of data was derived from the Juneau area and Stikine River Delta.
16
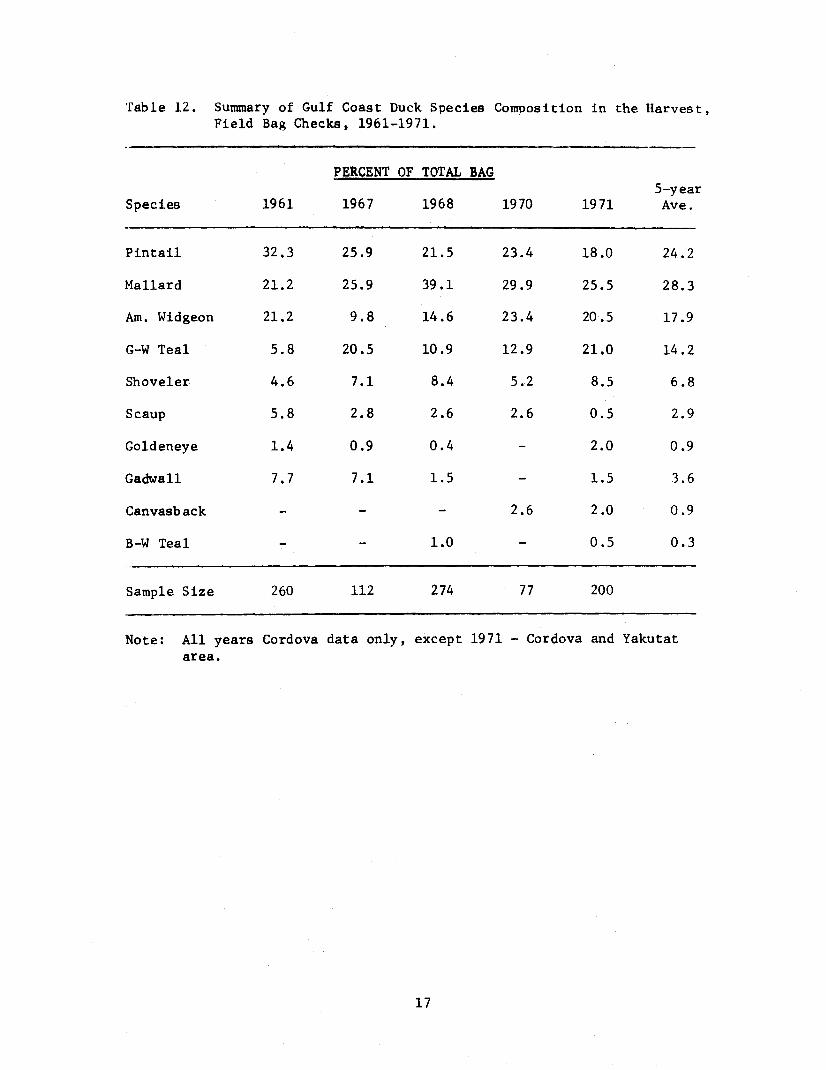
Table 12. Summary of Gulf Coast Duck Species Composition in the Harvest, Field Bag Checks, 1961-1971.
PERCENT OF TOTAL BAG 5-year
Species 1961 1967 1968 1970 1971 Ave.
Pintail 32.3 25.9 21.5 23.4 18.0 24.2
Mallard 21.2 25.9 39.1 29.9 25.5 28.3
Am. Widgeon 21.2 9.8 14.6 23.4 20.5 17.9
G-W Teal 5.8 20.5 10.9 12.9 21.0 14.2
Shoveler 4.6 7.1 8.4 5.2 8.5 6.8
Scaup 5.8 2.8 2.6 2.6 0.5 2.9
Goldeneye 1.4 0.9 0.4 2.0 0.9
Gadwall 7.7 7.1 1.5 1.5 3.6
Canvasback 2.6 2.0 0.9
B-W Teal 1.0 0.5 0.3
Sample Size 260 112 274 77 200
Note: All years Cordova data only, except 1971 - Cordova and Yakutat area.
17
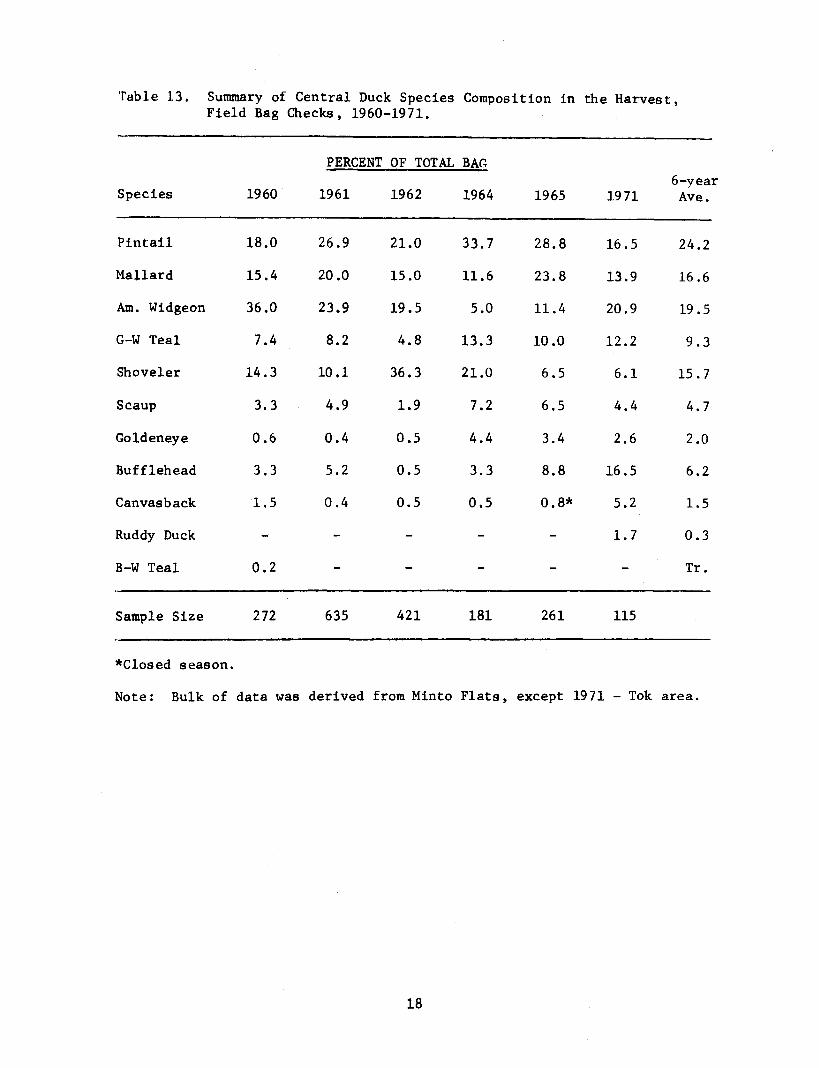
Table 13. Summary of Central Duck Species Composition in the Harvest, Field Bag Checks, 1960-1971.
PERCENT OF TOTAL BAr. 6-year
Species 1960 1961 1962 1964 1965 1971 Ave.
Pintail 18.0 26.9 21.0 33.7 28.8 16.5 24.2
Mallard 15.4 20.0 15.0 11.6 23.8 13.9 16.6
Am. Widgeon 36.0 23.9 19.5 5.0 11.4 20.9 19.5
G-W Teal 7.4 8.2 4.8 13.3 10.0 12.2 9.3
Shoveler 14.3 10.1 36.3 21.0 6.5 6.1 15.7
Scaup 3.3 4.9 1.9 7.2 6.5 4.4 4.7
Goldeneye 0.6 0.4 0.5 4.4 3.4 2.6 2.0
Bufflehead 3.3 5.2 0.5 3.3 8.8 16.5 6.2
Canvasback 1.5 0.4 0.5 0.5 0.8* 5.2 1.5
Ruddy Duck 1.7 0.3
B-W Teal 0.2 Tr.
Sample Size 272 635 421 181 261 115
*Closed season.
Note: Bulk of data was derived from Minto Flats, except 1971 - Tok area.
18

Table 14. Summary of Alaska Peninsula Duck Species Composition in the Harvest, Field Bag Checks, 1969-71.
PERCENT OF TOTAL BAG 3-year
Species 1969 1970 1971 Ave.
Pintail 51.0 29.6 26.2 35.6
Mallard 2.0 19.7 25.0 15.6
Am. Widgeon 8.2 18.3 1.2 9.2
G-W Teal 18.4 14.8 27.4 20.2
Shoveler 2.0 4.2 2.1
Scaup 6.3 8.3 4.9
Gadwall 16.3 6.3 8.3 10.3
c. Eider 0.7 0.2
E. Widgeon 2.0 0.7
St. Eider 3.6 1.2
Sample Size 49 142 84
Note: Bulk of data derived from Pilot Point and Cold Bay areas.
19

Table 15. Reported Frequency of Season Goose Bags and Percent of Harvest, Resident Hunters, 1971-72.
No. of Geese Harvested Percent of All Percent of During Season Hunters Taking Geese Harvest
1 23.8 4.8
2 23.0 9.4
3 13.2 8.1
4 8.6 7.0
5 3.4 3.5
6-10 17.4 27.7
11-15 5.4 14.8
16-20 2.5 9.3
21-40 2.7 15.4
100 .o 100.0
Note: Hunters who reported taking one goose during the season represented 23.8 percent of all hunters taking geese; 4.8 percent of the total goose harvest consisted of season bags of one goose.
20

Tables 4, 5 and 6 describe hunter success and harvest for each harvest area for resident and nonresident hunters. Table 7 presents projected kill for the major hunting areas in Alaska.
Crane Harvest
Resident hunters (including nonresidents with an Alaska address) reported an average of 2.2 sandhill cranes per hunter taking and 0.05 cranes per season per active waterfowl hunter. Statewide crane harvest by residents was calculated to be 492. Nonresidents took only a calculated 10 cranes. Tables 4 and 5 present data on hunter success and crane harvest by harvest area.
Snipe Harvest
Resident hunters (including nonresidents with an Alaska addr~ss) reported an average of 8.3 common (Wilson's) snipe per hunter taking and 0.31 birds per active hunter. Snipe harvest by residents was calculated to be 3,051. Nonresidents took only a projected 36 birds. Tables 4 and 5 present data on hunter success and snipe kill by harvest area.
Hunter Characteristics
Hunters were asked on the survey form to record the type of hunting method - jump shooting, pass shooting or decoy hunting - they employed. Statewide, pass shooting and jump shooting (40 and 39 percent of total) were the most common methods, followed by decoy hunting (21 percent of total). Table 16 presents data on hunting methods as reported by harvest area of residence.
Hunters were also asked whether they went hunting for waterfowl only, or whether they hunted birds only incidental to other hunts. Statewide, 88 percent of those residents hunting waterfowl made trips exclusively for waterfowl. Twelve percent reported they hunted waterfowl only incidental to other species. Table 16 presents these data by harvest area of residence. Seventy-seven percent of reporting nonresidents hunted exclusively for waterfowl at least once. It was impossible to determine how many of these hunters came to Alaska to hunt mainly for waterfowl.
Because both area of residence (hunter's address on license) and area of greatest duck harvest were provided on the survey forms, an estimate of travel involved to go duck hunting could be made. Of all hunters shooting most of their ducks out of their area of residence, one-third went to the Central area, about one-third went to the Alaska Peninsula and about one-fourth went to the Gulf Coast area. Slightly more than 7 percent of all resident hunters reported taking most of their birds outside of their area of residence. Table 17 compares area of residence to the harvest area where hunters reported taking most of their birds.
21

Table 16. Duck Hunting Methods and Affinity for Waterfowl Hunting as Reported by Area of Residence, 1971-72.
PERCENT OF TOTAL
Area of Residence Jump
Hunting Method Pass Decoy
Waterfowl Hunt Only
Yes* No*
North Slope
Seward Peninsula
Yukon Valley
Central
Yukon Delta
Cook Inlet
Gulf Coast
Southeast
Kodiak
Alaska Peninsula
Aleutian Chain
0
23
47
46
30
37
45
40
42
37
32
100
63
47
40
48
39
32
40
38
53
45
0 75
14 79
6 50
14 83
12 74
24 92
23 98
20 86
20 92
10 89
23 68
25
21
50
17
26
8
2
14
8
11
32
Statewide 39 40 21 88 12
Nonresident 77 23
*Yes = percent of total hunters who reported going hunting for waterfowl at least once during the season.
No • percent of total hunters who reported they hunted waterfowl only incidental to other game.
22

Table 17. Incidence of waterfowl hunting in areas other than that in which the hunter lives.*
.PERCENT OF HUNTERS WHO HUNTED IN: Total out Area of North Seward Yukon Yukon Cook Gulf Alaska Aleut. of Res.
Residence Slope Pen. Valley Central Delta Inlet Coast S.E. Kodiak Pen. Chain Bunt
North Slope 100.0 0.0
Seward Peninsula 100.0 0.0
Yukon Valley 100.0 0.0
Central 0.5 0.8 97.4 0.3 1.0 2.6
Yukon Delta 4.3 95.7 4.3
Cook Inlet 0.1 5.5 0.1 86.4 1.9 0.4 0.3 5.3 13.6
Gulf Coast 4.5 95.5 4.5
Southeast 0.3 0.3 3.0 96.4 3.6
Kodiak 1.3 96.1 2.6 3.9
Alaska Peninsula 100.0 0.0
Aleutian Chain 100.0 o.o
Percent of Total Going To: 0.0 1.7 5.0 33.3 0.8 1.7 21.7 2.5 1.7 31.7 o.o 7.3
*Of the waterfowl hunters living in Southeast, 0.3 percent reported shooting most of their ducks in the Yukon Valley and Central areas, 3.0 percent in the Gulf Coast area and 96.4 percent in the Southeast; a total of 3.6 percent traveled out of the Southeast. Of all waterfowl hunters in the state who hunted out of their area of residence, 2.5 percent came to the Southeast. A total of 7.3 percent of all waterfowl hunters shot most of their ducks in a different area than the one in which they live.

DISCUSSION
A comparison of the results of our 1971 mail survey and the 1971 estimates of waterfowl harvest made by the Bureau of Sport Fisheries and Wildlife (Carney, et al, 1972) points out several major differences (Table 18). The ADF&G estimate for hunter days was 46 percent below Bureau figures. Our total duck harvest figure was 16 percent above their estimate while our projected goose kill was 62 percent below their estimated harvest.
The accuracy of independent projections of duck stamp sales derived from the ADF&G mail survey provides good evidence that this survey provided the most reliable harvest information. These data indicate projected stamp sales of 14,493 compared to actual sales of 14,320 (1 percent error). This close correlation strongly suggests that our survey provided an excellent estimate of the 1970-71 waterfowl harvest. As stated previously, the Bureau admittedly takes a very small sample of hunters. Apparently, inadequate sampling (small sample size and possibly nonrandomized sample) in the Bureau survey explains much of this difference.
In addition the state survey included nonresident hunters while the Bureau survey did not. Although numbers of active nonresidents (509) and their resulting bird harvests are not large enough to greatly influence statewide harvest projections, the difference probably explains, at least partially, the greater statewide duck harvest indicated by the ADF&G survey.
As expected, most duck harvest occurred in the areas possessing the highest human populations. The Cook Inlet, Central and Southeast areas accounted for over 75 percent of the state's harvest . Daily and seasonal reported duck hunter success was similar in all areas except for the Alaska Peninsula, Aleutian Chain and unknown harvest areas, where hunters had lower seasonal success. Apparently many hunters concentrated primarily on geese on the Alaska Peninsula and took ducks incidental to goose hunting. Most of the hunters who did not report where they took most of their ducks (unknown harvest area) generally hunted only one or two days and usually shot no birds.
The goose harvest on the Alaska Peninsula was the largest of any harvest area. Goose hunting is excellent there; perhaps some of the best in North America. Nearly two-thirds of the goose harvest by nonresidents occurred on the Peninsula.
Although there are a number of areas which received high hunter use and sustained large harvests, apparently the bulk of Alaska's duck harvest occurs on areas receiving little use by hunters. As seen on Table 7, about 44 percent of the total hunter days and duck harvest occurred on 14 major areas. About 50 percent of the goose harvest occurred on 13 such areas.
The two most popular types of duck hunting in Alaska appear to be pass and jump shooting. Decoy hunting was reported to be only about
24

Table 18. A Comparison Between 1971 ADF&G and BSF&W Waterfowl Hunter Success Surveys .
BSF&W *ADF&r.
Percent active hunters
Number active hunters
Percent hunters who were successful
Days per active hunter
Total hunter days
Duck bag per active hunter
Total duck bag
Goose bag per active hunter
Total goose bag
70.0
9,912
55.0
6.6
65,136
7.3
71,900
1.9
18,600
72.4**
10,352
77.5
4.3
44,653
8.2
83,623
1.1
11,343
* Combination of resident and nonresident hunters. **Resident only.
25
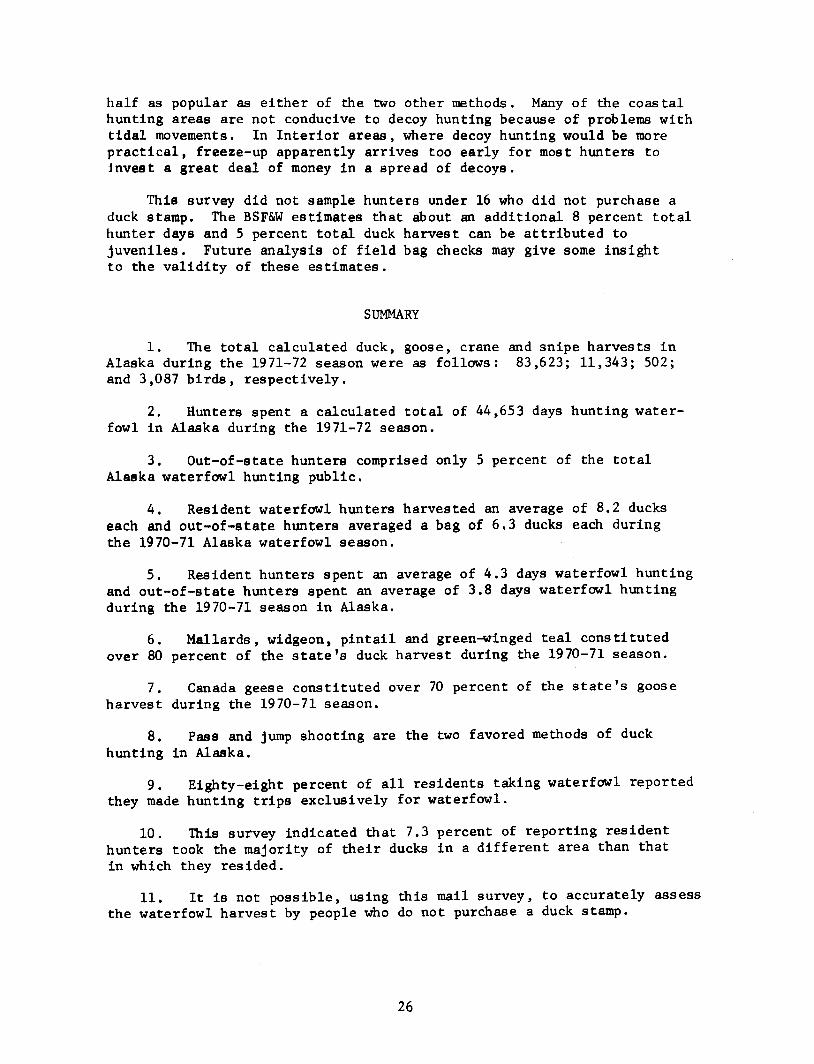
half as popular as either of the two other methods. Many of the coastal hunting areas are not conducive to decoy hunting because of problems with tidal movements. In Interior areas, where decoy hunting would be more practical, freeze-up apparently arrives too early for most hunters to 1nvest a great deal of money in a spread of decoys.
This survey did not sample hunters under 16 who did not purchase a duck stamp. The BSF&W estimates that about an additional 8 percent total hunter days and 5 percent total duck harvest can be attributed to juveniles. Future analysis of field bag checks may give some insight to the validity of these estimates.
SUMMARY
1. The total calculated duck, goose, crane and snipe harvests in Alaska during the 1971-72 season were as follows: 83,623; 11,343; 502; and 3,087 birds, respectively.
2. Hunters spent a calculated total of 44,653 days hunting waterfowl in Alaska during the 1971-72 season.
3. Out-of-state hunters comprised only 5 percent of the total Alaska waterfowl hunting public.
4. Resident waterfowl hunters harvested an average of 8.2 ducks each and out-of-state hunters averaged a bag of 6.3 ducks each during the 1970-71 Alaska waterfowl season.
5. Resident hunters spent an average of 4.3 days waterfowl hunting and out-of-state hunters spent an average of 3.8 days waterfowl hunting during the 1970-71 season in Alaska.
6. Mallards, widgeon, pintail and green~inged teal constituted over 80 percent of the state's duck harvest during the 1970-71 season.
7. Canada geese constituted over 70 percent of the state's goose harvest during the 1970-71 season.
8, Pass and jump shooting are the two favored methods of duck hunting in Alaska.
9. Eighty-eight percent of all residents taking waterfowl reported they made hunting trips exclusively for waterfowl.
10. This survey indicated that 7.3 percent of reporting resident hunters took the majority of their ducks in a different area than that in which they resided.
11. It is not possible, using this mail survey, to accurately assess the waterfowl harvest by people who do not purchase a duck stamp.
26
REFERENCES
Carney, S. M. and R. L. Croft. 1971. Species composition and age ratios of geese bagged during the 1969 and 1970 hunting seasons. U. S. Bureau of Sport Fisheries and Wildlife, Admin. Rept. No. 202. 9 p.
------------·• E. M. Martin and M. F. Sorensen. 19 ~. Waterfowl harvest and hunter activity in the U. S. during the 1971 hunting season. U. S. Bureau of Sport Fisheries and Wildlife, Admin. Rept. No. 216. 25 p.
Shepherd, P. E. K. 1964. Alaska Waterfowl Report. P-R project W-6-R-5 and 6, work plan H. 13 p.
Sorensen, M. F. and S. M. Carney. 1972. Species, age, and sex composition of ducks bagged in the 1972 hunting season in comparison with prior years. U. S. Bureau of Sport Fisheries and Wildlife, Admin. Rept. No. 218.
Williams, C. S. 1953. Procedure suggested for obtaining state waterfowl kill figures from game license stubs - Central Flyway. Printed rept. 4 P•
27