report of the chief financial officer - new cross hospital · report of the chief financial officer...
TRANSCRIPT

Report of the Chief Financial Officer
Summary Finance Report – February 2016
(Month 11)
Contents Page
Summary Tables 3 - 6
Income and Expenditure Account 7
Financial Targets and Rating 8
Risks 9
Pay Analysis 10 - 11
Patient Income Analysis 12 - 15
CIP 16
Statement of Financial Position 17
Cash Flow Statement 18
Summary Overview
Previously the Trust Board agreed an “adjusted” year end deficit of £0.3m. Subsequent to the plan
resubmission the Trust agreed to a TDA request for a £2.5m capital to revenue transfer, resulting in the
Trust having a further adjusted surplus target of £2.2m surplus. Following discussion at Finance &
Performance Committee; Audit Committee and with the agreement of the Trust Board the Trust notified
the NHS Trust Development Agency that it would not be able to meet the “stretch” target and is
predicting to be £2m below the stretch plan with a deficit of £2.4m (before capital to revenue transfer)
At Month 11 the Trust has a net deficit of (£4.37m), after TDA technical adjustments. In Month 11 the
position is (£3.23m) adverse to the stretch forecast. Both the original plan and the stretch forecast are
detailed on page 7.
For consistency with previous months reporting this report will continue to highlight variances to the
“stretch” target.
Contents & Summary Overview
2

Net Surplus
Other Income (excluding CRN income)
In Month 11 the Trust reported an in-month deficit of (£343k), against an in month
surplus plan of £877k, an adverse variance of (£1,219k) against the adjusted
stretch plan in month.
The Trusts Income and Expenditure position as at Month 11 is a deficit of
(£4,369k), after TDA technical adjustments, which is (£3,233k) adverse to the
stretch plan.
The Trust’s operating position (Earnings before interest, taxation, depreciation and
amortisation – EBITDA) is (£3,725k) below plan. The detail can be found on page
7.
At Month 11, patient contract income is showing a year to date deficit of
(£3.01m), with an in-month adverse variance of (£560k). The detailed reasons
for the variance in month are shown on page 12.
The key areas of underperformance in month are: Emergency Services (£259k),
Critical Care (£86k), Obstetrics (£43k) and General Surgery (£33k).
The key areas of underperformance year to date are: Emergency Services
(£1,230k), Clinical Haematology/Oncology (£1,156k), Cardiothoracic (£622k)
and Community (£321k).
Other Income has under-recovered by (£1.79m) year-to-date with an under-
recovery of (£34k) in Month 11 against the TDA plan. The year to date under-
recovery is due to the under-performance of Income on Directorate budgets.
3
Summary Tables
Patient Contract Income

Non Pay
Pay costs are underspent year to date by £2.24m against the stretch plan. In month pay
budgets are £0.2m overspent against the Month 11 stretch plan.
Substantive pay, agency and bank usage have marginally reduced in Month 11
whereas locum expenditure has increased since Month 10 (see page 10 for more
information).
Against the new financial target Division 1 has a favourable pay variance of £1.43m to
date due to continued vacancies.
Division 2 is underspent by £773k to date against the new financial target, due to
continued vacancies across the Division.
Non Pay is overspent year to date by (£787k) against the stretch target.
Division 1 is overspent by (£995k) to date across a number of Directorates. This is due
mainly to increased Maternity Pathway charges from other providers and additional
MRI scanner hire. There are also overspends on consumables relating to increased
activity.
Division 2 is £10k underspent at Month 11, while Estates and Facilities is (£77k)
overspent year to date due to non-recurrent expenditure incurred throughout the year.
Drugs was overspent by (£266k) in month, with a cumulative overspend of (£379k)
against the stretch target.
Division 1 is (£395k) adverse to the revised plan year to date. This relates to activity
related costs in Ophthalmology.
Division 2 is underspent by £105k against the revised plan, this is mainly within
Rheumatology.
4
Summary Expenditure Tables Pay
Drugs
Summary Tables – Capital, Cash & CIP Cash
Capital (cumulative)
5
Capital
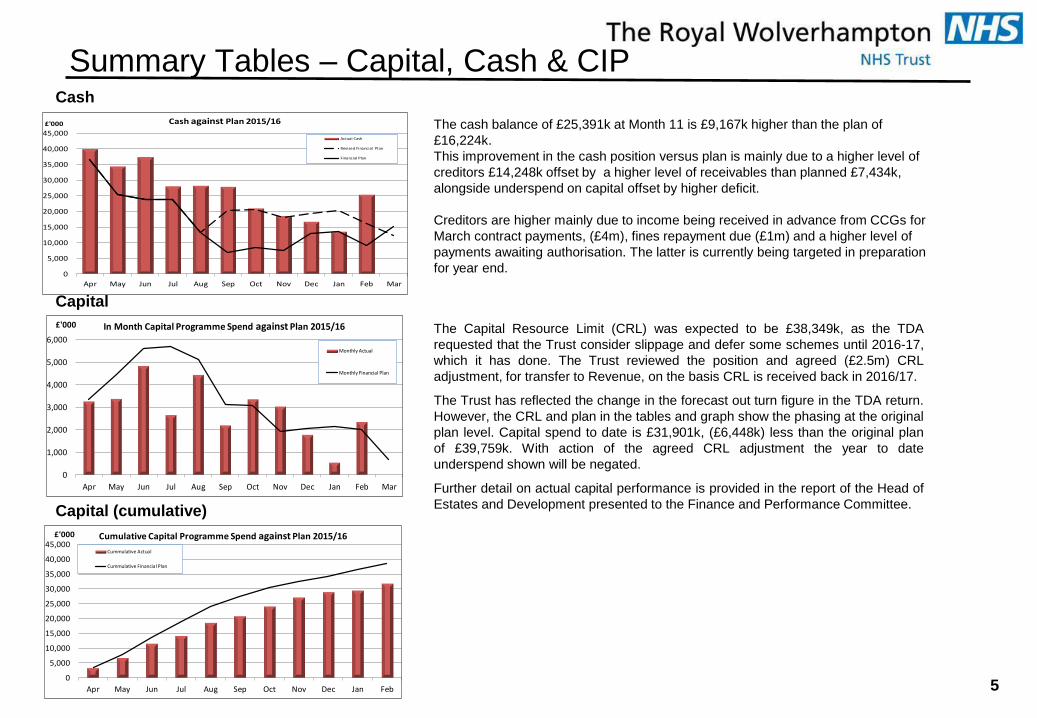
The Capital Resource Limit (CRL) was expected to be £38,349k, as the TDA
requested that the Trust consider slippage and defer some schemes until 2016-17,
which it has done. The Trust reviewed the position and agreed (£2.5m) CRL
adjustment, for transfer to Revenue, on the basis CRL is received back in 2016/17.
The Trust has reflected the change in the forecast out turn figure in the TDA return.
However, the CRL and plan in the tables and graph show the phasing at the original
plan level. Capital spend to date is £31,901k, (£6,448k) less than the original plan
of £39,759k. With action of the agreed CRL adjustment the year to date
underspend shown will be negated.
Further detail on actual capital performance is provided in the report of the Head of
Estates and Development presented to the Finance and Performance Committee.
The cash balance of £25,391k at Month 11 is £9,167k higher than the plan of
£16,224k.
This improvement in the cash position versus plan is mainly due to a higher level of
creditors £14,248k offset by a higher level of receivables than planned £7,434k,
alongside underspend on capital offset by higher deficit.
Creditors are higher mainly due to income being received in advance from CCGs for
March contract payments, (£4m), fines repayment due (£1m) and a higher level of
payments awaiting authorisation. The latter is currently being targeted in preparation
for year end.
0
1,000
2,000
3,000
4,000
5,000
6,000
Apr May Jun Jul Aug Sep Oct Nov Dec Jan Feb Mar
£'000 In Month Capital Programme Spend against Plan 2015/16
Monthly Actual
Monthly Financial Plan
0
5,000
10,000
15,000
20,000
25,000
30,000
35,000
40,000
45,000
Apr May Jun Jul Aug Sep Oct Nov Dec Jan Feb
£'000 Cumulative Capital Programme Spend against Plan 2015/16
Cummulative Actual
Cummulative Financial Plan
0
5,000
10,000
15,000
20,000
25,000
30,000
35,000
40,000
45,000
Apr May Jun Jul Aug Sep Oct Nov Dec Jan Feb Mar
£'000 Cash against Plan 2015/16
Actual Cash
Revised Financial Plan
Financial Plan

Summary Tables – Capital, Cash & CIP
CIP
6
CIP Cumulative
The original Trust CIP target for 2015/16 is £20.6m.
At Month 11 a total of £15.2m (Annual Budget) has been removed from budgets,
against the annual target of £20.6m. This represents 73.6% of the total target.
The recurrent CIP achieved to Month 11 is £8.41m, which represents 40.8% of the
annual target.
The in-month target was £2.89m, with actual achievement in month of £1.34m, a
shortfall in month of (£1.56m).
Income & Expenditure Account
7
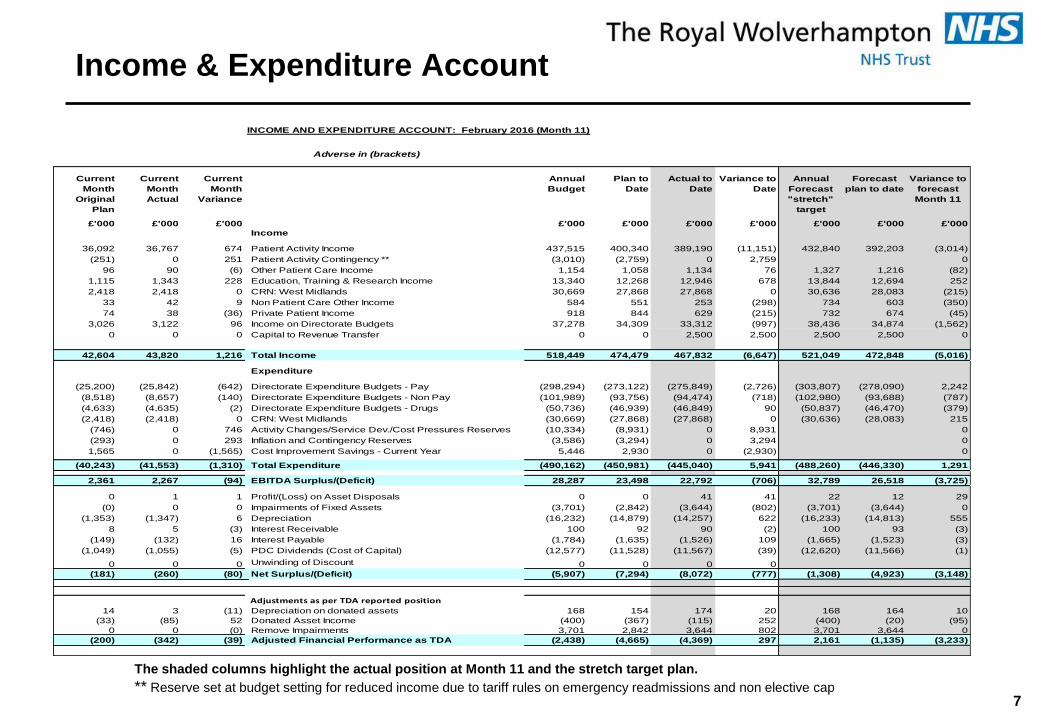
The shaded columns highlight the actual position at Month 11 and the stretch target plan.
** Reserve set at budget setting for reduced income due to tariff rules on emergency readmissions and non elective cap
INCOME AND EXPENDITURE ACCOUNT: February 2016 (Month 11)
Adverse in (brackets)
£'000 £'000 £'000 £'000 £'000 £'000 £'000 £'000 £'000 £'000
Income
36,092 36,767 674 Patient Activity Income 437,515 400,340 389,190 (11,151) 432,840 392,203 (3,014)
(251) 0 251 Patient Activity Contingency ** (3,010) (2,759) 0 2,759 0
96 90 (6) Other Patient Care Income 1,154 1,058 1,134 76 1,327 1,216 (82)
1,115 1,343 228 Education, Training & Research Income 13,340 12,268 12,946 678 13,844 12,694 252
2,418 2,418 0 CRN: West Midlands 30,669 27,868 27,868 0 30,636 28,083 (215)
33 42 9 Non Patient Care Other Income 584 551 253 (298) 734 603 (350)
74 38 (36) Private Patient Income 918 844 629 (215) 732 674 (45)
3,026 3,122 96 Income on Directorate Budgets 37,278 34,309 33,312 (997) 38,436 34,874 (1,562)
0 0 0 Capital to Revenue Transfer 0 0 2,500 2,500 2,500 2,500 0
42,604 43,820 1,216 Total Income 518,449 474,479 467,832 (6,647) 521,049 472,848 (5,016)
Expenditure
(25,200) (25,842) (642) Directorate Expenditure Budgets - Pay (298,294) (273,122) (275,849) (2,726) (303,807) (278,090) 2,242
(8,518) (8,657) (140) Directorate Expenditure Budgets - Non Pay (101,989) (93,756) (94,474) (718) (102,980) (93,688) (787)
(4,633) (4,635) (2) Directorate Expenditure Budgets - Drugs (50,736) (46,939) (46,849) 90 (50,837) (46,470) (379)
(2,418) (2,418) 0 CRN: West Midlands (30,669) (27,868) (27,868) 0 (30,636) (28,083) 215
(746) 0 746 Activity Changes/Service Dev./Cost Pressures Reserves (10,334) (8,931) 0 8,931 0
(293) 0 293 Inflation and Contingency Reserves (3,586) (3,294) 0 3,294 0
1,565 0 (1,565) Cost Improvement Savings - Current Year 5,446 2,930 0 (2,930) 0
(40,243) (41,553) (1,310) Total Expenditure (490,162) (450,981) (445,040) 5,941 (488,260) (446,330) 1,291
2,361 2,267 (94) EBITDA Surplus/(Deficit) 28,287 23,498 22,792 (706) 32,789 26,518 (3,725)
0 1 1 Profit/(Loss) on Asset Disposals 0 0 41 41 22 12 29
(0) 0 0 Impairments of Fixed Assets (3,701) (2,842) (3,644) (802) (3,701) (3,644) 0
(1,353) (1,347) 6 Depreciation (16,232) (14,879) (14,257) 622 (16,233) (14,813) 555
8 5 (3) Interest Receivable 100 92 90 (2) 100 93 (3)
(149) (132) 16 Interest Payable (1,784) (1,635) (1,526) 109 (1,665) (1,523) (3)
(1,049) (1,055) (5) PDC Dividends (Cost of Capital) (12,577) (11,528) (11,567) (39) (12,620) (11,566) (1)
0 0 0 Unwinding of Discount 0 0 0 0
(181) (260) (80) Net Surplus/(Deficit) (5,907) (7,294) (8,072) (777) (1,308) (4,923) (3,148)
Adjustments as per TDA reported position
14 3 (11) Depreciation on donated assets 168 154 174 20 168 164 10
(33) (85) 52 Donated Asset Income (400) (367) (115) 252 (400) (20) (95)
0 0 (0) Remove Impairments 3,701 2,842 3,644 802 3,701 3,644 0
(200) (342) (39) Adjusted Financial Performance as TDA (2,438) (4,665) (4,369) 297 2,161 (1,135) (3,233)
Plan to
Date
Annual
Budget
Current
Month
Original
Plan
Current
Month
Actual
Current
Month
Variance
Variance to
forecast
Month 11
Actual to
Date
Variance to
Date
Annual
Forecast
"stretch"
target
Forecast
plan to date
TDA
8
Financial Targets and Rating
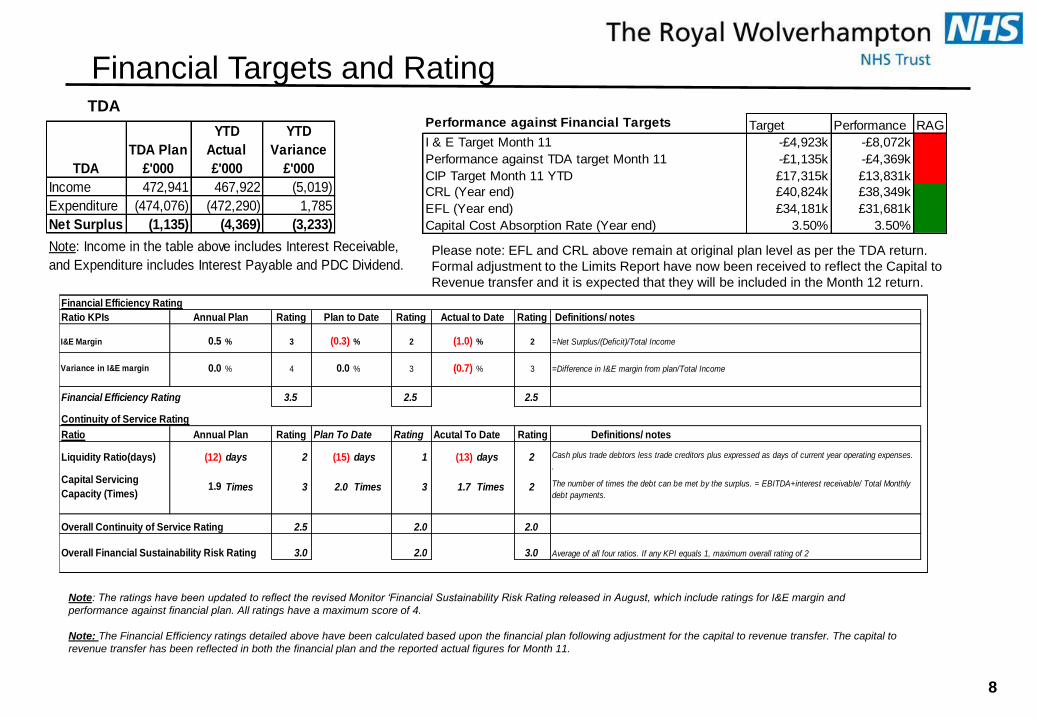
Note: The ratings have been updated to reflect the revised Monitor ‘Financial Sustainability Risk Rating released in August, which include ratings for I&E margin and
performance against financial plan. All ratings have a maximum score of 4.
Note: The Financial Efficiency ratings detailed above have been calculated based upon the financial plan following adjustment for the capital to revenue transfer. The capital to
revenue transfer has been reflected in both the financial plan and the reported actual figures for Month 11.
Performance against Financial Targets Target Performance RAG
I & E Target Month 11 -£4,923k -£8,072k
Performance against TDA target Month 11 -£1,135k -£4,369k
CIP Target Month 11 YTD £17,315k £13,831k
CRL (Year end) £40,824k £38,349k
EFL (Year end) £34,181k £31,681k
Capital Cost Absorption Rate (Year end) 3.50% 3.50%
Financial Efficiency Rating
Ratio KPIs Rating Rating Rating
I&E Margin 0.5 % 3 (0.3) % 2 (1.0) % 2
Variance in I&E margin 0.0 % 4 0.0 % 3 (0.7) % 3
Financial Efficiency Rating 3.5 2.5 2.5
Continuity of Service Rating
Ratio Rating Plan To Date Rating Acutal To Date Rating Definitions/ notes
Liquidity Ratio(days) (12) days 2 (15) days 1 (13) days 2
Capital Servicing
Capacity (Times)1.9 Times 3 2.0 Times 3 1.7 Times 2
Overall Continuity of Service Rating 2.5 2.0 2.0
Overall Financial Sustainability Risk Rating 3.0 2.0 3.0
=Net Surplus/(Deficit)/Total Income
Cash plus trade debtors less trade creditors plus expressed as days of current year operating expenses.
.
Annual Plan
The number of times the debt can be met by the surplus. = EBITDA+interest receivable/ Total Monthly
debt payments.
Average of all four ratios. If any KPI equals 1, maximum overall rating of 2
Annual Plan Actual to Date Definitions/ notesPlan to Date
=Difference in I&E margin from plan/Total Income
TDA
TDA Plan
£'000
YTD
Actual
£'000
YTD
Variance
£'000
Income 472,941 467,922 (5,019)
Expenditure (474,076) (472,290) 1,785
Net Surplus (1,135) (4,369) (3,233)
Note: Income in the table above includes Interest Receivable,
and Expenditure includes Interest Payable and PDC Dividend.Please note: EFL and CRL above remain at original plan level as per the TDA return.
Formal adjustment to the Limits Report have now been received to reflect the Capital to
Revenue transfer and it is expected that they will be included in the Month 12 return.

Risks
9
The level of financial risk and mitigations have been assessed. The main risks relate to CIP and contractual issues for which actions are being taken
to mitigate against.
RiskLikelihood of
risk
Potential
consequence
rating
RiskCurrent Risk
£000's
Risk after
Mitigation
£000's
Mitigating Action
Cost Improvement
Programme 2015/16Likely Major B4 4,099 3,000
The current forecast for CIP is an under
achievement in 2015/16 of £4.1m. Further non-
recurrent savings have been taken in month. The
recurrent risk is £10.4m
Contract income issues-
Fines, Readmissions,
Emergency Threshold
Likely Major B4 4,823 3,919
Discussions are on-going with Commissioners in
order to secure the return of funds. Staffordshire
CCG's have confirmed that they will not be
reinvesting any emergency threshold funds /
readmissions with RWT as the funds have been
invested within Staffordshire. Walsall CCG will be
returning fines and readmissions but not
emergency threshold. Meetings are continuing in
order to pursue further funding, including
Specialised Services in relation to the Cannock
transfer of activity.
Cash Rare Major E4 2,000 0
Further to Finance action taken, the Trust should
now achieve its 2015/16 EFL. However, there
remains a considerable level of outstanding
invoiced and accrued debt, in particular NHS,
where settlement is still being actively pursued.
Risk Rating
Likelihood Rating 1. Insignificant 2. Minor 3. Moderate 4. Major 5. Catastrophic
A - Almost Certain
B - Likely
C - Possible
D - Unlikely
E - Rare
Potential Consequence Rating

Agency
In Month 11, there are 7,361 WTE’s in post, against a forecast plan of 7,375 WTE.
Since Month 10 WTE’s have reduced by 35 WTE.
Division 2 is over-established in Month 11, with WTE’s of 54 above budgeted levels,
whilst Divisions 1 and Estates and Facilities divisions continue to hold a level of
vacancies. Division 1 has 191 WTE vacant posts at Month 11.
Note: The September forecast reduction is due to the need to correct the year to date to reflect
the revised forecast.
In Month 11 agency expenditure of £1.33m was incurred, a reduction of £19k since
Month 10 and an increase of £375k since the same period in 2014/15.
The main areas of expenditure in Month 11 are: Emergency Services Group (£385k),
Oncology & Heam Group (£179k), Rehab & Amb Group (£131k) and Critical care
(£85k).
The key movements between Months 10 and 11 have been within Oncology & Heam
Group reporting a £60k increase in Month 11 and Orthopaedics, reporting a £32k
increase. The Emergency Services Group agency expenditure has reduced by £75k in
Month 11 and Critical Care expenditure has reduced by £21k in month.
The Trust continues to monitor and manage agency expenditure, with the aim to
reduce costs. All Trusts have been given a nurse agency spend cap, as a percentage
of total nursing spend. For RWT this is 3%, and nurse agency spend is 0.5%, well
within the target.
In Month 11 Locum expenditure was £203k, an increase of £27k from the Month 10
expenditure level. The Month 11 expenditure is in line with the expenditure in the
same period of 2014/15.
Locum expenditure mainly occurred in Medical Services Group (£32k), Emergency
Services Group (£24k), Oncology & Haematology (£20k) and General surgery (£17k).
Critical Care and Children’s Services have both seen increases in locum usage in
Month 11.
10
Pay Analysis WTE
Locum
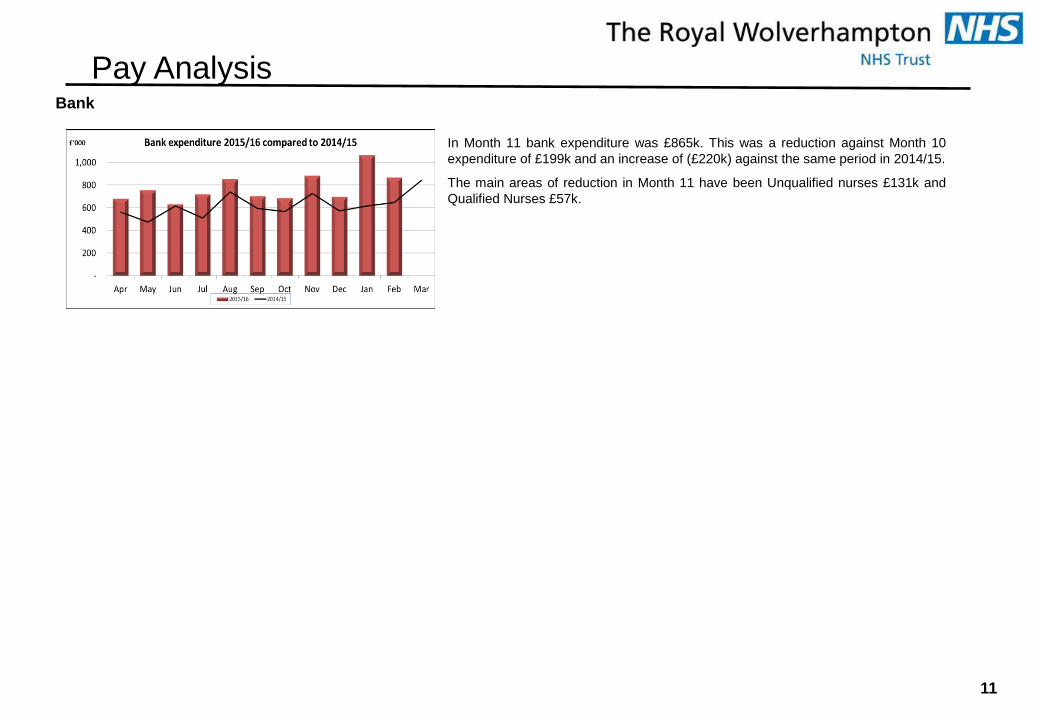
In Month 11 bank expenditure was £865k. This was a reduction against Month 10
expenditure of £199k and an increase of (£220k) against the same period in 2014/15.
The main areas of reduction in Month 11 have been Unqualified nurses £131k and
Qualified Nurses £57k.
11
Pay Analysis Bank
Patient Care Income - Variance
12
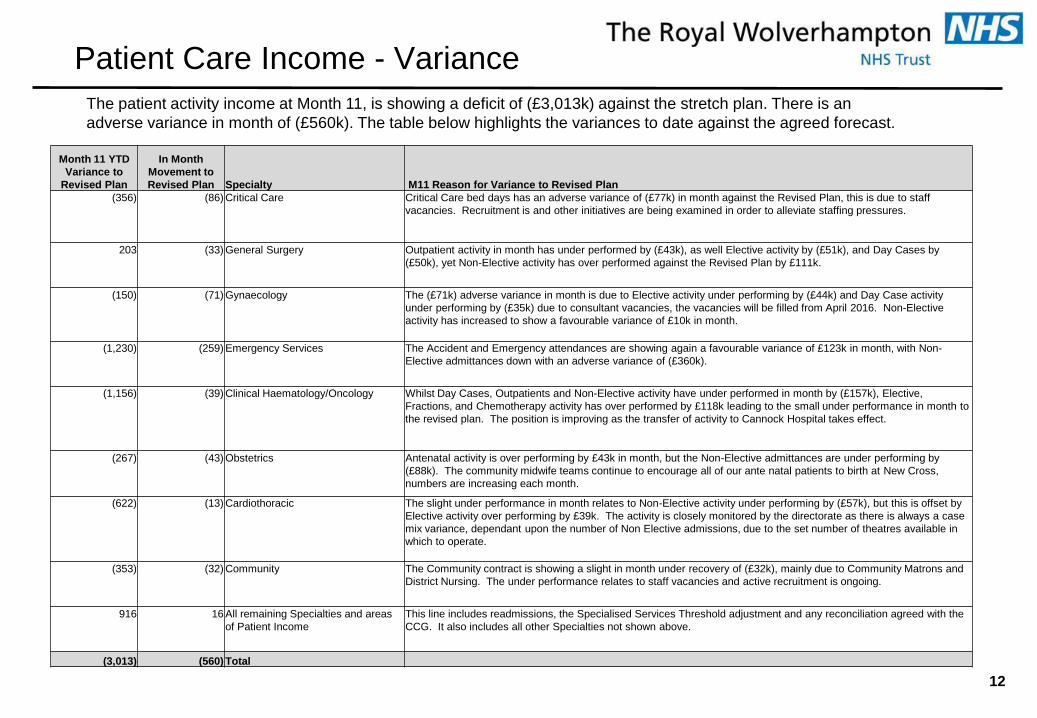
The patient activity income at Month 11, is showing a deficit of (£3,013k) against the stretch plan. There is an
adverse variance in month of (£560k). The table below highlights the variances to date against the agreed forecast.
Month 11 YTD
Variance to
Revised Plan
In Month
Movement to
Revised Plan Specialty M11 Reason for Variance to Revised Plan
(356) (86) Critical Care Critical Care bed days has an adverse variance of (£77k) in month against the Revised Plan, this is due to staff
vacancies. Recruitment is and other initiatives are being examined in order to alleviate staffing pressures.
203 (33) General Surgery Outpatient activity in month has under performed by (£43k), as well Elective activity by (£51k), and Day Cases by
(£50k), yet Non-Elective activity has over performed against the Revised Plan by £111k.
(150) (71) Gynaecology The (£71k) adverse variance in month is due to Elective activity under performing by (£44k) and Day Case activity
under performing by (£35k) due to consultant vacancies, the vacancies will be filled from April 2016. Non-Elective
activity has increased to show a favourable variance of £10k in month.
(1,230) (259) Emergency Services The Accident and Emergency attendances are showing again a favourable variance of £123k in month, with Non-
Elective admittances down with an adverse variance of (£360k).
(1,156) (39) Clinical Haematology/Oncology Whilst Day Cases, Outpatients and Non-Elective activity have under performed in month by (£157k), Elective,
Fractions, and Chemotherapy activity has over performed by £118k leading to the small under performance in month to
the revised plan. The position is improving as the transfer of activity to Cannock Hospital takes effect.
(267) (43) Obstetrics Antenatal activity is over performing by £43k in month, but the Non-Elective admittances are under performing by
(£88k). The community midwife teams continue to encourage all of our ante natal patients to birth at New Cross,
numbers are increasing each month.
(622) (13) Cardiothoracic The slight under performance in month relates to Non-Elective activity under performing by (£57k), but this is offset by
Elective activity over performing by £39k. The activity is closely monitored by the directorate as there is always a case
mix variance, dependant upon the number of Non Elective admissions, due to the set number of theatres available in
which to operate.
(353) (32) Community The Community contract is showing a slight in month under recovery of (£32k), mainly due to Community Matrons and
District Nursing. The under performance relates to staff vacancies and active recruitment is ongoing.
916 16 All remaining Specialties and areas
of Patient Income
This line includes readmissions, the Specialised Services Threshold adjustment and any reconciliation agreed with the
CCG. It also includes all other Specialties not shown above.
(3,013) (560) Total
Patient Care Activity Performance
13
3,000
3,500
4,000
4,500
5,000
5,500
6,000
Apr May Jun Jul Aug Sep Oct Nov Dec Jan Feb Mar
Elective Monthly Activity ( Spells )
14/15 Activity Actual
15/16 Activity Actual
15/16 Activity Plan
Revised Activity Plan
3,000
3,200
3,400
3,600
3,800
4,000
4,200
4,400
4,600
4,800
Apr May Jun Jul Aug Sep Oct Nov Dec Jan Feb Mar
Non-Elective Monthly Activity (Spells)
14/15 Activity Actual
15/16 Activity Actual
15/16 Activity Plan
Revised Activity Plan
6,000
7,000
8,000
9,000
10,000
11,000
12,000
Apr May Jun Jul Aug Sep Oct Nov Dec Jan Feb Mar
A&E Monthly Activity
14/15 Activity Actual
15/16 Activity Actual
15/16 Activity Plan
revised Plan
8,000
9,000
10,000
11,000
12,000
13,000
14,000
15,000
16,000
Apr May Jun Jul Aug Sep Oct Nov Dec Jan Feb Mar
Outpatient FirstMonthly Activity
14/15 Activity Actual
15/16 Activity Actual
15/16 Activity Plan
Revised Plan
20,000
25,000
30,000
35,000
40,000
45,000
Apr May Jun Jul Aug Sep Oct Nov Dec Jan Feb Mar
Outpatient Follow up Monthly Activity
14/15 Activity Actual
15/16 Activity Actual
15/16 Activity Plan
Revised Plan
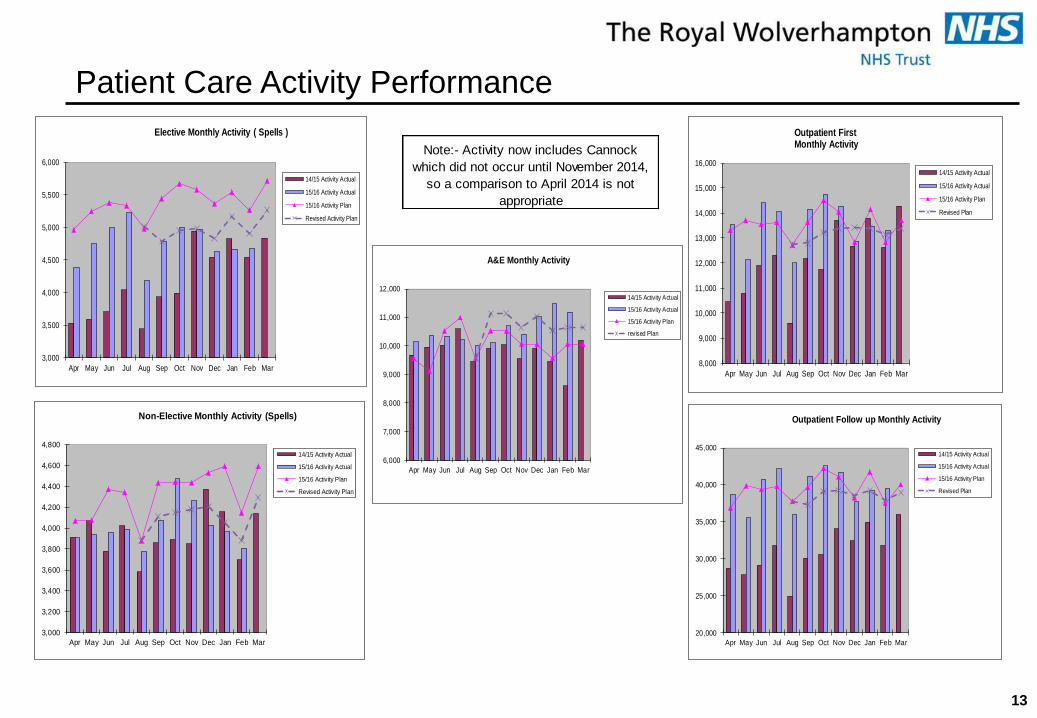
Note:- Activity now includes Cannock
which did not occur until November 2014,
so a comparison to April 2014 is not
appropriate
Community Performance against CCG Activity Plan
14
0
100
200
300
400
500
600
700
Apr May Jun Jul Aug Sep Oct Nov Dec Jan Feb Mar
Community Outpatients Monthly Activity
14/15 Activity Actual
15/16 Activity Actual
15/16 TOTAL Activity Plan
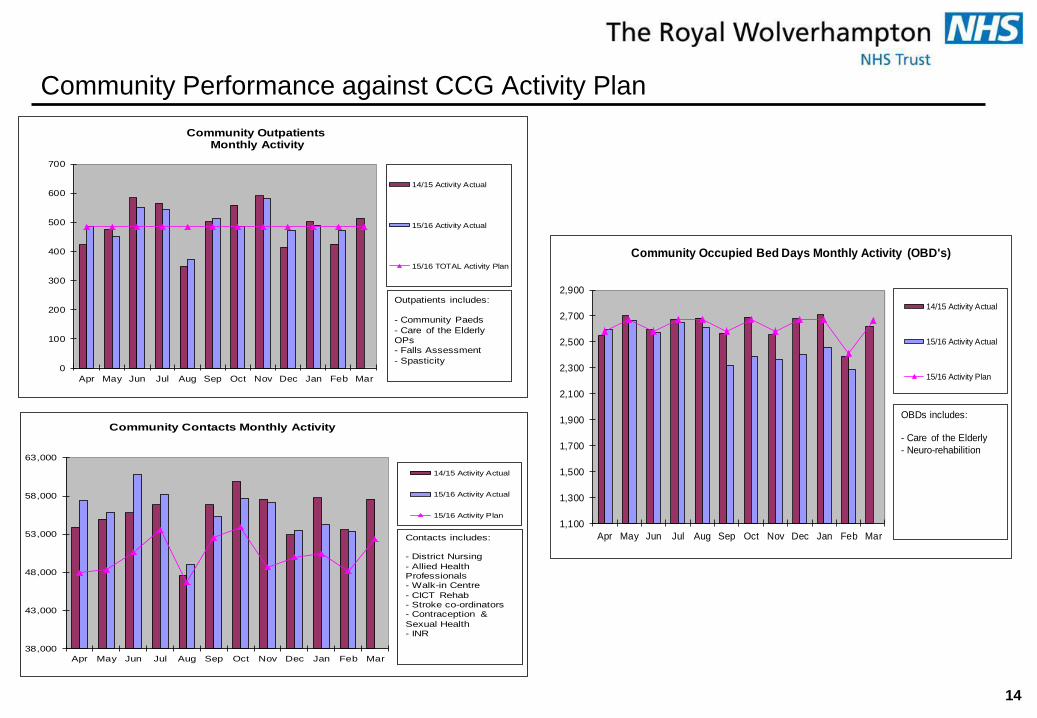
Outpatients includes:
- Community Paeds
- Care of the Elderly OPs- Falls Assessment
- Spasticity
38,000
43,000
48,000
53,000
58,000
63,000
Apr May Jun Jul Aug Sep Oct Nov Dec Jan Feb Mar
Community Contacts Monthly Activity
14/15 Activity Actual
15/16 Activity Actual
15/16 Activity Plan
Contacts includes:
- District Nursing
- Allied Health Professionals- Walk-in Centre
- CICT Rehab- Stroke co-ordinators- Contraception &
Sexual Health- INR
1,100
1,300
1,500
1,700
1,900
2,100
2,300
2,500
2,700
2,900
Apr May Jun Jul Aug Sep Oct Nov Dec Jan Feb Mar
Community Occupied Bed Days Monthly Activity (OBD's)
14/15 Activity Actual
15/16 Activity Actual
15/16 Activity Plan
OBDs includes:
- Care of the Elderly
- Neuro-rehabilition
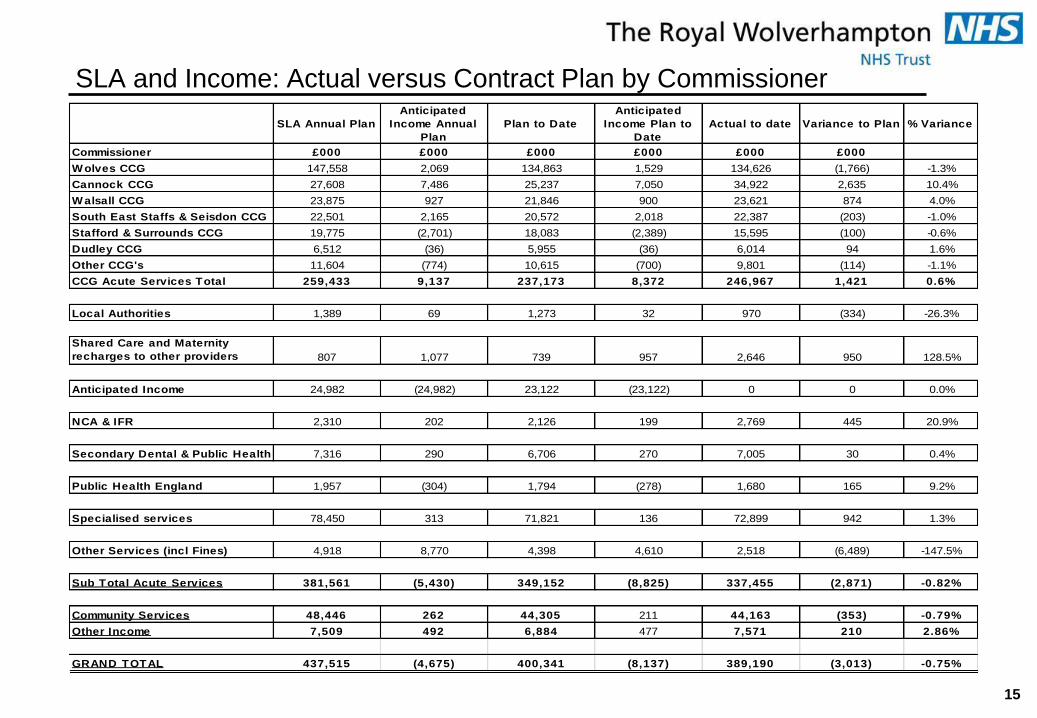
SLA and Income: Actual versus Contract Plan by Commissioner
15
SLA Annual Plan
Anticipated
Income Annual
Plan
Plan to Date
Anticipated
Income Plan to
Date
Actual to date Variance to Plan % Variance
Commissioner £000 £000 £000 £000 £000 £000
W olves CCG 147,558 2,069 134,863 1,529 134,626 (1,766) -1.3%
Cannock CCG 27,608 7,486 25,237 7,050 34,922 2,635 10.4%
W alsall CCG 23,875 927 21,846 900 23,621 874 4.0%
South East Staffs & Seisdon CCG 22,501 2,165 20,572 2,018 22,387 (203) -1.0%
Stafford & Surrounds CCG 19,775 (2,701) 18,083 (2,389) 15,595 (100) -0.6%
Dudley CCG 6,512 (36) 5,955 (36) 6,014 94 1.6%
Other CCG's 11,604 (774) 10,615 (700) 9,801 (114) -1.1%
CCG Acute Services Total 259,433 9,137 237,173 8,372 246,967 1,421 0.6%
Local Authorities 1,389 69 1,273 32 970 (334) -26.3%
Shared Care and Maternity
recharges to other providers 807 1,077 739 957 2,646 950 128.5%
Anticipated Income 24,982 (24,982) 23,122 (23,122) 0 0 0.0%
NCA & IFR 2,310 202 2,126 199 2,769 445 20.9%
Secondary Dental & Public Health 7,316 290 6,706 270 7,005 30 0.4%
Public Health England 1,957 (304) 1,794 (278) 1,680 165 9.2%
Specialised services 78,450 313 71,821 136 72,899 942 1.3%
Other Services (incl Fines) 4,918 8,770 4,398 4,610 2,518 (6,489) -147.5%
Sub Total Acute Services 381,561 (5,430) 349,152 (8,825) 337,455 (2,871) -0.82%
Community Services 48,446 262 44,305 211 44,163 (353) -0.79%
Other Income 7,509 492 6,884 477 7,571 210 2.86%
GRAND TOTAL 437,515 (4,675) 400,341 (8,137) 389,190 (3,013) -0.75%
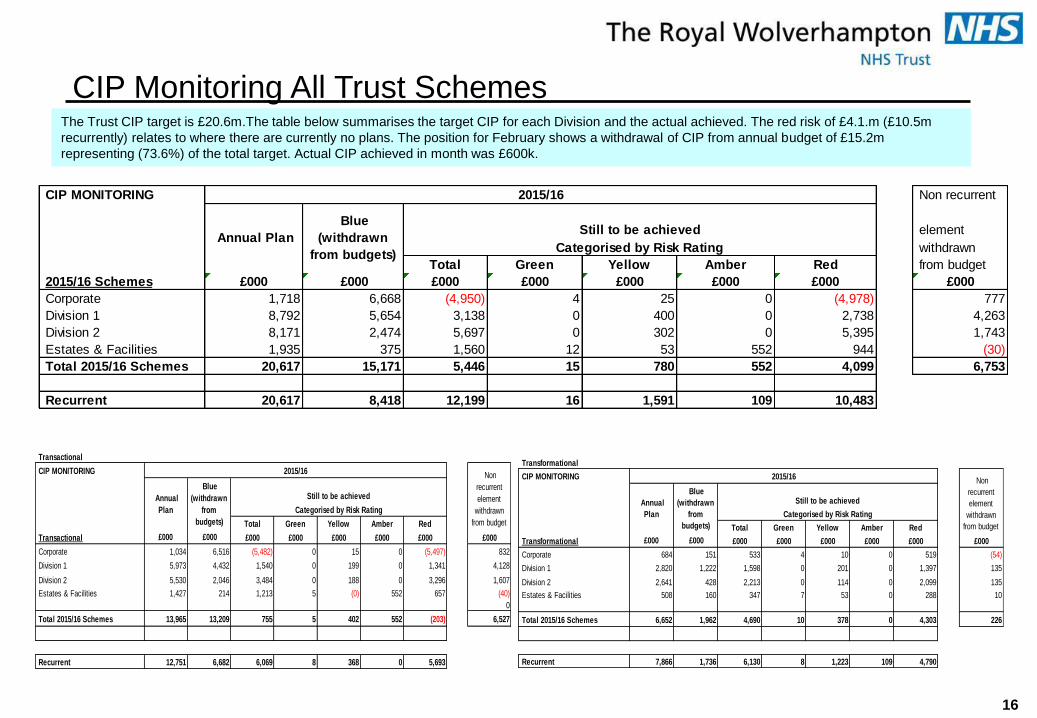
CIP Monitoring All Trust Schemes The Trust CIP target is £20.6m.The table below summarises the target CIP for each Division and the actual achieved. The red risk of £4.1.m (£10.5m
recurrently) relates to where there are currently no plans. The position for February shows a withdrawal of CIP from annual budget of £15.2m
representing (73.6%) of the total target. Actual CIP achieved in month was £600k.
16
CIP MONITORING Non recurrent
element
withdrawn
Total Green Yellow Amber Red from budget
2015/16 Schemes £000 £000 £000 £000 £000 £000 £000 £000
Corporate 1,718 6,668 (4,950) 4 25 0 (4,978) 777
Division 1 8,792 5,654 3,138 0 400 0 2,738 4,263
Division 2 8,171 2,474 5,697 0 302 0 5,395 1,743
Estates & Facilities 1,935 375 1,560 12 53 552 944 (30)
Total 2015/16 Schemes 20,617 15,171 5,446 15 780 552 4,099 6,753
Recurrent 20,617 8,418 12,199 16 1,591 109 10,483
2015/16
Annual Plan
Blue
(withdrawn
from budgets)
Still to be achieved
Categorised by Risk Rating
Transactional
CIP MONITORING
Total Green Yellow Amber Red
Transactional £000 £000 £000 £000 £000 £000 £000 £000
Corporate 1,034 6,516 (5,482) 0 15 0 (5,497) 832
Division 1 5,973 4,432 1,540 0 199 0 1,341 4,128
Division 2 5,530 2,046 3,484 0 188 0 3,296 1,607
Estates & Facilities 1,427 214 1,213 5 (0) 552 657 (40)
Unallocated 0 0 0 0 0 0 0 0
Total 2015/16 Schemes 13,965 13,209 755 5 402 552 (203) 6,527
Recurrent 12,751 6,682 6,069 8 368 0 5,693
2015/16 Non
recurrent
element
withdrawn
from budget
Annual
Plan
Blue
(withdrawn
from
budgets)
Still to be achieved
Categorised by Risk Rating
Transformational
CIP MONITORING
Total Green Yellow Amber Red
Transformational £000 £000 £000 £000 £000 £000 £000 £000
Corporate 684 151 533 4 10 0 519 (54)
Division 1 2,820 1,222 1,598 0 201 0 1,397 135
Division 2 2,641 428 2,213 0 114 0 2,099 135
Estates & Facilities 508 160 347 7 53 0 288 10
Unallocated 0 0 0 0 0 0 0
Total 2015/16 Schemes 6,652 1,962 4,690 10 378 0 4,303 226
Recurrent 7,866 1,736 6,130 8 1,223 109 4,790
Non
recurrent
element
withdrawn
from budget
2015/16
Annual
Plan
Blue
(withdrawn
from
budgets)
Still to be achieved
Categorised by Risk Rating

Statement of Financial Position
17
The Public Sector Payment Policy sets out a target for payment of 95%, in value and volume, to be paid within 30 days of receipt. The Trust's performance against this target is:
M11 Cumulative
- Value 66% 88%- Volume 78% 89%
M10 Cumulative
- Value 89% 90%- Volume 85% 90%
The Trust's performance on volume continues to be affected by the volume of pharmacy invoices associated with the take on of Cannock Hospital. We have previously reported that escalated action is currently taking place to resolve the problem
Calculated Debtor Days for the year to date are:-
M11 Actual M11 Plan M10 ActualTotal 12.29 13.91 12.91Being:-NHS 12.78 15.23 14.14Non NHS 9.26 5.39 4.98
The lower level of NHS debtor days this month is primarily due to significant invoices being raised last period to the DoH & TDA in respect of MSFT which have now cleared. Non NHS days are higher due to a large year to date invoice relating to Social Sevices salary recharge. This invoice has been settled in March.
THE ROYAL WOLVERHAMPTON NHS TRUST
2015/16 Balance Sheet as at 28th February 2016
Feb 2016 Feb 2016 Jan 2016 Movement March 2015
Plan Actual Actual in Month Actual
£000 £000 £000 £000 £000
NON CURRENT ASSETS
Property,Plant and Equipment - Tangible Assets 403,560 398,725 396,429 2,296 382,971
Intangible Assets 676 472 490 (18) 676
Trade and Other Receivables Non Current 1,517 1,517 1,517 0 1,710
TOTAL NON CURRENT ASSETS 405,753 400,714 398,436 2,278 385,357
CURRENT ASSETS
Inventories 5,642 5,544 6,118 (574) 6,291
Trade and Other Receivables 23,228 30,662 30,538 124 19,783
Other Current Assets 0 0 0 0 0
Cash and cash equivalents 16,224 25,391 13,605 11,786 41,598
TOTAL CURRENT ASSETS 45,094 61,597 50,261 11,336 67,672
Non Current Assets Held for Sale 800 800 800 0 800
TOTAL ASSETS 451,647 463,111 449,497 13,614 453,829
CURRENT LIABLILITES
Trade & Other Payables (53,043) (67,291) (54,381) (12,910) (52,498)
Liabilities arising from PFIs / Finance Leases (1,849) (1,885) (1,885) 0 (1,885)
Provisions for Liabilities and Charges (4,830) (4,515) (4,609) 94 (5,821)
TOTAL CURRENT LIABILITIES (59,722) (73,691) (60,875) (12,816) (60,204)
NET CURRENT ASSETS / (LIABILITIES) (14,628) (12,094) (10,614) (1,480) 7,468
TOTAL ASSETS LESS CURRENT LIABILITIES 391,925 389,420 388,622 798 393,625
NON CURRENT LIABILITIES
Other Liabilities (4,837) (5,516) (4,476) (1,040) (5,943)
Provision for Liabilities and Charges (648) (648) (629) (19) (648)
TOTAL NON CURRENT LIABILITIES (5,485) (6,164) (5,105) (1,059) (6,591)
TOTAL ASSETS EMPLOYED 386,440 383,256 383,517 (261) 387,034
FINANCED BY TAXPAYERS EQUITY
Public Dividend Capital 232,043 229,543 229,543 0 225,252
Retained Earnings 21,165 21,580 21,774 (194) 26,568
Revaluation Reserve 133,042 131,943 132,009 (66) 133,042
Donated Asset Reserve 0 0 0 0 1,982
Government Grant Reserve 0 0 0 0 0
Other Reserves 190 190 190 0 190
TOTAL TAXPAYERS EQUITY 386,440 383,256 383,516 (260) 387,034
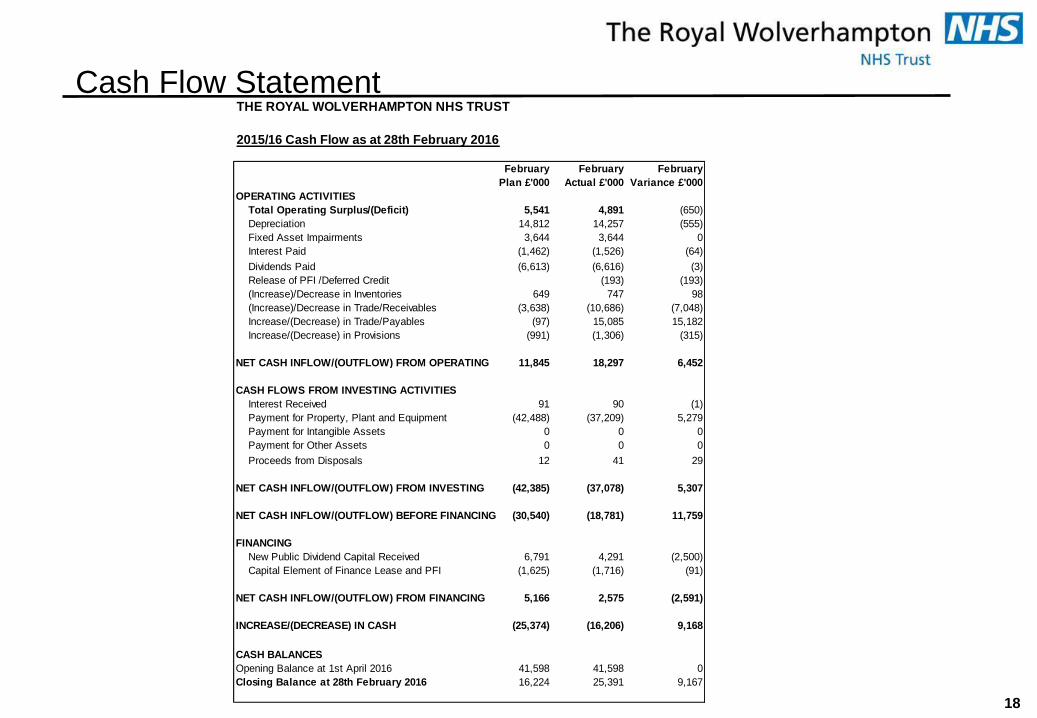
Cash Flow Statement
18
THE ROYAL WOLVERHAMPTON NHS TRUST
2015/16 Cash Flow as at 28th February 2016
February February February
Plan £'000 Actual £'000 Variance £'000
OPERATING ACTIVITIES
Total Operating Surplus/(Deficit) 5,541 4,891 (650)
Depreciation 14,812 14,257 (555)
Fixed Asset Impairments 3,644 3,644 0
Interest Paid (1,462) (1,526) (64)
Dividends Paid (6,613) (6,616) (3)
Release of PFI /Deferred Credit (193) (193)
(Increase)/Decrease in Inventories 649 747 98
(Increase)/Decrease in Trade/Receivables (3,638) (10,686) (7,048)
Increase/(Decrease) in Trade/Payables (97) 15,085 15,182
Increase/(Decrease) in Provisions (991) (1,306) (315)
11,845 18,297 6,452
CASH FLOWS FROM INVESTING ACTIVITIES
Interest Received 91 90 (1)
Payment for Property, Plant and Equipment (42,488) (37,209) 5,279
Payment for Intangible Assets 0 0 0
Payment for Other Assets 0 0 0
Proceeds from Disposals 12 41 29
(42,385) (37,078) 5,307
(30,540) (18,781) 11,759
FINANCING
New Public Dividend Capital Received 6,791 4,291 (2,500)
Capital Element of Finance Lease and PFI (1,625) (1,716) (91)
5,166 2,575 (2,591)
(25,374) (16,206) 9,168
CASH BALANCES
Opening Balance at 1st April 2016 41,598 41,598 0
Closing Balance at 28th February 2016 16,224 25,391 9,167
NET CASH INFLOW/(OUTFLOW) FROM OPERATING
NET CASH INFLOW/(OUTFLOW) FROM FINANCING
INCREASE/(DECREASE) IN CASH
NET CASH INFLOW/(OUTFLOW) FROM INVESTING
NET CASH INFLOW/(OUTFLOW) BEFORE FINANCING