report on investigation of bear river system
TRANSCRIPT

Utah State University Utah State University
DigitalCommons@USU DigitalCommons@USU
Elusive Documents U.S. Government Documents (Utah Regional Depository)
2-1955
Report on Investigation of Bear River System Report on Investigation of Bear River System
Public Services U.S. Department of Health, Education, and Welfare
Follow this and additional works at: https://digitalcommons.usu.edu/elusive_docs
Part of the Water Resource Management Commons
Recommended Citation Recommended Citation Services, Public, "Report on Investigation of Bear River System" (1955). Elusive Documents. Paper 109. https://digitalcommons.usu.edu/elusive_docs/109
This Report is brought to you for free and open access by the U.S. Government Documents (Utah Regional Depository) at DigitalCommons@USU. It has been accepted for inclusion in Elusive Documents by an authorized administrator of DigitalCommons@USU. For more information, please contact [email protected].
Report on the Investigation of Pollution
in the
BEAR RIVER SYSTEM
Idaho - Utah
U. S. DEPARTMENT OF HEALTH, EDmATION, AND WELFARE Public Health Service
Sanitar,r Engineering Services, Region IX Water Supply and Water Pollution Control Program
February 1955

Report on Investigation of Pollution in the Bear River System - August and November 1954
IN'I'ROllJ CT ION
In October 1952 the U. S~ Public Health Service, under prOVisions
of Public l.aw 845 (80th Congress) J prepared a "Report on Interstate
Pollution in the Bear River Watershed," with the assistance of the ~oming,
Idaho, and utah state water pollution control authorities. Included in
this report was a description of the area and waters involved, data on
stream flows, water uses, pollution contributed, effects of pollution,
and a discussion of the existing authority of the States of Wyoming,
Idaho, and Utah for enforcement of pollution control.
The principal pollution of interstate waters occurs on the Cub
River and its tributary, Horm Craele. Worm Creek receives partially
treated sanitary wastes from Preston, Idaho, and untreated beet sugar
refinery wastes from Franklin Sugar Company at Whitney, Idaho, near
Preston. Cub River receives untreated vegetable cannery wastes from
the plant of the California Packing Corporation at Franklin, Idaho,
just a mile upstream from the Idaho-Utah state line. '!hese streams
join after no'Wing a short distance separately in northern utah, and
the Cub joins the Bear from the east ten river miles below the Idaho-
Utah state line.
The report of the Public Health Service also included some cursory'
observations on effect of pollution by erosion silt and a brief discus-
sion of the fisheries. ~·lith regard to the fisheries, it was indicated
that the lower Bear is used principally for "rough" fishing: channel
catfish and carp. Downstream from the Idaho-Utah state line a few rainbow

and brown trout have been found in recent years, but the sharp decline
of the sport fishery over the past 20 years has been attributed largely
to the heavy burden of silt which is carried by the Bear and deposited
in pools and riffles.
In November of 1953 an extensive "fish-kill" in the lower Bear
River was attributed to the detrimental effect of beet sugar mill wastes
from the refinery at Garland, Utah. At that time a combination of cir
cumstances brought about complete exhaustion of d:i.ssolved oxygen over a
large flowing segment of the lO'wer Malad River and the Bear IUver and
virtually destroyed a valuable channel cat fishery as "lell as some
marketable carp. The Utah Department of Fish and Game investigated.
the situation as it progressed and has prepared a report. of its findings.
The department conservatively estimated the loss in the one "fish-kill"
at $10,000.
Since the er.actment of comprehensive water pollution eontrol legis
lation by the State of Utah in 1953, steps have been taken by the Utah
Department of Public Health to determine the extent and effect of pol
lution from imdustrial and sanitary waste sources. The State of Idaho,
Department of Public Health, has cooperated in a study of the interstate
problem of the Bear River System, and together the two states have under
taken a series of surveys to determine volumes and strengths of the
various .Tastes discharged and their effect upon the receiving streams.
The biological investigations were undertaken in order to provide in
formation on the effect of' pollution upon the aquatic life includlng
algae, aquatic plants, fish ane. fish-food organlsm5. The findings are
utilized to detect and mp.aGl~e pollution during the vegetable canning
season i" August and again during the season of beet sugar refining in
-2-

November. The effects of heavy siltation in the Bear River upon the
capacity of this stream for natural purification of wastes and upon fish
and fish-food organisms are also discussed.
The field surveys ,·,ere conducted by Biologist John N. Wilson and
Sanitary Engineer i-lilliam B. Schreeder. Dr. Arden R. Gaufin, Professor
of Zoology, University of Utah, provided valuable assistance on the earlier
survey, which is gratefully acknowledged. In conjunction with the second
survey of November 1954, the Utah Department of Fish and Game conductea a
fish population study in the Utah portion of the Bear River. Mr. Marion
Madsen, Chief of' Fisheries DiviSion, State of Utah Department of Fish and
Game, detailed ¥x. William McConnell, Field Projects leader, and his as
sociates Messrs. Neuhold and Clark to participate in ~he investigation.
-3-

SUMMARY MID CONCI11 SIONS
1. The results of two investigations involving the interstate
waters of the lower Bear River Basin in Idaho and utah are presented.
The sections of streams under stucV included the lower ninety-two miles
of the Bear River, the lower twenty to twenty-five miles of Malad and
Cub Rivers" and the lower nineteen mUes pf Worm creek, tributary to the Cub"
2. Both of the investigations were at times of low now in the
streams. The earlier, from August 8-17, 1954, was at the time of bean
pack at the California Packing ComparJiY', Franklin, Idaho, on the Cub River
just upstream from Idaho-Utah state line; and the later study of
November 8-12 was made while the three sugar refineries, Franklin Sugar
Co., Whitney, Idaho; Amalgamated Sugar Co., Lewiston, Utah; and utah and
Idaho Sugar Co., Garland, Utah; were in operation.
3. A critical situation of erOSion on tributaries west of Preston
has caused heavy sUtation in the bed of the Bear River for many miles
downstream. Bottom scouring" filling of pools and smothering of rUnes
have been responsible to a great extent for deterioration of the trout
fishery over the past thirty years. steps have been taken to correct
the si tua tion.
4. Sources of organic pollution are ma.IlY ani the aggregate BOD
loading in the fom of imustrial wastes discharged to the racei ving
waters is thirty times that of the municipal sanitary wastes. Less than
half of the total sewered population in the basin of the Lower Bear has
adequate treatment for its wastes. Ninety-two percent of the industrial
wastes are from sugar refineries, 7.5 percent from two vegetable can
neries, and the remainder from cheese factories, meat packing establish
ments and the like.
~-

5. These streams drain areas with calcareous deposits and are
therefore high in alkalinity. The Bear River at B-92 and the Malad
River have extremely high alkalinity--more than 300 ppm--the Cub River
and Worm Creek have lower alkalinity. From the standpoint of turbidity
from inorganic causes, the Cub was the clearest, the lower Bear and
the Malad the most turbid. Turbidity in Cutler reservoir and in the
lower Bear in August was caused partially by phytoplankton.
6. In August, dissolved oxygen concentrations under 5 ppm were
found below the cannery at Franklin, Idaho, on the Cub River. In
November, depletion of dissolved oxygen was found in the lowermost ten
miles of Cub River and the lower five to six miles of Worm Creek.
Although low water temperatures delay decomposition of sugar mill wastes
along the main stem of the Bear, dilution was not sufficient to fore
stall an oxygen sag in Cutler reservoir. The increment of untreated
sugar mill waste from the Malad River augments the organic loading in
the lower Bear River and creates a precarious situation for fish and
other aquatic life.
1. Phytoplankton in the Bear River below Preston, Idaho, is
limited by the screening effect of high turbidity. Plankton in the
upper Cub River and Worm Creek is largely composed of normally attached
forms which have been detached a~d carried downstream by the current.
In the lower reaches of the Cub plankton blooms develop each year. The
responsible organisms are tolerant to pollution and some of the same
species are to be found in tanks and filters of sewage treatment plants.
8. The Bear River from Preston, Idaho, to Cutler reservoir is
a virtual biological desert insofar as bottom life is concerned. This
-5-

is attributed primarily to the excessive siltation with attendant effects.
Below Cutler reservoir, siltation is still serious and pollution is severe
in late fall, but some fonns of bottom life with short life cycles are
able to surn ve.
9. Cub River and Worm Creek support good populations of aquatic
invertebrates in their upper and middle reaches, but gross pollution in
the lower 10-15 miles of each stream limits productivity and eliIninates
all but the most hardy species.
10. The trout fishery in the lower 92 miles of the Bear and the
lower stretches of the tributaries has been virtually eliminated by
organic and inorganic pollution. The successful re-establishment of a
channel cat fisher,y in the Bear River below Cutler dam is contingent upon
control of stream flow and of the seasonal. pollution.

SOURCES OF POLWTION
S:Utation
The 1952 report of t he Public Heal til Service includes a brief
statement on the serious problem of erosion on ttFive-Mile ft and "Deep"
Creeks llest of Preston. 'lhase streams enter the Bear from the west at
m:Ues 88 and 90, respectively. The erosion has been caused by irriga
tion practices which have raised the water table and caused seepage from
embankments of the light" sandy deposits overlying impervious clay strata.
According '00 H. A. Einstein, consul ting engineer retained by the
utah Power and Light Company for a study* on siltation of the Bear River,
in the years 1910-1950, 10,,000,000 tons of sarrly sediment have been
eroded from the tributary banks and washed into the Bear River. Bear
River channel is silted almost uniformly to a depth of 5-6 feet from the
profile of 37 years ago. Most of the material has come from "Five-l-1i1e lt
Creek and the maj or damage is downstream from this point 30 miles into
Utah to the Cub River pumping plant. Some of the sil t ha~ also settled
in Cutler reservoir" but only the finest material. has been carried beyond
the reservoir. As to particle-size" 80 percent has been found to be
between 0.1 and 0.3 millimeters" which is fine sand, readily settleable.
Organic Pollution
The report of 1952 contains a detailed table of pollution sources
which includes BOD population equivalents" treatment needs and current
status of municipal action. The followmg table (1) is an abridgement
of the original With only the more Significant oources listed. Moreover,
changes in status of treatment over the last two years are included.
* Report on fUe in the office of the Soil Conservation Service" Portland, Oregon.
-7-
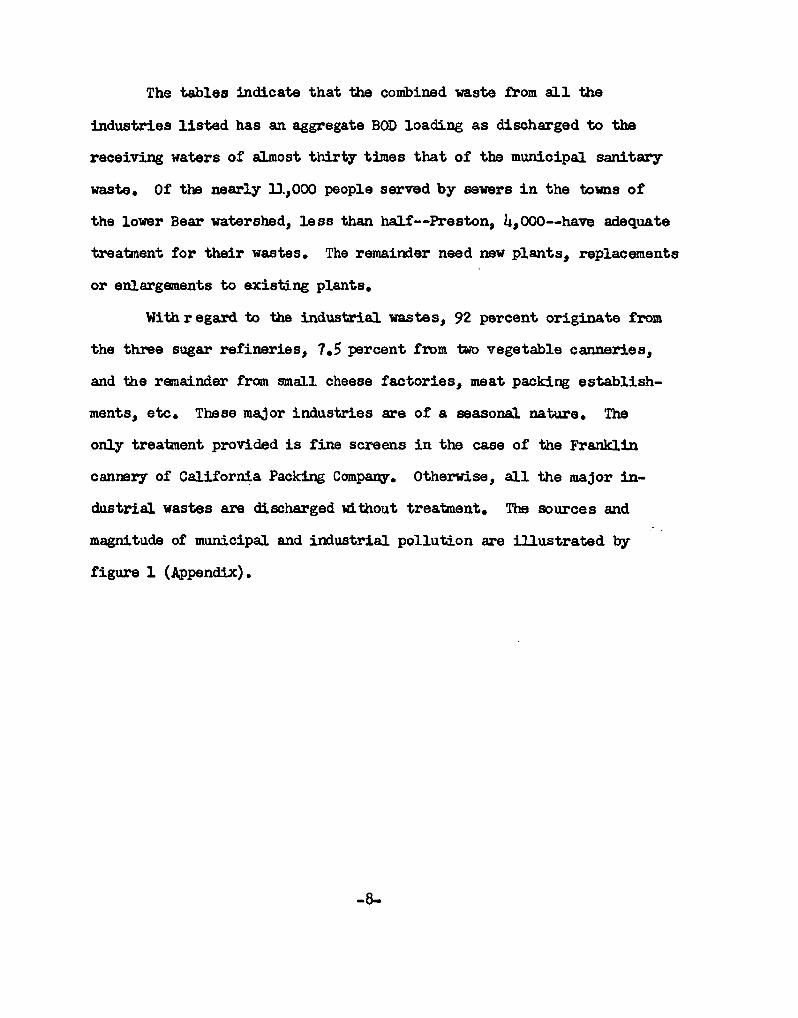
The tables indicate that the combined waste from all the
industries listed has an aggregate BOD loading as discharged to the
receiving waters of almost thirty times that of the mWlioipal. sanitary
waste. Of the nearly ll.,OOO people served by severs in the towns of
the lower Bear watershed, less than half--Preston, 4,OOO--have adequate
treatment for their wastes. The remainder need new plants, replacements
or enlargements to existing plants.
With regard to the industrial wastes, 92 percent originate from
the three sugar refineries, 7.5 percent from two vegetable canneries,
and the remainder from small cheese factories, meat packing establish
ments, etc. These major industries are of a seasonal.. nature. The
only treatment proVided is fine screens in the case of the Franklin
cannery of California Packing Company. Otherwise, all the major in
dustrial wastes are discharged wi. tnout treatment. The sources and
magnitude of municipal and industrial pollution are illustrated by
figure 1 (~pendix).
-8-

Name and
Location
Bear River Cache Valley Dairy Assn, Amalga, Utah
Calif. Packing Co., Smithfield, Utah
Cub River
Type Industry
Food
Food
~ Calif. Packing Co., Food I Franklin, Idaho
Amalgamated Sugar Co., Food Lewiston, utah
Sego Milk Co., Food Richmond, utah
worm Creek Franklin Sugar Co., Food Wh1tney, Idaho
Malad River Utah By-Products Co., Food Garland, Utah
Utah & Idaho Sugar Food Co., Garland, Utah
Allen Meat Co., Food Tremonton, Utah
TABLE 1 BASI~ DATA ON SOURCES OF n~DU3'I'R!iu. rOLLlll'IOr:
(Bear River ~.[atershcd - Prestor. to Great Salt Lake)
Type ~.;raste
Produced
Organic
Organic
Organic
Organic
Organic
. Organic
Organic
Organic
Organic
Treatment or Other Pollution Control Neasure
Degree Cap':,.' Opr.
None
Minor Undet. Undet.
None
Minor Undet. Undet.
None
None Undet. Undet •
Hi nor Undet. Undet.
Minor
None
P.E. (BO::)) Pnllutil"Jn Discharged Abe:t.emer;:t to Streams I'; ,2 r:; us
2,400 :k~w plant
35,200 Unu.ct.
Curr'.=r,t Act-jon
Hone
None
11,800
208,000 Undet. None
2,260
212,000
130
20C,OOO
NC\f plant Hone
::.<:nlargement
Undet.
Undet.
Eel'! plant
None
Hone
Hone
Re(!ej~-\rJ.ng
.:3tre:1lf.
Bear R:i.v.
Bear Riv.
::::ub iUv.
Cub H~.v.
Cub ~\::.v.
Naluct R::.v.
Iv1al:;.d Hi v •
Malad Hiv.

TABLE 1 (conttd) BASIC DATA ON SOURCES OF MUNICIPAL POLLUTLrnN
(Bear River Hatershed - Preston to Great SaltLak'€)
Name Population P .E. (BOD) Haste P.E. (BOD) 'fi'ea1bmemrtt :Receiving and Served by Untreated Treatment Discharged lmeeiBs Stream
Location Sewers :Tastes Provided to Watercourse*
Bear River City, 100, 100 ~!one 100 ll'lfewr p:lli!n:.lrlrlt Bear River Utah
Corinne, Utah 500 500 None 500 .ll!eiw pJl.amrlt :sear River
Lewiston, Utah 500 500 None 500 ll'lfew.r pJl;m;nrtt Cub River
Pre(3ton, Idaho 4,000 4,000 Primary 2,600 1llrome ilim'110 Cree}
~ 0
Garland, Utah 900 900 None 900 JmewT ]pi.b.mrtt .lad River
• Bear River High 1,200 600 Septic tank 550 &pJl.aiee Malad River School, Utah
Tremonton, Utah 1,600 18,000 Septic tank 17,850 Bejp>Jl.aiee ~ River
Malad, Idaho 1,900 1,900 Primary 1,425 IB:!rJJJlm:'ge Deep Creek to OOalad itlver
*Includes industrial waste discharged into municipal sewers.

Nethods
Physical and chemical analyses at the various stream sampling
points ,,,ere made in accordanc~ with "Stand.ard Methods for the Examina
U.on of i-later and Sewage," 9th edition. A limited number of "dwarf"
plankton or nannoplankton samples were collected, preserved by the
addi tion of concentrated formalin, and. concentrated by means of a
Foerst type continuous centrifuge. 'The other planl~ton samples ,"'ere
qualitative. They were collected by means of 2. ;;'-':>'0 mesh silk bolting
cloth tow nct. Duration of towing periods was three minutes in each
instance, but variations in velocity of flow precluded quantitative
determinations.
QuanUtative samples of bottom fauna ,",ere collected in pool.s
and slow runs by using !Ekman or Petersen dreo.ges, depending upon
firmness of the bottom. Riffle samples were collected h.y means of the
square foot bottom sampler ,-,ith #38-mesh trailing net. Qualitative
collections ,",ere made 'vi th a 40x30 inch, 38-mesh reconnaissance screen.
Fish collections were by la-foot seine with one-quarter inch mesh.
Wherever feaSible, adult winged insects were collected from bushes and
other vegetation near the \-rater's edge by means of a beating net. The
designation of sampling stations is based upon river mileages measured
from the mouth of each stream in question. Table 2 shows the stations
from ,"hich collections were made for the biological investigations.
-11-

Previous Sta. No.*
bear River
B-31
B-33
B-32
B-25
NaIad River
B-30
Cub River
B-27 16
11
B-28
B-26
Worm Creek
10
5
3
TABLE 2 RIVE..-q t·IILEAGES AND STATION LOCATIONS
Jta. rIo. Based on Ri ver ~1li1eage above Stream Mo.
B-12 17
B-40.5
50 B-55
62 ·72 80.8 88 90
B-92
1-1-11 14
101-22
C-1.5 C-IO C-12
13.5 C-19.5
20 C-21
C-25
W-2 7
w-B 15
W-17 W-19
Location
Bridge on U.S. Hwy. 30S at Corinne, Utah 1~lad River enters Cutler Dam--sampling point immediately below dam. Little Bear River enters Bridge west of Smithfield, Utah Cub River enters Idaho-Utah State Line Weston Creek enters from west Five Mile Creek enters from west Deep·Creek enters from northwest Bridge on U.S. Hwy. 91 north of Preston-Upstream control station.
Tremonton, Utah Garland, Utah Upper control station; 2 miles north of Riverside, Utah.
Hodges Road Bridge southwest of Merrills, Utah Above Lewiston Sugar Mill Worm Creek enters Bridge west of Franklin, .Idaho California Packing Co. First upstream control station; above Franklin Second upstream control station; Mapleton, Idaho
Fairview crOSSing Franklin Co. Sugar Mill Preston sewage treatment plant Lower end of Worm Creek Reservoir First bridge above Worm Creek Reservoir Upstream control station; lower end of canyon
*Used to designate stations on 'rabIes 3 and 4 which originally appeared in trip reports. All subsequent tables employ station numbers based on stream mileages.
-12-

Physico-Chemical Features (See Tables 3 and 4)
Bear River in November was roughly 50 F warmer in its lower
reaches than above Preston because of higher turbidity and discharge
of warm wastes. The highest (720 F) temperatures recorded in August
were at B-92 and M-22. The lowest (59°F) temperature was at W-19.
Turbidity in November was less than 7 ppm at the upstream
control stations on Bear. and Cub Rivers, W-17 on Worm Creek, and
above and below Franklin on Cub River. The latter represents con
di tions v.i th the California Packing Co. shut dOim fOlO i'.he season.
The highest turbidity found was 2000 ppm immediately below
the sugar refineries at W-IO and M-ll, Worm Creek and Malad Rivers,
respectively. Turbidity in the Malad above Garland at M-22 was higher
than the Cub below Franklin Sugar Co. or the Bear at Corinne. This
is attributed to erosion and other pollution from the upper Malad basin.
In August, the uppermost stations on the \{orm and Cub were the
only stations with turbidity so low as to be immeasurable on the tape.
The effect of the cannery at Franklin, which was processing green
beans at that time, ''las shOim by turbidities of 68 ppm at C-19.5 and
80 ppm at C-I0. Both of the stations on the Malad River had high
turbidities in August despite the inactivity of the sugar mill at
Garland-- 170 and 180 ppm-- but the Bear River at Corinne was higher
still with 200 ppm.
The high methyl oranGe alkalinity at B-92 on the Bear and W-19,
Worm Creek, in November indicates high soluble salt content of the
soil formations and water strata draining to these streams. A comparison
-13-

of W-19 to W-17 in November shows a discrepancy in the analytical.
results fran these two closely spaced stations that cannot be interpreted
without further investigation. The marked increases in alkalinity at
W-2 and C-12 are attributed to wastes from the sugar refineries on Wonn
Creek and Cub River. However, the lower Bear River at B-12 indicates
only a 4 ppm increase in alkalinity in November over August.
Dissolved oxygen values in August approached the critical. range
(under 5 ppm) only at C-19.5 Where a test at 7:10 a.m. showed 3.7 ppm.
In contrast, there were several. sections of critical oxygen values or
actual depletion recorded in November" largely as a result of the beet
sugar wastes. Most seriously affected in thi s regard are the lower
reaehes of Worm Creek and the Cub River. Almost the entire lower ten
miles of the Cub lacked dissolved oxygen in November.
'!he Bear River below the entrance of the Cub undergoes a marked
sag in dissolved oxygen which, presumably, reaches a low point in Cutler
reservoir and then increases as the stream flows toward Corinne and the
marshes. Below the Cutler dam in the backwater stream" the dissolved
oxygen was 3.7 ppm on November 11 and 6.4 ppm at B-12 on that same date.
~pon conversion to percent saturation, these are 31 and 55 percent,
respectively.
-14-

TA3LE 3 Ph;yrsico-Chemical Results Det.ermined on Reconnaipsance of
Bear River System - Idaho-Utah - August 11-14, 1954
i'later J\.ir M.O. Phen .• Station Stream Da~~ Temp. Temp. Turb. D.O. CO2 A1k. A1k.
of of ppm pH ppm ppm ppm
B-25 Bear R. 8-11 72 e6 13 8.6 10.1 0 304 0
3 Horm Cr. 8.-11 65 70 50 8.2 7.1 +.5 132 0
5 Worm Cr. ['.-12 59 79 0 8.4 10.6 14.0 ._* ,0 .7
10 Worm Cr. 8.-12 67 84 55 8.4 9.4 2.0 --* 0
B-26 Cub R. •
e-12 61 85 0 8.6 8.5 0 --* --* ..., 'r B-27 Cub R. 8-12 66 84 80 8.6 4:45 pm 9.25 5 --* --*
B-28 Cub R. 8-13 70 81 16.5 8.5 7:30 am 7.5 0 --* --* 1:00 pm 10.6
11 Cub R. 8-13 62 63 68 8.2 7:10 am 3.7 . 4.0 --* --* 9:00 am 4.15
B-29 Malad R. 8-14 72 84 170 8,6 6.7 14.0 330 0
B-30 Malad.R. 8-14 70 86 180 8.4 8.0 15.0 385 0
B-31 Bear R. 8-14 70 84 200 8.4 9.4 4.0 330 0
*Not determined - ran out of O.02N sulfuric acid for titration.

TABLE 4 Physico-Chemical Results Determined on Reconnaissance of
Bear River System - Idaho-Utah - November 9-12, 1954
Temp. of M.O. Turb. D.O. CO? Alk.
Station No. Stream Date Time H2O Air ppm pH ppm ppm ppm
B-25 Bear R. 11:;'9 8:00 am 40 40 0 8.4 9.3 0 350 3* Worm Cr. 11-9 10:15 am 38 46 0 8.2 11.8 2.5 157 5* Worm Cr. 11-10 11:00 am 40 54 55 8.4 11.3 6. 369
10* Worm Cr. 11-10 9:15 am 50 44 2000 7.4- 0 30. 750/
B-26 Cub R. 11-9 1:00 am 42 62 7. 6
0 8.8 12.3 0 172 B-27 Cub R. 11-10 2: 35 pm 52 56 110 7.4 0.8 14. 364
B-28 Cub R. 11-9 2:50 pm 45 60 0 8.6 17.7 0 248
~ 11* Cub R. 11-9 4:45 pm 40 37 0 8.6 13.7 0 250 16* Cub R. 11-10 10:15 am 48 50 90 7.4 0 20 500i. B-32 Bear R. 11-11 10:45 am 48 58 32 8.6 8.8 0 364 B-33 Bear R. 11-11 2:35 pm 47 58 .. 8.4 3.7 8 312 B-31 Bear R. 11-11 5 :25 pm 48 60 -** 8.4 6.4 -** 334
B-29 Malad R. 11-12 10.:30 am 52 52 75 8.4 8.3 0 -*** B-30 Malad R. 11-12 9:25 am 54 50 2000 8.6 4.1 0 396
* Stations established on former investigation by Utah and Idaho Health Departments.
** Too dark to make satisfactory determinations. *** Excessively high-color interference.

BIOlOGICAL FEATURES
Plankton
A limited number of plankton samples were collected in August 1954
from the Bear and Cub Rivers; a larger number of samples were collected
in November. Table 7 (Appendix) shows the results of the four tow net
hauls of August ;from widely separated stations on the Bear River and
from above and below major sources of pollution on the Cub River.
The microscopic examination of water for the determination of
plankton was undertaken for two principal reasons: (1) To detect and
measure pollution through the use of indicator organisns among the
plankton" and (2) recognizing the importance of plankton in the aquatic
food chain which culminates in fish, a study of the plankton leads to
a better understanding of the deleterious effects of h~h turbidity
and pollution by organic wastes on aquatic life.
Plant plank tons were predominant in the Bear at the upstream
control station~ B-92, but animal plankton supersedes the plants in
the lower reaches of the Bear as shown by the results at B-12. This is
attributed to adverse effects of turbidity which screens out the sunlight.
'!he minute animal plankters at B-12 were largely rotifers which are a
little larger than most single-celled protozoans. Most abundant were the
members of the genus Brachionus, a group which tolerates organic pollution.
There were nine genera and species of rotifers found at this station--the
most varied group of animals found a.zvwhere on the river system.
The clearer waters of the Cub River in August supported a more
nearly balanced fallna al d nora. The short time of flow from the head
waters to station C-2l above Franklin prevents development of many arrimal
-17-

plankters which have longer life histories than the plant plankters. Thus it
is seen that the predominant organisms at C-2l are diatoms (plants), but at
C-10 near Merrills, Utah, twelve kinds of-zooplankters (animal) have entered
the population in this eleven-mile distance of stream. There has also been
an increase in numbers and species of green and blue-green algae. Additions of
treated and untreated sanitary and industrial wastes from Franklin and via Worm
Creek to the lower Cub are also responsible for the ~arked change in the plankton
seen at C-10 and C-l.5. Most noteworthy of pollution tolerant organisms are
Pediastrum Boryanum, a green alga, Oscillatoria ~., blue-greens, Brachionus
calyciflorus, a rotifer, and Trachelomonas volvocina, a minute "whip-bearer" or
flaeellate protozoan. Oscillatoria and the latter flagellate are commonly found
residing in the upper part of sewage plant trickling filters.
The results of the tow net samples for August and November are summarized
in Tables 8 and 9. The former represents the main stem of the Bear, the latter,
the tributaries. Out of the total of 56 genera and species found in all samples;
11 or 12 of the more common and consistently occurring organisms are presented
in the tables.
The normal increase in numbers of diatoms expected in autumn is shown at
B-92 on the Bear. This is in response to the lowered temperature ~hich favors
diatom growth. The effect of pollution on the Cub and Worm with particular
reference to wastes from the sugar refineries is clearly indica~ed by the oc
currence of sewage fungi and zoogloeal colonies in all samples which were col-
lected below the major sources of these refinery wastes. Attention is directed
particularly to stations w~8, C-l.5 and M-22 on Table 9 and B-55, B-40.5 and
B-12 on Table 8.
Although the heavy concentration of beet pulp fragments at C-10 on the
Cub River and at W-2 on Worm Creek prevented successful collection of tow net
samples, observations and the collections of bottom fauna indicated extensive
growths of sewage fungi and zoogloeal at these stations. The tow samples at the
other stations far~her downstream represent masses ~f these bacteria and
fungi that were drifting downstream.
-18-

The fungi, normally, grow attached to some object or to the bottom and
slough off into the current as th~ir rap~d growth proliferates the
colony mass to the point where it can no longer wi. thstand the pull of
the current.
Experience has also shown that Sphaerotilus ~, sewage fungi,
can grow in very low concentrations of certain wastes, particularly when
there is a sui table ratio between carbohydrates and protein-runino acids.
The occurrence of these fungi and zoogloea in plankton samples from the
Bear River at B-55, at B-40.5 below Cutler dam,and at Corinne, Utah (B-12)
in November (Table 10), bears out the field observations made at that time.
It was noted that samples of river water from these stations foamed actively
when agitated and emitted the sweetish, acrid odor of sugar wastes.
Pollutional &limals and plants such as Paramecium ~, other ciliate
protozoa, and Euglena viridis followed a pattern of occurrence simd1ar to
the sewage fungi and zoogloea. Although the rotifers of the genus
Brachionus were also tolerant to pollution, the colder water temperature
had caused many of them to become dormant as "winter eggs. II This is a
normal occurence and is not attributable to the seasonal pollution of the
streams.
Bottom Fauna
All living things are sensitive to changes in their environment.
~h~~ges in food supply, light, dissolved eases, and cheDrica1 substances
in the aquatic environment affect plants 2nd alumals living free in the
water, attached to, or living on or in the bottom depositse Characteristics
-19-

of, and changes in, an aquatic environment may be evaluated by making
chemical and physical tests of the \Yaters. fnowing this, it is possible
to predict the type of organism8 that may occur. Conversely, a know-
ledge of the living organisms which occur will permit a classification
of the environment.
By the process of sedimentation, silt and debris are constantly
being deposited on the bottom. In the case of organic matter in polluted
streams, this sedimentation process shifts the scene of natural purifica-
tion from the water to the stream bottom, where decomposition is continued
and scavengers begin their work. The organisms Vihich find the envirorur:ent
favorable will serve as an index to the condition of the stream. Other
org~nisms, less tolerant to resulting lowered oxygen content and possible
presence of toxic substances over the deposts, will either migrate or die.
The ecological system of Kolkwitz and l:1arsson as presented by Fair and
'Whipple in their "Microscopy of Drinking Via.ter" (1927) was used as a
basis for the interpretations Which follow.
The resul ts of analyses of bottom fauna are presented in
Figures 2 and 3 and Tables 11 through 14 in the appendix. Tables 11 and
14 present the results of tests in riffles; 12 and 13 are results from
pools and runs. Differentiation of these types of samples is also made
on the maps by means of appropriate labels on the pie diagraLls. Owing to
high flows in the Bear River in August, qumltit2tive collections from
Sta .• B-92 were impractical. Results from this upstream control statj.on
are there.fore based. on collections made in November. The pie dia~TaI'JS on
V\orm Creek in August are based upon quali tati ve da.ta. providtld by Gaufin,
-20-

hence the proportions of pollutional to facultative to clean organisms
are approximations.
Bear River, 1~ Stem: (Tables 11 and 12 and Figure 3) - The
composite of the riffle samples from B-92 in November indicates productivity
in Grade 1 class (rich)* with 2.13 graIns of organisms per squartr-l~ot.
There were only 2 percent pollutional organisms and 13 species, genera or
families of organisms. This indicates a healthy, clean environment. In
contrast, the downstream sampling points on the Bear demonstrate the
adverse effect of inorganic and' organic pollution. Productivity drops to
a trace at Smithfield (B-55) and at Corinne (B-12); speciation or numbers
of kinds of organisms drops to 2 - 4. Effect of organic pollution from
the sugar refineries is shown at B-55 and B-12 in November with 80 and 63
percent pollutional indicator organisms respectively.
Malad River: (Table 12 and Figure 3) In November the Malad
River at M-22, the upstream control point, indicated low productivity,
li ttle diversUication of organisms and less than one-half of the organisms
pollutional-tolerant. This is attributed to the rigorous environmental
condi tions of high turbidity, unstable mud and silt bottom, and very high
dissolved salt concentration of the water. Addition of beet sugar refin-
ing wastes at Garland with attendant sludge deposits downstream creates
condj tions ~ich are satisfactory for growth of large numbers of sludge
worms and a few midges. Total productivity is avera.ge wi th 1.6 grams per
square foot; speciation is of low order with cnly two kinds of organisms
and 98.5 percent of these in the polluticnal category.
*Davis, H. S. "Instructions for Conducting Stream and Lake Surveys", Fishery Circular No. 26, U. S. Department of Commerce, Bureau of Fisheries, 1938.
-21-

Worm Creek: (Figures 2 and 3, Table 11) Because of water
storage in Glendale Reservoir imreediately below W-l7 and irrigation
diversions, flow in Worm Creek during the late summer and fall is
practically nil above the Preston sewage treatment plant. Flow at
W-2 in August therefore is compo~ed largely of the partially treated
sewage from Preston plus some irrigation return flows.
Reference is made to the field observations (Tabl& 6) in relation
to the upstream control station W-l7 and W-l9 on the Worm. In November
large numbers of stonefly qymphs were found at W-11. These are good
examples of clean water organisms. The large component of pollutional
organisms in the August sample from W-B (above treatment plant) ~s
attributed to the heavy deposits of deca,ying organic matter washed from
the land.
The so-called riffle at W-2 is a stretch of uneven hardpan clq
over which the water moves rap1~. Attachment surfaces in this reach
for most bottom fauna is presumed to be unsatisfactory. The results which
are reported for August and November indicate gross pollution in Worm
Creek wi thin one and a half miles of the Idaho-Utah line. In August the
conditions found. at W-2 are attributed to low flows, irrigation returns
and primary effluent from the Preston sewage treatment plant. In November
the increase in volume of flow and pollution load from the sugar beet
refinery at ~bitney, a short distance south of Preston, causes such severe
scouring of the bottom that samples of bottom fauna are not entirely
satisfactory. .Aside from a few specimens of damsel fly nymphs which had
probably been washed down from some upstream point, the only bottom organisms
found were a few pollution-tolerant sludge worms, Limnodrilus ~.
-22-

Cub Ri. ver: (Figures 2 and 3, Tables 1.3 and 14) - Results of
bottom faunal collections indicate clean stream conditions above
Franklin, Idaho, 'With some modification of natural stream conditions
from irrigation diversion. Stations 0-25 and 0-21, the tllO upstream
control stations, had rich growth in the riffles with up to 8.0 grams
per square foot at 0-21 f~~ 2.0 grams minimum at 0-25.
Speciation 1mS high with largest number of kinds (15) found at
0-25. There were insignificant numbers of pollutional organisms. The
73 percent of pollutional organisms from the pool at C-21 represents
scavengers that were feading on the decaying algae, fertile soil waSh,
and other organiC matter settled in the pool at this station.
The results of bottom faunal tests at C-19.5 in August reflect
the serious condition of pollution in the Oub River below Franklin.
Percent of pollutional indicator organisms increases in the riffles from
a maximum of 3.25 above Franklin to , 00 percent below Franklin.
Speciation decreases from 15 to 2, maximUDt range, while total numbers of
organiSms increase by" nearly a thousand, 2714 - 3488. Most of the in
crease at C-19.5 is made up by red midges and sludge worms. A siILilar
situation exists in the pools at these two stations in August, but with
lower productivity in the pools. Total numbers of red midges and sludge
worms in November at 0-19.5 was nearly doubled over numbers in August -
8550 per square foot.
The continued indication of severe pollution in NovEmlber at this
station was caused by lingering sludge deposits from the operation of
the California Packing, Plant in the late summer and early fall.
-23-

Stream conditions at 0-10 in August indicated partial reoovery
from pollution by cannery wastes, particularly in the rifnes. The
pools at C-IO in Au&~st contained principally red midges and sludge
worms, indicating decaying organic matter fran upstream sources. Re
covory in the riffles is sho1'ln b,y moderate speciation (10 kinds) and
only 6 percent pollution-tolerant organisms. TOJial p~oductivity was
low - 0.85 gm.. per square foot - owing to the "pollutional blanket"
of blue-green algae.
In November the combined. wastes from beet sugar mills at 'Whitney,
Idaho, and Lewiston, Utah, in addition to Preston's treatment plant
effluent and other minor sources, produce severe and rigorous conditions
of existence for bottom fauna at 0-10. As indicated in Table 6, the
flow was so high and fast that this reach resembled the tail race of a
power plant. Violent agita.tion and short-time of flow from major
pollution sources allow for a trace of dissolved o~gen to be present
in the water. Consequent~ a few scuds (2 species) were found to survi~e.
Sludge woms were also found in small numbers. There were only 3 kinds
of argani8mS in trace weight concentration per square foot at this station.
Fish
Despite the wide fluctuation in flow of the Bear ru ver above
Preston, trout fishing is reported to be excellent from above Preston
to the dam at Oneida. Below Preston the extremely heav.y siltation of the
river bed, the high turbidit,y of the water over the past 20-30 years, and
pollution have eliminated the trout. A few trash fish, such as carp and
-24-

catfish, have been reported from Pr~ston to Cutler reservoir, but a
fish population study in the' f-all.- of 1954 by the Utah Department of
Fish and G81I'Le has i.ndic8.ted an absence of fish of any kind at Station
B-55, Smithfield, Utah, and only a few carp below Cutler Dam. The
resul ts of these investieatior~ in November 1954, on the Bear and 1liialad
Rivers are presented in the following table:
TABLE 5
Stream River Station Seining Shocking
Besr B-5S 0 0
Bear B-40.5 4-5 carp
Malad M-22 0
Malad M-ll 0
Rotenone Poisoning
o
o
o
The stream shocker was of the direct current t~~e with an aluminum
boat utilized as one of the two electrodes. The shocker failed to function
in the :'~alad because of the high concentration of dissolved salts; therefore,
rotenone po:!.sor~ was used as a means of determining the population.
The Malad at M-22 had a fair-sized population of mosquito fish,
Ga'T,busia, in August, but for some reason these Ii ttle fish had migrated
from thE> area by late fall.
With regard to the other tributaries, Cub River eIlo. Worm Creek. the
Cub above lJapleton, Idaho, is reported to have mediocre trout fishing des-
pite the high fertility of the wat.er and abu.."ld~:.t production of fish food
orga~sms. The pools in the Cub above FranY~in support large populations

of minnovls, but no sport species were found in August or November. A
few species of minnows and some small c~ were collected below Franklin
in November and in August. No fish were found in the lower Worm at W-2
in August, though this was at a time when effluent from the sewage plant
at Preston was the only major source of waste in the creek.
Discussion
'" Cold weather and low water temperatures alleviate the severe condi-
tions of pollution downstream from the sugar refineries. Water temperatures
. in November were in the range at which refrigerators are held; consequently" .. the septic water from the Cub River was carried a long distance down the
Bear River and diluted to such an extent that less "than a mile downstream
from the mouth of the Cub" or mUe 61, the Bear River showed a drop of only
0.2 ppm of dissolved oxygen under that at the Trenton station" mile 66. At
some undetermined point downstream, either above or in Cutler reservoir,
the dissolved oxy~an drops below the 40% saturation point and the zone of
degradation beginS, as downstream from the Cutler dam the oxygen was only
31% saturation. At another undetermined point downstream between mile
40 • .5 and mile 12, the sag curve rises past the 40% mark and partial. recovery
is presumed to take place.
A significant gap in our knowledge exists in that reach of the Bear
from the confluence of the Malad River to the Bear River marshes during and
immediately following the season of beet sugar refinery. The long delay in
natural. purification of untreated wastes from the Cub River, combined with
the increment of untreated wastes from the Malad, create a situation of
instabili ty in the aquatic environment. '!his is borne out by results of
-26-

the biological investigations in this section. Shoult th~ Utah Depart
ment of Fish and Game plan to rehabilitate the fishery in this reach, it
is recommended that a program of 24-hour sampling for dissolved orJgen
~,d biochemical oxygen demand be ~~dertaken at prescribed points along the
lower 40 miles of the Bea.r River during and i!nmediately following the
processing of sugar beets.
-27-

APPENDIX --------
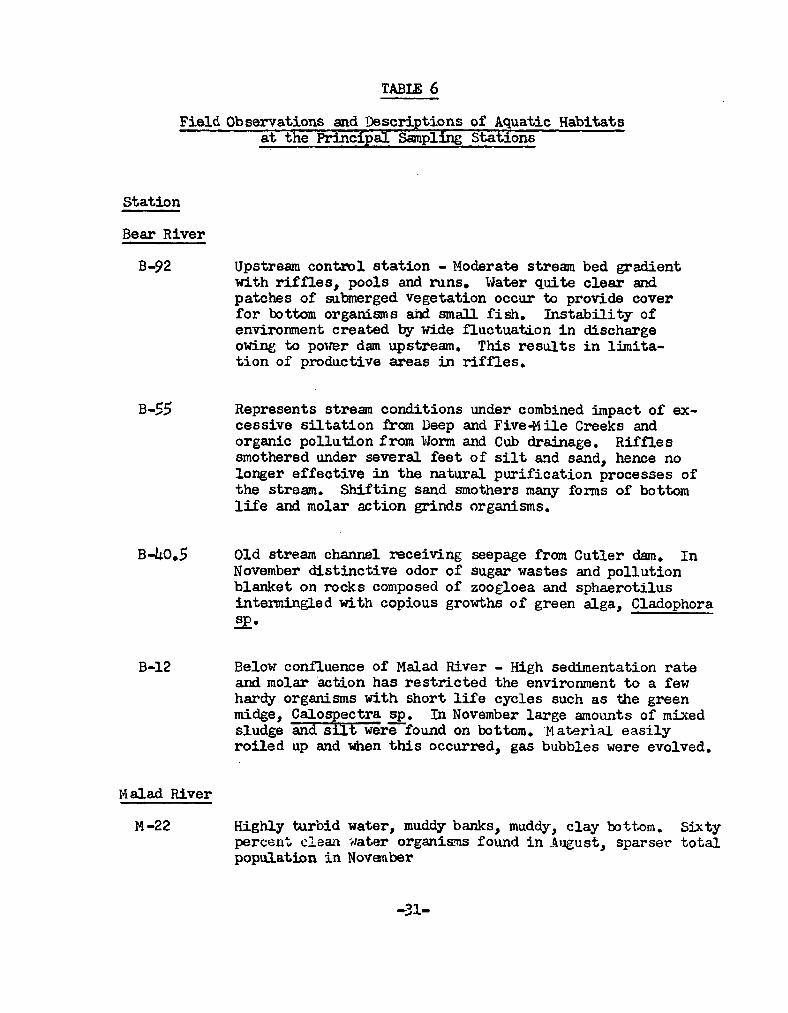
TABLE 6
Field Observations and Descriptions of Aquatic Habitats at the Principal SamplIng Stations
station
Bear River
B-92
B-55
B-4o.5
Upstream control station - Moderate stream bed gradient with riffles" pools and runs. \"later quite clear and patches of submerged vegetation occur to provide cover for bottom organisms am small fish. Ins tab ili ty of enviromnent created by Wide fluctuation in discharge owing to pOller dam upstream. This results in limitation of prodactive areas in riffles.
Represents stream conditions under combined impact of excessive siltation from Deep and Five~i1e Creeks and organic pollution from 1iJorm and Cub drainage. Riffles smothered under several feet of silt a."ld sand" hence no longer effective in the natural purification processes of the stream. Shifting sand smothers many forms of bottom life and molar action grinds organisms.
Old stream channel receiving seepage from Cutler dam. In November distinctive odor of sugar wastes and pollution blanket on rocks composed of zoogloea and sphaerotilus intermingled with copious growths of green alga" Cladophora ~.
B-12 Below confluence of Malad River - High sedimentation rate and molar "action has restricted the environment to a few hardy organisms with short life cycles such as the green midge, CaJ.ospectra Bp. In November large amounts of mixed sludge and silt werefoand on bottorn.M aterial easily roiled up and when this occurred" gas bubbles were evolved.
Ha1ad River
M-22 Highly turbid water" muddy banks, muddy, clay oott.om. Sixty percent clean ilater organi~ foand in August, sparset" total popul.atiDn in Novanber
-31-

(Table 6 - Continued)
Malad River (Cont'd)
M-ll Below sugar refinery at Garland" utah -Heavy growth of sludge worms up to 2 grams per square foot of bottom. No facultative or clean organisms found in November.
Worm Creek
W-19 steep gradient" rocky riffles, few pools, heavy brush along stream banks, almost impenetrable many places. There was much natural cover and although flow in November was estimated at less than 10 c.r.s. conditions of natural food and cover appeared ideal for trout.
W-17 Above Glendale Reservoir - Farming of the hilly land has caused erosion and resul~~t silting of pools and riffles. Therefore" only fair productivity and low organic enrichment in Worm Creek this station.
\'1-8 Above Preston treatment plant - Typical" slow-moving valley stream with less flow in A~ust and November than at W-17 because of irrigation diversions. Water clear but decqing organic matter lay in pockets on bottom. Margins were grassy and weedy.
W-2 Stream bed clay and hardpan" no rocky riffles. The stream flowed in a narrow trough liith steep banks 30-40 feet in height. There was much overhanging vegetation. Aquatic weed beds, Pot&nogeton sp., occurred in shallow areas. During sugar refining season this reach is a swift sluicewa:y of concentrated waste scoured clean of aquatic plants and bottom organisms.
Cub River
c-25 Mapleton, near lower end of Cub Ca.Yl.yon - Stream about 50 feet 'Wide and of variable depth, from a few inches over rocky ledges to several feet in the pools. Gradient is steep over rubble bed. Willows line the banks.
-32-

(Table 6 - Continued)
Cub River (Cont'd)
C-21
C-19.5
C-I0
Low flow most of year owing to irrigation diversions above. stream gradient much more nearly flat than c-25. Shallow riffles nearly choked with trailing masses of green algae. Very heavy growth of bottom fal~na - caddis-flies, particularly.
Below Franklin - Stream gradient quite flat between this point and C-21, but steepens slightly to provide appreciable riffles at this station. Gross pollDtion observed during bean pack in August. Heavy sludge deposits lined the pools. A few scattered mayfly and dragon fly qymphs were collected along the stream margins where pollution effects m~ have been less severe than at midstream. By November, 19.5 indicated progress in recovery, but pools still had deposits of sludge With sludge worms in abundance. lhese with large mnnber of 2-3 inch crane fly larvae, Holorusia rubiginosa, and some snails grossed a total weight of 4l.~ grams per squ.are foot - a record for all collections on the Bear River System.
In August &lme recovery from bean cannery wastes accomplished in the 9.5 miles of now. Heavy "pollution blanket" of bluegreen algae and fungi coated rocks in riffles. Only organisms with short life histories found here. In November this station represents condition on Cub below both sugar refineries -Whitney, ldapo, and Lewiston, Utah. Flow was very fast - 5 feet per second - and sewage fungus streamed from bottom and submerged objects. Riffles observed in August were submerged in November. stream resembled a tail race from a po'tler plant.
-33-

A - Abu.'1dant C - Common o - O\!ca3ional
TA5T.E 7
Eear R2ver System Plankton - Res~lts of Tow Hauls
August 1954
H - Rare Pred. - Predorr~n~lt
Location
Organisms
Green Algae
large sp.). (small '3p.)
Actinastrum Aantzschi AnkistroeeSl!lUS i"alcatus CCSI:iBrium sp. Crucigenia sp. _ Pediartrum Bor~la1rum Peoisetrwn duplex ScenedesDlus quadricaud.a Sphaerocystis Schroeteri Spirog:,.Tasp
Diatc,ms Amphora ovalis Cccccr.eiE pediculus Cocconeis placentula Cocconeis sp. Cyclotellf'. sp. C:yr.;~t.(.lpleura soles. DiatOILe; vult'are Gm;::phor::emA ecuminatum Gyrl)~i gma sp. hte10~ira sppo N,'lvicl.l.1a Nitzsch:i.a spp. S;)rn(~d!'F.. sfJp. C:'>rJ::bc:la sp.
Pr:)J~(i~Ca
Cerati~ tirundinella Ludor1na els£~mE Eu£;ler;,a sp.
: Eem' River Above Below
. . Cub River : Above C-21 : Below C-10
Preston : }.:'altld R. Jet : Fra~lin : jo,ierrills
o o
o
o
c o c
c o c
c o ,.. v
C o o
o
-34-
c o c R R
0
0 0
C
o R
o
o
c
C
A
A ."1.
r" v
o
o
o R o
A c c
C
0
C
C
o
(Continued)

(Table 7 - Continued)
Organisms
Protozoa (Cont1d) Gymnodinium ap. Pandorina morum. Stentor sp. Trachelaruonas volvocina Vorticella sp.
Rotifers Asplanchna sp. Brachionus ant~aris B. calyciflorus B. capsuliflorus B. caudatus B. patulus B. quadridentata Bdelloid rotifers Euchlanis sp. Filinia longiseta Keratella cochlearis Pedalia sp. Polyartbra trigla
Other organisms Cladocera Bosmina sp. Daphnia sp. Nauplii Cyclops sp. Nematodes
: Location : Bear· Rl.ver : Cub River : Above' : Below : Above C-2l : Below C-lO : Preston : Malad. R. Jet: Franklin : Merrills
R
o
-35-
o R R
o c C o o
o
o R o
o R
R
R
C o
o
C
R
o o R
o
o
R o

TABLE 8 Summarized Results of Tow Net Plankton from Bear River
August and November 1954
· B-92 : B-55 : B-40.5 · B-12 · · Organism · . · . · B-ll . .
B-1I;: · 11-9; 11-11; 11-11 . Green Algae Spirogyra Cladophora
Diatoms Diatoma wlgare Cit A A C Melosira 0 A A Surirella
Protozoa Ciliates C Euglena viridis Paramecium
Rotiters Brachionus spp. C**
Other Sphaerotilus C A Zoogloea C A
*C - Common; A - Abundant; 0 - Occasional; R - Rare **Encystment or w1mter egg stage starting.
-.36-
0
C
11-11
C C-A
C C
A A
..... .......-~--I.:-. ....

TABLE 9 Summarized Results of Tow Net Samples from Bear River
Tributaries - August and November 1954
Organism : w-B C-21 C-l0 C-l.5 M-22
:11-10 8-13 11-9 8-12 11-10 11-12 . Green Algae Pediastrum Boryanum A Spirogyro sp. A
Diatoms A Diatoma vulgare C A 0 Navicula spp. A R Surirel1a spp. A Melosira spp. C C
Protozoa R Euglena viridis C Paramecium ap. C Trachelomonas volvocina C
Rotifers R Brachionus spp. C
Others Sphaerotilus 0 . '
A C Zoogloea 0 A
-37-
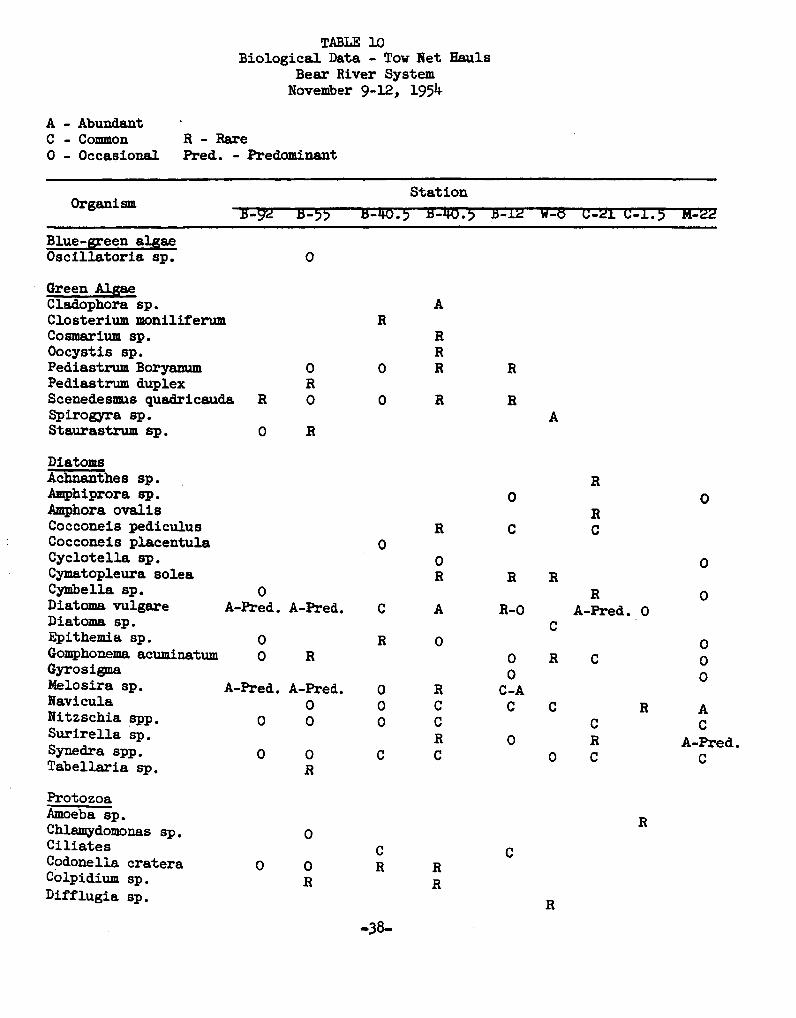
TABLE 10 Biological Data - Tow Bet Hauls
Bear River System November 9-12, 1954
A - Abundant C - Common R - Rare o - Occasional Pred. - PredomiD8.Dt
Station Organism
B-9"2 B-55 B-lro.5 B-2m.5 B-I2 ;-5 C-2I C-I.5 1'1-22
Blue-Eeen a!f5ae Oscillatoria sp. 0
Green Algae Cladophora sp. A Closterium moniliterum R Cosmarium sp. R Oocystis sp. R Pediastrum Boryanum 0 0 R R Pediastrum duplex a Scenedesmus quadricauda a 0 0 a a Spirogyra sp. A Staurastrum sp. 0 a
Diatoms Achnanthes sp. a Amph1prora sp. 0 0 Amphora ovalis a Cocconeis pediculus a e e Cocconeis placentula 0 Cyclotella sp. 0 0 Cymatopleura solea R a R Cymbella sp. 0 a 0 Diatoms. vulgare A-Pred. A-Pred. e A R-O A-Pred. 0 Diatoma sp. e Epithemi& sp. 0 R 0 0 Gomphonema acuminatum. 0 a 0 R e 0 Gyrosigma 0 0 Melosira sp. A-Pred. A-Pred. 0 R e-A Navicula 0 0 e e e R A Nitzschia .spp. 0 0 0 C e e Surirella sp. R 0 R A-Pred. Synedra spp. 0 0 e e 0 e e Tabellaria sp. R
Protozoa Amoeba sp. R Chlamydomonas sp. 0 Ciliates e e Codonella cratera 0 0 R R Colpidium. sp. R R Ditflugia sp.
R
-38-

TABLE 1a (cont'd)
Station Organism B-92 B-55 B-40.5 B-40.5 B-12 w-B C-2l C-l.5 M-22
Dinobryon sertularia R Euglena viridis C C C Euglena spp. C Euplotes sp. a Gymnodinium sp. R Pandorina morum 0 Paramecium sp. C Phacus R Pleuronema sp. a R Synura uvella R Vorticella sp. R R
Rot1fers a R Asplanchna sp. 0 Brach10nus angularis a C Euchlanis sp. a Keratella cochlear1s 0 a R Lecane luna R Polyarthra tr1g1a R
Miscellaneous Cyclops sp. R Nauplii R Sphaerotilus C A-Pred. A A-Pred. a A C Zoogloea C A-Pred. C A-Pred. a A
-39-

• ~ 0 I
Organisms
DiEtera - True Flies Tendipedidae
Green Simu1iidae Eriocera sp.
Ephemeroptera - Mayflies
ColeoEtera - Beetles Elmidae
LeEido~tera - Water Moths E10phila Sp.
Odonata - Dryon and Damsel Flies Enall.agpla sp.
Plecoptera - Stoneflies
Tr1choitera - Caddis Flies Brachycentridae Jbrdropsychidae
Crustacea Gammarus sp. Hyalella azteca
Oli~ochaetes - Aguatic Worms Limmodrilus sp. Peloscolex multisetosus Tubifex tubifex
TABLE II Biological. Data
Bottom Fauna - Riffle Samples Bear River System - August and November 1954
Numbers per square foot of bottom surface
Bear B-92 Worm W-17 11-9-54 11-9-54
204 775.
10
50
8
2
2 275
1 168
2 3
6 20 5 2
*Washed down from point upstream - eliminated.
Worm W-2 11-10-54
4*
8

TABLE 11 (cont'd)
Organisms Bear. B-92 Worm W-11 Worm W-2 11-9-54 11-9-54 11-10-54
Hirudinea - Leeches 2 G1ossiphonia sp. 6 G1ossiphonia stagnalis 3
Total 123~ 310 12
Weight Grams/sq. ft. 2.13 1 Trace Percent Pollutional 2 1.1 100 No. species, families, etc. 13 6 1
I
~ I

TABLE 12 Biological Data
Bottom Fauna - Pool and Run Samples Bear and Malad Rivers
Numbers per square foot
Organisms Bear B-55 Bear B-12 Bear B-12 Malad M-22 Malad M-ll 11-11-54 8-14-54 11-ll-54 11-12-54 11-12-54
DiEtera - True Flies Tendipedidae 3 Sma11 Green Tend. 13 6 Calospectra sp. 224 1 Spaniotoma sp. 1 Tendipes decorus 16 9
Olifiochaetes 4 215 Limnodrilus spp. 2 A
I Nais sp. 4 0 +...-N I
Leeches 2
Total 5 226 35 22 218 Wt-Gm/sq ft Trace Trace Trace Trace 1.6 Percent Pollutional 80 1 63 41 98.5 No. species, genera-tamilies 2 2 4 3 2

TABLE 13 Biological Data
Bottom Fauna - Pool and Run Samples Cub River • August and November 1954 Numbers per square toot bottom area
Organisms C-2l C-2l C-2l C-l9.5 C-l9.5 C-lO C-lO C-l2 8-13-54 11-9-54 11-9-54 8-13-54 11-9-54 8-12-54 11-10-54 11-10-54
Diptera - True flies Tendipedidue - Red 4 4
Small green 336 8 36 Calospectra spp. 26 272 56 Clinota.nypus sp. 32 208 Cryptochironomus sp. 16 Endochironomus sp. 36 Microtendipes sp. 36 Pentapedilum sp. 8 Tendipes decorus 2 72 424 184 270
1~ Bolorusia rubiginosa 16 8 \I.) Tabanidae 8 • Coleoptera - Beetles
Haliplidae 6 8 2 Phanocerus sp. 2
Ephemeroptera - Mayflies 4 2 Baetidae 4 28
Plecoptera - Stonetiles 1 Trichoptera - Caddis Flies
Bydropsychidae 4 4 Oligochaetes 16 8332 4
Naid1dae 176 1460 Nais sp. 620 0* 20 Limnodrilus spp. 160 A 4 Peloscolex multisetosus 18
Tubificidae ).08 84 Tubifex tubifex 0
Leeches 2 8 Glossiphonia stagnalis 2

TABLE 13 (cont'd)
I r-
E-•
Organisms C-21 8-13-54
Mollusca - Snails & Clams Ferrissidae Physa spp. 16 Sphaerium sp. 4 Pisidium sp. 18 Gyraulus sp.
Crustacea Byalella azteca
Total· 480
Wt-Grams/sqft 1.4 Percent Po1lutional 76 No. species-genera-families
0* - Occasional A - Abundant
13
C-21 11-9-54
8
337
Trace 7
6
C-2l C-19.5 C-19.5 C-l0 C-l0 C-12 11-9-54 8-13-54 11-9-54 8-12-24 11-10-24 11-1o-~4
8 48 10
152 8
24
2380 1336 8550 356 32 26
10 2 41 0.2 Trace Trace 73 85 99.5 82 100 85
16 4 10 5 3 3

TABLE 14 Biological Data
Bottom Fauna - Ritfle Samples Cub River - August and November 1954
Numbers per square toot bottom surface
Organisms C-25 C-25 C-21 C-21 C-21 C-19.5 C-19.5 C-10 C-10 8-12-54 11-9-54 8-13-54 8-13-54 11-9-54 8-13-54 11-9-54 8-12-54 11-10-54
Diptera - True flies 9 Tendipedidae-Red 732
Small green 20 248 262 30 13 330 Calospectra sp. 0 C1inotanypus sp. R Cryptochironomus sp. 0 Diamesinae A Spaniotoma sp. 31 Tendipes decorus A 6 Tipulidae 3 10
Eriocera sp. 1 2
!- Holorusia rubiginosa 6 \r\ Limnobiinae 80 • Simuliidae 21 1 216
Ceratopogonldae 1 Coleoptera - Beetles
Elm1dae 41 15 Phanocerus sp. 94 26 2
Halip11d.ae 1 Brychius op. 8
Ephemeroptera - Mayflies 300 186 16 Baetidae A 147 357 15 2 Heptagenidae R 98 119
Lepidoptera Elophila sp. 2
Neuroptera 1 4

TABLE 14 (cont1d)
C-25 C-25 C-21 C-21 C-21 C-19.5 C-19.5 C-l0 C-l0 Organisms 8-12-54 11-9-54 8-13-54 8-13-54 11-9-54 8-13-54 11-9-54 8-12-54 11-10-5
P1ecoptera - Stoneflies 18 18 20 2 Trichoptera - Caddis Flies 35 1486 335 3
Brachycentridae 139 Hydropsychidae 11 A 1942 A Leptoceridae 2 Microcaddis 1
Rhyacophilidae 1 Oligochaetes-Sludge Worms 2 2756 487 38
Nais sp. 0 A Limnodrulus spp. 1 C R 6 Tubifex tubifex C
Leeches 4 1 Glossiphonia sp. 1
t Snails
Gyraulus sp. 2 I Physa sPp. 3 13 26 1
Stagnicola sp. 1 Crustacea
Gammarus sp. 1 8 Byalella azteca 1 Nematodes 1
Total 569 382 2102 2714 405 3488 556 593 15 wtTn gr81llS/ sq.· ft 3.28 2.0 7.0 8.0 5.6 4* 6.75 0.85 Trace Percent po11utional 0 1 0.5 0 3.25 100 94 6 100 No. species, families, etc. 15 10 10 7 11 2 13 10 3 *Estimate A - Abundant o - Occasional C - CODDDOn R - Rare

.. oe ATIO-' MAP ICALI tJII MILlS
20 0 20 40
~9Ji~~S. .. OF r~!.JNICIPAL PQ.~~~I!"~
POI-'LJU,TION E'JLJIVALENT (<,.O.C.) ·;.r ~ASTES ~S~H~RCED TO !TREAM
d 5pOO AND \'~ .. EF>
ci 5,o00-15pOO
d'5POO - 30,000
SOURCES OF INDUSTRIAL POLLUTION
POPULATION EQUIVALENT (B.O.D.) OF WASTES DISCHARGED TO STREAM
1,000 AN" L ~OER
'pOO.5,000
L1,:- ,~,000-50,0(\0 r..........J1IS(.,OOl. 4,",0 OVE ..
TRE-ATMENT FACILITIES
o IN EXISTENCE
• NOT IN EXISTE"CE
FIGURE I
SOURCES OF
MUNICIPAL AND INDUSTRIAL POLLUTION LOWER BEAR RIVER SYSTEM
1954
SCA!..E 1114 ~IIo.ES

SMITHF'lELD •
, ( '.
.. 1 .. ,
\ " .,
~ .. .. )\<0
" )
\>.1&"
BIOLOGICAL
BEAR RIVER WATERSHED
0 ©
• C-IO
(P)
(ft)
(R)
FIGURE
DATA
LOCATtOIil MAP SCALI!' IN MiLtS
29 0 " ~
CLEAN WATER
FACULTATIVE
POLLUTIONAL
STATION NUMBER
POOL
RUN
RIFFLE
2
BOTTOM FAUNA LOWER BEAR RIVER SYSTEM
AUGUST 1954
SCALE IN MILES
5 0 5 10 iiiiiiI!!!!!!!! --

SMITHFIELD •
< •
I{P)
I(P)
,-~f-
8E AR R IllER WATERSHEO
0 ,~; ~ 7~
• C-IO
(P)
(ft)
(R)
LOt "liON MAP SCAl..l ." IIIll..ts
'9 0 IS to
CLEAN WATER
FACULTATIVE
POLLUTIONAL
STATION NUMBER
POOL
RUN
RIFFLE
FIGURE ;3
BIOLOGICAL DATA - BOTTOM FAUNA LOWER BEAR RIVER SYSTEM
NOVEMBER 1954
SCALE IN MILES