report on la county covid-19 data disaggregated by race...
TRANSCRIPT
1
Report on LA County COVID-19 Data Disaggregated by Race and Ethnicity
Background
Achieving racial/ethnic and socioeconomic equity in our response to the COVID-19 pandemic in Los Angeles (LA) County requires that data on all aspects of this disease be disaggregated by race/ethnicity and by measures of socioeconomic status. In recognition of this fact, the LA County Board of Supervisors (Board), on April 14th, 2020, directed the Department of Public Health (Public Health), in collaboration with the Department of Health Services (DHS) and the Department of the Medical Examiner-Coroner (MEC) to compile a report summarizing what we know to date about the racial/ethnic and socioeconomic characteristics of those who have been tested for SARS-CoV-2, the virus that causes COVID-19; those who have been diagnosed with infection; and those who have required hospitalization.
Organization of the Report
The data provided in this report are organized according to the itemized requests in the Board motion, beginning with the four items in the revised motion from Supervisors Solis and Barger and followed by the two additional items in the amendment to that motion from Supervisor Ridley-Thomas. After presenting the data we describe the limitations of the data and how we are addressing those limitations.
COVID-19 Confirmed Cases by Race/Ethnicity, Age Group and Socioeconomic Status
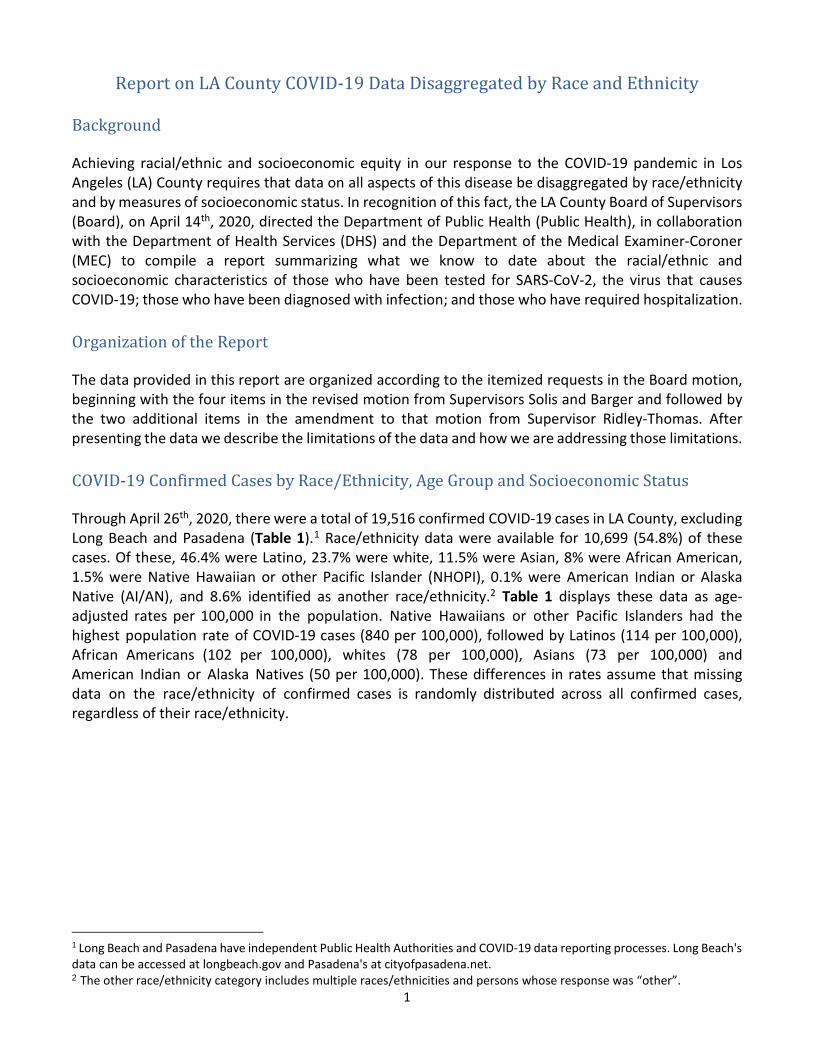
Through April 26th, 2020, there were a total of 19,516 confirmed COVID-19 cases in LA County, excluding Long Beach and Pasadena (Table 1).1 Race/ethnicity data were available for 10,699 (54.8%) of these cases. Of these, 46.4% were Latino, 23.7% were white, 11.5% were Asian, 8% were African American, 1.5% were Native Hawaiian or other Pacific Islander (NHOPI), 0.1% were American Indian or Alaska Native (AI/AN), and 8.6% identified as another race/ethnicity.2 Table 1 displays these data as age-adjusted rates per 100,000 in the population. Native Hawaiians or other Pacific Islanders had the highest population rate of COVID-19 cases (840 per 100,000), followed by Latinos (114 per 100,000), African Americans (102 per 100,000), whites (78 per 100,000), Asians (73 per 100,000) and American Indian or Alaska Natives (50 per 100,000). These differences in rates assume that missing data on the race/ethnicity of confirmed cases is randomly distributed across all confirmed cases, regardless of their race/ethnicity.
1 Long Beach and Pasadena have independent Public Health Authorities and COVID-19 data reporting processes. Long Beach's data can be accessed at longbeach.gov and Pasadena's at cityofpasadena.net. 2 The other race/ethnicity category includes multiple races/ethnicities and persons whose response was “other”.
2
Table 1: Confirmed COVID-19 Cases by Race/Ethnicity, Age-Adjusted Rates, through April 26th* (N=19,516)
Race/Ethnicity N % Age-Adjusted Rate per 100,000 95% CI
Asian 1,231 11.5% 73.2 (69.1-77.2) African American 882 8.3% 102.3 (95.6-109.1) Latino/Hispanic 4,960 46.4% 113.6 (110.4-116.7) American Indian or Alaska Native 12 0.1% 50.3 (21.9-78.8)^ Native Hawaiian or Other Pacific Islander 163 1.5% 840.0 (711.1-969) White 2,528 23.7% 78.2 (75.2-81.3) Other 923 8.6% Unknown/Missing* 8,817 *Race/ethnicity data were missing for 45.2% of cases; these data do not include Long Beach and Pasadena.^Age-adjusted rate and confidence interval should be interpreted with caution due to a small number of cases.
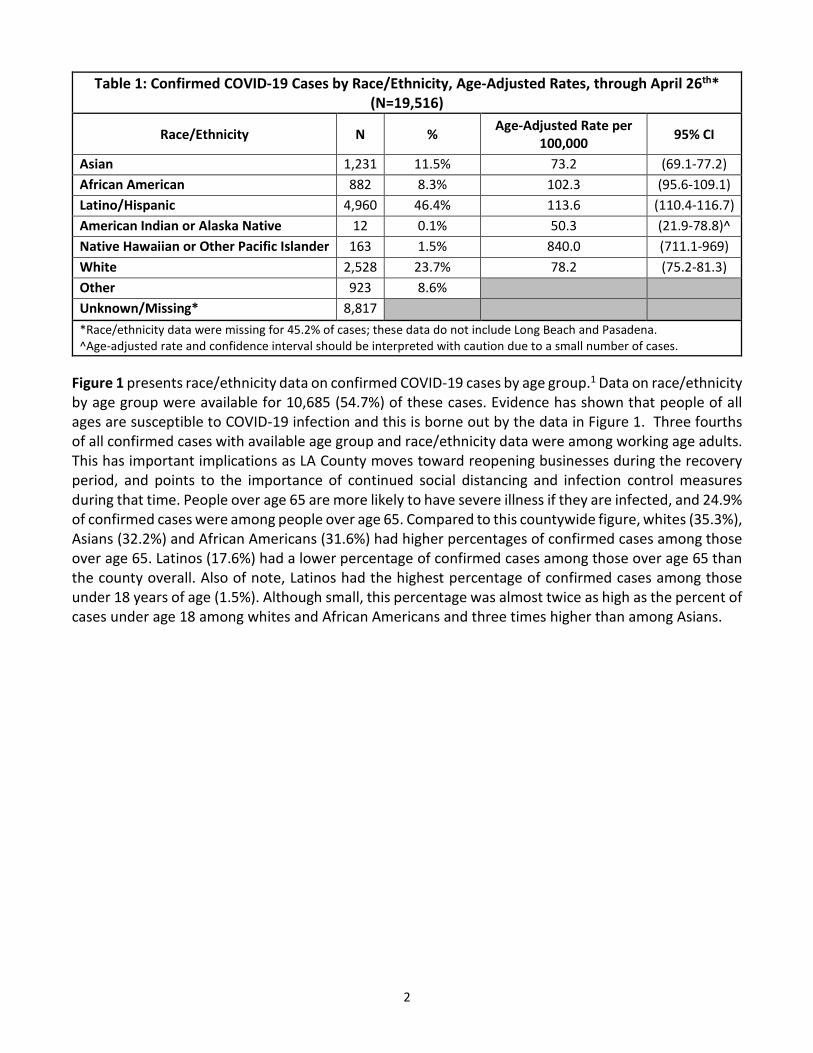
Figure 1 presents race/ethnicity data on confirmed COVID-19 cases by age group.1 Data on race/ethnicity by age group were available for 10,685 (54.7%) of these cases. Evidence has shown that people of all ages are susceptible to COVID-19 infection and this is borne out by the data in Figure 1. Three fourths of all confirmed cases with available age group and race/ethnicity data were among working age adults. This has important implications as LA County moves toward reopening businesses during the recovery period, and points to the importance of continued social distancing and infection control measures during that time. People over age 65 are more likely to have severe illness if they are infected, and 24.9% of confirmed cases were among people over age 65. Compared to this countywide figure, whites (35.3%), Asians (32.2%) and African Americans (31.6%) had higher percentages of confirmed cases among those over age 65. Latinos (17.6%) had a lower percentage of confirmed cases among those over age 65 than the county overall. Also of note, Latinos had the highest percentage of confirmed cases among those under 18 years of age (1.5%). Although small, this percentage was almost twice as high as the percent of cases under age 18 among whites and African Americans and three times higher than among Asians.
3
*Race/ethnicity by age group data were missing for 45.3% of cases.
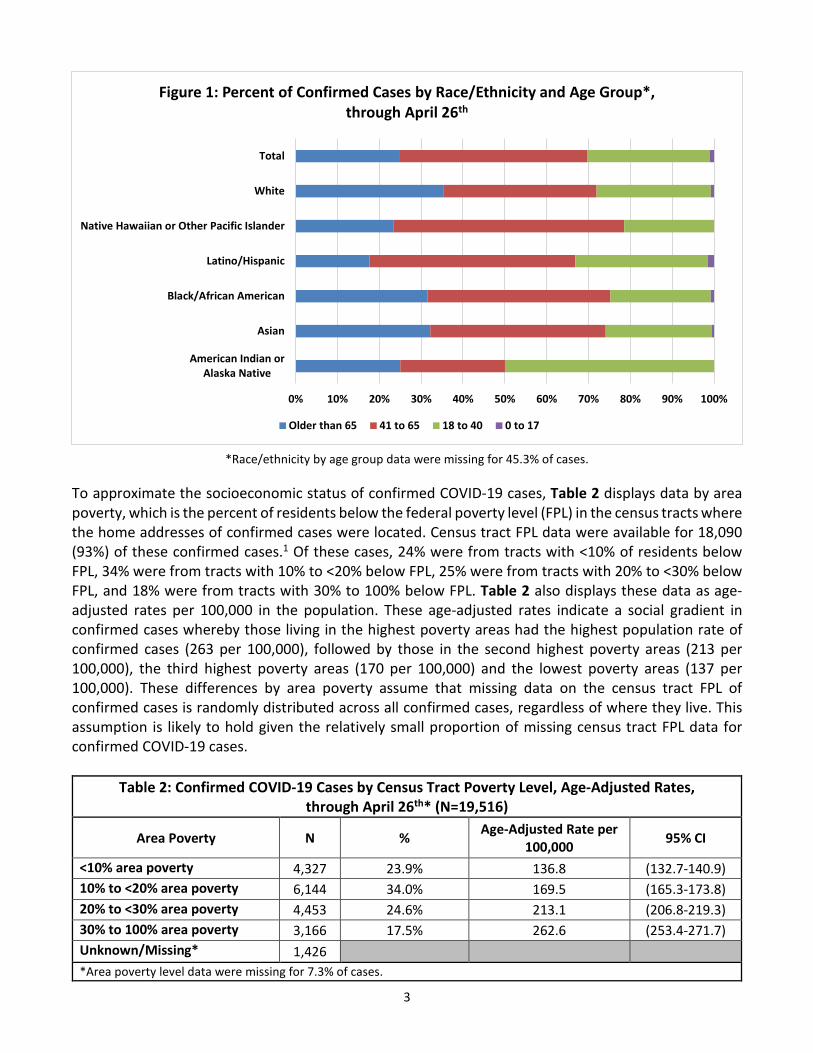
To approximate the socioeconomic status of confirmed COVID-19 cases, Table 2 displays data by area poverty, which is the percent of residents below the federal poverty level (FPL) in the census tracts where the home addresses of confirmed cases were located. Census tract FPL data were available for 18,090 (93%) of these confirmed cases.1 Of these cases, 24% were from tracts with <10% of residents below FPL, 34% were from tracts with 10% to <20% below FPL, 25% were from tracts with 20% to <30% below FPL, and 18% were from tracts with 30% to 100% below FPL. Table 2 also displays these data as age-adjusted rates per 100,000 in the population. These age-adjusted rates indicate a social gradient in confirmed cases whereby those living in the highest poverty areas had the highest population rate of confirmed cases (263 per 100,000), followed by those in the second highest poverty areas (213 per 100,000), the third highest poverty areas (170 per 100,000) and the lowest poverty areas (137 per 100,000). These differences by area poverty assume that missing data on the census tract FPL of confirmed cases is randomly distributed across all confirmed cases, regardless of where they live. This assumption is likely to hold given the relatively small proportion of missing census tract FPL data for confirmed COVID-19 cases.
Table 2: Confirmed COVID-19 Cases by Census Tract Poverty Level, Age-Adjusted Rates, through April 26th* (N=19,516)
Area Poverty N % Age-Adjusted Rate per 100,000 95% CI
<10% area poverty 4,327 23.9% 136.8 (132.7-140.9) 10% to <20% area poverty 6,144 34.0% 169.5 (165.3-173.8) 20% to <30% area poverty 4,453 24.6% 213.1 (206.8-219.3) 30% to 100% area poverty 3,166 17.5% 262.6 (253.4-271.7) Unknown/Missing* 1,426 *Area poverty level data were missing for 7.3% of cases.
0% 10% 20% 30% 40% 50% 60% 70% 80% 90% 100%
American Indian orAlaska Native
Asian
Black/African American
Latino/Hispanic
Native Hawaiian or Other Pacific Islander
White
Total
Figure 1: Percent of Confirmed Cases by Race/Ethnicity and Age Group*, through April 26th
Older than 65 41 to 65 18 to 40 0 to 17
4
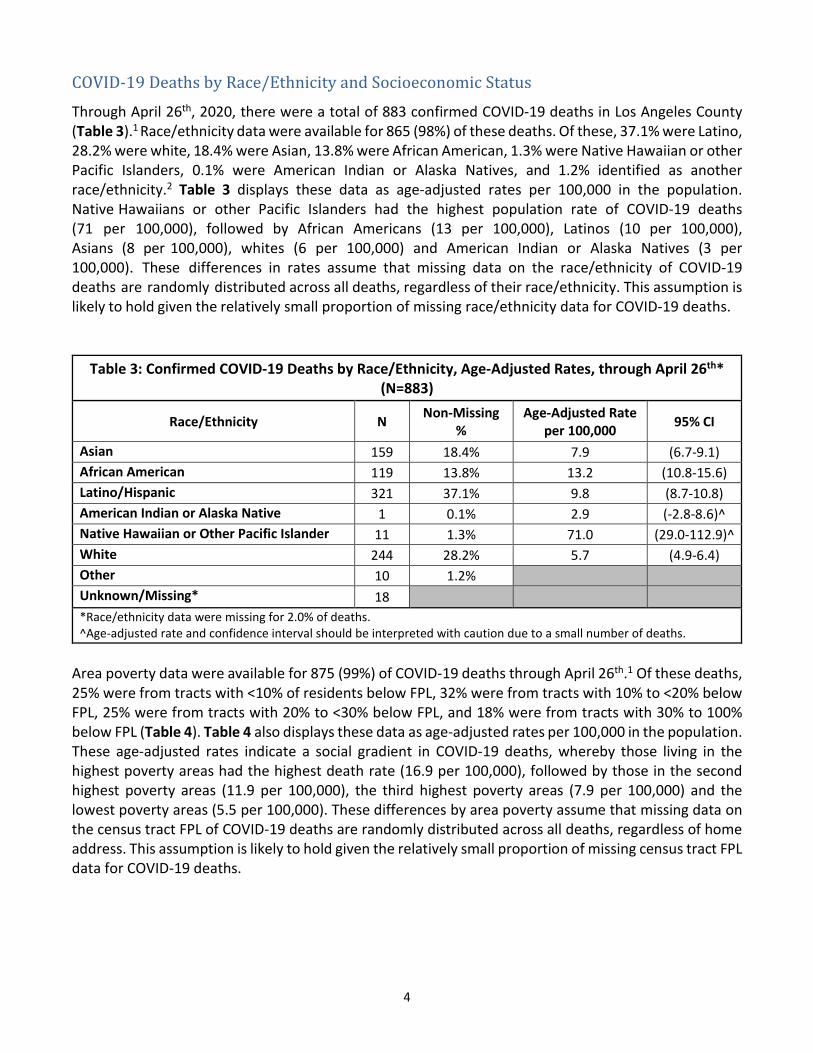
COVID-19 Deaths by Race/Ethnicity and Socioeconomic Status Through April 26th, 2020, there were a total of 883 confirmed COVID-19 deaths in Los Angeles County (Table 3).1 Race/ethnicity data were available for 865 (98%) of these deaths. Of these, 37.1% were Latino, 28.2% were white, 18.4% were Asian, 13.8% were African American, 1.3% were Native Hawaiian or other Pacific Islanders, 0.1% were American Indian or Alaska Natives, and 1.2% identified as another race/ethnicity.2 Table 3 displays these data as age-adjusted rates per 100,000 in the population. Native Hawaiians or other Pacific Islanders had the highest population rate of COVID-19 deaths (71 per 100,000), followed by African Americans (13 per 100,000), Latinos (10 per 100,000), Asians (8 per 100,000), whites (6 per 100,000) and American Indian or Alaska Natives (3 per 100,000). These differences in rates assume that missing data on the race/ethnicity of COVID-19 deaths are randomly distributed across all deaths, regardless of their race/ethnicity. This assumption is likely to hold given the relatively small proportion of missing race/ethnicity data for COVID-19 deaths.
Table 3: Confirmed COVID-19 Deaths by Race/Ethnicity, Age-Adjusted Rates, through April 26th* (N=883)
Race/Ethnicity N Non-Missing %
Age-Adjusted Rate per 100,000 95% CI
Asian 159 18.4% 7.9 (6.7-9.1) African American 119 13.8% 13.2 (10.8-15.6) Latino/Hispanic 321 37.1% 9.8 (8.7-10.8) American Indian or Alaska Native 1 0.1% 2.9 (-2.8-8.6)^ Native Hawaiian or Other Pacific Islander 11 1.3% 71.0 (29.0-112.9)^ White 244 28.2% 5.7 (4.9-6.4) Other 10 1.2% Unknown/Missing* 18 *Race/ethnicity data were missing for 2.0% of deaths.^Age-adjusted rate and confidence interval should be interpreted with caution due to a small number of deaths.
Area poverty data were available for 875 (99%) of COVID-19 deaths through April 26th.1 Of these deaths, 25% were from tracts with <10% of residents below FPL, 32% were from tracts with 10% to <20% below FPL, 25% were from tracts with 20% to <30% below FPL, and 18% were from tracts with 30% to 100% below FPL (Table 4). Table 4 also displays these data as age-adjusted rates per 100,000 in the population. These age-adjusted rates indicate a social gradient in COVID-19 deaths, whereby those living in the highest poverty areas had the highest death rate (16.9 per 100,000), followed by those in the second highest poverty areas (11.9 per 100,000), the third highest poverty areas (7.9 per 100,000) and the lowest poverty areas (5.5 per 100,000). These differences by area poverty assume that missing data on the census tract FPL of COVID-19 deaths are randomly distributed across all deaths, regardless of home address. This assumption is likely to hold given the relatively small proportion of missing census tract FPL data for COVID-19 deaths.
5
Table 4: Confirmed COVID-19 Deaths by Census Tract Poverty Level, Age-Adjusted Rates, through April 26th* (N=883)
Area Poverty N Non-Missing % Age-Adjusted Rate per 100,000 95% CI
<10% area poverty 214 24.5% 5.5 (4.8-6.2) 10% to <20% area poverty 283 32.3% 7.9 (7.0-8.8) 20% to <30% area poverty 219 25.0% 11.9 (10.3-13.5) 30% to 100% area poverty 159 18.2% 16.9 (14.2-19.5) Unknown/Missing* 8 *Area poverty level data were missing for 0.9% of deaths.
COVID-19 Testing and Testing Requests by Race/Ethnicity and Socioeconomic Status
As of April 26th, 2020, a total of 123,737 individuals were reported as having been tested for COVID-19 in LA County.1 Race/ethnicity data were available for 39,801 (32.2%) of individuals tested. Of tested individuals with available race/ethnicity data, 30.3% were white, 16.7% were Latino, 9.2% were African American, 8.6% were Asian, 3.1% were Native Hawaiian or other Pacific Islanders, 0.2% were American Indian or Alaska Natives, and 30.3% identified as another race/ethnicity.2 Age-adjusted population rates of testing by race/ethnicity were not calculated due to the high proportion of missing race/ethnicity data on those tested.
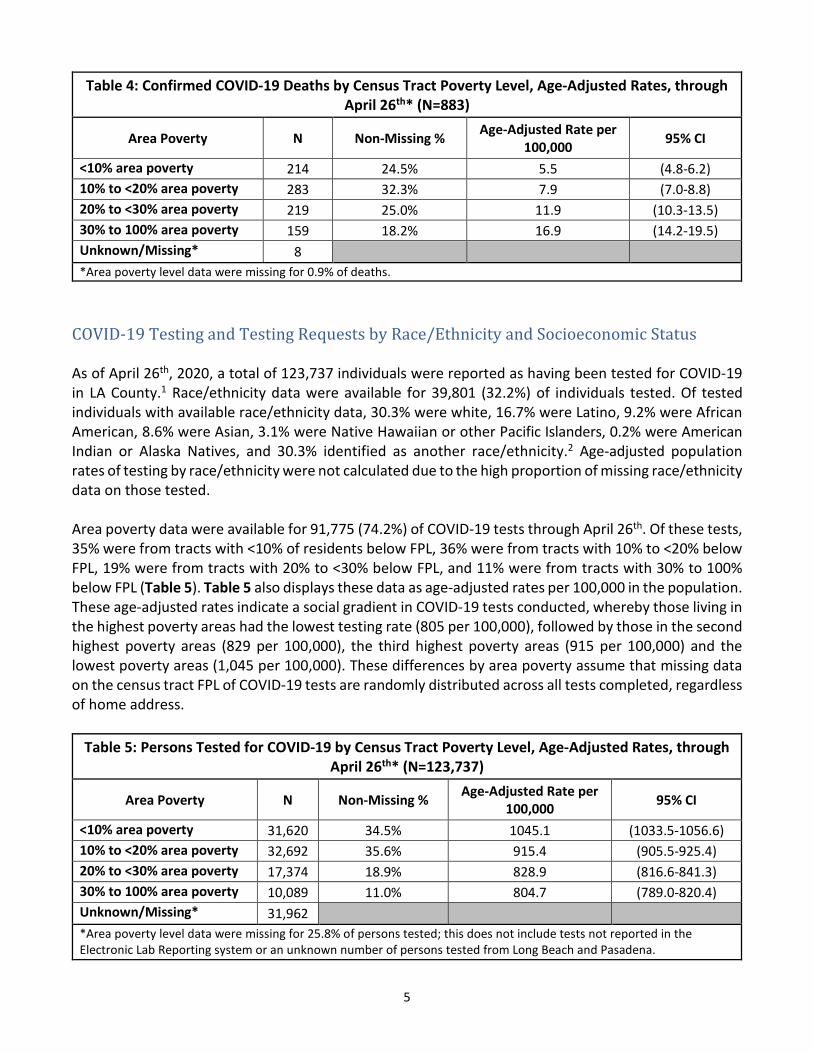
Area poverty data were available for 91,775 (74.2%) of COVID-19 tests through April 26th. Of these tests, 35% were from tracts with <10% of residents below FPL, 36% were from tracts with 10% to <20% below FPL, 19% were from tracts with 20% to <30% below FPL, and 11% were from tracts with 30% to 100% below FPL (Table 5). Table 5 also displays these data as age-adjusted rates per 100,000 in the population. These age-adjusted rates indicate a social gradient in COVID-19 tests conducted, whereby those living in the highest poverty areas had the lowest testing rate (805 per 100,000), followed by those in the second highest poverty areas (829 per 100,000), the third highest poverty areas (915 per 100,000) and the lowest poverty areas (1,045 per 100,000). These differences by area poverty assume that missing data on the census tract FPL of COVID-19 tests are randomly distributed across all tests completed, regardless of home address.
Table 5: Persons Tested for COVID-19 by Census Tract Poverty Level, Age-Adjusted Rates, through April 26th* (N=123,737)
Area Poverty N Non-Missing % Age-Adjusted Rate per 100,000 95% CI
<10% area poverty 31,620 34.5% 1045.1 (1033.5-1056.6) 10% to <20% area poverty 32,692 35.6% 915.4 (905.5-925.4) 20% to <30% area poverty 17,374 18.9% 828.9 (816.6-841.3) 30% to 100% area poverty 10,089 11.0% 804.7 (789.0-820.4) Unknown/Missing* 31,962 *Area poverty level data were missing for 25.8% of persons tested; this does not include tests not reported in theElectronic Lab Reporting system or an unknown number of persons tested from Long Beach and Pasadena.
6
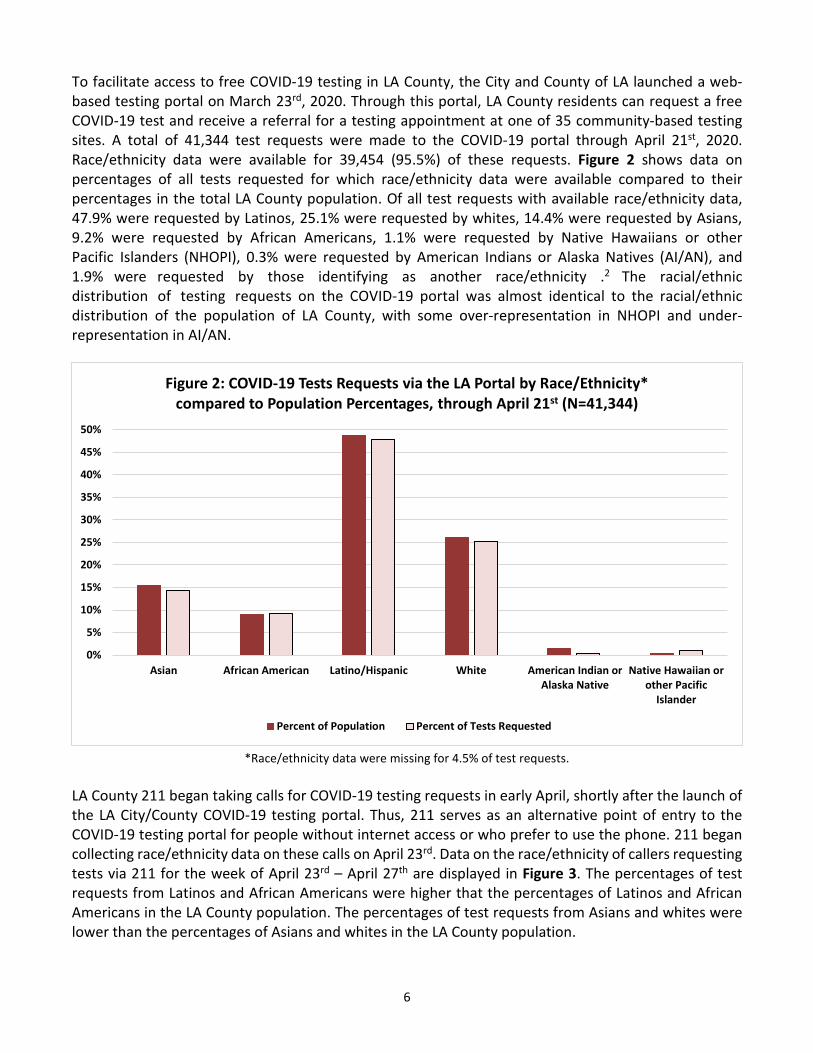
To facilitate access to free COVID-19 testing in LA County, the City and County of LA launched a web-based testing portal on March 23rd, 2020. Through this portal, LA County residents can request a free COVID-19 test and receive a referral for a testing appointment at one of 35 community-based testing sites. A total of 41,344 test requests were made to the COVID-19 portal through April 21st, 2020. Race/ethnicity data were available for 39,454 (95.5%) of these requests. Figure 2 shows data on percentages of all tests requested for which race/ethnicity data were available compared to their percentages in the total LA County population. Of all test requests with available race/ethnicity data, 47.9% were requested by Latinos, 25.1% were requested by whites, 14.4% were requested by Asians, 9.2% were requested by African Americans, 1.1% were requested by Native Hawaiians or other Pacific Islanders (NHOPI), 0.3% were requested by American Indians or Alaska Natives (AI/AN), and 1.9% were requested by those identifying as another race/ethnicity .2 The racial/ethnic distribution of testing requests on the COVID-19 portal was almost identical to the racial/ethnic distribution of the population of LA County, with some over-representation in NHOPI and under-representation in AI/AN.
*Race/ethnicity data were missing for 4.5% of test requests.
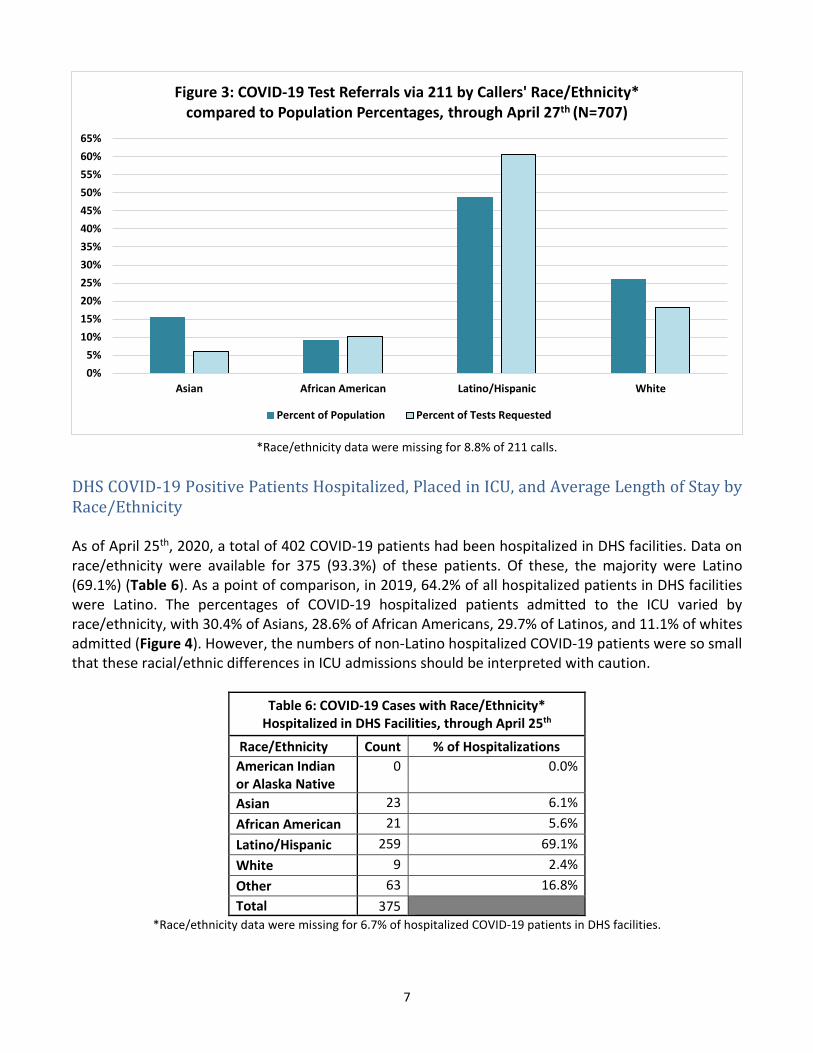
LA County 211 began taking calls for COVID-19 testing requests in early April, shortly after the launch of the LA City/County COVID-19 testing portal. Thus, 211 serves as an alternative point of entry to the COVID-19 testing portal for people without internet access or who prefer to use the phone. 211 began collecting race/ethnicity data on these calls on April 23rd. Data on the race/ethnicity of callers requesting tests via 211 for the week of April 23rd – April 27th are displayed in Figure 3. The percentages of test requests from Latinos and African Americans were higher that the percentages of Latinos and African Americans in the LA County population. The percentages of test requests from Asians and whites were lower than the percentages of Asians and whites in the LA County population.
0%
5%
10%
15%
20%
25%
30%
35%
40%
45%
50%
Asian African American Latino/Hispanic White American Indian or Alaska Native
Native Hawaiian orother Pacific
Islander
Figure 2: COVID-19 Tests Requests via the LA Portal by Race/Ethnicity* compared to Population Percentages, through April 21st (N=41,344)
Percent of Population Percent of Tests Requested
7
*Race/ethnicity data were missing for 8.8% of 211 calls.
DHS COVID-19 Positive Patients Hospitalized, Placed in ICU, and Average Length of Stay by Race/Ethnicity
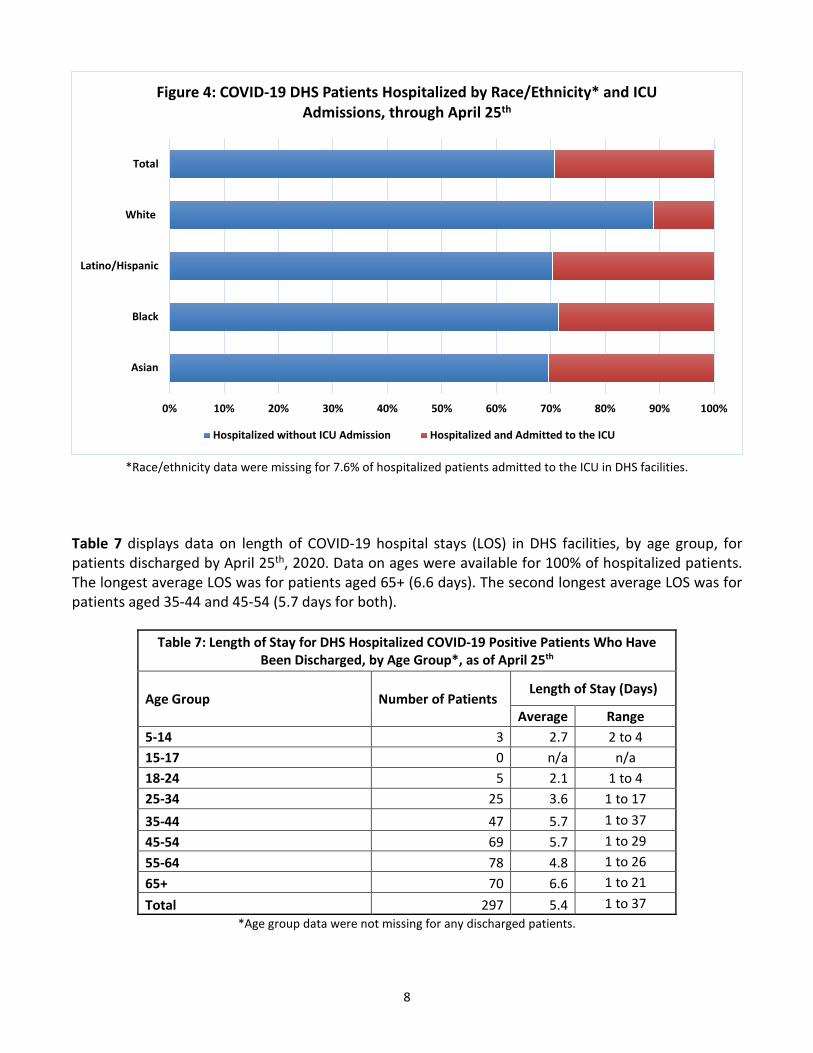
As of April 25th, 2020, a total of 402 COVID-19 patients had been hospitalized in DHS facilities. Data on race/ethnicity were available for 375 (93.3%) of these patients. Of these, the majority were Latino (69.1%) (Table 6). As a point of comparison, in 2019, 64.2% of all hospitalized patients in DHS facilities were Latino. The percentages of COVID-19 hospitalized patients admitted to the ICU varied by race/ethnicity, with 30.4% of Asians, 28.6% of African Americans, 29.7% of Latinos, and 11.1% of whites admitted (Figure 4). However, the numbers of non-Latino hospitalized COVID-19 patients were so small that these racial/ethnic differences in ICU admissions should be interpreted with caution.
Table 6: COVID-19 Cases with Race/Ethnicity* Hospitalized in DHS Facilities, through April 25th
Race/Ethnicity Count % of Hospitalizations American Indian or Alaska Native
0 0.0%
Asian 23 6.1% African American 21 5.6% Latino/Hispanic 259 69.1% White 9 2.4% Other 63 16.8% Total 375
*Race/ethnicity data were missing for 6.7% of hospitalized COVID-19 patients in DHS facilities.
0%5%
10%15%20%25%30%35%40%45%50%55%60%65%
Asian African American Latino/Hispanic White
Figure 3: COVID-19 Test Referrals via 211 by Callers' Race/Ethnicity* compared to Population Percentages, through April 27th (N=707)
Percent of Population Percent of Tests Requested
8
*Race/ethnicity data were missing for 7.6% of hospitalized patients admitted to the ICU in DHS facilities.
Table 7 displays data on length of COVID-19 hospital stays (LOS) in DHS facilities, by age group, for patients discharged by April 25th, 2020. Data on ages were available for 100% of hospitalized patients. The longest average LOS was for patients aged 65+ (6.6 days). The second longest average LOS was for patients aged 35-44 and 45-54 (5.7 days for both).
Table 7: Length of Stay for DHS Hospitalized COVID-19 Positive Patients Who Have Been Discharged, by Age Group*, as of April 25th
Age Group Number of Patients Length of Stay (Days)
Average Range 5-14 3 2.7 2 to 4 15-17 0 n/a n/a 18-24 5 2.1 1 to 4 25-34 25 3.6 1 to 17 35-44 47 5.7 1 to 37 45-54 69 5.7 1 to 29 55-64 78 4.8 1 to 26 65+ 70 6.6 1 to 21 Total 297 5.4 1 to 37
*Age group data were not missing for any discharged patients.
0% 10% 20% 30% 40% 50% 60% 70% 80% 90% 100%
Asian
Black
Latino/Hispanic
White
Total
Figure 4: COVID-19 DHS Patients Hospitalized by Race/Ethnicity* and ICU Admissions, through April 25th
Hospitalized without ICU Admission Hospitalized and Admitted to the ICU
9
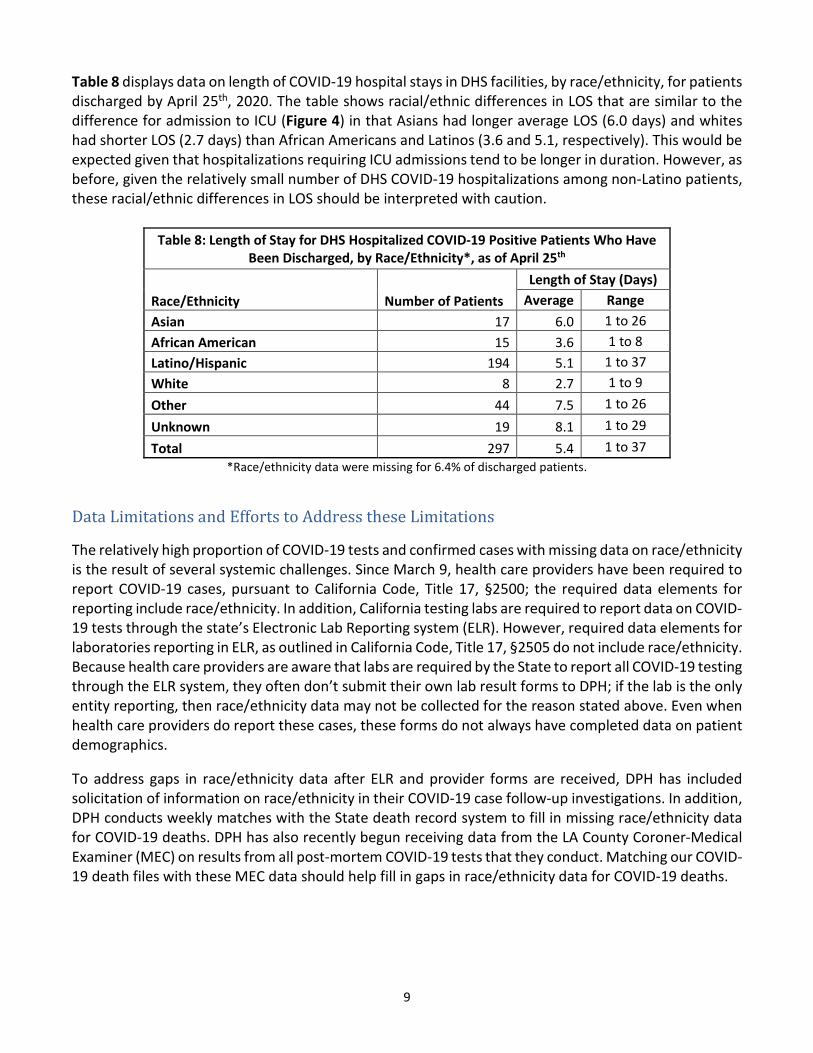
Table 8 displays data on length of COVID-19 hospital stays in DHS facilities, by race/ethnicity, for patients discharged by April 25th, 2020. The table shows racial/ethnic differences in LOS that are similar to the difference for admission to ICU (Figure 4) in that Asians had longer average LOS (6.0 days) and whites had shorter LOS (2.7 days) than African Americans and Latinos (3.6 and 5.1, respectively). This would be expected given that hospitalizations requiring ICU admissions tend to be longer in duration. However, as before, given the relatively small number of DHS COVID-19 hospitalizations among non-Latino patients, these racial/ethnic differences in LOS should be interpreted with caution.
Table 8: Length of Stay for DHS Hospitalized COVID-19 Positive Patients Who Have Been Discharged, by Race/Ethnicity*, as of April 25th
Race/Ethnicity Number of Patients Length of Stay (Days)
Average Range Asian 17 6.0 1 to 26 African American 15 3.6 1 to 8 Latino/Hispanic 194 5.1 1 to 37 White 8 2.7 1 to 9 Other 44 7.5 1 to 26 Unknown 19 8.1 1 to 29 Total 297 5.4 1 to 37
*Race/ethnicity data were missing for 6.4% of discharged patients.
Data Limitations and Efforts to Address these Limitations The relatively high proportion of COVID-19 tests and confirmed cases with missing data on race/ethnicity is the result of several systemic challenges. Since March 9, health care providers have been required to report COVID-19 cases, pursuant to California Code, Title 17, §2500; the required data elements for reporting include race/ethnicity. In addition, California testing labs are required to report data on COVID-19 tests through the state’s Electronic Lab Reporting system (ELR). However, required data elements for laboratories reporting in ELR, as outlined in California Code, Title 17, §2505 do not include race/ethnicity. Because health care providers are aware that labs are required by the State to report all COVID-19 testing through the ELR system, they often don’t submit their own lab result forms to DPH; if the lab is the only entity reporting, then race/ethnicity data may not be collected for the reason stated above. Even when health care providers do report these cases, these forms do not always have completed data on patient demographics. To address gaps in race/ethnicity data after ELR and provider forms are received, DPH has included solicitation of information on race/ethnicity in their COVID-19 case follow-up investigations. In addition, DPH conducts weekly matches with the State death record system to fill in missing race/ethnicity data for COVID-19 deaths. DPH has also recently begun receiving data from the LA County Coroner-Medical Examiner (MEC) on results from all post-mortem COVID-19 tests that they conduct. Matching our COVID-19 death files with these MEC data should help fill in gaps in race/ethnicity data for COVID-19 deaths.
10
Other Testing, Data Collection and Research Efforts Under Way or Planned by DPH and Academic Partners
DPH, in collaboration with researchers at USC, recently released the results of the first in a planned series of SARS-CoV-2 antibody seroprevalence studies in LA County. The purpose of these studies is to estimate the proportion of the total LA County adult population that has had the infection by testing for antibodies in representative samples of the adult population. The first of these studies estimated an adult seroprevalence of 4.1% (range: 2.8%-5.6%), meaning that an estimated 221,000 to 442,000 LA County adults have had the infection. DPH plans to repeat these seroprevalence studies at least monthly in order to track the spread of the virus over time. While the sample of nearly 900 adults in this first study was selected to represent all major racial/ethnic groups in the county, the sample size was not large enough to estimate statistically significant differences in seroprevalence across these groups. Future studies will increase efforts to ensure greater participation among communities of color and will also include a child component.
Another COVID-19-related research endeavor underway at DPH is designed to track the spread of COVID-19 in skilled nursing facilities to guide efforts to mitigate the impact of COVID-19 on patients in these facilities. Given that over one-third of COVID-19 deaths have occurred in these types of congregate living facilities, these surveillance studies will play an important role in reducing COVID-19 mortality in LA County.
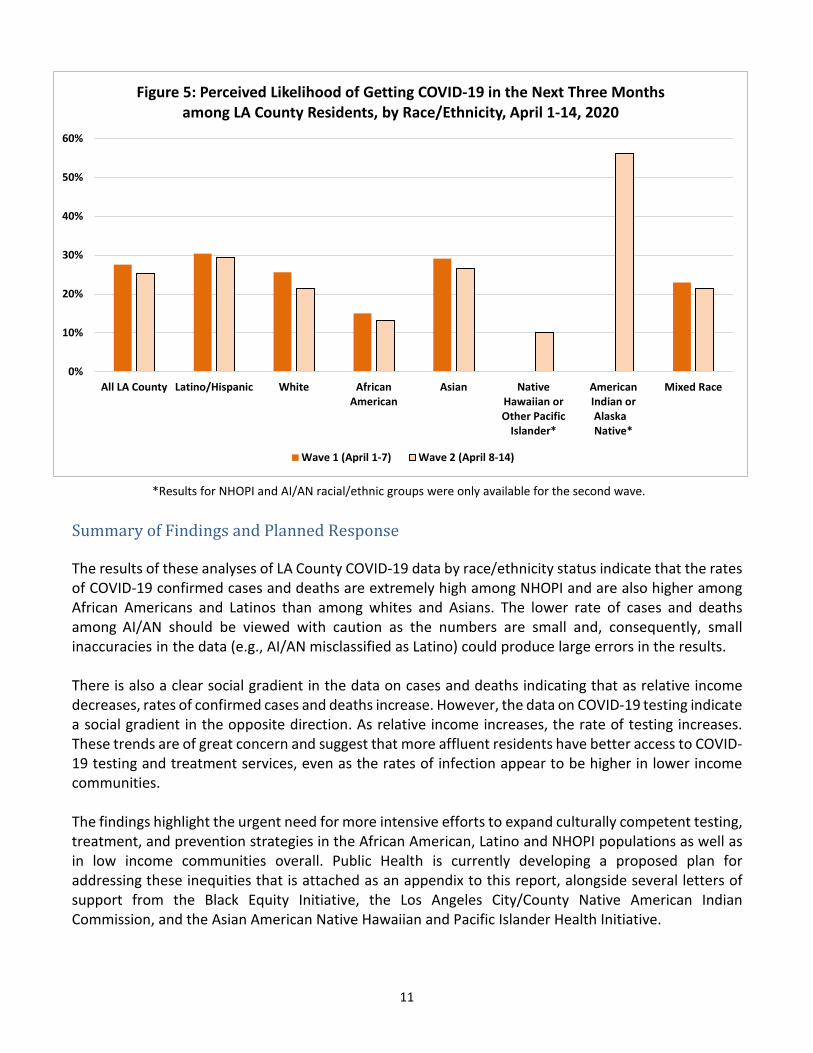
USC recently began fielding a supplement to their LABarometer study, a quarterly internet-based survey of approximately 1,800 LA County residents. The supplement consists of weekly data on experiences with and perceptions of COVID-19. USC recently shared raw data with DPH for analysis on the first two waves of this supplement, from April 1-7 and April 8-14. Figure 5 displays data on perceived likelihood of getting COVID-19 sometime in the next three months, by race/ethnicity. Across the two waves, African Americans had the lowest perceived likelihood of getting COVID-19 (15% and 13%), despite having among the highest rates of COVID-19 confirmed cases and deaths (Tables 1 and 3). The survey also collects data on COVID-related symptoms and on economic and mental health impacts. DPH will be analyzing and reporting on these data on an ongoing basis.
11
*Results for NHOPI and AI/AN racial/ethnic groups were only available for the second wave.
Summary of Findings and Planned Response
The results of these analyses of LA County COVID-19 data by race/ethnicity status indicate that the rates of COVID-19 confirmed cases and deaths are extremely high among NHOPI and are also higher among African Americans and Latinos than among whites and Asians. The lower rate of cases and deaths among AI/AN should be viewed with caution as the numbers are small and, consequently, small inaccuracies in the data (e.g., AI/AN misclassified as Latino) could produce large errors in the results.
There is also a clear social gradient in the data on cases and deaths indicating that as relative income decreases, rates of confirmed cases and deaths increase. However, the data on COVID-19 testing indicate a social gradient in the opposite direction. As relative income increases, the rate of testing increases. These trends are of great concern and suggest that more affluent residents have better access to COVID-19 testing and treatment services, even as the rates of infection appear to be higher in lower income communities.
The findings highlight the urgent need for more intensive efforts to expand culturally competent testing, treatment, and prevention strategies in the African American, Latino and NHOPI populations as well as in low income communities overall. Public Health is currently developing a proposed plan for addressing these inequities that is attached as an appendix to this report, alongside several letters of support from the Black Equity Initiative, the Los Angeles City/County Native American Indian Commission, and the Asian American Native Hawaiian and Pacific Islander Health Initiative.
0%
10%
20%
30%
40%
50%
60%
All LA County Latino/Hispanic White AfricanAmerican
Asian NativeHawaiian orOther Pacific
Islander*
AmericanIndian orAlaskaNative*
Mixed Race
Figure 5: Perceived Likelihood of Getting COVID-19 in the Next Three Months among LA County Residents, by Race/Ethnicity, April 1-14, 2020
Wave 1 (April 1-7) Wave 2 (April 8-14)
Strategies for Addressing COVID-19 Disparities in Health Outcomes Among Highly Impacted Populations Page 1 of 8
Strategies for Addressing COVID-19 Disparities in Health Outcomes Among Highly Impacted Populations Revised 4/28/2020
Background & Epidemiology The Centers for Disease Control and Prevention (CDC) has identified an outbreak caused by a novel coronavirus (COVID-19) previously unidentified in humans. Coronaviruses are a large family of viruses that cause disease of varying severities, ranging from the common cold to more severe diseases, such as Severe Respiratory Adult Syndrome (SARS) and Middle East Respiratory Syndrome (MERS). Coronaviruses are zoonotic, meaning that they cause infections that usually exist exclusively in animals, including camels, cats, and bats. Rarely, animal coronaviruses can evolve and infect humans and then spread from person to person, which is the case with MERS and SARS.
Common symptoms of COVID-19 in an infected person include fever, cough, shortness of breath, difficulty breathing, and are being updated as we learn more about this disease.1 Diagnosis is based on a patient’s clinical presentation and diagnostic exams (i.e., throat swabs, chest x-rays). There is no specific treatment or vaccine for the coronavirus.
As of April 27, there have been over 2.8 million cases of COVID-19 worldwide and nearly 199,000 deaths due to the virus.2 In the United States, there have been more than 957,000 total cases and nearly 54,000 total deaths.3 In Los Angeles County, to date, we have more than 20,000 cases and 942 deaths.
Preliminary national and local data indicate that COVID-19 has had a disproportionate impact on various communities. For instance, for the 865 people who have passed away in LA County, where race/ethnicity has been identified:
• 14% are African American, despite comprising 9% of LA County’s population• 18% are Asian, despite comprising 15.4% of LA County’s population• 1% are Native Hawaiian or Pacific Islander, despite comprising .4% of LA County’s population• 37% are Latinx, despite comprising 48.6% of LA County’s population• 28% are white, despite comprising 26% of LA County’s population• 1% are another race/ethnicity
1 Centers for Disease Control and Prevention. Symptoms of Coronavirus. Retrieved from https://www.cdc.gov/coronavirus/2019-ncov/symptoms-testing/symptoms.html 2 World Health Organization. Coronavirus disease 2019 (COVID-19): Situation Report – 98. Retrieved from https://www.who.int/docs/default-source/coronaviruse/situation-reports/20200427-sitrep-98-covid-19.pdf?sfvrsn=90323472_4 3 Centers for Disease Control and Prevention. Cases of Coronavirus Disease (COVID-19) in the U.S. Retrieved from https://www.cdc.gov/coronavirus/2019-ncov/cases-updates/cases-in-us.html
Strategies for Addressing COVID-19 Disparities in Health Outcomes Page 2 of 8 Among Highly Impacted Populations
To put these numbers in perspective, when we analyze these numbers as rates per 100,000 people in each of these groups, better comparisons across the population can be made. The death rate among African Americans is 13.2 per 100,000, which is significantly higher than the mortality rate of other races and ethnicities. For people who identify as Latinx, the death rate is 9.8; for people who are Asian, the rate of death is 7.9; and for whites, the death rate is 5.7.
Looking at this data by community poverty levels, people who live in areas with high rates of poverty have three times the rate of deaths for COVID-19 – 16.9 per 100,000 people – compared with communities with very low poverty levels who had a death rate of 5.5 per 100,000.
COVID-19 & EquityHistorically, communities disproportionately affected by poor health outcomes include Black/African American, Asian American, Native Hawaiian and Pacific Islander (AANHPI), and American Indian/Alaska Native (AI/AN) communities, as well as undocumented populations, frontline low wage workers, people experiencing homelessness (PEH), and justice-involved populations. This disproportionality is primarily the result of longstanding inequities in an array of health determinants, including limited access to health care (especially primary care) and limited access to affordable housing and nutritious foods. The strategies outlined below are intended to close the gaps in the impacts of COVID-19 and will require both targeted and tailored approaches for specific communities. Given our charge to advance the conditions that support optimal health and well-being for all and our commitment to promoting health equity, the Department of Public Health (Public Health) will abide by our health equity principles to: • Provide inclusive and accessible data. This includes providing data by race and ethnicity and
disaggregating data to the best of our abilities for each community, like AI/NA and the diverseAANHPI (Asian American Native Hawaiian and Pacific Islander) population;
• Advance policies designed to stem the spread of disease and promote health, while addressing—or at least acknowledging—possible unintended consequences; and
• Ensure the inclusion of those most impacted and work in partnership to center our mostvulnerable populations in our decision making.
Public Health has made good-faith efforts to live by our equity principles and departmental values. We have:
• Publicly disavowed the discrimination and xenophobia experienced by AANHPI communities;• Articulated why we’re seeing the disproportionate number of deaths among Black/African
American communities;• Increased language access by translating many documents into all threshold languages;• Began reporting COVID-19 case and death data by race and ethnicity when possible; and• Recently released an FAQ on COVID-19 and Black/African Americans; a targeted PSA is
forthcoming.
However, more can be done, and more coordinated approaches are needed to address the disparities in health outcomes related to COVID-19.
Strategies for Addressing COVID-19 Disparities in Health Outcomes Page 3 of 8 Among Highly Impacted Populations
Strategies In close partnership with other County Departments and community stakeholders, Public Health will work to address the impact of COVID-19 on affected communities. We propose the following strategies for addressing COVID-19 inequities among highly impacted populations:
1. Ensure access to testing for highly impacted communities.Testing assists in the early detection of COVID-19, timely isolation and contact tracing toprevent its spread, and early case management for individuals. Additionally, testing can supportproviders in managing care for those with chronic illnesses. Increasing access to and testing ofall highly impacted communities is needed considering emerging data shows that Black/AfricanAmerican individuals are disproportionately burdened deaths from COVID-19, Latinx and Asianpopulations have the next highest death rates from COVID-19, and NHPI (Native Hawaiian andPacific Islander) communities account for a higher percentage of deaths from COVID-19 relativeto their proportion of the total population. Greater inclusion of highly impacted communities inpopulation-level testing will position Public Health, elected officials, and the community tobetter understand the relationship between prevalence and higher mortality in Black/AfricanAmerican and other highly impacted communities.
Recommendations:a. Work closely with the Department of Health Services to make testing ubiquitous and more
accessible; expand options beyond mobile testing sites, which require residents to goonline and complete an eligibility form to schedule testing.
b. Testing should be available at clinics, hospitals, and in non-clinical areas in the community,especially those treating highly impacted populations.
c. All testing performed in non-clinical settings should link persons immediately to care.d. Clients should be provided with results so that they can give them to their care provider.e. Systems should connect persons who test positive to immediate medical consultation.f. Ensure representative sampling of diverse communities in the serology/antibody testing
prevalence study.g. Testing results along with patient demographic information should be electronically
transmitted to the Department of Public Health to ensure appropriate follow-up withpositive individuals.
2. Integrate testing with care coordination for highly impacted communities.In conjunction with improving access to testing for COVID-19, support and collaboration willhelp partners adopt additional strategies that may improve access to coordinated care forpatients. For example, coordinating the care of patients between different points of care andproviding tailored information to ensure that primary care providers recognize the higher risk ofdeath from COVID-19 for highly impacted communities.
3. Ensure access to potential treatments at care sites accessible to highly impactedcommunities.Although no specific treatments for COVID-19 exist at this point, Public Health and healthcareproviders should ensure highly impacted communities stay abreast of the latest news about
Strategies for Addressing COVID-19 Disparities in Health Outcomes Page 4 of 8 Among Highly Impacted Populations
medications, vaccines, and other therapeutics that may aid in the prevention and care of COVID-19.
Recommendations: a. Seek input from community members to develop culturally and linguistically appropriate
education and information on the potential benefits of participating in any clinical trials toevaluate possible treatments for COVID-19 and vaccines being developed to protectagainst COVID-19. It should be noted that based on preliminary discussion with keyinformants, a discussion of clinical trials with the community will face significantresistance and acceptance. Input is needed to determine appropriate messaging aboutclinical trials.
b. Ensure access to clinical trials/treatment for communities of color where they seek andreceive care.
c. Prioritize high impacted groups to gain access to medications and vaccines, onceapproved, based on documented higher risk for serious illness and death.
4. Facilitate access to other supportive resources.As Public Health issues Health Officer Orders for quarantine or isolation, staying home exceptwhen conducting essential activities and other recommendations, such as wearing cloth facecoverings, highly impacted populations may encounter additional needs or challenges ineffectively following preventative measures or recommendations. Thus, there is a need toidentify the community’s needs and to link individuals to supportive resources.
Recommendations:Work with local partners to ensure:a. Availability of housing options for those that test positive for COVID-19 but live in
overcrowded residential settings where it is difficult to implement isolation or quarantineguidelines;
b. We understand the needs of highly impacted populations (e.g., re-entry populationreturning to communities while social services and support agencies provide limitedservices or are closed to the public or pathways to housing and wrap-around services forpersons experiencing homelessness);
c. Wide use of validated resource lists or databases (e.g., One Degree or 211) to assistcommunity members in finding resources related to food, shelter, financial support,housing, etc.;
d. Special procedures for highly impacted populations at businesses and institutions (e.g.,responsive business hours that meet the needs of high-risk and highly impactedpopulations);
e. Translation of the COVID-19 – Guide for Immigrant Californians which lists assistanceavailable to immigrant individuals and their families in LA County, into our thresholdlanguages; and
f. Materials and supplies are available (e.g., hand sanitizer for local agencies).
Strategies for Addressing COVID-19 Disparities in Health Outcomes Page 5 of 8 Among Highly Impacted Populations
5. Continue to support local and national policies that alleviate the burden of thisdisease and promote more equitable investment in our communities.
Recommendations:a. Support existing policy change efforts like paid sick leave for all workers, better access
to health care and insurance, increased access to telehealth and telemedicine for hardto reach and geographically isolated individuals, and more protections and resources forundocumented communities and those employed under “Compact of Free Association(COFA)” work authorization agreements.
b. Support opportunities to invest in and strengthen CBOs serving highly impacted andunderserved communities, particularly if there is economic hardship following COVID-19impact.
6. Include community voices in our response and recovery plans and developcommunity-specific action plans to implement recommendations wherepossible.
Recommendations:a. Engage community voices in developing response and recovery plans for COVID-19.
Public Health has existing relationships with committees, including the CommunityPrevention and Population Health Task Force, Center for Health Equity Data AdvisoryCommittee, the Public Health Youth Advisory Committee, the Asian American, NativeHawaiian, and Pacific Islander Health Initiative, and other community leaders. Theseentities can act as both ambassadors and liaisons to other stakeholders and shareconcerns from highly impacted community members.
b. Review input/recommendations already received from the community. Advocacygroups have sent letters stating their concerns with the disproportionate impact ontheir communities and potential solutions. These recommendations should beacknowledged, implemented when possible, and the challenges and barriers thatprevent their implementation identified and communicated to the community.
The Black Equity Initiative “Open Letter to Philanthropy and Government Leaders:Equity Meets Its Moment” (see attached for the full letter):1. Use Public Health platform to speak about systemic harm to Black people and
advocate for equity-based investments;2. Track the flow of dollars from institutions to Black-led-and-serving organizations;3. Increase investments in Black CBOs by at least 25%, in line with the
recommendations made in 2017 by the Association of Black Foundation Executives(ABFE);
4. Fully fund public departments and commissions tasked with anti-discrimination andracial equity enforcement (e.g., Office of Racial Equity, Civil and Human RightsOrdinance, Equity and Targeted Student Achievement, Perinatal EquityInitiative/Black Infant Health, among others);
Strategies for Addressing COVID-19 Disparities in Health Outcomes Page 6 of 8 Among Highly Impacted Populations
5. Take an institution-and-infrastructure-building approach to funding nonprofits,recognizing strong Black-led institutions, alliances, coalitions, groups, and individualsare more important than ever.
The LA County/City Native American Indian Commission (LANAIC) letter in support of the motion, “-Ensuring Collection of Full Racial and Ethnic Data COVID-19 Patients throughout LAC” (see attached for the full letter): 1. Collect race and ethnic data for all COVID-19 testing, reported cases, and related
fatalities;2. Share race and ethnic data for high-risk individuals housed in emergency shelters;3. Collect race and ethnic data upon testing, hospital admission and any other healthcare
interaction related to COVID-19. Collection efforts should prioritize self-reported race;4. Use the following definitions of AI/NA for reporting:
a. Those who identify as AI/NA aloneb. Those who identify as AI/NA alone and in combination with other racesc. Those who AI/NA who identify as Hispanic
5. Work collaboratively with the LANAIC, local AI/NA data experts, and AI/AN-servingorganizations when collecting and reporting AI/NA health data.
The Asian American, Native Hawaiian and Pacific Islander (AANHPI) Health Collaborative (see attached for the full letter): 1. Improve accessibility, outreach, and translation of COVID-19 materials and
information for AANHPI communities;2. Improve disaggregated data coordination, collection, and coding among various
AANHPI ethnicities;a. Engage and partner with existing AANHPI researchers and epidemiologists
who have experience in disaggregating and developing models for AANHPIdata to improve surveillance for communicable diseases, such as COVID-19;and
b. Form an Asian & Pacific Islander Task Force prioritizing COVID-19 needs ofcommunities by making recommendations to the Board of Supervisors, theHealth Agency, and Public Health on policies and practices to improve healthin Los Angeles County. One of the key tasks of the Task Force can be to focuson the recommendations listed above.
3. More specific issues and proposed solutions are included in the letter.
7. Provide more inclusive data collection, reporting, and deeper analyses tounderstand the unique risk and preventive factors among highly impactedcommunities.These actions are critical to informing and shaping the interventions needed to reduce thenegative health impacts of COVID-19. More in-depth analyses would require further examinationof factors such as the community and individual levels of access to care, underlying conditionsthat increase risk, clinical course among those that died, hospital admissions, and environmentaland health equity factors (e.g., income, residence, education, employment status, or type ofemployment/ exposure level to COVID-19).
Strategies for Addressing COVID-19 Disparities in Health Outcomes Page 7 of 8 Among Highly Impacted Populations
Per a Board Motion on April 13, 2020, Public Health has been tasked with collecting full racial and ethnic data, including a breakdown by age groups and socioeconomic status across all testing sites. Frequent updates will be provided to the Board offices and will be posted on the Public Health website.
8. Contact tracing and trackingContact tracing is the practice of identifying and monitoring individuals who may have hadcontact with an infectious person. This work is critical to control the spread of a communicabledisease such as COVID-19. These efforts can be time and labor intense as they requireinterviewing skills, emotional intelligence, and oftentimes, multi-language capacity. As thenumber of cases rises, so will the need for knowledgable and trusted personnel to conductthis essential work.
Recommendations:a. Work with trusted partners/CBOs in contact tracing for hard-to-reach populations; andb. Increase the number of culturally competent interviewers in AA/Latino populations that are
more at risk. Consider using Public Health Investigators who are skilled interviewers of at-riskgroups.
9. Strengthen a tailored communication strategy to increase language access andconduct more robust outreach, education, and engagement.Information should be accurate, culturally, and linguistically appropriate, action-oriented,timely, and accessible.
Recommendations:a. Materials should continue to provide accurate information, including attention to dispelling
myths and rumors (could leverage Health Education Administration to maintain and updatematerials).
b. Information/education should include how and when to access testing, clinical care, andresources, with specific attention to the needs in highly impacted communities.
c. Engage community partners and leaders (e.g., focus groups, discussions, interviews) to seekinput and refine health messages for specific communities; community leaders should beengaged to help create messaging and assist with the timing of releasing information.
d. Partner with organizations/leaders trusted by the community (e.g., faith leaders, non-Englishmedia, and community agencies) to share key health messages.
e. Communicate and collaborate with ethnic and diverse media outlets to disseminateinformation, including translating press releases in more languages for ethnic media.
f. In addition to using traditional media (e.g., billboards, bus stops, PSAs), partner with others,and use non-traditional communication strategies (e.g., social media).
g. Information must be timely. For example, before lifting Safer at Home orders,• provide clear guidelines and communications on what individuals can do to protect
themselves and others;
Strategies for Addressing COVID-19 Disparities in Health Outcomes Page 8 of 8 Among Highly Impacted Populations
• explain rationale that Orders were in place to ensure the healthcare system would notbe overburdened;
• institutions must also have clear guidelines on how to maintain mitigation efforts.h. Launch a data-driven systematic education/awareness campaign one week before lifting stay
at home order.• An awareness campaign should inform the population regarding who is at high risk
for serious illness (e.g., the 20% who have bad outcomes); provide informationregarding who is at high risk based on data collected on hospitalized patients andthose that have died (e.g., types of underlying health conditions such as type ofdisease, BMI, smoking, vaping, or other factors).
• Business owners, schools, service providers, persons who live with persons at highrisk, and relatives of persons at high risk should understand who the highly impactedpopulations are.
• The awareness campaign should educate that wearing face masks reduces the spreadof COVID to others and that you need to take additional measures to protect yourself(e.g., 6ft AND more, wash your hands for 20 seconds, stay at home) to reduce the riskof being infected.
Next StepsExpand access to COVID-19 Polymerase chain reaction (PCR) testing and health care services among highly impacted populations through partnerships with local providers and CBOs.
• Working with DHS to expand community testing sites in underserved communities• Implementing a broader testing strategy at Skilled Nursing Facilities• Planning with Federally Qualified Health Centers (FQHCs) and community providers to improve
access to needed care and support
Develop work plans, beginning with focus group feedback, for specific populations, including: • Blacks/African Americans
Based on earlier data preliminarily indicating a greater risk of death from COVID-19 for African Americans, the following steps have already been taken or are in progress:
o Released an FAQ and flyers on COVID-19 and African American communities;o Participated in radio interviews related to the data findings and African Americans; ando Recording COVID-19 Public Service Announcements (PSAs) for the African American
community, after receiving feedback from a focus group.• Asian American Native Hawaiian And Pacific Islanders• American Indian/Alaska Natives• Latinx• Undocumented Populations
o The Los Angeles County Office of Immigrant Affairs (OIA) released both a poster for the uninsured and an FAQ on Coronavirus for Immigrants.
Finalize the development of a virtual “Town Hall for Action.” • In partnership with The California Endowment and LA Care• To invite and lift actionable strategies to prevent, mitigate, and control COVID-19 spread in
populations already disproportionately impacted
April 14, 2020 From: The Undersigned Black-led-and-serving Organizations
An Open Letter to Philanthropy and Government Leaders: Equity Meets Its Moment
Just three weeks into research on the myriad ways in which the novel coronavirus is devastating communities across this country a story is emerging that is not novel: Black people are dying at disproportionate rates across the country. At this early stage in the U.S. COVID-19 crisis, the stark racial disparity in death rates is linked to disparities in underlying health and economic conditions that increase the likelihood of death as a result of COVID-19. These health conditions—our conditions—are rooted in a history of being denied access to quality food, medical treatment, and the physiological stress of intergenerational racial terror.
As this epidemiological crisis continues, you should expect to hear stories suggesting that even when controlling for underlying health conditions, Black people are still dying from COVID-19 at disproportionate rates. Hidden in the statistics are questions none of us can ignore: how are Black people treated by nurses and physicians when seeking treatment for symptoms of COVID-19? How does race factor into the question of who lives or dies?
You should also expect to hear stories about Black people, particularly poor Black people, bearing the brunt of the severe economic dislocation caused by this pandemic. Yet, as funders and government leaders, you should not wait until these stories hit the front pages of our leading newspapers. You know the history. You know the right now. You should act immediately to robustly support those community-based organizations that empower Black Californians to both survive and challenge inequitable conditions.
In 2011, UCLA Luskin School of Public Affairs reported in its Annual State of the Sector Report that 39% of nonprofit organizations that disbanded between 2002—2011 in LA County served neighborhoods where more than 20% of the population lived in poverty and more than 40% of the residents were African American.
Data published by the Philanthropic Initiative for Racial Equity in 2017 revealed the proportion of annual grant money for African Americans decreased by 4.3% between 2005-2014, the highest decrease of any POC group over the same time period.
In its 2018 report, The Racial Wealth Gap, the California Budget and Policy Center detailed how government-sponsored policies and discriminatory practices have driven the racial wealth gap, where in 2014, the median value of liquid assets for white households in Los Angeles was $110,000, compared to $200 for US-born black households.
That same year, the LA County Department of Public Health Center for Health Equity published its action plan for birth equity, in which racism and its impact on life outcomes was the clear and determinant public health factor impacting Black infant and maternal death.
In 2019, the LA Homeless Service Authority declared in its groundbreaking report on Black people and homelessness: Structural racism, discrimination, and unconscious bias in housing,
employment, criminal justice, and child welfare policies have led to overrepresentation of Black people experiencing houselessness.
Data is clear: racial injustice continues to serve as a destructive force in society, undermining our economy, humanity and self-professed values of liberty and justice for all.
As Black-led-and-serving organizations, we are on the frontlines. We live the truth of inequity: that Los Angeles, the Inland Empire, and indeed, the nation, have historical legacies rooted in institutional and systemic racism; that our communities have been harmed by oppression and neglect.
Progress on Black equity and racial justice must be part of any forward movement in the United States, and it will only be achieved when philanthropic investments, public policies, and institutional practices boldly confront racial injustice.
Now is the time to double and triple down on eradicating it. Now is when equity gets put to the test. And now is the time to make good on your word: equity matters.
This begins with a commitment to invest in Black community organizations.
Why? Because Black communities continue to be the canary in America’s social and economicmine. From poor performing schools to predatory lending practices, our community experiences the pain first. Our communities have had to withstand the unnecessary loss of lives due to failed public policies and racial bigotry. At the same time, we are the pioneers of social justice resistance and transformative innovation. When reflecting on anti-terror lynching movements of the NAACP to the Black Panther Party’s free lunch and clinic programs to LA CAN’s COVID-19 sanitation centers in Skid Row, our community’s first responders have been leading the way in showing government and NGOs alike how to care for the needs of people rather than discard the people all together. We are more than CBOs: we are family. Some of us have lost members of our natural family to COVID-19 while coming to the aid of our community families. That is why we cannot be silent in this moment.
The one thing you, as philanthropic and government leaders can control in this crisis, is how we will be better when it’s over.
As funders and public officials, we call on you to act with the fierce urgency of now. We call on you to:
● Use your voice and public platform to speak about systemic harm to Black people andadvocate for equity-based investments
● Commit to rigorously tracking the flow of dollars from your institution to Black-led-and-serving organizations
● Increase investments in Black CBOs by at least 25%, in line with the recommendationsmade in 2017 by the Association of Black Foundation Executives (ABFE)
● Fully fund public departments and commissions tasked with anti-discrimination andracial equity enforcement (e.g., Office of Racial Equity, Civil and Human RightsOrdinance, Equity and Targeted Student Achievement, Perinatal Equity Initiative/BlackInfant Health, among others)
● Take an institution-and-infrastructure-building approach to funding nonprofits,recognizing strong Black-led institutions, alliances, coalitions, groups and individuals aremore important than ever.
Our collective work is both timeless and urgent. Disrupting systemic oppression cannot wait, nor can our response be colorblind or race neutral when the outcomes are not. Lives are at stake.
We can design an equitable recovery. For the sake of our shared humanity, we must.
In community,
Executive Directors (signed below) The undersigned organizations are part of the Black Equity Initiative (BEI) and the African American Infant and Maternal Mortality (AAIMM) Initiative. Black executive directors denoted by *.
Black Equity Initiative
Susan Burton*, A New Way of Life Re-Entry Project
John Kim, Advancement Project California
Sam Lewis*, Anti-Recidivism Coalition
Janette Robinson Flint*, Black Women for Wellness
Dina Walker*, BLU Educational Foundation—San Bernardino
Charisse Bremond Weaver*, Brotherhood Crusade
Mary Sutton, Collective REMAKE
Alberto Retana, Community Coalition (CoCo)
Jessica Ellis, Centinela Youth Services
Rev. Sam Casey*, Congregations Organized for Prophetic Engagement (COPE)—San Bernardino
Jeffery Wallace*, LeadersUp
Janel Baily* and LaTonya Harris*, Los Angeles Black Worker Center
Pete White*, Los Angeles Community Action Network (LA CAN)
Areva Martin*, Special Needs Network
Gloria Walton*, Strategic Concepts in Organizing and Policy Education (SCOPE)
Tremaine Mitchell*, Youth Action Project—San Bernardino
African American Infant and Maternal Mortality (AAIMM) Initiative
Michelle Fluke, Antelope Valley Partners for Health
Janette Robinson Flint*, Black Women for Wellness (also a BEI organization)
Sonya Young Aadam*, California Black Women’s Health Project
Dr. Sayida Peprah, PsyD*, Diversity Uplifts
Wenonah Valentine*, iDREAM for Racial Health Equity, a project of Community Partners
Kimberly Durdin* and Allegra Hill*, KindredSpaceLA and Birthing People Foundation
LOS ANGELES CITY/COUNTYNATIVE AMERICAN INDIAN COMMISSION
3175 West 6th Street, Los Angeles, California 90020(213) 738-3241 | Fax (213) 637-9655 | www.lanaic.org | [email protected]
ChairpersonCHRISSIE CASTRONavajo
Vice ChairpersonRUDY ORTEGA JR.Fernandeño Tataviam
TreasurerSHAWN IMITATES-DOGChoctaw/Lakota
SecretaryPAT LOPEZTaos Pueblo/Tiwa
ANDREA N. GARCIA, M.D.Mandan, Hidatsa, Arikara
ALLISON HICKSPrairie Band of PotawatomiNation/Choctaw
DAWN JACKSONSaginaw Chippewa
FRED LEAFPotawatomi
RANDALL MURPHYChoctaw/Lakota
TRACY PEREZNavajo
JOSEPH A. QUINTANAKewa Pueblo
TED TENORIOTiguan Nation
CHERI THOMASQuinault/Yurok
Executive DirectorALEXANDRA VALDESTlingit/Athabascan
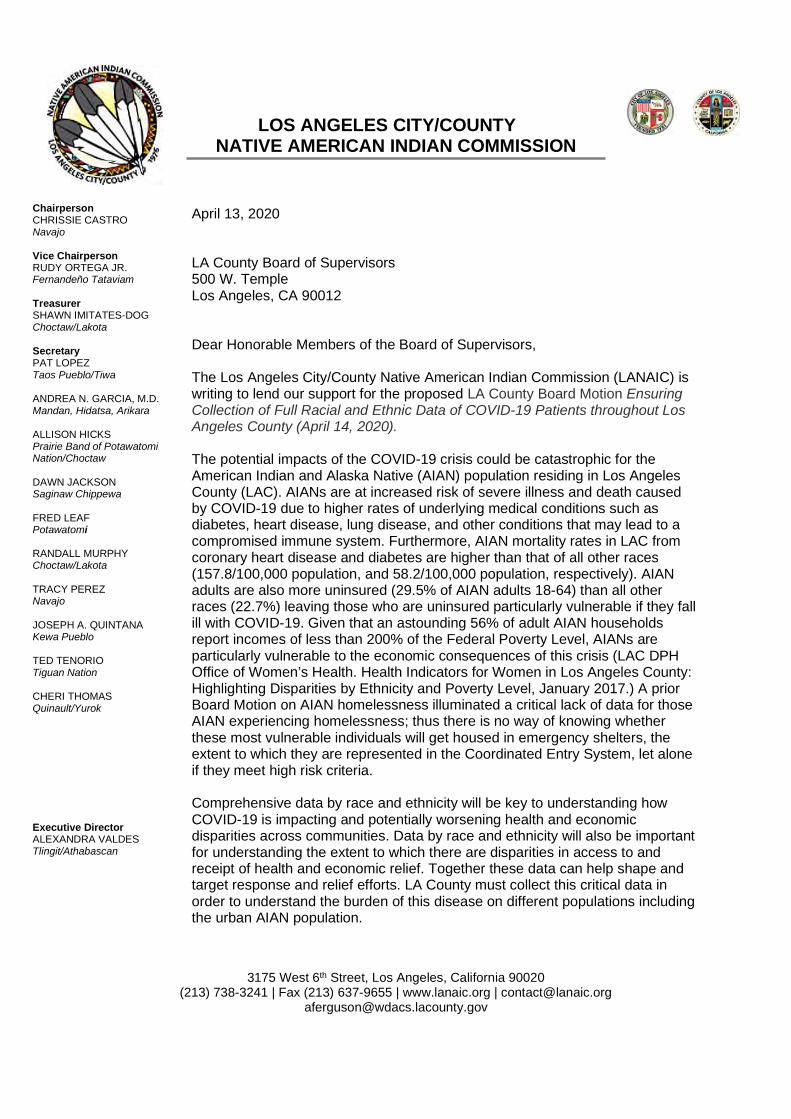
April 13, 2020
LA County Board of Supervisors500 W. TempleLos Angeles, CA 90012
Dear Honorable Members of the Board of Supervisors,
The Los Angeles City/County Native American Indian Commission (LANAIC) iswriting to lend our support for the proposed LA County Board Motion EnsuringCollection of Full Racial and Ethnic Data of COVID-19 Patients throughout LosAngeles County (April 14, 2020).
The potential impacts of the COVID-19 crisis could be catastrophic for theAmerican Indian and Alaska Native (AIAN) population residing in Los AngelesCounty (LAC). AIANs are at increased risk of severe illness and death causedby COVID-19 due to higher rates of underlying medical conditions such asdiabetes, heart disease, lung disease, and other conditions that may lead to acompromised immune system. Furthermore, AIAN mortality rates in LAC fromcoronary heart disease and diabetes are higher than that of all other races(157.8/100,000 population, and 58.2/100,000 population, respectively). AIANadults are also more uninsured (29.5% of AIAN adults 18-64) than all otherraces (22.7%) leaving those who are uninsured particularly vulnerable if they fallill with COVID-19. Given that an astounding 56% of adult AIAN householdsreport incomes of less than 200% of the Federal Poverty Level, AIANs areparticularly vulnerable to the economic consequences of this crisis (LAC DPHOffice of Women’s Health. Health Indicators for Women in Los Angeles County:Highlighting Disparities by Ethnicity and Poverty Level, January 2017.) A priorBoard Motion on AIAN homelessness illuminated a critical lack of data for thoseAIAN experiencing homelessness; thus there is no way of knowing whetherthese most vulnerable individuals will get housed in emergency shelters, theextent to which they are represented in the Coordinated Entry System, let aloneif they meet high risk criteria.
Comprehensive data by race and ethnicity will be key to understanding howCOVID-19 is impacting and potentially worsening health and economicdisparities across communities. Data by race and ethnicity will also be importantfor understanding the extent to which there are disparities in access to andreceipt of health and economic relief. Together these data can help shape andtarget response and relief efforts. LA County must collect this critical data inorder to understand the burden of this disease on different populations includingthe urban AIAN population.

LOS ANGELES CITY/COUNTY NATIVE AMERICAN INDIAN COMMISSION [ 2 ]
Data describing AIAN is already underreported, omitted, or highly inaccurate and we mustensure that is not the case with COVID-19. Though the AIAN population is small relative toother ethnic and minority populations, Los Angeles County contains the largest number of AIANcompared to all other counties in the United States (roughly 171,000). Previous AIANresearchers and advocates attempted to address this data issue in 2002 with a motionsponsored by Supervisors Burke and Antonovich that directed multiple county entities toimprove data collection for AIAN. Nearly two decades later in October 2019 similar directiveswere made to various County entities to improve AIAN data collection with the passage of theBoard Motion, Identifying, Supporting and Serving American Indians and Alaska Natives whoare at Risk of or Experiencing Homelessness.
Even with the aforementioned efforts we know that data collection of the AIAN communityremains a challenge for LA County. In order to ensure it is collected properly during the COVID-19 crisis we recommend the following:
That racial data be reported for those tested (to assess for testing disparities), thosereported positive, and COVID-19-related fatalities
That racial data be reported for those high-risk individuals who are housed in emergencyshelters
Mandate that racial data be collected upon testing, hospital admission and any otherhealthcare interaction related to COVID-19. Collection efforts should prioritize self-reported race.
That the following definitions of AIAN be reported:o Those who identify as AIAN aloneo Those who identify as AIAN alone and in combination with other raceso Those who AIAN who identify as Hispanic
That the Departments of Public Health and Health Services work collaboratively with theLANAIC, local AIAN data experts, and AIAN serving organizations when collecting andreporting AIAN health data
We applaud the Board’s effort to understand the disparate effects that COVID-19 may have onunderserved communities.
Sincerely,
Chrissie CastroChairpersonLos Angeles City/County Native American Indian Commission
Dear Dr. Davis,
While there is appreciation for the current level of in-language materials produced by the LA County Department of Public Health in addition to the in-language services provided by 2-1-1, we are not sure if they are reaching the most vulnerable AANHPI communities as there are limitations to directing those communities to the DPH website, as well as 2-1-1. Looking at recently released COVID-19 death data by the LA County Department of Public Health (as of 4/16/2020), there was a higher percentage of Asian deaths compared to the current county population (17% versus ~14%). We strongly recommend the exploration of the following activities that will maximize the impact of your efforts towards AANHPI communities:
1) Improve accessibility, outreach and translation of COVID-19 materials and informationfor AANHPI communities.
2) Improve disaggregated data coordination, collection, and coding among various AANHPIethnicities.
a) Engage existing AANHPI researchers and epidemiologists who have experiencein disaggregating and developing models for AANHPI data
3) Form an Asian & Pacific Islander Task Force prioritizing COVID-19 needs ofcommunities by making recommendations to the Board of Supervisors, the HealthAgency, and DPH on policies and practices to improve health in Los Angeles County.
a) One of the key tasks of the Task Force can be to focus on recommendationslisted in this letter.
In addition, a detailed list of COVID-19 outreach recommendations impacting AANHPI communities can be found on page 3 of this letter. This list of issues and potential solutions was put together collaboratively by a diverse set of leaders in our coalition.
About the AANHPI Health Initiative
Our Mission
The Initiative’s mission is to bring AANHPI (Asian American, Native Hawaiian and Pacific Islanders) health issues to the forefront so they can be actively addressed and result in the elimination of health disparities in these communities, with a specific focus on Los Angeles County.
Core Goals
● Develop a strong relationship between AANHPI communities and the LA CountyDept. of Public Health.
● Advocate for Los Angeles County Dept. of Public Health to recognize, prioritizeand address the AANHPI health disparities in this county.
● Consolidate and coordinate the health work our organizations are already doingto eliminate duplication, while also building with our shared resources.
● Analyze and tailor currently-used evidence based strategies to work for theAANHPI communities we serve.
Membership Includes:
● Asian American Advancing Justice - Los Angeles● Asian Americans/Pacific Islanders in Philanthropy - Los Angeles● Asian Pacific Islander Forward Movement● Asian Pacific Health Care Venture● Asian Pacific Policy & Planning Council● L.A. Walks● Pacific Islander Health Partnership● Southeast Asian Community Alliance● UCI Chao Family Comprehensive Cancer Center, Office of Community Outreach and
Engagement● Jonathan Nomachi● Ray Niu, American Heart Association H3 Employee Resource Group
In this unprecedented time, we are grateful for the leadership and the maximum effort demonstrated by County leaders such as the LA County Department of Public Health and look forward to further engagement in strengthening targeted outreach to AANHPI communities in LA County.
Respectfully,
Members of the Asian American, Native Hawaiian, Pacific Islander Health Initiative

Detailed COVID-19 Outreach Recommendations:
Overcrowded Housing
○ Issue: There are hidden AANHPI populations who do not receive or seek resources through traditional means, such as through Public Departments or CBO’s. These include: “boarding house” Immigrants and multi-family and multi-generational homes.
i. Solution: Expand LACDPH’s direct/personal outreach methods to better inform these individuals. This includes partnering and funding local CBO’s who are most closely connected to the community.
ii. Solution: Collaborate with ethnic restaurants and grocery networks/owners to help disseminate information to. Many in this population are in the restaurant or grocery industries and word-of-mouth is the best way to reach them.
NHPI Communities
○ Issue: NHPI communities rely heavily on churches, faith-based organizations (FBO), professional groups, and community-based organizations (CBO) to receive updates and resources regarding COVID-19. However, there are concerns that these key community institutions are not receiving timely information related to coronavirus.
i. Solution: Ensure NHPI FBO’s are aware of upcoming press briefings so they are prepared to share with their community members.
ii. Solution: Develop partnership with NHPI healthcare professional groups on social media as champions and messengers.
iii. Solution: Create a complete directory for NHPI community-based organizations and faith-based leaders/churches.
○ Issue: Some NHPI communities lack internet access, and much of what is shared requires internet, email and social media.
i. Solution: Work with low-cost phone service providers (such as Cricket) to disseminate resources through texts and calls.
ii. Solution: Focus more on phone-call outreach due to lack of internet access within the community.
○ Issue: Many NHPI communities fall under the federal “Compact of Free Association (COFA)” work authorization agreements and do not qualify for medi-cal, unemployment, and many social services.
i. Solution: LADPH to work with other county departments to create a mortarium and enable these communities to access state and county health and social service programs.
○ Issue: NHPI and African American communities appear to comprise a higher proportion of the deaths, and possibly the proportion of cases, compared to their
percent of the California and Los Angeles population. NHPIs might be coded incorrectly as Hispanic/Latino and/or Asian. It is unclear how individuals with mixed heritage are coded. Much of how data is coded and collected by race is crucial in understanding how education and information is being accessed
i. Solution: AANHPI researchers at UCLA, UCI, and across California havebeen closely monitoring the impacts of COVID-19 in our communities.They have experience in disaggregating AANHPI data and developingmodels of data collection. Partner with AANHPI researchers,epidemiologists, and scientists in improving surveillance forcommunicable diseases, such as COVID-19.
Community Based Organizations ○ Issue: CBO staff are overwhelmed with the amount of COVID-19 digital clutter.
i. Solution: A more organized and central place to ease looking upin-language information for staff to share with clients/communitymembers.
○ Issue: CBOs are meeting demands for in-language and supportive services on:small business relief, applying for unemployment, utilization of public benefits andpublic charge concerns, COVID-19 questions and testing; distributing carepackages to community members who lack access to food, basic necessities(soap, rice, sanitizer, masks, etc)
i. Solution: Official County script/quick guide for CBOs and clinic staff toaddress in-language community questions.
ii. Solution: Clarity on eviction moratoriums, rent relief, etc to immigrantcommunities.
iii. Solution: Ability for CBOs to connect with suppliers where they can bulkitems to create care packages.
iv. Solution: Guidelines/tool-kit in multiple languages on how to safelyoperate distribution centers offering crucial supplies and services tocommunities in need.
General AANHPI Population ○ Issue: AANHPI communities do not have access to the most up-to-date or
accurate information regarding COVID-19 developments in their respectivelanguages.
i. Solution: Translate all press releases and distribute to in-language mediain their respective languages.
● For Chinese, Vietnamese, Filipino, and Korean communitiesa. Media, print, broadcast, and radio are effective ways to
distribute information to in-language communities. Allshould have a “city-desk” or “Editor@” email account thatwill capture all press releases and be distributed by aneditor to reporters.
ii. Solution: Allow DPH presentations/town halls available in multipleAANHPI languages.
iii. Solution: Leverage relationships with local AANHPI media and radiogroups to host in-language COVID-19 segments, PSAs, and resourcesavailable by DPH.
iv. Solution: DPH can outreach to the following essential services todistribute information in multiple languages:
● Food Delivery/School Lunch Programs to update communitymembers in-language.
● Gas stations - many have video monitors and signs at the pump..● Ethnic grocery stores and Food 4 Less. Many are located in
low-income communities○ Issue: Prolonged wait-times to assess need for translator on COVID 19 helpline.
i. Solution: Script for 2-1-1 operators to have pre-set in-languagemessages ready to understand the process of identifying an interpreter tobetter support their resource questions