report on measures for 2016 exceedance of the target value
TRANSCRIPT

Report on measures for 2016
exceedance of the Target
Value for Nickel in Sheffield
Urban Area agglomeration
zone (UK0007)
December 2018

© Crown copyright 2018
You may re-use this information (excluding logos) free of charge in any format or medium,
under the terms of the Open Government Licence v.3. To view this licence visit
www.nationalarchives.gov.uk/doc/open-government-licence/version/3/ or email
This publication is available at www.gov.uk/government/publications
Any enquiries regarding this publication should be sent to us at
Air Quality and Industrial Emissions Department for Environment, Food and Rural Affairs Ground Floor, Seacole Building
2 Marsham Street
London, SW1P 4DF
Email: [email protected]
With technical input from Ricardo Energy & Environment
www.gov.uk/defra

Contents
1. Introduction ...................................................................................................................... 5
1.1 Context ....................................................................................................................... 5
1.2 Status of zone ............................................................................................................ 5
2 Exceedance situation Sheffield [Ni_UK0007_2016_1] related to industrial emissions ...... 7
2.1 Description of exceedance ......................................................................................... 7
2.2 Source apportionment .............................................................................................. 10
2.3 Measures ................................................................................................................. 14
2.4 Modelling .................................................................................................................. 21
2.5 Monitoring ................................................................................................................ 21
3. Industrial Sources of Nickel ........................................................................................... 22
3.1 Environment Agency Regulated Plant Part A ........................................................... 22
3.2 Local Authority Regulated Plant Part B .................................................................... 22
3.3 Unregulated plant – Local Authority ......................................................................... 22
A1. Local scale modelling of the industrial point sources ................................................... 23
A1.1. Ni emissions data and data from related studies .................................................. 23
A1.2. Modelling approach ............................................................................................... 44
A1.3. Model results......................................................................................................... 47
A1.4. Conclusions .......................................................................................................... 52
A2. Monitoring studies ....................................................................................................... 54
Executive Summary.............................................................................................................. 57
Introduction ........................................................................................................................ 58
Methods ............................................................................................................................. 60
Measurement Campaign ................................................................................................... 60
Instrumentation ............................................................................................................... 60
Emissions from local industrial processes ........................................................................... 61
Source identification ........................................................................................................ 63
Results ................................................................................................................................ 65
Temporal representativity ................................................................................................ 65
PM mass concentrations and chemical composition ........................................................... 67
Positive Matrix Factorisation (PMF) Source Apportionment ................................................ 73
Apportionment of Ni measurements using k-means cluster analysis of bivariate polar plots . 82
Conclusions ......................................................................................................................... 85
References .......................................................................................................................... 87
Appendix............................................................................................................................. 88

5
1. Introduction
1.1 Context
Under the EU Directive 2004/107/EC1, the target value (TV) for nickel (Ni) is an
annual mean concentration of 20 nanograms (one billionth of a gram (10-9)) per
cubic metre (m-3) of ambient air or lower. The Directive requires that Member States
shall report on measures in place to address the exceedance of the TV and that all
reasonable measures that do not entail disproportionate cost should be taken to
ensure this target is not exceeded.
Exceedance of the TV was reported in 2014 in the Sheffield Urban Area and a report
on measures was published detailing the exceedance and the measures in place2.
This document reports the exceedance situation for 2016 reflecting the more recent
assessment and updating the 2014 report on measures.
1.2 Status of zone
This is the report on measures required for exceedances of the TV for Ni within the
Sheffield Urban Area agglomeration zone identified within the 2016 UK air quality
assessment. Exceedances within this zone were identified on the basis of
measurement data, with model results on a 1 km x 1 km grid resolution providing
supplementary information. Fine scale modelling on a 50 m x 50 m grid resolution
located around an identified industrial source provides additional information for this
report on measures. This exceedance was reported via e-Reporting dataflow G3 on
attainment and Air Pollution in the UK4.
Table 1 summarises the spatial extent and associated resident population for the
exceedances identified in this zone, as reported via e-Reporting.
1 http://eur-lex.europa.eu/LexUriServ/LexUriServ.do?uri=OJ:L:2005:023:0003:0016:EN:PDF 2 https://uk-air.defra.gov.uk/library/bap-nickel-measures 3 http://cdr.eionet.europa.eu/gb/eu/aqd 4 http://uk-air.defra.gov.uk/library/annualreport/index

6
Table 1. Area exceeding Ni target value in 2016 and associated resident
population for exceeding areas within Sheffield Urban Area zone UK0007.
Zone code Zone Name Area exceeding TV
(km2)
Population exceeding TV
UK0007 Sheffield Urban Area None reported None reported
Figure 1 shows the locations of the exceedances in the context of the zone as a
whole.
Figure 1. Location of exceedance of the Ni target value in 2016 in Sheffield
Urban Area zone UK0007. Location of the exceeding monitoring station is
marked by the red circle. The area of the circle is indicative of the location of
the exceedance and does not represent the exceedance area reported.
An initial source apportionment was carried out and this analysis identified one
exceedance situation within this zone related to industrial emissions:
• Sheffield [Ni_UK0007_2016_1] related to industrial emissions (measured
exceedance at one monitoring station)

7
This report describes the exceedance situation in the zone. The sections below
include a description of the exceedance situation, including maps, information on
source apportionment and a list of measures already taken or to be taken.
Information on measures is reported within e-Reporting dataflow K.
2 Exceedance situation Sheffield [Ni_UK0007_2016_1] related to industrial emissions
2.1 Description of exceedance
This exceedance situation is located in the valley of the river Don to the North East
of Sheffield City Centre in the Sheffield Urban area agglomeration zone. The
exceedance was reported on the basis of measurements at the Sheffield Tinsley
monitoring station. The exceedance was reported at the location of the measurement
station and no population was reported for this exceedance.
Table 2 lists measured annual mean concentrations of Ni from monitoring sites in
Sheffield Urban Area agglomeration zone from 2004-2017, and Figure 2 indicates
the location of measurement sites. There is one measured exceedance at Sheffield
Tinsley (GB0538A) in 2016 for which this report relates. Figure 3 shows the location
of the exceedance situation in detail. The concentration of Ni at the other monitoring
station within the Sheffield Urban Area agglomeration zone was below the TV in
2016 and no other exceedances have been reported during the 2004-2017 period
apart from the measured exceedance reported for 2014.
Figure 3 shows the exceedance situation Ni_UK0007_2016_1 in detail. The figure
indicates the location of the measured exceedance. In addition, the figure presents
the results of national modelling on a 1 km x 1 km grid resolution that were submitted
to the Commission as a supplementary assessment. No modelled exceedance was
reported for the Sheffield Urban Area in 2016. Zone boundaries for the 1 km model
grid used to assign exceedance situations and associated populations are presented
as black hatching. Figure 3 shows the location of several industrial sites located
close to Sheffield Tinsley monitoring station.
The measured annual mean concentration of Ni at Sheffield Tinsley (GB0538A) in
2017 was 17 ngm-3 (99% data capture). This is below the Ni TV and therefore this
exceedance situation does not persist in 2017.

8
Figure 2: Location of monitoring sites in Sheffield Urban Area.

9
Table 2 Measured annual mean Ni concentrations in Sheffield Urban Area agglomeration zone UK0007 from 2004 to 2017
(ngm-3). (Percentage data capture is shown in brackets).
Station (EoI code) 2004 2005 2006 2007 2008 2009 2010 2011 2012 2013 2014 2015 2016 2017
Sheffield Brinsworth
(GB0792A)
20* 14* 12
(98)
11
(100)
12
(94)
9.8
(96)
15
(98)
15
(98)
13
(100)
13
(70)
Sheffield Centre
(GB0615A)
2 (92) 1.7
(98)
2.5
(98)
2.2
(91)
2.6
(88)
3.2
(66)
Sheffield Devonshire
Green (GB1027A)
0.86
(11)
2.6
(99)
1.9
(100)
2.7
(98)
1.7
(100)
Sheffield Tinsley
(GB0538A)
14
(81)
21
(96)
18
(94)
24
(89)
17
(99)
* Data capture not available

10
Figure 3 Exceedance situation Sheffield [Ni_UK0007_2016_1]. The exceeding
monitoring station is marked in red. Locations of local industrial sites are also
shown. Non-hatched grid squares are assigned to the Yorkshire and
Humberside zone UK0034 and do not form part of this exceedance situation.
Note that multiple emissions sources are indicated on the map for some
industrial sites (Outokumpu, Sheffield Forgemasters International Ltd, AMG
Superalloys UK Ltd, E.L.G. Haniel Metals Limited, Harsco Metals Group
Limited (Steelphalt), Trefoil Steel Company Limited, and CF Booths Limited).
2.2 Source apportionment
Modelling has been used to determine the annual mean Ni source apportionment for
the exceedance situation. National modelling on a 1 km x 1 km grid resolution
apportions the Ni concentration to regional and urban background sources.
Additional fine scale modelling has also been carried out in support of this Report on
Measures to characterise local industrial emissions, this is described in Appendix A1.

11
Table 3 provides a breakdown of the main emission sources (source apportionment)
that have contributed to the grid square in this exceedance. The penultimate column
is the total concentration from all emissions sources and is equal to the annual mean
Ni concentration measured at the Sheffield Tinsley monitoring site. The total
concentrations are presented rounded to integers for consistency with the values
reported in the compliance assessment. The values in the other columns have been
rounded to two decimal places. The other shaded columns are the subtotals for the
regional, urban background and local contributions.
Table 3 identifies that local emissions from industrial sources are the most significant
source of Ni. Table 4 gives a more detailed source apportionment for the industry
sector based on the fine scale modelling study presented in Appendix A1. This
shows local industrial emissions contribute 21.55 ngm-3 Ni to the annual mean
concentration measured at the Tinsley monitoring site, of which 1.08 ngm-3 derives
from unidentified local activities. This study also shows that the Outokumpu site is
the most significant local industrial emissions source contributing 11.06 ngm-3, as
indicated in Table 4, which includes contributions from reported emissions and a
contribution attributed within the modelling to diffuse sources on the site.
The source apportionment presented here has been informed by the fine scale
modelling carried out in support of this Report on Measures. The contribution from
the local industrial sources that were included within the fine scale model were
removed from the national model results. Therefore, there are differences between
the results of the national model presented in Figure 3 and submitted to the
Commission and the background annual mean source apportionment concentrations
presented in Table 3.

12
Table 3. Source apportionment for exceedance situation Ni_UK0007_2016_1. Annual mean Ni concentration (ngm-3).
OS
eastin
g (
m)
OS
No
rth
ing (
m)
Zone
a)
Re
gio
na
l b
ackg
rou
nd:
Tota
l
Re
gio
na
l b
ackg
rou
nd: F
rom
with
in M
em
ber
Sta
te
b)
Urb
an
ba
ckgro
un
d
incre
me
nt: T
ota
l
Urb
an
ba
ckgro
un
d
incre
me
nt: T
raff
ic
Urb
an
ba
ckgro
un
d
incre
me
nt: I
ndu
str
y in
clu
din
g
hea
t a
nd p
ow
er
pro
du
ctio
n
Urb
an
ba
ckgro
un
d
incre
me
nt: c
om
me
rcia
l a
nd
resid
en
tial
Urb
an
ba
ckgro
un
d
incre
me
nt: S
hip
pin
g
Urb
an b
ackgro
un
d
incre
me
nt: O
ff r
oad m
obile
ma
chin
ery
Urb
an
ba
ckgro
un
d
incre
me
nt: O
ther
c)
Loca
l in
cre
me
nt: T
ota
l
Loca
l in
cre
me
nt: I
ndu
str
y
inclu
din
g h
ea
t a
nd
po
wer
pro
du
ction
Tota
l fo
r a
ll em
issio
ns
so
urc
es (
a+
b+
c)
Re
sid
en
t p
op
ula
tion
440500 390500 7 1.00 1.00 1.03 0.03 0.51 0.37 0.00 0.09 0.02 21.55 21.55 24 2422

13
Table 4. Detailed source apportionment for industrial sources only for exceedance situation Sheffield
[Ni_UK0007_2016_1]. Annual mean Ni concentration (ngm-3).
OS
eastin
g (
m)
OS
No
rth
ing (
m)
Zone
Ou
tokum
pu
Sca
led c
ontr
ibutio
ns
from
Ou
toku
mp
u*
Lib
ert
y S
pecia
lity
Ste
els
AM
G S
upe
rallo
ys U
K
Ltd
Ha
rsco
Me
tals
Gro
up
Lim
ite
d, S
teelp
ha
lt
Oth
er
iden
tifie
d
indu
str
y s
ourc
es fro
m
Ea
st*
*
E.L
.G. H
anie
l M
eta
ls
Lim
ite
d
Sca
led c
ontr
ibutio
ns
from
No
rth E
ast*
**
Sh
eff
ield
Forg
em
aste
rs
Inte
rnatio
na
l Ltd
Oth
er
iden
tifie
d
indu
str
y s
ourc
es fro
m
We
st*
***
Un
iden
tified
so
urc
es
Loca
l in
cre
me
nt:
Indu
str
y in
clu
din
g
hea
t a
nd p
ow
er
pro
du
ction
440500 390500 7 5.82 5.24 0.02 0.03 0.06 0.002 1.47 7.76 0.06 0.01 1.08 21.55
* Contributions from Outokumpu Stainless Ltd (SMACC) attribute to diffuse emissions from roadways and raw material storage
areas, scaled to a measurement-model residual (refer to Appendix A1 for details)
** Other industry sources to the East of the Sheffield Tinsley monitoring site identified as contributing <0.01 ngm-3 each, including
Speciality Steels UK Ltd (Brinsworth Strip Mill) and CF Booths Limited (Clarence Metal Works).
*** Contributions from sources to the North East of the Sheffield Tinsley monitoring site (including E.L.G. Haniel Metals Limited,
Darwin Holdings Limited (Fitzwilliam Works), Trefoil Steel Company Limited (Rotherfield Works)) shown as an aggregated total in
the source apportionment since the individual contributions are unknown and scaled to a measurement-model residual (refer to
Appendix A1 for details)
**** Other industry sources to the West of the Sheffield Tinsley monitoring site identified as contributing <0.01 ngm-3 each, including
VEOLIA ES (SHEFFIELD) Ltd and E.ON Climate and Renewables UK Biomass Ltd.

14
2.3 Measures
Improving air quality is a high priority for the Government, including the attainment of
EU target values. An exceedance in this zone was reported in 2014 and in 2016, but
not in other years since the TV came into force, including 2017. The Government
takes any exceedance seriously whilst ensuring that any measures put in place are
proportionate to the exceedance. The Government has brought together the
regulators and local industrial operators with emissions of Ni to air in pursuit of this
aim. Meetings have enabled:
• the Government to communicate to the industrial regulators and operators the
extent of the issue and the seriousness with which it is taken;
• the regulators to demonstrate that the operators are applying all cost-effective
measures, and in particular are applying best available techniques as required by
Council Directive 96/61/EC;
• the operators to cooperate and share best practice in managing their
operations; and
• the development of the latest evidence in understanding the predominant
sources.
Much of the work in this area has focussed and will continue to focus on the
unidentified and scaled source contributions as highlighted in Table 4. Work thus far
undertaken has included fine scale modelling (Appendix 1) to model the impact of
known emissions to the measurements at Tinsley Monitoring Station and daily and
hourly monitoring campaigns at the Tinsley Monitoring station to obtain greater
temporal resolution as regards the measurements made at the site (Appendix 2).
Table 5 summarises measures taken or to be taken at local industrial sites identified
that may contribute to nickel in ambient air.

15
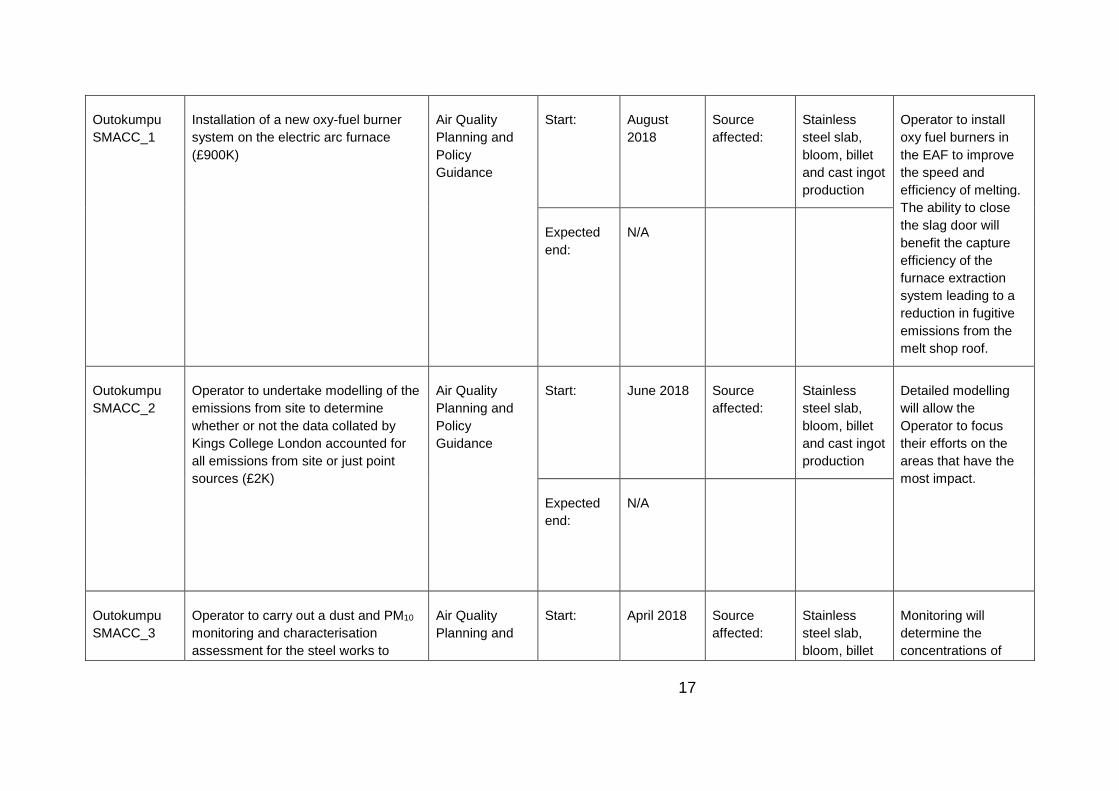
Table 5. Table of measures taken or to be taken at local industrial sites.
Measure
code
Measure Description Classification Implementation dates Other information Comment
ELG Haniel
Metals Ltd_1
Purchase of shearing machine
(@£400K)
Air Quality
Planning and
Policy
Guidance
Start: Dec 2018 Source
affected:
Waste
Processing
(stainless
steel and
non-ferrous
metals)
The use of the
shearing machine
will reduce the
frequency of oxy-
propane cutting,
which is carried out
in the open. Fugitive
emissions (including
particulate
matter/nickel) will
therefore be
reduced.
Expected
end:
N/A
ELG Haniel
Metals Ltd_2
Installation of plasma cutting booth
with ventilation and filtration system
(@11K)
Air Quality
Planning and
Policy
Guidance
Start:
June 2018 Source
affected:
Waste
Processing
(stainless
steel and
non-ferrous
metals)
Previously plasma
cutting was carried
out in the open.
Fugitive emissions
containing nickel

16
Expected
end:
N/A
from this process will
now be abated.
ELG Haniel
Metals Ltd_3
Monitoring of Densifier Unit by a
MCERTS certified monitoring
contractor (£2K)
Air Quality
Planning and
Policy
Guidance
Start: June 2018 Source
affected:
Waste
Processing
(stainless
steel and
non-ferrous
metals)
To determine whether
or not the emissions
arising from this
process contain nickel.
Expected
end:
October
2018
ELG Haniel
Metals Ltd_4
Monitoring of the oxy-propane cutting
station (£2K)
Air Quality
Planning and
Policy
Guidance
Start:
June 2018 Source
affected:
Waste
Processing
(stainless
steel and
non-ferrous
metals)
To determine whether
or not the emissions
arising from this
process contain nickel.
Expected
end:
October
2018
17
Outokumpu
SMACC_1
Installation of a new oxy-fuel burner
system on the electric arc furnace
(£900K)
Air Quality
Planning and
Policy
Guidance
Start: August
2018
Source
affected:
Stainless
steel slab,
bloom, billet
and cast ingot
production
Operator to install
oxy fuel burners in
the EAF to improve
the speed and
efficiency of melting.
The ability to close
the slag door will
benefit the capture
efficiency of the
furnace extraction
system leading to a
reduction in fugitive
emissions from the
melt shop roof.
Expected
end:
N/A
Outokumpu
SMACC_2
Operator to undertake modelling of the
emissions from site to determine
whether or not the data collated by
Kings College London accounted for
all emissions from site or just point
sources (£2K)
Air Quality
Planning and
Policy
Guidance
Start:
June 2018 Source
affected:
Stainless
steel slab,
bloom, billet
and cast ingot
production
Detailed modelling
will allow the
Operator to focus
their efforts on the
areas that have the
most impact.
Expected
end:
N/A
Outokumpu
SMACC_3
Operator to carry out a dust and PM10
monitoring and characterisation
assessment for the steel works to
Air Quality
Planning and
Start: April 2018 Source
affected:
Stainless
steel slab,
bloom, billet
Monitoring will
determine the
concentrations of

18
investigate the concentrations of nickel
and other materials potentially
migrating off site (Ref Doc.
DS/AG/Outokumpu/01) (£26K)
Policy
Guidance
and cast ingot
production
nickel and other
materials potentially
migrating off site
Expected
end:
October
2018
Outokumpu
SMACC_4
Operator to define
measurement/monitoring programme
for fugitive roof emissions.
Air Quality
Planning and
Policy
Guidance
Start:
May 2018 Source
affected:
Stainless
steel slab,
bloom, billet
and cast ingot
production
Monitoring will
confirm the quantity
of fugitive emissions
escaping through the
melt shop roof
Expected
end:
N/A
Outokumpu
SMACC_5
Operator to carry out measurements
as defined in the above monitoring
programme for fugitive emissions (10-
20K)
Air Quality
Planning and
Policy
Guidance
Start:
October
2018
Source
affected:
Stainless
steel slab,
bloom, billet
and cast ingot
production
Monitoring will
confirm the quantity
of fugitive emissions
escaping through the
melt shop roof

19
Expected
end
N/A
Outokumpu
SMACC_6
AOD Fume Hood - scheduled
maintenance (£120K)
Air Quality
Planning and
Policy
Guidance
Start:
2018 Source
affected:
Stainless
steel slab,
bloom, billet
and cast ingot
production
AOD Fume Hood
Replacement leading
to a reduction in
fugitive emissions
from the melt shop
roof - scheduled
maintenance Expected
end:
N/A
Outokumpu
SMACC_7
Refurbishment of main air fan in the
Melt Shop - Scheduled Maintenance
(£70K)
Air Quality
Planning and
Policy
Guidance
Start:
Expected
end:
2018
N/A
Source
affected:
Stainless
steel slab,
bloom, billet
and cast ingot
production
Refurbishment of
main air fan to
increase efficiency of
extraction in the Melt
Shop leading to a
reduction in fugitive
emissions from the
melt shop roof
Sheffield
Forgemasters
International
Limited_1
Installation of new Forge Burning
extraction (@500K)
Air Quality
Planning and
Policy
Guidance
Start:
August
2018
Source
affected:
Steel
Processing
Reduction in
particulates/nickel
emitted to

20
Expected
end:
N/A atmosphere is
expected.

21
2.4 Modelling
Appendix A1 presents fine scale modelling that has identified the emissions sources
as potential contributors to the concentrations measured at Sheffield Tinsley
monitoring station.
2.5 Monitoring
The Report on Measures for 2014 exceedance of the Target Value for Nickel in
Sheffield5 reported the outputs of a daily heavy metals monitoring campaign at
Sheffield Tinsley monitoring station over the period from 25th February 2016 to 9th
August 2016. Analysis of measured metal concentrations was undertaken to provide
measurement-based evidence to identify emissions sources contributing to Nickel
concentrations measured in the Tinsley area. This study identified contributions to
the measured concentration from sources to the South and sources to North East.
The source to the South was consistent with emissions from the Outokumpu site, but
the sources to the North East were not identified. The study identified that monitoring
to a higher time resolution might provide further insight into dominant sources.
During 2017 King’s College London were commissioned to undertake a ten-week
high time resolution (hourly) measurement campaign. This campaign took place
January and March 2017 with the aim of providing further evidence to identify
sources of Ni measured at the Tinsley AURN site. This work identified two sources of
Nickel: one related to point source emissions which was characterised by
molybdenum and manganese and one fugitive source type, characterised by
chromium and calcium, likely to be associated with material handling or transport.
Wind speed and direction measurements were used to quantify where these source
types were emitted from. There were three broad source directions –East, West and
South. The source from the South, which contributed 47% to the Nickel
concentrations measured during the study, was associated with emissions from the
Outokumpu facility. This contribution was associated mainly with point source type
emissions of Nickel, with a smaller contribution from fugitive source type emissions.
5 Report on measures for 2014 exceedance of the Target Value for Nickel in Sheffield Urban Area agglomeration zone (UK0007), https://uk-air.defra.gov.uk/assets/documents/reports/bap-nickel-measures/ni_sheffield_UK0007_reportonmeasures_2014.pdf

22
The source to the East contributed 40% to the measured Nickel concentrations and
was related mainly to industrial sources to the North East. The source from the West
represented emissions from over half of the industries in Sheffield, which lie in that
direction and was dominated by the point source type emissions. The sources to the
West provided the smallest contribution to measured Ni concentrations.
The widespread nature of point source emissions across industries in Sheffield
makes this challenging to tackle. However, the high time resolution measurements
help to focus resources and identify specific emissions from industrial sources.
3. Industrial Sources of Nickel
3.1 Environment Agency Regulated Plant Part A
Further information about operating processes at individual regulated plant can be
found in Appendix A1 and A2. From the industrial sites identified to date,
Outokumpu has been identified as making the most significant contribution from
regulated industry to the levels of Ni measured at Tinsley monitoring site.
Outokumpu is regulated by the Environment Agency and is declared as using BAT.
Ongoing further analysis of emissions samples from the area is being undertaken, in
conjunction with Outokumpu to assist in identification of other potential sources of
fugitive emissions that are currently unidentified. Actions to tackle Nickel emissions
from Outokumpu are presented in Table 5.
3.2 Local Authority Regulated Plant Part B
Further information about operating processes at individual sites can be found in
Appendix A1 and A2. The Local Authority has advised that these are all operating
within the terms and conditions of their permits.
3.3 Unregulated plant – Local Authority
Sheffield City Council has provided information that none of the other industrial sites
identified as potential contributors to Ni emissions in the region fall within the scope
of the regulations and as such there are no relevant measures to put forward.

23
A1. Local scale modelling of the industrial point sources
This annex summarises supplementary modelling work carried out to investigate the
sources of the measured exceedance of the 4th Daughter Directive (Directive
2004/107/EC, DD4) annual mean target value (TV) for nickel (Ni) of 20 ng m-3 at the
Sheffield Tinsley monitoring station for the year 2016. Under DD4 Member States
are required to identify zones and agglomerations where exceedances of the TV
occur. Exceedance of the TV triggers a requirement within the Directive to prepare a
report on measures. Source identification is not a formal requirement for this report
on measures but is clearly a prerequisite for demonstrating that all measures not
entailing disproportionate costs have been taken, and modelling can be useful to
evaluate source contributions.
The following sources of information were used to compile a list of the potential
sources of Ni relevant to this exceedance:
• a review of the results from high time resolution monitoring campaigns at the
Sheffield Tinsley monitoring station
• sources present in the National Atmospheric Emissions Inventory (NAEI) and
Pollution Climate Mapping (PCM) national modelling
• sources identified by the Environment Agency (EA), Sheffield City Council
(SCC) and Rotherham Metropolitan Borough Council (RMBC).
The data provided are described in the next section.
This annex also describes the modelling approach and model results, including
concentration maps, comparison of the model output with observations, modelled
source apportionment and compliance situation as modelled. It concludes with
recommendations for further work to build on the output of this modelling study to
further improve understanding of the Sheffield Ni TV exceedance reported in 2016.
A1.1. Ni emissions data and data from related studies
A1.1.1. Review of NPL reports
Information from National Physical Laboratory (NPL) monitoring at Sheffield Tinsley
considered in this study derives from the presentation to the Nickel in Air Review

24
Meeting, Environment Agency, Rotherham, 24th January 20186. Further information
also considered derives from the NPL draft 2016 report for the metals network7.
Key information from our review of the NPL reports:
• Exceedance of Ni TV at Sheffield Tinsley for 2016 (24 ng m-3), prior
exceedances in Sheffield during 2004 (at Brinsworth) and 2014 (Tinsley) and
an upward trend in concentrations over the last 10 years.
• Re-location of site from Brinsworth to Tinsley in order to better fit 4th Daughter
Directive micro-siting requirements. The Brinsworth monitoring site was too
close to building façade. Tinsley is an existing established AURN site (opened
1990), meets DD4 siting requirements, and is located close to significant point
sources and sensitive receptors.
• 25th February – 10th August 2016, and 18th January – 5th April 2017 daily
sampling at Tinsley (normal sampling frequency is weekly) – illustrates high
short-term peaks not evident in weekly sampling – short-term peaks can
contribute significantly to annual mean and indicative sources contributing
(e.g. weekday/weekend behaviour, relationship with meteorology/pollution
roses, correlations with other metals).
• Analysis from the 2016 daily monitoring shows:
o Weekday concentrations were elevated compared to the weekends
and the largest contributions were from the South and North East.
o Some residual elevated concentrations on the weekends along similar
directions, which could be indicative of fugitive/diffuse emissions from
similar sources.
o Correlations between Ni, and Cr, Mn, Fe, Cu: Cr and Mn mainly from
the South, other metals also sources to N/NE/E.
• NPL draft 2016 report for metals network identifies Outokumpu Stainless Ltd,
Sheffield, as the dominant local industrial source (located to South of Tinsley).
A1.1.2. Review of KCL reports
Kings College London (KCL) undertook a 10-week high time resolution (hourly)
measurement campaign (19th January – 26th March 2017) to identify the sources of
Ni measured at the Sheffield Tinsley AURN site8. Information from this campaign
and source apportionment study has been derived from the final report of that study9,
6 “Measured Concentrations of Nickel in Sheffield”, S. Goddard, NPL. Presentation to the Nickel in Air Review Meeting, Environment Agency, Rotherham, 24th January 2018. 7 “Annual Report for 2016 on the UK Heavy Metals Monitoring Network”, NPL, draft report received 06/03/2018 8 https://uk-air.defra.gov.uk/networks/site-info?uka_id=UKA00181 9 “Source Apportionment of Nickel Sources at Sheffield Tinsley”; David C Green, Anna Font, Max Priestman & Anja H Tremper, Environmental Research Group, King’s College London; November 2017.
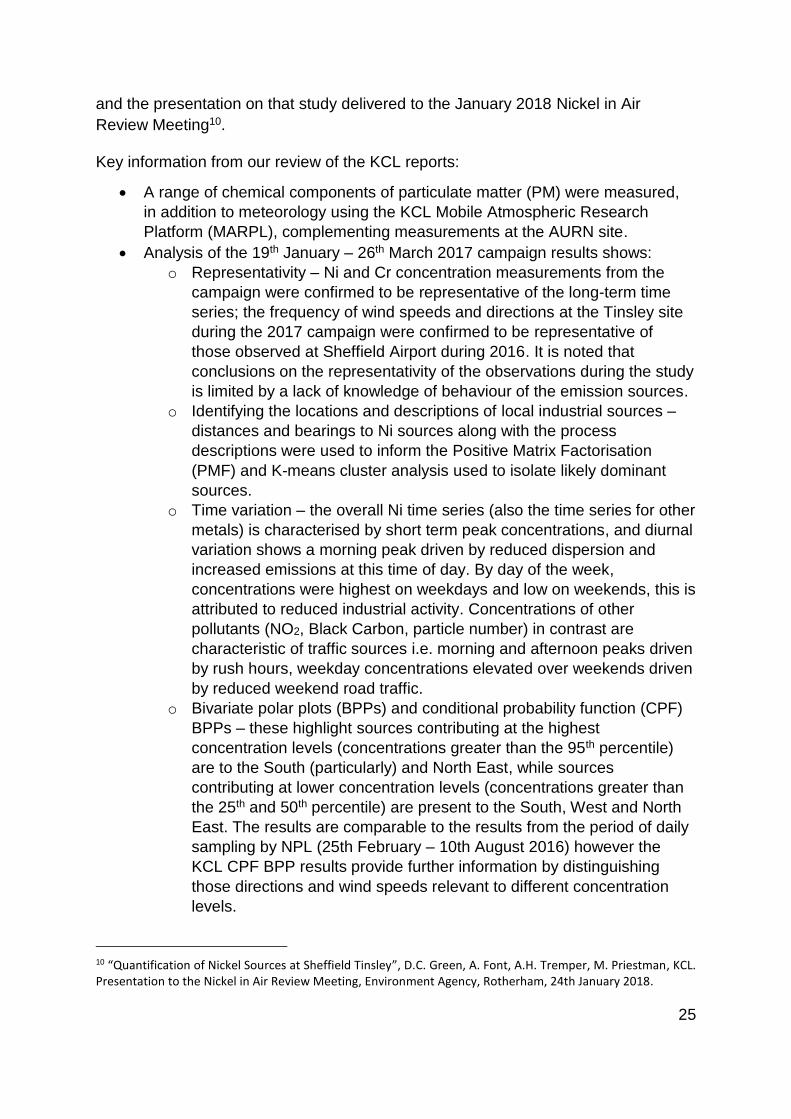
25
and the presentation on that study delivered to the January 2018 Nickel in Air
Review Meeting10.
Key information from our review of the KCL reports:
• A range of chemical components of particulate matter (PM) were measured,
in addition to meteorology using the KCL Mobile Atmospheric Research
Platform (MARPL), complementing measurements at the AURN site.
• Analysis of the 19th January – 26th March 2017 campaign results shows:
o Representativity – Ni and Cr concentration measurements from the
campaign were confirmed to be representative of the long-term time
series; the frequency of wind speeds and directions at the Tinsley site
during the 2017 campaign were confirmed to be representative of
those observed at Sheffield Airport during 2016. It is noted that
conclusions on the representativity of the observations during the study
is limited by a lack of knowledge of behaviour of the emission sources.
o Identifying the locations and descriptions of local industrial sources –
distances and bearings to Ni sources along with the process
descriptions were used to inform the Positive Matrix Factorisation
(PMF) and K-means cluster analysis used to isolate likely dominant
sources.
o Time variation – the overall Ni time series (also the time series for other
metals) is characterised by short term peak concentrations, and diurnal
variation shows a morning peak driven by reduced dispersion and
increased emissions at this time of day. By day of the week,
concentrations were highest on weekdays and low on weekends, this is
attributed to reduced industrial activity. Concentrations of other
pollutants (NO2, Black Carbon, particle number) in contrast are
characteristic of traffic sources i.e. morning and afternoon peaks driven
by rush hours, weekday concentrations elevated over weekends driven
by reduced weekend road traffic.
o Bivariate polar plots (BPPs) and conditional probability function (CPF)
BPPs – these highlight sources contributing at the highest
concentration levels (concentrations greater than the 95th percentile)
are to the South (particularly) and North East, while sources
contributing at lower concentration levels (concentrations greater than
the 25th and 50th percentile) are present to the South, West and North
East. The results are comparable to the results from the period of daily
sampling by NPL (25th February – 10th August 2016) however the
KCL CPF BPP results provide further information by distinguishing
those directions and wind speeds relevant to different concentration
levels.
10 “Quantification of Nickel Sources at Sheffield Tinsley”, D.C. Green, A. Font, A.H. Tremper, M. Priestman, KCL. Presentation to the Nickel in Air Review Meeting, Environment Agency, Rotherham, 24th January 2018.

26
o PMF source apportionment – two predominant, chemically and
physically distinct Ni source types were identified in the 13 and 14
factor PMF solutions. One of these is rich in Mo (Ni/Mo), contributing
73% or 72% of the Ni to the selected PMF solutions respectively, and
the other is rich in Cr (Ni/Cr), contributing 22% of the Ni to both
selected PMF solutions. The PMF solutions had 5-6% of the Ni
concentration unexplained and not assigned to specific sources.
Examining time variation and BPPs for these two sources:
▪ Ni/Mo source type – largest contributions from South and North
East, concentrations highest weekdays, in morning with
temperature inversions, attributed to a local buoyant source, and
conversely also at higher wind speeds attributed to either more
distant sources or atmospheric mixing increasing ground level
concentrations from nearby sources. The likely dominant
industrial sites highlighted based on directional analysis were
Darwin Holdings and/or Trefoil Steel to the North (10°), and
Outokumpu to the South. Other less significant sources to the
East were highlighted as contributing to the mean.
▪ Ni/Cr source type – largest contributions from South, and some
to the North, no diurnal variation hence behaviour independent
of industrial activity. Again, likely sources highlighted were
Darwin Holdings and/or Trefoil Steel to the North (10°), and
Outokumpu to the South. Wind speed was found to be highly
influential with the strength of the source to the South increasing
with wind speed, indicative of wind driven resuspension (e.g.
stockpiles, vehicle movement, material handling). The source
type also contains Ca indicative of the process (Ca used to
purify alloys as sinter and is retained in slag after processing).
Again, other less significant sources to the East were highlighted
as contributing to the mean.
o K-means cluster analysis of CPF BPPs – a 3 cluster solution was
derived for the 75th percentile CPF BPP of the Ni/Mo and Ni/Cr, 13 and
14 factor PMF solutions. This separates contributions into three broad
source directions – South (S to SSE), East (NNW to SSE), West (S to
NNW).
▪ South – this was identified as the dominant source direction
contributing 46.9% to the Ni concentrations measured (31.4%
Ni/Mo and 15.5% Ni/Cr) and “confidently” attributed to the
Outokumpu site (in this direction and accepted to be the largest
emitter of Ni in the area).
▪ East – identified as contributing 39.6% to the Ni concentrations
measured (34.6% Ni/Mo and 5% Ni/Cr) and attributed to Darwin
Holdings and/or Trefoil Steel (two facilities to the east, closely
aligned with the peak concentrations identifiable in the BPPs).
27
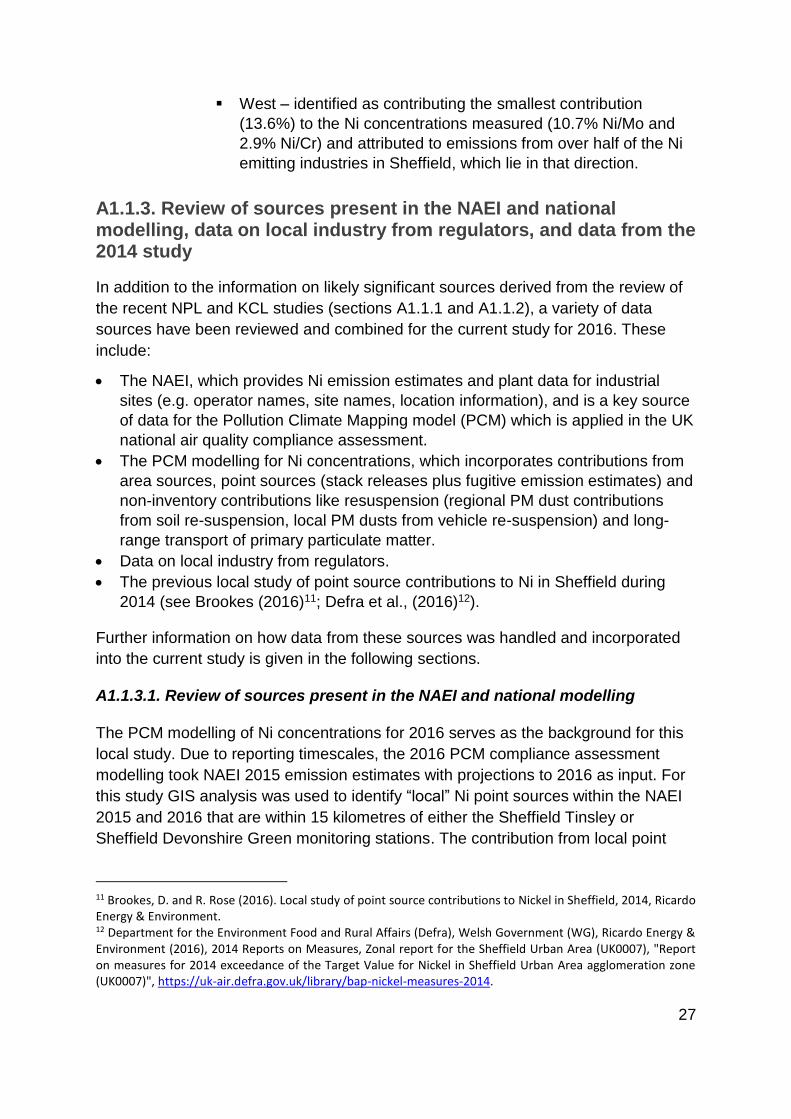
▪ West – identified as contributing the smallest contribution
(13.6%) to the Ni concentrations measured (10.7% Ni/Mo and
2.9% Ni/Cr) and attributed to emissions from over half of the Ni
emitting industries in Sheffield, which lie in that direction.
A1.1.3. Review of sources present in the NAEI and national modelling, data on local industry from regulators, and data from the 2014 study
In addition to the information on likely significant sources derived from the review of
the recent NPL and KCL studies (sections A1.1.1 and A1.1.2), a variety of data
sources have been reviewed and combined for the current study for 2016. These
include:
• The NAEI, which provides Ni emission estimates and plant data for industrial
sites (e.g. operator names, site names, location information), and is a key source
of data for the Pollution Climate Mapping model (PCM) which is applied in the UK
national air quality compliance assessment.
• The PCM modelling for Ni concentrations, which incorporates contributions from
area sources, point sources (stack releases plus fugitive emission estimates) and
non-inventory contributions like resuspension (regional PM dust contributions
from soil re-suspension, local PM dusts from vehicle re-suspension) and long-
range transport of primary particulate matter.
• Data on local industry from regulators.
• The previous local study of point source contributions to Ni in Sheffield during
2014 (see Brookes (2016)11; Defra et al., (2016)12).
Further information on how data from these sources was handled and incorporated
into the current study is given in the following sections.
A1.1.3.1. Review of sources present in the NAEI and national modelling
The PCM modelling of Ni concentrations for 2016 serves as the background for this
local study. Due to reporting timescales, the 2016 PCM compliance assessment
modelling took NAEI 2015 emission estimates with projections to 2016 as input. For
this study GIS analysis was used to identify “local” Ni point sources within the NAEI
2015 and 2016 that are within 15 kilometres of either the Sheffield Tinsley or
Sheffield Devonshire Green monitoring stations. The contribution from local point
11 Brookes, D. and R. Rose (2016). Local study of point source contributions to Nickel in Sheffield, 2014, Ricardo Energy & Environment. 12 Department for the Environment Food and Rural Affairs (Defra), Welsh Government (WG), Ricardo Energy & Environment (2016), 2014 Reports on Measures, Zonal report for the Sheffield Urban Area (UK0007), "Report on measures for 2014 exceedance of the Target Value for Nickel in Sheffield Urban Area agglomeration zone (UK0007)", https://uk-air.defra.gov.uk/library/bap-nickel-measures-2014.

28
sources of Ni based on the NAEI 2015 were subtracted from the national modelling
in order to avoid double counting of these contributions.
Local point sources of Ni based on the NAEI 2016 were reviewed in terms of if there
was further local data from either EA and local authority data (see Section A1.1.3.2)
or the 2014 study11 (see Section A1.1.3.3) to avoid duplication. If there was no
further local data to allow detailed treatment, the contribution from these sources
were modelled at 1 km x 1 km spatial resolution using the PCM modelling approach
including NAEI 2016 emissions and local meteorology and added to the background
Ni concentrations for 2016 from the national modelling (see Section A1.2).
A1.1.3.2. Review of EA and local authority data
In response to the 2016 Ni TV exceedance and informed by the NPL and KCL local
monitoring campaigns, the Environment Agency (EA) coordinated a project with
Sheffield City Council (SCC) and Rotherham Metropolitan Borough Council (RMBC)
during 2018 to identify and inspect Ni sources in the Sheffield Road area of
Tinsley/Templeborough, as well as the Outokumpu Stainless Limited (SMACC) site.
Information from the project report13, reports on industrial sites inspected and the
presentation the EA delivered to the January 2018 Nickel in Air Review Meeting14
were reviewed for this study and combined with the information on sources present
in the NAEI and national modelling (see Section A1.1.3.1), and the sources treated
in the 2014 study (see Section A1.1.3.3). The sites identified in the EA/SCC/RMBC
2018 project report are reproduced here in Table A1.1.
13 “Report on measures for 2016 exceedance of the Target Value for Nickel in Sheffield Urban Area Agglomeration Zone (UK0007)”, Environment Agency, report received 26/07/2018 14 “Outokumpu Stainless Ltd -SMACC”, Environment Agency. Presentation to the Nickel in Air Review Meeting, Environment Agency, Rotherham, 24th January 2018.

29
Table A1.1 – Sites identified in the EA/SCC/RMBC 2018 project
Operator Regulator
E.ON Climate and Renewable UK Biomass Limited, Blackburn Meadows,
Alsing Road, Sheffield, S9 1HF
Environment Agency
E.L.G. Haniel Metals Limited, Sheffield Road, Tinsley, Sheffield, S9 1RT Environment Agency
Yorkshire Water Services Limited, Blackburn Meadows STW, Alsing
Road, Tinsley, Sheffield. S9 1HF
Environment Agency
Outokumpu Stainless Ltd (SMACC), Europa Link, Sheffield, S9 1TZ Environment Agency
Harsco Metals Group Limited, Steelphalt, Sheffield Road, The Ickles,
Rotherham, S60 1DR
Environment Agency
AMG Aluminum Ltd & AMG Superalloys Ltd, Fullerton Road, Rotherham,
South Yorkshire, S60 1DL
Environment Agency /
Rotherham MBC
Speciality Steels UK Ltd, Sheffield Road, Rotherham, S60 1BN Environment Agency
Darwins Holdings Limited, Fitzwilliam Works, Sheffield Road, Tinsley, S9
1RL (notification of closure August 2018)
Sheffield City Council
Trefoil Steel Company Limited, Rotherfield Works, Dead Man’s Hole
Lane, Tinsley, S9 1QQ
Sheffield City Council
CF Booths Limited, Armer St, Rotherham S60 1AF Rotherham MBC
Hambleton Steel Limited, Rotherham S60 1DJ* Rotherham MBC
*Note: No information was available on Hambleton Steel Limited
A1.1.3.3. Review of the 2014 study and compilation of sources considered in
the 2016 study
The previous local study of point source contributions to Ni in Sheffield during 2014
(Brookes (2016)11, Defra (2016)12) provides a basis for the modelling approach for
2016. The information gathered for the 2014 modelling on emissions, processes and
release parameters has been combined with the emission data from the NAEI 2016,
EA and local authority data to compile the input for the 2016 modelling.
For a small number of industrial sources or potential releases, 2016 Ni emissions
data were indicated as being low and unspecified; these sites have been mapped
but not modelled (see Table A1.2 and Figure A1.1). Those sites that have been
modelled at higher resolution in the current study are listed in Table A1.3 and
mapped in Figure A1.1. Table A1.3 includes descriptions of whether emissions were
treated as line (e.g. along a roof vent), point (e.g. from a chimney stack) or volume
releases (e.g. diffuse emissions from a storage area or building). The bearings from
the Sheffield Tinsley monitoring station to each release point have been calculated
and used to relate each source to the three broad source directions identified in the
K-means cluster analysis of CPF BPPs in the KCL study (Green et al., 2017)9.
Temporal emission profiles have been applied where information was available on

30
operating hours from the EA 2018 site reports. A categorisation for modelling (a)-(c)
has also been made to indicate the level of confidence in the emissions data, where:
a) Indicates reported emissions and release parameters
b) Indicates derived emissions and/or release parameters based on the EA 2018
site reports
c) Indicates scaled contributions from uncertain local point/fugitive/diffuse
sources with release parameters based on the 2018 EA site reports

31
Table A1.2 – Identified Ni emitters or emission points that were not modelled due to low emissions rates or lack of information
Operator Address Postcode Process Type Emission point description Data
provider
E.L.G. Haniel
Metals Limited
Sheffield Road,
Tinsley, Sheffield
S9 1RT Started Operating in 2012 - Shredding
of Metal
Densifier Outfeed building – 2018 EA site report provides
results of short-term monitoring (June 2018) which indicate
minimal if any fugitive emissions for this emission point.
EA
Yorkshire
Water
Services
Limited
Blackburn
Meadows STW,
Alsing Road,
Tinsley, Sheffield.
S9 1HF Prior to October 2013: Incineration of
non-hazardous waste. Since March
2016: sewage sludge is anaerobically
digested in a bio-energy digestion plant
(BED).
Prior to October 2013 a sewage sludge incinerator operated. A
composting facility was then used to process sewage sludge
from 2014 to early 2016 and could have contributed diffuse Ni
emissions during this period. The 2018 EA site report indicates
that Ni emissions from the BED operating since March 2016
are negligible.
EA
Harsco Metals
Group
Limited,
Steelphalt
Sheffield Road,
The Ickles,
Rotherham
S60 1DR EA regulated – Crushing and screening
of metallurgical slag from steel works.
RMBC regulated – Road stone coating
activity - asphalt plant which involved
the use of bitumen mixed together
with varying proportions of aggregate,
filler and fibre pellets to produce
asphalt.
Roadstone coating plant - stack A1. 2018 EA site report
indicates Ni emissions are not quantified, abatement is in
place for PM emissions for which there is continuous
monitoring, this shows PM emissions are significantly below
the emission limit.
EA
Storage of limestone product. EA site report provides no
information on Ni emissions.
Open roadways. Emissions from roadways are continuously
abated which indicates Ni would be minimal compared to
open storage areas.
Hambleton
Steel Limited
Hambleton Steels,
Fullerton Road,
Ickles, Rotherham
S60 1DJ RMBC regulated – No data. No data. EA
32
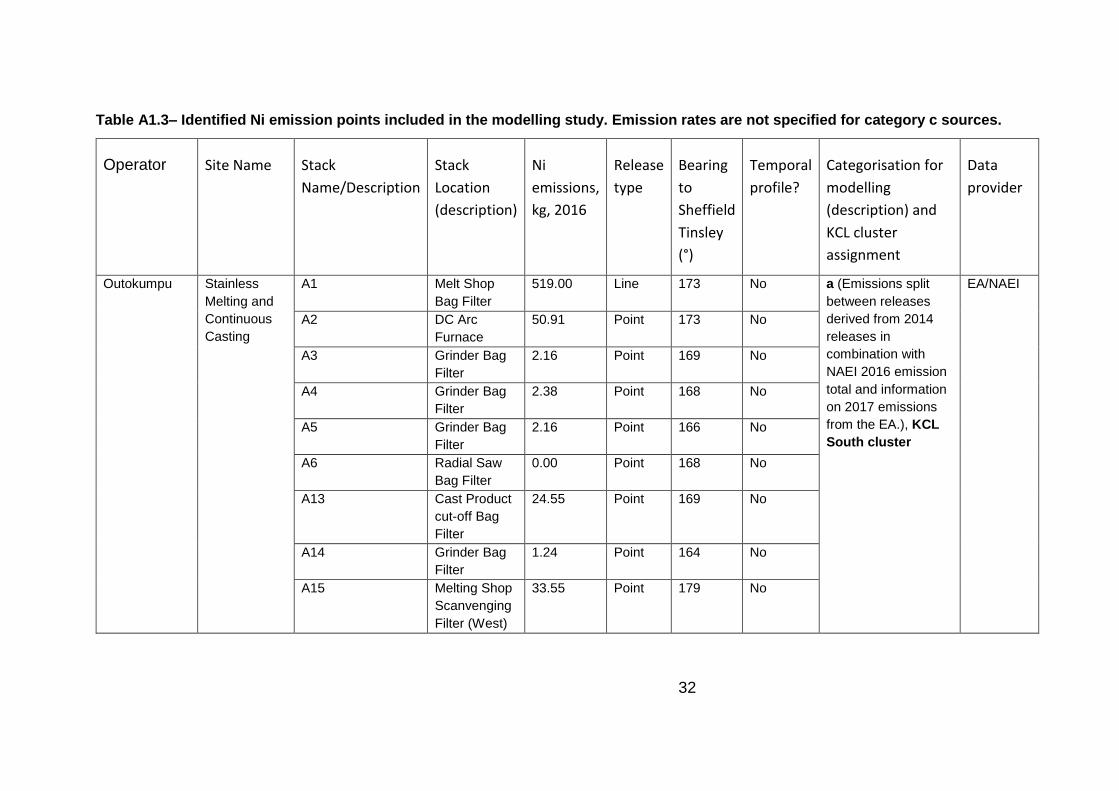
Table A1.3– Identified Ni emission points included in the modelling study. Emission rates are not specified for category c sources.
Operator Site Name Stack
Name/Description
Stack
Location
(description)
Ni
emissions,
kg, 2016
Release
type
Bearing
to
Sheffield
Tinsley
(°)
Temporal
profile?
Categorisation for
modelling
(description) and
KCL cluster
assignment
Data
provider
Outokumpu Stainless
Melting and
Continuous
Casting
A1 Melt Shop
Bag Filter
519.00 Line 173 No a (Emissions split
between releases
derived from 2014
releases in
combination with
NAEI 2016 emission
total and information
on 2017 emissions
from the EA.), KCL
South cluster
EA/NAEI
A2 DC Arc
Furnace
50.91 Point 173 No
A3 Grinder Bag
Filter
2.16 Point 169 No
A4 Grinder Bag
Filter
2.38 Point 168 No
A5 Grinder Bag
Filter
2.16 Point 166 No
A6 Radial Saw
Bag Filter
0.00 Point 168 No
A13 Cast Product
cut-off Bag
Filter
24.55 Point 169 No
A14 Grinder Bag
Filter
1.24 Point 164 No
A15 Melting Shop
Scanvenging
Filter (West)
33.55 Point 179 No

33
A16 Melting Shop
Scanvenging
Filter (East)
38.64 Point 179 No
A17 EAF Dust
Storage Silo
Filter
0.00 Point 172 No
N/A West vent
melt shop
roof
72.83 Line 178 No
N/A East vent
melt shop
roof
141.59 Line 173 No
N/A Roadways -
Traffic
Volume 171 No c (Modelled
contribution scaled
after unit emissions
applied distributed
over the volume of
each source derived
from the mapped
surface area and
estimated height.),
KCL South cluster
EA
N/A Raw
materials
storage area
- storage of
waste dust
Volume 170 No EA
Sheffield
Forgemasters
International
Ltd
Sheffield
Forgemasters
Brightside
A1 Melting Shop,
Bag Filter
Plant Roof
Vents
2.01 Line 244 No a (Emissions split
between releases
derived from 2014
releases in
combination with
NAEI 2016 emission
total.), KCL West
cluster
EA/NAEI
A2 Snow Grinder
and Melt
Shop Flame
Cutting
Facility
1.34 Point 251 No

34
A3 Forge Ingot
Burning, Bag
Filter and
Plant Stack
2.71 Point 260 No
A4 Gas Fired
Boiler Plant
Stack
1.20E-04 Point 250 No
A5 Gas Fired
Boiler Plant
Stack
1.20E-04 Point 252 No
A6 Gas Fired
Boiler Plant
Stack
1.20E-04 Point 250 No
A7 Gas Fired
Boiler Plant
Stack
1.20E-04 Point 250 No
A8 Forge
Heating
Furnace No.1
Stack
2.39E-04 Point 260 No
A9 Forge
Heating
Furnace No.7
Stack
1.80E-03 Point 261 No
A11 Heavy Forge
Roof Vents
(exhausts
from forge
furnaces2,
14, 17, 28,
selas furnace
4.19E-03 Line 261 No

35
and heat
treatment
furnaces
NTP1 to 16,
18 and 20a/b)
A13 Foundry Shot
Blast Stack
0.55 Point 257 No
A15 Foundry
Burning
Booth Stack
10.00 Point 257 No
A20 Foundry Heat
Treatment
Furnace
Stacks
3.59E-04 Point 256 No
A21 Foundry Heat
Treatment
Furnace
Stacks
5.99E-04 Point 256 No
A22 Foundry Heat
Treatment
Furnace
Stacks
3.59E-04 Point 257 No
A28 (251-255) Melting Shop
Low Casting
Bay Roof
Vents
(Furnaces
251-255)
5.15 Line 250 No
A31 Forge
Heating
8.38E-04 Point 262 No

36
Furnace No.3
stack
Liberty
Speciality
Steels
Aldwarke
Lane
- - 112.49 Point 47 No a (Modelling
parameters from
PCM and NAEI 2016
emissions.), KCL
East cluster
PCM/NAEI
VEOLIA ES
(SHEFFIELD)
LIMITED
Sheffield
Energy
Recovery
Facility
Release Point A1 Main Stack 5.00 Point 233 No a (modelling
parameters from
2014 study and NAEI
2016 emissions),
KCL West cluster
EA/NAEI
E.ON Climate
and
Renewables
UK Biomass
Ltd
Blackburn
Meadows
Renewable
Energy Plant
Release Point A1 Main Stack 5.00 Point 341 No a (Modelling
parameters from
2014 study and NAEI
2016 emissions.),
KCL West cluster
EA/NAEI
AMG
Superalloys
UK Ltd
Fullerton
Road
A1 Arc Furnace 2.12 Point 81 No a (Emissions split
between releases
derived from 2014
releases in
combination with
NAEI 2016 emission
total, locations based
on EA 2018 site
report in combination
with aerial imagery.),
KCL East cluster
EA/NAEI
A2 Arc Furnace 9.20 Point 81 No
Mix filter 65 Mix filter 65 0.11 Point 81 No
Pangborne
Shotblast
Pangborne
Shotblast
0.13 Point 81 No
Arc Furnace Shop
Roof Vent
Arc Furnace
Shop Roof
Vent
6.49 Line 80 No b (Release
parameters derived
from EA 2018 site
EA

37
report, height based
on EA LIDAR derived
building heights,
emissions estimated
based on EA 2018
site report.), KCL
East cluster
E.L.G. Haniel
Metals Limited
Sheffield
Road,
Tinsley,
Sheffield
Oxy-propane
Cutting Area
Oxy-propane
Cutting Area
Point 27 Yes c (Modelled
contribution scaled
after emissions and
release parameters
estimated from 2018
short term monitoring
of fugitive
emissions.), KCL
East cluster
EA
Plasma Cutting
Area
Plasma
Cutting Area
63.26 Point 16 Yes b (Release
parameters and
emissions derived
from EA 2018 site
report.), KCL East
cluster
EA
Harsco Metals
Group Limited,
Steelphalt
Sheffield
Road, The
Ickles,
Rotherham
Open stockpile
storage of slag
Storage of
slag prior to
crushing
(South of
crushing
plant)
3.27 Volume 61 No b (Emissions derived
from EA 2018 site
report applied
distributed over the
volume of each
source derived from
the mapped surface
area and estimated
EA
Open storage of
crushed/screened
slag
Storage of
slag prior to
coating
3.27 Volume 57 No EA

38
(North of
coating plant)
height.), KCL East
cluster
Open storage of
crushed/screened
slag
Storage of
slag prior to
coating
(South West
of coating
plant)
3.27 Volume 59 No EA
Enclosed crushing
plant
Crushing
plant
1.31 Volume 60 No EA
Speciality
Steels UK Ltd,
Brinsworth
Strip Mill
Sheffield
Road,
Rotherham
A1 Hot Mill
Reheat
Furnace
0.33 Point 40 Yes a (Modelling
parameters from
2014 study and 2016
emissions for A1
stack from EA 2018
site report. A
potential fugitive
release from the F1
hot mill roof is noted
but not treated,
because the 2018
site report indicates
these emissions are
suppressed by BAT
process.), KCL East
cluster
EA
Darwins
Holdings
Limited,
Fitzwilliam
Works
Sheffield
Road, Tinsley
Roof vents, roller
shutter doors etc.
Roof vents,
roller shutter
doors etc.
Volume 8 Yes c (All processes vent
internally into the
foundry. Modelled
contribution scaled
after unit emissions
EA

39
applied distributed
over the volume of
the building derived
from the mapped
surface area and
height based on EA
LIDAR derived
building heights.),
KCL East cluster
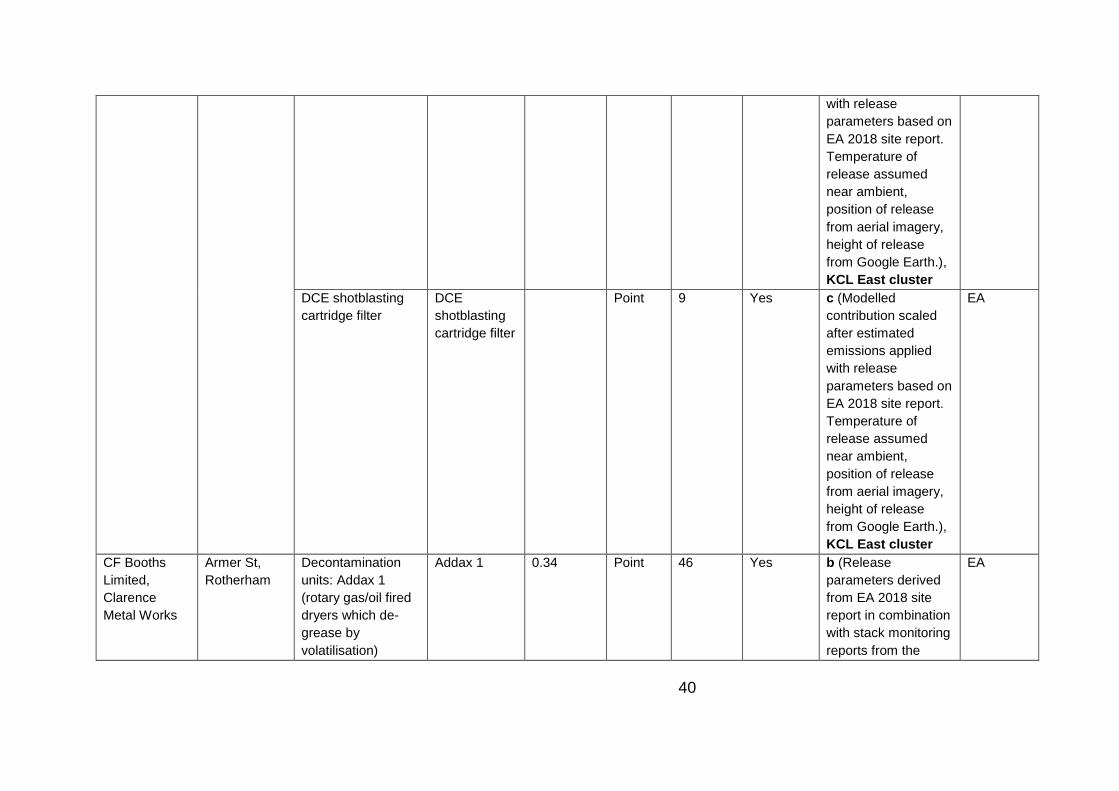
Trefoil Steel
Company
Limited,
Rotherfield
Works
Dead Man’s
Hole Lane,
Tinsley
Melting shop roof
vents (release
melting, tapping
and finishing
emissions which
vent internally)
Melting shop
roof vents
Line 8 Yes c (Modelled
contribution scaled
after unit emissions
applied distributed
over the length of
roof derived from
aerial imagery and at
height derived from
EA LIDAR derived
building heights and
Google Earth.
Temperature of
release assumed
near ambient, flow
estimated based on
reported flows for
other EAF roof
vents), KCL East
cluster
EA
Arc air cutting
cartridge filter grille
Arc air cutting
cartridge filter
grille
Point 9 Yes c (Modelled
contribution scaled
after estimated
emissions applied
EA
40
with release
parameters based on
EA 2018 site report.
Temperature of
release assumed
near ambient,
position of release
from aerial imagery,
height of release
from Google Earth.),
KCL East cluster
DCE shotblasting
cartridge filter
DCE
shotblasting
cartridge filter
Point 9 Yes c (Modelled
contribution scaled
after estimated
emissions applied
with release
parameters based on
EA 2018 site report.
Temperature of
release assumed
near ambient,
position of release
from aerial imagery,
height of release
from Google Earth.),
KCL East cluster
EA
CF Booths
Limited,
Clarence
Metal Works
Armer St,
Rotherham
Decontamination
units: Addax 1
(rotary gas/oil fired
dryers which de-
grease by
volatilisation)
Addax 1 0.34 Point 46 Yes b (Release
parameters derived
from EA 2018 site
report in combination
with stack monitoring
reports from the
EA

41
Decontamination
units: Addax 2
(rotary gas/oil fired
dryers which de-
grease by
volatilisation)
Addax 2 0.14 Point 46 Yes 2014 study.
Emissions derived
from stack
monitoring reports
from the 2014
study.), KCL East
cluster Decontamination
units: C4 (gas oil
fired box type batch
furnaces, 1000kg
capacity)
C4 0.08 Point 46 Yes
Furnaces: F3 (gas
oil heated crucible
furnace <=5 t
capacity)
F3 0.10 Point 47 Yes
Furnaces: combine
F1, F2, F4, F8
(electric induction
furnaces), with F5
and F6 (oxy-oil fired
rotary furnaces <5 t
capacity)
F1, F2, F4,
F8, F5 and
F6
0.06 Point 47 Yes
Furnaces: F9 and
F10 (electric
induction furnaces
<5 t capacity)
F9 and F10 0.08 Point 44 Yes
Combined fugitive
nickel emissions for
the Addax facilities
and furnaces
Addax
facilities and
furnaces
0.09 Volume 46 No b (Volume of the
source derived from
the mapped surface
area and height
based on EA LIDAR
EA
42
derived building
heights. Emissions
derived from EA
2018 site report.),
KCL East cluster
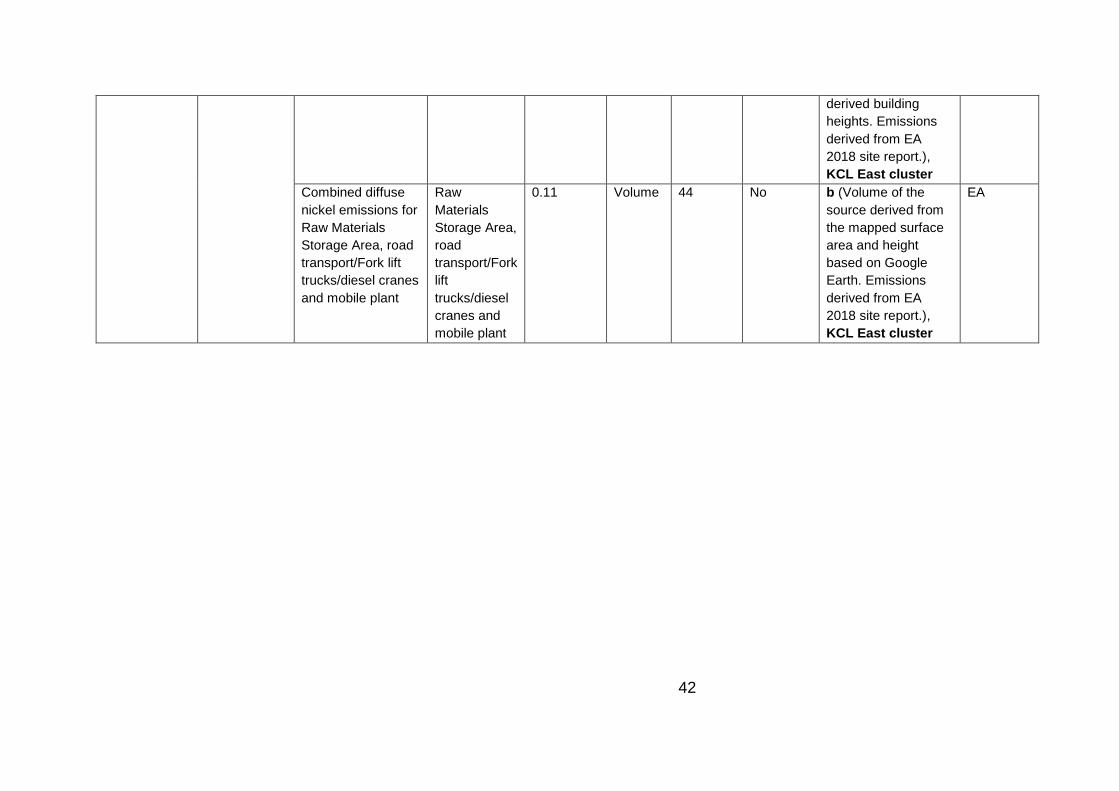
Combined diffuse
nickel emissions for
Raw Materials
Storage Area, road
transport/Fork lift
trucks/diesel cranes
and mobile plant
Raw
Materials
Storage Area,
road
transport/Fork
lift
trucks/diesel
cranes and
mobile plant
0.11 Volume 44 No b (Volume of the
source derived from
the mapped surface
area and height
based on Google
Earth. Emissions
derived from EA
2018 site report.),
KCL East cluster
EA

43
Figure A1.1 – Map of local industrial sources of Ni including modelled sources and sources that were not modelled (just mapped).
The locations of the Sheffield Tinsley and Sheffield Devonshire Green monitoring stations are also marked.

44
A1.2. Modelling approach
ADMS v5.2.1 was used for the current modelling study. Detailed source characteristics for the
release points summarised in Table A1.3 were derived from data received from the EA, the PCM
and the previous 2014 modelling study as discussed in Section A1.1.3.3.
Model input datasets including terrain and meteorology are briefly described below. Table A1.4
summarises generic modelling parameters applied for each model run.
Table A1.4 – Generic modelling parameters
Variable Parameters
Complex terrain Y
Terrain grid resolution setting 64x64
Surface roughness at dispersion site 1.0 m15
Minimum Monin-Obukhov Length (LMO) at dispersion site 30 m16
Surface roughness at met site 0.3 m17
Minimum Monin-Obukhov Length (LMO) at met site 20 m18
Model output grid resolution 50 m
A1.2.1. Terrain
To treat the effects of terrain on dispersion detailed local terrain data based on OS Terrain 50 was
incorporated (see Figure A1.2).
15 ADMS recommended value for cities, woodlands 16 ADMS recommended value for cities and large towns 17 ADMS recommended value for airports 18 ADMS recommended value for airports

45
Figure A1.2 - Detailed local terrain based on OS Terrain 50
A1.2.2. Meteorology
An analysis of available meteorological data in the vicinity of Sheffield (not detailed here) was
undertaken using the open source R package openair19. Data from Sheffield Doncaster Airport
and RAF Waddington were evaluated for comparability. Meteorological data for Sheffield
Doncaster Airport were used primarily (as the nearest airport meteorological station) and a gap
filling procedure based upon the US EPA protocol20 was followed to compensate for missing data
within the Sheffield Doncaster Airport dataset. The protocol was as follows: 1 hour gaps were filled
based upon the previous hour, gaps up to 3 hours were filled by interpolation, and larger gaps (>3
hours) were filled with measurements from RAF Waddington.
A1.2.3. Combining model data
As noted in Section A1.1.3, local Ni sources from the NAEI 2016 for which there was no further
local data were updated with emissions from the NAEI 2016 and modelled at 1 km x 1 km
resolution. The contribution of local sources categorised as (a) and (b) in Table A1.3 were
modelled in detail with output on a 50 m x 50 m resolution grid.
The contribution of local sources categorised as (c) in Table A1.3 have also been output on a 50
m x 50 m resolution grid. However, since the emissions rates are unknown, these sources were
19 https://github.com/davidcarslaw/openair 20 EPA-454/R-99-005, Meteorological Monitoring Guidance for Regulatory Modeling Applications, 2000, https://www3.epa.gov/scram001/guidance/met/mmgrma.pdf

46
initially modelled with unit emission rates. The contributions from these sources were then scaled
in order to provide source apportionment for the annual concentration measured at Sheffield
Tinsley.
The scaling factors applied to these sources were derived by:
1. Multiplying the annual mean measured Ni concentration for 2016 at the Sheffield Tinsley
monitoring station (i.e. 23.6 ng m-3) by the percentages allocated to the source direction
clusters in the KCL study (Green et al., 2017)9, in order to derive contributions
concentrations from each cluster (11.1 ng m-3 for South, 9.3 ng m-3 for East and 3.2 ng m-3
for West). No scaling has been applied to contributions from the West.
2. Allocating the local sources within this study to the clusters.
3. Scaling the contributions for category (c) sources in the South and East clusters to match
the residual between the measured proportion allocated to the clusters and the summed
contributions of category (a) and (b) sources in the clusters. No scaling has been applied to
contributions from the West.
In the KCL study9 the South cluster contribution is attributed to Outokumpu Stainless Ltd
(SMACC), hence the modelled South cluster contribution in this study has been derived by
subtracting the modelled contributions from Outokumpu category (a) components from the
measured proportion (0.469 x [Ni]measured, 2016 = 11.1 ng m-3) to determine a residual. The modelled
diffuse contributions from roadways and the raw material storage area (category (c) contributions)
have then been scaled to match this residual. Attributing a proportion of the contribution from
Outokumpu to the as yet unquantified diffuse sources is consistent with the KCL study, which
noted wind driven resuspension as a factor driving elevated concentrations at the Sheffield Tinsley
monitoring station.
The KCL study attributes the East cluster contributions to Darwin Holdings and/or Trefoil Steel
along with other sources to the East contributing to the mean. The EA/SCC/RMBC 2018 project13
further identified E.L.G. Haniel Metals Ltd as a Ni source in close proximity and in a similar
direction from the Sheffield Tinsley monitoring station (see bearings in Table A1.3). In this study
the modelled East cluster contribution has therefore been derived by subtracting the modelled
contributions from category (a) and (b) sources from the measured proportion (0.396 x [Ni]measured,
2016 = 9.3 ng m-3) to determine a residual. Since the three unknown contributions within the East
cluster are not uniquely identified, and in the absence of other information, the modelled
contributions from category (c) sources are combined and a single constant scaling factor has
been applied to make the summed contributions match this residual.
The KCL study attributes the remainder of the concentration observed at the Sheffield Tinsley
monitoring station to the West cluster contributions, corresponding to emissions from over half of
the Ni emitting industries in Sheffield. In this study, the modelled West contribution has been
derived from those local sources within this cluster without scaling, and the remaining background
contributions from other sources from the PCM national modelling have been added to this and
the South and East contributions to make the total modelled Ni concentration for 2016. No attempt

47
has been made to assign the small residual within the West cluster that is not accounted for by the
modelled components.
Figure A1.3 shows how different modelled contributions have been combined. It must be noted
that the source apportionment derived in this study depends on the representativeness of the KCL
study for the year 2016. Within the results (Section A1.3) the combined output is referred to as Ni
2016c.
Figure A1.3 – Schematic of process to combine modelled contributions
A1.3. Model results
The results from the modelling study are presented in terms of concentration maps including a
review of compliance impacts within the study domain (Section A1.3.1), and source apportionment
in comparison to observations (Section A1.3.2).
A1.3.1. Concentration maps and compliance impact
Figure A1.4 presents a subset of the 2016 annual mean Ni concentration map for the Sheffield
area from this study that excludes the contributions from the scaled sources. It is notable that even

48
excluding the scaled contributions, exceedances of the Ni TV (20 ng mg-3) are modelled in the
vicinity of the Outokumpu site to the South of the Sheffield Tinsley monitoring station and in the
vicinity of sources to the North and North East. The footprint of the modelled exceedance in this
case does not extend to the location of the Sheffield Tinsley monitoring station.
Figure A1.5 presents the modelled total 2016 annual mean Ni concentration map for the Sheffield
area from this study including the contributions from the scaled sources. The contribution of scaled
sources in the East cluster to the mapped total concentration is based on the use of a single
constant scaling factor as noted in Section A1.2.3. Including the scaled contributions (noting this
adds point, fugitive and diffuse contributions to the local sources identified in the KCL study
(Green et al., 2017)9 and the EA/SCC/RMBC 2018 project13) the area of exceedance of the Ni TV
(20 ng mg-3) extends from the sources to the North of the Sheffield Tinsley monitoring station
down to the Outokumpu site to the South, with the footprint of the modelled exceedance including
the location of the Sheffield Tinsley monitoring station. An inspection of the area of modelled
exceedance compared to 1 km gridded population (2011 census) indicates population exposure
from the area surrounding Outokumpu in the South to the Meadow Bank Road in the North. The
model results also suggest the area of exceedance extends across the zone boundary to the
South of Outokumpu into the neighbouring Yorkshire and Humberside non-agglomeration zone
(UK0034). Further work will keep this exceedance situation under review, including the possibility
of the exceedance extending into the Yorkshire and Humberside non-agglomeration zone
(UK0034).
A1.3.2. Source apportionment
Figure A1.6 shows the modelled Ni contribution from different sources at Sheffield monitoring site
locations based upon the combined modelling output for 2016 (Ni 2016c). Measured
concentrations at the sites are also presented, giving an indication of the level of agreement
between modelled and measured concentrations. As noted in Section A1.2.3 the contribution of
local sources categorised as (c) in Table A1.3 are uncertain and have been scaled such that the
total modelled from the South and East clusters in this study match the percentages apportioned
to these clusters in the KCL study9. This approach attributes the main industrial sources of Ni at
the Sheffield Tinsley monitoring station to the South cluster (Outokumpu) and the East cluster
(E.L.G. Haniel Metals, Darwin Holdings, Trefoil Steel). Since the unknown contributions in the East
cluster are not separable and have been scaled using a single factor, their contribution is shown
as an aggregated total in the source apportionment (labelled “Scaled contributions from North East
(c)”). It is notable that excluding the scaled components, the Outokumpu site remains the main
industrial source of Ni at both the Sheffield Tinsley and Sheffield Devonshire Green monitoring
stations.
With no scaling applied to sources in the West cluster or the other background contributions from
the national modelling, a small under prediction remains. The combined modelling output
represents 95% of the observed concentration at Sheffield Tinsley, and 70% of the observed
concentration at Sheffield Devonshire Green.

49
Figure A1.4 - Map of annual mean Ni concentrations for 2016 from local fine-scale modelling of industrial sources based on reported (a) or derived
(b) emissions added to the background Ni concentrations from the national model. The locations of modelled industrial sources and additional
industrial sources not modelled (just mapped) are also shown.
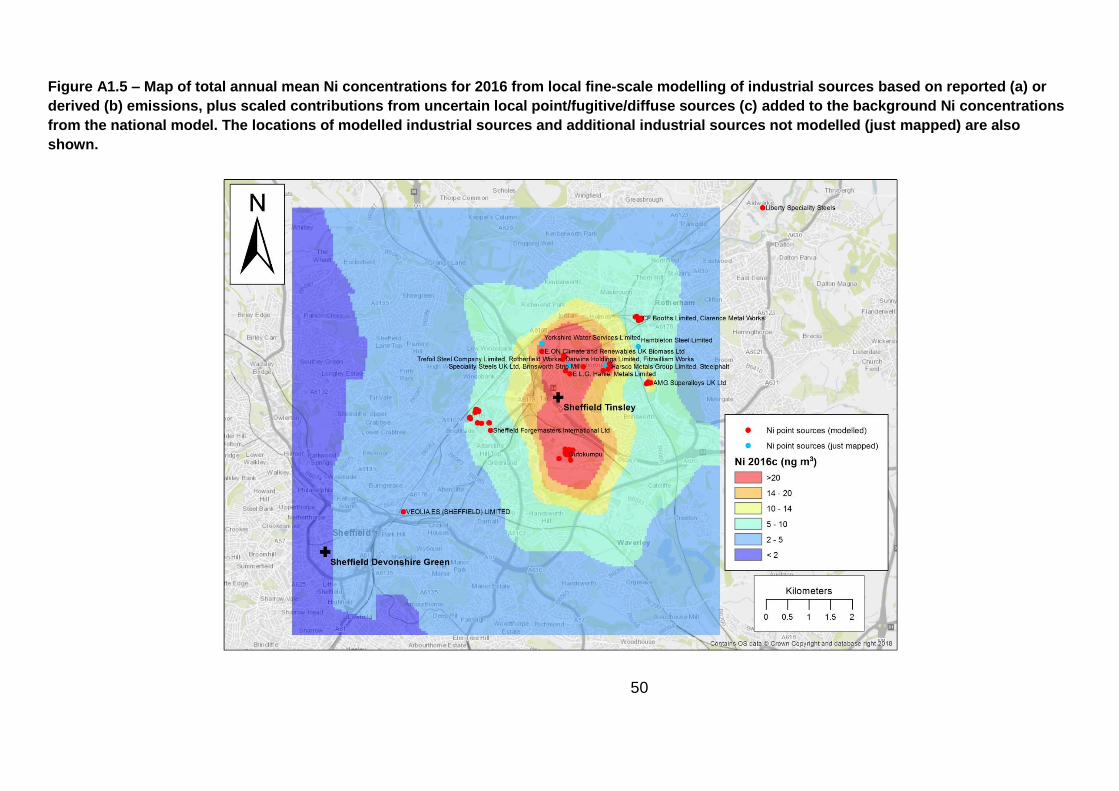
50
Figure A1.5 – Map of total annual mean Ni concentrations for 2016 from local fine-scale modelling of industrial sources based on reported (a) or
derived (b) emissions, plus scaled contributions from uncertain local point/fugitive/diffuse sources (c) added to the background Ni concentrations
from the national model. The locations of modelled industrial sources and additional industrial sources not modelled (just mapped) are also
shown.

51
Figure A1.6 - Annual mean Ni source apportionment at Sheffield monitoring sites in 2016 (combined detailed and national modelling output)

52
A1.4. Conclusions
Based upon the results of the detailed modelling study present here:
• The detailed modelling indicates exceedances of the Ni TV (20 ng mg-3) associated with the Outokumpu site and sites to the North of Sheffield Tinsley (including E.L.G. Haniel Metals, Darwin Holdings, and Trefoil Steel) although the individual contributions of the sources to the North East are not represented, and the magnitude of contributions and spatial extent of exceedances depends on the representativeness of the analysis in the KCL study (Green et al., 2017)9 for the 2016 annual mean.
• The footprint of the modelled exceedance includes the Sheffield Tinsley
monitoring station and inspection of the area of modelled exceedance
compared to 1 km gridded population (2011 census) indicates population
exposure from the area surrounding Outokumpu in the South to the Meadow
Bank Road in the North. The model results also suggest the area of
exceedance extends across the zone boundary to the South of Outokumpu
into the neighbouring Yorkshire and Humberside non-agglomeration zone
(UK0034). Further work will keep this exceedance situation under review,
including the possibility of the exceedance extending into the Yorkshire and
Humberside non-agglomeration zone (UK0034).
• The source apportionment analysis suggests that the main industrial source of
Ni at both the Sheffield Tinsley and Sheffield Devonshire Green monitoring
stations is Outokumpu, with sites to the North of Sheffield Tinsley (including
E.L.G. Haniel Metals, Darwin Holdings, and Trefoil Steel) contributing to the
measured exceedance there.
• The combined modelling output represents 95% of the observed
concentration at Sheffield Tinsley, and 70% of the observed concentration at
Sheffield Devonshire Green.
Recommendations:
• A significant proportion of the total Ni concentration modelled in this study has
been derived by scaling contributions from uncertain point, fugitive and diffuse
emissions from the industrial sites noted above. There is scope for further
improving understanding of the emissions, activity levels and timing of
operations identified in KCL study9 and the EA/SCC/RMBC 2018 project13,
which would focus attention on the main Ni emitters and provide information
for modelling studies.
• The high temporal resolution monitoring conducted by NPL and KCL has
been valuable in that it enables directional analysis and informs source
apportionment. Should work be needed to interpret future exceedances or to
analyse the impact of measures such monitoring campaigns would be
recommended.

53
• The national modelling for compliance assessment does not capture the
observed exceedance because not all of the sources identified in this study
are fully captured by the NAEI. Data gathered in this study and resulting from
measures to quantify and reduce emissions from industry in Sheffield, could
be used to inform future modelling and compliance assessments.

54
A2. Monitoring studies

55
Source Apportionment of Nickel Sources at Sheffield Tinsley
Environmental Research Group, King’s College London
November2017
David C Green, Anna Font, Max Priestman, Anja H. Tremper
56
Title Source Apportionment of Nickel Sources at Sheffield Tinsley
Customer Department for Environment, Food & Rural Affairs
Customer Ref
File Reference ERG\ AIRQUALI\Defra\Sheffield\SheffieldNickelReport_Final.docx
Report Number -
Environmental Research Group King’s College London 4th Floor Franklin-Wilkins Building 150 Stamford St London SE1 9NH Tel 020 7848 4044 Fax 020 7848 4045
Name Signature Date
Lead Author David Green
November 2017
Reviewed by Anna Font
November 2017
Approved by David Green
November 2017

57
Executive Summary
Concentrations of Nickel in PM10 measured at the Sheffield Tinsley monitoring stations have exceeded the EU Target
Value in 2004, 2014 and 2016. The nearby Outokumpu steel manufacturing plant, producing steel strip and coil
products, was highlighted as the potential source of the elevated Ni concentrations at these sites due to its locality as
well as it being the largest nickel emissions source in the UK but there are many other sources of Ni in the Sheffield
area. The aim of this study was to identify the sources of Nickel in PM10 measured at this location and data was collected
during a 10 week measurement campaign using the latest high time resolution measurement techniques.
This work identified two sources of Nickel: one related to point source emissions which was characterised by
molybdenum and manganese and one fugitive source type, characterised by chromium and calcium, likely to be
associated with material handling or transport.
Wind speed and direction measurements were used to quantify where these source types were emitted from. There
were 3 source directions – East, West and South. The source was from the south, which contributed 47% to the Nickel
concentrations measured during this study, can confidently be associated with the Outokumpu facility. This
contribution can be viewed as 31% from the point source type and 16% from the fugitive source type.
The source from the West made the smallest contribution (14%) and represented the emissions from over half of the
industries in Sheffield, which lie in that direction and was dominated by the point source type.
The source to the East contributed 40%. Of this, 35% was related to the point source type most likely and 5% from the
fugitive source type.
The widespread nature of the point related source type across industries in Sheffield makes this challenging to tackle.
However, focusing resources to identify specific processes from the identified industrial sources would be a useful initial
step towards reducing Nickel emissions. The fugitive source type was clearly most influenced by the local Outokumpu
plant and further work to identify the processes and / or activities which are leading to these emissions may be the
most cost-effective way of ensuring that the measurements at the Sheffield Tinsley site remain below the annual mean
EU Target Value for nickel.

58
Introduction
Nickel (Ni) concentrations in the UK are regulated under the 4th Daughter Directive (Directive 2004/107/EC, DD4); this
stipulates a Lower Assessment Threshold (LAT), an Upper Assessment Threshold (UAT) and Target Value (TV) (see Table
1). Exceedances of the UAT and LAT must be determined based on concentrations during the previous five years. An
assessment threshold will be deemed if it has been exceeded during at least three years out of the previous five. The
assessment threshold determines subsequent assessment measures. Member States are required to identify zones and
agglomerations where exceedances of the TV occur. Exceedance of the TV triggers a requirement within the Directive
to prepare a report on measures. In the case of industrial emissions, measures not entailing disproportionate costs, i.e.,
Best Available Technology (BAT), must be applied to attain the TV. Source identification is not a formal requirement
but is clearly a prerequisite for demonstrating that all measures not entailing disproportionate costs have been taken.
Table 1: Target Value, upper and lower assessment thresholds for Ni (Directive 2004/107/EC)
Nickel
Target Value 20 ng m-3
Upper assessment threshold in percent of the target value 70% (14 ng m-3)
Lower assessment threshold in percent of the target value 50% (10 ng m-3)
The UK Heavy Metals network measures the Ni concentrations on filters sampled over a 2-week period. Annual mean
Ni concentrations measured in Sheffield city centre (Centre and Devonshire Green monitoring stations) have remained
consistently below the LAT since monitoring began in 2004. However, annual mean Ni concentrations at the Brinsworth
and Tinsley monitoring stations have ranged from 10 to 21 ng m-3 during this time indicating a localised enhancement
of Ni.
A scoping assessment and supplementary modelling work (Brookes and Rose 2016) were carried out to investigate the
source of the measured exceedance of the TV for Ni during 2014. These studies identified that the annual mean Ni
concentrations at these stations were typically greater than the LAT of 10 ng m-3 across all years (2004-14). Further,
the annual mean Ni concentrations were between the TV and UAT in 2005, 2010, 2011 and 2013. Exceedances of the
TV were only measured in 2004 and 2014 but has since exceeded again in 2016. The nearby Outokumpu steel
manufacturing plant, producing steel strip and coil products, was highlighted as the potential source of the elevated Ni
concentrations at these sites due to its locality as well as it being the largest nickel emissions source in the UK.
An enhanced daily measurement study undertaken in 2016 (Butterfield and Goddard 2016) also identified the
Outokumpu facility as the most likely source but accepted that hourly time resolution measurements of Ni combined
with local meteorological measurements would be required to provide further insight.
The aim of this study was to identify the sources of Ni with size < 10 µm (PM10) measured at the Tinsley Defra
measurement station. For that, data was collected during a 10 week measurement campaign using the latest high time
resolution measurement techniques. The location of the Tinsley measurement station and also the main industrial
sources of Ni are shown in Figure 1.

59
Figure 1: Map of showing the Sheffield Tinsley measurement station location and surrounding industrial sources

60
Methods
Measurement Campaign
Between the 19th January and the 26th March 2017, a range of chemical components of Particulate Matter (PM) were
measured at the Tinsley measurement station using the King’s Mobile Atmospheric Research Platform (MARPL) (Figure
2). The Tinsley measurement station (53° 24’ 38’’ N; 1° 23’ 46 ‘’W) is an affiliated site on the DEFRA Automatic Urban
and Rural Network (AURN) and is also a Heavy Metals Network site. The equipment is held within the grounds of the
Tinsley Community Centre approximately 200 metres east of the M1 motorway. The surrounding area is generally open,
with residential areas to the east of the M1 and light industrial premises to the west of the M1.
Concentrations of nitrogen oxides (NOX = NO + NO2) were available for the duration of the campaign at hourly basis for
this location from the AURN (https://uk-air.defra.gov.uk/data/). During the campaign, the National Physical Laboratory
(NPL) increased the time resolution of the filter measurement from bi-weekly to daily at the Tinsley site. Also, the
measurement of regulatory metals was complemented with a small suite of additional metals. This was done to ensure
that the XRF technique was comparable to the longer term measurements using ICP-MS because a short number of
weekly samples would not have produced the number and the diversity in concentrations to establish a robust
correlation between measurement techniques.
Figure 2: MARPL at Tinsley monitoring station (left) and inside MARPL (right)
Instrumentation
The instrumentation deployed in MARPL is listed below.
Meteorological Measurements
Wind speed, wind direction and temperature were measured at a height of 10 m using a Met One AIO2 weather sensor
at 15-minute-mean time resolution.
Aethalometer AE21
The Magee-32 aethalometer measured Black Carbon (BC) in PM with diameter <2.5 µm (PM2.5) at a 15 minute
resolution. The measurement technique is based on the transmission of light at 880 nm through a sample collected
onto a quartz tape. The instrument calculates the absorption coefficient of the sample by measuring the attenuation
of the light passing through the sample relative to a clean piece of filter. The change in the attenuation is converted to
BC concentration using a mass extinction coefficient of 16.6 m2 g-1 chosen by the manufacturer to give a good match to
Elemental Carbon. In practice this mass extinction coefficient varies with factors such as particle size, sample
composition and quantity of material already on the filter. The effect of this nonlinearity due to filter loading was
corrected using the model developed by Virkkula et al (2007).
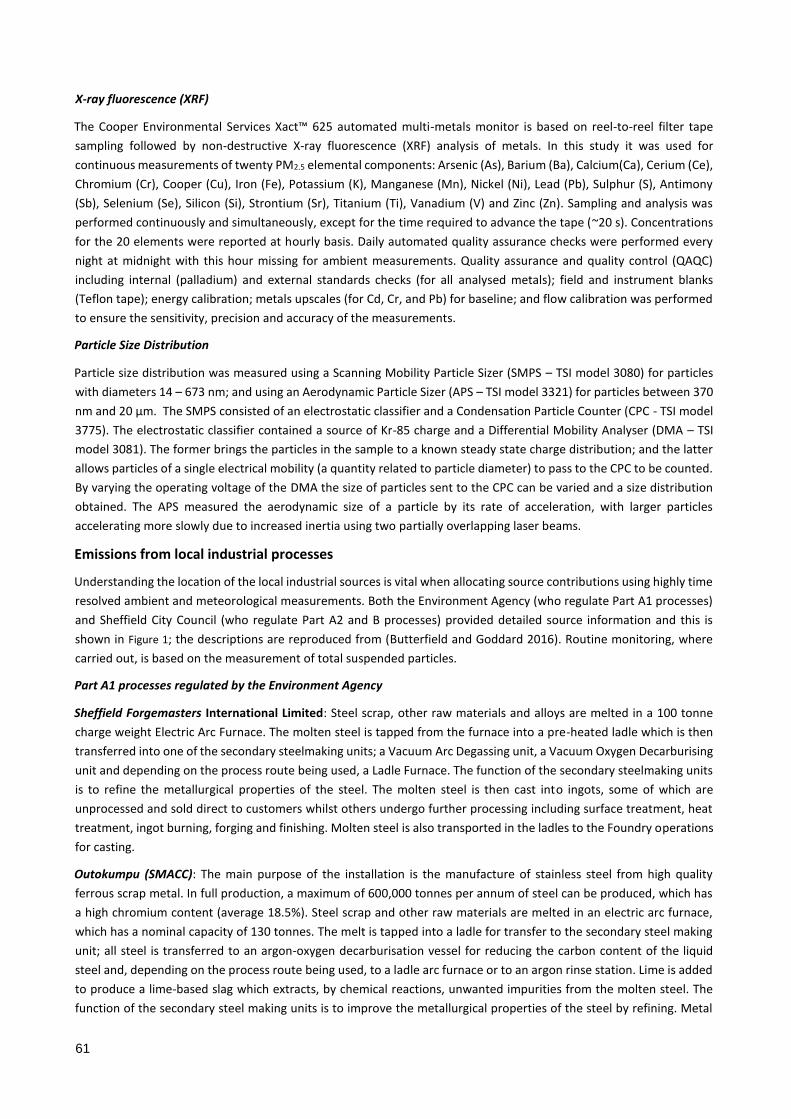
61
X-ray fluorescence (XRF)
The Cooper Environmental Services Xact™ 625 automated multi-metals monitor is based on reel-to-reel filter tape
sampling followed by non-destructive X-ray fluorescence (XRF) analysis of metals. In this study it was used for
continuous measurements of twenty PM2.5 elemental components: Arsenic (As), Barium (Ba), Calcium(Ca), Cerium (Ce),
Chromium (Cr), Cooper (Cu), Iron (Fe), Potassium (K), Manganese (Mn), Nickel (Ni), Lead (Pb), Sulphur (S), Antimony
(Sb), Selenium (Se), Silicon (Si), Strontium (Sr), Titanium (Ti), Vanadium (V) and Zinc (Zn). Sampling and analysis was
performed continuously and simultaneously, except for the time required to advance the tape (~20 s). Concentrations
for the 20 elements were reported at hourly basis. Daily automated quality assurance checks were performed every
night at midnight with this hour missing for ambient measurements. Quality assurance and quality control (QAQC)
including internal (palladium) and external standards checks (for all analysed metals); field and instrument blanks
(Teflon tape); energy calibration; metals upscales (for Cd, Cr, and Pb) for baseline; and flow calibration was performed
to ensure the sensitivity, precision and accuracy of the measurements.
Particle Size Distribution
Particle size distribution was measured using a Scanning Mobility Particle Sizer (SMPS – TSI model 3080) for particles
with diameters 14 – 673 nm; and using an Aerodynamic Particle Sizer (APS – TSI model 3321) for particles between 370
nm and 20 µm. The SMPS consisted of an electrostatic classifier and a Condensation Particle Counter (CPC - TSI model
3775). The electrostatic classifier contained a source of Kr-85 charge and a Differential Mobility Analyser (DMA – TSI
model 3081). The former brings the particles in the sample to a known steady state charge distribution; and the latter
allows particles of a single electrical mobility (a quantity related to particle diameter) to pass to the CPC to be counted.
By varying the operating voltage of the DMA the size of particles sent to the CPC can be varied and a size distribution
obtained. The APS measured the aerodynamic size of a particle by its rate of acceleration, with larger particles
accelerating more slowly due to increased inertia using two partially overlapping laser beams.
Emissions from local industrial processes
Understanding the location of the local industrial sources is vital when allocating source contributions using highly time
resolved ambient and meteorological measurements. Both the Environment Agency (who regulate Part A1 processes)
and Sheffield City Council (who regulate Part A2 and B processes) provided detailed source information and this is
shown in Figure 1; the descriptions are reproduced from (Butterfield and Goddard 2016). Routine monitoring, where
carried out, is based on the measurement of total suspended particles.
Part A1 processes regulated by the Environment Agency
Sheffield Forgemasters International Limited: Steel scrap, other raw materials and alloys are melted in a 100 tonne
charge weight Electric Arc Furnace. The molten steel is tapped from the furnace into a pre-heated ladle which is then
transferred into one of the secondary steelmaking units; a Vacuum Arc Degassing unit, a Vacuum Oxygen Decarburising
unit and depending on the process route being used, a Ladle Furnace. The function of the secondary steelmaking units
is to refine the metallurgical properties of the steel. The molten steel is then cast into ingots, some of which are
unprocessed and sold direct to customers whilst others undergo further processing including surface treatment, heat
treatment, ingot burning, forging and finishing. Molten steel is also transported in the ladles to the Foundry operations
for casting.
Outokumpu (SMACC): The main purpose of the installation is the manufacture of stainless steel from high quality
ferrous scrap metal. In full production, a maximum of 600,000 tonnes per annum of steel can be produced, which has
a high chromium content (average 18.5%). Steel scrap and other raw materials are melted in an electric arc furnace,
which has a nominal capacity of 130 tonnes. The melt is tapped into a ladle for transfer to the secondary steel making
unit; all steel is transferred to an argon-oxygen decarburisation vessel for reducing the carbon content of the liquid
steel and, depending on the process route being used, to a ladle arc furnace or to an argon rinse station. Lime is added
to produce a lime-based slag which extracts, by chemical reactions, unwanted impurities from the molten steel. The
function of the secondary steel making units is to improve the metallurgical properties of the steel by refining. Metal

62
alloying additions are made to achieve the correct steel analysis to meet specifications. The specific sources on the local
Outokumpu site are shown in Figure 3.
Figure 3: Sources on Outokumpu site
TATA Steel – Brinsworth Strip Mill: The Brinsworth Strip Mill, part of the TATA Special Steels business, operates a hot
mill producing narrow strip. The business also undertakes acid pickling of rolled strip to achieve the desired surface
cleanliness. The hot mill produces hot rolled strip (up to 515 mm wide) in carbon and alloy steels including certain non-
ferrous materials. It produces approximately 160,000 tonnes of hot coiled strip per annum. The Strip Pickling Plant
operates in conjunction with the Hot Mill to remove mill scale and clean the surface of the strip using dilute hydrochloric
acid prior to sale or subsequent cold rolling and/or heat treatment.
AMG Superalloys: The installation covers the production of nickel, cobalt and copper shot using an electric arc furnace;
and the production of ferro boron, chrome boron and nickel boron in three smaller electric arc furnaces.
Part B and A2 processes regulated by Sheffield City Council
Darwin Holdings: The melting of steel scrap, ferro alloys and pre-melt ingots in four high frequency electric induction
Inductotherm furnaces two of which have 2 tonne capacity, one with a 1 tonne capacity and one with 0.5 tonne nominal
capacity. All furnaces vent internally so emissions are fugitive. All their fettling/shot blasting activities vent internally to
the foundry.
Trefoil Steel: The production of stainless steel, carbon steel and low alloy steel melting clean pig iron and steel scrap
with the addition of ferro manganese, ferrochromium, ferro molybdenum, ferro silicon and calcium silicomanganese
as alloying elements, using two high frequency electric induction Inductotherm furnaces. The furnace capacities are
600 kg and 920 kg. The furnaces vent internally to the foundry so emissions are fugitive. They have shot blasting and
welding benches that vent internally but one arc air unit vents externally.
Norton Cast Products: The production of carbon steel, low alloy steel, stainless steel and nickel alloys in six furnaces.
This foundry has no stacks to atmosphere from the melting furnaces, the fumes are fugitive within the foundry and
then released via roof holes/cracks or roller shutter doors if these are open. They have recently installed a 5 tonne
furnace and this also vents internally. They have arc air, fettling and welding benches which are extracted to filters
which emit to atmosphere.
Atomising Systems: The process operates two main production atomisers. Atomisation is a process used to produce
powders of metal alloys to very high tolerance levels with respect to shape, size and consistency. The metal powders
are used in many industries and many applications ranging from solder and brazing pastes to catalytic converters and
nanotechnology. The main alloys produced on site are copper alloys. Other alloys include ferrous, nickel and precious
metal alloys. The production capacity is 2000 – 5000 tonnes of powder per annum.

63
Thessco Limited: Silver and base metals are melted in either electric or gas-fired furnaces of various sizes ranging from
0.035 to 1.5 tonne capacity. Molten metal alloys from the melting furnaces are then cast, using continuous casting units
or hand casting, into iron moulds.
Source identification
In order to identify the source contributing to the highest concentration of Ni, the bearings from the Tinsley monitoring
station to each registered process were calculated and are shown in
Table 2; information on the process was not always available and is therefore not included in section 0 above. The nickel
and chromium feedstock used by the industries near Tinsley as in March 2016 are summarized in Table 3.
Table 2: Mean distance and range of bearings to each Ni emitting process in the Sheffield area
Company Distance (m) Bearing
Darwins Holding Ltd 903 9
Trefoil Steel Company Ltd 983 9
AMG Superalloys UK Limited 2130 57
Outokumpu - Grinder Bag Filter 1327 168
Outokumpu - Cast Product cut-off Bag Filter 1488 169
Outokumpu - Melt Shop Bag Filter 1341 173
Outokumpu - DC Arc Furnace 1299 173
Outokumpu - Melting Shop Scanvenging Filter (West) 1429 180
Outokumpu - Melting Shop Scanvenging Filter (East) 1429 180
Outokumpu - West vent melt shop roof 1429 180
Outokumpu - East vent melt shop roof 1429 180
Sheffield Forgemasters International Ltd 2180 249
Atomising Systems Ltd 2448 186
Outokumpu Stainless Ltd 1270 193
Orchid Orthopedic Solutions Sheffield Ltd 3855 217
William Cook Integrity Ltd 3693 221
R.S. Bruce (metals & machinery) Ltd 2008 222
Castings Technology International 6182 224
Norton Cast Products Ltd 1903 225
The Alloy Steel Melting Company Ltd 5868 230
Veolia ES Sheffield Limited 4391 233
F E Mottram Ltd 3298 236
Thessco Ltd 3849 238
Brass Founders Sheffield 4321 243
Durham Foundry (Sheffield) Ltd 4067 245
ATI Allvac Ltd 3736 245
Transition International Ltd 6377 262
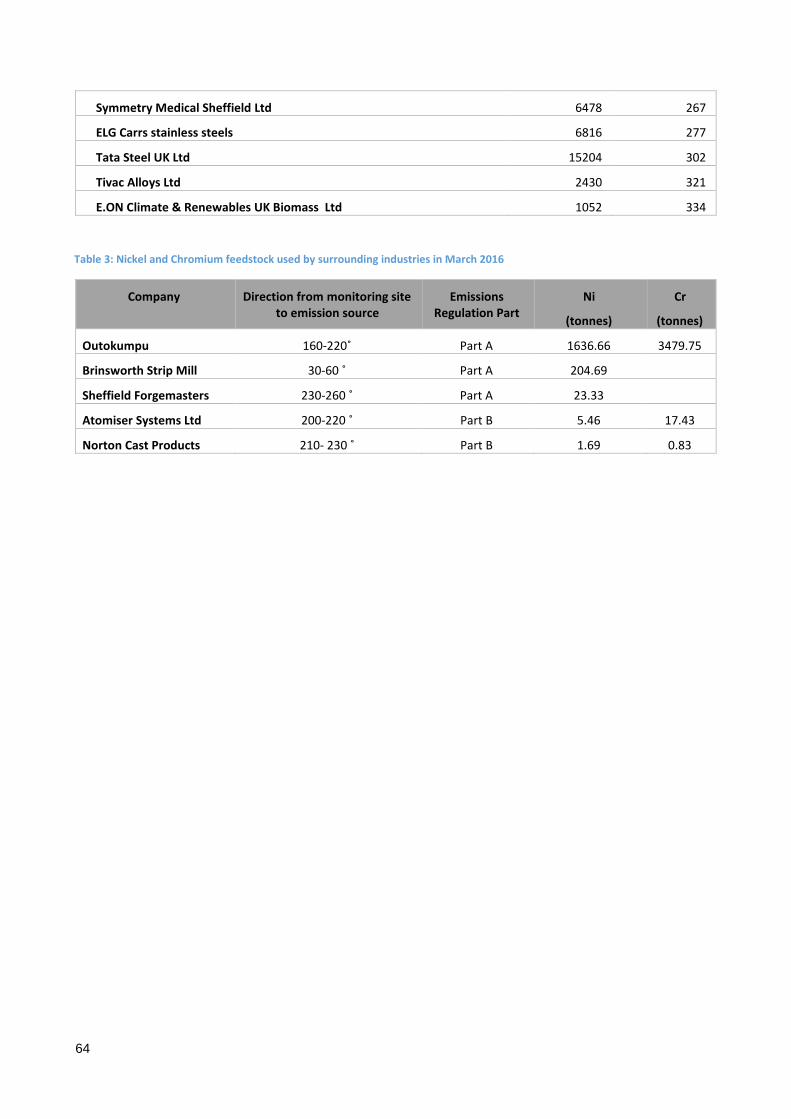
64
Symmetry Medical Sheffield Ltd 6478 267
ELG Carrs stainless steels 6816 277
Tata Steel UK Ltd 15204 302
Tivac Alloys Ltd 2430 321
E.ON Climate & Renewables UK Biomass Ltd 1052 334
Table 3: Nickel and Chromium feedstock used by surrounding industries in March 2016
Company Direction from monitoring site to emission source
Emissions Regulation Part
Ni
(tonnes)
Cr
(tonnes)
Outokumpu 160-220˚ Part A 1636.66 3479.75
Brinsworth Strip Mill 30-60 ˚ Part A 204.69
Sheffield Forgemasters 230-260 ˚ Part A 23.33
Atomiser Systems Ltd 200-220 ˚ Part B 5.46 17.43
Norton Cast Products 210- 230 ˚ Part B 1.69 0.83

65
Results
The following sections describe the measurements made using the different techniques during the campaign.
Temporal representativity
A key question when examining measurements from a relatively short sampling campaign is how representative of the
long term measurement they are. This question can be addressed by comparing the meteorological and ambient
measurement between the campaign and those measured over the long term. However, conclusions should be drawn
with some caution as, although the seasonal and meteorological variability can be somewhat characterised, little is
known about any changes in the emission patterns.
The long term weekly concentration of Ni is plotted in Figure 4 alongside the high time resolution measurements
averaged to a weekly mean. The long term means are stable except for a period between March and June 2016 where
Ni concentrations attained values > 100 ng/ m-3. Measurements for the period when the high-time resolve
measurements were undertaken (January – March 2017; shaded red rectangle) lie within the range of routinely
measured concentrations. The mean Ni concentration measured by routine filters was 19 ng m-3 (excluding those
measurements marked <LOD; Limit of Detection) while the mean concentration as measured by the XACT was 23.8 ng
m-3 (shown in Table 4).
Figure 4: Long term weekly measurements of Ni and Cr alongside measurements from the campaign (shaded red)
To assess whether the meteorological conditions experienced during this campaign were unusual, the wind speed and
wind direction measured during the campaign by the met mast at MARPL were compared to those measured at
Sheffield Airport for the whole of 2016; this comparison is shown in Figure 5. Generally, the two frequency plots are in
agreement, however there are large discrepancies in winds from 330˚, 360˚ and 150˚. Fortunately, none of these wind
directions align with any of the significant industrial sources and the campaign can be regarded as representative of the
typical wind speed and directions and therefore of industrial point sources. The broader seasonal variability, especially
drier summer conditions which may result in stronger fugitive sources, will not be reflected by this winter campaign.
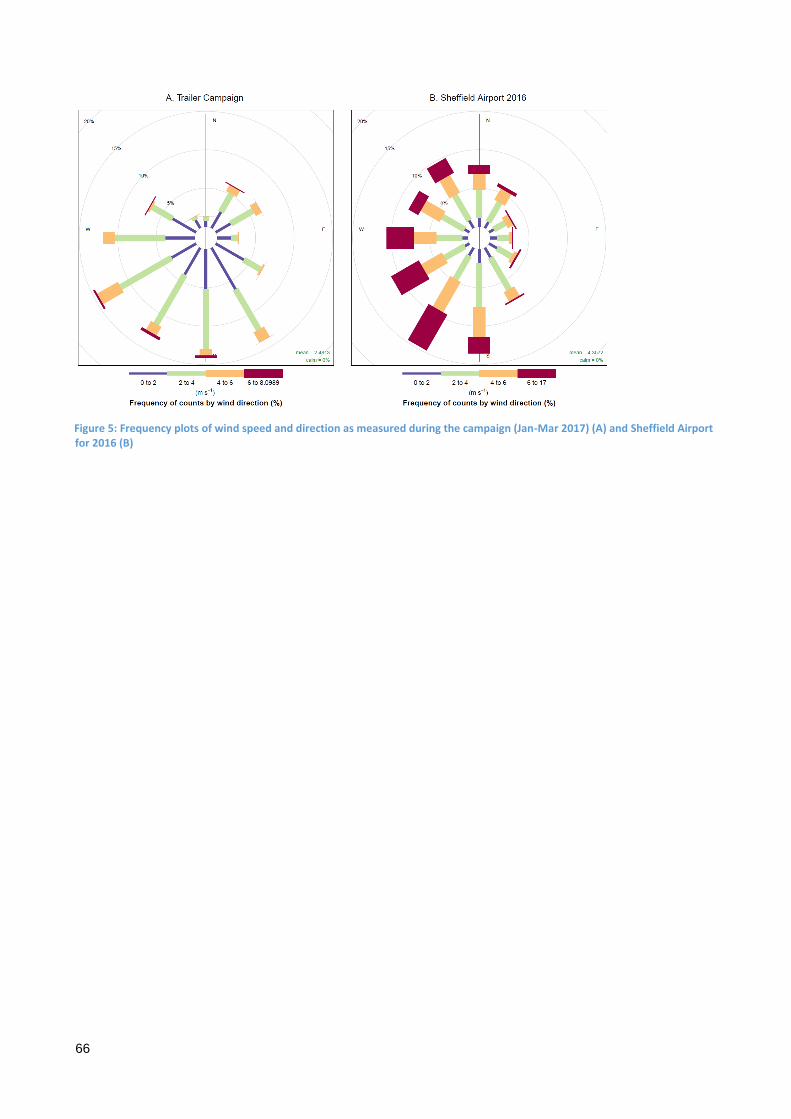
66
Figure 5: Frequency plots of wind speed and direction as measured during the campaign (Jan-Mar 2017) (A) and Sheffield Airport for 2016 (B)

67
PM mass concentrations and chemical composition
Campaign overview
The statistics for the hourly and daily mean concentrations for the metals measured by the XACT instrument are
summarized in Table 4. The mean Ni concentration was 23.8 ng m-3 (calculated from hourly means); this was above the
annual mean TV (20 ng m-3).
Table 4: PM chemical speciation data summary
Element Mean (ng m-3) Median (ng m-3) Min (ng m-3) Max (ng m-3)
As 2.9 0.4 0.0 670.8
Ba 2.7 1.1 1.1 160.1
Ca 402.0 248.5 1.7 4307.8
Cd 4.2 4.1 4.1 72.4
Ce 0.8 0.4 0.4 27.0
Cl 1364.5 761.2 4.8 9949.7
Cr 52.1 8.5 0.0 1520.0
Cu 18.0 11.4 0.3 203.1
Fe 685.7 453.5 10.9 15503.6
K 141.5 108.1 3.7 1020.0
Mn 47.2 14.6 0.2 1202.0
Mo 14.7 0.9 0.9 1794.6
Ni 23.8 3.1 0.3 1333.6
Pb 22.2 8.2 0.3 1310.4
Pt 0.2 0.2 0.2 1.8
S 782.2 492.0 24.9 4850.8
Sb 0.2 0.0 0.0 142.1
Se 0.9 0.2 0.1 34.8
Si 216.5 85.7 85.7 3545.2
Sr 1.2 0.5 0.5 9.3
Ti 27.4 11.3 0.4 2036.7
V 1.3 0.2 0.2 123.2
Zn 100.7 25.5 0.2 4873.8
The hourly time series, diurnal and weekly variations alongside a bivariate polar plot for Ni are shown in Figure 6. This
demonstrates the transient nature of the impact of the Ni emission at the Tinsley location; emissions combine with
meteorological factors to create a time series characterised by short term peak concentrations. This is in marked
contrast to the typical traffic signature exhibited by the NO2, Black Carbon (BC) and particle number (PCNT)
measurements shown in Figure 7, Figure 8 and Figure 9, respectively. All of these showed a bi-peak diurnal variation
consistent with the morning and afternoon rush hour peaks; and showed lower concentrations during the weekend
consistent with both reduced traffic and reduced industrial activity. The early morning peak was common to all
pollutants shown here and was the result of reduced dispersion and increased emissions at this time of day.
68
Figure 6: Hourly time series, diurnal variation, weekly variations and bivariate polar plot for Ni
Figure 7: Hourly time series, diurnal variation, weekly variations and bivariate polar plot for NO2
69
Figure 8: Hourly time series, diurnal variation, weekly variations and bivariate polar plot for Black Carbon
Figure 9: Hourly time series, diurnal variation, weekly variations and bivariate polar plot for Particle Number
Comparison with daily measurements
The comparison of daily mean, median, minimum and maximum metal concentrations as measured by the ICP-MS and
the XRF techniques is shown in Table 5. The overall means and peak concentrations were indeed comparable. Notably,

70
the Ni mean reported using the XRF technique (24.6 ng m-3) compared extremely well to that reported using ICP-MS
(24.3 ng m-3); as did the maximum concentration (113.5 and 113.2 ng m-3, respectively).
Table 5: Daily mean elemental measurements
Element XRF Daily (ng m-3) ICP-MS Daily (ng m-3)
Mean Median Min Max Mean Median Min Max
As 2.8 1.3 0.0 33.3 1.5 0.9 -0.2 26.2
Ba 2.7 1.8 1.1 28.4 0.8 0.3 0.0 11.7
Ca 396.6 368.1 37.2 1104.1 1.9 0.6 0.1 65.8
Cd 4.2 4.1 4.1 7.3 - - - -
Ce 0.8 0.7 0.4 1.6 - - - -
Cl 1370.8 1142.0 35.8 5129.1 - - - -
Cr 52.8 29.7 0.4 345.8 54.7 37.9 2.7 251.6
Cu 17.5 14.6 2.3 46.8 19.8 16.5 3.0 56.0
Fe 672.8 572.3 82.1 1952.7 706.7 584.4 91.8 1759.5
K 138.5 107.6 16.8 416.6 - - - -
Mn 47.4 32.4 1.6 286.9 40.8 29.4 1.8 241.2
Mo 15.1 7.1 0.9 129.8 - - - -
Ni 24.6 14.0 0.3 113.5 24.3 13.4 1.0 113.2
Pb 22.0 13.1 1.3 124.6 23.2 14.5 1.2 111.3
Pt 0.2 0.2 0.2 0.3 - - - -
S 777.8 548.6 126.0 3436.2 - - - -
Sb 0.2 0.0 0.0 6.2 - - - -
Se 0.9 0.3 0.1 5.5 1.9 1.2 0.3 6.2
Si 211.7 167.8 85.7 770.6 - - - -
Sr 1.2 1.1 0.5 3.6 - - - -
Ti 22.8 14.3 1.4 223.5 - - - -
V 1.2 0.6 0.2 12.9 1.5 1.1 0.2 9.6
Zn 99.9 58.2 4.5 624.8 102.1 56.5 3.8 605.4
Figure 10 shows the Reduced Major Axis (RMA) regression analysis comparing key metallic elements using XRF and ICP-
MS. All showed excellent agreement correlation coefficients (R) between 0.95 and 0.99. Slopes were generally greater
than 1 and varied between 1.06 and 1.29; this is consistent with previous comparisons (Furger, Minguillón et al. 2017)
and work undertaken in the UK (Font, Priestman et al. 2016). These inconstancies are likely due to differences in
sampling and calibration but are within expected between method variability. The consistency demonstrated by the
high correlation coefficients indicates that all sources were equally well captured by the different techniques and
therefore the hourly measurements undertaken by the XRF technique would accurately capture these sources in source
apportionment analysis.

71
Figure 10: RMA regression analysis comparing XRF and ICPMS measurements key metallic elements (clockwise from top left) Ni, Cr, Mn and Fe
Highly Time Resolved Ni Measurements
Measuring the chemical composition of airborne particulate matter (PM) can provide valuable information on the
concentration of regulated toxic metals and their sources and assist in the identification and validation of abatement
techniques. Undertaking these at a high time resolution (1 hour or less) enables receptor modelling techniques to be
more robustly linked to emission processes. Some indication of the primary Ni sources can be gained from a more
detailed analysis of the highly time resolved Ni concentrations in association with meteorological measurements. Figure
11 show a bivariate polar plot of the mean Ni concentrations superimposed on a map indicating the various sources
described for the Outokumpu site. It is clear that the dominant source lay in the direction of the Outokumpu site south
of Tinsley site although there was clearly an additional source to the north-east.

72
Figure 11: Bivariate polar plot of Ni concentrations superimposed on map showing Outokumpu emission sources
This type of bivariate polar plot accentuates the influence of peak concentrations on the mean. Further insight into the
potential wide range of sources in the area can be gained by examining the same data as a conditional probability
function bivariate polar plot. The Conditional Probability Function (CPF) BPP shows the probability (0-1) of any specific
point on the polar plot of exceeding a set percentile. The more likely that that point exceeds the percentile the greater
the intensity. This method appears to be very useful to identify sources of pollutants in complex areas where multiple
sources are located as those tend to occupy concentration intervals at given wind direction and conditions (Uria-
Tellaetxe and Carslaw 2014). CPF BPPs of Ni at the 25th, 50th, 75th and 95th percentiles are shown in Figure 12; the high
colour intensity to the south and north-east was consistent with the mean polar plot in Figure 11, Figure 6. However, at
lower concentrations, the influence of other sources became clear. At the lowest concentrations, below 0.3 ng m-3,
three directional sources were apparent but as concentrations increased through the 50th percentile (3.2 ng m-3) and
75th percentile (14 ng m-3) the influence of this westerly source decreased leaving only the sources to the south and
north-east. It is interesting to note that the source to the north-east was only prevalent at higher wind speeds – this
may be consistent with a fugitive ground level source which was only detectable under strong winds.
Figure 12: Conditional probability function bivariate polar plots showing Ni concentrations at the 25th, 50th, 75th and 95th percentiles

73
Positive Matrix Factorisation (PMF) Source Apportionment
Source apportionment techniques have been widely used to quantitatively determine PM sources. The main source
apportionment models include chemical mass balance (CMB) and positive matrix factorization (PMF). CMB uses a priori
knowledge of source profiles and assumes that the composition of all sources is well defined and known (Henry, Lewis
et al. 1984). This technique is ideal when changes between the source and the receptor are minimal, although this
rarely happens in real atmospheric conditions and the constraints may add a high level of uncertainty. PMF is a least-
squares approach based on a receptor-only multivariate factor analytic model (Paatero and Tapper 1994). The main
difference between PMF and CMB is that the first does not require any prior information about the sources as input to
the model and the profiles and contributions are uniquely modelled by the solver (Paatero, Hopke et al. 2002).
In this instance, we are not seeking to quantify the contribution of the different sources to total PM10 mass
concentrations; instead we are attempting to understand the contribution of each source to the Ni concentration. This
therefore requires a slightly modified approach and many sources, identified by the PMF algorithm, may contribute
significantly to the mass of PM10 (e.g. marine aerosol) but contain no Ni and therefore can be ignored. The important
aspect of the PMF solver in this study remains in those source outputs that contributed to Ni concentration.
PMF source apportionment was undertaken on the combined data set of XACT data; the chemical components included
were Ba, Ca, Ce, Cl, Cr, Cu, Fe, K, Mn, Mo, Ni, Pb, Pt, S, Se, Si, Sr, Ti, V. PMF runs were configured to yield between 1 and
15 sources. The resulting sources produce both an ‘explained variation’ and ‘percentage contribution’ for the overall
factors to the measured concentration of PM10 (shown in Figure 13). The “explained variation” provides information
about which factors were more important in describing either the mass or the factor while the relative contribution
quantifies which factor or element dominated the measured mass.
Figure 13: Explained variation, relative contribution and mass contribution of the different factor solutions (black is unexplained)
The optimum number of sources was chosen based on a number of model diagnostic outputs and attributes of idealised
expected solutions:
1. Q/Qexp is a measure of the model residuals and reduces as the model explains more of the variability
in the input measured data.
2. The maximum correlation between factor time series (TS_R2) measures whether two of the factors
are temporally correlated, identifying therefore factors that potentially describe the same source.
3. The maximum percentage Ni contribution. A solution which reflects the geographical distribution of
Ni sources as identified in the Bivariate Polar Plots (three as observed in Figure 11, Figure 12) was therefore
sought.

74
Figure 14: PMF diagnostic outputs – Q/Qexp (A), factor times series correlation coefficient (B) and the maximum percentage Ni contribution (C)
The results of these diagnostics are shown in Figure 14. Q/Qexp reduces as more factors are defined and the model
explains more of the measurements. Ideally a solution with the lowest Q/Qexp is chosen however the solutions need to
be physically meaningful so it is not just a matter of choosing the solution with the largest number of factors.
The maximum correlation between factor time series (TS_R2) increased beyond 9 factors and then stabilised (with the
exception of the 11 factor solution). Although there was some correlation between factors, there were not two factors
describing a single emission.
The maximum percentage Ni contribution from a single source decreased after 8 factors, indicating that as more factors
were introduced the Ni was apportioned to more than one single factor. Looking in detail at the solutions with more
than 9 factors, two distinct sources of nickel were common across the solutions (except for the 11 factor solution; Table
6). There was one factor rich in Cr and Mn and also, to a lesser extent, in Cu. It accounted for 25-30% of Ni. The other
was rich in Mo and to a lesser extent in Fe and accounted for 70-80% of the Ni. At 13 and 14 factors the maximum
contribution of Ni stabilised at approximately 70% before rising at 15 factors. The 15 factor solution allocated most of
the Ni to the Cr factor and distributed the remainder across several different factors. At a higher number of factors the
PMF algorithm did not distribute the Ni into additional sources. A stability in the factor solutions was therefore achieved
at 13 and 14 factors accompanied by a low Q/Qexp. These solutions are examined in more detail below.
Table 6: Relative contributions to the different elements from solution with more than 9 factors
Element Ni, Mn and Cr rich factors Ni and Mo rich factors
Number of Factors Number of Factors
9 10 11 12 13 14 15 9 10 11 12 13 14 15
Ba 22% 0% 0% 0% 0% 0% 0% 0% 0% 0% 0% 0% 0% 1%
Ca 0% 23% 9% 9% 17% 15% 21% 0% 0% 0% 0% 0% 0% 0%
Ce 0% 0% 0% 0% 0% 0% 0% 0% 0% 1% 0% 0% 0% 0%
Cl 84% 0% 0% 0% 0% 0% 0% 0% 0% 3% 0% 0% 0% 0%
Cr 20% 95% 98% 95% 99% 99% 74% 16% 5% 0% 5% 1% 1% 0%
Cu 3% 17% 14% 8% 21% 15% 27% 11% 9% 20% 4% 7% 7% 0%
Fe 3% 3% 14% 0% 2% 5% 2% 27% 26% 0% 26% 18% 16% 6%
K 77% 0% 0% 0% 0% 1% 0% 1% 0% 58% 0% 0% 0% 1%
Mn 0% 78% 68% 77% 76% 72% 51% 8% 6% 6% 5% 0% 0% 33%
Mo 13% 0% 16% 0% 0% 0% 0% 80% 83% 54% 77% 75% 82% 96%
Ni 53% 22% 90% 25% 29% 27% 0% 86% 78% 7% 75% 71% 73% 2%
Pb 0% 0% 0% 0% 0% 0% 0% 0% 0% 0% 0% 0% 0% 0%
Pt 0% 0% 0% 1% 1% 1% 0% 0% 0% 3% 0% 0% 0% 1%

75
S 0% 2% 2% 5% 0% 2% 0% 4% 2% 0% 2% 4% 2% 9%
Se 2% 0% 0% 0% 0% 0% 0% 0% 0% 0% 0% 0% 0% 0%
Si 0% 1% 1% 0% 0% 0% 1% 1% 1% 20% 1% 2% 1% 0%
Sr 0% 0% 0% 0% 0% 0% 0% 0% 1% 0% 1% 0% 0% 0%
Ti 0% 0% 0% 0% 0% 0% 0% 1% 1% 52% 0% 0% 1% 2%
V 70% 0% 0% 0% 0% 0% 0% 0% 0% 99% 0% 0% 0% 0%
Zn 0% 23% 12% 23% 0% 0% 41% 0% 0% 0% 0% 0% 0% 0%
Nickel Sources in the 13 and 14 Factor Solutions
The two Ni sources types were identified in both the 13 and 14 factor solutions. One was rich in Mo (Ni/Mo) and the
other in Cr (Ni/Cr). The Ni/Mo source type was the largest of the two sources contributing 73% and 72% of the assigned
Ni in factor 13 and 14, respectively. The Ni/Cr source type contributed 22% to both factor 13 and 14 (Figure 15). A 5-6%
of the Ni measured remained unexplained by the PMF algorithm and cannot be assigned to a specific source.
The different chemical composition; and the relative elemental contributions (i.e. how much of the total measured
concentration does the factor explain) can help to identify the different source types. However, much more information
relating to the scrap steel melted and composition of the alloys produced would be needed to categorically assign these
factors to specific industrial processes.
Figure 15: Relative elemental source contributions of Ni/Mo source type (left) and Ni/Cr source type (right)
Nickel / Molybdenum (Ni/Mo) source type
Figure 16 and Figure 17 show the hourly time series, diurnal variation, weekly variations and bivariate polar plot for 13
and 14 factor Ni/Mo source respectively. The solutions are very similar, having an R2 of 0.99. The hourly time series
demonstrates the typical episodic response expected from a nearby industrial source. The diurnal variation shows that
the concentrations were elevated on the early morning suggesting that at least some of the peak concentrations
occurred during still stable conditions; this was confirmed by the bivariate polar plot, with a colour intensity in the
centre – typical of elevated concentrations due lack of dispersion. However, there were also stronger influences at
higher wind speeds from both the south at approx. 180˚ and at approx. 10˚. This indicates two separate sources emitting
PM10 of a similar chemical composition. This was not unexpected as there are many similar industrial processes in the
Sheffield area. Concentrations were much lower on weekend days; this indicates that emissions were related to human
and industrial activity cycles.
Examining the description of the local industrial activity in section 0 and the bearing of these processes from the Tinsley
measurement station in section 2.4, it is clear that the source from approximately 10˚ was associated with Darwin
Holdings and / or Trefoil Steel. Their processes are consistent with a release of Fe, Mo and Ni. Outokumpu is the

76
dominant emitter to the south so was expected to be the source in this direction. Other sources to the east also
contributed towards the mean concentration.
To investigate the behaviour of this source type with wind speed and direction the Ni/Mo source strength in µg m-3 was
analysed as a pollution rose disaggregated into days of the week and are shown in Figure 18. In general, the Ni/Mo
source type was more prevalent on weekdays than on Sundays. However the frequency of winds from the south was
low (<5%) on Sundays, Mondays, Tuesdays and Thursdays but only Mondays and Sundays showed a contribution less
than 1 µg m-3 to the Ni/Mo source type. It is clear from the polar plot and the Thursday pollution rose that concentration
were elevated even at low wind speeds; this indicates a local source whose concentration increased during periods of
reduced dispersion. Conversely, elevated concentrations of this source type were predominantly seen during high wind
speeds from the south and north-east. This indicates that wind speed was also be important in the transport of the
source from more distant locations or the atmospheric mixing of the source in the atmosphere to increase ground level
concentrations from more nearby sources.
Figure 16: Hourly time series, diurnal variation, weekly variations and bivariate polar plot for the 13 factor Ni/Mo source

77
Figure 17: Hourly time series, diurnal variation, weekly variations and bivariate polar plot for the 14 factor Ni/Mo source
78
Figure 18: Ni/Mo source strength pollution rose disaggregated by day of week
Nickel / Chromium (Ni/Cr) source type
Figure 19 and Figure 20 show the hourly time series, diurnal variation, weekly variations and bivariate polar plot for 13
and 14 factor Ni/Cr source respectively. The solutions were very similar, having an R2 of 0.99. The hourly time series
demonstrates the typical episodic response expected from a nearby industrial source in a similar way to the Ni/Mo
source. However, the diurnal profile was somewhat different, with no morning and evening elevations which are
associated with reduced dispersion from local sources. Instead mean concentrations remained uniform throughout the
day suggesting that emissions from this source were independent of typical daily urban activity cycles. The strongest
source was clearly from the south although there were also signs of a source at approximately 10˚. Again, this indicates
two separate sources emitting PM10 of a similar chemical composition: Darwin Holdings and / or Trefoil Steel to the
north; and Outokumpu to the south; although in this case the source to the south was stronger than for the Ni/Mo
source. Again, other sources to the east also contributed towards the mean concentration.
To investigate the behaviour of this source type with wind speed and direction the Ni/Cr source strength in µg m-3 was
analysed as a pollution rose disaggregated into days of the week and are shown in Figure 21. In general, the Ni/Cr source
type was more prevalent on weekdays than on Sundays, however the frequency of winds from the south was low (<5%)
on Sundays, Mondays, Tuesdays and Thursdays but only Tuesdays and Thursdays showed a contribution greater than

79
1 µg m-3 to the Ni/Cr source type. This source type therefore appeared to be more strongly related to wind speed than
the Ni/Mo source type.
Figure 19: Hourly time series, diurnal variation, weekly variations and bivariate polar plot for the 13 factor Ni/Cr source
Figure 20: Hourly time series, diurnal variation, weekly variations and bivariate polar plot for the 14 factor Ni/Cr source

80
Figure 21: Ni/Cr source strength pollution rose disaggregated by day of week
To assess whether wind speed influenced the strength of this source, the winds from the south (from 170 to 190
degrees) were taken and binned by wind direction. The resulting plot is shown in Figure 22 and demonstrates that the
strength of the source from the south increased with wind speed. Although elevated wind speeds enhance the mixing
and dispersion from the source points to the measurement location, the lack of elevated concentrations at low wind
speeds (as was the case for the Ni/Mo source) indicates that wind resuspension clearly played a role. The industrial
activity / process which may be leading to these emissions was therefore likely to be related to fugitive emissions from
stockpiles, vehicle movements or material handling. The presence of Ca in the elemental signature for this source type
may help to identify the activity / process as it is used in the steel making and is a component of the slag produced as
a by-product.

81
Figure 22: Ni/Cr source strength vs wind speed coloured by wind direction (170-190 only)

82
Apportionment of Ni measurements using k-means cluster analysis of bivariate polar plots
K-means cluster analysis of condition probability function (CPF) bivariate polar plots (BPPs) was successfully applied to
source apportion Ni concentrations at Pontardawe in the Swansea Valley, where they routinely exceed the EU Target
Value (Font, Priestman et al. 2016). This approach relies upon the combination of high time resolution measurements
and meteorological measurement combined into bivariate polar plots; from where they can be grouped into clusters
based on the influencing meteorological variables (Carslaw and Beevers 2013). Using a CPF BPP better represents the
influence of different sources at low concentrations as BPPs using the mean are skewed by a small number of high
concentrations and tends to accentuate the influence of sources which contribute to the peak concentrations; this is
shown in Figure 12. A modified approach was used here using the results of the PMF model rather than the unprocessed
Ni data and allows the PMF solutions with multiple sources to be quantified by source direction.
The process of clustering data proceeds as follows. First, k points are randomly chosen from the data space which
represents the initial group centroids. Each data point is therefore assigned to the group based on the closest centroid
point. When all objects have been assigned, the position of k centroids is recalculated. The two steps are repeated until
the centroids no longer move.
One of the disadvantages of the method is the subjective choice of the number of k clusters. While many methods exist
to determine the optimum number of clusters applied to time series datasets, these methods do not work effectively
when applied to bivariate polar plots. The choice of the number of appropriate clusters is therefore heuristic and is best
determined by post-processing. The number of clusters might be chosen based on a priori knowledge of the area of
study (e.g. different known sources); or by repeating the k-means clustering with different numbers of groups (Carslaw
and Beevers, 2013).
Here the CPF percentile and the number of clusters was varied to achieve the optimum cluster solution. This was tested
using the Ni/Mo source from Factor 13; k-means clustering between 2 and 10 clusters was undertaken on CPF BPPs at
percentile values at 5% intervals between 50th and 75th percentiles; these results are included in the appendix. The
optimum cluster solution was chosen based on source relevance – the clusters needed to clearly distinguish between
the three source directions while still being physically meaningful. At low percentile values the southerly and easterly
sources were not adequately distinguished below 6 clusters, by which point the number of clusters exceeded the
meaningful sources. Only at the 75th percentile did the southerly, easterly and westerly sources resolve at low number
of clusters - here, 3 clusters were adequate to distinguish between the different source directions and provide three
broad source directions: South, East and West. K-means clustering was repeated on the remaining factor solutions at
the 75th percentile to ensure that this was an optimum solution; these are also included in the Appendix. The 75th
percentile CPF BPP and the resulting 3 source solution for the Ni/Mo and Ni/Cr sources for both the 13 and 14 factor
solutions are shown in Figure 23.

83
Figure 23: CPF BPP for 75th percentile (A) and the resulting 3 source solution (B) for the 13 factor Ni/Mo solution (1), 14 factor Ni/Mo solution (2), 13 factor Ni/Cr solution (3) and 14 factor Ni/Cr solution (4)

84
Table 7: Source contribution identified by each cluster / source direction
Sou
rce
Dir
ect
ion
13 Factors 14 Factors Mean
Ni/Mo source
Ni/Cr Source
Total Ni/Mo source
Ni/Cr Source
Total Ni/Mo source
Ni/Cr Source Total
µg
m-3
% Ni
µg
m-3
% Ni
µg
m-3
% Ni
µg
m-3
% Ni
µg
m-3
% Ni
µg
m-3
% Ni
µg
m-3
% Ni
µg
m-3
% Ni
µg
m-3
% Ni
South 7.2 32.2 3.4 15.1 10.6 47.3 6.9 30.7 3.6 15.9 10.4 46.6 7.0 31.4 3.5 15.5 10.5 46.9
West 2.4 10.7 0.7 3.0 3.1 13.8 2.4 10.6 0.6 2.7 3.0 13.4 2.4 10.7 0.6 2.9 3.0 13.6
East 7.8 34.8 1.1 4.8 8.9 39.6 7.7 34.4 1.2 5.3 8.9 39.7 7.8 34.6 1.1 5.0 8.9 39.6
The clustering algorithm allocated each measurement to one of these 3 source directions and the mean concentration
of each is shown in Table 7 and provides a quantification of the contribution of each source type (Ni/Mo or Ni/Cr) to the
total Ni concentration measured at Sheffield Tinsley. Both the 13 and 14 factor solutions are shown and provide similar
estimates for the Ni contributions from the different source types and directions. These can therefore be robustly
combined to provide a mean contribution from each. The dominant source direction was from the South which
contributed 46.9% to the Ni concentrations measured; this was made up of 31.4% Ni/Mo and 15.5% Ni/Cr. Given that
the Outokumpu facility lays in this direction and accepted to be the largest emitter of Ni in the area, this can confidently
be associated with this facility. The West source direction made the smallest contribution (13.6%) and was dominated
by the Ni/Mo source type (10.7%) while the Ni/Cr source type contributed 2.9%. This cluster represents the emissions
from over half of the Ni emitting industries in Sheffield, which lie in that direction. The East source direction contributed
39.6% which was dominated by the Ni/Mo source type (34.6%) with a more minor contribution from the Ni/Cr source
type (5%). There are two facilities to the east, closely aligned with the peak concentrations identifiable in the bivariate
polar plots – Darwin Holdings and Trefoil Industries – either or both could be responsible for the emissions from this
cluster.

85
Conclusions
This study analysed the data from MARPL deployment at the Tinsley site between 19th January and the 26th March 2017.
The aim of the project was to provide a source attribution of the measured nickel concentrations at this site.
The instrumentation deployed delivered a high time resolution dataset containing a range of elements and chemical
constituents of PM10 which were used to directly apportion PM mass or infer source characteristics. In particular the
range of different components measured was capable of distinguishing between different sources of nickel as they have
different chemical composition.
The source apportionment was undertaken in a two-step process:
1. Positive Matrix Factorisation (PMF) – this method used the XRF measurements to apportion the nickel sources around
Sheffield Tinsley. PMF yielded two types of Ni sources – one associated with high Mo concentrations (Ni/Mo) and one
with high Cr (Ni/Cr). These describe different processes used in the industries around Sheffield and they were observed
to be emitted at different times of days and consequentially had different diurnal profiles. However, they had similar
weekday to weekend cycles suggesting both were driven by anthropogenic rather than meteorology. The Ni/Mo source
contributed 72% of the overall Ni concentrations; and the Ni/Cr contributed 22%. The remaining 6% could not be
assigned to a specific source.
The Ni/Mo source type also contained some Cu and Fe and was observed to peak in the early morning; this was
consistent with local point sources influenced by a lack of dispersion. It was also elevated at the increased wind speeds
necessary to either transport emissions from the industrial source to the measurement location although a role of wind
driven resuspension cannot be ruled out.
The Ni/Cr source type also contained significant amounts of Mn, Cu, Ca and some Fe. It had no obvious diurnal pattern
and was shown to peak when wind directions were from the south and increased with wind speed; this indicates that
it was at least partially a wind-driven source. The type of activity which led to these emissions was therefore likely to
be related to fugitive emissions from stockpiles, vehicle movements or material handling. The presence of Ca in the
elemental signature for this source may help to identify the source as it is used in the steel making process and is a
component of the slag produced as a by-product.
2. Clustering of conditional probability function bivariate polar plots – this method relies upon the combination of high
time resolution measurements and meteorological measurement combined into bivariate polar plots; from where they
can be grouped into clusters based on the influencing meteorological variables. The resulting factors from the PMF
results were then cluster to be segregated into sources based on the direction and wind speed and calculated their
contribution to Ni concentrations.
There were 3 source directions – East, West and South. The source was from the south, which contributed 46.9% to the
Ni concentrations measured during this study, can confidently be associated with the Outokumpu facility as there were
no other significant sources of Ni in that direction. This contribution can be viewed as 31.4% from the Ni/Mo source
type, most likely related to point sources, and 15.5% from the Ni/Cr source type most likely related to fugitive emissions
from stockpiles, vehicle movements or material handling.
The source from the West made the smallest contribution (13.6%) and represented the emissions from over half of the
industries in Sheffield, which lie in that direction and was dominated by the Ni/Mo source.
The source to the East contributed 39.6%. Of this, 34.6% was related to the Ni/Mo source type most likely related to
point sources, and 5% from the Ni/Cr source type most likely related to fugitive emissions from stockpiles, vehicle
movements or material handling.
The widespread nature of the Ni/Mo point related source type across industries in Sheffield makes this challenging to
tackle. However, focusing resources to identify specific processes from the identified industrial sources (Outokumpu,
Darwin Holdings and Trefoil Industries) would be a useful initial step towards reducing Ni emissions. The Ni/Cr source
type was clearly most influenced by the local Outokumpu activity and was responsible for 15.5% of the Ni measured at

86
the Tinsley measurement station. Further work with Outokumpu to identify the processes and / or activities which are
leading to these emissions may be the most cost-effective way of ensuring that the measurements at the Sheffield
Tinsley site remain below the annual mean EU Target Value for Ni of 20 ng m-3.
The ongoing assessment of the Sheffield Tinsley site against the EU Target Value should clearly continue to be assessed
using the standard measurement approach. However, if a further assessment of the contribution of the different
sources is required, either during different seasonal conditions or following an intervention to reduce emissions from
a specific source, then a repeat of the measurement strategy employed here should be considered.

87
References
Brookes, D. and R. Rose (2016). Local study of point source contributions to nickel in Sheffield, 2014, Ricardo Energy &
Environment.
Butterfield, D. and S. L. Goddard (2016). Summary of Daily Metals Concentrations measured at Sheffield Tinsley 25th
February 2016 to 9th August 2016, National Physical Laboratory.
Carslaw, D. C. and S. D. Beevers (2013). "Characterising and understanding emission sources using bivariate polar plots
and k-means clustering." Environmental modelling & software 40: 325-329.
Font, A., M. Priestman, A. H. Tremper, D. C. Carslaw and D. C. Green (2016). Identifying Key
Sources of Emissions of Problem Pollutants in Wales A Research Collaboration to Utilise Novel Monitoring and Data
Analysis Assessment Techniques to Drive Innovation - Pontardawe Report, King's College London.
Furger, M., M. C. Minguillón, V. Yadav, J. G. Slowik, C. Hüglin, R. Fröhlich, K. Petterson, U.
Baltensperger and A. S. H. Prévôt (2017). "Elemental composition of ambient aerosols measured with high temporal
resolution using an online XRF spectrometer." Atmos. Meas. Tech. 10(6): 2061-2076.
Henry, R. C., C. W. Lewis, P. K. Hopke and H. J. Williamson (1984). "Review of receptor model fundamentals."
Atmospheric Environment (1967) 18(8): 1507-1515.
Paatero, P., P. K. Hopke, X.-H. Song and Z. Ramadan (2002). "Understanding and controlling rotations in factor analytic
models." Chemometrics and Intelligent Laboratory Systems 60(1–2): 253264.
Paatero, P. and U. Tapper (1994). "Positive matrix factorization: A non-negative factor model with optimal utilization of
error estimates of data values." Environmetrics 5(2): 111-126.
Uria-Tellaetxe, I. and D. C. Carslaw (2014). "Conditional bivariate probability function for source identification."
Environmental Modelling & Software 59(0): 1-9.
Virkkula, A., T. Mäkelä, R. Hillamo, T. Yli-Tuomi, A. Hirsikko, K. Hämeri and I. K. Koponen (2007). "A Simple Procedure
for Correcting Loading Effects of Aethalometer Data." Journal of the Air & Waste Management Association 57(10):
1214-1222.

88
Appendix
Figure 24: k-means clustering between 2 and 10 clusters on 13 Factor Ni/Mo source at 50th percentile CPF BPPs

89
Figure 25: k-means clustering between 2 and 10 clusters on 13 Factor Ni/Mo source at 55th percentile CPF BPPs

90
Figure 26: k-means clustering between 2 and 10 clusters on 13 Factor Ni/Mo source at 60th percentile CPF BPPs

91
Figure 27: k-means clustering between 2 and 10 clusters on 13 Factor Ni/Mo source at 65th percentile CPF BPPs

92
Figure 28: k-means clustering between 2 and 10 clusters on 13 Factor Ni/Mo source at 70th percentile CPF BPPs

93
Figure 29: k-means clustering between 2 and 10 clusters on 13 Factor Ni/Mo source at 75th percentile CPF BPPs

94
Figure 30: k-means clustering between 2 and 10 clusters on 13 Factor Ni/Cr source at 75th percentile CPF BPPs

95
Figure 31: k-means clustering between 2 and 10 clusters on 14 Factor Ni/Mo source at 75th percentile CPF BPPs

96
Figure 32: k-means clustering between 2 and 10 clusters on 14 Factor Ni/Cr source at 75th percentile CPF BPPs