report on solar energy storage life · pdf filereport on solar energy storage methods and life...
TRANSCRIPT
Energy Research and Development Div is ion FINAL PROJECT REPORT
Report on Solar Energy Storage Methods and Life Cycle Assessment
Prepared for: California Energy Commission
Prepared by: California Solar Energy Collaborative (CSEC), University of California Davis
MAY 201 2 CEC‐500‐2013‐073

PREPARED BY: Primary Authors: Yu Hou Ruxandra Vidu Pieter Stroeve
California Solar Energy Collaborative (CSEC) UC Davis Energy Institute University of California 1 Shields Avenue Davis, California 95616 http://energy.ucdavis.edu/centers-and-programs/crec/
Contract Number: 500-08-017, Task 5.3
Prepared for:
California Energy Commission
Prab Sethi Contract Manager
Linda Spiegel Office Manager Energy Generation Research
Laurie ten Hope Deputy Director
ENERGY RESEARCH AND DEVELOPMENT DIVISION Robert P. Oglesby Executive Director
DISCLAIMER
This report was prepared as the result of work sponsored by the California Energy Commission. It does not necessarily represent the views of the Energy Commission, its employees or the State of California. The Energy Commission, the State of California, its employees, contractors and subcontractors make no warrant, express or implied, and assume no legal liability for the information in this report; nor does any party represent that the uses of this information will not infringe upon privately owned rights. This report has not been approved or disapproved by the California Energy Commission nor has the California Energy Commission passed upon the accuracy or adequacy of the information in this report.

i
ACKNOWLEDGEMENTS
The following members of the California Renewable Energy Center leadership team guided the preparation of this report based on their experience in managing CREC predecessor organizations and developing the CREC Strategic Plan. Their contributions were indispensable.
• Pieter Stroeve, Co‐Director, California Solar Energy Collaborative
• Bryan Jenkins, Director, UC Davis Energy Institute and Principal Investigator
ii
PREFACE
The California Energy Commission Energy Research and Development Division supports public interest energy research and development that will help improve the quality of life in California by bringing environmentally safe, affordable, and reliable energy services and products to the marketplace.
The Energy Research and Development Division conducts public interest research, development, and demonstration (RD&D) projects to benefit California.
The Energy Research and Development Division strives to conduct the most promising public interest energy research by partnering with RD&D entities, including individuals, businesses, utilities, and public or private research institutions.
Energy Research and Development Division funding efforts are focused on the following RD&D program areas:
• Buildings End‐Use Energy Efficiency
• Energy Innovations Small Grants
• Energy‐Related Environmental Research
• Energy Systems Integration
• Environmentally Preferred Advanced Generation
• Industrial/Agricultural/Water End‐Use Energy Efficiency
• Renewable Energy Technologies
• Transportation
Report on Solar Energy Storage Methods is the final report for the Research program Plan for Renewable Energy project (contract number 500‐08‐017, Task 5.3, conducted by California Solar Energy Collaborative, University of California, Davis. The information from this project contributes to Energy Research and Development Division’s Renewable Energy Technologies Program.
For more information about the Energy Research and Development Division, please visit the Energy Commission’s website at www.energy.ca.gov/research/ or contact the Energy Commission at 916‐327‐1551.

iii
ABSTRACT
The sun provides an abundant source of renewable energy that can be integrated with the electrical grid. However, solar energy storage becomes critical when unsteady sources of energy provide a large portion of the total electricity produced. Different solar energy storage technologies were reviewed in this report and were classified into categories according to capacity and discharge time. Life cycle assessments were compiled and reviewed for a variety of storage technologies. Life cycle assessment is an important tool for evaluating the energy consumption and environmental impacts of a renewable energy process. It is important to note that storage methods based on a nonrenewable materials may undermine the effort toward a sustainable energy future when using renewable energy sources such as solar power. Keywords: California Energy Commission, renewable energy, research development and demonstration, California Renewable Energy Center, Solar energy storage, life cycle.
Please use the following citation for this report: Hou, Yu, Ruxandra Vidu, Pieter Stroeve. (UC Davis). 2012. Report on Solar Energy Storage
Methods and Life Cycle Assessment. California Energy Commission. Publication number: CEC-500-2013-073.

iv
TABLE OF CONTENTS
ACKNOWLEDGEMENTS ........................................................................................................................ 3
PREFACE .................................................................................................................................................... 4
ABSTRACT ................................................................................................................................................. 3
TABLE OF CONTENTS ........................................................................................................................... iv
EXECUTIVE SUMMARY .......................................................................................................................... 3
Introduction ........................................................................................................................................ 3
Project Purpose ................................................................................................................................... 3
Project Results ..................................................................................................................................... 3
Project Benefits ................................................................................................................................... 3
CHAPTER 1: Introduction ........................................................................................................................ 4
CHAPTER 2: Classification of Storage Methods ................................................................................... 6
2.1 Electricity Storage ............................................................................................................................. 6
2.2 Thermal Energy Storage .................................................................................................................. 7
CHAPTER 3: Electrical Energy Storage Methods.................................................................................. 8
3.1 Pumped Hydroelectric Storage (PHS) ........................................................................................... 8
3.2 Flywheels ......................................................................................................................................... 10
3.3 Compressed Air Energy Storage (CAES) .................................................................................... 10
3.4 Batteries, flow batteries and fuel cells ......................................................................................... 11
3.5 Superconducting Magnetic Energy Storage (SMES) .................................................................. 14
3.6 Capacitors ........................................................................................................................................ 15
3.7 Electrical energy harvesting and storage using nanoporous membranes .............................. 17
CHAPTER 4: Thermal Energy Storage Methods ................................................................................. 19
4.1 Sensible Heat Storage ..................................................................................................................... 19
4.2 Phase Change Material Storage (PCMS) ..................................................................................... 19
4.3 Sorption Storage ............................................................................................................................. 22
4.4 Solar fuels ........................................................................................................................................ 23
CHAPTER 5: Life Cycle Assessment ..................................................................................................... 25
CHAPTER 6: Conclusion ........................................................................................................................ 29

v
LIST OF FIGURES
Figure 1 Energy Load Profile within 24 Hours. Adopted from 2........................................................ 4
Figure 2 California’s Electricity Mix in 207 ............................................................................................ 5
Figure 3 Conceptual Diagram of Thermal Energy Storage .................................................................. 7
Figure 4: Diagram of a pumped storage facility .................................................................................... 8
Figure 5: CAES System ............................................................................................................................ 12
Figure 6:Schematics for a charged super capacitor: 1 and 2‐current collectors; 3 and 4‐ electrodes; 5‐separator; 6‐electrolyte; 7‐pores in the electrode material; 8‐positive charge; 9‐ negative ion;
10‐negative charge (electrons); 11‐positive ion.33 ............................................................................... 16
Figure 7: a) Typical design concept of thermal energy storage integration into solar thermal parabolic trough power plants.43 (b) Configuration of a single storage block.43 c) Storage segment with drillings for integrated heat exchanger.44 ................................................................... 21
Figure 8 Diagram of Solar Fuels Generation ........................................................................................ 24
Figure 9 LCA Flow Chart ........................................................................................................................ 27
LIST OF TABLES
Table 1. Classification of Electrical Energy Storage............................................................................... 6
Table 2. Large PHS Facilities in the United States. ................................................................................ 9
Table 3. Characteristics of Commercial Battery Units Used in Electric Utilities (adopted in part from23 Cost is converted from Euro to USD using 2009 exchange rate at 1 Euro = 1.4838 USD). 13
Table 4. Life Cycle Energy and GHG emissions for Capacitor Storage. ........................................... 28
3
EXECUTIVE SUMMARY
Introduction Cost‐effective solar energy storage methods are urgently needed due to the increased demand for solar power and due to its variability. Efficient energy storage is crucial for achieving energy independence and reducing environmental impacts. Energy generated during the off peak hours needs to be stored to meet peak hour demand. No single storage method can be universally used to store energy. In addition, varying site conditions such as geological locations and existing facilities determine which storage methods are most effective.
Project Purpose The goal of this project was to review the main methods for storing solar energy. The objectives of the project were to assess the most recent developments for different storage methods and to compare each method’s key parameters.
Project Results Performance optimization and integration with the power grid were the key developments for more mature technologies such as pumped hydroelectric storage and compressed air energy storage. Advancements for many other storage methods such as batteries, capacitors, and solar fuels depended on new material discoveries as well as property and material characterization. Criteria used to choose the right materials included but were not limited to cost, capacity, environmental impact, and availability. Some materials needed for certain storage methods are scarce, such as ruthenium for capacitors and lithium for batteries. Storage methods based on nonrenewable or unsustainable resources may therefore undermine the effort to increase generation capacity by increasing the use of solar power. Hybrid systems in which two or more storage systems work together to take advantage of various technologies were examined. Two examples were compressed air energy storage systems and supercapacitors. Life cycle assessments to characterize and quantify the cradle‐to‐grave energy consumption and environmental impacts of several storage technologies were also performed in this study. The authors concluded that the demand for solar energy storage could be met by using new materials and hybrid technologies, which would enable solar power to become a significant energy source in the near future.
Project Benefits California continues to lead the nation in energy efficiency, and its aggressive Renewables Portfolio Standard mandates that 33 percent of the state’s electricity will be generated from renewable resources by 2020. Existing and future energy storage technologies will be required to meet this goal. This project advanced the understanding of solar energy storage technologies, which will help accelerate developing and deploying renewable technologies into California’s energy portfolio.

4
Figure 1 Energy Load Profile within 24 Hours. Adopted from 2.
CHAPTER 1: Introduction In order to protect the environment and provide energy security, energy generated from renewable sources has been extensively studied. Among those, solar energy has many advantages such as availability and lower cost. Electricity generated by photovoltaic has grown significantly in the past years. In developed countries, a total installed capacity of 7.8 GW was reached in year 2007, a 40 percent increase from 2006.1 With advancement of solar technology, a growing trend of solar energy usage can be predicted. There is one major obstacle that exists not only for solar energy but also for other renewable energy sources such as wind and ocean wave power. Energy generated during the off peak hours needs to be stored to meet peak hour demand. Therefore, a planner only needs to design the generating capacity at the average load level instead of the peak hour load level as shown in Figure 1. During a typical day, the load is the lowest around 4 am, when there is not much activity in both industry and home. The first and highest peak comes a bit after 12:00 PM for industry and later, the second load peak comes around 9:00 PM for homes. This applies for energy generated from renewable and non‐ renewable sources.
For solar energy, electricity generation is unsteady. Generation of electricity fluctuates due to many different reasons. 2 Seasonal conditions, weather conditions and locations, cause the energy generation process to vary around the year, day, or even within the hour.
In 2007, solar power plants produced 0.22 percent of the electricity for the state of California as
1 Toledo, O. M.; Oliveira, D.; Diniz, A. Distributed photovoltaic generation and energy storage systems: A review. Renewable & Sustainable Energy Reviews. 2010, 14, 506. 2 Chen, H.; Cong T. N.; Yang W.; Tan C. Q.; Li Y. L.; Ding Y. L. Progress in electrical energy storage system: A critical review. Progress in Natural Science, 2009, 19, 291.

5
shown in Figure 2.3 For solar energy, 99 percent are generated within the state of California. By 2020, the state of California expects to have 33 percent of its utilities generated from various renewable energy sources.4 Without proper electricity storage this goal will be difficult to reach. Storage methods can be classified in different ways. It is important to review all the different methods and consider their advantages and disadvantages. Then, the decision makers can pick the proper one or combinations of storage methods to achieve their goals. In addition, life cycle assessment (LCA) techniques can be used to assess the total energy cost and environmental impact for each of the storage methods. Information for storage methods from construction to operation and to decommission will be needed to perform the life cycle assessment study.
Figure 2 California’s Electricity Mix in 207
In this review, the main methods of storing solar energy are reviewed. An assessment is given of the most recent developments for different storage methods. Many key parameters for each method are also presented in order to make specific comparisons between the methods of storage. Life cycle assessment is discussed as a tool to determine the cost and environmental impacts.
3 Californiaʹs Solar Energy Statistics & Data. 2010 http://www.energy.ca.gov/renewables/index.html. 4 California's Renewable Energy Programs. 2010 http://energyalmanac.ca.gov/renewables/solar/index.html.
6
CHAPTER 2: Classification of Storage Methods There are many different ways to classify various storage methods. Energy harvested from solar energy consists of two forms: electrical energy from PV panels and thermal energy from concentrated solar power. Therefore, in this paper, only the storage methods of electrical energy and thermal energy are reviewed. Since electricity supply is of primary concern, the focus of this review is mainly on electricity storage.
2.1 Electricity Storage
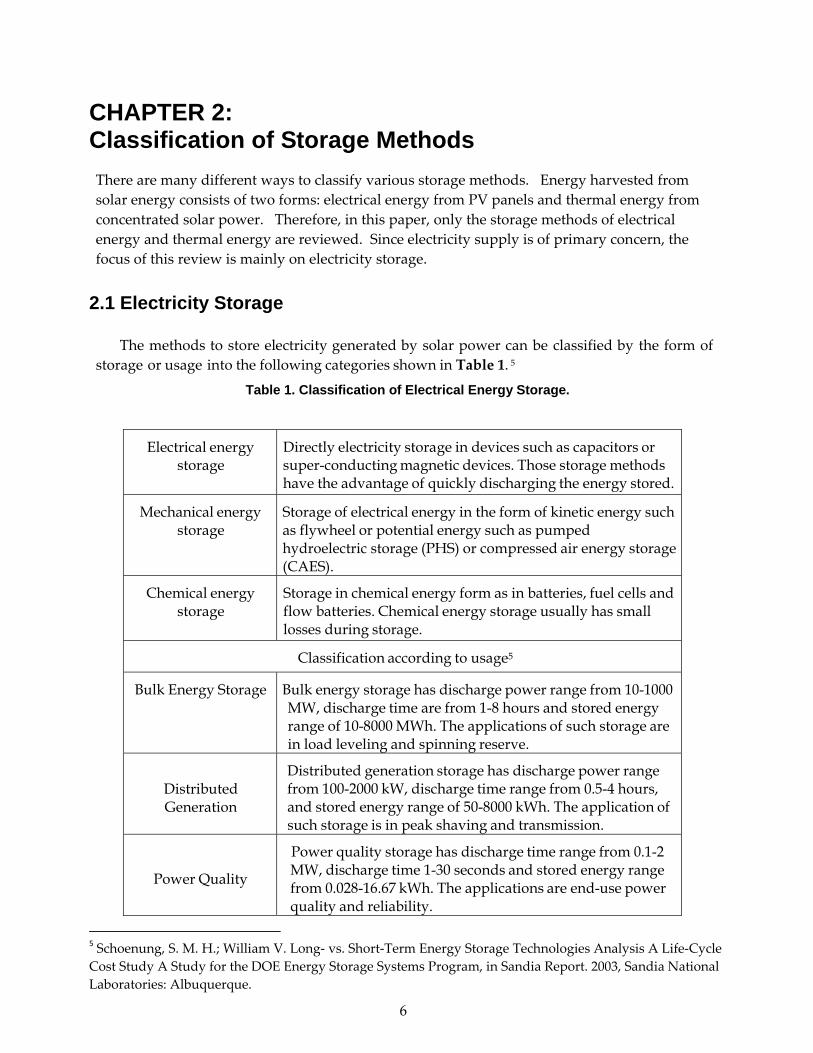
The methods to store electricity generated by solar power can be classified by the form of storage or usage into the following categories shown in Table 1. 5
Table 1. Classification of Electrical Energy Storage.
Electrical energy storage
Directly electricity storage in devices such as capacitors or super-conducting magnetic devices. Those storage methods have the advantage of quickly discharging the energy stored.
Mechanical energy storage
Storage of electrical energy in the form of kinetic energy such as flywheel or potential energy such as pumped hydroelectric storage (PHS) or compressed air energy storage (CAES).
Chemical energy storage
Storage in chemical energy form as in batteries, fuel cells and flow batteries. Chemical energy storage usually has small losses during storage.
Classification according to usage5
Bulk Energy Storage
Bulk energy storage has discharge power range from 10-1000 MW, discharge time are from 1-8 hours and stored energy range of 10-8000 MWh. The applications of such storage are in load leveling and spinning reserve.
Distributed Generation
Distributed generation storage has discharge power range from 100-2000 kW, discharge time range from 0.5-4 hours, and stored energy range of 50-8000 kWh. The application of such storage is in peak shaving and transmission.
Power Quality
Power quality storage has discharge time range from 0.1-2 MW, discharge time 1-30 seconds and stored energy range from 0.028-16.67 kWh. The applications are end-use power quality and reliability.
5 Schoenung, S. M. H.; William V. Long‐ vs. Short‐Term Energy Storage Technologies Analysis A Life‐Cycle Cost Study A Study for the DOE Energy Storage Systems Program, in Sandia Report. 2003, Sandia National Laboratories: Albuquerque.

7
2.2 Thermal Energy Storage Thermal energy is typically stored in a thermal reservoir for later usage. Thermal energy storage can also be classified according to usage. Thermal energy harvested from a solar source can be stored via thermal physical reaction, i.e. using the temperature difference of materials (or phase changes) to store energy. It can also be stored via chemical reaction, i.e. creating new chemical species (solar fuels). These methods are shown in Figure 3 and are described as:
Figure 3 Conceptual Diagram of Thermal Energy Storage
1. Thermal energy storage: thermal energy can be stored directly. In sensible heat storage, such as steam or hot water, by changing the temperature of materials (liquid or solid) during peak hour energy, the energy is stored by temperature difference of the material. In latent heat storage, such as phase change materials, by changing the phase of materials (liquid or solid) during peak hour energy, the energy is stored in the form of latent heat.6 2. Sorption Storage: in sorption storage, two chemicals, which are bonded together under standard conditions, are separated using peak hour energy. Energy is released when the two chemicals are mixed and exposed to standard conditions. The choice of materials has great impact on the performance of the storage system. 3. Chemical Energy Storage: heat generated from concentrated solar power is used to carry out endothermic chemical transformation and produce storable and transportable fuel. Examples are solar hydrogen, solar metal and the solar chemical heat pipe.7
6 Chen, H.; Cong T. N.; Yang W.; Tan C. Q.; Li Y. L.; Ding Y. L. Progress in electrical energy storage system: A critical review. Progress in Natural Science, 2009, 19, 291. 7 Chen, H.; Cong T. N.; Yang W.; Tan C. Q.; Li Y. L.; Ding Y. L. Progress in electrical energy storage system: A critical review. Progress in Natural Science, 2009, 19, 291

8
CHAPTER 3: Electrical Energy Storage Methods
3.1 Pumped Hydroelectric Storage (PHS) Pumped hydroelectric storage has the largest storage capacity that is commercially available. The basic idea is simple: use the excess electrical energy generated at off peak hours to pump water from a lower reservoir to a higher reservoir. The electrical energy is converted into gravitational potential energy. Since the electrical energy will be supplies from the grid, it can be generated from not only photovoltaic, but also from other kinds of renewable energy sources. When the peak hour comes, the water then will be discharged from the higher reservoir to the lower reservoir. The potential energy of water converts into electrical energy as normal hydroelectric power plants do. Typically, a turbine will be used to generate electricity. The typical power rating, i.e. the maximum power output, for a PHS system is typically about 1000 MW.8 There are some small‐scale PHS systems as well. These often have a capacity range from 1 MV to 30 MV.9 8 The storage capacity of the PHS will depend on the size of the reservoirs and the elevation difference between them. Figure 4 shows a diagram of a pumped hydroelectric storage system.
Figure 4: Diagram of a pumped storage facility
The energy related cost for pumped hydroelectric storage system is about 10 $/kWh and the discharge efficiency is about 87 percent.10 It should be noted that the 10 $/kWh is the incremental cost, which means the cost to generate one additional unit (kWh) of electricity. The
8 Chen, H.; Cong T. N.; Yang W.; Tan C. Q.; Li Y. L.; Ding Y. L. Progress in electrical energy storage system: A critical review. Progress in Natural Science, 2009, 19, 291 9 Hawaii Renewable Energy Development Venture Technology Assessment Small Pumped Hydro Storage. http://www.hawaiirenewable.com/. 10 Schoenung, S.M. Characteristics and Technologies for Long‐vs. Short‐Term Energy Storage, in Sandia Report. 2001, Sandia National Laboratories.

9
total cost of the system will range from 1,100 $/kWh to as high as 2,000 $/kWh.11 Energy can be stored in the PHS system for a long period of time. However, the system can be charged and discharged multiple times a day and the discharge time is just a few minutes.12 The drawback of PHS is that suitable sites are limited and many have already been used. Currently, there are about 150 operational PHS systems in the US, with total capacity of over 25 GW.13 Some of the larger facilities are listed in Table 2. For future construction, the sites will likely to be far away from major load center and require new transmission lines.14 The building of the infrastructures may take years and be very costly. The infrastructures for PHS system are expected to last for about 60 years.15 Using life cycle assessment, the average life cycle energy of nine different PHS facilities in United State for each MWh storage capacity is 373 GJ. This includes all the energy required from construction to operation and maintenance, and then decommissions over the lifetime of the PHS system. Details of life cycle assessment are discussed in a later section. PHS is a mature technology; there is little space for conceptual improvement. However, there are many possibilities for improvement in construction and operation to reduce cost and improve efficiency.
Table 2. Large PHS Facilities in the United States.
Location
Facility Capacity
Virginia
Bath County 2,772 MW
New Jersey
Mt. Hope 2,000 MW
California
Castaic Dam 1,566 MW
Michigan
Ludington 1,872 MW
California
Pyramid Lake 1,495 MW Commissioned in 1985, with 1.6 billion US dollars construction cost, the PHS system in Bath County, Virginia is the largest PHS system in the United States. In the state of California, Pyramid Lake and Castaic Lake acts as the high and low reservoirs for a PHS system, respectively. Commissioned in 1973, as part of the California State Water Project, the 1,495 MW storage system is the largest PHS in California. The state of Hawaii operates some small‐ scaled
11 Bradshaw, D.T. Pumped Hydroelectric Storage (PHS) and Compressed Air Energy Storage (CAES). IEEE PES Meeting on Energy Storage. 2000 12 Bradshaw, D.T. Pumped Hydroelectric Storage (PHS) and Compressed Air Energy Storage (CAES). IEEE PES Meeting on Energy Storage. 2000. 13 Utility Energy Storage. 2010 www.rkma.com/utilityenergystorageSAMPLE.pdf. 14 Bradshaw, D.T. Pumped Hydroelectric Storage (PHS) and Compressed Air Energy Storage (CAES). IEEE PES Meeting on Energy Storage. 2000 15 Denholm, P.K.; Gerald, L. Life cycle energy requirements and greenhouse gas emissions from large scale energy storage systems. Energy Conversion and Management. 2004, 45,13

10
PHS systems. A 160 MW, 8 hours of storage, system at Koko crater and Keau crater on Oahu and a 30 MW, 6 hour storage, on Maui are among them.
3.2 Flywheels A flywheel energy storage system stores energy in the form of angular momentum. During peak time, energy is used to spin a mass via a motor. At discharge, the motor becomes a generator that produces electricity. The system is usually kept in a vacuum containment at pressures around 10‐6‐10‐8 atm.2 The energy storage capacity depends on the speed, the mass of the spinning object and the size of the flywheel,
E � 1 mV 2
2
where E is the energy stored, and m and V are the mass and velocity of the spinning object, respectively. Some flywheels can store 25 kWh of energy with power rating of 100 kW. Flywheel energy storage system can be categorized into high‐speed flywheels and low‐speed flywheels. The high‐speed flywheel is mostly made of high strength composite material and the low‐speed flywheel is mostly made of metals. The high‐speed flywheel has higher tensile strength and is more durable than the low‐speed flywheel, but it is also more expensive to fabricate. A high‐speed flywheel can cost $25,000 for each kWh energy stored while a low‐ speed flywheel only costs about $300 for each kWh.16 This system can also be categorized as mechanical bearings and magnetic bearing. For magnetic bearing system, spinning speed from 20,000 to 50,000 rpm can be achieved. The efficiency for the system can be at 90 to 95 percent in short amounts of time.17 The system can go through 5,000,000 recharge/discharge cycles. The major limitation is the storage duration. The system is generally only good for short‐time bridging storage as defined in the classification chapter.
3.3 Compressed Air Energy Storage (CAES) The basic idea of a CAES system is to use the off peak excess electricity to compress air. At a later time, the compressed air can be used along with gas turbine to generate electricity.
As shown in Figure 5, electricity from the grid can be used to compress air into an air storage facility. Ideal air storage facilities are typically underground caverns, usually salt, mined hard rock or limestone caverns. Beside the PHS system, the CAES system is the only other large capacity system that is commercially available. During off peak hours, excess electricity can be used to run an air compressor to compress air into underground caverns. During discharge, the compressed air is released and a conventional gas turbine is used to generate electricity. The pressure for the compressed air is typically from 4.0 to 8.0 MPa.2
The storage capacity of CAES system depends on the size of the underground cavern. A cavern
16 Schoenung, S.M. Characteristics and Technologies for Long‐vs. Short‐Term Energy Storage, in Sandia Report. 2001, Sandia National Laboratories 17 Chen, H.; Cong T. N.; Yang W.; Tan C. Q.; Li Y. L.; Ding Y. L. Progress in electrical energy storage system: A critical review. Progress in Natural Science, 2009, 19, 291

11
size of 700,000 m3 corresponds to a capacity of 1500 MWh.18 The power rating of a CAES system ranges from 50 to 300 MW and the system is expected to charge and discharge on a daily basis. The storage efficiency of a CAES system is typically about 70 percent and the incremental cost is 3 $/kWh.9 The typical life time of a CAES system is about 40 years.18 19 Life cycle energy for each MWh storage capacity is about 270 GJ.12 The drawback of a CAES system is similar to the PHS system; a unique geographic location is required for the system. In addition, fossil fuel is often used for the gas turbine in a combined cycle power plant in a heat recovery steam generator (HRSG) because it combines the Brayton cycle of the gas turbine with the Rankine cycle of the HRSG. Thus, during operation, green house gas is emitted. A hybrid energy storage system based on CAES and a supercapacitor has been studied to improve the efficiency of the system.19 Performance analysis and optimal operation strategies have also being investigated.20
3.4 Batteries, flow batteries and fuel cells A battery is an electrochemical cell that converts stored chemical energy into electrical energy. Rechargeable batteries can have their chemical reaction reversed by supplying electrical energy to the cell; therefore, they can be used to store electricity generated by solar panels. Battery performance is evaluated by the following characteristics: energy and power capacity, efficiency, life span, operating temperature, depth of discharge, self‐discharge (loss during storage) and energy density. Operation life cycle depends heavily on the depth of discharge and operating temperature. Discharging completely and operating at higher than ambient temperature will reduce battery life. Voltage and current level were not evaluated because desired voltage and current levels can be achieved by connecting cells in series and parallel.
18 Lemofouet, S.R.; Alfred, A. Hybrid Energy Storage System Based on Compressed Air and Supercapacitors With Maximum Efficiency Point Tracking (MEPT). IEEE Transactions on Industrial Electronics. 2006, 53, 11. 19 Lemofouet, S.R.; Alfred, A. Hybrid Energy Storage System Based on Compressed Air and Supercapacitors With Maximum Efficiency Point Tracking (MEPT). IEEE Transactions on Industrial Electronics. 2006, 53, 11. 20 Najjar, Y.S.H.; Zaamout, M.S. Performance analysis of compressed air energy storage (CAES) plant for dry regions. Energy Conversion and Management. 1998, 39, 1503. ; Lund H.; et al. Optimal operation strategies of compressed air energy storage (CAES) on electricity spot markets with fluctuating prices. Applied Thermal Engineering. 2009, 29,799. ; Lund, H; Salgi, G. The role of compressed air energy storage (CAES) in future sustainable energy systems. Energy Conversion and Management. 2009, 50, 1172

12
Figure 5: CAES System
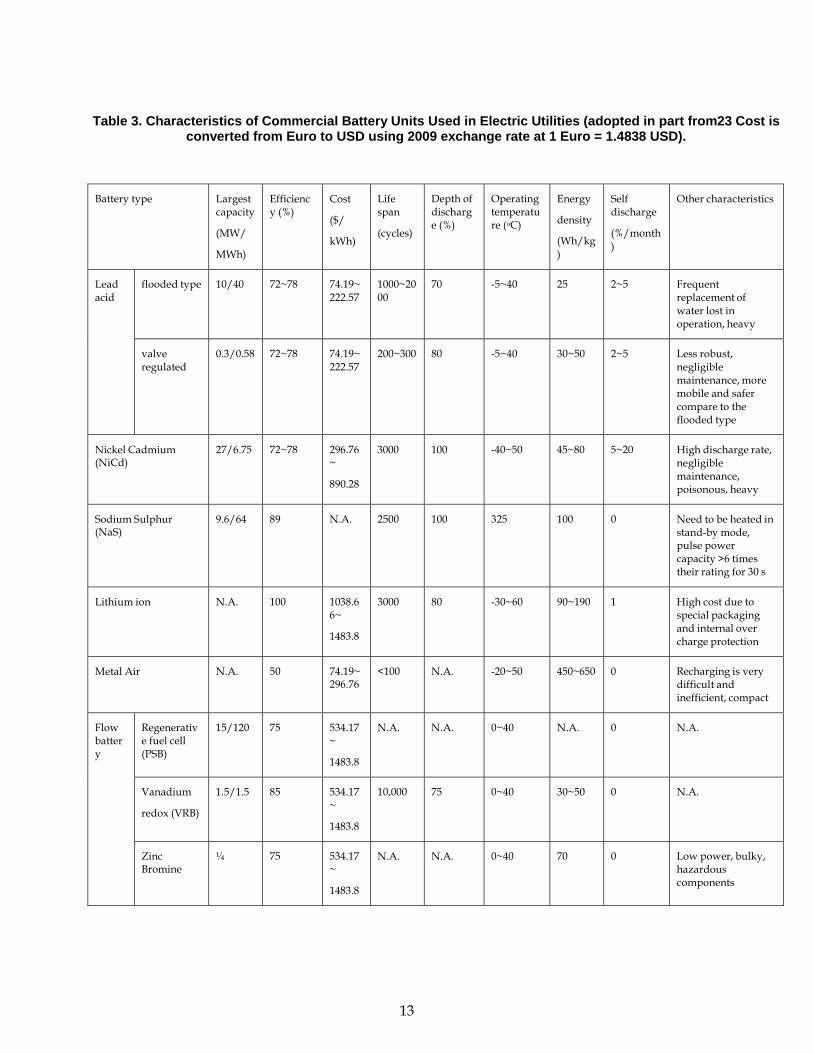
Significant developments happened recently in battery technology. Deep cycle batteries with energy capacities ranging from 17 to 40 MWh and efficiencies of about 70~80 percent are currently used in power system applications.21 Rechargeable battery types are summarized in Table 3. The lead‐acid battery is the oldest and most mature type. Li‐ion, NaS and NiCd batteries are leading technologies in high‐power‐density battery applications. The Li‐ion battery possesses the greatest potential for future development and optimization, it is most suitable for portable devices, but it has high cost and short lifetime. The NiCd and lead‐acid batteries supply excellent pulsed power, which means they are capable of supplying high power capacity in a short duration, but they are large, contain toxic heavy metals and suffer severe self‐discharge. The NaS battery is smaller and lighter than the NiCd battery, but it needs constant heat input to operate at 300 oC. The metal‐air battery has low cost and high energy density, but it is very difficult to recharge.22 A flow battery has two electrolytes that are stored separately and pumped through an electrochemical cell. It is good for long duration storage because of its negligible self‐discharge. However, the efficiency is reduced due to the energy used for pumping and to the energy loss in chemical reactions. Its power density is limited by the rates of the electrode reactions and therefore the main challenge for future development is to increase the power density by finding better electrode material.23
21 Linden, D. Handbook of Batteries. 2nd ed. 1995, New York: McCraw‐Hill. 22 Divya, K. C.; Ystergaard, J. Battery energy storage technology for power systems‐An overview. Electric Power Systems Research. 2009, 79, 511. 23 Linden, D. Handbook of Batteries. 2nd ed. 1995, New York: McCraw‐Hill.
13
Table 3. Characteristics of Commercial Battery Units Used in Electric Utilities (adopted in part from23 Cost is converted from Euro to USD using 2009 exchange rate at 1 Euro = 1.4838 USD).
Battery type
Largest capacity
(MW/
MWh)
Efficienc y (%)
Cost
($/
kWh)
Life span
(cycles)
Depth of discharg e (%)
Operating temperatu re (oC)
Energy
density
(Wh/kg )
Self discharge
(%/month )
Other characteristics
Lead acid
flooded type
10/40
72~78
74.19~ 222.57
1000~20 00
70 -5~40 25
2~5 Frequent replacement of water lost in operation, heavy
valve regulated
0.3/0.58
72~78
74.19~ 222.57
200~300 80 -5~40 30~50
2~5 Less robust, negligible maintenance, more mobile and safer compare to the flooded type
Nickel Cadmium (NiCd)
27/6.75
72~78
296.76 ~
890.28
3000 100 -40~50 45~80
5~20 High discharge rate, negligible maintenance, poisonous, heavy
Sodium Sulphur (NaS)
9.6/64
89
N.A. 2500 100 325 100
0 Need to be heated in
stand-by mode, pulse power capacity >6 times their rating for 30 s
Lithium ion
N.A.
100
1038.6 6~
1483.8
3000 80 -30~60 90~190
1 High cost due to special packaging and internal over charge protection
Metal Air
N.A.
50
74.19~ 296.76
<100 N.A. -20~50 450~650
0 Recharging is very difficult and inefficient, compact
Flow batter y
Regenerativ e fuel cell (PSB)
15/120
75
534.17 ~
1483.8
N.A. N.A. 0~40 N.A.
0 N.A.
Vanadium
redox (VRB)
1.5/1.5
85
534.17 ~
1483.8
10,000 75 0~40 30~50
0 N.A.
Zinc Bromine
¼
75
534.17 ~
1483.8
N.A. N.A. 0~40 70
0 Low power, bulky, hazardous components

14
Based on the time scale, battery energy storage (BES) application in power system can be classified into 4 types, as follows: i) instantaneous applications (0 to few seconds), ii) short term applications (few seconds to minutes), iii) mid‐term applications (minutes to few hours <5 h) and iv) long term/multi‐MWh applications (days). The mid‐term applications, which require modest amount of power for long duration of time, can be used to improve the reliability of systems with large amount of renewable energy like solar energy. Among the batteries listed above, NiCd batteries were primarily designed for mid‐term applications. Several other types of batteries have been used in electricity systems with renewable energy input. Vanadium redox flow batteries are quite promising to form large scale batteries designed specifically for the electricity grid. Lead‐acid batteries can be used for residential photovoltaic (PV) energy storage or in conjunction with ultracapacitors to achieve better efficiency. The nickel metal hydride (NiMH) battery systems have been used to store electricity generated by PV panels. With the vast interest in battery storage system for electricity generated from PV panels, considerable research has been conducted on the optimization in sizing PV‐battery storage systems.24 25, 28‐30A fuel cell is an electrochemical energy conversion device. Electricity can be produced from external supplies of fuel and oxidant. A reversible fuel cell can consume chemicals and electricity to produce another chemical (for example, hydrogen production by electrolysis), thus it is a form of storage. Fuel cells are different from batteries because fuel cells consume reactants, which must be replaced.25 Hydrogen fuel cells consume hydrogen and oxygen to produce electricity and water. In reverse, hydrogen fuel cells can store electricity by producing hydrogen and oxygen. An alternative to fuel cells is to combust hydrogen directly in a combustion engine, which is known as a hydrogen engine.26 The production of hydrogen will be discussed in the solar fuel section.
3.5 Superconducting Magnetic Energy Storage (SMES) The superconducting magnetic energy storage method stores electrical energy in magnetic field generated by direct current. Direct electrical current passes through a coil made of superconducting materials.2 The device is kept at low temperature, 50 – 77 K to maximize the efficiency. The low temperature keeps the coil at superconducting state, the resistance becomes
24 ) Celik, A. N.; Muneer, T.; Clarke P. Optimal sizing and life cycle assessment of residential photovoltaic energy systems with battery storage. Progress in Photovoltaics: Research and Applications. 2008, 16, 69. ; Henson, W. Optimal battery/ultracapacitor storage combination. Journal of Power Sources. 2008, 179, 417. ; Maharjan, et al. State‐of‐Charge (SOC)‐Balancing Control of a Battery Energy Storage System Based on a Cascade PWM Converter. Vol. 24. 2009, New York, NY, ETATS‐ UNIS: Institute of Electrical and Electronics Engineers. 9. ; Ekren, O.; Ekren, B. Y. Size optimization of a PV/wind hybrid energy conversion system with battery storage using response surface methodology. Applied Energy. 2008, 85,1086. 25 Chen, H.; Cong T. N.; Yang W.; Tan C. Q.; Li Y. L.; Ding Y. L. Progress in electrical energy storage system: A critical review. Progress in Natural Science, 2009, 19, 291 26 Schoenung, S. M. H.; William V. Long‐ vs. Short‐Term Energy Storage Technologies Analysis A Life‐Cycle Cost Study A Study for the DOE Energy Storage Systems Program, in Sandia Report. 2003, Sandia National Laboratories: Albuquerque

15
small or zero, thus, the energy can be stored in a persistent mode.27 31 The energy stored in the magnetic field is calculated from,
E � 1 LI 2
2 where E is the energy stored, L is the inductance of the coil and I is the current passing through it. The inductance is determined by the configuration of the coil. It should be noted that conversion between alternating current and direct current is needed for SMES systems. There is about a 2 to 3 percent loss in each way. The system usually consists of four parts: the superconducting coil, the power conditioning system, the cryogenic system and the control unit. The material for the superconductor is typically made of niobium‐titanium and the coolant can be liquid helium at temperature of 4.2 K, or super fluid helium at temperature of 1.8 K. SMES systems can have a storage efficiency of about 97‐98 percent, with loss of only 0.1 percent per hour. The power rating of SMES is typically up to 10 MW. Some larger SMES systems have achieved hundreds of MW, although only for a second. Theoretically, a coil of 150 to 500 m radius would have a load of 5,000 MWh at 1,000 MW.28 One clear advantage of SMES system is its rapid release of the stored energy in comparison with other methods. The major drawbacks for SMES are the high cost and the strong magnetic field generated by the system.29
3.6 Capacitors Supercapacitors, ultracapacitors or electrochemical double‐layer capacitors (EDLCs) are terms for the same high‐capacitance electronic component. Their capacitance can reach thousands of Farads, making them alternative means of electrical energy storage. Those types of capacitors are based on the same principle as a double electric charge layer capacitor. Higher capacitance is achieved by using porous electrodes with large surface area. As shown in Figure 6, the current collectors (1, 2), porous electrodes (3, 4) are separated by separator (5). The porous separator layer (5) and the porous electric conductive electrodes (3, 4) are submerged in liquid electrolyte (6). When voltage is applied between the two electrodes, cations of the electrolyte move to the cathode while anions move to the anode. Unlike the chemical reaction in a battery, the energy is stored by physical separation of charges in the capacitors, which can later be released by linking the cathode and anode through appliances.
Currently, the most widely used electrode material is activated carbon. Activated carbon with large specific surface area increases the capacitance dramatically. Coating of metallic oxides or conductive polymers on the activated carbon will further enhance the capacitance. Carbon nanotubes (CNTs) are also used as electrodes, because their central canal and entanglement
27 Cheung, K. Y.; Simon, T. H.; Navin, De Silva, Juvonen, R. G.; Matti, P. T. et al. Large‐ Scale Energy Sotrage System. 2003, Imperial College London. p. 31. 28 Cheung, K. Y.; Simon, T. H.; Navin, De Silva, Juvonen, R. G.; Matti, P. T. et al. Large‐ Scale Energy Sotrage System. 2003, Imperial College London. p. 31 29 Chen, H.; Cong T. N.; Yang W.; Tan C. Q.; Li Y. L.; Ding Y. L. Progress in electrical energy storage system: A critical review. Progress in Natural Science, 2009, 19, 291.

16
allows easy access of ions from electrolyte.30
Figure 6 Schematics for a charged super capacitor: 1 and 2-current collectors; 3 and 4- electrodes; 5-separator; 6-electrolyte; 7-pores in the electrode material; 8-positive charge; 9- negative ion; 10-
negative charge (electrons); 11-positive ion.33
30 Obreja, V. V. N. On the performance of supercapacitors with electrodes based on carbon nanotubes and carbon activated material‐A review. Physica E: Low‐dimensional Systems and Nanostructures. 2008, 40, 2596

17
Supercapacitor electrodes and devices that utilize conducting polymers are envisaged to bridge the gap between existing carbon‐based supercapacitors and batteries to form units of intermediate specific energy. Extensive research includes the major conducting polymer materials as well as composites of these materials with carbon nanotubes and inorganic battery materials. Conducting polymers have superior specific energies to the carbon‐based supercapacitors and have greater power capability compared to inorganic battery material. The main disadvantage is that conducting polymers swell and contract during the charge‐discharge thermal cycle. Therefore, cycle‐life is typically a few thousand cycles for conducting polymers compared with more than 500,000 cycles for carbon‐based devices. Supercapacitors are typically used in conjunction with batteries in power application because of their higher specific power (up to 5.12 kW/kg) and longer life time than batteries.31 They also have higher cycle life (up to 1,000,000 cycles), instant charging‐discharging, extended operational temperature range (‐40 ~ 65°C) and minimum loss of energy during storage. These advantages make them suitable for pulsed load applications.32 However, their specific energy is lower compared to batteries. Most of the commercial products have a specific energy below 10 Wh/kg, whereas the batteries have a value from 25~50 Wh/kg for lead‐acid ones and up to 190 Wh/kg for lithium ion batteries. Another disadvantage for supercapacitor is their low voltage. Voltage from individual supercapacitor can only reach 2.5V. Higher voltage can be achieved by connecting capacitors in series.33
3.7 Electrical energy harvesting and storage using nanoporous membranes
Recently, many phenomena observed for membranes with asymmetric pores and exploited in biomolecular separation, bio‐sensing, microfluidics, and logic gates, are also useful for energy harvesting and storage. Asymmetric pores such as conical pores can show superior performance characteristics in ion rectification compared to traditional cylindrical pores, which can be used to electrical energy harvesting and storage when this type of membrane separates two solutions of different salt concentrations.34 Nanopore characteristics such as size, shape, and charge distribution should be optimized for each application. In particular, the control of the pore tip size and charge appears to be crucial in all cases because it is in this narrow region where the interaction of the ions and the pore surface occurs, and this will eventually determine the
31 Shah, V. A. J.; Maheshwari, J. A.; Roy, R. Review of ultracapacitor technology and its applications, in Fifteenth National Power System Conference (NPSC). 2008: IIT Bombay. 32 Shah, V. A. J.; Maheshwari, J. A.; Roy, R. Review of ultracapacitor technology and its applications, in Fifteenth National Power System Conference (NPSC). 2008: IIT Bombay 33 Obreja, V. V. N. On the performance of supercapacitors with electrodes based on carbon nanotubes and carbon activated material‐A review. Physica E: Low‐dimensional Systems and Nanostructures. 2008, 40, 2596; Obreja, V. V. N. On the performance of commercial supercapacitors as storage devices for renewable electric energy sources, in International Conference on Renewable Energies And Power Quality. 2007. 34 Guo, W.; Cao, L. C.; Xia, J. C.; Nie, F. Q.; Ma, W.; Xue, J. M.; Song, Y. L., Zhu, D. B.; Wang, Y. G.; Jiang, L. Energy Harvesting with Single‐Ion‐Selective Nanopores: A Concentration‐Gradient‐Driven NanofluidicPowerSource. AdvancedFunctionalMaterials 2010, 20, 1339.

18
nanodevice performance. Additionally, the efficiency of the power generation based on a salinity‐gradient should be optimized by appropriate tailoring of the surface charge distribution and nanopore geometry. For energy generation and storage, ion pumping between two solutions up a concentration gradient, information processing based on different nanopore conductance levels, and electrical energy generation with two solutions at different salt concentrations are significant problems for membrane chemical engineering. In particular, implementing these processes in practical devices will demand: (i) a better knowledge of the physical conditions dictating ion pumping (the relationship between the asymmetric nanostructure characteristics and the applied periodic potential should be clarified), (ii) a significant improvement of the nanopore rectification properties, and (iii) a clear understanding of the nanopore characteristics entering in the electrical circuit used for the conversion of chemical energy into electrical energy.

19
CHAPTER 4: Thermal Energy Storage Methods
4.1 Sensible Heat Storage Changing the temperature of materials (liquid or solid) by using solar energy generated at its peak hour, energy is stored by the temperature difference of the material with the original temperature. Some examples include solar water and air heaters, graphite and concrete storage. The concept of solar water and air heaters is simple: using the solar radiation to store thermal energy in air and water. This storage method is getting popularity due to its relative low cost and simple manufacturing process but the density of thermal storage is low. For concrete storage, 20 m3 of concrete storage material can store up to 400 kWh of energy.35
4.2 Phase Change Material Storage (PCMS) Latent heat refers to the energy associated with phase change of a material. When a material undergoes a phase change, heat is absorbed or released. The latent heat materials store about 5‐ 14 times more heat per unit volume than sensible heat storage materials. The energy stored during a phase change can be calculated as: E � mL , where m is the mass of the material that has a phase change and L is the latent heat associated with the phase change. PCM are classified into three categories: organic (paraffin, fatty acids), inorganic (hydrates, molten salts, metal) and eutectic (organic‐organic, organic‐inorganic, inorganic‐inorganic compounds). The latent heat of organic PCM ranges from 10 kJ/kg to 300 kJ/kg. For inorganic PCM, the latent heat ranges from 20 to 250 kJ/kg. Eutectic is a mixture of two or more components, to minimize melting temperature of the mixture. The latent heat of eutectic material ranges from 100 kJ/kg to 200 kJ/kg.36 Recently, many developments in latent heat storage have been observed, mainly because the utilization of solar and industrial heat is a promising method to save energy and reduce CO2 emission. The advantages of using latent heat storage include large density of heat storage and constant temperature. This process is completely reversible and can be repeatedly utilized without degradation but it is necessary to encapsulate the PCMs to avoid contamination and the leakage of the liquid phase. Encapsulation is necessary when the PCM contains water such as the salt‐based PCM solutions. In this case, encapsulation is required to prevent water evaporation or water uptake. Organic solutions do not contain water so that they can be exposed to air.
35 Sharma, A.; Tyagi, V. V.; Chen, C. R.; Buddhi, D. Review on thermal energy storage with phase change materials and applications. Renewable and Sustainable Energy Reviews. 2009, 13, 318. Laing, D. Concrete Storage Development for Parabolic Trough Power Plants, in Parabolic Trough Technology Workshop. 2007: Golden CO, USA. 36 Sharma, A.; et al. Review on thermal energy storage with phase change materials and applications. Renewable and Sustainable Energy Reviews. 2007, 13, 318.

20
Technologies for PCM encapsulation include macro, micro or molecular encapsulation. Macro‐ encapsulation refers to storage of large volume of PCM in a container. The methods often fail because of poor thermal conductivity of the PCM material. The PCM can turn into two different phases in the same container and effective heat transfer cannot be achieved. PCM materials perform best in small containers such as cells. Micro‐encapsulation has the advantage to be easily and economically incorporated in construction materials and the thermal conductivity problem does not exist at small scale. The heat transfer is quick enough within the PCM material. Molecular encapsulation results in a material that can be cut without significant PCM leakage. This technology allows a very high concentration of PCM to be dispersed within a polymeric material. In recent years, especially after 2005, the research focused on integrating the latent heat storage into the solar power generation system. For this purpose, the development of latent heat storage for temperatures relevant for solar thermal power plants is required. A recent review on research and technology directions on developing latent heat storage for high temperature application can be found somewhere else.37 A typical design for a PCM‐storage system includes a heat exchanger embedded in the storage material. Figure 7 shows a system with direct generation of steam (DSG: direct steam generation). The energy from the sun is collected by melting the PCM impregnated into the thermal storage block and then usage of the heat released from the phase change of the material to produce steam and generate electric power.
37 Nomura, T.; Okinaka, N.; Akiyama, T. Technology of Latent Heat Storage for High
Temperature Application: A Review. ISIJ International. 2010, 50, 1229

21
Figure 7: a) Typical design concept of thermal energy storage integration into solar thermal parabolic trough power plants.43 (b) Configuration of a single storage block.43 c) Storage segment
with drillings for integrated heat exchanger.44
a)
b)
c)

22
4.3 Sorption Storage Sorption is the fixation or capture of a gas or a vapor (sorbate) by a solid or liquid substance (sorbent). The sorption of gas by liquid is called absorption while the sorption of gas by solid is called adsorption. Adsorption includes two mechanisms: thermo‐physical reaction by Van der Waals forces (physisorption) and thermo‐chemical reaction by valence forces (chemisorption). Chemisorption processes typically store more heat per unit mass than physisorption but may be irreversible. The principle of using sorption (also for thermochemical storage) to store energy is based on a reversible physico‐chemical reaction. The A/B is defined as the working sorbate/sorbent couple. When heat is introduced to the system, AB is split into compounds A and B; this is the regeneration or charging phase:
AB + Heat Sorbate A + Sorbent B The compounds A and B have to be stored separately. This way, solar thermal energy is stored as the chemical potential of A and B with negligible loss, which gives sorption the potential for long‐term storage.38 When A and B are mixed, A is fixed onto B to form AB, releasing heat; this is the discharging phase. The reversible reaction can be used to store and release energy as needed. Sorption materials have the highest storage density of all repetitive storage media. Several international programs have studied sorption for long‐term solar energy storage, including HYDES (high energy density sorption heat storage for solar space heating) from 1998 to 2001, MODESTORE (modular high energy density heat storage) from 2003 to 2006, “Task 32: advanced storage concepts for solar and low energy buildings” from 2003 to 2007, and “Task 42”, initiated by the IEA for 2009 to 2012.39 Up to date, no commercially available system has been developed as yet, because of the high cost of suitable sorption materials. Many materials have the ability to perform sorption reaction, but only a handful can be actually used due to technical, economic or environmental constraints.40 Several pairs of materials have been studied; each pair has drawbacks that prevent its practical use. For NaOH/H2O, LiCl/ H2O and LiBr/H2O the absorption process can be performed. The NaOH/H2O pair is highly corrosive therefore its use needs additional care when handled and recycled. The LiCl/H2O pair has a high storage density of 253 kWh/m3, but it is not suitable for seasonal storage because the LiCl salt is expensive, costing 3,600 Euros/m3. The LiBr/H2O pair has a storage density of 180~310 kWh/ m3 of a diluted solution. Zeolite/H2O and silica gel/H2O are two systems that can undergo physisorption. The zeolite/H2O pair has a storage density of 124 kWh/m3 for heating and 100 kWh/ m3 for cooling when used within a
38 NʹTsoukpoe, K. E.; Liu, H.; Le Pierres, N.; Luo, L. G. A review on long‐term sorption solar energy storage. Renewable and Sustainable Energy Reviews. 2009, 13, 2385; Faninger, G. Thermal Energy Storage. 2004; www.etn.wsr.ac.at/pdf/task28_2_6_Thermal_Energy_Storage.pdf. 39 Bakel, C. Laboratory tests of chemical reactions and prototype sorption storage units. 2008; www.iea‐shc.org. Bakker, M.H.; Hauer, A. Advanced materials for compact thermal energy storage: a new
joint IEA SHC/ECES Task. in The 1st International Conference on Solar Heating, Colling and Buildings. 2008 40 NʹTsoukpoe, K. E.; Liu, H.; Le Pierres, N.; Luo, L. G. A review on long‐term sorption solar energy storage. Renewable and Sustainable Energy Reviews. 2009, 13, 2385
23
district heating net.41 56 Synthetic zeolite is expensive; natural zeolites can be used when the heating temperature is below 100 oC. The silica gel/H2O pair was reported to have a theoretical storage density of 200~300 kWh/m3. But only 50 kWh/m3 was obtained experimentally, which has an energy density less than water.42 Na2S/H2O and MgSO4/H2O are two systems that can be used for chemisorption. The Na2S/H2O pair has not only have a high energy storage density (1980 kWh/m3 for heating and 1300 kWh/m3 for cooling), but also a high thermal power density. However, this material is very corrosive and needs to be operated under a vacuum environment.43 The MgSO4/H2O pair has a theoretical storage density of 780 kWh/m3, but its low power density undermines its practical use.44 Research to discover or develop more suitable materials is ongoing, for example, the Selective Water Sorbents is a promising composite.45 In the near future, sorption may become a practical method to store solar energy.
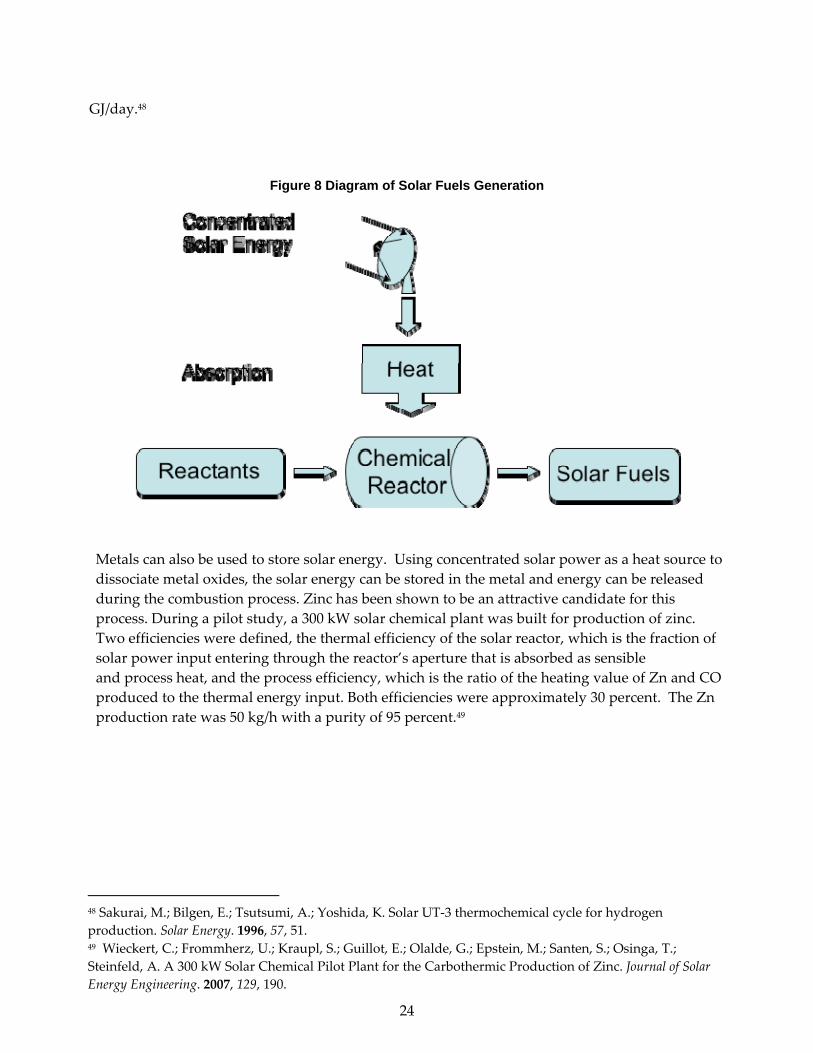
4.4 Solar fuels The principle of solar fuels is shown in Figure 8. Using optical devices, scattered sunlight can be concentrated and the heat generated from concentrated solar power can be used to carry out endothermic chemical transformation to produce storable and transportable fuels.46 A few examples are solar hydrogen, solar metal and the solar chemical heat pipe. The engine which combust hydrogen to generate power is called the hydrogen engine.47 There are three different ways to generate hydrogen with solar power: electrochemical, photochemical and thermochemical. Electrical energy can be directly stored as solar fuel as well. It is not efficient to convert electricity into thermal energy and then produce hydrogen, therefore, this option is not considered. By using the thermochemical route, water and fossil fuel can be used as sources for hydrogen. The solar project UT‐3 in Japan has achieved a production capacity of 702
41 Hauer, A. Thermal Energy Storage with Zeolite For Heating and Cooling Application. The 3rd
Workshop of Annex 17 ECES IA/IEA. 2002 42 NʹTsoukpoe, K. E.; Liu, H.; Le Pierres, N.; Luo, L. G. A review on long‐term sorption solar energy storage. Renewable and Sustainable Energy Reviews. 2009, 13, 2385 43 de Boer, R.H.; Veldhuis W.G.; Smeding, S.F. Solid‐Sorption Cooling with Integrated Thermal Storage: The SWEAT prototype. International Conference on Heat Powered Cycles, HPC 2004. 2004. Larnaca, Cyprus 44 Bakel, C. Laboratory tests of chemical reactions and prototype sorption storage units. 2008; www.iea‐shc.org.; NʹTsoukpoe, K. E.; Liu, H.; Le Pierres, N.; Luo, L. G. A review on long‐term sorption solar energy storage. Renewable and Sustainable Energy Reviews. 2009, 13, 2385. 45 Aristov, Y.I. New Family of Solid Sorbents for Adsorptive cooling: Material Scientist Approach. Journal of Engineering Thermophysics. 2007, 16, 10 46 (59) Steinfeld, A. Solar hydrogen production via a two‐step water‐splitting thermochemical cycle based on Zn/ZnO redox reactions. International Journal of Hydrogen Energy. 2002, 27, 611. (60) Steinfeld, A. Solar thermochemical production of hydrogen‐a review. Solar Energy. 2005,78, 603. (61) Steinfeld, A.; Kuhn, P.; Reller, A.; Palumbo, R.; Murray, J.; Tamaura, Y. Solar‐processed metals as clean energy carriers and water‐splitters. International Journal of Hydrogen Energy. 1998, 23, 767. 47 Schoenung, S. M. H.; William V. Long‐ vs. Short‐Term Energy Storage Technologies Analysis A Life‐Cycle Cost Study A Study for the DOE Energy Storage Systems Program, in Sandia Report. 2003, Sandia National Laboratories: Albuquerque.
24
GJ/day.48
Figure 8 Diagram of Solar Fuels Generation
Metals can also be used to store solar energy. Using concentrated solar power as a heat source to dissociate metal oxides, the solar energy can be stored in the metal and energy can be released during the combustion process. Zinc has been shown to be an attractive candidate for this process. During a pilot study, a 300 kW solar chemical plant was built for production of zinc. Two efficiencies were defined, the thermal efficiency of the solar reactor, which is the fraction of solar power input entering through the reactor’s aperture that is absorbed as sensible and process heat, and the process efficiency, which is the ratio of the heating value of Zn and CO produced to the thermal energy input. Both efficiencies were approximately 30 percent. The Zn production rate was 50 kg/h with a purity of 95 percent.49
48 Sakurai, M.; Bilgen, E.; Tsutsumi, A.; Yoshida, K. Solar UT‐3 thermochemical cycle for hydrogen production. Solar Energy. 1996, 57, 51. 49 Wieckert, C.; Frommherz, U.; Kraupl, S.; Guillot, E.; Olalde, G.; Epstein, M.; Santen, S.; Osinga, T.; Steinfeld, A. A 300 kW Solar Chemical Pilot Plant for the Carbothermic Production of Zinc. Journal of Solar Energy Engineering. 2007, 129, 190.

25
S E)
CHAPTER 5: Life Cycle Assessment Life cycle assessments are investigations performed to characterize and quantify the cradle‐to‐ grave environmental impacts of certain product and service. LCA accounts for the materials, resources and energy that enters the system, and waste and pollution that leaves.65 There are two types of life cycle assessment methods: i) Process‐Based LCA and ii) Economic‐Input‐ Output LCA (EIO‐LCA). A Process‐Based LCA, also referred as the conventional LCA, is a life cycle assessment that accounts for input and output based on the physical processes. An EIO‐ LCA is a life cycle assessment accounts the monetary input and output of a product or service. It should be noted that unlike EIO‐LCA, the Process‐Based LCA does not include human labor. There are four major steps in caring out a life cycle assessment: goal definition and scope, inventory analysis, impact assessment and interpretation.66 Detail guidelines and standards of performing LCA can be found from the International organization for standardization and the United States environmental protection agency.66‐67 Recently, conventional life cycle assessments have been performed to compare the user‐phase efficiency and the life cycle efficiency for some storage method. Life cycle assessment data for pumped hydroelectric storage, compressed air energy storage and rechargeable battery for several different cases have been studied by Denholm and Gerald.12 The life cycle energy inputs and greenhouse gas emissions related to the different energy storage methods were reported. For the battery energy storage system, two types of systems were studied; the vanadium‐redox battery (VRB) and the Regenesys (PSB) batteries. Two life cycle assessment tools were used, the Economic Input/output (EIO) and Process Chain Analysis (PCA). The total system efficiency is calculated in net energy ratio,
ERnet � ERs � ERT � ERM where ERs is the AC‐AC round trip efficiency of the storage conversion process. ERT and ERm are the storage medium and transmission energy ratios. The energy ratio is defined as kWhin/kWhout.12 In addition to the efficiency, the greenhouse gas emissions for different systems are also calculated. The total greenhouse gas emission factor is defined as
EF L
� ( EFgen � ERnet ) � EFop � (
EM s � P L S

26
Swhere E L is the total electrical energy delivered by storage facility over it lifetime. EFgen is the emission factor of primary electricity generation; EFop is the operational emission factor per unit of energy delivered by storage facility; EMs is the emission associated with storage planet construction per unit of storage constructed and P is the storage plant size. The emission factor is defined as tons of CO2 emitted per GWh of energy.12 For PHS system, the total life cycle energy is typically of order 373 GJ per MWh storage capacity, and GHG emissions are 35.7 tonnes CO2 per MWh storage capacity. For the CAES system, the total life cycle energy is 266 GJ per MWh storage capacity, and GHG emissions is 19.4 tonnes CO2 per MWh storage capacity. For PSB battery system, the total life cycle energy is 1,755 GJ per MWh storage capacity, and GHG emissions is 125 tonnes CO2 per MWh storage capacity. For VRB battery system, the total life cycle energy is 2,253 GJ per MWh storage capacity, and GHG emissions is 161 tonnes CO2 per MWh storage capacity. A EIO‐LCA study was also conducted by the Sandia National Laboratory in 2003.50 A life cycle cost analysis was performed for various storage technologies that include many types of batters, fuel cells, PHS, CAES, SMES, capacitors and many others. The results of this study are presented as annual cost ($/kW‐year). In the bulk energy storage category, the CAES appears to have the lowest cost and the NiCd battery has the highest annual cost. In the distribution generation category, the NiCd battery still has the highest annual cost and the hydrogen engine has the lowest. It should be noted that some storage technologies could be classified in more than one category. In the Power Quality category, the low speed fly wheel storage has the flywheel has the highest annual cost and the high speed flywheel has the lowest.51 As an example, a LCA study was performed for a supercapacitor. The size of the supercapacitor was obtained from Nesscap (http://www.nesscap.com/products_edlc.htm). The following assumptions were made to calculate the life cycle energy and green house gas emission: the voltage charging the capacitor was 2.5 V and 75 percent depth of discharge.52 The capacitor had a capacitance of 5000 farad and could be charged 1,000,000 times.53 As shown in Section 3.6, a capacitor is composed of 6 components, the electricity collector, the separator, the electrode, the electrolyte, the casing and the wire. Process Chain Analysis (PCA) was used to calculate the energy input and greenhouse gas (GHG) emission of each component, to get the values of the whole system by summing over all the components. The life cycle process of each component is shown in Figure 9.
50 Schoenung, S. M. H.; William V. Long‐ vs. Short‐Term Energy Storage Technologies Analysis A Life‐Cycle Cost Study A Study for the DOE Energy Storage Systems Program, in Sandia Report. 2003, Sandia National Laboratories: Albuquerque 51 Schoenung, S. M. H.; William V. Long‐ vs. Short‐Term Energy Storage Technologies Analysis A Life‐Cycle Cost Study A Study for the DOE Energy Storage Systems Program, in Sandia Report. 2003, Sandia National Laboratories: Albuquerque 52 Obreja, V. V. N. On the performance of supercapacitors with electrodes based on carbon nanotubes and carbon activated material‐A review. Physica E: Low‐dimensional Systems and Nanostructures. 2008, 40, 2596. 53 Obreja, V. V. N. On the performance of commercial supercapacitors as storage devices for renewable electric energy sources, in International Conference on Renewable Energies And Power Quality. 2007.

27
Figure 9 LCA Flow Chart
From the Ecoinvent and GaBI database, the life cycle values of energy input and GHG emission were obtained for each raw material except the assembly and use phases.54 68‐69 The energy consumption during the assembly and use phase was negligible for such capacitor, because all components were designed to assemble together without much effort and minimum maintenance needed during use phase.55 With those assumptions, the LCA input and greenhouse gas emission were calculated for each component of the capacitor and the total value for the whole system was the sum of the values for the components. The results of our study are presented in Table 4.
54 Ecoinvent. 2010; http://www.ecoinvent.ch/. 55 GaBi. 2010; http://www.gabi‐software.com/index.php?id=85&L=6&redirect=1.

28
Table 4. Life Cycle Energy and GHG emissions for Capacitor Storage.
Component
Life Cycle Energy (GJ/MWh storage capacity)
GHG emissions (tonnes CO2/MWh storage capacity)
Reference
Collector (TiN with Aluminum) Foil)
4.6E-3 2.85E-4 70
Separator (Glass Fiber)
2.62E-4 5.22E-6 70
Electrode (PAC with RuO2)
6.22E-3 3.13E-4 70-73
Electrolyte (H2SO4)
6.47E-5 6.51E-6 71
Casing (PVC)
2.13E-4 6.4E-5 74
Wire (Cu)
3.14E-4 1.62E-5 75
Whole System
1.3E-2 6.91E-4
It is noted that the results are not exact comparable with the results from the LCA study for the PHS, CAES and battery systems. The PHS, CAES and battery systems have a high operational energy cost and the super‐capacitor system’s operational energy cost is negligible. Therefore, the results are reported in energy cost per storage capacity instead of energy input per energy output. From these results, it appears that the capacitor is a highly efficient storage method due to the fact that the capacitor could be re‐used many times. The energy needed for the production of the capacitor components become relative small. It is worth mentioning that the production RuO2 was investigated during the study. There is limited ruthenium production around the world and the global reserve of ruthenium is very small. In many processes, some critical information will not be available if no life cycle assessments are performed. Therefore, LCA studies such as presented above should be performed for all other storage methods as well. The studies can provide us a more realistic indication regarding theefficiency and environmental impact of each storage method and may reveal additional information, such as the production of raw materials and co‐products of the process, which could be important.
29
CHAPTER 6: Conclusion Solar energy storage methods are urgently needed due to the increased demand and unsteady nature of solar power. The implementation of proper energy storage remains crucial to achieve energy security and to reduce environmental impact. It is difficult to compare different types of storage methods using only one factor. In fact, no single type of storage method can be universally used to store energy. For specific situations, geological locations and existing facilities, different storage methods are possible and need to be considered. At present, batteries are the most common method in use to store solar energy. For more mature technologies such as PHS and CAES, current developments are mostly focused on performance optimization and integration with the power grid. For many other storage methods, such as batteries, capacitors, sorption, and solar fuels, the advancements for those methods depend on discovery of new materials and characterization of materials and properties. Less expensive, high capacity and environmentally friendly materials are some of the criteria in choosing the right materials. It should be noted that some materials needed for certain storage methods are scarce, such as ruthenium for capacitors and lithium for batteries. While using renewable energy sources such as solar power, storage methods based on nonrenewable resources may undermine the initial effort to resolve the energy problem. In addition, hybrid systems of two or more storage systems working together have been suggested to take advantage of various technologies. A few suggested examples are: CAES system and supercapacitor,56 supercapacitor and battery,57 as well as solar‐hydrogen and fuel cell.58 With new materials and hybrid technologies, the demand for storage can be met. Solar power can become a main energy source in the near future.
56 Lemofouet, S.R.; Alfred, A. Hybrid Energy Storage System Based on Compressed Air and Supercapacitors With Maximum Efficiency Point Tracking (MEPT). IEEE Transactions on Industrial Electronics. 2006, 53, 11. 57 Shah, V. A. J.; Maheshwari, J. A.; Roy, R. Review of ultracapacitor technology and its applications, in Fifteenth National Power System Conference (NPSC). 2008: IIT Bombay. 58 Yilanci, A.; Dincer, I.; Ozturk, H. K. A review on solar‐hydrogen/fuel cell hybrid energy systems for stationary applications. Progress in Energy and Combustion Science. 2009, 35, 231.