report on the 2011 proficiency test of the european union
TRANSCRIPT

EUR 25196 EN - 2012
Report on the 2011 Proficiency Test of the European Union Reference Laboratory for
Mycotoxins, for the Network of National Reference Laboratories
Determination of Aflatoxin B1 in Baby food, Maize powder, Animal feed and Test solution
Project ID: MYCO-AFLA-06
Zoltan Kunsagi, Andreas Breidbach, Joerg Stroka

The mission of the JRC-IRMM is to promote a common and reliable European measurement system in support of EU policies. European Commission Joint Research Centre Institute for Reference Materials and Measurements Contact information Address: Retieseweg 111, B-2440 Geel E-mail: [email protected] Tel.: +32-14-571229 Fax: +32-14-571783 http://irmm.jrc.ec.europa.eu/ http://www.jrc.ec.europa.eu/ Legal Notice Neither the European Commission nor any person acting on behalf of the Commission is responsible for the use which might be made of this publication.
Europe Direct is a service to help you find answers to your questions about the European Union
Freephone number (*):
00 800 6 7 8 9 10 11
(*) Certain mobile telephone operators do not allow access to 00 800 numbers or these calls may be billed.
A great deal of additional information on the European Union is available on the Internet. It can be accessed through the Europa server http://europa.eu/ JRC 68705 EUR 25196 EN ISBN 978-92-79-22867-4 ISSN 1831-9424 doi:10.2787/57856
Luxembourg: Publications Office of the European Union, 2012
© European Union, 2012 Reproduction is authorised provided the source is acknowledged Printed in Belgium

Report on the 2011 Proficiency Test of the European Union Reference Laboratory for
Mycotoxins, for the Network of National Reference Laboratories
Determination of Aflatoxin B1 in Baby food, Maize powder, Animal feed and Test solution
Zoltan Kunsagi Andreas Breidbach
Joerg Stroka
Project ID: MYCO-AFLA-06 PT coordinator: Joerg Stroka
January 2012

2
Table of contents
1. Summary ____________________________________________________________________________ 3
2. Introduction __________________________________________________________________________ 3
3. Scope _______________________________________________________________________________ 5
3.1. Confidentiality_____________________________________________________________________ 5
4. Time frame ___________________________________________________________________________ 5
5. Material______________________________________________________________________________ 5
5.1. Preparation _______________________________________________________________________ 5
5.2. Homogeneity______________________________________________________________________ 6
5.3. Stability__________________________________________________________________________ 6
5.4. Distribution _______________________________________________________________________ 6
6. Instructions to participants_______________________________________________________________ 7
7. Reference values and their uncertainties ____________________________________________________ 7
8. Evaluation of results ____________________________________________________________________ 7
8.1. General observations _______________________________________________________________ 7
8.2. Scores and evaluation criteria_________________________________________________________ 8
8.3. Laboratory results and scoring ________________________________________________________ 9
8.4. Evaluation of the questionnaire_______________________________________________________ 18
9. Conclusions__________________________________________________________________________ 18
10. Acknowledgements ___________________________________________________________________ 19
11. Abbreviations _______________________________________________________________________ 20
12. References _________________________________________________________________________ 20
13. Annexes ___________________________________________________________________________ 22
13.1. Homogeneity tests _______________________________________________________________ 23
13.2. Stability tests ___________________________________________________________________ 26
13.3. Invitation letter to laboratories ______________________________________________________ 27
13.4. Opening of registration ____________________________________________________________ 28
13.5. Accompanying letter ______________________________________________________________ 31
13.6. Acknowledgment of receipt form_____________________________________________________ 33
13.7. Questionnaire ___________________________________________________________________ 34
13.8. Experimental details ______________________________________________________________ 39
13.9. Assigned values _________________________________________________________________ 76
13.9.1. Introduction ___________________________________________________________________ 76
13.9.2. Materials and Methods ___________________________________________________________ 76
13.9.3. Results_______________________________________________________________________ 79

3
1. Summary
The Institute for Reference Materials and Measurements (IRMM) of the Joint Research Centre (JRC), a Directorate-General of the European Commission, operates the European Union Reference Laboratory (EU-RL) for Mycotoxins. One of its core tasks is to organise interlaboratory comparisons (ILCs) among appointed National Reference Laboratories (NRLs). In 2011 the annual proficiency test was also open to EU official control laboratories falling under the responsibility of the NRLs in order to support the NRLs fulfilling their tasks according to Regulation No 882/2004. This report presents the results of the ILC of the EU-RL for Mycotoxins which focused on the determination of aflatoxin B1 in food and feed samples. The test materials were naturally contaminated baby food, maize powder, cereal-based animal feed, an ampouled aflatoxin B1 solution and a blank baby food material. The materials were procured at IRMM and dispatched to the participants in May 2011. Each participant received 2.5 ml of solution and four sachets containing approximately 30 g of test material each. Sixty-nine participants from 28 countries registered for the exercise. Sixty-one sets of results were reported for the solution, 58 for the baby food, 67 for the maize powder and 62 for the animal feed. One laboratory did not report any results. The assigned values were 12.1 µg/ml for the test solution, 0.197 µg/kg for the baby food, 3.1 µg/kg for the maize powder and 9.9 µg/kg for the animal feed. The uncertainties of the respective assigned values were 0.2 µg/ml, 0.017 µg/kg, 0.14 µg/kg and 0.66 µg/kg, respectively. Participants were invited to report the uncertainty of their measurements. This was done by the majority of laboratories. Laboratory results were rated with z-scores and zeta-scores in accordance with ISO 13528 and the International Harmonized Protocol for the Proficiency Testing of Analytical Chemistry Laboratories. No z-scores were calculated for the blank material. In total about 90% of the attributed z-scores were below an absolute value of two, which indicated that most of the participants performed satisfactory or better.
2. Introduction Aflatoxins are mycotoxins that grow in many cereals and oilseeds but are found primarily in maize and peanuts. They are produced by strains of Aspergillus flavus, Aspergillus parasiticus and Aspergillus nomius. Aspergillus flavus produces B aflatoxins only, while the other species produce both B and G ones. Toxic effects of aflatoxins include carcinogenic, mutagenic, teratogenic, and immunosuppressive activity. Aflatoxin B1 (Figure 1) is the most potent hepatocarcinogen known in mammals and it is classified by the International Agency of Research on Cancer (IARC) as Group 1 carcinogen. Existing methods for aflatoxin analysis in food and feed are numerous and varied. The methodologies used for the determination of aflatoxin B1 in almost all food and feed matrices range from high-performance liquid-chromatography (HPLC) with various detection systems such as fluorescence (FLD) or mass selective detection (MSD), over thin-layer chromatography (TLC) to enzyme linked immunosorbant assays (ELISA). The most common principle in EU Member States is however HPLC with Kobra Cell derivatisation and fluorescence detection.

4
Figure 1: Structure of aflatoxin B1
Molecular formula: C17H12O6 CAS: 1162-65-8
Molecular weight: 312.274 g/mol
Commission Regulation (EC) No 1881/2006 lays down maximum limits for aflatoxin B1 in certain foods. For feed the guidance values are set in Directive 2002/32/EC of the European Parliament and of the Council (Table 1). Table 1: Legislation in the EU regarding aflatoxin B1 in the tested matrices in the proficiency test
Legislative reference
Matrix Maximum limit
All cereals and all products derived from cereals, including processed cereal products, with the exception of:
2 µg/kg
- Maize and rice to be subjected to sorting or other physical treatment before human consumption or use as an ingredient in foodstuffs
5 µg/kg
- Processed cereal-based foods and baby foods for infants and young children
0.1 µg/kg
Commission Regulation (EC) No 1881/2006 of 19 December 2006 setting maximum levels for certain contaminants in foodstuffs
- Dietary foods for special medical purposes intended specifically for infants
0.1 µg/kg
All feed materials 20 µg/kg Complete feedingstuffs for cattle, sheep and goats with the exception of:
20 µg/kg
— complete feedingstuffs for dairy animals
5 µg/kg
— complete feedingstuffs for calves and lambs
10 µg/kg
Complete feedingstuffs for pigs and poultry (except young animals)
20 µg/kg
Other complete feedingstuffs 10 µg/kg Complementary feedingstuffs for cattle, sheep and goats (except complementary feedingstuffs for dairy animals, calves and lambs)
20 µg/kg
Complementary feedingstuffs for pigs and poultry (except young animals)
20 µg/kg
Directive 2002/32/EC of the European Parliament and of the Council
Other complementary feedingstuffs 5 µg/kg

5
3. Scope
As stated in Article 32 of Regulation (EC) No 882/2004 1, one of the core duties of the EU-RL is to organise interlaboratory comparison tests (ILCs) for the benefit of staff from NRLs. The scope of this ILC was to test the competence of the appointed NRLs to determine the amount of aflatoxin B1 in food and feed samples. The proficiency test was also open to EU official control laboratories falling under the responsibility of the NRLs in order to support the NRLs fulfilling their tasks. The ILC was designed and the reported data were processed along the lines of the International Harmonized Protocol for the Proficiency Testing of Analytical Chemical Laboratories (Thompson et al. 2006)2. The assessment of the measurement results was undertaken on the basis of requirements laid down in legislation and followed administrative and logistic procedures of ISO Guide 43 3.
3.1. Confidentiality Confidentiality of the participants and their results towards third parties is guaranteed. The NRLs were requested to forward the information about the possibilities that official control laboratories have, since there are two options OCL can register. 1. The NRL enrols official control laboratories and covers participation fees: In this case the NRL submits a list of participants. The coverage of the participation fees has to be confirmed. In return the performance data of the respective official control laboratories will be disclosed to the NRL. 2. The official control laboratory enrols itself and covers the participation fee: In this case the NRL will get access to the performance data of the official control laboratory only upon providing a letter of consent by the participating lab."
4. Time frame
The ILC was agreed upon by the NRL network at the fifth EU-RL Mycotoxins workshop held on 10-11 March 2010. Specific details of the exercise were refined during the sixth EU-RL Mycotoxins workshop held on 7 April 2011. Invitation letters were sent to the participants on 25 March 2011 (Annex 13.3) and the planned ILC was published on the IRMM web page 4. The opening of registration was on 4 May 2011 (Annex 13.4). The samples were dispatched to the participants on 30 May 2011. Reporting deadline was 1 July 2011 which was postponed by a week.
5. Material
5.1. Preparation
The test materials were naturally contaminated cereal-based baby food, maize powder and cereal-based animal feed test samples from various sources. Six kilos of baby food, 4 kg of maize powder and 5 kg of maize powder were stored at IRMM at -20 °C waiting for processing. The materials were individually homogenized for 2 hours in Lödige

6
laboratory mixer (Model L20, Paderborn, Germany). Thereafter, about 120-120 vacuum sealed packages were produced at room temperature. The amount of material in each sachet was about 30 g. A test solution was also prepared, which contained Aflatoxin B1 (obtained from Sigma, code A-6636, 10 mg, Lot 56H4027) in a mixture of toluene and acetonitrile (both supplied by VWR) 98:2 (v/v). About 150 ampoules were filled under inert atmosphere, each with 2.5 ml of solution and flame sealed. All the test materials were stored under -18 °C until dispatch.
5.2. Homogeneity Sufficient homogeneity was assumed for the test solution after mixing. Homogeneities of the contaminated test materials were evaluated according to chapter 3.11.2 of the Harmonized Protocol 2. The contents of 10 randomly selected test sample sachets were analysed in duplicate by liquid chromatography with fluorescent detection (HPLC-FLD) and Kobra Cell derivatisation. 5 All analyses complied with the provisions given by the Harmonized Protocol. Hence it was concluded that the test materials were sufficiently homogeneous. (Annex 13.1)
5.3. Stability The amount of aflatoxin B1 in the test materials was monitored at the beginning of the study, during the study as well as after receipt of the results of the participants as it is suggested in the Harmonized Protocol. Statistically significant differences of the results of analysis obtained on the three mentioned dates were not found. (Annex 13.2)
5.4. Distribution
All samples were packed in cardboard boxes and sent via express mail. One set of material was sent to every participant. The test materials were dispatched to the participants by IRMM on 30 May 2011. The samples were mostly received within 24 hours after dispatch. Each participant received: a) four packages containing approximately 30 g of test materials (3 contaminated and 1 blank), b) one ampoule containing the aflatoxin B1 solution, c) an accompanying letter with instructions on sample handling and reporting (Annex 13.5), d) a sample receipt form (Annex 13.6) and e) a registration key for the reporting interface. The materials were shipped at room temperature; storage however was required to be at -18° C until the analysis was performed. Based on previous experience a short period of 1-2 days without cooling imposes no harm for the material, for storage above -18° C over a longer period of time no stability information is available.

7
6. Instructions to participants The laboratories were asked to report the recovery corrected value in µg/kg, including the recovery in % and measurement uncertainty plus coverage factor. For recovery experiments they had the chance to use the material containers marked as "Baby food - Blank". Another aim was to assess the content of aflatoxin B1 in solution by spectrophotometer. The laboratories were asked to report the value in µg/ml. The results were to be reported in a special on-line form for which each participant received an individual access code. A specific questionnaire was attached to this on-line form. The questionnaire was intended to provide further information on the measurements and the laboratories. A copy of the questionnaire is presented in Annex 13.7.
7. Reference values and their uncertainties For the test solution the consensus value of the reported results was used. Assigned values and their uncertainties for the aflatoxin B1 content for baby food, maize powder and animal feed were established by "Exact-matching Double Isotope Dilution Mass Spectrometry". This methodology is considered to be a primary ratio method with a direct link to
SI units. 6
More information about the assigned values is presented in Annex 13.9.
8. Evaluation of results
8.1. General observations
Sixty-nine participants from twenty-eight countries registered to the PT (Figure 2) and sixty-eight sent back results. Lab 102 couldn't submit their results before the deadline because they had a problem with their instrument. Sixty-one sets of results were reported for the aflatoxin B1 solution, 58 for baby food, 67 for maize powder and 62 for animal feed. Thirty-two laboratories reported uncertainties for aflatoxin B1 in solution, 52 for baby food, 61 for maize powder and 57 for animal feed. All member states of the European Union and Switzerland participated in the study. 33 out of 69 were official control laboratories.

8
Figure 2: Participating countries, number of laboratories
NETHERLANDS 3
POLAND 3
PORTUGAL 1
ROMANIA 2
SLOVAKIA 1
SLOVENIA 1
SPAIN 5
SWEDEN 2
SWITZERLAND 1
UNITED KINGDOM 9
CYPRUS 2
BULGARIA 1
BELGIUM 4
AUSTRIA 3
DENMARK 2
CZECH REPUBLIC 4
ESTONIA 1
FINLAND 2
FRANCE 2
GERMANY 1
GREECE 2
HUNGARY 2
IRELAND 2
LUXEMBOURG 1
MALTA 1
LITHUANIA 1ITALY 9LATVIA 1
8.2. Scores and evaluation criteria
Individual laboratory performance is expressed in terms of z and zeta (ζ) scores in accordance with ISO 13528 7 and the International Harmonised Protocol 2.
z=pσ
reflab Xx −
Equation 1.
ζ =reflab
reflab
uu
Xx
22+
−
Equation 2.
where: xlab is the measurement result reported by a participant Xref is the reference value (assigned value) ulab is the standard uncertainty reported by a participant uref is the standard uncertainty of the reference value σp is the standard deviation for proficiency assessment (target standard deviation) σp was calculated by the Horwitz equation: - for analyte concentrations < 120 ppb (baby food, maize powder, animal feed)
cp ⋅= 22.0σ Equation 3.

9
- for analyte concentrations ≥ 120 ppb ≤ 13.8% (test solution)
8495.002.0 cp ⋅=σ Equation 4.
where: c = concentration of the assigned value, Xref, expressed as a dimensionless mass ratio, e.g. 1 ppb = 10-9, 1 ppm = 10-6 The z score compares the participant's deviation from the reference value with the target standard deviation accepted for the proficiency test, σp. The z-score is interpreted as: |z| ≤ 2 satisfactory result 2 < |z| ≤ 3 questionable result |z| > 3 unsatisfactory result
The zeta (ζ) score provides an indication of whether the participant's estimate of uncertainty is consistent with the observed deviation from the assigned value. The ζ-score is the most relevant evaluation parameter, as it includes all parts of a measurement result, namely the expected value, its uncertainty as well as the uncertainty of the assigned values. The interpretation of the zeta score is similar to the interpretation of the z-score: |ζ| ≤ 2 satisfactory result 2 < |ζ| ≤ 3 questionable result |ζ| > 3 unsatisfactory result An unsatisfactory |ζ|-score might be due to an underestimation of the uncertainty, or to a large error causing a large deviation from the reference value, or to a combination of the two factors. A laboratory with an unsatisfactory |ζ|-score indicated an uncertainty which is not consistent with the laboratory's deviation from the reference value.
8.3. Laboratory results and scoring
Statistical evaluation of the results was performed using MS Excel and ProLab software 8. The robust mean values and robust standard deviations were computed according to Algorithm A of ISO 13528 7 by application of a MS Excel macro that was written by the Analytical Methods Committee of The Royal Society of Chemistry (AMC) 9. The representative figures are tabulated for each test sample in the following sections of the report.

10
Table 2: Summary statistics for the test solution
Number of results 61
Range of results µg/ml 10.3-15
Median of results of participants µg/ml 12.0
Mean of results of participants µg/ml 12.1
Robust mean of results of participants µg/ml 12.1
Assigned value (consensus value of participants' results) µg/ml 12.1
Expanded uncertainty (k=2) of the assigned value µg/ml 0.2
Robust standard deviation (σ̂ ) µg/ml 0.3
Target standard deviation (fitness for purpose, RSDR= 11 %) µg/ml 1.3
Number (percentage) of results of |z| > 2.0 1 (2%) Table 3: Results of analysis and z-scores for the test solution (The meaning of colours: green – satisfactory, yellow – questionable result)
Lab Code Result
[µg/ml] z-score Lab Code
Result
[µg/ml] z-score
101 12 -0,1 136 12.07 0,0 103 12.04 0,0 137 13.85 1,3 104 No result - 138 11.83 -0,2 105 10.2 -1,4 139 11.85 -0,2 106 13.2 0,8 140 12.02 0,0 107 No result - 141 No result - 108 10.766 -1,0 142 12.91 0,6 109 12 -0,1 143 11.77 -0,2 110 13.22 0,9 144 11.93 -0,1 111 12.9811 0,7 145 No result - 112 10.9 -0,9 146 11.97 -0,1 113 12.17 0,1 147 11.8 -0,2 114 12.12 0,0 148 11.6 -0,4 115 12.044 0,0 149 12.3 0,2 116 12.3 0,2 150 12.4 0,2 117 11.5 -0,4 151 12.27 0,1 118 11.9 -0,1 152 11.8 -0,2 119 12.12 0,0 153 11.8 -0,2 120 10.912 -0,9 154 12.092 0,0 121 No result - 155 12.027 0,0 122 12.1 0,0 156 12.06 0,0 123 11.5 -0,4 157 10.3 -1,3 124 11.75 -0,3 158 12.8 0,5 125 12.93 0,6 159 13.76 1,3 126 12.2 0,1 160 12.1 0,0 127 12.11 0,0 161 No result - 128 No result - 162 11.688 -0,3 129 11.66 -0,3 163 12.26 0,1 130 11.94 -0,1 164 11.963 -0,1 131 12.22 0,1 165 14.736 2,0 132 11.8 -0,2 166 11.8 -0,2 133 15 2,2 167 11.7 -0,3 134 9.42 -2,0 168 12.68 0,4 135 12.01 -0,1 169 12 -0,1
The results are written as reported by the laboratories.

Figure 3: EU-RL Mycotoxins PT 2011: Aflatoxin B1 in test solution
Certified value: Xref = 12,1 µg/ml; Uref = 0,2 µg/ml (k=2); σ = 1,3 µg/ml
8
9
10
11
12
13
14
15
16
17134
105
157
108
112
120
117
123
148
129
162
167
124
143
132
147
152
153
166
138
139
118
144
130
164
146
101
109
169
135
140
155
103
115
156
136
154
122
160
127
114
119
113
126
131
163
151
116
149
150
168
158
142
125
111
106
110
159
137
165
133
Lab Code
Afl
ato
xin
B1
(µ
g/m
l)
no value reported by lab:
102, 104, 107, 121, 128, 141,
145, 161
This graph displays all revised measurement results and their associated uncertainties. The uncertainties are shown as reported.
The red line corresponds to Xref, the blue lines mark the boundary of the reference interval (Xref ± 2uref), and the green lines that of the target interval (Xref ± 2σ).

Table 4: Summary statistics for the baby food
Number of results 58
Range of results µg/kg 0.1 – 3.27
Median of results of participants µg/kg 0.21
Mean of results of participants µg/kg 0.30
Robust mean of results of participants µg/kg 0.202
Assigned value (isotope dilution LC-MS/MS) µg/kg 0.197
Expanded uncertainty (k=2) of the assigned value µg/kg 0.017
Robust standard deviation (σ̂ ) µg/kg 0.044
Target standard deviation (fitness for purpose, RSDR= 22 %) µg/kg 0.04
Number (percentage) of results of |z| > 2.0 8 (14%)
Number (percentage) of results of |ζ| > 2.0 19 (33%)
Table 5: Results of analysis and z-scores for the baby food (The meaning of colours: green – satisfactory, yellow – questionable, red – unsatisfactory result)
Lab
Code
Result
[µg/kg] z-score ζ-score
Lab
Code
Result
[µg/kg] z-score ζ-score
101 <0.3 - - 136 0.12 -1.8 -4.5 103 0.308 2.6 2.4 137 0.16 -0.9 -2.1 104 0.243 1.1 0.8 138 0.23 0.8 0.5 105 1.1 20.8 106.2 139 0.199 0.0 0.0 106 0.14 -1.3 -6.7 140 1.11 21.1 4.3 107 No result - - 141 0.16 -0.9 -1.2 108 0.36 3.8 19.2 142 0.21 0.3 0.3 109 0.234 0.9 1.2 143 0.27 1.7 3.4 110 No result - - 144 0.3 2.4 1.0 111 0.2 0.1 0.1 145 No result - - 112 0.1 -2.2 -11.4 146 0.21 0.3 0.4 113 0.188 -0.2 -0.4 147 0.22 0.5 0.5 114 No result - - 148 0.16 -0.9 -1.4 115 0.24 1.0 2.0 149 0.22 0.5 0.5 116 0.18 -0.4 -0.3 150 0.56 8.4 13.7 117 0.18 -0.4 -0.4 151 0.181 -0.4 -0.5 118 0.22 0.5 0.5 152 0.17 -0.6 -0.7 119 <0.3 - - 153 0.171 -0.6 -1.5 120 <1 - - 154 0.17 -0.6 -1.0 121 0.19 -0.2 -0.8 155 No result - - 122 0.21 0.3 0.3 156 0.18 -0.4 -0.5 123 0.19 -0.2 -0.8 157 0.23 0.8 1.9 124 0.16 -0.9 -2.8 158 0.24 1.0 1.4 125 0.27 1.7 2.9 159 3.27 70.9 361.5 126 0.18 -0.4 -0.3 160 0.2 0.1 0.1 127 0.28 1.9 9.8 161 <0.3 - - 128 0.232 0.8 4.1 162 0.22 0.5 1.1 129 No result - - 163 0.11 -2.0 -4.0 130 0.23 0.8 0.9 164 0.21 0.3 0.3 131 0.15 -1.1 -1.5 165 0.186 -0.3 -0.6 132 0.15 -1.1 -1.1 166 0.26 1.5 2.4 133 0.203 0.1 0.2 167 0.22 0.5 2.1 134 0.25 1.2 2.0 168 0.193 -0.1 -0.1 135 0.25 1.2 2.0 169 0.14 -1.3 -4.7
The results are written as reported by the laboratories.

Figure 4: EU-RL Mycotoxins PT 2011: Aflatoxin B1 in baby food
Certified value: Xref = 0,197 µg/kg; Uref = 0,017 µg/kg (k=2); σ = 0,043 µg/kg
0
0,05
0,1
0,15
0,2
0,25
0,3
0,35
0,4
0,45
0,5112
163
136
106
169
131
132
124
137
141
148
152
154
153
116
117
126
156
151
165
113
121
123
168
139
111
160
133
122
142
146
164
118
147
149
162
167
130
138
157
128
109
115
158
104
134
135
166
125
143
127
144
103
108
150
105
140
159
Lab Code
Afl
ato
xin
B1
(µ
g/kg
)
no value reported by lab: 102, 107,
110, 114, 129, 145, 155
"less than" reported by: 101, 119,
120, 161
This graph displays all revised measurement results and their associated uncertainties. The uncertainties are shown as reported.
The red line corresponds to Xref, the blue lines mark the boundary of the reference interval (Xref ± 2uref), and the green lines that of the target interval (Xref ± 2σ).
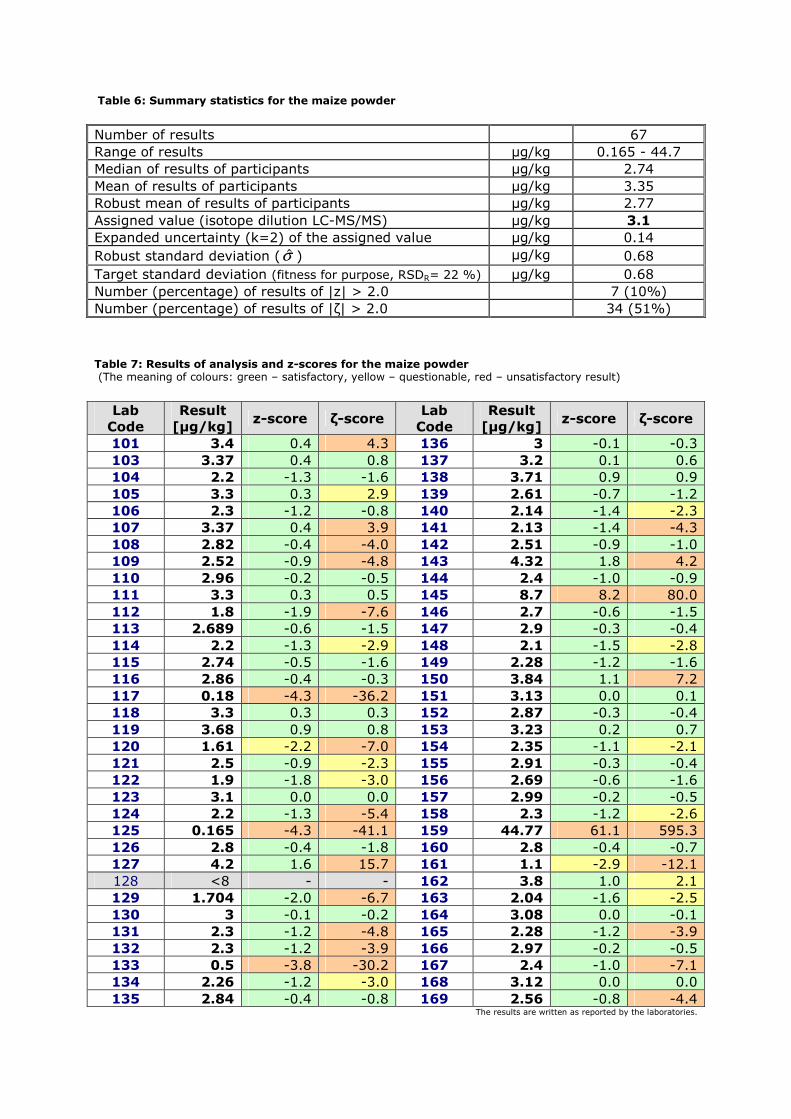
Table 6: Summary statistics for the maize powder
Number of results 67
Range of results µg/kg 0.165 - 44.7
Median of results of participants µg/kg 2.74
Mean of results of participants µg/kg 3.35
Robust mean of results of participants µg/kg 2.77
Assigned value (isotope dilution LC-MS/MS) µg/kg 3.1
Expanded uncertainty (k=2) of the assigned value µg/kg 0.14
Robust standard deviation (σ̂ ) µg/kg 0.68
Target standard deviation (fitness for purpose, RSDR= 22 %) µg/kg 0.68
Number (percentage) of results of |z| > 2.0 7 (10%)
Number (percentage) of results of |ζ| > 2.0 34 (51%)
Table 7: Results of analysis and z-scores for the maize powder (The meaning of colours: green – satisfactory, yellow – questionable, red – unsatisfactory result)
Lab
Code
Result
[µg/kg] z-score ζ-score
Lab
Code
Result
[µg/kg] z-score ζ-score
101 3.4 0.4 4.3 136 3 -0.1 -0.3 103 3.37 0.4 0.8 137 3.2 0.1 0.6 104 2.2 -1.3 -1.6 138 3.71 0.9 0.9 105 3.3 0.3 2.9 139 2.61 -0.7 -1.2 106 2.3 -1.2 -0.8 140 2.14 -1.4 -2.3 107 3.37 0.4 3.9 141 2.13 -1.4 -4.3 108 2.82 -0.4 -4.0 142 2.51 -0.9 -1.0 109 2.52 -0.9 -4.8 143 4.32 1.8 4.2 110 2.96 -0.2 -0.5 144 2.4 -1.0 -0.9 111 3.3 0.3 0.5 145 8.7 8.2 80.0 112 1.8 -1.9 -7.6 146 2.7 -0.6 -1.5 113 2.689 -0.6 -1.5 147 2.9 -0.3 -0.4 114 2.2 -1.3 -2.9 148 2.1 -1.5 -2.8 115 2.74 -0.5 -1.6 149 2.28 -1.2 -1.6 116 2.86 -0.4 -0.3 150 3.84 1.1 7.2 117 0.18 -4.3 -36.2 151 3.13 0.0 0.1 118 3.3 0.3 0.3 152 2.87 -0.3 -0.4 119 3.68 0.9 0.8 153 3.23 0.2 0.7 120 1.61 -2.2 -7.0 154 2.35 -1.1 -2.1 121 2.5 -0.9 -2.3 155 2.91 -0.3 -0.4 122 1.9 -1.8 -3.0 156 2.69 -0.6 -1.6 123 3.1 0.0 0.0 157 2.99 -0.2 -0.5 124 2.2 -1.3 -5.4 158 2.3 -1.2 -2.6 125 0.165 -4.3 -41.1 159 44.77 61.1 595.3 126 2.8 -0.4 -1.8 160 2.8 -0.4 -0.7 127 4.2 1.6 15.7 161 1.1 -2.9 -12.1 128 <8 - - 162 3.8 1.0 2.1 129 1.704 -2.0 -6.7 163 2.04 -1.6 -2.5 130 3 -0.1 -0.2 164 3.08 0.0 -0.1 131 2.3 -1.2 -4.8 165 2.28 -1.2 -3.9 132 2.3 -1.2 -3.9 166 2.97 -0.2 -0.5 133 0.5 -3.8 -30.2 167 2.4 -1.0 -7.1 134 2.26 -1.2 -3.0 168 3.12 0.0 0.0 135 2.84 -0.4 -0.8 169 2.56 -0.8 -4.4
The results are written as reported by the laboratories.

Figure 5: EU-RL Mycotoxins PT 2011: Aflatoxin B1 in maize powder
Certified value: Xref = 3,1 µg/kg; Uref = 0,14 µg/kg (k=2); σ = 0,68 µg/kg
0
1
2
3
4
5
6125
117
133
161
120
129
112
122
163
148
141
140
104
114
124
134
149
165
106
131
132
158
154
144
167
121
142
109
169
139
113
156
146
115
126
160
108
135
116
152
147
155
110
166
157
130
136
164
123
168
151
137
153
105
111
118
103
107
101
119
138
162
150
127
143
145
159
Lab Code
Afl
ato
xin
B1
(µ
g/
kg
)
no value reported by lab: 102
"less than" reported by: 128
This graph displays all revised measurement results and their associated uncertainties. The uncertainties are shown as reported.
The red line corresponds to Xref, the blue lines mark the boundary of the reference interval (Xref ± 2uref), and the green lines that of the target interval (Xref ± 2σ).

Table 8: Summary statistics for the animal feed
Number of results 62
Range of results µg/kg 3.72 - 45
Median of results of participants µg/kg 8.81
Mean of results of participants µg/kg 9.28
Robust mean of results of participants µg/kg 8.63
Assigned value (isotope dilution LC-MS/MS) µg/kg 9.9
Expanded uncertainty (k=2) of the assigned value µg/kg 0.66
Robust standard deviation (σ̂ ) µg/kg 1.74
Target standard deviation (fitness for purpose, RSDR= 22 %) µg/kg 2.2
Number (percentage) of results of |z| > 2.0 3 (5%)
Number (percentage) of results of |ζ| > 2.0 19 (31%)
Table 9: Results of analysis and z-scores for the animal feed (The meaning of colours: green – satisfactory, yellow – questionable, red – unsatisfactory result)
Lab
Code
Result
[µg/kg] z-score ζ-score
Lab
Code
Result
[µg/kg] z-score ζ-score
101 9.3 -0,3 -1,8 136 10.2 0,1 0,3 103 9.05 -0,4 -1,1 137 11.3 0,6 1,2 104 No result - - 138 11.83 0,9 1,1 105 10.9 0,5 3,0 139 No result - - 106 7.5 -1,1 -0,7 140 8.1 -0,8 -1,1 107 8.7 -0,6 -0,7 141 7.46 -1,1 -2,9 108 8.03 -0,9 -5,7 142 8.91 -0,5 -0,5 109 10.5 0,3 0,7 143 17.24 3,4 6,2 110 9.56 -0,2 -1,0 144 8.2 -0,8 -0,6 111 10.6 0,3 0,6 145 7.02 -1,3 -8,7 112 5.7 -1,9 -8,8 146 8.3 -0,7 -1,8 113 9.981 0,0 0,1 147 8.3 -0,7 -1,2 114 6 -1,8 -4,8 148 10 0,0 0,1 115 9.31 -0,3 -0,7 149 No result - - 116 11.1 0,6 0,5 150 11.04 0,5 1,5 117 7.8 -1,0 -1,2 151 9.2 -0,3 -0,7 118 9.2 -0,3 -0,4 152 7.83 -1,0 -1,3 119 9.12 -0,4 -0,4 153 9.97 0,0 0,1 120 5.61 -2,0 -5,5 154 7.52 -1,1 -2,0 121 8.6 -0,6 -1,4 155 9.72 -0,1 -0,1 122 7.8 -1,0 -1,2 156 9.06 -0,4 -1,0 123 10 0,0 0,3 157 9.33 -0,3 -0,7 124 8.7 -0,6 -1,2 158 7 -1,3 -3,0 125 9.04 -0,4 -1,0 159 45 16,1 106,4 126 8.3 -0,7 -2,7 160 8.5 -0,6 -1,2 127 No result - - 161 9 -0,4 -0,6 128 9 -0,4 -2,0 162 10.24 0,2 0,4 129 5.597 -2,0 -6,0 163 3.72 -2,8 -7,6 130 No result - - 164 6.24 -1,7 -8,3 131 7.2 -1,2 -4,2 165 6.35 -1,6 -5,5 132 7.4 -1,1 -3,4 166 No result - - 133 7.5 -1,1 -4,0 167 5.8 -1,9 -11,1 134 8.12 -0,8 -1,9 168 10.24 0,2 0,2 135 8.24 -0,8 -1,9 169 9.25 -0,3 -1,3
The results are written as reported by the laboratories.

Figure 6: EU-RL Mycotoxins PT 2011: Aflatoxin B1 in animal feed
Certified value: Xref = 9,9 µg/kg; Uref = 0,66 µg/kg (k=2); σ = 2,2 µg/kg
2
4
6
8
10
12
14
16
18
20163
129
120
112
167
114
164
165
158
145
131
132
141
106
133
154
117
122
152
108
140
134
144
135
126
146
147
160
121
107
124
142
128
161
125
103
156
119
118
151
169
101
115
157
110
155
153
113
123
148
136
162
168
109
111
105
150
116
137
138
143
159
Lab Code
Afl
ato
xin
B1
(µ
g/kg
)
no value reported by lab: 102, 104,
127, 130, 139, 149, 166
This graph displays all revised measurement results and their associated uncertainties. The uncertainties are shown as reported.
The red line corresponds to Xref, the blue lines mark the boundary of the reference interval (Xref ± 2uref), and the green lines that of the target interval (Xref ± 2σ).

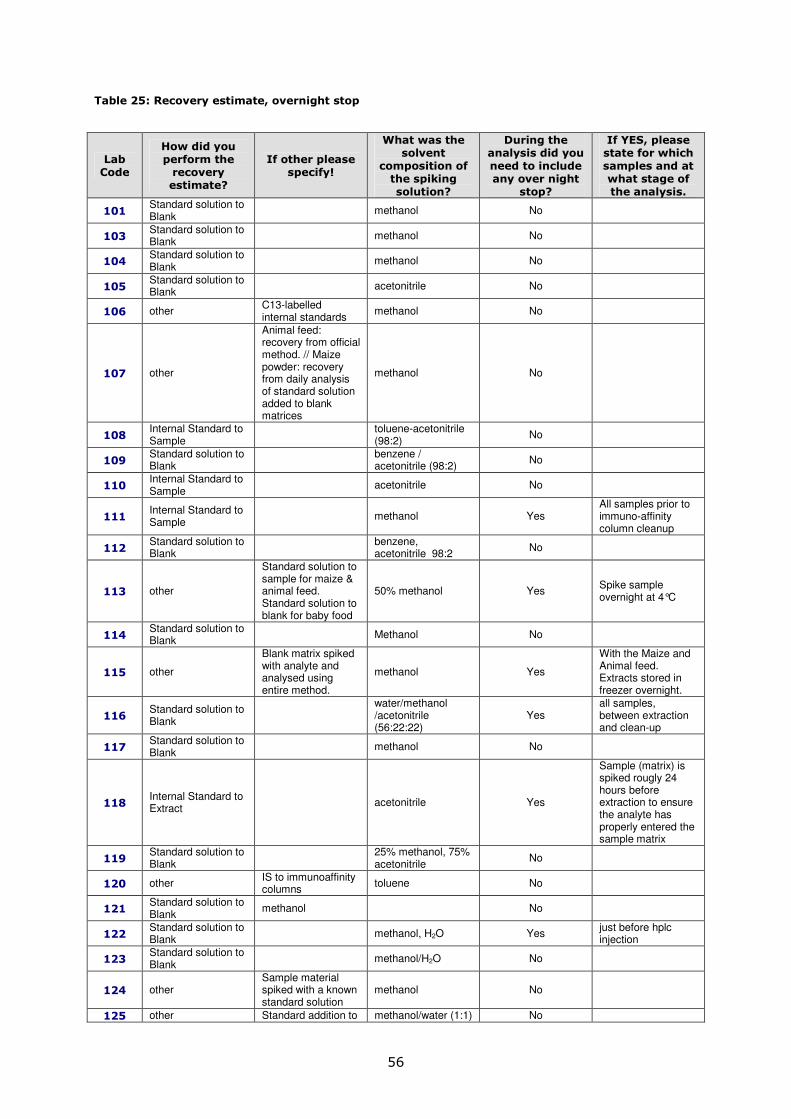
8.4. Evaluation of the questionnaire Sixty-one laboratories analyzed the aflatoxin B1 solution. Even though the EU-RL asked in the accompanying letter to do the analysis with a spectrophotometer, two laboratories analyzed the test solution with LC-MS/MS and three with HPLC-FLD technique. For the recovery estimation nearly all of the participants used a "standard spiked to blank" method. Sixty-three laboratories used immunoaffinity columns (IAC) as a clean up methodology. The manufacturers and the number of the labs using them are the following: R-Biopharm (37), Vicam (17), Romer Labs (5), Neogen (2), LC Tech (2). Forty-four percent of the participants used acid washed glassware during the analyses and 88 % reported that protection against daylight was applied. Ninety-two percent of the participants found the instructions distributed adequate and regarding the registering-reporting interface the EU-RL received mostly good reviews. Details on the spectrophotometer conditions, samples preparation and HPLC analyses etc can be found in Annex 13.8.
No statistically relevant information could be obtained that linked performance results with answers on methodology, overnight step, calibrant control etc.
9. Conclusions Sixty-nine participants from twenty-eight countries registered to the interlaboratory comparison for aflatoxin B1 of which 61 sets of results were reported for the test solution, 58 for baby food, 67 for maize powder and 62 for animal feed. One laboratory did not report any results. The performance of most participants was outstanding compared with PTs of previous years organized be the EU-RL. In total about 90% of the attributed z-scores were below an absolute value of two, which indicated that most of the participants performed satisfactory or better than the minimal performance criteria required. The analysis of all data revealed that laboratory performance was not linked to any analytical technique or sample preparation method used. The great majority of laboratories in this interlaboratory comparison applied analytical methods which, with the regard to performance characteristics, were compliant with EU legislation. Zeta-scores were not as good as the z-scores, which indicates that the respective participants should review their uncertainty estimation. Only z-scores were used for benchmarking and NRLs with unsatisfactory z-scores will be invited for a corrective action.

19
10. Acknowledgements The organisers of the study would like to thank Franz Ulberth, Beatriz de la Calle, Ines Baer and Donata Lerda for their support and the Reference Materials Unit at IRMM, in particular Håkan Emteborg, for ampouling of the test samples. The authors also would like thank to the colleagues at EU-RL Mycotoxins group for their help at daily work and revising this report: Katrien Bouten, Anna Kolossova, Carsten Mischke, Katy Kroeger-Negoita and Vytautas Tamosiunas. The laboratories participating in this exercise, listed in Table 10, are also kindly acknowledged. Table 10: Participating laboratories (Entries in italic are official control laboratories)
Organisation Country
Institut für Umwelt und Lebensmittelsicherheit Austria Eurofins-ofi Lebensmittelanalytik GmbH Austria AGES GmbH Austria
Fytolab Belgium Coda-Cerva (VAR) Belgium
Federal Laboratory for the Safety of the Food Chain Belgium Oleotest n.v. Belgium NDRVMI Bulgaria
Department Of Agriculture Cyprus
State General Laboratory Cyprus
Institute of Chemical Technology in Prague Czech Republic Czech Agriculture and Food Inspection Authority Czech Republic
UKZUZ (Central Institute for Supervising and Testing in Agriculture) Czech Republic
State Veterinary Institute Prague Czech Republic The Danish Plant Directorate Denmark
National Food Institute Denmark
Agricultural Research Centre Estonia
Finnish Food Safety Authority Evira Finland
Finnish Customs Laboratory Finland
LDA 22 France Laboratoire SCL de Rennes France
Federal institute for risk assessment -BfR Germany
General Chemical State Laboratory Greece
General Chemical State Laboratory Greece Central Agricultural Office, Food and Feed Safety Directorate – Feed NRL Hungary
Central Agricultural Office, Food and Feed Safety Directorate – Food NRL Hungary
Dublin Public Analyst's Laboratory Ireland
The State Laboratory Ireland Istituto Zooprofilattico Sperimentale delle Venezie Italy Istituto Zooprofilattico Sperimentale regioni Lazio e Toscana Italy ARPA Piemonte Italy Istituto Zooprofilattico Sperimentale Umbria Marche Italy Istituto Zooprofilattico Sperimentale LER Italy Istituto Zooprofilattico Puglia Basilicata Foggia Italy ARPAL Italy Istituto Superiore di Sanità Italy
Istituto Zooprofilattico Sperimentale Italy Institute of Food Safety,Animal Health and Environment "BIOR" Latvia
National Food and Veterinary Risk Assessment Institute Lithuania
Laboratoire National de Santé Luxembourg
Public Health Laboratory Malta
Food and Consumer Product Safety Authority (nVWA) Netherlands Silliker Netherlands BV - Dr. A. Verwey Netherlands RIKILT Netherlands
WSSE Katowice Poland National Veterinary Research Institute Poland
National Institute of Public Health - National Institute of Hygiene Poland
INRB, IP - Laboratório Nacional de Investigação Veterinária Portugal
Sanitary Veterinary And Food Safety Directorate Romania
Hygiene Institute of Veterinary Public Health Romania
State Veterinary and Food Institute Slovakia
University in Ljubljana, Veterinary Faculty-National Veterinary Institute Slovenia
Centro Nacional De Alimentacion (Spanish Food Safety and Nutrition Agency) Spain
Servicio Territorial de Sanidad y B. Social de Soria-Junta de Castilla y León Spain Laboratorio Normativo de Salud Pública Spain

20
Organisation Country
Centro de Salud Pública de Valencia Spain CNTA Spain National Food Administration Sweden
National Veterinary Institute (SVA) Sweden
Kantonales Laboratorium Basel-Landschaft Switzerland
Leicestershire and Staffordshire Scientific Services United Kingdom The City of Edinburgh Council United Kingdom Lancashire County Laboratory United Kingdom Minton, Treharne & Davies Ltd. United Kingdom Kent County Council United Kingdom Worcestershire Scientific Services United Kingdom Food and Environment Research Agency United Kingdom
Cardiff Scientific Services United Kingdom Somerset County Council United Kingdom
11. Abbreviations ANOVA Analysis of variance CEN European Committee for Standardisation EC European Commission ELISA Enzyme linked immunosorbant assays EU European Union EU-RL European Reference Laboratory FLD Fluorescent detection HPLC High-performance liquid chromatography IAC Immunoaffinity column ILC Interlaboratory Comparison IRMM Institute for Reference Materials and Measurements ISO International Organisation for Standardisation IUPAC International Union for Pure and Applied Chemistry JRC Joint Research Centre LoD Limit of Detection LoQ Limit of Quantification NRL National Reference Laboratory OCL Official Control Laboratory PT Proficiency Test TLC Thin-layer chromatography
12. References
1. Commission Regulation (EC) No 882/2004 of the European Parliament and of the council of 29 April 2004 on official controls performed to ensure the verification of compliance with feed and food law, animal health and animal welfare rules http://eur-lex.europa.eu/LexUriServ/LexUriServ.do?uri=CONSLEG:2004R0882:20060525:EN:PDF
2. Thompson, M., Ellison, S.L.R., and Wood, R., The International Harmonized Protocol for the Proficiency Testing of Analytical Chemistry Laboratories. Pure Appl. Chem., 2006. 78(1): p. 145–196. http://media.iupac.org/publications/pac/2006/pdf/7801x0145.pdf
3. ISO Guide 43 - Proficiency Testing by Interlaboratory Comparisions - Part 1: Development and Operation of Laboratory Proficiency Testing Schemes, - Part 2: Selection and use of proficiency testing schemes by laboratory accreditation bodies

21
4. IRMM. Inter-laboratory Comparisons at the Institute for Reference Materials and Measurements. 2011; Available from: http://irmm.jrc.ec.europa.eu/EURLs/EURL_mycotoxins/interlaboratory_comparisons/Pages/index.aspx
5. EN 14123:2007 Foodstuffs. Determination of aflatoxin B1 and the sum of aflatoxin B1, B2, G1 and G2 in hazelnuts, peanuts, pistachios, figs, and paprika powder. High performance liquid chromatographic method with post-column derivatisation and immunoaffinity column cleanup 6. Mackay, L.G., et al., High accuracy analysis by isotope dilution mass spectrometry using an iterative exact matching technique. Accreditation and Quality Assurance: Journal for Quality, Comparability and Reliability in Chemical Measurement, 2003. 8(5): p. 191-194.
7. ISO 13528:2005; Statistical Methods for Use in Proficiency Testing by Interlaboratory Comparisons 8. ProLab Software, QuoData, Dresden http://www.quodata.de
9. Analytical Methods Committee, Robust statistics: a method of coping with outliers, Technical brief No 6, Apr 2001. http://www.rsc.org/pdf/amc/brief6.pdf

13. Annexes

23
13.1. Homogeneity tests
Homogeneities of the contaminated baby food, maize power and animal feed
materials were evaluated according to chapter 3.11.2 of the Harmonized
Protocol.
Table 11: Duplicated results for 10 distribution units of baby food analysed for aflatoxin B1 (µg/kg), together with some intermediate stages of the ANOVA calculation
Sample Result a Result b D = a - b S = a + b D2 = (a - b)2
1 0,11 0,11 0,00 0,22 0,00
2 0,11 0,10 0,01 0,21 0,00
3 0,11 0,13 -0,02 0,24 0,00
4 0,11 0,11 0,00 0,22 0,00
5 0,10 0,10 0,00 0,20 0,00
6 0,10 0,10 0,00 0,20 0,00
7 0,10 0,09 0,01 0,19 0,00
8 0,10 0,10 0,00 0,20 0,00
9 0,11 0,12 -0,01 0,23 0,00
10 0,10 0,11 -0,01 0,21 0,00
Figure 7: Analytical results of the homogeneity study of baby food test material
Baby food
0,08
0,09
0,10
0,11
0,12
0,13
0,14
0 1 2 3 4 5 6 7 8 9 10 11
Distribution unit serial identity code
Ana
lyti
cal re
su
lt (
µg
/k
g)
The data are presented visually above, and show no suspect features such as discordant duplicated results, outlying samples, trends, discontinuities, or any other systematic effects. Cochran's test: The largest value of D2 is 0.0004 and the sum of D2 is 0.0008, so the Cochran test statistic is 0.0004/0.0008=0.5. This is less than the 5% critical value of 0.602 for this type of test, so there is no evidence for analytical outliers and we proceed with the complete data set. Homogeneity test
- Analytical variance: san2= ∑D2/2m = 0.0008/20 = 0.00004
- Between-sample variance: the variance of the sums S = a + b is 0.00024, so ssam
2 = (Vs/2 – san2)/2 = (0.00024/2 – 0.00004)/2 = 0.00004
- Acceptable between-sample variance: the target standard deviation is 0.02332 µg/kg, so the allowable between-sample variance is σall
2 = (0.3σp)2 = (0.3 X 0.02332)2 =
0.000049 - Critical value: The critical value for the test is 1.88 σall
2 + 1.01 san2 = 1.88 X 0.000049 +
1.01 X 0.00004 = 0.00013 Since ssam
2 = 0.00004 < 0.00013, passed and the baby food material is sufficiently homogeneous.

24
Table 12: Duplicated results for 10 distribution units of maize powder analysed for aflatoxin B1 (µg/kg), together with some intermediate stages of the ANOVA calculation
Sample Result a Result b D = a - b S = a + b D2 = (a - b)2
1 2,03 2,04 -0,01 4,07 0,00
2 2,18 2,09 0,09 4,27 0,01
3 2,02 1,94 0,08 3,96 0,01
4 1,98 2,01 -0,03 3,99 0,00
5 2,23 2,11 0,12 4,34 0,01
6 2,08 2,01 0,07 4,09 0,00
7 2,07 1,81 0,26 3,88 0,07
8 1,90 1,98 -0,08 3,88 0,01
9 1,92 2,06 -0,14 3,98 0,02
10 2,05 1,98 0,07 4,03 0,00
Figure 8: Analytical results of the homogeneity study of maize powder test material
Maize powder
1,60
1,70
1,80
1,90
2,00
2,10
2,20
2,30
0 1 2 3 4 5 6 7 8 9 10 11
Distribution unit serial identity code
Ana
lyti
ca
l re
su
lt (
µg
/k
g)
The data are presented visually above, and show no suspect features such as discordant duplicated results, outlying samples, trends, discontinuities, or any other systematic effects. Cochran's test: The largest value of D2 is 0.07 and the sum of D2 is 0.13, so the Cochran test statistic is 0.07/0.13=0.538. This is less than the 5% critical value of 0.602 for this type of test, so there is no evidence for analytical outliers and we proceed with the complete data set. Homogeneity test
- Analytical variance: san2= ∑D2/2m = 0.13/20 = 0.0065
- Between-sample variance: the variance of the sums S = a + b is 0.02, so ssam
2 = (Vs/2 – san2)/2 = (0.02/2 – 0.0065)/2 = 0.00175
- Acceptable between-sample variance: the target standard deviation is 0.45 µg/kg, so the allowable between-sample variance is σall
2 = (0.3σp)2 = (0.3 X 0.45)2 = 0.018
- Critical value: The critical value for the test is 1.88 σall2 + 1.01 san
2 = 1.88 X 0.018 + 1.01 X 0.0065 = 0.0404 Since ssam
2 = 0.00175 < 0.0404, passed and the maize powder material is sufficiently homogeneous.

25
Table 13: Duplicated results for 10 distribution units of animal feed analysed for aflatoxin B1 (µg/kg), together with some intermediate stages of the ANOVA calculation
Sample Result a Result b D = a - b S = a + b D2 = (a - b)2
1 7,66 7,49 0,2 15,2 0,03
2 8,05 7,49 0,6 15,5 0,31
3 7,81 7,52 0,3 15,3 0,08
4 7,54 7,74 -0,2 15,3 0,04
5 7,31 7,71 -0,4 15,0 0,16
6 7,30 7,30 0,0 14,6 0,00
7 8,12 7,61 0,5 15,7 0,26
8 7,59 7,38 0,2 15,0 0,04
9 7,45 7,54 -0,1 15,0 0,01
10 7,44 7,43 0,0 14,9 0,00
Figure 9: Analytical results of the homogeneity study of animal feed test material
Animal feed
7,00
7,20
7,40
7,60
7,80
8,00
8,20
8,40
0 1 2 3 4 5 6 7 8 9 10 11
Distribution unit serial identity code
An
aly
tica
l re
su
lt (
µg
/k
g)
The data are presented visually above, and show no suspect features such as discordant duplicated results, outlying samples, trends, discontinuities, or any other systematic effects. Cochran's test: The largest value of D2 is 0.31 and the sum of D2 is 0.94, so the Cochran test statistic is 0.31/0.94=0.330. This is less than the 5% critical value of 0.602 for this type of test, so there is no evidence for analytical outliers and we proceed with the complete data set. Homogeneity test
- Analytical variance: san2= ∑D2/2m = 0.94/20 = 0.047
- Between-sample variance: the variance of the sums S = a + b is 0.11, so ssam
2 = (Vs/2 – san2)/2 = (0.11/2 – 0.047)/2 = 0.004
- Acceptable between-sample variance: the target standard deviation is 1.67 µg/kg, so the allowable between-sample variance is σall
2 = (0.3σp)2 = (0.3 X 1.67)2 = 0.251
- Critical value: The critical value for the test is 1.88 σall2 + 1.01 san
2 = 1.88 X 0.251 + 1.01 X 0.047 = 0.519 Since ssam
2 = 0.004 < 0.519, passed and the animal feed material is sufficiently homogeneous.

26
13.2. Stability tests
Stabilities of the contaminated baby food, maize power and animal feed
materials were evaluated according to chapter 3.11.5 of the Harmonized
Protocol.
Table 14: Stability study for aflatoxin B1 (µg/kg) in baby food
sample 15/04/2011 20/06/2011 6/10/2011
1 0,13 0,15 0,17
2 0,14 0,14 0,15
3 0,14 0,17 0,13
mean 0,14 0,15 0,15
difference 0,01 0,01
Table 15: Stability study for aflatoxin B1 (µg/kg) in maize powder
5/05/2011 20/06/2011 6/10/2011
sample 1 2,28 2,28 2,45
sample 2 2,33 2,32 2,43
sample 3 2,40 2,45 2,31
mean 2,34 2,35 2,40
difference 0,01 0,06
Table 16: Stability study for aflatoxin B1 (µg/kg) in animal feed
10/05/2011 20/06/2011 6/10/2011
sample 1 7,81 7,75 6,89
sample 2 7,45 7,79 8,16
sample 3 7,71 7,77 8,08
mean 7,66 7,77 7,71
difference 0,11 0,05
The differences due to instability were smaller than the desired limit of 0.1* pσ according
to the Harmonized Protocol, so there are no consequential instabilities and the materials are suitable for use.

27
13.3. Invitation letter to laboratories

28
13.4. Opening of registration

29

30

31
13.5. Accompanying letter

32

33
13.6. Acknowledgment of receipt form

34
13.7. Questionnaire

35

36

37

38

39
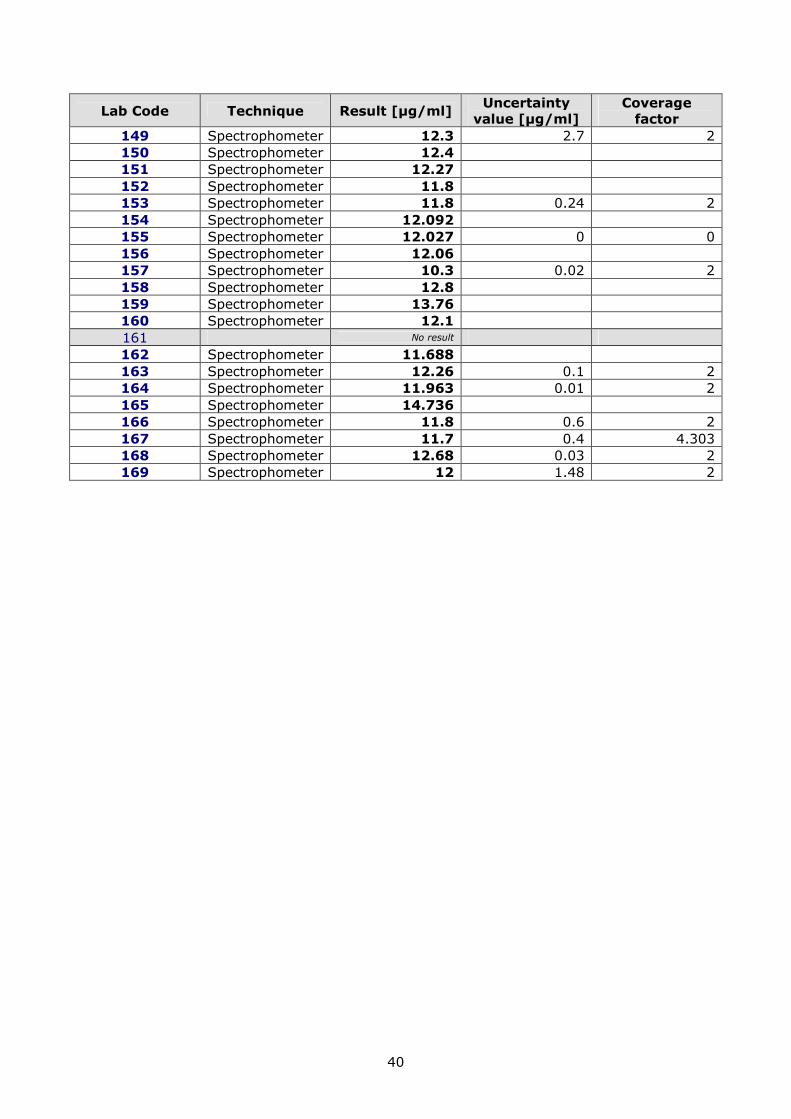
13.8. Experimental details
Table 17: Results and method performance characteristics (test solution)
Lab Code Technique Result [µg/ml] Uncertainty
value [µg/ml]
Coverage
factor
101 Spectrophometer 12 103 Spectrophometer 12.04 0.24 2 104 No result 105 LC-MS/MS 10.2 106 LC-MS/MS 13.2 107 No result 108 Spectrophometer 10.766 109 Spectrophometer 12 0.21 2 110 HPLC-FLD 13.22 0.13 2 111 Spectrophometer 12.9811 112 Spectrophometer 10.9 113 Spectrophometer 12.17 114 Spectrophometer 12.12 0.07 2 115 Spectrophometer 12.044 116 Spectrophometer 12.3 1.5 2 117 Spectrophometer 11.5 22 1 118 Spectrophometer 11.9 0.3 2 119 Spectrophometer 12.12 0.12 2 120 Spectrophometer 10.912 121 No result 122 Spectrophometer 12.1 2.7 2 123 HPLC-FLD 11.5 5 124 Spectrophometer 11.75 0.29 2 125 Spectrophometer 12.93 126 Spectrophometer 12.2 127 Spectrophometer 12.11 128 No result 129 Spectrophometer 11.66 1.4 2 130 Spectrophometer 11.94 0.36 2 131 Spectrophometer 12.22 132 Spectrophometer 11.8 0.04 2 133 HPLC-FLD 15 0.75 2 134 Spectrophometer 9.42 0.38 2 135 Spectrophometer 12.01 1.8 2 136 Spectrophometer 12.07 137 Spectrophometer 13.85 2.77 2 138 Spectrophometer 11.83 139 Spectrophometer 11.85 0.24 2 140 Spectrophometer 12.02 1 2 141 No result 142 Spectrophometer 12.91 143 Spectrophometer 11.77 144 Spectrophometer 11.93 0.08 2 145 No result 146 Spectrophometer 11.97 0.6 2 147 Spectrophometer 11.8 2 148 Spectrophometer 11.6 0.66 2
40
Lab Code Technique Result [µg/ml] Uncertainty
value [µg/ml]
Coverage
factor
149 Spectrophometer 12.3 2.7 2 150 Spectrophometer 12.4 151 Spectrophometer 12.27 152 Spectrophometer 11.8 153 Spectrophometer 11.8 0.24 2 154 Spectrophometer 12.092 155 Spectrophometer 12.027 0 0 156 Spectrophometer 12.06 157 Spectrophometer 10.3 0.02 2 158 Spectrophometer 12.8 159 Spectrophometer 13.76 160 Spectrophometer 12.1 161 No result 162 Spectrophometer 11.688 163 Spectrophometer 12.26 0.1 2 164 Spectrophometer 11.963 0.01 2 165 Spectrophometer 14.736 166 Spectrophometer 11.8 0.6 2 167 Spectrophometer 11.7 0.4 4.303 168 Spectrophometer 12.68 0.03 2 169 Spectrophometer 12 1.48 2

41
Table 18: Results and method performance characteristics (baby food)
Lab
Code Technique
Result
[µg/kg]
Uncertainty
value
[µg/kg]
Coverage
factor
Recovery
[%]
LoD
[µg/kg]
LoQ
[µg/kg]
101 HPLC-FLD <0.3 99 0.1 0.3 103 HPLC-FLD 0.308 0.092 2 61.0 0.01 0.05 104 LC-MS/MS 0.243 0.12 2 79 0.004 0.008 105 LC-MS/MS 1.1 82 0.03 0.1 106 LC-MS/MS 0.14 95 0.05 0.1 107 No result - - - 108 HPLC-FLD 0.36 114.3 0.3 0.8 109 HPLC-FLD 0.234 0.06 2 103.7 0.070 0.100 110 No result 35 0.03 0.1 111 HPLC-FLD 0.2 0.04 2 82-109 0.001 0.1 112 HPLC-FLD 0.1 67 0.02 0.05 113 HPLC-FLD 0.188 0.04 2 89.66 0.1 0.25 114 No result - - - 115 HPLC-FLD 0.24 0.04 2 69 0.01 0.05 116 HPLC-FLD 0.18 0.13 2 70.9 0.02 0.05 117 HPLC-FLD 0.18 22 1 86.3 0.10 0.10 118 LC-MS/MS 0.22 0.1 2 106 0.03 0.08 119 HPLC-FLD <0.3 107 0.3 0.3 120 LC-MS/MS <1 70 0.3 1.0 121 HPLC-FLD 0.19 0.06 100 0.003 0.01 122 HPLC-FLD 0.21 0.09 2 84 0.08 0.08 123 HPLC-FLD 0.19 25 101 0.07 0.2 124 HPLC-FLD 0.16 0.02 2 77 0.008 0.015 125 HPLC-FLD 0.27 0.047 2 83.4 0.15 0.5 126 HPLC-FLD 0.18 0.1 2 100 0.06 0.1 127 HPLC-FLD 0.28 0.01 69 0.02 0.05 128 HPLC-FLD 0.232 56 0.025 0.050 129 No result 55 0.1 0.1 130 HPLC-FLD 0.23 0.07 2 49 0.024 0.032 131 HPLC-FLD 0.15 0.06 2 79 0.02 0.05 132 HPLC-FLD 0.15 0.081 2 60.8 0.15 0.4 133 HPLC-FLD 0.203 0.061 2 91.2 0.02 0.04 134 HPLC-FLD 0.25 0.05 2 60 0.05 0.08 135 HPLC-FLD 0.25 0.05 2 94.2 0.05 0.2 136 HPLC-FLD 0.12 0.03 2 133.7 0.02 0.1 137 HPLC-FLD 0.16 0.03 2 81.0 0.025 0.075 138 HPLC-FLD 0.23 0.12 2 73.9 0.002 0.004 139 HPLC-FLD 0.199 0.08 2 80 0.02 0.05 140 HPLC-FLD 1.11 0.42 2 72.0 0.5 1.5 141 LC-MS/MS 0.16 0.06 2 80 0.03 0.05 142 HPLC-FLD 0.21 0.1 2 91.35 0.2 0.5 143 HPLC-FLD 0.27 0.04 2 93.3 - 0.03 144 HPLC-FLD 0.3 0.2 2 125 0.08 0.1 145 No result - - - 146 HPLC-FLD 0.21 0.06 2 93.4 0.018 0.035 147 HPLC-FLD 0.22 0.1 2 33 0.0035 0.007 148 HPLC-FLD 0.16 0.05 2 100 0.02 0.06 149 HPLC-FLD 0.22 0.1 2 80.4 0.007 0.1 150 HPLC-FLD 0.56 0.05 2 60 0.012 0.014

42
Lab
Code Technique
Result
[µg/kg]
Uncertainty
value
[µg/kg]
Coverage
factor
Recovery
[%]
LoD
[µg/kg]
LoQ
[µg/kg]
151 HPLC-FLD 0.181 0.058 2 100 0.10 0.10 152 HPLC-FLD 0.17 0.07 2 87 0.02 0.05 153 HPLC-FLD 0.171 0.029 2 77 0.05 0.15 154 HPLC-FLD 0.17 0.05 2 86 0.03 0.09 155 No result 95 0.02 0.1 156 HPLC-FLD 0.18 0.07 2 85 0.025 0.05 157 HPLC-FLD 0.23 0.03 2 98 0.05 0.06 158 LC-MS/MS 0.24 0.06 2 108 0.02 0.05 159 ELISA 3.27 4 1.7 1 160 HPLC-FLD 0.2 0.06 2 76.7 0.03 0.1 161 LC-MS/MS <0.3 125 0.15 0.3 162 HPLC-FLD 0.22 0.04 2 77.5 0.25 0.5 163 HPLC-FLD 0.11 0.04 2 86 0.02 0.05 164 HPLC-FLD 0.21 0.08 2 74.6 0.02 0.08 165 HPLC-FLD 0.186 0.031 2 120 0.2 0.24 166 HPLC-FLD 0.26 0.05 2 97.4 0.2 0.4 167 LC-MS/MS 0.22 0.02 2.776 90.0 0.02 0.06 168 LC-MS/MS 0.193 0.058 2 78 0.02 0.06 169 HPLC-FLD 0.14 0.0174 2 105 0.05 0.1

43
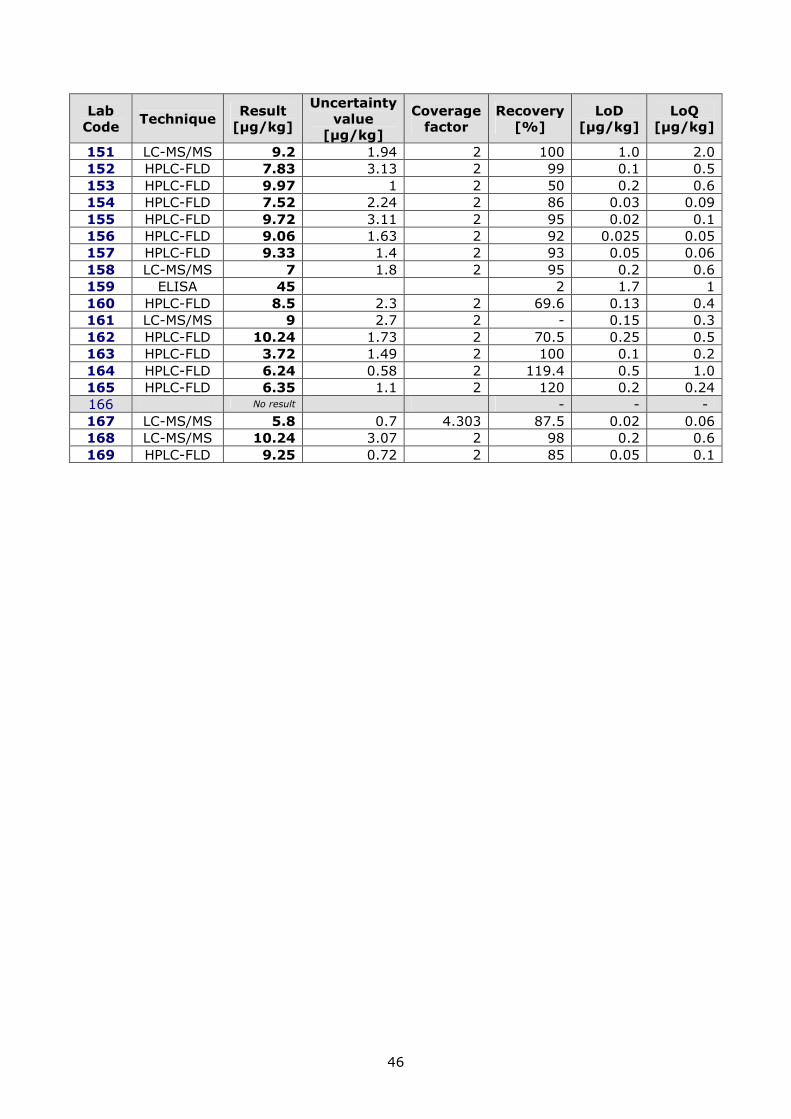
Table 19: Results and method performance characteristics (maize powder)
Lab
Code Technique
Result
[µg/kg]
Uncertainty
value
[µg/kg]
Coverage
factor
Recovery
[%]
LoD
[µg/kg]
LoQ
[µg/kg]
101 HPLC-FLD 3.4 92 0.1 0.3 103 HPLC-FLD 3.37 0,67 2 94.0 0.04 0.20 104 LC-MS/MS 2.2 1.1 2 100 0.5 1.0 105 LC-MS/MS 3.3 79 0.03 0.1 106 LC-MS/MS 2.3 2.1 2 80 0.5 1 107 HPLC-FLD 3.37 82 n.d. 0.8 108 HPLC-FLD 2.82 110 0.3 0.8 109 HPLC-FLD 2.52 0,2 2 94.2 0.07 0.50 110 HPLC-FLD 2.96 0,59 2 102.3 0.03 0.1 111 HPLC-FLD 3.3 0,73 2 82-109 0.001 0.1 112 HPLC-FLD 1.8 0,31 2 81 0.2 0.37 113 HPLC-FLD 2.689 0.54 2 93.28 0.1 0.25 114 HPLC-FLD 2.2 0,6 2 - - - 115 HPLC-FLD 2.74 0,44 2 82.6 0.17 0.2 116 HPLC-FLD 2.86 1,6 2 65.1 0.02 0.05 117 HPLC-FLD 0.18 22 1 90.5 0.10 0.10 118 LC-MS/MS 3.3 1,3 2 108 0.3 1 119 HPLC-FLD 3.68 1,47 2 107 0.3 0.3 120 LC-MS/MS 1.61 0,4 2 71 0.3 1.0 121 HPLC-FLD 2.5 0,75 3 98 0.03 0.1 122 HPLC-FLD 1.9 0,8 2 84 0.08 0.08 123 HPLC-FLD 3.1 20 107 0.07 0.2 124 HPLC-FLD 2.2 0,3 2 71 0.1 0.5 125 HPLC-FLD 0.165 0,029 2 - 0.15 0.5 126 HPLC-FLD 2.8 0,3 2 87 0.06 0.1 127 HPLC-FLD 4.2 0,4 91 0.02 0.05 128 HPLC-FLD <8 100 2.0 8.0 129 HPLC-FLD 1.704 0,392 2 88 0.1 0.1 130 HPLC-FLD 3 0.9 2 56 0.006 0.011 131 HPLC-FLD 2.3 0,3 2 105 0.2 0.5 132 HPLC-FLD 2.3 0,39 2 85 0.15 0.4 133 HPLC-FLD 0.5 0,1 2 83.9 0.2 0.4 134 HPLC-FLD 2.26 0,55 2 97 0.4 1 135 HPLC-FLD 2.84 0,6 2 93.7 0.1 0.3 136 HPLC-FLD 3 0,7 2 99.9 0.02 0.1 137 HPLC-FLD 3.2 0,3 2 80.9 0.2 0.6 138 HPLC-FLD 3.71 1,29 2 90.7 0.002 0.004 139 HPLC-FLD 2.61 0,78 2 92 0.1 0.2 140 HPLC-FLD 2.14 0,81 2 72.0 0.5 1.5 141 LC-MS/MS 2.13 0.43 2 75 0.3 0.5 142 HPLC-FLD 2.51 1.2 2 103 0.2 0.5 143 HPLC-FLD 4.32 0,57 2 89.3 - 0.03 144 HPLC-FLD 2.4 1,5 2 107 0.08 0.1 145 ELISA 8.7 82 0.5 - 146 HPLC-FLD 2.7 0,5 2 93.0 0.018 0.035 147 HPLC-FLD 2.9 0,9 2 85 0.09 0.2 148 HPLC-FLD 2.1 0,7 2 103 0.2 0.6 149 HPLC-FLD 2.28 1 2 87.5 0.007 0.1 150 HPLC-FLD 3.84 0,15 2 80 0.25 0.29

44
Lab
Code Technique
Result
[µg/kg]
Uncertainty
value
[µg/kg]
Coverage
factor
Recovery
[%]
LoD
[µg/kg]
LoQ
[µg/kg]
151 LC-MS/MS 3.13 0,66 2 100 1.0 2.0 152 HPLC-FLD 2.87 1.15 2 99 0.1 0.5 153 HPLC-FLD 3.23 0,37 2 50 0.2 0.6 154 HPLC-FLD 2.35 0,7 2 86 0.03 0.09 155 HPLC-FLD 2.91 0,93 2 96 0.02 0.1 156 HPLC-FLD 2.69 0,48 2 92 0.025 0.05 157 HPLC-FLD 2.99 0,45 2 93 0.05 0.06 158 LC-MS/MS 2.3 0,6 2 95 0.2 0.6 159 ELISA 44.77 1 1.7 1 160 HPLC-FLD 2.8 0,87 2 77.5 0.07 0.2 161 LC-MS/MS 1.1 0,3 2 - 0.15 0.3 162 HPLC-FLD 3.8 0,64 2 61.6 0.25 0.5 163 HPLC-FLD 2.04 0,82 2 71 0.1 0.2 164 HPLC-FLD 3.08 0,58 2 96.1 0.1 0.5 165 HPLC-FLD 2.28 0,396 2 120 0.2 0.24 166 HPLC-FLD 2.97 0,5 2 97.7 0.025 0.05 167 LC-MS/MS 2.4 0,3 4,303 71.0 0.02 0.06 168 LC-MS/MS 3.12 0,936 2 98 0.2 0.6 169 HPLC-FLD 2.56 0,2 2 83.4 0.05 0.1

45
Table 20: Results and method performance characteristics (animal feed)
Lab
Code Technique
Result
[µg/kg]
Uncertainty
value
[µg/kg]
Coverage
factor
Recovery
[%]
LoD
[µg/kg]
LoQ
[µg/kg]
101 HPLC-FLD 9.3 92 0.1 0.3 103 HPLC-FLD 9.05 1.36 2 103.0 0.04 0.20 104 No result - - - 105 LC-MS/MS 10.9 76 0.03 0.1 106 LC-MS/MS 7.5 6.9 2 80 0.5 1 107 HPLC-FLD 8.7 3.4 2 109.45 n.a. >0.5 108 HPLC-FLD 8.03 105.5 0.3 0.8 109 HPLC-FLD 10.5 1.6 2 108.6 0.071 0.25 110 HPLC-FLD 9.56 0.19 2 102.2 0.03 0.1 111 HPLC-FLD 10.6 2.33 2 82-109 0.001 0.1 112 HPLC-FLD 5.7 0.69 2 81 0.2 1.4 113 HPLC-FLD 9.981 2.0 2 88.29 0.1 0.25 114 HPLC-FLD 6 1.5 2 86 0.5 2.0 115 HPLC-FLD 9.31 1.49 2 82.6 0.17 0.2 116 HPLC-FLD 11.1 4.9 2 70.9 0.02 0.05 117 HPLC-FLD 7.8 22 1 91.3 0.10 0.10 118 LC-MS/MS 9.2 3.7 2 118 0.3 1 119 HPLC-FLD 9.12 3.65 2 107 0.3 0.3 120 LC-MS/MS 5.61 1.4 2 73 0.3 1.0 121 HPLC-FLD 8.6 2.6 3 98 0.03 0.1 122 HPLC-FLD 7.8 3.4 2 84 0.2 0.2 123 HPLC-FLD 10 15 103 0.07 0.2 124 HPLC-FLD 8.7 1.9 2 89 0.1 0.2 125 HPLC-FLD 9.04 1.57 2 - 0.15 0.5 126 HPLC-FLD 8.3 1 2 87 0.06 0.1 127 No result - - - 128 HPLC-FLD 9 0.7 2,31 101 0.5 2.0 129 HPLC-FLD 5.597 1.287 2 88 0.1 0.1 130 No result - - - 131 HPLC-FLD 7.2 1.1 2 105 0.5 1 132 HPLC-FLD 7.4 1.3 2 85 0.15 0.4 133 HPLC-FLD 7.5 1 2 84.0 0.2 0.4 134 HPLC-FLD 8.12 1.8 2 94 0.4 1 135 HPLC-FLD 8.24 1.6 2 96.1 0.1 0.3 136 HPLC-FLD 10.2 2.2 2 97.2 0.02 0.1 137 HPLC-FLD 11.3 2.3 2 80.9 0.2 0.6 138 HPLC-FLD 11.83 3.45 2 93.1 0.002 0.004 139 No result - - - 140 HPLC-FLD 8.1 3.1 2 72.0 0.5 1.5 141 LC-MS/MS 7.46 1.52 2 75 0.3 0.5 142 HPLC-FLD 8.91 4.2 2 103 0.2 0.5 143 HPLC-FLD 17.24 2.28 2 71.0 - 0.03 144 HPLC-FLD 8.2 5.2 2 93 0.08 0.1 145 ELISA 7.02 82 0.5 - 146 HPLC-FLD 8.3 1.7 2 93.0 0.018 0.035 147 HPLC-FLD 8.3 2.6 2 85 0.09 0.2 148 HPLC-FLD 10 3 2 89 0.1 1 149 No result - - - 150 HPLC-FLD 11.04 1.32 2 76 0.25 0.29
46
Lab
Code Technique
Result
[µg/kg]
Uncertainty
value
[µg/kg]
Coverage
factor
Recovery
[%]
LoD
[µg/kg]
LoQ
[µg/kg]
151 LC-MS/MS 9.2 1.94 2 100 1.0 2.0 152 HPLC-FLD 7.83 3.13 2 99 0.1 0.5 153 HPLC-FLD 9.97 1 2 50 0.2 0.6 154 HPLC-FLD 7.52 2.24 2 86 0.03 0.09 155 HPLC-FLD 9.72 3.11 2 95 0.02 0.1 156 HPLC-FLD 9.06 1.63 2 92 0.025 0.05 157 HPLC-FLD 9.33 1.4 2 93 0.05 0.06 158 LC-MS/MS 7 1.8 2 95 0.2 0.6 159 ELISA 45 2 1.7 1 160 HPLC-FLD 8.5 2.3 2 69.6 0.13 0.4 161 LC-MS/MS 9 2.7 2 - 0.15 0.3 162 HPLC-FLD 10.24 1.73 2 70.5 0.25 0.5 163 HPLC-FLD 3.72 1.49 2 100 0.1 0.2 164 HPLC-FLD 6.24 0.58 2 119.4 0.5 1.0 165 HPLC-FLD 6.35 1.1 2 120 0.2 0.24 166 No result - - - 167 LC-MS/MS 5.8 0.7 4.303 87.5 0.02 0.06 168 LC-MS/MS 10.24 3.07 2 98 0.2 0.6 169 HPLC-FLD 9.25 0.72 2 85 0.05 0.1

47
Table 21: Number of samples analysed by laboratories per year for aflatoxin B1
Number of samples per year Lab Code
< 50 50 – 250 251 – 1000 1000 <
101 X 103 X
104 X 105 X 106 X 107 X 108 X 109 X
110 X 111 X 112 X 113 X 114 X
115 X 116 X 117 X 118 X 119 X
120 X 121 X 122 X 123 X 124 X 125 X
126 X 127 X 128 X 129 X 130 X
131 X 132 X 133 X 134 X 135 X
136 X 137 X 138 X 139 X 140 X 141 X
142 X 143 X 144 X 145 X 146 X
147 X 148 X 149 X 150 X 151 X
152 X 153 X 154 X 155 X 156 X
157 X 158 X 159 X 160 X 161 X 162 X
163 X

48
Number of samples per year Lab Code
< 50 50 – 250 251 – 1000 1000 <
164 X 165 X
166 X 167 X 168 X 169 X

49
Table 22: Matrices analysed on routine basis, accreditation
Lab Code
Which food or feed matrices does your laboratory
analyse for aflatoxin B1 on a routine basis the most?
Are you accredited for the determination of
aflatoxin B1?
If YES, please specify the scope exactly how it is mentioned in your accreditation
101 maize, corn gluten, soya No
103 pig feed, poultry feed, soy been etc. Yes Determination of total aflatoxins (B1, B2, G1, G2) in feeding stuffs and foodstuffs by HPLC method
104 all kinds of nuts and spices Yes Mycotoxins in food
105 cereals - barley Yes Aflatoxins B1, B2, G1, G2 in cereals by UPLC-MS/MS
106 wheat – flour - barley Yes
RES44 nivalenol, 3-Ac DON, aflaB1,aflaB2,aflaG1,aflaG2,fumonisinB1,HT2,T2, zearalenone, aochratoxinA,cytohalasinE for cereals and cereal products/dried fruit/nuts/babyfood with UPLC-MS/MS
107 maize; complete animal feed various matrices based
Yes
Aflatoxin B1 in animal feed by HPLC-FLD - UNI EN ISO 17375:2006 at concentration in the sample > 0.5 ug/kg// Aflatoxin B1 in raw materials for livestock by HPLC-FLD in the range 0.010-0.030 ug/kg // Method not accredited, used for maize powder: Aflatoxin B1+B2+G1+G2 in cereals based food by HPLC-FLD in the range 0.4-4 ug/kg for aflatoxin B1
108 feed and feedstuffs matrices No
109 nuts Yes Mycotoxins in foodstuffs by HPLC-FL/UV
110 hazelnuts Yes nuts, spice, cereal
111 peanuts, animal feeds Yes
Determination of aflatoxins B1, B2, G1 and G2 in foods such as peanut butter, pistachio paste, fig paste and paprika powder and for the determination of aflatoxin B1 in baby food adn animal feeding stuffs.
112 complementary and complete feedingstuffs, maize, food (no baby food)
Yes Aflatoxin B1
113 animal feed, nuts, nut products Yes Aflatoxins B1 B2 G1 G2 in animal feeding stuffs, nuts & nut products using immunoaffinity column/HPLC/fluorescence detector
114 feed, peanuts No
115 cereals, nuts, spices Yes
Aflatoxins B1, B2, G1, G2 and Total Aflatoxins in following ranges: Seeds: Cereals: nut products: dried fruit and dried fruit products: 0.2 - 20(µg/kg), Shelled nuts: 0.2 - 25 (µg/kg), Nuts and groundnuts in shell: 0.2 - 40 (µg/kg), Spices: 0.2 - 30 (µg/kg), aflatoxin B1 in Babyfood: 0.05 - 20 (µg/kg)
116 food matrices - nuts, peanuts, dried fruit, spices, cereals, baby food
Yes Aflatoxin B1+B2+G1+G2 in nuts, peanuts, cocoa, coffee, dried fruit, spices, cereals, baby food by HPLC-FLD
117 peanuts, spices and vegetable oils Yes
Bepalen van het gehalte aan aflatoxine B1, B2, G1 en G2; ImmunoAffiniteit clean-up en detectie mbv HPLC en Fluorescentie detectie. Scope noten, kopra, vijgen, pindakaas, specerijen, kruiden, plantaardige olien, mengvoeders en diervoeders
118 cereals No
119 feed, nuts Yes
The determination of aflatoxins B1, G1, B2, G2 in nuts, nut products, pulses, cereal products, spices and animal feeding stuufs by immunoaffinity column separation and HPLC
120 cereals, animal feeds Yes Aflatoxins in feed by LC-MS/MS
121 hazelnuts cocoa nuts Yes aflatoxin in food
122 nuts, dried fruit, cereals powder Yes Aflatoxin B1, B2, G1, G2 and sum in food
123 animal feed, human food , Yes aflatoxin B1+B2+G1+G2 in animal feed and human food
124 dried fruit and nuts No
125 cereal feeds, nuts, spices No
126 nuts, spices, rice Yes The Determination of Aflatoxins in Food and Feeding Stuffs by Immunoaffinity Column and High Performance Liquid Chromatography
127 spices, cereals, peanuts Yes C-P 215 Aflatoxine B & G und Ochratoxin A über IAC mittels HPLC und Nachsäulenderivatisiering (Coring-Zelle)
128 maize, bovine feed, chicken feed Yes Aflatoxin B1 in animal feed by HPLC-FLD and IAC VICAM AOZ in the range 0.0020 - 0.040 mg/Kg

50
Lab Code
Which food or feed matrices does your laboratory
analyse for aflatoxin B1 on a routine basis the most?
Are you accredited for the determination of
aflatoxin B1?
If YES, please specify the scope exactly how it is mentioned in your accreditation
129 animal feed Yes Aflatoxin B1 in animal feed in the range 0.1 -20 µg/kg
130 we do not analyse on routine basis Yes Aflatoxin B1+B2+G1+G2 in figs, peanutbutter, pistachio and other nuts by RPLC-FLD
131 nuts, animal feed Yes Aflatoxin B1 in feed and babyfood, aflatoxin B1, B2, G1, G2 in cereals, nuts and derived products
132 cereals, nuts, dried fruits and their products
Yes Determination of Aflatoxins (B1,B2,G1,G2) in nuts,dried fruits,cereals and their products by HPLC-FLD
133 peanuts, almonds, dried figs Yes peanuts,fruits,cereals,maize,seasonings by HPLC:Aflatoxin B1+G1 in the range of 0.4-180 µg/kg;AflatoxinB2+G2 in the range of 0.2-45 µg/kg
134 animal feed No
135 peanut, baby food Yes Aflatoxin B1,B2,G1,G2 in in food of plant origin by HPLC
136 nuts, rice, dried fruit Yes Aflatoxin B1, B2, G1 and G2 in food, 0,1-120 µg/kg, HPLC-fluorescence
137 nuts, cereals, dried fruits Yes Determination of aflatoxins B1, B2, G1, G2 in nuts, dried fruits and cereals
138 peanuts pistachios rice Yes aflatoxins B1 B2 G1 G2 in nuts, ground nuts, spices and cereals by HPLC-FLD
139 nuts, almonds, nut-cereal-products Yes Sum of aflatoxins B1, B2, G1 and G2 in food
140 animal feeds, spices, nuts Yes
Aflatoxins G1,G2,B1,B2 in animal feeds, cereals, dried fruit, spices and herbs using Rhone Diagnostics Easi Extract columns and HPLC with detection by Kobra
141 baby food, food for human use Yes Aflatoxin B1+B2+G1+G2 in food for human use and B1 in baby food
142 animal feeds & compound animal feedstuffs
Yes Aflatoxin B1 in straight & compound animal feedstuffs by RP HPLC-FLD in the range of 0.5-50µg/kg
143 paprika, chili, nutmeg No
144 maize Yes Aflatoxins B and G in food by IAC/HPLC-FLD
145 feed for dairy cows and cereals Yes Aflatoxin B1 in food and cereals
146 nuts, animal feed, spices Yes
Aflatoxin B1 - Aflatoxins B1,B2,G1 and G2 in Feed and feedstuffs (incl. nuts and spices) - Own method (performance characteristics of regulation (EC) 2006/401) - HPLC after immuno-affinity clean-up
147 baby food, cereal, animal feed Yes Aflatoxins B1, B2, G1 + G2 using automated immunoaffinity column clean up & HPLC with post column derivatisation
148 oilseeds, cereals for food an feed, spices
Yes Aflatoxin in animals feed, extraction/cleaning by solvant and SPE, ISO 14718
149 peanut, hazelnut, rice Yes
METHOD N.1 : Determination of aflatoxin B1 and the sum of aflatoxin B1,B2,G1 and G2 in hazelnuts, peanuts, pistachios, figs and paprika powder. METHOD N.2 : Determination of total aflatoxins (B1,B2,G1,B2) with HPLC.
150 food Yes Food and animal feed. Aflatoxin B1,B2,G1,G2 by HPLC-FLD using IAC clean-up.
151 feed and feed ingredients in the broadest thinkable range
Yes Aflatoxin B1 in Feed & Feed Ingredients (as part of a multimycotoxin method)
152 mixed animal feed, nuts, rice Yes Food/animal feed-Analyse of Aflatoxin B1, B2, G1 and G2 in cereals, cereal products, nuts etc., spices, oils and meat
153 feed, animal liver, eggs Yes Aflatoxin B1 in feed and feed material by HPLC-FLD, 0.2-7.5 ug/kg
154 nut products, spices Yes Aflatoxin B1,B2,G1,G2 in Food and Animal Feeding Stuffs
155 nuts, feed materials, figs Yes Aflatoxins in food (except baby food), feed materials and compound feed
156 cereals, animal feed, liver Yes Aflatoxin B1+B2+G1+G2 in food and feed
157 pistachios, animal feed, maize Yes Aflatoxin B1 in maize (0.06-17.57ug/kg) and animal feed (0.51-21.07ug/kg); Aflatoxin B1,B2,G1,G2 in peanut butter and pistachios
158 cereals, dried fruit, nuts Yes
Aflatoxin B1+B2+G1+G2 in cereals, dried fruit by UPLC-MS/MS in the range 0.6,1.2,0.9,1.2-9 µg/kg ; Aflatoxin B1+B2+G1+G2 in nuts by UPLC-MS/MS in the range 0.3-9 µg/kg.

51
Lab Code
Which food or feed matrices does your laboratory
analyse for aflatoxin B1 on a routine basis the most?
Are you accredited for the determination of
aflatoxin B1?
If YES, please specify the scope exactly how it is mentioned in your accreditation
159 only feed No
160 cereals, premixes, Yes Aflatoxin B1 and Aflatoxin B1+B2+G1+G2 in cereals, nuts, spices, dried fruits and vegetables, dried figs, cocoa, cocoa products, cereals products, feedstuff
161 wheat, flour, malt No
162 compound animal feeds Yes Aflatoxins B1,B2,G1,G2 in Animal Feeds and Foods, General
163 nuts, feed, grain Yes Aflatoxins in vegetal origin food products and feedstuff by HPLC-FLD
164 nuts, spices, cereals based feeds Yes Aflatoxins in food, Aflatoxin B1 in feed
165 cereals Yes Aflatoxin B1 and Aflatoxin B1+B2+G1+G2 in nonanimal products By HPLC-FLD
166 herbs Yes mycotoxins in food by HPLC
167 baby food No
168 cereal, feed No
169 animal feed, fish meat; spices Yes Afl B1 in feed SR EN ISO 17375:2006; Afl B1 and sum of B1, B2, G1, G2 in food SR EN 16050/2007; SR EN 14123/2008

52
Table 23: Spectrophotometric analysis I.
Lab Code What is the brand and model of your UV-
spectrophotometer?
Do you normally check your calibrants by UV-
spectrophotometry?
At which wavelength did you identify the maximum for aflatoxin B1 (nm)?
101 Shimadzu UV-1700 Pharma Spec No 347.3
103 Thermo Electron Corp, Nicolet Evolution 300 No 348.3
104 Perkin-Elmer, Lambda Bio Yes 366
105 not applied No
106 - Yes
107 not tested. No
108 Hitachi U-2000 spectrophotometer Yes 363
109 SHIMADZU UV-160 Yes 348
110 - No
111 Cary UV300 No 349
112 Perkin Elmer Lambda BIO20 No 348
113 Varian Cary 50 Bio No 347.6
114 Thermo Spectronic HeliosB No 348
115 Shimadzu, UV-Vis 2450 Yes 348
116 Analytic Jena, Specord 210 Yes 348
117 Thermo Yes 360
118 Thermo Scientific Genesys 6 No 348
119 Unicam alpha helios No 349
120 VARIAN CARY 50 Win UV Yes 358 and 349
121 We do not have a UV-spectrophotometer No
122 Shimadzu UV 2401PC No 348
123 perkin elmer - lamda 12 Yes 360
124 GBC UV/VIS 911A Yes 348
125 Thermo Unicam Helios alpha No 360
126 Thermo Evolution 100 Yes 348
127 VARIAN Cary 3 Yes 349
128 n.a. No
129 UV/VIS Lamba 12 Yes 355
130 Perkin-Elmer Lambda 10 Yes 347
131 Unicam UV/Vis Spectrometer 2 No 348
132 UV-1700, Pharma Spec, Shimadzu Yes 347.2
133 - No
134 ThermoSpectronic Helios Epsilon 9423UUE1000E No 365
135 Beckman Yes 347
136 Unicam UV2-100 Yes 348
137 Shimadzu UV-1700 Pharma Spec No 347.7
138 Perkin Elmer lambda 400 No 348
139 Varian Cary 1E UV-VIS Yes 348
140 Varian Cary 50 Solascreen No 349.5

53
Lab Code What is the brand and model of your UV-
spectrophotometer?
Do you normally check your calibrants by UV-
spectrophotometry?
At which wavelength did you identify the maximum for aflatoxin B1 (nm)?
141 -- No
142 Brand: PerkinElmer, Model: Lambada 35 UV/Vis spectrophotometer No 347.4
143 Perkin-Elmer Lambda 25 Yes 348
144 Thermo Spectronic UV 500 Yes 350
145 - No
146 SHIMADZU UV 1601 Yes 348.2
147 Hitachi U2000 Yes 348.2
148 SHIMADZU UV-1800 Yes 348.3
149 Perkin Elmer UV/VIS Spectrometer Lambda 2 No 347.8
150 Perkin Elmer Lambda 25 No 348
151 Hitachi No 346.96
152 Shimadzu UV-1602 No 348
153 Beckman DU-62 No 350
154 Varian, Cary 300 Yes 348
155 Ultrospec 2100 pro Yes 348
156 Cecil CE7400 No 347.8
157 BECKMAN - DU 640 No 365
158 Shimadzu UV-160 A No 349.5
159 lary 50 Scan (Varian) No 350
160 Agilent 8453 Yes 348
161 It isn't realized by technical problems No
162 Cecil CE1021 No 349.3
163 PerkinElmer Lambda 35 UV/VIS No 347
164 Shimadzu UV-1700 Yes 348
165 GBC, Cintra 10e No 346
166 Hitachi U1800 Yes 348
167 SHIMADZU UV-1601 No 348.2
168 JASCO V530 No 347.3
169 GBC CINTRA-10 No 330-400
54
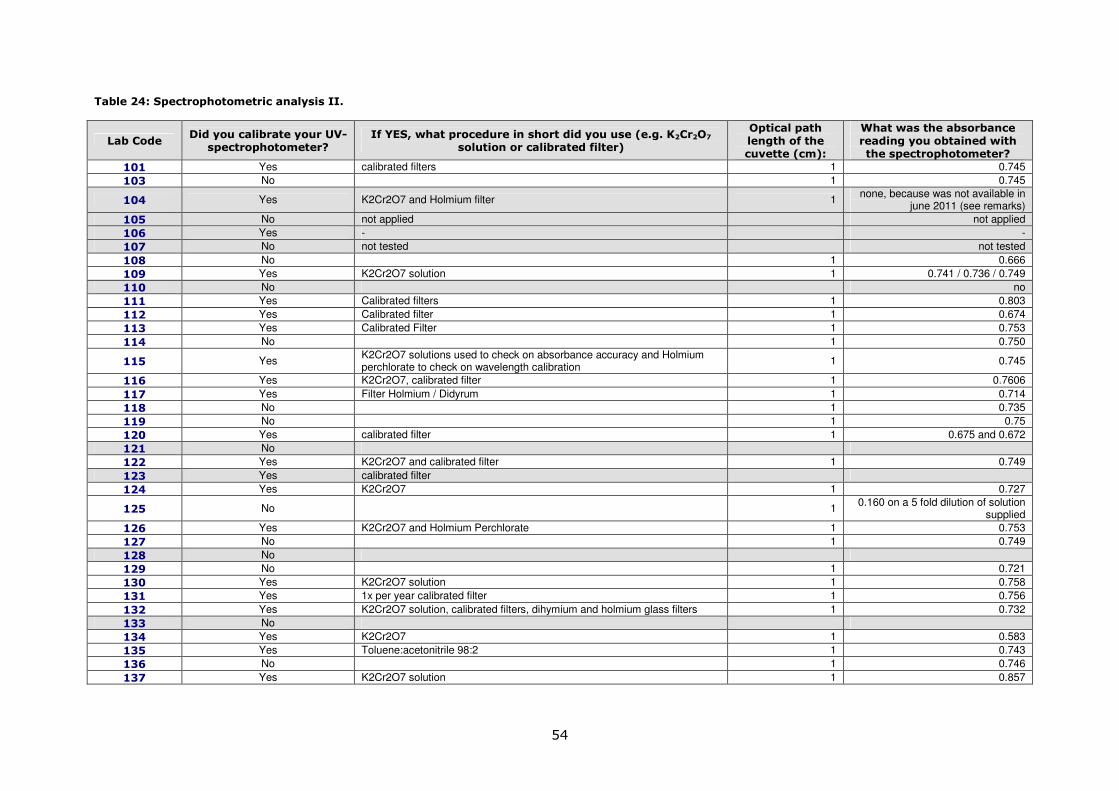
Table 24: Spectrophotometric analysis II.
Lab Code Did you calibrate your UV-
spectrophotometer? If YES, what procedure in short did you use (e.g. K2Cr2O7
solution or calibrated filter)
Optical path length of the cuvette (cm):
What was the absorbance reading you obtained with the spectrophotometer?
101 Yes calibrated filters 1 0.745
103 No 1 0.745
104 Yes K2Cr2O7 and Holmium filter 1 none, because was not available in
june 2011 (see remarks)
105 No not applied not applied
106 Yes - -
107 No not tested not tested
108 No 1 0.666
109 Yes K2Cr2O7 solution 1 0.741 / 0.736 / 0.749
110 No no
111 Yes Calibrated filters 1 0.803
112 Yes Calibrated filter 1 0.674
113 Yes Calibrated Filter 1 0.753
114 No 1 0.750
115 Yes K2Cr2O7 solutions used to check on absorbance accuracy and Holmium perchlorate to check on wavelength calibration
1 0.745
116 Yes K2Cr2O7, calibrated filter 1 0.7606
117 Yes Filter Holmium / Didyrum 1 0.714
118 No 1 0.735
119 No 1 0.75
120 Yes calibrated filter 1 0.675 and 0.672
121 No
122 Yes K2Cr2O7 and calibrated filter 1 0.749
123 Yes calibrated filter
124 Yes K2Cr2O7 1 0.727
125 No 1 0.160 on a 5 fold dilution of solution
supplied
126 Yes K2Cr2O7 and Holmium Perchlorate 1 0.753
127 No 1 0.749
128 No
129 No 1 0.721
130 Yes K2Cr2O7 solution 1 0.758
131 Yes 1x per year calibrated filter 1 0.756
132 Yes K2Cr2O7 solution, calibrated filters, dihymium and holmium glass filters 1 0.732
133 No
134 Yes K2Cr2O7 1 0.583
135 Yes Toluene:acetonitrile 98:2 1 0.743
136 No 1 0.746
137 Yes K2Cr2O7 solution 1 0.857

55
Lab Code Did you calibrate your UV-
spectrophotometer? If YES, what procedure in short did you use (e.g. K2Cr2O7
solution or calibrated filter)
Optical path length of the cuvette (cm):
What was the absorbance reading you obtained with the spectrophotometer?
138 Yes calibrated filter (Holmium oxyde) 1 0.7315
139 No 1 0.733
140 Yes K2Cr2O7 1 0.7439
141 No -- --
142 No 1 0.7983
143 Yes Calibrated filter (14-02-2011) 1 0.7279
144 Yes K2Cr2O7 1 0.738
145 No - -
146 Yes calibrated filter 1 0.7402
147 Yes K2Cr2O7 + Calibrated Filters 1 0.73
148 Yes Aqueous solutions Co Ni Ref NIST SRM931g-LGC Pr, holmium oxyde 4% in HCLO4 10% Ref RM-HL n° 11989
1 0.718
149 No 1 0.76
150 No 1 0.76722
151 No 1 0.759
152 No 1 0.73
153 No 1 0.146
154 Yes calibrated filter 1 0.748
155 Yes Calibrated regularly by a service company 1 0.744
156 No 1 0.746
157 Yes K2Cr2O7 solution 1 0.6371 (mean value)
158 Yes calibrated filter 1 0.792
159 No 1 0.851
160 Yes K2Cr2O7 solution 1 0.748538
161 Yes K2Cr2O7 1 x
162 Yes Calibrated Dimydium and Holmium filters 1 0.723
163 Yes K2Cr2O7 1 0.7546; 0.7574; 0.7596; 0.7616
164 Yes calibrated filters (checked each year by eichamt) 1 0.74
165 No 1 0.9116
166 No 1 0.731
167 No 1 0.723
168 Yes calibration glass filter 1 0.78432
169 No 1 0.1361
56
Table 25: Recovery estimate, overnight stop
Lab Code
How did you perform the
recovery estimate?
If other please specify!
What was the solvent
composition of the spiking solution?
During the analysis did you need to include any over night
stop?
If YES, please state for which samples and at what stage of the analysis.
101 Standard solution to Blank
methanol No
103 Standard solution to Blank
methanol No
104 Standard solution to Blank
methanol No
105 Standard solution to Blank
acetonitrile No
106 other C13-labelled internal standards
methanol No
107 other
Animal feed: recovery from official method. // Maize powder: recovery from daily analysis of standard solution added to blank matrices
methanol No
108 Internal Standard to Sample
toluene-acetonitrile (98:2)
No
109 Standard solution to Blank
benzene / acetonitrile (98:2)
No
110 Internal Standard to Sample
acetonitrile No
111 Internal Standard to Sample
methanol Yes All samples prior to immuno-affinity column cleanup
112 Standard solution to Blank
benzene, acetonitrile 98:2
No
113 other
Standard solution to sample for maize & animal feed. Standard solution to blank for baby food
50% methanol Yes Spike sample overnight at 4°C
114 Standard solution to Blank
Methanol No
115 other
Blank matrix spiked with analyte and analysed using entire method.
methanol Yes
With the Maize and Animal feed. Extracts stored in freezer overnight.
116 Standard solution to Blank
water/methanol /acetonitrile (56:22:22)
Yes all samples, between extraction and clean-up
117 Standard solution to Blank
methanol No
118 Internal Standard to Extract
acetonitrile Yes
Sample (matrix) is spiked rougly 24 hours before extraction to ensure the analyte has properly entered the sample matrix
119 Standard solution to Blank
25% methanol, 75% acetonitrile
No
120 other IS to immunoaffinity columns
toluene No
121 Standard solution to Blank
methanol No
122 Standard solution to Blank
methanol, H2O Yes just before hplc injection
123 Standard solution to Blank
methanol/H2O No
124 other Sample material spiked with a known standard solution
methanol No
125 other Standard addition to methanol/water (1:1) No

57
Lab Code
How did you perform the
recovery estimate?
If other please specify!
What was the solvent
composition of the spiking solution?
During the analysis did you need to include any over night
stop?
If YES, please state for which samples and at what stage of the analysis.
portion of sample
126 Standard solution to Blank
methanol No
127 Standard solution to Blank
toluene No
128 other ERM-376 No
129 Standard solution to Blank
chloroform No
130 Standard solution to Blank
toluene : acetonitrile = 98:2
Yes WE did stop after IAC elution and before HPLC/FLD
131 Standard solution to Blank
acetonitrile No
132 Standard solution to Blank
toluene: acetonitrile No
133 Standard solution to Blank
methanol, water No
134 Standard solution to Blank
acetonitrile No
135 Standard solution to Blank
acetonitrile No
136 other
Baby Food, Maize std to blank sample, Animal Feed std to EURL-contam. sample
benzene:acetonitrile 98:2
Yes
Clean-up 1 day eluates frozen, HPLC analysis next day
137 Standard solution to Blank
[methanol - (benzene 98/acetonitrile 2)]=[87.15-12.85]
No
138 other standard solution to sample
methanol/water 50/50% V/V
Yes after IAC purification
139 Standard solution to Blank
methanol-water No
140 Internal Standard to Sample
methanol No
141 Standard solution to Blank
methanol-water No
142 other
result obtained from a known concentration spiked blank sample
methanol No
143 Internal Standard to Extract
methanol Yes For all samples
144 Standard solution to Blank
methanol No
145 Internal Standard to Sample
methanol No
146 Standard solution to Blank
methanol No
147 Standard solution to Blank
acetonitrile No
148 Standard solution to Blank
chloroform No
149 Standard solution to Blank
methanol No
150 Standard solution to Blank
acetonitrile Yes after evaporation
151 other
Check versus assigned value of Fapas CRM (baby food); Standard addition procedure for maize powder & animal feed (maize-based)
methanol/water No Samples were analysed overnight
152 Standard solution to Blank
acetonitrile No
153 Standard solution to methanol:water No

58
Lab Code
How did you perform the
recovery estimate?
If other please specify!
What was the solvent
composition of the spiking solution?
During the analysis did you need to include any over night
stop?
If YES, please state for which samples and at what stage of the analysis.
Blank (1+1)
154 Standard solution to Blank
methanol No
155 Internal Standard to Sample
methanol No
156 other standard solution spike to matrix
methanol No
157 Standard solution to Blank
No
158 Standard solution to Blank
acetonitrile Yes Baby Food, between extraction and purification
159 Internal Standard to Sample
No
160 Standard solution to Blank
toluene No
161 Standard solution to Blank
acetonitrile No
162 other Standard solution to sample
methanol No
163 Standard solution to Blank
methanol Yes
For all samples one day sample preparation and the second day HPLC analysis
164 Standard solution to Blank
acetonitrile No
165 Standard solution to Blank
acetonitrile No
166 Standard solution to Blank
methanol No
167 Standard solution to Blank
methanol No
168 Standard solution to Blank
acetonitrile No
169 Internal Standard to Sample
acetonitrile Yes
All samples were left at the room temperature till next day for defrosting

59
Table 26: Extraction mode
Lab Code
What was the extraction solvent used?
What was the extraction mode (e.g. blending or
shaking)?
What was the extraction time?
What was the extraction solvent to sample ratio
used during extraction (in ml/g)?
Were any extraction aids
added?
If YES, please state what and in which quantity.
101 85:15 acetone:water shaking 30mins 1:5 No
103 acetone/water shaking 60 min 5ml / 1g No
104 acetonitrile-water (80-20) shaking 120 min maize powder 4 ml/g, babyfood 4
ml/g Yes
for babyfood 0.3 g NaHCO3 per 25 g
sample
105 methanol, water shaking 60 min 25/5 Yes NaCl, 0.4g
106 methanol-water ultra-turrax 15 minutes 60/10 Yes defatting with hexane
107 animal feed: acetone/water, 85/15%
v/v. // maize powder: methanol/water, 70/30% v/v
Animal feed: magnetic stirrer. // Maize powder:
Ultra-turrax
Animal feed: 30 min. // Maize powder: 3
min
Animal feed: 1:5. // Maize powder: 1:5
Yes Maize powder: NaCl,
10g
108 pure acetone and HPLC grade water
(85:15) shaking 30 minutes 5 ml/g for all materials No
109 methanol / water (70:30) for babyfood and maize. dichloromethane for feed
blending 2 minutes 5 Yes Na Cl 1 g for babyfood
and maize, Celite 6.25 g for feed
110 methanol/water (80/20) blending 3 minutes 10 ml/g No
111 maize and animal feed 85:15
acetone/water. baby food 80:20 methanol/water
shaking 30 minutes 5 Yes Only for baby food 5
grams sodium chloride
112 methanol-water 80:20 shaking 10 min 4 ml/g No
113 70% methanol blending 1 minute Baby food 50/10 Animal feed &
maize 50/5 Yes NaCl 5g
114 methanol:H2O (60:40) shaking 30 min
Sample 5 grams:extraction solvent 25 ml. Final ratio was
5g/50ml liquid, because 25 ml of water was added before filtering.
Yes 0,4 gram
115 80:20 methanol : water shaking 30 minutes 6 Yes
50ml Cyclohexane for Maize and Animal feed samples, 2.5g NaCL in
all samples.
116 80 % methanol blending (ultra-turrax) 3 min 5:1 Yes NaCl - 5 g
117 methanol / water blending 3 min. 150 ml solvent / 15g sample Yes NaCl 0.5g
118
Step1: 49% ACN / 50 % H2O / 1% HaC | Step2 (additive): 99% ACN / 1% HaC
= (final ACN: 79%) shaking 2 times 60 minutes
Step1: 1 g sample + 3.35 ml 49% ACN / 50 % H20 / 1% HaC | Step 2: + 4.65 ml 99% ACN / 1% HaC final = 1 g sample + 8 ml solvent
Yes NaCl : 1 g sample + 0.2
g NaCl
119 60% acetonitrile 40% water blending 2 minutes 6.25 for 12 gram sample weight. 12.5 for 5 gram sample weight.
No
120 methanol:water 60:40 shaking, ultrasonic 70 min baby food, maize 3.3 ml/g ,
animal feed 5 ml/g Yes 1.5 g
121 methanol, water shaking 30 min 10 Yes NaCl, 5g
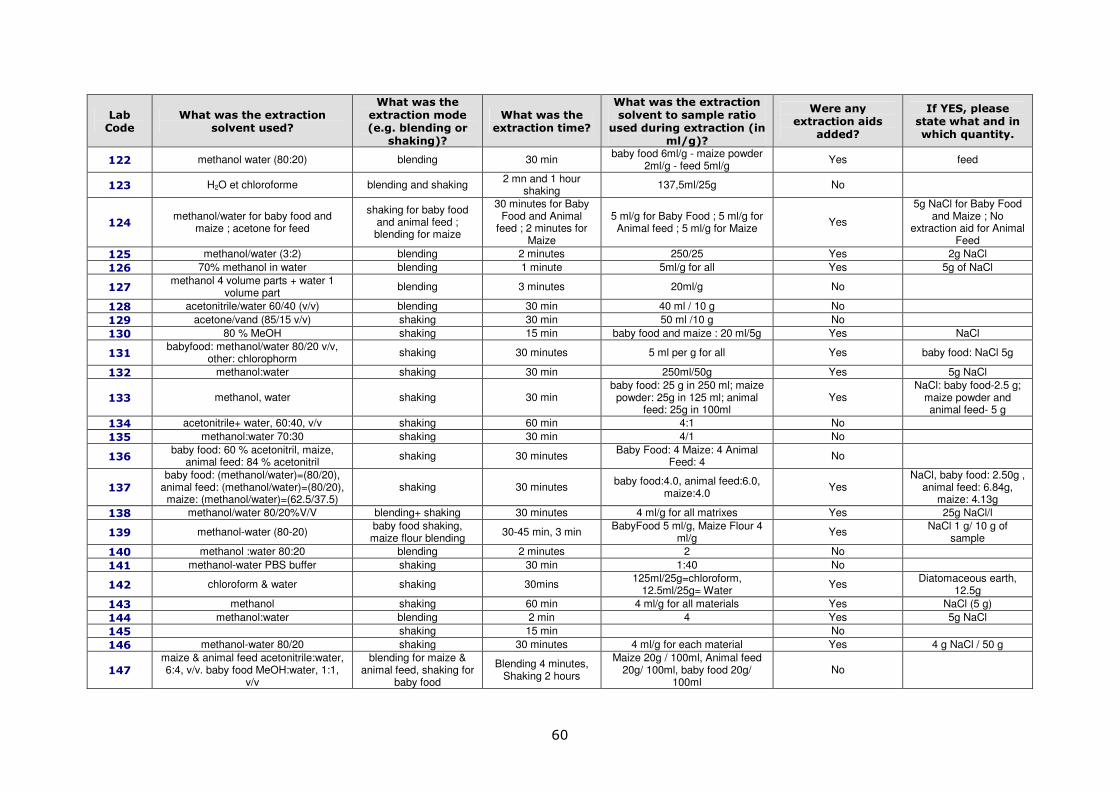
60
Lab Code
What was the extraction solvent used?
What was the extraction mode (e.g. blending or
shaking)?
What was the extraction time?
What was the extraction solvent to sample ratio
used during extraction (in ml/g)?
Were any extraction aids
added?
If YES, please state what and in which quantity.
122 methanol water (80:20) blending 30 min baby food 6ml/g - maize powder
2ml/g - feed 5ml/g Yes feed
123 H2O et chloroforme blending and shaking 2 mn and 1 hour
shaking 137,5ml/25g No
124 methanol/water for baby food and
maize ; acetone for feed
shaking for baby food and animal feed ; blending for maize
30 minutes for Baby Food and Animal
feed ; 2 minutes for Maize
5 ml/g for Baby Food ; 5 ml/g for Animal feed ; 5 ml/g for Maize
Yes
5g NaCl for Baby Food and Maize ; No
extraction aid for Animal Feed
125 methanol/water (3:2) blending 2 minutes 250/25 Yes 2g NaCl
126 70% methanol in water blending 1 minute 5ml/g for all Yes 5g of NaCl
127 methanol 4 volume parts + water 1
volume part blending 3 minutes 20ml/g No
128 acetonitrile/water 60/40 (v/v) blending 30 min 40 ml / 10 g No
129 acetone/vand (85/15 v/v) shaking 30 min 50 ml /10 g No
130 80 % MeOH shaking 15 min baby food and maize : 20 ml/5g Yes NaCl
131 babyfood: methanol/water 80/20 v/v,
other: chlorophorm shaking 30 minutes 5 ml per g for all Yes baby food: NaCl 5g
132 methanol:water shaking 30 min 250ml/50g Yes 5g NaCl
133 methanol, water shaking 30 min baby food: 25 g in 250 ml; maize powder: 25g in 125 ml; animal
feed: 25g in 100ml Yes
NaCl: baby food-2.5 g; maize powder and animal feed- 5 g
134 acetonitrile+ water, 60:40, v/v shaking 60 min 4:1 No
135 methanol:water 70:30 shaking 30 min 4/1 No
136 baby food: 60 % acetonitril, maize,
animal feed: 84 % acetonitril shaking 30 minutes
Baby Food: 4 Maize: 4 Animal Feed: 4
No
137 baby food: (methanol/water)=(80/20),
animal feed: (methanol/water)=(80/20), maize: (methanol/water)=(62.5/37.5)
shaking 30 minutes baby food:4.0, animal feed:6.0,
maize:4.0 Yes
NaCl, baby food: 2.50g , animal feed: 6.84g,
maize: 4.13g
138 methanol/water 80/20%V/V blending+ shaking 30 minutes 4 ml/g for all matrixes Yes 25g NaCl/l
139 methanol-water (80-20) baby food shaking, maize flour blending
30-45 min, 3 min BabyFood 5 ml/g, Maize Flour 4
ml/g Yes
NaCl 1 g/ 10 g of sample
140 methanol :water 80:20 blending 2 minutes 2 No
141 methanol-water PBS buffer shaking 30 min 1:40 No
142 chloroform & water shaking 30mins 125ml/25g=chloroform,
12.5ml/25g= Water Yes
Diatomaceous earth, 12.5g
143 methanol shaking 60 min 4 ml/g for all materials Yes NaCl (5 g)
144 methanol:water blending 2 min 4 Yes 5g NaCl
145 shaking 15 min No
146 methanol-water 80/20 shaking 30 minutes 4 ml/g for each material Yes 4 g NaCl / 50 g
147 maize & animal feed acetonitrile:water, 6:4, v/v. baby food MeOH:water, 1:1,
v/v
blending for maize & animal feed, shaking for
baby food
Blending 4 minutes, Shaking 2 hours
Maize 20g / 100ml, Animal feed 20g/ 100ml, baby food 20g/
100ml No
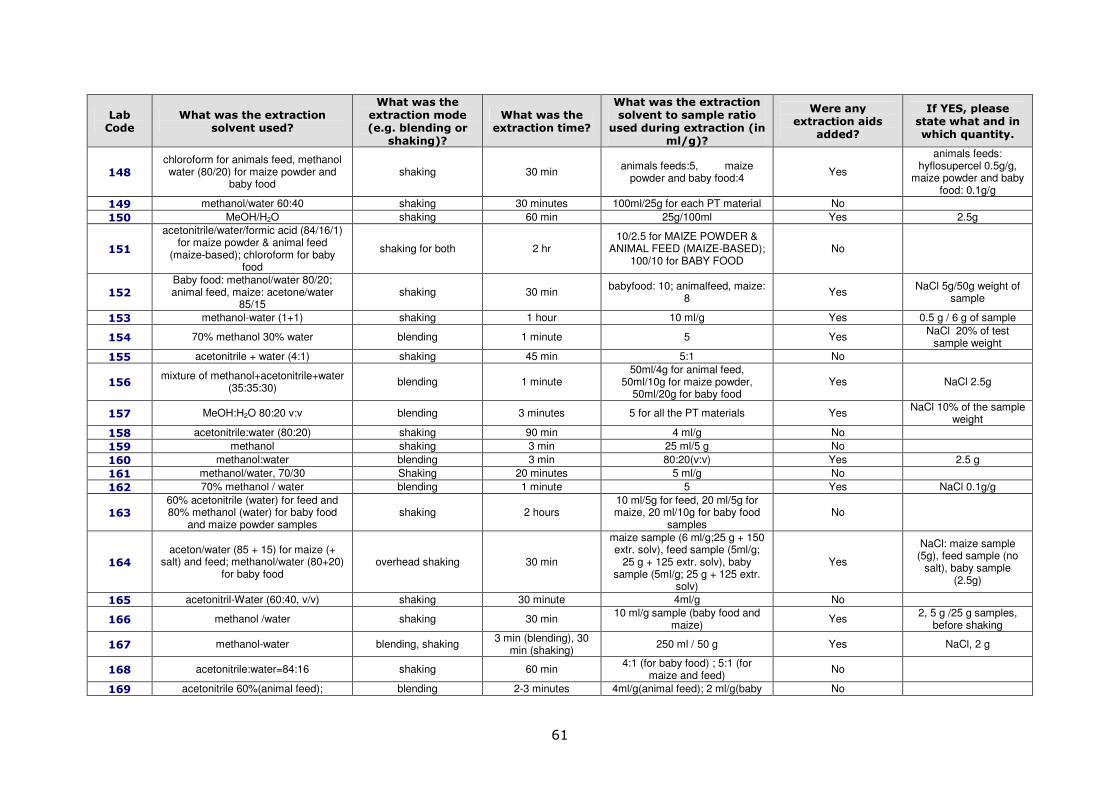
61
Lab Code
What was the extraction solvent used?
What was the extraction mode (e.g. blending or
shaking)?
What was the extraction time?
What was the extraction solvent to sample ratio
used during extraction (in ml/g)?
Were any extraction aids
added?
If YES, please state what and in which quantity.
148
chloroform for animals feed, methanol water (80/20) for maize powder and
baby food shaking 30 min
animals feeds:5, maize powder and baby food:4
Yes
animals feeds: hyflosupercel 0.5g/g,
maize powder and baby food: 0.1g/g
149 methanol/water 60:40 shaking 30 minutes 100ml/25g for each PT material No
150 MeOH/H2O shaking 60 min 25g/100ml Yes 2.5g
151
acetonitrile/water/formic acid (84/16/1) for maize powder & animal feed
(maize-based); chloroform for baby food
shaking for both 2 hr 10/2.5 for MAIZE POWDER &
ANIMAL FEED (MAIZE-BASED); 100/10 for BABY FOOD
No
152 Baby food: methanol/water 80/20; animal feed, maize: acetone/water
85/15 shaking 30 min
babyfood: 10; animalfeed, maize: 8
Yes NaCl 5g/50g weight of
sample
153 methanol-water (1+1) shaking 1 hour 10 ml/g Yes 0.5 g / 6 g of sample
154 70% methanol 30% water blending 1 minute 5 Yes NaCl 20% of test
sample weight
155 acetonitrile + water (4:1) shaking 45 min 5:1 No
156 mixture of methanol+acetonitrile+water
(35:35:30) blending 1 minute
50ml/4g for animal feed, 50ml/10g for maize powder,
50ml/20g for baby food Yes NaCl 2.5g
157 MeOH:H2O 80:20 v:v blending 3 minutes 5 for all the PT materials Yes NaCl 10% of the sample
weight
158 acetonitrile:water (80:20) shaking 90 min 4 ml/g No
159 methanol shaking 3 min 25 ml/5 g No
160 methanol:water blending 3 min 80:20(v:v) Yes 2.5 g
161 methanol/water, 70/30 Shaking 20 minutes 5 ml/g No
162 70% methanol / water blending 1 minute 5 Yes NaCl 0.1g/g
163 60% acetonitrile (water) for feed and 80% methanol (water) for baby food
and maize powder samples shaking 2 hours
10 ml/5g for feed, 20 ml/5g for maize, 20 ml/10g for baby food
samples No
164
aceton/water (85 + 15) for maize (+ salt) and feed; methanol/water (80+20)
for baby food overhead shaking 30 min
maize sample (6 ml/g;25 g + 150 extr. solv), feed sample (5ml/g;
25 g + 125 extr. solv), baby sample (5ml/g; 25 g + 125 extr.
solv)
Yes
NaCl: maize sample (5g), feed sample (no
salt), baby sample (2.5g)
165 acetonitril-Water (60:40, v/v) shaking 30 minute 4ml/g No
166 methanol /water shaking 30 min 10 ml/g sample (baby food and
maize) Yes
2, 5 g /25 g samples, before shaking
167 methanol-water blending, shaking 3 min (blending), 30
min (shaking) 250 ml / 50 g Yes NaCl, 2 g
168 acetonitrile:water=84:16 shaking 60 min 4:1 (for baby food) ; 5:1 (for
maize and feed) No
169 acetonitrile 60%(animal feed); blending 2-3 minutes 4ml/g(animal feed); 2 ml/g(baby No

62
Lab Code
What was the extraction solvent used?
What was the extraction mode (e.g. blending or
shaking)?
What was the extraction time?
What was the extraction solvent to sample ratio
used during extraction (in ml/g)?
Were any extraction aids
added?
If YES, please state what and in which quantity.
methanol 80%(maize and baby food) food and maize)

Table 27: Immunoaffinity column
Lab Code
What type of clean up methodology was used
(e.g. immunoaffinity column)?
Please specify the manufacturer of the
immunoaffinity columns you used during the
analysis
Please specify the brand and the
production code of the immunoaffinity
column!
101 immunoaffinity column LC Tech Aflaclean 12058
103 immunoaffinity column Romer Labs. AflaStar R COIAC 1004
104 dilution with water prior to
injection in LC-MS/MS
105 immunoaffinity column R-Biopharm Aflaprep
106 immunoaffinity column Vicam AOZ HPLC (G1031)
107 Animal feed: immunoaffinity
column // Maize powder: immunoaffinity column
Animal feed: R-Biopharm. // Maize powder: Vicam
Animal feed: Aflaprep, cod. P07. // Maize powder:
Aflatest WB SR, cod. G1068
108 immunoaffinity column Vicam Afla B (TM) VICAM afla (B) G1003;
production code 143
109 immunoaffinity column for
babyfood and maize R-Biopharm Rhône LTD.
Easi Extract Aflatoxins RP7 0N
110 immunoaffinity column R-Biopharm r-biopharm ee afla 50 xh
172/50
111 immunoaffinity column
Romer Aflastar IAC column Lot No.
AF1019-1102
112 immunoaffinity column Vicam G1031
113 immunoaffinity column R-Biopharm Aflaprep Batch no : YD299
114
immunoaffinity column. Sample volume 10 ml, water for
washing 10 ml, methanol for extraction 3 ml. Volumetric flask of 5ml was filled with
water.
R-Biopharm Rhone Ltd Aflaprep, product code P07
115 immunoaffinity column Vicam Aflatest G1010
116 immunoaffinity column R-Biopharm Aflaprep, RBR P07
117 immunoaffinity column
Rhone Biopharm Ltd batch VJ 664/50 Product
number PO7
118 none (evaporate and shoot) NA NA
119 immunoaffinity column R Biopharm
120 immunoaffinity column R- Biopharm Rhone Ltd Aflaprep P07
121 immunoaffinity column Vicam VICAM, GXP 18.10.2012
122 immunoaffinity column Vicam Vicam Aflatest 12022
123 immunoaffinity column R-biopharm
124 immunoaffinity column R-Biopharm Rhone Ltd AflaPrep (50) P07
125 immunoaffinity column r-Biopharm Aflaprep P07
126 immunoaffinity column R-Biopharm Aflaprep YD299
127 immunoaffinity column LC-Tech combined IAC for aflatoxins and ochratoxin A
Lot 709 expiry date 11-2012
128 immunoaffinity column Vicam AOZ G1031
129 immunoaffinity column Aflaprep R-Biopharm R-Biopharm YA 245/50
130 immunoaffinity column R-Biopharm Rhone Easi-Extract aflatoxin; YE
307/10
131 babyfood: immunoaffinity
column, other: SPE (florisil + C18)
R-Biopharm Easi-Extract aflatoxin XA
941/50
132 immunoaffinity column Vicam Wide Bore Aflatest WB,LOT 1791
133 immunoaffinity column Vicam VICAM G1024
134 immunoaffinity column Vicam G1024
135 immunoaffinity column R-Biopharm Rhone LTD Easi-Extract Aflatoxin,
RP71/RP70N
136 MultiSep-columns 226 Afla
ZON+ Romer Labs
137 immunoaffinity column Vicam Aflaprep Lot 1769
138 immunoaffinity column R-BioPharm Aflaprep P07 production
code: XL236/50
139 immunoaffinity column R-Biopharm-Rhone Easi-Ectract Aflatoxin
RP71/RP70N
140 immunoaffinity column R-Biopharm Rhone Easi Extract
141 immunoaffinity column R-Biopharm-Orsell
142 immunoaffinity column R-Biopharm, Rhone LTD Aflaprep, Code:P07
143 immunoaffinity column Biopharm-Rhône Aflaprep: PC P07
144 immunoaffinity column R-Biopharm Rhône Aflaprep 50
145 -
146 immunoaffinity column Vicam Aflatest WB Super Recovery
(G1068)

64
Lab Code
What type of clean up methodology was used
(e.g. immunoaffinity column)?
Please specify the manufacturer of the
immunoaffinity columns you used during the
analysis
Please specify the brand and the
production code of the immunoaffinity
column!
147 immunoaffinity column R-Biopharm Rhone Aflaprep
148 animals feed: SPE forisil and
C18, maize powder and baby food: immunoaffinity column
Neogen for aflatoxin 8043
149 immunoaffinity column Romer Aflastar fit COIAC1001
150 immunoaffinity column Romer Labs AflaStar IAC Order No.
COIAC1004
151 maize powder & animal feed (maize-based): none; baby
food: immunoaffinity column R-Biopharm AflaPrep WH 887/50
152 immunoaffinity column R-Biopharm Aflaprep RBRP07
153 immunoaffinity column R-Biopharm Rhone Aflaprep, RBRP07
154 immunoaffinity column Neogen Neocolumn aflatoxin- narrow
bore. Product code 8040
155 immunoaffinity column Vicam AflaTest WB, Reorder
#G1025
156 immunoaffinity column Vicam AflaTest, product code
G1010
157 immunoaffinity column R-Biopharm Aflaprep 50 P07 Bx:YA
246/50
158
immunoaffinity column for baby food ; 80% acetonitrile extract diluted with water (1:1) to corn
and feed
R-Biopharm Rhone Aflaprep P07
159 No used
160 immunoaffinity column R-Biopharm
161 immunoaffinity column R-Biopharm RIDA aflatoxin column, art.
nº R5002, lot. 14490
162 immunoaffinity column R-Biopharm Rhone Ltd Aflaprep 50 XH174/50
163 immunoaffinity column R-Biopharm Rhone Ltd Easi-Extract® Aflatoxin
RP71
164 immunoaffinity column Vicam Aflatest widebore
165 immunoaffinity column Romer AflaStar
166 immunoaffinity column Vicam AflaTest WB; lot 1802
167 immunoaffinity column R-Biopharm, Rhone Aflaprep P07
168 Mycosep 226
169 immunoaffinity column R-Biopharm-Rhone Easi-extract aflatoxin EE AFLA 50/BX YB 268/50

65
Table 28: Detection techniques, specifying the methods
Lab Code Detection
techniques Please specify your method (type of column, injection volume,
mobile phase etc.)!
101 HPLC-FLD Symmetry C18. 100µl, 50%H2O:40%MeOH:10%CH3CN
103 HPLC-FLD ACE C18, 5um, 150x4.6 mm, mobil phase: water/MeOH/Acn 68/16/16
104 LC-MS/MS 10 µl inj, UPLC column 100 x 2.1 mm, 1,7µm, colum temp 50 °C, flow 0.4 ml min, gradient from 90% water + 0.1% Formic acid, to 90% acetonitril + 0.1 % formic acid in 12 min. MS transitions: m/z 313 > 241 and 313 > 285
105 LC-MS/MS HSS T3 (Waters column), 5 µl injection, 5mM
106 LC-MS/MS multimethod mycotoxins
107 HPLC-FLD
Animal feed: C18 5 um, (250 x 4.6) mm, injection volume = 50 ul, mobile phase = H2O/acetonitrile/methanol, 6+2+3 v/v. // Maize powder: C18 5 um, (250 x 4.6) mm, injection volume = 50 ul, mobile phase = H2O/acetonitrile/methanol, 60/20/20% v/v
108 HPLC-FLD
ISO/FDIS 17375; column: LiChrospher R100 RP-18(5 um) column 25*4.6 mm EcoPack; Injection volume: 100 uL; Mobile phase: water-acetonitrile-methanol (6+2+3); flow rate: 1 ml/min for mobile phase and 0.3 ml/min for PBPB reagent; Wavelenghts: emission 435 nm and 365 for excitation
109 HPLC-FLD Spherisorb ODS2 (250 x 4.6); 25 ul; Water / Methanol / Acetonitrile (54:28:18)
110 HPLC-FLD column: Hypersil ODS 5µ 40°C / injection: 100 µl / eluent: water acetonitrile, with acetic acid and kaliumbromide for electochemical derivatisation / flow: 1 ml/min / FLD Ex wavelength 365nm Em wavelength 435nm
111 HPLC-FLD 25 cm x 4.6 mm id Sperisorb ODS1 5 micron, injection volume 0.1 ml, mobile phase 580 ml water + 300 ml acetonitrile + 120 ml methanol.
112 HPLC-FLD Waters symmetry c18 15 cm, 4.6 mm, 3.5 um- 100ul - Acetic acid 0.1% Methanol Acetonitrile
113 HPLC-FLD Sperisorb 5µ ODS(1) ; 100 µL injection ; Mobile phase H20/ACN/MeOH 65/17.5/17.5 + KBr
114 HPLC-FLD Column: Waters Spherisorb 5µm ODS2 4.6X250mm, injection volume: 100µl, mobile phase: H2O/MEOH/ACN/THF (615/240/120/25), flow rate: 1ml/min
115 HPLC-FLD Column (Phenomenex Kinetex 2.6u PFP, 100A), Injection Volume 200µL, Mobile phase 45:55 Methanol:water.
116 HPLC-FLD C18 (250 mm x 4,6 mm, 5 µm), injection 100 µl, mobil phase: water/methanol /acetonitril (56:22:22), Ex. 365 nm, Em. 435 nm
117 HPLC-FLD RP18 10 cm - 4,8 mm / Injection 100 µl / flow 0,5ml/min / Mobile phase Methanol/ACN/Water/HNO3/ KBr
118 LC-MS/MS Waters Acquity UPLC HSS T3 2.1 x 100 mm, 1.8 µm | Micromass Quattro Premier in ESI positive | IS: 13C | Evaporate & shoot
119 HPLC-FLD Phenomenex Spherisirb ODS1 5micron, 25 by 4.6 mm, 220 microL, Methanol: acetonitrile:water (20:20:60), Flow rate 7ml/min.
120 LC-MS/MS Zorbax XDB C18 150x4,6mm, MP- methanol and 10mM NH4AC in water, Esquire 6000, APPI
121 HPLC-FLD phenomenex RP18 Luna 5µµm, 250x3mm, 35°C, 0,75 ml/min inj. 200 µl
122 HPLC-FLD C18 symmetry Waters (76mm x 4.6mm, 3.5µm) - inj 20µl - Water/methanol 60/40
123 HPLC-FLD C 18 Waters - 20 µl - MeOH/ACN/Buffer KBr-HNO3
124 HPLC-FLD Column: Supelcosil C18 ; Injection Volume: Maize 50ul, Feed 200ul, Baby Food 500ul ; Mobile Phase: Water/Methanol/Acetonitrile
125 HPLC-FLD
126 HPLC-FLD 150mm Genesis C18 column, injection vol = 100µl, mobile phase = 300ml Methanol/100ml acetonitrile/600ml water/119mg KBr/350µl 4M nitric acid
127 HPLC-FLD Luna 3umC18 Phenomenenx, 50uL injection volume, Water/acetontrile/methanol
128 HPLC-FLD C18 (150x4,6 mm); 50 µL; MeOH, ACN, H2O, (AcOH 1%/ACN 1/1) gradient; for determination of OTA and ZON in a single run
129 HPLC-FLD Waters Nova-Pak C 18 µm 3.6x150 mm .Inj volume 250 µl. Mobile phase water/methanol/acetonitril (540/290/200 v/v/v)
130 HPLC-FLD Sperisorp 5 ODS-1, 250 x 4,6 mm; 25 ul
131 HPLC-FLD injection vol.: 100 µl, column (for all materials): Novapak C18, 3,9x150 mm, babyfood: MF: 40% MeOH, flow: 1 ml/min; other: MF: 112 H2O/ 56 MeOH, 25 ACN, flow: 0,4 ml/min + 0,2 ml/min (iodine derivatisation)
132 HPLC-FLD Phenosphere C18 5um 250x4.60mm, 200ul, Water:MeOH:ACN (60:20:20)
133 HPLC-FLD Lichrospher C18, mobil phase: methanol:ACN:water (15:20:65) + 119 mg KBr + 100 ul HNO3;injection volume: 100ul(baby food), 50ul (maize powder, animal feed)
134 HPLC-FLD Inertsil C8 150x4.6 mm, Varian, 50 ul, acetonitrile+methanol+water , 8: 27:65, v/v/v
135 HPLC-FLD Thermo HPLC column ODS 250 mm × 4.6 mm × 5 µm, Acetonitrile:methanol:water:phosphoric acid 200:200:600:0.1+ 0.119 g KBr
136 HPLC-FLD Column: ACE 3 C18 3µm 100x4.6 mm, Injection Volume: BabyFood 30µl Maize, Animal feed 20µl, Mobile phase Water:Acetonitril:Metanol 900:180:240 KBr, HNO3
137 HPLC-FLD column: Waters Symmetry 4.6x250mm/5um/ODC(C18), inj vol=200uL, mobile phase: (THF/water)=(21.0/79.0)

66
Lab Code Detection
techniques Please specify your method (type of column, injection volume,
mobile phase etc.)!
138 HPLC-FLD Lichrospher C18 250 mm 4.6 mm ID 100 microliter injection
139 HPLC-FLD RP, NovaPak C18, injection 0.1 ml, Mobile phase methanol-acetonitrile-water(290-140-570)
140 HPLC-FLD Pursuit XRS3 C18 150 x 4.6mm, 100ul, 60:40 water:methanol 0.9ml/min Ex 362nm Em 455nm
141 LC-MS/MS Xterra C18 20µl Water-formic acid
142 HPLC-FLD HPLC reverse phase C18 column, column heater 35C, 100µl injection volume,Mobile Phase: Water/MeOH/ACN (65/35/20), pump set @ 1ml/min
143 HPLC-FLD Spherisorb 5 microm ODS2; 100 microL; methanol/water 40:60 (V/V)
144 HPLC-FLD C18 column, 400uL, H2O:AcN:MeOH (56:15:29), 0.7 ml/min
145 ELISA competitive assay
146 HPLC-FLD C18 - 250 mm - 5 µm - 200 µl - water(610)/ACN(175)/methanol(215) - 1 ml/min
147 HPLC-FLD S5-ODS1 Excel, 250mmx4.6mm, Water:Acetonitrile:MeOH, 56:30:14, with nitric acid & KBr for KOBRA cell. Injection volume 400µl
148 HPLC-FLD Column: Lchro CART 125-4, 5µ, Injection Volume: 100µl, mobile phase: methanol, acetonitril, water (36-17-44)
149 HPLC-FLD Column RP18e 250x4.6 mm 5 µm, injection volume 25 µl, mobile phase water/acetonitrile/methanol 66:19:15,flow rate 0.7 ml/min.
150 HPLC-FLD Column - Phenomenex Luna C18, 20 mkl, H2O/MeOH/ KBr/ 4M HNO3
151 HPLC-FLD, LC-MS/MS
HPLC-FLD: BABY FOOD: Column: Waters Symmetry C18, 5µm, 3,0 * 150 mm; Injection volume 100 ul; Mobile phase: Water/methanol/acetonitril, 130/70/40(v/v/v) + 1 mM KBr + 1 mM HNO3 LC-MS/MS: MAIZE POWDER & ANIMAL FEED (MAIZE-BASED): Column:Restek, Ultra aqueous C18 3µm 100x2,1mm; Injection volume 5 ul; Mobile phase: Water/Methanol gradient with 1mM ammoniumformiate and 1% formic acid
152 HPLC-FLD Zorbax Eclipse XDB-C18, 5µ, 250*4.6; injection volume: 100µl; acetonitrile/methanol/water 20/30/60; flow 1 ml/min; excitation: 362 nm, emission: 448 nm
153 HPLC-FLD Prodigy column 5u ODS(2), 250x4.6 mm (Phenomenex), inj. volume 100 uL, mob. phase water-methanol-acetonitrile (600+200+200), λex = 362 nm, λem = 425 nm
154 HPLC-FLD column - spherisorb 5u ODS1, injection volume 100uL, mobile phase 58 water:30 acetonitrile:12 methanol
155 HPLC-FLD C18; 250 ul; water+methanol+acetonitrile+nitric acid+potassium bromide
156 HPLC-FLD Waters NovaPak C18 column, 4µm 3.9x150mm, 100µl injection, 25°C, flow rate 1ml/min, mobile phase: CH3OH/H2O (with KBr and 4MHNO3)/ACN, 20:68:12
157 HPLC-FLD C18 250x4.6mm 5micron; Vinj=150ul; MeOH:AcCN:H2O 29:17:54
158 LC-MS/MS Column Acquity UPLC-BEH C18, 2.1x50 mm, 1.7 µm ; injection volume 10µl; mobile phase A:Water, B:Methanol+0.1% Formic Acid +0.5mM Ammonium acetate; Gradient 10-90 Methanol ; flow 0.3 ml/min
159 ELISA Enzyme linked imunossay
160 HPLC-FLD Inertsil ODS-2, 5 um, 150 mm x 4.6 mm; 100 ul; water:acetonitrile:methanol (60:10:30 v/v) added 119 mg KBr and 100 ul HNO3 per 1 litre
161 LC-MS/MS
Column Ascentis c18, 15cmx2.1mm, 3um. Inyection volume 20 ul. Mobile phase: A=Water/methanol, 90/10, 0.1 % acetic acid, 1mM amonium acetate, B=Methanol/water, 98/2, 0.1% acetic acid, 1mM amonium acetate. Apparatus: Quattromicro, MS method: 313.14-241 and 314.14-268.9, cone 35, collision 30
162 HPLC-FLD C18 250x4.6mm, 100µl, water/methanol/acetonitrile 600/250/125
163 HPLC-FLD LiChroCART 250-4 RT-18 (5µm) LiChrosper® 100; 20 µL; KBr and HNO3 solution/ acetonitrile/methanol (6/2/3)
164 HPLC-FLD Gemini C18 (Phenomenex) 250 x 4,6 5µ, injection volume 50µl, flow: 1 ml/min,colum temp. 30°C, mobile phase: water:methanol:acetonitrile (540:290:170V/V )+ 119 mg potassium bromide + 100µl nitric acid (65%)
165 HPLC-FLD C 18, injection volume 50 microliters, mobile phase:water 57%, Methanol 3.7%, acetonitrile 5% , 120 g potasium bromide, 350 microliters nitric acid
166 HPLC-FLD column C-18 Symmetry Waters; inj 100 ul; MeOH:AcN:H2O - 28:19:53
167 LC-MS/MS Flow rate=0.2 ml/min, column: hypersil gold 100x2.1, 5µm, inj. vol.: 20 µL, mobile phase: MeOH/H2O, ESI positive ion mode, precursor ion 313, products: 241, 285
168 LC-MS/MS Column: ZORBAX SB-C18 (2.1x50 mm, 1.8 microns). Mobile phase: formic acid 0.1% and formic acid 0.1% in acetonitrile (gradient elution). Flow: 0.4 ml/min. Column temperature: 40°C. Injection volume: 10 microliters
169 HPLC-FLD Mobile phase: 60:30:20(water:methanol:acetonitrile); 120 mg KBr, 350microl HNO3 4M, Nucleosil 100-5 C8; EC 250/4.6, flow rate 1 ml/min, injection volume 100 microl;

67
Table 29: Derivatisation, acid washed glassware, protection against daylight
Lab Code Which derivatisation method was applied?
Did you use acid washed glassware?
Was protection against daylight applied?
101 Photochemical Derivatisation (UVE LCtech)
No Yes
103 Kobra cell Yes Yes
104 none Yes Yes
105 none No No
106 - No Yes
107 UVE LC Tech No Yes
108 PBPB (Pyridinium hydrobromide perbromide)
Yes Yes
109 PBPB Yes Yes
110 Kobra cell No Yes
111 Kobra cell No Yes
112 UVE - LC TeCK No No
113 Kobra Cell No Yes
114 Post column derivatisation with 50mg/1000mlH2O, flow rate 0.4ml/min
No Yes
115 PHRED i.e. photochemical reactor for enhanced detection.
Yes Yes
116 Kobra cell Yes Yes
117 Kobra cell Yes Yes
118 none No Yes
119 Post column derivatisation No Yes
120 - No Yes
121 - No No
122 Iodine No Yes
123 Kobra cell Yes Yes
124 Bromination using PBPB No Yes
125 Kobra cell No Yes
126 Kobra Cell Yes Yes
127 Coring-cell = Kobra cell No Yes
128 fotochemical UVE No Yes
129 post column derivatisation Yes Yes
130 PBPB Yes Yes
131 baby food: Kobra cell, other: iodine derivatisation
Yes No
132 Post column Derivatisation with saturated iodine solution
Yes Yes
133 Kobra cell No Yes
134 precolumn Yes Yes
135 Kobra cell Yes Yes
136 Kobra Cell No Yes
137 iodine No Yes
138 Kobra cell Yes Yes
139 Post-column with PBPB (pyridinium hydrobromide perbromide)
Yes Yes
140 Kobra cell No Yes
141 -- No Yes
142
Kobra cell, reaction tubing, minimum 34cm X 0.5mm internal diameter PTFE, current source set to 100µA
Yes Yes
143 Kobra cell Yes Yes
144 Post-column derivatisation Yes Yes
145 - No Yes
146 PBPB Yes Yes
147 Kobra cell Yes Yes
148 Kobra-cell Yes Yes
149 post column derivatisation with iodine
No No
150 Kobra cell No Yes
151 baby food: Kobra No Yes
152 post column with PBPB No Yes
153 Kobra cell No Yes
154 iodine saturated water No Yes
155 Kobra cell Yes Yes
156 Kobra cell No No

68
Lab Code Which derivatisation method was applied?
Did you use acid washed glassware?
Was protection against daylight applied?
157 post column derivatisation with PBPB
Yes Yes
158 no one No Yes
159 No used No Yes
160 Kobra cell Yes Yes
161 There isn´t derivatisation Yes No
162 Kobra cell No No
163 Kobra cell Yes Yes
164 Kobra cell No Yes
165 Kobra cell No Yes
166 second pump, PBPB Yes Yes
167 - No Yes
168 no derivatisation method was applied
Yes Yes
169 Kobra cell No Yes

69
Table 30: Integration mode, problems during the analysis
Lab Code
How did you
integrate the
signals?
If automatic,
did you confirm the integration correctness
visually?
Did you encounter
any problems during the analysis?
If YES, what were the specific
problems and to which
samples do they apply?
Did you notice any unusual
observations which,
however, did not seem to have any
effect on the results?
If YES, what were these
observations and to which samples do they apply?
101 Automatic Yes No No
103 Automatic Yes No No
104 Automatic Yes No No
105 Manual No No
106 Automatic Yes No No
107 Manual No No
108 Manual No No
109 Automatic Yes No No
110 Automatic Yes Yes bad recovery with baby food cont.
No
111 Automatic Yes No No
112 Automatic Yes No No
113 Automatic Yes No No
114 Manual No No
115 Automatic Yes No No
116 Manual Yes
Samples of maize powder had to be filtered before clean-up.
No
117 Automatic Yes No No
118 Automatic Yes No Yes
The feed seemed to be
particularly greasy!
119 Automatic Yes No No
120 Manual No No
121 Automatic Yes No No
122 Automatic Yes No No
123 Automatic Yes No No
124 Automatic Yes No No
125 Manual No No
126 Automatic Yes Yes baby food extracts required centrifugation
No
127 Automatic Yes No Yes
With animal feed we had unusual low recoveries,
therefore we did not commit any
results
128 Manual No No
129 Automatic Yes No No
130 Automatic Yes No No
131 Automatic Yes No No
132 Automatic Yes No No
133 Manual No No
134 Automatic No No No
135 Automatic Yes No No
136 Automatic Yes No No
137 Manual No No
138 Automatic Yes No Yes
blank baby food matrix not
mentioned in the delivery
notice
139 Manual Yes
Blank baby food material behaved differently compared to Baby
Yes
Not unusual but unfortunately
the temperature in the lab was

70
Lab Code
How did you
integrate the
signals?
If automatic,
did you confirm the integration correctness
visually?
Did you encounter
any problems during the analysis?
If YES, what were the specific
problems and to which
samples do they apply?
Did you notice any unusual
observations which,
however, did not seem to have any
effect on the results?
If YES, what were these
observations and to which samples do they apply?
Food Test. For that reason the recovery used for result was an average of a longer time.
26-28 C during the analysis
140 Automatic Yes No No
141 Automatic Yes No No
142 Automatic Yes No No
143 Automatic Yes Yes Samples´weight clearly insufficient
No
144 Automatic Yes No No
145 Automatic Yes No Yes turbidity of the
extracts
146 Automatic Yes No No
147 Automatic Yes Yes
Yes centrifuge normally used for baby food was broken, so had to use an alternative that is not refrigerated & has a slower speed. Extracts were dirtier than normal and much lower than expected recovery values were determined.
Yes
As above baby food extract not as clear after centrifugation as usual, and
believe this led to the lower
than expected recovery
148 Automatic Yes No No
149 Manual No No
150 Automatic Yes No No
151 Manual No No
152 Manual Yes
unusual extraction for maize has to be applied (acetone/water instead of methanol/water): filtrate-dilution blocked IAC-column, even after filtration and centrifugation
No
153 Automatic Yes No No
154 Automatic Yes No No
155 Automatic Yes No No
156 Automatic Yes No Yes poor filtration of
baby food extract
157 Automatic Yes No No
158 Automatic Yes No No
159 Automatic Yes No No
160 Manual No No
161 Manual No No
162 Automatic Yes No No
163 Automatic Yes No No
164 Automatic Yes Yes
Baby sample: sample clumped together by adding extraction solvent.
No
165 Automatic Yes No No
166 Automatic Yes No No
167 Automatic Yes No No

71
Lab Code
How did you
integrate the
signals?
If automatic,
did you confirm the integration correctness
visually?
Did you encounter
any problems during the analysis?
If YES, what were the specific
problems and to which
samples do they apply?
Did you notice any unusual
observations which,
however, did not seem to have any
effect on the results?
If YES, what were these
observations and to which samples do they apply?
168 Automatic Yes No No
169 Manual No No

72
Table 31: Instructions for the proficiency test
Lab Code
Did you find the instructions
distributed for this PT
adequate?
If NO, which parts do you think can improve?
101 Yes
103 Yes
104 Yes
105 No Instructions regarding determination of AfB1 standard solution were not absolutely clear.
106 No
instructions how to calculate the M.U. in detail are missing, since the baby food matrices are not known in detail, it's not possible to calculate a M.U. in a correct way; there's is not enough blank matrix to spike multiple times to be able to calculate a correct M.U.
107 Yes
108 Yes
109 Yes
110 Yes
111 Yes
112 Yes
113 Yes
114 Yes
115 Yes
116 Yes
117 Yes
118 Yes
119 Yes
120 Yes
121 Yes
122 Yes
123 Yes
124 Yes
125 No
1. More specific instruction on measuring concentration of standard solution needed 2. Should have specifically stated each sample needed spiking in introduction 3. Provide larger test portions to be sufficient to undertake spiking of all matrices
126 Yes
127 Yes
128 Yes
129 Yes
130 Yes
131 Yes
132 Yes
133 Yes
134 Yes
135 Yes
136 Yes
137 Yes
138 Yes
139 Yes
140 Yes
141 Yes
142 Yes
143 Yes
144 Yes
145 Yes
146 Yes
147 Yes
148 Yes
149 Yes
150 No To much info requested in questionnaire.
151 Yes
152 No maybe unproper transportation-conditions: samples and standard-solution received uncooled and very warm (uncooled logistic-car)
153 Yes

73
Lab Code
Did you find the instructions
distributed for this PT
adequate?
If NO, which parts do you think can improve?
154 Yes
155 Yes
156 Yes
157 Yes
158 Yes
159 Yes
160 Yes
161 Yes
162 Yes
163 Yes
164 Yes
165 Yes
166 Yes
167 Yes
168 Yes
169 Yes
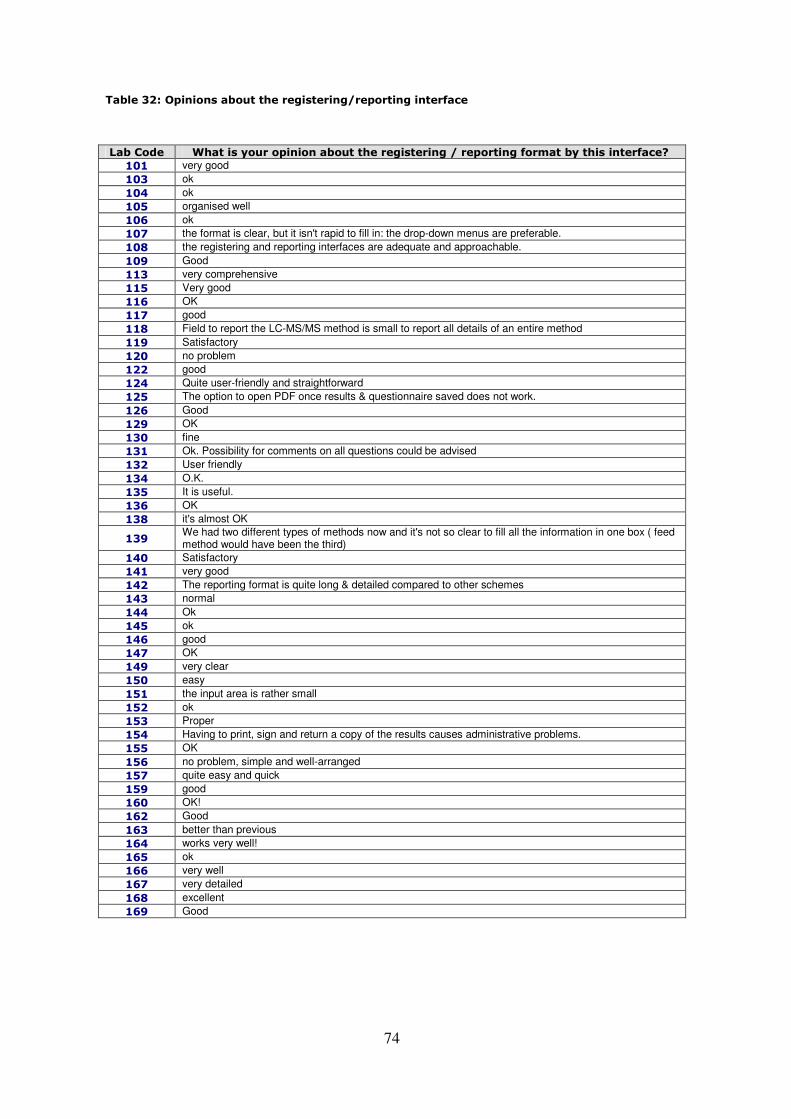
74
Table 32: Opinions about the registering/reporting interface
Lab Code What is your opinion about the registering / reporting format by this interface?
101 very good
103 ok
104 ok
105 organised well
106 ok
107 the format is clear, but it isn't rapid to fill in: the drop-down menus are preferable.
108 the registering and reporting interfaces are adequate and approachable.
109 Good
113 very comprehensive
115 Very good
116 OK
117 good
118 Field to report the LC-MS/MS method is small to report all details of an entire method
119 Satisfactory
120 no problem
122 good
124 Quite user-friendly and straightforward
125 The option to open PDF once results & questionnaire saved does not work.
126 Good
129 OK
130 fine
131 Ok. Possibility for comments on all questions could be advised
132 User friendly
134 O.K.
135 It is useful.
136 OK
138 it's almost OK
139 We had two different types of methods now and it's not so clear to fill all the information in one box ( feed method would have been the third)
140 Satisfactory
141 very good
142 The reporting format is quite long & detailed compared to other schemes
143 normal
144 Ok
145 ok
146 good
147 OK
149 very clear
150 easy
151 the input area is rather small
152 ok
153 Proper
154 Having to print, sign and return a copy of the results causes administrative problems.
155 OK
156 no problem, simple and well-arranged
157 quite easy and quick
159 good
160 OK!
162 Good
163 better than previous
164 works very well!
165 ok
166 very well
167 very detailed
168 excellent
169 Good

75
Table 33: Other comments
Lab Code Any other comments you wish to address?
104 We didn't analyse the animal feed sample, because it is out of our scope and we were not able to do the spectrophotometric analysis of the standard solution because our organisation is in the middle of a movement (instrument not available!)
106 The test solution is measured with a dilution and with LCMS-MS, since we don't use spectrophotometric analysis
107 The matrices baby food and test solution were not analyzed: no results will be sent.
108 It will be more accurate if the PT include also blanks for recoveries in maize powder and feed.
116 We consider sending of signed forms by fax or e-mail as useless, old-fashioned and redundant when are results and other forms submitted on-line.
119 A certified standard material would have been desirable for health and safety reasons.
124 It would have been preferable if more sample material was provided to perform our routine method in full
128 Data reported are only for animal feed and maize (treated as a feed material). For baby food we use a different method (not accredited yet).
132 More blank sample for baby food must be provided and the kind of baby food must be stated (e.g. cereal based baby food or infant formula)
139 We didn't analyze the feed sample. The result for baby food is given for the test material, not for dry matter.
148 One Question: why did you asked the quantification of aflatoxin B1 only?
149 The animal feed material wasn't tested because the laboratory doesn't analyze this type of material
150 Was insufficient sample amount for maize powder and animal feed to carry out routinely sample preparation. We took smaller amount of test material. It can be affected on the results.
151 When using two different methods for the samples, answering this questionnaire is not easy
160 Please, send more amount of samples the next PT. In our method the amount of sample weight is 25 g.
164 Questionnaire contains no question, if the results have been corrected for recovery! in our case: yes!

76
13.9. Assigned values
13.9.1. Introduction
Exact-matching, double isotope dilution mass spectrometry (EMD-IDMS), considered to be a primary ratio method, was used to determine the assigned values of the test materials. Figure 10 depicts the process of EMD-IDMS. Sample blends (SB) are prepared by adding the spike solution, an isotopically labelled analogue of the analyte, to the test material at an amount that will result ideally in a ratio of signal analyte over signal labelled analogue of close to 1. Calibration blends (CB) are prepared in a similar fashion. Instead of using a contaminated material an analyte-free material is fortified with the same amount of spike as in the sample blend. Additionally an amount of a reference material of the analyte (solution of analyte in pure solvent at known mass fraction and uncertainty) is added to bring the ratio close to 1 again. Normally a few iterations of preparing SBs and CBs are needed until the right amounts of spike and reference material are fixed to obtain ratios close to 1. Once these amounts are fixed a number of SBs and CBs are prepared and measured as SB/CB pairs in direct succession. The ion ratio SB/CB is then calculated by dividing the ion ratio in the sample blend through the ion ration in the calibration blend for each of the measurement pairs. Through this process biases caused by extraction efficiencies, chromatographic effects, mass spectrometric discrimination, etc. are effectively eliminated. And for such a bias-free process increasing the number of repetitions results in increased accuracy.
SampleBlend
Spike
Equilibration,
Extraction,
(Clean-up)
Test
material
Ion Ratio
LC-MS
CalibrationBlend
Spike
Equilibration,
Extraction,
(Clean-up)
Blank
material
Ion Ratio
LC-MS
Reference
material
SampleBlendSampleBlendSampleBlend
Spike
Equilibration,
Extraction,
(Clean-up)
Test
material
Ion Ratio
LC-MS
Spike
Equilibration,
Extraction,
(Clean-up)
Test
material
Ion Ratio
LC-MS
CalibrationBlend
Spike
Equilibration,
Extraction,
(Clean-up)
Blank
material
Ion Ratio
LC-MS
Reference
material
CalibrationBlendCalibrationBlend
Spike
Equilibration,
Extraction,
(Clean-up)
Blank
material
Ion Ratio
LC-MS
Reference
materialSpike
Equilibration,
Extraction,
(Clean-up)
Blank
material
Ion Ratio
LC-MS
Reference
material
Figure 20: Depiction of the process of exact-matching, double isotope dilution mass spectrometry
13.9.2. Materials and Methods
Test Materials:
Three units each of the three test materials Baby Food, Maize, and Animal Feed were selected at random. The Aflatoxin-free Baby Food material provided with the PT was used as blank material for the Baby Food calibration blends. An Aflatoxin-free maize material was used as blank material for all other calibration blends.

77
Reference Materials:
The certified reference material “Aflatoxin B1 in Acetonitrile” (ERM-AC057, IRMM, from now on “AC057”, 3.79±0.11 µg/g (k=2)) was used for all subsequent solutions for calibration blends. 13C17 Aflatoxin B1 (Biopure, Austria, from now on “I”) was used for all subsequent spike solutions. The following dilutions were prepared gravimetrically with an analytical balance (d=0.01mg):
Name Made from
Type Mass fraction w [µg/g]
Standard uncertainty u(w) [µg/g]
I Spike 0.502 0.013
II AC057 Reference 0.358 0.0052
III I Spike 0.0347 0.0009
IV AC057 Reference 0.0347 0.0005
V I Spike 0.00219 5.7e-5
VI AC057 Reference 0.0029 3.0e-5
Table 34: Reference and Spike solutions
Preparation of blends:
Test portions of 2 g of either test or blank material were used for the preparation of the different blends. To the test portions in a 50 ml polypropylene screw cap tube 4 ml of water were added and the whole content was fully suspended. After providing time for equilibration either spike or reference material were added and everything mixed again. The masses of the test portions, the spike, and the reference material were determined with an analytical scale (d=0.01mg) to the 5th decimal.
Then 16 ml acetonitrile were added slowly with intermediate mixing to avoid sudden precipitation of proteins in the blends which could cause loss of analyte. The blends were then agitated on an orbital shaker for a specified amount of time and briefly centrifuged at a RCF of 3200 g.
For the first iteration of all three test materials equilibration time was determined. To that end aliquots of 2 ml were withdrawn from the tubes after 10, 50, 100, and 1140 min. These aliquots were dried down in a stream of N2 at 70 °C. The dry extract was reconstituted by adding 120 µl acetonitrile and vortex mixing. Then 280 µl water were added and the tube vortex mixed again. Of these solutions 20 µl were injected onto column. No significant differences between the different equilibration times could be determined. Therefore the extraction time was fixed at 30 min plus 10 min centrifugation.
The second iteration revealed an inhomogeneity within the test units at 2 g test portion size. Therefore an additional homogenization step was performed for all materials by submitting the full content of each test unit to 15 min milling in a Mortar Mill.
After the third iteration the correct amounts of spike and reference material were known for all test materials. For Baby Food and Maize two test portions each of the three test units were prepared for the final measurements. For the Animal Feed the first test unit was used up during the first three iterations and three test portions each of the remaining two test units were measured.
Measurements:
Measurements were performed on a LC-LC-MS system consisting of a binary high-pressure solvent delivery system (LC-20AD, Shimadzu), a quaternary low-pressure Accela solvent

78
delivery system, an Accela auto liquid sampler (Thermo Scientific), and a TSQ Quantum Ultra (Thermo Scientific). Separation was afforded in the first dimension by an Ascentis C18 column (50 x 2.1 mm, 3 µm) at a flow rate of 200 µl/min with a mobile phase of acetonitrile/water/formic acid (380/619/1,v/v/v). Elution strength was such that a retention factor of approx. 2 was obtained. The first dimension peak was trapped into a 100 µl loop installed to a 6 port, 2 way switching valve. The valve was then switched and the loop content injected onto the second dimension column.
Second dimension separation was afforded by an Ascentis Phenyl column (50 x 2.1 mm, 3 µm) at a flow rate of 200 µl/min with a mobile phase of acetonitrile/water/formic acid/ammonium formate pH 3.7 (480/519/0.5/0.5). Again, elution strength for a retention factor of approx. 2 was chosen. The 2-dimensional heart cut approach was chosen to obtain maximum resolution at high loading capacity for improved peak signal and precision while acceptable cycle times were maintained.
Electro spray ion source settings were as follows: spray voltage 2400 kV, vaporizer temperature 250 ºC, capillary temperature 320 ºC, sheath gas 30, ion sweep gas 10.0, aux gas 10 (gas pressures in arbitrary units).
In selected reaction monitoring (SRM) mode the proton-adducts of the parent compound were selected for the following transitions: 313.1->241.0, 313.1->270.0, 313.1->284.9 for Aflatoxin B1 (AFB1), and 330.1->227.2, 330.1->283.8, 330.1->301.4, 330.1->314.0 for 13C17 Aflatoxin B1 (13C-AFB1). The dwell times were chosen such that about 20 scans across a peak were registered.
Batches of runs were structured such that each SB run was directly followed by a CB run. This was then repeated 10 times for each test portion. A total of 120 runs were performed for each test material
Calculation of the assigned values and their uncertainties
Since there was no significant signal of the labelled 13C-AFB1 in the reference or test materials, and likewise no significant signal of the analyte AFB1 in the spike solutions the following simplified model equation was used:
ismp
SBISTD
CBISTD
ic
icism
m
m
mRww
,
,
,
,
,, ×××= Equation 5.
with
ws,i = mass fraction of analyte in test portion
wc,i = mass fraction of analyte in reference solution
mc,i = mass of reference solution added to CB
mISTD,CB = mass of the spike added to CB
mISTD,SB = mass of the spike added to SB
msmp,i = mass of test portion
R = Mean ion ratio SB over CB

79
The combined uncertainty of ws,i is then given by:
22
,
,
2
,
,
2
,
,
2
,
,
2
,
,
2
,
,
)()(
)()()()()(
+
+
+
+
+
=
R
Ru
m
mu
m
mu
m
mu
m
mu
w
wu
w
wu
ismp
ismp
CBISTD
CBISTD
SBISTD
SBISTD
ic
ic
ic
ic
is
is
Equation 6.
The assigned value xa was calculated as the average of all ws,i of the six preparations per test material:
BSisa Fwx ×= , Equation 7.
The combined uncertainty of xa is then given by:
2
2
2
,
2)()(
)(a
BS
a
is
aax
Fu
nx
wuxxu +×=
∑ Equation 8.
In Equation 7 the term FBS has a value of 1 and accounts for the uncertainties due to the between-samples variability.
13.9.3. Results
Table 35 lists the assigned values and their uncertainties for the three materials and Figures 11, 12, and 13 depict the distribution of the six measurements per test material. The individual values for the six measurements of each test material are listed in Tables 36, 37, and 38.
Material
Assigned value xa
[µg/kg]
Expanded uncertainty
u(xa)
[µg/kg]
Relative expanded
uncertainty
[%]
Coverage factor
Baby Food 0.197 0.017 8.9 2
Maize 3.1 0.14 4.6 2
Animal Feed
9.9 0.66 6.7 2
Table 35: Assigned values and their associated uncertainties for the three materials

80
Figure 11: Distribution of the six measurements of Baby Food; the solid circles depict the measured value, the vertical lines the associated expanded uncertainties; the solid line depicts the assigned value and the broken lines the expanded uncertainty range.
Figure 12: Distribution of the six measurements of Maize; the solid circles depict the measured value, the vertical lines the associated expanded uncertainties; the solid line depicts the assigned value and the broken lines the expanded uncertainty range.

81
Figure 13: Distribution of the six measurements of Animal Feed; the solid circles depict the measured value, the vertical lines the associated expanded uncertainties; the solid line depicts the assigned value and the broken lines the expanded uncertainty range.

82
Test Unit
Test Portion
wc,i u(wc,i) mc,i u(mc,i) R )(Ru mISTD,SB u(mISTD,SB) mISTD,CB u(mISTD,CB) msmp,i u(msmp,i)
[ng/g] [ng/g] [g] [g] [g] [g] [g] [g] [g] [g]
1 1 2.09090 0.03034 0.22059 0.00007 0.93662 0.02350 0.23302 0.00007 0.23065 0.00007 2.00594 0.00001
1 2 2.09090 0.03034 0.22059 0.00007 0.78196 0.02724 0.23476 0.00007 0.23065 0.00007 1.99938 0.00001
2 1 2.09090 0.03034 0.20491 0.00007 0.95870 0.03851 0.22988 0.00007 0.23246 0.00007 1.99918 0.00001
2 2 2.09090 0.03034 0.20491 0.00007 0.93204 0.02899 0.23057 0.00007 0.23246 0.00007 1.99918 0.00001
3 1 2.09090 0.03034 0.20354 0.00007 0.91353 0.04178 0.23108 0.00007 0.23358 0.00007 2.00759 0.00001
3 2 2.09090 0.03034 0.20354 0.00007 0.89419 0.01981 0.23004 0.00007 0.23358 0.00007 2.00557 0.00001
Table 36: Individual values for the six measurements of the Baby Food material; each column represents one term of either Equation 5 or Equation 6.

83
Test Unit
Test Portion
wc,i u(wc,i) mc,i u(mc,i) R )(Ru mISTD,SB u(mISTD,SB) mISTD,CB u(mISTD,CB) msmp,i u(msmp,i)
[ng/g] [ng/g] [g] [g] [g] [g] [g] [g] [g] [g]
1 1 34.68843 0.50340 0.17862 0.00005 1.00752 0.00832 0.18688 0.00005 0.19160 0.00005 2.00837 0.00001
1 2 34.68843 0.50340 0.17862 0.00005 0.98658 0.01322 0.18817 0.00005 0.19160 0.00005 2.00943 0.00001
2 1 34.68843 0.50340 0.17862 0.00005 1.07440 0.01343 0.18564 0.00005 0.19160 0.00005 2.00966 0.00001
2 2 34.68843 0.50340 0.17929 0.00005 1.01424 0.01197 0.18736 0.00005 0.18962 0.00005 2.00936 0.00001
3 1 34.68843 0.50340 0.17929 0.00005 1.04011 0.01328 0.18790 0.00005 0.18962 0.00005 1.99895 0.00001
3 2 34.68843 0.50340 0.17929 0.00005 0.98913 0.01781 0.18922 0.00005 0.18962 0.00005 1.99959 0.00001
Table 37: Individual values for the six measurements of the Maize Powder material; each column represents one term of either Equation 5 or Equation 6.

84
Test Unit
Test Portion
wc,i u(wc,i) mc,i u(mc,i) R )(Ru mISTD,SB u(mISTD,SB) mISTD,CB u(mISTD,CB) msmp,i u(msmp,i)
[ng/g] [ng/g] [g] [g] [g] [g] [g] [g] [g] [g]
1 1 354.72715 5.14779 0.05553 0.00002 1.02124 0.02272 0.03125 0.00002 0.03158 0.00002 2.02067 0.00002
1 2 354.72715 5.14779 0.05567 0.00002 1.04894 0.02086 0.03001 0.00002 0.03045 0.00002 2.01887 0.00002
1 3 354.72715 5.14779 0.05567 0.00002 1.06132 0.03409 0.02971 0.00002 0.03045 0.00002 2.00618 0.00002
2 1 354.72715 5.14779 0.05553 0.00002 1.02736 0.02038 0.03106 0.00002 0.03158 0.00002 2.02034 0.00002
2 2 354.72715 5.14779 0.05567 0.00002 0.98491 0.02631 0.02892 0.00002 0.03045 0.00002 2.00200 0.00002
2 3 354.72715 5.14779 0.05567 0.00002 1.06035 0.03104 0.03017 0.00002 0.03045 0.00002 2.00059 0.00002
Table 38: Individual values for the six measurements of the Animal Feed material; each column represents one term of either Equation 5 or Equation 6.

European Commission EUR 25196 EN – Joint Research Centre – Institute for Reference Materials and Measurements Title: Report on the 2011 Proficiency Test of the European Union Reference Laboratory for Mycotoxins, for the Network of National Reference Laboratories - Determination of Aflatoxin B1 in Baby food, Maize powder, Animal feed and Test solution Author(s): Zoltan Kunsagi, Andreas Breidbach, Joerg Stroka Luxembourg: Publications Office of the European Union 2012 – 84 pp. – 21.0 x 29.7 cm EUR – Scientific and Technical Research series – ISSN 1831-9424 ISBN 978-92-79-22867-4 doi:10.2787/57856 Abstract This report presents the results of a proficiency test of the EU-RL for Mycotoxins which focused on the determination of aflatoxin B1 in food and feed samples.
Sixty nine participants from 28 countries registered for the exercise. Sixty-one sets of results were reported for the solution, 58 for the baby food, 67 for the maize powder and 62 for the animal feed. One laboratory did not report any results.
In total about 90% of the attributed z scores were below an absolute value of two, which indicated that most of the participants performed satisfactory or better.

How to obtain EU publications Our priced publications are available from EU Bookshop (http://bookshop.europa.eu), where you can place an order with the sales agent of your choice. The Publications Office has a worldwide network of sales agents. You can obtain their contact details by sending a fax to (352) 29 29-42758.
The mission of the JRC is to provide customer-driven scientific and technical support for the conception, development, implementation and monitoring of EU policies. As a service of the European Commission, the JRC functions as a reference centre of science and technology for the Union. Close to the policy-making process, it serves the common interest of the Member States, while being independent of special interests, whether private or national.
L
A-N
A-2
51
96
-EN
-N